| Location | Functional Use | Owned/Leased | |
| U.S. Properties: | |||
| Ontario, California | Distribution/Manufacturing | Leased | |
| Booneville, Mississippi | Distribution/Manufacturing | Owned/Leased | |
| Ogdensburg, New York | Distribution/Manufacturing | Owned/Leased | |
| Sidney, New York | Distribution/Manufacturing | Owned | |
| Alexandria, Pennsylvania | Distribution/Manufacturing | Owned | |
East Texas, Pennsylvania(1) | Distribution/Manufacturing/Office | Owned | |
| Pleasant Prairie, Wisconsin | Distribution/Manufacturing | Leased | |
| Non-U.S. Properties: | |||
| Sydney, Australia | Distribution/Manufacturing | Owned | |
| Bauru, Brazil | Distribution/Manufacturing/Office | Owned | |
| Brampton, Canada | Distribution/Manufacturing/Office | Leased | |
| Missisauga, Canada | Distribution/Manufacturing/Office | Leased | |
| Tabor, Czech Republic | Manufacturing | Owned | |
| Halesowen, England | Distribution | Owned | |
| Lillyhall, England | Manufacturing | Leased | |
| Tornaco, Italy | Distribution | Leased | |
| Lerma, Mexico | Manufacturing/Office | Owned | |
| Born, Netherlands | Distribution | Leased | |
| Wellington, New Zealand | Distribution/Office | Owned | |
| Arcos de Valdevez, Portugal | Manufacturing | Owned | |
| (1) | Scheduled to be closed during the second quarter of 2013. Manufacturing and distribution activities will be substantially relocated to Sidney, New York. |
We believe that the properties are suitable to the respective businesses and have production capacities adequate to meet the needs of our businesses.
ITEM 3.LEGAL PROCEEDINGS
In January of 2013, Tilibra filed a protest disputing the tax assessment at the first administrative level of appeal within the FRD. We believe that we have meritorious defenses and intend to vigorously contest this matter, however, there can be no assurances that we will ultimately prevail. We are in the early stages of the process to challenge the FRD's tax assessment, and the ultimate outcome will not be determined until the Brazilian tax appeal process is complete, which is expected to take many years. In addition, Tilibra's 2008-2012 tax years remain open and subject to audit, and there can be no assurances that we will not receive additional tax assessments regarding the goodwill deducted for the Tilibra acquisition for one or more of those years, which could increase the Company's exposure to a total of approximately $44.5 million (based on current exchange rates), including interest
16
and penalties which have accumulated to date. If the FRD's initial position is ultimately sustained, the amount assessed would adversely affect our reported cash flow in the year of settlement.
Because there is no settled legal precedent on which to base a definitive opinion as to whether we will ultimately prevail, the Company considers the outcome of this dispute to be uncertain. Since it is not more likely than not that we will prevail, in the fourth quarter of 2012, we recorded a reserve in the amount of $44.5 million in consideration of this matter. In addition, the Company will continue to accrue interest related to this matter until such time as the outcome is known or until evidence is presented that we are more likely than not to prevail.
For further information see Note 3, Acquisitions, to the consolidated financial statements contained in Item 8 of this report.
There are various other claims, lawsuits and pending actions against us incidental to our operations. It is the opinion of management that the ultimate resolution of these matters will not have a material adverse effect on our consolidated financial position, results of interest and concern to ACCO Brands.operations or cash flows. However, we can make no assurances that we will ultimately be successful in our defense of any of these matters.
ITEM 4.MINE SAFETY DISCLOSURES
Not applicable.
17
PART II
Our common stock is traded on the New York Stock Exchange (“NYSE”) under the symbol “ACCO.” The following table sets forth, for the periods indicated, the high and low sales prices for our common stock as reported on the NYSE for 2011 and 2012:
| High | Low | ||||||
| 2011 | |||||||
| First Quarter | $ | 9.66 | $ | 7.77 | |||
| Second Quarter | $ | 10.39 | $ | 6.91 | |||
| Third Quarter | $ | 8.89 | $ | 4.62 | |||
| Fourth Quarter | $ | 10.20 | $ | 4.33 | |||
| 2012 | |||||||
| First Quarter | $ | 13.25 | $ | 9.24 | |||
| Second Quarter | $ | 13.30 | $ | 8.50 | |||
| Third Quarter | $ | 10.94 | $ | 6.01 | |||
| Fourth Quarter | $ | 7.95 | $ | 5.80 | |||
As of February 1, 2013, we had approximately 18,263 registered holders of our common stock.
Dividend Policy
We have not paid any dividends on our common stock since becoming a public company. We intend to retain any future earnings to reduce our indebtedness and fund the development and growth of our business. Currently our debt agreements restrict our ability to make dividend payments and we do not anticipate paying any cash dividends in the foreseeable future. Any determination as to the declaration of dividends is at our Board of Directors’ sole discretion based on factors it deems relevant.
18
STOCK PERFORMANCE GRAPH
The following graph compares the cumulative total stockholder return on our common stock to that of the S&P Office Services and Supplies (SuperCap1500) Index and the Russell 2000 Index assuming an investment of $100 in each from December 31, 2007 through December 31, 2012.
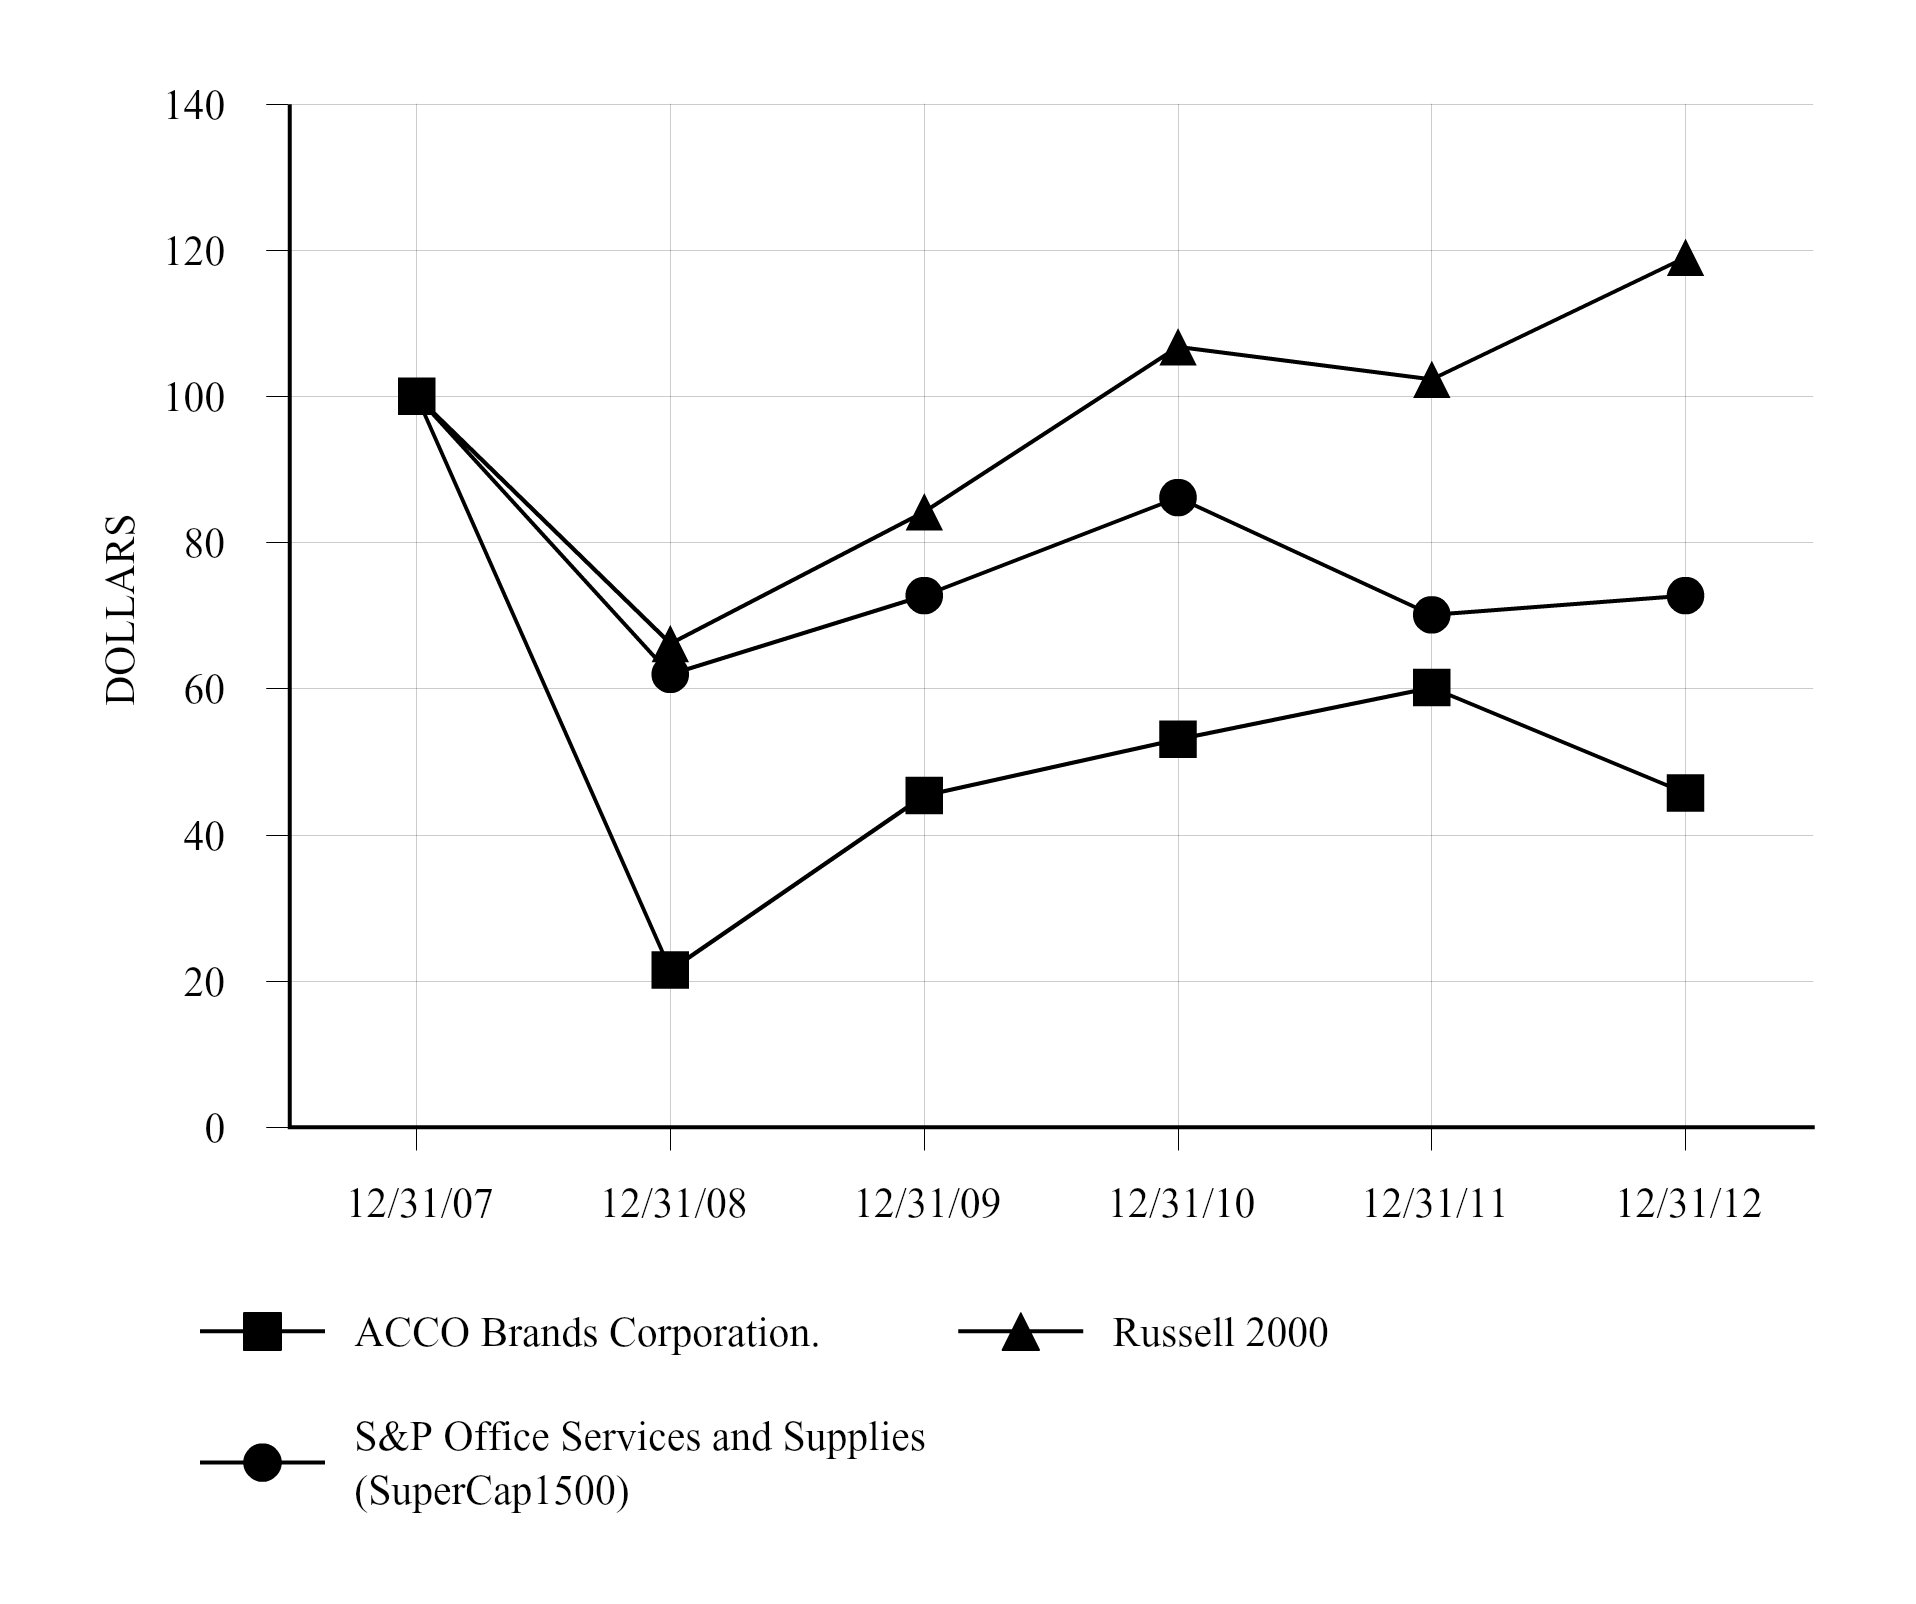
| Cumulative Total Return | |||||||||||||||||||||||
| 12/31/07 | 12/31/08 | 12/31/09 | 12/31/10 | 12/31/11 | 12/31/12 | ||||||||||||||||||
| ACCO Brands Corporation. | $ | 100.00 | $ | 21.51 | $ | 45.39 | $ | 53.12 | $ | 60.16 | $ | 45.76 | |||||||||||
| Russell 2000 | 100.00 | 66.21 | 84.20 | 106.82 | 102.36 | 119.09 | |||||||||||||||||
S&P Office Services and Supplies (SuperCap1500) | 100.00 | 61.97 | 72.79 | 86.16 | 70.12 | 72.79 | |||||||||||||||||
19
ITEM 6.SELECTED FINANCIAL DATA
SELECTED HISTORICAL FINANCIAL DATA
The following table sets forth our selected consolidated financial data. The selected consolidated financial data as of and for the five fiscal years ended December 31, 2012 are derived from our consolidated financial statements. The data should be read in conjunction with the consolidated financial statements and related notes included elsewhere in this annual report.
| Year Ended December 31, | |||||||||||||||||||
2012(1) | 2011 | 2010 | 2009 | 2008 | |||||||||||||||
| (in millions of dollars, except per share data) | |||||||||||||||||||
| Income Statement Data: | |||||||||||||||||||
| Net sales | $ | 1,758.5 | $ | 1,318.4 | $ | 1,284.6 | $ | 1,233.3 | $ | 1,539.2 | |||||||||
Operating income (loss)(2) | 139.3 | 115.2 | 109.7 | 75.4 | (199.9 | ) | |||||||||||||
| Interest expense, net | 89.3 | 77.2 | 78.3 | 67.0 | 63.7 | ||||||||||||||
Other expense (income), net(2) | 61.3 | 3.6 | 1.2 | 5.4 | (17.8 | ) | |||||||||||||
Income (loss) from continuing operations(3) | 117.0 | 18.6 | 7.8 | (118.6 | ) | (255.1 | ) | ||||||||||||
| Per common share: | |||||||||||||||||||
Income (loss) from continuing operations(3) | |||||||||||||||||||
| Basic | $ | 1.24 | $ | 0.34 | $ | 0.14 | $ | (2.18 | ) | $ | (4.71 | ) | |||||||
| Diluted | $ | 1.22 | $ | 0.32 | $ | 0.14 | $ | (2.18 | ) | $ | (4.71 | ) | |||||||
| Balance Sheet Data (at year end): | |||||||||||||||||||
| Total assets | $ | 2,507.7 | $ | 1,116.7 | $ | 1,149.6 | $ | 1,106.8 | $ | 1,282.2 | |||||||||
| External debt | 1,072.1 | 669.0 | 727.6 | 725.8 | 708.7 | ||||||||||||||
| Total stockholders’ equity (deficit) | 639.2 | (61.9 | ) | (79.8 | ) | (117.2 | ) | (3.4 | ) | ||||||||||
| Other Data: | |||||||||||||||||||
| Cash (used) provided by operating activities | $ | (7.5 | ) | $ | 61.8 | $ | 54.9 | $ | 71.5 | $ | 37.2 | ||||||||
| Cash (used) provided by investing activities | (423.2 | ) | 40.0 | (14.9 | ) | (3.9 | ) | (18.7 | ) | ||||||||||
| Cash provided (used) by financing activities | 360.1 | (63.1 | ) | (0.1 | ) | (44.5 | ) | (37.7 | ) | ||||||||||
| (1) | On May 1, 2012, the Company completed the Merger of the Mead C&OP with a wholly-owned subsidiary of the Company. Accordingly, the results of Mead C&OP are included in the Company's consolidated financial statements from the date of the Merger. For further information on the Merger, see Note 3, Acquisitions, to the consolidated financial statements, contained in Item 8 of this report. |
| (2) | Income (loss) from continuing operations in the years 2009 and 2008 was impacted by non-cash goodwill and asset impairment charges of $1.7 million and $263.8 million, respectively. |
Income (loss) from continuing operations in the year 2012 was impacted by $61.4 million in charges related to the refinancing completed in 2012 and recorded within Other expense (income), net. For further information on our refinancing, see Note 4, Long-term Debt and Short-term Borrowings, to the consolidated financial statements, contained in Item 8 of this report. The year 2008 was impacted by a $19.0 million gain due to early extinguishment of debt relating to the purchase of $49.6 million of our debt.
| (3) | Income (loss) from continuing operations for the years 2012, 2011, 2010, 2009 and 2008 was impacted by restructuring charges (income) of $24.3 million, $(0.7) million, $(0.5) million, $17.4 million and $28.8 million, respectively. |
Income (loss) from continuing operations for the years 2009 and 2008 was impacted by certain other charges that have been recorded within cost of products sold, and advertising, selling, general and administrative expenses. These charges are incremental to the cost of our underlying restructuring actions and do not qualify as restructuring. These charges include redundant warehousing or storage costs during the transition to new distribution centers, equipment and other asset move costs, ongoing facility overhead and maintenance costs after exit, gains on the sale of exited facilities, certain costs associated with our debt refinancing and employee retention incentives. Within cost of products sold on the Consolidated Statements of Operations for the years ended December 31, 2009 and 2008, these charges totaled $3.4
20
million and $7.5 million, respectively. Within advertising, selling, general and administrative expenses on the Consolidated Statements of Operations for the years ended December 31, 2009, and 2008, these charges totaled $1.2 million and $3.1 million, respectively. Included within the 2008 result, is a charge for $4.2 million related to the exit of the Company’s former CEO, a $3.5 million gain on the sale of a manufacturing facility and net gains of $2.4 million on the sale of three additional properties. We did not incur these other charges in 2012, 2011 and 2010.
During 2009, we recorded a non-cash charge of $108.1 million to establish a valuation allowance against our U.S. deferred taxes. Following the Merger in the second quarter of 2012, we released into income $126.1 million of the valuation allowance that had been previously recorded against the U.S. deferred income tax assets. For a further discussion of the valuation allowance, see Note 11, Income Taxes, to the consolidated financial statements, contained in Item 8 of this report.
21
| ITEM 7. | MANAGEMENT’S DISCUSSION AND ANALYSIS OF FINANCIAL CONDITION AND RESULTS OF OPERATIONS |
INTRODUCTION
ACCO Brands is one of the world's largest suppliers of branded school and office products (excluding furniture, computers, printers and bulk paper). We sell our products through many channels that include the office products resale industry as well as through mass retail distribution and e-tailers. We design, develop, manufacture and market a wide variety of traditional and computer-related office products, school supplies and paper-based time management products. Through a focus on research, marketing and innovation, we seek to develop new products that meet the needs of our consumers and commercial end-users, and support our brands. We compete through a balance of innovation, a low-cost operating model and an efficient supply chain. We sell our products primarily to markets located in the United States, Northern Europe, Canada, Brazil, Australia and Mexico.
Our office, school and calendar product lines use name brands such as AT-A-GLANCE®, Day-Timer®, Five Star®, GBC®, Hilroy®, Marbig, Mead®, NOBO, Quartet®, Rexel, Swingline®, Tilibra®, Wilson Jones® and many others. Our products and brands are not confined to one channel or product category and are designed based on end-user preference. We currently manufacture approximately half of our products, and specify and source approximately the other half of our products, mainly from Asia.
The majority of our office products, such as stapling, binding and laminating equipment and related consumable supplies, shredders and whiteboards, are used by businesses. Most of these business end-users purchase their products from our customers, which include commercial contract stationers, retail superstores, mass merchandisers, wholesalers, resellers, mail order and internet catalogs, club stores and dealers. We also supply some of our products directly to large commercial and industrial end-users. Historically, we have targeted the premium end of the product categories in which we compete. However, we also supply private label products for our customers and provide business machine maintenance and certain repair services.
Our school products include notebooks, folders, decorative calendars, and stationery products. We distribute our school products primarily through traditional and online retail mass market, grocery, drug and office superstore channels. We also supply private label products within the school products sector. Our calendar products are sold throughout all channels where we sell office or school products, and we also sell direct to consumers.
Our Computer Products Group designs, distributes, markets and sells accessories for laptop and desktop computers, tablets and smartphones. These accessories primarily include security products, iPad® covers and keypads, smartphone accessories, power adapters, input devices such as mice, laptop computer carrying cases, hubs, docking stations and ergonomic devices. We sell these products mostly under the Kensington®, Microsaver® and ClickSafe® brand names. All of our computer products are manufactured by third-party suppliers, principally in Asia, and are stored in and distributed from our regional facilities. These computer products are sold primarily to consumer electronics online retailers, information technology value-added resellers, original equipment manufacturers and office products retailers.
We believe our leading product positions provide the above-named officersscale to enable us to invest in product innovation and drive growth across our product categories. In addition, the expertise we use to satisfy the exacting technical specifications of our more demanding commercial customers is in many instances the basis for expanding our products and innovations to consumer products. We plan to grow via a strategy of organic growth supplemented by acquisitions that can leverage our existing business.
Mead C&OP Merger and Debt Refinancing
On November 17, 2011, we announced the signing of a definitive agreement to acquire the Mead Consumer and Office Products Business (“Mead C&OP”). On May 1, 2012, we completed the merger ("Merger") of Mead C&OP with a wholly-owned subsidiary of the Company. Mead C&OP is a leading manufacturer and marketer of school supplies, office products, and planning and organizing tools - including the Mead®, Five Star®, Trapper Keeper®, AT-A-GLANCE®, Cambridge®, Day Runner®, Hilroy, Tilibra and Grafons brands in the U.S., Canada and Brazil.
In the Merger, MeadWestvaco Corporation (“MWV”) shareholders received 57.1 million shares of the Company's common stock, or 50.5% of the combined company, valued at $602.3 million on the date of the Merger. After the transaction was completed we had 113.1 million common shares outstanding.
Under the terms of the Merger agreement, MWV established a new subsidiary (“Monaco SpinCo Inc.”) to which it conveyed Mead C&OP in return for a $460.0 million payment. The shares of Monaco SpinCo Inc. were then distributed to MWV's shareholders
22
as a dividend. Immediately after the spin-off and distribution, a newly formed subsidiary of the Company merged with and into Monaco SpinCo Inc. and MWV shareholders effectively received in the stock dividend and subsequent conversion approximately one share of ACCO Brands common stock for every three shares of MWV they held. Fractional shares were paid in cash. The subsidiary company subsequently merged with Mead Products LLC (“Mead Products”), the surviving corporate entity, which is a wholly-owned subsidiary of ACCO Brands Corporation.
As of December 31, 2012, $30.5 million has been received back from MWV through working capital adjustments to the purchase price.
For accounting purposes, the Company was the acquiring enterprise. The Merger was accounted for as a purchase business combination. Accordingly, the results of Mead C&OP are included in the Company's consolidated financial statements from the date of the Merger. In connection with this transaction, in the years ended December 31, 2012 and 2011, we incurred expenses of $22.9 million and $5.6 million, respectively, related to the transaction, including integration costs.
On May 1, 2012, we entered into a refinancing in conjunction with the Merger. The refinancing transactions reduced our effective interest rate while increasing our borrowing capacity and extending the maturities of our credit facilities.
The new credit facilities and notes are as follows:
$250 million of U.S. Dollar Senior Secured Revolving Credit Facilities due May 2017
$285 million of U.S. Dollar Senior Secured Term Loan A due May 2017
C$34.5 million of Canadian Dollar Senior Secured Term Loan A due May 2017
$450 million of U.S. Dollar Senior Secured Term Loan B due May 2019
$500 million of U.S. Dollar Senior Unsecured Notes due May 2020
Interest rates under the senior secured term loans are based on the London Interbank Offered Rate (LIBOR). The range of borrowing costs under the pricing grid is LIBOR plus 3.00% for the Term A loans and LIBOR plus 3.25% with a LIBOR rate floor of 1.00% for the Term B loans. The senior secured credit facilities had a weighted average interest rate of 3.89% as of December 31, 2012 and the senior unsecured notes have an interest rate of 6.75%.
In addition, on May 1, 2012, we repurchased or discharged all of our outstanding senior secured notes of $425.1 million, due March 2015, for $464.7 million including a premium and related fees of $39.6 million. On May 4, 2012, we redeemed all of our outstanding senior subordinated notes of $246.3 million, due August 2015, for $252.6 million including a premium of $6.3 million. We also terminated our senior secured asset-based revolving credit facility of $175.0 million, which was undrawn as of May 1, 2012. Associated with these transactions were $15.5 million in write-offs for original issue discount and debt origination costs.
In conjunction with our refinancing, we paid $38.5 million in additional bank, legal and advisory fees associated with our new credit facilities. These fees were capitalized and will be amortized over the life of the credit facilities and senior unsecured notes.
During 2012, we voluntarily repaid $200.3 million of our debt comprising $64.2 million of our U.S. Dollar Senior Secured Term Loan A, $12.9 million of our Canadian Dollar Senior Secured Term Loan A and $123.2 million of our U.S. Dollar Senior Secured Term Loan B.
As part of the inclusion of Mead C&OP 's financial results with those of the Company, certain information technology costs associated with the manufacturing and distribution operations have been actively engagedreclassified from advertising, selling, general and administrative expenses (SG&A) to cost of products sold. This reclassification was done to enable the financial results of the two businesses to be consistent and to better reflect those costs associated with the cost of products sold. All prior periods have been reclassified to make the results comparable. For the years ended December 31, 2011 and 2010 reclassified costs totaled $15.5 million and $14.6 million, respectively. These historical reclassifications have had no effect on net income.
Discontinued Operations
As of May 31, 2011, we disposed of the GBC Fordigraph Pty Ltd (“GBC Fordigraph”) business. The Australia-based business was formerly part of the ACCO Brands International segment and the results of operations are included in the financial statements as a discontinued operation for all periods presented. GBC Fordigraph represented $45.9 million in annual net sales for the year ended December 31, 2010. In 2011, we received net proceeds of $52.9 million and recorded a gain on the sale of $41.9 million ($36.8 million after-tax).
23
For further information on the Company’s discontinued operations see Note 19, Discontinued Operations, to the consolidated financial statements contained in Item 8 of this report.
Management’s Discussion and Analysis of Financial Condition and Results of Operations should be read in conjunction with the consolidated financial statements of ACCO Brands Corporation and the accompanying notes contained therein. Unless otherwise noted, the following discussion pertains only to our continuing operations.
Adjustments Subsequent to the Earnings Release Filed on Form 8-K on February 13, 2013
On February 21, 2013, in connection with completing our 2012 audited financial statements for filing in this report, we determined that the Company should record a reserve in the amount of $44.5 million in consideration of a contingent liability related to a tax assessment issued in December 2012 by the Federal Revenue Department of the Ministry of Finance of Brazil against the Company's newly acquired indirect subsidiary, Tilibra Produtos de Papelaria Ltda. ("Tilibra"). Of the total reserve recorded, $43.3 million was an adjustment to the allocation of the purchase price for the fair value of non-current liabilities assumed as of the acquisition date and was recorded as an increase to goodwill and the remaining $1.2 million was charged to current income tax expense and represents additional interest that has accumulated since the date of the acquisition. One additional revision resulted in a reduction of both deferred tax liabilities and goodwill of $9.9 million. These adjustments were recorded as the Company continues its process of finalizing the purchase price allocation for the Merger. For further information see Note 3, Acquisitions, to the consolidated financial statements contained in Item 8 of this report.
The Company also recorded an additional tax expense of $2.9 million reflecting an adjustment to the deferred tax expense to reflect a change in certain tax rates for which deferred taxes have previously been provided in other comprehensive income (loss).
The net effect of these changes was to reduce the Company's previously reported net income for the twelve months ended December 31, 2012 as included on the Form 8-K filed on February 13, 2013 by $4.1 million to $115.4 million, reduce earnings per diluted share by $0.04 to $1.20 per diluted share and increase our previously reported net loss for the three months ended December 31, 2012 by $4.1 million to $16.6 million or by $0.04 per diluted share to $0.15 loss per diluted share. There was no change to the amount of pretax income previously reported.
Overview of Company Performance
ACCO Brands’ results are dependent upon a number of factors affecting sales, including pricing and competition. Historically, key drivers of demand in the office and school products industries have included trends in white collar employment levels, enrollment levels in education, gross domestic product (GDP) and growth in the number of small businesses and home offices together with usage of personal computers. Pricing and demand levels for office products have also reflected a substantial consolidation within the global resellers of office products. This consolidation has led to multiple years of industry pricing pressure and a more efficient level of asset utilization by customers, resulting in lower sales pricing and volume for suppliers of office products. In February 2013, two of our largest customers, Office Depot and Office Max, announced that they have entered into a merger agreement. While management currently expects that the effects on our business of the proposed merger, if consummated, would be realized primarily in our retail channel, which only represents approximately one-third of our business with these customers, there can be no assurance that the combination of these two large customers will not adversely affect our business and results of operations. See “Risk Factors - Our customers may further consolidate, which could adversely impact our margins and sales."
With 45% of revenues for the year ended December 31, 2012 arising from foreign operations, exchange rate fluctuations can play a major role in our reported results. Foreign currency fluctuations impact the business in two ways: 1) the translation of our foreign operations results into U.S. dollars: a weak U.S. dollar benefits us and a strong U.S. dollar reduces the dollar-denominated contribution from foreign operations; and 2) the impact of foreign currency fluctuations on cost of goods sold. Approximately half of the products we sell worldwide are sourced from Asia, and are paid for in U.S. dollars. However, our international operations sell in their local currency and are exposed to their domestic currency movements against the U.S. dollar. A strong U.S. dollar, therefore, increases our cost of goods sold and a weak U.S. dollar decreases our cost of goods sold for our international operations.
We respond to these market changes by adjusting selling prices, but this response can be difficult during periods of rapid fluctuation. A significant portion of our foreign-currency cost of goods purchases is hedged with forward foreign currency contracts, which delays the economic effect of a fluctuating U.S. dollar helping us align our market pricing. The financial impact on our business from foreign exchange movements for our cost of goods is also further delayed until the inventory is sold. Foreign exchange exposures impact the business at different times: the translation of results is impacted immediately when the exchange
24
rates move, whereas the impact on cost of goods is typically delayed due to a combination of currency hedging strategies and our inventory cycle.
The cost of certain commodities used to make products increased significantly, during 2011, negatively impacting cost of goods, mainly for products sold in the second half of the year. We implemented price increases in the first and third quarters of 2011 to offset these cost increases. As commodity costs continued to rise, in the first quarter of 2012, we implemented price increases in a limited number of markets in an effort to further offset increases in commodity costs. We continue to monitor commodity costs and work with suppliers and customers to negotiate balanced and fair pricing that best reflects the current economic environment.
During the first quarter of 2012, we committed to new cost savings plans intended to improve the efficiency and effectiveness of our businesses. The cost savings activities are principally in the U.S. and the U.K. We believe these actions will benefit our efforts to improve profitability and enhance shareholder value. These actions are expected to result in approximately $8 million in annualized cost savings when fully realized. In connection with these actions, we incurred pretax charges, principally employee termination and severance costs, of approximately $7 million in 2012, substantially all of which were recorded in the six months ending June 30, 2012. Cash costs related to these charges, net of asset sale proceeds, are expected to be approximately $5 million, which we substantially recovered in savings in the second half of 2012. During the year ended December 31, 2012, we received proceeds of $2.7 million related to the sale of a facility in the U.K.
The actions described in the preceding paragraph were independent of and not a part of any plan of integration related to our acquisition of Mead C&OP.
In the second quarter of 2012, we committed to cost savings plans largely related to the consolidation and integration of Mead C&OP. The largest plan, which is expected to result in employee severance charges of approximately $11 million, is related to our dated goods business and involves closing a facility in East Texas, Pennsylvania during March 2013 and relocating its activities. We expect to realize cash savings equal to the cash cost by the end of 2014. The East Texas facility is owned by us and will be marketed for sale. However, current real estate market conditions make a future sale date uncertain and therefore the foregoing estimates do not reflect potential cash sale proceeds from the sale of the facility. The remaining plans are primarily related to eliminating duplication in the management advertising, selling, general and administrative structures in the U.S. and Canada. Between now and the fourth quarter of 2013, we anticipate additional restructuring charges of approximately $25 million, of which approximately $4 million are non-cash charges. These charges relate to cost-reduction initiatives in the company's European and North American operations and are associated with the completion of the Mead integration and productivity initiatives. The cash component of the charge will approximate $15 million in 2013 and $6 million in 2014.
In the first quarter of 2011, we initiated plans to rationalize our European operations. The associated costs primarily related to employee terminations, which were accounted for as regular business expenses in selling, general and administrative expenses and were primarily incurred in the first half of 2011. These were largely offset by associated savings realized in the second half of 2011. These costs totaled $4.5 million during the year ended December 31, 2011.
We fund our liquidity needs for capital investment, working capital and other financial commitments through cash flow from continuing operations and our $250.0 million senior secured revolving credit facility. Based on our borrowing base, as of December 31, 2012, $238.5 million remained available for borrowing under this facility.
During 2009, we determined that it was no longer more likely than not that our U.S. deferred tax assets would be realized, and as a result, we recorded a non-cash charge of $108.1 million to establish a valuation allowance against our U.S. deferred tax assets. Due to the acquisition of Mead C&OP in the second quarter of 2012, we analyzed our need for maintaining valuation reserves against the expected U.S. future tax benefits. Based on our analysis we determined that there existed sufficient evidence in the form of future taxable income from the combined operations to release $126.1 million of the valuation allowance that had been previously recorded against the U.S. deferred income tax assets. The resulting deferred tax assets are comprised principally of net operating loss carry-forwards, that are expected to be fully realized within the expiration period and other temporary differences.
25
Fiscal 2012 versus Fiscal 2011
The following table presents the Company’s results for the years ended December 31, 2012 and 2011.
| Year Ended December 31, | Amount of Change | ||||||||||||||
| (in millions of dollars) | 2012 | 2011 | $ | % | |||||||||||
| Net sales | $ | 1,758.5 | $ | 1,318.4 | $ | 440.1 | 33 | % | |||||||
| Cost of products sold | 1,225.1 | 919.2 | 305.9 | 33 | % | ||||||||||
| Gross profit | 533.4 | 399.2 | 134.2 | 34 | % | ||||||||||
| Gross profit margin | 30.3 | % | 30.3 | % | 0.0 | pts | |||||||||
| Advertising, selling, general and administrative expenses | 349.9 | 278.4 | 71.5 | 26 | % | ||||||||||
| Amortization of intangibles | 19.9 | 6.3 | 13.6 | NM | |||||||||||
| Restructuring charges (income) | 24.3 | (0.7 | ) | 25.0 | NM | ||||||||||
| Operating income | 139.3 | 115.2 | 24.1 | 21 | % | ||||||||||
| Operating income margin | 7.9 | % | 8.7 | % | (0.8) | pts | |||||||||
| Interest expense, net | 89.3 | 77.2 | 12.1 | 16 | % | ||||||||||
| Equity in earnings of joint ventures | (6.9 | ) | (8.5 | ) | (1.6 | ) | (19 | )% | |||||||
| Other expense, net | 61.3 | 3.6 | 57.7 | NM | |||||||||||
| Income tax (benefit) expense | (121.4 | ) | 24.3 | (145.7 | ) | NM | |||||||||
| Effective tax rate | NM | 56.6 | % | NM | |||||||||||
| Income from continuing operations | 117.0 | 18.6 | 98.4 | NM | |||||||||||
| Income (loss) from discontinued operations, net of income taxes | (1.6 | ) | 38.1 | (39.7 | ) | (104 | )% | ||||||||
| Net income | 115.4 | 56.7 | 58.7 | NM | |||||||||||
Net Sales
Net sales increased$440.1 million, or 33%, to $1.76 billion compared to $1.32 billion in the prior-year period. The acquisition of Mead C&OP contributed sales of $551.5 million. The underlying decline of $111.4 million includes an unfavorable currency translation of $17.1 million, or 1%. The remaining decline of $94.3 million, or 7%, occurred primarily in the International and North America business segments.
International segment sales declined $61 million (excluding the effect of Mead C&OP and currency translation) of which the decline in the European business accounted for $56 million. Approximately $32 million of the European decline was due to the Company's decision to re-focus on more profitable business; the remainder of the European decline was due to the weak economic environment. Australia also experienced weak consumer demand and lower price points.
North American segment sales declined $27 million (excluding the effect of Mead C&OP and currency translation). Approximately half of the sales decline was in the direct channel, which services large U.S. print finishing customers, with the remainder mainly from lower Canadian sales and declines in the calendar business.
Cost of Products Sold
Cost of products sold includes all manufacturing, product sourcing and distribution costs, including depreciation related to assets used in the manufacturing, procurement and distribution process, allocation of certain information technology costs supporting those processes, inbound and outbound freight, shipping and handling costs, purchasing costs associated with materials and packaging used in the production processes. Cost of products sold increased $305.9 million, or 33%, to $1.23 billion. The acquisition of Mead C&OP contributed $355.8 million, which includes $13.3 million in amortization of the acquisition step-up in inventory value. Excluding the impact of Mead C&OP acquisition, the principal drivers of the underlying decline of $49.9 million were lower sales volumes and a $12.1 million impact of favorable currency translation.
As part of the inclusion of Mead C&OP's financial results with those of the Company, certain information technology costs associated with the manufacturing and distribution operations have been reclassified from advertising, selling, general and administrative expenses to cost of products sold. This reclassification was done to enable the financial results of the two businesses to be consistent and to better reflect those costs associated with the cost of products sold. All prior periods have been reclassified
26
to make the results comparable. For the year ended December 31, 2011, reclassified costs totaled $15.5 million. These historical reclassifications were not material and had no effect on net income.
Gross Profit
Management believes that gross profit and gross profit margin provide enhanced shareholder understanding of underlying profit drivers. Gross profit increased $134.2 million, or 34%, to $533.4 million. The acquisition of Mead C&OP contributed $195.7 million, which includes a $13.3 million charge for the acquisition step-up in inventory value. The principal drivers of the underlying decline of $61.5 million were lower sales volumes and a $5.0 million impact of unfavorable currency translation. Gross profit margin was unchanged at 30.3%. The inclusion of Mead C&OP, which has a mix of relatively higher margin products, was offset by an adverse sales mix in the legacy ACCO Brands businesses and the charge for the acquisition step-up in inventory value.
SG&A (Advertising, selling, general and administrative expenses)
Advertising, selling, general and administrative expenses (SG&A) include advertising, marketing, selling (including commissions), research and development, customer service, depreciation related to assets outside the manufacturing and distribution processes and all other general and administrative expenses outside the manufacturing and distribution functions (e.g., finance, human resources, etc.). SG&A increased $71.5 million, or 26%, to $349.9 million, and as a percentage of sales, SG&A decreased to 19.9% from 21.1% in the prior-year period. The acquisition of Mead C&OP contributed $77.9 million of the increase. The underlying decrease of $6.4 million was driven by savings in the North America and International business segments and the absence of $4.5 million of business rationalization charges within our European operations incurred during 2011 as well as favorable currency translation of $2.6 million, partially offset by $22.9 million in transaction and integration costs associated with the acquisition of Mead C&OP.
Restructuring Charges
Employee termination and severance charges included in restructuring charges primarily relate to our plans for integration with Mead C&OP that were initiated in the second quarter of 2012. These charges were $24.3 million in the current year period compared to income of $0.7 million in the prior-year period due to the release of reserves related to prior projects no longer required. The current year period charges primarily relate to consolidation and integration of the recently acquired Mead C&OP business, but also include certain cost savings plans that are expected to improve the efficiency and effectiveness of our U.S. and European businesses.
Operating Income
Operating income increased$24.1 million, or 21%, to $139.3 million and as a percentage of sales operating income declined to 7.9% from 8.7%. The acquisition of Mead C&OP increased operating income by $101.2 million. The underlying decline of $77.1 million was driven by $24.3 million in restructuring costs, $22.9 million in transaction and integration costs associated with the acquisition of Mead C&OP, a $13.3 million charge for the acquisition step-up in inventory value, lower sales volume in the legacy ACCO Brands businesses and unfavorable currency translation of $2.2 million. Savings in the North America and International business segments and the absence of $4.5 million of business rationalization charges within our European operations incurred during 2011 partially offset the underlying decline.
Interest Expense, Net, Equity in Earnings of Joint Ventures and Other Expense, Net
Interest expense was $89.3 million compared to $77.2 million in the prior-year period. The increase was due to merger-related expenses for the committed financing required for the Merger of $16.4 million and accelerated amortization of debt origination costs of $3.6 million. The underlying decrease was due to our refinancing completed in May 2012 which substantially lowered our effective interest rate. Also, 2011 includes $1.2 million of accelerated amortization of debt origination costs resulting from debt repayments in the third quarter of 2011.
Equity in earnings of joint ventures was income of $6.9 million compared to $8.5 million in the prior-year period. During the fourth quarter of 2012 we took an impairment charge of $1.9 million related our Neschen GBC Graphics Films, LLC ("Neschen")joint venture. The Company has committed at the end of 2012 to pursue an exit strategy with regards to Neschen, due to significant excess capacity and other opportunities to reduce our costs of products sourced from Neschen.
Other expense, net, was $61.3 million compared to expense of $3.6 million in the prior year period. The significant increase was due to the refinancing of our debt in May 2012. The Company repurchased or discharged all of its outstanding Senior Secured Notes of $425.1 million, due March 2015, for $464.7 million including a premium and related fees of $39.6 million, and redeemed
27
all of its outstanding Senior Subordinated Notes of $246.3 million, due August 2015, for $252.6 million including a premium of $6.3 million. The increase was also due to the write-off of debt origination costs of $15.5 million related to the refinanced debt. In the prior year we paid $3.0 million in premiums on the repurchase of $34.9 million of our Senior Secured Notes.
Income Taxes
Income tax benefit from continuing operations was $121.4 million on a loss before taxes of $4.4 million compared to an income tax expense from continuing operations of $24.3 million on income before taxes of $42.9 million in the prior-year period. The tax benefit for 2012 is primarily due to the release of certain valuation allowances for the U.S. of $126.1 million and certain foreign jurisdictions in the amount of $19.0 million. The high effective tax rate for 2011 of 56.6% is due to no tax benefit being provided on losses incurred in the U.S. and certain foreign jurisdictions where valuation reserves are recorded against future tax benefits. For a further discussion of income taxes and the release of the valuation allowances see Note 11 Income Taxes, to the consolidated financial statements contained in Item 8 of this report.
Income from Continuing Operations
Income from continuing operations was $117.0 million, or $1.22 per diluted share, compared to income of $18.6 million, or $0.32 per diluted share in the prior-year.
Income (loss) from Discontinued Operations
Loss from discontinued operations was $1.6 million, or $0.02 per diluted share, compared to income of $38.1 million, or $0.66 per diluted share in the prior-year.
Discontinued operations include the results of GBC Fordigraph, which was sold during the second quarter of 2011, and the commercial print finishing business, which was sold during 2009. For a further discussion of discontinued operations see Note 19, Discontinued Operations, to the consolidated financial statements contained in Item 8 of this report.
The components of discontinued operations for the years ended December 31, 2012 and 2011 are as follows:
| (in millions of dollars) | 2012 | 2011 | |||||
| Income from operations before income taxes | $ | — | $ | 2.5 | |||
| Gain (loss) on sale before income taxes | (2.1 | ) | 41.5 | ||||
| Provision (benefit) for income taxes | (0.5 | ) | 5.9 | ||||
| Income (loss) from discontinued operations | $ | (1.6 | ) | $ | 38.1 | ||
Net Income
Net income was $115.4 million, or $1.20 per diluted share, compared to net income of $56.7 million, or $0.98 per diluted share, in the prior year.
28
Segment Discussion
| Year Ended December 31, 2012 | Amount of Change | |||||||||||||||||||||||||||||
| Net Sales | Segment Operating Income (A) | Operating Income Margin | Adjusted Charges (B) | Net Sales | Net Sales | Segment Operating Income | Segment Operating Income | Margin Points | ||||||||||||||||||||||
| (in millions of dollars) | $ | % | $ | % | ||||||||||||||||||||||||||
| ACCO Brands North America | $ | 1,028.2 | $ | 86.2 | 8.4 | % | $ | 37.2 | $ | 405.1 | 65% | $ | 48.8 | 130 | % | 240 | ||||||||||||||
| ACCO Brands International | 551.2 | 62.0 | 11.2 | % | 5.2 | 46.2 | 9% | 3.1 | 5 | % | (50 | ) | ||||||||||||||||||
| Computer Products Group | 179.1 | 35.9 | 20.0 | % | 0.3 | (11.2 | ) | (6)% | (11.2 | ) | (24 | )% | (480 | ) | ||||||||||||||||
| Total segment sales | $ | 1,758.5 | $ | 184.1 | $ | 440.1 | $ | 40.7 | ||||||||||||||||||||||
| Year Ended December 31, 2011 | ||||||||||||||||||||||||||||||
| Net Sales | Segment Operating Income (A) | Operating Income Margin | Adjusted Charges (B) | |||||||||||||||||||||||||||
| (in millions of dollars) | ||||||||||||||||||||||||||||||
| ACCO Brands North America | $ | 623.1 | $ | 37.4 | 6.0 | % | $ | — | ||||||||||||||||||||||
| ACCO Brands International | 505.0 | 58.9 | 11.7 | % | — | |||||||||||||||||||||||||
| Computer Products Group | 190.3 | 47.1 | 24.8 | % | — | |||||||||||||||||||||||||
| Total segment operating income | $ | 1,318.4 | $ | 143.4 | ||||||||||||||||||||||||||
(A) Segment operating income excludes corporate costs; Interest expense, net; Equity in earnings of joint ventures and Other expense, net. See Note 16, Information on Business Segments, to the consolidated financial statements contained in Item 8 of this report for a reconciliation of total segment operating income to income from continuing operations before income taxes.
(B) Adjusted charges include restructuring charges for 2012 and non-recurring charges related to the Merger.
ACCO Brands North America
ACCO Brands North America net sales increased $405.1 million, or 65%, to $1.03 billion, compared to $623.1 million in the prior-year period. The acquisition of Mead C&OP contributed sales of $432.6 million. The remaining decline of $27.5 million includes an unfavorable currency translation of $0.9 million. The comparable decline (exclusive of currency translation) of $26.6 million, or 4%, occurred in the legacy ACCO Brands U.S. and Canadian businesses due to lower demand from large print finishing customers, weak demand including lower customer inventories and declines in the calendar business.
ACCO Brands North Americas operating income increased $48.8 million, or 130%, to $86.2 million, and operating income margin increased to 8.4% from 6.0% in the prior-year period. The acquisition of Mead C&OP contributed $81.4 million, net of other charges consisting of $11.5 millionin amortization of the acquisition step-up in inventory value and $2.2 million of restructuring charges. The underlying decrease of $32.6 million was driven by $23.5 million of other charges, consisting of $18.4 million of restructuring charges, $5.1 million of integration charges, as well as, lower sales and unfavorable product mix (higher sales of low-margin products). This was partially offset by savings within SG&A.
ACCO Brands International
ACCO Brands International net sales increased $46.2 million, or 9%, to $551.2 million compared to $505.0 million in the prior-year period. The acquisition of Mead C&OP contributed sales of $118.9 million. The remaining decline of $72.7 million includes an unfavorable currency translation of $11.9 million, or 2%. The comparable decline (exclusive of currency translation) was $60.8 million, or 12%. Of this decline, Europe accounted for $56 million - of which approximately $32 million was anticipated from our previously announced plans to restructure the business and focus on more profitable products, channels and/or geographic markets. The remaining $24 million in European sales decline together with an $11 million decline in our Australian sales was due to weak consumer demand, lower pricing, customer focus on lower-price-point items and share loss to our customers' directly sourced opening price point items. We achieved some modest growth in the legacy Latin American business that partially offset the declines noted above.
ACCO Brands International operating income increased $3.1 million, or 5%, to $62.0 million, and operating income margin decreased to 11.2% from 11.7% in the prior-year period. The acquisition of Mead C&OP contributed $19.8 million, net of other
29
charges consisting of $1.8 million in amortization of the acquisition step-up in inventory value. Europe also incurred $3.4 million in restructuring charges, primarily during the first quarter of 2012. The remaining decrease of $13.3 million in operating income was primarily driven by lower sales volume and pricing in Australia. The European business largely offset its substantial top-line decline through cost reductions.
Computer Products Group
Computer Products net sales decreased $11.2 million, or 6%, to $179.1 million compared to $190.3 million in the prior-year period. Unfavorable foreign currency translation decreased sales by $4.3 million, or 2%. The remaining decrease primarily reflects lower net pricing due to promotions and the loss of $3.2 million in royalty income. Volume increased slightly as sales of new products for smartphones and tablets offset lower sales of PC accessories, including high-margin PC security products.
Operating income decreased $11.2 million, or 24%, to $35.9 million, and operating margin decreased to 20.0% from 24.8%. The decrease was primarily due to lower pricing, loss of royalty income and unfavorable product mix, impacted by the lower security product volume as noted above.
Fiscal 2011 versus Fiscal 2010
The following table presents the Company’s results for the years ended December 31, 2011, and 2010.
| Year Ended December 31, | Amount of Change | ||||||||||||||
| (in millions of dollars) | 2011 | 2010 | $ | % | |||||||||||
| Net sales | $ | 1,318.4 | $ | 1,284.6 | $ | 33.8 | 3 | % | |||||||
| Cost of products sold | 919.2 | 902.0 | 17.2 | 2 | % | ||||||||||
| Gross profit | 399.2 | 382.6 | 16.6 | 4 | % | ||||||||||
| Gross profit margin | 30.3 | % | 29.8 | % | 0.5 | pts | |||||||||
| Advertising, selling, general and administrative expenses | 278.4 | 266.7 | 11.7 | 4 | % | ||||||||||
| Amortization of intangibles | 6.3 | 6.7 | (0.4 | ) | (6 | )% | |||||||||
| Restructuring income | (0.7 | ) | (0.5 | ) | (0.2 | ) | (40 | )% | |||||||
| Operating income | 115.2 | 109.7 | 5.5 | 5 | % | ||||||||||
| Operating income margin | 8.7 | % | 8.5 | % | 0.2 | pts | |||||||||
| Interest expense, net | 77.2 | 78.3 | (1.1 | ) | (1 | )% | |||||||||
| Equity in earnings of joint ventures | (8.5 | ) | (8.3 | ) | 0.2 | 2 | % | ||||||||
| Other expense, net | 3.6 | 1.2 | 2.4 | 200 | % | ||||||||||
| Income tax expense | 24.3 | 30.7 | (6.4 | ) | (21 | )% | |||||||||
| Effective tax rate | 56.6 | % | 79.7 | % | NM | ||||||||||
| Income from continuing operations | 18.6 | 7.8 | 10.8 | NM | |||||||||||
| Income from discontinued operations, net of income taxes | 38.1 | 4.6 | 33.5 | 728 | % | ||||||||||
| Net income | 56.7 | 12.4 | 44.3 | NM | |||||||||||
Net Sales
Net sales increased $33.8 million, or 3%, to $1.32 billion, primarily due to translation gains from the U.S. dollar weakening relative to the prior-year period, which favorably impacted sales by $39.8 million, or 3%. Underlying sales declined modestly as lower volume in the International and Americas segments were partially offset by higher pricing and volumes gains in the Computer Products segment.
Cost of Products Sold
Cost of products sold includes all manufacturing, product sourcing and distribution costs, including depreciation related to assets used in the manufacturing, procurement and distribution process, allocation of certain information technology costs supporting those processes, inbound and outbound freight, shipping and handling costs, purchasing costs associated with materials and packaging used in the production processes. Cost of products sold increased $17.2 million, or 2% to $919.2 million. The
30
increase reflects the impact of unfavorable currency translation of $25.8 million as well as higher commodity and fuel costs, which were partially offset by lower sales volume and improved manufacturing, freight and distribution efficiencies.
As part of the inclusion of Mead C&OP's financial results with those of the Company, certain information technology costs associated with the manufacturing and distribution operations have been reclassified from advertising, selling, general and administrative expenses to cost of products sold. This reclassification was done to enable the financial results of the two businesses to be consistent and to better reflect those costs associated with the cost of products sold. All prior periods have been reclassified to make the results comparable. For the years ended December 31, 2011 and 2010, reclassified costs totaled $15.5 million and $14.6 million, respectively. These historical reclassifications were not material and had no effect on net income.
Gross Profit
Management believes that gross profit and gross profit margin provide enhanced shareholder appreciation of underlying profit drivers. Gross profit increased $16.6 million, or 4%, to $399.2 million. The increase in gross profit was primarily due to the benefit from favorable currency translation of $14.0 million. Gross profit margin increased to 30.3% from 29.8%, primarily due to improved freight and distribution efficiencies, particularly in Europe.
SG&A (Advertising, selling, general and administrative expenses)
SG&A expenses include advertising, marketing, selling (including commissions), research and development, customer service, depreciation related to assets outside the manufacturing and distribution processes and all other general and administrative expenses outside the manufacturing and distribution functions (e.g., finance, human resources, etc.). SG&A increased $11.7 million, or 4%, to $278.4 million, of which currency translation contributed $6.8 million of the increase. SG&A as a percentage of sales increased to 21.1% from 20.8% . This increase was due to $5.6 million in costs associated with the pending acquisition of Mead C&OP. Business rationalization charges of $4.5 million, primarily incurred in the first quarter of 2011, were offset by savings during the rest of the 2011.
Operating Income
Operating income increased $5.5 million, or 5%, to $115.2 million, and as a percentage of sales, operating income increased modestly to 8.7% from 8.5%. The increase in operating income was driven by $7.0 million of favorable currency translation and improved gross margins, partially offset by the SG&A cost increases described above.
Interest Expense, Net and Other Expense, Net
Interest expense was $77.2 million compared to $78.3 million in the prior-year. The decrease in interest was due to repurchases of our Senior Secured Notes and Senior Subordinated Notes totaling $34.9 million and $25.0 million, respectively, as well as lower borrowings under our revolving credit facility during the year. This reduction was partially offset by the acceleration of debt origination amortization costs resulting from bond repurchases of $1.2 million.
Other expense was $3.6 million compared to $1.2 million in the prior-year period. The increase was due to $3.0 million of premium paid on the repurchase of $34.9 million of the Senior Secured Notes, partially offset by lower foreign exchange losses in the current year.
Income Taxes
Income tax expense from continuing operations was $24.3 million on income before taxes of $42.9 million compared to an income tax expense from continuing operations of $30.7 million on income before taxes of $38.5 million in the prior year. The high effective tax rates for 2011 and 2010 are due to no tax benefit being provided on losses incurred in the U.S. and certain foreign jurisdictions where valuation reserves are recorded against future tax benefits. Included in the 2011 amount is a $2.8 million benefit from the reversal of a valuation reserve in the U.K. Included in the 2010 amount is an $8.6 million expense recorded to reflect the tax impact of foreign currency fluctuations on an intercompany debt obligation, partially offset by the benefit of a $2.8 million out-of-period adjustment to increase deferred tax assets of a non-U.S. subsidiary.
Income from Continuing Operations
Income from continuing operations was $18.6 million, or $0.32 per diluted share, compared to income of $7.8 million, or $0.14 per diluted share in the prior-year period.
31
Income from Discontinued Operations
Income from discontinued operations was $38.1 million, or $0.66 per diluted share, compared to income of $4.6 million, or $0.08 per diluted share in the prior-year period.
Discontinued operations include the results of GBC Fordigraph, which was sold during the second quarter of 2011, and the commercial print finishing business, which was sold during 2009. For a further discussion of discontinued operations see Note 19, Discontinued Operations, to the consolidated financial statements contained in Item 8 of this report.
The components of discontinued operations for the years ended December 31, 2011 and 2010 are as follows:
| (in millions of dollars) | 2011 | 2010 | |||||
| Income from operations before income tax | $ | 2.5 | $ | 6.6 | |||
| Gain (loss) on sale before income tax | 41.5 | (0.1 | ) | ||||
| Income tax expense | 5.9 | 1.9 | |||||
| Income from discontinued operations | $ | 38.1 | $ | 4.6 | |||
Net Income
Net income was $56.7 million, or $0.98 per diluted share, compared to net income of $12.4 million, or $0.22 per diluted share, in the prior-year period.
Segment Discussion
| Year Ended December 31, 2011 | Amount of Change | |||||||||||||||||||||||||
| Net Sales | Segment Operating Income (A) | Operating Income Margin | Net Sales | Net Sales | Segment Operating Income | Segment Operating Income | Margin Points | |||||||||||||||||||
| (in millions of dollars) | $ | % | $ | % | ||||||||||||||||||||||
| ACCO Brands North America | $ | 623.1 | $ | 37.4 | 6.0 | % | $ | (8.5 | ) | (1)% | $ | (6.8 | ) | (15 | )% | (100 | ) | |||||||||
| ACCO Brands International | 505.0 | 58.9 | 11.7 | % | 29.0 | 6% | 15.3 | 35 | % | 250 | ||||||||||||||||
| Computer Products Group | 190.3 | 47.1 | 24.8 | % | 13.3 | 8% | 4.1 | 10 | % | 50 | ||||||||||||||||
| Total segment sales | $ | 1,318.4 | $ | 143.4 | $ | 33.8 | $ | 12.6 | ||||||||||||||||||
| Year Ended December 31, 2010 | ||||||||||||||||||||||||||
| Net Sales | Segment Operating Income (A) | Operating Income Margin | ||||||||||||||||||||||||
| (in millions of dollars) | ||||||||||||||||||||||||||
| ACCO Brands North America | $ | 631.6 | $ | 44.2 | 7.0 | % | ||||||||||||||||||||
| ACCO Brands International | 476.0 | 43.6 | 9.2 | % | ||||||||||||||||||||||
| Computer Products Group | 177.0 | 43.0 | 24.3 | % | ||||||||||||||||||||||
| Total segment operating income | $ | 1,284.6 | $ | 130.8 | ||||||||||||||||||||||
(A) Segment operating income excludes corporate costs; Interest expense, net; Equity in earnings of joint ventures and Other expense, net. See Note 16, Information on Business Segments, to the consolidated financial statements contained in Item 8 of this report for a reconciliation of total segment operating income to income from continuing operations before income taxes.
ACCO Brands North America
ACCO Brands North America net sales decreased $8.5 million, or 1% to $623.1 million, compared to $631.6 million in the prior-year period. Foreign currency translation favorably impacted sales by $3.9 million. Sales volume declined 4%, primarily in the U.S. due to inventory management initiatives by certain customers. The decline was partially offset by higher pricing and increased volumes in Canada.
32
Operating income decreased $6.8 million, or 15%, to $37.4 million and included favorable foreign currency translation of $0.6 million. Operating income margin decreased to 6.0% from 7.0% in the prior-year period primarily due to the deleveraging of fixed costs due to lower sales volume.
ACCO Brands International
ACCO Brands International net sales increased $29.0 million, or 6%, to $505.0 million, compared to $476.0 million in the prior-year period. The increase was driven by foreign currency translation, which increased sales by $31.4 million, or 7%. Sales volume declined 3% due to weak European market demand, partially offset by European price increases and small volume gains in the Latin America and Asia-Pacific regions.
Operating income increased $15.3 million, or 35%, to $58.9 million, including a $4.9 million benefit from foreign currency translation. Operating income margin increased to 11.7% from 9.2%, mainly due to the substantial improvements in European operations, resulting from higher pricing, improved freight and distribution efficiencies, as well as SG&A savings. Included in the net SG&A savings were $4.5 million of business rationalization charges within Europe.
Computer Products Group
Computer Products net sales increased $13.3 million, or 8%, to $190.3 million. The favorable impact from foreign currency translation increased sales by $4.5 million, or 3%. The remainder of the increase primarily reflects volume gains from sales of new accessory products for smartphones and tablets.
Operating income increased $4.1 million, or 10%, to $47.1 million, resulting from a $1.5 million benefit from foreign currency translation, higher volume and lower SG&A expenses, partially offset by lower security product sales, which adversely impacted both margin and royalty income. Operating income margins increased to 24.8% from 24.3% primarily due to the favorable benefit from increased sales, partially offset by the adverse sales mix.
Liquidity and Capital Resources
Our primary liquidity needs are to service indebtedness, reduce our borrowing, fund capital expenditures and support working capital requirements. Our principal sources of liquidity are cash flows from operating activities, cash and cash equivalents held and seasonal borrowings under our senior secured revolving credit facility. We maintain adequate financing arrangements at market rates. Because of the seasonality of our business we typically carry greater cash balances in the first, second and third quarters of our fiscal year. Lower cash balances are typically carried during the fourth quarter due to the absorption of our Brazilian cash into working capital. Our Brazilian business is highly seasonal due to the combined impact of the back-to-school season coinciding with the calendar year-end in the fourth quarter. Due to various tax laws, it is costly to transfer short-term working capital in and out of Brazil. Our normal practice is therefore to hold seasonal cash requirements within Brazil, invested in Brazilian government securities. Our priority for all other cash flow use over the near term, after funding internal growth, is debt reduction, and investment in new products through both organic development and acquisitions.
Any available overseas cash, other than that held for working capital requirements in Brazil, is repatriated on a continuous basis. Undistributed earnings of foreign subsidiaries that are expected to be permanently reinvested and thus not available for repatriation, aggregate approximately $586 million and $517 million as of December 31, 2012 and 2011, respectively. If these amounts were distributed to the U.S., in the form of a dividend or otherwise, we would be subject to additional U.S. income taxes. Determination of the amount of unrecognized deferred income tax liabilities on these earnings is not practicable.
Refinancing Transactions
On May 1, 2012 we entered into a refinancing in conjunction with the Merger.
For further information on our refinancing see Introduction - Mead C&OP Merger and Debt Refinancing contained elsewhere in Item 7 of this report and Note 4, Long-term Debt and Short-term Borrowings, to the consolidated financial statements contained in Item 8 of this report.
Loan Covenants
We must meet certain restrictive financial covenants as defined under the senior secured credit facilities. The covenants become more restrictive over time and require us to maintain certain ratios related to consolidated leverage and consolidated interest coverage. We are also subject to certain customary restrictive covenants under the senior unsecured notes.
33
The table below sets forth the financial covenant ratio levels under the senior secured credit facilities:
Maximum Consolidated Leverage Ratio(1) | Minimum - Interest Coverage Ratio(2) | |||
| May 1, 2012 to December 31, 2012 | 4.50:1.00 | 3.00:1.00 | ||
| January 1, 2013 to December 31, 2013 | 4.25:1.00 | 3.00:1.00 | ||
| January 1, 2014 to December 31, 2014 | 4.00:1.00 | 3.25:1.00 | ||
| January 1, 2015 to December 31, 2015 | 3.75:1.00 | 3.25:1.00 | ||
| January 1, 2016 and thereafter | 3.50:1.00 | 3.50:1.00 | ||
| (1) | The leverage ratio is computed by dividing our net funded indebtedness by the cumulative four-quarter-trailing EBITDA, which excludes restructuring, transaction costs, integration and other charges up to certain limits as well as other adjustments defined under the senior secured credit facilities. |
| (2) | The interest coverage ratio for any period is the cumulative four-quarter-trailing EBITDA, for the Company, for such period, adjusted as provided in (1), divided by cash interest expense for the Company for such period and other adjustments, all as defined under the senior secured credit facilities. |
The senior secured credit facilities contain customary events of default, including payment defaults, breach of representations and warranties, covenant defaults, cross-defaults and cross-accelerations, certain bankruptcy or insolvency events, certain ERISA-related events, changes in control or ownership, and invalidity of any loan document.
The indenture governing the senior unsecured notes does not contain financial performance covenants. However, that indenture does contain covenants that limit, among other things, our ability and the ability of our restricted subsidiaries to:
incur additional indebtedness;
pay dividends on our capital stock or repurchase our capital stock;
enter into or permit to exist contractual limits on the ability of our subsidiaries to pay dividends to the Company;
enter into certain transactions with affiliates;
make investments;
create liens; and
sell certain assets or merge with or into other companies.
Certain of these covenants will be subject to suspension when and if the notes are rated at least “BBB–” by Standard & Poor’s or at least “Baa3” by Moody’s. Each of the covenants is subject to a number of important exceptions and qualifications.
See also Note 4, Long-term Debt and Short-term Borrowings, to the consolidated financial statements contained in Item 8 of this report.
Compliance with Loan Covenants
As of December 31, 2012 our Leverage Ratio was approximately 3.7 to 1 and the Interest Coverage was approximately 4.5 to 1. The amount available for borrowings under our revolving credit facilities was $238.5 million (allowing for $11.5 million of letters of credit outstanding on that date).
As of and for the period ended December 31, 2012, we were in compliance with all applicable loan covenants.
Guarantees and Security
Obligations under the senior secured credit facilities are guaranteed by certain of our existing and future domestic subsidiaries. In the case of the obligations of ACCO Brands Canada its Senior Secured Term Loan A is guaranteed by its future subsidiaries and by our other existing and future Canadian subsidiaries.
The senior unsecured notes are fully and unconditionally guaranteed, jointly and severally, on a senior unsecured basis by each of our existing and future domestic subsidiaries other than certain excluded subsidiaries. The senior unsecured notes and the related guarantees will rank equally in right of payment with all of the existing and future senior debt of the Company, Mead Products and the guarantors, senior in right of payment to all of the existing and future subordinated debt of the Company, Mead Products and the guarantors, and effectively subordinated to all of the existing and future secured indebtedness of the Company,
34
Mead Products and the guarantors to the extent of the value of the assets securing such indebtedness. The senior unsecured notes and the guarantees will be structurally subordinated to all existing and future liabilities, including trade payables, of each of the Company's and Mead Products’ subsidiaries that do not guarantee the notes.
Cash Flow
Fiscal 2012 versus Fiscal 2011
Cash Flow from Operating Activities
For the year ended December 31, 2012, cash used by operating activities was $7.5 million, compared to the cash provided in the prior-year period of $61.8 million. Net income for 2012 was $115.4 million, compared to $56.7 million in 2011. Non-cash and non-operating adjustments to net income on a pre-tax basis in 2012 totaled $106.6 million, compared to $10.0 million in 2011. The 2012 net adjustments were substantially higher than 2011, largely due to the inclusion of Mead C&OP in 2012 and the sale of GBC Fordigraph in 2011 which resulted in a pre-tax net gain of $41.9 million.
The operating cash outflow in 2012 of $7.5 million for the year ended December 31, 2012 was driven by the May 1, 2012 timing of the Merger with Mead C&OP, and only includes the cash flow from Mead C&OP since that date. The outflow includes cash payments of $16.1 million related to the transaction and $61.6 million related to the associated debt extinguishment and refinancing. This was largely offset by cash generated from operating profits. The use of cash for net working capital was $117.0 million in 2012, and reflects a large seasonal investment in working capital for the Mead C&OP business. The Mead business has a very seasonal cash flow pattern whereby strong sales during the fourth quarter result in substantial accounts receivable at the end of the year and strong cash collections during the early part of the following year. As a result, nearly all of the Mead annual net cash generation occurs during the first quarter. The use of cash for accounts payable reflects lower inventory purchases, primarily for Mead C&OP, due to the seasonally lower sales volume anticipated during the first quarter. Other significant cash payments in 2012 included interest payments of $79.3 million (excluding financing-related payments), income tax payments of $28.8 million and contributions to the Company's pension and defined benefit plans of $19.2 million.
The table below shows our cash flow from accounts receivable, inventories and accounts payable for the years ended December 31, 2012 and 2011, respectively:
| 2012 | 2011 | |||||||
| Accounts receivable | $ | (153.8 | ) | $ | 0.6 | |||
| Inventories | 61.8 | 5.4 | ||||||
| Accounts payable | (25.0 | ) | 16.8 | |||||
| Cash flow (used by)/provided by net working capital | $ | (117.0 | ) | $ | 22.8 | |||
Cash Flow from Investing Activities
Cash used by investing activities was $423.2 million for the year ended December 31, 2012 and reflects $397.5 million of net cash paid for Mead C&OP. For additional information, see Note 3, Acquisitions, to the consolidated financial statements contained in Item 8 of this report. Cash provided by investing activities in 2011 was $40.0 million and included proceeds from the sale of GBC Fordigraph of $53.6 million. Capital expenditures were $30.3 million and $13.5 million for the years ended December 31, 2012 and 2011, respectively. The increase in capital expenditures reflects the acquisition of Mead C&OP, as well as additional investments in information technology systems, including the cost of replacing the IT infrastructure previously supplied by Mead C&OP's former parent company. During 2012, the Company also received net proceeds of $3.1 million from the sale of assets, which included a manufacturing facility located in the United Kingdom. In addition, $1.5 million of net proceeds associated with the 2009 sale of the Company’s former commercial print finishing business were collected in 2012, while additional cash expenditures associated with the sale and exit of the business of approximately $2.4 million are anticipated during the Company2013 year.
Cash Flow from Financing Activities
Cash provided by financing activities for the year ended December 31, 2012 was $360.1 million, and its predecessor as employees (orincludes proceeds from new debt facilities of $1.27 billion, offset by repayments of the Company's extinguished and new debt facilities of $872.0 million and debt issuance payments of $38.5 million. Cash used by financing activities in 2011 was $63.1 million, primarily representing repayments of long-term debt.
35
Fiscal 2011 versus Fiscal 2010
Cash Flow from Operating Activities
For the year ended December 31, 2011, cash provided by operating activities was $61.8 million, compared to $54.9 million in the caseprior year. Net income for 2011 was $56.7 million, compared to $12.4 million in 2010. Non-cash and non-operating adjustments to net income on a pre-tax basis in 2011 totaled $10.0 million, compared to $46.2 million in 2010. The 2011 net adjustments were substantially lower than 2010, largely due to the sale of Mr. Rubin, as an employeeGBC Fordigraph which resulted in a pre-tax net gain of General Binding Corporation (“GBC”)$41.9 million.
The table below shows our cash flow from accounts receivable, inventories and accounts payable for the years ended December 31, 2011 and 2010, respectively:
| 2011 | 2010 | |||||||
| Accounts receivable | $ | 0.6 | $ | (18.5 | ) | |||
| Inventories | 5.4 | (9.8 | ) | |||||
| Accounts payable | 16.8 | 14.8 | ||||||
| Cash flow from net working capital | $ | 22.8 | $ | (13.5 | ) | |||
Operating cash flow in 2011 of $61.8 million was the result of the realization of income from operations and net working capital, partially offset by the use of cash to fund income tax and interest payments and contributions to our pension plans. Compared to the prior year, accounts receivable levels reflect improved customer collections and increased sales in the early part of the fourth quarter, which allowed us to its mergercollect more of our receivables before the end of the quarter. Inventory levels demonstrate improved supply chain management. Payments associated with the predecessor2010 annual incentive plan of approximately $9 million were made during the first quarter of 2011, compared to approximately $1 million in the prior year. Income tax payments were $27.7 million in 2011, compared to only $13.9 million in the 2010 period when we benefited from substantial refunds related to prior years and had lower operating profit. Interest payments of $71.9 million were slightly higher than the prior year, while contributions to our pension plans of $13.5 million were slightly less than payments made during the prior year. Payments associated with our wind-down of restructuring activities were $3.4 million, while European business rationalization activity resulted in payments of $4.2 million during 2011. In addition, the second half of 2011 included payments in pursuit of the CompanyMead C&OP acquisition of $4.8 million.
During the 2010 year, a recurring pattern of strong sales during the final month of each quarter lead to high quarter-end accounts receivable balances. In addition, inventory levels increased due to higher commodity costs and in August 2005)support of the sales growth anticipated during the first quarter of 2011.
Cash Flow from Investing Activities
Cash provided by investing activities was $40.0 million for the past fiveyear ended December 31, 2011 and cash used was $14.9 million for the year ended December 31, 2010. The sale of GBC Fordigraph during the second quarter of 2011 generated net proceeds of $52.9 million, and approximately $5.4 million of taxes associated with the sale were paid in 2012. We also received $0.6 million of net proceeds associated with the 2009 sale of our former commercial print finishing business. Capital expenditures were $13.5 million and $12.6 million for the periods ended December 31, 2011 and 2010, respectively. Additional cash payments of $1.4 million associated with the purchase of two minor product line acquisitions were also recognized during the first half of 2011.
Cash Flow from Financing Activities
Cash used by financing activities was $63.1 million and $0.1 million for the years ended December 31, 2011 and 2010, respectively. During 2011, principally during the third quarter, we repurchased $59.9 million of our Senior Subordinated Notes and Senior Secured Notes debt.
Capitalization
We had approximately 113.1 million common shares outstanding as of December 31, 2012.
36
Adequacy of Liquidity Sources
We are subject to credit risk relative to the ability of counterparties to meet their contractual payment obligations or the potential non-performance of counterparties to deliver contracted commodities or services at the contracted price. The impact of any global economic downturn and the ability of our suppliers and customers to access credit markets is also unpredictable, outside of our control and may create additional risks for us, both directly and indirectly. The inability of suppliers to access financing or the insolvency of one or more of our suppliers could lead to disruptions in our supply chain, which could adversely impact our sales and/or increase our costs. Our suppliers may require us to pay cash in advance or obtain letters of credit for their benefit as a condition to selling us their products and services. If one or more of our principal customers were to file for bankruptcy, our sales could be adversely impacted and our ability to collect outstanding accounts receivable from any such customer could be limited. Any of these risks and uncertainties could have a material adverse effect on our business, financial condition, results of operations or cash flows.
Based on our 2013 business plan and latest forecasts, we believe that cash flow from operations, our current cash balance and other sources of liquidity, including borrowings available under our senior secured revolving credit facility will be adequate to support requirements for working capital, capital expenditures, and to service indebtedness for the foreseeable future. Our future operating performance is dependent on many factors, some of which are beyond our control, including prevailing economic, financial and industry conditions.
Our operating performance is dependent on our continued ability to access funds under our credit and loan agreements, including under our senior secured revolving credit facility and from cash on hand, maintain sales volumes, drive profitable growth, realize cost savings and generate cash from operations. The financial institutions that fund our senior secured revolving credit facility could also be impacted by any volatility in the capacity indicated abovecredit markets, and if one or more of them could not fulfill our revolving credit requests, our operations may be adversely impacted. If our revolving credit is unavailable due to a lender not being able to fund requested amounts, or because we have not maintained compliance with our covenants, or we do not meet our sales or growth initiatives within the time frame we expect, our cash flow could be materially adversely impacted. A material decrease in our cash flow could cause us to fail to meet our obligations under our borrowing arrangements. A default under our credit or loan agreements could restrict or terminate our access to borrowings and materially impair our ability to meet our obligations as they come due. If we do not comply with any of our covenants and thereafter we do not obtain a substantially similar capacity except:
waiver or amendment that otherwise addresses that non-compliance, our lenders may accelerate payment of all amounts outstanding under the affected borrowing arrangements, which amounts would immediately become due and payable, together with accrued interest. Such acceleration would cause a default under the agreements governing the senior secured term loans and other agreements that provide us with access to funding. Any one or more defaults, or our inability to generate sufficient cash flow from our operations in the future to service our indebtedness and meet our other needs, may require us to refinance all or a portion of our existing indebtedness or obtain additional financing or reduce expenditures that we deem necessary to our business. There can be no assurance that any refinancing of this kind would be possible or that any additional financing could be obtained. The inability to obtain additional financing could have a material adverse effect on our financial condition and on our ability to meet our obligations to noteholders.
37
Our contractual obligations and related payments by period at December 31, 2012 were as follows:
| 2013 | 2014 - 2015 | 2016 -2017 | Thereafter | Total | |||||||||||||||
| (in millions of dollars) | |||||||||||||||||||
| Contractual obligations | |||||||||||||||||||
Debt(1) | $ | 1.3 | $ | 52.3 | $ | 191.8 | $ | 826.7 | $ | 1,072.1 | |||||||||
Interest on debt(2) | 56.5 | 111.3 | 101.6 | 102.9 | 372.3 | ||||||||||||||
| Operating lease obligations | 21.0 | 34.0 | 25.5 | 48.4 | 128.9 | ||||||||||||||
Purchase obligations(3) | 89.4 | 16.2 | 16.1 | — | 121.7 | ||||||||||||||
Other long-term liabilities(4) | 14.3 | — | — | — | 14.3 | ||||||||||||||
| Total | $ | 182.5 | $ | 213.8 | $ | 335.0 | $ | 978.0 | $ | 1,709.3 | |||||||||
| (1) | The required 2013, 2014 and some 2015 principal cash payments on the U.S. Dollar and Canadian Dollar Senior Secured Term Loans were made in 2012. |
| (2) | Interest calculated at December 31, 2012 rates for variable rate debt. |
| (3) | Purchase obligations primarily consist of contracts and non-cancelable purchase orders for raw materials and finished goods. |
| (4) | Obligations related to the Company’s pension plans. |
Due to the uncertainty with respect to the timing of future cash flows associated with our unrecognized tax benefits at December 31, 2012, we are unable to make reasonably reliable estimates of the period of cash settlement with the respective taxing authorities. Therefore, $56.3 million of unrecognized tax benefits have been excluded from the contractual obligations table above. See Note 11, Income Taxes, to the consolidated financial statements contained in Item 8 of this report for a discussion on income taxes.
Critical Accounting Policies
Our financial statements are prepared in conformity with accounting principles generally accepted in the U.S. Preparation of our financial statements require us to make judgments, estimates and assumptions that affect the amounts of actual assets, liabilities, revenues and expenses presented for each reporting period. Actual results could differ significantly from those estimates. We regularly review our assumptions and estimates, which are based on historical experience and, where appropriate, current business trends. We believe that the following discussion addresses our critical accounting policies, which require more significant, subjective and complex judgments to be made by our management.
Revenue Recognition
We recognize revenue from product sales when earned, net of applicable provisions for discounts, returns and allowances. We consider revenue to be realized or realizable and earned when all of the following criteria are met: title and risk of loss have passed to the customer, persuasive evidence of an arrangement exists, delivery has occurred, the price is fixed or determinable and collectability is reasonably assured. We also provide for our estimate of potential bad debt at the time of revenue recognition.
Allowances for Doubtful Accounts and Sales Returns
Trade receivables are recorded at the stated amount, less allowances for discounts, doubtful accounts and returns. The allowance for doubtful accounts represents estimated uncollectible receivables associated with potential customer defaults on contractual obligations, usually due to customers’ potential insolvency. The allowance includes amounts for certain customers where a risk of default has been specifically identified. In addition, the allowance includes a provision for customer defaults on a general formula basis when it is determined the risk of some default is probable and estimable, but cannot yet be associated with specific customers. The assessment of the likelihood of customer defaults is based on various factors, including the length of time the receivables are past due, historical experience and existing economic conditions.
The allowance for sales returns represents estimated uncollectible receivables associated with the potential return of products previously sold to customers, and is recorded at the time that the sales are recognized. The allowance includes a general provision for product returns based on historical trends. In addition, the allowance includes a reserve for currently authorized customer returns that are considered to be abnormal in comparison to the historical basis.
38
Inventories
Inventories are priced at the lower of cost (principally first-in, first-out with minor amounts at average) or market. A reserve is established to adjust the cost of inventory to its net realizable value. Inventory reserves are recorded for obsolete or slow moving inventory based on assumptions about future demand and marketability of products, the impact of new product introductions and specific identification of items, such as product discontinuance or engineering/material changes. These estimates could vary significantly, either favorably or unfavorably, from actual requirements if future economic conditions, customer inventory levels or competitive conditions differ from expectations.
Property, Plant and Equipment
Property, plant and equipment are carried at cost. Depreciation is provided, principally on a straight-line basis, over the estimated useful lives of the assets. Gains or losses resulting from dispositions are included in operating income. Betterments and renewals, that improve and extend the life of an asset, are capitalized; maintenance and repair costs are expensed. Purchased computer software is capitalized and amortized over the software’s useful life. The following table shows estimated useful lives of property, plant and equipment:
| Buildings | 40 to 50 years | ||
| Leasehold improvements | Lesser of lease term or the life of the asset | ||
| Machinery, equipment and furniture | 3 to 10 years | ||
Long-Lived Assets
We test long-lived assets for impairment whenever events or changes in circumstances indicate that the assets’ carrying amount is not recoverable from its undiscounted cash flows. When such events occur, we compare the sum of the undiscounted cash flows expected to result from the use and eventual disposition of the asset or asset group to the carrying amount of a long-lived asset or asset group. The cash flows are based on our best estimate at the time of future cash flow, derived from the most recent business projections. If this comparison indicates that there is an impairment, the amount of the impairment is typically calculated using discounted expected future cash flows. The discount rate applied to these cash flows is based on our weighted average cost of capital, computed by selecting market rates at the valuation dates for debt and equity that are reflective of the risks associated with an investment in the Company’s industry as estimated by using comparable publicly traded companies.
Intangible Assets
Intangible assets are comprised primarily of indefinite-lived intangible assets acquired and purchased intangible assets arising from the application of purchase accounting. Indefinite-lived intangible assets are not amortized, but are evaluated annually to determine whether the indefinite useful life is appropriate. Indefinite-lived intangibles are tested for impairment on an annual basis and written down when impaired. An interim impairment test is performed if an event occurs or conditions change that would more likely than not reduce the fair value below the carrying value.
In addition, purchased intangible assets other than goodwill are amortized over their useful lives unless their lives are determined to be indefinite. Certain of our trade names have been assigned an indefinite life as we currently anticipate that these trade names will contribute cash flows to ACCO Brands indefinitely.
We review indefinite-lived intangibles for impairment annually, normally in the second quarter, and whenever market or business events indicate there may be a potential adverse impact on a particular intangible. We consider the implications of both external factors (e.g., market growth, pricing, competition, and technology) and internal factors (e.g., product costs, margins, support expenses, and capital investment) and their potential impact on cash flows for each business in both the near and long term, as well as their impact on any identifiable intangible asset associated with the business. Based on recent business results, consideration of significant external and internal factors, and the resulting business projections, indefinite-lived intangible assets are reviewed to determine whether they are likely to remain indefinite-lived, or whether a finite life is more appropriate. In addition, based on events in the period and future expectations, management considers whether the potential for impairment exists. Finite lived intangibles are amortized over 10, 15, 23 or 30 years.
As part of our review in the second quarter of 2012, $21.4 million of the value previously assigned to one of our legacy indefinite-lived trade names was changed to an amortizable intangible asset. The legacy indefinite-lived trade name was not impaired. The change was made in respect of decisions regarding our future use of the trade name. We commenced amortizing the trade name in June of 2012 on a prospective basis over a life of 30 years.
39
Goodwill
We test goodwill for impairment at least annually, normally in the second quarter, and on an interim basis if an event or circumstance indicates that it is more likely than not that an impairment has been incurred. If the carrying amount of the goodwill exceeds its fair value, an impairment loss is recognized. During 2012, we adopted ASU No. 2011-08, Intangibles - Goodwill and Other (Topic 350): Testing Goodwill for Impairment. ASU No. 2011-08 permits an entity to first assess qualitative factors to determine if it is more likely than not that the fair value of a reporting unit is less than its carrying amount as a basis for determining whether it is necessary to perform the two-step goodwill impairment test included in U.S. GAAP. Entities are not required to calculate the fair value of a reporting unit unless they determine that it is more likely than not that the fair value is less than the carrying amount. We concluded it was not necessary to apply the traditional two-step fair value quantitative impairment test in ASC 350 to any of our reporting units in 2012. When applying a fair-value-based test, estimates are made of the expected future cash flows to be derived from each reporting unit. The resulting fair value determination is significantly impacted by estimates of future prices for our products, capital needs, economic trends and other factors.
Given the current economic environment and the uncertainties regarding the impact on our business, there can be no assurance that our estimates and assumptions made for purposes of our qualitative impairment testing during 2012 will prove to be accurate predictions of the future. If our assumptions regarding forecasted revenue or margin growth rates of certain reporting units are not achieved, we may be required to record impairment charges in future periods, whether in connection with our next annual impairment testing in the second quarter of fiscal year 2013 or prior to that, if any such change constitutes a triggering event outside of the quarter from when the annual impairment test is performed. It is not possible at this time to determine if any such future impairment charge would result or, if it does, whether such charge would be material.
Employee Benefit Plans
We provide a range of benefits to our employees and retired employees, including pensions, post-retirement, post-employment and health care benefits. We record annual amounts relating to these plans based on calculations specified by accounting principles generally accepted in the U.S., which include various actuarial assumptions, including discount rates, assumed rates of return, compensation increases, turnover rates and health care cost trend rates. Actuarial assumptions are reviewed on an annual basis and modifications to these assumptions are made based on current rates and trends when it is deemed appropriate. As required by accounting principles generally accepted in the U.S., the effect of our modifications are generally recorded and amortized over future periods. We believe that the assumptions utilized in recording our obligations under the plans are reasonable based on our experience. The actuarial assumptions used to record our plan obligations could differ materially from actual results due to changing economic and market conditions, higher or lower withdrawal rates or other factors which may impact the amount of retirement related benefit expense recorded by us in future periods.
The discount rate assumptions used to determine the post-retirement obligations of the benefit plans is based on a spot-rate yield curve that matches projected future benefit payments with the appropriate interest rate applicable to the timing of the projected future benefit payments. The assumed discount rates reflect market rates for high-quality corporate bonds currently available. Our discount rates were determined by considering the average of pension yield curves constructed of a large population of high quality corporate bonds. The resulting discount rates reflect the matching of plan liability cash flows to the yield curves.
The expected long-term rate of return on plan assets reflects management’s expectations of long-term average rates of return on funds invested based on our investment profile to provide for benefits included in the projected benefit obligations. The expected return is based on the outlook for inflation, fixed income returns and equity returns, while also considering historical returns over the last 10 years, and asset allocation and investment strategy.
At the end of each calendar year an actuarial evaluation is performed to determine the funded status of our pension and post-retirement obligations and any actuarial gain or loss is recognized in other comprehensive income (loss) and then amortized into the income statement in future periods.
Pension expense was $8.9 million, $6.9 million and $8.2 million for the years ended December 31, 2012, 2011 and 2010, respectively. The $2.0 million increase in pension expenses in 2012 compared to 2011 was due to the inclusion of the Mead C&OP plans and the settlement losses on the Supplemental Retirement Plan (the "SRP") as part of the Merger. Post-retirement (income) expense was $(0.8) million, $0.2 million and $0.0 million for the years ended December 31, 2012, 2011 and 2010, respectively.
40
The weighted average assumptions used to determine net cost for years ended December 31, 2012, 2011 and 2010 were:
| Pension Benefits | Post-retirement | |||||||||||||||||||||||||
| U.S. | International | |||||||||||||||||||||||||
| 2012 | 2011 | 2010 | 2012 | 2011 | 2010 | 2012 | 2011 | 2010 | ||||||||||||||||||
| Discount rate | 5.0 | % | 5.5 | % | 5.9 | % | 4.7 | % | 5.4 | % | 5.8 | % | 4.5 | % | 5.0 | % | 5.9 | % | ||||||||
| Expected long-term rate of return | 8.2 | % | 8.2 | % | 8.2 | % | 6.2 | % | 6.4 | % | 6.8 | % | — | — | — | |||||||||||
| Rate of compensation increase | N/A | N/A | N/A | 3.6 | % | 4.4 | % | 4.5 | % | — | — | — | ||||||||||||||
In 2013, we expect pension expenses of approximately $7.2 million and post-retirement income of approximately $0.2 million. The estimated $1.7 million decrease in pension expense for 2013 compared to 2012 is primarily due to higher than expected returns on the plans assets because of higher level of assets at the end of 2012 versus 2011, primarily due to actual market returns and the lack of service costs in our U.K. plan which was frozen to future accruals in 2012. Partially offsetting is a full year of expense for the acquired Mead C&OP plans as opposed to only 8 months of expense in 2012.
A 25-basis point change (0.25%) in our discount rate assumption would lead to an increase or decrease in our pension expense of approximately $1.0 million for 2013. A 25-basis point change (0.25%) in our long-term rate of return assumption would lead to an increase or decrease in pension expense of approximately $1.1 million for 2013.
Pension and post-retirement liabilities of $119.8 million as of December 31, 2012, increased from $106.1 million at December 31, 2011, due to lower discount rates compared to prior year assumptions, partially offset by the actual over performance of the assets of the pension plans compared to the expected long-term rate of return of the assets of the pension plans.
Weighted average assumptions used to determine benefit obligations for years ended December 31, 2012, 2011, and 2010 were:
| Pension Benefits | Post-retirement | |||||||||||||||||||||||||
| U.S. | International | |||||||||||||||||||||||||
| 2012 | 2011 | 2010 | 2012 | 2011 | 2010 | 2012 | 2011 | 2010 | ||||||||||||||||||
| Discount rate | 4.2 | % | 5.0 | % | 5.5 | % | 4.3 | % | 4.7 | % | 5.4 | % | 4.0 | % | 4.5 | % | 5.0 | % | ||||||||
| Rate of compensation increase | N/A | N/A | N/A | 4.0 | % | 3.6 | % | 4.4 | % | — | — | — | ||||||||||||||
Customer Program Costs
Customer programs and incentives are a common practice in our industry. We incur customer program costs to obtain favorable product placement, to promote sell-through of products and to maintain competitive pricing. Customer program costs and incentives, including rebates, promotional funds and volume allowances, are accounted for as a reduction to gross sales. These costs are recorded at the time of sale based on management’s best estimates. Estimates are based on individual customer contracts and projected sales to the customer in comparison to any thresholds indicated by contract. In the absence of a signed contract, estimates are based on historical or projected experience for each program type or customer. Management periodically reviews accruals for these rebates and allowances, and adjusts accruals when circumstances indicate (typically as a result of a change in sales volume expectations or customer contracts).
Income Taxes
Deferred tax liabilities or assets are established for temporary differences between financial and tax reporting bases and are subsequently adjusted to reflect changes in tax rates expected to be in effect when the temporary differences reverse. A valuation allowance is recorded to reduce deferred tax assets to an amount that is more likely than not to be realized. Facts and circumstances may change that cause us to revise the conclusions on our ability to realize certain net operating losses and other deferred tax attributes.
The amount of income taxes that we pay is subject to ongoing audits by federal, state and foreign tax authorities. Our estimate of the potential outcome of any uncertain tax position is subject to management’s assessment of relevant risks, facts and circumstances existing at that time. We believe that we have adequately provided for reasonably foreseeable outcomes related to
41
these matters. However, our future results may include favorable or unfavorable adjustments to our estimated tax liabilities in the period the assessments are revised or resolved.
Deferred income taxes are not provided on certain undistributed earnings of foreign subsidiaries that are expected to be permanently reinvested in those companies, aggregating approximately $586 million and $517 million as of December 31, 2012 and 2011, respectively. If these amounts were distributed to the U.S., in the form of a dividend or otherwise, we would be subject to additional U.S. income taxes. Determination of the amount of unrecognized deferred income tax liabilities on these earnings is not practicable.
Stock–Based Compensation
Stock-based compensation cost is estimated at the grant date based on the fair value of the award, and the cost is recognized as expense ratably over the vesting period. Determining the appropriate fair value model to use requires judgment. Determining the assumptions that enter into the model is highly subjective and also requires judgment, including long-term projections regarding stock price volatility, employee exercise, post-vesting termination, and pre-vesting forfeiture behaviors, interest rates and dividend yields. The grant date fair value of each award is estimated using the Black-Scholes option-pricing model.
We have utilized historical volatility for a pool of peer companies for a period of time that is comparable to the expected life of the option to determine volatility assumptions for stock-based compensation prior to 2012. Beginning with 2012 volatility is calculated using a combination of peer companies (50%) and ACCO Brands' historic volatility (50%). The weighted average expected option term reflects the application of the simplified method, which defines the life as the average of the contractual term of the options and the weighted average vesting period for all option tranches. The risk-free interest rate for the expected term of the option is based on the U.S. Treasury yield curve in effect at the time of grant. Forfeitures are estimated at the time of grant in order to calculate the amount of share-based payment awards ultimately expected to vest. The forfeiture rate is based on historical rates.
The use of different assumptions would result in different amounts of stock compensation expense. Holding all other variables constant, the indicated change in each of the assumptions below increases or decreases the fair value of an option (and hence, expense), as follows:
| Assumption | Change to Assumption | Impact on Fair Value of Option | ||
| Expected volatility | Higher | Higher | ||
| Expected life | Higher | Higher | ||
| Risk-free interest rate | Higher | Higher | ||
| Dividend yield | Higher | Lower | ||
The pre-vesting forfeitures assumption is ultimately adjusted to the actual forfeiture rate. Therefore, changes in the forfeitures assumption would not impact the total amount of expense ultimately recognized over the vesting period. Different forfeitures assumptions would only impact the timing of expense recognition over the vesting period. Estimated forfeitures will be reassessed in subsequent periods and may change based on new facts and circumstances.
Management is not able to estimate the probability of actual results differing from expected results, but believes our assumptions are appropriate, based upon our historical and expected future experience.
We recognized stock-based compensation expense of $9.2 million, $6.3 million and $4.2 million for the years ended December 31, 2012, 2011 and 2010, respectively.
Recent Accounting Pronouncements
In September 2011, the Financial Accounting Standards Board (“FASB”) issued Accounting Standard Update (ASU) No. 2011-08, Intangibles - Goodwill and Other (Topic 350): Testing Goodwill for Impairment. ASU No. 2011-08 was issued to simplify the testing of goodwill for impairment by allowing an optional qualitative factors test to determine whether it is more likely than not that the fair value of a reporting unit is less than its carrying amount as a basis for determining whether it is necessary to perform the two-step goodwill impairment test already included in ASC Topic 350. ASU No. 2011-08 is effective for annual and interim goodwill tests performed for fiscal years after December 15, 2011. We adopted the standard in 2012 and it did not have a significant impact on its consolidated financial statements or results of operations.
42
In July 2012, the FASB issued ASU No. 2012-02, Intangibles-Goodwill and Other (Topic 350): Testing Indefinite-Lived Intangible Assets for Impairment. The revised standard is intended to reduce the cost and complexity of testing indefinite-lived intangible assets other than goodwill for impairment. It allows companies to perform a qualitative assessment to determine whether further impairment testing of indefinite-lived intangible assets is necessary, similar in approach to the goodwill impairment test. It is effective for annual and interim impairment tests performed for fiscal years beginning after September 15, 2012. We will adopt the standard, and it is expected to have no effect on the Companyconsolidated financial statements or results of operations.
In October 2012, the FASB issued ASU No. 2012-04, Technical Corrections and Improvements. The amendments in this ASU affect a wide range of topics, but are generally considered nonsubstantive in nature. It is effective for fiscal periods beginning after December 15, 2012. We will adopt the standard, and it is expected to have no effect on the consolidated financial statements or results of operations.
In February 2013, the FASB issued ASU No. 2013-02, Reporting of Amounts Reclassified Out of Accumulated Other Comprehensive Income. The revised standard is intended to improve the reporting of reclassifications out of accumulated other comprehensive income. It is effective for fiscal periods beginning after December 15, 2012. We will adopt the standard and its required disclosure.
43
ITEM 7A.QUANTITATIVE AND QUALITATIVE DISCLOSURES ABOUT MARKET RISK
Our industry is concentrated in a small number of major customers, principally office products superstores, large retailers, wholesalers and contract stationers. Customer consolidation and share growth of private-label products continue to increase pricing pressures, which may adversely affect margins for us and our competitors. We are addressing these challenges through design innovations, value-added features and services, as well as continued cost and asset reduction.
We are exposed to various market risks, including changes in foreign currency exchange rates and interest rate changes. We enter into financial instruments to manage and reduce the impact of these risks, not for trading or speculative purposes. The counterparties to these financial instruments are major financial institutions.
Foreign Exchange Risk Management
We enter into forward foreign currency and option contracts principally to hedge currency fluctuations in transactions (primarily anticipated inventory purchases and intercompany loans) denominated in foreign currencies, thereby limiting the risk that would otherwise result from changes in exchange rates. The majority of our exposure to local currency movements is in Europe, Australia, Canada, Brazil, Mexico and Japan. All of the existing foreign exchange contracts as of December 31, 2012 have maturity dates in 2013. Increases and decreases in the fair market values of the forward agreements are expected to be offset by gains/losses in recognized net underlying foreign currency transactions or loans. Notional amounts of outstanding foreign currency forward exchange contracts were $175.4 million and $147.5 millionat least,December 31, 2012 and 2011, respectively. The net fair value of these foreign currency contracts was $0.4 million and $2.4 million at December 31, 2012 and 2011, respectively. At December 31, 2012, a 10% unfavorable exchange rate movement in our portfolio of foreign currency forward contracts would have reduced our unrealized gains by $13.9 million. Consistent with the use of these contracts to neutralize the effect of exchange rate fluctuations, such unrealized losses or gains would be offset by corresponding gains or losses, respectively, in the remeasurement of the underlying transactions being hedged. When taken together, we believe these forward contracts and the offsetting underlying commitments do not create material market risk.
For more information related to outstanding foreign currency forward exchange contracts see Note 13, Fair Value of Financial Instruments and Note 14, Derivative Financial Instruments, to the consolidated financial statements contained in Item 8 of this report.
Interest Rate Risk Management
As discussed in Note 4, Long-term Debt and Short-term Borrowings, to the consolidated financial statements contained in Item 8 of this report, our previous debt has been refinanced in conjunction with the Merger with a combination of unsecured notes and senior secured term loans. The unsecured notes have fixed interest rates and, accordingly, are not exposed to market risk resulting from changes in interest rates. However, the fair market value of our long-term fixed interest rate debt is subject to interest rate risk. Generally, the fair market value of fixed interest rate debt will increase as interest rates fall and decrease as interest rates rise. In addition, fair market values will also reflect the credit markets' view of credit risk spreads and our risk profile. These interest rate changes may affect the fair market value of the fixed interest rate debt and any repurchases of these notes, but do not impact our earnings or cash flows.
Interest rates under the senior secured term loans are based on the London Interbank Offered Rate (LIBOR). The range of borrowing costs under the pricing grid is LIBOR plus 3.00% for $242.6 million of the debt and LIBOR plus 3.25% with a LIBOR rate floor of 1.00% for $326.8 million of the debt. We are required to pay a quarterly commitment fee on the unused portion of the senior secured revolving credit facilities ranging from 0.375% to 0.5%, dependent on our consolidated leverage ratio. There were no borrowings outstanding under our senior secured revolving credit facilities as of December 31, 2012.
The following reasons:table summarizes information about our major debt components as of December 31, 2012, including the principal cash payments and interest rates.
44
Debt Obligations
| Stated Maturity Date | |||||||||||||||||||||||||||||||
| (in millions of dollars) | 2013(1) | 2014(1) | 2015(1) | 2016 | 2017 | Thereafter | Total | Fair Value | |||||||||||||||||||||||
| Long term debt: | |||||||||||||||||||||||||||||||
| Fixed rate Unsecured Notes | $ | — | $ | — | $ | — | $ | — | $ | — | $ | 500.0 | $ | 500.0 | $ | 523.8 | |||||||||||||||
| Average fixed interest rate | 6.75 | % | 6.75 | % | 6.75 | % | 6.75 | % | 6.75 | % | 6.75 | % | |||||||||||||||||||
| Variable rate Senior Secured Term Loans (U.S. dollars) | $ | — | $ | — | $ | 49.9 | $ | 99.8 | $ | 71.2 | $ | 326.7 | $ | 547.6 | $ | 549.2 | |||||||||||||||
| Variable rate Senior Secured Term Loan (Canadian dollars) | $ | — | $ | — | $ | 1.0 | $ | 12.1 | $ | 8.7 | $ | — | $ | 21.8 | $ | 21.8 | |||||||||||||||
Average variable interest rate(2) | 3.89 | % | 3.89 | % | 3.94 | % | 4.09 | % | 4.25 | % | 4.25 | % | |||||||||||||||||||
| (1) | The required 2013, 2014 and some 2015 principal cash payments on the U.S. Dollar and Canadian Dollar Senior Secured Term Loans were made in 2012. |
| (2) | Rates presented are as of December 31, 2012. |
45
ITEM 8.FINANCIAL STATEMENTS AND SUPPLEMENTARY DATA
INDEX TO CONSOLIDATED FINANCIAL STATEMENTS
46
The Board of Directors hasand Stockholders of ACCO Brands Corporation:
We have audited the accompanying consolidated balance sheets of ACCO Brands Corporation and subsidiaries as of December 31, 2012 and 2011, and the related consolidated statements of operations, comprehensive income (loss), cash flows, and stockholders' equity (deficit), for each of the years in the three-year period ended December 31, 2012. In connection with our audits of the consolidated financial statements, we also audited the related consolidated financial statement schedule, Schedule II - Valuation and Qualifying Accounts and Reserves. We also have audited ACCO Brands Corporation's internal control over financial reporting as of December 31, 2012, based on criteria established in Internal Control - Integrated Framework issued by the Committee of Sponsoring Organizations of the Treadway Commission (COSO). ACCO Brands Corporation's management is responsible for these consolidated financial statements and financial statement schedule, for maintaining effective internal control over financial reporting, and for its assessment of the effectiveness of internal control over financial reporting, included in the accompanying management report on internal control over financial reporting. Our responsibility is to express an Audit Committee whose membersopinion on these consolidated financial statements and financial statement schedule and an opinion on the Company's internal control over financial reporting based on our audits.
We conducted our audits in accordance with the standards of the Public Company Accounting Oversight Board (United States). Those standards require that we plan and perform the audits to obtain reasonable assurance about whether the financial statements are Messrs. Hargrove (Chairperson), Jenkins, Norkusfree of material misstatement and Mrs. Dvorak. Each member meetswhether effective internal control over financial reporting was maintained in all material respects. Our audits of the independence standardsconsolidated financial statements included examining, on a test basis, evidence supporting the amounts and disclosures in the financial statements, assessing the accounting principles used and significant estimates made by management, and evaluating the overall financial statement presentation. Our audit of internal control over financial reporting included obtaining an understanding of internal control over financial reporting, assessing the risk that a material weakness exists, and testing and evaluating the design and operating effectiveness of internal control based on the assessed risk. Our audits also included performing such other procedures as we considered necessary in the circumstances. We believe that our audits provide a reasonable basis for our opinions.
A company's internal control over financial reporting is a process designed to provide reasonable assurance regarding the reliability of financial reporting and the preparation of financial statements for external purposes in accordance with generally accepted accounting principles. A company's internal control over financial reporting includes those policies and procedures that (1) pertain to the maintenance of records that, in reasonable detail, accurately and fairly reflect the transactions and dispositions of the assets of the company; (2) provide reasonable assurance that transactions are recorded as necessary to permit preparation of financial statements in accordance with generally accepted accounting principles, and that receipts and expenditures of the company are being made only in accordance with authorizations of management and directors of the company; and (3) provide reasonable assurance regarding prevention or timely detection of unauthorized acquisition, use, or disposition of the company's assets that could have a material effect on the financial statements.
Because of its inherent limitations, internal control over financial reporting may not prevent or detect misstatements. Also, projections of any evaluation of effectiveness to future periods are subject to the risk that controls may become inadequate because of changes in conditions, or that the degree of compliance with the policies or procedures may deteriorate.
In our opinion, the consolidated financial statements referred to above present fairly, in all material respects, the financial position of ACCO Brands Corporation and subsidiaries as of December 31, 2012 and 2011, and the results of their operations and their cash flows for each of the years in the three-year period ended December 31, 2012, in conformity with U.S. generally accepted accounting principles. Also in our opinion, the related financial statement schedule, when considered in relation to the basic consolidated financial statements taken as a whole, presents fairly, in all material respects, the information set forth therein. Also in our Corporate Governance Principlesopinion, ACCO Brands Corporation maintained, in all material respects, effective internal control over financial reporting as of December 31, 2012, based on criteria established in Internal Control - Integrated Framework issued by the Committee of Sponsoring Organizations of the Treadway Commission.
ACCO Brands Corporation acquired the Mead Consumer and those set forthOffice Products Business (“Mead C&OP Business”) during 2012, and management excluded from its assessment of the effectiveness of ACCO Brands Corporation's internal control over financial reporting as of December 31, 2012, the Mead C&OP Business's internal control over financial reporting associated with total assets of $514.4 million and total revenues of $551.5 million included in the New York Stock Exchange Listed Company Manual. In addition, each member meetsconsolidated financial statements of ACCO Brands Corporation and subsidiaries as of and for the independence standard under Rule 10A-3year ended December 31, 2012. Our audit of internal control over financial reporting of ACCO Brands Corporation also excluded an evaluation of the internal control over financial reporting of the Mead C&OP Business.
/s/ KPMG LLP
Chicago, Illinois
February 28, 2013
47
MANAGEMENT’S REPORT ON INTERNAL CONTROL OVER FINANCIAL REPORTING
Management of ACCO Brands Corporation and its subsidiaries is responsible for establishing and maintaining adequate internal controls over financial reporting, as defined in Rules 13a-15(f) and 15d-15(f) under the Securities Exchange Act of 1934 (the “Exchange Act”)1934. The Company’s internal control over financial reporting is designed and effected by the Company’s board of directors, management and other personnel to provide reasonable assurance regarding the reliability of the Company’s financial reporting and the preparation of financial statements for external purposes in accordance with U.S. generally accepted accounting principles.
Because of its inherent limitations, internal control over financial reporting may not prevent or detect misstatements. Also, projections of any evaluation of effectiveness to future periods are subject to the risk that controls may become inadequate because of changes in conditions, or that the degree of compliance with the policies or procedures may deteriorate.
As required by Section 404 of the Sarbanes-Oxley Act of 2002, management assessed the effectiveness of the Company’s internal control over financial reporting as of December 31, 2012. Each memberIn making this assessment, management used the criteria set forth by the Committee of Sponsoring Organizations of the Treadway Commission (COSO) in Internal Control-Integrated Framework.
Based on our assessment, management concluded that the Company maintained effective internal control over financial reporting as of December 31, 2012.
The scope of managements' assessment of the effectiveness of internal control over financial reporting includes all of the Company's business units except for the Mead Consumer and Office Products Business (“Mead C&OP”), which was acquired by the Company on May 1, 2012. Consolidated net sales for the year-ended December 31, 2012 were $551.5 million and consolidated assets as of December 31, 2012 were $514.4 million.
The effectiveness of the Company’s internal control over financial reporting as of December 31, 2012 has been audited by KPMG LLP, an independent registered public accounting firm, as stated in their report that appears herein.
/s/ ROBERT J. KELLER | /s/ NEAL V. FENWICK | |
| Robert J. Keller | Neal V. Fenwick | |
| Chairman of the Board and | Executive Vice President and | |
| Chief Executive Officer | Chief Financial Officer | |
| (principal executive officer) | (principal financial officer) | |
| February 28, 2013 | February 28, 2013 | |
48
ACCO Brands Corporation and Subsidiaries
Consolidated Balance Sheets
| December 31, 2012 | December 31, 2011 | ||||||
| (in millions of dollars, except share data) | |||||||
| Assets | |||||||
| Current assets: | |||||||
| Cash and cash equivalents | $ | 50.0 | $ | 121.2 | |||
| Accounts receivable less allowances for discounts, doubtful accounts and returns of $19.3 and $13.9, respectively | 498.7 | 269.5 | |||||
| Inventories | 265.5 | 197.7 | |||||
| Deferred income taxes | 31.1 | 7.6 | |||||
| Other current assets | 29.0 | 26.9 | |||||
| Total current assets | 874.3 | 622.9 | |||||
| Total property, plant and equipment | 591.4 | 463.3 | |||||
| Less accumulated depreciation | (317.8 | ) | (316.1 | ) | |||
| Property, plant and equipment, net | 273.6 | 147.2 | |||||
| Deferred income taxes | 36.4 | 16.7 | |||||
| Goodwill | 589.4 | 135.0 | |||||
| Identifiable intangibles, net of accumulated amortization of $123.3 and $102.3, respectively | 646.6 | 130.4 | |||||
| Other assets | 87.4 | 64.5 | |||||
| Total assets | $ | 2,507.7 | $ | 1,116.7 | |||
| Liabilities and Stockholders' Equity (Deficit) | |||||||
| Current liabilities: | |||||||
| Notes payable to banks | $ | 1.2 | $ | — | |||
| Current portion of long-term debt | 0.1 | 0.2 | |||||
| Accounts payable | 152.4 | 127.1 | |||||
| Accrued compensation | 38.0 | 24.2 | |||||
| Accrued customer program liabilities | 119.0 | 66.8 | |||||
| Accrued interest | 6.3 | 20.2 | |||||
| Other current liabilities | 112.4 | 67.6 | |||||
| Total current liabilities | 429.4 | 306.1 | |||||
| Long-term debt | 1,070.8 | 668.8 | |||||
| Deferred income taxes | 165.0 | 85.6 | |||||
| Pension and post-retirement benefit obligations | 119.8 | 106.1 | |||||
| Other non-current liabilities | 83.5 | 12.0 | |||||
| Total liabilities | 1,868.5 | 1,178.6 | |||||
| Stockholders’ deficit: | |||||||
| Stockholders' equity (deficit): | |||||||
| Preferred stock, $0.01 par value, 25,000,000 shares authorized; none issued and outstanding | — | — | |||||
| Common stock, $0.01 par value, 200,000,000 shares authorized; 113,403,824 and 55,659,753 shares issued and 113,143,344 and 55,475,735 outstanding, respectively | 1.1 | 0.6 | |||||
| Treasury stock, 260,480 and 184,018 shares, respectively | (2.5 | ) | (1.7 | ) | |||
| Paid-in capital | 2,018.5 | 1,407.4 | |||||
| Accumulated other comprehensive loss | (156.1 | ) | (131.0 | ) | |||
| Accumulated deficit | (1,221.8 | ) | (1,337.2 | ) | |||
| Total stockholders' equity (deficit) | 639.2 | (61.9 | ) | ||||
| Total liabilities and stockholders' equity (deficit) | $ | 2,507.7 | $ | 1,116.7 | |||
See notes to consolidated financial statements.
49
ACCO Brands Corporation and Subsidiaries
Consolidated Statements of Operations
| Year Ended December 31, | |||||||||||
| (in millions of dollars, except per share data) | 2012 | 2011 | 2010 | ||||||||
| Net sales | $ | 1,758.5 | $ | 1,318.4 | $ | 1,284.6 | |||||
| Cost of products sold | 1,225.1 | 919.2 | 902.0 | ||||||||
| Gross profit | 533.4 | 399.2 | 382.6 | ||||||||
| Operating costs and expenses: | |||||||||||
| Advertising, selling, general and administrative expenses | 349.9 | 278.4 | 266.7 | ||||||||
| Amortization of intangibles | 19.9 | 6.3 | 6.7 | ||||||||
| Restructuring charges (income) | 24.3 | (0.7 | ) | (0.5 | ) | ||||||
| Total operating costs and expenses | 394.1 | 284.0 | 272.9 | ||||||||
| Operating income | 139.3 | 115.2 | 109.7 | ||||||||
| Non-operating expense (income): | |||||||||||
| Interest expense, net | 89.3 | 77.2 | 78.3 | ||||||||
| Equity in earnings of joint ventures | (6.9 | ) | (8.5 | ) | (8.3 | ) | |||||
| Other expense, net | 61.3 | 3.6 | 1.2 | ||||||||
| Income (loss) from continuing operations before income tax | (4.4 | ) | 42.9 | 38.5 | |||||||
| Income tax (benefit) expense | (121.4 | ) | 24.3 | 30.7 | |||||||
| Income from continuing operations | 117.0 | 18.6 | 7.8 | ||||||||
| Income (loss) from discontinued operations, net of income taxes | (1.6 | ) | 38.1 | 4.6 | |||||||
| Net income | $ | 115.4 | $ | 56.7 | $ | 12.4 | |||||
| Per share: | |||||||||||
| Basic income per share: | |||||||||||
| Income from continuing operations | $ | 1.24 | $ | 0.34 | $ | 0.14 | |||||
| Income (loss) from discontinued operations | $ | (0.02 | ) | $ | 0.69 | $ | 0.08 | ||||
| Basic income per share | $ | 1.23 | $ | 1.03 | $ | 0.23 | |||||
| Diluted income per share: | |||||||||||
| Income from continuing operations | $ | 1.22 | $ | 0.32 | $ | 0.14 | |||||
| Income (loss) from discontinued operations | $ | (0.02 | ) | $ | 0.66 | $ | 0.08 | ||||
| Diluted income per share | $ | 1.20 | $ | 0.98 | $ | 0.22 | |||||
| Weighted average number of shares outstanding: | |||||||||||
| Basic | 94.1 | 55.2 | 54.8 | ||||||||
| Diluted | 96.1 | 57.6 | 57.2 | ||||||||
See notes to consolidated financial statements.
50
ACCO Brands Corporation and Subsidiaries
Consolidated Statements of Comprehensive Income (Loss)
| Year Ended December 31, | |||||||||||
| (in millions of dollars) | 2012 | 2011 | 2010 | ||||||||
| Net income | $ | 115.4 | $ | 56.7 | $ | 12.4 | |||||
| Other comprehensive income (loss), before tax: | |||||||||||
| Unrealized losses on derivative financial instruments: | |||||||||||
| Losses arising during the period | (0.2 | ) | (0.3 | ) | (3.1 | ) | |||||
| Reclassification adjustment for (income) losses included in net income | (1.9 | ) | 4.9 | 1.8 | |||||||
| Foreign currency translation: | |||||||||||
| Foreign currency translation adjustments | (10.9 | ) | (8.9 | ) | 11.0 | ||||||
| Less: reclassification adjustment for sale of GBC Fordigraph Pty Ltd included in net income | — | (6.1 | ) | — | |||||||
| Pension and other post-retirement plans: | |||||||||||
| Actuarial (loss) gain arising during the period | (21.1 | ) | (46.3 | ) | 4.4 | ||||||
| Amortization of actuarial loss and prior service cost included in net income | 7.2 | 7.8 | 7.0 | ||||||||
| Other | (4.5 | ) | 0.9 | 3.0 | |||||||
| Other comprehensive income (loss), before tax | (31.4 | ) | (48.0 | ) | 24.1 | ||||||
| Income tax expense related to items of other comprehensive income (loss) | 6.3 | 3.1 | (3.2 | ) | |||||||
| Comprehensive income | $ | 90.3 | $ | 11.8 | $ | 33.3 | |||||
See notes to consolidated financial statements.
51
ACCO Brands Corporation and Subsidiaries
Consolidated Statements of Cash Flows
| Year Ended December 31, | |||||||||||
| (in millions of dollars) | 2012 | 2011 | 2010 | ||||||||
| Operating activities | |||||||||||
| Net income | $ | 115.4 | $ | 56.7 | $ | 12.4 | |||||
| Amortization of inventory step-up | 13.3 | — | — | ||||||||
| Loss (gain) on disposal of assets | 2.0 | (40.4 | ) | (1.5 | ) | ||||||
| Deferred income tax provision | (9.9 | ) | 3.9 | 12.3 | |||||||
| Release of tax valuation allowance | (145.1 | ) | — | — | |||||||
| Depreciation | 34.5 | 26.5 | 29.6 | ||||||||
| Other non-cash charges | 2.3 | 0.1 | 0.7 | ||||||||
| Amortization of debt issuance costs and bond discount | 9.9 | 8.2 | 6.3 | ||||||||
| Amortization of intangibles | 19.9 | 6.4 | 6.9 | ||||||||
| Stock-based compensation | 9.2 | 6.3 | 4.2 | ||||||||
| Loss on debt extinguishment | 15.5 | 2.9 | — | ||||||||
| Changes in balance sheet items: | |||||||||||
| Accounts receivable | (153.8 | ) | 0.6 | (18.5 | ) | ||||||
| Inventories | 61.8 | 5.4 | (9.8 | ) | |||||||
| Other assets | 7.4 | 0.2 | (5.1 | ) | |||||||
| Accounts payable | (25.0 | ) | 16.8 | 14.8 | |||||||
| Accrued expenses and other liabilities | 30.1 | (27.8 | ) | (2.2 | ) | ||||||
| Accrued income taxes | 2.0 | (1.1 | ) | 7.7 | |||||||
| Equity in earnings of joint ventures, net of dividends received | 3.0 | (2.9 | ) | (2.9 | ) | ||||||
| Net cash (used) provided by operating activities | (7.5 | ) | 61.8 | 54.9 | |||||||
| Investing activities | |||||||||||
| Additions to property, plant and equipment | (30.3 | ) | (13.5 | ) | (12.6 | ) | |||||
| Assets acquired | — | (1.4 | ) | (1.1 | ) | ||||||
| Proceeds (payments) from the sale of discontinued operations | 1.5 | 53.5 | (3.7 | ) | |||||||
| Proceeds from the disposition of assets | 3.1 | 1.4 | 2.5 | ||||||||
| Cost of acquisition, net of cash acquired | (397.5 | ) | — | — | |||||||
| Net cash (used) provided by investing activities | (423.2 | ) | 40.0 | (14.9 | ) | ||||||
| Financing activities | |||||||||||
| Proceeds from long-term debt | 1,270.0 | 0.1 | 1.5 | ||||||||
| Repayments of long-term debt | (872.0 | ) | (63.0 | ) | (0.2 | ) | |||||
| Borrowings (repayments) of short-term debt, net | 1.2 | — | (0.5 | ) | |||||||
| Payments for debt issuance costs | (38.5 | ) | — | (0.8 | ) | ||||||
| Net payments for exercise of stock options | (0.6 | ) | (0.2 | ) | (0.1 | ) | |||||
| Net cash provided (used) by financing activities | 360.1 | (63.1 | ) | (0.1 | ) | ||||||
| Effect of foreign exchange rate changes on cash | (0.6 | ) | (0.7 | ) | (0.3 | ) | |||||
| Net (decrease) increase in cash and cash equivalents | (71.2 | ) | 38.0 | 39.6 | |||||||
| Cash and cash equivalents | |||||||||||
| Beginning of period | 121.2 | 83.2 | 43.6 | ||||||||
| End of period | $ | 50.0 | $ | 121.2 | $ | 83.2 | |||||
| Cash paid during the year for: | |||||||||||
| Interest | $ | 94.9 | $ | 71.9 | $ | 70.6 | |||||
| Income taxes | $ | 28.8 | $ | 27.7 | $ | 13.9 | |||||
| Year Ended December 31, | |||||||||||
| (in millions of dollars) | 2012 | 2011 | 2010 | ||||||||
| Non-cash transactions | |||||||||||
| Common stock issued in conjunction with the Mead C&OP acquisition | $ | 602.3 | $ | — | $ | — | |||||
See notes to consolidated financial statements.
52
ACCO Brands Corporation and Subsidiaries
Consolidated Statements of Stockholders’ Equity (Deficit)
| (in millions of dollars) | Common Stock | Paid-in Capital | Accumulated Other Comprehensive Income (Loss) | Treasury Stock | Accumulated Deficit | Total | |||||||||||||||||
| Balance at December 31, 2009 | $ | 0.5 | $ | 1,397.0 | $ | (107.0 | ) | $ | (1.4 | ) | $ | (1,406.3 | ) | $ | (117.2 | ) | |||||||
| Net loss | — | — | — | — | 12.4 | 12.4 | |||||||||||||||||
| Loss on derivative financial instruments, net of tax | — | — | (0.5 | ) | — | — | (0.5 | ) | |||||||||||||||
| Translation impact | — | — | 11.0 | — | — | 11.0 | |||||||||||||||||
| Pension and post-retirement adjustment, net of tax | — | — | 10.4 | — | — | 10.4 | |||||||||||||||||
| Stock-based compensation activity | 0.1 | 4.2 | — | (0.1 | ) | — | 4.2 | ||||||||||||||||
| Other | — | (0.1 | ) | — | — | — | (0.1 | ) | |||||||||||||||
| Balance at December 31, 2010 | 0.6 | 1,401.1 | (86.1 | ) | (1.5 | ) | (1,393.9 | ) | (79.8 | ) | |||||||||||||
| Net income | — | — | — | — | 56.7 | 56.7 | |||||||||||||||||
| Income on derivative financial instruments, net of tax | — | — | 3.7 | — | — | 3.7 | |||||||||||||||||
| Translation impact | — | — | (15.0 | ) | — | — | (15.0 | ) | |||||||||||||||
| Pension and post-retirement adjustment, net of tax | — | — | (33.6 | ) | — | — | (33.6 | ) | |||||||||||||||
| Stock-based compensation activity | — | 6.3 | — | (0.2 | ) | — | 6.1 | ||||||||||||||||
| Balance at December 31, 2011 | 0.6 | 1,407.4 | (131.0 | ) | (1.7 | ) | (1,337.2 | ) | (61.9 | ) | |||||||||||||
| Net income | — | — | — | — | 115.4 | 115.4 | |||||||||||||||||
| Stock issuance - Mead C&OP acquisition | 0.5 | 601.8 | — | — | — | 602.3 | |||||||||||||||||
| Loss on derivative financial instruments, net of tax | — | — | (2.1 | ) | — | — | (2.1 | ) | |||||||||||||||
| Translation impact | — | — | (10.9 | ) | — | — | (10.9 | ) | |||||||||||||||
| Pension and post-retirement adjustment, net of tax | — | — | (12.1 | ) | — | — | (12.1 | ) | |||||||||||||||
| Stock-based compensation activity | — | 9.4 | — | (0.8 | ) | — | 8.6 | ||||||||||||||||
| Other | — | (0.1 | ) | — | — | — | (0.1 | ) | |||||||||||||||
| Balance at December 31, 2012 | $ | 1.1 | $ | 2,018.5 | $ | (156.1 | ) | $ | (2.5 | ) | $ | (1,221.8 | ) | $ | 639.2 | ||||||||
Shares of Capital Stock
| Common Stock | Treasury Stock | Net Shares | ||||||
| Shares at December 31, 2009 | 54,719,296 | (147,105 | ) | 54,572,191 | ||||
| Stock issuances - stock based compensation | 361,167 | (10,575 | ) | 350,592 | ||||
| Shares at December 31, 2010 | 55,080,463 | (157,680 | ) | 54,922,783 | ||||
| Stock issuances - stock based compensation | 579,290 | (26,338 | ) | 552,952 | ||||
| Shares at December 31, 2011 | 55,659,753 | (184,018 | ) | 55,475,735 | ||||
| Stock issuances - stock based compensation | 654,263 | (76,462 | ) | 577,801 | ||||
| Stock issuance - Mead C&OP acquisition | 57,089,808 | — | 57,089,808 | |||||
| Shares at December 31, 2012 | 113,403,824 | (260,480 | ) | 113,143,344 | ||||
See notes to consolidated financial statements.
53
ACCO Brands Corporation and Subsidiaries
Notes to Consolidated Financial Statements
1. Basis of Presentation
The management of ACCO Brands Corporation is responsible for the accuracy and internal consistency of the preparation of the consolidated financial statements and notes contained in this annual report.
The consolidated financial statements include the accounts of ACCO Brands Corporation and its domestic and international subsidiaries. Intercompany accounts and transactions have been eliminated in consolidation. Our investments in companies that are between 20% and 50% owned are accounted for using the equity method of accounting. ACCO Brands has equity investments in the following joint ventures: Pelikan-Artline Pty Ltd (“Pelikan-Artline”) - 50% ownership; and Neschen GBC Graphic Films, LCC (“Neschen”) - 50% ownership. Our share of earnings from equity investments is included on the line entitled “Equity in earnings of joint ventures” in the consolidated statements of operations. Companies in which our investment exceeds 50% have been consolidated.
On May 1, 2012, we completed the merger of the Mead Consumer and Office Products Business (“Mead C&OP”) with a wholly-owned subsidiary of the Company (the "Merger"). Accordingly, the results of Mead C&OP are included in our consolidated financial statements from the date of the Merger, May 1, 2012. For further information on the Merger see Note 3, Acquisitions.
As part of the inclusion of Mead C&OP's financial results with those of the Company, certain information technology costs associated with the manufacturing, procurement and distribution operations have been reclassified from advertising, selling, general and administrative expenses (SG&A) to cost of products sold. This was done to enable the financial results of the two businesses to be consistent and to better reflect those costs associated with the cost of products sold. All prior periods have been adjusted to make the results comparable. For the years ended December 31, 2011 and 2010 reclassified costs totaled $15.5 million and $14.6 million, respectively. These historical reclassifications were not material and have had no effect on net income.
We sold our GBC Fordigraph Pty Ltd (“GBC Fordigraph”) business to The Neopost Group as of May 31, 2011. This business was part of the ACCO Brands International segment. GBC Fordigraph is reported as a discontinued operation on the condensed consolidated statement of operations for all periods presented in this annual report. The cash flows from discontinued operations have not been separately classified on the accompanying consolidated statements of cash flows. For further information on the Company’s discontinued operations see Note 18, Discontinued Operations.
2. Significant Accounting Policies
Nature of Business
ACCO Brands is primarily involved in the manufacturing, marketing and distribution of office products; such as stapling, binding and laminating equipment and related consumable supplies, shredders and whiteboards; school products; such as notebooks, folders, decorative calendars, and stationery products; calendar products; and accessories for laptop and desktop computers, smartphones and tablets - selling primarily to large resellers. Our subsidiaries operate principally in the United States, Northern Europe, Canada, Brazil, Australia and Mexico.
Use of Estimates
The preparation of financial statements in conformity with accounting principles generally accepted in the U.S. requires management to make estimates and assumptions that affect the reported amounts of assets and liabilities and the disclosure of contingent assets and liabilities at the date of the financial statements, and the reported amounts of revenues and expenses during the reporting period. Actual results could differ from these estimates.
Cash and Cash Equivalents
Highly liquid investments with an original maturity of three months or less are included in cash and cash equivalents.
Allowances for Doubtful Accounts, Discounts and Returns
Trade receivables are recorded at the stated amount, less allowances for discounts, doubtful accounts and returns. The allowance for doubtful accounts represents estimated uncollectible receivables associated with potential customer defaults on
54
ACCO Brands Corporation and Subsidiaries
Notes to Consolidated Financial Statements (Continued)
contractual obligations, usually due to customers’ potential insolvency. The allowances include amounts for certain customers where a risk of default has been specifically identified. In addition, the allowances includes a provision for customer defaults on a general formula basis when it is determined the risk of some default is probable and estimable, but cannot yet be associated with specific customers. The assessment of the likelihood of customer defaults is based on various factors, including the length of time the receivables are past due, historical experience and existing economic conditions.
The allowance for sales returns represents estimated uncollectible receivables associated with the potential return of products previously sold to customers, and is recorded at the time that the sales are recognized. The allowance includes a general provision for product returns based on historical trends. In addition, the allowance includes a reserve for currently authorized customer returns that are considered to be abnormal in comparison to the historical basis.
Inventories
Inventories are priced at the lower of cost (principally first-in, first-out with minor amounts at average) or market. A reserve is established to adjust the cost of inventory to its net realizable value. Inventory reserves are recorded for obsolete or slow-moving inventory based on assumptions about future demand and marketability of products, the impact of new product introductions and specific identification of items, such as product discontinuance or engineering/material changes. These estimates could vary significantly, either favorably or unfavorably, from actual requirements if future economic conditions, customer inventory levels or competitive conditions differ from expectations.
Property, Plant and Equipment
Property, plant and equipment are carried at cost. Depreciation is provided, principally on a straight-line basis, over the estimated useful lives of the assets. Gains or losses resulting from dispositions are included in operating income. Betterments and renewals, that improve and extend the life of an asset are capitalized; maintenance and repair costs are expensed. Purchased computer software is capitalized and amortized over the software’s useful life.
The following table shows estimated useful lives of property, plant and equipment:
| Buildings | 40 to 50 years | |
| Leasehold improvements | Lesser of lease term or the life of the asset | |
| Machinery, equipment and furniture | 3 to 10 years | |
Long-Lived Assets
We test long-lived assets for impairment whenever events or changes in circumstances indicate that the assets’ carrying amount is not recoverable from its undiscounted cash flows. When such events occur, we compare the sum of the undiscounted cash flows expected to result from the use and eventual disposition of the asset or asset group to the carrying amount of a long-lived asset or asset group. The cash flows are based on our best estimate at the time of future cash flow, derived from the most recent business projections. If this comparison indicates that there is impairment, the amount of the impairment is typically calculated using discounted expected future cash flows. The discount rate applied to these cash flows is based on our weighted average cost of capital, computed by selecting market rates at the valuation dates for debt and equity that are reflective of the risks associated with an investment in our industry as estimated by using comparable publicly traded companies.
Intangible Assets
Intangible assets are comprised primarily of indefinite-lived intangible assets acquired and purchased intangible assets arising from the application of purchase accounting. Indefinite-lived intangible assets are not amortized, but are evaluated annually to determine whether the indefinite useful life is appropriate. Indefinite-lived intangibles are tested for impairment on an annual basis and written down when impaired. An interim impairment test is performed if an event occurs or conditions change that would more likely than not reduce the fair value below the carrying value.
In addition, purchased intangible assets other than goodwill are amortized over their useful lives unless their lives are determined to be indefinite. Certain of our trade names have been assigned an indefinite life as we currently anticipate that these trade names will contribute cash flows to ACCO Brands indefinitely.
55
ACCO Brands Corporation and Subsidiaries
Notes to Consolidated Financial Statements (Continued)
We review indefinite-lived intangibles for impairment annually, normally in the second quarter, and whenever market or business events indicate there may be a potential adverse impact on a particular intangible. We consider the implications of both external factors (e.g., market growth, pricing, competition, and technology) and internal factors (e.g., product costs, margins, support expenses, and capital investment) and their potential impact on cash flows for each business in both the near and long term, as well as their impact on any identifiable intangible asset associated with the business. Based on recent business results, consideration of significant external and internal factors, and the resulting business projections, indefinite-lived intangible assets are reviewed to determine whether they are likely to remain indefinite-lived, or whether a finite life is more appropriate. In addition, based on events in the period and future expectations, management considers whether the potential for impairment exists. Finite lived intangibles are amortized over 10, 15, 23 or 30 years.
As part of our review in the second quarter of 2012, $21.4 million of the value previously assigned to one of our legacy indefinite-lived trade names was changed to an amortizable intangible asset. The legacy indefinite-lived trade name was not impaired. The change was made in respect of decisions regarding our future use of the trade name. We commenced amortizing the trade name in June of 2012 on a prospective basis over a life of 30 years.
Goodwill
Goodwill has been recorded on our balance sheet and represents the excess of the cost of the acquisitions when compared to the fair value of the net assets acquired. We test goodwill for impairment at least annually, normally in the second quarter, and on an interim basis if an event or circumstance indicates that it is more likely than not that an impairment has been incurred. If the carrying amount of the goodwill exceeds its fair value, an impairment loss is recognized. During 2012, we adopted ASU No. 2011-08, Intangibles - Goodwill and Other (Topic 350): Testing Goodwill for Impairment. ASU No. 2011-08 permits entities to first assess qualitative factors to determine if it is more likely than not that the fair value of a reporting unit is less than its carrying amount as a basis for determining whether it is necessary to perform the two-step goodwill impairment test included in U.S. GAAP. Entities are not required to calculate the fair value of a reporting unit unless they determine that it is more likely than not that the fair value is less than the carrying amount. We concluded it was not necessary to apply the traditional two-step fair value quantitative impairment test in ASC 350 to any of our reporting units in 2012. When applying a fair-value-based test, estimates are made of the expected future cash flows to be derived from each reporting unit. The resulting fair value determination is significantly impacted by estimates of future prices for our products, capital needs, economic trends and other factors.
Given the current economic environment and the uncertainties regarding the impact on our business, there can be no assurance that our estimates and assumptions made for purposes of our qualitative impairment testing during 2012 will prove to be accurate predictions of the future. If our assumptions regarding forecasted revenue or margin growth rates of certain reporting units are not achieved, we may be required to record impairment charges in future periods, whether in connection with our next annual impairment testing in the second quarter of fiscal year 2013 or prior to that, if any such change constitutes a triggering event outside of the quarter from when the annual impairment test is performed. It is not possible at this time to determine if any such future impairment charge would result or, if it does, whether such charge would be material.
Employee Benefit Plans
We provide a range of benefits to our employees and retired employees, including pension, post-retirement, post-employment and health care benefits. We record annual amounts relating to these plans based on calculations, which include various actuarial assumptions, including discount rates, assumed rates of return on plan assets, compensation increases, turnover rates and health care cost trend rates. We review our actuarial assumptions on an annual basis and make modifications to the assumptions based on current rates and trends when it is deemed appropriate to do so. The effect of the modifications are generally recorded and amortized over future periods.
Income Taxes
Deferred tax liabilities or assets are established for temporary differences between financial and tax reporting bases and are subsequently adjusted to reflect changes in tax rates expected to be in effect when the temporary differences reverse. A valuation allowance is recorded to reduce deferred tax assets to an amount that is more likely than not to be realized. Facts and circumstances may change and cause us to revise the conclusions on our ability to realize certain net operating losses and other deferred tax attributes.
56
ACCO Brands Corporation and Subsidiaries
Notes to Consolidated Financial Statements (Continued)
The amount of income taxes that we pay is subject to ongoing audits by federal, state and foreign tax authorities. Our estimate of the potential outcome of any uncertain tax position is subject to management’s assessment of relevant risks, facts and circumstances existing at that time. We believe that we have adequately provided for reasonably foreseeable outcomes related to these matters. However, our future results may include favorable or unfavorable adjustments to our estimated tax liabilities in the period the assessments are revised or resolved.
Revenue Recognition
We recognize revenue from product sales when earned, net of applicable provisions for discounts, returns and allowances. We consider revenue to be realized or realizable and earned when all of the following criteria are met: title and risk of loss have passed to the customer, persuasive evidence of an arrangement exists, delivery has occurred, the price is fixed or determinable and collectability is reasonably assured. We also provide for our estimate of potential bad debt at the time of revenue recognition.
Cost of Products Sold
Cost of products sold includes all manufacturing, product sourcing and distribution costs, including depreciation related to assets used in the manufacturing, procurement and distribution process, allocation of certain information technology costs supporting those processes, inbound and outbound freight, shipping and handling costs, purchasing costs associated with materials and packaging used in the production processes.
Advertising, Selling, General and Administrative Expenses
Advertising, selling, general and administrative expenses include advertising, marketing, selling (including commissions), research and development, customer service, depreciation related to assets outside the manufacturing and distribution processes and all other general and administrative expenses outside the manufacturing and distribution functions (e.g., finance, human resources, information technology, etc.).
Customer Program Costs
Customer program costs include, but are not limited to, sales rebates which are generally tied to achievement of certain sales volume levels, in-store promotional allowances, shared media and customer catalog allowances and other cooperative advertising arrangements, and freight allowance programs. We generally recognizes customer program costs as a deduction to gross sales at the time that the associated revenue is recognized. Certain customer incentives that do not directly relate to future revenues are expensed when initiated.
In addition, accrued customer program liabilities principally include, but are not limited to, sales volume rebates, promotional allowances, shared media and customer catalog allowances and other cooperative advertising arrangements, and freight allowances as discussed above.
Shipping and Handling
We reflect all amounts billed to customers for shipping and handling in net sales and the costs incurred from shipping and handling product (including costs to ship and move product from the seller’s place of business to the buyer’s place of business, as well as costs to store, move and prepare products for shipment) in cost of products sold.
Warranty Reserves
We offer our customers various warranty terms based on the type of product that is sold. Estimated future obligations related to products sold under these warranty terms are provided by charges to operations in the period in which the related revenue is recognized.
Advertising Costs
Advertising costs amounted to $125.7 million, $98.1 million and $92.9 million for the years ended December 31, 2012, 2011 and 2010, respectively. These costs include, but are not limited to, cooperative advertising and promotional allowances as described in “Customer Program Costs” above, and are principally expensed as incurred.
57
ACCO Brands Corporation and Subsidiaries
Notes to Consolidated Financial Statements (Continued)
Research and Development
Research and development expenses, which amounted to $20.8 million, $20.5 million and $24.0 million for the years ended December 31, 2012, 2011 and 2010, respectively, are classified as general and administrative expenses and are charged to expense as incurred.
Stock-Based Compensation
Our primary types of share-based compensation consist of stock options, stock-settled appreciation rights, restricted stock unit awards, and performance stock unit awards. Stock-based compensation cost is measured at the grant date, based on the fair value of the award, and is recognized as expense over the requisite service period. Where awards are made with non-substantive vesting periods (for example, where a portion of the award vests upon retirement eligibility), we estimate and recognize expense based on the period from the grant date to the date on which the employee is retirement eligible.
Foreign Currency Translation
Foreign currency balance sheet accounts are translated into U.S. dollars at the rates of exchange at the balance sheet date. Income and expenses are translated at the average rates of exchange in effect during the period. The related translation adjustments are made directly to a separate component of accumulated other comprehensive income (loss) in stockholders’ equity. Some transactions are made in currencies different from an entity’s functional currency. Gains and losses on these foreign currency transactions are included in income as they occur.
Derivative Financial Instruments
We recognize all derivatives as either assets or liabilities on the balance sheet and measures those instruments at fair value. If the derivative is designated as a fair value hedge and is effective, the changes in the fair value of the derivative and of the hedged item attributable to the hedged risk are recognized in earnings in the same period. If the derivative is designated as a cash flow hedge, the effective portions of changes in the fair value of the derivative are recorded in other comprehensive income (loss) and are recognized in the income statement when the hedged item affects earnings. Ineffective portions of changes in the fair value of cash flow hedges are recognized in earnings.
Certain forecasted transactions, assets and liabilities are exposed to foreign currency risk. We continually monitor our foreign currency exposures in order to maximize the overall effectiveness of our foreign currency hedge positions. Principal currencies hedged include the U.S. dollar, Euro, Australian dollar, Canadian dollar and Pound sterling.
Recent Accounting Pronouncements
In September 2011, the Financial Accounting Standards Board (“FASB”) issued Accounting Standard Update (ASU) No. 2011-08, Intangibles - Goodwill and Other (Topic 350): Testing Goodwill for Impairment. ASU No. 2011-08 was issued to simplify the testing of goodwill for impairment by allowing an optional qualitative factors test to determine whether it is more likely than not that the fair value of a reporting unit is less than its carrying amount as a basis for determining whether it is necessary to perform the two-step goodwill impairment test already included in ASC Topic 350. ASU No. 2011-08 is effective for annual and interim goodwill tests performed for fiscal years after December 15, 2011. We adopted the standard in 2012 and it did not have a significant impact on our consolidated financial statements or results of operations.
In July 2012, the FASB issued ASU No. 2012-02, Intangibles-Goodwill and Other (Topic 350): Testing Indefinite-Lived Intangible Assets for Impairment. The revised standard is intended to reduce the cost and complexity of testing indefinite-lived intangible assets other than goodwill for impairment. It allows companies to perform a qualitative assessment to determine whether further impairment testing of indefinite-lived intangible assets is necessary, similar in approach to the goodwill impairment test. It is effective for annual and interim impairment tests performed for fiscal years beginning after September 15, 2012. We will adopt the standard, and it is expected to have no effect on the consolidated financial statements or results of operations.
In October 2012, the FASB issued ASU No. 2012-04, Technical Corrections and Improvements. The amendments in this ASU affect a wide range of topics, but are generally considered nonsubstantive in nature. It is effective for fiscal periods beginning
58
ACCO Brands Corporation and Subsidiaries
Notes to Consolidated Financial Statements (Continued)
after December 15, 2012. We will adopt the standard, and it is expected to have no effect on the consolidated financial statements or results of operations.
In February 2013, the FASB issued ASU No. 2013-02, Reporting of Amounts Reclassified Out of Accumulated Other Comprehensive Income. The revised standard is intended to improve the reporting of reclassifications out of accumulated other comprehensive income. It is effective for fiscal periods beginning after December 15, 2012. We will adopt the standard and its required disclosure.
3.Acquisitions
On May 1, 2012, the Company completed the Merger of Mead C&OP with a wholly-owned subsidiary of the Company. Mead C&OP is a leading manufacturer and marketer of school supplies, office products, and planning and organizing tools - including the Mead®, Five Star®, Trapper Keeper®, AT-A-GLANCE®, Cambridge®, Day Runner®, Hilroy, Tilibra and Grafons brands in the U.S., Canada and Brazil.
In the Merger, MeadWestvaco Corporation (“MWV”) shareholders received 57.1 million shares of the Company's common stock, or 50.5% of the combined company, valued at $602.3 million on the date of the Merger. After the transaction was completed we had 113.1 million common shares outstanding.
Under the terms of the Merger agreement, MWV established a new subsidiary (“Monaco SpinCo Inc.”) to which it conveyed Mead C&OP in return for a $460.0 million payment. The shares of Monaco SpinCo Inc. were then distributed to MWV's shareholders as a dividend. Immediately after the spin-off and distribution, a newly formed subsidiary of the Company merged with and into Monaco SpinCo Inc. and MWV shareholders effectively received in the stock dividend and subsequent conversion approximately one share of ACCO Brands common stock for every three shares of MWV they held. Fractional shares were paid in cash. The subsidiary company subsequently merged with Mead Products LLC (“Mead Products”), the surviving corporate entity, which is a wholly-owned subsidiary of ACCO Brands Corporation.
For accounting purposes, the Company is the acquiring enterprise. Accounting Standards Codification (“ASC”) Topic 805 “Business Combinations” requires the use of the purchase method of accounting for business combinations. In applying the purchase method, it is necessary to identify both the accounting acquiree and the accounting acquiror. In a business combination effected through an exchange of equity interests, such as the Merger, the entity that issues the shares (ACCO in this case) is generally the acquiring entity. In identifying the acquiring entity in a combination effected through an exchange of equity interests, however, all pertinent facts and circumstances must be considered, including the following:
The relative voting interests in the combined entity after the combination. In this case stockholders of MWV, the sole stockholder of Monaco SpinCo Inc., received 50.5% of the equity ownership and associated voting rights in ACCO.
The composition of the governing body of the combined entity . In this case the composition of the Board of Directors of ACCO is composed of the members of the Board of Directors of ACCO and two members, who were selected by MWV and approved by the ACCO Board of Directors.
The composition of the senior management of the combined entity. In this case, the senior management of ACCO is composed of the members of senior management of ACCO immediately prior to consummation of the Merger, along with an executive of MEAD C&OP.
ACCO’s management determined that ACCO is the accounting acquiror in this combination based on the facts and circumstances outlined above. Accordingly, the results of Mead C&OP are included in the Company's consolidated financial statements from the date of the Merger, May 1, 2012.
The purchase price, net of working capital adjustments and cash acquired, was $999.8 million. The consideration given included 57.1 million shares of ACCO Brands common stock, which were issued to MWV shareholders with a fair value of $602.3 million and a $460.0 million dividend paid to MWV. The calculation of consideration given for Mead C&OP was finalized during the fourth quarter of 2012 and is described in the following table.
59
ACCO Brands Corporation and Subsidiaries
Notes to Consolidated Financial Statements (Continued)
| (in millions, except per share price) | At May 1, 2012 | ||
| Calculated consideration for Mead C&OP: | |||
Outstanding shares of ACCO Brands common stock(1) | 56.0 | ||
Multiplier needed to calculate shares to be issued(2) | 1.0202020202 | ||
| Number of shares issued to MWV shareholders | 57.1 | ||
Closing price per share of ACCO Brands common stock(3) | $ | 10.55 | |
| Value of common shares issued | $ | 602.3 | |
| Plus: | |||
| Dividend paid to MWV | 460.0 | ||
| Less: | |||
Working capital adjustment(4) | (30.5 | ) | |
| Consideration for Mead C&OP | $ | 1,031.8 | |
(1) Represents the number of shares of the Company's common stock as of May 1, 2012.
(2) Represents MWV shareholders' negotiated ownership percentage in ACCO Brands of 50.5% divided by the 49.5% that was owned by ACCO Brands shareholders upon completion of the Merger.
(3) Represents the closing price per share of the Company's stock as of April 30, 2012.
(4) Represents the difference between the target net working capital and the closing net working capital as of April 30, 2012.
The following table presents the preliminary allocation of the purchase price to the fair values of the assets acquired and liabilities assumed at the date of acquisition.
| (in millions of dollars) | At May 1, 2012 | ||
| Calculation of Goodwill: | |||
| Consideration given for Mead C&OP | $ | 1,031.8 | |
| Cash acquired | (32.0 | ) | |
| Net purchase price | $ | 999.8 | |
| Plus fair value of liabilities assumed: | |||
| Accounts payable and accrued liabilities | 103.8 | ||
| Current and non-current deferred tax liabilities | 207.8 | ||
| Other non-current liabilities | 72.8 | ||
| Fair value of liabilities assumed | $ | 384.4 | |
| Less fair value of assets acquired: | |||
| Accounts receivable | 73.3 | ||
| Inventory | 143.5 | ||
| Property, plant and equipment | 136.6 | ||
| Identifiable intangibles | 543.2 | ||
| Other assets | 24.2 | ||
| Fair value of assets acquired | $ | 920.8 | |
| Goodwill | $ | 463.4 | |
We are continuing our review of our fair value estimate of assets acquired and liabilities assumed during the measurement period, which will conclude as soon as we receive the information we are seeking about facts and circumstances that existed as of the acquisition date, or learn that more information is not available. This measurement period will not exceed one year from
60
ACCO Brands Corporation and Subsidiaries
Notes to Consolidated Financial Statements (Continued)
the acquisition date. The excess of the purchase price over the preliminary fair value of net assets acquired has been allocated to goodwill in the amount of $463.4 million.
The final determination of the fair values and resulting goodwill may differ significantly from what is reflected above. Our fair value estimate of assets acquired and liabilities assumed is pending review and completion of several elements. The primary areas that are not yet finalized relate to on-going legal disputes, income and non-income related taxes and the fair value of contingent assets or liabilities. Accordingly, there could be material adjustments to our consolidated financial statements.
In connection with our May 1, 2012 acquisition of Mead C&OP, we assumed all of the tax liabilities for the acquired foreign operations. In December of 2012, the Federal Revenue Department of the Ministry of Finance of Brazil ("FRD") issued a tax assessment against our newly acquired indirect subsidiary, Tilibra Produtos de Papelaria Ltda. ("Tilibra"), which challenged the goodwill recorded in connection with the 2004 acquisition of Tilibra. This assessment denied the deductibility of that goodwill from Tilibra's taxable income for the year 2007. The assessment seeks a payment of approximately R$26.9 million ($13.2 million based on current exchange rates) of tax, penalties and interest.
In January of 2013, Tilibra filed a protest disputing the tax assessment at the first administrative level of appeal within the FRD. We believe that we have meritorious defenses and intend to vigorously contest this matter, however, there can be no assurances that we will ultimately prevail. We are in the early stages of the process to challenge the FRD's tax assessment, and the ultimate outcome will not be determined until the Brazilian tax appeal process is complete, which is expected to take many years. In addition, Tilibra's 2008-2012 tax years remain open and subject to audit, and there can be no assurances that we will not receive additional tax assessments regarding the goodwill deducted for the Tilibra acquisition for one or more of those years, which could increase the Company's exposure to a total of approximately $44.5 million (based on current exchange rates), including interest and penalties which have accumulated to date. If the FRD's initial position is ultimately sustained, the amount assessed would adversely affect our reported cash flow in the year of settlement.
Because there is no settled legal precedent on which to base a definitive opinion as to whether we will ultimately prevail, the Company considers the outcome of this dispute to be uncertain. Since it is not more likely than not that we will prevail, in the fourth quarter of 2012, we recorded a reserve in the amount of $44.5 million in consideration of this matter, of which $43.3 million was recorded as an adjustment to the allocation of the purchase price for the fair value of non-current liabilities assumed as of the acquisition date and was recorded as an increase to goodwill. In addition, the Company will continue to accrue interest related to this matter until such time as the outcome is known or until evidence is presented that we are more likely than not to prevail. During 2012, the Company accrued $1.2 million of additional interest that has accumulated since the date of the acquisition as a charge to current income tax expense.
Acquisition-related costs of $14.5 million that were incurred during the twelve months ended December 31, 2012, and $5.6 million that were expensed during 2011, were classified as Selling, General and Administrative expenses.
Had the acquisition occurred on January 1, 2011, unaudited pro forma consolidated results for the twelve month periods ending December 31, 2012 and 2011 would have been as follows:
| Twelve Months Ended December 31, | |||||||
| (in millions of dollar, except per share data) | 2012 | 2011 | |||||
| Net sales | $ | 1,895.0 | $ | 2,064.0 | |||
| Income from continuing operations | 60.4 | 116.7 | |||||
| Income from continuing operations per common share (diluted) | $ | 0.53 | $ | 1.03 | |||
The pro forma amounts above are not necessarily indicative of the results that would have occurred if the acquisition had been completed on January 1, 2011. The pro forma amounts are based on the historical results of operations, and are adjusted for depreciation and amortization of finite-lived intangibles and property, plant and equipment, and other charges related to acquisition accounting. The pro forma results of operations for the twelve months ended December 31, 2011 have also been adjusted to include certain transaction and financing related costs in the first year of combined reporting. These 2011 adjustments include: amortization of the purchase accounting step-up in inventory cost of $13.3 million, transaction costs related to the Merger of $20.1 million and expenses of $88.0 million related to the Company's refinancing completed on May 1, 2012. Also included is $101.9 million for the release of the U.S. tax valuation allowance as if the Company began providing a tax benefit on U.S. losses beginning January 1, 2011.
61
ACCO Brands Corporation and Subsidiaries
Notes to Consolidated Financial Statements (Continued)
4. Long-term Debt and Short-term Borrowings
Notes payable and long-term debt consisted of the following as of December 31, 2012 and 2011:
| (in millions of dollars) | 2012 | 2011 | ||||||
| U.S. Dollar Senior Secured Term Loan B, due May 2019 (floating interest rate of 4.25% at December 31, 2012) | $ | 326.8 | $ | — | ||||
| U.S. Dollar Senior Secured Term Loan A, due May 2017 (floating interest rate of 3.32% at December 31, 2012) | 220.8 | — | ||||||
| Canadian Dollar Senior Secured Term Loan A, due May 2017 (floating interest rate of 4.26% at December 31, 2012) | 21.8 | — | ||||||
| Senior Unsecured Notes, due May 2020 (fixed interest rate of 6.75%) | 500.0 | — | ||||||
| Senior Secured Notes, due March 2015, net of discount (fixed interest rate of 10.625%) | — | 420.9 | (1) | |||||
| U.S. Dollar Senior Subordinated Notes, due August 2015 (fixed interest rate of 7.625%) | — | 246.3 | ||||||
| Other borrowings | 2.7 | 1.8 | ||||||
| Total debt | 1,072.1 | 669.0 | ||||||
| Less: current portion | (1.3 | ) | (0.2 | ) | ||||
| Total long-term debt | $ | 1,070.8 | $ | 668.8 | ||||
| (1) | Net of unamortized original issue discount of $4.2 million as of December 31, 2011. |
As of December 31, 2012, there were no borrowings under the $250 million senior secured revolving credit facility. The amount available for borrowings was $238.5 million (allowing for $11.5 million of letters of credit outstanding on that date).
On May 1, 2012 we entered into a refinancing in conjunction with the Merger. The refinancing reduced our effective interest rate while increasing our borrowing capacity and extending the maturities of our credit facilities.
The new credit facilities and notes are as follows:
$250 million of U.S. Dollar Senior Secured Revolving Credit Facilities due May 2017
$285 million of U.S. Dollar Senior Secured Term Loan A due May 2017
C$34.5 million of Canadian Dollar Senior Secured Term Loan A due May 2017
$450 million of U.S. Dollar Senior Secured Term Loan B due May 2019
$500 million of U.S. Dollar Senior Unsecured Notes due May 2020
Interest rates under the senior secured term loans are based on the London Interbank Offered Rate ("LIBOR"). The range of borrowing costs under the pricing grid is LIBOR plus 3.00% for the Term A loans and LIBOR plus 3.25% with a LIBOR rate floor of 1.00% for the Term B loans. The senior secured credit facilities had a weighted average interest rate of 3.89% as of December 31, 2012 and the senior unsecured notes have an interest rate of 6.75%.
In addition on May 1, 2012 we repurchased or discharged all of our outstanding senior secured notes of $425.1 million, due March 2015, for $464.7 million including a premium and related fees of $39.6 million. On May 4, 2012 we redeemed all of our outstanding senior subordinated notes of $246.3 million, due August 2015, for $252.6 million including a premium of $6.3 million. We also terminated our senior secured asset-based revolving credit facility of $175.0 million, which was undrawn as of May 1, 2012. Associated with these transactions were $15.5 million in write-offs for original issue discount and debt origination costs.
In conjunction with our refinancing, we paid $38.5 million in additional bank, legal and advisory fees associated with our new credit facilities. These fees were capitalized and are being amortized over the life of the credit facilities and senior unsecured notes.
During 2012, we voluntarily repaid $64.2 million of our U.S. Dollar Senior Secured Term Loan A, $12.9 million of our Canadian Dollar Senior Secured Term Loan A and $123.2 million of our U.S. Dollar Senior Secured Term Loan B.
During 2011, we repurchased $34.9 million of our Senior Secured Notes and $25.0 million of our Senior Subordinated Notes. We paid a $3.0 million premium on the repurchase of our Senior Secured Notes, which was included in Other expense, net in the Consolidated Statements of Operations
62
ACCO Brands Corporation and Subsidiaries
Notes to Consolidated Financial Statements (Continued)
Loan Covenants
We must meet certain restrictive financial covenants as defined under the senior secured credit facilities. The covenants become more restrictive over time and require us to maintain certain ratios related to consolidated leverage and consolidated interest coverage. We are also subject to certain customary restrictive covenants under the senior unsecured notes.
The table below sets forth the financial covenant ratio levels under the senior secured credit facilities:
Maximum Consolidated Leverage Ratio(1) | Minimum - Interest Coverage Ratio(2) | |||
| May 1, 2012 to December 31, 2012 | 4.50:1.00 | 3.00:1.00 | ||
| January 1, 2013 to December 31, 2013 | 4.25:1.00 | 3.00:1.00 | ||
| January 1, 2014 to December 31, 2014 | 4.00:1.00 | 3.25:1.00 | ||
| January 1, 2015 to December 31, 2015 | 3.75:1.00 | 3.25:1.00 | ||
| January 1, 2016 and thereafter | 3.50:1.00 | 3.50:1.00 | ||
| (1) | The leverage ratio is computed by dividing our net indebtedness by the cumulative four-quarter-trailing EBITDA, which excludes transaction, restructuring, integration and other charges up to certain limits as well as other adjustments as defined under the senior secured credit facilities. |
| (2) | The interest coverage ratio for any period is the cumulative four-quarter-trailing EBITDA, for the Company, for such period, adjusted as provided in (1), divided by cash interest expense for the Company for such period and other adjustments, all as defined under the senior secured credit facilities. |
The senior secured credit facilities contain customary events of default, including payment defaults, breach of representations and warranties, covenant defaults, cross-defaults and cross-accelerations, certain bankruptcy or insolvency events, certain ERISA-related events, changes in control or ownership, and invalidity of any loan document.
The indenture governing the senior unsecured notes does not contain financial performance covenants. However, that indenture does contain covenants that limit, among other things, our ability and the ability of our restricted subsidiaries to:
incur additional indebtedness;
pay dividends on our capital stock or repurchase our capital stock;
enter into or permit to exist contractual limits on the ability of our subsidiaries to pay dividends to the Company;
enter into certain transactions with affiliates;
make investments;
create liens; and
sell certain assets or merge with or into other companies.
Certain of these covenants will be subject to suspension when and if the notes are rated at least “BBB–” by Standard & Poor’s or at least “Baa3” by Moody’s. Each of the covenants is subject to a number of important exceptions and qualifications.
Guarantees and Security
Obligations under the senior secured credit facilities are irrevocably and unconditionally guaranteed, jointly and severally, by certain of our existing and future domestic subsidiaries. In the case of the obligations of ACCO Brands Canada its senior secured term loan A is guaranteed by its future subsidiaries and by the Company's other existing and future Canadian subsidiaries.
The senior unsecured notes are irrevocably and unconditionally guaranteed, jointly and severally, on a senior unsecured basis by each of our existing and future domestic subsidiaries other than certain excluded subsidiaries. The senior unsecured notes and the related guarantees will rank equally in right of payment with all of the existing and future senior debt of the Company, Mead Products and the guarantors, senior in right of payment to all of the existing and future subordinated debt of the Company, Mead Products and the guarantors, and effectively subordinated to all of the existing and future secured indebtedness of the Company, Mead Products and the guarantors to the extent of the value of the assets securing such indebtedness. The senior unsecured notes and the guarantees are and structurally subordinated to all existing and future liabilities, including trade payables, of each of the Company's and Mead Products’ subsidiaries that do not guarantee the notes.
63
ACCO Brands Corporation and Subsidiaries
Notes to Consolidated Financial Statements (Continued)
Compliance with Loan Covenants
As of and for the year ended December 31, 2012, we were in compliance with all applicable loan covenants.
5. Pension and Other Retiree Benefits
We have a number of pension plans, principally in the U.K. and the U.S. The plans provide for payment of retirement benefits, mainly commencing between the ages of 60 and 65, and also for payment of certain disability and severance benefits. After meeting certain qualifications, an employee acquires a vested right to future benefits. The benefits payable under the plans are generally determined on the basis of an employee’s length of service and earnings. Cash contributions to the plans are made as necessary to ensure legal funding requirements are satisfied.
The Company provides post-retirement health care and life insurance benefits to certain employees and retirees in the U.S. and certain employee groups outside of the U.S. These benefit plans for ACCO Brands legacy employees have been frozen to new participants. Many employees and retirees outside of the U.S. are covered by government health care programs.
On January 20, 2009, the Company’s Board of Directors approved plan amendments to temporarily freeze our ACCO Brands legacy U.S. pension and non-qualified supplemental retirement plans effective March 7, 2009. No additional benefits will accrue under these plans after that date until further action by the Board of DirectorsDirectors. On September 30, 2012 our U.K. pension plan was frozen.
The Merger with Mead C&OP has added additional pension and post-retirement plans in the U.S. and Canada. In the U.S. we have added a pension plan for certain bargained hourly employees of Mead C&OP. In Canada we have assumed the Mead C&OP pension and post-retirement plans for its Canadian employees.
64
ACCO Brands Corporation and Subsidiaries
Notes to Consolidated Financial Statements (Continued)
The following table sets forth our defined benefit pension plans and other post-retirement benefit plans funded status and the amounts recognized in our consolidated balance sheets:
| Pension Benefits | Post-retirement | ||||||||||||||||||||||
| U.S. | International | ||||||||||||||||||||||
| (in millions of dollars) | 2012 | 2011 | 2012 | 2011 | 2012 | 2011 | |||||||||||||||||
| Change in projected benefit obligation (PBO) | |||||||||||||||||||||||
| Projected benefit obligation at beginning of year | $ | 171.9 | $ | 162.5 | $ | 284.6 | $ | 268.3 | $ | 13.4 | $ | 13.3 | |||||||||||
| Service cost | 1.2 | — | 2.1 | 2.1 | 0.2 | 0.2 | |||||||||||||||||
| Interest cost | 8.4 | 8.6 | 14.3 | 14.7 | 0.6 | 0.6 | |||||||||||||||||
| Actuarial loss | 19.9 | 9.5 | 30.7 | 14.2 | 0.1 | — | |||||||||||||||||
| Participants’ contributions | — | — | 0.8 | 0.9 | 0.2 | 0.2 | |||||||||||||||||
| Benefits paid | (12.2 | ) | (8.7 | ) | (13.2 | ) | (13.0 | ) | (0.8 | ) | (0.9 | ) | |||||||||||
| Curtailment gain | — | — | — | (0.6 | ) | — | — | ||||||||||||||||
| Foreign exchange rate changes | — | — | 13.6 | (2.0 | ) | 0.2 | — | ||||||||||||||||
| Other items | 0.7 | — | (0.4 | ) | — | — | — | ||||||||||||||||
| Mead C&OP acquisition | 1.8 | — | 28.5 | — | 2.1 | — | |||||||||||||||||
| Projected benefit obligation at end of year | 191.7 | 171.9 | 361.0 | 284.6 | 16.0 | 13.4 | |||||||||||||||||
| Change in plan assets | |||||||||||||||||||||||
| Fair value of plan assets at beginning of year | 119.1 | 124.8 | 242.7 | 242.3 | — | — | |||||||||||||||||
| Actual return on plan assets | 19.8 | (3.2 | ) | 35.5 | 7.0 | — | — | ||||||||||||||||
| Employer contributions | 8.7 | 6.2 | 9.9 | 6.6 | 0.6 | 0.7 | |||||||||||||||||
| Participants’ contributions | — | — | 0.8 | 0.9 | 0.2 | 0.2 | |||||||||||||||||
| Benefits paid | (12.2 | ) | (8.7 | ) | (13.2 | ) | (13.0 | ) | (0.8 | ) | (0.9 | ) | |||||||||||
| Foreign exchange rate changes | — | — | 11.8 | (1.1 | ) | — | — | ||||||||||||||||
| Mead C&OP acquisition | — | — | 24.4 | — | — | — | |||||||||||||||||
| Fair value of plan assets at end of year | 135.4 | 119.1 | 311.9 | 242.7 | — | — | |||||||||||||||||
| Funded status (Fair value of plan assets less PBO) | $ | (56.3 | ) | $ | (52.8 | ) | $ | (49.1 | ) | $ | (41.9 | ) | $ | (16.0 | ) | $ | (13.4 | ) | |||||
| Amounts recognized in the consolidated balance sheet consist of: | |||||||||||||||||||||||
| Other current liabilities | $ | — | $ | 0.2 | $ | 0.5 | $ | 0.6 | $ | 1.1 | $ | 1.2 | |||||||||||
Accrued benefit liability(1) | 56.3 | 52.6 | 48.6 | 41.3 | 14.9 | 12.2 | |||||||||||||||||
| Components of accumulated other comprehensive income, net of tax: | |||||||||||||||||||||||
| Unrecognized prior service cost | 0.4 | — | (0.2 | ) | 0.4 | — | — | ||||||||||||||||
| Unrecognized actuarial loss (gain) | 57.8 | 56.1 | 74.2 | 62.2 | (1.1 | ) | (2.6 | ) | |||||||||||||||
| (1) | Pension and post-retirement liabilities of $119.8 million as of December 31, 2012, increased from $106.1 million as of December 31, 2011, due to lower discount rates compared to prior year assumptions, partially offset by the over performance of the assets of the pension plans compared to the expected long-term rate of return of the assets of the pension plans. |
65
ACCO Brands Corporation and Subsidiaries
Notes to Consolidated Financial Statements (Continued)
Of the amounts included within accumulated other comprehensive income (loss), we expect to recognize the following pre-tax amounts as components of net periodic benefit cost during 2013:
| Pension Benefits | Post-retirement | ||||||||||
| (in millions of dollars) | U.S. | International | |||||||||
| Prior service cost | $ | 0.1 | $ | — | $ | — | |||||
| Actuarial loss (gain) | 9.6 | 2.5 | (0.7 | ) | |||||||
| $ | 9.7 | $ | 2.5 | $ | (0.7 | ) | |||||
All of our plans have projected benefit obligations in excess of plan assets.
The accumulated benefit obligation for all defined benefit pension plans was $536.2 million and $443.6 million at December 31, 2012 and 2011, respectively.
The following table sets out information for pension plans with an accumulated benefit obligation in excess of plan assets:
| U.S. | International | ||||||||||||||
| (in millions of dollars) | 2012 | 2011 | 2012 | 2011 | |||||||||||
| Projected benefit obligation | $ | 191.7 | $ | 171.9 | $ | 349.6 | $ | 272.8 | |||||||
| Accumulated benefit obligation | 189.8 | 171.9 | 335.3 | 260.2 | |||||||||||
| Fair value of plan assets | 135.4 | 119.1 | 300.6 | 230.9 | |||||||||||
The components of net periodic benefit cost for pension and post-retirement plans for the years ended December 31, 2012, 2011, and 2010, respectively, were as follows:
| Pension Benefits | Post-retirement | ||||||||||||||||||||||||||||||||||
| U.S. | International | ||||||||||||||||||||||||||||||||||
| (in millions of dollars) | 2012 | 2011 | 2010 | 2012 | 2011 | 2010 | 2012 | 2011 | 2010 | ||||||||||||||||||||||||||
| Service cost | $ | 1.2 | $ | — | $ | — | $ | 2.1 | $ | 2.1 | $ | 2.3 | $ | 0.2 | $ | 0.2 | $ | 0.2 | |||||||||||||||||
| Interest cost | 8.4 | 8.6 | 8.9 | 14.3 | 14.7 | 14.6 | 0.6 | 0.6 | 0.7 | ||||||||||||||||||||||||||
| Expected return on plan assets | (10.4 | ) | (10.7 | ) | (10.4 | ) | (16.2 | ) | (16.0 | ) | (15.1 | ) | — | — | — | ||||||||||||||||||||
| Amortization of prior service cost | — | — | — | 0.4 | 0.2 | 0.1 | — | — | — | ||||||||||||||||||||||||||
| Amortization of net loss (gain) | 6.2 | 4.3 | 3.0 | 2.2 | 3.9 | 4.8 | (1.6 | ) | (0.6 | ) | (0.9 | ) | |||||||||||||||||||||||
| Curtailment | — | — | — | — | (0.2 | ) | — | — | — | — | |||||||||||||||||||||||||
| Settlement loss | 0.7 | — | — | — | — | — | — | — | — | ||||||||||||||||||||||||||
| Net periodic benefit cost | $ | 6.1 | $ | 2.2 | $ | 1.5 | $ | 2.8 | $ | 4.7 | $ | 6.7 | $ | (0.8 | ) | $ | 0.2 | $ | — | ||||||||||||||||
During the second quarter of 2012, due to of the Merger, we settled the Amended and Restated ACCO Brands Corporation Supplemental Retirement Plan (the "SRP"), which resulted in a settlement charge of $0.7 million. The SRP provided that the accrued vested benefit of each participant be paid in an actuarial equivalent lump sum upon the occurrence of a change of control (as defined in the SRP).
During the first quarter of 2012, we changed the amortization of our net loss included in accumulated other comprehensive income (loss) for our U.K. pension plan from the average remaining service period of active employees expected to receive benefits under the plan to the average remaining life expectancy of the inactive participants. This change was the result of decreases in plan participation resulting in substantially all of the participants now being inactive. This change reduced the net periodic benefit cost by approximately $3.3 million for the year ended December 31, 2012.
66
ACCO Brands Corporation and Subsidiaries
Notes to Consolidated Financial Statements (Continued)
Other changes in plan assets and benefit obligations that were recognized in other comprehensive income (loss) during the years ended December 31, 2012, 2011, and 2010 were as follows:
| Pension Benefits | Post-retirement | ||||||||||||||||||||||||||||||||||
| U.S. | International | ||||||||||||||||||||||||||||||||||
| (in millions of dollars) | 2012 | 2011 | 2010 | 2012 | 2011 | 2010 | 2012 | 2011 | 2010 | ||||||||||||||||||||||||||
| Current year actuarial loss (gain) | $ | 9.6 | $ | 23.5 | $ | (0.2 | ) | $ | 11.4 | $ | 22.8 | $ | (4.2 | ) | $ | 0.1 | $ | — | $ | — | |||||||||||||||
| Amortization of actuarial (loss) gain | (6.2 | ) | (4.3 | ) | (3.0 | ) | (2.2 | ) | (3.9 | ) | (4.8 | ) | 1.6 | 0.6 | 0.9 | ||||||||||||||||||||
| Current year prior service cost (income) | 0.8 | — | — | (0.3 | ) | — | — | — | — | — | |||||||||||||||||||||||||
| Amortization of prior service cost | — | — | — | (0.4 | ) | (0.2 | ) | (0.1 | ) | — | — | — | |||||||||||||||||||||||
| Exchange rate adjustment | — | — | — | 4.1 | (1.0 | ) | (3.2 | ) | (0.1 | ) | — | 0.1 | |||||||||||||||||||||||
| Total recognized in other comprehensive income (loss) | $ | 4.2 | $ | 19.2 | $ | (3.2 | ) | $ | 12.6 | $ | 17.7 | $ | (12.3 | ) | $ | 1.6 | $ | 0.6 | $ | 1.0 | |||||||||||||||
| Total recognized in net periodic benefit cost and other comprehensive income (loss) | $ | 10.3 | $ | 21.4 | $ | (1.7 | ) | $ | 15.4 | $ | 22.4 | $ | (5.6 | ) | $ | 0.8 | $ | 0.8 | $ | 1.0 | |||||||||||||||
Assumptions
Weighted average assumptions used to determine benefit obligations for the years ended December 31, 2012, 2011, and 2010 were as follows:
| Pension Benefits | Post-retirement | |||||||||||||||||||||||||
| U.S. | International | |||||||||||||||||||||||||
| 2012 | 2011 | 2010 | 2012 | 2011 | 2010 | 2012 | 2011 | 2010 | ||||||||||||||||||
| Discount rate | 4.2 | % | 5.0 | % | 5.5 | % | 4.3 | % | 4.7 | % | 5.4 | % | 4.0 | % | 4.5 | % | 5.0 | % | ||||||||
| Rate of compensation increase | N/A | N/A | N/A | 4.0 | % | 3.6 | % | 4.4 | % | — | — | — | ||||||||||||||
Weighted average assumptions used to determine net cost for the years ended December 31, 2012, 2011, and 2010 were as follows:
| Pension Benefits | Post-retirement | |||||||||||||||||||||||||
| U.S. | International | |||||||||||||||||||||||||
| 2012 | 2011 | 2010 | 2012 | 2011 | 2010 | 2012 | 2011 | 2010 | ||||||||||||||||||
| Discount rate | 5.0 | % | 5.5 | % | 5.9 | % | 4.7 | % | 5.4 | % | 5.8 | % | 4.5 | % | 5.0 | % | 5.9 | % | ||||||||
| Expected long-term rate of return | 8.2 | % | 8.2 | % | 8.2 | % | 6.2 | % | 6.4 | % | 6.8 | % | — | — | — | |||||||||||
| Rate of compensation increase | N/A | N/A | N/A | 3.6 | % | 4.4 | % | 4.5 | % | — | — | — | ||||||||||||||
67
ACCO Brands Corporation and Subsidiaries
Notes to Consolidated Financial Statements (Continued)
Weighted average health care cost trend rates used to determine post-retirement benefit obligations and net cost as of December 31, 2012, 2011, and 2010 were as follows:
| Post-retirement Benefits | ||||||||
| 2012 | 2011 | 2010 | ||||||
| Health care cost trend rate assumed for next year | 7 | % | 7 | % | 8 | % | ||
| Rate that the cost trend rate is assumed to decline (the ultimate trend rate) | 5 | % | 5 | % | 5 | % | ||
| Year that the rate reaches the ultimate trend rate | 2020 | 2020 | 2020 | |||||
Assumed health care cost trend rates may have a significant effect on the amounts reported for the health care plans. A one-percentage-point change in assumed health care cost trend rates would have the following effects:
| 1-Percentage- | 1-Percentage- | ||||||
| (in millions of dollars) | Point Increase | Point Decrease | |||||
| Increase (decrease) on total of service and interest cost | $ | 0.1 | $ | (0.2 | ) | ||
| Increase (decrease) on post-retirement benefit obligation | 1.6 | (1.4 | ) | ||||
Plan Assets
The investment strategy for the Company is to optimize investment returns through a diversified portfolio of investments, taking into consideration underlying plan liabilities and asset volatility. Each plan has a different target asset allocation, which is reviewed periodically and is based on the underlying liability structure. The target asset allocation for our U.S. plan is 65% in equity securities, 20% in fixed income securities and 15% in alternative assets. The target asset allocation for non-U.S. plans is set by the local plan trustees.
Our pension plan weighted average asset allocations as of December 31, 2012 and 2011 were as follows:
| 2012 | 2011 | |||||||||||
| U.S. | International | U.S. | International | |||||||||
| Asset category | ||||||||||||
| Equity securities | 64 | % | 47 | % | 63 | % | 48 | % | ||||
| Fixed income | 30 | 39 | 32 | 42 | ||||||||
| Real estate | — | 4 | — | 4 | ||||||||
Other(1) | 6 | 10 | 5 | 6 | ||||||||
| Total | 100 | % | 100 | % | 100 | % | 100 | % | ||||
| (1) | Insurance contracts, multi-strategy hedge funds and cash and cash equivalents for certain of our plans. |
68
ACCO Brands Corporation and Subsidiaries
Notes to Consolidated Financial Statements (Continued)
U.S. Pension Plan Assets
Fair value measurements of our U.S. pension plan assets by asset category as of December 31, 2012 were as follows:
| (in millions of dollars) | Quoted Prices in Active Markets for Identical Assets (Level 1) | Significant Other Observable Inputs (Level 2) | Significant Unobservable Inputs (Level 3) | Fair Value as of December 31, 2012 | |||||||||||
| Common stocks | $ | 8.1 | $ | — | $ | — | $ | 8.1 | |||||||
| Mutual funds | 79.1 | — | — | 79.1 | |||||||||||
| Common collective trust funds | — | 8.0 | — | 8.0 | |||||||||||
| Government debt securities | — | 4.4 | — | 4.4 | |||||||||||
| Corporate debt securities | — | 11.2 | — | 11.2 | |||||||||||
| Asset-backed securities | — | 8.6 | — | 8.6 | |||||||||||
| Multi-strategy hedge funds | — | 6.2 | — | 6.2 | |||||||||||
| Government mortgage-backed securities | — | 4.2 | — | 4.2 | |||||||||||
| Collateralized mortgage obligations, mortgage backed securities, and other | — | 5.6 | — | 5.6 | |||||||||||
| Total | $ | 87.2 | $ | 48.2 | $ | — | $ | 135.4 | |||||||
Fair value measurements of our U.S. pension plan assets by asset category as of December 31, 2011 were as follows:
| (in millions of dollars) | Quoted Prices in Active Markets for Identical Assets (Level 1) | Significant Other Observable Inputs (Level 2) | Significant Unobservable Inputs (Level 3) | Fair Value as of December 31, 2011 | |||||||||||
| Common stocks | $ | 6.9 | $ | — | $ | — | $ | 6.9 | |||||||
| Mutual funds | 68.3 | — | — | 68.3 | |||||||||||
| Government debt securities | — | 10.9 | — | 10.9 | |||||||||||
| Corporate debt securities | — | 8.0 | — | 8.0 | |||||||||||
| Asset-backed securities | — | 7.8 | — | 7.8 | |||||||||||
| Multi-strategy hedge funds | — | 5.4 | — | 5.4 | |||||||||||
| Government mortgage-backed securities | — | 4.0 | — | 4.0 | |||||||||||
| Common collective trust funds, collateralized mortgage obligations, mortgage backed securities, and other fixed income securities | — | 7.8 | — | 7.8 | |||||||||||
| Total | $ | 75.2 | $ | 43.9 | $ | — | $ | 119.1 | |||||||
Mutual funds and common stocks: The fair values of mutual fund and common stock fund investments are determined by obtaining quoted prices on nationally recognized securities exchanges (level 1 inputs).
Debt securities: Fixed income securities, such as corporate and government bonds, collateralized mortgage obligations, asset-backed securities, and other debt securities are valued using quotes from independent pricing vendors based on recent trading activity and other relevant information, including market interest rate curves, referenced credit spreads, and estimated prepayment rates, where applicable (level 2 inputs).
Multi-strategy hedge funds: The fair values of participation units held in multi-strategy hedge funds are based on their net asset values, as reported by the managers of the funds and are based on the daily closing prices of the underlying investments (level 2 inputs).
69
ACCO Brands Corporation and Subsidiaries
Notes to Consolidated Financial Statements (Continued)
Common collective trusts: The fair values of participation units held in common collective trusts are based on their net asset values, as reported by the managers of the common collective trusts and as supported by the unit prices of actual purchase and sale transactions occurring as of or close to the financial statement date (level 2 inputs).
International Pension Plans Assets
Fair value measurements of our international pension plans assets by asset category as of December 31, 2012 were as follows:
| (in millions of dollars) | Quoted Prices in Active Markets for Identical Assets (Level 1) | Significant Other Observable Inputs (Level 2) | Significant Unobservable Inputs (Level 3) | Fair Value as of December 31, 2012 | |||||||||||
| Cash and cash equivalents | $ | 4.3 | $ | — | $ | — | $ | 4.3 | |||||||
| Equity securities | 130.5 | 15.8 | — | 146.3 | |||||||||||
| Corporate debt securities | — | 103.6 | — | 103.6 | |||||||||||
| Multi-strategy hedge funds | — | 15.0 | — | 15.0 | |||||||||||
| Insurance contracts | — | 12.2 | — | 12.2 | |||||||||||
| Other debt securities | — | 10.3 | — | 10.3 | |||||||||||
| Real estate | — | 9.9 | 1.0 | 10.9 | |||||||||||
| Government debt securities | — | 9.3 | — | 9.3 | |||||||||||
| Total | $ | 134.8 | $ | 176.1 | $ | 1.0 | $ | 311.9 | |||||||
Fair value measurements of our international pension plans assets by asset category as of December 31, 2011 were as follows:
| (in millions of dollars) | Quoted Prices in Active Markets for Identical Assets (Level 1) | Significant Other Observable Inputs (Level 2) | Significant Unobservable Inputs (Level 3) | Fair Value as of December 31, 2011 | |||||||||||
| Cash and cash equivalents | $ | 3.2 | $ | — | $ | — | $ | 3.2 | |||||||
| Equity securities | 116.6 | — | — | 116.6 | |||||||||||
| Corporate debt securities | — | 82.6 | — | 82.6 | |||||||||||
| Real estate | — | 10.0 | — | 10.0 | |||||||||||
| Insurance contracts | — | 9.7 | — | 9.7 | |||||||||||
| Other debt securities | — | 9.7 | — | 9.7 | |||||||||||
| Government debt securities | — | 9.0 | — | 9.0 | |||||||||||
| Multi-strategy hedge funds | — | 1.9 | — | 1.9 | |||||||||||
| Total | $ | 119.8 | $ | 122.9 | $ | — | $ | 242.7 | |||||||
Equity securities: The fair values of equity securities are determined by obtaining quoted prices on nationally recognized securities exchanges (level 1 inputs).
Debt securities: Fixed income securities, such as corporate and government bonds and other debt securities consisting of index linked securities. These debt securities are valued using quotes from independent pricing vendors based on recent trading activity and other relevant information, including market interest rate curves, referenced credit spreads, and estimated prepayment rates, where applicable (level 2 inputs).
Real estate: Real estate, exclusive of the Canadian plan, consists of managed real estate investment trust securities (level 2 inputs). Real estate in the Canadian plan was acquired in the Merger of Mead C&OP and the properties are appraised by a third party on an annual basis (level 3 inputs). There have been no substantial purchases or gain/losses since the Merger.
70
ACCO Brands Corporation and Subsidiaries
Notes to Consolidated Financial Statements (Continued)
Insurance contracts: Valued at contributions made, plus earnings, less participant withdrawals and administrative expenses, which approximate fair value (level 2 inputs).
Multi-strategy hedge funds: The fair values of participation units held in multi-strategy hedge funds are based on their net asset values, as reported by the managers of the funds and are based on the daily closing prices of the underlying investments (level 2 inputs).
Cash Contributions
We contributed $19.2 million to our defined benefit plans in 2012, including $3.3 million for the settlement of the SRP.
We expect to contribute $14.3 million to our defined benefit plans in 2013.
The following table presents estimated future benefit payments for the next ten fiscal years:
| Pension | Post-retirement | ||||||
| (in millions of dollars) | Benefits | Benefits | |||||
| 2013 | $ | 21.5 | $ | 1.1 | |||
| 2014 | $ | 22.3 | $ | 1.2 | |||
| 2015 | $ | 22.7 | $ | 1.1 | |||
| 2016 | $ | 23.3 | $ | 1.1 | |||
| 2017 | $ | 24.0 | $ | 1.1 | |||
| Years 2018 — 2022 | $ | 125.8 | $ | 4.9 | |||
We also sponsor a number of defined contribution plans. Contributions are determined under various formulas. Costs related to such plans amounted to $8.0 million, $6.6 million and $6.1 million for the years ended December 31, 2012, 2011, and 2010, respectively. The $1.4 million increase in defined contribution plan costs in 2012 compared to 2011 was due to the Merger with Mead C&OP.
6. Stock-Based Compensation
We have two share-based compensation plans under which a total of 15,665,000 shares may be issued under awards to key employees and non-employee directors.
The following table summarizes the impact of all stock-based compensation expense on our consolidated statements of operations for the years ended December 31, 2012, 2011 and 2010.
| (in millions of dollars) | 2012 | 2011 | 2010 | ||||||||
| Advertising, selling, general and administrative expense | $ | 9.2 | $ | 6.3 | $ | 4.2 | |||||
| Income from continuing operations before income tax | 9.2 | 6.3 | 4.2 | ||||||||
| Income tax expense | 3.3 | 0.2 | 0.2 | ||||||||
| Net income | $ | 5.9 | $ | 6.1 | $ | 4.0 | |||||
There was no capitalization of stock based compensation expense.
71
ACCO Brands Corporation and Subsidiaries
Notes to Consolidated Financial Statements (Continued)
Stock-based compensation expense by award type (including stock options, stock-settled appreciation rights (“SSARs”), restricted stock units (“RSUs”) and performance stock units (“PSUs”)) for the years ended December 31, 2012, 2011 and 2010 are as follows:
| (in millions of dollars) | 2012 | 2011 | 2010 | ||||||||
| Stock option compensation expense | $ | 1.8 | $ | 0.6 | $ | 0.4 | |||||
| SSAR compensation expense | 0.1 | 0.2 | 0.2 | ||||||||
| RSU compensation expense | 3.9 | 3.0 | 2.8 | ||||||||
| PSU compensation expense | 3.4 | 2.5 | 0.8 | ||||||||
| Total stock-based compensation | $ | 9.2 | $ | 6.3 | $ | 4.2 | |||||
Stock Option and SSAR Awards
The exercise price of each stock option and SSAR equals or exceeds the fair market price of our stock on the date of grant. Options/SSARs can generally be exercised over a maximum term of up to seven years. Stock options/SSARs outstanding as of December 31, 2012 generally vest ratably over three years. There were no SSAR or option awards issued during 2010. During 2011 and 2012, we granted only option awards. The fair value of each option/SSAR grant is estimated on the date of grant using the Black-Scholes option-pricing model using the weighted average assumptions as outlined in the following table:
| Year Ended December 31, | |||||||||
| 2012 | 2011 | ||||||||
| Weighted average expected lives | 4.5 | years | 4.5 | years | |||||
| Weighted average risk-free interest rate | 0.75 | % | 1.65 | % | |||||
| Weighted average expected volatility | 55.7 | % | 50.7 | % | |||||
| Expected dividend yield | 0.0 | % | 0.0 | % | |||||
| Weighted average grant date fair value | $ | 5.41 | $ | 3.85 | |||||
We have utilized historical volatility for a pool of peer companies for a period of time that is comparable to the expected life of the option/SSAR to determine volatility assumptions for stock-based compensation prior to 2012. Beginning with 2012 volatility is calculated using a combination of peer companies (50%) and ACCO Brands' historic volatility (50%). The weighted average expected option/SSAR term reflects the application of the simplified method, which defines the life as the average of the contractual term of the option/SSAR and the weighted average vesting period for all option tranches. The risk-free interest rate for the expected term of the option is based on the U.S. Treasury yield curve in effect at the time of grant. Forfeitures are estimated at the time of grant in order to calculate the amount of share-based payment awards ultimately expected to vest. The forfeiture rate is based on historical rates.
A summary of the changes in stock options/SSARs outstanding under the Company’s stock compensation plans during the year ended December 31, 2012 is presented below:
| Number Outstanding | Weighted Average Exercise Price | Weighted Average Remaining Contractual Term | Aggregate Intrinsic Value | |||||||||
| Outstanding at December 31, 2011 | 6,108,456 | $ | 12.23 | |||||||||
| Granted | 698,526 | $ | 11.83 | |||||||||
| Exercised | (297,446 | ) | $ | 1.58 | ||||||||
| Lapsed | (1,630,983 | ) | $ | 20.28 | ||||||||
| Outstanding at December 31, 2012 | 4,878,553 | $ | 10.12 | 3.2 years | $ | 9.7 | million | |||||
| Exercisable shares at December 31, 2012 | 3,796,756 | $ | 9.95 | 2.4 years | $ | 9.7 | million | |||||
| Options/SSARs vested or expected to vest | 4,814,335 | $ | 10.12 | 3.1 years | $ | 9.7 | million | |||||
We received cash of $0.2 million and $0.1 million from the exercise of stock options for the years ended December 31, 2012 and 2011, respectively. The aggregate intrinsic value of options exercised during the years ended December 31, 2012 and 2011,
72
ACCO Brands Corporation and Subsidiaries
Notes to Consolidated Financial Statements (Continued)
were not significant. No stock options were exercised in 2010. The aggregate intrinsic value of SSARs exercised during the years ended December 31, 2012, 2011 and 2010 totaled $2.5 million, $3.0 million and $2.1 million, respectively. The fair value of options and SSARs vested during the years ended December 31, 2012, 2011 and 2010 was $1.0 million, $0.6 million and $1.1 million, respectively. As of December 31, 2012, we had unrecognized compensation expense related to stock options of $3.7 million, which will be recognized over a weighted-average period of 2.1 years.
Stock Unit Awards
The ACCO Brands Corporation 2011 Amended and Restated ACCO Brands Corporation Incentive Plan provides for stock based awards in the form of RSUs, PSUs, incentive and non-qualified stock options, and stock appreciation rights, any of which may be granted alone or with other types of awards and dividend equivalents. RSUs vest over a pre-determined period of time, generally three to four years from the date of grant. Stock-based compensation expense for the years ended December 31, 2012, 2011 and 2010 includes $0.9 million, $0.6 million and $0.7 million, respectively, of expense related to RSUs granted to non-employee directors, which became fully vested on the grant date. PSUs also vest over a pre-determined period of time, minimally three years, but are further subject to the achievement of certain business performance criteria in future periods. Based upon the level of achieved performance, the number of shares actually awarded can vary from 0% to 150% of the original grant.
There were 1,428,592 RSUs outstanding at December 31, 2012. All outstanding RSUs as of December 31, 2012 vest within four years of their date of grant. Also outstanding at December 31, 2012 were 1,571,005 PSUs. All outstanding PSUs as of December 31, 2012 vest at the end of their respective performance periods subject to achievement of the performance targets associated with such awards. Upon vesting, all of the remaining PSU awards will be converted into the right to receive one share of common stock of the Company for each unit that vests. The cost of these awards is determined using the fair value of the shares on the date of grant, and compensation expense is generally recognized over the period during which the employees provide the requisite service to the Company. We generally recognize compensation expense for our PSU awards ratably over the performance period based on management’s judgment of the likelihood that performance measures will be attained. We generally recognize compensation expense for our RSU awards ratably over the service period.
A summary of the changes in the stock unit awards outstanding under our equity compensation plans during 2012 is presented below:
| Stock Units | Weighted Average Grant Date Fair Value | |||||
| Outstanding at December 31, 2011 | 2,391,360 | $ | 8.80 | |||
| Granted | 1,536,779 | $ | 11.54 | |||
| Vested | (453,831 | ) | $ | 11.11 | ||
| Forfeited and cancelled | (474,711 | ) | $ | 9.25 | ||
| Outstanding at December 31, 2012 | 2,999,597 | $ | 9.78 | |||
The weighted-average grant date fair value of our stock unit awards was $11.54, $8.73, and $7.06 for the years ended December 31, 2012, 2011 and 2010, respectively. The fair value of stock unit awards that vested during the years ended December 31, 2012, 2011 and 2010 was $5.0 million, $2.5 million and $1.3 million, respectively. As of December 31, 2012, the Company had unrecognized compensation expense related to RSUs and PSUs of $7.2 million and $7.8 million, respectively. The unrecognized compensation expense related to RSUs and PSUs will be recognized over a weighted-average period of 2.3 years and 1.8 years, respectively.
We will satisfy the requirement for delivering the common shares for stock-based plans by issuing new shares.
73
ACCO Brands Corporation and Subsidiaries
Notes to Consolidated Financial Statements (Continued)
7. Inventories
Inventories are stated at the lower of cost or market value. The components of inventories were as follows:
| December 31, | |||||||
| (in millions of dollars) | 2012 | 2011 | |||||
| Raw materials | $ | 40.1 | $ | 23.9 | |||
| Work in process | 5.4 | 3.6 | |||||
| Finished goods | 220.0 | 170.2 | |||||
| Total inventories | $ | 265.5 | $ | 197.7 | |||
8. Property, Plant and Equipment
Property, plant and equipment, net consisted of:
| December 31, | |||||||
| (in millions of dollars) | 2012 | 2011 | |||||
| Land and improvements | $ | 27.5 | $ | 13.6 | |||
| Buildings and improvements to leaseholds | 151.3 | 115.5 | |||||
| Machinery and equipment | 379.2 | 321.7 | |||||
| Construction in progress | 33.4 | 12.5 | |||||
| 591.4 | 463.3 | ||||||
| Less: accumulated depreciation | (317.8 | ) | (316.1 | ) | |||
Property, plant and equipment, net(1) | $ | 273.6 | $ | 147.2 | |||
| (1) | Net property, plant and equipment as of December 31, 2012 and 2011 contained $26.9 million and $24.9 million of computer software assets, which are classified within machinery and equipment and construction in progress. Amortization of software costs was $8.4 million, $9.5 million and $10.1 million for the years ended December 31, 2012, 2011 and 2010, respectively. |
9. Goodwill and Identifiable Intangible Assets
Goodwill
Changes in the net carrying amount of goodwill by segment were as follows:
| (in millions of dollars) | ACCO Brands North America | ACCO Brands International | Computer Products Group | Total | ||||||||||||
| Balance at December 31, 2010 | $ | 78.0 | (1) | $ | 52.1 | (1) | $ | 6.8 | $ | 136.9 | ||||||
| Translation | (0.2 | ) | (1.7 | ) | — | (1.9 | ) | |||||||||
| Balance at December 31, 2011 | 77.8 | 50.4 | 6.8 | 135.0 | ||||||||||||
| Mead C&OP acquisition | 318.7 | 144.7 | — | 463.4 | ||||||||||||
| Translation | (0.2 | ) | (8.8 | ) | — | (9.0 | ) | |||||||||
| Balance at December 31, 2012 | $ | 396.3 | $ | 186.3 | $ | 6.8 | $ | 589.4 | ||||||||
| Goodwill | $ | 527.2 | $ | 270.5 | $ | 6.8 | $ | 804.5 | ||||||||
| Accumulated impairment losses | (130.9 | ) | (84.2 | ) | — | (215.1 | ) | |||||||||
| Balance at December 31, 2012 | $ | 396.3 | $ | 186.3 | $ | 6.8 | $ | 589.4 | ||||||||
(1) | We implemented certain organizational changes in conjunction with the Merger. Effective as of the second quarter of 2012, our former ACCO Brands Americas segment became ACCO Brands North America as the pre-acquisition Latin America |
74
ACCO Brands Corporation and Subsidiaries
Notes to Consolidated Financial Statements (Continued)
business was moved into the ACCO Brands International segment. Goodwill associated with our legacy ACCO Brands Latin America business is therefore now included in the ACCO Brands International segment.
The authoritative guidance on goodwill and other intangible assets requires that goodwill be tested for impairment at a reporting unit level. We have determined that our reporting units are ACCO Brands North America, ACCO Brands International and Computer Products Group segments. We test goodwill for impairment annually and whenever events or circumstances make it more likely than not that an impairment may have occurred. During 2012, we adopted ASU No. 2011-08, Intangibles - Goodwill and Other (Topic 350): Testing Goodwill for Impairment. ASU No. 2011-08 permits entities to first assess qualitative factors to determine if it is more likely than not that the fair value of a reporting unit is less than its carrying amount as a basis for determining whether it is necessary to perform the two-step goodwill impairment test included in U.S. GAAP. Entities are not required to calculate the fair value of a reporting unit unless they determine that it is more likely than not that the fair value is less than the carrying amount. We concluded that it was not necessary to apply the traditional two-step fair value quantitative impairment test in ASC 350 to any of our reporting units in 2012. When applying a fair-value-based test, if it is determined to be required, the fair value of a reporting unit is compared to its carrying value. If the fair value of a reporting unit exceeds the carrying value of the net assets assigned to a reporting unit, goodwill is considered not impaired and no further testing is required. If the carrying value of the net assets assigned to a reporting unit exceeds the fair value of areporting unit, the second step of the impairment test is performed in order to determine the implied fair value of a reporting unit’s goodwill. Determining the implied fair value of goodwill requires valuation of a reporting unit’s tangible and intangible assets and liabilities in a manner similar to the allocation of purchase price in a business combination. If the carrying value of a reporting unit’s goodwill exceeds its implied fair value, goodwill is deemed impaired and is written down to the extent of the difference. Based upon our most recent annual qualitative impairment test completed during 2012, it is not more likely than not that the fair value of the reporting units goodwill is less than their carrying amounts.
Goodwill has been recorded on our balance sheet related to the Merger and represents the excess of the cost of the acquisition when compared to the fair value estimate of the net assets acquired on May 1, 2012 (the date of the Merger). See Note 3, Acquisitions, for details on the preliminary calculation of the goodwill acquired in the Merger with Mead C&OP.
Given the current economic environment and the uncertainties regarding the impact on our business, there can be no assurance that our estimates and assumptions made for purposes of our impairment testing in 2012 will prove to be accurate predictions of the future. If our assumptions regarding forecasted revenue or margin growth rates are not achieved, we may be required to record additional impairment charges in future periods, whether in connection with our next annual impairment testing in the second quarter of 2013 or prior to that, if any such change constitutes a triggering event outside of the quarter from when the annual impairment test is performed. It is not possible at this time to determine if any such future impairment charge would result or, if it does, whether such charge would be material.
Identifiable Intangibles
The identifiable intangible assets of $543.2 million acquired in the Merger with Mead C&OP include trade names and customer relationships and were recorded at their fair values. The values assigned were based on the estimated future discounted cash flows attributable to the asset. These future cash flows were estimated based on the historical cash flows and then adjusted for anticipated future changes, primarily expected changes in sales volume or price. We have assigned an “audit committeeindefinite life to certain trade names, which include the Five Star®, Mead®, Tilibra and Hilroy brands, based on the Company's intention to use these trade names for an indefinite period of time and the expected sustainability of brands and the product categories and cash flows with which they are associated. Each of the named brands has a long history of high brand recognition in the markets that it serves, has significant market share in the product categories in which it competes and has demonstrated strong historical financial expert”performance.
The customer relationships and certain trade names will be amortized on an accelerated basis. Definite-lived trade names and customer relationships are expected to be amortized over lives ranging from 10 to 15 years from the Merger date of May 1, 2012.
75
ACCO Brands Corporation and Subsidiaries
Notes to Consolidated Financial Statements (Continued)
The allocations of the acquired identifiable intangibles acquired in the Merger are as follows:
| (in millions of dollars) | Estimated Fair Value | Estimated Average Remaining Useful Life | |||
| Trade names - indefinite lived | $ | 415.3 | Indefinite | ||
| Trade names - finite lived | 50.3 | 10-15 years | |||
| Customer relationships | 77.6 | 10-15 years | |||
| $ | 543.2 | ||||
As of June 1, 2012, $21.4 million of the value previously assigned to one of our legacy indefinite-lived trade names was changed to an amortizable intangible asset. The change was made in respect of decisions regarding our future use of the trade name. We commenced amortizing the trade name in June of 2012 on a prospective basis over a life of 30 years.
The gross carrying value and accumulated amortization by class of identifiable intangible assets as of December 31, 2012 and 2011 are as follows:
| December 31, 2012 | December 31, 2011 | ||||||||||||||||||||||
| (in millions of dollars) | Gross Carrying Amounts | Accumulated Amortization | Net Book Value | Gross Carrying Amounts | Accumulated Amortization | Net Book Value | |||||||||||||||||
| Indefinite-lived intangible assets: | |||||||||||||||||||||||
| Trade names | $ | 524.9 | $ | (44.5 | ) | (1) | $ | 480.4 | $ | 138.2 | (2) | $ | (44.5 | ) | (1) | $ | 93.7 | ||||||
| Amortizable intangible assets: | |||||||||||||||||||||||
| Trade names | 130.9 | (2) | (36.7 | ) | 94.2 | 58.0 | (27.8 | ) | 30.2 | ||||||||||||||
| Customer and contractual relationships | 103.7 | (32.7 | ) | 71.0 | 26.1 | (21.5 | ) | 4.6 | |||||||||||||||
| Patents/proprietary technology | 10.4 | (9.4 | ) | 1.0 | 10.4 | (8.5 | ) | 1.9 | |||||||||||||||
| Subtotal | 245.0 | (78.8 | ) | 166.2 | 94.5 | (57.8 | ) | 36.7 | |||||||||||||||
| Total identifiable intangibles | $ | 769.9 | $ | (123.3 | ) | $ | 646.6 | $ | 232.7 | $ | (102.3 | ) | $ | 130.4 | |||||||||
| (1) | Accumulated amortization prior to the adoption of authoritative guidance on goodwill and other intangible assets, at which time further amortization ceased. |
| (2) | A trade name with a gross carrying value of $21.4 million has been reclassified to amortizable intangible assets effective in the second quarter of 2012. |
The Company’s intangible amortization was $19.9 million, $6.3 million and $6.7 million for the years ended December 31, 2012, 2011 and 2010, respectively.
Estimated amortization expense for amortizable intangible assets for the next five years is as follows:
| (in millions of dollars) | 2013 | 2014 | 2015 | 2016 | 2017 | ||||||||||||||
| Estimated amortization expense | $ | 24.7 | $ | 22.2 | $ | 19.9 | $ | 17.5 | $ | 14.3 | |||||||||
Actual amounts of amortization expense may differ from estimated amounts due to changes in foreign currency exchange rates, additional intangible asset acquisitions, impairment of intangible assets, accelerated amortization of intangible assets and other events.
10. Restructuring
During the year 2012, we initiated cost savings plans related to the consolidation and integration of the recently acquired Mead C&OP business. The most significant of these plans relates to our dated goods business and includes the 2013 closure of a manufacturing and distribution facility in East Texas, Pennsylvania and relocation of its activities to other facilities within the Company. We have also committed to certain cost savings plans that are expected to improve the efficiency and effectiveness of our U.S. and European businesses, which are independent of any plans related to our acquisition of the Mead C&OP business.
76
ACCO Brands Corporation and Subsidiaries
Notes to Consolidated Financial Statements (Continued)
During the year ended December 31, 2012, the Company recorded restructuring charges of $24.3 million. No new restructuring initiatives were expensed in the years ended December 31, 2011 or 2010.
A summary of the activity in the restructuring accounts and a reconciliation of the liability for the year ended December 31, 2012 is as follows:
| (in millions of dollars) | Balance at December 31, 2011 | Provision/ (Income) | Cash Expenditures | Non-cash Items/ Currency Change | Balance at December 31, 2012 | ||||||||||||||
| Employee termination costs | $ | 0.3 | $ | 24.0 | $ | (9.2 | ) | $ | 0.1 | $ | 15.2 | ||||||||
| Termination of lease agreements | 0.7 | (0.1 | ) | (0.4 | ) | — | 0.2 | ||||||||||||
| Other | — | 0.1 | (0.1 | ) | — | — | |||||||||||||
| Sub-total | 1.0 | 24.0 | (9.7 | ) | 0.1 | 15.4 | |||||||||||||
| Asset impairments/net loss on disposal of assets resulting from restructuring activities | 0.2 | 0.3 | (0.3 | ) | (0.2 | ) | — | ||||||||||||
| Total restructuring liability | $ | 1.2 | $ | 24.3 | $ | (10.0 | ) | $ | (0.1 | ) | $ | 15.4 | |||||||
Management expects the $15.2 million employee termination costs balance to be substantially paid within the next 12 months. Cash payments associated with lease termination costs of $0.2 million are expected to be paid within the next six months.
Not included in the restructuring table above is a $0.1 million net gain on the sale of a manufacturing facility and certain assets in the U.K. The sale, which occurred during the second quarter of 2012, generated net cash proceeds of $2.7 million. The gain on sale has been recognized our Consolidated Statements of Operations in selling, general and administrative expenses.
A summary of the activity in the restructuring accounts and a reconciliation of the liability for the year ended December 31, 2011 is as follows:
| (in millions of dollars) | Balance at December 31, 2010 | Provision/ (Income) | Cash Expenditures | Non-cash Items/ Currency Change | Balance at December 31, 2011 | ||||||||||||||
| Employee termination costs | $ | 2.2 | $ | (0.6 | ) | $ | (1.4 | ) | $ | 0.1 | $ | 0.3 | |||||||
| Termination of lease agreements | 3.0 | (0.5 | ) | (1.9 | ) | 0.1 | 0.7 | ||||||||||||
| Sub-total | 5.2 | (1.1 | ) | (3.3 | ) | 0.2 | 1.0 | ||||||||||||
| Asset impairments/net loss on disposal of assets resulting from restructuring activities | — | 0.4 | (0.1 | ) | (0.1 | ) | 0.2 | ||||||||||||
| Total restructuring liability | $ | 5.2 | $ | (0.7 | ) | $ | (3.4 | ) | $ | 0.1 | $ | 1.2 | |||||||
A summary of the activity in the restructuring accounts and a reconciliation of the liability for the year ended December 31, 2010 is as follows:
| (in millions of dollars) | Balance at December 31, 2009 | Provision/ (Income) | Cash Expenditures | Non-cash Items/ Currency Change | Balance at December 31, 2010 | ||||||||||||||
| Employee termination costs | $ | 8.0 | $ | (1.5 | ) | $ | (3.9 | ) | $ | (0.4 | ) | $ | 2.2 | ||||||
| Termination of lease agreements | 4.4 | 0.2 | (1.5 | ) | (0.1 | ) | 3.0 | ||||||||||||
| Sub-total | 12.4 | (1.3 | ) | (5.4 | ) | (0.5 | ) | 5.2 | |||||||||||
| Asset impairments/net loss on disposal of assets resulting from restructuring activities | — | 0.8 | — | (0.8 | ) | — | |||||||||||||
| Total restructuring liability | $ | 12.4 | $ | (0.5 | ) | $ | (5.4 | ) | $ | (1.3 | ) | $ | 5.2 | ||||||
77
ACCO Brands Corporation and Subsidiaries
Notes to Consolidated Financial Statements (Continued)
In addition to the restructuring described above, in the first quarter of 2011 we initiated plans to rationalize our European operations. The associated costs primarily relate to employee terminations, which were accounted for as regular business expenses and were largely offset by associated savings realized during the remainder of the 2011 year. These costs totaled $4.5 million during the year ended December 31, 2011 and are included within advertising, selling, general and administrative expenses in the Consolidated Statements of Operations.
A summary of the activity in the rationalization charges and a reconciliation of the liability for the year ended December 31, 2011 is as follows:
| (in millions of dollars) | Balance at December 31, 2010 | Provision | Cash Expenditures | Non-cash Items/ Currency Change | Balance at December 31, 2011 | ||||||||||||||
| Employee termination costs | $ | — | $ | 4.5 | $ | (4.2 | ) | $ | 0.1 | $ | 0.4 | ||||||||
The $0.4 million of employee termination costs remaining as of December 31, 2011 were paid in 2012.
11. Income Taxes
The components of income (loss) before income taxes from continuing operations are as follows:
| (in millions of dollars) | 2012 | 2011 | 2010 | ||||||||
| Domestic operations | $ | (94.9 | ) | $ | (48.6 | ) | $ | (38.5 | ) | ||
| Foreign operations | 90.5 | 91.5 | 77.0 | ||||||||
| Total | $ | (4.4 | ) | $ | 42.9 | $ | 38.5 | ||||
The reconciliation of income taxes computed at the U.S. federal statutory income tax rate to our effective income tax rate for continuing operations is as follows:
| (in millions of dollars) | 2012 | 2011 | 2010 | ||||||||
| Income tax at U.S. statutory rate | $ | (1.5 | ) | $ | 15.0 | $ | 13.5 | ||||
| State, local and other tax, net of federal benefit | (0.6 | ) | (1.3 | ) | (0.8 | ) | |||||
| U.S. effect of foreign dividends and earnings | 23.7 | 11.6 | 4.9 | ||||||||
| Unrealized foreign currency (loss) gain on intercompany debt | (7.7 | ) | 0.9 | 8.6 | |||||||
| Foreign income taxed at a lower effective rate | (7.2 | ) | (7.7 | ) | (6.7 | ) | |||||
| (Decrease) increase in valuation allowance | (145.1 | ) | 5.4 | 15.7 | |||||||
| U.S. effect of capital gain | 11.0 | — | — | ||||||||
| Correction of deferred tax error on foreign subsidiary | 0.8 | — | (2.8 | ) | |||||||
| Change in prior year tax estimates | (0.4 | ) | 1.0 | (1.3 | ) | ||||||
| Miscellaneous | 5.6 | (0.6 | ) | (0.4 | ) | ||||||
| Income taxes as reported | $ | (121.4 | ) | $ | 24.3 | $ | 30.7 | ||||
| Effective tax rate | NM | 56.6 | % | 79.7 | % | ||||||
For 2012, we recorded an income tax benefit from continuing operations of $121.4 million on a loss before taxes of $4.4 million. The tax benefit for 2012 is primarily due to the $145.1 million release of certain valuation allowances.
We continually review the need for establishing or releasing valuation allowances on our deferred tax attributes. Due to the acquisition of Mead C&OP in the second quarter of 2012, we analyzed our need for maintaining valuation reserves against the expected U.S. future tax benefits. Based on our analysis we determined that there existed sufficient evidence in the form of future taxable income from the combined operations to release $126.1 million of the valuation allowance that had been previously recorded against the U.S. deferred income tax assets. The resulting deferred tax assets are comprised principally of net operating loss carryforwards that are expected to be fully realized within the expiration period and other temporary differences. Also, as part
78
ACCO Brands Corporation and Subsidiaries
Notes to Consolidated Financial Statements (Continued)
of this ongoing review, valuation allowances were released in certain foreign jurisdictions in the amount of $19.0 million, primarily during the second quarter of 2012, due to the sustained profitability of these businesses.
For the year ended December 31, 2011, income tax expense from continuing operations was $24.3 million on income before taxes of $42.9 million. For 2010, we recorded income tax expense from continuing operations of $30.7 million on income before taxes of $38.5 million. The high effective rates for 2011 and 2010 of 56.6% and 79.7% are due to increases in the valuation allowance of $5.4 million, net of a $2.8 million reversal of a valuation reserve in the U.K., and $15.7 million, respectively. Therefore no tax benefit was being provided on losses incurred in the U.S. and certain foreign jurisdictions where valuation allowances were recorded against certain tax benefits. Also contributing to the high effective tax rate for 2010 was an $8.6 million expense recorded to reflect the income tax impact of foreign currency fluctuations on an intercompany debt obligation, partially offset by the benefit of the $2.8 million out-of-period adjustment.
The effective tax rates for discontinued operations were 25.6%, 13.4% and 29.6% in 2012, 2011 and 2010, respectively. The lower rate in 2011 reflects the benefit of the goodwill tax basis and prior year capital loss carryforwards that reduced the taxable gain on the sale of GBC Fordigraph in Australia.
The U.S. federal statute of limitations remains open for the years 2009 and forward. Foreign and U.S. state jurisdictions have statutes of limitations generally ranging from 3 to 5 years. Years still open to examination by foreign tax authorities in major jurisdictions include Australia (2008 forward), Brazil (2007 forward), Canada (2006 forward) and the U.K. (2010 forward). We are currently under examination in various foreign jurisdictions.
The components of the income tax expense from continuing operations are as follows:
| (in millions of dollars) | 2012 | 2011 | 2010 | ||||||||
| Current expense | |||||||||||
| Federal and other | $ | 6.0 | $ | 0.3 | $ | 0.6 | |||||
| Foreign | 27.1 | 19.8 | 18.1 | ||||||||
| Total current income tax expense | 33.1 | 20.1 | 18.7 | ||||||||
| Deferred (benefit) expense | |||||||||||
| Federal and other | (129.5 | ) | 4.9 | 4.8 | |||||||
| Foreign | (25.0 | ) | (0.7 | ) | 7.2 | ||||||
| Total deferred income tax (benefit) expense | (154.5 | ) | 4.2 | 12.0 | |||||||
| Total income tax (benefit) expense | $ | (121.4 | ) | $ | 24.3 | $ | 30.7 | ||||
79
ACCO Brands Corporation and Subsidiaries
Notes to Consolidated Financial Statements (Continued)
The components of deferred tax assets (liabilities) are as follows:
| (in millions of dollars) | 2012 | 2011 | |||||
| Deferred tax assets | |||||||
| Compensation and benefits | $ | 15.6 | $ | 14.7 | |||
| Pension | 38.5 | 34.2 | |||||
| Inventory | 5.8 | 5.4 | |||||
| Other reserves | 18.0 | 7.2 | |||||
| Accounts receivable | 6.0 | 3.7 | |||||
| Capital loss carryforwards | — | 10.3 | |||||
| Foreign tax credit carryforwards | 20.5 | 20.5 | |||||
| Net operating loss carryforwards | 135.2 | 129.3 | |||||
| Miscellaneous | 6.3 | 3.3 | |||||
| Gross deferred income tax assets | 245.9 | 228.6 | |||||
| Valuation allowance | (55.4 | ) | (204.3 | ) | |||
| Net deferred tax assets | 190.5 | 24.3 | |||||
| Deferred tax liabilities | |||||||
| Depreciation | (27.3 | ) | (2.0 | ) | |||
| Identifiable intangibles | (257.4 | ) | (73.0 | ) | |||
| Unrealized foreign currency gain on intercompany debt | (3.3 | ) | (10.6 | ) | |||
| Gross deferred tax liabilities | (288.0 | ) | (85.6 | ) | |||
| Net deferred tax liabilities | $ | (97.5 | ) | $ | (61.3 | ) | |
Deferred income taxes are not provided on certain undistributed earnings of foreign subsidiaries that are expected to be permanently reinvested in those companies, which aggregate to approximately $586 million and $517 million as of December 31, 2012 and at 2011, respectively. If these amounts were distributed to the U.S., in the form of a dividend or otherwise, we would be subject to additional U.S. income taxes. Determination of the amount of unrecognized deferred income tax liabilities on these earnings is not practicable.
At December 31, 2012, $404.5 million of net operating loss carryforwards are available to reduce future taxable income of domestic and international companies. These loss carryforwards expire in the years 2013 through 2031 or have an unlimited carryover period.
We recognize interest and penalties related to unrecognized tax benefits as a component of income taxes in our results of operations. As of December 31, 2012, we have accrued $1.4 million for interest and penalties on unrecognized tax benefits.
A reconciliation of the beginning and ending amount of unrecognized tax benefits is as follows:
| (in millions of dollars) | 2012 | 2011 | 2010 | ||||||||
| Balance at beginning of year | $ | 5.5 | $ | 5.7 | $ | 6.0 | |||||
| Additions for tax positions of prior years | 2.0 | 0.1 | 0.2 | ||||||||
| Reductions for tax positions of prior years | (1.5 | ) | (0.2 | ) | (0.5 | ) | |||||
| Settlements | — | (0.1 | ) | — | |||||||
| Mead C&OP acquisition | 50.3 | — | — | ||||||||
| Balance at end of year | $ | 56.3 | $ | 5.5 | $ | 5.7 | |||||
As of December 31, 2012 the amount of unrecognized tax benefits increased to $56.3 million, of which $51.6 million would affect our effective tax rate, if recognized. We expect the amount of unrecognized tax benefits to change within the next twelve months, but these changes are not expected to have a significant impact on our results of operations or financial position. None of the positions included in the unrecognized tax benefit relate to tax positions for which the ultimate deductibility is highly certain, but for which there is uncertainty about the timing of such deductibility.
80
ACCO Brands Corporation and Subsidiaries
Notes to Consolidated Financial Statements (Continued)
Income Tax Assessment
In connection with our May 1, 2012 acquisition of Mead C&OP, we assumed all of the tax liabilities for the acquired foreign operations. In December of 2012, the Federal Revenue Department of the Ministry of Finance of Brazil ("FRD") issued a tax assessment against our newly acquired indirect subsidiary, Tilibra Produtos de Papelaria Ltda. ("Tilibra"), which challenged the goodwill recorded in connection with the 2004 acquisition of Tilibra. This assessment denied the deductibility of that goodwill from Tilibra's taxable income for the year 2007. The assessment seeks payment of approximately R$26.9 million ($13.2 million based on current exchange rates) of tax, penalties and interest.
In January of 2013, Tilibra filed a protest disputing the tax assessment at the first administrative level of appeal within the FRD. We believe that we have meritorious defenses and intend to vigorously contest this matter, however, there can be no assurances that we will ultimately prevail. We are in the early stages of the process to challenge the FRD's tax assessment, and the ultimate outcome will not be determined until the Brazilian tax appeal process is complete, which is expected to take many years. In addition, Tilibra's 2008-2012 tax years remain open and subject to audit, and there can be no assurances that we will not receive additional tax assessments regarding the goodwill deducted for the Tilibra acquisition for one or more of those years, which could increase the Company's exposure to a total of approximately $44.5 million (based on current exchange rates), including interest and penalties which have accumulated to date. If the FRD's initial position is ultimately sustained, the amount assessed would adversely affect our reported cash flow in the year of settlement.
Because there is no settled legal precedent on which to base a definitive opinion as to whether we will ultimately prevail, the Company considers the outcome of this dispute to be uncertain. Since it is not more likely than not that we will prevail, in the fourth quarter of 2012, we recorded a reserve in the amount of $44.5 million in consideration of this matter, of which $43.3 million was recorded as an adjustment to the allocation of the purchase price for the fair value of non-current liabilities assumed as of the acquisition date and was recorded as an increase to goodwill. In addition, the Company will continue to accrue interest related to this matter until such time as the outcome is known or until evidence is presented that we are more likely than not to prevail. During 2012, the Company accrued $1.2 million of additional interest that has accumulated since the date of the acquisition as a charge to current income tax expense.
12. Earnings per Share
Total outstanding shares as of December 31, 2012 and 2011 were 113.1 million and 55.5 million, respectively. The calculation of basic earnings per common share is based on the weighted average number of common shares outstanding in the year, or period, over which they were outstanding. Our calculation of diluted earnings per common share assumes that any common shares outstanding were increased by shares that would be issued upon exercise of those stock units for which the average market price for the period exceeds the exercise price; less, the shares that could have been purchased by the Company with the related proceeds, including compensation expense measured but not yet recognized, net of tax.
| (in millions) | 2012 | 2011 | 2010 | |||||
| Weighted-average number of common shares outstanding — basic | 94.1 | 55.2 | 54.8 | |||||
| Stock options | 0.1 | 0.1 | 0.1 | |||||
| Stock-settled stock appreciation rights | 0.9 | 1.7 | 2.1 | |||||
| Restricted stock units | 1.0 | 0.6 | 0.2 | |||||
| Adjusted weighted-average shares and assumed conversions — diluted | 96.1 | 57.6 | 57.2 | |||||
Awards of shares representing approximately 5.4 million, 4.3 million and 4.1 million as of December 31, 2012, 2011 and 2010, respectively, of potentially dilutive shares of common stock were outstanding and are not included in the computation of dilutive earnings per share as their effect would have been anti-dilutive because their exercise prices were higher than the average market price during the period.
13. Derivative Financial Instruments
We are exposed to various market risks, including changes in foreign currency exchange rates and interest rate changes. We enter into financial instruments to manage and reduce the impact of these risks, not for trading or speculative purposes. The counterparties to these financial instruments are major financial institutions. We continually monitor our foreign currency exposures in order to maximize the overall effectiveness of our foreign currency hedge positions. Principal currencies hedged include the
81
ACCO Brands Corporation and Subsidiaries
Notes to Consolidated Financial Statements (Continued)
U.S. dollar, Euro, Australian dollar, Canadian dollar and Pound sterling. We are subject to credit risk, which relates to the ability of counterparties to meet their contractual payment obligations or the potential non-performance by counterparties to financial instrument contracts. Management continues to monitor the status of our counterparties and will take action, as appropriate, to further manage our counterparty credit risk. There are no credit contingency features in our derivative financial instruments.
On the date in which we enter into a derivative, the derivative is designated as a hedge of the identified exposure. We measure the effectiveness of our hedging relationships both at hedge inception and on an ongoing basis.
Forward Currency Contracts
We enter into forward foreign currency contracts to reduce the effect of fluctuating foreign currencies, primarily on foreign denominated inventory purchases and intercompany loans. The majority of the Company’s exposure to local currency movements is in Europe, Australia, Canada, Brazil, Mexico and Japan.
Forward currency contracts are used to hedge foreign denominated inventory purchases for Europe, Australia, Canada and Japan and are designated as cash flow hedges. Unrealized gains and losses on these contracts for inventory purchases are deferred in other comprehensive income (loss) until the contracts are settled and the underlying hedged transactions are recognized, at which time the deferred gains or losses will be reported in the “Cost of products sold” line in the Consolidated Statements of Operations. As of December 31, 2012 and December 31, 2011, the Company had cash flow designated foreign exchange contracts outstanding with a U.S. dollar equivalent notional value of $85.0 million and $71.9 million, respectively.
Forward currency contracts used to hedge foreign denominated intercompany loans are not designated as hedging instruments. Gains and losses on these derivative instruments are recognized within "Other expense, net" in the Consolidated Statements of Operations and are largely offset by the changes in the fair value of the hedged item. The periods of the forward foreign exchange contracts correspond to the periods of the hedged transactions, and do not extend beyond 2013. As of December 31, 2012 and 2011, we have undesignated foreign exchange contracts outstanding with a U.S. dollar equivalent notional value of $90.4 million and $75.6 million, respectively.
The following table summarizes the fair value of our derivative financial instruments as of December 31, 2012 and 2011, respectively.
| Fair Value of Derivative Instruments | |||||||||||||||||||
| Derivative Assets | Derivative Liabilities | ||||||||||||||||||
| (in millions of dollars) | Balance Sheet Location | December 31, 2012 | December 31, 2011 | Balance Sheet Location | December 31, 2012 | December 31, 2011 | |||||||||||||
| Derivatives designated as hedging instruments: | |||||||||||||||||||
| Foreign exchange contracts | Other current assets | $ | 0.7 | $ | 3.0 | Other current liabilities | $ | 0.6 | $ | 0.2 | |||||||||
| Derivatives not designated as hedging instruments: | |||||||||||||||||||
| Foreign exchange contracts | Other current assets | 0.5 | 0.8 | Other current liabilities | 0.2 | 1.2 | |||||||||||||
| Total derivatives | $ | 1.2 | $ | 3.8 | $ | 0.8 | $ | 1.4 | |||||||||||
The following tables summarizes the pre-tax effect of the Company’s derivative financial instruments on the Consolidated Statements of Operations for the years ended December 31, 2012, 2011 and 2010 respectively.
| The Effect of Derivative Instruments in Cash Flow Hedging Relationships on the Consolidated Statements of Operations for the Years Ended December 31, | |||||||||||||||||||||||||
| Amount of Gain (Loss) Recognized in OCI (Effective Portion) | Location of (Gain) Loss Reclassified from OCI to Income | Amount of (Gain) Loss Reclassified from AOCI to Income (Effective Portion) | |||||||||||||||||||||||
| (in millions of dollars) | 2012 | 2011 | 2010 | 2012 | 2011 | 2010 | |||||||||||||||||||
| Cash flow hedges: | |||||||||||||||||||||||||
| Foreign exchange contracts | (0.2 | ) | $ | (0.3 | ) | $ | (3.1 | ) | Cost of products sold | $ | (1.9 | ) | $ | 4.4 | $ | 0.8 | |||||||||
82
ACCO Brands Corporation and Subsidiaries
Notes to Consolidated Financial Statements (Continued)
| The Effect of Derivatives Not Designated as Hedging Instruments on the Consolidated Statements of Operations | |||||||||||||
| Location of (Gain) Loss Recognized in Income on Derivatives | Amount of (Gain) Loss Recognized in Income year ended December 31, | ||||||||||||
| (in millions of dollars) | 2012 | 2011 | 2010 | ||||||||||
| Foreign exchange contracts | Other expense, net | $ | 2.3 | $ | 0.9 | $ | (1.8 | ) | |||||
14. Fair Value of Financial Instruments
In establishing a fair value, there is a fair value hierarchy that prioritizes the inputs to valuation techniques used to measure fair value. The basis of the fair value measurement is categorized in three levels, in order of priority, as described below:
| Level 1 | Unadjusted quoted prices in active markets for identical assets or liabilities |
| Level 2 | Unadjusted quoted prices in active markets for similar assets or liabilities, or |
| Unadjusted quoted prices for identical or similar assets or liabilities in markets that are not active, or | |
| Inputs other than quoted prices that are observable for the asset or liability | |
| Level 3 | Unobservable inputs for the asset or liability |
We utilize the best available information in measuring fair value. Financial assets and liabilities are classified in their entirety based on the lowest level of input that is significant to the fair value measurement.
We have determined that our financial assets and liabilities are Level 2 in the fair value hierarchy. The following table sets forth our financial assets and liabilities that were accounted for at fair value on a recurring basis as of December 31, 2012 and 2011, respectively:
| (in millions of dollars) | December 31, 2012 | December 31, 2011 | |||||
| Assets: | |||||||
| Forward currency contracts | $ | 1.2 | $ | 3.8 | |||
| Liabilities: | |||||||
| Forward currency contracts | $ | 0.8 | $ | 1.4 | |||
Our forward currency contracts are included in "Other current assets" or "Other current liabilities" and mature within 12 months. The forward foreign currency exchange contracts are primarily valued based on the foreign currency spot and forward rates quoted by the banks or foreign currency dealers. As such, these derivative instruments are classified within Level 2.
The fair values of cash and cash equivalents, notes payable to banks, accounts receivable and accounts payable approximate carrying amounts due principally to their short maturities. The carrying amount of total debt was $1,072.1 million and $669.0 million and the estimated fair value of total debt was $1,097.5 million and $727.2 million at December 31, 2012 and 2011, respectively. The fair values are determined from quoted market prices, where available, and from investment bankers using current interest rates considering credit ratings and the remaining terms of maturity.
83
ACCO Brands Corporation and Subsidiaries
Notes to Consolidated Financial Statements (Continued)
15. Accumulated Other Comprehensive Income (Loss)
Comprehensive income is defined as net income (loss) and other changes in stockholders’ equity from transactions and other events from sources other than stockholders. The components of, and changes in, accumulated other comprehensive income (loss) were:
| (in millions of dollars) | Derivative Financial Instruments | Foreign Currency Adjustments | Unrecognized Pension and Other Post-retirement Benefit Costs | Accumulated Other Comprehensive Income (Loss) | |||||||||||
| Balance at December 31, 2010 | $ | (1.5 | ) | $ | (2.1 | ) | $ | (82.5 | ) | $ | (86.1 | ) | |||
| Changes during the year (net of taxes of $3.1) | 3.7 | (15.0 | ) | (33.6 | ) | (44.9 | ) | ||||||||
| Balance at December 31, 2011 | 2.2 | (17.1 | ) | (116.1 | ) | (131.0 | ) | ||||||||
| Changes during the year (net of taxes of $6.3) | (2.1 | ) | (10.9 | ) | (12.1 | ) | (25.1 | ) | |||||||
| Balance at December 31, 2012 | $ | 0.1 | $ | (28.0 | ) | $ | (128.2 | ) | $ | (156.1 | ) | ||||
16. Information on Business Segments
In conjunction with the Merger during the second quarter of 2012, we realigned our Americas and International segments. The pre-acquisition Latin America business has been moved into the International segment along with Mead C&OP's Brazilian operations. Our Computer Products Group was unaffected by the realignment or the Merger.
Our three business segments are described below.
ACCO Brands North America and ACCO Brands International
On May 1, 2012, we implemented certain organizational changes in our business segments in conjunction with the Merger with Mead C&OP. Effective as of the second quarter of 2012, the Company's former ACCO Brands Americas segment became ACCO Brands North America as the Company's pre-acquisition Latin America business was moved into the ACCO Brands International segment. These two segments manufacture, source and sell traditional office products, school supplies, calendar products and document finishing solutions. ACCO Brands North America comprises the U.S. and Canada, and ACCO Brands International comprises the rest of the world, principally Europe, Australia, Latin America and Asia-Pacific. Prior periods have been restated for comparability.
As discussed in Note 1, Basis of Presentation, during the second quarter of 2011 the Company sold GBC Fordigraph which was formerly part of the ACCO Brands International segment and is included in the financial statement caption “Discontinued Operations.” The ACCO Brands International segment is now presented on a continuing operations basis excluding GBC Fordigraph.
Our office, school and calendar product lines use name brands such as: AT-A-GLANCE®, Day-Timer®, Five Star®, GBC®, Hilroy®, Marbig, Mead®, NOBO, Quartet®, Rexel, Swingline®, Tilibra®, Wilson Jones® and many others. Products and brands are not confined to one channel or product category and are sold based on end-user preference in each geographic location. We manufacture approximately 50% of our products, and specify and source approximately 50% of our products, mainly from Asia. The majority of our office products, such as stapling, binding and laminating equipment and related consumable supplies, shredders and whiteboards, are used by businesses. Most of these end-users purchase their products from our customers, which include commercial contract stationers, mass merchandisers, retail superstores, wholesalers, resellers, mail order and internet catalogs, club stores and dealers. We also supply some of our products directly to large commercial and industrial end-users. For all of our products, historically, we have targeted the premium end of the product categories in which we compete. However, we also supply private label products for our customers and provide machine maintenance and certain repair services. Our school products include notebooks, folders, decorative calendars, and stationery products. We distribute our school products primarily through traditional and online retail mass market, grocery, drug and office superstore channels. Our calendar products are sold throughout all channels where we sell office or school products, and we also sell calendar products direct to consumers.
The customer base to which we sell our products is mainly made up of large global and regional resellers of our products. Mass and retail channels mainly sell to individual consumers but also to small businesses. Office superstores mainly sell to
84
ACCO Brands Corporation and Subsidiaries
Notes to Consolidated Financial Statements (Continued)
commercial customers but also to individual consumers at their retail stores. As a result, there is no clear correlation between product, consumer or distribution channel. We also sell to commercial contract stationers, wholesalers, distributors, mail order and internet catalogs, and independent dealers. Over half of our product sales by our customers are to business end-users, who generally seek premium products that have added value or ease-of-use features and a reputation for reliability, performance and professional appearance. Some of our document finishing products are sold directly to high-volume end-users and commercial reprographic centers.
Computer Products Group
The Computer Products Group designs, distributes, markets and sells accessories for laptop and desktop computers and tablets and smartphones. These accessories primarily include security products, iPad® covers and keypads, smartphone accessories, power adapters, input devices such as mice, laptop computer carrying cases, hubs, docking stations and ergonomic devices. The Computer Products Group sells mostly under the Kensington®, Microsaver® and ClickSafe® brand names, with the majority of its revenue coming from the U.S. and Western Europe.
All of our computer products are manufactured to our specifications by third-party suppliers, principally in Asia, and are stored and distributed from our regional facilities. Our computer products are sold primarily to consumer electronics retailers, information technology value-added resellers, original equipment manufacturers and office products retailers.
Financial information by reportable segment is set forth below.
Net sales by business segment for the years ended December 31, 2012, 2011 and 2010 are as follows:
| (in millions of dollars) | 2012 | 2011 | 2010 | ||||||||
| ACCO Brands North America | $ | 1,028.2 | $ | 623.1 | $ | 631.6 | |||||
| ACCO Brands International | 551.2 | 505.0 | 476.0 | ||||||||
| Computer Products Group | 179.1 | 190.3 | 177.0 | ||||||||
| Net sales | $ | 1,758.5 | $ | 1,318.4 | $ | 1,284.6 | |||||
Operating income by business segment for the years ended December 31, 2012, 2011 and 2010 are as follows (a):
| (in millions of dollars) | 2012 | 2011 | 2010 | ||||||||
| ACCO Brands North America | $ | 86.2 | $ | 37.4 | $ | 44.2 | |||||
| ACCO Brands International | 62.0 | 58.9 | 43.6 | ||||||||
| Computer Products Group | 35.9 | 47.1 | 43.0 | ||||||||
| Segment operating income | 184.1 | 143.4 | 130.8 | ||||||||
| Corporate | (44.8 | ) | (28.2 | ) | (21.1 | ) | |||||
| Operating income | 139.3 | 115.2 | 109.7 | ||||||||
| Interest expense, net | 89.3 | 77.2 | 78.3 | ||||||||
| Equity in earnings of joint ventures | (6.9 | ) | (8.5 | ) | (8.3 | ) | |||||
| Other expense, net | 61.3 | 3.6 | 1.2 | ||||||||
| Income (loss) from continuing operations before income tax | $ | (4.4 | ) | $ | 42.9 | $ | 38.5 | ||||
| (a) | Operating income as presented in the segment table above is defined as i) net sales; ii) less cost of products sold; iii) less advertising, selling, general and administrative expenses; iv) less amortization of intangibles; and v) less restructuring. |
85
ACCO Brands Corporation and Subsidiaries
Notes to Consolidated Financial Statements (Continued)
Segment assets:
The following table presents the measure of segment assets used by the Company’s chief operating decision maker.
| December 31, | |||||||
| 2012 | 2011 | ||||||
| (in millions of dollars) | |||||||
| ACCO Brands North America (b) | $ | 505.1 | $ | 272.9 | |||
| ACCO Brands International (b) | 486.4 | 282.2 | |||||
| Computer Products Group (b) | 90.3 | 85.5 | |||||
| Total segment assets | 1,081.8 | 640.6 | |||||
| Unallocated assets | 1,424.5 | 468.9 | |||||
| Corporate (b) | 1.4 | 7.2 | |||||
| Total assets | $ | 2,507.7 | $ | 1,116.7 | |||
| (b) | Represents total assets, excluding: goodwill and identifiable intangibles resulting from business acquisitions, intercompany balances, cash, deferred taxes, prepaid pension assets, prepaid debt issuance costs and joint ventures accounted for on an equity basis. |
As a supplement to the presentation of segment assets presented above, the table below presents segment assets, including the allocation of identifiable intangible assets and goodwill resulting from business combinations.
| December 31, | |||||||
| (in millions of dollars) | 2012 | 2011 | |||||
| ACCO Brands North America (c) | $ | 1,398.6 | $ | 433.4 | |||
| ACCO Brands International (c) | 814.3 | 372.2 | |||||
| Computer Products Group (c) | 104.8 | 100.4 | |||||
| Total segment assets | 2,317.7 | 906.0 | |||||
| Unallocated assets | 188.6 | 203.5 | |||||
| Corporate (c) | 1.4 | 7.2 | |||||
| Total assets | $ | 2,507.7 | $ | 1,116.7 | |||
| (c) | Represents total assets, excluding: intercompany balances, cash, deferred taxes, prepaid pension assets, prepaid debt issuance costs and joint ventures accounted for on an equity basis. |
Property, plant and equipment, net by geographic region are as follows:
| December 31, | |||||||
| (in millions of dollars) | 2012 | 2011 | |||||
| U.S. | $ | 141.0 | $ | 76.2 | |||
| Brazil | 62.1 | — | |||||
| U.K. | 22.7 | 23.8 | |||||
| Australia | 17.1 | 17.5 | |||||
| Other countries | 30.7 | 29.7 | |||||
| Property, plant and equipment | $ | 273.6 | $ | 147.2 | |||
86
ACCO Brands Corporation and Subsidiaries
Notes to Consolidated Financial Statements (Continued)
Net sales by geographic region for the years ended December 31, 2012, 2011 and 2010 are as follows (d):
| (in millions of dollars) | 2012 | 2011 | 2010 | ||||||||
| U.S. | $ | 959.2 | $ | 621.3 | $ | 633.0 | |||||
| Canada | 160.8 | 105.2 | 97.8 | ||||||||
| Australia | 133.4 | 143.0 | 137.0 | ||||||||
| Brazil | 118.9 | — | — | ||||||||
| UK | 98.0 | 115.6 | 107.3 | ||||||||
| Other countries | 288.2 | 333.3 | 309.5 | ||||||||
| Net sales | $ | 1,758.5 | $ | 1,318.4 | $ | 1,284.6 | |||||
| (d) | Net sales are attributed to geographic areas based on the location of the selling company. |
Major Customers
Sales to the Company’s five largest customers totaled $716.2 million, $508.2 million and $496.4 million in the years ended December 31, 2012, 2011 and 2010, respectively. Sales to Staples, our largest customer, were $236.3 million (13%), $175.9 million (13%) and $166.8 million (13%) in the years ended December 31, 2012, 2011 and 2010, respectively. Sales to our second largest customer were $138.9 million (11%) and $141.0 million (11%) in the years ended December 31, 2011 and 2010, respectively. Sales to no other customer exceeded 10% of annual sales.
A significant percentage of our sales are to customers engaged in the office products resale industry. Concentration of credit risk with respect to trade accounts receivable is partially mitigated because a large number of geographically diverse customers make up each operating companies’ domestic and international customer base, thus spreading the credit risk. At December 31, 2012, and 2011, our top five trade account receivables totaled $184.3 million and $116.0 million, respectively.
17. Joint Venture Investments
Summarized below is aggregated financial information for the Company’s joint ventures, Pelikan-Artline Pty Ltd and Neschen GBC Graphics Films, LLC ("Neschen"), which are accounted for under the equity method. Accordingly, we record our proportionate share of earnings or losses on the line entitled “Equity in earnings of joint ventures” in the Consolidated Statements of Operations. Our share of the net assets of the joint ventures are included within “Other assets” in the Condensed Consolidated Balance Sheets.
| Year Ended December 31, | |||||||||||
| (in millions of dollars) | 2012 | 2011 | 2010 | ||||||||
| Net sales | $ | 161.9 | $ | 165.6 | $ | 151.8 | |||||
| Gross profit | 95.6 | 94.6 | 85.8 | ||||||||
| Operating income | 24.7 | 24.3 | 23.0 | ||||||||
| Net income | 17.4 | 16.9 | 16.3 | ||||||||
| December 31, | |||||||
| (in millions of dollars) | 2012 | 2011 | |||||
| Current assets | $ | 80.7 | $ | 94.3 | |||
| Non-current assets | 36.9 | 37.1 | |||||
| Current liabilities | 34.2 | 40.0 | |||||
| Non-current liabilities | 12.8 | 16.7 | |||||
During the fourth quarter of 2012 we recorded an impairment charge of $1.9 million related to our investment in Neschen. We have committed to pursue an exit strategy in regards to Neschen, due to significant excess capacity and other opportunities to
87
ACCO Brands Corporation and Subsidiaries
Notes to Consolidated Financial Statements (Continued)
reduce the cost of products that we have historically sourced from Neschen. Neschen reported net sales of $8.3 million and net income of $0.1 million for the year ended December 31, 2012.
18. Commitments and Contingencies
Pending Litigation
In connection with our May 1, 2012 acquisition of Mead C&OP, we assumed all of the tax liabilities for the acquired foreign operations. In December of 2012, the Federal Revenue Department of the Ministry of Finance of Brazil ("FRD") issued a tax assessment against our newly acquired indirect subsidiary, Tilibra Produtos de Papelaria Ltda. ("Tilibra"), which challenged the goodwill recorded in connection with the 2004 acquisition of Tilibra. This assessment denied the deductibility of that goodwill from Tilibra's taxable income for the year 2007. The assessment seeks a payment of approximately R$26.9 million ($13.2 million based on current exchange rates) of tax, penalties and interest.
In January of 2013, Tilibra filed a protest disputing the tax assessment at the first administrative level of appeal within the FRD. We believe that we have meritorious defenses and intend to vigorously contest this matter, however, there can be no assurances that we will ultimately prevail. We are in the early stages of the process to challenge the FRD's tax assessment, and the ultimate outcome will not be determined until the Brazilian tax appeal process is complete, which is expected to take many years. In addition, Tilibra's 2008-2012 tax years remain open and subject to audit, and there can be no assurances that we will not receive additional tax assessments regarding the goodwill deducted for the Tilibra acquisition for one or more of those years, which could increase the Company's exposure to a total of approximately $44.5 million (based on current exchange rates), including interest and penalties which have accumulated to date. If the FRD's initial position is ultimately sustained, the amount assessed would adversely affect our reported cash flow in the year of settlement.
Because there is no settled legal precedent on which to base a definitive opinion as to whether we will ultimately prevail, the Company considers the outcome of this dispute to be uncertain. Since it is not more likely than not that we will prevail, in the fourth quarter of 2012, we recorded a reserve in the amount of $44.5 million in consideration of this matter. In addition, the Company will continue to accrue interest related to this matter until such time as the outcome is known or until evidence is presented that we are more likely than not to prevail.
There are various other claims, lawsuits and pending actions against us incidental to our operations. It is the opinion of management that the ultimate resolution of these matters will not have a material adverse effect on our consolidated financial position, results of operations or cash flows. However, we can make no assurances that we will ultimately be successful in our defense of any of these matters.
Lease Commitments
Future minimum rental payments for all non-cancelable operating leases (reduced by minor amounts from subleases) at December 31, 2012 are as follows:
| (in millions of dollars) | |||
| 2013 | $ | 21.0 | |
| 2014 | 18.3 | ||
| 2015 | 15.7 | ||
| 2016 | 13.7 | ||
| 2017 | 11.8 | ||
| Remainder | 48.4 | ||
| Total minimum rental payments | $ | 128.9 | |
Total rental expense reported in our statement of operations for all non-cancelable operating leases (reduced by minor amounts for subleases) amounted to $22.3 million, $21.7 million and $23.2 million for the years ended December 31, 2012, 2011 and 2010, respectively.
88
ACCO Brands Corporation and Subsidiaries
Notes to Consolidated Financial Statements (Continued)
Unconditional Purchase Commitments
Future minimum payments under unconditional purchase commitments, primarily for inventory purchase commitments at December 31, 2012 are as follows:
| (in millions of dollars) | |||
| 2013 | $ | 89.4 | |
| 2014 | 8.1 | ||
| 2015 | 8.1 | ||
| 2016 | 8.1 | ||
| 2017 | 8.0 | ||
| Thereafter | — | ||
| $ | 121.7 | ||
Environmental
We are subject to laws and regulations relating to the protection of the environment. While it is not possible to quantify with certainty the potential impact of actions regarding environmental matters, particularly remediation and other compliance efforts that our subsidiaries may undertake in the future, in the opinion of management, compliance with the present environmental protection laws, before taking into account any estimated recoveries from third parties, will not have a material adverse effect upon the results of operations, cash flows or financial condition of the Company.
19. Discontinued Operations
During the second quarter of 2011, we sold GBC Fordigraph to The Neopost Group. The Australia-based business was formerly part of the ACCO Brands International segment and is included in the financial statements as discontinued operations. GBC Fordigraph represented $45.9 million in annual net sales for the year ended December 31, 2010. We received final proceeds of $52.9 million during 2011, inclusive of working capital adjustments and selling costs. In connection with this transaction, in 2011, the Company recorded a gain on sale of $41.9 million ($36.8 million after- tax).
Also included in discontinued operations are residual costs of our commercial print finishing business, which was sold during the second quarter of 2009. During the twelve months ended December 31, 2012, the Company recorded additional costs related to a legal settlement and to ongoing legal disputes of $2.0 million related to its former commercial print finishing business.
The operating results and financial position of discontinued operations are as follows:
| (in millions, except per share data) | 2012 | 2011 | 2010 | ||||||||
| Operating Results: | |||||||||||
| Net sales | $ | — | $ | 19.9 | $ | 45.9 | |||||
Income from operations before income taxes(1) | — | 2.5 | 6.6 | ||||||||
| Gain (loss) on sale before income taxes | (2.1 | ) | 41.5 | (0.1 | ) | ||||||
| Provision (benefit) for income taxes | (0.5 | ) | 5.9 | 1.9 | |||||||
| Income (loss) from discontinued operations | $ | (1.6 | ) | $ | 38.1 | $ | 4.6 | ||||
| Per share: | |||||||||||
| Basic income (loss) from discontinued operations | $ | (0.02 | ) | $ | 0.69 | $ | 0.08 | ||||
| Diluted income (loss) from discontinued operations | $ | (0.02 | ) | $ | 0.66 | $ | 0.08 | ||||
| (1) | During the fourth quarter of 2010, we completed the sale of a property formerly occupied by our commercial print finishing business, resulting in a gain on sale of $1.7 million. |
Litigation-related accruals of $2.4 million and $1.1 million related to discontinued operations are included in other current liabilities as of December 31, 2012 and 2011, respectively. Of the $2.4 million accrued at December 31, 2012, $1.1 million was paid in January of 2013.
89
ACCO Brands Corporation and Subsidiaries
Notes to Consolidated Financial Statements (Continued)
20. Quarterly Financial Information (Unaudited)
The following is an analysis of certain items in the consolidated statements of operations by quarter for 2012 and 2011:
| (in millions of dollars, except per share data) | 1st Quarter | 2nd Quarter | 3rd Quarter | 4th Quarter | |||||||||||
| 2012 | |||||||||||||||
| Net sales | $ | 288.9 | $ | 438.7 | $ | 501.2 | $ | 529.7 | |||||||
| Gross profit | 79.8 | 124.3 | 151.2 | 178.1 | |||||||||||
| Operating income | 4.0 | 11.6 | 56.4 | 67.3 | |||||||||||
| Income (loss) from continuing operations | (17.3 | ) | 94.2 | 55.2 | (15.1 | ) | |||||||||
| Loss from discontinued operations, net of income taxes | (0.1 | ) | — | — | (1.5 | ) | |||||||||
| Net income (loss) | $ | (17.4 | ) | $ | 94.2 | $ | 55.2 | $ | (16.6 | ) | |||||
| Basic income (loss) per share: | |||||||||||||||
| Income (loss) from continuing operations | $ | (0.31 | ) | $ | 1.00 | $ | 0.49 | $ | (0.13 | ) | |||||
| Loss from discontinued operations | $ | — | $ | — | $ | — | $ | (0.01 | ) | ||||||
| Net income (loss) | $ | (0.31 | ) | $ | 1.00 | $ | 0.49 | $ | (0.15 | ) | |||||
| Diluted income (loss) per share: | |||||||||||||||
| Income (loss) from continuing operations | $ | (0.31 | ) | $ | 0.98 | $ | 0.48 | $ | (0.13 | ) | |||||
| Loss from discontinued operations | $ | — | $ | — | $ | — | $ | (0.01 | ) | ||||||
| Net income (loss) | $ | (0.31 | ) | $ | 0.98 | $ | 0.48 | $ | (0.15 | ) | |||||
| 2011 | |||||||||||||||
| Net sales | $ | 298.4 | $ | 330.2 | $ | 339.1 | $ | 350.7 | |||||||
| Gross profit | 85.2 | 101.4 | 103.2 | 109.4 | |||||||||||
| Operating income | 13.3 | 30.6 | 35.4 | 35.9 | |||||||||||
| Income (loss) from continuing operations | (9.0 | ) | 6.3 | 11.9 | 9.4 | ||||||||||
| Income (loss) from discontinued operations, net of income taxes | 0.9 | 37.4 | (0.2 | ) | — | ||||||||||
| Net income (loss) | $ | (8.1 | ) | $ | 43.7 | $ | 11.7 | $ | 9.4 | ||||||
| Basic income (loss) per share: | |||||||||||||||
| Income (loss) from continuing operations | $ | (0.16 | ) | $ | 0.11 | $ | 0.22 | $ | 0.17 | ||||||
| Income (loss) from discontinued operations | $ | 0.02 | $ | 0.68 | $ | — | $ | — | |||||||
| Net income (loss) | $ | (0.15 | ) | $ | 0.79 | $ | 0.21 | $ | 0.17 | ||||||
| Diluted income (loss) per share: | |||||||||||||||
| Income (loss) from continuing operations | $ | (0.16 | ) | $ | 0.11 | $ | 0.21 | $ | 0.16 | ||||||
| Income (loss) from discontinued operations | $ | 0.02 | $ | 0.64 | $ | — | $ | — | |||||||
| Net income (loss) | $ | (0.15 | ) | $ | 0.75 | $ | 0.20 | $ | 0.16 | ||||||
90
ITEM 9.CHANGES IN AND DISAGREEMENTS WITH ACCOUNTANTS ON ACCOUNTING AND FINANCIAL DISCLOSURE
Not applicable.
ITEM 9A. CONTROLS AND PROCEDURES
As of the end of the period covered by this Annual Report on Form 10-K, we carried out an evaluation, under the supervision and with the participation of our Disclosure Committee and our management, including the Chief Executive Officer and the Chief Financial Officer, of the effectiveness of the design and operation of our disclosure controls and procedures. Based upon that evaluation, the Chief Executive Officer and the Chief Financial Officer concluded that our disclosure controls and procedures were effective.
In the second quarter of 2012, we completed the Merger of Mead C&OP which represented $551.5 million of our consolidated net sales for the year ended December 31, 2012. Consolidated assets as of December 31, 2012 were $514.4 million. As the acquisition occurred in the second quarter of 2012, the scope of our assessment of the effectiveness of internal control over financial reporting does not include Mead C&OP. This exclusion is in accordance with the SEC's general guidance that an assessment of a recently acquired business may be omitted from our scope in the year of acquisition.
The report called for by Item 407(d)(5)(ii)308(a) of Regulation S-K is incorporated herein by reference to the Report of Management on Internal Control Over Financial Reporting included in Part II, Item 8 of this report.
The attestation report called for by Item 308(b) of Regulation S-K is incorporated herein by reference to the Report of Independent Registered Public Accounting Firm, included in Part II, Item 8 of this report.
There has been no change in our internal control over financial reporting that occurred during the Company’s last fiscal quarter that has materially affected, or is reasonably likely to materially affect, the Company’s internal control over financial reporting.
ITEM 9B.OTHER INFORMATION
Not applicable.
PART III
ITEM 10.DIRECTORS, EXECUTIVE OFFICERS AND CORPORATE GOVERNANCE
Information required under the Exchange Act.
Code of Business Conduct
The Company has adopted a code of business conduct as required by the listing standards of the New York Stock Exchange and rules of the Securities and Exchange Commission. This code applies to all of the Company’s directors, officers and employees. The code of business conduct is published and available at the Investor Relations Section of the Company’s internet website at www.accobrands.com. The Company will post on its website any amendments to, or waivers from, our code of business conduct applicable to any of its directors or executive officers. The foregoing information will be available in print to any shareholder who requests such information from ACCO Brands Corporation, 300 Tower Parkway, Lincolnshire, IL 60069, Attn: Office of the General Counsel. After April 16, 2013 please send all inquiries to ACCO Brands Corporation, Four Corporate Drive, Lake Zurich, IL 60047-2997, Attn: Office of the General Counsel.
As required by Section 303A.12(a) of the New York Stock Exchange Listed Company Manual, the Company’s Chief Executive Officer certified to the NYSE within 30 days after the Company’s 20112012 Annual Meeting of Stockholders that he was not aware of any violation by the Company of the NYSE Corporate Governance Listing Standards.
ITEM 11.EXECUTIVE COMPENSATION
 |  |
Name | Base Salary on 1/1/2010 | Effective Date of Increase | New Base Salary | % Change |
Robert J. Keller | $756,000 | 4/4/2011 | $786,000 | 4.0% |
Neal V. Fenwick | $437,500 | 4/4/2011 | $450,000 | 3.3% |
Name | Base Salary on 1/1/2011 | Effective Date of Increase | New Base Salary | % Change |
Robert J. Keller | $786,000 | 4/2/2012 | $825,000 | 5.0% |
Boris Elisman | $525,000 | 4/2/2012 | $540,000 | 2.9% |
Neal Fenwick | $450,000 | 4/2/2012 | $465,000 | 3.3% |
| Christopher M. Franey | $410,000 | 4/2/2012 | $425,000 | 3.7% |
Thomas H. Shortt | $410,000 | 4/2/2012 | $425,000 | 3.7% |
Name | Target AIP as % of Salary (100% of Target) | Maximum AIP as % of Salary (200% of Target) |
Robert J. Keller | 105% | 210% |
Boris Elisman | 80% | 160% |
Neal V. Fenwick | 65% | 130% |
| Christopher M. Franey | 65% | 130% |
Thomas H. Shortt | 65% | 130% |
Name | Target AIP Opportunity | Actual AIP Award |
Robert J. Keller | $816,819 | $368,385 |
Boris Elisman | �� 420,000 | 189,420 |
Neal V. Fenwick | 290,006 | 130,793 |
| Christopher M. Franey | 266,500 | 120,192 |
Thomas H. Shortt | 266,094 | 120,008 |
2010-2012 LTIP Grant | |||
Name | Total Target Award Value | Target PSUs (Based on Free Cash Flow) | Target Cash (Based on Revenue Growth) |
Robert J. Keller | $1,148,038 | 65,800 | $680,200 |
Boris Elisman | $420,000 | 22,900 | $236,800 |
Neal V. Fenwick | $435,800 | 23,800 | $245,400 |
| Christopher M. Franey | $336,100 | 18,400 | $188,900 |
Thomas H. Shortt | $393,800 | 21,500 | $221,800 |
2011 Free Cash Flow PSUs for the 2010-2012 LTIP Grant Period | |||
Name | Threshold ($45 Million) | Target (and Actual)* ($60 Million) | Maximum ($75 Million) |
Robert J. Keller | 10,967 | 21,933 | 32,900 |
Boris Elisman | 3,817 | 7,633 | 11,450 |
Neal V. Fenwick | 3,967 | 7,933 | 11,900 |
| Christopher M. Franey | 3,067 | 6,133 | 9,200 |
Thomas H. Shortt | 3,584 | 7,167 | 10,751 |
2011-2013 LTIP Grant | ||||
Name | Total Target Award Value | NQSOs | RSUs | Target PSUs |
Robert J. Keller | $1,257,600 | 87,700 | 39,700 | 104,100 |
Boris Elisman | 682,500 | 47,600 | 21,600 | 56,500 |
Neal V. Fenwick | 450,000 | 31,400 | 14,200 | 37,300 |
| Christopher M. Franey | 410,000 | 28,600 | 13,000 | 34,000 |
Thomas H. Shortt | 410,000 | 28,600 | 13,000 | 34,000 |
2011 Free Cash Flow PSUs for the 2011-2013 LTIP Grant Period | |||
Name | Threshold ($45 Million) | Target (and Actual)* ($60 Million) | Maximum ($75 Million) |
Robert J. Keller | 8,675 | 17,350 | 26,025 |
Boris Elisman | 4,709 | 9,417 | 14,126 |
Neal V. Fenwick | 3,109 | 6,217 | 9,326 |
| Christopher M. Franey | 2,834 | 5,667 | 8,501 |
Thomas H. Shortt | 2,834 | 5,667 | 8,501 |
2012-2014 LTIP Grant | ||||
Name | Total Target Award Value | NQSOs | RSUs | Target PSUs |
Robert J. Keller | $1,856,000 | 108,159 | 50,822 | 133,911 |
Boris Elisman | $775,000 | 45,163 | 21,221 | 55,916 |
Neal V. Fenwick | $465,000 | 27,098 | 12,733 | 33,550 |
| Christopher M. Franey | $500,000 | 29,138 | 13,691 | 36,075 |
Thomas H. Shortt | $380,000 | 22,145 | 10,405 | 27,417 |
2012 Revenue Growth Target PSUs for the 2012-2014 LTIP Grant | |||
Name | Threshold | Target | Maximum |
Robert J. Keller | 11,160 | 22,319 | 33,479 |
Boris Elisman | 4,660 | 9,319 | 13,979 |
Neal V. Fenwick | 2,796 | 5,592 | 8,388 |
| Christopher M. Franey | 3,007 | 6,013 | 9,020 |
Thomas H. Shortt | 2,285 | 4,570 | 6,855 |
2012 Working Capital DSI Target PSUs for the 2012-2014 LTIP Grant | |||
Name | Threshold | Target | Maximum |
Robert J. Keller | 5,580 | 11,160 | 16,740 |
Boris Elisman | 2,330 | 4,660 | 6,990 |
Neal V. Fenwick | 1,398 | 2,796 | 4,194 |
| Christopher M. Franey | 1,504 | 3,007 | 4,511 |
Thomas H. Shortt | 1,143 | 2,285 | 3,428 |
2012 Working Capital DSO Target PSUs for the 2012-2014 LTIP Grant | |||
Name | Threshold | Target | Maximum |
Robert J. Keller | 5,580 | 11,159 | 16,739 |
Boris Elisman | 2,330 | 4,660 | 6,990 |
Neal V. Fenwick | 1,398 | 2,796 | 4,194 |
| Christopher M. Franey | 1,504 | 3,007 | 4,511 |
Thomas H. Shortt | 1,143 | 2,285 | 3,428 |
91
(a) | (b) | (c) | (d) | (e) | (f) | (g) | (h) | (i) | (j) |
Year | Salary ($) | Bonus ($) | Stock Awards ($)(1)(2) | Option Awards ($)(1) | Non-Equity Incentive ($)(3) | Change in Pension ($)(4) | All Other Comp ($)(5) | Total ($) | |
Robert J. Keller | |||||||||
| Chairman of the Board and Chief Executive Officer | 2011 | 777,923 | — | 5,431,634 | 337,645 | 368,385 | — | 35,725 | 6,951,312 |
| 2010 | 755,446 | — | 467,838 | — | 440,826 | — | 35,353 | 1,699,463 | |
| 2009 | 619,805 | — | — | 68,250 | — | — | 20,592 | 708,647 | |
| Boris Elisman | |||||||||
| President and Chief Operating Officer | 2011 | 525,000 | — | 697,433 | 183,260 | 189,420 | 18,000 | 27,599 | 1,640,712 |
| 2010 | 424,942 | — | 162,819 | — | 157,260 | 14,000 | 27,527 | 786,548 | |
| 2009 | 349,971 | — | — | 31,500 | — | 18,000 | 18,974 | 418,445 | |
| Neal V. Fenwick | |||||||||
| Executive Vice President and Chief FinancialOfficer | 2011 | 446,164 | — | 459,895 | 120,890 | 130,793 | 259,575 | 34,885 | 1,452,202 |
| 2010 | 435,431 | — | 169,218 | — | 162,048 | 236,214 | 34,626 | 1,037,537 | |
| 2009 | 363,095 | — | — | 31,500 | — | 1,444,000 | 26,949 | 1,865,544 |
(a) | (b) | (c) | (d) | (e) | (f) | (g) | (h) | (i) | (j) |
Year | Salary ($) | Bonus ($) | Stock Awards ($)(1)(2) | Option Awards ($)(1) | Non-Equity Incentive ($)(3) | Change in Pension ($)(4) | All Other Comp ($)(5) | Total ($) | |
| Christopher M. Franey | |||||||||
| Executive Vice President and President, International and Kensington | 2011 | 410,000 | 419,710 | 110,110 | 120,192 | — | 62,771 | 1,122,783 | |
| 2010 | 367,920 | — | 130,824 | — | 122,135 | — | 57,040 | 677,919 | |
| 2009 | 290,107 | 176,500(6) | — | 21,000 | — | — | 122,298 | 609,905 | |
| Thomas H. Shortt | |||||||||
| Executive Vice President and President, Product Strategy and Development | 2011 | 409,375 | — | 419,710 | 110,110 | 120,008 | — | 27,063 | 1,086,266 |
| 2010 | 393,462 | — | 152,865 | — | 146,447 | — | 32,676 | 725,450 | |
| 2009 | 260,192 | — | — | 26,250 | — | — | 476,184 | 762,626 |
Automobile Allowance ($) | Company Contributions to Defined Contribution Plans ($)(a) | Tax Gross Ups, Tax Equalization and Relocation Expenses ($)(b) | Miscellaneous Perquisites ($) | Total ($) | |
Mr. Keller | 15,996 | 11,025 | — | 8,704(c) | 35,725 |
| Mr. Elisman | 13,992 | 11,025 | — | 2,582(c) | 27,599 |
| Mr. Fenwick | 13,992 | 11,025 | — | 9,868(d) | 34,885 |
| Mr. Franey | 13,992 | 11,025 | 33,685 | 4,069(c) | 62,771 |
| Mr. Shortt | 13,992 | 11,025 | — | 2,046(c) | 27,063 |
Name | Grant Date for Awards | Estimated Future Payouts under Non-Equity Incentive Plan Awards(1) | Estimated Future Payouts under Equity Incentive Plan Awards(2) | All Other Stock Awards: Number of Shares of Stock or Units#(3) | All Other Option Awards: Number of Securities Underlying Options #(4) | Exercise or Base Price of Option Awards ($/Share)(5) | Grant Date Fair Value of Stock and Option Awards ($)(6) | ||||
Threshold ($) | Target ($) | Maximum ($) | Threshold (#) | Target (#) | Maximum (#) | ||||||
Robert J. Keller | 02/24/11 | 206,325 | 825,300 | 1,650,600 | — | ||||||
| 05/18/11 | 52,050 | 104,100 | 156,150 | 929,613 | |||||||
| 05/18/11 | 539,700 | 4,502,021 | |||||||||
| 05/18/11 | 87,700 | 8.93 | 337,645 | ||||||||
Boris Elisman | 02/24/11 | 105,000 | 420,000 | 840,000 | 28,250 | 56,500 | 84,750 | 21,600 | 47,600 | 8.93 | — |
| 05/18/11 | 504,545 | ||||||||||
| 05/18/11 | 192,888 | ||||||||||
| 05/18/11 | 183,260 | ||||||||||
Neal V. Fenwick | 02/24/11 | 73,125 | 292,500 | 585,000 | — | ||||||
| 05/18/11 | 18,650 | 37,300 | 55,950 | 333,089 | |||||||
| 05/18/11 | 14,200 | 126,806 | |||||||||
| 05/18/11 | 31,400 | 8.93 | 120,890 | ||||||||
Christopher M. Franey | 02/24/11 | 66,625 | 266,500 | 533,000 | — | ||||||
| 05/18/11 | 17,000 | 34,000 | 51,000 | 303,620 | |||||||
| 05/18/11 | 13,000 | 116,090 | |||||||||
| 05/18/11 | 28,600 | 8.93 | 110,110 | ||||||||
Thomas H. Shortt | 02/24/11 | 66,625 | 266,500 | 533,000 | — | ||||||
| 05/18/11 | 17,000 | 34,000 | 51,000 | 303,620 | |||||||
| 05/18/11 | 13,000 | 116,090 | |||||||||
| 05/18/11 | 28,600 | 8.93 | 110,110 | ||||||||
Option and SSAR Awards | Stock Awards | |||||||
Name | Number of Securities Underlying Unexercised Options (#) or SSARs Exercisable | Number of Securities Underlying Unexercised Options (#) or SSARs Unexercisable(1) | Option or SSARs Exercise Price ($) | Option or SSARs Expiration Date | Number of Shares or Units of Stock That Have Not Vested (#) | Market Value of Shares of Units That Have Not Vested ($)(3) | Equity Incentive Plan Awards: Number of Unearned Units That Have Not Vested (#)(4) | Equity Incentive Plan Awards: Market Value of Unearned Units That Have Not Vested ($)(3) |
Robert J. Keller | — | 87,700 | 8.93 | 5/18/2017 | 500,000(5) | 4,825,000 | 45,667 | 440,687 |
| — | 108,333(2) | 0.81 | 2/25/2016 | 39,700(6) | 383,105 | |||
| 105,000 | — | 2.59 | 11/7/2015 | 23,000(7) | 221,950 | |||
32,900(9) | 317,485 | |||||||
17,350(10) | 167,428 | |||||||
Boris Elisman | — | 47,600 | 8.93 | 5/18/2017 | 21,600(6) | 208,440 | 22,650 | 218,573 |
| 100,000 | 50,000(2) | 0.81 | 2/25/2016 | 11,000(8) | 106,150 | |||
| 21,400 | — | 14.02 | 4/6/2015 | 11,450(9) | 110,493 | |||
| 7,000 | — | 21.49 | 3/15/2014 | 9,417(10) | 90,874 | |||
| 40,000 | — | 22.68 | 12/6/2012 | |||||
| 39,877 | — | 19.59 | 11/28/2014 | |||||
Neal V. Fenwick | — | 31,400 | 8.93 | 5/18/2017 | 14,200(6) | 137,030 | 16,400 | 158,260 |
| 100,000 | 50,000(2) | 0.81 | 2/25/2016 | 11,000(8) | 106,150 | |||
| 21,400 | — | 14.02 | 3/18/2015 | 11,900(9) | 114,835 | |||
| 14,500 | — | 21.49 | 3/15/2014 | 6,217(10) | 59,994 | |||
| 90,000 | — | 22.68 | 12/6/2012 | |||||
| 71,780 | — | 18.25 | 10/27/2014 | |||||
| 39,877 | — | 14.42 | 9/28/2013 | |||||
| 20,400 | — | 12.32 | 9/22/2012 | |||||
Christopher M. Franey | — | 28,600 | 8.93 | 5/18/2017 | 13,000(8) | 125,450 | 14,400 | 138,960 |
| 66,667 | 33,333(2) | 0.81 | 2/25/2016 | 4,530(8) | 43,715 | |||
| 9,600 | — | 14.02 | 12/10/2015 | 9,200(9) | 88,780 | |||
5,667(10) | 54,687 | |||||||
Thomas H. Shortt | — | 28,600 | 8.93 | 5/18/2017 | 13,000(6) | 125,450 | 14,916 | 143,939 |
| 83,333 | 41,667(2) | 1.09 | 3/31/2016 | 10,751(9) | 103,747 | |||
5,667(10) | 54,687 | |||||||
Name | SSAR Awards Number of Shares Acquired on Exercise (#) | SSAR Awards Value Realized on Exercise ($)(3) | Stock Awards Number of Shares Acquired on Vesting (#) | Stock Awards Value Realized on Vesting ($)(3) |
Robert J. Keller | 216,667 | 837,418(1) | 15,000(2) | 105,975 |
| Boris Elisman | — | — | 3,500(2) | 30,905 |
| Neal V. Fenwick | — | — | 6,000(2) | 52,980 |
| Christopher M. Franey | — | — | — | — |
| Thomas H. Shortt | — | — | — | — |
Name | Plan Name | Years of Credited Service (1) (#) | Present Value of Accumulated Benefit(2) ($) | Payments During Last Fiscal Year ($) |
Robert J. Keller | ACCO Pension | — | — | — |
| Supplemental Pension | — | — | — | |
Boris Elisman | ACCO Pension | 4 | 59,000 | — |
| Supplemental Pension | 4 | 56,000 | — | |
Neal V. Fenwick | ACCO Europe Pension | 22 | 3,370,629 | — |
| ACCO Pension | 3 | 48,000 | — | |
| Supplemental Pension | 3 | 59,000 | — |
| Retirement Agreement | 3 | 102,000 | — | |
Christopher M. Franey | ACCO Pension | — | — | — |
| Supplemental Pension | — | — | — | |
Thomas H. Shortt | ACCO Pension | — | — | — |
| Supplemental Pension | — | — | — |
Termination by Executive for Retirement | Termination by Company without cause | Termination by the Company without cause or by the executive for “good reason” following a change in control | Death or Disability | |||||||||||||
| Payments and Benefits Compensation: | ||||||||||||||||
Cash severance(1) | $ | — | $ | 3,222,600 | $ | 4,817,787 | $ | — | ||||||||
Annual incentive(1) | — | 825,300 | 825,300 | — | ||||||||||||
| Benefits: | ||||||||||||||||
Continuation of benefits(2) | — | 18,258 | 27,296 | — | ||||||||||||
Outplacement services | — | 60,000 | 60,000 | — | ||||||||||||
Additional 401(k) Plan Contributions(3) | — | — | 32,965 | — | ||||||||||||
| Long-Term Incentive Awards Acceleration: | ||||||||||||||||
Value of Stock Options and SSARs(4) | 13,079 | — | 1,020,808 | 970,743 | ||||||||||||
Value of Restricted Stock Units(5) | 1,316,241 | 1,316,241 | 5,430,055 | 1,363,632 | ||||||||||||
Value of Performance Share Units(6) | 484,913 | — | 1,912,795 | 484,913 | ||||||||||||
Value of Long-Term Cash Awards(7) | 224,013 | — | 904,213 | 450,746 | ||||||||||||
Federal Excise Tax and Gross-up(8) | — | — | 5,209,802 | — | ||||||||||||
Total | $ | 2,038,246 | $ | 5,442,399 | $ | $20,241,021 | $ | 3,270,034 | ||||||||
Termination by Executive for Retirement | Termination by Company without cause | Termination by the Company without cause or by the executive for “good reason” following a change in control | Death or Disability | |||||||||||||
| Payments and Benefits Compensation: | ||||||||||||||||
Cash severance(1) | $ | — | $ | 1,338,750 | $ | 2,126,250 | $ | — | ||||||||
Annual incentive(1) | — | 420,000 | 420,000 | — | ||||||||||||
| Benefits: | ||||||||||||||||
Continuation of benefits(2) | — | 21,806 | 28,036 | — | ||||||||||||
| Outplacement services | — | 30,000 | 30,000 | — | ||||||||||||
Additional 401(k) Plan Contributions(3) | — | — | 24,806 | — | ||||||||||||
Pension enhancement(4) | — | — | 56,000 | — | ||||||||||||
| Long-Term Incentive Awards Acceleration: | ||||||||||||||||
Value of Stock Options and SSARs(5) | 7,098 | — | 476,272 | 449,098 | ||||||||||||
Value of Restricted Stock Units(6) | 143,592 | 143,592 | 314,590 | 149,324 | ||||||||||||
Value of Performance Share Units(7) | 201,367 | — | 893,918 | 201,367 | ||||||||||||
Value of Long-Term Cash Awards(8) | 77,987 | — | 314,787 | 156,921 | ||||||||||||
Federal Excise Tax and Gross-up(9) | 1,882,303 | |||||||||||||||
Total | $ | 430,044 | $ | 1,954,148 | $ | 6,566,962 | $ | 956,710 | ||||||||
Termination by Executive for Retirement | Termination by Company without cause | Termination by the Company without cause or by the executive for “good reason” following a change in control | Death or Disability | |||||||||||||
| Payments and Benefits Compensation: | ||||||||||||||||
Cash severance(1) | $ | — | $ | 1,080,000 | $ | 1,670,625 | $ | — | ||||||||
Annual incentive(1) | — | 292,500 | 292,500 | — | ||||||||||||
| Benefits: | ||||||||||||||||
Continuation of benefits(2) | — | 21,806 | 28,036 | — | ||||||||||||
| Outplacement services | — | 30,000 | 30,000 | — | ||||||||||||
Additional 401(k) Plan Contributions(3) | — | — | 24,806 | — | ||||||||||||
Pension enhancement(4) | — | — | 161,000 | — | ||||||||||||
| Long-Term Incentive Awards Acceleration: | ||||||||||||||||
Value of Stock Options and SSARs(5) | 4,683 | — | 464,608 | 446,683 | ||||||||||||
Value of Restricted Stock Units(6) | 128,808 | 128,808 | 243,180 | 134,540 | ||||||||||||
Value of Performance Share Units(7) | 174,829 | — | 687,891 | 174,829 | ||||||||||||
Value of Long-Term Cash Awards(8) | 80,818 | — | 326,218 | 162,818 | ||||||||||||
Federal Excise Tax and Gross-up(9) | — | — | 1,363,012 | — | ||||||||||||
Total | $ | 389,138 | $ | 1,553,114 | $ | 5,291,876 | $ | 918,670 | ||||||||
Termination by Executive for Retirement | Termination by Company without cause | Termination by the Company without cause or by the executive for “good reason” following a change in control | Death or Disability | |||||||||||||
| Payments and Benefits Compensation: | ||||||||||||||||
Cash severance(1) | $ | — | $ | 984,000 | $ | 1,522,125 | $ | — | ||||||||
Annual incentive(1) | — | 266,500 | 266,500 | — | ||||||||||||
| Benefits: | ||||||||||||||||
Continuation of benefits(2) | — | 15,976 | 20,540 | — | ||||||||||||
| Outplacement services | — | 30,000 | 30,000 | — | ||||||||||||
Additional 401(k) Plan Contributions(3) | — | — | 24,806 | — | ||||||||||||
| Long-Term Incentive Awards Acceleration: | ||||||||||||||||
Value of Stock Options and SSARs(4) | 4,265 | — | 315,058 | 298,731 | ||||||||||||
Value of Restricted Stock Units(5) | 59,357 | 59,357 | 169,165 | 69,702 | ||||||||||||
Value of Performance Share Units(6) | 143,467 | — | 589,944 | 143,467 | ||||||||||||
Value of Long-Term Cash Awards(7) | 62,211 | — | 251,109 | 125,177 | ||||||||||||
Federal Excise Tax and Gross-up(8) | — | — | 1,413,226 | — | ||||||||||||
Total | $ | 269,300 | $ | 1,355,833 | $ | 4,602,473 | $ | 637,077 | ||||||||
Termination by Executive for Retirement | Termination by Company without cause | Termination by the Company without cause or by the executive for “good reason” following a change in control | Death or Disability | |||||||||||||
| Payments and Benefits Compensation: | ||||||||||||||||
Cash severance(1) | $ | — | $ | 984,000 | $ | 1,522,125 | $ | — | ||||||||
Annual incentive(1) | — | 266,500 | 266,500 | — | ||||||||||||
| Benefits: | ||||||||||||||||
Continuation of benefits(2) | — | — | — | — | ||||||||||||
| Outplacement services | — | 30,000 | 30,000 | — | ||||||||||||
Additional 401(k) Plan Contributions(3) | — | — | 24,806 | — | ||||||||||||
| Long-Term Incentive Awards Acceleration: | ||||||||||||||||
Value of Stock Options and SSARs(4) | 4,265 | — | 388,928 | 372,601 | ||||||||||||
Value of Restricted Stock Units(5) | 25,987 | 25,987 | 125,450 | 25,987 | ||||||||||||
Value of Performance Share Units(6) | 158,434 | — | 624,848 | 158,434 | ||||||||||||
Value of Long-Term Cash Awards(7) | 73,047 | — | 294,847 | 146,980 | ||||||||||||
Federal Excise Tax and Gross-up(8) | — | 1,245,810 | ||||||||||||||
Total | $ | 261,733 | $ | 1,306,487 | $ | 4,523,314 | $ | 704,002 | ||||||||
Name | Fees Earned or Paid in Cash | Stock Awards(1) | Total |
George V. Bayly | $81,750 | $73,500 | $155,250 |
| Kathleen S. Dvorak | 98,250 | 73,500 | 171,750 |
| G. Thomas Hargrove | 102,750 | 73,500 | 176,250 |
| Robert H. Jenkins | 110,750 | 73,500 | 184,250 |
| Thomas Kroeger | 93,750 | 73,500 | 167,250 |
| Michael Norkus | 104,250 | 73,500 | 177,750 |
| Sheila G. Talton | 93,750 | 73,500 | 167,250 |
| Norman H. Wesley | 93,750 | 73,500 | 167,250 |
Equity Compensation Plan Information
The following table gives information, as of December 31, 2011,2012, about our common stock that may be issued upon the exercise of options, stock-settled appreciation rights (“SSARs”) and other equity awards under all compensation plans under which equity securities are reserved for issuance.
| Plan category | Number of securities to be issued upon exercise of outstanding options, warrants and rights (a) | Weighted-average exercise price of outstanding options, warrants and rights (b) | Number of securities remaining available for future issuance under equity compensation plans (excluding securities reflected in column (a)) (c) | |||||||
Equity compensation plans approved by security holders(1) | 4,878,553 | $ | 10.12 | 11,295,208 | (2) | |||||
| Equity compensation plans not approved by security holders | — | — | — | |||||||
| Total | 4,878,553 | $ | 10.12 | 11,295,208 | (2) | |||||
Plan category | Number of securities to be Issued upon exercise of outstanding options, warrants and rights (a) | Weighted-average exercise price of outstanding options, warrants and rights (b) | Number of securities remaining available for future issuance under equity compensation plans (excluding securities reflected in column (a)) (c) | |||||||||
Equity compensation plans approved by security holders(1) | 6,108,456 | $ | 12.23 | 2,432,992 | (2) | |||||||
| Equity compensation plans not approved by security holders | — | — | — | |||||||||
| Total | 6,108,456 | $ | 12.23 | 2,432,992 | (2) | |||||||
| (1) | This number includes |
| (2) | These are shares available for grant as of December 31, |
Other information required under this Item is contained in the Company’s 2013 Definitive Proxy Statement, which is to be filed with the Securities and Exchange Commission prior to April 30, 2013, and is incorporated herein by reference.
Information required under this Item is contained in the Company’s 2013 Definitive Proxy Statement, which is to be filed with the Securities and Exchange Commission prior to April 30, 2013 and is incorporated herein by reference.
ITEM 14.PRINCIPAL ACCOUNTANT FEES AND SERVICES
Information required under this Item is contained in the Company’s 2013 Definitive Proxy Statement, which is to be filed with the Securities and Exchange Commission prior to April 30, 2013 and is incorporated herein by reference.
92
PART IV
ITEM 15.EXHIBITS AND FINANCIAL STATEMENT SCHEDULES
The table below sets forth the beneficial ownership of the Company’s common stock as of March 7, 2012. The table sets forth the beneficial ownershipfollowing Exhibits are filed herewith or are incorporated by the following individuals or entities:
| (a) | Financial Statements, Financial Statement Schedules and Exhibits |
| 1. | All Financial Statements |
The following consolidated financial statements of the Company and its subsidiaries are filed as part of this report under Item 8 - Financial Statements and Supplementary Data:
Beneficial Ownership | |||||
Name | Number of Shares | Number of Shares Subject to Options and SSARs(1) | Number of Shares Subject to RSUs(2) | Total | Percent |
Wellington Management Company, LLP 75 State St. Boston, MA 02109(3) | 7,666,990 | — | — | 7,666,990 | 13.8% |
Invesco Ltd. 1555 Peachtree St. NE Atlanta, GA 30309(4) | 5,968,241 | — | — | 5,968,241 | 10.8% |
BlackRock, Inc. 40 East 52nd St New York, NY 10022(6) | 5,955,364 | — | — | 5,955,364 | 10.7% |
Wells Fargo & Company 420 Montgomery St. San Francisco, CA 94163(5) | 4,771,039 | — | — | 4,771,039 | 8.6% |
JP Morgan Chase & Co. 270 Park Ave. New York, NY 10017(7) | 2,907,904 | — | — | 2,907,904 | 5.2% |
George V. Bayly | 20,000 | — | 32,849 | 52,849 | * |
| Kathleen S. Dvorak | — | — | 18,478 | 18,478 | * |
| G. Thomas Hargrove | 80,000 | — | 32,849 | 112,849 | * |
| Robert H. Jenkins | 12,000 | — | 28,766 | 40,766 | * |
| Robert J. Keller | 224,127 | 213,333 | 11,961 | 449,421 | * |
| Thomas Kroeger | — | — | 20,888 | 20,888 | * |
| Michael Norkus | 52,000 | — | 20,888 | 72,888 | * |
| Sheila Talton | — | — | 18,478 | 18,478 | * |
| Norman H. Wesley | 29,671 | — | 32,849 | 62,520 | * |
| Mark C. Anderson | 685 | 62,200 | 5,800 | 68,685 | * |
| Boris Elisman | 8,398 | 258,277 | 11,000 | 277,675 | * |
Neal V. Fenwick(8) | 76,543 | 427,957 | 11,000 | 515,410 | * |
Christopher M. Franey(9) | 625 | 109,600 | — | 110,225 | * |
David L. Kaput(10) | 19,079 | 79,400 | 6,800 | 105,279 | * |
Thomas P. O’Neill, Jr.(11) | 63,981 | 54,266 | 6,200 | 124,447 | * |
Steven Rubin(12) | 71,917 | 110,266 | 11,000 | 193,183 | * |
Thomas H. Shortt(13) | 2,645 | 125,000 | — | 127,645 | * |
| Thomas W. Tedford | — | — | — | — | * |
| All directors and executive officers as a group (18 persons) | 661,671 | 1,440,299 | 269,806 | 2,371,776 | 4.3% |
| Page | |
| Reports of Independent Registered Public Accounting Firm | |
| Management’s Report on Internal Control Over Financial Reporting | |
| Consolidated Balance Sheets as of December 31, 2012 and 2011 | |
| Consolidated Statements of Operations for the years ended December 31, 2012, 2011 and 2010 | |
| Consolidated Statements of Comprehensive Income (Loss) for the years ended December 31, 2012, 2011 and 2010 | |
| Consolidated Statements of Cash Flows for the years ended December 31, 2012, 2011 and 2010 | |
| Consolidated Statements of Stockholders’ Equity (Deficit) for the years ended December 31, 2012, 2011 and 2010 | |
| Notes to Consolidated Financial Statements | |
| 2. | Financial Statement Schedule: |
Schedule II - Valuation and Qualifying Accounts and Reserves, for each of the years ended December 31, 2012, 2011 and 2010.
The separate consolidated financial statements of Pelikan-Artline Pty Ltd, the Company’s 50 percent owned joint venture as of September 30, 2012 and 2011 and for each of the years in the three-year period ended September 30, 2012 required to be included in this report pursuant to Rule 3-09 of Regulation S-X, are filed as Exhibit 99.1.
| 3. | Exhibits: |
A list of exhibits filed or furnished with this Report on Form 10-K (or incorporated by reference to exhibits previously filed or furnished by the Company) is provided in the accompanying Exhibit Index.
93
| 2.1 | Agreement and Plan of Merger, dated November 17, 2011, by and among MeadWestvaco Corporation, Monaco SpinCo Inc., ACCO Brands Corporation and Augusta Sub, Inc. (incorporated by reference to Exhibit 2.1 to Form 8-K filed by the |
| 2.2 | Amendment No. 1, dated as of |
| 2.3 | Share Sale Agreement dated May 25, 2011 entered into by and between GBC Australia Pty Ltd, ACCO Brands Corporation, Neopost Holding Pty Ltd and NEOPOST S.A. (incorporated by reference to Exhibit 2.1 to Form 10-Q filed by the Registrant on July 27, 2011 (File No. 001-08454)) |
| 3.1 | Restated Certificate of Incorporation of ACCO Brands |
| 3.2 | Certificate of |
| 3.3 | By-laws of ACCO Brands |
| 4.1 | Rights Agreement, dated as of |
| 4.2 | Indenture, dated as of April 30, 2012, among Monaco SpinCo Inc., as issuer, the guarantors named therein, and Wells Fargo Bank, National Association, as trustee (incorporated by reference to Exhibit 10.3 of the |
| 4.3 | First Supplemental Indenture, dated as of |
| 4.4 | Second Supplemental Indenture, dated as of May 1, 2012, among the Company, Mead Products LLC, the guarantors named therein and Wells Fargo Bank, National Association, as trustee (incorporated by reference to Exhibit 10.5 of the Registrant's Form 8-K filed on May 7, 2012 (File No. 001-08454)) |
| 4.5 | Registration Rights Agreement, dated as of May 1, 2012, among Monaco SpinCo Inc., the Company, the guarantors named therein, and representatives of the initial purchasers named therein (incorporated by reference to Exhibit 10.6 of the Registrant's Form 8-K filed on May 7, 2012 (File No. 001-08454)) |
| 10.1 | ACCO Brands Corporation 2005 Long-Term Incentive Plan (incorporated by reference to Exhibit 10.1 to the Registrant’s Current Report on Form 8-K dated August 3, 2005 and filed August 8, 2005 (File No. 001-08454)) |
| 10.2 | ACCO Brands Corporation 2005 Assumed Option and Restricted Stock Unit Plan, together with Sub-Plan A thereto (incorporated by reference to Exhibit 10.2 to the Registrant’s Current Report on Form 8-K dated August 3,2005 and filed August 8, 2005 (File No. 001-08454)) |
| 10.3 | ACCO Brands Corporation Annual Executive Incentive Compensation Plan (incorporated by reference to Exhibit 10.3 to the Registrant’s Current Report on Form 8-K dated August 3, 2005 and filed August 8, 2005 (File No. 001-08454)) |
| 10.4 | Tax Allocation Agreement, dated as of August 16, 2005, between ACCO World Corporation and Fortune Brands, Inc. (incorporated by reference to Exhibit 10.1 to the Registrant’s Current Report on Form 8-K dated August 12, 2005 and filed August 17, 2005 (File No. 001-08454)) |
94
| 10.5 | Tax Allocation Agreement, dated as of August 16, 2005, between General Binding Corporation and Lane Industries, Inc. (incorporated by reference to Exhibit 10.2 to the Registrant’s Current Report on Form 8-K dated August 12, 2005 and filed August 17, 2005 (File No. 001-08454)) |
| 10.6 | Employee Matters Agreement, dated as of March 15, 2005, by and among Fortune Brands, Inc., ACCO World Corporation and General Binding Corporation (incorporated by reference to Exhibit 10.2 to the Registrant’s Registration Statement on Form S-4 (File No. 333-124946)) |
| 10.7 | Executive Severance/Change in Control Agreement, dated as of August 26, 2000, by and between Steven Rubin and GBC (incorporated by reference to Exhibit 10.15 to General Binding Corporation’s Annual Report on Form 10-K for the fiscal year ended December 31, 2004 (File No. 001-08454)) |
| 10.8 | Letter Agreement, dated as of September 5, 2003, between ACCO World Corporation and Neal Fenwick (incorporated by reference to Exhibit 10.6 to the Registrant’s Registration Statement on Form S-4 (File No. 333-124946)) |
| 10.9 | Letter Agreement, dated November 8, 2000, as revised in January 2001, between ACCO World Corporation and Neal Fenwick (incorporated by reference to Exhibit 10.7 to the Registrant’s Registration Statement on Form S-4 (File No. 333-124946)) |
| 10.10 | Letter Agreement, dated September 8, 1999, between ACCO World Corporation and Neal Fenwick (incorporated by reference to Exhibit 10.8 to the Registrant’s Registration Statement on Form S-4 (File No. 333-124946)) |
| 10.11 | Amended and Restated ACCO Brands Corporation 2005 Incentive Plan (incorporated by reference to Annex A of the Registrant’s definitive proxy statement filed April 4, 2006 (File No. 001-08454)) |
| 10.12 | Amendment to the Amended and Restated ACCO Brands Corporation 2005 Incentive Plan (incorporated by reference to Exhibit 10.1 to Form 8-K filed by the Registrant on May 19, 2008 (File No. 001-08454)) |
| 10.13 | ACCO Brands Corporation Executive Severance Plan (effective December 1, 2007) (incorporated by reference to Exhibit 10.1 to Form 8-K filed by the Registrant on November 29, 2007 (File No. 001-08454)) |
| 10.14 | 2008 Amended and Restated ACCO Brands Corporation Supplemental Retirement Plan (incorporated by reference to Exhibit 10.31 to Form 10-K filed by the Registrant on February 29, 2008 (File No. 001-08454)) |
| 10.15 | Amendment to the 2008 Amended and Restated ACCO Brands Corporation Supplemental Retirement Plan (incorporated by reference to Exhibit 10.1 to Form 8-K filed by the Registrant on January 22, 2009 (File No. 001-08454)) |
| 10.16 | Retirement Agreement for David D. Campbell effective as of May 1, 2008 (incorporated by reference to Exhibit 10.3 to Form 10-Q filed by the Registrant on May 7, 2008 (File No. 001-08454)) |
| 10.17 | Retirement Agreement for Neal V. Fenwick effective as of May 1, 2008 (incorporated by reference to Exhibit 10.4 to Form 10-Q filed by the Registrant on May 7, 2008 (File No. 001-08454)) |
| 10.18 | Letter Agreement dated November 4, 2008, between ACCO Brands Corporation and Robert J. Keller (incorporated by reference to Exhibit 10.1 to Form 8-K filed by the Registrant on November 5, 2008 (File No. 001-08454)) |
| 10.19 | Form of Indemnification Agreement (incorporated by reference to Exhibit 10.1 to Form 8-K filed by the Registrant on December 24, 2008 (File No. 001-08454)) |
| 10.20 | Form of Stock-settled Stock Appreciation Rights Agreement under the ACCO Brands Corporation Amended and Restated 2005 Long-Term Incentive Plan, as amended (incorporated by reference to Exhibit 10.46 to Form 10-K filed by the Registrant on March 2, 2009 (File No. 001-08454)) |
95
| 10.21 | Letter agreement, dated October 11, 2007, from ACCO Brands Corporation to David A. Kaput (incorporated by reference to Exhibit 10.1 to Form 8-K filed by the Registrant on March 3, 2009 (File No. 001-08454)) |
| 10.22 | Amended and Restated ACCO Brands Deferred Compensation Plan for Non-Employee Directors, effective December 14, 2009 (incorporated by reference to Exhibit 10.41 to Form 10-K filed by the Registrant on February 26, 2010 (File No. 001-089454)) |
| 10.23 | Letter agreement, dated November 4, 2008, from ACCO Brands Corporation to Christopher M. Franey (incorporated by reference to Exhibit 10.42 to Form 10-K filed by the Registrant on February 26, 2010 (File No. 001-08454)) |
| 10.24 | Letter agreement, dated March 6, 2009, from ACCO Brands Corporation to Thomas H. Shortt (incorporated by reference to Exhibit 10.43 to Form 10-K filed by the Registrant on February 26, 2010 (File No. 001-08454)) |
| 10.25 | Form of 2010-2012 Cash Based |
| 10.26 | Form of 2010-2012 Performance Stock Unit Award Agreement under the ACCO Brands Corporation Amended and Restated Incentive Plan (incorporated by reference to Exhibit 10.2 to Form 10-Q filed by the Registrant on May 7, 2010 (File No. 001-08454)) |
| 10.27 | Description of certain compensation arrangements with respect to the Registrant's named executive officers (incorporated by reference to Item 5.02 of Registrant's Form 8-K filed on March 1, 2010 (File No. 001-08454)) |
| 10.28 | Description of changes to compensation arrangements for Christopher M. Franey (incorporated by reference to Item 5.02 of Registrant's Form 8-K filed on September 21, 2010 (File No. 001-08454)) |
| 10.29 | Description of changes to compensation arrangements for Boris Elisman (incorporated by reference to Item 5.02 of Registrant's Form 8-K filed on December 14, 2010 (File No. 001-08454)) |
| 10.30 | Amended and Restated 2005 Incentive Plan Restricted Stock Unit Award Agreement, effective as of February 24, 2011 between Robert J. Keller and ACCO Brands Corporation (incorporated by reference to Exhibit 10.1 to Form 8-K filed by the Registrant on February 15, 2011 (File No. 001-08454)) |
| 10.31 | 2011 Amended and Restated ACCO Brands Corporation Incentive Plan (incorporated by reference to Exhibit 10.1 to ACCO Brands Corporation's Current Report on Form 8-K filed with the SEC on |
| 10.32 | Form of Directors Restricted Stock Unit Award Agreement under the 2011 Amended and Restated ACCO Brands Corporation Incentive Plan (incorporated by |
| 10.33 | Form of Nonqualified Stock Option Agreement under the 2011 Amended and Restated ACCO Brands Corporation Incentive Plan (incorporated by |
| 10.34 | Form of Restricted Stock Unit Award Agreement under the 2011 Amended and Restated ACCO Brands Corporation Incentive Plan (incorporated by |
| 10.35 | Form of Performance Stock Unit Award Agreement under the 2011 Amended and |
96
ContentsThe Board of Directors has adopted Corporate Governance Principles to address significant issues of corporate governance, such as Board composition and responsibilities, director compensation, and executive succession planning. The Corporate Governance Principles provide that a majority of the members of the Board of Directors, and each member of the Audit, Compensation and Corporate Governance and Nominating Committees, must meet certain criteria for independence. Based on the New York Stock Exchange independence requirements, the Corporate Governance Principles (which are available on our website, www.accobrands.com
) set forth certain guidelines to assist in determining director independence. Section A.3 of the Corporate Governance Principles states:
2010 | 2011 | |||||||
Audit Fees | $ | 2,195,000 | $ | 2,376,000 | ||||
Audit-related fees | — | — | ||||||
Tax fees | 243,000 | 237,000 | ||||||
All other fees | 54,000 | 535,000 | ||||||
Total | $ | 2,492,000 | $ | 3,148,000 | ||||
Number Description of Exhibit
| 10.36 | Form of Stock-Settled Stock Appreciation Rights Award Agreement under the 2011 Amended and Restated ACCO Brands Corporation Incentive Plan (incorporated by reference to Exhibit 10.6 to ACCO Brands Corporation's Current Report on Form 8-K filed with the SEC on May 20, 2011 (File No. 001-08454)) |
| 10.37 | Separation Agreement, dated November 17, 2011, by and between MeadWestvaco and Monaco SpinCo Inc. (incorporated by reference to Exhibit 10.1 of Registrant's Form 8-K filed on November 22, 2011 (File No. 001-08454)) |
| 10.38 | Employee Benefits Agreement, dated as of November 17, 2011, by and among MeadWestvaco Corporation, Monaco Spinco Inc. and ACCO Brands Corporation. (incorporated by reference to Exhibit 10.3 of Registrant's Form S-4/A filed on February 13, 2012 (File No. 333-178869)) |
| 10.39 | Amendment to the February 24, 2011 Amended and Restated 2005 Restricted Stock Unit Award Agreement, made and entered into as of December 7, 2011, between Robert J. Keller and ACCO Brands Corporation (incorporated by reference to Exhibit 10.1 of Registrant's Form 8-K filed on December 12, 2011 (File No. 001-08454)) |
| 10.40 | Amendment No. 1, dated as of March 19, 2012, to the Separation Agreement, dated as of November 17, 2011, by and among MeadWestvaco Corporation and Monaco SpinCo Inc. (incorporated by reference to Exhibit 10.1 to Form 8-K filed by the Registrant on March 22, 2012 (File No. 001-08454)) |
| 10.41 | Credit Agreement, dated as of March 26, 2012, among ACCO Brands Corporation, certain direct and indirect subsidiaries of ACCO Brands Corporation, Barclays Bank PLC and Bank of Montreal, as administrative agents, and the other agents and lenders named therein (incorporated by reference to Exhibit 10.1 to Form 8-K filed by the Registrant on March 30, 2012 (File No. 001-08454)) |
| 10.42 | Amendment of 2011 Amended and Restated ACCO Brands Corporation Incentive Plan (incorporated by reference to Exhibit 10.1 of the Registrant's Form 8-K filed on April 24, 2012 (File No. 001-08454)) |
| 10.43 | Transition Services Agreement, effective as of May 1, 2012, between Monaco SpinCo Inc. and MeadWestvaco Corporation (incorporated by reference to Exhibit 10.1 of the Registrant's Form 8-K filed on May 7, 2012 (File No. 001-08454)) |
| 10.44 | Tax Matters Agreement, effective as of May 1, 2012, among the Company, MeadWestvaco Corporation and Monaco SpinCo Inc. (incorporated by reference to Exhibit 10.2 of the Registrant's Form 8-K filed on May 7, 2012 (File No. 001-08454)) |
| 10.45 | Amendment to the 2008 Amended and Restated ACCO Brands Corporation Supplemental Retirement Plan (incorporated by reference to Exhibit 10.8 of the Registrant's Form 8-K filed on May 7, 2012 (File No. 001-08454)) |
| 10.46 | Amendment of the ACCO Brands Corporation Executive Severance Plan, adopted as of October 23, 2012 (incorporated by reference to Exhibit 10.1 to Form 10-Q filed by the Registrant on October 31, 2012 (File No. 001-08454)) |
| 21.1 | Subsidiaries of the Registrant* |
| 23.1 | Consent of KPMG LLP* |
| 23.2 | Consent of BDO* |
| 24.1 | Power of attorney* |
| 31.1 | Certification of the Chief Executive Officer pursuant to Section 302 of the Sarbanes-Oxley Act of 2002* |
| 31.2 | Certification of the Chief Financial Officer pursuant to Section 302 of the Sarbanes-Oxley Act of 2002* |
97
| 32.1 | Certification of the Chief Executive Officer pursuant to Section 906 of the Sarbanes-Oxley Act of 2002* |
| 32.2 | Certification of the Chief Financial Officer pursuant to Section 906 of the Sarbanes-Oxley Act of 2002* |
| 99.1 | Pelikan-Artline Pty Ltd Audited Financial Statements as of September 30, 2012* |
| 101 | The following financial statements from the Company's Annual Report on Form 10-K for the year ended December 31, 2012 formatted in XBRL (eXtensible Business Reporting Language): (i) the Consolidated Balance Sheets as of December 31, 2012 and 2011, (ii) the Consolidated Statements of Operations for the years ended December 31, 2012, 2011 and 2010, (iii) the Consolidated Statements of Comprehensive Income (Loss) for the years ended December 31, 2012, 2011 and 2010, (iv) the Consolidated Statements of Cash Flows for the years ended December 31, 2012, 2011 and 2010, (v) Consolidated Statements of Stockholders Equity (Deficit) for the years ended December 31, 2012, 2011 and 2010, and (vi) related notes to those financial statements+ |
| * | Filed herewith. |
| + | In accordance with Rule 406T of Regulation S-T, the XBRL related information in Exhibit 101 shall not be deemed to be “filed” for purposes of Sections 11 and 12 of the Securities Act of 1933 and Section 18 of the Securities Exchange Act of 1934, or otherwise subject to liability under those sections, and shall not be part of any registration statement or other document filed under the Securities Act or the Exchange Act, except as shall be expressly set forth by specific reference in such filing. |
98
SIGNATURES
Pursuant to the requirements of Section 13 or 15(d) of the Securities Exchange Act of 1934, the Registrant has duly caused this report to be signed on its behalf by the undersigned thereunto duly authorized.
| REGISTRANT: | ||
| ACCO BRANDS CORPORATION | ||
| By: | /s/ Robert J. Keller | |
| Robert J. Keller | ||
Chairman of the Board and Chief Executive Officer (principal executive officer) | ||
| By: | /s/ Neal V. Fenwick | |
| Neal V. Fenwick | ||
Executive Vice President and Chief Financial Officer (principal financial officer) | ||
| By: | /s/ Thomas P. O’Neill, Jr. | |
| Thomas P. O’Neill, Jr. | ||
February 28, 2013
Pursuant to the requirements of the Securities Exchange Act of 1934, this report has been signed on its behalf by the following persons on behalf of the Registrant and in the capacities and on the dates indicated.
| Signature | Title | Date | ||
| /s/ Robert J. Keller | Chairman of the Board and Chief Executive Officer (principal executive officer) | February 28, 2013 | ||
| Robert J. Keller | ||||
| /s/ Neal V. Fenwick | Executive Vice President and Chief Financial Officer (principal financial officer) | February 28, 2013 | ||
| Neal V. Fenwick | ||||
| /s/ Thomas P. O’Neill, Jr. | Senior Vice President, Finance and Accounting (principal accounting officer) | February 28, 2013 | ||
| Thomas P. O’Neill, Jr. | ||||
| /s/ James A. Buzzard* | Director | February 28, 2013 | ||
| James A. Buzzard | ||||
| /s/ Kathleen S. Dvorak* | Director | February 28, 2013 | ||
| Kathleen S. Dvorak | ||||
| /s/ G. Thomas Hargrove* | Director | February 28, 2013 | ||
| G. Thomas Hargrove | ||||
99
| Signature | ||||
| /s/ Robert H. Jenkins* | Director | February 28, 2013 | ||
| Robert H. Jenkins | ||||
| /s/ Thomas Kroeger* | Director | February 28, 2013 | ||
| Thomas Kroeger | ||||
| /s/ Michael Norkus* | Director | February 28, 2013 | ||
| Michael Norkus | ||||
| /s/ Sheila G. Talton* | Director | February 28, 2013 | ||
| Sheila G. Talton | ||||
| /s/ Norman H. Wesley* | Director | February 28, 2013 | ||
| Norman H. Wesley | ||||
| /s/ Neal V. Fenwick | ||||
| * Neal V. Fenwick as Attorney-in-Fact | ||||
100
Allowances for Doubtful Accounts
Changes in the allowances for doubtful accounts were as follows:
| Year Ended December 31, | |||||||||||
| (in millions of dollars) | 2012 | 2011 | 2010 | ||||||||
| Balance at beginning of year | $ | 5.1 | $ | 5.2 | $ | 6.9 | |||||
| Additions charged to expense | 2.2 | 1.4 | 3.3 | ||||||||
| Deductions—write offs | (3.0 | ) | (1.3 | ) | (5.3 | ) | |||||
| Mead C&OP acquisition | 2.1 | — | — | ||||||||
| Foreign exchange changes | 0.1 | (0.2 | ) | 0.3 | |||||||
| Balance at end of year | $ | 6.5 | $ | 5.1 | $ | 5.2 | |||||
Allowances for Sales Returns and Discounts
Changes in the allowances for sales returns and discounts were as follows:
| Year Ended December 31, | |||||||||||
| (in millions of dollars) | 2012 | 2011 | 2010 | ||||||||
| Balance at beginning of year | $ | 7.7 | $ | 9.2 | $ | 9.8 | |||||
| Additions charged to expense | 41.0 | 41.6 | 31.8 | ||||||||
| Deductions—returns | (41.6 | ) | (43.1 | ) | (32.1 | ) | |||||
| Mead C&OP acquisition | 2.8 | — | — | ||||||||
| Foreign exchange changes | 0.7 | — | (0.3 | ) | |||||||
| Balance at end of year | $ | 10.6 | $ | 7.7 | $ | 9.2 | |||||
Allowances for Cash Discounts
Changes in the allowances for cash discounts were as follows:
| Year Ended December 31, | |||||||||||
| (in millions of dollars) | 2012 | 2011 | 2010 | ||||||||
| Balance at beginning of year | $ | 1.1 | $ | 1.2 | $ | 1.2 | |||||
| Additions charged to expense | 16.4 | 11.0 | 11.3 | ||||||||
| Deductions—discounts taken | (16.0 | ) | (11.0 | ) | (11.1 | ) | |||||
| Mead C&OP acquisition | 0.6 | — | — | ||||||||
| Foreign exchange changes | 0.1 | (0.1 | ) | (0.2 | ) | ||||||
| Balance at end of year | $ | 2.2 | $ | 1.1 | $ | 1.2 | |||||
101
ACCO Brands Corporation
VALUATION AND QUALIFYING ACCOUNTS AND RESERVES
SCHEDULE II (Continued)
Warranty Reserves
Changes in the reserve for warranty claims were as follows:
| Year Ended December 31, | |||||||||||
| (in millions of dollars) | 2012 | 2011 | 2010 | ||||||||
| Balance at beginning of year | $ | 2.7 | $ | 3.1 | $ | 2.8 | |||||
| Provision for warranties issued | 3.3 | 3.0 | 3.2 | ||||||||
| Settlements made (in cash or in kind) | (3.2 | ) | (3.4 | ) | (2.9 | ) | |||||
| Balance at end of year | $ | 2.8 | $ | 2.7 | $ | 3.1 | |||||
Income Tax Valuation Allowance
Changes in the deferred tax valuation allowances were as follows:
| Year Ended December 31, | |||||||||||
| (in millions of dollars) | 2012 | 2011 | 2010 | ||||||||
| Balance at beginning of year | $ | 204.3 | $ | 193.2 | $ | 188.9 | |||||
| Charges/(credits) to expense | (145.1 | ) | 5.4 | 15.7 | |||||||
| Charged to other accounts | (4.3 | ) | 7.0 | (7.6 | ) | ||||||
| Foreign exchange changes | 0.5 | (1.3 | ) | (3.8 | ) | ||||||
| Balance at end of year | $ | 55.4 | $ | 204.3 | $ | 193.2 | |||||
See accompanying report of independent registered public accounting firm.
102