UNITED STATES
SECURITIES AND EXCHANGE COMMISSION
Washington, D.C. 20549
FORM 10-K/A
☒ | ANNUAL REPORT PURSUANT TO SECTION 13 OR 15(d) OF THE SECURITIES EXCHANGE ACT OF 1934 |
For the fiscal year ended June 30, 2021OR
☐ | |
TRANSITION REPORT PURSUANT TO SECTION 13 OR 15(d) OF THE SECURITIES EXCHANGE ACT OF 1934 | |
Commission File Number: 0-23406
| | |
SOUTHERN MISSOURI BANCORP, INC. | ||
(Exact name of registrant as specified in its charter) | ||
| | |
Missouri | 43-1665523 | |
(State or other jurisdiction of incorporation or organization) | | (I.R.S. Employer Identification No.) |
| | |
2991 Oak Grove Road, Poplar Bluff, Missouri | | 63901 |
(Address of principal executive offices) | | (Zip Code) |
Registrant’s telephone number, including area code: (573) (573) 778-1800
Securities registered pursuant to Section 12(b) of the Act:
Title of Each Class | Trading Symbol | Name of Each Exchange on Which Registered | ||
Common Stock , par value $0.01 per share | | SMBC | | The NASDAQ Stock Market, LLC |
Indicate by check mark if the registrant is a well-known seasoned issuer, as defined in Rule 405 of the Securities Act. YES NO X
Indicate by check mark if the registrant is not required to file reports pursuant to Section 13 or Section 15(d) of the Act. YES NO X
Indicate by check mark whether the registrant (1) has filed all reports required to be filed by Section 13 or 15(d) of the Securities Exchange Act of 1934 during the preceding 12 months (or for such shorter period that the registrant was required to file such reports), and (2) has been subject to such filing requirements for the past 90 days. YES X NO
Indicate by check mark whether the registrant has submitted electronically and posted on its corporate web site, if any, every interactive data file required to be submitted and posted pursuant to Rule 405 of Regulation S-T (§ 232.405 of this chapter) during the preceding 12 months (or for such shorter period that the registration was required to submit and post such files. YES X NO
Indicate by check mark whether the registrant is a large accelerated filer, an accelerated filer, a non-accelerated filer, or a smaller reporting company, or an emerging growth company.
| | | | | |
| | | | | |
| | | | | |
Large accelerated filer | ¨ | Accelerated filer | ☒ | | |
| | | | | |
Non-accelerated filer | ¨ | Smaller reporting company | ☐ | Emerging growth company | ☐ |
If an emerging growth company, indicate by check mark if the registrant has elected not to use the extended transition period for complying with any new or revised financial accounting standards provided pursuant to Section 13(a) of the Exchange Act ◻
Indicate by check mark whether the registrant has filed a report on and attestation to its management's assessment of the effectiveness of its internal control over financial reporting under Section 404(b) of the Sarbanes-Oxley Act (15 U.S.C. 7262(b)) by the registered public accounting firm that prepared or issued its audit report. ☒
Indicate by check mark whether the registrant is a shell company (as defined in Rule 12b-2 of the Exchange Act). YES NO X
The aggregate market value of the voting stock held by non-affiliates of the registrant, computed by reference to the average of the high and low traded price of such stock as of the last business day of the registrant'sregistrant’s most recently completed second fiscal quarter, was $274.4$242.2 million. (The exclusion from such amount of the market value of the shares owned by any person shall not be deemed an admission by the registrant that such person is an affiliate of the registrant.)
As of September 13, 2019,10, 2021, there were issued and outstanding 9,201,7838,894,568 shares of the Registrant'sRegistrant’s common stock.
DOCUMENTS INCORPORATED BY REFERENCE
Part III of Form 10-K - Portions of the Proxy Statement for the 20192021 Annual Meeting of Stockholders.
PART I
Item 1. Description of Business
General
Southern Missouri Bancorp, Inc. ("Company") is a bank holding company and the parent company of Southern Bank (“Bank”). The soleCompany changed its state of incorporation to Missouri on April 1, 1999, after originally incorporating in Delaware on December 30, 1993 for the purpose of this Amendment No. 1 on Form 10-K/A to our Annual Report on Form 10-Kbecoming the holding company for the Bank, which was known as Southern Missouri Savings Bank upon completion of its conversion from a state chartered mutual savings and loan association to a state chartered stock savings bank. As part of the conversion in April 1994, the Company sold 1.8 million shares of its common stock to the public. The Company’s Common Stock is quoted on the NASDAQ Global Market under the symbol "SMBC".
The Bank was originally chartered by the state of Missouri as a mutual savings and loan association in 1887. On June 20, 1995, it converted to a federally chartered stock savings bank and took the name Southern Missouri Savings Bank, FSB. On February 17, 1998, Southern Missouri Savings Bank converted from a federally chartered stock savings bank to a Missouri chartered stock savings bank and changed its name to Southern Missouri Bank & Trust Co. On June 4, 2004, Southern Missouri Bank & Trust Co. converted from a Missouri chartered stock savings bank to a Missouri state chartered trust company with banking powers ("Charter Conversion"). On June 1, 2009, the institution changed its name to Southern Bank.
The primary regulator of the Bank is the Missouri Division of Finance. The Bank is a member of the Federal Reserve, and the Board of Governors of the Federal Reserve System ("Federal Reserve Board" or "FRB") is the Bank’s primary federal regulator. The Bank’s deposits continue to be insured up to applicable limits by the Deposit Insurance Fund ("DIF") of the Federal Deposit Insurance Corporation ("FDIC"). With the Bank’s conversion to a trust company with banking powers, the Company became a bank holding company regulated by the FRB.
The principal business of the Bank consists primarily of attracting retail deposits from the general public and using such deposits along with wholesale funding from the Federal Home Loan Bank of Des Moines ("FHLB"), and, to a lesser extent, brokered deposits, to invest in one- to four-family residential mortgage loans, mortgage loans secured by commercial real estate, commercial non-mortgage business loans, construction loans, and consumer loans. These funds are also used to purchase mortgage-backed and related securities ("MBS"), municipal bonds, and other permissible investments.
At June 30, 2021, the Company had total assets of $2.7 billion, total deposits of $2.3 billion and stockholders’ equity of $283.4 million. The Company has not engaged in any significant activity other than holding the stock of the Bank. Accordingly, the information set forth in this report, including financial statements and related data, relates primarily to the Bank. The Company’s revenues are derived principally from interest earned on loans and investment securities, and, to a lesser extent, banking service charges, bank card interchange fees, gains on sales of loans and loan servicing income, loan late charges, increases in the cash surrender value of bank owned life insurance, and other fee income.
COVID-19 Pandemic Response
Southern Missouri remains committed to serving our communities in this difficult time, and to the safety of our team members and customers.
General operating conditions. Beginning Monday, March 23, 2020, the Company closed its lobbies to access except by appointment, and encouraged customers to utilize our online, mobile, drive-thru, or integrated teller machines (ITMs) for service when possible. The Company began re-opening lobbies on Monday, May 4, 2020, subject to guidance by state and local authorities. At times, some facilities have again closed to the public for a short period of time due to unavailability of team members complying with quarantine orders from local health authorities. From the initial onset of the pandemic in March, 2020, the Company has worked to increase our telework capabilities, and we have had as many
2
as 10-15% of our team members working remotely during the month of August, 2021 either on a regular or rotating basis. No team members have been furloughed, and no furloughs are anticipated. While continuing to encourage safety, the Company has relaxed restrictions on business travel, although some training events or conferences our team members would typically have attended remained in online format. The Company chose not to extend beyond March 31, 2021, the additional leave provisions (over and above the Company’s standard paid time off policy) provided for under the Families First Coronavirus Response Act (the FFCRA) or the CARES Act. The operations of the Company’s internal controls have not been significantly impacted by changes in our work environment.
SBA Paycheck Protection Program Lending. In the first and second rounds of funding made available through the Small Business Administration’s Paycheck Protection Program (PPP), the Company originated just over 3,200 loans totaling $197.2 million through the program’s expiration May 31, 2021. The Company has made substantial progress in processing and receiving approval from the SBA for applications by borrowers for forgiveness, and as of August 20, 2021, total PPP loans outstanding were reduced to $37.0 million.
Deferrals and modifications. In the months following the onset of the pandemic, the Company adhered to regulatory guidance encouraging financial institutions to work with borrowers affected by the pandemic to defer or temporarily modify payment arrangements. Under the CARES Act and subsequent legislation, in instances where the borrower was otherwise current and performing prior to the pandemic, the Company was permitted the option of temporarily suspending certain requirements under U.S. GAAP related to troubled debt restructurings (TDRs). As of June 30, 2020, the Company had provided such relief for approximately 900 loans totaling $380.2 million. As of June 30, 2021, the number of such modifications were reduced to six loans with balances totaling $23.9 million, and of these, $23.7 million are now considered a “special mention” status credit in regards to classification. For more information regarding these deferrals and modifications, see discussion included in Item 7 – Management’s Discussion and Analysis of Financial Condition and Results of Operations (specifically: Financial Condition, Allowance for Credit Losses).
Acquisitions
On May 22, 2020, the Company completed its acquisition of Central Federal Bancshares, Inc. (“Central”) and its wholly owned subsidiary, Central Federal Savings & Loan Association of Rolla (“Central Federal”), in an all-cash transaction. At closing, Central held total assets of $70.6 million, loans, net, of $51.4 million, and deposits of $46.7 million. The Company acquired Central primarily for the purpose of conducting commercial banking activities in a market where it believes the Company’s business model will perform well, and for the long-term value of its core deposit franchise. The acquisition resulted in a bargain purchase gain of $123,000, while none of the purchase price was allocated to goodwill.
On November 21, 2018, the Company completed its acquisition of Gideon Bancshares Company (“Gideon”) and its wholly owned subsidiary, First Commercial Bank (“First Commercial”), in a stock and cash transaction. At closing, Gideon held total assets of $217 million, loans, net, of $144 million, and deposits of $171 million. The Company acquired Gideon primarily for the purpose of conducting commercial banking activities in markets where it believes the Company’s business model will perform well, and for the long-term value of its core deposit franchise. The goodwill of $1.0 million arising from the acquisition consists largely of synergies and economies of scale expected from combining the operations of the Bank and First Commercial. Goodwill from this transaction was assigned to the acquisition of First Commercial, and was not deductible for tax purposes.
On February 23, 2018, the Company completed its acquisition of Southern Missouri Bancshares, Inc. (“Bancshares”), and its wholly owned subsidiary, Southern Missouri Bank of Marshfield (“SMB-Marshfield”), in a stock and cash transaction. SMB-Marshfield was merged into the Bank at acquisition. At closing, Bancshares held total assets of $86.2 million, loans, net, of $68.3 million, and deposits of $68.2 million. The Company acquired SMB-Marshfield primarily for the purpose of conducting commercial banking activities in a market where it believes the Company’s business model will perform well, and for the long-term value of its core deposit franchise. The goodwill of $4.4 million arising from the acquisition consisted largely of synergies and economies of scale expected from combining the operations of the Bank and SMB-Marshfield. Goodwill from this transaction was assigned to the acquisition of the bank holding company, and was not deductible for tax purposes.
3
On June 16, 2017, the Company completed its acquisition of Tammcorp, Inc. (Tammcorp), and its subsidiary, Capaha Bank (Capaha), Tamms, Illinois, in a stock and cash transaction. Capaha was merged into the Bank at acquisition. At closing, Tammcorp held total assets of $187 million, loans, net, of $153 million, and deposits of $167 million. The Company acquired Capaha primarily for the purpose of expanding its commercial banking activities to markets where it believes the Company’s business model will perform well, and for the long-term value of its core deposit franchise. A Tammcorp note payable of $3.7 million was contractually required to be repaid in conjunction with the acquisition. The goodwill of $4.1 million arising from the acquisition consisted largely of synergies and economies of scale expected from combining the operations of the Bank and Capaha. Goodwill from this transaction was assigned to the acquisition of the bank holding company, and was not deductible for tax purposes.
On August 5, 2014, the Company completed its acquisition of Peoples Service Company (PSC) and its subsidiaries, Peoples Banking Company (PBC) and Peoples Bank of the Ozarks (Peoples), Nixa, Missouri, in a stock and cash transaction (the “Peoples Acquisition”). Peoples was merged into the Bank in early December, 2014, in connection with the conversion of Peoples’ data system. At closing, PSC held total assets of $267 million, loans, net, of $193 million, and deposits of $221 million. The Company acquired Peoples primarily for the purpose of expanding its commercial banking activities to markets where it believes the Company’s business model will perform well, and for the long-term value of its core deposit franchise. Notes payable of $2.9 million were contractually required to be repaid on the date of acquisition. The goodwill of $3.0 million arising from the acquisition consisted largely of synergies and economies of scale expected from combining the operations of the Bank and Peoples. Goodwill from this transaction was assigned to the acquisition of the bank holding company, and was not deductible for tax purposes.
The Company completed its acquisition of Ozarks Legacy Community Financial, Inc. (Ozarks Legacy), and its subsidiary, Bank of Thayer, headquartered in Thayer, Missouri, in October 2013. At closing, Ozarks Legacy had total assets of approximately $81 million, loans, net, of $38 million, and deposits of $68 million. The Company completed its acquisition of Citizens State Bankshares of Bald Knob, Inc. (Citizens), and its subsidiary, Citizens State Bank, headquartered in Bald Knob, Arkansas, in February 2014. At closing, Citizens had total assets of approximately $72 million, loans, net, of $12 million, and deposits of $64 million. (The Ozarks Legacy and Citizens acquisitions are referred to as the “Fiscal 2014 Acquisitions” collectively.)
On December 17, 2010, the Bank entered into a Purchase and Assumption Agreement with the FDIC, as receiver, to acquire certain assets and assume certain liabilities of the former First Southern Bank, with headquarters in Batesville, Arkansas, and one branch location in Searcy, Arkansas (the “Fiscal 2011 Acquisition”). As a result of the transaction, the Company acquired loans recorded at a fair value of $115 million and assumed deposits recorded at a fair value of $131 million, at December 17, 2010.
Capital Raising Transactions
On June 20, 2017, the Company completed an at-the-market common stock issuance. A total of 794,762 shares of the Company’s common stock were sold at a weighted-average price of approximately $31.46 per share, representing gross proceeds to the Company of approximately $25.0 million. The proceeds from the transaction have been used for general corporate purposes, including working capital to support organic growth at Southern Bank, and to support acquisitions to the extent available.
On November 22, 2011, the Company completed an underwritten public offering of 1,150,000 shares of common stock at a price to the public of $19.00 per share, for aggregate gross proceeds of $21.9 million. The proceeds from the offering have been used for general corporate purposes, including the funding of loan growth and the purchase of securities.
Forward Looking Statements
This document contains statements about the Company and its subsidiaries which we believe are “forward-looking statements” within the meaning of the Private Securities Litigation Reform Act of 1995. These forward-looking statements may include, without limitation, statements with respect to anticipated future operating and financial performance, growth opportunities, interest rates, cost savings and funding advantages expected or anticipated to be
4
realized by management. Words such as "may," "could," "should," "would," "believe," "anticipate," "estimate," "expect," "intend," "plan" and similar expressions are intended to identify these forward-looking statements. Forward-looking statements by the Company and its management are based on beliefs, plans, objectives, goals, expectations, anticipations, estimates and intentions of management and are not guarantees of future performance. The important factors we discuss below, as well as other factors discussed under the caption "Management’s Discussion and Analysis of Financial Condition and Results of Operations" and identified in the filing and in our other filings with the SEC and those presented elsewhere by our management from time to time, could cause actual results to differ materially from those indicated by the forward-looking statements made in this document:
| ● | potential adverse impacts to economic conditions in the Company’s local market areas, other markets where the Company has lending relationships, or other aspects of the Company’s business operations or financial markets, generally, resulting from the ongoing COVID-19 pandemic and any governmental or societal responses thereto; |
| ● | expected cost savings, synergies and other benefits from our merger and acquisition activities, including our ongoing and recently completed acquisitions, might not be realized within the anticipated time frames, to the extent anticipated, or at all, and costs or difficulties relating to integration matters, including but not limited to customer and employee retention, might be greater than expected; |
| ● | the strength of the United States economy in general and the strength of the local economies in which we conduct operations; |
| ● | fluctuations in interest rates and in real estate values; |
| ● | monetary and fiscal policies of the Board of Governors of the Federal Reserve System (the “Federal Reserve Board”) and the U.S. Government and other governmental initiatives affecting the financial services industry; |
| ● | the risks of lending and investing activities, including changes in the level and direction of loan delinquencies and write-offs and changes in estimates of the adequacy of the allowance for loan losses; |
| ● | our ability to access cost-effective funding; |
| ● | the timely development of and acceptance of our new products and services and the perceived overall value of these products and services by users, including the features, pricing and quality compared to competitors’ products and services; |
| ● | fluctuations in real estate values and both residential and commercial real estate markets, as well as agricultural business conditions; |
| ● | demand for loans and deposits in our market area; |
| ● | legislative or regulatory changes that adversely affect our business; |
| ● | changes in accounting principles, policies, or guidelines; |
| ● | results of examinations of us by our regulators, including the possibility that our regulators may, among other things, require us to increase our reserve for loan losses or to write-down assets; |
| ● | the impact of technological changes; and |
| ● | our success at managing the risks involved in the foregoing. |
5
The Company disclaims any obligation to update or revise any forward-looking statements based on the occurrence of future events, the receipt of new information, or otherwise.
Market Area
The Bank provides its customers with a full array of community banking services and conducts its business from its headquarters in Poplar Bluff, as well as 46 full service branch offices and two limited service branch offices, as of June 30, 2021. The branch offices are located in Poplar Bluff (4), Van Buren, Dexter (2), Kennett, Doniphan, Sikeston, Qulin, Matthews, Springfield (3), Thayer (2), West Plains, Alton, Clever, Forsyth, Fremont Hills, Kimberling City, Ozark, Nixa, Rogersville, Marshfield, Cape Girardeau (2), Jackson, Gideon, Chaffee, Benton, Advance, Bloomfield, Essex, and Rolla, Missouri; Jonesboro (2), Paragould, Batesville, Searcy, Bald Knob, Bradford, and Cabot, Arkansas; and Anna, Cairo, and Tamms, Illinois. In August 2021, a new branch was opened inWest Plains, Missouri.
For purposes of management and oversight of its operations, the Bank has organized its facilities into three regional markets. The Bank’s east region includes 24 of its facilities, one of which is limited service, which are situated in Butler, Cape Girardeau, Carter, New Madrid, Ripley, Scott, and Stoddard counties in Missouri, and Alexander and Union counties in Illinois. These counties have a total population of approximately 248,000, and included within this market area is the Cape Girardeau, Missouri, Metropolitan Statistical Area (MSA), which has a population of approximately 97,000. At June 30, 2021 the Bank’s south region includes 13 of its facilities, one of which is limited service, which are situated in Dunklin, Howell, and Oregon counties in Missouri, and Craighead, Greene, Independence, Lonoke, and White counties in Arkansas. These counties have a total population of approximately 425,000, and included within this market area is the Jonesboro, Arkansas, MSA, which has a population of approximately 136,000. The Cabot, Arkansas, branch in Lonoke County, is located in the northeast corner of the Little Rock, Arkansas, MSA. The Bank’s west region includes 12 of its facilities, which are situated in Christian, Greene, Phelps, Stone, Taney, and Webster counties in Missouri. These counties have a total population of approximately 554,000, and included within this market area is the Springfield, Missouri, MSA, which has a population of approximately 475,000. Each of these markets also serves a few communities just outside these county borders which do not have a notable impact on the demographics of the market area.
The Bank’s east and south regions are generally rural in nature with economies supported by manufacturing activity, agriculture (livestock, dairy, poultry, rice, timber, soybeans, wheat, melons, corn, and cotton), healthcare, and education. Large employers include hospitals, manufacturers, school districts, and colleges. In the west region, the Bank’s operations are generally more concentrated in the Springfield, Missouri, MSA, and major employers include healthcare providers, educational institutions, federal, local, and state government, retailers, transportation and distribution firms, and leisure, entertainment, and hospitality interests. For purposes of the Bank’s lending policy, the Bank’s primary lending area is considered to be the counties where the Bank has a branch facility, and any contiguous county.
Competition
The Bank faces strong competition in attracting deposits (its primary source of lendable funds) and originating loans. At June 30, 2021, the Bank was one of 26 bank or saving association groups located in its east region competing for approximately $6.6 billion in deposits at FDIC-insured institutions, one of 42 bank or saving association groups located in its south region (eight of these institutions overlap with the Bank’s east region) competing for $9.1 billion in deposits, and one of 45 bank or savings association groups located in its west region (13 of these overlap with the Bank’s east or south regions) competing for $15.1 billion in deposits.
Competitors for deposits include commercial banks, credit unions, digital payment applications, money market funds, and other investment alternatives, such as mutual funds, full service and discount broker-dealers, equity markets, brokerage accounts and government securities. The Bank’s competition for loans comes principally from other financial institutions, mortgage banking companies, mortgage brokers and life insurance companies. The Bank expects competition to continue to increase in the future as a result of legislative, regulatory and technological changes within the financial services industry. Technological advances, for example, have lowered barriers to market entry, allowed banks to expand their geographic reach by providing services over the Internet and made it possible for non-depository
6
institutions to offer products and services that traditionally have been provided by banks. The Gramm-Leach-Bliley Act, which permits affiliation among banks, securities firms and insurance companies, also has changed the competitive environment in which the Bank conducts business.
Lending Activities
General. The Bank’s lending activities consist of originating loans secured by mortgages on one- to four-family and multi-family residential real estate, commercial and agricultural real estate, construction loans on residential and commercial properties, commercial and agricultural business loans and consumer loans. The Bank has also occasionally purchased loan participation interests originated by other lenders. At June 30, 2021, the Bank had purchased participations in 23 loans totaling $83.0 million.
Supervision of the loan portfolio is the responsibility of our Chief Lending Officer, Rick Windes, Regional President Justin Cox, and our Chief Credit Officer, Mark Hecker (our “Senior Lending and Credit Officers”). The Chief Lending Officer and Regional President are responsible for oversight of loan production. The Chief Credit Officer is responsible for oversight of underwriting, loan policy, and administration. Loan officers have varying amounts of lending authority depending upon experience and types of loans. Loans beyond their authority are presented to the next level of authority, which may include one of three Regional Small Business Loan Committees, one of three Regional Senior Loan Committees, an Agricultural Loan Committee, or a Senior Agricultural Loan Committee.
The Regional Small Business Loan Committees each consists of lenders selected by our Senior Lending and Credit Officers, and is authorized to approve lending relationships up to $1.5 million. The Regional Senior Loan Committees each consists of one director appointed by the Board of Directors, and senior lenders selected by our Senior Lending and Credit Officers. Each Regional Senior Loan Committee is authorized to approve lending relationships up to $3.0 million. The Bank’s Agricultural Loan Committee consists of several lending officers with agricultural lending experience selected by our Senior Lending and Credit Officers, and is authorized to approve agricultural lending relationships up to $1.5 million. The Senior Agricultural Loan Committee consists of our Chief Credit Officer, as well as several senior lending officers with agricultural lending experience selected by our Senior Lending and Credit Officers. The Senior Agricultural Loan Committee is authorized to approve agricultural lending relationships up to $5.0 million.
Lending relationships above $3.0 million require approval of our Bank Senior Loan Committee, comprised of our Senior Lending and Credit Officers and two senior lenders from each region, or the approval of our Executive Loan Committee, comprised of our Chief Executive Officer and our Senior Lending and Credit Officers. In addition to the approval of the Bank Senior Loan Committee or the Executive Loan Committee, lending relationships in excess of $5.0 million require the approval of the Directors’ Loan Committee, which is comprised of all Bank directors. All loans are subject to ratification by the full Board of Directors.
The aggregate amount of loans that the Bank is permitted to make under applicable federal regulations to any one borrower, including related entities, or the aggregate amount that the Bank could have invested in any one real estate project, is based on the Bank’s capital levels. At June 30, 2021, the maximum amount which the Bank could lend to any one borrower and the borrower’s related entities was approximately $81.4 million. At June 30, 2021, the Bank’s ten largest credit relationships, as defined by loan to one borrower limitations, ranged from $35.2 million to $14.6 million, net of participation interests sold. As of June 30, 2021, the majority of these credits were commercial real estate, multi-family real estate, or commercial business loans, and all of these relationships were performing in accordance with their terms.
7
Loan Portfolio Analysis. The following table sets forth the composition of the Bank’s loan portfolio by type of loan and type of security as of the dates indicated.
| | | | | | | | | | | | | | | | | | | | | | | | | | |
| | At June 30, |
| |||||||||||||||||||||||
| | 2021 | | 2020 | | 2019 | | 2018 | | 2017 |
| |||||||||||||||
|
| Amount |
| Percent |
| Amount |
| Percent |
| Amount |
| Percent |
| Amount |
| Percent |
| Amount |
| Percent |
| |||||
| | (Dollars in thousands) |
| |||||||||||||||||||||||
Type of Loan: | | | | | | | | | | | | | | | | | | | | | | | | | | |
Mortgage Loans: | | |
| |
| | |
| |
| | |
| |
| | |
| |
| | |
| |
| |
Residential real estate | | $ | 721,216 |
| 32.78 | % | $ | 627,357 |
| 29.29 | % | $ | 491,992 |
| 26.65 | % | $ | 450,919 |
| 28.84 | % | $ | 442,463 |
| 31.66 | % |
Commercial real estate (1) | |
| 889,793 |
| 40.44 | |
| 887,419 |
| 41.43 | |
| 840,777 |
| 45.53 | |
| 704,647 |
| 45.07 | |
| 603,922 |
| 43.21 | |
Construction | |
| 208,824 |
| 9.49 | |
| 185,924 |
| 8.68 | |
| 123,287 |
| 6.68 | |
| 112,718 |
| 7.21 | |
| 106,782 |
| 7.63 | |
Total mortgage loans | |
| 1,819,833 |
| 82.71 | |
| 1,700,700 |
| 79.40 | |
| 1,456,056 |
| 78.86 | |
| 1,268,284 |
| 81.12 | |
| 1,153,167 |
| 82.50 | |
Other Loans: | |
|
|
|
| |
|
|
|
| |
|
|
|
| |
|
|
|
| |
|
|
|
| |
Automobile loans | |
| 15,146 |
| 0.69 | |
| 12,084 |
| 0.56 | |
| 11,379 |
| 0.62 | |
| 9,056 |
| 0.58 | |
| 6,378 |
| 0.46 | |
Commercial business (2) (3) | |
| 414,124 |
| 18.82 | |
| 468,448 |
| 21.87 | |
| 355,874 |
| 19.27 | |
| 281,272 |
| 17.99 | |
| 247,184 |
| 17.68 | |
Home equity | |
| 37,783 |
| 1.72 | |
| 43,149 |
| 2.01 | |
| 43,369 |
| 2.35 | |
| 39,218 |
| 2.51 | |
| 35,222 |
| 2.52 | |
Other | |
| 24,745 |
| 1.12 | |
| 25,534 |
| 1.20 | |
| 42,786 |
| 2.32 | |
| 30,297 |
| 1.94 | |
| 22,051 |
| 1.58 | |
Total other loans | |
| 491,798 |
| 22.35 | |
| 549,215 |
| 25.64 | |
| 453,408 |
| 24.56 | |
| 359,843 |
| 23.02 | |
| 310,835 |
| 22.24 | |
Total loans | |
| 2,311,631 |
| 105.06 | |
| 2,249,915 |
| 105.04 | |
| 1,909,464 |
| 103.42 | |
| 1,628,127 |
| 104.14 | |
| 1,464,002 |
| 104.74 | |
Less: | |
|
|
|
| |
|
|
|
| |
|
|
|
| |
|
|
|
| |
|
|
|
| |
Undisbursed loans in process | |
| 74,540 |
| 3.39 | |
| 78,452 |
| 3.66 | |
| 43,153 |
| 2.34 | |
| 46,533 |
| 2.98 | |
| 50,740 |
| 3.63 | |
Deferred fees and discounts | |
| 3,625 |
| 0.16 | |
| 4,395 |
| 0.21 | |
| 3 |
| 0.00 | |
| — |
| — | |
| (6) |
| (0.00) | |
Allowance for loan losses | |
| 33,222 |
| 1.51 | |
| 25,139 |
| 1.17 | |
| 19,903 |
| 1.08 | |
| 18,214 |
| 1.16 | |
| 15,538 |
| 1.11 | |
Net loans receivable | | $ | 2,200,244 |
| 100.00 | % | $ | 2,141,929 |
| 100.00 | % | $ | 1,846,405 |
| 100.00 | % | $ | 1,563,380 |
| 100.00 | % | $ | 1,397,730 |
| 100.00 | % |
| | | | | | | | | | | | | | | | | | | | | | | | | | |
Type of Security: | |
|
|
|
| |
|
|
|
| |
|
|
|
| |
|
|
|
| |
|
|
|
| |
Residential real estate | |
|
|
|
| |
|
|
|
| |
|
|
|
| |
|
|
|
| |
|
|
|
| |
One-to four-family | | $ | 526,208 |
| 23.92 | % | $ | 482,009 |
| 22.50 | % | $ | 395,317 |
| 21.41 | % | $ | 414,258 |
| 26.50 | % | $ | 352,723 |
| 25.24 | % |
Multi-family | |
| 359,200 |
| 16.33 | |
| 286,654 |
| 13.38 | |
| 172,303 |
| 9.33 | |
| 137,238 |
| 8.78 | |
| 151,585 |
| 10.85 | |
Commercial real estate | |
| 701,438 |
| 31.88 | |
| 688,145 |
| 32.13 | |
| 647,078 |
| 35.05 | |
| 502,073 |
| 32.11 | |
| 463,890 |
| 33.19 | |
Land | |
| 232,987 |
| 10.59 | |
| 243,892 |
| 11.39 | |
| 241,360 |
| 13.07 | |
| 214,715 |
| 13.73 | |
| 184,967 |
| 13.23 | |
Commercial | |
| 414,124 |
| 18.82 | |
| 468,448 |
| 21.88 | |
| 355,874 |
| 19.28 | |
| 281,272 |
| 17.99 | |
| 247,184 |
| 17.68 | |
Consumer and other | |
| 77,674 |
| 3.52 | |
| 80,767 |
| 3.77 | |
| 97,532 |
| 5.28 | |
| 78,571 |
| 5.03 | |
| 63,653 |
| 4.55 | |
Total loans | |
| 2,311,631 |
| 105.06 | |
| 2,249,915 |
| 105.04 | |
| 1,909,464 |
| 103.42 | |
| 1,628,127 |
| 104.14 | |
| 1,464,002 |
| 104.74 | |
| | | | | | | | | | | | | | | | | | | | | | | | | | |
Less: | |
|
|
|
| |
|
|
|
| |
|
|
|
| |
|
|
|
| |
|
|
|
| |
Undisbursed loans in process | |
| 74,540 |
| 3.39 | |
| 78,452 |
| 3.66 | |
| 43,153 |
| 2.34 | |
| 46,533 |
| 2.98 | |
| 50,740 |
| 3.63 | |
Deferred fees and discounts | |
| 3,625 |
| 0.16 | |
| 4,395 |
| 0.21 | |
| 3 |
| 0.00 | |
| — |
| — | |
| (6) |
| (0.00) | |
Allowance for loan losses | |
| 33,222 |
| 1.51 | |
| 25,139 |
| 1.17 | |
| 19,903 |
| 1.08 | |
| 18,214 |
| 1.16 | |
| 15,538 |
| 1.11 | |
Net loans receivable | | $ | 2,200,244 |
| 100.00 | % | $ | 2,141,929 |
| 100.00 | % | $ | 1,846,405 |
| 100.00 | % | $ | 1,563,380 |
| 100.00 | % | $ | 1,397,730 |
| 100.00 | % |
| (1) | Commercial real estate loan balances included farmland and other agricultural-related real estate loans of $180.6 million, $185.3 million, $182.7 million, $160.3 million, and $140.0 million as of June 30, 2021, 2020, 2019, 2018, and 2017, respectively. |
| (2) | Commercial business loan balances included agricultural equipment and production loans of $104.9 million, $100.3 million, $95.5 million, $81.5 million, and $85.7 million as of June 30, 2021, 2020, 2019, 2018 and 2017, respectively. |
| (3) | Commercial business loan balances included PPP loans of $63.0 million and $132.3 million as of June 30, 2021 and 2020, respectively, and none as of June 30, 2019, 2018, and 2017. |
8
The following table shows the fixed and adjustable rate composition of the Bank’s loan portfolio at the dates indicated.
| | | | | | | | | | | | | | | | | | | | | | | | | | |
| | At June 30, |
| |||||||||||||||||||||||
| | 2021 | | 2020 | | 2019 | | 2018 | | 2017 |
| |||||||||||||||
|
| Amount |
| Percent |
| Amount |
| Percent |
| Amount |
| Percent |
| Amount |
| Percent |
| Amount |
| Percent |
| |||||
|
| (Dollars in thousands) | | |||||||||||||||||||||||
Type of Loan: | | | | | | | | | | | | | | | | | | | | | | | | | | |
Fixed-Rate Loans: |
| |
|
|
|
| |
|
|
|
| |
|
|
|
| |
|
|
|
| |
|
|
| |
Residential real estate | | $ | 556,360 |
| 25.29 | % | $ | 407,437 |
| 19.02 | % | $ | 254,234 |
| 13.77 | % | $ | 207,405 |
| 13.27 | % | $ | 189,054 |
| 13.53 | % |
Commercial real estate | |
| 743,976 |
| 33.81 | |
| 725,830 |
| 33.89 | |
| 658,874 |
| 35.68 | |
| 557,556 |
| 35.66 | |
| 476,132 |
| 34.06 | |
Construction | |
| 202,309 |
| 9.19 | |
| 183,214 |
| 8.55 | |
| 116,304 |
| 6.30 | |
| 104,995 |
| 6.72 | |
| 89,542 |
| 6.40 | |
Consumer | |
| 37,045 |
| 1.68 | |
| 35,139 |
| 1.64 | |
| 51,905 |
| 2.81 | |
| 36,784 |
| 2.35 | |
| 26,305 |
| 1.88 | |
Commercial business | |
| 303,996 |
| 13.82 | |
| 365,219 |
| 17.05 | |
| 222,290 |
| 12.04 | |
| 151,766 |
| 9.71 | |
| 137,613 |
| 9.85 | |
Total fixed-rate loans | |
| 1,843,686 |
| 83.79 | |
| 1,716,839 |
| 80.15 | |
| 1,303,607 |
| 70.60 | |
| 1,058,506 |
| 67.71 | |
| 918,646 |
| 65.72 | |
Adjustable-Rate Loans: | |
|
|
|
| |
|
|
|
| |
|
|
|
| |
|
|
|
| |
|
|
|
| |
Residential real estate | |
| 164,856 |
| 7.49 | |
| 219,920 |
| 10.27 | |
| 237,758 |
| 12.88 | |
| 243,514 |
| 15.58 | |
| 253,409 |
| 18.13 | |
Commercial real estate | |
| 145,817 |
| 6.63 | |
| 161,589 |
| 7.54 | |
| 181,903 |
| 9.85 | |
| 147,091 |
| 9.41 | |
| 127,790 |
| 9.14 | |
Construction | |
| 6,515 |
| 0.30 | |
| 2,710 |
| 0.13 | |
| 6,983 |
| 0.38 | |
| 7,723 |
| 0.49 | |
| 17,240 |
| 1.23 | |
Consumer | |
| 40,629 |
| 1.84 | |
| 45,628 |
| 2.13 | |
| 45,629 |
| 2.47 | |
| 41,787 |
| 2.67 | |
| 37,346 |
| 2.67 | |
Commercial business | |
| 110,128 |
| 5.01 | |
| 103,229 |
| 4.82 | |
| 133,584 |
| 7.23 | |
| 129,506 |
| 8.28 | |
| 109,571 |
| 7.85 | |
Total adjustable-rate loans | |
| 467,945 |
| 21.27 | |
| 533,076 |
| 24.89 | |
| 605,857 |
| 32.81 | |
| 569,621 |
| 36.43 | |
| 545,356 |
| 39.02 | |
Total loans | |
| 2,311,631 |
| 105.06 | |
| 2,249,915 |
| 105.04 | |
| 1,909,464 |
| 103.41 | |
| 1,628,127 |
| 104.14 | |
| 1,464,002 |
| 104.74 | |
Less: | |
|
|
|
| |
|
|
|
| |
|
|
|
| |
|
|
|
| |
|
|
|
| |
Undisbursed loans in process | |
| 74,540 |
| 3.39 | |
| 78,452 |
| 3.66 | |
| 43,153 |
| 2.34 | |
| 46,533 |
| 2.98 | |
| 50,740 |
| 3.63 | |
Net deferred loan fees | |
| 3,625 |
| 0.16 | |
| 4,395 |
| 0.21 | |
| 3 |
| 0.00 | |
| — |
| — | |
| (6) |
| (0.00) | |
Allowance for loan loss | |
| 33,222 |
| 1.51 | |
| 25,139 |
| 1.17 | |
| 19,903 |
| 1.07 | |
| 18,214 |
| 1.16 | |
| 15,538 |
| 1.11 | |
Net loans receivable | | $ | 2,200,244 |
| 100.00 | % | $ | 2,141,929 |
| 100.00 | % | $ | 1,846,405 |
| 100.00 | % | $ | 1,563,380 |
| 100.00 | % | $ | 1,397,730 |
| 100.00 | % |
Residential Mortgage Lending. The Bank actively originates loans for the acquisition or refinance of one- to four-family residences. These loans are originated as a result of customer and real estate agent referrals, existing and walk-in customers and from responses to the Bank’s marketing campaigns. At June 30, 2021, residential loans secured by one- to four-family residences totaled $467.2 million, or 21.2% of net loans receivable.
The Bank currently offers both fixed-rate and adjustable-rate mortgage ("ARM") loans. During the year ended June 30, 2021, the Bank originated $18.5 million of ARM loans and $158.6 million of fixed-rate loans that were secured by one- to four-family residences, for retention in the Bank’s portfolio. An additional $152.9 million in fixed-rate one- to four-family residential loans were originated for sale on the secondary market. Substantially all of the one- to four-family residential mortgage originations in the Bank’s portfolio are secured by property located within the Bank’s market area.
The Bank generally originates one- to four-family residential mortgage loans for retention in its portfolio in amounts up to 90% of the lower of the purchase price or appraised value of residential property. For loans originated in excess of 80% loan-to-value, the Bank generally charges an additional 25-100 basis points, but does not require private mortgage insurance. At June 30, 2021, the outstanding balance of loans originated with a loan-to-value ratio in excess of 80% was $98.4 million. For fiscal years ended June 30, 2021, 2020, 2019, 2018, and 2017, originations of one- to four-family loans in excess of 80% loan-to-value have totaled $52.2 million, $45.9 million, $23.3 million, $26.3 million, and $25.0 million, respectively, totaling $172.6 million. The outstanding balance of those loans at June 30, 2021, was $84.8 million. Originating loans with higher loan-to-value ratios presents additional credit risk to the Bank. Consequently, the Bank limits this product to borrowers with a favorable credit history and a demonstrable ability to service the debt. The majority of new residential mortgage loans originated by the Bank for retention in its portfolio conform to secondary market underwriting standards; however, documentation of loan files may not be adequate to allow for immediate sale. The interest rates charged on these loans are competitively priced based on local market conditions, the availability of funding, and anticipated profit margins. Fixed and ARM loans originated by the Bank are amortized over periods as long as 30 years, but typically are repaid over shorter periods.
Fixed-rate loans secured by one- to four-family residences have contractual maturities up to 30 years, and are generally fully amortizing with payments due monthly. These loans normally remain outstanding for a substantially shorter period of time because of refinancing and other prepayments. A significant change in the interest rate environment can alter the average life of a residential loan portfolio. The one- to four-family fixed-rate loans do not
9
contain prepayment penalties. At June 30, 2021, one- to four-family loans with a fixed rate totaled $346.9 million and had a weighted-average maturity of 187 months.
The Bank currently originates one- to four-family ARM loans, which adjust annually, after an initial period of one to seven years. Typically, originated ARM loans secured by owner occupied properties reprice at a margin of 2.75% to 3.00% over the weekly average yield on United States Treasury securities adjusted to a constant maturity of one year (“CMT”). Generally, ARM loans secured by non-owner occupied residential properties reprice at a margin of 3.75% over the CMT index. Residential ARM loan originations are subject to annual and lifetime interest rate caps and floors. As a consequence of using interest rate caps, initial rates which may be at a premium or discount, and a "CMT" loan index, the interest earned on the Bank’s ARMs will react differently to changing interest rates than the Bank’s cost of funds. At June 30, 2021, one- to four-family loans tied to the CMT index totaled $91.3 million. One- to four-family loans tied to other indices totaled $29.9 million.
In underwriting one- to four-family residential real estate loans, the Bank evaluates the borrower’s ability to meet debt service requirements at current as well as fully indexed rates for ARM loans, and the value of the property securing the loan. Most properties securing real estate loans made by the Bank during fiscal 2021 had appraisals performed on them by independent fee appraisers approved and qualified by the Board of Directors. The Bank generally requires borrowers to obtain title insurance and fire, property and flood insurance (if indicated) in an amount not less than the amount of the loan. Real estate loans originated by the Bank generally contain a "due on sale" clause allowing the Bank to declare the unpaid principal balance due and payable upon the sale of the security property.
The Bank also originates loans secured by multi-family residential properties that are often located outside the Company’s primary market area, but made to borrowers who operate within the primary market area. At June 30, 2021, the Bank had $254.0 million, or 11.5% of net loans receivable, in multi-family residential real estate. The majority of the multi-family residential loans that are originated by the Bank are amortized over periods generally up to 25 years, with balloon maturities up to ten years. Both fixed and adjustable interest rates are offered and it is typical for the Bank to insertinclude an interest rate “floor” and “ceiling” in variable-rate loan agreements. Variable rate loans typically adjust daily, monthly, quarterly or annually based on the signatureWall Street prime interest rate. Generally, multi-family residential loans do not exceed 85% of the lower of the appraised value or purchase price of the secured property. The Bank generally requires a Board-approved independent certified fee appraiser to be engaged in determining the collateral value. As a general rule, the Bank requires the unlimited guaranty of all individuals (or entities) owning (directly or indirectly) 20% or more of the borrowing entity.
The primary risk associated with multi-family loans is the ability of the income-producing property that collateralizes the loan to produce adequate cash flow to service the debt. High unemployment or generally weak economic conditions may result in borrowers having to provide rental rate concessions to achieve adequate occupancy rates. In an effort to reduce these risks, the Bank evaluates the guarantor’s ability to inject personal funds as a tertiary source of repayment.
Commercial Real Estate Lending. The Bank actively originates loans secured by commercial real estate including farmland, single- and multi-tenant retail properties, restaurants, hotels, nursing homes and other healthcare related facilities, land (improved and unimproved), convenience stores, automobile dealerships, and other automotive-related services, warehouses and distribution centers, and other businesses generally located in the Bank’s market area. At June 30, 2021, the Bank had $889.8 million in commercial real estate loans, which represented 40.4% of net loans receivable. Of this amount, $180.6 million were loans secured by agricultural properties. The Bank expects to continue to maintain or increase the percentage of commercial real estate loans, inclusive of agricultural properties, in its total portfolio.
Commercial real estate loans originated by the Bank are generally based on amortization schedules of up to 25 years with monthly principal and interest payments. Generally, these loans have fixed interest rates and maturities ranging up to ten years, with a balloon payment due at maturity. Alternatively, for some loans, the interest rate adjusts at least annually after an initial fixed-rate period up to seven years, based upon the Wall Street prime rate. The Bank typically includes an interest rate "floor" in the loan agreement. The Bank’s fixed-rate commercial real estate portfolio has a weighted average maturity of 63 months. Variable rate commercial real estate originations typically adjust
10
daily, monthly, quarterly or annually based on the Wall Street prime rate. Generally, loans for improved commercial properties do not exceed 80% of the lower of the appraised value or the purchase price of the secured property. Agricultural real estate terms offered differ slightly, with amortization schedules of up to 25 years with an 80% loan-to-value ratio, or 30 years with a 75% loan-to-value ratio. Agricultural real estate loans generally require annual, instead of monthly, payments. Before credit is extended, the Bank analyzes the financial condition of the borrower, the borrower’s credit history, and the reliability and predictability of the cash flow generated by the property and the value of the property itself. Generally, personal guarantees are obtained from the borrower in addition to obtaining the secured property as collateral for such loans. The Bank also generally requires appraisals on properties securing commercial real estate to be performed by a Board-approved independent certified fee appraiser.
Generally, loans secured by commercial real estate involve a greater degree of credit risk than one- to four-family residential mortgage loans. These loans typically involve large balances to single borrowers or groups of related borrowers. Because payments on loans secured by commercial real estate are often dependent on the successful operation or management of the secured property, repayment of such loans may be subject to adverse conditions in the real estate market or the economy. See "Asset Quality."
Construction Lending. The Bank originates real estate loans secured by property or land that is under construction or development. At June 30, 2021, the Bank had $208.8 million, or 9.5% of net loans receivable in construction loans outstanding.
Construction loans originated by the Bank are generally secured by mortgage loans for the construction of owner occupied residential real estate or to finance speculative construction secured by residential real estate, land development, or owner-occupied or non-owner occupied commercial real estate. At June 30, 2021, $59.0 million of the Bank’s construction loans were secured by one- to four-family residential real estate, $105.2 million were secured by multi-family residential real estate, and $44.6 million were secured by commercial real estate. Included in the one- to four-family residential real estate construction loans were $17.9 million in loans for speculative construction, while the multifamily construction loans included $73.5 million participation loans purchased for developments awarded low income housing tax credits, and for which a firm takeout commitment exists (see “Loan Originations, Sales, and Purchases”). During construction, these loans typically require monthly interest-only payments with single-family residential construction loans maturing in six to twelve months, while multifamily or commercial construction loans typically mature in 12 to 24 months. Once construction is completed, construction loans may be converted to permanent financing, generally with monthly payments using amortization schedules of up to 30 years on residential and up to 25 years on commercial real estate.
Speculative construction and land development lending generally affords the Bank an opportunity to receive higher interest rates and fees with shorter terms to maturity than those obtainable from residential lending. Nevertheless, construction and land development lending is generally considered to involve a higher level of credit risk than one- to four-family residential lending due to (i) the concentration of principal among relatively few borrowers and development projects, (ii) the increased difficulty at the time the loan is made of accurately estimating building or development costs and the selling price of the finished product, (iii) the increased difficulty and costs of monitoring and disbursing funds for the loan, (iv) the higher degree of sensitivity to increases in market rates of interest and changes in local economic conditions, and (v) the increased difficulty of working out problem loans. Due in part to these risk factors, the Bank may be required from time to time to modify or extend the terms of some of these types of loans. In an effort to reduce these risks, the application process includes a submission to the Bank of accurate plans, specifications and costs of the project to be constructed. These items are also used as a basis to determine the appraised value of the subject property. Loan amounts are generally limited to 80% of the lesser of current appraised value and/or the cost of construction.
Consumer Lending. The Bank offers a variety of secured consumer loans, including: home equity, automobile, second mortgage, mobile home and deposit-secured loans. The Bank originates substantially all of its consumer loans in its primary market area. Generally, consumer loans are originated with fixed rates for terms of up to approximately five years, with the exception of home equity lines of credit, which are variable, tied to the prime rate of interest, and are for a period of ten years. At June 30, 2021, the Bank’s consumer loan portfolio totaled $77.7 million, or 3.5% of net loans receivable.
11
Home equity loans represented 48.6% of the Bank’s consumer loan portfolio at June 30, 2021, and totaled $37.8 million, or 1.7% of net loans receivable.
Home equity lines of credit (HELOCs) are secured with a deed of trust and are generally issued for up to 90% of the appraised or assessed value of the property securing the line of credit, less the outstanding balance on the first mortgage. Interest rates on the HELOCs are adjustable and are tied to the current prime interest rate, generally with an interest rate floor in the loan agreement. This rate is obtained from the Wall Street Journal and adjusts on a daily basis. Interest rates are based upon the loan-to-value ratio of the property with better rates given to borrowers with more equity. HELOCs are secured by residential properties, which is generally considered to be stronger collateral than that securing other consumer loans. In addition, because of the adjustable rate structure, HELOCs present less interest rate risk to the Bank.
Automobile loans represented 19.5% of the Bank’s consumer loan portfolio at June 30, 2021, and totaled $15.1 million, or 0.69% of net loans receivable. Of that total, an immaterial amount was originated by auto dealers. Typically, automobile loans are made for terms of up to 66 months for new and used vehicles. Loans secured by automobiles have fixed rates and are generally made in amounts up to 100% of the purchase price of the vehicle.
Consumer loan rates and terms vary according to the type of collateral, length of contract and creditworthiness of the borrower, which is evaluated using credit scoring. Consumers with additional qualifying Bank products are eligible for additional pricing discounts. The underwriting standards employed for consumer loans include employment stability, an application, a determination of the applicant’s payment history on other debts, and an assessment of ability to meet existing and proposed obligations. Although creditworthiness of the applicant is a primary consideration, the underwriting process also includes a comparison of the value of the security, if any, in relation to the proposed loan amount.
Consumer loans may entail greater credit risk than do residential mortgage loans, because they are generally unsecured or are secured by rapidly depreciable or mobile assets, such as automobiles. In the event of repossession or default, there may be no secondary source of repayment or the underlying value of the collateral could be insufficient to repay the loan. In addition, consumer loan collections are dependent on the borrower’s continuing financial stability, and thus are more likely to be affected by adverse personal circumstances. Furthermore, the application of various federal and state laws, including bankruptcy and insolvency laws, may limit the amount which can be recovered on such loans. The Bank’s delinquency levels for these types of loans are reflective of these risks. See "Asset Classification."
Commercial Business Lending. The Bank’s commercial business lending activities encompass loans with a variety of purposes and security, including loans to finance accounts receivable, inventory, equipment and operating lines of credit. At June 30, 2021, the Bank had $414.1 million in commercial business loans outstanding, or 18.8% of net loans receivable. Of this amount, $104.9 million were loans related to agriculture, including amortizing equipment loans and annual production lines. At June 30, 2021, commercial loan balances included $63.0 million in PPP loans outstanding. The Bank expects the percentage of commercial business loans in its total loan portfolio to modestly decline in the near term as these borrowers’ loans are forgiven by the SBA, but expects the percentage of the loan portfolio attributable to commercial business loans to remain relatively stable over the long term.
The Bank currently offers both fixed and adjustable rate commercial business loans. At fiscal year end, the Bank had $304.0 million in fixed rate and $110.1 million of adjustable rate commercial business loans. The adjustable rate business loans typically reprice daily, monthly, quarterly, or annually, in accordance with the Wall Street prime rate of interest. The Bank typically includes an interest rate "floor" in the loan agreement.
Commercial business loan terms vary according to the type and value of collateral, length of contract and creditworthiness of the borrower. Generally, commercial loans secured by fixed assets are amortized over periods up to five years, while commercial operating lines of credit or agricultural production lines are generally for a one year period. The Bank’s commercial business loans are evaluated based on the loan application, a determination of the applicant’s payment history on other debts, business stability and an assessment of ability to meet existing obligations and payments on the proposed loan. Although creditworthiness of the applicant is a primary consideration, the underwriting process also includes a comparison of the value of the security, if any, in relation to the proposed loan amount.
12
Unlike residential mortgage loans, which generally are made on the basis of the borrower’s ability to make repayment from his or her employment and other income, and which are secured by real property whose value tends to be more easily ascertainable, commercial business loans are of higher risk and typically are made on the basis of the borrower’s ability to make repayment from the cash flow of the borrower’s business. As a result, the availability of funds for the repayment of commercial business loans may be substantially dependent on the success of the business itself. Further, the collateral securing the loans may depreciate over time, may be difficult to appraise and may fluctuate in value based on the success of the business.
Contractual Obligations and Commitments, Including Off-Balance Sheet Arrangements. The following table discloses our independent registered public accountingfixed and determinable contractual obligations and commercial commitments by payment date as of June 30, 2021. Commitments to extend credit totaled $491.6 million at June 30, 2021.
| | | | | | | | | | | | | | | |
|
| Less Than |
| |
| |
| More Than |
| | | ||||
| | 1 Year | | 1-3 Years | | 4-5 Years | | 5 Years | | Total | |||||
|
| (Dollars in thousands) | |||||||||||||
Federal Home Loan Bank advances | | $ | 24,242 | | $ | 17,000 | | $ | 16,000 | | $ | 287 | | $ | 57,529 |
Certificates of deposit | |
| 358,777 | |
| 152,202 | |
| 51,607 | |
| — | |
| 562,586 |
Total | | $ | 383,019 | | $ | 169,202 | | $ | 67,607 | | $ | 287 | | $ | 620,115 |
| | | | | | | | | | | | | | | |
|
| Less Than |
| |
| |
| More Than |
| | | ||||
| | 1 Year | | 1-3 Years | | 4-5 Years | | 5 Years | | Total | |||||
|
| (Dollars in thousands) | |||||||||||||
Construction loans in process | | $ | 74,540 | | $ | — | | $ | — | | $ | — | | $ | 74,540 |
Other loan commitments | |
| 355,291 | |
| 14,441 | |
| 11,153 | |
| 36,199 | |
| 417,084 |
| | $ | 429,831 | | $ | 14,441 | | $ | 11,153 | | $ | 36,199 | | $ | 491,624 |
Loan Maturity and Repricing
The following table sets forth certain information at June 30, 2021, regarding the dollar amount of loans maturing or repricing in the Bank’s portfolio based on their contractual terms to maturity or repricing, but does not include scheduled payments or potential prepayments. Demand loans, loans having no stated schedule of repayments and no stated maturity, and overdrafts are reported as due in one year or less. Mortgage loans that have adjustable rates are shown as maturing at their next repricing date. Listed loan balances are shown before deductions for undisbursed loan proceeds, unearned discounts, unearned income and allowance for loan losses.
| | | | | | | | | | | | | | | |
| | | | After | | After | | | | | | ||||
| | | | One Year | | 5 Years | | | | | |||||
|
| Within |
| Through |
| Through |
| After |
| | | ||||
| | One Year | | 5 Years | | 10 Years | | 10 Years | | Total | |||||
|
| (Dollars in thousands) | |||||||||||||
Residential real estate | | $ | 133,660 | | $ | 175,846 | | $ | 204,360 | | $ | 207,350 | | $ | 721,216 |
Commercial real estate | |
| 234,086 | |
| 396,215 | |
| 248,639 | |
| 10,853 | |
| 889,793 |
Construction | | | 175,989 | | | 23,688 | | | 9,147 | | | — | | | 208,824 |
Consumer | | | 44,109 | | | 28,940 | | | 4,524 | | | 101 | | | 77,674 |
Commercial business | | | 181,317 | | | 190,426 | | | 40,488 | | | 1,893 | | | 414,124 |
Total loans | | $ | 769,161 | | $ | 815,115 | | $ | 507,158 | | $ | 220,197 | | $ | 2,311,631 |
As of June 30, 2021, loans with a maturity date after June 30, 2022, with fixed interest rates totaled $1.4 billion, and loans with a maturity date after June 30, 2022, with adjustable rates totaled $99.2 million.
Loan Originations, Sales and Purchases
Generally, loans are originated by the Bank’s staff, who are salaried loan officers. All loan officers are eligible for bonuses based on production, market performance, and credit quality. Certain lenders, in particular those originating higher volume of residential loans for sale on the secondary market, may earn a relatively higher percentage of their total
13
compensation through bonuses. Loans are originated both to be held for investment and to be sold into the secondary market. Loan applications are generally taken and processed at each of the Bank’s full-service locations, and the Bank in recent years began processing online applications for single-family residential loans.
While the Bank originates both adjustable-rate and fixed-rate loans, the ability to originate loans is dependent upon the relative customer demand for loans in its market. In fiscal 2021, the Bank originated $971.8 million of loans, compared to $848.1 million and $606.3 million, respectively, in fiscal 2020 and 2019. Of these loans, mortgage loan originations were $771.2 million, $570.1 million, and $437.6 million in fiscal 2021, 2020, and 2019, respectively. Increases in originations over recent periods is attributed to PPP lending activity, increased borrower refinancing, and an expanded market area and customer base following recent acquisitions.
From time to time, the Bank has purchased loan participations consistent with its loan underwriting standards. During fiscal 2021, the Bank committed to purchase $37.5 million of new loan participations. At June 30, 2021, outstanding balances on loan participations purchased totaled $83.0 million, or 3.8% of net loans receivable. An additional $37.0 million is available to be drawn on these purchased participation loans. Approximately 89% of the Bank’s outstanding balance in loan participations purchased are construction loans for multifamily developments awarded low income housing tax credits, and for which a firm BKD, LLP,takeout commitment exists. Of the available credit on loan participations purchased, approximately 86% is attributable to these construction loans for multifamily development. At June 30, 2021, all of these participations were performing in accordance with their reportsrespective terms. The Bank evaluates additional loan participations on an ongoing basis, based in part on local loan demand, liquidity, portfolio and capital levels.
The following table shows total loans originated, purchased, sold and repaid during the periods indicated.
| | | | | | | | | |
| | Year Ended June 30, | |||||||
|
| 2021 |
| 2020 | | 2019 | |||
| | (Dollars in thousands) | |||||||
Total loans at beginning of period | | $ | 2,249,915 | | $ | 1,909,464 | | $ | 1,628,127 |
| |
| | |
| | |
| |
Loans originated: | | | | | | | | | |
One- to four-family residential | | | 330,000 | | | 214,852 | | | 106,113 |
Multi-family residential and commercial real estate | | | 290,246 | | | 252,684 | | | 234,075 |
Construction loans | | | 150,947 | | | 102,560 | | | 97,442 |
Commercial business | | | 172,229 | | | 253,355 | | | 143,776 |
Consumer and others | | | 28,421 | | | 24,643 | | | 24,921 |
Total loans originated | | | 971,843 | | | 848,094 | | | 606,327 |
| | | | | | | | | |
Loans purchased: | | | | | | | | | |
Total loans purchased (1) (2) | | | 55,271 | | | 77,959 | | | 166,112 |
| | | | | | | | | |
Loans sold: | | | | | | | | | |
Total loans sold | | | (157,406) | | | (95,826) | | | (50,488) |
| | | | | | | | | |
Principal repayments | | | (778,032) | | | (474,057) | | | (431,898) |
Participation principal repayments | | | (29,193) | | | (14,407) | | | (6,438) |
| | | | | | | | | |
Foreclosures | | | (767) | | | (1,312) | | | (2,278) |
Net loan activity | | | 61,716 | | | 340,451 | | | 281,337 |
Total loans at end of period | | $ | 2,311,631 | | $ | 2,249,915 | | $ | 1,909,464 |
| (1) | Amount reported in fiscal 2020 includes the Company’s acquisition of loans from the Central Federal acquisition recorded at a $51.4 million fair value. |
| (2) | Amount reported in fiscal 2019 includes the Company’s acquisition of loans from the Gideon acquisition recorded at a $144.3 million fair value. |
14
Loan Commitments
The Bank issues commitments for single- and multi-family residential mortgage loans, commercial real estate loans, operating or working capital lines of credit, and standby letters-of-credit. Such commitments may be oral or in writing with specified terms, conditions and at a specified rate of interest. The Bank had outstanding net loan commitments of approximately $491.6 million at June 30, 2021. See Note 12 of Notes to the Consolidated Financial Statements contained in Item 8.
Loan Fees
In addition to interest earned on loans, the Bank receives income from fees in connection with loan originations, loan modifications, late payments and for miscellaneous services related to its loans. Income from these activities varies from period to period depending upon the volume and type of loans made and competitive conditions.
Asset Quality
Delinquent Loans. Generally, when a borrower fails to make a required payment, the Bank begins the collection process by mailing a computer generated notice to the customer. If the delinquency is not cured promptly, the customer is contacted again by notice or telephone. After an account secured by real estate becomes over 60 days past due, the Bank will typically send a demand notice to the customer which, if not cured within the time provided or unless satisfactory arrangements have been made, will lead to foreclosure. Foreclosure may not begin until the loan reaches 120 days delinquency in the case of consumer residential loans. For consumer loans, the Missouri Right-To-Cure Statute is followed, which requires issuance of specifically worded notices at specific time intervals prior to repossession or further collection efforts.
The following table sets forth the Bank’s loan delinquencies by type and by amount at June 30, 2021.
| | | | | | | | | | | | | | | | | | |
| | Loans Delinquent For: | | Total Loans | ||||||||||||||
| | | | Delinquent 60 Days | ||||||||||||||
| | 60-89 Days | | 90 Days and Over | | or More | ||||||||||||
|
| Numbers |
| Amounts |
| Numbers |
| Amounts |
| Numbers |
| Amounts | ||||||
| | (Dollars in thousands) | ||||||||||||||||
Residential real estate | | | 7 | | $ | 364 | | | 9 | | $ | 613 | | | 16 | | $ | 977 |
Commercial real estate | | | — | | | — | | | 1 | | | 30 | | | 1 | | | 30 |
Construction | | | — | |
| — | | | 3 | |
| 374 | | | 3 | |
| 374 |
Consumer | | | 9 | |
| 66 | | | 3 | |
| 84 | | | 12 | |
| 150 |
Commercial Business | | | 5 | |
| 939 | | | 3 | |
| 110 | | | 8 | |
| 1,049 |
Totals | | | 21 | | $ | 1,369 | | | 19 | | $ | 1,211 | | | 40 | | $ | 2,580 |
CARES Act Relief from TDR Classification Requirements for Borrowers Impacted by COVID-19 Pandemic. In March 2020, the Coronavirus Aid, Relief and Economic Security Act (the CARES Act) was signed into law, providing banking organizations with the option to temporarily suspend certain requirements under U.S. GAAP related to troubled debt restructurings (TDR) for a limited period of time to account for the effects of COVID-19. The relief was extended by the 2021 Consolidated Appropriations Act signed into law in December 2020. The Company has elected to not apply ASC Subtopic 310-40 for loans eligible under the CARES Act, based on the modification’s (1) relation to COVID-19, (2) execution for a loan that was not more than 30-days past due as of December 31, 2019, and (3) execution between March 1, 2020, and the earlier of the date that falls 60 days following the termination of the declared National Emergency, or January 1, 2022. As of June 30, 2021, those loans for which the Company had elected to modify but not consider as TDRs totaled $23.9 million, and were concentrated primarily in non-owner-occupied commercial real estate. For further information about these modifications, see discussion included in Item 7 - Management’s Discussion and Analysis of Financial Condition and Results of Operations (specifically: Financial Condition, Allowance for Credit Losses).
Non-Performing Assets. The table below sets forth the amounts and categories of non-performing assets in the Bank’s loan portfolio. Loans are placed on non-accrual status when the collection of principal and/or interest becomes
15
doubtful, and as a result, previously accrued interest income on the loan is removed from current income. The Bank has no reserves for uncollected interest and does not accrue interest on non-accrual loans. A loan may be transferred back to accrual status once a satisfactory repayment history has been restored. Foreclosed assets held for sale include assets acquired in settlement of loans and are shown net of reserves.
The decrease in nonperforming assets in fiscal 2021 was attributed primarily to the decrease in nonaccrual loans, which, in turn, was attributed primarily to the resolution of certain nonperforming loans acquired in the Gideon Acquisition. In connection with the Gideon Acquisition we acquired nonperforming loans which totaled $10.2 million (at fair value) as of June 30, 2019. This group of nonperforming loans had declined to $1.8 million as of June 30, 2020, and declined further to an immaterial amount as of June 30, 2021.
For information regarding accrual of interest on loans, see Note 1 of Notes to the Consolidated Financial Statements contained in Item 8.
The Company may treat purchased credit deteriorated loans as an accruing asset because these loans are recorded at acquisition at fair value, which includes an accretable discount recorded as interest income over the expected life of the obligation.
The following table sets forth information with respect to the Bank’s non-performing assets as of the dates indicated.
| | | | | | | | | | | | | | | | |
| | At June 30, |
| |||||||||||||
| | 2021 | | 2020 | | 2019 | | 2018 | | 2017 |
| |||||
| | (Dollars in thousands) | | |||||||||||||
Nonaccruing loans: | | |
| | |
| | |
| | |
| | |
| |
Residential real estate | | $ | 3,235 | | $ | 4,010 | | $ | 6,404 | | $ | 5,913 | | $ | 1,263 | |
Construction | |
| 30 | |
| — | |
| — | |
| 25 | |
| 35 | |
Commercial real estate | |
| 1,914 | |
| 3,106 | |
| 10,876 | |
| 1,962 | |
| 960 | |
Consumer | |
| 100 | |
| 196 | |
| 309 | |
| 209 | |
| 158 | |
Commercial business | |
| 589 | |
| 1,345 | |
| 3,424 | |
| 1,063 | |
| 409 | |
Total | |
| 5,868 | |
| 8,657 | |
| 21,013 | |
| 9,172 | |
| 2,825 | |
| | | | | | | | | | | | | | | | |
Loans 90 days past due accruing interest: | |
|
| |
|
| |
|
| |
|
| |
|
| |
Residential real estate | |
| — | |
| — | |
| — | |
| — | |
| 59 | |
Construction | |
| — | |
| — | |
| — | |
| — | |
| — | |
Commercial real estate | |
| — | |
| — | |
| — | |
| — | |
| — | |
Consumer | |
| — | |
| — | |
| — | |
| — | |
| 13 | |
Commercial business | |
| — | |
| — | |
| — | |
| — | |
| 329 | |
Total | |
| — | |
| — | |
| — | |
| — | |
| 401 | |
| | | | | | | | | | | | | | | | |
Total nonperforming loans | |
| 5,868 | |
| 8,657 | |
| 21,013 | |
| 9,172 | |
| 3,226 | |
Nonperforming investments | | | — | | | — | | | — | | | — | | | — | |
Foreclosed assets held for sale: | |
| | |
| | |
| | |
| | |
| | |
Real estate owned | |
| 2,227 | |
| 2,561 | |
| 3,723 | |
| 3,874 | |
| 3,014 | |
Other nonperforming assets | |
| 23 | |
| 9 | |
| 29 | |
| 50 | |
| 86 | |
Total nonperforming assets | | $ | 8,118 | | $ | 11,227 | | $ | 24,765 | | $ | 13,096 | | $ | 6,326 | |
| | | | | | | | | | | | | | | | |
Total nonperforming loans to net loans | | | 0.27 | % | | 0.40 | % | | 1.14 | % | | 0.59 | % | | 0.23 | % |
Total nonperforming loans to total assets | | | 0.22 | % | | 0.34 | % | | 0.95 | % | | 0.49 | % | | 0.19 | % |
Total nonperforming assets to total assets | | | 0.30 | % | | 0.44 | % | | 1.12 | % | | 0.69 | % | | 0.37 | % |
At June 30, 2021, troubled debt restructurings (TDRs) totaled $6.5 million, of which $3.2 million was considered nonperforming and was included in the nonaccrual loan total above. The remaining $3.3 million in TDRs have complied with the modified terms for a reasonable period of time and are therefore considered by the Company to be accrual status loans. At June 30, 2020, TDRs totaled $11.2 million, of which $2.6 million was considered
16
nonperforming and was included in the nonaccrual loan total above. In general, these loans were subject to classification as TDRs at June 30, 2021 and 2020, on the basis of guidance under ASU 2011-02 “Receivables: A Creditor’s Determination of Whether a Restructuring is a Troubled Debt Restructuring”, which indicates that the Company may not consider the borrower’s effective borrowing rate on the old debt immediately before the restructuring in determining whether a concession has been granted.
Real Estate Owned. Real estate properties acquired through foreclosure or by deed in lieu of foreclosure are recorded at the lower of cost or fair value, less estimated disposition costs, which establishes a new cost basis. If fair value at the date of foreclosure is lower than the balance of the related loan, the difference will be charged-off to the allowance for loan losses at the time of transfer. Management periodically updates real estate valuations and if the value declines, a specific provision for losses on such property is established by a charge to noninterest expense. At June 30, 2021, the Company’s balance of real estate owned totaled $2.2 million and included $622,000 in residential properties and $1.5 million in non-residential properties.
Asset Classification. Applicable regulations require that each insured institution review and classify its assets on a regular basis. In addition, in connection with examinations of insured institutions, regulatory examiners have authority to identify problem assets and, if appropriate, require them to be classified. There are three classifications for problem assets: substandard, doubtful and loss. Substandard assets must have one or more defined weaknesses and are characterized by the distinct possibility that the insured institution will sustain some loss if the deficiencies are not corrected. Doubtful assets have the weaknesses of substandard assets with the additional characteristic that the weaknesses make collection or liquidation in full on the basis of currently existing facts, conditions and values questionable, and there is a high possibility of loss. An asset classified loss is considered uncollectible and of such little value that continuance as an asset of the institution is not warranted. When an insured institution classifies problem assets as loss, it charges off the balance of the assets. Assets which do not currently expose the Bank to sufficient risk to warrant classification in one of the aforementioned categories but possess weaknesses, may be designated as special mention. The Bank’s determination as to the classification of its assets and the amount of its valuation allowances is subject to review by the FRB and the Missouri Division of Finance, which can order the establishment of additional loss allowances.
On the basis of management’s review of the assets of the Company, at June 30, 2021, adversely classified assets totaled $20.3 million, or 0.75% of total assets as compared to $27.0 million, or 1.06% of total assets at June 30, 2020. Of the amount adversely classified as of June 30, 2021, $19.5 million was considered substandard, and $850,000 was considered doubtful. Included in adversely classified assets at June 30, 2021, were various loans totaling $18.1 million (see Note 3 of Notes to the Consolidated Financial Statements contained in Item 8 for more information on adversely classified loans) and foreclosed real estate and repossessed assets totaling $2.2 million. Adversely classified loans are so designated due to concerns regarding the borrower’s ability to generate sufficient cash flows to service the debt. Adversely classified loans totaling $4.7 million had been placed on nonaccrual status at June 30, 2021, of which $1.3 million were more than 30 days delinquent. Of the remaining $13.6 million of adversely classified loans, $491,000 were more than 30 days delinquent.
Other Loans of Concern. In addition to the adversely classified assets above, there were also other loans with respect to which management has concerns as to the ability of the borrowers to continue to comply with present loan terms, which may ultimately result in the adverse classification of such assets. These loans continued to perform according to contractual terms as of June 30, 2021, but were identified as having elevated risk due to concerns regarding the borrower’s ability to continue to generate sufficient cash flows to service the debt. At June 30, 2021, these other loans of concern totaled $48.4 million, as compared to $56.7 million at June 30, 2020. These totals were attributable primarily to a limited number of construction and commercial real estate loans secured by hotel properties with combined balances of $23.7 million and $27.3 million, respectively, as of June 30, 2021 and 2020. These borrowers requested and received payment deferrals or modifications due to the impact of the COVID-19 pandemic on their operations, and were not able to return to their previously contracted arrangements by the fiscal year ends noted. Other loans of concern attributable to the Gideon Acquisition declined from $13.7 million, at fair value, as of the November 2018 acquisition, to $9.3 million, at fair value, as of June 30, 2021.
Allowance for Credit Losses. The Bank’s allowance for credit losses is established through a provision for credit losses based on management’s expectation of lifetime credit losses on financial assets held at amortized cost. Management estimates the ACL using relevant available information, from internal and external sources, relating to past
17
events, current conditions, and reasonable and supportable forecasts. Adjustments may be made to historical loss information for differences identified in current loan-specific risk characteristics, such as differences in underwriting standards or terms; lending review systems; experience, ability, or depth of lending management and staff; portfolio growth and mix; delinquency levels and trends; as well as for changes in environmental conditions, such as changes in economic activity or employment, agricultural economic conditions, property values, or other relevant factors. These provisions for credit losses are charged against earnings in the year they are established. The Bank had an allowance for credit losses at June 30, 2021, of $33.2 million, which represented 409% of nonperforming assets as compared to an allowance of $25.1 million, which represented 224% of nonperforming assets at June 30, 2020.
At June 30, 2021, the Bank also had an allowance for credit losses on off-balance sheet credit exposures of $1.8 million, as compared to $2.0 million at June 30, 2020. This amount is maintained as a separate liability account to cover estimated credit losses associated with off-balance sheet credit instruments such as off-balance sheet loan commitments, standby letters of credit, and guarantees.
Although management believes that it uses the best information available to determine the allowance, unforeseen market conditions could result in adjustments and net earnings could be significantly affected if circumstances differ substantially from assumptions used in making the final determination. Future additions to the allowance will likely be the result of periodic loan, property and collateral reviews and thus cannot be predicted with certainty in advance. Further discussion of the methodology used in establishing the allowance is provided in Note 1 and Note 3 of the Notes to the Consolidated Financial Statements contained in Item 8, and in “Management’s Discussion and Analysis of Financial Condition and Results of Operations – Critical Accounting Policies – Allowance for Credit Losses” in section of Item 9A,7 of this Form 10-K.
The following table sets forth an analysis of the Bank’s allowance for loan losses for the periods indicated. Where specific loan loss reserves have been established, any difference between the loss reserve and the amount of loss realized has been charged or credited to current income.
| | | | | | | | | | | | | | | | |
|
| Year Ended June 30, | | |||||||||||||
|
| 2021 |
| 2020 |
| 2019 |
| 2018 |
| 2017 | | |||||
| | (Dollars in thousands) | | |||||||||||||
Allowance at beginning of period | | $ | 25,139 | | $ | 19,903 | | $ | 18,214 | | $ | 15,538 | | $ | 13,791 | |
Impact of CECL adoption | | | 9,333 | | | — | | | — | | | — | | | — | |
Recoveries | | | | | | | | | | | | | | | | |
Residential real estate | | | 3 | | | 19 | | | 23 | | | 2 | | | 10 | |
Construction real estate | | | — | | | — | | | — | | | — | | | 1 | |
Commercial real estate | | | 1 | | | 15 | | | 5 | | | 2 | | | 20 | |
Commercial business | | | 35 | | | 28 | | | 2 | | | 8 | | | 31 | |
Consumer | | | 47 | | | 25 | | | 16 | | | 23 | | | 8 | |
Total recoveries | | | 86 | | | 87 | | | 46 | | | 35 | | | 70 | |
| | | | | | | | | | | | | | | | |
Charge offs: | | | | | | | | | | | | | | | | |
Residential real estate | | | 180 | | | 379 | | | 30 | | | 190 | | | 211 | |
Construction real estate | | | — | | | — | | | — | | | 9 | | | 31 | |
Commercial real estate | | | 90 | | | 12 | | | 164 | | | 56 | | | 19 | |
Commercial business | | | 318 | | | 273 | | | 92 | | | 22 | | | 337 | |
Consumer | | | 146 | | | 189 | | | 103 | | | 129 | | | 65 | |
Total charge offs | | | 734 | | | 853 | | | 389 | | | 406 | | | 663 | |
| | | | | | | | | | | | | | | | |
Net charge offs | | | (648) | | | (766) | | | (343) | | | (371) | | | (593) | |
Provision for loan losses | | | (602) | | | 6,002 | | | 2,032 | | | 3,047 | | | 2,340 | |
Balance at end of period | | $ | 33,222 | | $ | 25,139 | | $ | 19,903 | | $ | 18,214 | | $ | 15,538 | |
| | | | | | | | | | | | | | | | |
Ratio of allowance to total loans outstanding at the end of the period | | | 1.49 | % | | 1.16 | % | | 1.07 | % | | 1.15 | % | | 1.10 | % |
18
Ratio of net charge offs to average loans outstanding during the period | | | 0.03 | % | | 0.04 | % | | 0.02 | % | | 0.02 | % | | 0.05 | % |
The following table sets forth the breakdown of the allowance for loan losses by loan category for the periods indicated.
| | | | | | | | | | | | | | | | | | | | | | | | | | | | | | | |
| | At June 30, | | ||||||||||||||||||||||||||||
| | 2021 | | 2020 | | 2019 | | 2018 | | 2017 | | ||||||||||||||||||||
| | | | | Percent of | | | | | Percent of | | | | | Percent of | | | | | Percent of | | | | | Percent of | | |||||
| | | | | Loans in | | | | | Loans in | | | | | Loans in | | | | | Loans in | | | | | Loans in | | |||||
| | | | | Each | | | | | Each | | | | | Each | | | | | Each | | | | | Each | | |||||
| | | | | Category | | | | | Category | | | | | Category | | | | | Category | | | | | Category | | |||||
| | | | | to Total | | | | | to Total | | | | | to Total | | | | | to Total | | | | | to Total | | |||||
|
| Amount |
| Loans | | Amount |
| Loans | | Amount |
| Loans | | Amount |
| Loans | | Amount |
| Loans | | ||||||||||
| | (Dollars in thousands) | | ||||||||||||||||||||||||||||
Residential real estate | | $ | 11,192 | | | 31.21 | % | $ | 4,875 | | | 27.89 | % | $ | 3,706 | | | 25.76 | % | $ | 3,226 | | | 27.70 | % | $ | 3,230 | | | 30.22 | % |
| | | | | | | | | | | | | | | | | | | | | | | | | | | | | | | |
Construction | | | 2,170 | | | 9.03 | | | 2,010 | | | 8.26 | | | 1,365 | | | 6.46 | | | 1,097 | | | 6.92 | | | 964 | | | 7.30 | |
| | | | | | | | | | | | | | | | | | | | | | | | | | | | | | | |
Commercial real estate | |
| 14,535 | | | 38.49 | |
| 12,132 | | | 39.44 | |
| 9,399 | | | 44.03 | |
| 8,793 | | | 43.28 | |
| 7,068 | | | 41.25 | |
| | | | | | | | | | | | | | | | | | | | | | | | | | | | | | | |
Consumer | |
| 916 | | | 3.36 | |
| 1,182 | | | 3.59 | |
| 1,046 | | | 5.11 | |
| 902 | | | 4.82 | |
| 757 | | | 4.35 | |
| | | | | | | | | | | | | | | | | | | | | | | | | | | | | | | |
Commercial business | |
| 4,409 | | | 17.91 | |
| 4,940 | | | 20.82 | |
| 4,387 | | | 18.64 | |
| 4,196 | | | 17.28 | |
| 3,519 | | | 16.88 | |
| | | | | | | | | | | | | | | | | | | | | | | | | | | | | | | |
Total allowance for loan losses | | $ | 33,222 | | | 100.00 | % | $ | 25,139 | | | 100.00 | % | $ | 19,903 | | | 100.00 | % | $ | 18,214 | | | 100.00 | % | $ | 15,538 | | | 100.00 | % |
Investment Activities
General. Under Missouri law, the Bank is permitted to invest in various types of liquid assets, including U.S. Government and State of Missouri obligations, securities of various federal agencies, certain certificates of deposit of insured banks and savings institutions, banker’s acceptances, repurchase agreements, federal funds, commercial paper, investment grade corporate debt securities and obligations of States and their political sub-divisions. Generally, the investment policy of the Company is to invest funds among various categories of investments and repricing characteristics based upon the Bank’s need for liquidity, to provide collateral for borrowings and public unit deposits, to help reach financial performance targets and to help maintain asset/liability management objectives.
The Company’s investment portfolio is managed in accordance with the Bank’s investment policy which was adopted by the Board of Directors of the Bank and is implemented by members of the asset/liability management committee which consists of the President/Chief Executive Officer, the Chief Financial Officer, the Chief Operations Officer, and four outside directors.
Investment purchases and/or sales must be authorized by the appropriate party, depending on the aggregate size of the investment transaction, prior to any investment transaction. The Board of Directors reviews all investment transactions. All investment purchases are identified as available-for-sale ("AFS") at the time of purchase. The Company has not classified any investment securities as held-to-maturity over the last five years. Securities classified as "AFS" must be reported at fair value with unrealized gains and losses, net of tax, recorded as a separate component of stockholders’ equity. At June 30, 2021, AFS securities totaled $207.0 million (not including FHLB and Federal Reserve Bank membership stock, or other equity securities without readity-determinable fair values). For information regarding the amortized cost and market values of the Company’s investments, see Note 2 of Notes to the Consolidated Financial Statements contained in Item 8.
As of June 30, 2021, the Company had no derivative instruments and no outstanding hedging activities. Management has reviewed potential uses for derivative instruments and hedging activities, but has no definitive plans to employ these tools.
19
Debt and Other Securities. At June 30, 2021, the Company’s debt and other securities portfolio totaled $68.7 million, or 2.54% of total assets as compared to $49.6 million, or 1.95% of total assets at June 30, 2020. During fiscal 2021, the Bank had $10.1 million in maturities and $32.2 million in purchases of these securities. Of the securities that matured, $6.3 million was called for early redemption. At June 30, 2021, the investment securities portfolio included $47.7 million in municipal bonds, of which $39.2 million is subject to early redemption at the option of the issuer, and $20.3 million in corporate obligations, all of which is subject to early redemption at the option of the issuer. The remaining portfolio consists of $672,000 in other securities, primarily SBA pools. Based on projected maturities, the weighted average life of the debt and other securities portfolio at June 30, 2021, was 47 months. Membership stock held in the FHLB of Des Moines, totaling $5.9 million and in the Federal Reserve Bank of St. Louis, totaling $5.0 million, along with equity stock of $764,000 in two correspondent (bankers’) banks, was not included in the above totals.
Mortgage-Backed Securities. At June 30, 2021, mortgage-backed securities (“MBS”) totaled $138.3 million, or 5.1%, of total assets, as compared to $126.9 million, or 5.0%, of total assets at June 30, 2020. During fiscal 2021, the Bank had maturities and prepayments of $47.5 million and $75.8 million in purchases of MBS. At June 30, 2021, the MBS portfolio included $65.0 million in fixed-rate residential MBS issued by government-sponsored enterprises (GSEs), $36.5 million in fixed-rate commercial MBS issued by GSEs, and $36.9 million in fixed rate collateralized mortgage obligations (“CMOs”) issued by GSEs generally consisting of underlying residential property loans, all of which passed the Federal Financial Institutions Examination Council’s sensitivity test. Based on projected prepayment rates, the weighted average life of the MBS and CMOs at June 30, 2021, was 58 months. Actual prepayment rates experienced, which often vary due to changes in market interest rates, may cause the anticipated average life of MBS portfolio to extend or shorten as compared to prepayment rates anticipated.
Investment Securities Analysis
The following table sets forth the Company’s debt and other securities portfolio, at carrying value, and membership stock, at cost, at the dates indicated.
| | | | | | | | | | | | | | | | | | | | | |
| | At June 30, | | ||||||||||||||||||
| | 2021 | | | 2020 | | | 2019 | | ||||||||||||
| | Fair | | Percent of | | | Fair | | Percent of | | | Fair | | Percent of | | ||||||
|
| Value |
| Portfolio | | | Value |
| Portfolio | | | Value |
| Portfolio | | ||||||
| | (Dollars in thousands) | | ||||||||||||||||||
U.S. government and government agencies | | $ | — | | | — | % | | $ | — | | | — | % | | $ | 7,270 | | | 11.07 | % |
State and political subdivisions | | | 47,696 | | | 59.35 | | | | 41,988 | | | 68.45 | | | | 42,783 | | | 65.14 | |
Corporate obligations | | | 20,311 | | | 25.28 | | | | 6,659 | | | 10.86 | | | | 4,846 | | | 7.38 | |
Other securities | |
| 672 | | | 0.84 | | |
| 965 | | | 1.57 | | |
| 207 | | | 0.32 | |
FHLB membership stock | | | 5,873 | | | 7.31 | | | | 6,604 | | | 10.76 | | | | 5,447 | | | 8.29 | |
Federal Reserve Bank membership stock. | |
| 5,031 | | | 6.26 | | |
| 4,363 | | | 7.10 | | |
| 4,350 | | | 6.62 | |
Correspondent (banker’s) bank stock. | |
| 775 | | | 0.96 | | |
| 775 | | | 1.26 | | |
| 775 | | | 1.18 | |
Total | | $ | 80,358 | | | 100.00 | % | | $ | 61,354 | | | 100.00 | % | | $ | 65,678 | | | 100.00 | % |
20
The following table sets forth the maturities and weighted average yields of AFS debt securities in the Company’s investment securities portfolio and membership stock at June 30, 2021.
| | | | | | | | | |
| | Available for Sale Securities |
| ||||||
| | June 30, 2021 |
| ||||||
| | Amortized | | Fair | | Tax-Equiv. |
| ||
|
| Cost |
| Value |
| Wtd.-Avg. Yield |
| ||
| | (Dollars in thousands) |
| ||||||
State and political subdivisions: | | |
| | |
| |
| |
Due within 1 year | | $ | 1,873 | | $ | 1,887 |
| 1.26 | % |
Due after 1 year but within 5 years | |
| 7,568 | |
| 7,720 |
| 3.29 | |
Due after 5 years but within 10 years | |
| 13,452 | |
| 13,898 |
| 2.13 | |
Due over 10 years | |
| 23,364 | |
| 24,191 |
| 2.37 | |
Total | |
| 46,257 | |
| 47,696 |
| 2.40 | |
| | | | | | | | | |
Corporate obligations: | |
|
| |
|
|
|
| |
Due within 1 year | |
| — | |
| — |
| — | % |
Due after 1 year but within 5 years | |
| 1,996 | |
| 2,000 |
| 4.09 | |
Due after 5 years but within 10 years | |
| 16,909 | |
| 17,110 |
| 3.50 | |
Due over 10 years | |
| 1,451 | |
| 1,201 |
| 1.24 | |
Total | |
| 20,356 | |
| 20,311 |
| 3.40 | |
| | | | | | | | | |
Other securities: | |
|
| |
|
|
|
| |
Due within 1 year | |
| — | |
| — |
| — | % |
Due after 1 year but within 5 years | |
| — | |
| — |
| — | |
Due after 5 years but within 10 years | |
| 25 | |
| 25 |
| — | |
Due over 10 years | |
| 622 | |
| 647 |
| 2.11 | |
Total | |
| 647 | |
| 672 |
| 2.03 | |
| | | | | | | | | |
No stated maturity: | |
|
| |
|
|
|
| |
FHLB memebership/correspondent stock | |
| 6,648 | |
| 6,648 |
| 3.90 | % |
Federal Reserve Bank membership stock | |
| 5,031 | |
| 5,031 |
| 6.00 | |
Total | |
| 11,679 | |
| 11,679 |
| 4.80 | |
Total debt and other securities | | $ | 78,939 | | $ | 80,358 |
| 3.01 | % |
The following table sets forth certain information at June 30, 2021 regarding the dollar amount of MBS and CMOs at amortized cost due, based on their consent filedcontractual terms to maturity, but does not include scheduled payments or potential prepayments. MBS and CMOs that have adjustable rates are shown at amortized cost as Exhibit maturing at their next repricing date.
| | | |
|
| At June 30, 2021 | |
| | (Dollars in thousands) | |
Amounts due: | | |
|
Within 1 year | | $ | — |
After 1 year through 3 years | |
| 4,973 |
After 3 years through 5 years | |
| 39,051 |
After 5 years | |
| 92,002 |
Total | | $ | 136,026 |
21
The following table sets forth the dollar amount of all MBS and CMOs at amortized cost due, based on their contractual terms to maturity, one year after June 30, 2021, which have fixed, floating, or adjustable interest rates.
| | | |
|
| At June 30, 2021 | |
|
| (Dollars in thousands) | |
Interest rate terms on amounts due after 1 year: | |
|
|
Fixed |
| $ | 136,026 |
Adjustable | | | — |
Total |
| $ | 136,026 |
The following table sets forth certain information with respect to each MBS and CMO security at the dates indicated.
| | | | | | | | | | | | | | | | | | |
| | At June 30, | ||||||||||||||||
| | 2021 | | 2020 | | 2019 | ||||||||||||
| | Amortized | | Fair | | Amortized | | Fair | | Amortized | | Fair | ||||||
|
| Cost |
| Value |
| Cost |
| Value |
| Cost |
| Value | ||||||
|
| | (Dollars in thousands) | |||||||||||||||
Residential MBS issued by GSEs | | $ | 64,400 | | $ | 64,953 | | $ | 62,315 | | $ | 63,954 | | $ | 38,267 | | $ | 38,257 |
Commercial MBS issued by GSEs | |
| 35,425 | |
| 36,481 | |
| 17,466 | |
| 19,051 | |
| 13,084 | |
| 13,608 |
CMOs issued by GSEs | |
| 36,201 | |
| 36,907 | |
| 42,594 | |
| 43,907 | |
| 57,946 | |
| 58,564 |
Total | | $ | 136,026 | | $ | 138,341 | | $ | 122,375 | | $ | 126,912 | | $ | 109,297 | | $ | 110,429 |
Deposit Activities and Other Sources of Funds
General. The Company’s primary sources of funds are deposits, borrowings, payments of principal and interest on loans, MBS and CMOs, interest and principal received on investment securities and other short-term investments, and funds provided from operating results. Loan repayments are a relatively stable source of funds, while deposit inflows and outflows and loan prepayments are significantly influenced by general market interest rates and overall economic conditions.
Borrowings, including FHLB advances, have been used at times to provide additional liquidity. Borrowings are used on an overnight or short-term basis to compensate for periodic fluctuations in cash flows, and are used on a longer term basis to fund loan growth and to help manage the Company’s sensitivity to fluctuating interest rates.
Deposits. The Bank’s depositors are generally residents and entities located in the States of Missouri, Arkansas, or Illinois. Deposits are attracted from within the Bank’s market area through the offering of a broad selection of deposit instruments, including interest-bearing and noninterest-bearing transaction accounts, money market deposit accounts, saving accounts, certificates of deposit and retirement savings plans. At times, the Company will utilize brokered deposits in lieu of borrowings, subject to market pricing and availability. For larger depositors, such as public units, the Company often utilizes a reciprocal deposit program to provide additional FDIC coverage to our customer through other financial institutions while conveniently allowing management of the deposit relationship through our institution. Deposit account terms vary according to the minimum balance required, the time periods the funds may remain on deposit and the interest rate, among other factors. In determining the terms of its deposit accounts, the Bank considers current market interest rates, profitability to the Bank, managing interest rate sensitivity and its customer preferences and concerns. The Bank’s Asset/Liability Committee regularly reviews its deposit mix and pricing.
The Bank will periodically promote a particular deposit product as part of the Bank’s overall marketing plan. Deposit products have been promoted through various mediums, which include digital and social media, television, radio and newspaper advertisements, as well as “grassroots” marketing techniques, such as sponsorship of – or activity at – community events. The emphasis of these campaigns is to increase consumer awareness and market share of the Bank.
The flow of deposits is influenced significantly by general economic conditions, changes in prevailing interest rates, and competition. Based on its experience, the Bank believes that its deposits are relatively stable sources of funds. However, the ability of the Bank to attract and maintain money market deposit accounts, passbook savings accounts, and
22
certificates of deposit, and the rates paid on these deposits, has been and will continue to be significantly affected by market conditions. The following table depicts the composition of the Bank’s deposits as of June 30, 2021:
| | | | | | | | | | | | | | |
As of June 30, 2021 | | |||||||||||||
Weighted | | | | | | | | | | | | |
| |
Average | | | | | | | | | | | | | Percentage | |
Interest | | | | | | | Minimum | | | | | of Total | | |
Rate |
| | Term |
| Category |
| Amount |
| Balance |
| Deposits | | ||
| | | | | | | | | | (Dollars in thousands) | | | | |
0.00 | % | | None | | Non-interest Bearing | | $ | 100 | | $ | 358,418 | | 15.38 | % |
0.96 | | | None | | NOW Accounts | |
| 100 | |
| 925,280 | | 39.70 | |
0.66 | | | None | | Savings Accounts | |
| 100 | |
| 230,905 | | 9.91 | |
1.26 | | | None | | Money Market Deposit Accounts | |
| 1,000 | |
| 253,614 | | 10.88 | |
| | | | | | | | | | | | | | |
| | |
| | Certificates of Deposit | | | | | | | | | |
0.97 | | | 6 months or less | | Fixed Rate/Term | |
| 1,000 | |
| 72,418 | | 3.11 | |
0.75 | | | 6 months or less | | IRA Fixed Rate/Term | |
| 1,000 | |
| 6,318 | | 0.27 | |
1.48 | | | 7-12 months | | Fixed Rate/Term | |
| 1,000 | |
| 158,252 | | 6.79 | |
1.37 | | | 7-12 months | | IRA Fixed Rate/Term | |
| 1,000 | |
| 24,129 | | 1.04 | |
2.00 | | | 13-24 months | | Fixed Rate/Term | |
| 1,000 | |
| 106,938 | | 4.59 | |
1.67 | | | 13-24 months | | IRA Fixed Rate/Term | |
| 1,000 | |
| 17,292 | | 0.74 | |
2.51 | | | 25-36 months | | Fixed Rate/Term | |
| 1,000 | |
| 29,396 | | 1.26 | |
2.54 | | | 25-36 months | | IRA Fixed Rate/Term | |
| 1,000 | |
| 6,431 | | 0.28 | |
1.95 | | | 48 months and more | | Fixed Rate/Term | |
| 1,000 | |
| 116,662 | | 5.01 | |
1.97 | | | 48 months and more | | IRA Fixed Rate/Term | |
| 1,000 | |
| 24,750 | | 1.06 | |
| | | | | | | | | | $ | 2,330,803 | | 100.00 | % |
The following table indicates the amount of the Bank’s jumbo certificates of deposit by time remaining until maturity as of June 30, 2021. Jumbo certificates of deposit require minimum deposits of $100,000 and rates paid on such accounts are generally negotiable.
| | | |
Maturity Period |
| Amount | |
| | (Dollars in thousands) | |
Three months or less | | $ | 61,857 |
Over three through six months | |
| 59,179 |
Over six through twelve months | |
| 84,342 |
Over 12 months | |
| 136,063 |
Total | | $ | 341,441 |
23
Time Deposits by Rates
The following table sets forth the time deposits in the Bank classified by rates at the dates indicated.
| | | | | | | | | |
|
| At June 30, | |||||||
|
| 2021 |
| 2020 |
| 2019 | |||
|
| (Dollars in thousands) | |||||||
0.00 - 0.99% | | $ | 332,958 | | $ | 72,236 | | $ | 2,447 |
1.00 - 1.99% | |
| 155,078 | |
| 393,625 | |
| 221,409 |
2.00 - 2.99% | |
| 63,777 | |
| 168,985 | |
| 398,931 |
3.00 - 3.99% | |
| 10,606 | |
| 39,191 | |
| 56,310 |
4.00 - 4.99% | |
| 167 | |
| 160 | |
| 162 |
5.00 - 5.99% | |
| — | |
| — | |
| — |
6.00 - 6.99% | |
| — | |
| 274 | |
| — |
| | | | | | | | | |
Total | | $ | 562,586 | | $ | 674,471 | | $ | 679,259 |
The following table sets forth the amount and maturities of all time deposits at June 30, 2021.
| | | | | | | | | | | | | | | | | | | | | |
|
| Amount Due |
| ||||||||||||||||||
| | | | | | | | | | | | | | | | | | | | Percent |
|
| | Less | | | | | | | | | | | | | | | | | of Total |
| |
| | Than One | | 1-2 | | 2-3 | | 3-4 | | After | | | | | Certificate |
| |||||
|
| Year |
| Years |
| Years |
| Years |
| 4 Years |
| Total |
| Accounts |
| ||||||
|
| (Dollars in thousands) | | ||||||||||||||||||
0.00 – 0.99% | | $ | 260,753 | | $ | 58,537 | | $ | 10,644 | | $ | 3,012 | | $ | 12 | | $ | 332,958 |
| 59.18 | % |
1.00 – 1.99% | |
| 64,151 | |
| 15,111 | |
| 5,866 | |
| 18,355 | |
| 51,595 | |
| 155,078 |
| 27.57 | |
2.00 - 2.99% | |
| 29,599 | |
| 11,221 | |
| 3,821 | |
| 19,136 | |
| — | |
| 63,777 |
| 11.34 | |
3.00 - 3.99% | |
| 4,274 | |
| 5,300 | |
| 1,032 | |
| — | |
| — | |
| 10,606 |
| 1.89 | |
4.00 - 4.99% | |
| — | |
| — | |
| 167 | |
| — | |
| — | |
| 167 |
| 0.03 | |
5.00 - 5.99% | |
| — | |
| — | |
| — | |
| — | |
| — | |
| — |
| — | |
6.00 - 6.99% | |
| — | |
| — | |
| — | |
| — | |
| — | |
| — |
| — | |
| | | | | | | | | | | | | | | | | | | | | |
Total | | $ | 358,777 | | $ | 90,169 | | $ | 21,530 | | $ | 40,503 | | $ | 51,607 | | $ | 562,586 |
| 100.00 | % |
24
Deposit Flow
The following table sets forth the balance of deposits in the various types of accounts offered by the Bank at the dates indicated.
| | | | | | | | | | | | | | | | | | | | | | | | |
|
| At June 30, | ||||||||||||||||||||||
| | 2021 |
| 2020 | | 2019 | ||||||||||||||||||
| | | |
| Percent of | | Increase | | | |
| Percent of | | Increase |
| | |
| Percent of | | Increase | |||
|
| Amount |
| Total |
| (Decrease) |
| Amount |
| Total |
| (Decrease) |
| Amount |
| Total |
| (Decrease) | ||||||
| | (Dollars in thousands) | ||||||||||||||||||||||
Noninterest bearing | | $ | 358,418 |
| 15.38 | % | $ | 42,370 | | $ | 316,048 |
| 14.47 | % | $ | 97,159 | | $ | 218,889 |
| 11.56 | % | $ | 15,372 |
NOW checking | |
| 925,280 |
| 39.70 | |
| 143,343 | |
| 781,937 |
| 35.79 | |
| 142,718 | |
| 639,219 |
| 33.75 | |
| 70,214 |
Savings accounts | |
| 230,905 |
| 9.91 | |
| 49,676 | |
| 181,229 |
| 8.29 | |
| 13,256 | |
| 167,973 |
| 8.87 | |
| 10,433 |
Money market deposit | |
| 253,614 |
| 10.88 | |
| 22,452 | |
| 231,162 |
| 10.58 | |
| 42,807 | |
| 188,355 |
| 9.95 | |
| 71,966 |
Fixed-rate certificates which mature(1): | |
|
|
|
| |
|
| |
|
|
|
| |
|
| |
|
|
|
| |
|
|
Within one year | |
| 358,777 |
| 15.39 | |
| (140,642) | |
| 499,419 |
| 22.86 | |
| 31,743 | |
| 467,676 |
| 24.70 | |
| 156,236 |
Within three years | |
| 111,699 |
| 4.79 | |
| (13,907) | |
| 125,606 |
| 5.75 | |
| (65,419) | |
| 191,025 |
| 10.09 | |
| 14,231 |
After three years | |
| 92,110 |
| 3.95 | |
| 42,664 | |
| 49,446 |
| 2.26 | |
| 28,888 | |
| 20,558 |
| 1.08 | |
| (24,659) |
Variable-rate certificates which mature: | |
|
|
|
| |
|
| |
|
|
|
| |
|
| |
|
|
|
| |
|
|
Within one year | |
| — |
| — | |
| — | |
| — |
| — | |
| — | |
| — |
| — | |
| — |
Within three years | |
| — |
| — | |
| — | |
| — |
| — | |
| — | |
| — |
| — | |
| — |
Total | | $ | 2,330,803 |
| 100.00 | % | $ | 145,956 | | $ | 2,184,847 |
| 100.00 | % | $ | 291,152 | | $ | 1,893,695 |
| 100.00 | % | $ | 313,793 |
| (1) | At June 30, 2021, 2020, and 2019, certificates in excess of $100,000 totaled $341.4 million, $421.7 million, and $427.1 million, respectively. |
The following table sets forth the deposit activities of the Bank for the periods indicated.
| | | | | | | | | |
|
| At June 30, | |||||||
|
| 2021 |
| 2020 |
| 2019 | |||
|
| (Dollars in thousands) | |||||||
Beginning Balance | | $ | 2,184,847 | | $ | 1,893,695 | | $ | 1,579,902 |
| | | | | | | | | |
Net increase before interest credited | |
| 131,067 | |
| 267,068 | |
| 292,585 |
Interest credited | |
| 14,889 | |
| 24,084 | |
| 21,208 |
Net increase in deposits | |
| 145,956 | |
| 291,152 | |
| 313,793 |
| | | | | | | | | |
Ending balance | | $ | 2,330,803 | | $ | 2,184,847 | | $ | 1,893,695 |
In the unlikely event the Bank is liquidated, depositors will be entitled to payment of their deposit accounts prior to any payment being made to the Company as the sole stockholder of the Bank.
Borrowings. As a member of the FHLB of Des Moines, the Bank has the ability to apply for FHLB advances. These advances are available under various credit programs, each of which has its own maturity, interest rate and repricing characteristics. Additionally, FHLB advances have prepayment penalties as well as limitations on size or term. In order to utilize FHLB advances, the Bank must be a member of the FHLB system, have sufficient collateral to secure the requested advance and own stock in the FHLB equal to 4.45% of the amount borrowed. See "REGULATION – The Bank – Federal Home Loan Bank System."
Although deposits are the Bank’s primary and preferred source of funds, the Bank has actively used FHLB advances. The Bank’s general policy has been to utilize borrowings to meet short-term liquidity needs, or to provide a longer-term source of funding loan growth when other cheaper funding sources are unavailable or to aide in asset/liability management. As of June 30, 2021, the Bank had $57.5 million in outstanding FHLB advances, including $57.2 million in fixed-rate long term advances, $287,000 of fixed rate amortizing advances, and no overnight borrowings. In order for the Bank to borrow from the FHLB, it has reported $769.8 million of its residential and commercial real estate loans to the FHLB as eligible collateral for available credit of approximately $440.9 million, and has purchased $5.9 million in membership stock in the FHLB of Des Moines. Of the available credit, in addition to the
25
amount advanced, $351,000 is encumbered in relation to residential real estate loans sold onto the secondary market through the FHLB, and none was utilized for the issuance of letters of credit to secure public unit deposits. At June 30, 2021, the Bank had additional borrowing capacity on its reported residential and commercial real estate loans pledged to the FHLB of approximately $383.0 million, as compared to $296.6 million at June 30, 2020.
Additionally, the Bank is approved to borrow from the Federal Reserve Bank’s discount window on a primary credit basis. Primary credit is available to approved institutions on a generally short-term basis at the “discount rate” set by the FOMC. The Bank has pledged agricultural real estate and other loans to farmers as collateral for any amounts borrowed through the discount window. As of June 30, 2021, the Bank was approved to borrow up to $216.8 million through the discount window, but no balance was outstanding.
Southern Missouri Statutory Trust I, a Delaware business trust subsidiary of the Company, issued $7.0 million in Floating Rate Capital Securities (the "Trust Preferred Securities") with a liquidation value of $1,000 per share in March, 2004. The securities are due in 30 years, were redeemable after five years and bear interest at a floating rate based on LIBOR. At June 30, 2021, the current rate was 2.87%. The securities represent undivided beneficial interests in the trust, which was omittedestablished by Southern Missouri Bancorp for the purpose of issuing the securities. The Trust Preferred Securities were sold in a private transaction exempt from registration under the Securities Act of 1933, as amended (the "Act") and have not been registered under the Act. The securities may not be offered or sold in the United States absent registration or an applicable exemption from registration requirements.
Southern Missouri Statutory Trust I used the proceeds of the sale of the Trust Preferred Securities to purchase Junior Subordinated Debentures of Southern Missouri Bancorp. Southern Missouri Bancorp is using the net proceeds for working capital and investment in its subsidiaries. Trust Preferred Securities currently qualify as Tier I Capital for regulatory purposes. See "Regulation" for further discussion on the treatment of the trust-preferred securities.
In its October 2013 acquisition of Ozarks Legacy, the Company assumed $3.1 million in floating rate junior subordinated debt securities. The securities had been issued in June 2005 by Ozarks Legacy in connection with the sale of trust preferred securities, bear interest at a floating rate based on LIBOR, and mature in 2035. At June 30, 2021, the carrying value was $2.7 million, and bore interest at a current coupon rate of 2.57% and an effective rate of 3.95%.
In the Peoples Acquisition, the Company assumed $6.5 million in floating rate junior subordinated debt securities. The debt securities had been issued in 2005 by PBC in connection with the sale of trust preferred securities, bear interest at a floating rate based on LIBOR, are now redeemable at par, and mature in 2035. At June 30, 2021, the carrying value was $5.3 million and bore interest at a current coupon rate of 1.92% and an effective rate of 3.74%.
The following table sets forth certain information regarding short-term borrowings by the Bank at the end of and during the periods indicated:
| | | | | | | | | | |
|
| Year Ended June 30, |
| |||||||
|
| 2021 |
| 2020 |
| 2019 |
| |||
| | (Dollars in thousands) |
| |||||||
Year end balances |
| |
|
| |
|
| |
| |
Short-term FHLB advances | | $ | — | | $ | — | | $ | — | |
Securities sold under agreements to repurchase | |
| — | |
| — | |
| 4,376 | |
| | $ | — | | $ | — | | $ | 4,376 | |
| | | | | | | | | | |
Weighted average rate at year end | |
| — | % |
| — | % |
| 0.93 | % |
26
The following table sets forth certain information as to the Bank’s borrowings for the periods indicated:
| | | | | | | | | | |
|
| Year Ended June 30, |
| |||||||
|
| 2021 |
| 2020 |
| 2019 |
| |||
|
| (Dollars in thousands) | | |||||||
FHLB advances |
| |
|
| |
|
| |
| |
Daily average balance | | $ | 65,896 | | $ | 87,241 | | $ | 92,371 | |
Weighted average interest rate | |
| 2.07 | % |
| 2.21 | % |
| 2.57 | % |
Maximum outstanding at any month end | | $ | 85,678 | | $ | 123,452 | | $ | 154,100 | |
| | | | | | | | | | |
Securities sold under agreements to repurchase | |
|
| |
|
| |
|
| |
Daily average balance | | $ | — | | $ | 82 | | $ | 3,988 | |
Weighted average interest rate | |
| — | % |
| 0.03 | % |
| 0.90 | % |
Maximum outstanding at any month end | | $ | — | | $ | — | | $ | 4,703 | |
| | | | | | | | | | |
Subordinated Debt | |
|
| |
|
| |
|
| |
Daily average balance | | $ | 15,193 | | $ | 15,093 | | $ | 14,994 | |
Weighted average interest rate | |
| 3.51 | % |
| 5.22 | % |
| 6.14 | % |
Maximum outstanding at month end | | $ | 15,243 | | $ | 15,142 | | $ | 15,043 | |
Subsidiary Activities
The Bank has four subsidiaries, SMS Financial Services, Inc., which had no assets or liabilities at June 30, 2021, and is currently inactive, and SB Corning, LLC, SB Real Estate Investments, LLC, and Southern Insurance Services, LLC, which are active subsidiaries. SB Corning, LLC represents investment in a limited partnership formed for the purpose of generating low income housing tax credits. The initial investment in this subsidiary was $1.5 million, and at June 30, 2021, the carrying value of the investment was $847,000. SB Real Estate Investments, LLC is a wholly owned subsidiary of the Bank formed to hold Southern Bank Real Estate Investments, LLC. Southern Bank Real Estate Investments, LLC is a REIT which is majority-owned by the investment subsidiary, but has other preferred shareholders in order to meet the requirements to be a REIT. At June 30, 2021, SB Real Estate Investments, LLC held assets of approximately $1.1 billion Southern Bank Real Estate Investments, LLC also held assets of approximately $1.1 billion. Southern Insurance Services, LLC, is an entity acquired in the Gideon Acquisition, and is engaged in the brokerage of commercial and consumer insurance products. Assets held by this subsidiary are immaterial.
Employees and Human Capital Resources
As of June 30, 2021, the Company had 457 full-time employees and 31 part-time employees for a total of 488 employees (collectively, our “Team Members”). The Company believes that our Team Members play the most important role in the success of a service company like the Bank, and that the Company’s relationship with its Team Members is good. None of the Company’s Team Members are represented by a collective bargaining unit.
Our human capital objectives include attracting, developing, and retaining the best available talent from a diverse pool of candidates for our team. To do so, we maintain competitive pay and benefits, regularly updating our compensation structure and periodically working with outside consultants to review our compensation and benefit programs. Additionally, the Company’s training committee identifies opportunities and paths for development of our staff, and our Company seeks to, whenever possible, fill positions by promotion from within. Among our executive team, market presidents, regional retail officers, and administrative team, 63% of these leaders have been promoted to their position from within. Training opportunities include Team Member-directed pursuits, internally developed training programs, professional development conferences and seminars, as well as other programs or studies that are appropriate for Team Members based on their current position and career path.
27
We recognize the importance of our Team Members’ financial health, and offer benefits such as a 401(K) retirement savings plan and make both matching and profit-sharing contributions to that plan, which also includes the Company’s stock as an investment option. Our health benefit options include PPO and HSA-eligible coverage at affordable cost to participants.
We value and promote diversity and inclusion in every aspect of our business and at every level within the company. We recruit, hire, and promote employees based on their individual ability and experience and in accordance with Affirmative Action and Equal Employment Opportunity laws and regulations. Our policy is that we do not discriminate on the basis of race, color, religion, sex, gender, sexual orientation, ancestry, pregnancy, medical condition, age, marital status, national origin, citizenship status, disability, veteran status, gender identity, genetic information, or any other status protected by law. We believe that a sense of belonging is essential for providing a work environment where everyone can perform their very best. We are committed to fostering an environment that encourages diverse viewpoints, backgrounds and experiences.
We are committed to serving the communities where our Team Members live, work and play, believing that by strengthening our communities and demonstrating our commitment to them, we build relationships with existing and potential customers and with the larger community. We support our communities through a variety of sponsorships and financial contributions to non-profit agencies across our footprint. We also make Team Member involvement in our communities a priority, encourage Team Members to spend time supporting local organizations, and specifically budget funds each year to support local programs. We are proud of the efforts Team Members make to invest their time in their communities, and we appreciate the impact of that investment on the health of our communities and our organization.
The Company is committed to the overall wellbeing of our team members. In the COVID-19 pandemic, we have worked to implement state and local directives regarding public health, and encouraged Team Members to consider vaccination after visiting with their physicians or health professionals. In addition, we have provided additional paid time off for Team Members who have documented their vaccination status. We have encouraged department managers to complete work remotely where possible and limit in-person work in office in communities where transmission is elevated, and we have invested in and seen improvement in our team’s ability to work remotely. See Item 1, “Description of Business – COVID-19 Pandemic Response” for further discussion.
28
GOVERNMENT SUPERVISION AND REGULATION
The following is a brief description of certain laws and regulations applicable to the Company and the Bank. Descriptions of laws and regulations here and elsewhere in this prospectus do not purport to be complete and are qualified in their entirety by reference to the actual laws and regulations. Legislation is introduced from time to time in the United States Congress or the Missouri state legislature that may affect the operations of the Company and the Bank. In addition, the regulations governing us may be amended from time to time. Any such legislation or regulatory changes in the future could adversely affect our operations and financial condition.
Financial Regulatory Reform.
In 2010, the Dodd-Frank Wall Street Reform and Consumer Protection Act (the “Dodd-Frank Act”) imposed various restrictions and an expanded framework of regulatory oversight for financial institutions, including depository institutions and their holding companies.
In May 2018 the Economic Growth, Regulatory Relief and Consumer Protection Act (the “Act”), was enacted to modify or remove certain financial reform rules and regulations, including some of those implemented under the Dodd-Frank Act. While the Act maintains most of the regulatory structure established by the Dodd-Frank Act, it amends certain aspects of the regulatory framework for small depository institutions with assets of less than $10 billion and for large banks with assets of more than $50 billion. Many of these changes could result in meaningful regulatory relief for community banks such as the Bank.
The Act, among other matters, expands the definition of qualified mortgages which may be held by a financial institution and offers optional, simplified regulatory capital rules for financial institutions and their holding companies with total consolidated assets of less than $10 billion by instructing the federal banking regulators to establish a single Community Bank Leverage Ratio (“CBLR”) of between 8 and 10 percent. Effective January 1, 2020, the CBLR was 9.0%. However, the CBLR was temporarily reduced to 8.0% for 2020 and 8.5% for 2021, in response to the COVID-19 pandemic. Any qualifying depository institution or its holding company that exceeds the “community bank leverage ratio” will be considered to have met generally applicable leverage and risk-based regulatory capital requirements and any qualifying depository institution that exceeds the new ratio will be considered to be “well capitalized” under the prompt corrective action rules. The Act also expands the category of holding companies that may rely on the “Small Bank Holding Company and Savings and Loan Holding Company Policy Statement” (the “HC Policy Statement”) by raising the maximum amount of assets a qualifying holding company may have from $1 billion to $3 billion. This expansion also excludes such holding companies from the minimum capital requirements of the Dodd-Frank Act. In addition, the Act includes regulatory relief for community banks regarding regulatory examination cycles, call reports, the Volcker Rule (proprietary trading prohibitions), mortgage disclosures and consent filedrisk weights for certain high-risk commercial real estate loans.
The Coronavirus Aid, Relief, and Economic Security Act of 2020 (the “CARES ACT”). In response to the COVID-19 pandemic, the CARES Act was signed into law on March 27, 2020. The CARES Act directed federal banking agencies to adopt interim final rules to lower the threshold under the CBLR from 9.0% to 8.0% and to provide a reasonable grace period for a community bank that falls below the threshold to regain compliance. In April 2020, the federal banking agencies issued two interim final rules implementing this directive, and adopted the final rules effective November 2020. One final rule provides that, as of the second quarter 2020, banking organizations with leverage ratios of 8% or greater (and that meet the other existing qualifying criteria) may elect to use the CBLR framework. As noted above, the second final rule provides a transition from the temporary 8.0% CBLR requirement to a 9.0% CBLR requirement. It establishes a minimum CBLR of 8.0% for the second through fourth quarters of 2020, 8.5% for 2021, and 9.0% thereafter, and maintains a two-quarter grace period for qualifying community banking organizations whose leverage ratios fall no more than 100 basis points below the applicable CBLR requirement. The Company and the Bank have not made an election to utilize the CBLR framework, but will continue to monitor the available option, and could do so in the future.
The CARES Act also allowed banks to elect to suspend requirements under accounting principles generally accepted in the United States of America (“GAAP”) for loan modifications related to the COVID-19 pandemic that
29
would otherwise be categorized as a restructured loan, including impairment for accounting purposes, until the earlier of 60 days after the termination date of the national emergency or December 31, 2020. The 2021 Consolidated Appropriations Act (CAA) extended the relief until January 1, 2022. Under the CARES Act and related banking agency guidance, banks are not required to designate as a troubled debt restructuring loans that were modified as a result of the COVID-19 pandemic and made on a good faith basis to borrowers who were current. This includes short-term (e.g., six months) modifications such as payment deferrals, fee waivers, extensions of repayment terms, or other delays in payment that are insignificant. Borrowers are considered current under the CARES Act and related banking agency guidance if they were not more than 30 days past due on their contractual payments as of December 31, 2019, or prior to any relief, respectively, and have experienced financial difficulty as a result of COVID-19. For additional information related to loan modifications as a result of the COVID-19 pandemic, see “Item 1 – Description of Business” and “Item 7 – Management’s Discussion and Analysis of Financial Condition and Results of Operations.”
The CARES Act also authorized the Small Business Administration (“SBA”) to temporarily guarantee loans under a new loan program called the Paycheck Protection Program, or PPP. The CAA authorized additional PPP lending activity in 2021. The goal of the PPP was to prevent job losses and to encourage small businesses to maintain payrolls. Under both the initial and second rounds of PPP lending, the Company originated just over 3,200 loans totaling $197.2 million through the May 31, 2021, final expiration of the PPP. As of June 30, 2021, outstanding balances were $69.3 million, as the Company has processed a significant number of applications from borrowers for forgiveness.
The Bank
General. As a state-chartered, federally insured trust company with banking powers, the Bank is subject to extensive regulation. Lending activities and other investments must comply with various statutory and regulatory requirements, including prescribed minimum capital standards. The Bank is regularly examined by the FRB and the Missouri Division of Finance and files periodic reports concerning the Bank’s activities and financial condition with its regulators. The Bank’s relationship with depositors and borrowers also is regulated to a great extent by both federal law and the laws of Missouri, especially in such matters as the ownership of deposit accounts and the form and content of mortgage documents.
Federal and state banking laws and regulations govern all areas of the operation of the Bank, including reserves, loans, mortgages, capital, issuance of securities, payment of dividends, and establishment of branches. Federal and state bank regulatory agencies also have the general authority to limit the dividends paid by insured banks and bank holding companies if such payments should be deemed to constitute an unsafe and unsound practice, and in other circumstances. The FRB as the primary federal regulator of the Company and the Bank has authority to impose penalties, initiate civil and administrative actions and take other steps intended to prevent banks from engaging in unsafe or unsound practices.
State Regulation and Supervision. As a state-chartered trust company with banking powers, the Bank is subject to applicable provisions of Missouri law and the regulations of the Missouri Division of Finance. Missouri law and regulations govern the Bank’s ability to take deposits and pay interest thereon, to make loans on or invest in residential and other real estate, to make consumer loans, to invest in securities, to offer various banking services to its customers, and to establish branch offices.
Federal Reserve System. The FRB requires all depository institutions to maintain reserves at specified levels against their transaction accounts (checking, NOW and Super NOW checking accounts). These reserves may be in the form of cash or deposits with the original Form 10-K.institution’s regional Federal Reserve Bank. Effective March 26, 2020, the FRB reduced the reserve requirement ratio to 0% for all account types, eliminating reserve requirements for all depository institutions.
The Bank is authorized to borrow from the Federal Reserve Bank "discount window." The purpose of the discount window is to provide an additional backstop funding option for eligible depository institutions seeking to supplement their funding sources, particularly to meet unexpected short-term funding needs. Depository institutions like the Bank would typically utilize FHLB borrowings before borrowing from the Federal Reserve Bank’s discount window.
30
Federal Home Loan Bank System. The Bank is a member of the FHLB of Des Moines, which is one of 11 regional FHLBs that provide home financing credit. Each FHLB serves as a reserve or central bank for its members within its assigned region. It is funded primarily from proceeds derived from the sale of consolidated obligations of the FHLB System and makes loans or advances to members in accordance with policies and procedures established by the Board of Directors of the FHLB of Des Moines, which are subject to the oversight of the Federal Housing Finance Agency. All advances from the FHLB are required to be fully secured by sufficient collateral as determined by the FHLB. In addition, all long-term advances are required to provide funds for residential home financing. See Business - Deposit Activities and Other Sources of Funds - Borrowings.
As a member, the Bank is required to purchase and maintain stock in the FHLB of Des Moines. At June 30, 2021, the Bank had $5.9 million in FHLB stock, which was in compliance with this requirement. The Bank received $269,000 and $337,000 in dividends from the FHLB of Des Moines for the years ended June 30, 2021 and 2020, respectively.
The FHLBs continue to contribute to low- and moderately-priced housing programs through direct loans or interest subsidies on advances targeted for community investment and low- and moderate-income housing projects. These contributions have adversely affected the level of FHLB dividends paid and could continue to do so in the future. These contributions could also have an adverse effect on the value of FHLB stock in the future. A reduction in value of the Bank’s FHLB stock may result in a corresponding reduction in the Bank’s capital.
Federal Deposit Insurance Corporation. The Bank’s deposits are insured up to applicable limits by the Deposit Insurance Fund (“DIF”) of the FDIC. The general insurance limit is $250,000. As insurer, the FDIC imposes deposit insurance premiums and is authorized to conduct examinations of and to require reporting by FDIC-insured institutions. It also may prohibit any FDIC-insured institution from engaging in any activity the FDIC determines by regulation or order to pose a serious risk to the DIF. The FDIC also has the authority to initiate enforcement actions against a member bank of the FRB after giving the FRB an opportunity to take such action.
In accordance with the Dodd-Frank Act, the FDIC has issued regulations setting insurance premium assessments based on an institution’s total assets minus its Tier 1 capital instead of its deposits. The Bank’s FDIC premiums are based on its supervisory ratings and certain financial ratios. Federal law required that the reserve ratio of the FDIC deposit insurance fund reach at least 1.35% by September 2020, and that depository institutions with consolidated assets of $10 billion or less receive assessment credits for the portion of their assessments that contributed to the growth of the reserve ratio from between 1.15% and 1.35%, to be applied when the reserve ratio is at or above 1.38%. Subsequent rule-making provided that the assessment credits were to be applied so long as the ratio remained above 1.35%. In September 2019, the Deposit Insurance Fund Reserve Ratio reached 1.40%, exceeding the required minimum reserve ratio to provide for receipt of assessment credits. As a result, the FDIC applied credits to the Bank’s assessments due in fiscal 2020, resulting in a reduced expense recognition for the 2020 fiscal year. The Bank’s credits were fully utilized as of June 30, 2020, and expense recognition for deposit insurance premiums returned to normalized levels in fiscal 2021.
Insurance of deposits may be terminated by the FDIC upon a finding that the institution has engaged in unsafe or unsound practices, is in an unsafe or unsound condition to continue operations or has violated any applicable law, regulation, rule, order or condition imposed by the FDIC. Management of the Bank is not aware of any practice, condition or violation that might lead to termination of the Bank’s deposit insurance.
In addition to the assessment for deposit insurance, institutions were required for many years to make payments on bonds issued in the late 1980s by the Financing Corporation to recapitalize a predecessor deposit insurance fund. The final bonds matured in calendar year 2019, and the Bank did not recognize expense related to the Financing Corporation in fiscal 2020 or 2021.
Standards for Safety and Soundness. The federal banking regulatory agencies have prescribed, by regulation, standards for all insured depository institutions relating to: (i) internal controls, information systems and internal audit systems; (ii) loan documentation; (iii) credit underwriting; (iv) interest rate risk exposure; (v) asset growth; (vi) asset quality; (vii) earnings; and (viii) compensation, fees and benefits ("Guidelines"). The Guidelines set forth the safety and
31
soundness standards that the federal banking agencies use to identify and address problems at insured depository institutions before capital becomes impaired. If the FRB determines that the Bank fails to meet any standard prescribed by the Guidelines, the agency may require the Bank to submit to the agency an acceptable plan to achieve compliance with the standard.
Guidance on Subprime Mortgage Lending. The federal banking agencies have issued guidance on subprime mortgage lending to address issues related to certain mortgage products marketed to subprime borrowers, particularly adjustable rate mortgage products that can involve "payment shock" and other risky characteristics. Although the guidance focuses on subprime borrowers, the banking agencies note that institutions should look to the principles contained in the guidance when offering such adjustable rate mortgages to non-subprime borrowers. The guidance prohibits predatory lending programs; provides that institutions should underwrite a mortgage loan on the borrower’s ability to repay the debt by its final maturity at the fully-indexed rate, assuming a fully amortizing repayment schedule; encourages reasonable workout arrangements with borrowers who are in default; mandates clear and balanced advertisements and other communications; encourages arrangements for the escrowing of real estate taxes and insurance; and states that institutions should develop strong control and monitoring systems.
The federal banking agencies have announced their intention to carefully review the risk management and consumer compliance processes, policies and procedures of their supervised financial institutions and their intention to take action against institutions that engage in predatory lending practices, violate consumer protection laws or fair lending laws, engage in unfair or deceptive acts or practices, or otherwise engage in unsafe or unsound lending practices.
Guidance on Commercial Real Estate Concentrations. The federal banking agencies have issued guidance on sound risk management practices for concentrations in commercial real estate lending. The particular focus is on exposure to commercial real estate loans that are dependent on the cash flow from the real estate held as collateral and that are likely to be sensitive to conditions in the commercial real estate market (as opposed to real estate collateral held as a secondary source of repayment or as an abundance of caution). The purpose of the guidance is not to limit a bank’s commercial real estate lending but to guide banks in developing risk management practices and maintaining capital levels commensurate with the level and nature of real estate concentrations. A bank that has experienced rapid growth in commercial real estate lending, has notable exposure to a specific type of commercial real estate loan, or is approaching or exceeding the following supervisory criteria may be identified for further supervisory analysis with respect to real estate concentration risk: total loans for construction, land development, and other land represent 100% or more of the bank’s total capital; or total commercial real estate loans (as defined in the guidance) greater than 300% of the Bank’s total capital and an increase in the bank’s commercial real estate portfolio of 50% or more during the prior 36 months.
Regulatory Capital Requirements. The Bank is required to maintain specified levels of regulatory capital under federal banking regulations. The capital adequacy requirements are quantitative measures established by regulation that require the Bank to maintain minimum amounts and ratios of capital. Failure to meet minimum capital requirements can initiate certain mandatory and possibly additional discretionary actions by bank regulators that, if undertaken, could have a direct material effect on the Company’s financial statements.
Effective January 1, 2015, (with some changes transitioned into full effectiveness on January 1, 2019), the Bank became subject to capital regulations which created required minimum ratio for common equity Tier 1 (“CET1”) capital, Tier 1 capital and total capital and the minimum leverage ratio; established risk-weightings for assets and certain off-balance sheet items for purposes of the risk-based capital ratios; required an additional capital conservation buffer over the minimum risk-based capital ratios; and defined what qualifies as capital for purposes of meeting the capital requirements. These regulations implement the regulatory capital reforms required by the Dodd Frank Act and the “Basel III” requirements.
Under applicable capital regulations, the minimum capital ratios are: (1) a CET1 capital ratio of 4.5% of risk-weighted assets; (2) a Tier 1 capital ratio of 6.0% of risk-weighted assets; (3) a total capital ratio of 8.0% of risk-weighted assets; and (4) a leverage ratio (the ratio of Tier 1 capital to average total adjusted assets) of 4.0%. CET1 generally consists of common stock; retained earnings; accumulated other comprehensive income (“AOCI”) except in the case of banking organizations that have elected to exclude AOCI from regulatory capital, as discussed below; and certain minority interests; all subject to applicable regulatory adjustments and deductions.
32
In addition to the capital requirements, there were a number of changes in what constitutes regulatory capital compared to earlier regulations, subject to transition periods. These changes include the phasing-out of certain instruments as qualifying capital. Mortgage servicing and deferred tax assets over designated percentages of CET1 are deducted from capital. In addition, Tier 1 capital includes AOCI, which includes all unrealized gains and losses on available for sale debt and equity securities. Because of our asset size, we had the one-time option of deciding whether to permanently opt-out of the inclusion of unrealized gains and losses on available for sale debt and equity securities in our capital calculations. We made the decision to opt out.
In addition to the minimum CET1, Tier 1 and total capital ratios, the capital regulations require a capital conservation buffer consisting of additional CET1 capital greater than 2.5% of risk-weighted assets above the required minimum risk-based in order to avoid limitations on paying dividends, engaging in share repurchases and paying discretionary bonuses based on percentages of eligible retained income that could be utilized for such actions. The phase-in of the capital conservation buffer requirement began on January 1, 2016, when a buffer greater than 0.625% of risk-weighted assets was required, which amount increased by 0.625% each year until the buffer requirement was fully implemented on January 1, 2019. At June 30, 2021, the Bank and the Company reported risk-based capital ratios meeting the capital conservation buffer.
Under the prompt corrective action standards of the FRB, in order to be considered well-capitalized, the Bank must have a ratio of CET1 capital to risk-weighted assets of at least 6.5%, a ratio of Tier 1 capital to risk-weighted assets of at least 8%, a ratio of total capital to risk-weighted assets of at least 10%, and a leverage ratio of at least 5%; and in order to be considered adequately capitalized, it must have the minimum capital ratios described above. To be considered well-capitalized a bank holding company must have, on a consolidated basis, at least a Tier 1 risk-based capital ratio of at least 8% and a total risk-based capital ratio of at least 10% and not be subject to a higher enforceable individualized capital requirement. At June 30, 2021, the Bank and the Company were categorized as “well capitalized” under these prompt corrective action standards.
Activities and Investments of Insured State-Chartered Banks. Subject to certain regulatory exceptions, the FDIA and FDIC regulations provide that an insured state-chartered bank may not, directly, or indirectly through a subsidiary, engage as "principal" in any activity that is not permissible for a national bank unless the FDIC has determined that such activities would pose no risk to the Deposit Insurance Fund and that the bank is in compliance with this Amendment No. 1applicable regulatory capital requirements.
Under regulations dealing with equity investments, an insured state bank generally may not directly or indirectly acquire or retain any equity investment of a type, or in an amount, that is not permissible for a national bank. An insured state bank is not prohibited from, among other things, (i) acquiring or retaining a majority interest in a subsidiary, (ii) investing as a limited partner in a partnership the sole purpose of which is direct or indirect investment in the acquisition, rehabilitation or new certificationsconstruction of a qualified housing project, provided that such limited partnership investments may not exceed 2% of the bank’s total assets, (iii) acquiring up to 10% of the voting stock of a company that solely provides or reinsures directors’, trustees’ and officers’ liability insurance coverage or bankers’ blanket bond group insurance coverage for insured depository institutions, and (iv) acquiring or retaining the voting shares of a depository institution if certain requirements are met.
Affiliate Transactions. The Company and the Bank are separate and distinct legal entities. Various legal limitations restrict the Bank from lending to or otherwise engaging in transactions with the Company (or any other affiliate), generally limiting such transactions with an affiliate to 10% of the Bank’s capital and surplus and limiting all such transactions with all affiliates to 20% of the Bank’s capital and surplus. Such transactions, including extensions of credit, sales of securities or assets and provision of services, also must be on terms and conditions consistent with safe and sound banking practices, including credit standards, that are substantially the same or at least as favorable to the Bank as those prevailing at the time for transactions with unaffiliated companies.
Federally insured banks are subject, with certain exceptions, to certain additional restrictions (including collateralization) on extensions of credit to their parent holding companies or other affiliates, on investments in the stock or other securities of affiliates and on the taking of such stock or securities as collateral from any borrower. In addition,
33
such banks are prohibited from engaging in certain tying arrangements in connection with any extension of credit or the providing of any property or service.
Community Reinvestment Act. Banks are also subject to the provisions of the Community Reinvestment Act of 1977 ("CRA"), which requires the appropriate federal bank regulatory agency, in connection with its regular examination of a bank, to assess the bank’s record in meeting the credit needs of the community serviced by the bank, including low and moderate income neighborhoods. The regulatory agency’s assessment of the bank’s record is made available to the public. Further, such assessment is required of any bank which has applied, among other things, to establish a new branch office that will accept deposits, relocate an existing office or merge or consolidate with, or acquire the assets or assume the liabilities of, a financial institution. The Bank received a "satisfactory" rating during its most recent CRA examination.
In July 2021, the FDIC, the Federal Reserve Board and the Office of the Comptroller of the Currency announced plans to jointly work to “strengthen and modernize” the CRA regulations and the related regulatory framework. No timetable for a rulemaking process was announced.
Dividends. Dividends from the Bank constitute the major source of funds for dividends that may be paid by Rules 13a-14(a)the Company. The amount of dividends payable by the Bank to the Company depends upon the Bank’s earnings and 13a-14(b)capital position, and is limited by federal and state laws, regulations and policies.
The amount of dividends actually paid by the Bank during any one period will be strongly affected by the Bank’s management policy of maintaining a strong capital position. Dividends can be restricted if the capital conservation buffer is not maintained as described under “Capital Rules” above.
A bank holding company is required to give the FRB prior written notice of any purchase or redemption of its outstanding equity securities if the gross consideration for the purchase or redemption, when combined with the net consideration paid for all such purchases or redemptions during the preceding 12 months, is equal to 10% or more of the company’s consolidated net worth. The FRB may disapprove such a purchase or redemption if it determines that the proposal would constitute an unsafe or unsound practice or would violate any law, regulation, FRB order, or any condition imposed by, or written agreement with, the FRB. This notification requirement does not apply to any company that meets the well-capitalized standard for bank holding companies, is well-managed, and is not subject to any unresolved supervisory issues.
Under Missouri law, the Bank may pay dividends from certain undivided profits and may not pay dividends if its capital is impaired.
Bank Secrecy Act / Anti-Money Laundering Laws. The Bank is subject to the Bank Secrecy Act and other anti-money laundering laws and regulations, including the USA PATRIOT Act of 2001. These laws and regulations require the Bank to implement policies, procedures, and controls to detect, prevent, and report money laundering and terrorist financing and to verify the identity of their customers. Violations of these requirements can result in substantial civil and criminal sanctions. In addition, provisions of the USA PATRIOT Act require the federal financial institution regulatory agencies to consider the effectiveness of a financial institution's anti-money laundering activities when reviewing mergers and acquisitions.
The Company
Federal Securities Law. The stock of the Company is registered with the SEC under the Securities Exchange Act of 1934, as amended (the "Exchange Act"). As such, the Company is subject to the information, proxy solicitation, insider trading restrictions and other requirements of the SEC under the Exchange Act.
The Company’s stock held by persons who are affiliates (generally officers, directors and principal stockholders) of the Company may not be resold without registration or unless sold in accordance with certain resale restrictions. If the Company meets specified current public information requirements, each affiliate of the Company is able to sell in the public market, without registration, a limited number of shares in any three-month period.
34
Bank Holding Company Regulation. Bank holding companies are subject to comprehensive regulation by the FRB under the Bank Holding Company Act (“BHCA”). As a bank holding company, the Company is required to file reports with the FRB and such additional information as the FRB may require, and the Company and its non-banking affiliates are subject to examination by the FRB. Under FRB policy, a bank holding company must serve as a source of financial strength for its subsidiary banks. Under this policy the FRB may require, and has required in the past, a holding company to contribute additional capital to an updatedundercapitalized subsidiary bank. Under the Dodd-Frank Act, this policy is codified and rules to implement it are to be established. Under the BHCA, a bank holding company must obtain FRB approval before: (i) acquiring, directly or indirectly, ownership or control of any voting shares of another bank or bank holding company if, after such acquisition, it would own or control more than 5% of such shares (unless it already owns or controls the majority of such shares); (ii) acquiring all or substantially all of the assets of another bank or bank holding company; or (iii) merging or consolidating with another bank holding company.
The Company is subject to the activity limitations imposed on bank holding companies that are not financial holding companies. The BHCA prohibits a bank holding company, with certain exceptions, from acquiring direct or indirect ownership or control of more than 5% of the voting shares of any company which is not a bank or bank holding company, or from engaging directly or indirectly in activities other than those of banking, managing or controlling banks, or providing services for its subsidiaries. The principal exceptions to these prohibitions involve certain activities which are permitted, by statute or by FRB regulation or order, have been identified as activities closely related to the business of banking or managing or controlling banks. The list of exhibitsactivities permitted by the FRB includes, among other things, operating a savings institution, mortgage company, finance company, credit card company or factoring company; performing certain data processing operations; providing certain investment and financial advice; underwriting and acting as an insurance agent for certain types of credit-related insurance; leasing property on a full-payout, non-operating basis; selling money orders, travelers’ checks and United States Savings Bonds; real estate and personal property appraising; providing tax planning and preparation services; and, subject to certain limitations, providing securities brokerage services for customers.
TAXATION
Federal Taxation
General. The Company and the Bank report their income on a fiscal year basis using the accrual method of accounting and are subject to federal income taxation in the same manner as other corporations with some exceptions, including particularly the Bank’s reserve for bad debts discussed below. The following discussion of tax matters is intended only as a summary and does not purport to be a comprehensive description of the tax rules applicable to the Bank or the Company.
Bad Debt Reserve. Historically, savings institutions, such as the Bank used to be, which met certain definitional tests primarily related to their assets and the nature of their business ("qualifying thrift"), were permitted to establish a reserve for bad debts and to make annual additions thereto, which may have been deducted in arriving at their taxable income. The Bank’s deductions with respect to their loans, which are generally loans secured by certain interests in real property, historically has been computed using an amount based on the Bank’s actual loss experience, in accordance with IRC Section 585(B)(2). Due to the Bank’s loss experience, the Bank generally recognized a bad debt deduction equal to their net charge-offs.
The Bank’s average assets for the current year exceeded $500 million, thus classifying it as a large bank for purposes of IRC Section 585. Under IRC Section 585(c)(3), a bank that becomes a large bank must change its method of accounting from the reserve method to a specific charge-off method under IRC Section 166. The Bank’s deductions with respect to their loans are computed under the specific charge-off method. The specific charge-off method has been used in the current year and will be used in all subsequent tax years.
Dividends-Received Deduction. The Company may exclude from its income 100% of dividends received from the Bank as a member of the same affiliated group of corporations. The corporate dividends-received deduction is generally 50% in the case of dividends received from unaffiliated corporations with which the Company and the Bank will not file a consolidated tax return, except that if the Company or the Bank owns more than 20% of the stock of a corporation distributing a dividend, then 65% of any dividends received may be deducted.
35
Missouri Taxation
General. Missouri-based banks, such as the Bank, are subject to a Missouri bank franchise and income tax.
Bank Franchise Tax. The Missouri bank franchise tax is imposed on (i) the bank’s taxable income at the rate of 4.48%, less credits for certain Missouri taxes, including income taxes. However, the credits exclude taxes paid for real estate, unemployment taxes, bank tax, and taxes on tangible personal property owned by the Bank and held for lease or rentals to others - income-based calculation; and (ii) the bank’s net assets at a rate of .007%. Net assets are defined as total assets less deposits and the investment in greater than 50% owned subsidiaries - asset-based calculation.
Income Tax. The Bank and its holding company and related subsidiaries are subject to an income tax that is imposed on the consolidated taxable income apportioned to Missouri at the rate of 4.0%. The return is filed on a consolidated basis by all members of the consolidated group including the Bank.
Arkansas Taxation
General. Due to its loan activity and the acquisitions of Arkansas banks in recent periods, the Bank is subject to an Arkansas income tax. The tax is imposed on the Bank’s apportioned taxable income at a rate of 6%.
Illinois Taxation
General. Due to its loan activity and the acquisitions of Illinois banks in recent periods, the Bank is subject to an Illinois income tax. The tax is imposed on the Bank’s apportioned taxable income at a rate of 9.5%.
Audits
The Company’s Missouri income tax returns for the fiscal years ending June 30, 2016 through 2018 are under audit by the Missouri Department of Revenue. There have been no IRS or other state audits of the Company’s federal or state income tax returns during the past five years.
For additional information regarding taxation, see Note 9 of Notes to the Consolidated Financial Statements contained in Item 15,8.
INTERNET WEBSITE
We maintain a website with the address of www.bankwithsouthern.com. The information contained on our website is not included as a part of, or incorporated by reference into, this Amendment No. 1 does not modify, or update any other disclosures contained in, our original Annual Report on Form 10-K. This Annual Report on Form 10-K and our other reports, proxy statements and other information, including earnings press releases, filed with the SEC are available at http://investors.bankwithsouthern.com. For more information regarding access to these filings on our website, please contact our Corporate Secretary, Southern Missouri Bancorp, Inc., 2991 Oak Grove Road, Poplar Bluff, Missouri, 63901; telephone number (573) 778-1800.
36
Item 1A. Risk Factors
An investment in our securities is subject to inherent risks. Before making an investment decision, you should carefully consider the risks and uncertainties described below together with all of the other information included in this report. In addition to the risks and uncertainties described below, other risks and uncertainties not currently known to us or that we currently deem to be immaterial also may materially and adversely affect our business, financial condition and results of operations. The value or market price of our securities could decline due to any of these identified or other risks, and you could lose all or part of your investment.
Risks Relating to the Company and the Bank
Risks Relating to Marco Economic Conditions
The COVID-19 pandemic has adversely impacted our ability to conduct business and is expected to adversely impact our financial results and those of our customers. The ultimate impact will depend on future developments, which are highly uncertain and cannot be predicted, including the scope and duration of the pandemic and actions taken by governmental authorities in response to the pandemic.
The COVID-19 pandemic has significantly adversely affected our operations and the way we provide banking services to businesses and individuals, some of whom are currently, and many of whom have recently been under government issued stay-at-home orders. As an essential business, we have continued to provide banking and financial services to our customers, at times with only drive-thru service available our facilities. After re-opening our lobbies, we have again moved to only drive-thru service in some communities due to unavailability of team members complying with quarantine orders from local health authorities. In addition, we have continued to provide access to banking and financial services through online and mobile banking, ATMs and by telephone. If the COVID-19 pandemic worsens, it could limit or disrupt our ability to provide banking and financial services to our customers.
To help limit risk of spread within our teams, many of our employees currently are or have been working remotely to enable the Company to continue to provide banking services to our customers. Heightened cybersecurity, information security, and operational risks may result from these remote work-from-home arrangements. Despite the fact that we continue to train employees, examine opportunities to strengthen the security of our IT network, and utilize third party auditors, there can be no guarantee that we will fully eliminate these risks. We also could be adversely affected if key personnel or a significant number of employees were to become unavailable due to the effects and restrictions of the COVID-19 pandemic. We also rely upon our third-party vendors to conduct business and to process, record and monitor transactions. If any of these vendors are unable to continue to provide us with these services, it could negatively impact our ability to serve our customers. Although we have business continuity plans and other safeguards in place, there is no assurance that such plans and safeguards will be effective.
There is a pervasive uncertainty surrounding the future economic conditions that will emerge in the months and years following the onset of the pandemic. As a result, management is confronted with a significant and unfamiliar degree of uncertainty in estimating the impact of the pandemic on credit quality, revenues and asset values. To date, throughout the industry, the COVID-19 pandemic has resulted in declines in loan demand and loan originations (other than through government sponsored programs, such as the Payroll Protection Program) and market interest rates, and it has negatively impacted some of our business and consumer borrowers’ ability or willingness to make their loan payments timely. Because the length of the pandemic and the efficacy of the extraordinary measures being put in place to address its economic consequences are unknown, including recent reductions in the targeted federal funds rate, until the pandemic subsides, we expect our net interest income and net interest margin may be adversely affected in the near term, if not longer. Some of our borrowers have become unemployed or may face unemployment, and certain businesses may be at risk of insolvency due to declines in revenue, especially in businesses related to travel, hospitality, leisure and physical personal services.
The impact of the pandemic may continue to adversely affect us during our 2022 fiscal year and possibly longer as loan demand, market interest rates, and the ability of some customers to make timely loan payments has been significantly affected. Although the Company makes estimates of credit losses related to the pandemic as part of its
37
evaluation of the allowance for credit losses, such estimates involve significant judgment and are made in the context of continued uncertainty as to the impact the pandemic will have on the credit quality of our loan portfolio. It is possible that increased loan delinquencies, adversely classified loans and loan charge-offs could result in the future due to the pandemic. Consistent with guidance provided by banking regulators, we have modified loans by providing various loan payment deferral options to our borrowers affected by the COVID-19 pandemic. Notwithstanding these modifications, these borrowers may not be able to resume making full payments on their loans as the COVID-19 pandemic subsides. Any increases in the allowance for credit losses will result in a decrease in net income, and, most likely, capital, and may have a material negative effect on our financial condition and results of operations.
The PPP loans made by the Bank are guaranteed by the SBA and, if used by the borrower for authorized purposes, may be fully forgiven. However, in the event of a loss resulting from a default on a PPP loan and a determination by the SBA that there was a deficiency in the manner in which the PPP loan was originated, funded or serviced by the Bank, the SBA may deny its liability under the guaranty, reduce the amount of the guaranty, or, if it has already made payment under the guaranty, seek recovery of any loss related to the deficiency from the Bank. In addition, several larger banks were subject to litigation regarding their processing of PPP loan applications. The Bank could be exposed to the risk of similar litigation, from both customers and non-customers that approached the Bank seeking PPP loans. PPP lenders, including the Bank, may also be subject to the risk of litigation in connection with other aspects of the PPP, including but not limited to borrowers seeking forgiveness of their loans. If any such litigation is filed against the Bank, it may result in significant financial or reputational harm to us.
In accordance with U.S. GAAP, we record assets acquired and liabilities assumed at their fair value with the excess of the purchase consideration over the net assets acquired resulting in the recognition of goodwill. If adverse economic conditions or the recent decrease in our stock price and market capitalization as a result of the pandemic were to be deemed sustained rather than temporary, it may significantly affect the fair value of our goodwill and may trigger impairment charges. Any impairment charge could have a material adverse effect on our results of operations and financial condition. Goodwill has been evaluated during fiscal year 2021, as well as for triggering events at June 30, 2021, and it was determined that goodwill was not impaired.
Even after the COVID-19 pandemic subsides, the U.S. economy will likely require some time to recover from its effects, the length of which is unknown, and during which we may experience a recession. As a result, we anticipate our business may be materially and adversely affected during this recovery. To the extent the COVID-19 pandemic adversely impacts our business, financial condition, liquidity, or results of operations, it may also have the effect of heightening many of the other risks described in this section.
Changes in economic conditions, particularly an economic slowdown in southern Missouri or northern Arkansas, could hurt our business.
Our business is directly affected by market conditions, trends in industry and finance, legislative and regulatory changes, and changes in governmental monetary and fiscal policies and inflation, all of which are beyond our control. Future deterioration in economic conditions, particularly within our primary market area in southern Missouri and northern Arkansas, could result in the following consequences, among others, any of which could hurt our business materially:
| ● | loan delinquencies may increase; |
| ● | problem assets and foreclosures may increase; |
| ● | demand for our products and services may decline; |
| ● | loan collateral may decline in value, in turn reducing a customer’s borrowing power and reducing the value of collateral securing our loans; and |
| ● | the net worth and liquidity of loan guarantors may decline, impairing their ability to honor commitments to us. |
38
Downturns in the real estate markets in our primary market area could hurt our business.
Our business activities and credit exposure are primarily concentrated in southern Missouri and northern Arkansas. While we did not and do not have a sub-prime lending program, our residential real estate, construction and land loan portfolios, our commercial and multi-family loan portfolios and certain of our other loans could be affected by the downturn in the real estate market. We anticipate that significant declines in the real estate markets in our primary market area would hurt our business and would mean that collateral for our loans would hold less value. As a result, our ability to recover on defaulted loans by selling the underlying real estate would be diminished, and we would be more likely to suffer losses on defaulted loans. The events and conditions described in this risk factor could therefore have a material adverse effect on our business, results of operations and financial condition.
Risks Relating to Credit and Lending Activities
Our allowance for credit losses may be insufficient to absorb losses in our loan portfolio.
Lending money is a substantial part of our business. Every loan carries a certain risk that it will not be repaid in accordance with its terms or that any underlying collateral will not be sufficient to ensure repayment. This risk is affected by, among other things:
| ● | cash flow of the borrower and/or the project being financed; |
| ● | in the case of a collateralized loan, the changes and uncertainties as to the future value of the collateral; |
| ● | the credit history of a particular borrower; |
| ● | changes in economic and industry conditions; and |
| ● | the duration of the loan. |
We maintain an allowance for credit losses which we believe is appropriate to provide for expected losses over the life of loans in our portfolio. The amount of this allowance is determined by our management through a periodic review and consideration of several factors, including, but not limited to:
| ● | historical default and loss experience; |
| ● | historical recovery experience; |
| ● | economic conditions; |
| ● | evaluation of non-performing loans; |
| ● | the amount and quality of collateral, including guarantees, securing the loans. |
| ● | risk characteristics of the various classifications of loans; and |
| ● | the rate of growth, quality, size and diversity of the loan portfolio; |
If actual credit losses exceed the projections modeled in arriving at our estimate of the allowance for credit losses, our business, financial condition and profitability may suffer.
The Financial Accounting Standards Board (FASB), adopted Accounting Standards Update (ASU), 2016-13 “Financial Instruments—Credit Losses (Topic 326): Measurement of Credit Losses on Financial Instruments,” on June 16, 2016, which changed previous allowance for loan losses methodology to consider current expected credit losses (CECL). This accounting pronouncement was applicable to us effective for our fiscal year beginning July 1, 2020. The federal banking regulators, including the Federal Reserve have adopted rules that gives a banking organization the option to phase in over a three-year or five-year period the day-one adverse effects of CECL on its regulatory capital. We elected the five-year period for our Company.
39
CECL has substantially changed how we calculate our allowance for credit losses. We have adopted CECL and prepared our consolidated financial statements based on the required methodology; however we cannot predict how it will affect our results of operations and financial condition over time, including our regulatory capital. In general, expectations are that the CECL methodology will lead to increased volatility in banking organizations’ required level of allowances at different points in the economic cycle, and in their results of operations.
If our nonperforming assets increase, our earnings will be adversely affected.
At June 30, 2021 and June 30, 2020, our nonperforming assets were $8.1 million and $11.2 million, respectively, or 0.30% and 0.44% of total assets, respectively. Our nonperforming assets adversely affect our net income in various ways:
| ● | We do not accrue interest income on nonaccrual loans, nonperforming investment securities, or other real estate owned. |
| ● | We must provide for expected credit losses through a current period charge to the provision for credit losses. |
| ● | Non-interest expense increases when we must write down the value of properties in our other real estate owned portfolio to reflect changing market values. |
| ● | There are legal fees associated with the resolution of problem assets, as well as carrying costs, such as taxes, insurance, and maintenance fees related to our other real estate owned. |
| ● | The resolution of nonperforming assets requires the active involvement of management, which can divert management’s attention from more profitable activities. |
If additional borrowers become delinquent and do not pay their loans and we are unable to successfully manage our nonperforming assets, our losses and troubled assets could increase significantly, which could have a material adverse effect on our financial condition and results of operations. See also “Regulation – Regulatory Capital Requirements.”
Our construction lending exposes us to significant risk.
Our construction loan portfolio, which totaled $208.8 million, or 9.49% of loans, net, at June 30, 2021, includes residential and non-residential construction and development loans. Construction and development lending, especially non-residential construction and development lending, is generally considered to have more complex credit risks than traditional single-family residential lending because the principal is concentrated in a limited number of loans with repayment dependent on the successful completion and sale, leasing, or operation of the related real estate project. Consequently, these loans are often more sensitive to adverse conditions in the real estate market or the general economy than other real estate loans. These loans are generally less predictable and more difficult to evaluate and monitor and collateral may be difficult to dispose of in a market decline. Additionally, we may experience significant construction loan losses because independent appraisers or project engineers inaccurately estimate the cost or value of construction loan projects.
Deterioration in our construction portfolio could result in increases in the provision for credit losses and an increase in charge-offs, all of which could have a material adverse effect on our financial condition and results of operations.
40
Our loan portfolio possesses increased risk due to our percentage of commercial real estate and commercial business loans.
At June 30, 2021, 59.3% of our loans, net, consisted of commercial real estate and commercial business loans to small and mid-sized businesses, generally located in our primary market area, which are the types of businesses that have a heightened vulnerability to local economic conditions. Over the last ten years, we have increased this type of lending from 56.0% of our portfolio at June 30, 2011, to 59.3% of our portfolio at June 30, 2021, in order to improve the yield on our assets. At June 30, 2021, our loan portfolio included $889.8 million of commercial real estate loans and $414.1 million of commercial business loans compared to $887.4 million and $468.4 million, respectively, at June 30, 2020. The credit risk related to these types of loans is considered to be greater than the risk related to one- to four-family residential loans because the repayment of commercial real estate loans and commercial business loans typically is dependent on the successful operation and income stream of the borrower’s business or the real estate securing the loans as collateral, which can be significantly affected by economic conditions. Additionally, commercial loans typically involve larger loan balances to single borrowers or groups of related borrowers compared to residential real estate loans. Commercial loans not collateralized by real estate are often secured by collateral that may depreciate over time, be difficult to appraise and fluctuate in value (such as accounts receivable, inventory and equipment). If loans that are collateralized by real estate become troubled and the value of the real estate has been significantly impaired, then we may not be able to recover the full contractual amount of principal and interest that we anticipated at the time we originated the loan, which could require us to increase our provision for credit losses and adversely affect our operating results and financial condition.
Several of our commercial borrowers have more than one commercial real estate or business loan outstanding with us. Consequently, an adverse development with respect to a single loan or credit relationship can expose us to significantly greater risk of loss compared to an adverse development with respect to a single one- to four-family residential mortgage loan. Finally, if we foreclose on a commercial real estate loan, our holding period for the collateral, if any, typically is longer than for one- to four-family residential property because there are fewer potential purchasers of the collateral. Since we plan to continue to increase our originations of these loans, it may be necessary to increase the level of our allowance for credit losses due to the increased risk characteristics associated with these types of loans. Any increase to our provision credit loan losses would adversely affect our operating results and financial condition. Any delinquent payments or the failure to repay these loans would hurt our operating results and financial condition.
Our loan portfolio possesses risk due to our agricultural lending.
Included in the commercial real estate loans described above are agricultural real estate loans totaling $180.6 million, or 8.2% of our loan portfolio, net, at June 30, 2021. Agricultural real estate lending involves a greater degree of risk and typically involves larger loans to single borrowers than lending on single-family residences. Payments on agricultural real estate loans are dependent on the profitable operation or management of the farm property securing the loan. The success of the farm may be affected by many factors outside the control of the farm borrower, including adverse weather conditions that prevent the planting of a crop or limit crop yields (such as hail, drought and floods), loss of livestock due to disease or other factors, declines in market prices for agricultural products (both domestically and internationally) and the impact of government regulations (including changes in price supports, subsidies, and environmental regulations). In addition, many farms are dependent on a limited number of key individuals whose injury or death may significantly affect the successful operation of the farm. If the cash flow from a farming operation is diminished, the borrower’s ability to repay the loan may be impaired. The primary agricultural activity in our market areas is livestock, dairy, poultry, rice, timber, soybeans, wheat, melons, corn, and cotton. Accordingly, adverse circumstances affecting these activities could have an adverse effect on our agricultural real estate loan portfolio. Our agricultural real estate lending has grown significantly since June 30, 2011 when these loans totaled $42.4 million, or 7.6% of our loan portfolio, and we intend to continue to grow this portion of our loan portfolio.
41
Included in the commercial business loans described above are agricultural production and equipment loans. At June 30, 2021, these loans totaled $104.9 million, or 4.8%, of our loan portfolio, net. As with agricultural real estate loans, the repayment of operating loans is dependent on the successful operation or management of the farm property. The same risk applies to agricultural operating loans which are unsecured or secured by rapidly depreciating assets such as farm equipment or assets such as livestock or crops. Any repossessed collateral for a defaulted loan may not provide an adequate source of repayment of the outstanding loan balance as a result of the greater likelihood of damage, loss or depreciation to the collateral. Our agricultural operating loans have also grown significantly since June 30, 2011, when such loans totaled $45.3 million, or 8.1% of our loan portfolio.
At times, various agricultural commodity prices have been negatively impacted by recent actions taken, or which are feared could be taken, by governments in markets where U.S. agricultural products are exported. Declines in the pricing available to U.S. farmers negatively impacts cash flows for these borrowers to service their debts, and negatively affects the value of real estate and equipment which may be pledged as collateral to secure borrowings. In addition to the various risks to farm operations and management noted above, agricultural loans often are structured for annual payments, to coincide with borrower cash flows. As compared to other loan types which generally require monthly payments, an annual payment schedule may increase risk that the Company would not timely identify a borrower experiencing financial difficulties, hindering its ability to work to mitigate losses.
Continued growth of our commercial real estate and commercial business loan portfolios may increase the risk of credit defaults in the future.
Due to our emphasis on commercial real estate and commercial business lending, a substantial amount of the loans in our commercial real estate and commercial business portfolios and our lending relationships are of relatively recent origin. In general, loans do not begin to show signs of credit deterioration or default until they have been outstanding for some period of time, a process referred to as “seasoning.” A portfolio of older loans will usually behave more predictably than a newer portfolio. Commercial real estate and commercial business loans naturally create portfolio “churn” as loans are originated and repaid. As a result, our portfolio consists of a mix of seasoned and unseasoned loans. We believe that our underwriting practices are sound and based on industry standards and best practices. However, a significant portion of our loan portfolio is relatively new, therefore, the current level of delinquencies and defaults may not be representative of the level that will prevail as the portfolio becomes more seasoned, which may be higher than current levels. If delinquencies and defaults increase, we may be required to increase our provision for loan losses, which would adversely affect our results of operations and financial condition.
As we approach thresholds defined in interagency guidance on commercial real estate concentrations, we may incur additional expense or slow the growth of certain categories of commercial real estate lending.
The federal banking agencies have issued guidance on sound risk management practices for concentrations in commercial real estate lending (see “REGULATION – Guidance on Commercial Real Estate Concentrations”). For the purposes of this guidance, “commercial real estate” includes, among other types, multi-family residential loans and non-owner occupied nonresidential loans, two categories which have been a source of loan growth for the Company. A bank that has experienced rapid growth in commercial real estate lending, has notable exposure to a specific type of commercial real estate loan, or is approaching or exceeding the following supervisory criteria may be identified for further supervisory analysis with respect to real estate concentration risk: total loans for construction land development and other land representing 100% or more of the bank’s tier 1 regulatory capital plus the allowance for loan losses includable in total regulatory capital; or total commercial real estate loans (as defined in the guidance) that exceed 300% of the bank’s tier 1 regulatory capital plus the allowance for loan losses includable in total regulatory capital and the bank’s commercial real estate portfolio has increased by 50% or more during the prior 36 months.
During fiscal 2017, the Bank exceeded the 300% threshold for non-owner occupied commercial real estate loans (as defined in the guidance) for the first time as a percentage of tier 1 regulatory capital plus the allowance for credit losses includable in total regulatory capital, peaking at 305% at December 31, 2016. Since June 30, 2017, the Bank has been below the 300% threshold, and decreased from 288% of tier 1 regulatory capital plus the allowance for credit losses includable in total regulatory capital at June 30, 2020, to 277% at June 30, 2021.
42
In recent years, the Company’s non-owner occupied commercial real estate loans (as defined in the guidance) as a percent of tier 1 regulatory capital plus the allowance for loan losses includable in total regulatory capital has also approached the 300% threshold, but peaked at 293% at December 31, 2016. The Company reported 271% of tier 1 regulatory capital plus the allowance for loan losses includable in total regulatory capital concentrated in non-owner occupied commercial real estate loans at June 30, 2021, as compared to 280% at June 30, 2020.
The Bank and Company may see its non-owner occupied commercial real estate lending grow as a percentage of total regulatory capital, or it may slow the growth of this type of lending activity. Should we continue to grow this category of our loan portfolio, we may incur additional expense to meet the heightened supervisory expectations related to this lending activity. If we slow the growth of commercial real estate loans generally, or particular concentrations of borrowers or categories of properties within that definition, we may be negatively impacted in terms of our asset growth, net interest margin and earnings, leverage, or other targets.
Credit losses on investment securities could require charges to earnings, which could negatively impact our results of operations.
In assessing the potential credit losses of investment securities, we are required to evaluate instances in which the fair value of particular securities are less than their amortized cost basis. The evaluation considers factors including; past events, current conditions, and reasonable & supportable forecasts, and the Company’s ability and intent to hold the security until maturity. A qualitative determination is acceptable. In fiscal 2009, we incurred charges to recognize the other-than-temporary impairment (OTTI) of available-for-sale investments related to investments in Freddie Mac preferred stock ($304,000 impairment realized in the first quarter of fiscal 2009) and a pooled trust preferred collateralized debt obligation, Trapeza CDO IV, Ltd., class C2 ($375,000 impairment realized in the second quarter of fiscal 2009). We currently hold additional collateralized debt obligations (CDOs) for which credit losses are not currently expected, based on our best judgment using information currently available.
Risks Relating to Market Interest Rates
Changes in interest rates may negatively affect our earnings and the value of our assets.
Our earnings and cash flows depend substantially upon our net interest income. Net interest income is the difference between interest income earned on interest-earning assets, such as loans and investment securities, and interest expense paid on interest-bearing liabilities, such as deposits and borrowed funds. Interest rates are sensitive to many factors that are beyond our control, including general economic conditions, competition and policies of various governmental and regulatory agencies and, in particular, the policies of the Federal Reserve Board. Changes in monetary policy, including changes in interest rates, could influence not only the interest we receive on loans and investment securities and the amount of interest we pay on deposits and borrowings, but these changes could also affect: (i) our ability to originate loans and obtain deposits; (ii) the fair value of our financial assets and liabilities, including our securities portfolio; and (iii) the average duration of our interest-earning assets. This also includes the risk that interest-earning assets may be more responsive to changes in interest rates than interest-bearing liabilities, or vice versa (repricing risk), the risk that the individual interest rates or rate indices underlying various interest-earning assets and interest-bearing liabilities may not change in the same degree over a given time period (basis risk), and the risk of changing interest rate relationships across the spectrum of interest-earning asset and interest-bearing liability maturities (yield curve risk), including a prolonged flat or inverted yield curve environment. Any substantial, unexpected, prolonged change in market interest rates could have a material adverse effect on our financial condition and results of operations.
43
The replacement of the LIBOR benchmark interest rate may adversely affect us.
On July 27, 2017, the U.K. Financial Conduct Authority, which regulates LIBOR, announced that it will no longer persuade or compel banks to submit rates for the calculation of LIBOR to the LIBOR administrator after 2021. The announcement also indicates that the continuation of LIBOR on a current basis cannot and will not be guaranteed after 2021. Consequently, at this time, it is not possible to predict whether and to what extent banks will continue to provide LIBOR submissions to the LIBOR administrator or whether any additional reforms to LIBOR may be enacted in the United Kingdom or elsewhere. Similarly, it is not possible to predict whether LIBOR will continue to be viewed as an acceptable benchmark for certain loans and liabilities, what rate or rates may become accepted alternatives to LIBOR or the effect of any such changes in views or alternatives on the values of the loans and liabilities, whose interest rates are tied to LIBOR. ICE Benchmark Administration (“IBA”), the authorized and regulated administrator of LIBOR recently announced it would consult on its plans for the discontinuation of LIBOR. IBA intends to end publication of some LIBOR tenors on December 31, 2021 and the remaining LIBOR tenors in June 2023. Financial services regulators and industry groups have collaborated to develop alternate reference rate indices or reference rates. The transition to a new reference rate requires changes to contracts, risk and pricing models, valuation tools, systems, product design and hedging strategies. Uncertainty as to the nature of such potential changes, alternative reference rates, the elimination or replacement of LIBOR, or other reforms may adversely affect the value of, and the return on our loans, and our investment securities.
Risks Relating to Liquidity
Liquidity risk could impair our ability to fund operations and jeopardize our financial condition.
Liquidity is essential to our business. An inability to raise funds through deposits, borrowings, the sale of loans and other sources could have a substantial negative effect on our liquidity. Our access to funding sources in amounts adequate to finance our activities or the terms of which are acceptable to us could be impaired by factors that affect us specifically or the financial services industry or economy in general. Factors that could detrimentally impact our access to liquidity sources include a decrease in the level of our business activity as a result of a downturn in the markets in which our loans are concentrated or an adverse regulatory action against us. Our ability to borrow could also be impaired by factors that are not specific to us, such as a disruption in the financial markets or negative views and expectations about the prospects for the financial services industry generally.
Risks Relating to Acquisition Activities
We may fail to realize all of the anticipated benefits of our acquisition activities.
The success of our acquisition activities depends on, among other things, our ability to realize anticipated cost savings and to combine the businesses of the companies in a manner that does not materially disrupt the existing customer relationships of the companies or result in decreased revenues from customers. If we are unable to achieve these objectives, the anticipated benefits of the acquisitions may not be realized fully, if at all, or may take longer to realize than expected.
We have pursued a strategy of supplementing internal growth by acquiring other financial companies or their assets and liabilities that we believe will help fulfill our strategic objectives and enhance our earnings. There are risks associated with this strategy, including the following:
| ● | We may be exposed to potential asset quality issues or unknown or contingent liabilities of the banks, businesses, assets and liabilities we acquire. If these issues or liabilities exceed our estimates, our results of operations and financial condition may be adversely affected; |
| ● | Prices at which acquisitions can be made fluctuate with market conditions. We have experienced times during which acquisitions could not be made in specific markets at prices we considered acceptable and expect that we will experience this condition in the future; |
44
| ● | The acquisition of other entities generally requires integration of systems, procedures and personnel of the acquired entity into us to make the transaction economically successful. This integration process is complicated and time consuming and can also be disruptive to the customers of the acquired business. If the integration process is not conducted successfully and with minimal effect on the acquired business and its customers, we may not realize the anticipated economic benefits of particular acquisitions within the expected time frame, or at all, and we may lose customers or employees of the acquired business. We may also experience greater than anticipated customer losses even if the integration process is successful. |
| ● | To the extent our costs of an acquisition exceed the fair value of the net assets acquired, the acquisition will generate goodwill. We are required to assess our goodwill for impairment at least annually, and any goodwill impairment charge could have a material adverse effect on our results of operations and financial condition; |
| ● | To finance an acquisition, we may borrow funds, thereby increasing our leverage and diminishing our liquidity, or raise additional capital, which could dilute the interests of our existing shareholders; and |
| ● | We have completed four acquisitions since June 2017 which enhanced our rate of growth. We do not necessarily expect to be able to maintain our past rate of growth, and may not be able to grow at all in the future. |
Risks Relating to Future Growth
Our growth or future losses may require us to raise additional capital in the future, but that capital may not be available when it is needed or the cost of that capital may be very high.
We are required by federal and state regulatory authorities to maintain adequate levels of capital to support our operations. While we anticipate that our capital resources will satisfy our capital requirements for the foreseeable future, we may at some point need to raise additional capital to support our operations or continued growth, both internally and through acquisitions. Any capital we obtain may result in the dilution of the interests of existing holders of our common stock, or otherwise adversely affect your investment.
Our ability to raise additional capital, if needed, will depend on conditions in the capital markets at that time, which are outside our control, and on our financial condition and performance. Accordingly, we cannot make assurances of our ability to raise additional capital if needed, or if the terms will be acceptable to us. If we cannot raise additional capital when needed, our ability to further expand our operations through internal growth and acquisitions could be materially impaired and our financial condition and liquidity could be materially and adversely affected.
Risks Relating to Regulation
Legislative or regulatory changes or actions, or significant litigation, could adversely impact us or the businesses in which we are engaged.
The financial services industry is extensively regulated. We are subject to extensive state and federal regulation, supervision and legislation that govern almost all aspects of our operations. Laws and regulations may change from time to time and are primarily intended for the protection of consumers, depositors and the deposit insurance funds, and not to benefit our shareholders. The impact of any changes to laws and regulations or other actions by regulatory agencies may negatively impact us or our ability to increase the value of our business. Regulatory authorities have extensive discretion in connection with their supervisory and enforcement activities, including the imposition of restrictions on the operation of an institution, the classification of assets by the institution and the adequacy of an institution’s allowance for loan losses. Additionally, actions by regulatory agencies or significant litigation against us could require us to devote significant time and resources to defending our business and may lead to penalties that materially affect us and our shareholders.
45
Non-compliance with USA Patriot Act, Bank Secrecy Act, or other laws and regulations could result in fines or sanctions.
The USA Patriot and Bank Secrecy Acts require financial institutions to develop programs to prevent financial institutions from being used for money laundering and terrorist activities. If such activities are detected, financial institutions are obligated to file suspicious activity reports with the U.S. Treasury’s Office of Financial Crimes Enforcement Network. These rules require financial institutions to establish procedures for identifying and verifying the identity of customers seeking to open new financial accounts. Failure to comply with these regulations could result in fines or sanctions. Several banking institutions have received large fines for non-compliance with these laws and regulations. Although we have developed policies and procedures designed to assist in compliance with these laws and regulations, no assurance can be given that these policies and procedures will be effective in preventing violations of these laws and regulations.
We operate in a highly regulated environment and may be adversely affected by changes in federal and state laws and regulations, some of which is expected to increase our costs of operations.
We are currently subject to extensive examination, supervision and comprehensive regulation by the FDIC, the Missouri Division of Finance, and the Federal Reserve. The FDIC, the Missouri Division of Finance, and the Federal Reserve govern the activities in which we may engage, primarily for the protection of depositors and the Deposit Insurance Fund. These regulatory authorities have extensive discretion, including the ability to restrict an institution’s operations, require the institution to reclassify assets, determine the adequacy of the institution’s allowance for loan losses and determine the level of deposit insurance premiums assessed. Any change in such regulation and oversight, whether in the form of regulatory policy, new regulations or legislation or additional deposit insurance premiums could have a material adverse impact on our operations. Because our business is highly regulated, the laws and applicable regulations are subject to frequent change. See “Regulation.”
In response to the financial crisis of 2008, Congress took actions that are intended to strengthen confidence and encourage liquidity in financial institutions, and the FDIC has taken actions to increase insurance coverage on deposit accounts. The Dodd-Frank Act created the CFPB.
The CFPB has examination and primary enforcement authority with respect to depository institutions with $10 billion or more in assets, their service providers and certain non-depository entities such as debt collectors and consumer reporting agencies. In the case of banks, such as the Bank, with total assets of less than $10 billion, this examination and enforcement authority is held by the institution’s primary federal banking regulator (the FDIC, in the case of the Bank). The CFPB has finalized a number of significant rules that could have a significant impact on our business and the financial services industry more generally. In particular, the CFPB has adopted rules impacting nearly every aspect of the lifecycle of a residential mortgage loan.
In response to the financial crisis of 2008, federal and state banking regulators were active in responding to concerns and trends identified in examinations and have issued many formal enforcement orders requiring capital ratios in excess of regulatory requirements. The Federal Reserve and the Missouri Division of Finance regulate the activities in which the Bank may engage primarily for the protection of depositors and not for the protection or benefit of stockholders. In addition, new laws and regulations may increase our costs of regulatory compliance and of doing business and otherwise affect our operations. New laws and regulations may significantly affect the markets in which we do business, the markets for and value of our loans and investments, the fees we can charge and our ongoing operations, costs and profitability. Regulatory changes regarding card interchange fee income do not currently apply to us but could change in the future. Further, legislative proposals limiting our rights as a creditor could result in credit losses or increased expense in pursuing our remedies as a creditor.
46
Risks Relating to Technology and Cyber Security and Other Operational Matters
We are subject to security and operational risks relating to our use of technology that could damage our reputation and business.
Security breaches in our mobile and internet banking activities could expose us to possible liability and damage our reputation. Any compromise of our security also could deter customers from using our internet banking services that involve the transmission of confidential information. We rely on standard internet security systems to provide the security and authentication necessary to effect secure transmission of data. These precautions may not protect our systems from compromises or breaches of our security measures, which could damage our reputation and business.
We face significant operational risks because the financial services business involves a high volume of transactions and increased reliance on technology, including risk of loss related to cyber-security breaches.
We operate in diverse markets and rely on the ability of our employees and systems to process a high number of transactions and to collect, process, transmit and store significant amounts of confidential information regarding our customers, employees and others and concerning our own business, operations, plans and strategies. Operational risk is the risk of loss resulting from our operations, including but not limited to, the risk of fraud by employees or persons outside our company, the execution of unauthorized transactions by employees, errors relating to transaction processing and technology, systems failures or interruptions, breaches of our internal control systems and compliance requirements, and business continuation and disaster recovery. Insurance coverage may not be available for such losses, or where available, such losses may exceed insurance limits. This risk of loss also includes the potential legal actions that could arise as a result of operational deficiencies or as a result of non-compliance with applicable regulatory standards or customer attrition due to potential negative publicity. In addition, we outsource some of our data processing to certain third-party providers. If these third-party providers encounter difficulties, including as a result of cyber-attacks or information security breaches, or if we have difficulty communicating with them, our ability to adequately process and account for transactions could be affected, and our business operations could be adversely affected.
The financial services industry has noted recent increases in electronic fraudulent activity, attempted security breaches, and cyber-attacks, including attempts to initiate fraudulent activity through consumer, commercial, and public unit accounts. We are regularly the target of attempted cyber and other security threats and must continuously monitor and develop our information technology networks and infrastructure to prevent, detect, address and mitigate the risk of unauthorized access, misuse, computer viruses and other events that could have a security impact. Insider or employee cyber and security threats are increasingly a concern for companies, including ours. We are not aware that we have experienced any material misappropriation, loss or other unauthorized disclosure of confidential or personally identifiable information as a result of a cybersecurity breach or other act, however, some of our clients may have been affected by these breaches, which could increase their risks of identity theft, credit card fraud and other fraudulent activity that could involve their accounts with us.
In the event of a breakdown in our internal control systems, improper operation of systems or improper employee actions, or a breach of our security systems, including if confidential or proprietary information were to be mishandled, misused or lost, we could suffer financial loss, face regulatory action, civil litigation and/or suffer damage to our reputation.
Our information technology systems may be subject to failure, interruption, or security breaches.
Information technology systems are critical to our business. We use various technology systems to manage our customer relationships, general ledger, securities investments, deposits, and loans. We have established policies and procedures to prevent or limit the impact of system failures, interruptions, and security breaches, including privacy breaches and cyber-attacks, but such events may still occur or may not be adequately addressed if they do occur.
There have been increasing efforts by third parties to breach data security at financial institutions. There have been a number of instances involving financial services and consumer-based companies reporting the unauthorized disclosure of client or customer information or the destruction or theft of corporate data. Although we take protective
47
measures, the security of our computer systems, software, and networks may be vulnerable to breaches, unauthorized access, misuse, computer viruses, or other malicious code and cyber-attacks that could have an impact on information security. Because the techniques used to cause security breaches change frequently, we may be unable to proactively address these techniques or to implement adequate preventative measures.
Information security risks continue to increase due to new technologies, the increasing use of the Internet and telecommunication technologies (including mobile devices) to conduct financial and other business transactions, and the increasing sophistication and activities of organized crime, perpetrators of fraud, hackers, and others. The Company makes significant investments in various technology to identify and prevent intrusions into its information system. The Company also has policies and procedures designed to prevent or limit the effect of failure, interruption or security breach of its information systems and performs regular audits using both internal and outside resources. However, there can be no assurances that any such failures, interruptions or security breaches will not occur, or if they do occur, that they will be adequately addressed. In addition to unauthorized access, denial-of-service attacks, or other operational disruptions could overwhelm Company websites and prevent the Company from adequately serving customers. Should any of the Company’s systems become compromised or customer information be obtained by unauthorized parties, the reputation of the Company could be damaged, relationships with existing customers may be impaired, and the Company could be subject to lawsuits, all of which could result in a material adverse effect on the Company’s business, financial condition and results of operations.
The Company continually encounters technological change.
The financial services industry is continually undergoing rapid technological change with frequent introductions of new technology-driven products and services, including the entrance of financial technology companies offering new financial service products. The Company regularly upgrades or replaces core technological systems. The effective use of technology increases efficiency and enables financial institutions to better serve customers and reduce costs. The Company’s future success depends, in part, upon its ability to address the needs of its customers by using technology to provide products and services that will satisfy customer demands, as well as to create additional efficiencies in the Company’s operations. Many of the Company’s competitors have substantially greater resources to invest in technological improvements. The Company may encounter significant problems or may not be able to effectively implement new technology-driven products, including the core deposit system, and services, or be successful in marketing the new products and services to its customers. These problems might include significant time delays, cost overruns, loss of key people, and technological system failures. Failure to successfully keep pace with technological change affecting the financial services industry or failure to successfully complete the replacement of the core deposit system, or another core technological system, could have a material adverse effect on the Company’s business, financial condition and results of operations.
The Company’s operations rely on certain external vendors.
The Company relies on third-party vendors to provide products and services necessary to maintain day-to-day operations. For example, the Company outsources a portion of its information systems, communication, data management, and transaction processing to third parties. Accordingly, the Company is exposed to the risk that these vendors might not perform in accordance with the contracted arrangements or service level agreements for a number of reasons, including, but not limited to, changes in the vendor’s organizational structure, financial condition, support for existing products and services, or strategic focus. Such failure to perform could be disruptive to the Company’s operations, which could have a materially adverse impact on its business, results of operations and financial condition. These third parties are also sources of risk associated with operational errors, system interruptions or breaches and unauthorized disclosure of confidential information. If the vendors encounter any of these issues, the Company could be exposed to disruption of service, damage to reputation and litigation. Because the Company is an issuer of debit cards, it is periodically exposed to losses related to security breaches which occur at retailers that are unaffiliated with the Company (e.g., customer card data being compromised at retail stores). These losses include, but are not limited to, costs and expenses for card reissuance as well as losses resulting from fraudulent card transactions.
The occurrence of any system failures, interruption, or breach of security could damage our reputation and result in a loss of customers and business, subject us to additional regulatory scrutiny, or could expose us to litigation
48
and possible financial liability. Any of these events could have a material adverse effect on our financial condition and results of operations.
The soundness of other financial institutions could adversely affect us.
Our ability to engage in routine funding transactions could be adversely affected by the actions and commercial soundness of other financial institutions. Financial services institutions are interrelated as a result of trading, clearing, counterparty or other relationships. We have exposure to many different industries and counterparties, and we routinely execute transactions with counterparties in the financial industry. As a result, defaults by, or even rumors or questions about, one or more financial services institutions, or the financial services industry generally, have led to market-wide liquidity problems and could lead to losses or defaults by us or by other institutions. Many of these transactions expose us to credit risk in the event of default of our counterparty or client. In addition, our credit risk may be exacerbated when the collateral we hold cannot be realized upon or is liquidated at prices insufficient to recover the full amount of the loan. We cannot assure you that any such losses would not materially and adversely affect our business, financial condition or results of operations.
Significant legal actions could subject us to substantial liabilities.
We are from time to time subject to claims related to our operations. These claims and legal actions, including supervisory actions by our regulators, could involve large monetary claims and significant defense costs. As a result, we may be exposed to substantial liabilities, which could adversely affect our results of operations and financial condition.
Risks Relating to Earnings and Capital from Potential Impairment of Intangible or Deferred Tax Assets
Impairment of intangible assets or deferred tax assets could require charges to earnings, which could negatively impact our results of operations.
Deferred tax assets are only recognized to the extent it is more likely than not they will be realized. Should our management determine it is not more likely than not that the deferred tax assets will be realized, a valuation allowance with a charge to earnings would be reflected in the period. At June 30, 2021, our net deferred tax asset was $4.5 million, none of which was disallowed for regulatory capital purposes. Based on the levels of taxable income in prior years and our expectation of profitability in the current year and future years, management has determined that no valuation allowance was required at June 30, 2021. If we are required in the future to take a valuation allowance with respect to our deferred tax asset, our financial condition, results of operations and regulatory capital levels would be negatively affected.
Risks Relating to Our Common Stock
The price of our common stock may fluctuate significantly, and this may make it difficult for you to resell our common stock when you want or at prices you find attractive.
We cannot predict how our common stock will trade in the future. The market value of our common stock will likely continue to fluctuate in response to a number of factors including the following, most of which are beyond our control, as well as the other factors described in this “Risk Factors” section:
| ● | actual or anticipated quarterly fluctuations in our operating and financial results; |
| ● | developments related to investigations, proceedings or litigation; |
| ● | changes in financial estimates and recommendations by financial analysts; |
| ● | dispositions, acquisitions and financings; |
| ● | actions of our current shareholders, including sales of common stock by existing shareholders and our directors and executive officers; |
49
| ● | fluctuations in the stock prices and operating results of our competitors; |
| ● | regulatory developments; and |
| ● | other developments in the financial services industry. |
The market value of our common stock may also be affected by conditions affecting the financial markets in general, including price and trading fluctuations. These conditions may result in (i) volatility in the level of, and fluctuations in, the market prices of stocks generally and, in turn, our common stock and (ii) sales of substantial amounts of our common stock in the market, in each case that could be unrelated or disproportionate to changes in our operating performance. These broad market fluctuations may adversely affect the market value of our common stock. Currently, market prices of stocks issued by financial institutions have been negatively impacted by interest rates which are at historic lows and anticipated to remain there, and market expectations regarding elevated future credit losses resulting from the economic effects of the pandemic.
Regulatory and contractual restrictions may limit or prevent us from paying dividends on and repurchasing our common stock.
Southern Missouri Bancorp, Inc., is an entity separate and distinct from its subsidiary bank and derives substantially all of its revenue in the form of dividends from the Bank. Accordingly, the Company is and will be dependent upon dividends from its subsidiary bank to pay the principal of and interest on its indebtedness, to satisfy its other cash needs and to pay dividends on its common and preferred stock. The Bank’s ability to pay dividends is subject to its ability to earn net income and to meet certain regulatory requirements. In the event the subsidiary bank is unable to pay dividends to the Company, the Company may not be able to pay dividends on its common or preferred stock. Also, the Company’s right to participate in a distribution of assets upon the subsidiary’s liquidation or reorganization is subject to the prior claims of the subsidiary’s creditors. In addition, holders of our common stock are entitled to receive dividends only when, as and if declared by our board of directors. Although we have historically paid cash dividends on our common stock, we are not required to do so and our board of directors could reduce, suspend or eliminate our common stock cash dividend in the future.
If we defer interest payments on our outstanding junior subordinated debt securities or if certain defaults relating to those debt securities occur, we will be prohibited from declaring or paying dividends or distributions on, and from making liquidation payments with respect to, our common stock.
As of June 30, 2021, we had outstanding $16.8 million aggregate principal amount of junior subordinated debt securities issued in connection with the sale of trust preferred securities by subsidiaries of ours that are statutory business trusts. As of that date, those debt securities were carried at a book value of $15.2 million.
We guarantee the trust preferred securities described above. The indentures under which the junior subordinated debt securities were issued, together with the guarantee, prohibit us, subject to limited exceptions, from declaring or paying any dividends or distributions on, or redeeming, repurchasing, acquiring or making any liquidation payments with respect to, any of our capital stock at any time when (i) there shall have occurred and be continuing an event of default under the indenture; (ii) we are in default with respect to payment of any obligations under the guarantee; or (iii) we have elected to defer payment of interest on the junior subordinated debt securities. In that regard, we are entitled, at our option but subject to certain conditions, to defer payments of interest on the junior subordinated debt securities from time to time for up to five years.
Events of default under the indentures generally consist of our failure to pay interest on the junior subordinated debt securities under certain circumstances, our failure to pay any principal of or premium on such junior subordinated debt securities when due, our failure to comply with certain covenants under the indenture, and certain events of bankruptcy, insolvency or liquidation relating to us.
As a result of these provisions, if we were to elect to defer payments of interest on the junior subordinated debt securities, or if any of the other events described in clause (i) or (ii) of the second paragraph of this risk factor were to occur, we would be prohibited from declaring or paying any dividends on our common stock, from redeeming,
50
repurchasing or otherwise acquiring any of our common stock, and from making any payments to holders of our common stock in the event of our liquidation, which would likely have a material adverse effect on the market value of our common stock. Moreover, without notice to or consent from the holders of our common stock, we may issue additional series of junior subordinated debt securities in the future with terms similar to those of our existing junior subordinated debt securities or enter into other financing agreements that limit our ability to purchase or to pay dividends or distributions on our capital stock, including our common stock.
Anti-takeover provisions could negatively impact our shareholders.
Provisions of our articles of incorporation and bylaws, Missouri law and various other factors may make it more difficult for companies or persons to acquire control of us without the consent of our board of directors. These provisions include limitations on voting rights of beneficial owners of more than 10% of our common stock, the election of directors to staggered terms of three years and not permitting cumulative voting in the election of directors. Our bylaws also contain provisions regarding the timing and content of shareholder proposals and nominations for service on the Board of Directors.
Item 1B. Unresolved Staff Comments
None.
Item 2. Description of Properties
At June 30, 2021, the Bank operated from its headquarters, 46 full-service branch offices, and two limited-service branch offices. The Bank owns the office building and related land in which its headquarters are located, and 44 of its branch offices. The remaining four branch offices are either leased or partially owned.
For additional information regarding our properties, see "Part II, Item 8. Financial Statements and Supplementary Data – Notes to Consolidated Financial Statements – Note 5 – Premises and Equipment".
Management believes that our current facilities are adequate to meet our present and immediately foreseeable needs. However, we will continue to monitor customer growth and expand our branching network, if necessary, to serve our customers’ needs.
Item 3. Legal Proceedings
In the opinion of management, the Bank is not a party to any pending claims or lawsuits that are expected to have a material effect on the Bank’s financial condition or operations. Periodically, there have been various claims and lawsuits involving the Bank mainly as a defendant, such as claims to enforce liens, condemnation proceedings on properties in which the Bank holds security interests, claims involving the making and servicing of real property loans and other issues incident to the Bank’s business. Aside from such pending claims and lawsuits, which are incident to the conduct of the Bank’s ordinary business, the Bank is not a party to any material pending legal proceedings that would have a material effect on the financial condition or operations of the Bank.
Item 4. Mine Safety Disclosures
Not applicable.
51
Item 4A. Information About Our Executive Officers
Pursuant to General Instruction G(3) of Form 10-K and the instructions of Form 401 and Regulation S-K, the following information is furnished in lieu of being included in the Registrant’s definitive proxy statement.
The following information as to the business experience during the past five years is supplied with respect to executive officers of the Company and its subsidiaries who are not directors of the Company and its subsidiaries. There are no arrangements or understandings between the persons named and any other person pursuant to which such officers were selected.
Greg A. Steffens, age 54, the Company’s President and Chief Executive Officer, joined our Company in 1998 as Chief Financial Officer, and was appointed President and CEO in 1999. He has over 31 years of experience in the banking industry, including service from 1993 to 1998 as chief financial officer of Sho-Me Financial Corp (Mount Vernon, Missouri), prior to the sale of that company to Union Planters Corporation. Mr. Steffens also served from 1989 to 1993 as an examiner with the Office of Thrift Supervision. Mr. Steffens holds a Bachelor of Science Degree in Business Administration-Accounting and Finance from the University of Central Missouri, Warrensburg, Missouri.
Matthew T. Funke, age 44,the Company’s Chief Financial Officer, joined our Company in 2003. He has more than 22 years of banking and finance experience. Mr. Funke was initially hired to establish an internal audit function for the Company, and served as internal auditor and compliance officer until 2006, when he was named Chief Financial Officer. Previously, Mr. Funke was employed with Central Bancompany, Inc. (Jefferson City, Missouri), where he advanced to the role of internal audit manager, and as a fiscal analyst with the Missouri General Assembly. Mr. Funke holds a Bachelor of Science Degree in Accounting from Missouri State University, Springfield, Missouri, and is a graduate of the Southwest Graduate School of Banking at SMU, Dallas, Texas.
Kimberly A. Capps, age 53, the Company’s Chief Operations Officer, joined our Company in 1994. She has over 28 years of banking experience. Ms. Capps is responsible for the Company’s retail deposit operations, product development and marketing, enterprise data and delivery, and banking applications. Ms. Capps was initially hired by our bank subsidiary as controller, and was named Chief Financial Officer in 2001. In 2006, Ms. Capps was named Chief Operations Officer. Prior to joining the Company, Ms. Capps was employed for more than three years with the accounting firm of Kraft, Miles & Tatum (Poplar Bluff, Missouri), where she specialized in financial institution audits and taxation. She holds a Bachelor of Science Degree in Business Administration-Accounting from Southeast Missouri State University, Cape Girardeau, Missouri.
Lora L. Daves, age 54, the Company’s Chief Risk Officer, joined our Company in 2006. Ms. Daves is responsible for the oversight of the Company’s internal audit, loan review, BSA, CRA, and compliance functions. Ms. Daves served as our Chief Credit Officer from 2006 through 2016. Ms. Daves has over 32 years of banking and finance experience, including 11 years beginning with Mercantile Bank of Poplar Bluff, which merged with and into US Bank, a subsidiary of U.S. Bancorp (Minneapolis, Minnesota) during her tenure there. Ms. Daves’ responsibilities with US Bank included credit analysis, underwriting, credit presentation, credit approval, monitoring credit quality, and analysis of the allowance for loan losses. She advanced to hold responsibility for regional credit administration, loan review, compliance, and problem credit management. Ms. Daves’ experience also includes four years as Chief Financial Officer of a southeast Missouri healthcare provider which operated a critical access hospital, eight rural health clinics, two retail pharmacies, an ambulatory surgery center, and provided outpatient radiology and physical therapy services; and four years with a national real estate development and management firm, working in their St. Louis-based Midwest regional office as a general accounting manager. Ms. Daves holds a Bachelor of Science Degree in Business Administration-Accounting from Southeast Missouri State University, Cape Girardeau, Missouri.
Justin G. Cox, age 41, is our Regional President for the Bank’s west region, in which role he is responsible for loan production activity in the region, and also provides joint oversight of the deposit-taking operation in the region. Mr. Cox joined our Company in 2010 as a lending officer, as an integral part of the team which established our presence in Springfield, Missouri, through the opening of a loan production office in that market. Mr. Cox has more than 18 years banking experience. He previously worked for Metropolitan National Bank (Springfield, Missouri), and advanced to the
52
role of Vice President of Lending for that institution. Mr. Cox holds a Bachelor of Science Degree in Business Administration-Marketing & Management from Southwest Baptist University, Bolivar, Missouri.
Mark E. Hecker, age 55, the Company’s Chief Credit Officer, joined our Company in January 2017. Mr. Hecker is responsible for administration of the Company’s credit portfolio, including the approval process for proposed new credits and monitoring of the portfolio’s credit quality. Mr. Hecker has over 31 years of banking experience, having most recently served twelve years with BankLiberty (Liberty, Missouri) as its Chief Lending Officer. Prior to that, Mr. Hecker served as a commercial banker for Midland Bank (Lee’s Summit, Missouri) and its successor organization, Commercial Federal Bank (Omaha, Nebraska) for eight years. Mr. Hecker was employed as an examiner with the FDIC for more than six years and is a Commissioned Bank Examiner. Mr. Hecker holds a Bachelor of Science Degree in Business Administration-Accounting from the University of Central Missouri, Warrensburg, Missouri.
Rick A. Windes, age 57, the Company’s Chief Lending Officer, joined our Company in May 2018. Mr. Windes is responsible for the Company’s loan production. Mr. Windes has 28 years’ experience in commercial lending and lending management. Most recently, he served as a regional president in Springfield, Missouri, for Bear State Bank (Little Rock, Arkansas), prior to its merger with Arvest Bank. Previously, he was the senior lender for Metropolitan National Bank (Springfield, Missouri) prior to its acquisition by Bear State Bank. Mr. Windes holds a Bachelor of Science Degree in Business Administration from Truman State University, Kirksville, Missouri, and is a graduate of the Graduate School of Banking at Colorado, Boulder, Colorado.
Brett A. Dorton, age 49, the Company’s Chief Strategies Officer, joined our Company in November 2018, through the Gideon Acquisition. Mr. Dorton had served as President and Director at First Commercial Bank, Gideon’s bank subsidiary. Mr. Dorton was employed by First Commercial Bank for 18 years, including five years as President. Mr. Dorton is responsible for oversight of the Company’s entry into wealth management and commercial and consumer insurance brokerage, will serve a key role in future merger and acquisition activity, and is assisting in continued management of the acquired First Commercial Bank lending portfolio and its transition to appropriate lending officers in various Southern Bank markets. Mr. Dorton has 26 years’ experience in bank management, lending, fixed income portfolio management, and wealth management advisory services. Prior to his employment by First Commercial Bank, he was a loan officer with First Midwest Bank of Dexter. Mr. Dorton holds a Bachelor of Science Degree in Economics and Finance from Union University, Jackson, Tennessee, and is a graduate of the Graduate School of Banking at Louisiana State University, Baton Rouge, Louisiana. He holds Series 7 and 63 securities licenses.
Martin J. Weishaar, age 57, the Company’s Chief Legal Officer, joined our Company in October 2019. Mr. Weishaar is responsible for supervision of the Company’s legal needs and is also charged with oversight of the information technology department. Mr. Weishaar has more than 21 years of experience in the banking industry, having served as General Counsel/Chief Operating Officer for BankLiberty (Liberty, Missouri) from 1999-2019. For 10 years prior to that, he served as a private practice attorney in Kansas and Missouri, advising various clients including financial institutions. Mr. Weishaar holds a Bachelor of Arts Degree in Political Science and a Juris Doctor Degree from the University of Kansas, Lawrence, Kansas.
53
PART II
Item 5. Market for the Registrant’s Common Equity, Related Stockholder Matters and Issuer Purchases of Equity Securities
The common stock of Southern Missouri Bancorp, Inc., is traded under the symbol “SMBC” on the Nasdaq Global Market. At June 30, 2021, there were 8,905,198 shares of common stock outstanding and approximately 249 common stockholders of record.
Our cash dividend payout policy is continually reviewed by management and the Board of Directors. The Company intends to continue its policy of paying quarterly dividends; however, future dividend payments will depend upon a number of factors, including capital requirements, regulatory limitations (See “Item 1. Description of Business – Regulation”), the Company’s financial condition, results of operations and the Bank’s ability to pay dividends to the Company. The Company relies significantly upon such dividends originating from the Bank to accumulate earnings for payment of cash dividends to stockholders. See “Item 1A. Risk Factors �� Risks Relating to our Common Stock – Regulatory and Contractual Restrictions may limit or prevent us from paying dividends on and repurchasing our common stock.”
Information regarding our equity compensation plans is included in Part II, Item 11 of this Form 10-K.
On May 19, 2021, Southern Missouri Bancorp, Inc. (the “Company”), the parent corporation of Southern Bank, completed its program, originally announced November 28, 2018, to repurchase up to 450,000 common shares. The Company repurchased the full number of shares authorized under the program at an average cost of $33.32 per share.
Also, on May 20, 2021, the Company announced its intention to repurchase up to an additional 445,000 shares of its common stock, or approximately 5.0% of its 8.9 million outstanding common shares. The shares will be purchased at prevailing market prices in the open market or in privately negotiated transactions, subject to availability and general market conditions. Repurchased shares will be held as treasury shares to be used for general corporate purposes.
The following table summarizes the Company’s stock repurchase activity for each month during the three months ended June 30, 2021.
| | | | | | | | | |
|
| |
| | |
| Total # of Shares |
| |
| | | | Average | | Purchased as Part of a | | Maximum Number | |
| | Total # | | Price | | Publicly | | of Shares That | |
| | of Shares | | Paid Per | | Announced | | May Yet Be | |
| | Purchased | | Share | | Program | | Purchased (1) | |
04/01/21 - 04/30/21 period |
| 14,542 | | $ | 40.03 |
| 14,542 |
| 33,125 |
05/01/21 - 05/31/21 period |
| 37,256 | |
| 43.41 |
| 37,256 |
| 440,869 |
06/01/21 - 06/30/21 period |
| 2,300 | |
| 44.01 |
| 2,300 |
| 438,569 |
| (1) | Represents the remaining shares available for purchase as of the last calendar day of the month shown. |
54
The following graph shows a comparison of stockholder return on the common stock of Southern Missouri Bancorp, Inc., to the cumulative total returns for the indices shown below. The graph was compiled by S&P Global Market Intelligence, a division of S&P Global, Inc. The graph assumes an initial investment of $100 and reinvestment of dividends. The graph is historical only and may not be indicative of possible future performance.
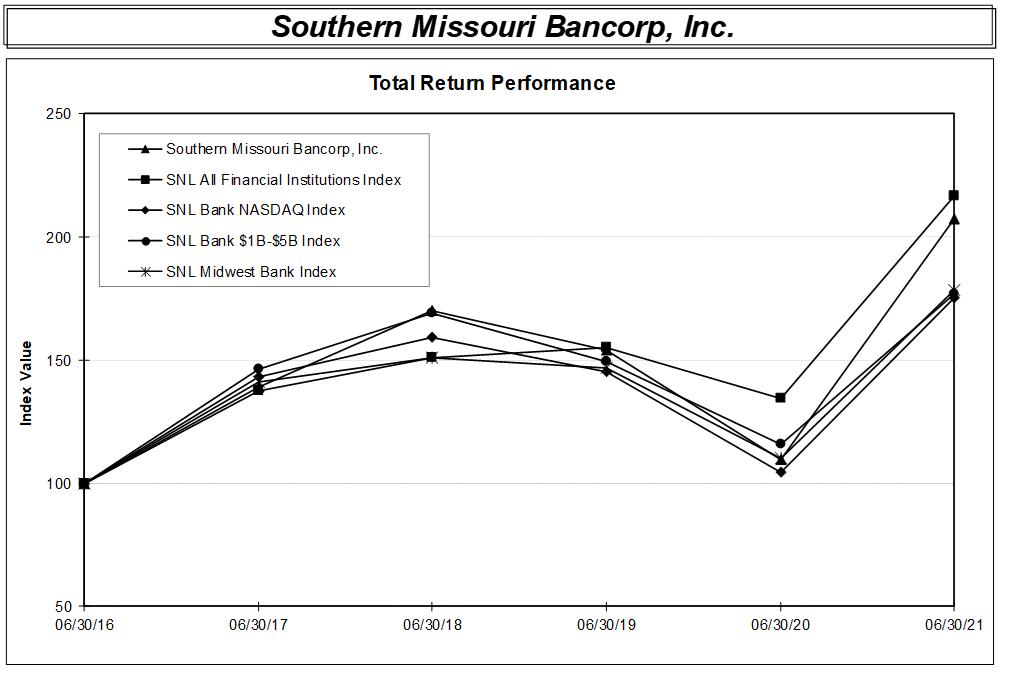
| | | | | | | | | | | | |
| | Period Ending | ||||||||||
Index |
| 06/30/16 |
| 06/30/17 |
| 06/30/18 |
| 06/30/19 |
| 06/30/20 |
| 6/30/21 |
Southern Missouri Bancorp, Inc. |
| 100.00 |
| 139.01 |
| 170.29 |
| 154.27 |
| 109.83 |
| 207.32 |
SNL All Financial Institutions Index |
| 100.00 |
| 137.68 |
| 151.08 |
| 155.16 |
| 134.57 |
| 216.65 |
SNL Bank NASDAQ Index |
| 100.00 |
| 142.98 |
| 159.20 |
| 145.32 |
| 104.42 |
| 175.06 |
SNL Bank $1B-$5B Index |
| 100.00 |
| 146.04 |
| 168.77 |
| 149.37 |
| 115.77 |
| 176.72 |
SNL Midwest Bank Index |
| 100.00 |
| 141.18 |
| 150.74 |
| 146.91 |
| 110.03 |
| 178.15 |
55
Item 6. Selected Financial Data
The summary information presented below under “Selected Financial Condition Data” and “Selected Operations Data” for the years ended June 30, 2021, 2020 and 2019 are derived in part from the audited consolidated financial statements that appear in this annual report. The following information is only a summary and you should read it in conjunction with “Management’s Discussion and Analysis of Financial Condition and Results of Operations” under Item 7 of this report and “Financial Statements and Supplementary Data” under Item 8 of this report below.
| | | | | | | | | | | | | | | |
(Dollars in thousands) | | At June 30, | |||||||||||||
Financial Condition Data: |
| 2021 |
| 2020 |
| 2019 |
| 2018 |
| 2017 | |||||
Total assets | | $ | 2,700,530 | | $ | 2,542,157 | | $ | 2,214,402 | | $ | 1,886,115 | | $ | 1,707,712 |
Loans receivable, net | |
| 2,200,244 | |
| 2,141,929 | |
| 1,846,405 | |
| 1,563,380 | |
| 1,397,730 |
Mortgage-backed securities | |
| 138,341 | |
| 126,912 | |
| 110,429 | |
| 90,176 | |
| 78,275 |
Cash, interest-bearing deposits and investment securities | |
| 193,250 | |
| 104,831 | |
| 91,475 | |
| 84,428 | |
| 97,674 |
Deposits | |
| 2,330,803 | |
| 2,184,847 | |
| 1,893,695 | |
| 1,579,902 | |
| 1,455,597 |
Borrowings | |
| 57,529 | |
| 70,024 | |
| 52,284 | |
| 82,919 | |
| 56,849 |
Subordinated debt | |
| 15,243 | |
| 15,142 | |
| 15,043 | |
| 14,945 | |
| 14,848 |
Stockholder's equity | |
| 283,423 | |
| 258,347 | |
| 238,392 | |
| 200,694 | |
| 173,083 |
| | | | | | | | | | | | | | | |
(Dollars in thousands, except per share data) | | For the Year Ended June 30, | |||||||||||||
Operating Data: |
| 2021 |
| 2020 |
| 2019 |
| 2018 |
| 2017 | |||||
Interest income | | $ | 109,475 | | $ | 107,052 | | $ | 97,482 | | $ | 77,174 | | $ | 61,488 |
Interest expense | |
| 16,789 | |
| 26,916 | |
| 24,700 | |
| 14,791 | |
| 10,366 |
| | | | | | | | | | | | | | | |
Net interest income | |
| 92,686 | |
| 80,136 | |
| 72,782 | |
| 62,383 | |
| 51,122 |
Provision for credit losses | |
| (1,024) | |
| 6,002 | |
| 2,032 | |
| 3,047 | |
| 2,340 |
| | | | | | | | | | | | | | | |
Net interest income after provision for credit losses | |
| 93,710 | |
| 74,134 | |
| 70,750 | |
| 59,336 | |
| 48,782 |
| | | | | | | | | | | | | | | |
Noninterest income | |
| 20,042 | |
| 14,750 | |
| 13,093 | |
| 12,369 | |
| 10,011 |
Noninterest expense | |
| 54,047 | |
| 54,452 | |
| 47,892 | |
| 42,973 | |
| 37,179 |
| | | | | | | | | | | | | | | |
Income before income taxes | |
| 59,705 | |
| 34,432 | |
| 35,951 | |
| 28,732 | |
| 21,614 |
Income taxes | |
| 12,525 | |
| 6,887 | |
| 7,047 | |
| 7,803 | |
| 6,062 |
Net Income | | $ | 47,180 | | $ | 27,545 | | $ | 28,904 | | $ | 20,929 | | $ | 15,552 |
| | | | | | | | | | | | | | | |
Basic earnings per share available to common stockholders(2) | | $ | 5.22 | | $ | 3.00 | | $ | 3.14 | | $ | 2.40 | | $ | 2.08 |
Diluted earnings per share available to common stockholders(2) | | $ | 5.22 | | $ | 2.99 | | $ | 3.14 | | $ | 2.39 | | $ | 2.07 |
Dividends per share(2) | | $ | 0.62 | | $ | 0.60 | | $ | 0.52 | | $ | 0.44 | | $ | 0.40 |
56
| | | | | | | | | | |
| | At June 30, | ||||||||
Other Data: |
| 2021 |
| 2020 |
| 2019 |
| 2018 |
| 2017 |
Number of: |
|
|
|
|
|
|
|
|
|
|
Real Estate Loans |
| 8,506 |
| 8,127 |
| 7,695 |
| 7,241 |
| 6,800 |
Deposit Accounts |
| 100,407 |
| 96,813 |
| 91,086 |
| 79,762 |
| 72,186 |
Full service offices |
| 47 |
| 46 |
| 45 |
| 38 |
| 39 |
Limited service offices |
| 2 |
| 2 |
| 2 |
| 3 |
| 3 |
| | | | | | | | | | | |
|
| At or for the year ended June 30, |
| ||||||||
Key Operating Ratios: |
| 2021 |
| 2020 |
| 2019 |
| 2018 |
| 2017 |
|
Return on assets (net income divided by average assets) | | 1.79 | % | 1.18 | % | 1.38 | % | 1.17 | % | 1.05 | % |
| | | | | | | | | | | |
Return on average common equity (net income available to common stockholders divided by average common equity) | | 17.69 |
| 11.11 |
| 13.13 |
| 11.30 |
| 11.70 | |
| | | | | | | | | | | |
Average equity to average assets | | 10.14 |
| 10.60 |
| 10.49 |
| 10.31 |
| 8.96 | |
| | | | | | | | | | | |
Interest rate spread (spread between weighted average rate on all interest-earning assets and all interest-bearing liabilities) | | 3.61 |
| 3.50 |
| 3.56 |
| 3.62 |
| 3.64 | |
| | | | | | | | | | | |
Net interest margin (net interest income as a percentage of average interest-earning assets | | 3.77 |
| 3.72 |
| 3.78 |
| 3.78 |
| 3.74 | |
| | | | | | | | | | | |
Noninterest expense to average assets | | 2.05 |
| 2.33 |
| 2.28 |
| 2.39 |
| 2.51 | |
| | | | | | | | | | | |
Average interest-earning assets to average interest-bearing liabilities | | 122.59 |
| 117.63 |
| 116.89 |
| 117.15 |
| 113.13 | |
| | | | | | | | | | | |
Allowance for credit losses to gross loans(1) | | 1.49 |
| 1.16 |
| 1.07 |
| 1.15 |
| 1.10 | |
| | | | | | | | | | | |
Allowance for credit losses to nonperforming loans(1) | | 566.16 |
| 290.38 |
| 94.72 |
| 198.58 |
| 481.65 | |
| | | | | | | | | | | |
Net charge-offs (recoveries) to average outstanding loans during the period | | 0.03 |
| 0.04 |
| 0.02 |
| 0.02 |
| 0.05 | |
| | | | | | | | | | | |
Ratio of nonperforming assets to total assets(1) | | 0.30 |
| 0.44 |
| 1.12 |
| 0.69 |
| 0.37 | |
| | | | | | | | | | | |
Dividend payout ratio | | 11.87 |
| 20.02 |
| 16.48 |
| 18.29 |
| 19.14 | |
| (1) | At end of period. |
57
Item 7. Management’s Discussion and Analysis of Financial Condition and Results of Operations
This discussion and analysis reviews our consolidated financial statements and other relevant statistical data and is intended to enhance your understanding of our financial condition and results of operations. The information in this section has been derived from the Consolidated Financial Statements and notes thereto, which are included in Item 8 of this Form 10-K. You should read the information in this section in conjunction with the business and financial information regarding us as provided in this Form 10-K.
OVERVIEW
Southern Missouri Bancorp, Inc., is a Missouri corporation originally organized for the principal purpose of becoming the holding company of Southern Bank. The principal business of Southern Bank consists of attracting deposits from the communities it serves and investing those funds in loans secured by residential and commercial real estate, as well as commercial business and consumer loans. These funds have also been used to purchase investment securities, mortgage-backed securities (MBS), U.S. government and federal agency obligations and other permissible securities.
Southern Bank’s results of operations are primarily dependent on the levels of its net interest margin and noninterest income, and its ability to control operating expenses. Net interest margin is dependent primarily on the difference or spread between the average yield earned on interest-earning assets (including loans, mortgage-related securities, and investments) and the average rate paid on interest-bearing liabilities (including deposits, securities sold under agreements to repurchase, and borrowings), as well as the relative amounts of these assets and liabilities. Southern Bank is subject to interest rate risk to the degree that its interest-earning assets mature or reprice at different times, or on a varying basis, from its interest-bearing liabilities.
Southern Bank’s noninterest income consists primarily of fees charged on transaction and loan accounts, interchange income from customer debit and ATM card use, gains on sales of loans originated for sale on the secondary market, and increased cash surrender value of bank owned life insurance (“BOLI”). Southern Bank’s operating expenses include: employee compensation and benefits, occupancy and data processing expenses, legal and professional fees, federal deposit insurance premiums, amortization of intangible assets, and other general and administrative expenses.
Southern Bank’s operations are significantly influenced by general economic conditions including monetary and fiscal policies of the U.S. government and the Federal Reserve Board. Additionally, Southern Bank is subject to policies and regulations issued by financial institution regulatory agencies including the Federal Reserve, the Missouri Division of Finance, and the Federal Deposit Insurance Corporation. Each of these factors may influence interest rates, loan demand, prepayment rates and deposit flows. Interest rates available on competing investments as well as general market interest rates influence the Bank’s cost of funds. Lending activities are affected by the demand for real estate and other types of loans, which in turn is affected by the interest rates at which such financing may be offered. Lending activities are funded through the attraction of deposit accounts consisting of checking accounts, passbook and statement savings accounts, money market deposit accounts, certificate of deposit accounts with terms of 60 months or less, securities sold under agreements to repurchase, advances from the Federal Home Loan Bank of Des Moines, and, to a lesser extent, brokered deposits. The Bank intends to continue to focus on its lending programs for one- to four-family and multi-family residential real estate, commercial real estate, commercial business and consumer financing on loans secured by properties or collateral located primarily in Missouri and Arkansas.
CRITICAL ACCOUNTING POLICIES
The Company has established various accounting policies, which govern the application of accounting principles generally accepted in the United States of America in the preparation of our financial statements. Our significant accounting policies are described in Item 8 of this Form 10-K under the Notes to the Consolidated Financial Statements. Certain accounting policies involve significant judgments and assumptions by management that have a material impact on the carrying value of certain assets and liabilities; management considers such accounting policies to be critical accounting policies. The judgments and assumptions used by management are based on historical experience and other factors, which are believed to be reasonable under the circumstances. Because of the nature of the judgments
58
and assumptions made by management, actual results could differ from these judgments and estimates that could have a material impact on the carrying values of assets and liabilities and the results of operations of the Company.
Allowance for Credit Losses. The Company's allowance for credit losses is its estimate of credit losses expected in the loan portfolio, on unfunded lending commitments, or in its available-for-sale securities portfolio over the expected life of those assets. While these estimates are based on substantive methods for determining the required allowance, actual outcomes may differ significantly from estimated results, especially when determining required allowances for larger, complex commercial credits or unfunded lending commitments to commercial borrowers. Consumer loans, including single family residential real estate, are individually smaller and generally behave in a similar manner, and loss estimates for these credits are considered more predictable. Additionally, the Company estimates the allowance for credit losses as a calculation of expected lifetime credit losses utilizing a forward-looking forecast of macroeconomic conditions, which may differ significantly from actual results. Further discussion of the methodology used in establishing the allowance is provided in Note 1 and Note 3 to the Notes to the Consolidated Financial Statements included in Item 8 of this Form 10-K, and in the “Financial Condition – Loans” and “Allowance for Credit Losses” sections of this Item 7.
FINANCIAL CONDITION
General. The Company experienced balance sheet growth in fiscal 2021, with total assets of $2.7 billion at June 30, 2021, reflecting an increase of $158.4 million, or 6.2%, as compared to June 30, 2020. Asset growth was comprised mainly of increases in cash and cash equivalents, loans, and available-for-sale (“AFS”) securities.
Cash and equivalents. Cash and cash equivalents were $123.6 million at June 30, 2021, an increase of $69.3 million, or 127.8%, as compared to June 30, 2020. The increase was primarily a result of deposit growth outpacing loan growth during the period. Interest-bearing time deposits were $1.0 million at June 30, 2021, relatively unchanged as compared to June 30, 2020.
Investments. Available-for-sale (AFS) securities were $207.0 million at June 30, 2021, an increase of $30.5 million, or 17.3%, as compared to June 30, 2020. The Company increased holdings of corporate debt, residential and commercial mortgage-backed securities (MBS), and municipal securities, while holdings of collateralized mortgage obligations (CMOs) issued by government-sponsored entities declined.
Loans. Loans, net of the allowance for credit losses, were $2.2 billion at June 30, 2021, an increase of $58.3 million, or 2.7%, as compared to June 30, 2020. Gross loans increased by $66.4 million, or 3.1%, during the fiscal year, while the ACL at June 30, 2021, reflected an increase of $8.1 million, as compared to the balance of our allowance for loan and lease losses (ALLL) at June 30, 2020. The Company adopted ASU 2016-13, Financial Instruments – Credit Losses, also known as the current expected credit loss (“CECL”) standard, effective as of July 1, 2020, the beginning of our 2021 fiscal year. Adoption resulted in a $9.3 million increase in the ACL, relative to the ALLL as of June 30, 2020, while negative provisioning combined with net charge offs to decrease the ACL by $1.2 million, as compared to July 1, 2020. The increase in loan balances in the portfolio was primarily attributable to increases in residential real estate loans and drawn construction loan balances, partially offset by decreases in commercial loans and consumer loans. Residential real estate loans increased primarily due to growth in multifamily and 1- to 4-family residential lending. Due to its liquidity position, the Company retained some single-family residential loans which it typically would have sold on the secondary market. Commercial loan balances decreased primarily as a result of forgiveness of PPP loans, which declined by $69.3 million during the fiscal year. Remaining unpaid PPP loan balances were $63.0 million at June 30, 2021.
Nonperforming loans were $5.9 million, or 0.26% of gross loans, at June 30, 2021, as compared to $8.7 million, or 0.40% of gross loans at June 30, 2020. The decrease in nonperforming loans over the fiscal year was attributed primarily to the resolution of certain nonperforming loans acquired in the Gideon Acquisition. In connection with the Gideon Acquisition, we acquired nonperforming loans which totaled $10.2 million (at fair value) as of June 30, 2019. This group of loans had declined to $1.8 million as of June 30, 2020, and declined further to an immaterial amount as of June 30, 2021.
59
Allowance for Credit Losses. Our ACL at June 30, 2021, totaled $33.2 million, representing 1.49% of gross loans and 566.1% of nonperforming loans, as compared to an ALLL of $25.1 million, representing 1.16% of gross loans and 290.4% of nonperforming loans at June 30, 2020. The ACL at June 30, 2021, also represented 1.53% of gross loans excluding PPP loans. The Company has estimated its credit losses as of June 30, 2021, under ASC 320-20, and management believes the allowance for credit losses as of that date is adequate based on that estimate; however, there remains significant uncertainty regarding the possible length of time before economic activity fully recovers from the COVID-19 pandemic, including uncertainty regarding the effectiveness of recent efforts by the U.S. government and Federal Reserve to respond to the pandemic and its economic impact. Most recently, public health authorities have reported increasing case counts and hospitalizations in parts of our market area. Management considered the potential impact of the pandemic on its consumer and business borrowers, particularly those business borrowers most affected by efforts to contain the pandemic, most notably including our borrowers in the hotel industry. See also, “Provision for Credit Losses, under Comparison of Operating Results for the Years Ended June 30, 2021 and 2020”.
The Company regularly reviews its ACL and makes adjustments to its balance based on management’s estimate of (1) the total expected losses included in the Company’s financial assets held at amortized cost, which is limited to the Company’s loan portfolio, and (2) any credit deterioration in the Company’s available-for-sale securities as of the balance sheet date. The Company holds no securities classified as held-to-maturity. Although the Company maintains its ACL at a level that it considers sufficient to provide for losses, there can be no assurance that future losses will not exceed internal estimates. In addition, the amount of the ACL is subject to review by regulatory agencies, which can order the Company to record additional allowances. The required ACL has been estimated based upon the guidelines in ASC Topic 326, Financial Instruments – Credit Losses. For a summary of changes in the ACL during the current and prior fiscal years, and a breakdown of the ACL by loan category as of the current and prior fiscal year end, see Description of Business – Asset Quality, Allowance for Credit Losses, contained within Item 1 of this Form 10-K.
The estimate involves consideration of quantitative and qualitative factors relevant to the loans as segmented by the Company, and is based on an evaluation, at the reporting date, of historical peer data, coupled with qualitative adjustments to address current economic conditions and credit quality, and reasonable and supportable forecasts. Specific qualitative factors considered include, but may not be limited to:
●Changes in lending policies and/or loan review system
●National, regional, and local economic trends and/or conditions
●Changes and/or trends in the nature, volume, or terms of the loan portfolio
●Experience, ability, and depth of lending management and staff
●Levels and/or trends of delinquent, non-accrual, problem assets, or charge offs and recoveries
●Concentrations of credit
●Changes in collateral values
●Agricultural economic conditions
●Risks from regulatory, legal, or competitive factors
At our June 30, 2020, fiscal year end, prior to the adoption of ASU 2016-13, the Company’s ALLL was $25.1 million. Upon adoption of the standard, effective July 1, 2020, the Company increased the ACL by $8.9 million, related to the transition from the incurred loss model to the CECL ACL model, increased the ACL by $434,000 related to the transition from purchased credit impaired to purchased credit deteriorated methodology, and reduced retained earnings by $6.9 million, net of deferred taxes, through a one-time cumulative effect adjustment. During fiscal 2021, the ACL decreased by an additional $1.2 million, reflecting a recovery of provision for credit losses on loan balances outstanding of $602,000, and net charge offs of $648,000. The recovery was based on the estimated required ACL, reflecting management’s estimate of the current expected credit losses on the Company’s loan balances outstanding at June 30, 2021, and as of that date the Company’s ACL was $33.2 million. While the Company’s management believes the ACL at June 30, 2021, is adequate, based on that estimate, there remains significant uncertainty regarding the possible length of the COVID-19 pandemic and the aggregate impact that it will have on global and regional economies, including uncertainty regarding the effectiveness of recent efforts by the U.S. government and the Federal Reserve Board to respond to the pandemic and its economic impact. Management considered the impact of the pandemic on its consumer and business borrowers, particularly those business borrowers most affected by efforts to contain the pandemic, including our borrowers in the retail and multi-tenant retail industry, restaurants, and hotels.
60
Provisions of the CARES Act and subsequent legislation allow financial institutions the option to temporarily suspend certain requirements under U.S. GAAP related to troubled debt restructurings (TDRs) for certain loans that were otherwise current and performing prior to the COVID-19 pandemic, but for which borrowers experienced or expected difficulties due to the impact of the pandemic. Initially, the Company generally granted deferrals under this program for three-month periods, while interest-only modifications were generally for six-month periods. Some borrowers were granted additional periods of deferral or interest-only modifications. The Company did not account for these loans as TDRs. As of June 30, 2021, no loans remained on COVID-related payment deferrals, and six loans with balances totaling approximately $23.9 million remained on interest-only payment modifications. By comparison, at June 30, 2020, approximately 900 loans with balances totaling $380.2 million were provided either such deferrals or modifications. For borrowers whose payment terms have not returned to the original terms under their loan agreement, the Company has generally classified the credit as a “special mention” status credit. Loans remaining under a COVID-related payment deferral or interest-only modification which have been placed on watch or special mention status total $23.7 million. While management considers progress made by our borrowers in responding to the pandemic to be relatively strong, and the performance of our loan portfolio to be encouraging to date, we cannot predict with certainty the difficulties to be faced in coming months. Many communities where our borrowers operate are currently experiencing increases in COVID-19 cases, which could lead to reductions in business activity or employee attendance, and borrowers could be required by local authorities to restrict activity.
Premises and Equipment. Premises and equipment decreased to $64.1 million, down $1.0 million, or 1.6%, as compared to June 30, 2020. The decrease was due primarily to depreciation, along with the sale of properties previously acquired through merger and acquisition activity, partially offset by remodeling investments in existing facilities, capitalization of right-of-use assets on new facilities and ground leases, and investments in furniture, fixtures, and equipment.
BOLI. The Bank has purchased “key person” life insurance policies (BOLI) on employees at various times since fiscal 2003, and has acquired additional BOLI in connection with certain acquisitions. At June 30, 2021, the cash surrender value of all such policies was $43.8 million, up $454,000, or 1.0%, as compared to June 30, 2020.
Intangible Assets. The July 2009 acquisition of the Southern Bank of Commerce resulted in goodwill of $126,000. The October 2013 acquisition of Ozarks Legacy Community Financial, Inc., resulted in goodwill of $1.5 million and a $1.4 million core deposit intangible, which was amortized over a five-year period using the straight-line method and was fully amortized as of June 30, 2021. The February 2014 acquisition of Citizens State Bankshares, Inc., resulted in a $624,000 core deposit intangible, which was amortized over a five-year period using the straight-line method and was fully amortized as of June 30, 2021. The August 2014 acquisition of Peoples Service Company, Inc., and its subsidiary, Peoples Bank of the Ozarks (the “Peoples Acquisition”) resulted in goodwill of $3.0 million and a $3.0 million core deposit intangible, which was amortized over a six-year period using the straight-line method and was fully amortized as of June 30, 2021. The June 2017 acquisition of Tammcorp, Inc., and its subsidiary, Capaha Bank (the “Capaha Acquisition”) resulted in goodwill of $4.1 million and a $3.4 million core deposit intangible, which is being amortized over a seven-year period using the straight-line method. The SMB-Marshfield Acquisition resulted in goodwill of $4.4 million and a $1.3 million core deposit intangible, which is being amortized over a seven-year period using the straight-line method. The Gideon Acquisition resulted in goodwill of $1.0 million and a $4.1 million core deposit intangible, which is being amortized over a seven-year period using the straight-line method. The May 2020 Central Federal Acquisition resulted in a bargain purchase gain of $123,000 and a $540,000 core deposit intangible, which is being amortized over a six-year period using the straight-line method. Goodwill from these acquisitions is not being amortized, but is tested for impairment at least annually.
Deposits. Deposits were $2.3 billion at June 30, 2021, an increase of $146.0 million, or 6.7%, as compared to June 30, 2020. This increase primarily reflected an increase in interest-bearing transaction accounts, noninterest-bearing transaction accounts, savings accounts, and money market deposit accounts, partially offset by a decrease in time deposits. Since June 30, 2020, the Company’s public unit deposits increased by $21.2 million, to total $326.4 million at June 30, 2021, with the increase primarily resulting from higher nonmaturity balances held by our existing customer base. Since June 30, 2020, brokered certificates of deposit decreased by $18.3 million, to total $5.0 million at June 30, 2021, while brokered nonmaturity deposits were little changed at $20.1 million at June 30, 2021. The Company decreased brokered funding during the fiscal year as better core liquidity reduced the Company’s need for wholesale
61
funding. Our discussion of brokered deposits excludes those deposits originated through reciprocal arrangements. We continued to utilize reciprocal deposit programs, and at fiscal year end, we had placed deposits of $260.5 million through reciprocal programs, up from $231.9 million a year earlier. At June 30, 2021, $157.4 million reflected deposits we had placed on behalf of our public unit depositors, up from $138.1 million a year ago. Deposit balances saw growth primarily in interest-bearing transaction accounts, noninterest-bearing transaction accounts, money market deposit accounts, and savings accounts, partially offset by declines in certificates of deposit. The average loan-to-deposit ratio for the fourth quarter of fiscal 2021 was 93.0%, as compared to 98.9% for the same period of the prior fiscal year.
Borrowings. FHLB advances were $57.5 million at June 30, 2021, a decrease of $12.5 million, or 17.8%, as the Company’s deposit inflows outpaced loan demand and investment portfolio growth. The Company held no overnight advances at June 30, 2020, or June 30, 2021, but did utilize a comparatively modest amount of overnight borrowings during the first and second quarters of the fiscal year. Usage of overnight borrowings in this seasonal pattern was reduced from common historical levels, as liquidity was elevated in the COVID pandemic environment.
Subordinated Debt. In March 2004, $7.0 million of Floating Rate Capital Securities of Southern Missouri Statutory Trust I, with a liquidation value of $1,000 per share were issued. The securities bear interest at a floating rate based on LIBOR, are now redeemable at par, and mature in 2034. In connection with its October 2013 acquisition of Ozarks Legacy, the Company assumed $3.1 million in floating rate junior subordinated debt securities. The debt securities had been issued in June 2005 by Ozarks Legacy in connection with the sale of trust preferred securities, bear interest at a floating rate based on LIBOR, are now redeemable at par, and mature in 2035. The carrying value of these debt securities was approximately $2.7 million at June 30, 2021, relatively unchanged as compared to June 30, 2020. In connection with the Peoples Acquisition, the Company assumed $6.5 million in floating rate junior subordinated debt securities. The debt securities had been issued in 2005 by Peoples, in connection with the sale of trust preferred securities, bear interest at a floating rate based on LIBOR, are now redeemable at par, and mature in 2035. The carrying value of these debt securities was approximately $5.3 million at June 30, 2021, relatively unchanged as compared to June 30, 2020.
Stockholders’ Equity. The Company’s stockholders’ equity was $283.4 million at June 30, 2021, an increase of $25.1 million, or 9.7%, as compared to June 30, 2020. The increase was attributable to the retention of net income, partially offset by cash dividends paid, a decrease in accumulated other comprehensive income, which was due to an increase in market interest rates, stock repurchase activity totaling 238,482 shares acquired for $8.3 million, at an average price of $34.97 per share, and the adoption of CECL which reduced equity by $7.2 million.
COMPARISON OF OPERATING RESULTS FOR THE YEARS ENDED JUNE 30, 2021 AND 2020
Net Income. The Company’s net income available for the fiscal year ended June 30, 2021, was $47.2 million, an increase of $19.6 million, or 71.3%, as compared to the prior fiscal year.
Net Interest Income. Net interest income for fiscal 2021 was $92.7 million, an increase of $12.6 million, or 15.7%, when compared to the prior fiscal year. The increase, as compared to the prior fiscal year, was attributable to a 14.2% increase in the average balance of interest-earning assets, combined with an increase in the net interest margin, from 3.72% to 3.77%. Average earning asset balance growth was due primarily to loan growth, including higher average balances resulting from PPP loans outstanding over the course of the fiscal year and other loan growth, as well as the effect of the late-fiscal 2020 Central Federal Acquisition. Additionally, significantly higher average cash and cash equivalent balances contributed to the increase in average earning assets, but reduced the Company’s net interest margin. The average balance of investment securities was modestly higher.
As a material amount of PPP loans were forgiven and therefore repaid ahead of their scheduled maturity during fiscal 2021, the Company recognized accelerated accretion of interest income from deferred origination fees on these loans. In fiscal 2021, this component of interest income totaled $3.4 million, adding 14 basis points to the net interest margin, with no comparable item in the prior fiscal year. Loan discount accretion and deposit premium amortization related to the Company’s August 2014 acquisition of Peoples Bank of the Ozarks, the June 2017 acquisition of Capaha Bank, the February 2018 acquisition of Southern Missouri Bank of Marshfield, the Gideon Acquisition, and the Central Federal Acquisition, resulted in $1.9 million in net interest income for fiscal 2021, as compared to $1.8 million in net
62
interest income for fiscal 2020. The Company generally expects this component of net interest income will continue to decline over time, although volatility may occur to the extent we have periodic resolutions of specific loans. Combined, these components of net interest income contributed eight basis points to net interest margin in fiscal 2021, unchanged from a contribution of eight basis points in fiscal 2020. Additionally, in fiscal 2020, the Company recognized an additional $767,000 in interest income as a result of the resolution of a limited number of nonperforming loans, with no material contribution from similar resolutions in fiscal 2021. This recognition of interest income in the year-ago period contributed four basis points to net interest margin.
Interest Income. Interest income for fiscal 2021 was $109.5 million, an increase of $2.4 million, or 2.3%, when compared to the prior fiscal year. The increase was due to an increase of $306.7 million, or 14.2%, in the average balance of interest-earning assets, partially offset by a 52 basis point decrease in the average yield earned on interest-earning assets, from 4.97% in fiscal 2020, to 4.45% in fiscal 2021.
Interest income on loans receivable for fiscal 2021 was $105.1 million, an increase of $2.9 million, or 2.9%, when compared to the prior fiscal year. The increase was due to a $208.3 million increase in the average balance of loans receivable, partially offset by a 37 basis point decrease in the average yield earned on loans receivable. The decrease in the average yield was attributed primarily to origination and repricing of loans and borrower refinancing as average market interest rates decreased significantly compared to the prior fiscal year, as the economy was impacted by the COVID-19 pandemic. The decrease in loan yields generally was partially offset by the accelerated accretion of deferred origination fees on PPP loans detailed above.
Interest income on the investment portfolio and other interest-earning assets was $4.4 million for fiscal 2021, a decrease of $524,000, or 10.6%, when compared to the prior fiscal year. The decrease was due to a 105 basis point decrease in the average yield earned on these assets, partially offset by a $98.4 million increase in the average balance of these assets. The notable decrease in average yield and increase in average balances was attributable primarily to the increase in cash and cash equivalents.
Interest Expense. Interest expense was $16.8 million for fiscal 2021, a decrease of $10.1 million, or 37.6%, when compared to the prior fiscal year. The decrease was due to a 63 basis point decrease in the average rate paid on interest-bearing liabilities, from 1.47% in fiscal 2020, to 0.84% in fiscal 2021, partially offset by an increase of $176.1 million, or 9.6%, in the average balance of interest-bearing liabilities.
Interest expense on deposits was $14.9 million for fiscal 2021, a decrease of $9.2 million, or 38.2%, when compared to the prior fiscal year. The decrease was due to a 63 basis point decrease in the average rate paid on interest-bearing deposits, partially offset by the $199.9 million increase in the average balance of those deposits. The decrease in the average rate paid on deposits was attributable primarily lower market interest rates over the course of fiscal 2021, as compared to the prior fiscal year.
Interest expense on FHLB advances was $1.4 million for fiscal 2021, a decrease of $566,000, or 29.3%, when compared to the prior fiscal year. The decrease was due to a $21.3 million decrease in the average balance of these advances, combined with a 14 basis point decrease in the average rate paid on advances. The decrease in the average rate paid was attributable primarily to market declines in borrowing rates available on average during fiscal 2021, as compared to the prior fiscal year.
Provision for Credit Losses. The Company recorded a negative provision for credit losses of $1.0 million for fiscal 2021, as compared to a provision for loan losses of $6.0 million for the prior fiscal year. The negative provision in the current period was due both to a $602,000 reduction in the Company’s required allowance for credit losses on outstanding loan balances, as well as a $422,000 reduction in the Company’s required allowance for off-balance sheet credit exposure. (In the prior fiscal year, the provision for off-balance sheet credit exposure was reported as a component of noninterest expense.) Reduced provisioning was attributed primarily to a generally improved economic outlook as compared to the year-ago period, moderated growth in unguaranteed loan balances, along with relatively consistent levels of net charge offs, and reductions in adversely classified credits, delinquent loans, and nonperforming loans. As a percentage of average loans outstanding, the negative provision for credit losses in the current fiscal year represented a recovery of 0.05%, while the Company recorded net charge offs during the current fiscal year of 0.03%. During the prior
63
fiscal year, the provision for loan losses as a percentage of average loans outstanding represented a charge of 0.31%, while the Company recorded net charge offs of 0.04% (annualized). (See Note 1 and Note 3 to the consolidated financial statements, “Critical Accounting Policies” and “Financial Condition – Allowance for Credit Losses” in this Item 7, and “Asset Quality” in Item 1 of this Form 10-K.)
Noninterest Income. Noninterest income was $20.0 million for fiscal 2021, an increase of $5.3 million, or 35.9%, when compared to the prior fiscal year. The increase was due primarily to increased gains realized on the sale of residential real estate loans originated for that purpose, loan servicing income, bank card interchange income, earnings on bank owned life insurance (BOLI), and other income, partially offset by a decrease in deposit account service charges and fees. Gains realized on the sale of residential real estate loans originated for that purpose increased due increased to refinancing and home-buying activity in the low market rate environment. Loan servicing income increased as the Company saw increases in the dollar amount of loans serviced, and recognized a $369,000 increase in the fair value of mortgage servicing rights, as compared to a $391,000 decrease in fair value recognized in the prior fiscal year. Bank card interchange income improved as a result of increases in the number and dollar amount of card transactions. Earnings on BOLI increased due to $696,000 in nonrecurring benefits in fiscal 2021. Deposit account service charges decreased as NSF activity was reduced.
Noninterest Expense. Noninterest expense was $54.0 million for fiscal 2021, a decrease of $405,000, or 0.7%, when compared to the prior fiscal year. The decrease in noninterest expense was attributable primarily to expenses included in the prior fiscal year’s results related to the Central Federal acquisition, which totaled $1.2 million, as compared to no material charges for comparable activity in the current fiscal year. Additionally, as noted in “Provision for Credit Losses” above, in the prior year, the provision for off-balance sheet credit exposure, which totaled $648,000, was reported as a component of noninterest expense. The Company reported higher compensation expense, deposit insurance premiums, and occupancy expenses, while expenses related to and losses on the disposition of foreclosed real estate, amortization of core deposit intangibles, data processing expenses, and other expenses were lower. Compensation and occupancy increased as the Company added two facilities, and provided standard year-over-year compensation adjustments, although these came in a more challenging environment for recruitment and retention. The increase in deposit insurance premiums reflected a return to normalized levels for premiums after the Company benefitted from one-time assessment credits for much of the prior fiscal year. Data processing expenses were reduced due to inclusion in the prior fiscal year’s results of charges relating to the Central Federal acquisition, including contract termination charges, and other expenses were lower due in part to losses recognized in fiscal 2020 on disposal of former bank facilities that had been obtained in earlier acquisitions.
Provision for Income Taxes. The Company recorded an income tax provision of $12.5 million for fiscal 2021, an increase of $5.6 million, or 81.9%, as compared to the prior fiscal year, attributable to higher pre-tax income, and an increase in the Company’s effective tax rate, to 21.0% for fiscal 2021, as compared to 20.0% for fiscal 2020. The higher effective tax rate was attributable primarily to reduced tax-advantaged investments relative to the Company’s pre-tax income.
COMPARISON OF OPERATING RESULTS FOR THE YEARS ENDED JUNE 30, 2020 AND 2019
Net Income. The Company’s net income available for the fiscal year ended June 30, 2020, was $27.5 million, a decrease of $1.4 million, or 4.7%, as compared to the prior fiscal year.
Net Interest Income. Net interest income for fiscal 2020 was $80.1 million, an increase of $7.4 million, or 10.1%, when compared to the prior fiscal year. The increase, as compared to the prior fiscal year, was attributable to an 11.8% increase in the average balance of interest-earning assets, partially offset by a decline in the net interest margin, from 3.78% to 3.72%. Average earning asset balance growth was due in part to the full-year effect of the mid-fiscal 2019 Gideon Acquisition and organic growth, a portion of which was attributable to the PPP loans originated in the fourth quarter of the fiscal year. The late fiscal 2020 Central Federal Acquisition contributed a relatively small amount to average earning asset growth for the fiscal year. Accretion of fair value discount on loans and amortization of fair value premiums on time deposits related to the Peoples Acquisition was $300,000 in fiscal 2020, as compared to $765,000 in fiscal 2019. Accretion of fair value discount on loans and amortization of fair value premiums on time deposits related to the Capaha Acquisition was $238,000 in fiscal 2020, as compared to $1.1 million in fiscal 2019. Accretion of fair value
64
discount on loans and amortization of fair value premiums on time deposits related to the SMB-Marshfield Acquisition was $192,000 in fiscal 2020, as compared to $274,000 in fiscal 2019. Accretion of fair value discount on loans and amortization of fair value premiums on time deposits related to the Gideon Acquisition was $1.1 million in fiscal 2020, as compared to $808,000 in fiscal 2019 , due to the mid-fiscal 2019 timing of the acquisition, as compared to the full-year effect in fiscal 2020. Accretion of fair value discount on loans and amortization of fair value premiums on time deposits related to the Central Federal Acquisition was $23,000 in fiscal 2020, with no comparable contribution in fiscal 2019. In total, these components of net interest income contributed an additional eight basis points to the net interest margin in fiscal 2020, as compared to a contribution of 15 basis points in fiscal 2019. Partially offsetting the decline in the accretion of fair value discount on acquired loans, the Company saw material benefits from the resolution of a limited number of nonperforming loans, at $767,000, while there was no comparable material item in the prior fiscal year, contributing an additional four basis points to the net interest margin in fiscal 2020.
Interest Income. Interest income for fiscal 2020 was $107.1 million, an increase of $9.6 million, or 9.8%, when compared to the prior fiscal year. The increase was due to an increase of $227.9 million, or 11.8%, in the average balance of interest-earning assets, partially offset by a nine basis point decrease in the average yield earned on interest-earning assets, from 5.06% in fiscal 2019, to 4.97% in fiscal 2020.
Interest income on loans receivable for fiscal 2020 was $102.1 million, an increase of $9.8 million, or 10.6%, when compared to the prior fiscal year. The increase was due to a $220.1 million increase in the average balance of loans receivable, partially offset by a nine basis point decrease in the average yield earned on loans receivable. The decrease in the average yield was attributed primarily to origination and repricing of loans and borrower refinancing as market interest rates declined somewhat early in the fiscal year, followed by more significant declines later in the fiscal year as the economy was impacted by the COVID-19 pandemic. Additionally, a reduction in discount accretion on acquired loan portfolios, from $3.0 million in fiscal 2019 to $1.9 million in fiscal 2020, reduced the average yield on loans by eight basis points, while interest income of $767,000 attributable to resolution of a limited number of nonperforming loans in fiscal 2020, with no comparable material items in fiscal 2019, increased the average yield on loans by four basis points.
Interest income on the investment portfolio and other interest-earning assets was $4.9 million for fiscal 2020, a decrease of $232,000, or 4.5%, when compared to the prior fiscal year. The decrease was due to a 23 basis point decrease in the average yield earned on these assets, partially offset by a $7.8 million increase in the average balance of these assets.
Interest Expense. Interest expense was $26.9 million for fiscal 2020, an increase of $2.2 million, or 9.0%, when compared to the prior fiscal year. The increase was due to an increase of $183.3 million, or 11.1%, in the average balance of interest-bearing liabilities, partially offset by a three basis point decrease in the average rate paid on interest-bearing liabilities, from 1.50% in fiscal 2019, to 1.47% in fiscal 2020.
Interest expense on deposits was $24.1 million for fiscal 2020, an increase of $2.9 million, or 13.6%, when compared to the prior fiscal year. The increase was due primarily to the $193.0 million increase in the average balance of those deposits, combined with a two basis point increase in the average rate paid on interest-bearing deposits. The increase in the average rate paid on deposits was attributable primarily to market increases in rates paid to depositors over prior periods, especially through the third quarter of fiscal 2019. The pace of increases in average deposit rates began to slow in the first quarter of fiscal 2020, followed by a modest decline in the second quarter, and more substantial declines in the third and fourth quarters of fiscal 2020.
Interest expense on FHLB advances was $1.9 million for fiscal 2020, a decrease of $445,000, or 18.7%, when compared to the prior fiscal year. The decrease was due to a 36 basis point decrease in the average rate paid on FHLB advances, combined with a $5.1 million decrease in the average balance of these advances. The decrease in the average rate paid was attributable primarily to market declines in borrowing rates available on average during the fiscal year, as compared to the prior year.
Provision for Loan Losses. The provision for loan losses was $6.0 million for fiscal 2020, an increase of $4.0 million, or 195.4%, as compared to the prior fiscal year. The increase in provision was attributed primarily to uncertainty regarding the economic environment resulting from the COVID-19 pandemic and the potential impact on the Company’s
65
borrowers, a related increase in the level of watch status loans, and a modest increase in net charge offs. These factors were partially offset by a reduction in adversely classified, nonperforming (See: Financial Condition – Loans), and delinquent loans, and by slower loan growth as compared to the prior fiscal year, exclusive of the 100% SBA-guaranteed PPP loans and acquired loans subject to purchase accounting. In fiscal 2020, net charge offs were $766,000, or 0.04% as a percentage of average loans outstanding, as compared to $343,000, or 0.02% as a percentage of average loans outstanding, for the prior fiscal year. At June 30, 2020, classified loans totaled $24.5 million, or 1.13% of gross loans, as compared to $28.3 million, or 1.51% of gross loans, at June 30, 2019, with the decrease primarily the result of the resolution of classified loans acquired in the Gideon Acquisition, which included classified loans carried at a fair value of $9.1 million at June 30, 2020, as compared to $13.5 million at June 30, 2019. Classified loans were comprised primarily of commercial real estate, residential real estate, and commercial operating loans. All loans so designated were classified due to concerns as to the borrowers’ ability to continue to generate sufficient cash flows to service the debt.
The above provision was made based on management’s analysis of the various factors which affect the loan portfolio and management’s desire to maintain the allowance at a level considered adequate. Management performed a detailed analysis of the loan portfolio, including types of loans, the charge-off history, and an analysis of the allowance for loan losses. Management also considered the continued origination of loans secured by commercial and agricultural real estate, and commercial and agricultural operating loans, which bear an inherently higher level of credit risk. Management believed the allowance for loan losses at June 30, 2020, was adequate to cover all losses inherent in the portfolio; however, there remained significant uncertainty regarding the possible length of the COVID-19 pandemic and the aggregate impact that it will have on global and regional economies, including uncertainty regarding the effectiveness of recent efforts by the U.S. government and Federal Reserve to respond to the pandemic and its economic impact. Management considered the impact of the pandemic on its consumer and business borrowers, particularly those business borrowers most affected by efforts to contain the pandemic, including our borrowers in the retail and multi-tenant retail industry, restaurants, and hotels.
Noninterest Income. Noninterest income was $14.8 million for fiscal 2020, an increase of $1.7 million, or 12.7%, when compared to the prior fiscal year. The increase was attributable in part to the full year impact of the mid-fiscal 2019 Gideon Acquisition, and consisted primarily of higher bank card interchange income, gains realized on the sale of residential real estate loans originated for that purpose, and deposit account service charges. These increases were partially offset by lower earnings on bank owned life insurance (BOLI), which decreased in part due to the inclusion in the prior period’s results of a $346,000 nonrecurring benefit, gains on the sale of available-for-sale securities, loan servicing fees, and other loan fees. Bank card interchange income increased on higher activity levels and benefits under a new affiliation contract. Gains realized on the sale of residential real estate loans originated for that purpose increased primarily due to refinancing activity, and the Company saw increases in the dollar amount of loans serviced. However, the fair value of mortgage servicing rights was impaired due to the lower rate environment, and charges to recognize that impairment resulted in lower noninterest income. Deposit account service charges increased for the full fiscal year as compared to the prior fiscal year, but were notably weak in the fourth quarter of the current fiscal year, reflecting reduced consumer behavior and reduced NSF charges as account balances were higher.
Noninterest Expense. Noninterest expense was $54.5 million for fiscal 2020, an increase of $6.6 million, or 13.7%, when compared to the prior fiscal year. The increase in noninterest expense was attributable in part to the full year impact of the mid-fiscal 2019 Gideon Acquisition, and resulted primarily from higher compensation expense, occupancy and data processing expenses, amortization of core deposit intangibles, advertising, and other operating expenses, including expenses related to and losses on the disposition of foreclosed real estate and provision for off-balance sheet credit exposure. These increases were partially offset by decreases in FDIC deposit insurance assessments, as the Company benefitted from the FDIC’s application of credits against the deposit insurance assessments due from smaller banks, such as the Company’s subsidiary, resulting in no deposit insurance premium expense for the Company for much of the current fiscal year. The credits were exhausted, and the expense will return to a normalized level for the fiscal year that will end June 30, 2021. In total, fiscal 2020 results included $1.2 million in merger-related charges, as compared to $829,000 in comparable expenses for the prior fiscal year.
Provision for Income Taxes. The Company recorded an income tax provision of $6.9 million for fiscal 2020, a decrease of $160,000, or 2.3%, as compared to the prior fiscal year, attributable to lower pre-tax income, partially offset
66
by an increase in the Company’s effective tax rate, to 20.0% for fiscal 2020, as compared to 19.6% for fiscal 2019. The higher effective tax rate was attributable primarily to reduced tax-advantaged investments.
LIQUIDITY AND CAPITAL RESOURCES
Southern Missouri’s primary potential sources of funds include deposit growth, FHLB advances, amortization and prepayment of loan principal, investment maturities and sales, and capital generated from ongoing operations. While scheduled repayments on loans and securities as well as the maturity of short-term investments are a relatively predictable source of funding, deposit flows, FHLB advance redemptions and loan and security prepayment rates are significantly influenced by factors outside of the Bank’s control, including general economic conditions and market competition. The Bank has relied on FHLB advances as a source for funding cash or liquidity needs.
Southern Missouri uses its liquid assets as well as other funding sources to meet ongoing commitments, to fund loan demand, to repay maturing certificates of deposit and FHLB advances, to make investments, to fund other deposit withdrawals and to meet operating expenses. At June 30, 2021, the Bank had outstanding commitments to extend credit of $491.6 million (including $315.0 million in unused lines of credit). Total commitments to originate fixed-rate loans with terms in excess of one year were $134.5 million at rates ranging from 2.25% to 5.00%, with a weighted-average rate of 4.04%. Management anticipates that current funding sources will be adequate to meet foreseeable liquidity needs.
For the fiscal year ended June 30, 2021, Southern Missouri increased deposits by $146.0 million. The Company decreased FHLB advances by $12.5 million. During the prior fiscal year, Southern Missouri increased deposits by $291.2 million, and discontinued its offering of securities sold under agreements, resulting in a decline of $4.4 million. The Company increased FHLB advances by $25.1 million during the prior fiscal year. At June 30, 2021, the Bank had reported $769.8 million of its single-family residential and commercial real estate loan portfolios as eligible collateral to the FHLB for available credit of approximately $440.9 million, of which $57.5 million was advanced, while $351,000 was encumbered in relation to residential real estate loans sold onto the secondary market through FHLB, and none was utilized for the issuance of letters of credit to secure public unit deposits. The Bank had also pledged $263.8 million of its agricultural real estate and agricultural operating and equipment loans to the Federal Reserve Bank of St. Louis’s discount window for available credit of approximately $216.8 million, as of June 30, 2021, none of which was advanced. In addition, the Bank has the ability to identify eliglbe loans within several of its other loan portfolios, including, for example, its multi-family residential real estate, home equity, or commercial business loans, for additional credit availability with the FHLB. In total, FHLB borrowings are limited to 45% of Bank assets, or approximately $1.2 billion as most recently reported by the FHLB on June 30, 2021, which means that an amount up to $1.1 billion may still be eligible to be borrowed from the FHLB, subject to available collateral. Along with the ability to borrow from the FHLB and Federal Reserve Bank of St. Louis, management believes its liquid resources will be sufficient to meet the Company’s liquidity needs.
Liquidity management is an ongoing responsibility of the Bank’s management. The Bank adjusts its investment in liquid assets based upon a variety of factors including (i) expected loan demand and deposit flows, (ii) anticipated investment and FHLB advance maturities, (iii) the impact on profitability, and (iv) asset/liability management objectives.
At June 30, 2021, the Bank had $358.8 million in CDs maturing within one year and $1.8 billion in other deposits without a specified maturity, as compared to $499.4 million in CDs maturing within one year and $1.5 billion in other deposits without a specified maturity as of June 30, 2020. Management believes that most maturing interest-bearing liabilities will be retained or replaced by new interest-bearing liabilities. Also, at June 30, 2021, the Bank had no overnight advances from the FHLB, $24.3 million in term FHLB advances maturing within one year, and $33.3 million in FHLB advances with a maturity date in excess of one year. Of the advances with maturity dates in excess of one year, $5.0 million was eligible for early redemption by the lender within one year.
REGULATORY CAPITAL
Federally insured financial institutions are required to maintain minimum levels of regulatory capital. Federal Reserve regulations establish capital requirements, including a tier 1 leverage (or core capital) requirement and risk-
67
based capital requirements. The Federal Reserve Board is also authorized to impose capital requirements in excess of these standards on individual institutions on a case-by-case basis.
At June 30, 2021, the Bank exceeded regulatory capital requirements with tier 1 leverage, total risk-based capital, and tangible common equity capital of $282.6 million, $308.5 million and $282.6 million, respectively. The Bank’s tier 1 capital represented 10.43% of total adjusted assets and 12.79% of total risk-weighted assets, while total risk-based capital was 13.96% of total risk-weighted assets, and tangible common equity capital was 12.79% of total risk-weighted assets. To be considered adequately capitalized, the Bank must maintain tier 1 leverage capital levels of at least 4.0% of adjusted total assets and 6.0% of risk-weighted assets, total risk-based capital of 8.0% of risk-weighted assets, and tangible common equity capital of 4.5% of risk-weighted assets. To be considered well capitalized, the Bank must maintain tier 1 leverage capital levels of at least 5.0% of adjusted total assets and 8.0% of risk-weighted assets, total risk-based capital of 10.0% of risk-weighted assets, and tangible common equity capital of 6.5% of risk-weighted assets.
At June 30, 2021, the Company exceeded regulatory capital requirements with tier 1 leverage, total risk-based capital, and tangible common equity capital of $287.7 million, $315.5 million and $272.5 million, respectively. The Company’s tier 1 capital represented 10.61% of total adjusted assets and 12.93% of total risk-weighted assets, while total risk-based capital was 14.18% of total risk-weighted assets, and tangible common equity capital was 12.25% of total risk-weighted assets. To be considered adequately capitalized, the Company must maintain tier 1 leverage capital levels of at least 4.0% of adjusted total assets and 6.0% of risk-weighted assets, total risk-based capital of 8.0% of risk-weighted assets, and tangible common equity capital of 4.5% of risk weighted assets.
See Item 1 – Business – Regulation, and Note 11 of the Notes to the Consolidated Financial Statements contained in Item 8 of this Form 10-K for additional detail on the Company’s capital requirements.
IMPACT OF INFLATION
The consolidated financial statements and related data presented herein have been prepared in accordance with U.S. generally accepted accounting principles, which require the measurement of financial position and operating results in historical dollars without considering changes in the relative purchasing power of money over time due to inflation. The primary impact of inflation on the operations of the Company is reflected in increased operating costs. Unlike most industrial companies, virtually all of the assets and liabilities of a financial institution are monetary in nature. As a result, changes in interest rates generally have a more significant impact on a financial institution’s performance than does inflation. Interest rates do not necessarily move in the same direction or to the same extent as the prices of goods and services. In the current interest rate environment, liquidity and maturity structure of the Company’s assets and liabilities are critical to the maintenance of acceptable performance levels.
AVERAGE BALANCE, INTEREST AND AVERAGE YIELDS AND RATES
The following table sets forth certain information relating to the Company’s average interest-earning assets and interest-bearing liabilities and reflects the average yield on assets and the average cost of liabilities for the periods indicated. These yields and costs are derived by dividing income or expense by the average balance of assets or liabilities, respectively, for the years indicated. Nonaccrual loans are included with other noninterest-earning assets.
The table also presents information with respect to the difference between the weighted-average yield earned on interest-earning assets and the weighted-average rate paid on interest-bearing liabilities, or interest rate spread, which financial institutions have traditionally used as an indicator of profitability. Another indicator of an institution’s net interest income is its net yield (or net interest margin) on interest-earning assets, which is its net interest income divided by the average balance of interest-earning assets. Net interest income is affected by the interest rate spread and by the
68
relative amounts of interest-earning assets and interest-bearing liabilities. When interest-earning assets approximate or exceed interest-bearing liabilities, any positive interest rate spread will generate net interest income.
| | | | | | | | | | | | | | | | | | | | | | | | | |
| | Years Ended June 30, |
| ||||||||||||||||||||||
| | 2021 | | 2020 | | 2019 |
| ||||||||||||||||||
|
| Average |
| Interest and |
| Yield/ |
| Average |
| Interest and |
| Yield/ |
| Average |
| Interest and |
| Yield/ |
| ||||||
(Dollars in thousands) | | Balance | | Dividends | | Cost |
| Balance | | Dividends | | Cost |
| Balance | | Dividends | | Cost |
| ||||||
Interest-earning assets: | | | | | | | | | | | | | | | | | | | | | | | | | |
Mortgage loans (1) | | $ | 1,664,650 | | $ | 84,319 | | 5.07 | % | $ | 1,506,098 | | $ | 77,906 | | 5.17 | % | $ | 1,346,952 | | $ | 69,911 | | 5.19 | % |
Other loans (1) | | | 505,350 | | | 20,758 | | 4.11 | | | 455,562 | | | 24,223 | | 5.32 | | | 394,625 | | | 22,417 | | 5.68 | |
Total net loans | |
| 2,170,000 | |
| 105,077 |
| 4.84 | |
| 1,961,660 | |
| 102,129 |
| 5.21 | |
| 1,741,577 | |
| 92,328 |
| 5.30 | |
Mortgage-backed securities | | | 121,149 | | | 2,042 | | 1.69 | | | 121,079 | | | 2,802 | | 2.31 | | | 102,500 | | | 2,704 | | 2.64 | |
Investment securities (2) | | | 71,489 | | | 2,130 | | 2.98 | | | 62,985 | | | 1,992 | | 3.16 | | | 77,305 | | | 2,323 | | 3.01 | |
Other interest-earning assets | | | 97,548 | | | 226 | | 0.23 | | | 7,767 | | | 129 | | 1.66 | | | 4,209 | | | 127 | | 3.02 | |
TOTAL INTEREST- EARNING ASSETS (1) | |
| 2,460,186 | |
| 109,475 |
| 4.45 | |
| 2,153,491 | |
| 107,052 |
| 4.97 | |
| 1,925,591 | |
| 97,482 |
| 5.06 | |
Other noninterest-earning assets (3) | | | 170,336 | | | — | | — | | | 186,019 | | | — | | — | | | 172,440 | | | — | | — | |
TOTAL ASSETS | | $ | 2,630,522 | | | 109,475 |
| — | | $ | 2,339,510 | | | 107,052 |
| — | | $ | 2,098,031 | | | 97,482 |
| — | |
| | | | | | | | | | | | | | | | | | | | | | | | | |
Interest-bearing liabilities: | |
|
| |
|
|
|
| |
|
| |
|
|
|
| |
|
| |
|
|
|
| |
Savings accounts | | $ | 203,493 | | | 566 | | 0.28 | | $ | 167,458 | | | 1,099 | | 0.66 | | $ | 161,379 | | | 1,179 | | 0.73 | |
NOW accounts | | | 861,796 | | | 5,036 | | 0.58 | | | 679,277 | | | 6,529 | | 0.96 | | | 585,077 | | | 5,920 | | 1.01 | |
Money market accounts | | | 241,534 | | | 833 | | 0.34 | | | 211,059 | | | 2,654 | | 1.26 | | | 155,263 | | | 2,146 | | 1.38 | |
Certificates of deposit | | | 618,884 | | | 8,454 | | 1.37 | | | 667,987 | | | 13,802 | | 2.07 | | | 631,110 | | | 11,963 | | 1.90 | |
TOTAL INTEREST- BEARING DEPOSITS | |
| 1,925,707 | |
| 14,889 |
| 0.77 | |
| 1,725,781 | |
| 24,084 |
| 1.40 | |
| 1,532,829 | |
| 21,208 |
| 1.38 | |
Borrowings: | |
|
| |
|
|
|
| |
|
| |
|
|
|
| |
|
| |
|
|
|
| |
Securities sold under agreements to repurchase | | | — | | | — | | — | | | 82 | | | — | | 0.03 | | | 3,988 | | | 36 | | 0.90 | |
FHLB advances | | | 65,896 | | | 1,366 | | 2.07 | | | 87,241 | | | 1,932 | | 2.21 | | | 92,371 | | | 2,377 | | 2.57 | |
Note payable | |
| — | |
| — |
| — | |
| 2,547 | |
| 112 |
| 4.39 | |
| 3,239 | |
| 158 |
| 4.88 | |
Junior subordinated debt | | | 15,193 | | | 534 | | 3.51 | | | 15,093 | | | 788 | | 5.22 | | | 14,994 | | | 921 | | 6.14 | |
TOTAL INTEREST- BEARING LIABILITIES | |
| 2,006,796 | |
| 16,789 |
| 0.84 | |
| 1,830,744 | |
| 26,916 |
| 1.47 | |
| 1,647,421 | |
| 24,700 |
| 1.50 | |
Noninterest-bearing demand deposits | | | 343,643 | | | — | | — | | | 244,090 | | | — | | — | | | 220,368 | | | — | | — | |
Other liabilities | | | 13,375 | | | — | | — | | | 16,780 | | | — | | — | | | 10,128 | | | — | | — | |
TOTAL LIABILITIES | |
| 2,363,814 | |
| 16,789 |
| — | |
| 2,091,614 | |
| 26,916 |
| — | |
| 1,877,917 | |
| 24,700 |
| — | |
Stockholders’ equity | |
| 266,708 | |
| — |
| — | |
| 247,896 | |
| — |
| — | |
| 220,114 | |
| — |
| — | |
TOTAL LIABILITIES AND STOCKHOLDERS' EQUITY | | $ | 2,630,522 | | | 16,789 |
| — | | $ | 2,339,510 | | | 26,916 |
| — | | $ | 2,098,031 | | | 24,700 |
| — | |
| | | | | | | | | | | | | | | | | | | | | | | | | |
Net interest income | |
|
| | $ | 92,686 |
|
| |
|
| | $ | 80,136 |
|
| |
|
| | $ | 72,782 |
|
| |
Interest rate spread (4) | |
|
| |
|
|
| 3.61 | % |
|
| |
|
|
| 3.50 | % |
|
| |
|
|
| 3.56 | % |
Net interest margin (5) | |
|
| |
|
|
| 3.77 | % |
|
| |
|
|
| 3.72 | % |
|
| |
|
|
| 3.78 | % |
Ratio of average interest-earning assets to average interest-bearing liabilities | |
| 122.59 | % |
|
|
|
| |
| 117.63 | % |
|
|
|
| |
| 116.89 | % |
|
|
|
| |
| (1) | Calculated net of deferred loan fees, loan discounts and loans-in-process. Nonaccrual loans are not included in average loans. |
| (2) | Includes FHLB membership stock, Federal Reserve membership stock, and related cash dividends. |
| (3) | Includes equity securities and related cash dividends. |
| (4) | Represents the difference between the average rate on interest-earning assets and the average cost of interest-bearing liabilities. |
| (5) | Represents net interest income divided by average interest-earning assets. |
69
YIELDS EARNED AND RATES PAID
The following table sets forth for the periods and at the date indicated, the weighted average yields earned on the Company’s assets, the weighted average interest rates paid on the Company’s liabilities, together with the net yield on interest-earning assets.
| | | | | | | | | |
| | At June 30, | | For The Year Ended June 30, |
| ||||
|
| 2021 |
| 2021 |
| 2020 |
| 2019 |
|
Weighted-average yield on loan portfolio |
| 4.41 | % | 4.84 | % | 5.21 | % | 5.30 | % |
Weighted-average yield on mortgage-backed securities |
| 1.77 |
| 1.69 |
| 2.31 |
| 2.64 | |
Weighted-average yield on investment securities (1) |
| 2.86 |
| 2.98 |
| 3.16 |
| 3.01 | |
Weighted-average yield on other interest-earning assets |
| 0.19 |
| 0.23 |
| 1.66 |
| 3.02 | |
Weighted-average yield on all interest-earning assets |
| 4.08 |
| 4.45 |
| 4.97 |
| 5.06 | |
Weighted-average rate paid on interest-bearing deposits |
| 0.60 |
| 0.77 |
| 1.40 |
| 1.38 | |
Weighted-average rate paid on securities sold under agreements to repurchase |
| — |
| — |
| 0.03 |
| 0.90 | |
Weighted-average rate paid on FHLB advances |
| 1.97 |
| 2.07 |
| 2.21 |
| 2.57 | |
Weighted-average rate paid on note payable |
| — |
| — |
| 4.39 |
| 4.88 | |
Weighted-average rate paid on subordinated debt |
| 3.37 |
| 3.51 |
| 5.22 |
| 6.14 | |
Weighted-average rate paid on all interest-bearing liabilities |
| 0.66 |
| 0.84 |
| 1.47 |
| 1.50 | |
Interest rate spread (spread between weighted average rate on all interest-earning assets and all interest- bearing liabilities) |
| 3.42 |
| 3.61 |
| 3.50 |
| 3.56 | |
Net interest margin (net interest income as a percentage of average interest-earning assets) |
| 3.55 |
| 3.77 |
| 3.72 |
| 3.78 | |
| (1) | Includes Federal Home Loan Bank, Federal Reserve Bank stock. |
70
RATE/VOLUME ANALYSIS
The following table sets forth the effects of changing rates and volumes on net interest income of the Company. Information is provided with respect to (i) effects on interest income attributable to changes in volume (changes in volume multiplied by prior rate), (ii) effects on interest income attributable to changes in rate (changes in rate multiplied by prior volume), and (iii) changes in rate/volume (change in rate multiplied by change in volume).
| | | | | | | | | | | | | | | | | | | | | | | | |
| | Years Ended June 30, | | Years Ended June 30, | ||||||||||||||||||||
| | 2021 Compared to 2020 | | 2020 Compared to 2019 | ||||||||||||||||||||
| | Increase (Decrease) Due to | | Increase (Decrease) Due to | ||||||||||||||||||||
| | | |
| | |
| Rate/ |
| | | | | |
| | |
| Rate/ |
| | | ||
(Dollars in thousands) |
| Rate | | Volume | | Volume | | Net |
| Rate | | Volume | | Volume | | Net | ||||||||
Interest-earning assets: | | | | | | | | | | | | | | | | | | | | | | | | |
Loans receivable (1) | | $ | (7,128) | | $ | 10,848 | | $ | (772) | | $ | 2,948 | | $ | (1,671) | | $ | 11,722 | | $ | (250) | | $ | 9,801 |
Mortgage-backed securities | |
| (761) | |
| 2 | |
| (1) | |
| (760) | |
| (332) | |
| 490 | |
| (60) | |
| 98 |
Investment securities (2) | |
| (115) | |
| 269 | |
| (15) | |
| 139 | |
| 120 | |
| (431) | |
| (21) | |
| (332) |
Other interest-earning deposits | |
| (111) | |
| 1,486 | |
| (1,278) | |
| 97 | |
| (58) | |
| 108 | |
| (48) | |
| 2 |
Total net change in income on interest-earning assets | |
| (8,115) | |
| 12,605 | |
| (2,066) | |
| 2,424 | |
| (1,941) | |
| 11,889 | |
| (379) | |
| 9,569 |
| | | | | | | | | | | | | | | | | | | | | | | | |
Interest-bearing liabilities: | |
|
| |
|
| |
|
| |
|
| |
|
| |
|
| |
|
| |
|
|
Deposits | |
| (9,796) | |
| 1,359 | |
| (758) | |
| (9,195) | |
| 509 | |
| 2,466 | |
| (101) | |
| 2,874 |
Securities sold under agreements to repurchase | | | — | | | — | | | — | | | — | | | (35) | | | (35) | | | 34 | | | (36) |
FHLB advances | |
| (124) | | | (473) | |
| 31 | |
| (566) | |
| (332) | | | (132) | |
| 19 | |
| (445) |
Note payable | |
| — | |
| (112) | |
| — | |
| (112) | |
| (16) | |
| (34) | |
| 4 | |
| (46) |
Subordinated debt | |
| (257) | |
| 5 | |
| (1) | |
| (253) | |
| (139) | |
| 6 | |
| — | |
| (133) |
Total net change in expense on interest-bearing liabilities | |
| (10,177) | |
| 779 | |
| (728) | |
| (10,126) | |
| (13) | |
| 2,271 | |
| (44) | |
| 2,214 |
Net change in net interest income | | $ | 2,062 | | $ | 11,826 | | $ | (1,338) | | $ | 12,550 | | $ | (1,928) | | $ | 9,618 | | $ | (335) | | $ | 7,355 |
| (1) | Does not include interest on loans placed on nonaccrual status. |
| (2) | Does not include dividends earned on equity securities. |
Item 7A Quantitative and Qualitative Disclosures About Market Risk
The goal of the Company’s asset/liability management strategy is to manage the interest rate sensitivity of both interest-earning assets and interest-bearing liabilities in order to maximize net interest income without exposing the Company to an excessive level of interest rate risk. The Company employs various strategies intended to manage the potential effect that changing interest rates may have on future operating results. The primary asset/liability management strategy has been to focus on matching the anticipated repricing intervals of interest-earning assets and interest-bearing liabilities. At times, however, depending on the level of general interest rates, the relationship between long- and short-term interest rates, market conditions and competitive factors, the Company may increase its interest rate risk position in order to maintain its net interest margin.
In an effort to manage the interest rate risk resulting from fixed rate lending, the Company has at times utilized longer term (up to 10 year maturities), fixed-rate FHLB advances, which may be subject to early redemption, to offset interest rate risk. Other elements of the Company’s current asset/liability strategy include: (i) increasing originations of commercial real estate, commercial business loans, agricultural real estate, and agricultural operating lines, which typically provide higher yields and shorter repricing periods, but inherently increase credit risk, (ii) limiting the price volatility of the investment portfolio by maintaining a relatively short weighted average maturity, (iii) actively soliciting less rate-sensitive nonmaturity deposits, and (iv) offering competitively priced money market accounts and CDs with
71
maturities of up to five years. The degree to which each segment of the strategy is achieved will affect profitability and exposure to interest rate risk.
The Company continues to generate long-term, fixed-rate residential loans. During the fiscal year ended June 30, 2021, fixed rate residential loan originations totaled $311.5 million (of which $152.9 million was originated for sale into the secondary market), compared to $186.9 million during the prior year (of which $72.2 million was originated for sale into the secondary market). At June 30, 2021, the fixed-rate, single-family residential loan portfolio totaled $346.9 million, with a weighted average maturity of 187 months, compared to $257.7 million with a weighted average maturity of 156 months at June 30, 2020. The Company originated $18.5 million in adjustable rate residential loans during the fiscal year ended June 30, 2021, compared to $28.0 million during the prior fiscal year. At June 30, 2021, fixed rate loans with remaining maturities in excess of 10 years totaled $220.1 million, or 10.0%, of loans receivable, compared to $128.4 million, or 6.0%, of loans receivable, at June 30, 2020. The Company originated $399.2 million in fixed rate commercial, commercial real estate, and multifamily loans during the year ended June 30, 2021, compared to $472.2 million during the prior fiscal year. The Company also originated $63.3 million in adjustable rate commercial, commercial real estate, and multifamily loans during the fiscal year ended June 30, 2021, compared to $33.9 million during the prior fiscal year. At June 30, 2021, adjustable-rate home equity lines of credit totaled $37.8 million, compared to $43.2 million as of June 30, 2020. At June 30, 2021, the Company’s weighted average life of its investment portfolio was 4.7 years, compared to 3.3 years at June 30, 2020. At June 30, 2021, CDs with original terms of two years or more totaled $249.9 million, compared to $252.3 million at June 30, 2020.
INTEREST RATE SENSITIVITY ANALYSIS
The following table sets forth as of June 30, 2021 and 2020, management’s estimates of the projected changes in net portfolio value in the event of 100, 200, and 300 basis point, instantaneous and permanent increases or decreases in market interest rates.
Computations in the table below are based on prospective effects of hypothetical changes in interest rates and are based on an internally generated model using the actual maturity and repricing schedules for Southern Bank’s loans and deposits, adjusted by management’s assumptions for prepayment rates and deposit runoff. Further, the computations do not consider any reactions that the Bank may undertake in response to changes in interest rates. These projected changes should not be relied upon as indicative of actual results in any of the aforementioned interest rate changes.
Management cannot accurately predict future interest rates or their effect on the Company’s NPV and net interest income in the future. Certain shortcomings are inherent in the method of analysis presented in the computation of NPV and net interest income. For example, although certain assets and liabilities may have similar maturities or periods of repricing, they may react in different degrees to changes in market interest rates. Also, the interest rates on certain types of assets and liabilities may fluctuate in advance of changes in market interest rates, while interest rates on other types of assets and liabilities may lag behind changes in market interest rates. Additionally, most of Southern Bank’s loans have features which restrict changes in interest rates on a short-term basis and over the life of the asset. Further, in the event of a change in interest rates, prepayment and early withdrawal levels would likely deviate significantly from those assumed in calculating the foregoing table. Finally, the ability of many borrowers to service their debt may decrease in the event of an interest rate increase.
| | | | | | | | | | | | | |
June 30, 2021 |
| ||||||||||||
| | | | | | | | | | NPV as Percentage of |
| ||
| | Net Portfolio | | PV of Assets |
| ||||||||
Change in Rates |
| Value |
| Change |
| % Change |
| NPV Ratio |
| Change |
| ||
| | (Dollars in thousands) | | (%) | | (basis points) | | ||||||
+300 bp | | $ | 252,800 | | $ | (46,274) |
| (15) | | 10.05 | | (96) | |
+200 bp | |
| 277,898 | |
| (21,176) |
| (7) | | 10.76 | | (25) | |
+100 bp | |
| 297,372 | |
| (1,702) |
| (1) | | 11.23 | | 21 | |
0 bp | |
| 299,074 | |
| — |
| — | | 11.01 | | — | |
‑100 bp | |
| 334,713 | |
| 35,638 |
| 12 | | 12.11 | | 109 | |
‑200 bp | |
| 347,520 | |
| 48,446 |
| 16 | | 12.51 | | 149 | |
‑300 bp | |
| 352,759 | |
| 53,685 |
| 18 | | 12.67 | | 165 | |
72
| | | | | | | | | | | | | |
June 30, 2020 |
| ||||||||||||
| | | | | | | | | | NPV as Percentage of |
| ||
| | Net Portfolio | | PV of Assets |
| ||||||||
Change in Rates |
| Value |
| Change |
| % Change |
| NPV Ratio |
| Change |
| ||
| | (Dollars in thousands) | | (%) | | (basis points) | | ||||||
+300 bp | | $ | 238,832 | | $ | (16,824) |
| (7) | | 9.99 | | (7) | |
+200 bp | |
| 251,461 | |
| (4,196) |
| (2) | | 10.31 | | 25 | |
+100 bp | |
| 262,302 | |
| 6,645 |
| 3 | | 10.53 | | 47 | |
0 bp | |
| 255,657 | |
| — |
| — | | 10.06 | | — | |
‑100 bp | |
| 268,902 | |
| 13,245 |
| 5 | | 10.49 | | 43 | |
‑200 bp | |
| 277,452 | |
| 21,795 |
| 9 | | 10.79 | | 73 | |
‑300 bp | |
| 283,773 | |
| 28,116 |
| 11 | | 11.01 | | 95 | |
The Company has worked to limit its exposure to rising rates in the current historically low rate environment by (a) increasing the share of funding on its balance sheet obtained from non-maturity transaction accounts, (b) limiting FHLB borrowings and (c) limiting the duration of its available-for-sale investment portfolio.
Item 8. Financial Statements and Supplementary Information
73
Stockholders, Board of Directors
and Audit Committee
Southern Missouri Bancorp, Inc.
Poplar Bluff, Missouri
Opinion on the Financial Statements
We have audited the accompanying consolidated balance sheets of Southern Missouri Bancorp, Inc. (“Company”) as of June 30, 20192021 and 20182020 and the related consolidated statements of income, comprehensive income, stockholders’ equity and cash flows for each of the years in the three-year period ended June 30, 2019,2021, and the related notes (collectively referred to as the “financial statements”). In our opinion, the consolidated financial statements referred to above present fairly, in all material respects, the financial position of the Company as of June 30, 20192021 and 2018,2020, and the results of its operations and its cash flows for each of the years in the three year period ended June 30, 2019,2021, in conformity with accounting principles generally accepted in the United States of America.
We have also audited, in accordance with the standards of the Public Company Accounting Oversight Board (United States) (“PCAOB”), the Company’s internal control over financial reporting as of June 30, 20192021 based on criteria established in Internal Control-Integrated Framework (2013) issued by the Committee of Sponsoring Organizations of the Treadway Commission (COSO) and our report dated September 13, 2019,2021, expressed an unqualified opinion.
Adoption of New Accounting Standard
As discussed in Notes 1 and 3 to the consolidated financial statements, the Company has changed its method of accounting for the allowance for credit losses effective July 1, 2020 due to the adoption of Accounting Standards Codification (ASC) Topic 326, Financial Instruments-CreditLosses. As discussed below, the allowance for credit losses is considered a critical audit matter.
Basis for Opinion
These financial statements are the responsibility of the Company’s management. Our responsibility is to express an opinion on the Company’s financial statements based on our audits.
We are a public accounting firm registered with the PCAOB and are required to be independent with respect to the Company in accordance with the U.S. federal securities laws and the applicable rules and regulations of the Securities and Exchange Commission and the PCAOB.
We conducted our audits in accordance with the standards of the PCAOB. Those standards require that we plan and perform the audits to obtain reasonable assurance about whether the financial statements are free of material misstatement, whether due to error or fraud. Our audits included performing procedures to assess the risks of material misstatement of the financial statements, whether due to error or fraud, and performing procedures that respond to those risks. Such procedures include examining, on a test basis, evidence supporting the amounts and disclosures in the financial statements. Our audits also included evaluating the accounting principles used and significant estimates made by management, as well as evaluating the overall presentation of the financial statements. We believe that our audits provide a reasonable basis for our opinion.
74
Critical Audit Matter
The critical audit matter communicated below is a matter arising from the current period audit of the financial statements that was communicated or required to be communicated to the audit committee and that: (1) relates to accounts or disclosures that are material to the financial statements and (2) involved especially challenging, subjective or complex judgments. The communication of the critical audit matter does not alter in any way our opinion on the consolidated financial statements, taken as a whole, and we are not, by communicating the critical audit matter below, providing a separate opinion on the critical audit matter or on the accounts or disclosures to which it relates.
Allowances for Credit Losses
The Company’s loan portfolio totaled $2.2 billion as of June 30, 2021 and the associated allowance for credit losses on loans was $33.2 million. The Company’s unfunded loan commitments totaled $318.7 million, with an associated allowance for credit loss of $1.8 million. Together these amounts represent the allowances for credit losses (“ACL”). As discussed in Notes 1 and 3 to the consolidated financial statements, the allowance for credit losses related to loans is a contra-asset valuation account that is deducted from the amortized cost basis of loans to present the net amount expected to be collected. As discussed in Notes 1 and 3 to the consolidated financial statements, the allowance for credit losses related to unfunded commitments is a liability account and is included in other liabilities. The amount of each allowance account represented management’s best estimate of current expected credit losses on these financial instruments considering all relevant available information, from internal and external sources, relevant to assessing exposure to credit loss over the contractual term of the instrument.
In calculating the allowance for credit losses, loans were segmented into pools based upon similar risk characteristics. For each of these loan pools, management measured expected credit losses over the life of each loan utilizing either a remaining life model or a discounted cash flow (DCF) model. The remaining life model used historical internal and peer loss rates applied to the estimated remaining life of each pool. For the DCF model, management generates cash flow projections at the instrument level adjusting payment expectations for estimated prepayment speed, curtailments, time to recovery, probability of default and loss given default. The Company uses regression analysis of historical internal and peer data to determine suitable loss drivers while modeling lifetime probability of default and loss given default. The Company’s analysis also determines how expected probability of default and loss given default will react to forecasted levels of the loss drivers. The models were adjusted to reflect the current impact of certain macroeconomic variables as well as their expected changes over a reasonable and supportable forecast period. After the reasonable and supportable forecast period, the forecasted macroeconomic variables were reverted to their historical mean utilizing a rational, systematic basis. Additional qualitative adjustments are applied for risk factors that are not considered within the modeling process but are relevant in assessing the expected credit losses within the loan pools. Loans that do not share risk characteristics are evaluated on an individual basis, which may be based on the fair value of the collateral or a discounted cash flow model of expected cash flows. For unfunded commitments, the Company applies expected funding percentages to the respective model loss rates based on similar risk characteristics to estimate the allowance for credit losses.
Auditing management’s estimate of the ACL and allowance for unfunded commitments involves a high degree of subjectivity due to the complexities of the key assumptions used, such as applicable loss drivers for collectively evaluated segments of the loan portfolio and the timing and amount of cash flows for individually analyzed loans. Management’s identification and measurement of the qualitative factor adjustments is highly judgmental and had a significant effect on the ACL. There was a high degree of auditor judgment involved, due to the significant judgments made by management related to significant assumptions used and related uncertainty in determining the ACL. Therefore, there was an increased level of audit effort when performing audit procedures to evaluate ACL.
75
How We Addressed the Matter in Our Audit
The primary procedures we performed related to this CAM included:
| ● | Obtained an understanding of the Company’s process for establishing the ACL, including the implementation of models and assumptions and the qualitative factor adjustments of the ACL |
| ● | Evaluated and tested the design and operating effectiveness of related controls over the reliability and accuracy of data used to calculate and estimate the various components of the ACL including: |
| o | Loan data completeness and accuracy |
| o | Grouping of loans based on similar risk characteristics |
| o | Use of historical internal data and external peer data |
| o | Model inputs utilized |
| o | Approval of model assumptions selected |
| o | Establishment of qualitative factors |
| o | Loan risk ratings |
| ● | Tested the mathematical accuracy of the calculation of the ACL |
| ● | Performed reviews of individual credit files and internally prepared loan review reports and support to evaluate the reasonableness of loan credit risk ratings |
| ● | Tested the completeness and accuracy, including the evaluation of the relevance and reliability, of inputs utilized in the calculation of the ACL |
| ● | Evaluated the reasonableness of selected loss drivers utilized and loss driver forecasts for loan segments |
| ● | Tested the reasonableness of specific allowances on individually reviewed loans |
| ● | Evaluated analytically credit quality trends in delinquencies, non-accruals, charge-offs and loan risk ratings |
| ● | Evaluated the overall reasonableness of the ACL considering trends identified within peer groups |
| ● | Tested significant assumptions used in the estimation of the ACL of unfunded loan commitments |
| ● | Evaluated qualitative adjustments made to the ACL, including assessing the reasonableness and basis for those adjustments in estimating the ACL |
/s/ BKD, LLP
We have served as the Company’s auditor since 2002.
Decatur, Illinois
September 13, 20192021
76
| (dollars in thousands) | 2019 | 2018 | ||||||
Assets | ||||||||
| Cash and cash equivalents | $ | 35,400 | $ | 26,326 | ||||
| Interest-bearing time deposits | 969 | 1,953 | ||||||
| Available for sale securities (Note 2) | 165,535 | 146,325 | ||||||
| Stock in FHLB of Des Moines | 5,233 | 5,661 | ||||||
| Stock in Federal Reserve Bank of St. Louis | 4,350 | 3,566 | ||||||
| Loans receivable, net of allowance for loan losses of $19,903 and $18,214 at June 30, 2019 and June 30, 2018, respectively (Notes 3 and 4) | 1,846,405 | 1,563,380 | ||||||
| Accrued interest receivable | 10,189 | 7,992 | ||||||
| Premises and equipment, net (Note 5) | 62,727 | 54,832 | ||||||
| Bank owned life insurance – cash surrender value | 38,337 | 37,547 | ||||||
| Goodwill | 14,089 | 13,078 | ||||||
| Other intangible assets, net | 9,239 | 6,918 | ||||||
| Prepaid expenses and other assets | 21,929 | 18,537 | ||||||
| TOTAL ASSETS | $ | 2,214,402 | $ | 1,886,115 | ||||
Liabilities and Stockholders' Equity | ||||||||
| Deposits (Note 6) | $ | 1,893,695 | $ | 1,579,902 | ||||
| Securities sold under agreements to repurchase (Note 7) | 4,376 | 3,267 | ||||||
| Advances from FHLB of Des Moines (Note 8) | 44,908 | 76,652 | ||||||
| Note payable (Note 9) | 3,000 | 3,000 | ||||||
| Accounts payable and other liabilities | 12,889 | 6,449 | ||||||
| Accrued interest payable | 2,099 | 1,206 | ||||||
| Subordinated debt (Note 10) | 15,043 | 14,945 | ||||||
| TOTAL LIABILITIES | 1,976,010 | 1,685,421 | ||||||
| Commitments and contingencies (Note 15) | ||||||||
| Common stock, $.01 par value; 25,000,000 and 12,000,000 shares authorized; 9,324,659 and 8,996,584 shares issued, respectively, at June 30, 2019 and June 30, 2018 | 93 | 90 | ||||||
| Additional paid-in capital | 94,541 | 83,413 | ||||||
| Retained earnings | 143,677 | 119,536 | ||||||
| Treasury stock of 35,351 and 0 shares at June 30, 2019 and June 30, 2018, respectively, at cost | (1,166 | ) | - | |||||
| Accumulated other comprehensive income (loss) | 1,247 | (2,345 | ) | |||||
| TOTAL STOCKHOLDERS' EQUITY | 238,392 | 200,694 | ||||||
| TOTAL LIABILITIES AND STOCKHOLDERS' EQUITY | $ | 2,214,402 | $ | 1,886,115 | ||||
| | | | | | |
(dollars in thousands) |
| 2021 |
| 2020 | ||
Assets | | | | | | |
Cash and cash equivalents | | $ | 123,592 | | $ | 54,245 |
Interest-bearing time deposits | |
| 979 | |
| 974 |
Available for sale securities (Note 2) | |
| 207,020 | |
| 176,524 |
Stock in FHLB of Des Moines | |
| 5,873 | |
| 6,390 |
Stock in Federal Reserve Bank of St. Louis | |
| 5,031 | |
| 4,363 |
Loans receivable, net of ACL of $33,222 and ALLL of $25,139 at June 30, 2021 and June 30, 2020, respectively (Note 3) | |
| 2,200,244 | |
| 2,141,929 |
Accrued interest receivable | |
| 10,079 | |
| 12,116 |
Premises and equipment, net (Note 5) | |
| 64,077 | |
| 65,106 |
Bank owned life insurance – cash surrender value | |
| 43,817 | |
| 43,363 |
Goodwill | |
| 14,089 | |
| 14,089 |
Other intangible assets, net | |
| 7,129 | |
| 7,700 |
Prepaid expenses and other assets | |
| 18,600 | |
| 15,358 |
TOTAL ASSETS | | $ | 2,700,530 | | $ | 2,542,157 |
| | | | | | |
Liabilities and Stockholders' Equity | |
|
| |
|
|
Deposits (Note 6) | | $ | 2,330,803 | | $ | 2,184,847 |
Advances from FHLB (Note 7) | |
| 57,529 | |
| 70,024 |
Accounts payable and other liabilities | |
| 12,753 | |
| 12,151 |
Accrued interest payable | |
| 779 | |
| 1,646 |
Subordinated debt (Note 8) | |
| 15,243 | |
| 15,142 |
TOTAL LIABILITIES | |
| 2,417,107 | |
| 2,283,810 |
| | | | | | |
Commitments and contingencies (Note 12) | | | | | | |
| | | | | | |
Common stock, $.01 par value; 25,000,000 shares authorized; 9,361,629 and 9,345,339 shares issued, respectively, at June 30, 2021 and June 30, 2020 | |
| 94 | |
| 93 |
Additional paid-in capital | |
| 95,585 | |
| 95,035 |
Retained earnings | |
| 200,140 | |
| 165,709 |
Treasury stock of 456,431 and 217,949 shares at June 30, 2021 and June 30, 2020, respectively, at cost | |
| (15,278) | |
| (6,937) |
Accumulated other comprehensive income | |
| 2,882 | |
| 4,447 |
TOTAL STOCKHOLDERS' EQUITY | |
| 283,423 | |
| 258,347 |
TOTAL LIABILITIES AND STOCKHOLDERS' EQUITY | | $ | 2,700,530 | | $ | 2,542,157 |
See accompanying notes to consolidated financial statements.
77
YEARS ENDED JUNE 30, 2019, 20182021, 2020 AND 2017
Southern Missouri Bancorp, Inc.
| (dollars in thousands except per share data) | 2019 | 2018 | 2017 | |||||||||
Interest Income: | ||||||||||||
| Loans | $ | 92,328 | $ | 73,122 | $ | 57,988 | ||||||
| Investment securities | 2,323 | 2,166 | 1,975 | |||||||||
| Mortgage-backed securities | 2,704 | 1,817 | 1,496 | |||||||||
| Other interest-earning assets | 127 | 69 | 29 | |||||||||
| TOTAL INTEREST INCOME | 97,482 | 77,174 | 61,488 | |||||||||
Interest Expense: | ||||||||||||
| Deposits | 21,208 | 12,825 | 8,472 | |||||||||
| Securities sold under agreements to repurchase | 36 | 37 | 95 | |||||||||
| Advances from FHLB of Des Moines | 2,377 | 1,041 | 1,138 | |||||||||
| Note payable | 158 | 121 | 13 | |||||||||
| Subordinated debt | 921 | 767 | 648 | |||||||||
| TOTAL INTEREST EXPENSE | 24,700 | 14,791 | 10,366 | |||||||||
| NET INTEREST INCOME | 72,782 | 62,383 | 51,122 | |||||||||
| Provision for loan losses (Note 3) | 2,032 | 3,047 | 2,340 | |||||||||
| NET INTEREST INCOME AFTER PROVISION FOR LOAN LOSSES | 70,750 | 59,336 | 48,782 | |||||||||
Noninterest income: | ||||||||||||
| Deposit account charges and related fees | 5,005 | 4,584 | 3,824 | |||||||||
| Bank card interchange income | 4,658 | 3,775 | 2,864 | |||||||||
| Loan late charges | 463 | 432 | 432 | |||||||||
| Loan servicing fees | 376 | 801 | 397 | |||||||||
| Other loan fees | 1,360 | 1,467 | 1,146 | |||||||||
| Net realized gains on sale of loans | 771 | 804 | 840 | |||||||||
| Net realized gains on sale of AFS securities | 244 | 334 | - | |||||||||
| Earnings on bank owned life insurance | 1,329 | 947 | 1,135 | |||||||||
| Other income | 964 | 727 | 446 | |||||||||
| TOTAL NONINTEREST INCOME | 15,170 | 13,871 | 11,084 | |||||||||
Noninterest expense: | ||||||||||||
| Compensation and benefits | 26,379 | 23,302 | 19,406 | |||||||||
| Occupancy and equipment, net | 10,625 | 9,763 | 8,418 | |||||||||
| Deposit insurance premiums | 661 | 517 | 681 | |||||||||
| Legal and professional fees | 965 | 1,178 | 1,233 | |||||||||
| Advertising | 1,161 | 1,197 | 1,102 | |||||||||
| Postage and office supplies | 772 | 729 | 561 | |||||||||
| Intangible amortization | 1,672 | 1,457 | 911 | |||||||||
| Bank card network fees | 2,120 | 1,580 | 1,150 | |||||||||
| Other operating expense | 5,614 | 4,752 | 4,790 | |||||||||
| TOTAL NONINTEREST EXPENSE | 49,969 | 44,475 | 38,252 | |||||||||
| INCOME BEFORE INCOME TAXES | 35,951 | 28,732 | 21,614 | |||||||||
| Income Taxes (Note 11) | ||||||||||||
| Current | 6,972 | 8,333 | 4,899 | |||||||||
| Deferred | 75 | (530 | ) | 1,163 | ||||||||
| 7,047 | 7,803 | 6,062 | ||||||||||
| NET INCOME | $ | 28,904 | $ | 20,929 | $ | 15,552 | ||||||
| Basic earnings per share available to common stockholders | $ | 3.14 | $ | 2.40 | $ | 2.08 | ||||||
| Diluted earnings per share available to common stockholders | $ | 3.14 | $ | 2.39 | $ | 2.07 | ||||||
| Dividends paid | $ | 0.52 | $ | 0.44 | $ | 0.40 | ||||||
| | | | | | | | | |
(dollars in thousands except per share data) |
| 2021 |
| 2020 |
| 2019 | |||
Interest Income: | | | | | | | | | |
Loans | | $ | 105,077 | | $ | 102,129 | | $ | 92,328 |
Investment securities | | | 2,130 | | | 1,992 | | | 2,323 |
Mortgage-backed securities | | | 2,042 | | | 2,802 | | | 2,704 |
Other interest-earning assets | | | 226 | | | 129 | | | 127 |
TOTAL INTEREST INCOME | | | 109,475 | | | 107,052 | | | 97,482 |
Interest Expense: | | | | | | | | | |
Deposits | | | 14,889 | | | 24,084 | | | 21,208 |
Securities sold under agreements to repurchase | | | — | | | — | | | 36 |
Advances from FHLB | | | 1,366 | | | 1,932 | | | 2,377 |
Note payable | | | — | | | 112 | | | 158 |
Subordinated debt | | | 534 | | | 788 | | | 921 |
TOTAL INTEREST EXPENSE | | | 16,789 | | | 26,916 | | | 24,700 |
NET INTEREST INCOME | | | 92,686 | | | 80,136 | | | 72,782 |
Provision for credit losses (Note 3) | | | (1,024) | | | 6,002 | | | 2,032 |
NET INTEREST INCOME AFTER PROVISION FOR LOAN LOSSES | | | 93,710 | | | 74,134 | | | 70,750 |
Noninterest income: | | |
| | |
| | |
|
Deposit account charges and related fees | | | 5,254 | | | 5,680 | | | 5,005 |
Bank card interchange income | | | 3,913 | | | 3,073 | | | 2,581 |
Loan late charges | | | 587 | | | 573 | | | 463 |
Loan servicing fees | | | 1,454 | | | 196 | | | 376 |
Other loan fees | | | 1,200 | | | 1,258 | | | 1,360 |
Net realized gains on sale of loans | | | 3,980 | | | 1,630 | | | 771 |
Net realized gains on sale of AFS securities | | | 90 | | | — | | | 244 |
Earnings on bank owned life insurance | | | 1,800 | | | 1,021 | | | 1,329 |
Other income | | | 1,764 | | | 1,319 | | | 964 |
TOTAL NONINTEREST INCOME | | | 20,042 | | | 14,750 | | | 13,093 |
Noninterest expense: | | |
| | |
| | |
|
Compensation and benefits | | | 31,010 | | | 29,336 | | | 26,379 |
Occupancy and equipment, net | | | 7,880 | | | 7,288 | | | 6,586 |
Data processing expense | | | 4,812 | | | 5,173 | | | 3,545 |
Telecommunications expense | | | 1,261 | | | 1,263 | | | 1,137 |
Deposit insurance premiums | | | 766 | | | 155 | | | 661 |
Legal and professional fees | | | 1,093 | | | 969 | | | 965 |
Advertising | | | 1,080 | | | 1,227 | | | 1,161 |
Postage and office supplies | | | 796 | | | 804 | | | 772 |
Intangible amortization | | | 1,395 | | | 1,771 | | | 1,672 |
Foreclosed property expenses/losses | | | 142 | | | 992 | | | 442 |
Provision for off balance sheet credit exposure | | | — | | | 648 | | | 149 |
Other operating expense | | | 3,812 | | | 4,826 | | | 4,423 |
TOTAL NONINTEREST EXPENSE | | | 54,047 | | | 54,452 | | | 47,892 |
INCOME BEFORE INCOME TAXES | | | 59,705 | | | 34,432 | | | 35,951 |
Income Taxes (Note 9) | | | | | | | | | |
Current | | | 10,844 | | | 6,890 | | | 6,972 |
Deferred | | | 1,681 | | | (3) | | | 75 |
| | | 12,525 | | | 6,887 | | | 7,047 |
NET INCOME | | $ | 47,180 | | $ | 27,545 | | $ | 28,904 |
| | | | | | | | | |
Basic earnings per share | | $ | 5.22 | | $ | 3.00 | | $ | 3.14 |
Diluted earnings per share | | $ | 5.22 | | $ | 2.99 | | $ | 3.14 |
Dividends paid | | $ | 0.62 | | $ | 0.60 | | $ | 0.52 |
See accompanying notes to consolidated financial statements.
78