Washington, D.C. 20549
FORM 10-K/A10-K
Annual Report Pursuant to Section 13 or 15(d) of
the
the
Securities Exchange Act of 1934
For the fiscal year ended December 31, | Commission file number 000-21329 |
TIB FINANCIAL CORP.
(Exact Name of Registrant as Specified in Its Charter )Charter)
Florida | ||
(State of Incorporation) | 65-0655973 (I.R.S. Employer Identification No.) | |
599 9th Street North Suite 101 Naples, Florida (Address of Principal Executive Offices) | 34102 (Zip Code) | |
(239) 263-3344
(Registrant’s telephone number)
Securities Registered pursuant to Section 12(b) | ||
Securities Registered pursuant to Section 12(g) of the Act: None | ||
Indicate by check mark if the registrant is a well-known seasoned issuer, as defined in Rule 405 of the Securities Act. ¨ Yes or þ No | ||
Check if the issuer is not required to file reports pursuant to Section 13 or Section 15(d) of the Act. ¨ | ||
Check whether the issuer (1) has filed all reports required to be filed by Section 13 or 15(d) of the Securities Exchange Act of 1934 during the preceding 12 months (or for such shorter period that the issuer was required to file such reports), and (2) has been subject to such filing requirements for the past 90 days. þ Yes or ¨ No | ||
Check if there is no disclosure of delinquent filers pursuant to Item 405 of Regulation S-K contained in this form, and will not be contained, to the best of issuer’s knowledge, in definitive proxy or information statements incorporated by reference in Part III of this Form 10-K or any amendment to this Form 10-K. þ | ||
| Indicate by check mark whether the registrant is a large accelerated filer, an accelerated filer, or a non-accelerated filer. See definition of “accelerated filer and large accelerated filer” in Rule 12b-2 of the Exchange Act. | ||
Large accelerated filer ¨ | Accelerated filer þ | Non-accelerated filer ¨ |
Indicate by check mark whether the registrant is a shell company (as defined in Rule 12b-2 of the Exchange Act). ¨ Yes or þ No | ||
The aggregate market value of the voting stock held by non-affiliates of the registrant as of June 30, 2007 was approximately $164,753,000 based on the $12.85 per share closing price on June 29, 2007. | ||
The number of shares outstanding of issuer’s class of common stock at February 29, 2008 was 12,787,649 shares of common stock. | ||
| Documents Incorporated By Reference: Portions of the Proxy Statement for the 2008 Annual Meeting of Shareholders to be filed with the Securities and Exchange Commission within 120 days of the Registrant’s 2007 fiscal year end are incorporated by reference into Parts II and III of this report. | ||
| PART I | Page | |
| ITEM 1 | 1 | |
| ITEM 1A | 12 | |
| ITEM 1B | 19 | |
| ITEM 2 | 20 | |
| ITEM 3 | 21 | |
| ITEM 4 | 21 | |
| PART II | ||
| ITEM 5 | 21 | |
| ITEM 6 | 23 | |
| ITEM 7 | 25 | |
| ITEM 7A | 50 | |
| ITEM 8 | 51 | |
| ITEM 9 | 93 | |
| ITEM 9A | 93 | |
| ITEM 9B | 94 | |
| PART III | ||
| ITEM 10 | 95 | |
| ITEM 11 | 95 | |
| ITEM 12 | 95 | |
| ITEM 13 | 95 | |
| ITEM 14 | 95 | |
| PART IV | ||
| ITEM 15 | 96 | |
CAUTIONARY NOTICE REGARDING FORWARD LOOKING STATEMENTS
Certain of the matters discussed under the caption “Management's Discussion and Analysis of Financial Condition and Results of Operations” and elsewhere in this Annual Report on Form 10-K may constitute “forward-looking statements” within the meaning of the Private Securities Litigation Reform Act and as such may involve known and unknown risk, uncertainties and other factors which may cause the actual results, performance or achievements of TIB Financial Corp. (the “Company”) to be materially different from future results described in such forward-looking statements. Actual results may differ materially from the results anticipated in these forward-looking statements due to a variety of factors, including, without limitation: the effects of future economic conditions; governmental monetary and fiscal policies, as well as legislative and regulatory changes; the risks of changes in interest rates on the level and composition of deposits, loan demand, and the values of loan collateral, and interest rate risks; the effects of competition from other commercial banks, thrifts, consumer finance companies, and other financial institutions operating in the Company’s market area and elsewhere. All forward-looking statements attributable to the Company are expressly qualified in their entirety by these cautionary statements. The Company disclaims any intent or obligation to update these forward-looking statements, whether as a result of new information, future events or otherwise.
PART I
As used in this document, the terms “we,” “us,” “our,” “TIB Financial,” and “Company” mean TIB Financial Corp. and its subsidiaries (unless the context indicates another meaning); the term “Banks” mean TIB Bank (and its subsidiaries) and The Bank of Venice (unless the context indicates another meaning).
General
We are a financial holding company headquartered in Naples, Florida, whose business is conducted primarily through our wholly-owned subsidiaries, TIB Bank, The Bank of Venice and Naples Capital Advisors, Inc. Together we have twenty full-service banking offices in Florida that are located in Monroe, Miami-Dade, Collier, Lee, Highlands, and Sarasota counties. TIB Bank, which was formed in 1974, serves the Southern Florida market while The Bank of Venice serves the Sarasota County market. At December 31, 2007, we had approximately $1.44 billion in total assets, $1.05 billion in total deposits, $1.11 billion in total loans, and $96.2 million in shareholder’s equity. The Banks’ deposits are insured by the Federal Deposit Insurance Corporation (FDIC), up to applicable limits.
Through the Banks, we offer a wide range of commercial and retail banking and financial services to businesses and individuals. Our account services include checking, interest-bearing checking, money market, savings, certificates of deposit and individual retirement accounts. We offer all types of commercial loans, including: owner-operated commercial real estate; acquisition, development and construction; income-producing properties; working capital; inventory and receivable facilities; and equipment loans. We also offer a full complement of consumer loan products including residential real estate, installment loans, home equity, home equity lines, and indirect auto dealer loans. Our lending focus is predominantly on small to medium-sized business and consumer borrowers. Most importantly, we provide our customers with access to local officers who are empowered to act with flexibility to meet customers' needs in an effort to foster and develop long-term loan and deposit relationships. Through Naples Capital Advisors, Inc., we offer wealth management and advisory services.
We are subject to examination and regulation by the Board of Governors of the Federal Reserve System, the Florida Office of Financial Regulation, and the FDIC. This regulation is intended for the protection of our depositors, not our shareholders.
Business Strategy
Our business strategy is to operate as a profitable, diversified financial services company providing a variety of banking and other financial services, with an emphasis on consumer and residential mortgage lending, commercial business loans to small and medium-sized businesses and private banking and wealth management. As a result of the consolidation of small and medium-sized financial institutions, we believe there is a significant opportunity for a community-focused bank to provide a full range of financial services to small and middle-market commercial and retail customers. We emphasize comprehensive retail and small business products and responsive, decentralized decision-making which reflects our knowledge of our local markets and customers.
To continue asset growth and profitability, our marketing strategy is targeted to:
| · | Provide customers with access to our local executives who make key credit and account decisions; |
| · | Pursue commercial lending opportunities with small to mid-sized businesses which we believe are underserved by our larger competitors; |
| · | Continue originating indirect auto dealer loans to diversify our sources of loans and revenue and enhance our net interest margin and generate attractive risk adjusted returns; |
| · | Cross-sell our products and services to our existing customers to leverage our relationships and enhance profitability; and |
| · | Adhere to safe and sound credit standards to maintain the continued quality of assets as we implement our growth strategy. |
Banking services
Commercial Banking. The Banks focus their commercial loan originations on established small and mid-sized businesses, professionals and professional organizations in their market areas. These loans are usually accompanied by cash management services and deposit relationships. The Banks provide commercial real estate loans to finance the acquisition and development of owner operated properties; acquisition, development and construction of investment properties; builder construction lines of credit; and the purchase of income-producing properties, including office buildings, industrial buildings, self-storage, hotel/motel, medical centers, marinas, retail and shopping centers. The Banks offer a complete range of commercial loan products, including revolving lines of credit for working capital and term loans for the acquisition of equipment, funding property improvements or other business related expenses. Commercial underwriting is driven by cash flow repayment analysis along with the additional support provided by collateral and the principals involved with the loan.
Retail Banking. Retail banking activities emphasize consumer deposit and checking accounts. An extensive range of these services is offered by the Banks to meet the varied needs of its customers from young persons to senior citizens. In addition to traditional products and services, the Banks offer contemporary products and services, such as debit cards, Internet banking and electronic bill payment services. Consumer loan products offered by the Banks include home equity lines of credit, second mortgages, new and used auto loans, including indirect loans through auto dealers, new and used boat loans, overdraft protection, and unsecured personal credit lines.
Mortgage Banking. The Banks’ mortgage banking business is structured to provide a source of fee income largely from the process of originating mortgages for sale in the secondary market (primarily fixed rate loans), as well as the origination of primarily adjustable rate loans to be held in the Banks’ loan portfolio. Mortgage banking capabilities include conventional and nonconforming mortgage underwriting; and construction and permanent financing.
Lending activities
Loan Portfolio Composition. At December 31, 2007, the Banks' loan portfolios totaled $1.13 billion, representing approximately 78% of our total assets of $1.44 billion. For a discussion of our loan portfolio, see “Management's Discussion of Financial Condition and Results of Operation - Loan Portfolio.”
The composition of the Banks’ loan portfolio at December 31, 2007 and 2006 is indicated below, along with the growth from the prior year
| (Dollars in thousands) | Total Loans December 31, 2007 | % of Total Loans | Total Loans December 31, 2006 | % of Total Loans | % Increase (Decrease) from December 31, 2006 to 2007 | |||||||||||||||
| Real estate mortgage loans: | ||||||||||||||||||||
| Commercial | $ | 612,084 | 54 | % | $ | 546,276 | 51 | % | 12 | % | ||||||||||
| Residential | 112,138 | 10 | % | 82,243 | 8 | % | 36 | % | ||||||||||||
| Farmland | 11,361 | 1 | % | 24,210 | 2 | % | (53 | %) | ||||||||||||
| Construction and vacant land | 168,595 | 15 | % | 157,672 | 15 | % | 7 | % | ||||||||||||
| Commercial and agricultural loans | 72,076 | 6 | % | 84,905 | 8 | % | (15 | %) | ||||||||||||
| Indirect auto dealer loans | 117,439 | 11 | % | 141,552 | 13 | % | (17 | %) | ||||||||||||
| Home equity loans | 21,820 | 2 | % | 17,199 | 2 | % | 27 | % | ||||||||||||
| Other consumer loans | 12,154 | 1 | % | 9,795 | 1 | % | 24 | % | ||||||||||||
| Total | $ | 1,127,667 | 100.0 | % | $ | 1,063,852 | 100.0 | % | 6 | % | ||||||||||
Commercial Real Estate Mortgage Loans. At December 31, 2007, the Banks’ commercial real estate loan portfolio totaled $612.1 million. The Banks also have $11.4 million in loans outstanding that are secured by farmland. The Banks originate commercial mortgages secured by office and retail buildings, hotels, bed and breakfast inns, and multi-purpose warehouse buildings. Although terms may vary, the Banks’ commercial mortgages generally are long term in nature, owner-occupied or owner operated, and variable-rate loans. The Banks seek to reduce the risks associated with commercial mortgage lending by generally lending in their market area and obtaining periodic financial statements and tax returns from borrowers. Commercial real estate loans are underwritten with future cash flows as the primary source of repayment. It is also the Banks’ general policy to obtain personal guarantees from the principals of the borrowers and assignments of all leases related to the collateral.
Commercial Loans. At December 31, 2007, the Banks’ commercial loan portfolio totaled $72.1 million. The Banks originate secured and unsecured loans for business purposes. Loans are made for acquisition, expansion, and working capital purposes and may be secured by real estate, accounts receivable, inventory, equipment or other assets. The financial condition and cash flow of commercial borrowers are closely monitored by the submission of corporate financial statements, personal financial statements and income tax returns.
Construction Loans. At December 31, 2007, the Banks’ construction loan portfolio totaled $168.6 million. The Banks provide interim real estate acquisition development and construction loans to builders, developers, and the owner-occupants of the building. Real estate development and construction loans to provide interim financing on the property are based on acceptable percentages of the appraised value of the property securing the loan in each case. Real estate development and construction loan funds are disbursed periodically at pre-specified stages of completion. Interest rates on these loans are generally adjustable. The Banks carefully monitor these loans with on-site inspections and control of disbursements.
Development and construction loans are secured by the properties under development or construction and personal guarantees are typically obtained. Further, to assure that reliance is not placed solely in the value of the underlying property, the Banks consider the market conditions and feasibility of the proposed project, the financial condition and reputation of the borrower and any guarantors, the amount of the borrower’s equity in the project, independent appraisals, costs estimates and pre-construction sale information.
Loans to individuals for the construction of their primary or secondary residences are secured by the property under construction. The loan to value ratio of construction loans is based on the lesser of the cost to construct or the appraised value of the completed home. Construction loans generally have a maturity of 12 months. These construction loans to individuals may be converted to permanent loans upon completion of construction.
Residential Real Estate Mortgage Loans. At December 31, 2007, the Banks’ residential loan portfolio totaled $112.1 million. The Banks originate adjustable and fixed-rate residential mortgage loans. Such mortgage loans are generally originated under terms, conditions and documentation acceptable to the secondary mortgage market. The Banks will place some of these, primarily adjustable rate, loans into our portfolio, although the majority of loans originated are sold to investors.
Indirect Auto Dealer Loans. At December 31, 2007, TIB Bank's indirect auto dealer loans portfolio totaled $117.4 million. TIB Bank buys loans that have been originated by automobile dealerships—this is commonly referred to as indirect lending. We predominately buy loans from auto dealers in Southwest Florida and they are for the purchase of new or late model used cars. We serve customers over a broad range of creditworthiness and the required terms and rates are reflective of those risk profiles.
The balance of outstanding indirect loans declined in 2007 as we reacted to local economic conditions by implementing more stringent underwriting criteria and reducing the volume of our originations. We expect new production in 2008 to be less than loan principal repayments causing the total amount of indirect loans held in the portfolio to decline during the year.
We strive to deliver attractive risk adjusted returns while maintaining credit quality in our indirect lending operations due to a combination of factors including:
| · | Business with a limited number of dealers - The dealerships we do business with are characterized by being very sound financially and trade predominately in vehicles which retain market value reasonably well over time. We continually monitor dealers for compliance with our lending guidelines. We endeavor to be one of the main buyers of loans from every dealer we do business with which allows us to have a cooperative relationship with that dealer. |
| · | Thorough underwriting of applicants - We evaluate credit scores and other pertinent information such as the stability of the applicant's job, home ownership, and the nature of any credit issues which may give us a better indication of creditworthiness than just the credit score. |
| · | Effective collections - We get to customers quickly and more often as payment issues arise. We begin contacting the customer once their payment is 10 days past due. After an account is 15 days past due, it is referred to a collection company for resolution including field contacts as necessary. |
Other Consumer Loans and Home Equity Loans. At December 31, 2007, the Banks’ consumer loan portfolios totaled $12.2 million, and their home equity portfolios totaled $21.8 million. The Banks offer a variety of consumer loans. These loans are typically secured by residential real estate or personal property, including automobiles and boats. Home equity loans (closed-end and lines of credit) are typically made up to 85% of the appraised value of the property securing the loan, in each case, less the amount of any existing liens on the property. Closed-end loans have terms of up to 15 years. Lines of credit have an original maturity of 10 years. The interest rates on closed-end home equity loans are fixed, while interest rates on home equity lines of credit are variable.
Credit administration
The Banks’ lending activities are governed by written policies approved by their boards of directors to ensure proper management of credit risk. Loans are subject to a defined credit process that includes repayment analysis of the borrower, risk-rating of credits, establishment of lending limits and application of lending procedures, including the holding of adequate collateral and the maintenance of compensating balances, as well as procedures for on-going identification and management of credit deterioration. Regular portfolio reviews are performed to identify potential underperforming credits, estimate loss exposure, and to ascertain compliance with the Banks’ policies. Management review consists of evaluation of the financial strengths of the borrower and the guarantor, the related collateral and the effects of economic conditions.
The Banks generally do not make commercial or consumer loans outside their market areas unless the borrower has an established relationship with one of the Banks and conducts its principal business operations within the Banks’ market areas. Consequently, the Banks and their borrowers are affected by the economic conditions prevailing in their market areas.
Private Banking and Wealth Management
On January 2, 2008, the Company acquired Naples Capital Advisors, Inc. of Naples, Florida. The investment management company, which has $80 million in assets under advisement from area families and high net worth individuals, became a wholly-owned subsidiary. This acquisition spearheads our entry into a new business line offering private banking, wealth management and trust services throughout our market areas. The Company has applied for trust powers which are expected to be granted by the State of Florida Office of Financial Regulation by mid-summer, 2008.
Merchant Bankcard Processing
Through December 30, 2005, TIB Bank processed credit card transactions for merchants primarily in the Florida Keys. TIB Bank sold the merchant bankcard processing segment to NOVA Information Systems on December 30, 2005. Subsequent to the sale, all historical operating results are reflected as discontinued operations in the accompanying financial statements.
Employees
As of December 31, 2007, the Banks employed 337 full-time employees and 13 part-time employees. Except for certain officers of the Banks who presently serve as officers of the Company, the Company does not have any employees. The Company and its subsidiaries are not a party to any collective bargaining agreement, and management believes the Company and its subsidiaries enjoy satisfactory relations with their employees.
Related Party Transactions
At December 31, 2007, we had $1.13 billion in total loans outstanding, of which $679,000 was outstanding to certain of our executive officers and directors and their related business interests. In the ordinary course of business, the Banks make loans to our directors and their affiliates and to policy-making officers, all of which are made on substantially the same terms, including interest rates and collateral, as those prevailing at the time for comparable transactions and do not involve more than the normal risk of collectibility.
SUPERVISION AND REGULATION
General
We are extensively regulated under federal and state law. Generally, these laws and regulations are intended to protect depositors, not shareholders. The following is a summary description of certain provisions of certain laws that affect the regulation of bank holding companies and banks. The discussion is qualified in its entirety by reference to applicable laws and regulations. Changes in such laws and regulations may have a material effect on our business and prospects, as well as those of the Banks.
Federal Bank Holding Company Regulation and Structure
We are a bank holding company within the meaning of the Bank Holding Company Act of 1956, as amended, and, as such, we are subject to regulation, supervision, and examination by the Federal Reserve. We are required to file annual and quarterly reports with the Federal Reserve and to provide the Federal Reserve with such additional information as it may require. The Federal Reserve may examine us and our subsidiaries.
With certain limited exceptions, we are required to obtain prior approval from the Federal Reserve before acquiring direct or indirect ownership or control of more than 5% of any voting securities or substantially all of the assets of a bank or bank holding company, or before merging or consolidating with another bank holding company. In acting on applications for such approval, the Federal Reserve must consider various statutory factors, including among others, the effect of the proposed transaction on competition in the relevant geographical and product markets, each party’s financial condition and management resources and record of performance under the Community Reinvestment Act. Additionally, with certain exceptions, any person proposing to acquire control through direct or indirect ownership of 25% or more of any of our voting securities is required to give 60 days’ written notice of the acquisition to the Federal Reserve, which may prohibit the transaction, and to publish notice to the public.
Generally, a bank holding company may not engage in any activities other than banking, managing or controlling its bank and other authorized subsidiaries, and providing services to these subsidiaries. With prior approval of the Federal Reserve, we may acquire more than 5% of the assets or outstanding shares of a company engaging in non-bank activities determined by the Federal Reserve to be closely related to the business of banking or of managing or controlling banks. In recent years, changes in law have significantly increased the right of an eligible bank holding company, called a “financial holding company,” to engage in a full range of financial activities, including insurance and securities activities, as well as merchant banking and other financial services. We are a financial holding company and thus have expanded financial affiliation opportunities as long as the Banks remain well-capitalized under the standards discussed below, and also meet certain other requirements. As of December 31, 2007, the Banks met these requirements for our continued qualification as a financial holding company.
Subsidiary banks of a bank holding company are subject to certain quantitative and qualitative restrictions on extensions of credit to the bank holding company or its subsidiaries, investments in their securities, and the use of their securities as collateral for loans to any borrower. These regulations and restrictions may limit our ability to obtain funds from the Banks for our cash needs, including funds for the payment of dividends, interest and operating expenses. Further, a bank holding company and its subsidiaries are prohibited from engaging in certain tie-in arrangements in connection with any extension of credit, lease or sale of property or furnishing of services. For example, the Banks may not generally require a customer to obtain other services from themselves or us, and may not require that a customer promise not to obtain other services from a competitor as a condition to and extension of credit to the customer. The Federal Reserve has ended the anti-tying rules for bank holding companies and their non-banking subsidiaries. Such rules were retained for banks.
Under Federal Reserve policy, a bank holding company is expected to act as a source of financial strength to its subsidiary banks and to make capital injections into a troubled subsidiary bank, and the Federal Reserve may charge the bank holding company with engaging in unsafe and unsound practices for failure to commit resources to a subsidiary bank when required. A required capital injection may be called for at a time when the holding company does not have the resources to provide it. In addition, depository institutions insured by the FDIC can be held liable for any losses incurred by, or reasonably anticipated to be incurred by, the FDIC in connection with the default of, or assistance provided to, a commonly controlled FDIC-insured depository institution.
Federal and State Bank Regulation
The Banks are Florida state-chartered banks, with all the powers of a commercial bank regulated and examined by the Florida Office of Financial Regulation and the FDIC. The FDIC has extensive enforcement authority over the institutions it regulates to prohibit or correct activities that violate law, regulation or written agreement with the FDIC. Enforcement powers also regulate activities that are deemed to constitute unsafe or unsound practices. Enforcement actions may include the appointment of a conservator or receiver, the issuance of a cease and desist order, the termination of deposit insurance, the imposition of civil money penalties on the institution, its directors, officers, employees and institution-affiliated parties, the issuance of directives to increase capital, the issuance of formal and informal agreements, the removal of or restrictions on directors, officers, employees and institution-affiliated parties, and the enforcement of any such mechanisms through restraining orders or other court actions.
In its lending activities, the maximum legal rate of interest, fees and charges that a financial institution may charge on a particular loan depends on a variety of factors such as the type of borrower, the purpose of the loan, the amount of the loan and the date the loan is made. Other laws tie the maximum amount that may be loaned to any one customer and its related interest to capital levels. The Banks are also subject to certain restrictions on extensions of credit to executive officers, directors, principal shareholders or any related interest of such persons which generally require that such credit extensions be made on substantially the same terms as are available to third persons dealing with the Banks and not involve more than the normal risk of repayment. The Banks are also subject to federal laws establishing certain record keeping, customer identification and reporting requirements with respect to certain large cash transactions, sales of travelers’ checks or other monetary instruments, and international transportation of cash or monetary instruments. Further, under the USA Patriot Act of 2001, financial institutions, including the Banks, are required to implement additional policies and procedures with respect to, or additional measures designed to address, any or all of the following matters, among others: money laundering, suspicious activities and currency transaction reporting, and currency crimes.
The Community Reinvestment Act requires that, in connection with the examination of financial institutions within their jurisdictions, the FDIC evaluates the record of the financial institution in meeting the credit needs in its communities including low and moderate income neighborhoods, consistent with the safe and sound operation of those banks. These factors are also considered by all regulatory agencies in evaluating mergers, acquisitions and applications to open a branch or facility. As of the date of their most recent examination reports, the Banks have a Community Reinvestment Act rating of “Satisfactory.”
Under the Federal Deposit Insurance Corporation Improvement Act of 1991, each federal banking agency is required to prescribe, by regulation, noncapital safety and soundness standards for institutions under its authority. The federal banking agencies, including the FDIC, have adopted standards covering internal controls, information systems and internal audit systems, loan documentation, credit underwriting, interest rate exposure, asset growth, and compensation, fees and benefits. An institution that fails to meet those standards be subject to regulatory sanctions and/or be required by the agency to develop a plan acceptable to the agency, specifying the steps that the institution will take to meet the standards. We believe that we substantially meet all standards that have been adopted. This law also imposes capital standards on insured depository institutions. See “Capital Requirements” below.
The Federal Deposit Insurance Corporation Improvement Act of 1991 also provides for, among other things, (i) publicly available annual financial condition and management reports for financial institutions, including audits by independent accountants, (ii) the establishment of uniform accounting standards by federal banking agencies, (iii) the establishment of a “prompt corrective action” system of regulatory supervision and intervention, based on capitalization levels with more scrutiny and restrictions placed on depository institutions with lower levels of capital, (iv) additional grounds for the appointment of a conservator or receiver, and (v) restrictions or prohibitions on accepting brokered deposits, except for institutions which significantly exceed minimum capital requirements. FDICIA also provides for increased funding of the FDIC insurance funds and the implementation of risked-based premiums.
Deposit Insurance
As FDIC member institutions, deposits of the Banks are currently insured to the current maximum allowed by law through the Bank Insurance Fund, which is administered by the FDIC.
Limits on Dividends and Other Payments
Our current ability to pay dividends is largely dependent upon the receipt of dividends from the Banks. Both federal and state laws impose restrictions on the ability of the Banks to pay dividends. Federal law prohibits the payment of a dividend by an insured depository institution if the depository institution is considered “undercapitalized” or if the payment of the dividend would make the institution “undercapitalized.” See “Capital Requirements" below. The Federal Reserve has issued a policy statement that provides that bank holding companies should pay dividends only out of the prior year’s net income, and then only if their prospective rate of earnings retention appears consistent with their capital needs, asset quality, and overall financial condition. For a Florida state-chartered bank, dividends may be paid out of the bank’s aggregate net profits for the current year combined with its retained earnings for the preceding two years as the board deems appropriate. No dividends may be paid at a time when a bank’s net income from the preceding two years is a loss or which would cause the capital accounts of the bank to fall below the minimum amount required by law. In addition to these specific restrictions, bank regulatory agencies also have the ability to prohibit proposed dividends by a financial institution that would otherwise be permitted under applicable regulations if the regulatory body determines that such distribution would constitute an unsafe or unsound practice.
Capital Requirements
The Federal Reserve and FDIC have adopted certain risk-based capital guidelines to assist in the assessment of the capital adequacy of a banking organization’s operations for both transactions reported on the balance sheet as assets and transactions, such as letters of credit and recourse arrangements which are recorded as off balance sheet items. Under these guidelines, nominal dollar amounts of assets and credit equivalent amounts of off balance sheet items are multiplied by one of several risk adjustment percentages, which range from 0% for assets with low credit risk, such as certain U.S. Treasury securities, to 200% for assets with relatively high credit risk, such as asset-backed and mortgage-backed securities that are rated below investment grade.
A banking organization’s risk-based capital ratio is obtained by dividing its qualifying capital by its total risk adjusted assets. The regulators measure risk-adjusted assets, which include off balance sheet items, against both total qualifying capital (the sum of Tier 1 capital and limited amounts of Tier 2 capital) and Tier 1 capital. “Tier 1,” or core capital includes common equity, perpetual preferred stock (excluding auction rate issues), trust preferred securities (subject to certain limitations), and minority interest in equity accounts of consolidated subsidiaries (less goodwill and other intangibles), subject to certain exceptions. “Tier 2,” or supplementary capital, includes, among other things limited-life preferred stock, hybrid capital instruments, mandatory convertible securities and trust preferred securities, qualifying and subordinated debt, and the allowance for loan and lease losses, subject to certain limitations and less required deductions. The inclusion of elements of Tier 2 capital is subject to certain other requirements and limitations of the federal banking agencies.
The federal banking agencies are required to take “prompt corrective action” with respect to depository institutions that do not meet minimum capital requirements. As a result, the federal bank regulatory authorities have adopted regulations setting forth a five tiered system for measuring the capital adequacy of the depository institutions that they supervise. Under these regulations, a depository institution is classified in one of the following capital categories: “well capitalized,” “adequately capitalized,” “undercapitalized,” “significantly undercapitalized,” and “critically undercapitalized.” An institution may be deemed by the regulators to be in a capitalization category that is lower than is indicated by its actual capital position if, among other things, it receives an unsatisfactory examination rating with respect to asset quality, management, earnings or liquidity. As of December 31, 2007, the Banks met the definition of a “well-capitalized” institution.
A depository institution generally is prohibited from making any capital distribution (including payment of a cash dividend) or paying any management fees to its holding company if the depository institution would thereafter be undercapitalized. Undercapitalized depository institutions are subject to growth limitations and are required to submit capital restoration plans. If a depository institution fails to submit an acceptable plan, it is treated as if it is significantly undercapitalized. Significantly undercapitalized depository institutions may be subject to a number of other requirements and restrictions including orders to sell sufficient voting stock to become adequately capitalized, requirements to reduce total assets and stop accepting deposits from correspondent banks. Critically undercapitalized institutions are subject to the appointment of a receiver or conservator; generally within 90 days of the date such institution is determined to be critically undercapitalized.
The federal banking agencies also have significantly expanded powers to take enforcement action against institutions that fail to comply with capital or other standards. Such action may include limitations on the right to pay dividends, the issuance by the applicable regulatory authority of a capital directive to increase capital and, in the case of depository institutions, the termination of deposit insurance by the FDIC. The circumstances under which the FDIC is permitted to provide financial assistance to an insured institution before appointment of a conservator or receiver also is limited under law. In addition, future changes in regulations or practices could further reduce the amount of capital recognized for purposes of capital adequacy. Such a change could affect the ability of the Banks to grow and could restrict the amount of profits, if any, available for the payment of dividends to us.
Interstate Banking Legislation
The Riegle-Neal Interstate Banking and Branching Efficiency Act of 1994 (“Riegle-Neal”), subject to certain restrictions, allows adequately capitalized and managed bank holding companies to acquire existing banks across state lines, regardless of state statutes that would prohibit acquisitions by out-of-state institutions. Further, a bank holding company may consolidate interstate bank subsidiaries into branches and a bank may merge with an unaffiliated bank across state lines to the extent that the applicable states authorize such transactions. Florida has a law which permits interstate branching through merger transactions under the federal interstate laws. Under the Florida law, with the prior approval of the Florida Office of Financial Regulation, a Florida bank may establish, maintain and operate one or more branches in a state other than the State of Florida pursuant to a merger transaction in which the Florida bank is the resulting bank. In addition, Florida law provides that one or more Florida banks may enter into a merger transaction with one or more out-of-state banks, and an out-of-state bank resulting from such transaction may maintain and operate branches of a Florida bank that participated in such merger.
Financial Services Modernization
Enacted in 1999, the Graham-Leach-Bliley Act reformed and modernized certain areas of financial services regulations and repealed the affiliation provisions of the federal Glass-Steagall Act of 1933, which, taken together, limited the securities, insurance and other non-banking activities of any company that controls a FDIC insured financial institution. The Act provides that a financial holding company may engage in a full range of financial activities, including insurance and securities sales and underwriting activities, real estate development, and, with certain exceptions, merchant banking activities, with expedited notice procedures. The Act also permits certain qualified national banks to form “financial subsidiaries,” which have broad authority to engage in all financial activities except insurance underwriting, insurance investments, real estate investment or development, and merchant banking, and expands the potential financial activities of subsidiaries of state banks, subject to applicable state law. The range of activities in which bank holding companies and their subsidiaries may engage is not as broad. The law also includes substantive requirements for maintenance of customer financial privacy.
Sarbanes-Oxley Act
In 2002, the Sarbanes-Oxley Act was enacted which imposes a myriad of corporate governance and accounting measures designed so that shareholders have full and accurate information about the public companies in which they invest. All public companies are affected by the Act. Some of the principal provisions of the Act include:
| · | The creation of an independent accounting oversight board to oversee the audit of public companies and auditors who perform such audits; |
| · | Auditor independence provisions which restrict non-audit services that independent accountants may provide to their audit clients; |
| · | Additional corporate governance and responsibility measures which (a) require the chief executive officer and chief financial officer to certify financial statements and to forfeit salary and bonuses in certain situations, and (b) protect whistleblowers and informants; |
| · | Expansion of the authority and responsibilities of the company’s audit, nominating and compensation committees; |
| · | Mandatory disclosure by analysts of potential conflicts of interest; and |
| · | Enhanced penalties for fraud and other violations. |
Other Legislative Considerations
The United States Congress and the Florida Legislature periodically consider and may adopt legislation that results in additional deregulation, among other matters, of banks and other financial institutions. Such legislation could modify or eliminate current prohibitions with other financial institutions, including mutual funds, securities, brokerage firms, insurance companies, banks from other states, and investment banking firms. The effect of any such legislation on our business or that of the Banks cannot be accurately predicted. We cannot predict what legislation might be enacted or what other implementing regulations might be adopted, and if enacted or adopted, the effect on us.
Competition
The banking business is highly competitive. Banks generally compete with other financial institutions through the banking products and services offered, the pricing of services, the level of service provided, the convenience and availability of services, and the degree of expertise and the personal manner in which services are offered. The Banks encounter strong competition from most of the financial institutions in the Banks' primary service areas. In the conduct of certain areas of their banking business, the Banks also compete with credit unions, consumer finance companies, insurance companies, money market mutual funds and other financial institutions, some of which are not subject to the same degree of regulation and restrictions imposed upon the Banks. Many of these competitors have substantially greater resources and lending limits than the Banks have and offer certain services, such as trust services, that the Banks do not provide presently. Management believes that personalized service and competitive pricing is a sustainable competitive advantage that will provide us with a method to compete effectively in our primary service areas.
Monetary Policy
Our earnings are affected by domestic and foreign economic conditions, particularly by the monetary and fiscal policies of the United States government and its agencies. The Federal Reserve has an important impact on the operating results of banks and other financial institutions through its power to implement national monetary policy. The methods used by the Federal Reserve include setting the reserve requirements of banks, establishing the discount rate on bank borrowings and conducting open market transactions in United States Government securities.
FDIC Insurance Assessments
The FDIC insures the deposits of the Banks up to prescribed limits for each depositor. The amount of FDIC assessments paid by each Bank Insurance Fund (BIF) member institution is based on its relative risks of default as measured by regulatory capital ratios and other factors. Specifically, the assessment rate is based on the institution’s capitalization risk category and supervisory subgroup category. An institution’s capitalization risk category is based on the FDIC’s determination of whether the institution is well capitalized, adequately capitalized or less than adequately capitalized. An institution’s supervisory subgroup category is based on the FDIC’s assessment of the financial condition of the institution and the probability that FDIC intervention or other corrective action will be required. The FDIC may terminate insurance of deposits upon a finding that the institution has engaged in unsafe and unsound practices, is in an unsafe or unsound condition to continue operations, or has violated any applicable law, regulation, rule, order, or condition imposed by the FDIC. As a result of the Federal Deposit Insurance Reform Act of 2005, the Banks were assessed deposit insurance on a quarterly basis beginning January 1, 2007. The Banks’ latest assessment rate is approximately 0.06% of total deposits.
Statistical Information
Certain statistical information is found in Item 7, “Management's Discussion and Analysis of Financial Condition and Results of Operations” of this Annual Report on Form 10-K.
RISK FACTORS
Our business is subject to a variety of risks, including the risks described below as well as adverse business conditions and changes in regulations and the local, regional and national economic environment. The risks and uncertainties described below are not the only ones facing us. Additional risks and uncertainties not known to us or not described below which we have not determined to be material may also impair our business operations. You should carefully consider the risks described below, together with all other information in this report, including information contained in the “Business,” “Management’s Discussion and Analysis of Results of Operations and Financial Condition,” and “Quantitative and Qualitative Disclosures about Market Risk” sections. This report contains forward-looking statements that involve risks and uncertainties, including statements about our future plans, objectives, intentions and expectations. Many factors, including those described below, could cause actual results to differ materially from those discussed in forward-looking statements. If any of the following risks actually occur, our business, financial condition and results of operations could be adversely affected, and we may not be able to achieve our goals. Such events may cause actual results to differ materially from expected and historical results, and the trading price of our common stock could decline.
Risks Related to Our Business
Our business strategy includes the continuation of significant growth plans, and if we fail to grow or fail to manage our growth effectively as we pursue our strategy, it could negatively affect our results of operations
We intend to continue pursuing a significant growth strategy for our business. Our prospects must be considered in light of the risks, expenses and difficulties frequently encountered by companies in significant growth stages of development. We cannot assure you that we will be able to expand our market presence in our existing markets or successfully enter new markets or that any such expansion will not adversely affect our results of operations. Failure to manage our growth effectively could have a material adverse effect on our business, future prospects, financial condition or results of operations, and could adversely affect our ability to successfully implement our business strategy. Also, if our growth occurs more slowly than anticipated or declines, our operating results could be materially adversely affected.
Our ability to successfully grow will depend on a variety of factors including the continued availability of desirable business opportunities, the competitive responses from other financial institutions in our market areas and our ability to manage our growth. While we believe that we have the management resources and internal systems in place to successfully manage our future growth, there can be no assurance that growth opportunities will be available or that growth will be successfully managed.
Our business may face risks with respect to future expansion
We may acquire other financial institutions or parts of financial institutions in the future and we may engage in additional de novo branch expansion. We may also consider and enter into new lines of business or offer new products or services. Acquisitions and mergers involve a number of risks, including:
· | the time and costs associated with identifying and evaluating potential acquisitions and merger partners; |
· | the estimates and judgments used to evaluate credit, operations, management and market risks with respect to the target institution may not be accurate; |
· | the time and costs of evaluating new markets, hiring experienced local management and opening new offices, and the time lags between these activities and the generation of sufficient assets and deposits to support the costs of the expansion; |
· | our ability to finance an acquisition and possible dilution to our existing shareholders; |
· | the diversion of our management’s attention to the negotiation of a transaction, and the integration of the operations and personnel of the combining businesses; |
· | entry into new markets where we lack experience; |
· | the introduction of new products and services into our business; |
· | the incurrence and possible impairment of goodwill associated with an acquisition and possible adverse short-term effects on our results of operations; and |
· | the risk of loss of key employees and customers. |
We may incur substantial costs to expand, and can give no assurance such expansion will result in the levels of profits we seek. There can be no assurance integration efforts for any future mergers or acquisitions will be successful. Also, we may issue equity securities, including common stock and securities convertible into shares of our common stock in connection with future acquisitions, which could cause ownership and economic dilution to our shareholders. There is no assurance that, following any future mergers or acquisitions, our integration efforts will be successful or, after giving effect to the acquisition, that we will achieve profits comparable to, or better than, our historical experience.
Our business is subject to the success of the local economies where it operates
Our success significantly depends upon the growth in population, income levels, deposits and housing starts in our primary and secondary markets. If the communities in which we operate do not grow or if prevailing economic conditions locally or nationally are unfavorable, our business may not succeed. Adverse economic conditions in our specific market area could reduce our growth rate, affect the ability of our customers to repay their loans to us and generally affect our financial condition and results of operations. We are less able than a larger institution to spread the risks of unfavorable local economic conditions across a large number of diversified economies. Moreover, we cannot give any assurance that we will benefit from any market growth or favorable economic conditions in our primary market areas if they do occur.
Any adverse market or economic conditions in the State of Florida may disproportionately increase the risk that our borrowers will be unable to make their loan payments. In addition, the market value of the real estate securing loans as collateral could be adversely affected by unfavorable changes in market and economic conditions. As of December 31, 2007, approximately 82% of our loans held for investment were secured by real estate. Of this amount, approximately 67% were commercial real estate loans, 12% were residential real estate loans and 18% were construction and development loans. Any sustained period of increased payment delinquencies, foreclosures or losses caused by adverse market or economic conditions in the State of Florida could adversely affect the value of our assets, revenues, results of operations and financial condition.
We make and hold in our portfolio a significant number of land acquisition and development and construction loans, which pose more credit risk than other types of loans typically made by financial institutions.
We offer land acquisition and development and construction loans for builders, developers and individuals. As of December 31, 2007, approximately $168.6 million of our loan portfolio represents loans for construction and vacant land. Land acquisition and development and construction loans are considered more risky than other types of loans. The primary credit risks associated with land acquisition and development and construction lending are underwriting, project risks and market risks. Project risks include cost overruns, borrower credit risk, project completion risk, general contractor credit risk, and environmental and other hazard risks. Market risks are risks associated with the sale of the completed residential or commercial units. They include affordability risk, which means the risk of affordability of financing by borrowers, product design risk, and risks posed by competing projects. While we believe we have established adequate reserves on our financial statements to cover the credit risk of our land acquisition and development and construction loan portfolio, there can be no assurance that losses will not exceed our reserves, which could adversely impact our earnings. In February 2008, a $13.5 million commercial land development loan matured and was placed on nonaccrual because the borrowers were unable to service the debt. Non-performing loans in our land acquisition and development and construction portfolio may increase further and these non-performing loans may result in a material level of charge-offs, which may negatively impact our capital and earnings.
If the value of real estate in our core Florida market were to decline materially, a significant portion of our loan portfolio could become under-collateralized, which could have a material adverse effect on us.
With most of our loans concentrated in Southern Florida, a decline in local economic conditions could adversely affect the values of our real estate collateral. Additionally, the availability of property insurance, including windstorm and flood insurance, and the significant increases in the cost thereof in the Florida market may negatively affect borrowers’ abilities to repay existing loans and the abilities of potential borrowers to qualify for new loans. Consequently, a decline in local economic conditions may have a greater effect on our earnings and capital than on the earnings and capital of larger financial institutions whose real estate loan portfolios are geographically diverse.
In addition to the financial strength and cash flow characteristics of the borrower in each case, the Banks often secure their loans with real estate collateral. At December 31, 2007, approximately 82% of the Banks’ loans have real estate as a primary or secondary component of collateral. The real estate collateral in each case provides an alternate source of repayment in the event of default by the borrower and may deteriorate in value during the time the credit is extended. If we are required to liquidate the collateral securing a loan to satisfy the debt during a period of reduced real estate values, our earnings and capital could be adversely affected.
Current and anticipated deterioration in the housing market and the homebuilding industry may lead to increased loss severities and further worsening of delinquencies and non-performing assets in our loan portfolios. Consequently, our results of operations may be adversely impacted.
There has been substantial industry concern and publicity over asset quality among financial institutions due in large part to issues related to residential mortgage lending, declining real estate values and general economic concerns. As of December 31, 2007, our non performing loans have increased significantly to $16.1 million, or 1.4% of our loan portfolio. Furthermore, the housing and residential mortgage markets recently have experienced a variety of difficulties and changed economic conditions. If market conditions continue to deteriorate, they may lead to additional valuation adjustments on our loan portfolios and real estate owned as we continue to reassess the market value of our loan portfolio, the losses associated with the loans in default and the net realizable value of real estate owned.
The homebuilding industry has experienced a significant and sustained decline in demand for new homes and an oversupply of new and existing homes available for sale in various markets, including the markets in which we lend. Our customers who are builders and developers face greater difficulty in selling their homes in markets where these trends are more pronounced. Consequently, we may face increased delinquencies and non-performing assets if builders and developers are forced to default on their loans with us. We do not anticipate that the housing market will improve in the near-term, and accordingly, additional downgrades, provisions for loan losses and charge-offs related to our loan portfolio may occur.
An inadequate allowance for loan losses would reduce our earnings.
The risk of credit losses on loans varies with, among other things, general economic conditions, the type of loan being made, the creditworthiness of the borrower over the term of the loan and, in the case of a collateralized loan, the value and marketability of the collateral for the loan. Management maintains an allowance for loan losses based upon, among other things, historical experience, an evaluation of economic conditions and regular reviews of delinquencies and loan portfolio quality. Based upon such factors, management makes various assumptions and judgments about the ultimate collectibility of the loan portfolio and provides an allowance for loan losses based upon a percentage of the outstanding balances and for specific loans when their ultimate collectibility is considered questionable. If management’s assumptions and judgments prove to be incorrect and the allowance for loan losses is inadequate to absorb losses, or if the bank regulatory authorities require the Banks to increase the allowance for loan losses as a part of their examination process, the Banks’ earnings and capital could be significantly and adversely affected.
Our indirect lending program has a limited operating history and, as a result, the financial performance to date of this program may not be a reliable indicator of whether this business will be successful.
A portion of our current lending involves the purchase of consumer automobile installment sales contracts from automobile dealers primarily located in Southwest Florida. We began this program in 2002 and as of December 31, 2007, we had approximately $117 million of indirect loans outstanding. These loans are for the purchase of new or late model used cars. We serve customers over a broad range of creditworthiness and the required terms and rates are reflective of those risk profiles. While these loans have higher yields than many of our other loans, they involve significant risks in addition to normal credit risk. Potential risk elements associated with indirect lending include the limited personal contact with the borrower as a result of indirect lending through dealers, the absence of assured continued employment of the borrower, the varying general creditworthiness of the borrower, changes in the local economy and difficulty in monitoring collateral. While indirect automobile loans are secured, they are secured by depreciating assets and characterized by loan to value ratios that could result in the Bank not recovering the full value of an outstanding loan upon default by the borrower. Due to the economic slowdown in Southwest Florida, we are currently experiencing significantly higher delinquencies, charge-offs and repossessions of vehicles in this portfolio. If the economy continues to contract, we may continue to experience higher levels of delinquencies, repossessions and charge-offs.
The market value of our debt securities may be impacted by the level of interest rates and the credit quality and strength of the underlying issuers.
If a decline in market value is determined to be other than temporary, under generally accepted accounting principals, we are required to write these securities down to their estimated fair value. As of December 31, 2007, we owned collateralized debt obligations with a historical cost of $10.0 million which were determined to be other than temporarily impaired. Accordingly, we wrote these securities down to their estimated fair value of $6.1 million. Future changes in interest rates or the credit quality and strength of the underlying issuers may reduce the market value of these and other securities. If such decline is determined to be other than temporary, we will write them down through a charge to earnings to their then current fair value.
Our de novo branching strategy could cause our expenses to increase faster than revenues.
Our primary strategy for building market share in Southwest Florida is based on establishing new branches. We currently plan to open one additional branch each year in 2008 and 2009. There are considerable costs involved in opening branches and new branches generally do not generate sufficient revenues to offset their costs until they have been in operation for at least a year or more. Accordingly, our new branches can be expected to negatively impact earnings for some period of time until the branches reach certain economies of scale. Our expenses could be further increased if we encounter delays in the opening of any of our new branches. Finally, we have no assurance that our new branches will be successful even after they have been established.
If we are unable to increase our share of deposits in our markets, we may accept out of market and brokered deposits, the costs of which may be higher than expected.
We can offer no assurance that we will be able to maintain or increase our market share of deposits in our highly competitive service areas. If we are unable to do so, we may be forced to accept increased amounts of out of market or brokered deposits. At times, the cost of out of market and brokered deposits exceeds the cost of deposits in our local market. In addition, the cost of out of market and brokered deposits can be volatile, and if we are unable to access these markets or if our costs related to out of market and brokered deposits increases, our liquidity and ability to support demand for loans could be adversely affected.
Our recent results may not be indicative of our future results.
We may not be able to sustain our historical rate of growth or may not even be able to grow our business at all. In addition, the rapid growth of recent years may distort some of our historical financial ratios and statistics. In the future, we may not have the benefit of several recently favorable factors, such as a generally stable interest rate environment or the ability to find suitable expansion opportunities. Various factors, such as economic conditions, regulatory and legislative considerations and competition, may also impede or prohibit our ability to expand our market presence. If we experience a significant decrease in our historical rate of growth, our results of operations and financial condition may be adversely affected due to a high percentage of our operating costs being fixed expenses.
Our continued growth and current level of earnings may require us to raise additional capital in the future, but that capital may not be available when it is needed.
We are required by federal and state regulatory authorities to maintain adequate levels of capital to support our operations. We anticipate our capital resources will satisfy our capital requirements for the foreseeable future. We may at some point, however, need to raise additional capital to support our continued growth.
Our ability to raise additional capital, if needed, will depend on conditions in the capital markets at that time, which are outside of our control, and on our financial performance. Accordingly, we cannot give any assurance that we will be able to raise additional capital if needed on terms acceptable to us. If we cannot raise additional capital when needed, our ability to further expand our operations through internal growth and acquisitions could be materially impaired.
Our net interest income could be negatively affected by the Federal Reserve’s recent interest rate adjustments.
As a financial institution, our earnings are significantly dependent upon our net interest income, which is the difference between the interest income that we earn on interest-earning assets, such as investment securities and loans, and the interest expense that we pay on interest-bearing liabilities, such as deposits and borrowings. Therefore, any change in general market interest rates, including changes resulting from changes in the Federal Reserve’s fiscal and monetary policies, affect us more than non-financial institutions and can have a significant effect on our net interest income and total income. Our assets and liabilities may react differently to changes in overall market rates or conditions because there may be mismatches between the repricing or maturity characteristics of the assets and liabilities. As a result, an increase or decrease in market interest rates could have material adverse effects on our net interest margin and results of operations.
In response to the dramatic deterioration of the sub-prime, mortgage, credit and liquidity in financial markets and increasing concerns about recessionary trends, the Federal Reserve recently has taken action on five occasions to reduce interest rates by a total of 225 basis points since September 2007, which likely will reduce our net interest income during the first quarter of 2008 and the foreseeable future. This reduction in net interest income likely will be exacerbated by the high level of competition that we face in our markets, which requires us to offer more attractive interest rates to borrowers on loans and to our other customers on deposits, and to rely upon out-of-market funding sources. Any reduction in our net interest income will negatively affect our business, financial condition, liquidity, operating results and cash flows. Additionally, in 2008, we expect to have continued margin pressure given these interest rate reductions, along with elevated levels of non-performing assets.
Increases in interest rates may negatively affect our earnings and the value of our assets.
Changes in interest rates may affect our level of interest income, the primary component of our gross revenue, as well as the level of our interest expense, our largest recurring expenditure. In a period of rising interest rates, our interest expense could increase in different amounts and at different rates while the interest that we earn on our assets may not change in the same amounts or at the same rates. Accordingly, increases in interest rates could decrease our net interest income.
Changes in the level of interest rates also may negatively affect our ability to originate real estate loans, the value of our assets and our ability to realize gains from the sale of our assets, all of which ultimately affect our earnings. A decline in the market value of our assets may limit our ability to borrow additional funds or result in our lenders requiring additional collateral from us under our borrowing agreements. As a result, we could be required to sell some of our loans and investments under adverse market conditions, upon terms that are not favorable to us, in order to maintain our liquidity. If those sales are made at prices lower than the amortized costs of the investments, we will incur losses.
Competition from financial institutions and other financial service providers may adversely affect our profitability.
The banking business is highly competitive and we experience competition in each of our markets from many other financial institutions. We compete with commercial banks, credit unions, savings and loan associations, mortgage banking firms, consumer finance companies, securities brokerage firms, insurance companies, money market funds, and other mutual funds, as well as other super-regional, national and international financial institutions that operate offices in our primary market areas and elsewhere.
We compete with these institutions both in attracting deposits and in making loans. In addition, we have to attract our customer base from other existing financial institutions and from new residents. Many of our competitors are well-established, larger financial institutions. While we believe we can and do successfully compete with these other financial institutions in our primary markets, we may face a competitive disadvantage as a result of our smaller size, lack of geographic diversification and inability to spread our marketing costs across a broader market. Although we compete by concentrating our marketing efforts in our primary markets with local advertisements, personal contacts, and greater flexibility and responsiveness in working with local customers, we can give no assurance this strategy will be successful.
We are subject to extensive regulation that could limit or restrict our activities.
We operate in a highly regulated industry and are subject to examination, supervision, and comprehensive regulation by various federal and state agencies. Our compliance with these regulations is costly and restricts certain of our activities, including payment of dividends, mergers and acquisitions, investments, loans and interest rates charged, interest rates paid on deposits and locations of offices. We are also subject to capitalization guidelines established by our regulators, which require us to maintain adequate capital to support our growth.
The laws and regulations applicable to the banking industry could change at any time, and we cannot predict the effects of these changes on our business and profitability. Because government regulation greatly affects the business and financial results of all commercial banks and bank holding companies, our cost of compliance could adversely affect our ability to operate profitably.
The various federal and state regulatory agencies have advised that they may require enhanced credit monitoring and at times set limits or restrictions on certain lending activities based upon concentrations of risk identified (for example, concentrations of commercial real estate loans exceeding 300% of capital). We cannot assure compliance with any possible future requirements will not adversely affect our ability to operate profitably or grow at the rates we desire.
The Sarbanes-Oxley Act of 2002, and the related rules and regulations promulgated by the Securities and Exchange Commission and Nasdaq that are applicable to us, have increased the scope, complexity and cost of corporate governance, reporting and disclosure practices. As a result, we may experience greater compliance costs.
We face regulatory risks related to our commercial real estate loan concentrations.
Commercial real estate, or CRE, is cyclical and poses risks of possible loss due to concentration levels and similar risks of the asset class. As of December 31, 2007, approximately 55% of our loan portfolio consisted of CRE loans. The banking regulators are more closely scrutinizing CRE lending and may require banks with higher levels of CRE loans to implement more rigorous underwriting, internal controls, risk management policies and portfolio stress testing, as well as possibly requiring higher levels of allowances for possible loan losses and capital levels as a result of CRE lending growth and exposures.
We are dependent upon the services of our management team.
Our future success and profitability is substantially dependent upon the management and banking abilities of our senior executives. We believe that our future results will also depend in part upon our attracting and retaining highly skilled and qualified management and other personnel. Competition for such personnel is intense, and we cannot assure you that the Company will be successful in retaining such personnel. We also cannot guarantee that members of our executive management team will remain with us. Changes in key personnel and their responsibilities may be disruptive to the Company’s business and could have a material adverse effect on our business, financial condition and results of operations.
Risk Related to an Investment in Our Common Stock
Future capital needs could result in dilution of shareholders’ investments.
Our board of directors may determine from time to time that there is a need to obtain additional capital through the issuance of additional shares of our common stock or other securities. These issuances would dilute the ownership interests of current shareholders in the Company and may dilute the per share book value of our common stock. New investors may also have rights, preferences and privileges senior to our current shareholders which may adversely impact our current shareholders.
Although publicly traded, the trading market in our common stock is less liquid and the price of our common stock due to this limited trading market may be more volatile in the future.
Our common stock is thinly traded. The average daily trading volume of our shares on The NASDAQ National Market during 2007 was approximately 20,444 shares. Thinly traded stock can be more volatile than stock trading in an active public market. We cannot predict the extent to which an active public market for our common stock will develop or be sustained. In recent years, the stock market has experienced a high level of price and volume volatility, and market prices for the stock of many companies have experienced wide price fluctuations that have not necessarily been related to their operating performance. Therefore, our shareholders may not be able to sell their shares at the volumes, prices, or times that they desire.
Our ability to pay dividends is limited and we may be unable to pay future dividends.
Our ability to pay dividends is limited by regulatory restrictions and the need to maintain sufficient consolidated capital and is dependent upon the receipt of dividends from the Banks and cash available at the holding company. The ability of the Banks to pay dividends to us is limited by their obligations to maintain sufficient capital and by other general restrictions on their dividends that are applicable to state banks that are regulated by the FDIC. If we do not satisfy these regulatory requirements, we will be unable to pay dividends on our common stock. Based on the level of undistributed earnings of TIB Bank for the prior two years, declaration of dividends by TIB Bank, during 2008, would likely require regulatory approval. The Bank of Venice has no retained earnings available for dividends.
Holders of our junior subordinated debentures have rights that are senior to those of our common stockholders.
We have supported our continued growth through the issuance of trust preferred securities from special purpose trusts and accompanying junior subordinated debentures. At December 31, 2007, we had outstanding trust preferred securities and accompanying junior subordinated debentures totaling $33 million. Payments of the principal and interest on the trust preferred securities of these special purpose trusts are conditionally guaranteed by us. Further, the accompanying junior subordinated debentures we issued to the special purpose trusts are senior to our shares of common stock. As a result, we must make payments on the junior subordinated debentures before any dividends can be paid on our common stock and, in the event of our bankruptcy, dissolution or liquidation, the holders of the junior subordinated debentures must be satisfied before any distributions can be made on our common stock. We have the right to defer distributions on our junior subordinated debentures (and the related trust preferred securities) for up to five years, during which time no dividends may be paid on our common stock.
We may issue debt and equity securities or securities convertible into equity securities, which are senior to our common stock as to distributions and in liquidation, which could negatively affect the value of our common stock.
In the future, we may attempt to increase our capital resources by entering into debt or debt-like financing that is unsecured or secured by all or up to all of our assets, or by issuing debt or equity securities, which could include issuances of secured or unsecured commercial paper, medium-term notes, senior notes, subordinated notes, common stock, warrants, or other securities convertible into common stock. In the event of our liquidation, our lenders and holders of our debt securities would receive a distribution of our available assets before distributions to the holders of our common stock. Because our decision to incur debt and issue securities in our future offerings will depend on market conditions and other factors beyond our control, we cannot predict or estimate the amount, timing or nature of our future offerings and debt financings. Further, market conditions could require us to accept less favorable terms for the issuance of our securities in the future.
We did not receive any written comments during 2007 from the Commission staff regarding our periodic and current reports under the Act. There are no comments that remain unresolved from any prior period.
The Company‘s executive offices are located at 599 9th Street North, Naples, Florida. TIB Bank‘s executive offices are located at 6435 Naples Boulevard, Naples, Florida. The Bank of Venice’s executive offices are located at 240 Nokomis Avenue South, Venice, Florida. All Company operated properties are as follows:
| Address | Location | Purpose | Owned/ Leased |
| 30400 Overseas Highway | Big Pine Key | Branch | Owned |
| 8100 Health Center Boulevard | Bonita Springs | Branch and Office Space | Leased |
| 12205 Metro Parkway | Fort Myers | Branch | Owned |
| 12195 Metro Parkway | Fort Myers | Indirect lending | Leased |
| 600 North Homestead Boulevard | Homestead | Branch | Owned |
| 777 North Krome Avenue | Homestead | Branch | Owned |
| 632 Washington Avenue | Homestead | Office Space | Leased |
| 28 N.E. 18 Street | Homestead | Office Space | Owned |
| 80900 Overseas Highway | Islamorada | Branch and Office Space | Owned |
| 99451 Overseas Highway | Key Largo | Branch and Office Space | Owned |
| 103330 Overseas Highway | Key Largo | Branch | Owned |
| 330 Whitehead Street | Key West | Branch | Owned |
| 3618 North Roosevelt Boulevard | Key West | Branch | Owned |
| 2348 Overseas Highway | Marathon | Branch | Owned |
| 11401 Overseas Highway | Marathon Shores | Branch | Owned |
| 6435 Naples Boulevard | Naples | TIB Bank HQ, Branch & Office Space | Owned |
| 3940 Prospect Avenue – Suite 104 & 105 | Naples | Branch and Office Space | Leased |
| 1720 J & C Boulevard – Suite 1 | Naples | Office Space | Leased |
599 9th Street North – Suite 100 & 101 | Naples | Corporate HQ & Branch | Owned |
599 9th Street North – Suite 201 | Naples | Office space | Owned |
| 1125 US Highway 27 South | Sebring | Branch | Leased |
| 91980 Overseas Highway | Tavernier | Branch | Owned |
| 240 Nokomis Avenue South | Venice | Bank of Venice HQ & Branch | Owned |
| 1790 East Venice Avenue, Suite 101 | Venice | Branch | Leased |
| 3479 Precision Drive, Suite 118 | Venice | Branch | Leased |
In 2005, TIB Bank sold land that it bought in 2004 located at the Miami Land & Development Subdivision in Homestead, Florida. TIB Bank also purchased a property at 17000 Cam Circle in Ft. Myers, Florida which was later sold in 2006.
In 2006, TIB Bank purchased parcels of land located at the Lehigh Acres Subdivision in Lehigh, FL and at the City Gate Subdivision in Naples, Florida, where it plans to construct new branches. In addition, TIB Bank entered into a sale-leaseback transaction on a building and related land located at 12195 Metro Parkway in Fort Myers, Florida.
In 2007, TIB Bank sold vacant land adjacent to the branch located at 3618 North Roosevelt Boulevard in Key West, Florida and a building located at 228 Atlantic Boulevard in Key Largo, FL which had previously been used for office space. TIB Bank also entered into a lease agreement for a building located at 704 Washington Street in Homestead, FL. This building will be used as office space and will be occupied in early 2008.
While the Company and the Banks are from time to time parties to various legal proceedings arising in the ordinary course of their business, management believes after consultation with legal counsel that there are no proceedings threatened or pending against the Company or the Banks that will, individually or in the aggregate, have a material adverse effect on the consolidated results of operations or financial condition of the Company.
We did not submit any matters to a vote of our security holders during the Company's fourth quarter of the fiscal year ended December 31, 2007.
PART II
ITEM 5: MARKET FOR REGISTRANT'S COMMON EQUITY, RELATED SHAREHOLDER MATTERS AND ISSUER PURCHASES OF EQUITY SECURITIES
Our common stock trades on the NASDAQ National Market under the symbol “TIBB.” As of December 31, 2007, there were 595 registered shareholders of record and 12,783,161 shares of our common stock outstanding. The share and per share amounts discussed throughout this document have been adjusted to account for the effects of the two-for-one stock split distributed October 23, 2006. The following table sets forth, for the periods indicated, the high and low sale prices per share for our common stock on the NASDAQ National Market:
| 2007 | 2006 | |||||||||||||||
| (Quarter Ended) | High | Low | High | Low | ||||||||||||
| March 31 | $ | 18.21 | $ | 14.67 | $ | 16.18 | $ | 14.75 | ||||||||
| June 30 | 15.00 | 12.77 | 16.25 | 14.44 | ||||||||||||
| September 30 | 13.34 | 10.38 | 16.20 | 15.64 | ||||||||||||
| December 31 | 11.17 | 6.73 | 18.44 | 15.84 | ||||||||||||
For the year ended December 31, 2007, we paid cash dividends to our shareholders in the amount of $.06 per share for the first three quarters and $.0625 per share for the last quarter ($.2425 in the aggregate). For the year ended December 31, 2006, we paid cash dividends to our shareholders in the amount of $.05875 per share for the first three quarters and $.06 per share for the last quarter ($.23625 in the aggregate). Our ability to continue to pay cash dividends to our shareholders is primarily dependent on the earnings of the Banks. Payment of dividends by the Banks to us is limited by dividend restrictions in capital requirements imposed by bank regulators. Information regarding restrictions on the ability of the Banks to pay dividends to us is contained in Note 14 of the "Notes to Consolidated Financial Statements" contained in Item 8 hereof. In general, future dividend policy is subject to the discretion of the board of directors and will depend upon a number of factors, including the future earnings, capital requirements, regulatory constraints, and our financial condition as well as that of the Banks.
With respect to information regarding our securities authorized for issuance under equity incentive plans, the information contained in the section entitled “Executive Compensation – Equity Compensation Plan Information” of our definitive Proxy Statement for the 2008 Annual Meeting of Shareholders is incorporated herein by reference.
Issuer Purchases of Equity Securities
As of December 31, 2007, we repurchased a total of 69,200 shares of our common stock through the repurchase program announced August 6, 2007. The following table presents information relating to the purchases of the Company’s common stock by the Company during the fourth quarter of 2007:
| Issuer Purchases of Equity Securities | ||||||||||||||||
| Period | Total Number of Shares Purchased | Average Price Paid Per Share | Total Number of Shares Purchased as Part of Publicly Announced Plans or Programs | Maximum Number (or Approximate Dollar Value) of Shares that May Yet Be Purchased Under the Plans or Programs | ||||||||||||
| 400,000 | ||||||||||||||||
| November 1 – 30, 2007 | 50,700 | $ | 8.06 | 50,700 | 349,300 | |||||||||||
| December 1 – 31, 2007 | 18,500 | 8.68 | 18,500 | 330,800 | ||||||||||||
| Total | 69,200 | $ | 8.23 | 69,200 | 330,800 | |||||||||||
STOCK PRICE PERFORMANCE GRAPH
The stock price performance graph below shall not be deemed incorporated by reference by any general statement incorporating by reference this Form 10-K into any filing under the Securities Act of 1933 or under the Securities Exchange Act of 1934, duringexcept to the preceding 12 months (orextent TIB Financial Corp. specifically incorporates this information by reference, and shall not otherwise be deemed filed under such Acts.
The graph below compares the cumulative total return of TIB Financial Corp., the Nasdaq Composite Index and a peer group index.
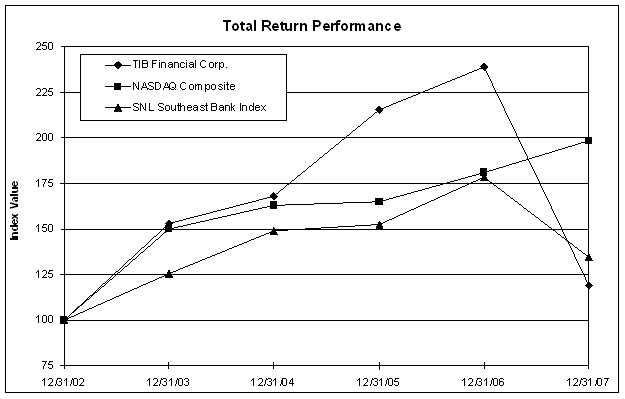
| Period Ending | ||||||||||||||||||||||||
| Index | 12/31/02 | 12/31/03 | 12/31/04 | 12/31/05 | 12/31/06 | 12/31/07 | ||||||||||||||||||
| TIB Financial Corp. | 100.00 | 153.23 | 168.19 | 215.44 | 239.08 | 118.95 | ||||||||||||||||||
| NASDAQ Composite | 100.00 | 150.01 | 162.89 | 165.13 | 180.85 | 198.60 | ||||||||||||||||||
| SNL Southeast Bank Index | 100.00 | 125.58 | 148.92 | 152.44 | 178.75 | 134.65 | ||||||||||||||||||
Source : SNL Financial LC, Charlottesville, VA
The selected consolidated financial data presented below as of and for such shorter period that the issuer was required to file such reports),years ended December 31, 2007, 2006, 2005, 2004 and (2)2003 is unaudited and has been subjectderived from our Consolidated Financial Statements and from our records. The information presented below should be read in conjunction with the Consolidated Financial Statements and related notes, and “Management’s Discussion and Analysis of Financial Condition and Results of Operations.”
Balance Sheet Data
As of December 31,
| (Dollars in thousands) | 2007 | 2006 | 2005 | 2004 | 2003 | |||||||||||||||
| Total assets | $ | 1,444,739 | $ | 1,319,093 | $ | 1,076,070 | $ | 829,325 | $ | 669,298 | ||||||||||
| Investment securities | 160,357 | 131,199 | 97,464 | 77,807 | 52,557 | |||||||||||||||
| Total loans | 1,127,667 | 1,063,852 | 882,372 | 653,521 | 538,598 | |||||||||||||||
| Allowance for loan losses | 14,973 | 9,581 | 7,546 | 6,243 | 5,216 | |||||||||||||||
| Deposits | 1,049,958 | 1,029,457 | 920,424 | 687,859 | 553,813 | |||||||||||||||
| Shareholders’ equity | 96,240 | 85,862 | 77,524 | 68,114 | 41,246 | |||||||||||||||
Income Statement Data
Year ended December 31,
| (Dollars in thousands) | 2007 | 2006 | 2005 | 2004 | 2003 | |||||||||||||||
| Interest and dividend income | $ | 94,741 | $ | 85,234 | $ | 59,434 | $ | 40,916 | $ | 34,606 | ||||||||||
| Interest expense | 48,721 | 38,171 | 20,304 | 10,730 | 9,839 | |||||||||||||||
| Net interest income | 46,020 | 47,063 | 39,130 | 30,186 | 24,767 | |||||||||||||||
| Provision for loan losses | 9,657 | 3,491 | 2,413 | 2,455 | 1,586 | |||||||||||||||
| Net interest income after provision for loan losses | 36,363 | 43,572 | 36,717 | 27,731 | 23,181 | |||||||||||||||
| Non-interest income * | 1,362 | 6,275 | 6,258 | 6,306 | 7,084 | |||||||||||||||
| Non-interest expense | (41,921 | ) | (35,833 | ) | (31,856 | ) | (27,057 | ) | (23,541 | ) | ||||||||||
| Income tax (expense) benefit | 1,775 | (5,021 | ) | (3,927 | ) | (2,337 | ) | (2,324 | ) | |||||||||||
| Income (loss) from continuing operations | (2,421 | ) | 8,993 | 7,192 | 4,643 | 4,400 | ||||||||||||||
| Income from discontinued operations, net of taxes | - | 254 | 4,632 | 555 | 702 | |||||||||||||||
| Net income (loss) | $ | (2,421 | ) | $ | 9,247 | $ | 11,824 | $ | 5,198 | $ | 5,102 | |||||||||
| * | Non-interest income during 2007 includes a charge of $5.7 million related to the other than temporary impairment of investment securities as discussed in more detail in the "Investment Portfolio” section of management’s discussion and analysis. |
Per Share Data
Year ended December 31,
| 2007 | 2006 | 2005 | 2004 | 2003 | ||||||||||||||||
| Book value per share at year end * | $ | 7.53 | $ | 7.33 | $ | 6.69 | $ | 6.00 | $ | 4.65 | ||||||||||
| Basic earnings (loss) per share from continuing operations | $ | (0.20 | ) | $ | 0.78 | $ | 0.63 | $ | 0.44 | $ | 0.52 | |||||||||
| Basic earnings per share from discontinued operations | - | 0.02 | 0.41 | 0.05 | 0.08 | |||||||||||||||
| Basic earnings (loss) per share | $ | (0.20 | ) | $ | 0.80 | $ | 1.04 | $ | 0.49 | $ | 0.60 | |||||||||
| Diluted earnings (loss) per share from continuing operations | $ | (0.20 | ) | $ | 0.76 | $ | 0.61 | $ | 0.42 | $ | 0.50 | |||||||||
| Diluted earnings per share from discontinued operations | - | 0.02 | 0.39 | 0.05 | 0.08 | |||||||||||||||
| Diluted earnings (loss) per share | $ | (0.20 | ) | $ | 0.78 | $ | 1.00 | $ | 0.47 | $ | 0.58 | |||||||||
| Basic weighted average common equivalent shares outstanding | 12,299,093 | 11,609,394 | 11,423,948 | 10,619,720 | 8,514,448 | |||||||||||||||
| Diluted weighted average common equivalent shares outstanding | 12,299,093 | 11,889,606 | 11,800,892 | 10,959,392 | 8,871,722 | |||||||||||||||
| Dividends declared per share | $ | 0.2425 | $ | 0.2363 | $ | 0.2313 | $ | 0.2263 | $ | 0.2213 | ||||||||||
| * | Calculation includes unvested shares of restricted stock. |
Performance Ratios
| 2007 | 2006 | 2005 | 2004 | 2003 | ||||||||||||||||
| Return (loss) on average assets** | (0.18 | )% | 0.74 | % | 0.74 | % | 0.63 | % | 0.71 | % | ||||||||||
| Return (loss) on average equity** | (2.52 | )% | 11.05 | % | 10.19 | % | 7.83 | % | 11.69 | % | ||||||||||
| Average equity/average assets | 6.99 | % | 6.72 | % | 7.26 | % | 8.01 | % | 6.05 | % | ||||||||||
| Net interest margin | 3.60 | % | 4.18 | % | 4.38 | % | 4.51 | % | 4.43 | % | ||||||||||
| Dividend payout ratio *** | (123.19 | )% | 30.50 | % | 36.74 | % | 51.76 | % | 42.82 | % | ||||||||||
| Allowance for loan losses/total loans | 1.33 | % | 0.90 | % | 0.86 | % | 0.96 | % | 0.97 | % | ||||||||||
| Non-performing assets/total assets | 1.88 | % | 0.69 | % | 0.46 | % | 0.60 | % | 0.55 | % | ||||||||||
| Non-performing loans/total loans | 1.43 | % | 0.40 | % | 0.11 | % | 0.11 | % | 0.07 | % | ||||||||||
| Allowance for loan losses/non-performing loans | 93.08 | % | 226.88 | % | 789.33 | % | 886.79 | % | 1,336.33 | % | ||||||||||
| Non-interest expense/tax equivalent net interest income and non-interest income from continuing operations | 87.86 | % | 66.75 | % | 69.69 | % | 73.48 | % | 73.44 | % | ||||||||||
| ** | The computation of return on average assets and return on average equity is based on net income from continuing operations. |
| *** | The computation of the dividend payout ratio is based on net income (loss) from continuing operations. |
ITEM 7: MANAGEMENT’S DISCUSSION AND ANALYSIS OF FINANCIAL CONDITION AND RESULTS OF OPERATIONS
Overview
The Banks operate primarily as real estate secured commercial lenders, focusing on middle-market businesses in our Southern Florida markets. The Banks fund their lending activity primarily by gathering retail and commercial deposits from our service area. TIB Bank was formed in and has a substantial market presence in the Florida Keys. In recent years, TIB Bank has expanded into the adjacent Florida counties of Miami-Dade, Collier, Lee and Highlands. On April 30, 2007, we completed the acquisition of The Bank of Venice located in Sarasota County, Florida. Despite slowing economic growth in Florida, we anticipate increased opportunities in these contiguous markets for our well-positioned financial institution.
Historically we have been utilizing a de novo branching strategy of evaluating and selecting sites and building new bank branch locations to such filing requirements forenter and grow in these new markets. While de novo expansion has a dilutive effect on short-term earnings, the past 90 days. Yesþ or Nooresulting growth will continue to add significant value to our franchise. By timing our expansion, we plan to balance earnings, growth and expense.
The acquisition of delinquent filers pursuantThe Bank of Venice expanded our presence into Sarasota County. We believe this strategic merger will provide new growth opportunities through our operation of a local community bank in an attractive new market. The pricing, market and culture fit indicate the acquisition will be advantageous to Item 405our growth and expansion plans.
We believe the completion of Regulation S-K containedour strategic merger with The Bank of Venice on April 30, 2007 and the January 2, 2008 closing of our acquisition of Naples Capital Advisors, a wealth management and investment advisory firm with approximately $80 million of assets under advisement are exemplary accomplishments which will further enhance our franchise value and current position in this form,the marketplace.
On March 7, 2008, the Company consummated a transaction whereby two of Southwest Florida’s prominent families, their representatives and will not be contained, to the best of issuer’s knowledge, in definitive proxy or information statements incorporated by reference in Part III of this Form 10-K or any amendment to this Form 10-K.þ
Performance Overview
TIB Financial Corp. is a financial services holding company focused on growth and expansion in the Florida marketplace and the parent company of TIB Bank and The Bank of Venice. For the year ended December 31, 2007, our operations resulted in a net loss of $2.4 million, or $0.20 per basic and diluted share. These results compared with net income of $9.0 million from continuing operations, or $0.78 per basic share and $0.76 per diluted share, for the prior year. The most significant factors contributing to the 2007 loss were the $9.7 million provision for loan losses and write-downs of investment securities totaling $5.7 million.
Our operating environment remains challenging and our loan growth is muted due to loan payoffs and a lower level of loan origination. During this period of slower economic activity, our loans increased 6% from last year. Our strategy of building relationships with small businesses and middle-market customers continues to drive our growth and expansion.
Deteriorating credit quality and the interest rate environment continue to be the dominant forces affecting our industry and our main challenges are managing asset quality and efficiently funding the growth of our loan portfolios. We are leveraging our current product and delivery advantages along with our sustainable customer service quality advantages in our efforts to increase market share and plan to continue to capitalize on the opportunities in our region.
Net interest income on a tax-equivalent basis was 5,682,639$46.4 million for 2007, a decrease of 2% from $47.4 million a year ago. Changes in monetary policy by the Federal Reserve affect the prime rate, our loan yields, our deposit and borrowing costs and our net interest margin. During a period of increasing short-term interest rates through mid-year 2006 followed by decreasing rates starting in September 2007, our interest margin contracted 58 basis points from 4.18% in 2006 to 3.60% in 2007.
Non-interest income, which includes service charges on deposit accounts, investment securities gains and losses, real estate fees and other operating income, decreased approximately $4.9 million to $1.4 million in 2007 from $6.3 million in 2006. Excluding the effect of the $5.7 million write-down of investment securities and the increased gains on sales of assets, non-interest income was comparable during 2006 to 2007. Service charges on deposit accounts increased from $2.5 million in 2006 to $2.7 million in 2007, but were offset by a decline in fees on mortgage loans sold. The decrease is primarily attributable to a lower volume of residential real estate closings in the Monroe and Collier counties markets resulting in lower residential mortgage originations and lower fees from the sale of mortgage loans.
Non-interest expense for 2007 was $41.9 million, compared with $35.8 million a year ago. The increase in non-interest expense for 2007 is primarily attributable to a 12% increase in salaries and employee benefits expenses including severance costs for certain employees. Salaries and employee benefits for The Bank of Venice, during 2007, were approximately $900,000. Net occupancy and other expenses increased 30% compared to 2006. The increase in this category includes approximately $371,000 related to The Bank of Venice. The increase in other expenses was primarily attributable to increases in repossession expenses, consulting engagements, FDIC insurance assessments and $507,000 related to the operations of The Bank of Venice.
Total assets increased 10% during 2007 to $1.44 billion as of December 31, 2007, compared with $1.32 billion a year ago. Total loans grew 6% to $1.13 billion as of December 31, 2007, compared with $1.06 billion a year ago. Commercial real estate mortgage loans accounted for the largest categorical dollar increase during 2007, representing $65.8 million of the total increase. Asset growth was funded by a $96.7 million increase in FHLB advances and other borrowings and an increase in total deposits to $1.05 billion as of December 31, 2007, representing deposit growth of 2% from $1.03 billion in the prior year. As of December 31, 2007, the acquisition of The Bank of Venice resulted in $72.9 million, $58.7 million and $51.9 million of the 2007 growth in assets, loans and deposits, respectively.
In response to slowing economic activity and continued softness in residential real estate in our markets, we strengthened our reserve for loan losses. As of December 31, 2007 the allowance for loan losses totaled $15.0 million, or 1.33% of total loans. This level of allowance represents 93% of non-performing loans at December 31, 2007. This compares with 0.90% and 227%, respectively, as of December 31, 2006. Annual net charge-offs represented 0.45% of average loans as of December 31, 2007, compared with 0.15% as of December 31, 2006.
Our balance sheet reflects the continued success of our strategic expansion into more dynamic growth markets in South Florida. By the end of 2007, approximately 51% of the Company’s customer deposit base was located outside our historical core business market of the Florida Keys.
Economic and Operating Environment Overview
During 2007, business activity in our primary markets experienced an economic contraction as the ripple effect of the residential real estate crisis significantly impacted certain of our local markets. The national trends of slowing economic expansion with increased overall employment and productivity gains were significantly more favorable than the trends in southern Florida. In an effort to respond to the credit and liquidity crisis which arose during the third quarter of 2007 and thereafter, the Federal Reserve acted to ease monetary policy and promote growth by lowering short-term interest rates by 225 basis points between September 2007 and January 2008 including once between regularly scheduled interest rate meetings. Accordingly, the target Federal Funds Rate began 2007 at 5.25% and ended the year at 4.25%. The Prime lending rate decreased from 8.25% to 7.25% during the year.
The effect of the interest rate environment during 2007 was a continued contraction of our net interest margin. The decreasing Prime rate directly affects yields on loans tied to that index and even loans not indexed to Prime are priced reflective of overall lower asset yields. In contrast, our funding needs resulted in our decision to be more competitive on deposit pricing and seek additional wholesale funding. We believe that the net effect of the current interest rate environment will translate into margin contraction as we continue to manage these factors with our increased funding needs and our desire to obtain such funding through our branch distribution system.
During 2007, TIB Bank strengthened its underwriting criteria resulting in a contraction of its indirect automobile lending program, in an effort to enhance overall loan quality in this portfolio. As of December 31, 2007, we had approximately $117.4 million of indirect auto loans outstanding. The balance of outstanding indirect loans declined in 2007 as we reacted to local economic conditions and a higher level of delinquencies and charge-offs resulting from this portfolio which is highly concentrated in southwest Florida, an area significantly impacted by the downturn of the residential housing market. We expect new production in 2008 to be less than loan principal repayments causing the total amount of indirect loans held in the portfolio to decline during the year.
In January 2007, we completed construction of our 16,000-square-foot banking office in Naples, Florida and subsequently relocated the TIB Bank headquarters to this facility. On April 30, 2007, we completed the acquisition of The Bank of Venice which subsequently opened its second and third branches in Venice, Florida. We expect to open one to two additional branches in Southwest Florida during 2008 and 2009. Additional branch sites will continue to be explored in other high-growth markets throughout Florida.
Additionally, on December 12, 2007, we entered into an agreement to purchase Naples Capital Advisors, a wealth management and investment advisory firm with approximately $80 million of assets under advisement. Under the terms of the agreement, Naples Capital Advisors will become a wholly-owned subsidiary of the Company. Shareholders of Naples Capital Advisors will be entitled to receive $1.33 million in cash. The closing of the merger occurred on January 2, 2008. During the first quarter of 2008, we began offering private banking services and filed an application to seek approval to capitalize and operate a trust company.
Subsequently, on March 7, 2008, the Company consummated a transaction whereby two of Southwest Florida’s prominent families, their representatives and their related business interests purchased 1.2 million shares of the Company’s common stock and warrants to purchase an additional 1.2 million shares of common stock.stock at an exercise price of $8.40 per share at any time prior to March 7, 2011. Gross proceeds from the investment provided additional capital of $10.1 million.
Analysis of Financial Condition
Our assets totaled $1.44 billion at December 31, 2007 compared to $1.32 billion at the end of 2006, an increase of $125.6 million, or 10%. The effect of the Proxy Statementacquisition of The Bank of Venice accounts for $72.9 million of the increase. The growth in assets was primarily a result of increased investing and lending activity as the Banks invested funds provided by deposit growth and borrowings.
Total loans increased $63.8 million or 6%, to $1.13 billion at December 31, 2007. The growth in the loan portfolio was primarily attributed to increases in commercial real estate loans of $65.8 million and residential real estate loans of $29.9 million, partially offset by a $24.1 million decrease in indirect auto dealer loans.
Total deposits increased $20.5 million or 2%, from $1.03 billion at the end of 2006 to $1.05 billion on December 31, 2007. Non-interest-bearing deposits decreased $16.0 million or 10%, while interest-bearing deposits increased $36.5 million or 4%.
Borrowed funds, consisting of Federal Home Loan Bank (FHLB) advances, short-term borrowings, notes payable, and subordinated debentures, totaled $280.9 million at year end 2007 compared to $184.3 million at the end of 2006. During 2007, we increased our FHLB advances by $15.0 million. On January 1, 2007 we repaid $4.0 million of notes payable bearing interest at 9% at par.
Shareholders’ equity increased $10.4 million or 12%, from $85.9 million on December 31, 2006 to $96.2 million at the end of 2007.
Book value per share increased to $7.53 at December 31, 2007, from $7.33 at December 31, 2006.
Results of Operations
Net income
2007 compared with 2006:
Net loss from continuing operations was $2.4 million for 2007, compared to net income of $9.0 million for 2006. Basic and diluted loss per share from continuing operations for 2007 were $0.20, as compared to basic and diluted earnings per share of $0.78 and $0.76, respectively, in 2006.
Based on continuing operations, the loss on average assets for 2007 was 0.18% compared to a return on average assets of 0.74% for 2006. On the same basis, loss on average shareholders’ equity was 2.5% for 2007 while the return on average shareholders’ equity was 11.05% for 2006.
As discussed in Note 2 of the accompanying "Notes to Consolidated Financial Statements", the Company closed the sale of the merchant bankcard processing segment in the fourth quarter of 2005. Accordingly, the results of the merchant bankcard operations were classified as discontinued operations during 2006. The Company’s net loss for 2007 was $2.4 million compared to net income of $9.2 million for 2006. Basic and diluted loss per share for 2007 were $0.20 as compared to basic and diluted earnings per share of $0.80 and $0.78, respectively, in 2006.
Contributing significantly to the loss during 2007 were the $9.7 million provision for loan losses and the write-down of $5.7 million of investment securities. In response to continued slowing economic activity and softening real estate values in our markets, our provision for loan losses in excess of net charge offs resulted in an increase of the allowance for loan losses to $15.0 million or 1.33% of total loans at December 31, 2007. For additional information on these items, see the sections that follow entitled “Allowance and Provision for Loan Losses” and “Investment Portfolio”, respectively.
2006 compared with 2005:
Net income from continuing operations was $9.0 million for 2006, compared to $7.2 million for 2005, an increase of 25%. Basic and diluted earnings per share from continuing operations for 2006 were $0.78 and $0.76, respectively, as compared to $0.63 and $0.61 per share in 2005.
Return on average assets based on net income from continuing operations was 0.74% for 2006 and 2005, while return on average shareholders’ equity based on net income from continuing operations was 11.05% and 10.19%, respectively.
As discussed in Note 2 of the accompanying "Notes to Consolidated Financial Statements", the Company closed the sale of the merchant bankcard processing segment in the fourth quarter of 2005. Accordingly, the results of the merchant bankcard operations were classified as discontinued operations during 2006 and 2005. The Company’s 2006 net income of $9.2 million decreased 22% compared to $11.8 million in 2005 due to $4.6 million of net income from discontinued operations in 2005. Basic and diluted earnings per share for 2006 were $0.80 and $0.78, respectively, as compared to $1.04 and $1.00 per share in 2005.
Net interest income
Net interest income represents the amount by which interest income on interest-earning assets exceeds interest expense incurred on interest-bearing liabilities. Net interest income is the largest component of our income, and is affected by the interest rate environment, and the volume and the composition of interest-earning assets and interest-bearing liabilities. Our interest-earning assets include loans, federal funds sold, interest-bearing deposits in other banks, and investment securities. Our interest-bearing liabilities include deposits, federal funds purchased, notes payable related to Company shares repurchased, subordinated debentures, FHLB advances, and other short-term borrowings.
2007 compared with 2006:
Net interest income was $46.0 million for the 2005 Annual Meetingyear ended December 31, 2007, compared to $47.1 million for the same period in 2006. The 2% decrease was mainly attributable to deposit accounts re-pricing higher during 2007 lagging prime based asset re-pricings which occurred more timely during 2006 and remained stable throughout the first three quarters of Shareholdersthe year. The impact of this lag effect was exacerbated during the fourth quarter as it combined with intense local market competition for deposits as well as the evaporation of wholesale market liquidity resulting in funding rates remaining at higher levels even as the Federal Reserve began swiftly lowering rates in September. Partially offsetting this decrease were increases in loan and securities volume. Additional factors impacting net interest income included a significant increase in the level of nonaccrual loans, increases in interest rates paid on transaction accounts and more significantly time deposits, our highest cost deposit category as a percentage share of total deposits, along with additional funding from short-term borrowings and FHLB advances.
Many of the Banks’ loans are indexed to the prime rate. The comparability of the level of the prime rate in 2007 and 2006 combined with the impact of a higher level of non-accrual loans and the acquisition of The Bank of Venice is reflected in a slightly lower average yield for the loan portfolio. The acquisition of The Bank of Venice on April 30, 2007 reduced the average loan yield slightly as it generally has a lower yielding loan mix than TIB Bank. The average yield on interest-earning assets for the 2007 was 7.39% which was a decrease of 16 basis points compared to the 7.55% yield earned during 2006. The average cost of interest-bearing liabilities increased 38 basis points from 4.07% during 2006 to 4.45% in 2007. The average cost of interest bearing deposits and all interest bearing liabilities reflect in part the increase in local deposit competition as well as a general liquidity premium resulting from worldwide financial market turmoil during the second half of 2007. As a result, our tax equivalent net interest margin contracted 58 basis points to 3.60% from 4.18% in 2006. Going forward, we expect market interest rates to decline in the immediate term and then remain relatively stable resulting in a short-term decline in loan yields followed by a period of stability. At the same time, while we expect deposit costs will follow in their decline, they will continue to be filedsubject to the forces of competitive pressure which may result in deposit rates decreasing more slowly. In the current interest rate environment, we believe that our interest margin will contract further. The predominant driver in the increase in net interest income is and will continue to be the growth of our balance sheet. Although the timing and possible effects of future changes in interest rates could be significant, we expect any such impact to continue to be less in extent than the relative impact of asset growth.
2006 compared with 2005:
Net interest income was $47.1 million for the year ended December 31, 2006, compared to $39.1 million for the same period in 2005. The 20% increase was mainly attributable to increased lending volume. Partially offsetting this increase were increases in interest expense on transaction accounts and more significantly time deposits. Additional funding from short-term borrowings and FHLB advances also increased interest expense. The average yield on interest-earning assets for 2006 was 7.55% which was an increase of 91 basis points compared to the 6.64% yield earned during 2005. The average cost of interest-bearing liabilities increased 125 basis points from 2.82% during 2005 to 4.07% in 2006. The average cost of interest bearing deposits and all interest bearing liabilities reflect in part the increase in short-term interest rates and the change in the funding mix for 2006 as compared to 2005. As a result of these changes, our tax equivalent net interest margin contracted 20 basis points to 4.18% from 4.38% in 2005.
The following table sets forth information with respect to the average balances, interest income and average yield by major categories of interest-earning assets; the average balances, interest expense and average rate by major categories of interest-bearing liabilities; the average balances of noninterest-earning assets, noninterest-bearing liabilities and shareholders’ equity; and net interest income, interest rate spread, and net interest margin for the years ended December 31, 2007, 2006 and 2005.
Average Balance Sheets
| 2007 | 2006 | 2005 | ||||||||||||||||||||||||||||||||||
(Dollars in thousands) | Average Balances | Income/ Expense | Yields/ Rates | Average Balances | Income/ Expense | Yields/ Rates | Average Balances | Income/ Expense | Yields/ Rates | |||||||||||||||||||||||||||
| ASSETS | ||||||||||||||||||||||||||||||||||||
| Interest-earning assets: | ||||||||||||||||||||||||||||||||||||
| Loans (a)(b) | $ | 1,088,751 | $ | 84,775 | 7.79 | % | $ | 989,617 | $ | 78,382 | 7.92 | % | $ | 772,363 | $ | 54,492 | 7.06 | % | ||||||||||||||||||
| Investment securities (b) | 146,376 | 7,633 | 5.21 | % | 123,651 | 6,149 | 4.97 | % | 86,325 | 3,938 | 4.56 | % | ||||||||||||||||||||||||
| Interest bearing deposits in other banks | 383 | 19 | 4.96 | % | 448 | 22 | 4.94 | % | 359 | 10 | 2.90 | % | ||||||||||||||||||||||||
| FHLB stock | 8,408 | 503 | 5.98 | % | 4,935 | 285 | 5.78 | % | 2,725 | 113 | 4.15 | % | ||||||||||||||||||||||||
| Federal funds sold | 42,187 | 2,144 | 5.08 | % | 15,465 | 739 | 4.78 | % | 38,374 | 1,202 | 3.13 | % | ||||||||||||||||||||||||
| Total interest-earning assets | 1,286,105 | 95,074 | 7.39 | % | 1,134,116 | 85,577 | 7.55 | % | 900,146 | 59,755 | 6.64 | % | ||||||||||||||||||||||||
| Non-interest earning assets: | ||||||||||||||||||||||||||||||||||||
| Cash and due from banks | 20,394 | 22,402 | 21,680 | |||||||||||||||||||||||||||||||||
| Premises and equipment, net | 36,609 | 32,205 | 27,007 | |||||||||||||||||||||||||||||||||
| Allowances for loan losses | (10,174 | ) | (8,325 | ) | (6,887 | ) | ||||||||||||||||||||||||||||||
| Other assets | 41,167 | 32,037 | 30,626 | |||||||||||||||||||||||||||||||||
| Total non-interest earning assets | 87,996 | 78,319 | 72,426 | |||||||||||||||||||||||||||||||||
| Total Assets | $ | 1,374,101 | $ | 1,212,435 | $ | 972,572 | ||||||||||||||||||||||||||||||
| LIABILITIES & SHAREHOLDERS’ EQUITY | ||||||||||||||||||||||||||||||||||||
| Interest bearing liabilities: | ||||||||||||||||||||||||||||||||||||
| Interest bearing deposits: | ||||||||||||||||||||||||||||||||||||
| NOW accounts | $ | 151,745 | 4,967 | 3.27 | % | $ | 131,386 | 3,500 | 2.66 | % | $ | 92,754 | 919 | 0.99 | % | |||||||||||||||||||||
| Money market | 186,996 | 7,753 | 4.15 | % | 166,501 | 5,959 | 3.58 | % | 165,266 | 3,686 | 2.23 | % | ||||||||||||||||||||||||
| Savings deposits | 55,360 | 968 | 1.75 | % | 48,897 | 346 | 0.71 | % | 47,774 | 243 | 0.51 | % | ||||||||||||||||||||||||
| Time deposits | 486,658 | 24,172 | 4.97 | % | 477,204 | 21,852 | 4.58 | % | 357,824 | 12,595 | 3.52 | % | ||||||||||||||||||||||||
| Total interest-bearing deposits | 880,759 | 37,860 | 4.30 | % | 823,988 | 31,657 | 3.84 | % | 663,618 | 17,443 | 2.63 | % | ||||||||||||||||||||||||
| Short-term borrowings and FHLB advances | 174,583 | 7,861 | 4.50 | % | 86,883 | 4,102 | 4.72 | % | 39,465 | 1,282 | 3.25 | % | ||||||||||||||||||||||||
| Long-term borrowings | 39,860 | 3,000 | 7.53 | % | 27,442 | 2,412 | 8.79 | % | 17,052 | 1,579 | 9.26 | % | ||||||||||||||||||||||||
| Total interest bearing liabilities | 1,095,202 | 48,721 | 4.45 | % | 938,313 | 38,171 | 4.07 | % | 720,135 | 20,304 | 2.82 | % | ||||||||||||||||||||||||
| Non-interest bearing liabilities and shareholders’ equity: | ||||||||||||||||||||||||||||||||||||
| Demand deposits | 163,478 | 174,798 | 169,426 | |||||||||||||||||||||||||||||||||
| Other liabilities | 19,338 | 17,903 | 12,443 | |||||||||||||||||||||||||||||||||
| Shareholders’ equity | 96,083 | 81,421 | 70,568 | |||||||||||||||||||||||||||||||||
| Total non-interest bearing liabilities and shareholders’ equity | 278,899 | 274,122 | 252,437 | |||||||||||||||||||||||||||||||||
| Total liabilities and shareholders’ equity | $ | 1,374,101 | $ | 1,212,435 | $ | 972,572 | ||||||||||||||||||||||||||||||
| Interest rate spread | 2.94 | % | 3.48 | % | 3.82 | % | ||||||||||||||||||||||||||||||
| Net interest income | $ | 46,353 | $ | 47,406 | $ | 39,451 | ||||||||||||||||||||||||||||||
| Net interest margin (c) | 3.60 | % | 4.18 | % | 4.38 | % | ||||||||||||||||||||||||||||||
__________
| (a) | Average loans include non-performing loans. Interest on loans includes loan fees of $706 in 2007, $632 in 2006, and $468 in 2005. |
| (b) | Interest income and rates include the effects of a tax equivalent adjustment using applicable Federal tax rates in adjusting tax exempt interest on tax exempt investment securities and loans to a fully taxable basis. |
| (c) | Net interest margin is net interest income divided by average total interest-earning assets. |
Changes in net interest income
The table below details the components of the changes in net interest income for the last two years. For each major category of interest-earning assets and interest-bearing liabilities, information is provided with respect to changes due to average volumes and changes due to rates, with the changes in both volumes and rates allocated to these two categories based on the proportionate absolute changes in each category.
2007 compared to 2006 Due to changes in | 2006 compared to 2005 Due to changes in | |||||||||||||||||||||||
| (Dollars in thousands) | Average Volume | Average Rate | Net Increase (Decrease) | Average Volume | Average Rate | Net Increase (Decrease) | ||||||||||||||||||
| Interest income | ||||||||||||||||||||||||
| Loans (a) | $ | 7,738 | $ | (1,345 | ) | $ | 6,393 | $ | 16,637 | $ | 7,253 | $ | 23,890 | |||||||||||
| Investment securities (a) | 1,174 | 310 | 1,484 | 1,830 | 381 | 2,211 | ||||||||||||||||||
| Interest-bearing deposits in other banks | (3 | ) | - | (3 | ) | 3 | 9 | 12 | ||||||||||||||||
| FHLB stock | 207 | 11 | 218 | 116 | 56 | 172 | ||||||||||||||||||
| Federal funds sold | 1,355 | 50 | 1,405 | (918 | ) | 455 | (463 | ) | ||||||||||||||||
| Total interest income | 10,471 | (974 | ) | 9,497 | 17,668 | 8,154 | 25,822 | |||||||||||||||||
| Interest expense | ||||||||||||||||||||||||
| NOW accounts | 592 | 875 | 1,467 | 511 | 2,070 | 2,581 | ||||||||||||||||||
| Money market | 784 | 1,010 | 1,794 | 28 | 2,245 | 2,273 | ||||||||||||||||||
| Savings deposits | 51 | 571 | 622 | 6 | 97 | 103 | ||||||||||||||||||
| Time deposits | 440 | 1,880 | 2,320 | 4,867 | 4,390 | 9,257 | ||||||||||||||||||
| Short-term borrowings and FHLB advances | 3,957 | (198 | ) | 3,759 | 2,047 | 773 | 2,820 | |||||||||||||||||
| Long-term borrowings | 972 | (384 | ) | 588 | 917 | (84 | ) | 833 | ||||||||||||||||
| Total interest expense | 6,796 | 3,754 | 10,550 | 8,376 | 9,491 | 17,867 | ||||||||||||||||||
| Change in net interest income | $ | 3,675 | $ | (4,728 | ) | $ | (1,053 | ) | $ | 9,292 | $ | (1,337 | ) | $ | 7,955 | |||||||||
__________
(a) Interest income includes the effects of a tax equivalent adjustment using applicable federal tax rates in adjusting tax exempt interest on tax exempt investment securities and loans to a fully taxable basis.
Non-interest income
The following table presents the principal components of non-interest income for the years ended December 31:
| (Dollars in thousands) | 2007 | 2006 | 2005 | |||||||||
| Fees on mortgage loans sold | $ | 1,446 | $ | 1,599 | $ | 1,880 | ||||||
| Service charges on deposit accounts | 2,692 | 2,457 | 2,360 | |||||||||
| Investment securities gains (losses), net | (5,660 | ) | - | 1 | ||||||||
| Debit card income | 733 | 711 | 572 | |||||||||
| Earnings on bank owned life insurance policies | 445 | 400 | 416 | |||||||||
| Gain on sale of assets | 957 | 138 | 267 | |||||||||
| Other | 749 | 970 | 762 | |||||||||
| Total non-interest income | $ | 1,362 | $ | 6,275 | $ | 6,258 | ||||||
Non-interest income decreased by $4.9 million, or 78 %, in 2007 when compared to 2006 and 2005. The decrease is primarily due to losses on investment securities write-downs of $5.7 million.
2007 compared to 2006:
Non-interest income remained relatively constant during 2007 as compared to 2006 excluding the losses on investment securities and increased gains on sale of assets. While service charges on deposit accounts increased approximately 10% to $2.7 million during 2007, this increase was offset by the 10% decline in fees on mortgage loans sold. The increase in service charges is primarily due to an increase in overdraft related charges. The decrease in fees on mortgage loans sold is primarily due to lower volumes resulting from the continuing softening of the local real estate markets.
2006 compared to 2005:
Service charges on deposit accounts increased slightly in 2006. This increase is primarily due to growth in the number of deposit accounts and to increases in the volume of ATM usage. Debit card income also increased 24.3% over 2005 which resulted from the increase in customer usage of debit cards.
Non-interest expenses
The following table represents the principal components of non-interest expenses for the years ended December 31:
| (Dollars in thousands) | 2007 | 2006 | 2005 | |||||||||
| Salary and employee benefits | $ | 22,550 | $ | 20,205 | $ | 17,724 | ||||||
| Net occupancy expense | 7,979 | 6,120 | 5,502 | |||||||||
| Accounting, legal, and other professional | 2,144 | 1,710 | 1,444 | |||||||||
| Computer services | 2,172 | 1,955 | 1,650 | |||||||||
| Postage, courier and armored car | 837 | 845 | 719 | |||||||||
| Marketing and community relations | 1,151 | 983 | 731 | |||||||||
| Operating supplies | 581 | 581 | 589 | |||||||||
| Directors’ fees | 568 | 518 | 468 | |||||||||
| Indirect loan production expense | 12 | 276 | 379 | |||||||||
| Provision for unfunded commitments | (98 | ) | (101 | ) | 316 | |||||||
| Travel expenses | 396 | 387 | 299 | |||||||||
| FDIC and state assessments | 629 | 298 | 253 | |||||||||
| Amortization of intangibles | 440 | 288 | 291 | |||||||||
| Repossessed asset expenses | 986 | 312 | 128 | |||||||||
| Operational charge-offs | 74 | 124 | 69 | |||||||||
| Other operating expenses | 1,500 | 1,332 | 1,294 | |||||||||
| Total non-interest expenses | $ | 41,921 | $ | 35,833 | $ | 31,856 | ||||||
Over the past three years, non-interest expenses have increased from $31.9 million to $41.9 million or 32%. While primarily due to increases in employee salaries and benefits, facilities and infrastructure costs necessary to manage and facilitate our organizational growth, the increase in this category includes the operating costs of The Bank of Venice subsequent to its acquisition on April 30, 2007.
2007 compared to 2006:
Non-interest expense for 2007 was $41.9 million, an increase of approximately $6.1 million or 17% over $35.8 million for 2006. The increase reflects $1.8 million of non-interest expenses of The Bank of Venice which were not present in 2006; increases in employees’ salaries and benefits including severance for certain employees and signing bonuses for newly hired professionals related to the launch of our private banking and the acquisition of Naples Capital Advisors, Inc.; expenses related to consulting engagements; expenses related to the early termination of various contracts; increased repossession related expenses; and an increase in the FDIC insurance assessment.
2006 compared to 2005:
Non-interest expense for 2006 was $35.8 million, an increase of approximately $4.0 million or 12% over $31.9 million for 2005. The increase in non-interest expense is primarily attributable to salaries and employee benefits increasing $2.5 million. At December 31, 2006 the Company had 337 full-time employees and 11 part-time employees, compared to 332 full-time employees and 12 part-time employees at December 31, 2005. The higher personnel costs include approximately $305,000 of stock-based compensation expense. The Company began recording compensation expense related to stock options on January 1, 2006 pursuant to the adoption of SFAS 123R. Other expense includes a charitable contribution of approximately $135,000 expressing our commitment to and reinvestment in the community by funding the construction of affordable local housing.
Provision for income taxes
The provision for income taxes includes federal and state income taxes. The effective income tax rates for the years ended December 31, 2007, 2006, and 2005 were 42%, 36% and 37%, respectively. The fluctuations in effective tax rates reflect the effect of the differences in deductibility of certain income and expenses. The primary factor resulting in the higher tax benefit rate during 2007 is the greater relative impact of the effect of tax exempt interest income on the pretax loss. During 2006, the lower effective income tax rate was largely due to the recognition of a state income tax credit related to the Company’s funding of affordable housing construction costs for a local charitable organization. During 2006, the Company’s taxable income exceeded the 34% federal statutory income tax bracket and a portion of our taxable income was taxable at a rate of 35%. Additionally, during 2005, due primarily to the gain recognized on the sale of our merchant bankcard processing segment during that year, the Company’s taxable income exceeded the 34% Federal statutory tax bracket resulting in a portion of our taxable income being taxed at 35% and 38% statutory Federal income tax rates. Our future effective income tax rate will fluctuate based on the mix of taxable and tax free investments we make and, to a greater extent, our overall level of taxable income. See Notes 1 and 11 of our consolidated financial statements for additional information about the calculation of income tax expense and the various components thereof.
Loan Portfolio
Prior to our entrance into the Southwest Florida market in 2001, our primary locations were in the Florida Keys (Monroe County) and south Miami-Dade County. As this region’s primary industry is tourism, commercial loan demand is primarily for resort, hotel, restaurant, marina, and related real estate secured property loans. We serve this market by offering long-term, adjustable rate financing to the owners of these types of properties for acquisition and improvements. As our business has expanded in Southwest Florida, our loan portfolio has benefited from the resulting geographic diversification which is expected to provide more industry-based diversity to our loan portfolio. As of December 31, 2007, we had approximately $573.4 million of loans outstanding (including indirect auto dealer loans) in Southwest Florida.
The cost of living in Monroe County is higher in comparison to other counties in Florida due in large part to the limited and expensive real estate with various construction restrictions and environmental considerations. Accordingly, collateral values on loans secured by property in this market are greater. Collier and Lee counties in Southwest Florida are significantly higher growth communities and the majority of the growth of our commercial loan portfolio has been generated by serving this market. The quality of our credit administration along with historically stable real estate values has kept real estate secured loan losses for recent years at low levels.
Loans are expected to produce higher yields than investment securities and other interest-earning assets. The absolute volume of loans and the volume as a percentage of total earning assets are important determinants of the net interest margin. Total loans outstanding increased to $1.13 billion at the end of 2007 as compared to $1.06 billion at year end 2006, an increase of 6%. Of this amount, real estate mortgage loans increased 12% from $810.4 million to $904.2 million. Commercial real estate mortgage loans accounted for much of this increase, growing from $546.3 million to $612.1 million at the respective year ends. Residential loans also increased significantly growing from $82.2 million at December 31, 2006 to $112.1 million at December 31, 2007. Offsetting these increases in 2007 were declines in indirect auto dealer loans. This portfolio decreased from $141.6 million at December 31, 2006 to $117.4 million at December 31, 2007. The acquisition of The Bank of Venice during 2007 resulted in $58.7 million of the total loan growth during 2007. We generally originate commercial loans with rates that fluctuate with the prime lending rate or may be fixed for initial periods of 3 to 5 years and residential loans held in the portfolio with rates that adjust periodically and are tied to the one year treasury index. At December 31, 2007, 74% of the total loan portfolio had floating or adjustable rates.
The following table presents the composition our loan portfolio at December 31:
| (Dollars in thousands) | 2007 | 2006 | 2005 | 2004 | 2003 | |||||||||||||||
| Real estate mortgage loans: | ||||||||||||||||||||
| Commercial | $ | 612,084 | $ | 546,276 | $ | 451,969 | $ | 351,346 | $ | 297,221 | ||||||||||
| Residential | 112,138 | 82,243 | 76,003 | 67,204 | 60,104 | |||||||||||||||
| Farmland | 11,361 | 24,210 | 4,660 | 4,971 | 2,317 | |||||||||||||||
| Construction and vacant land | 168,595 | 157,672 | 125,207 | 49,815 | 32,089 | |||||||||||||||
| Commercial and agricultural loans | 72,076 | 84,905 | 80,055 | 64,622 | 63,624 | |||||||||||||||
| Indirect auto dealer loans | 117,439 | 141,552 | 118,018 | 91,890 | 59,437 | |||||||||||||||
| Home equity loans | 21,820 | 17,199 | 17,232 | 13,856 | 12,574 | |||||||||||||||
| Other consumer loans | 12,154 | 9,795 | 9,228 | 9,817 | 11,232 | |||||||||||||||
| Subtotal | 1,127,667 | 1,063,852 | 882,372 | 653,521 | 538,598 | |||||||||||||||
| Less: deferred loan costs (fees) | 1,489 | 1,616 | 1,652 | 2,157 | 1,815 | |||||||||||||||
| Less: allowance for loan losses | (14,973 | ) | (9,581 | ) | (7,546 | ) | (6,243 | ) | (5,216 | ) | ||||||||||
| Net loans | $ | 1,114,183 | $ | 1,055,887 | $ | 876,478 | $ | 649,435 | $ | 535,197 | ||||||||||
The two most significant components of our loan portfolio are commercial real estate and construction and vacant land. Our goal of maintaining high standards of credit quality include a strategy of diversification of loan type and purpose within these categories. The following charts illustrate the composition of these portfolios as of December 31.
| 2007 | 2006 | |||||||||||||||
| (Dollars in thousands) | Commercial Real Estate | Percentage Composition | Commercial Real Estate | Percentage Composition | ||||||||||||
| Mixed Use Commercial/Residential | $ | 103,937 | 17 | % | $ | 92,220 | 17 | % | ||||||||
| 1-4 Family and Multi Family | 76,339 | 13 | % | 75,154 | 14 | % | ||||||||||
| Hotels/Motels | 86,909 | 14 | % | 77,055 | 14 | % | ||||||||||
| Guesthouses | 81,817 | 13 | % | 76,990 | 14 | % | ||||||||||
| Office Buildings | 97,633 | 16 | % | 74,380 | 14 | % | ||||||||||
| Retail Buildings | 64,819 | 11 | % | 57,930 | 10 | % | ||||||||||
| Restaurants | 37,186 | 6 | % | 31,802 | 6 | % | ||||||||||
| Marinas/Docks | 20,364 | 3 | % | 26,312 | 5 | % | ||||||||||
| Warehouse and Industrial | 29,958 | 5 | % | 21,206 | 4 | % | ||||||||||
| Other | 13,122 | 2 | % | 13,227 | 2 | % | ||||||||||
| Total | $ | 612,084 | 100 | % | $ | 546,276 | 100 | % | ||||||||
| 2007 | 2006 | |||||||||||||||
| (Dollars in thousands) | Construction and Vacant Land | Percentage Composition | Construction and Vacant Land | Percentage Composition | ||||||||||||
| Construction: | ||||||||||||||||
Residential – owner occupied | $ | 20,620 | 12 | % | $ | 23,892 | 15 | % | ||||||||
Residential – commercial developer | 36,107 | 21 | % | 42,664 | 27 | % | ||||||||||
Commercial structure | 14,367 | 9 | % | 24,035 | 15 | % | ||||||||||
| Total construction | 71,094 | 42 | % | 90,591 | 57 | % | ||||||||||
| Land: | ||||||||||||||||
Raw land | 15,890 | 9 | % | 6,580 | 4 | % | ||||||||||
Residential lots | 16,775 | 10 | % | 19,759 | 13 | % | ||||||||||
Land development | 29,818 | 18 | % | 9,578 | 6 | % | ||||||||||
Commercial lots | 35,018 | 21 | % | 31,164 | 20 | % | ||||||||||
| Total land | 97,501 | 58 | % | 67,081 | 43 | % | ||||||||||
| Total | $ | 168,595 | 100 | % | $ | 157,672 | 100 | % | ||||||||
The contractual maturity distribution of our loan portfolio at December 31, 2007 is indicated in the table below. The majority of these are amortizing loans.
| Loans maturing | ||||||||||||||||
| (Dollars in thousands) | Within 1 Year | 1 to 5 Years | After 5 Years | Total | ||||||||||||
| Real estate mortgage loans: | ||||||||||||||||
| Commercial | $ | 72,530 | $ | 95,315 | $ | 444,239 | $ | 612,084 | ||||||||
| Residential | 3,221 | 1,761 | 107,156 | 112,138 | ||||||||||||
| Farmland | 1,021 | 1,831 | 8,509 | 11,361 | ||||||||||||
| Construction and vacant land (a) | 79,180 | 60,431 | 28,984 | 168,595 | ||||||||||||
| Commercial and agricultural loans | 33,840 | 24,579 | 13,657 | 72,076 | ||||||||||||
| Indirect auto dealer loans | 3,557 | 97,109 | 16,773 | 117,439 | ||||||||||||
| Home equity loans | 1,851 | 6,610 | 13,359 | 21,820 | ||||||||||||
| Other consumer loans | 2,428 | 7,117 | 2,609 | 12,154 | ||||||||||||
| Total loans | $ | 197,628 | $ | 294,753 | $ | 635,286 | $ | 1,127,667 | ||||||||
__________
(a)$22,364 of this amount relates to residential real estate construction loans that have been approved for permanent financing but are still under construction. The remaining amount relates to vacant land and commercial real estate construction loans, some of which have been approved for permanent financing but are still under construction.
| Loans maturing | ||||||||||||||||
| (Dollars in thousands) | Within 1 Year | 1 to 5 Years | After 5 Years | Total | ||||||||||||
| Loans with: | ||||||||||||||||
| Predetermined interest rates | $ | 44,706 | $ | 191,381 | $ | 55,886 | $ | 291,973 | ||||||||
| Floating or adjustable rates | 152,922 | 103,372 | 579,400 | 835,694 | ||||||||||||
| Total loans | $ | 197,628 | $ | 294,753 | $ | 635,286 | $ | 1,127,667 | ||||||||
Allowance and Provision for Loan Losses
The allowance for loan losses is a valuation allowance for probable incurred credit losses in the loan portfolio. Our formalized process for assessing the adequacy of the allowance for loan losses and the resultant need, if any, for periodic provisions to the allowance charged to income, includes both individual loan analyses and loan pool analyses. Individual loan analyses are periodically performed on loan relationships of a significant size, or when otherwise deemed necessary, and primarily encompass commercial real estate and other commercial loans. The result is that commercial real estate loans and commercial loans are divided into the following risk categories: Pass, Special Mention, Substandard and Loss. When appropriate, a specific reserve will be established for individual loans. Otherwise, we allocate an allowance for each risk category. The allocations are based on factors including historical loss rate, perceived economic conditions (local, national and global), perceived strength of our management, recent trends in loan loss history, and concentrations of credit.
Home equity loans, indirect auto dealer loans, residential loans and consumer loans generally are not analyzed individually. These loans are grouped into pools and assigned risk categories based on their current payment status and management’s assessment of risk inherent in the various types of loans. As above, when appropriate, a specific reserve will be established for individual loans. Otherwise, we allocate an allowance for each loan classification. The allocations are based on the same factors mentioned above.
Senior management and the Board of Directors review this calculation and the underlying assumptions on a routine basis not less frequently than quarterly.
The allowance for loan losses amounted to $15.0 million and $9.6 million at December 31, 2007 and December 31, 2006, respectively. Based on an analysis performed by management at December 31, 2007, the allowance for loan losses is considered to be adequate to cover estimated loan losses in the portfolio as of that date. However, management’s judgment is based upon a number of assumptions about future events, which are believed to be reasonable, but which may or may not prove valid. Thus, there can be no assurance that charge-offs in future periods will not exceed the allowance for loan losses or that significant additional increases in the allowance for loan losses will not be required. In addition, various regulatory agencies, as an integral part of their examination process, periodically review our allowance for loan losses. Such agencies may require us to recognize additions to the allowance based on their judgments about information available to them at the time of their examination.
The provision for loan losses is a charge to income in the current period to replenish the allowance and maintain it at a level that management has determined to be adequate to absorb estimated losses in the loan portfolio. Our provision for loan losses was $9.7 million, $3.5 million and $2.4 million for the years ended December 31, 2007, 2006 and 2005, respectively. Loan growth of $181.5 million and $228.9 million was the primary driver of the provision for loan losses during 2006 and 2005, respectively. The higher provision for loan losses in 2007 was primarily attributable to the continued contraction of residential real estate activity and the ripple effect on our local economies as well as the increase in our nonperforming loans, delinquencies and charge-offs. Additionally, due to the weakening economic environment, we increased economic risk factors employed in estimating the allowance during the second quarter of 2006 and have maintained these higher factors since that period. We again elevated certain quantitative and qualitative factors used in estimating our allowance for loan losses during each quarter of 2007.
Management continuously monitors and actively manages the credit quality of the loan portfolio and will continue to recognize the provision required to maintain the allowance for loan losses at an appropriate level. Due to the economic slowdown discussed above our customers are exhibiting increasing difficulty in timely payment of their loan obligations. We believe that this trend will continue in the near term. Consequently, we may experience higher levels of delinquent and nonperforming loans, which may require higher provisions for loan losses, higher charge-offs and higher collection related expenses in future periods.
Changes affecting the allowance for loan losses are summarized for the years ended December 31,
| (Dollars in thousands) | 2007 | 2006 | 2005 | 2004 | 2003 | |||||||||||||||
| Balance at beginning of year | $ | 9,581 | $ | 7,546 | $ | 6,243 | $ | 5,216 | $ | 4,272 | ||||||||||
| Charge-offs: | ||||||||||||||||||||
| Real estate mortgage loans: | ||||||||||||||||||||
| Commercial | 118 | - | - | - | - | |||||||||||||||
| Residential | 63 | - | - | - | - | |||||||||||||||
| Farmland | - | - | - | - | - | |||||||||||||||
| Construction and vacant land | 1,251 | - | - | - | - | |||||||||||||||
| Commercial and agricultural loans | 278 | 12 | 107 | 92 | 183 | |||||||||||||||
| Indirect auto dealer loans | 3,110 | 1,557 | 1,045 | 1,313 | 370 | |||||||||||||||
| Home equity loans | 331 | - | - | - | 53 | |||||||||||||||
| Other consumer loans | 51 | 4 | 67 | 82 | 61 | |||||||||||||||
| Total charge-offs | 5,202 | 1,573 | 1,219 | 1,487 | 667 | |||||||||||||||
| Recoveries: | ||||||||||||||||||||
| Real estate mortgage loans: | ||||||||||||||||||||
| Commercial | - | - | - | - | 6 | |||||||||||||||
| Residential | - | - | - | - | - | |||||||||||||||
| Farmland | - | - | - | - | - | |||||||||||||||
| Construction and vacant land | - | - | - | - | - | |||||||||||||||
| Commercial and agricultural loans | - | 20 | 6 | 38 | 1 | |||||||||||||||
| Indirect auto dealer loans | 262 | 55 | 65 | 3 | 8 | |||||||||||||||
| Home equity loans | 2 | 2 | 8 | 2 | 1 | |||||||||||||||
| Other consumer loans | 6 | 40 | 30 | 16 | 9 | |||||||||||||||
| Total recoveries | 270 | 117 | 109 | 59 | 25 | |||||||||||||||
| Net charged off | 4,932 | 1,456 | 1,110 | 1,428 | 642 | |||||||||||||||
| Provision for loan losses | 9,657 | 3,491 | 2,413 | 2,455 | 1,586 | |||||||||||||||
| Acquisition of The Bank of Venice | 667 | - | - | - | - | |||||||||||||||
| Allowance for loan losses at end of year | $ | 14,973 | $ | 9,581 | $ | 7,546 | $ | 6,243 | $ | 5,216 | ||||||||||
| Ratio of net charge-offs to average net loans outstanding | 0.45 | % | 0.15 | % | 0.14 | % | 0.24 | % | 0.13 | % | ||||||||||
While no portion of the allowance is in any way restricted to any individual loan or group of loans and the entire allowance is available to absorb losses from any and all loans, the following table represents management’s best estimate of the allocation of the allowance for loan losses to the various segments of the loan portfolio based on information available as of December 31. Qualitative factors used in determining the allowance for loan losses resulted in the establishment of an unallocated reserve totaling approximately $1.1 million as of December 31, 2007. Due to the ongoing evaluation and changes in the basis for the allowance for loan losses, actual future charge offs will not necessarily follow the allocations described below.
| 2007 | 2006 | 2005 | 2004 | 2003 | ||||||||||||||||||||||||||||||||||||
| (Dollars in thousands) | Allowance | % of Total Loans | Allowance | % of Total Loans | Allowance | % of Total Loans | Allowance | % of Total Loans | Allowance | % of Total Loans | ||||||||||||||||||||||||||||||
| Real estate mortgage loans: | ||||||||||||||||||||||||||||||||||||||||
| Commercial | $ | 5,250 | 54 | % | $ | 3,764 | 51 | % | $ | 2,971 | 51 | % | $ | 2,513 | 54 | % | $ | 2,608 | 55 | % | ||||||||||||||||||||
| Residential | 381 | 10 | % | 191 | 8 | % | 168 | 9 | % | 144 | 10 | % | 151 | 11 | % | |||||||||||||||||||||||||
| Farmland | 84 | 1 | % | 161 | 2 | % | 30 | 1 | % | 34 | 1 | % | 20 | 1 | % | |||||||||||||||||||||||||
| Construction and vacant land | 1,218 | 15 | % | 922 | 15 | % | 743 | 14 | % | 312 | 8 | % | 217 | 6 | % | |||||||||||||||||||||||||
| Commercial and agricultural loans | 1,547 | 6 | % | 1,002 | 8 | % | 912 | 9 | % | 737 | 10 | % | 901 | 12 | % | |||||||||||||||||||||||||
| Indirect auto dealer loans | 5,072 | 11 | % | 3,352 | 13 | % | 2,523 | 13 | % | 2,312 | 14 | % | 1,095 | 11 | % | |||||||||||||||||||||||||
| Home equity loans | 213 | 2 | % | 87 | 2 | % | 85 | 2 | % | 67 | 2 | % | 78 | 2 | % | |||||||||||||||||||||||||
| Other consumer loans | 113 | 1 | % | 102 | 1 | % | 114 | 1 | % | 124 | 1 | % | 146 | 2 | % | |||||||||||||||||||||||||
| Unallocated | 1,095 | - | - | - | - | |||||||||||||||||||||||||||||||||||
| $ | 14,973 | 100 | % | $ | 9,581 | 100 | % | $ | 7,546 | 100 | % | $ | 6,243 | 100 | % | $ | 5,216 | 100 | % | |||||||||||||||||||||
Non-Performing Assets
Non-performing assets include non-accrual loans and investments securities, accruing loans contractually past due 90 days or more, repossessed personal property, and other real estate. Loans and investments are placed on non-accrual status when management has concerns relating to the ability to collect the principal and interest and generally when such assets are 90 days or more past due. A loan is considered impaired when it is probable that not all principal and interest amounts will be collected according to the loan contract. Non-performing assets were as follows for the periods ending December 31:
| (Dollars in thousands) | 2007 | 2006 | 2005 | 2004 | 2003 | |||||||||||||||
| Total non-accrual loans (a) | $ | 16,086 | $ | 4,223 | $ | 956 | $ | 704 | $ | 390 | ||||||||||
| Accruing loans delinquent 90 days or more (a) | - | - | - | - | - | |||||||||||||||
| Total non-performing loans | 16,086 | 4,223 | 956 | 704 | 390 | |||||||||||||||
| Non-accrual investment security(b) | 3,154 | - | - | - | - | |||||||||||||||
| Repossessed personal property (primarily indirect auto dealer loans) | 3,136 | 1,958 | 962 | 688 | 598 | |||||||||||||||
| Other real estate owned | 1,846 | - | 190 | 882 | 193 | |||||||||||||||
| Other assets (c) | 2,915 | 2,861 | 2,815 | 2,665 | 2,472 | |||||||||||||||
| Total non-performing assets | $ | 27,137 | $ | 9,042 | $ | 4,923 | $ | 4,939 | $ | 3,653 | ||||||||||
| Allowance for loan losses | $ | 14,973 | $ | 9,581 | $ | 7,546 | $ | 6,243 | $ | 5,216 | ||||||||||
| Non-performing assets as a percent of total assets | 1.88 | % | 0.69 | % | 0.46 | % | 0.60 | % | 0.55 | % | ||||||||||
| Non-performing loans as a percent of total loans | 1.43 | % | 0.40 | % | 0.11 | % | 0.11 | % | 0.07 | % | ||||||||||
| Allowance for loan losses as a percent of non-performing loans (a) | 93.08 | % | 226.88 | % | 789.33 | % | 886.79 | % | 1,336.33 | % | ||||||||||
_________
| (a) | Non-performing loans from 2003 through 2005 exclude the $1.6 million loan discussed below that is guaranteed for both principal and interest by the USDA. In December 2006, the Bank stopped accruing interest on this loan pursuant to a ruling made by the USDA. Accordingly, the loan is included in total non-accrual loans as of December 31, 2006 and 2007. Other non-accrual loans at December 31, 2003 through December 31, 2006 are primarily indirect auto dealer loans. Non-accrual loans as of December 31, 2007 and 2006 are as follows: |
| December 31, 2007 | December 31, 2006 | |||||||||||||||
| Collateral Description | Number of Loans | Outstanding Balance | Number of Loans | Outstanding Balance | ||||||||||||
| Residential 1-4 family | 13 | $ | 4,442 | 2 | $ | 150 | ||||||||||
| Commercial and agricultural | 4 | 293 | 1 | 142 | ||||||||||||
| Commercial real estate | 4 | 2,619 | 1 | 396 | ||||||||||||
| Residential land development | 1 | 2,686 | - | - | ||||||||||||
| Participations in residential loan pools | 9 | 1,246 | - | - | ||||||||||||
| Government guaranteed loan | 1 | 1,641 | 1 | 1,641 | ||||||||||||
| Indirect auto-dealer loans | 238 | 3,159 | 156 | 1,894 | ||||||||||||
| $ | 16,086 | $ | 4,223 | |||||||||||||
| (b) | In December 2007, the Company placed a collateralized debt security secured primarily by homebuilders, REITs, real estate companies and commercial mortgage backed securities on non-accrual. This security had an original cost of $6.0 million and was rated A at purchase. Additionally, management deemed the decline in market value of this security other than temporary and recorded a realized loss of $2.8 million in writing the security down to its December 31, 2007 fair value of $3.2 million. For additional details on this and other investment securities, see the section of management’s discussion and analysis that follows entitled “Investment Portfolio”. |
| (c) | In 1998, TIB Bank made a $10.0 million loan to construct a lumber mill in northern Florida. Of this amount, $6.4 million had been sold by the Bank to other lenders. The loan was 80% guaranteed as to principal and interest by the U.S. Department of Agriculture (USDA). In addition to business real estate and equipment, the loan was collateralized by the business owner’s interest in a trust. Under provisions of the trust agreement, beneficiaries cannot receive trust assets until November 2010. |
The portion of this loan guaranteed by the USDA and held by us was approximately $1.6 million at December 31, 2007 and December 31, 2006. The loan was accruing interest until December 2006 when the Bank ceased the accrual of interest pursuant to a ruling made by the USDA. Accrued interest on this loan totals approximately $941,000 at December 31, 2007 and December 31, 2006, respectively.
In pursuing a sale of the property and equipment, the Bank has incurred various expenditures. The Bank capitalized the liquidation costs and portion of the protective advances which it expects will be fully reimbursed by the USDA. The non-guaranteed principal and interest ($2.0 million at December 31, 2007 and December 31, 2006) and the reimbursable capitalized liquidation costs and protective advance costs totaling approximately $954,000 and $899,000 at December 31, 2007 and December 31, 2006, respectively, are included as “other assets” in the financial statements.
Florida law requires a bank to liquidate or charge off repossessed real property within five years, and repossessed personal property within six months. Since the property had not been liquidated during this period, the Bank charged-off the non guaranteed principal and interest totaling $2.0 million at June 30, 2003, for regulatory purposes. Since we believe this amount is ultimately realizable, we did not write off this amount for financial statement purposes under generally accepted accounting principles.
In February 2008, a $13.5 million commercial land development loan matured and was placed on non-accrual because the borrowers were unable to service the debt.
Liquidity and Rate Sensitivity
Liquidity represents the ability to provide steady sources of funds for loan commitments and investment activities, as well as to provide sufficient funds to cover deposit withdrawals and payments of debt, off-balance sheet obligations and operating obligations. Funds can be obtained from operations by converting assets to cash, by attracting new deposits, by borrowing, by raising capital and other ways.
Major sources of increases and decreases in cash and cash equivalents are as follows for the three years ending December 31:
| (Dollars in thousands) | 2007 | 2006 | 2005 | |||||||||
| Provided by operating activities | $ | 3,770 | $ | 11,607 | $ | 19,998 | ||||||
| Used by investing activities | (40,328 | ) | (229,815 | ) | (246,077 | ) | ||||||
| Provided by financing activities | 52,065 | 232,250 | 224,651 | |||||||||
| Net increase (decrease) in cash and cash equivalents | $ | 15,507 | $ | 14,042 | $ | (1,428 | ) | |||||
As discussed in Note 16 of the Consolidated Financial Statements, the Company had unfunded loan commitments and unfunded letters of credit totaling $136.1 million at December 31, 2007. The Company believes the likelihood of these commitments either needing to be totally funded or funded at the same time is low. However, should significant funding requirements occur, the Company has available borrowing capacity from various sources as discussed below.
The Banks have unsecured overnight federal funds purchased accommodation up to a maximum of $30.0 million from their principal correspondent banks. Additionally, the Banks have agreements with various financial institutions under which securities can be sold under agreements to repurchase. Further, the Banks have invested in FHLB stock for the purpose of establishing credit lines with the FHLB. The credit availability to the Banks is based on a percentage of the Banks’ total assets as reported on the most recent quarterly financial information submitted to the regulators subject to the pledging of sufficient collateral. At December 31, 2007, in addition to $25.0 million in letters of credit used in lieu of pledging securities to the State of Florida there was $140.0 million in advances outstanding. Borrowings are collateralized by the Banks’ qualifying one-to-four family residential mortgage loans and commercial real estate loans. The amount eligible for collateral approximated $200.9 million at December 31, 2007.
Scheduled maturities and paydowns of loans and investment securities are a continued source of liquidity. Also, many adjustable rate residential real estate loans originated are salable in the secondary mortgage market at par or better and therefore provide a secondary source for liquidity.
At December 31, 2007, our gross loan to deposit ratio was 107.5% compared to a ratio of 103.3% at December 31, 2006. Management monitors and assesses the adequacy of our liquidity position on a monthly basis to ensure that sufficient sources of liquidity are maintained and available.
Under state banking law, regulatory approval will be required if the total of all dividends declared in any calendar year by a bank exceeds the bank’s net profits to date for that year combined with its retained net profits for the preceding two years. Subsequent to year end, TIB Bank paid $7.6 million of dividends to the holding company that had been declared during 2007. Based on the level of undistributed earnings for the prior two years, declaration of dividends by TIB Bank, during 2008, would likely require regulatory approval. The Bank of Venice has no retained earnings available for dividends. These dividends represent the Company’s primary source of liquidity on a stand alone basis.
Closely related to liquidity management is the management of interest-earning assets and interest-bearing liabilities. The Company manages its rate sensitivity position to avoid wide swings in net interest margins and to minimize risk due to changes in interest rates.
Our interest rate sensitivity position at December 31, 2007 is presented in the table below.
| (Dollars in thousands) | 3 Months or Less | 4 to 6 Months | 7 to 12 Months | 1 to 5 Years | Over 5 Years | Total | ||||||||||||||||||
| Interest-earning assets: | ||||||||||||||||||||||||
| Loans | $ | 337,276 | $ | 44,677 | $ | 81,806 | $ | 540,507 | $ | 123,401 | $ | 1,127,667 | ||||||||||||
| Investment securities-taxable | 35,969 | 9,997 | 7,284 | 18,383 | 77,916 | 149,549 | ||||||||||||||||||
| Investment securities-tax exempt | 1,486 | 683 | 201 | 968 | 6,246 | 9,584 | ||||||||||||||||||
| Marketable equity securities | 1,224 | - | - | - | - | 1,224 | ||||||||||||||||||
| FHLB stock | 8,881 | - | - | - | - | 8,881 | ||||||||||||||||||
| Federal funds sold and securities purchased under agreements to resell | 48,744 | - | - | - | - | 48,744 | ||||||||||||||||||
| Interest-bearing deposit in other banks | 146 | - | - | - | - | 146 | ||||||||||||||||||
| Total interest-bearing assets | 433,726 | 55,357 | 89,291 | 559,858 | 207,563 | 1,345,795 | ||||||||||||||||||
| Interest-bearing liabilities: | ||||||||||||||||||||||||
| NOW accounts | 161,878 | - | - | - | - | 161,878 | ||||||||||||||||||
| Money market | 176,900 | - | - | - | - | 176,900 | ||||||||||||||||||
| Savings deposits | 55,045 | - | - | - | - | 55,045 | ||||||||||||||||||
| Time deposits | 138,116 | 131,831 | 152,922 | 89,885 | - | 512,754 | ||||||||||||||||||
| Subordinated debentures | 25,000 | - | - | - | 8,000 | 33,000 | ||||||||||||||||||
| Other borrowings | 102,922 | - | 30,000 | 115,000 | - | 247,922 | ||||||||||||||||||
| Total interest-bearing liabilities | 659,861 | 131,831 | 182,922 | 204,885 | 8,000 | 1,187,499 | ||||||||||||||||||
| Interest sensitivity gap | $ | (226,135 | ) | $ | (76,474 | ) | $ | (93,631 | ) | $ | 354,973 | $ | 199,563 | $ | 158,296 | |||||||||
| Cumulative interest sensitivity gap | $ | (226,135 | ) | $ | (302,609 | ) | $ | (396,240 | ) | $ | (41,267 | ) | $ | 158,296 | $ | 158,296 | ||||||||
| Cumulative sensitivity ratio | (16.8 | %) | (22.5 | %) | (29.4 | %) | (3.1 | %) | 11.8 | % | 11.8 | % | ||||||||||||
We are cumulatively liability sensitive through the five-year time period, and asset sensitive in the over five year timeframe above. Certain liabilities such as non-indexed NOW and passbook savings accounts, while technically subject to immediate re-pricing in response to changing market rates, historically do not re-price as quickly or to the extent as other interest-sensitive accounts. If market interest rates should decrease, it is anticipated that our net interest margin would decrease. Also, as approximately 14% of our deposit funding is comprised of non-interest-bearing liabilities, total interest-earning assets are substantially greater than the total interest-bearing liabilities and therefore it is anticipated that, over time, the effects on net interest income from changes in asset yield will be greater than the change in expense from liability cost. In the next three months, we anticipate short-term interest rates may decline and we expect that our net interest margin may decline. This expectation is due to the effects of competitive pressure on loan production combined with increased depositor rate sensitivity. Due to the Federal Reserve’s recent monetary policy where short-term interest rates are decreasing, we anticipate that our net interest margin contraction would be slower because we have positioned the Company by increasing our liability sensitivity through variable borrowings and shorter term certificates of deposit. We expect this will be largely offset by the effect of having more total assets subject to rate changes than total liabilities that are rate sensitive.
Even in the near term, we believe the $396.2 million one year cumulative negative sensitivity gap may exaggerate the probable effects on earnings for two reasons. First, the liabilities subject to re-pricing are predominately not indexed to any specific market rate and therefore they may not fully reflect the changes in market rates in any rate re-pricings. Further, the assets subject to re-pricing are expected to reflect fully any changes in market rates, primarily the prime rate.
Interest-earning assets and time deposits are presented based on their contractual terms. It is anticipated that run off in any deposit category will be approximately offset by new deposit generation. It is our policy to maintain our cumulative one year gap ratio in the -30% to 0% range. At December 31, 2007, the Company was within this range with a one year cumulative sensitivity ratio of -29.4%. Anticipating the end of the cycle of Federal Reserve interest rate hikes, we had intentionally increased the liability sensitivity of the balance sheet through variable rate funding decisions when possible. The effectiveness of this tactic will depend on the timing and extent of the current round of interest rate decreases.
Investment Portfolio
Contractual maturities of investment securities at December 31, 2007 are shown below. Expected maturities may differ from contractual maturities because borrowers may have the right to call or repay obligations without call or prepayment penalties. Other securities include mortgage-backed securities and marketable equity securities which are not due at a single maturity date.
| (Dollars in thousands) | Within 1 Year | After 1 Year Within 5 Years | After 5 Years Within 10 Years | After 10 Years | Other Securities | |||||||||||||||||||||||||||||||
| Amount | Yield | Amount | Yield | Amount | Yield | Amount | Yield | Amount | ||||||||||||||||||||||||||||
| Securities Available for Sale: | ||||||||||||||||||||||||||||||||||||
| U.S. Gov’t agencies and corporations | $ | 8,525 | 3.09 | % | $ | 25,236 | 4.73 | % | $ | 27,958 | 5.12 | % | $ | 11,942 | 5.57 | % | $ | - | ||||||||||||||||||
| States and political subdivisions – tax exempt (a) | 1,548 | 5.31 | % | 1,461 | 6.68 | % | 4,708 | 5.25 | % | 1,867 | 5.66 | % | - | |||||||||||||||||||||||
| States and political subdivisions – taxable | - | - | 176 | 7.29 | % | - | - | 2,299 | 6.10 | % | - | |||||||||||||||||||||||||
| Marketable equity securities (a) | - | - | - | - | - | - | - | - | 1,224 | |||||||||||||||||||||||||||
| Mortgage-backed securities | - | - | - | - | - | - | - | - | 60,160 | |||||||||||||||||||||||||||
| Corporate bonds | - | - | - | - | - | - | 2,765 | 6.13 | % | - | ||||||||||||||||||||||||||
| Collateralized debt obligations | - | - | - | - | - | - | 10,488 | 5.06 | % | - | ||||||||||||||||||||||||||
| Total | $ | 10,073 | 3.43 | % | $ | 26,873 | 4.86 | % | $ | 32,666 | 5.14 | % | $ | 29,361 | 5.48 | % | $ | 61,384 | ||||||||||||||||||
Yield by classification of investment securities at December 31, 2007 was as follows:
| (Dollars in thousands) | Yield | Totals | ||||||
| Securities Available for Sale: | ||||||||
| U.S. Government agencies and corporations | 4.82 | % | 73,661 | |||||
| States and political subdivisions – tax exempt (a) | 5.56 | % | 9,584 | |||||
| States and political subdivisions – taxable | 6.18 | % | 2,475 | |||||
| Marketable equity securities (a) (b) | 14.34 | % | 1,224 | |||||
| Mortgage-backed securities | 5.39 | % | 60,160 | |||||
| Corporate bonds | 6.13 | % | 2,765 | |||||
| Collateralized debt obligations | 5.06 | % | 10,488 | |||||
| Total | 5.21 | % | $ | 160,357 | ||||
_____
| (a) | Weighted average yields on tax exempt obligations and marketable equity securities have been computed by grossing up actual tax exempt income |
| (b) | Weighted average yield on marketable equity securities was computed using the actual 2007 income grossed up to an 85% taxable equivalent basis. We expect the future yield and relative proportion of tax exempt income to be significantly lower during 2008 and beyond. |
The following table presents the amortized cost, unrealized gains, unrealized losses, and market value for the major categories of our investment portfolio for each reported period:
Available for Sale—December 31, 2007
| (Dollars in thousands) | Amortized Cost | Unrealized Gains | Unrealized Losses | Fair Value | ||||||||||||
| U.S. Government agencies and corporations | $ | 72,482 | $ | 1,245 | $ | 66 | $ | 73,661 | ||||||||
| States and political subdivisions-tax exempt | 9,629 | 6 | 51 | 9,584 | ||||||||||||
| States and political subdivisions-taxable | 2,495 | 1 | 21 | 2,475 | ||||||||||||
| Marketable equity securities | 1,224 | - | - | 1,224 | ||||||||||||
| Mortgage-backed securities | 60,161 | 295 | 296 | 60,160 | ||||||||||||
| Corporate bonds | 2,865 | - | 100 | 2,765 | ||||||||||||
| Collateralized debt obligations | 11,110 | - | 622 | 10,488 | ||||||||||||
| $ | 159,966 | $ | 1,547 | $ | 1,156 | $ | 160,357 | |||||||||
Available for Sale—December 31, 2006
| (Dollars in thousands) | Amortized Cost | Unrealized Gains | Unrealized Losses | Fair Value | ||||||||||||
| U.S. Treasury Securities | $ | 5,087 | $ | - | $ | 125 | $ | 4,962 | ||||||||
| U.S. Government agencies and corporations | 84,014 | 278 | 1,294 | 82,998 | ||||||||||||
| States and political subdivisions-tax exempt | 10,818 | 22 | 98 | 10,742 | ||||||||||||
| States and political subdivisions-taxable | 2,578 | 12 | - | 2,590 | ||||||||||||
| Marketable equity securities | 3,000 | 484 | - | 3,484 | ||||||||||||
| Mortgage-backed securities | 16,428 | 94 | 8 | 16,514 | ||||||||||||
| Collateralized debt obligations | 9,996 | - | 87 | 9,909 | ||||||||||||
| $ | 131,921 | $ | 890 | $ | 1,612 | $ | 131,199 | |||||||||
Available for Sale—December 31, 2005
| (Dollars in thousands) | Amortized Cost | Unrealized Gains | Unrealized Losses | Fair Value | ||||||||||||
| U.S. Treasury Securities | $ | 5,182 | $ | 1 | $ | 145 | $ | 5,038 | ||||||||
| U.S. Government agencies and corporations | 64,145 | 5 | 1,738 | 62,412 | ||||||||||||
| States and political subdivisions-tax exempt | 9,594 | 91 | 101 | 9,584 | ||||||||||||
| States and political subdivisions-taxable | 2,655 | 8 | - | 2,663 | ||||||||||||
| Marketable equity securities | 3,000 | 439 | - | 3,439 | ||||||||||||
| Mortgage-backed securities | 10,083 | 193 | 24 | 10,252 | ||||||||||||
| Collateralized debt obligations | 3,996 | 80 | - | 4,076 | ||||||||||||
| $ | 98,655 | $ | 817 | $ | 2,008 | $ | 97,464 | |||||||||
Other than temporary impairment of available for sale securities
As of December 31, 2007, we owned three collateralized debt obligation investment securities with an aggregate original cost of $10.0 million that had an estimated fair value of $6.1 million at that time. The underlying assets in the three collateralized debt obligations are comprised primarily of corporate debt obligations of homebuilders, REITs, real estate companies and commercial mortgage backed securities. These securities are floating rate securities which were rated “A” or better by an independent and nationally recognized rating agency at the time of our purchase. In late December 2007, these securities were downgraded below investment grade by a nationally recognized rating agency. Due to the ratings downgrade, and the amount of unrealized loss, management concluded that the loss of value was other than temporary under generally accepted accounting principles and the Company wrote these investment securities down to their estimated fair value. This resulted in the recognition of an other than temporary impairment loss of $3.9 million. In determining their estimated fair value, management utilized a discounted cash flow modeling valuation approach. Additionally, during 2007, the market value of an investment in equity securities, which the Company originally acquired in 2003 for $3.0 million to obtain community reinvestment credit, of a publicly owned company declined significantly. As of December 31, 2007, management determined that this decline was other than temporary and wrote this investment down by $1.8 million to its fair value at that time. These write downs resulted in a total recognized other than temporary impairment loss of $5.7 million during 2007. During 2006 and 2005, no other than temporary impairment losses were necessary.
We regularly review each investment security for impairment based on criteria that include the extent to which cost exceeds market price, the duration of that market decline, the financial health of and specific prospects for the issuer(s) and our ability and intention with regard to holding the security to maturity. Future declines in the market value of these or other securities may result in additional impairment charges which may be material to the financial condition and results of operations of the Company.
Deposits
The following table presents the average amount outstanding and the average rate paid on deposits by us for the years ended December 31, 2007, 2006, and 2005.
| 2007 | 2006 | 2005 | ||||||||||||||||||||||
| (Dollars in thousands) | Average Amount | Average Rate | Average Amount | Average Rate | Average Amount | Average Rate | ||||||||||||||||||
| Non-interest bearing deposits | $ | 163,478 | $ | 174,798 | $ | 169,426 | ||||||||||||||||||
| Interest-bearing deposits | ||||||||||||||||||||||||
| NOW Accounts | 151,745 | 3.27 | % | 131,386 | 2.66 | % | 92,754 | 0.99 | % | |||||||||||||||
| Money market | 186,996 | 4.15 | % | 166,501 | 3.58 | % | 165,266 | 2.23 | % | |||||||||||||||
| Savings deposit | 55,360 | 1.75 | % | 48,897 | 0.71 | % | 47,774 | 0.51 | % | |||||||||||||||
| Time deposits | 486,658 | 4.97 | % | 477,204 | 4.58 | % | 357,824 | 3.52 | % | |||||||||||||||
| Total | $ | 1,044,237 | 3.63 | % | $ | 998,786 | 3.17 | % | $ | 833,044 | 2.09 | % | ||||||||||||
The following table presents the maturity of our time deposits at December 31, 2007:
| (Dollars in thousands) | Deposits $100 and Greater | Deposits Less than $100 | Total | |||||||||
| Months to maturity: | ||||||||||||
| 3 or less | $ | 61,678 | $ | 62,306 | $ | 123,984 | ||||||
| 4 to 6 | 60,479 | 71,475 | 131,954 | |||||||||
| 7 through 12 | 60,911 | 92,754 | 153,665 | |||||||||
| Over 12 | 57,785 | 45,366 | 103,151 | |||||||||
| Total | $ | 240,853 | $ | 271,901 | $ | 512,754 | ||||||
Off-Balance Sheet Arrangements and Contractual Obligations
Our off-balance sheet arrangements and contractual obligations at December 31, 2007 are summarized in the table that follows. The amounts shown for commitments to extend credit and letters of credit are contingent obligations, some of which are expected to expire without being drawn upon. As a result, the amounts shown for these items do not necessarily represent future cash requirements. We believe that our current sources of liquidity are more than sufficient to fulfill the obligations we have as of December 31, 2007 pursuant to off-balance sheet arrangements and contractual obligations.
| Amount of Commitment Expiration Per Period | ||||||||||||||||||||
| (Dollars in thousands) | Total Amounts Committed | One Year or Less | Over One Year Through Three Years | Over Three Years Through Five Years | Over Five Years | |||||||||||||||
| Off-balance sheet arrangements | ||||||||||||||||||||
Commitments to extend credit | $ | 259,413 | $ | 111,513 | $ | 59,488 | $ | 20,857 | $ | 67,555 | ||||||||||
Standby letters of credit | 2,948 | 2,745 | 203 | - | - | |||||||||||||||
| Total | $ | 262,361 | $ | 114,258 | $ | 59,691 | $ | 20,857 | $ | 67,555 | ||||||||||
| Contractual obligations | ||||||||||||||||||||
Time deposits | $ | 512,754 | $ | 409,603 | $ | 92,091 | $ | 11,060 | $ | - | ||||||||||
Operating lease obligations | 6,397 | 1,273 | 1,661 | 1,180 | 2,283 | |||||||||||||||
Purchase obligations | 12,693 | 2,271 | 4,903 | 5,519 | - | |||||||||||||||
Long-term debt | 63,000 | - | 30,000 | - | 33,000 | |||||||||||||||
Other long-term liabilities reflected on the balance sheet under GAAP | 6,676 | 40 | 161 | 323 | 6,152 | |||||||||||||||
| Total | $ | 601,520 | $ | 413,187 | $ | 128,816 | $ | 18,082 | $ | 41,435 | ||||||||||
The Banks are party to financial instruments with off-balance sheet risk in the normal course of business to meet the financing needs of their customers. These financial instruments include commitments to extend credit and standby letters of credit. These instruments involve, to varying degrees, elements of credit risk in excess of the amount recognized in the consolidated balance sheets.
The Banks’ exposure to credit loss in the event of nonperformance by the other party to financial instruments for commitments to extend credit and standby letters of credit is represented by the contractual notional amount of these instruments. The Banks use the same credit policies in making commitments to extend credit and generally use the same credit policies for letters of credit as they do for on-balance sheet instruments.
Commitments to extend credit are legally binding agreements to lend to a customer as long as there is no violation of any condition established in the contract. Since some of these commitments are expected to expire without being drawn upon, the total commitment amount does not necessarily represent future cash requirements. Unused commercial lines of credit, which comprise a substantial portion of these commitments, generally expire within a year from their date of origination. Other loan commitments generally expire in 30 days. The amount of collateral obtained, if any, by the Banks upon extension of credit is based on management’s credit evaluation of the borrower. Collateral held varies but may include security interests in business assets, mortgages on commercial and residential real estate, deposit accounts with the Banks or other financial institutions, and securities.
Standby letters of credit are conditional commitments issued by the Banks to assure the performance or financial obligations of a customer to a third party. The credit risk involved in issuing standby letters of credit is essentially the same as that involved in extending loans to customers. The Banks generally hold collateral and/or obtain personal guarantees supporting these commitments.
The Banks are obligated under operating leases for office and banking premises which expire in periods varying from one to nineteen years. Future minimum lease payments, before considering renewal options that generally are present, total $6.4 million at December 31, 2007.
Purchase obligations consist of computer and item processing services, and debit and ATM card processing and support services contracted by the Company under long term contractual relationships.
Long term debt, at December 31, 2007, consists of subordinated debentures totaling $33.0 million and securities sold under repurchase agreement totaling $30.0 million. These borrowings are further described in Note 10 of the Consolidated Financial Statements.
Other long-term liabilities represent obligations under the non-qualified retirement plan for the Company’s directors and the non-qualified deferred compensation arrangement with certain of the Company’s executive officers. Under the director retirement plan, the Company pays each participant, or their beneficiary, the amount of board compensation fees that the director has elected to defer and interest in 120 equal monthly installments, beginning the month following the director’s normal retirement date. The amount presented above reflects the future obligation to be paid, assuming no future fee deferrals. Under the executive deferred compensation plan, the Company pays each participant, or their beneficiary, 43% of the executive’s highest compensation level in the three years immediately preceding the date of termination of employment for a period of up to 15 years.
Capital Adequacy
There are various primary measures of capital adequacy for banks and financial holding companies such as risk based capital guidelines and the leverage capital ratio. See Note 14 to the Consolidated Financial Statements.
As of December 31, 2007, the Banks exceeded the levels of capital required in order to be categorized by the FDIC as well capitalized under the regulatory framework for prompt corrective action. The risk-based capital ratios of Tier 1 capital to risk-weighted assets were 9.2% and 15.5%, the risk-based ratios of total capital to risk-weighted assets were 10.4% and 16.7%, and the leverage ratios were 7.8% and 11.9% for TIB Bank and The Bank of Venice, respectively.
As of December 31, 2007, the Company exceeded its required levels of capital under capital adequacy guidelines. The Company’s risk-based capital ratio of Tier 1 capital to risk-weighted assets was 10.0%, its risk-based ratio of total capital to risk-weighted assets was 11.3%, and its leverage ratio was 8.4%.
As previously discussed, in March 2008, we sold 1.2 million shares of our common stock and warrants to purchase an additional 1.2 million shares resulting in gross proceeds of $10.1 million. This strengthens our capital to support future growth and expansion.
Inflation
Inflation has an important impact on the growth of total assets in the banking industry and causes a need to increase equity capital higher than normal levels in order to maintain an appropriate equity to assets ratio. We have been able to maintain an adequate level of equity, as previously mentioned and cope with the effects of inflation by managing our interest rate sensitivity gap position through our asset/liability management program, and by periodically adjusting our pricing of services and banking products to take into consideration current costs.
Recent Accounting Policies
During 2004, the FASB revised Statement No. 123, “Accounting for Stock-Based Compensation” ("SFAS 123R") which established accounting requirements for share-based compensation to employees and carries forward prior guidance on accounting for awards to non-employees. The provisions of this statement became effective for fiscal years beginning after June 15, 2005 for all equity awards granted or modified after the effective date and for the subsequent vesting of previously granted awards. SFAS 123R requires an entity to recognize compensation expense based on an estimate of the fair value and number of awards expected to actually vest, exclusive of awards expected to be forfeited. Previously, the Company accounted for stock options granted to employees according to the provisions of APB Opinion No. 25, whereby compensation expense was recorded based upon the intrinsic value method. The stock-based compensation table included in Note 1 of the accompanying financial statements illustrates the effect on net income and earnings per share if we had applied the fair value recognition provisions of SFAS 123 to stock-based employee compensation. Subsequent to adoption, the income tax benefits for the exercise of stock options in excess of income tax expense for financial reporting purposes are classified as cash inflows from financing activities and cash outflows from operating activities in the statement of cash flows. The Company adopted SFAS 123R on January 1, 2006, as required, using the modified prospective transition method. Accordingly, the Company has recorded stock-based employee compensation cost for stock options using the fair value method starting in 2006.
During 2007 and 2006, employee compensation expense includes $284,000 and $305,000, respectively, for stock options pursuant to the provisions of SFAS 123R. Prior to January 1, 2006, stock options were accounted for using the intrinsic value method; therefore, no stock based compensation cost is reflected in net income for the years ending December 31, 2005 and 2004, as all options granted had an exercise price equal to or greater than the market price of the underlying common stock at the date of grant.
In February 2006, the Financial Accounting Standards Board (“FASB”) issued Statement No. 155, “Accounting for Certain Hybrid Financial Instruments – an amendment of FASB Statements No. 133 and 140,” (“SFAS 155”). SFAS 155 simplifies and conforms the accounting for certain financial instruments permitting fair value remeasurement for any hybrid financial instrument with an embedded derivative that otherwise would require bifurcation, provided that the whole instrument is accounted for on a fair value basis. The amendments to SFAS No. 133 also clarify that interest-only and principal-only strips are not embedded derivatives. The amendments to SFAS No. 140 allow a qualifying special purpose entity to hold a derivative financial instrument that pertains to a beneficial interest other than another derivative financial instrument. This statement is effective for all financial instruments acquired or issued after the beginning of the first fiscal year after September 15, 2006. Adoption on January 1, 2007, as required, did not have a material effect on the Company’s financial condition, results of operations or liquidity.
In March 2006, the FASB issued Statement No. 156, “Accounting for Servicing of Financial Assets-an amendment of FASB Statement No. 140”. This Statement provides the following: 1) revised guidance on when a servicing asset and servicing liability should be recognized; 2) requires all separately recognized servicing assets and servicing liabilities to be initially measured at fair value, if practicable; 3) permits an entity to elect to measure servicing assets and servicing liabilities at fair value each reporting date and report changes in fair value in earnings in the period in which the changes occur; 4) upon initial adoption, permits a onetime reclassification of available-for-sale securities to trading securities for securities which are identified as offsetting the entity's exposure to changes in the fair value of servicing assets or liabilities that a servicer elects to subsequently measure at fair value; and 5) requires separate presentation of servicing assets and servicing liabilities subsequently measured at fair value in the statement of financial position and additional footnote disclosures. This Standard is effective as of the beginning of an entity's first fiscal year that begins after September 15, 2006 with the effects of initial adoption being reported as a cumulative-effect adjustment to retained earnings. Adoption on January 1, 2007, as required, did not have a material effect on the Company’s financial condition, results of operations or liquidity.
The Company adopted the provisions of FASB Interpretation No. 48, Accounting for Uncertainty in Income Taxes (“FIN 48”), on January 1, 2007. The adoption of FIN 48 had no affect on the Company’s financial statements. The Company has no material unrecognized tax benefits and does not anticipate any increase in unrecognized benefits during 2008 relative to any tax positions taken prior to January 1, 2007 or December 31, 2007. Should the accrual of any interest or penalties relative to unrecognized tax benefits be necessary, it is the Company’s policy to record such accruals in its income taxes accounts; no such accruals exist as of January 1, 2007. The Company and its subsidiaries file a consolidated U.S. federal income tax return and a consolidated income tax return in the state of Florida. These returns are subject to examination by taxing authorities for all years after 2003.
In September 2006, FASB issued Statement No. 157, “Fair Value Measurements” (“FAS 157”). This statement defines fair value, establishes a framework for measuring fair value and expands disclosures about fair value measurements. This statement establishes a fair value hierarchy about the assumptions used to measure fair value and clarifies assumptions about risk and the effect of a restriction on the sale or use of an asset. The standard is effective for fiscal years beginning after November 15, 2007. In February 2008, the FASB issued Staff Position (“FSP”) 157-2, Effective Date of FASB Statement No. 157. This FSP delays the effective date of FAS 157 for all nonfinancial assets and nonfinancial liabilities, except those that are recognized or disclosed at fair value on a recurring basis (at least annually) to fiscal years beginning after November 15, 2008, and interim periods within those fiscal years. The impact of adoption was not material to the Company’s financial condition, results of operations or liquidity.
In September 2006, the FASB Emerging Issues Task Force (“EITF”) finalized Issue No. 06-4, “Accounting for Deferred Compensation and Postretirement Benefit Aspects of Endorsement Split-Dollar Life Insurance Arrangements”. This issue requires that a liability be recorded during the service period when a split-dollar life insurance agreement continues after participants’ employment or retirement. The required accrued liability will be based on either the post-employment benefit cost for the continuing life insurance or based on the future death benefit depending on the contractual terms of the underlying agreement. This issue is effective for fiscal years beginning after December 15, 2007. Adoption on January 1, 2008, as required, did not have a material effect on the Company’s financial condition, results of operations or liquidity.
In September 2006, the FASB issued SFAS No. 158, Employers’ Accounting for Defined Benefit Pension and Other Postretirement Plans – an amendment of FASB Statements No. 87, 88, 106 and 132(R). This Statement requires an employer to recognize the overfunded or underfunded status of a defined benefit postretirement plan (other than a multiemployer plan) as an asset or liability in its balance sheet, beginning with year end 2006, and to recognize changes in the funded status in the year in which the changes occur through comprehensive income beginning in 2007. Additionally, defined benefit plan assets and obligations are to be measured as of the date of the employer’s fiscal year-end, starting in 2008. Adoption had no effect on the Company’s financial condition, results of operations or liquidity as the Company does not have any defined benefit plans falling within the scope of SFAS No. 158.
In September 2006, the Securities and Exchange Commission within 120 days(SEC) released Staff Accounting Bulletin No. 108, “Considering the Effects of Prior Year Misstatements when Quantifying Misstatements in Current Year Financial Statements” (SAB 108), which is effective for fiscal years ending on or after November 15, 2006. SAB 108 provides guidance on how the effects of prior-year uncorrected financial statement misstatements should be considered in quantifying a current year misstatement. SAB 108 requires public companies to quantify misstatements using both an income statement (rollover) and balance sheet (iron curtain) approach and evaluate whether either approach results in a misstatement that, when all relevant quantitative and qualitative factors are considered, is material. If prior year errors that had been previously considered immaterial now are considered material based on either approach, no restatement is required so long as management properly applied its previous approach and all relevant facts and circumstances were considered. The adoption of SAB 108 had no effect on the Company’s financial statements.
In September 2006, the FASB Emerging Issues Task Force finalized Issue No. 06-5, “Accounting for Purchases of Life Insurance - Determining the Amount That Could Be Realized in Accordance with FASB Technical Bulletin No. 85-4 (Accounting for Purchases of Life Insurance)”. This issue requires that a policyholder consider contractual terms of a life insurance policy in determining the amount that could be realized under the insurance contract. It also requires that if the contract provides for a greater surrender value if all individual policies in a group are surrendered at the same time, that the surrender value be determined based on the assumption that policies will be surrendered on an individual basis. Lastly, the issue discusses whether the cash surrender value should be discounted when the policyholder is contractually limited in its ability to surrender a policy. This issue is effective for fiscal years beginning after December 15, 2006. The adoption of this issue on January 1, 2007, as required, did not have a material impact on the financial condition, results of operations, or liquidity of the Registrant’s 2004 fiscal year end are incorporated by reference into Part IIICompany.
In February 2007, the FASB issued SFAS No. 159, “The Fair Value Option for Financial Assets and Financial Liabilities”. This Statement permits entities to choose to measure many financial instruments and certain other items at fair value. The objective is to improve financial reporting by providing entities with the opportunity to mitigate volatility in reported earnings caused by measuring related assets and liabilities differently without having to apply complex hedge accounting provisions. This Statement is expected to expand the use of fair value measurement, which is consistent with the Board’s long-term measurement objectives for accounting for financial instruments. This Statement is effective for fiscal years beginning after November 15, 2007. Adoption on January 1, 2008, as required, did not have a material effect on the Company’s financial condition, results of operations or liquidity.
In June 2007, the FASB finalized Issue No. 06-11, “Accounting for Income Tax Benefits of Dividends on Share-Based Payment Awards”. This issue requires that a realized income tax benefit from dividends or dividend equivalents that are charged to retained earnings and are paid to employees for equity classified nonvested equity shares, nonvested equity share units, and outstanding equity share options should be recognized as an increase to additional paid-in capital. The amount recognized in additional paid-in capital for the realized income tax benefit from dividends on those awards should be included in the pool of excess tax benefits available to absorb tax deficiencies on share-based payment awards (as described in paragraphs 62 and 63 of Statement 123(R)). This issue is effective for fiscal years beginning after December 15, 2007. Adoption on January 1, 2008, as required, did not have a material effect on the Company’s financial condition, results of operations or liquidity.
In December 2007, the FASB issued Statement of Financial Accounting Standards No. 160, “Noncontrolling Interests in Consolidated Financial Statements” (“FAS 160”), which requires all entities to report noncontrolling (minority) interests in subsidiaries as equity in the consolidated financial statements. Additionally, FAS 160 requires that transactions between an entity and noncontrolling interests be treated as equity transactions. FAS 160 is effective for fiscal years beginning after December 15, 2008. Management has not yet completed its analysis of the potential impact of FAS 160, but does not expect it to have a material effect on the Company’s financial condition, results of operations or liquidity.
Critical Accounting Policies
In reviewing and understanding financial information for the Company, you are encouraged to read and understand the significant accounting policies which are used in preparing the consolidated financial statements of the Company. These policies are described in Note 1 to the TIBConsolidated Financial Corp. (the “Company”) Annual Report on Form 10-KStatements. Of these policies, management believes that the accounting for the fiscal year endedallowance for loan losses and the impairment of investment securities are the most critical.
Losses on loans result from a broad range of causes from borrower specific problems, to industry issues, to the impact of the economic environment. The identification of these factors that lead to default or non-performance under a borrower loan agreement and the estimation of loss in these situations are very subjective. In addition, a dramatic change in the performance of one or a small number of borrowers can have a significant impact on the estimate of losses. As described above under the “Allowance and Provision for Loan Losses” heading, management has implemented a process that has been applied consistently to systematically consider the many variables that impact the estimation of the allowance for loan losses.
Impairment of investment securities results in a write-down that must be included in net income when a market decline below cost is other-than-temporary. We regularly review each investment security for impairment based on criteria that include the extent to which cost exceeds market price, the duration of that market decline, the financial health of and specific prospects for the issuer(s) and our ability and intention with regard to holding the security to maturity.
Market risk is the risk that a financial institution’s earnings and capital, or its ability to meet its business objectives, will be adversely affected by movements in market rates or prices such as interest rates, foreign exchange rates, equity rates, equity prices, credit spreads and/or commodity prices. The Company has assessed its market risk as predominately interest rate risk.
The interest rate sensitivity as of December 31, 2004 (the “Original Filing”), which2007 was filed with the Securities and Exchange Commission on March 16, 2005, is being filed to amend the Original Filing as follows:
Yield curve twists change both the level and slope of the yield curve and are more realistic than parallel yield curve shifts and are more useful for planning purposes. A 200 basis point yield curve twist decrease would result in short term rates decreasing approximately 200 basis points and long term rates decreasing approximately 100 basis points. A 200 basis point yield curve twist increase would result in a short term rates increasing approximately 200 basis points and long term rates increasing approximately 100 basis points.
The corrected reportanalysis indicates a 200 basis point parallel interest rate increase would have relatively no impact to TIB Bank’s net interest income over a 12-month period. A 200 basis point parallel interest rate decrease would result in a decrease in net interest income of Crowe Chizekapproximately $1.2 million over a 12-month period. Additionally, a 200 basis point yield curve twist increase would have relatively no impact to net interest income over a 12-month period. A 200 basis point yield curve twist decrease would result in a decrease in net interest income of approximately $830,000 over a 12-month period.
We attempt to retain interest rate neutrality by generating mostly adjustable rate loans and Company LLC is included below. managing the securities, wholesale funding, and Fed Funds positions to offset the re-pricing characteristics of the deposit liabilities.
The consolidated financial statements, and notes thereto from the Original Filing have been included in their entirety following the correctedand report of Crowe Chizek and Company LLC and have not been updated for events occurring subsequentindependent registered public accounting firm thereon included on the following pages are incorporated herein by reference.
Index to the March 16, 2005 filing date.Consolidated Financial Statements
| Page | |
| 52 | |
| 53 | |
| 54 | |
| 56 | |
| 58 | |
| 60 | |
Board of Directors and Shareholders
TIB Financial Corp.
Naples, FL.Florida
We have audited the accompanying consolidated balance sheets of TIB Financial Corp. as of December 31, 20042007 and 2003,2006, and the related consolidated statements of operations, stockholders’changes in shareholders' equity, and cash flows for each of the three years in the three-year period ended December 31, 2004. These2007. We also have audited the Company's internal control over financial reporting as of December 31, 2007, based on criteria established in Internal Control – Integrated Framework issued by the Committee of Sponsoring Organizations of the Treadway Commission (COSO). The Company's management is responsible for these financial statements, are the responsibilityfor maintaining effective internal control over financial reporting, and for its assessment of the Company’s management.effectiveness of internal control over financial reporting, included in Management's Annual Report on Internal Control Over Financial Reporting contained in Item 9A.(b) of the accompanying Form 10-K. Our responsibility is to express an opinion on these financial statements and an opinion on the Company's internal control over financial reporting based on our audits.
We conducted our audits in accordance with the standards of the Public Company Accounting Oversight Board (United States). Those standards require that we plan and perform the auditaudits to obtain reasonable assurance about whether the financial statements are free of material misstatement. An audit includesmisstatement and whether effective internal control over financial reporting was maintained in all material respects. Our audits of the financial statements included examining, on a test basis, evidence supporting the amounts and disclosures in the financial statements. An audit also includesstatements, assessing the accounting principles used and significant estimates made by management, as well asand evaluating the overall financial statement presentation. Our audit of internal control over financial reporting included obtaining an understanding of internal control over financial reporting, assessing the risk that a material weakness exists, and testing and evaluating the design and operating effectiveness of internal control based on the assessed risk. Our audits also included performing such other procedures as we considered necessary in the circumstances. We believe that our audits provide a reasonable basis for our opinion.opinions.
A company's internal control over financial reporting is a process designed to provide reasonable assurance regarding the reliability of financial reporting and the preparation of financial statements for external purposes in accordance with generally accepted accounting principles. A company's internal control over financial reporting includes those policies and procedures that (1) pertain to the maintenance of records that, in reasonable detail, accurately and fairly reflect the transactions and dispositions of the assets of the company; (2) provide reasonable assurance that transactions are recorded as necessary to permit preparation of financial statements in accordance with generally accepted accounting principles, and that receipts and expenditures of the company are being made only in accordance with authorizations of management and directors of the company; and (3) provide reasonable assurance regarding prevention or timely detection of unauthorized acquisition, use, or disposition of the company's assets that could have a material effect on the financial statements.
Because of its inherent limitations, internal control over financial reporting may not prevent or detect misstatements. Also, projections of any evaluation of effectiveness to future periods are subject to the risk that controls may become inadequate because of changes in conditions, or that the degree of compliance with the policies or procedures may deteriorate.
In our opinion, the consolidated financial statements referred to above present fairly, in all material respects, the financial position of the CompanyTIB Financial Corp. as of December 31, 20042007 and 2003,2006, and the results of its operations and its cash flows for each of the three years in the three-year period ended December 31, 2004,2007, in conformity with U.S.accounting principles generally accepted accounting principles.in the United States of America. Also in our opinion, the Company maintained, in all material respects, effective internal control over financial reporting as of December 31, 2007, based on criteria established in Internal Control – Integrated Framework issued by the Committee of Sponsoring Organizations of the Treadway Commission (COSO).
| /s/ Crowe Chizek and Company LLC | ||||
| Crowe Chizek and Company LLC | ||||
| Fort Lauderdale, Florida | ||||
| March 17, 2008 |
Consolidated Balance Sheets
As of December 31,
| December 31, | 2004 | 2003 | ||||||||||||||
Assets | ||||||||||||||||
| (Dollars in thousands, except per share amounts) | 2007 | 2006 | ||||||||||||||
Assets | ||||||||||||||||
| Cash and due from banks | $ | 27,410 | $ | 17,197 | $ | 22,315 | $ | 25,223 | ||||||||
| Federal funds sold | 15,528 | 16,484 | ||||||||||||||
| Federal funds sold and securities purchased under agreements to resell | 48,744 | 30,329 | ||||||||||||||
| Cash and cash equivalents | 42,938 | 33,681 | 71,059 | 55,552 | ||||||||||||
| Investment securities available for sale | 77,807 | 52,557 | 160,357 | 131,199 | ||||||||||||
| Loans, net of deferred loan costs and fees | 655,678 | 540,413 | 1,129,156 | 1,065,468 | ||||||||||||
| Less: Allowance for loan losses | 6,243 | 5,216 | 14,973 | 9,581 | ||||||||||||
| Loans, net | 649,435 | 535,197 | 1,114,183 | 1,055,887 | ||||||||||||
| Premises and equipment, net | 27,559 | 21,073 | 38,284 | 34,102 | ||||||||||||
| Goodwill | 155 | 155 | 4,686 | 106 | ||||||||||||
| Intangible assets, net | 1,392 | 1,687 | 2,772 | 813 | ||||||||||||
| Accrued interest receivable and other assets | 30,039 | 24,948 | 53,398 | 41,434 | ||||||||||||
Total Assets | $ | 829,325 | $ | 669,298 | ||||||||||||
| Total assets | $ | 1,444,739 | $ | 1,319,093 | ||||||||||||
Liabilities and Shareholders’ Equity | ||||||||||||||||
Liabilities | ||||||||||||||||
| Deposits: | ||||||||||||||||
| Noninterest-bearing demand | $ | 152,035 | $ | 121,728 | $ | 143,381 | $ | 159,380 | ||||||||
| Interest-bearing | 535,824 | 432,085 | 906,577 | 870,077 | ||||||||||||
| Total deposits | 687,859 | 553,813 | 1,049,958 | 1,029,457 | ||||||||||||
| Federal Home Loan Bank (FHLB) advances | 35,000 | 45,000 | 140,000 | 125,000 | ||||||||||||
| Short-term borrowings | 12,157 | 4,041 | 77,922 | 22,250 | ||||||||||||
| Long-term borrowings | 18,250 | 18,250 | 63,000 | 37,000 | ||||||||||||
| Accrued interest payable and other liabilities | 7,945 | 6,948 | 17,619 | 19,524 | ||||||||||||
Total liabilities | 761,211 | 628,052 | 1,348,499 | 1,233,231 | ||||||||||||
Shareholders’ equity | ||||||||||||||||
| Preferred stock – no par value: 5,000,000 and 0 shares authorized, 0 and 0 shares issued | — | — | ||||||||||||||
| Common stock – $.10 par value: 20,000,000 and 7,500,000 shares authorized, 5,679,239 and 4,431,328 shares issued | 568 | 443 | ||||||||||||||
| Commitments and Contingencies (Notes 1, 6 and 16) | ||||||||||||||||
| Shareholders’ Equity | ||||||||||||||||
| Preferred stock – no par value: 5,000,000 shares authorized, 0 shares issued | - | - | ||||||||||||||
| Common stock - $.10 par value: 40,000,000 shares authorized, 12,852,361 and 11,720,527 shares issued, 12,783,161 and 11,720,527 outstanding | 1,285 | 1,172 | ||||||||||||||
| Additional paid in capital | 38,284 | 14,255 | 56,133 | 40,514 | ||||||||||||
| Retained earnings | 28,968 | 26,203 | 39,151 | 44,620 | ||||||||||||
| Accumulated other comprehensive income | 294 | 345 | ||||||||||||||
| Accumulated other comprehensive income (loss) | 240 | (444 | ) | |||||||||||||
| Treasury stock, at cost, 69,200 and 0 shares | (569 | ) | - | |||||||||||||
Total shareholders’ equity | 68,114 | 41,246 | 96,240 | 85,862 | ||||||||||||
Total Liabilities and Shareholders’ Equity | $ | 829,325 | $ | 669,298 | $ | 1,444,739 | $ | 1,319,093 | ||||||||
| See accompanying notes to consolidated financial statements | See accompanying notes to consolidated financial statements | |||||||||||||||
See accompanying notes to consolidated financial statements.
Consolidated Statements of IncomeOperations