|
|
| 69 |
23
PART III.I.
Certain statements contained in this Annual Report on Form 10-K (this “Annual Report”) constitute “forward-looking statements,” including forward-looking statements within the meaning of the Private Securities Litigation Reform Act of 1995. In some cases, forward-looking statements can be identified by the use of forward-looking terminology such as “may,” “will,” “estimate,” “intend,” “plan,” “continue,” “believe,” “expect” or “anticipate” or the negatives thereof, variations thereon or similar terminology. The forward-looking statements contained in this Annual Report are generally located under the headings “Business” and “Management’s Discussion and Analysis of Financial Condition and Results of Operations,” but may be found in other locations as well, and include statements regarding our ability to grow market share, the size of the addressable big + tall market, the impact of our strategic growth initiatives, including our ability to build brand awareness, develop new stores and create and expand alliances and collaborations, our ability to grow our top line and maintain profitability, the expected change in gross margin rate in 2024, our expected capital expenditures in 2024, our expected marketing spend in 2024, expected store openings in 2024 and beyond, and our ability to meet our liquidity needs. These forward-looking statements generally relate to plans and objectives for future operations and are based upon management’s reasonable estimates of future results or trends. The forward-looking statements in this Annual Report should not be regarded as a representation by us or any other person that the objectives or plans of the Company will be achieved. Numerous factors could cause our actual results to differ materially from such forward-looking statements, including, without limitation, risks relating to: our ability to successfully implement our business strategy and grow our market share, including through improving brand awareness, increasing our digital presence and expanding existing and entering into new alliances and collaborations, and manage our store portfolio; loss or disruption in our operations and supply chain, including due to the ongoing conflict in the Middle East; labor costs and shortages; increases in certain raw material costs and freight costs; the impact of macroeconomic factors, such as inflation, the ongoing conflict in Ukraine, consumer confidence and high interest rates; as well as those risks and uncertainties set forth below under Item 10.1A, Directors, Executive OfficersRisk Factors. Readers are encouraged to review these risks and Corporate Governanceuncertainties carefully.
These forward-looking statements speak only as of the date of the document in which they are made. We disclaim any obligation or undertaking to provide any updates or revisions to any forward-looking statement to reflect any change in its expectations or any change in events, conditions, or circumstances in which the forward-looking statement is based.
Item 1. Business
Destination XL Group, Inc., together with its subsidiaries (the “Company”), is the leading specialty retailer of big & tall men’s apparel with retail locations throughout the United States. We operate under the trade names of Destination XL®, DXL®, DXL Men’s Apparel, DXL outlets, Casual Male XL® and Casual Male XL outlets. At February 3, 2024, we operated 232 DXL retail stores, 15 DXL outlet stores, 17 Casual Male XL retail stores, 19 Casual Male XL outlet stores, and a digital business, including an e-commerce site at www.dxl.com, a mobile site m.destinationXL.com and mobile app. Unless the context indicates otherwise, all references to “we,” “our,” “ours,” “us” and “the Company” refer to Destination XL Group, Inc. and our consolidated subsidiaries. We refer to our fiscal years ended February 3, 2024, January 28, 2023 and January 29, 2022 as “fiscal 2023,” “fiscal 2022” and “fiscal 2021,” respectively.
OUR INDUSTRY
We define the big & tall men’s clothing market as starting at a waist size of 38” and greater, as well as tops sized 1XL and greater. With the assistance of Coresight Research, we believe that the U.S. big & tall men's clothing market is approximately $23 billion and is highly fragmented. Big + Tall is all we do. With our proprietary fit and extensive selection of exclusive brands, we believe that we can grow market share as an integrated commerce retailer able to target a broad market, attracting customers from various income, age and lifestyle segments, offering the underserved consumer the widest selection of sizes and styles.
HISTORY
Our Company was incorporated in the State of Delaware in 1976 under the name "Kara Enterprises, Inc." and subsequently operated under the name "Designs, Inc." Until fiscal 1995, we operated exclusively in Levi Strauss & Co. branded apparel mall and outlet stores. In May 2002, we acquired the Casual Male business from Casual Male Corp. at a bankruptcy court-ordered auction. At the time of the acquisition, Casual Male was the largest specialty retailer of men’s clothing in the big & tall market in the United States. As a result of the acquisition, on August 8, 2002, we changed our name to “Casual Male Retail Group, Inc.”
In fiscal 2010, we launched a new store concept, Destination XL (“DXL”). The DXL store concept offers our customers an extensive assortment of products, ranging from value-oriented to luxury-oriented with an increased presence of name brands, without having to shop multiple stores. In addition to offering our customers a wide assortment, we also wanted to provide them with a unique shopping experience. We are focused on providing outstanding customer service through our DXL stores, with larger fitting rooms and professional, trained associates providing personal attention. With the initial success of this store format, we made a similar change to our e-commerce business in fiscal 2011 when we launched our DestinationXL.com website (now dxl.com).
Set forth below
4
OUR BUSINESS
We operate as an integrated commerce retailer of big & tall men’s clothing and shoes. Through our multiple brands, which include both national brands and our own brands, we provide a premium, personalized shopping experience, whether in-store or digitally, with a broad range of merchandise at varying price points, catering from the value-oriented customer to the luxury customer. Our objective is certain information regardingto appeal to all of our customers by providing a good, better, best array of product assortments in all primary lifestyles with multiple and convenient ways to shop.
What is unique about our business is our proprietary fit, our ability to manage an array of sizes and optimize our in-stock position throughout each season. Our best-selling pant has 58 size combinations and a unique specification as compared to an average retailer who may only have 15 different size combinations. We maintain a consolidated inventory across all channels that enables us to manage our in-stock position of all sizes effectively, ultimately improving customer service. Moreover, our planning and allocation methodologies, with respect to store assortment planning, help to optimize each location’s market potential without excessive inventory levels.
Our DXL retail stores, e-commerce site, dxl.com, and mobile app cater to all income demographics and offer our customers merchandise to fit a variety of lifestyles from casual to business, young to mature, in all price ranges and in all large sizes from XL and up. In addition, we also offer a selection of shoes in sizes 10W to 18W on our website at dxl.com. Our Casual Male XL retail stores primarily carry moderate-priced national brands and our own brands of casual sportswear and dresswear. We also operate Casual Male XL outlets and DXL outlets for our value-oriented customers. Through digital marketplaces, we are able to extend our reach, by providing a select offering of our merchandise to new customers who may not be current directors, including information furnished by them as to their principal occupations and business experience forDXL customers.
BUSINESS STRATEGY
Over the past five years, certain directorships heldwe have transformed our business, investing in our customer relationship capabilities, our data infrastructure and our data analytics capabilities. We have achieved a heightened level of operational excellence, recapitalized our balance sheet to provide a greater level of financial flexibility, made investments in our technical capabilities, and upgraded our leadership team. Since fiscal 2019, we have grown net sales by each director within10% and more than doubled our adjusted EBITDA margin rate. In addition, we believe strongly that there is a great opportunity for us to grow our market share. We believe that our addressable market is approximately $23 billion, yet based on our research our unaided brand awareness is 9% and our aided brand awareness is 28%. If we are to grow our revenue base and market share, our addressable market needs to know who we are, what we offer, how we are different from our competition and why they should shop with us.
We believe that we can change the growth trajectory of the Company through investments in brand marketing, new store development, a new and efficient eCommerce platform, and alliances/collaborations with other brands. We have spent the past fiveyear developing a deeper understanding of the big + tall consumer and we are now ready to execute on our long-range plan. We expect to fund these strategic initiatives with cash on hand. Accordingly, in fiscal 2024, our primary focus will be on the following four initiatives:
5
As a result of these investments in marketing, stores, and other growth initiatives in fiscal 2024, we believe we can grow our top line and invest greater resources while maintaining a minimum acceptable level of profitability and free cash flow.
MERCHANDISE
We offer our customers an extensive assortment of apparel consisting of both our own brands and over 100 well-known national brands, within our “good,” “better” and “best” price points. Regardless of our customers’ age, socioeconomic status, or lifestyle preference, we are able to assemble a wardrobe to fit their apparel needs. With over 5,000 styles available, we carry an extensive selection of tops in sizes up to 7XL and 7XLT with additional assortments up to 8XL, bottoms with waist sizes 38” to 70”, and shoes in sizes 10W to 18W.
What sets us apart from our competitors is our proprietary fit. We are different because our fit is different. Our merchandise is not just an extension of regular sizes. The fit is built from unique specifications for every size and style, with specific design features for the big and tall customer.
Our stores are merchandised to showcase entire outfits by lifestyle, including traditional, active, modern, tailored and denim. This format allows us to merchandise key items and seasonal goods in prominent displays and makes coordinating outfits easier for the customer while encouraging multi-item purchases. This lifestyle layout also allows us to manage store space and product assortment effectively in each market to target local demographics. The key item strategy is also fully integrated by lifestyle, allowing us to focus on merchandise presentation and offer our customers a compelling value proposition.
Merchandise assortments in our DXL stores are organized not only by lifestyle but, within each lifestyle, the assortments are shown in a “good,” “better” and “best” visual presentation. With the “best” merchandise assortments featured most prominently in the DXL store, our customers can visualize current fashion trends and select their wardrobes within their desired price points in a convenient manner.
Big and tall is all we do and through our own brands and exclusivity with national brands, we estimate that more than 80% of our inventory assortment, in units, is not available elsewhere. Several of the national brands that we carry, in sizes 2XL and above, are sold exclusively by us in our stores and on our website and may otherwise only be available on the brand’s website, if at all. In addition to our exclusive brands, we also work with several other national brands to offer a unique, curated merchandise assortment, in sizes 2XL and above, that are exclusively sold in our stores and on our website and are not available from the brand’s own website. These offerings are a subset of the larger merchandise offering that we carry for these respective brands. The penetration of national brands in a specific DXL store can range from 39% to 80%, depending on several factors, but on average, approximately half of the assortment is branded apparel.
In October 2023, we launched UNTUCKit, Fit by DXL in collaboration with UNTUCKit, sold exclusively by DXL. The launch was supported by a comprehensive marketing campaign on both DXL and UNTUCKit channels. The shirts are sold exclusively online with ‘try-on’ capsules in select physical stores. Based on the performance, we are expanding this program in fiscal 2024. We will continue to explore other strategic collaborations with other brands that are widely recognized and that could complement our curated assortment.
Name |
| Age |
| Director |
| Audit |
| Compensation |
| Nominating and |
| Cybersecurity |
Lionel F. Conacher, Chairman of the Board and Director |
| 60 |
| 2018 |
| C |
| X |
|
|
|
|
Harvey S. Kanter, President and Chief Executive Officer and Director |
| 61 |
| 2019 |
|
|
|
|
|
|
|
|
Carmen R. Bauza, Director |
| 61 |
| 2021 |
|
|
|
|
| X |
| X |
Jack Boyle, Director |
| 55 |
| 2017 |
|
|
| X |
| C |
|
|
Willem Mesdag, Director |
| 69 |
| 2014 |
| X |
| C |
|
|
|
|
Ivy Ross, Director |
| 67 |
| 2013 |
| X |
|
|
|
|
| C |
Elaine K. Rubin, Director |
| 60 |
| 2021 |
|
|
|
|
| X |
| X |
C= current member and committee chairperson
X=6
Value-Priced Apparel -“Good” Merchandise
For our value-oriented customers, we carry Champion, Lee, Wrangler and Reebok. In addition, we carry several value-priced private label lines:
Harbor Bay® was our first proprietary brand and it is a traditional line that continues to represent a significant portion of our business, specifically in terms of our core basic merchandise.
Oak Hill® is a premium line catering to those customers looking for slightly more style and quality than our Harbor Bay line but still in a traditional lifestyle.
Synrgy™ targets the customer looking for a contemporary/modern look.
True Nation® is a denim-inspired line consisting of vintage-screen t-shirts and wovens and is geared towards our younger customers.
Society of One®is an activewear brand that offers versatile styling options and is grounded by performance technology.
Moderate-Priced Apparel -“Better” Merchandise
We offer our customers an extensive selection of quality sportswear and dress clothing at moderate prices carrying well-known brands such as: Levi's®, Columbia, Carhartt®, and Jockey®. Our exclusive brands in this price range include O’Neill® and Nautica®, Adidas Golf® and vineyard vines®. Within our product assortment for Callaway®, Majestic and Tommy Bahama® we also offer exclusive styles specially curated for our customers.
Higher-End Fashion Apparel -“Best” Merchandise
Within this higher-end price range, we carry a broad selection of quality apparel from well-known branded manufacturers, such as The North Face®, Polo Ralph Lauren®, Jack Victor®, Boss®, Faherty®, Original Penguin Golf®, Michael Kors®, and Tallia®. Our exclusive brands in this price range include Brooks Brothers®, JOE’S®Jeans, 7 for all Mankind®, Boss®, Faherty®, Original Penguin Golf® and Robert Barakett®. Within our product assortment for Psycho Bunny®, Lucky and Robert Graham® we also offer exclusive styles specially curated for our customers. Polo Ralph Lauren builds one collection a quarter for our customers that is exclusive to DXL.
Shoes
Our DXL website offers an assortment of footwear, with a broad selection from casual to formal, in varying price points. We currently have a selection of more than 200 styles of shoes, ranging in sizes from 10W to 18W, including designer brands such as Cole Haan®, Timberland®, Sketchers®, New Balance®, Reebok® and Deerstags.
STORE CHANNEL
DXL Men’s Apparel Stores
As of February 3, 2024, we operated 232 DXL retail stores. Our DXL store concept brings all of our brands together in one format. Within this format, we cater to our diverse customer base, with merchandise representing all price points, from our higher-end brands to value-oriented brands, and all lifestyles, from business to denim. The size of our DXL stores averages 7,400 square feet. Depending on the customers in each respective market, we can adjust the appropriate mix of merchandise, with varying selections from each of our price points, to cater to each demographic market. Our DXL stores are located on real estate that is highly visible, often adjacent to high-performing regional malls or other high-traffic shopping areas.
In many markets, rebranding a Casual Male XL store to a DXL store provides a viable alternative to the more costly endeavor of relocating a Casual Male XL store to new DXL real estate. In addition, the converted stores benefit from DXL advertising. We are actively reviewing opportunities to relocate or convert Casual Male XL stores to DXL stores.
During fiscal 2023, we opened three new DXL stores, with plans to open eight new stores in fiscal 2024. These new DXL stores offer an updated look and feel both inside and outside, with the store layout focusing on improving our customer engagement and their overall shopping experience.
We believe that our store portfolio is a vital asset to our business strategy and we are investing in stores over the next several years. Over the next three to five years, we believe we could potentially open approximately 50 net new DXL stores across the country, which could average 6,000 square feet or 300,000 sq. ft. in total, a 15% increase over our current square footage.
Casual Male XL Retail Stores
As of February 3, 2024, we operated 17 Casual Male XL full-price retail stores, located primarily in strip centers or stand-alone locations. The majority of the merchandise carried in our Casual Male XL stores is moderate-priced basic or fashion-neutral items, such as jeans, casual pants, t-shirts, polo shirts, dress shirts and suit separates. These stores also carry a full complement of our own brand collections. The average Casual Male XL retail store is approximately 3,200 square feet.
7
DXL Outlet /Casual Male XL Outlet Stores
As of February 3, 2024, we operated 15 DXL outlet stores and 19 Casual Male XL outlet stores designed to offer a wide range of casual clothing for the big & tall customer at prices that are generally 20-25% lower than our moderate-priced merchandise. Much of the merchandise in our outlet stores is offered at discounted prices to cater to the value-oriented customer. In addition to own brands and national brands at our “good” price tier, our outlets also carry clearance product obtained from DXL and Casual Male XL stores, offering the outlet customer the ability to purchase brand and fashion product for a reduced price.
The average DXL outlet is approximately 5,100 square feet and the average Casual Male XL outlet store is approximately 3,000 square feet.
DIRECT CHANNEL
Our direct business is a critical channel for growing sales and market share through new customer acquisition and digital engagement of the active file. Since fiscal 2019, comparable sales from our direct business in fiscal 2023 have grown 50.9%, with our total direct business representing 31.3% of our total retail sales in fiscal 2023, as compared to 23.1% of our retail sales in fiscal 2019.
We define our direct business as sales that originate online, whether through our website, our app, those initiated online at the store level, our Guest Engagement Center, or through a third-party marketplace. We want to serve our customers wherever and how they want to shop, whether in-person at a store, over the telephone, or online via a computer, smartphone or tablet.
A key to being a successful integrated commerce retailer is having the ability to showcase all of our store inventories online, resulting in additional transactions that are initiated online, but are ultimately completed in store. In addition, our stores are able to fulfill an order for an item that is out-of-stock in our warehouse. This capability has not only resulted in incremental sales, but it has also helped us reduce clearance merchandise at the store level and manage margins.
DXL Website and App
Our DXL website and app have been instrumental in our growth over the past three years, with sales from our website and app together increasing 47.4% from fiscal 2019. We continue to see our consumers shift to online shopping helping to drive higher new customer acquisition for the website business.
As mentioned above, we expect to launch an updated website in the second half of fiscal 2024 that we believe will offer a superior user experience to our customers, with modernized design aesthetics and improved performance, while also providing us the tools to improve our agility and efficiency.
Digital Sales at Store Level
In support of our integrated commerce approach, our store associates use our website to help fulfill our in-store customers’ clothing needs. If a wider selection of a lifestyle, color or size of an item is not available in our store, then our store associates can order the item for our customer online through our direct channel and have it shipped to the store or directly to the customer. Our customers also have the ability to shop-by-store and pick-up in store on the same day.
Digital Marketplaces
We continue to broaden our reach through digital, third-party marketplaces. A large portion of our assortment is available on Amazon.com and Walmart.com. Digital marketplaces provide us an opportunity to drive awareness, grow our customer base and introduce new customers to our brand.
MERCHANDISE PLANNING AND ALLOCATION
Our merchandise planning and allocation function is critical to the effective management of our inventory, store assortments, product sizes and overall gross margin profitability. The merchandise planning and allocation team has an array of planning and replenishment tools available to assist in maintaining an appropriate level of inventory, in-stock positions at the stores and for the direct channel, and pre-season planning for product assortments for each store and the direct channel. Additionally, in-season reporting identifies opportunities and challenges in inventory performance. Over the past several years, we have made, and we will continue to make, investments in implementing best practice tools and processes for our merchandise planning and allocation.
Our evergreen merchandise made up approximately 42% of our merchandise assortment in fiscal 2023. Our planning and allocation team estimates quantity and demand several months in advance to optimize gross margin and minimize end-of-season merchandise for all seasonal merchandise. We develop customized assortment strategies by store that accentuate lifestyle preferences for each particular store.
8
Our merchandising data warehouse provides the merchandising team with standardized reporting for monitoring assortment performance by product category and by store, identifying in-stock positions by size and generally monitoring overall inventory levels relative to selling. At season end, we analyze the overall performance of product categories, overall assortments and specific styles by store to focus on the opportunities and challenges for the next season’s planning cycle.
The merchandise planning and allocation team utilizes a set of specific universal reporting tools in fulfilling their daily, weekly and monthly roles and responsibilities. These reporting tools provide focused and actionable views of the business to optimize the overall assortment by category and by store. We are confident that our inventory performance is optimized by having all members of the merchandise planning and allocation team follow a standardized set of processes with the use of standardized reporting tools.
STORE OPERATIONS
We believe that our store associates are critical to creating the highest quality experience for our guests. The culture in our stores is to be guest-centric - to engage and build a relationship with each of our customers. Our overall goal is to accomplish three key initiatives in our stores. The first is that we strive to build relationships with all of our guests. The second is that we believe our stores need to be clean, neat and organized in an effort to allow the "just-looking" customer to find what he needs with ease. The last component is our stores serving as mini-distribution centers. The majority of our stores are able to fulfill customer orders that were placed online in one of our digital channels. Our associates are well versed in not only the product selection carried in their specific store, but also the product selection carried online. With a point-of-sale system that can access items online for the guest who is physically in the store, our associates are able to fulfill all of their customers’ needs.
Our multi-unit, field management team receives extensive training on recruiting associates who are the correct fit for our stores. All store associates participate in our DXL FIT Expert Training and Certification program as part of our commitment to deliver a great guest experience. All new DXL store management team hires are trained extensively through senior peer trainers throughout the country. We believe having a mix of internal promotions (store manager to Regional Sales Manager) as well as external hires with extensive multi-unit background gives us an inclusive and diverse Regional Sales management team. Regional Vice Presidents give us touchpoints in the field in addition to our Regional Sales Managers and store management team to ensure consistency in executing our standards and all programs and processes we deem important to our success.
Each new member of the committee
Lionel F. Conacher has beenstore management team goes through extensive training with their Regional Sales Manager and a director since June 2018peer Store Manager. We believe our training system, together with monitoring sales metrics to help identify opportunities for further training, will improve sales productivity and became Chairman of the Board on August 12, 2020. Since September 2021, Mr. Conacher has served as a member of the board of directors for Better Choice Company Inc., a publicly-traded company. He also served as a member of the audit committee from November 2021 until September 2022. From September 2022 until May 2023, he served as its interim chief executive officer. Mr. Conacher was a managing partner of Next Ventures, GP from August 2018 until February 2021. From January 2011 to June 2018, Mr. Conacher was a senior advisor for Altamont Capital Partners LLC (“ACP”), a private equity firm. Prior to joining ACP, from April 2008 until July 2010, Mr. Conacher was the president and chief operating officer of Thomas Weisel Partners, an investment bank. Additionally, Mr. Conacher served as the chairman of Wunderlich Securities, an investee company of ACP, from December 2013 until July 2017. Mr. Conacher previously served as a member of the board of directors for AmpHP Inc., a venture-backed human performance company. He formerly served as a member of the board of directors of Mervin Manufacturing, a leading designer and manufacturer of snow boards and other board sports equipment, and PowerDot, Inc., a consumer electronics company that markets a muscle recovery and performance tool. Mr. Conacher brings extensive financial and operational experience to the Board.strengthen our customers' brand loyalty.
Harvey S. KanterOur field organization is the President, Chief Executive Officer and a director of the Company. Mr. Kanter joined the Company in February 2019 in a transition role as Advisor to the Acting CEO and assumed the role of President and Chief Executive Officer and a director of the Company in April 2019. Mr. Kanter currently serves as a non-executive co-chair, Seattle University Center for Leadership Formation, Albers School of Business and Economics. Mr. Kanter served as a director and a member of the compensation committee of Potbelly Corporation, a publicly-traded company, from August 2015 until May 2019. Mr. Kanter has over 30 years of business experience, with an extensive background in the retail industry having served from March 2012 until June 2017 as the president and chief executive officer of Blue Nile, Inc., a leading online retailer of high-quality diamonds and fine jewelry and formerly a publicly-traded company. From March 2012 until February 2020, Mr. Kanter also served as a member of the board of directors of Blue Nile, Inc. and, from January 2014 until February 2020 as its chairman. From January 2009 to March 2012, Mr. Kanter was the chief executive officer and president of Moosejaw Mountaineering and Backcountry Travel, Inc., a leading multi-channel retailer of premium outdoor apparel and gear. From April 2003 to June 2008, Mr. Kanter served in various executive positions at Michaels Stores, Inc. He was a former brand ambassador for the Fred Hutch Cancer Research Institute, and previously served as an advisory member to the Seattle University Executive MBA Program. Mr. Kanter brings an extensive knowledge of integrated-commerce retailing, with strong strategic and operational expertise.
Carmen R. Bauza was appointed a director of the Company in December 2021. In March 2023, Ms. Bauza joined the board of directors of OneWater Marine Inc., a publicly-traded company, and serves as a member of its audit and compensation committees. Since May 2022, Ms. Bauza has also served on the board of directors of Zumiez, Inc., a publicly-traded company, and serves as a member of its audit and governance and nominating committees. Ms. Bauza serves as a member of the board of managers of Claire’s Holdings LLC. which she joined in October 2018. Most recently, Ms. Bauza was the chief merchandising officer at Fanatics, Inc. from January 2019 until April 2021. Prior to that, she was the chief merchandising officer at HSN from November 2016 until December 2017 and the senior vice president, general merchandise manager consumables, health and wellness at Walmart from June
3
2007 to October 2016. She previously held roles at Bath & Body Works, Five Below and The Walt Disney Company. Ms. Bauza currently serves as a member of the board of trustees at Seton Hill University and as a member of the advisory board of RoundTable Healthcare Partners Council. Ms. Bauza brings extensive retail and merchandising experience to the Board.
Jack Boyle has been a director since August 2017. Since February 2019, Mr. Boyle has been the global co-president of direct to consumer/omni-channel for Fanatics, Inc., a market leader for officially licensed sports merchandise. Mr. Boyle originally joined Fanatics as president of merchandising in June 2012, and from December 2017 to February 2019, served as co-president of North America direct to consumer/omni-channel. From February 2005 to June 2012, Mr. Boyle was the executive vice president, general merchandising manager of women’s apparel, intimate, cosmetics and accessories for Kohl’s Corporation. From October 2003 to February 2005, he served as senior vice president, divisional merchandise manager of women’s apparel for Kohl’s Corporation, vice president of junior sportswear from July 2000 to October 2003 and vice president of planning/allocation for women's apparel from December 1999 to July 2000. From June 1990 to December 1999, Mr. Boyle held various merchandise positions, including divisional merchandise manager of women’s at May Company. Mr. Boyle brings to the Board extensive experience in merchandising, brand management and omni-channel leadership.
Willem Mesdag has been a director since January 2014. Since January 2005, Mr. Mesdag has been the managing partner of Red Mountain Capital Partners LLC, an investment management firm. Since January 2021, Mr. Mesdag has been a consultant for HPS Investment Partners, a global investment firm. Prior to founding Red Mountain in 2005, Mr. Mesdag was a partner and managing director of Goldman Sachs & Co., which he joined in 1981. Prior to Goldman Sachs, he was a securities lawyer at Ballard, Spahr, Andrews & Ingersoll, which he joined in 1978. He also serves on the board of Heidrick & Struggles International, Inc., a publicly-traded company. He previously served on the boards of 3i Group plc, Cost Plus, Inc., Encore Capital Group, Inc., Nature’s Sunshine Products, Inc. and Yuma Energy, Inc., all of which are or were publicly-traded companies. Having had an extensive career in international investment banking and finance and having served on domestic and international public-company boards, Mr. Mesdag brings to the Board significant knowledge and experience related to business and financial issues, corporate governance and brings an investor's perspective to the Board.
Ivy Ross has been a director since January 2013. In May 2014, Ms. Ross joined Google as head of glass and is currently a vice president of hardware design at Google. From July 2011 until April 2014, Ms. Ross was the chief marketing officer of Art.com from where she oversaw the company's marketing, branding, merchandising and user-experience functions. Prior to Art.com, from June 2008 to June 2011, Ms. Ross was EVP of marketing for the Gap brand, and also acted as the creative catalyst for all brands within Gap, Inc. Ms. Ross also has held senior creative and product design positions at Disney Stores North America, Mattel, Calvin Klein, Coach, Liz Claiborne, Swatch Watch and Avon. She also has served on Proctor and Gamble’s design board since its inception. With her industry insight and marketing expertise, Ms. Ross provides a valuable perspective to the Board as we continue to build our DXL brand.
Elaine K. Rubin has been a director since April 2021. Since January 2010, Ms. Rubin has been the founder and president of Digital Prophets Network, LLC, a consulting, advisory and placement firm with a network of digital commerce experts that supports the growth of retail and direct-to-consumer businesses. Since October 2013, she has also served as an advisor to Hint, Inc., which produces fruit-infused water. Prior to that, Ms. Rubin previously held leadership positions at 1800flowers.com, iVillage.com and amazon.com. She previously served on the boards of Smart & Final Stores, Inc. and Blue Nile, Inc., both of which were formerly publicly-traded companies. Ms. Rubin co-founded shop.org in February 1996 and served as its elected chair of the board of directors from February 1996 to October 2007 and served on the board of the National Retail Federation (NRF) from 2001 until 2010. Ms. Rubin brings extensive knowledge and experience of digital commerce business and will provide a valuable insight to the Board as we continue to grow our direct business.
All directors hold office until the next Annual Meeting of Stockholders and until their respective successors have been duly elected and qualified or until their earlier death, resignation or removal.
Current Non-Director Executive Officers
Peter H. Stratton, Jr., 51, has been our Executive Vice President, Chief Financial Officer and Treasurer since November 2017. Prior to that, Mr. Stratton served as our Senior Vice President, Chief Financial Officer and Treasurer from June 2014 to November 2017. From August 2009 to June 2014, Mr. Stratton was our Senior Vice President of Finance, Corporate Controller and Chief Accounting Officer. Mr. Stratton joined the Company in June 2009 as Vice President of Finance. Prior to joining the Company, Mr. Stratton served as the senior director of corporate accounting at BearingPoint, Inc. from May 2007 to June 2009. Prior to May 2007, Mr. Stratton held various finance and accounting leadership positions at Legal Sea Foods, Inc., Shaw’s Supermarkets, Inc. and Cintas Corporation.
Francis C. Chane, 60, has been our Senior Vice President of Supply Chain and Customer Fulfillment since June 2011. Mr. Chane joined the Company in June 2008 as our Vice President of Distribution & Logistics. Prior to joining our Company, Mr. Chane was the
4
vice president operations & facilities for Redcats USA, a division of the French multi-national company PPR, from 1999 to June 2008. Prior to that, Mr. Chane held various leadership positions with WearGuard Corporation, a division of Aramark Corporation.
John F. Cooney, 40, has been our Senior Vice President, Corporate Controller and Chief Accounting Officer since March 2022. Prior to that, Mr. Cooney was the Vice President of Finance and Managing Director, Corporate Controller and Chief Accounting Officer from May 2018 until March 2022 and was our Vice President of Finance, Corporate Controller and Chief Accounting Officer from May 2015 until May 2018 and our Vice President of Finance and Corporate Controller from June 2014 until May 2015. From November 2010 until June 2014, Mr. Cooney was our Director of Financial Accounting and Reporting. Prior to joining the Company, Mr. Cooney was an audit manager with PricewaterhouseCoopers LLP, which he joined in August 2004.
Anthony J. Gaeta, 53, has beenoverseen by our Chief Stores and Real Estate Officer, since April 2023. Prior that that, Mr. Gaeta wasVP Store Operations, Regional Vice Presidents, Regional Sales Managers, and a Store Operations Team, who provide management development and guidance to individual store managers. Each Regional Sales Manager is responsible for hiring and developing store managers at the Chief Stores Officer from March 2022 until April 2023. From November 2017 until March 2022, Mr. Gaeta was the Senior Vice President of Store Sales and Operations. Priorstores assigned to that Mr. Gaeta wasRegional Sales Manager’s market, and for the Vice Presidentoverall operations and profitability of Store Operationsthose stores. Each store is staffed with a store manager, assistant manager and Training from November 2013 until November 2017key holders. The store manager is responsible for achieving certain sales and a Zone Vice President from April 2010 until November 2013. Prioroperational targets. Our stores have an incentive-based commission plan for managers and selling staff to joining the Company, Mr. Gaeta was a regional manager for Men’s Wearhouse from September 2007 until April 2010encourage associates to focus on our customer’s wardrobing needs and prior to that, a regional vice president for After Hours Formalwear from March 2006 until September 2007.sales productivity.
Stacey A. Jones,MARKETING AND ADVERTISING
We believe that our marketing initiatives are critical to driving our sales growth by increasing traffic to our stores, website and app. Last year, we launched our brand initiative “52,Wear What You Want” ℠ inviting our customer to not only experience the depth of our assortment but also the breadth of exclusivity across our brands, offering brands and styles not available elsewhere. We are providing him with the freedom to choose his own style and wear what he wants. Big + Tall is all we do, and we trade on the belief that we offer superior fit, assortment, and experience to him and through this initiative we are eager to develop relationships with our customers that are built on respect, trust, and belonging.
Over the past few years, our marketing strategy has been a more targeted, personalized, data-driven model, enabling us to engage differently with each of our Chief Human Resources Officer since February 2021. From May 2018 until February 2021, she servedcustomers based on their shopping behaviors across all our buying channels. We adopted a stringent, analytical perspective to our marketing program, focusing on understanding incremental outcomes in addition to the “return on ad spend” throughout all our programs. This data-driven philosophy extends across all our marketing initiatives as Vice President, Managing Directorwe look at new ways to engage our customers. Our on-going work on enhancing our customer segmentation will ultimately drive our long-term marketing strategy, enabling us to create targeted and personalized content and messaging to our various customer segments. Our marketing programs have included email, direct mail, our loyalty program, direct marketing, digital marketing, social media, and streaming media, among others. Because we are not highly promotional, our loyalty program, The DXL Rewards Club, provides a strong value to our customers and we are planning on making further enhancements to the program during fiscal 2024.
While we will continue to invest in these targeted marketing initiatives, we also plan to increase our marketing spend in fiscal 2024 to include broad-based advertising, focusing specifically at building brand awareness. We have been working to transform our brand
9
positioning by focusing on key customer insights and leveraging our distinct advantages of Human Resources. Priorsuperior fit, depth of assortment, great styles and largely exclusive brands and an experience like no other. Our focus is to acquire new customers and achieve a greater lifetime value across our entire customer file. Working with our new creative and media agencies, we are planning a multi-channel campaign, targeting an early summer 2024 multi-market test-launch.
We expect our marketing costs in fiscal 2024 to be approximately 7.0%-7.5% of sales as compared to 5.9% of sales in fiscal 2023.
GLOBAL SOURCING
Our global sourcing strategy is a balanced approach, which considers quality, cost and lead-time, depending on the requirements of the program. We believe our current sourcing structure meets our operating requirements and provides capacity for growth. The growth and effectiveness of our global direct sourcing program is a key component to the strength of merchandise margins.
We have built a strong internal team with extensive experience that is responsible for managing an international network of vendors and suppliers across the globe. We have established strong relationships with many of the leading factories and mills across the globe. Our sourcing network consists of over 30 factories in eight countries which are experts in big & tall sizing and production. In fiscal 2023, approximately 52% of all our product needs were sourced directly. We manufacture a significant percentage of our own brand merchandise in Southeast Asian countries including Vietnam, Bangladesh, Cambodia and India. We continue to reduce dependency on China, with less than 10% of our own brands sourced from April 2013China, inclusive of our raw materials and trims, and have moved certain programs into the Western Hemisphere with duty-free opportunities such as Nicaragua and Mexico.
In an effort to April 2018, Ms. Jones was Vice President, Human Resources Operations. Ms. Jones joinedminimize foreign currency risk, all payments to our direct sourced vendors are made in U.S. dollars with payment on account.
See "Sustainability" below for a discussion of our environmental, ethical and social audits.
DISTRIBUTION
All of our retail distribution operations are centralized at our headquarters located in Canton, Massachusetts. We believe that having a centralized distribution facility maximizes the Companyselling space and in-stock position of our stores and reduces the necessary levels of back-room stock. In addition, the distribution center provides order fulfillment services for our e-commerce business. In-bound calls for our e-commerce business are primarily fulfilled by our distribution center and if an order cannot be fulfilled by our distribution center, the order is completed at the store level.
Our supply chain technology provides visibility for imports and domestic deliveries giving our buyers accurate shipping information and allowing the distribution center to plan staffing for arriving freight, resulting in October 2001reduced costs and has heldimproved receipt efficiency.
Our warehousing application and labor management system enable us to streamline our distribution processes, enhance our in-transit times, and reduce our distribution costs. We will continually work to make improvements and upgrades to our software.
For store shipments and domestic customer deliveries, we use large national carriers. We are able to track all deliveries from the warehouse to our individual stores, including the status of in-transit shipments. In addition, we are able to provide our direct customers with Authorized Return Service and Web labels, making returns more convenient for them.
In order to service our International customers, we have contracted with a global e-commerce company for payment and shipment services. Through this service, international customers view and pay for products in their local currency. Our vendor then ships directly to our customer, which we believe helps avoid potential fraud and currency exchange rate risks.
MANAGEMENT INFORMATION SYSTEMS
The infrastructure of our management information systems is a priority to us. We believe that the investments we have made in this regard have improved our overall efficiency and improved our access to information enabling timely, data-driven decisions.
Our management information systems consist of a full range of retail merchandising and financial systems, which include merchandise planning and reporting, distribution center processing, inventory allocation, sales reporting, and financial processing and reporting. We believe that our current infrastructure provides us the ability and capacity to process transactions more efficiently and provides our management team with comprehensive tools with which to manage our business. Our direct and retail channels maintain a shared inventory system and we operate a single-system platform for our DXL and Casual Male XL stores to deliver improved efficiencies.
In an effort to improve our inventory management, we have created a standardized set of “best practices” for both our merchandise planning and allocation groups. Using a retail business intelligence solution, we are able to integrate data from several sources and
10
provide enterprise-wide analytics reporting. Over the past few years, we have continued to develop a custom Assortment Suite application to leverage business intelligence and predictive analytics to provide high-impact insights into core merchandising tasks.
COMPETITION
Our business faces competition from a variety of positions in both Retail Operationssources, including department stores, mass merchandisers, other specialty stores and Human Resources. Priordiscount and off-price retailers that sell big & tall men’s clothing. While we have successfully competed on the basis of merchandise assortment, comfort and fit, customer service and desirable store locations, there can be no assurances that other retailers, including e-commerce retailers, will not adopt purchasing and marketing concepts similar to joiningours. Discount retailers with significant buying power, such as Walmart, Kohl's and J.C. Penney, represent a source of competition for us. The direct business has many competitors, including the Company, she held leadership positions with Converse, Inc., Jet ApparelKing Size catalog and T.A.C. Group, Inc.website as well as online marketplaces, such as Amazon.
Robert S. Molloy,The United States big & tall men’s clothing market is highly competitive with many national and regional department stores, specialty apparel retailers, single market operators and discount stores offering a broad range of apparel products intended for big and tall men. Besides retail competitors, we consider any casual apparel manufacturer operating in outlet malls throughout the United States to be a competitor in the casual apparel market. We believe that we are the only national operator of men’s apparel stores focused exclusively on the men’s big & tall market. 63, has been
SEASONALITY
Historically, and consistent with the retail industry, we have experienced seasonal fluctuations as it relates to our General Counsel since February 2008operating income, net income, and Secretaryfree cash flow. Traditionally, a significant portion of our operating income, net income, and free cash flow is generated in the second and fourth quarters. Our inventory is typically at peak levels by the end of the third quarter, which represents a significant use of cash, which is then relieved in the fourth quarter as we sell-down our inventory through the holiday shopping season.
TRADEMARKS/TRADEMARK LICENSE AGREEMENTS
We own several service marks and trademarks relating to our businesses, including, among others, “Destination XL®”, “DXL®”, “DXL Mens Apparel®”, “Big on Being Better®”, “Casual Male®”, “Casual Male XL®”, “Harbor Bay®”, “Oak Hill®”, “Continuous Comfort®”, “Synrgy™”, “Society of One®”, “True Nation®” and “Wear What You Want℠”. We also hold a U.S. patent for an extendable collar system, which is marketed as “Neck-Relaxer®” and a U.S. copyright for a no-iron hang tag.
SUSTAINABILITY
At DXL, we recognize the importance of addressing and prioritizing environmental, social and governance ("ESG") issues throughout our business, including recognizing and addressing specific climate-related risks. During fiscal 2021, we formed the Sustainability Committee, consisting of a cross-disciplinary team from corporate management that engaged with a third-party firm to assist us in the development of the Company's initial ESG strategy and initiatives. The committee reports to the senior management team of the Company sinceand to the Nominating and Corporate Governance Committee of our Board of Directors, which is responsible for the oversight of our initiatives. We are working to develop short- and long-term ESG goals, as well as an action plan.
Since 2019, we have been a member of a leading ethical trade service provider to increase our social, environmental and ethical sustainability, and we participate in their Ethical Trade Audit platform. Since fiscal 2020, we have retained LRQA, formerly Elevate, a global leader in supply chain assessment, and instituted 4-Pillar audits of our supply chain factories. Our intent is to increase our social, environmental and ethical sustainability by utilizing LRQA’s audit tool, "ERSA", which stands for ELEVATE Responsible Sourcing Assessment. ERSA 3.0 covers social compliance, human rights, environmental business ethics, and worker’s sentiment surveys. All audits can be found on their EIQ tool which is a web-based analytical system on which we participate in their Ethical Trade Audit platform. In fiscal 2023, we retained LRQA to also perform environment assessment audits. Through collaboration with LRQA and Bureau Veritas, we are pursuing what we call a “5-Pillar Audit”, which includes traceability of both raw materials and the equipment used to produce finished goods.
HUMAN CAPITAL MANAGEMENT
As of February 3, 2024, we had 1,439 employees. We hire additional temporary employees during the peak holiday season. None of our employees is represented by any collective bargaining agreement. Our associates are our greatest asset and we are committed to providing them with a safe and healthy work environment. Each associate is required to sign a set of policies that include, among other policies, the code of ethics, anti-harassment and procedures for raising a complaint. Our policies also contain protection of human rights and prohibit, among other things, the use of child labor or forced, bonded or indentured labor.
11
Inclusion and Diversity
We are committed to inclusivity, acceptance, and equality. Since 2017, we have had a diversity and inclusion initiative called “Normalizing the Brand.” The program brings awareness to unconscious bias and focuses on ensuring that the composition of our organization looks and feels like the communities where we live and serve. We have policies and training in place with respect to anti-discrimination and anti-harassment, among others, and provide our associates with access to an anonymous hot-line for reporting any concerns. Throughout the year, we require our associates to participate in educational videos. In 2021, we joined with CEO Action for Diversity & Inclusion, a coalition of over 2,000 CEOs, pledging to advance diversity and inclusion in the workplace. By signing on to this commitment, we have pledged to take action to cultivate a workplace where diverse perspectives and experiences are welcomed and respected, and where employees feel encouraged to discuss diversity and inclusion without retribution.
Workplace, Culture and Career Development
We are committed to providing our associates an environment where they have an opportunity to provide input on issues affecting the Company’s workforce and the employer-associate relationship. Periodically through the year, we encourage feedback and ideas from our associates through our annual engagement surveys and periodic pulse surveys. Perhaps most importantly, we promote professional and career development and mentorship programs. Since 2014, we have offered our associates the opportunity to participate in our DXLG Mentor Program, which pairs up to 20 mentees with mentors for one-year periods. The DXL Women’s Leadership Group was formed in fiscal 2016 with a mission of “Women supporting, educating and empowering each other @ DXLG”. It started as a pilot program and quickly expanded to now include over 40 female leaders, both people and process managers, in the corporate office and field. In addition, for the past five years, we have presented Leadercast, a platform for leadership development content available online.
Our Associate Engagement & Development Committee organizes “Lunch, Learn, Lead” and “Coffee Talk” sessions throughout the year to provide our associates an opportunity to gain insight on a variety of topics, such as, DXL’s social responsibility initiatives, TED talks, Global Sourcing, Normalizing the Brand and Technology. We also joined with Marist College to provide our DXL associates and their immediate adult family members with a 25% discount toward on-line tuition costs.
Compensation and Benefits
Our compensation programs are designed to pay our associates competitively in the market, based on their skills, qualifications, role, and abilities. Our benefits are designed to help employees and their families stay healthy and help them balance their work and personal lives. These benefits include health and wellness, paid time off, employee assistance, competitive pay, career growth opportunities, paid volunteer time, product discounts, and a culture of recognition. The challenges created by the global pandemic brought mental health awareness to the forefront. We are continually looking for programs and opportunities to offer our associates to ensure physical and mental wellness. We also highlight mental health awareness as part of our “Lunch, Learn, Lead” series and provide other relevant content within our learning management system. We also provide an Employee Assistance Program (EAP) which provides 24/7 assistance to associates and their family members for a variety of issues such as stress, family, parenting, and finances.
In October 2022, we added a new voluntary benefit, DailyPay, which allows our associates to access their money as they earn it, instead of having to wait until their payday to access their funds.
For more information regarding human capital, our programs, our health and safety as well as diversity information regarding our board, senior management and associates, such information can be found on our corporate website at https://investor.dxl.com. The information included in, referenced to, or otherwise accessible through, our website is not incorporated by reference in, or considered to be part of, this document or any document unless expressly incorporated by reference therein.
AVAILABLE INFORMATION
Our corporate website is www.dxl.com. Our investor relations site is http://investor.dxl.com. We make available through our website, free of charge, our Annual Reports on Form 10-K, Quarterly Reports on Form 10-Q, Current Reports on Form 8-K and all amendments to such reports filed or furnished pursuant to Section 13(a) of the Securities Exchange Act of 1934, as amended, as soon as reasonably practicable after we have electronically filed such material with, or furnished such materials to, the Securities and Exchange Commission. The SEC maintains an internet site that contains reports, proxy and information statements, and other information for issuers that file electronically with the SEC at http://www.sec.gov.
12
Item 1A. Risk Factors
The following risk factors are the important factors of which we are aware that could cause actual results, performance or achievements to differ materially from those expressed in any of our forward-looking statements. We operate in a continually changing business environment and new risk factors emerge from time-to-time. Other unknown or unpredictable factors also could have material adverse effects on our future results, performance or achievements. We cannot assure you that our projected results or events will be achieved or will occur.
Strategic Risks That May 2014. FromAffect Our Business
We may not be successful in executing our long-term strategy and growing our market share.
For us to be successful in the future and maintain growth, we must be able to continue increasing our share of the big & tall men’s apparel market. Our growth is dependent on our ability to continue to build upon our DXL brand, maintain our existing customers and attract new customers. We have developed and are implementing long-term strategic initiatives to grow our business. Our failure to execute our strategy successfully could prevent us from growing our market share, which could have a material adverse effect on our results of operations, cash flows and financial position, including if we were unable to:
Our marketing programs and efforts to drive traffic and convert that traffic into an increased loyal customer base are critical to achieving market share growth within the big & tall men’s apparel market and may not be successful.
Our ability to increase our share of the big & tall men’s apparel market is largely dependent on effectively marketing our brand and merchandise to all of our target customers in several diverse market segments so that they will become loyal shoppers who spend a greater portion of their wallets on our product offerings. In order to grow our market share, we depend on the success of our marketing and advertising in a variety of ways, including streaming media advertising, advertising events, our loyalty program, direct mail, and digital marketing, including social media and customer prospecting. Our business is directly impacted by the success of these efforts and those of our vendors. Future marketing efforts by us, our vendors or our other licensors, may be more costly than prior years and, if not successful, may negatively affect our ability to meet our sales goals and gain market share.
As part of our long-term strategy, we are planning to increase the amount that we expect to spend annually on our marketing efforts over the next few fiscal years, with marketing costs for fiscal 2024 expected to increase to 7.0%-7.5% of sales. There can be no assurance that our long-term strategy and the increased investment in marketing will grow our business or build brand awareness. If our marketing campaigns are unable to drive traffic to our stores and website, the marketing costs incurred will have a negative impact on the Company's profitability.
Our direct business is a significant component of our growth strategy, and the failure to develop our digital infrastructure could disrupt our business and negatively impact our sales.
We have made significant investments in capital spending and labor to develop our direct channels and increased investments in digital marketing to attract new customers. The growth of our overall sales is dependent on customers’ continuing to expand their
13
online purchases in addition to in-store purchases. While it is our objective to continue to grow this business, there can be no assurance that this growth will continue or be sustainable.
Our success in growing our direct business will depend in part upon our development of an increasingly sophisticated e-commerce experience and infrastructure. Increasing sophistication requires that we provide additional website features, functionality and messaging in order to be competitive in the marketplace and maintain market share. We continually update our website features, but we cannot predict future trends and required functionality or our adoption rate for customer preferences. In addition, we are vulnerable to additional risks and uncertainties associated with e-commerce sales, including security breaches, cyber-attacks, consumer privacy concerns, changes in state tax regimes and government regulation of internet activities. Our failure to respond to these risks and uncertainties appropriately could reduce our direct sales, increase our costs and diminish our growth prospects, which could negatively affect our operating results.
If we are unable to develop and implement our integrated commerce initiatives successfully, our market share and financial results could be adversely affected.
Our customer’s shopping behavior continues to evolve across multiple channels and we are working to meet his needs, with real time store inventory visibility, our mobile app, and BOPIS (buy online pick-up in stores). We consider ourselves a customer-centric integrated commerce retailer, and we continue to make ongoing investments in our information technology systems to support these evolving capabilities.
Integrated commerce is rapidly evolving and our success depends on our ability to anticipate and implement innovations in sales and marketing technology and logistics in order to appeal to existing and potential customers who increasingly rely on multiple channels to meet their shopping needs. In addition, our competitors are also investing in these initiatives, some of which may be more successful than our initiatives.
If the investment in our integrated commerce initiatives is not successful, our systems are unable to support such initiatives, or if our competitors are more successful, our financial results and our market penetration may be adversely affected.
Our business may be adversely affected if we are unable to manage and grow our store portfolio successfully.
We lease all of our store locations. Renewing and renegotiating these leases at acceptable lease terms is critical to the profitability of our stores. While we worked closely with our landlords to renegotiate and restructure a majority of our lease portfolio from the onset of the pandemic, there still may be certain stores that may not be profitable and we may not be able to renew existing agreements. We will continue to evaluate our store portfolio to optimize store profitability. As part of that evaluation, we may choose not to renew certain lease locations.
One of our long-term strategic initiatives is to grow our store portfolio over the next several years and we have identified multiple white space opportunities in new or underpenetrated markets. We are also actively reviewing opportunities to relocate or convert the majority of our remaining Casual Male XL stores to DXL. If we are unable to find locations or obtain favorable lease terms, we may not be able to grow or maintain our current store base and the lack of store growth could negatively affect our ability to growth revenue and market share.
Operational Risks That May 2018 until FebruaryAffect Our Business
The loss of, or disruption in, our centralized distribution center could negatively impact our business and operations.
The majority of our merchandise for our stores and e-commerce operations is received into our centralized distribution center in Canton, Massachusetts, where it is then processed, sorted and shipped to our stores or directly to our customers. We depend in large part on the orderly operation of this receiving and distribution process, which depends, in turn, on adherence to shipping schedules and effective management of the distribution center. Although we believe that our receiving and distribution process is efficient and well-positioned to support our strategic plans, events beyond our control, such as disruptions in operations due to fire or other catastrophic events, employee matters or shipping problems, labor shortages, severe weather, the impact of climate change or disruptions in our distribution center, could result in delays in the delivery of merchandise to our stores or directly to our customers.
With all of our management information systems centralized in our corporate headquarters, any disruption or destruction of our system infrastructure could materially affect our business. This type of disaster would be mitigated by our offsite storage and disaster recovery plans, but we would still incur business interruption that may impact our business for a significant period of time.
14
Although we maintain business interruption and property insurance, we cannot be sure that our insurance will be sufficient, or that insurance proceeds will be timely paid to us, in the event our distribution center is shut down for any reason or if we incur higher costs and longer lead times in connection with a disruption relating to our distribution center.
Our business may be adversely affected due to disruptions in the global supply chain.
Disruptions in the global supply chain in foreign ports, the impact of climate change and shortages of vessels and shipping containers may impact our ability to import inventory in a timely manner. Recent events in the Middle East have made accessing the Suez Canal a risk, thereby prompting vessels to avoid this route, which adds time and cost. Drought has left water levels lower than ever forcing Panama to reduce the volume of ships passing through the Panama Canal, leading to delays and increased shipping costs. In addition, the ongoing war in Ukraine may cause additional tariffs, sanctions, import/export restrictions and future actions that may have a negative impact on the supply chain and may limit the availability of certain raw materials and result in an increase of associated cost. Furthermore, in the event that commercial transportation is curtailed or substantially delayed, we may not be able to maintain adequate inventory levels of important merchandise on a consistent basis, which would negatively impact our sales and potentially erode the confidence of our customer base, leading to loss of sales and an adverse impact on our results of operations. Furthermore, we may continue to incur incremental freight costs which could negatively harm our gross margin rates.
We are dependent on third parties for the manufacture of the merchandise we sell.
We do not own or operate any manufacturing facilities and are therefore entirely dependent on third parties to manufacture the merchandise we sell. Without adequate supplies of merchandise to sell to our customers in the merchandise styles and fashions demanded by our particular customer base, sales would decrease materially and our business would suffer. We are dependent on these third parties’ ability to fulfill our merchandise orders and meet our delivery terms. In the event that manufacturers are unable or unwilling to ship products to us in a timely manner or continue to manufacture products for us, we would have to rely on other current manufacturing sources or identify and qualify new manufacturers. We might not be able to identify or qualify such manufacturers for existing or new products in a timely manner and such manufacturers might not allocate sufficient capacity to us in order to meet our requirements. Our inability to secure adequate and timely supplies of private-label merchandise would negatively impact proper inventory levels, sales and gross margin rates, and ultimately our results of operations.
In addition, even if our current manufacturers continue to manufacture our products, they may not maintain adequate controls with respect to product specifications and quality and may not continue to produce products that are consistent with our standards. If we were forced to rely on manufacturers who produce products of inferior quality, then our brand and customer satisfaction would likely suffer which would negatively impact our business. These manufacturers may also increase the cost to us of the products we purchase from them.
The United States Treasury Department has placed sanctions on China’s Xinjiang Production and Construction Corporation ("XPCC") for serious human rights abuses against ethnic minorities in China’s Xinjiang Uyghur Autonomous Region ("XUAR"). In addition, in January 2021, Mr. Molloy also servedthe US Customs Border Protection (“CBP”) issued a Withhold Release Order on Products Made in Xinjiang region of China. In response to the problems in Xinjiang, we developed a Compliance Certificate of Traceability for our cotton vendors. Although we prohibit our vendors from doing business with XPCC, we could be subject to penalties, fines or sanctions and our brand could be harmed if any of the vendors from which we purchase product is found to have done business, directly or indirectly, with XPCC.
We work with a third-party audit vendor to ensure a responsible and ethical supply chain. We are and will continue to pursue our corporate responsibilities and create a positive effect on human rights as Chief Administrative Officer. Prior to joining the Company, Mr. Molloy servedwell as the vice president, assistant general counsel at Staples, Inc. from May 1999environment. The Company publishes a Vendor Code of Conduct, which is a part of every agreement requiring compliance by the manufacturing facilities. If, despite third-party audits, the manufacturing facilities engage in workplace or human rights violations and we are unable to February 2008. Prior to May 1999, Mr. Molloy was a trial attorney.identify or correct it, it may negatively affect our business and harm our brand.
James ReathOur business is highly competitive, and competitive factors may reduce our revenues and profit margins., 51, joined
The United States big & tall men’s apparel market is highly competitive with many national and regional department stores, mass merchandisers, specialty apparel retailers, discount stores and online retailers offering a broad range of apparel products similar to the products that we sell. Besides retail competitors, we consider any manufacturer of big & tall men’s merchandise operating in outlet malls throughout the United States to be a competitor. It is also possible that another competitor, either a mass merchant or a men’s specialty store or specialty apparel catalog, could gain market share in big & tall men’s apparel due to more favorable pricing, locations, brand and fashion assortment and size availability. Many of our competitors and potential competitors may have substantially greater financial, manufacturing and marketing resources than we do.
15
The presence in the marketplace of various fashion trends and the limited availability of shelf space also can affect competition. We may not be able to compete successfully with our competitors in the future and could lose market share. A significant loss of market share would adversely affect our revenues and results of operations.
In addition, we maintain exclusivity arrangements with several of the brands that we carry. If we were to lose any of these exclusivity arrangements or brands altogether, our revenues may be adversely affected.
Our business may be negatively impacted and we may be liable if third parties misappropriate proprietary information of our customers and breach our security systems.
We may be harmed by security risks we face in connection with our electronic processing and transmission of confidential customer information. The majority of our retail sales are settled through credit and debit card transactions. While our Board of Directors has a Cybersecurity and Data Privacy Committee to oversee the monitoring and management of cyber risk and data privacy for our Company, and we have not had any security breaches to date, any breach could expose us to risks of loss, litigation, and liability and could adversely affect our operations as well as cause our shoppers to stop shopping with us as a result of their lack of confidence in September 2022the security of their personally identifiable information, which could have a negative impact on our sales and profitability. We attempt to limit exposures to security breaches and sensitive customer data through the use of “tokenization” in connection with both in-store and online credit card transactions, which eliminates the storage of credit card numbers. Like many retailers, we have seen an increase in cyberattack attempts, predominantly through phishing and social engineering scams, and in particular, ransomware. While none of these attempts has been successful, there can be no assurance that our continued security measures will be effective or sufficient in the future. If third parties are able to penetrate our network security or otherwise misappropriate the personal information or credit card information of our customers or if third parties gain unauthorized and improper access to such information, we could be subject to liability. These liabilities could include claims for unauthorized purchases with credit card information, impersonation or other similar fraud claims, or claims for other misuses of personal information, including unauthorized marketing purposes, and could ultimately result in litigation. Liability for misappropriation of this information could be significant.
Further, if a third party were to use this proprietary customer information in order to compete with us, it could have a material adverse impact on our business and could result in litigation.
Our ability to operate and expand our business and to respond to changing business and economic conditions will depend on the availability of adequate capital.
The operation of our business, the rate of our expansion and our ability to respond to changing business and economic conditions, all depend on the availability of adequate capital, which in turn depends on cash flow generated by our business and, if necessary, the availability of equity or debt capital.
The amount that we are able to borrow and have outstanding under our credit facility at any given time is determined using an availability formula based on eligible assets. As a result, our ability to borrow is subject to certain risks and uncertainties, such as advance rates and the amount and quality of inventory, which could reduce the funds available to us under our Chief Marketing Officer. Mr. Reath has over 20 yearscredit facility. In addition, because of marketing leadership experiencethe disruptions in the supply chain, inventory levels may be lower than expected. This directly impacts our borrowing base and there can be no assurance that we can effectively manage the balance of maintaining inventory and sufficient availability, especially during peak selling periods.
We cannot make assurances that our cash flow from operations or cash available under our credit facility will be sufficient to meet our needs. If we are unable to generate sufficient cash flows from operations in the future, we may have to obtain additional financing. If we incur additional indebtedness, that indebtedness may contain significant financial and other covenants that may significantly restrict our operations and we cannot ensure we would be able to obtain refinancing or that such additional financing would be on favorable terms.
We may be unable to predict fashion trends and customer preferences successfully.
Customer tastes and fashion trends are volatile and tend to change rapidly. Our success depends in large part upon our ability to predict effectively and respond to changing fashion tastes and consumer demands and to translate market trends to appropriate saleable product offerings. If we are unable to predict or respond to changing styles or trends successfully and misjudge the market for products or any new product lines, our sales will be impacted and we may be faced with a particular focussubstantial amount of unsold inventory or missed opportunities. In response, we may be forced to rely on omni-retail, digital marketing,additional markdowns or promotional sales to dispose of excess, slow-moving inventory, which would decrease our revenues and margins. In addition, the failure to satisfy consumer demand, specifically in our DXL stores and from our website, could have serious longer-term consequences, such as an adverse impact on our brand buildingvalue and consumer insights. Priorthe loss of market share to joiningour competitors.
16
The loss of any of our key trademarks or licenses could adversely affect demand for our products.
We own and use a number of trademarks and operate under several trademark license agreements. We believe that certain of these trademarks have significant value and are instrumental in our ability to create and sustain demand for and to market our products. We cannot be certain that these trademarks and licensing agreements will remain in effect and enforceable or that any license agreements, upon expiration, can be renewed on acceptable terms or at all. In addition, any future disputes concerning these trademarks and licenses may cause us to incur significant litigation costs or force us to suspend use of the Company, he wasdisputed trademarks.
Fluctuations in the senior vice presidentprice, availability and quality of marketing at Bed Bath & Beyond Inc. from January 2021 until July 2022. Priorraw materials and finished goods could increase costs.
Due to that, Mr. Reath servedthe aftermath of the COVID-19 pandemic, as well as the senior vice president, marketing at Macy’s, Inc. from April 2017ban of Xinjiang cotton, we are seeing cost increases in labor and across raw materials. We have secured raw materials in key item programs to December 2020. From November 2013 through April 2017, he was at BBDO New York where he served as executive vice president, headreduce the impact on our gross margin. Fluctuations in the price, availability and quality of retail from January 2016. Mr. Reath wasfabrics or other raw materials used in the manufacturing of our merchandise could have a material adverse effect on our gross margin or on our ability to meet our customers’ demands. Several factors may affect our costs for raw materials including, among other things, demand, currency fluctuations, political instability, inflationary pressures, fuel prices and weather, including the impact of global climate change. To the extent that we cannot offset these cost increases with McKinney from June 2010 until November 2013, where he served as vice presidentother cost reductions or efficiencies, such higher costs will need to be passed on to our customers. Such increased costs could lead to reduced customer demand, which could have a material adverse effect on our results of operations and group account director until January 2012 when he was promotedcash flow.
If our long-lived assets become impaired, we may need to executive vice president – directorrecord significant non-cash impairment charges.
Periodically, we review our long-lived assets for impairment whenever economic events or changes in circumstances indicate that the carrying value of retailan asset may not be recoverable. Specifically, if an individual store location is unable to generate sufficient future cash flows, we may be required to record a partial or full impairment of that store’s right-of-use assets and shopper marketingits property and became a partnerequipment. In addition, significant negative industry or general economic trends, disruptions to our business and unexpected significant changes or planned changes in our use of the firm and memberassets (such as store relocations or closures) may also result in impairment charges. Due to the uncertainty that remains regarding the duration of the boardpandemic and its impact on our store locations, we may need to take additional impairment charges. Any such impairment charges, if significant, could adversely affect our financial position and results of directors. He was also the chief marketing officer at Young & Rubicam from April 2008 until June 2010. He serves on the New Jersey Regional Council of the American Red Cross.operations.
Allison SuretteRisks Related To Environmental, Social And Governance Issues
, 42, has beenThe effects of climate change may adversely impact our Chief Merchandising Officer since March 2022. Prior to that, Ms. Surette was the Senior Vice President, General Merchandise Manager from May 2018 to March 2022 and Vice President, Merchandise Manager of Private Label, Active, Young Men’s and Outerwear from September 2016 to May 2018. Ms. Surette joined the Company in May 2006 as an Associate Planner and in June 2008, she transitioned into Merchandising as an Associate Buyer for Branded Collections. From October 2010 to January 2014, she served as a Buyer of Traditional Branded Collections and Buyer of Private Label Sportshirts and Outerwear. From January 2014 to September 2016, she was the Senior Buyer of Private Label Sportshirts and Outerwear. Prior to joining the Company, Ms. Surette was a planner for TJX from June 2003 until May 2006.business.
There is increasing concern that a gradual rise in global average temperatures due to increased concentration of carbon dioxide and other greenhouse gases ("GHG") in the atmosphere will cause significant changes in weather patterns. This could result in an increase in the frequency, severity, and duration of extreme weather conditions and natural disasters, as well as water scarcity and poor water quality. These events could adversely impact the availability and price of cotton and other raw materials, disrupt the supply chain and our ability to secure merchandise. Further, extreme weather conditions caused by climate change could negatively impact our financial results if our retail locations are no family relationships betweenunable to open, customers are unable to travel or our distribution center is unable to fulfill orders or delivery inventory. These events could also create adverse economic conditions and impact consumer confidence and discretionary spending. As a result, the effects of climate change could have a long-term adverse impact on our business and results of operations. We are working to develop policies, standards and goals to help mitigate these risks, including working closely with our vendors and business partners to help identify such risks, develop standards and improve processes.
We may be unable to achieve our environmental, social and governance goals.
We are committed to corporate social responsibility and sustainability and we recognize the importance of environmental, social and governance ("ESG") issues. Our Sustainability Committee, comprising a cross-discipline of corporate management, has engaged with a third-party firm to assist us in the development of the Company's ESG policies and initiatives. Achievement of our initiatives is subject to risks and uncertainties and we may fail to achieve our objectives. We may also incur additional costs and require additional resources to implement such policies and initiatives.
Our business is subject to evolving regulations and expectations with respect to ESG matters that may expose us to increased risks.
An increased focus by local, state, regional, national, and international regulatory bodies on GHG emissions and climate change issues increases the risk to our business if we are unable to comply with the multiple and evolving policy changes. For example, in March 2024, the SEC adopted rules to enhance and standardize climate-related disclosures by public companies so that there is more consistent, comparable, and reliable information about the financial effects of climate-related risks on a public company’s operations
17
and how it manages those risks. In addition, in October 2023, California enacted the Climate Corporate Data Accountability Act and the Climate Related Financial Risk Act that will require large public and private companies that do business within the state to disclose their Scopes 1, 2, and 3 GHG emissions, with third-party assurance of GHG emissions information for certain entities, and issue public reports on their climate-related financial risk and related mitigation measures.
Investor advocacy groups, certain institutional investors, investment funds, other market participants, stockholders, and customers have focused increasingly on the ESG or sustainability practices of companies, including those associated with climate change. If our ESG practices do not meet investor or other industry stakeholder expectations and standards, which continue to evolve, our brand, reputation and employee retention may be negatively impacted based on an assessment of our ESG practices. Any disclosures we make may include our policies and practices on a variety of social and ethical matters, including corporate governance, environmental compliance, employee health and safety practices, human capital management, product quality, supply chain management, and workforce inclusion and diversity. It is possible that stakeholders may not be satisfied with our ESG practices or the speed of their adoption. We could also incur additional costs and require additional resources to monitor,
General Risks That May Affect Our Business
Our business is seasonal and is affected by general political and economic conditions.
Our business is seasonal. Historically, a significant portion of our operating income has been generated during our second and fourth quarters. If, for any reason, we miscalculate the demand for our products during these quarters, our sales in that quarter could decline, resulting in higher labor costs as a percentage of sales, lower margins and excess inventory, which could cause our annual operating results to suffer. Due to our seasonality, the possible adverse impact from such risks is potentially greater if any such risks occur during our second and fourth quarters.
In addition, our operations may be negatively affected by local, regional or national political and economic conditions, such as levels of disposable consumer income, inflation, consumer debt, interest rates, consumer confidence and other macro issues. The volatile political environment, including the upcoming U.S. presidential and congressional election in November 2024, increases the chance of other legislative and regulatory changes at both the federal and state level that could affect us in ways we cannot predict. In addition, about 46% of the world's population will be holding elections in 2024, the outcome of those elections may have long-term implications on global economies, conflicts, trade negotiations and policies that may directly or indirectly affect our business.
The global impact of the COVID-19 pandemic and its variants have had, and other global health pandemics may have, an adverse effect on our business, financial results, liquidity, supply chain and workforce.
The COVID-19 pandemic and its variants caused global uncertainty and disruption and had a material impact on our business, predominately in fiscal 2020 and early 2021. Through fiscal 2023, the pandemic continued to have a lingering negative effect on the global economy that directly impacted our business, specifically as it related to the economy, rising interest rates, labor shortages, increased material costs, global supply chain issues, inflationary pressures, and changes in consumer spending behaviors. Our business may be negatively impacted as it relates to the risk and uncertainty of a potential COVID-19 resurgence, new variants or a new global health pandemic which could materially affect our financial results, access to sources of liquidity and inventory.
Our success depends significantly on our key personnel and our ability to attract and retain additional personnel.
Our future success is dependent on the personal efforts, performance and abilities of our key management, which includes our executive officers as well as members of our senior management. The loss of any of our directorssenior management may result in a loss of organizational focus, poor operating execution, an inability to identify and executive officers.execute strategic initiatives, an impairment in our ability to identify new store locations, and an inability to consummate possible acquisitions. The competition is intense for the type of highly skilled individuals with relevant industry experience that we require and we may not be able to continue to attract and retain new employees of the caliber needed to achieve our objectives.
Delinquent Section 16(a) ReportsLabor shortages or increases in labor costs due to new regulations could harm our business.
Since the end of the pandemic, we have continued to experience labor shortages primarily in our distribution facility and in our stores. If such labor shortages continue, especially during peak-selling periods, it may negatively impact our ability to process inventory in a timely manner and effectively staff our stores. Because of the tight labor market our hourly rates have increased to attract candidates. If we are unable to pass on these higher costs through price increases or reduced workforce hours, our margins and profitability may be adversely impacted which could have a material adverse effect on our business, results of operations or financial condition.
18
Failure to comply with laws, rules and regulations could negatively affect our business operations and financial performance.
Our business is subject to federal, state, and increasing local rules and regulations, such as state and local wage and hour laws, the U.S. Foreign Corrupt Practices Act, the Employee Retirement Income Security Act (“ERISA”), securities laws, import and export laws (including customs regulations), privacy and information security regulations, unclaimed property laws, and many others. The effect of some of these laws and regulations may be to increase the cost of doing business and may have a material impact on our earnings. In addition, the complexity of the regulatory environment in which we operate and the related cost of compliance are both increasing due to legal and regulatory requirements and increased enforcement. We may also be subject to investigations or audits by governmental authorities and regulatory agencies, which can occur in the ordinary course of business or which can result from increased scrutiny from a particular agency towards an industry, country or practice. If we fail to comply with laws, rules and regulations or the manner in which they are interpreted or applied, we may be subject to government enforcement action, class action litigation or other litigation, damage to our reputation, civil and criminal liability, damages, fines and penalties, and increased cost of regulatory compliance, any of which could adversely affect our results of operations and financial performance.
Risks Related to Our Corporate Structure and Stock
Our stock price has been and will likely continue to be volatile and fluctuate substantially.
The market price of our common stock has been and will likely continue to fluctuate substantially as a result of many factors, some of which are beyond our control. For example, from September 8, 2021, when we relisted on the Nasdaq Global market, through February 2, 2024, the reported price of our common stock has ranged from a low of $3.27 on July 1, 2022, to a high of $8.99 on November 17, 2021. Factors that could cause fluctuations in the market price of our common stock include the following:
Our certificate of incorporation, as amended, limits transfers of our common stock and may, along with state law, inhibit potential acquisition bids that could be beneficial to our stockholders.
Our certificate of incorporation, as amended, contains provisions that restrict any person or entity from attempting to purchase our stock, without prior permission from the Board of Directors, to the extent that such transfer would (i) create or result in an individual or entity becoming a five-percent stockholder of our stock, or (ii) increase the stock ownership percentage of any existing five-percent stockholder. These provisions provide that any transfer that violates such provisions shall be null and void and would require the purported transferee, upon demand by us, to transfer the shares that exceed the five percent limit to an agent designated by us for the purpose of conducting a sale of such excess shares. These provisions would make the acquisition of our Company more expensive to the acquirer and could significantly delay, discourage, or prevent third parties from acquiring our Company without the approval of our Board of Directors.
In addition, we are subject to certain provisions of Delaware law, which could also delay or make more difficult a merger, tender offer or proxy contest involving us. In particular, Section 16(a)203 of the Delaware General Corporation Law prohibits a Delaware corporation from engaging in certain business combinations with any interested stockholder for a period of three years unless specific conditions are met. In addition, certain provisions of Delaware law could have the effect of delaying, deferring or preventing a change in control of us, including, without limitation, discouraging a proxy contest or making more difficult the acquisition of a substantial block of our common stock. The provisions could also limit the price that investors might be willing to pay in the future for shares of our common stock.
Item 1B. Unresolved Staff Comments
None.
19
Item 1C.Cybersecurity
Risk Management and Strategy
We recognize the critical importance of maintaining the trust and confidence of our customers and employees. Consequently, we maintain a comprehensive security incident response plan (“SIRP”) and we assess, identify, and manage material risks associated with cybersecurity threats. Our SIRP includes immediate actions to mitigate the impact and long-term strategies for remediation and prevention of future incidents.
We have integrated cybersecurity risk management into our broader risk management framework through various mechanisms, including (i) our updates to the Cybersecurity and Data Privacy Committee (the “Cyber Committee”, created by our Board of Directors (the “Board”) in 2016), which meets at least quarterly; (ii) our annual enterprise risk management update to the Board, and (iii) our information technology and security related internal controls, including vulnerability management programs.
The Company trains employees to understand their role in attempting to protect the Company from cybersecurity attacks. Our information security training program for employees includes acknowledgement of our information security policies, regular internal communications, and testing to measure the effectiveness of our information security program. For example, we conduct regular phishing awareness campaigns designed to emulate current threats and provide immediate feedback and, as necessary, additional training or remedial action.
In addition, the Company engages third parties to assist in assessing, identifying, and remediating material risks from cybersecurity threats. Our key cybersecurity controls are regularly tested by third-party service providers, which we retain to help identify vulnerabilities in our systems and to help maintain compliance to standards and regulatory requirements. Other third-party service providers are enlisted by the Company for security operations center services to augment our teams’ monitoring capabilities and to assist with our investigation and response to alerts on emerging and ongoing threats.
Further, our cybersecurity team continuously evaluates and addresses cybersecurity risks in alignment with our business objectives and operational needs. We use various security tools and processes to help prevent, identify, escalate, investigate, resolve and recover from identified vulnerabilities and security incidents in a timely manner, including, but not limited to, risk assessment network security controls, detection and response tools and a vulnerability management program.
The complexity and evolving nature of cybersecurity threats requires that we engage with a range of external experts, including cybersecurity assessors and consultants, in evaluating and testing our risk management systems. This enables us to leverage specialized knowledge and insights, to be confident that our cybersecurity strategies and processes are consistent with industry best practices. Our collaboration with these third-parties includes regular threat assessments and consultation on security enhancements.
In order to mitigate data or security incidents that may originate from third party vendors or suppliers, we conduct both privacy and security assessments to properly identify, prioritize, assess and remediate any third-party risks, and require security and privacy addenda to our contracts where applicable.
The nature of our business exposes us to cybersecurity threats and attacks that can lead to the unauthorized acquisition or access, compromise, loss, misuse or theft of our data, including personal information, confidential information or intellectual property. To date, risks from cybersecurity threats, including as a result of any previous cybersecurity incidents, have not materially affected the Company, including our business strategy, results of operations, or financial condition. Also see Part 1, Item 1A, Risk Factors, in this Annual Report on Form 10-K for a discussion of cybersecurity risks.
Governance
Our Board is ultimately responsible for the risk oversight of the Company, including cybersecurity and privacy risks.Our Board has delegated day-to-day responsibility for oversight of cybersecurity risks to the Cyber Committee. The Cyber Committee is composed of board members with diverse expertise including risk management, technology, and finance, equipping them to oversee cybersecurity risks effectively.
Pursuant to its charter, our Cyber Committee:
20
At the management level, our Chief Technology Officer (“CTO”), SVP, Technology and Information as well as our cybersecurity personnel are primarily responsible for identifying, assessing, monitoring and managing our cybersecurity. Our CTO reports directly to our President and Chief Executive Officer and at least quarterly meets with the Cyber Committee. Our current CTO has over 35 years of industry experience, including serving as CIO/CTO for over 6 years and having extensive experience in developing and leading technology risk management programs. Additionally, our technology staff holds multiple industry standard security certifications, including Cisco Certified Network Associate ("CCNA"), PCI Internal Security Assessor ("PCI ISA") and Certified Ethical Hacker ("CEH").
21
Item 2. Properties
Our corporate offices and retail distribution center are located at 555 Turnpike Street in Canton, Massachusetts. The property consists of a 755,992 gross square foot building located on approximately 27.3 acres. We owned the property until January 30, 2006, at which time we entered into a sale-leaseback transaction, whereby we entered into a twenty-year lease agreement for an initial annual rent payment of $4.6 million, with periodic increases every fifth anniversary of the lease.
As of February 3, 2024, we operated 232 Destination XL retail stores, 15 Destination XL outlet stores, 17 Casual Male XL retail stores and 19 Casual Male XL outlet stores. We lease all of these stores directly from owners of several different types of centers, including life-style centers, shopping centers, freestanding buildings, outlet centers and downtown locations. The store leases are generally 5 to 10 years in length and contain renewal options extending their terms by between 5 and 10 years. Following this discussion is a listing by state of all store locations open at February 3, 2024.
Sites for new stores are selected based on several factors, including population and density levels, the demographic profile of the area in which the site is located, the types of stores and other retailers in the area, the location of the store within the center and the attractiveness of the store layout. We also utilize financial models to project the profitability of each location using assumptions such as the center’s sales per square foot averages, sales to invested capital ratio, and return on investment requirements.
22
Store count by state at February 3, 2024
United States |
| DXL retail and |
|
| Casual Male XL |
| ||
Alabama |
| 2 |
|
| 1 |
| ||
Arizona |
| 5 |
|
|
| — |
| |
Arkansas |
|
| — |
|
| 1 |
| |
California |
| 25 |
|
| 4 |
| ||
Colorado |
| 3 |
|
|
| — |
| |
Connecticut |
| 3 |
|
|
| — |
| |
Delaware |
| 2 |
|
|
| — |
| |
Florida |
| 11 |
|
| 4 |
| ||
Georgia |
| 4 |
|
| 2 |
| ||
Idaho |
| 1 |
|
|
| — |
| |
Illinois |
| 11 |
|
| 1 |
| ||
Indiana |
| 6 |
|
| 2 |
| ||
Iowa |
| 3 |
|
|
| — |
| |
Kansas |
| 2 |
|
|
| — |
| |
Kentucky |
| 3 |
|
|
| — |
| |
Louisiana |
| 3 |
|
| 1 |
| ||
Maine |
| 2 |
|
|
| — |
| |
Maryland |
| 6 |
|
| 2 |
| ||
Massachusetts |
| 7 |
|
|
| — |
| |
Michigan |
| 13 |
|
| 1 |
| ||
Minnesota |
| 3 |
|
|
| — |
| |
Mississippi |
| 1 |
|
| 1 |
| ||
Missouri |
| 6 |
|
| 1 |
| ||
Montana |
| 1 |
|
|
| — |
| |
Nebraska |
| 2 |
|
|
| — |
| |
Nevada |
| 3 |
|
|
| — |
| |
New Hampshire |
| 3 |
|
|
| — |
| |
New Jersey |
| 9 |
|
| 2 |
| ||
New Mexico |
| 1 |
|
|
| — |
| |
New York |
| 18 |
|
| 1 |
| ||
North Carolina |
| 4 |
|
| 1 |
| ||
North Dakota |
| 1 |
|
|
| — |
| |
Ohio |
| 11 |
|
| 1 |
| ||
Oklahoma |
| 2 |
|
|
| — |
| |
Oregon |
| 2 |
|
| 1 |
| ||
Pennsylvania |
| 13 |
|
| 4 |
| ||
Rhode Island |
| 1 |
|
|
| — |
| |
South Carolina |
| 4 |
|
|
| — |
| |
South Dakota |
| 1 |
|
|
| — |
| |
Tennessee |
| 7 |
|
|
| — |
| |
Texas |
| 24 |
|
| 3 |
| ||
Utah |
| 1 |
|
|
| — |
| |
Virginia |
| 6 |
|
| 2 |
| ||
Washington |
| 5 |
|
|
| — |
| |
West Virginia |
|
| 1 |
|
| 0 |
| |
Wisconsin |
| 5 |
|
|
| — |
| |
Item 3. Legal Proceedings
From time to time, we are subject to various legal proceedings and claims that arise in the ordinary course of business. Management believes that the resolution of these matters will not have a material adverse impact on our future results of operations or financial position.
Item 4. Mine Safety Disclosures
Not applicable.
23
PART II.
Item 5. Market for Registrant’s Common Equity, Related Stockholder Matters and Issuer Purchases of Equity Securities
Market Information
Our common stock is listed for trading on the Nasdaq Global Market under the symbol “DXLG”.
Holders
As of March 15, 2024, based upon data provided by the transfer agent for our common stock, there were approximately 75 holders of record of our common stock. The number of holders does not include individuals or entities who beneficially own shares but whose shares are held of record by a broker or clearing agent.
Issuer Purchases of Equity Securities
On March 14, 2023, the Company’s Board of Directors approved a stock repurchase program pursuant to which the Company was initially authorized to repurchase up to $15.0 million of its common stock through open market and privately-negotiated transactions. The initial authorization was completed during the third quarter of fiscal 2023. On November 15, 2023, the Board of Directors approved an amendment to the stock repurchase program to increase the amount authorized under the program from $15.0 million to $25.0 million, effective November 17, 2023. Subsequent to the end of fiscal 2023, the stock repurchase program was completed.
Stock repurchase activity during the three months ended February 3, 2024 was as follows:
Period |
| (a) |
|
| (b) |
|
| (c) |
|
| (d) |
| ||||
|
|
|
|
|
|
|
|
|
|
|
|
| ||||
October 29, 2023 to November 25,2023 |
|
| — |
|
| $ | — |
|
|
| — |
|
| $ | 10,150,003 |
|
November 26, 2023 to December 30, 2023 |
|
| 1,207,271 |
|
| $ | 4.12 |
|
|
| 1,207,271 |
|
| $ | 5,172,641 |
|
December 31, 2023 to February 3, 2024 |
|
| 1,121,923 |
|
| $ | 4.20 |
|
|
| 1,121,923 |
|
| $ | 461,187 |
|
Total |
|
| 2,329,194 |
|
| $ | 4.16 |
|
|
| 2,329,194 |
|
| $ | 461,187 |
|
(1) Average price paid per share and the approximate dollar value of shares that may yet be purchased under the plan excludes the accrual of excise tax of $0.2 million as of February 3, 2024.
Stock Performance Graph
The following Performance Graph compares our cumulative stockholder return with a broad market index (Standard & Poor’s 500) and one published industry index (Dow Jones U.S. Apparel Retailers) for each of the most recent five years ended January 31. The cumulative stockholder return for shares of our common stock (“DXLG”) and each of the indices is calculated assuming that $100 was invested on January 31, 2019. We paid no cash dividends during the periods shown. The performance of the indices is shown on a total return (dividends reinvested) basis. The graph lines merely connect January 31 of each year and do not reflect fluctuations between those dates. In addition, we have included a chart of the annual percentage return of our common stock, the S&P 500 and the Dow Jones U.S. Apparel Retailers.
24
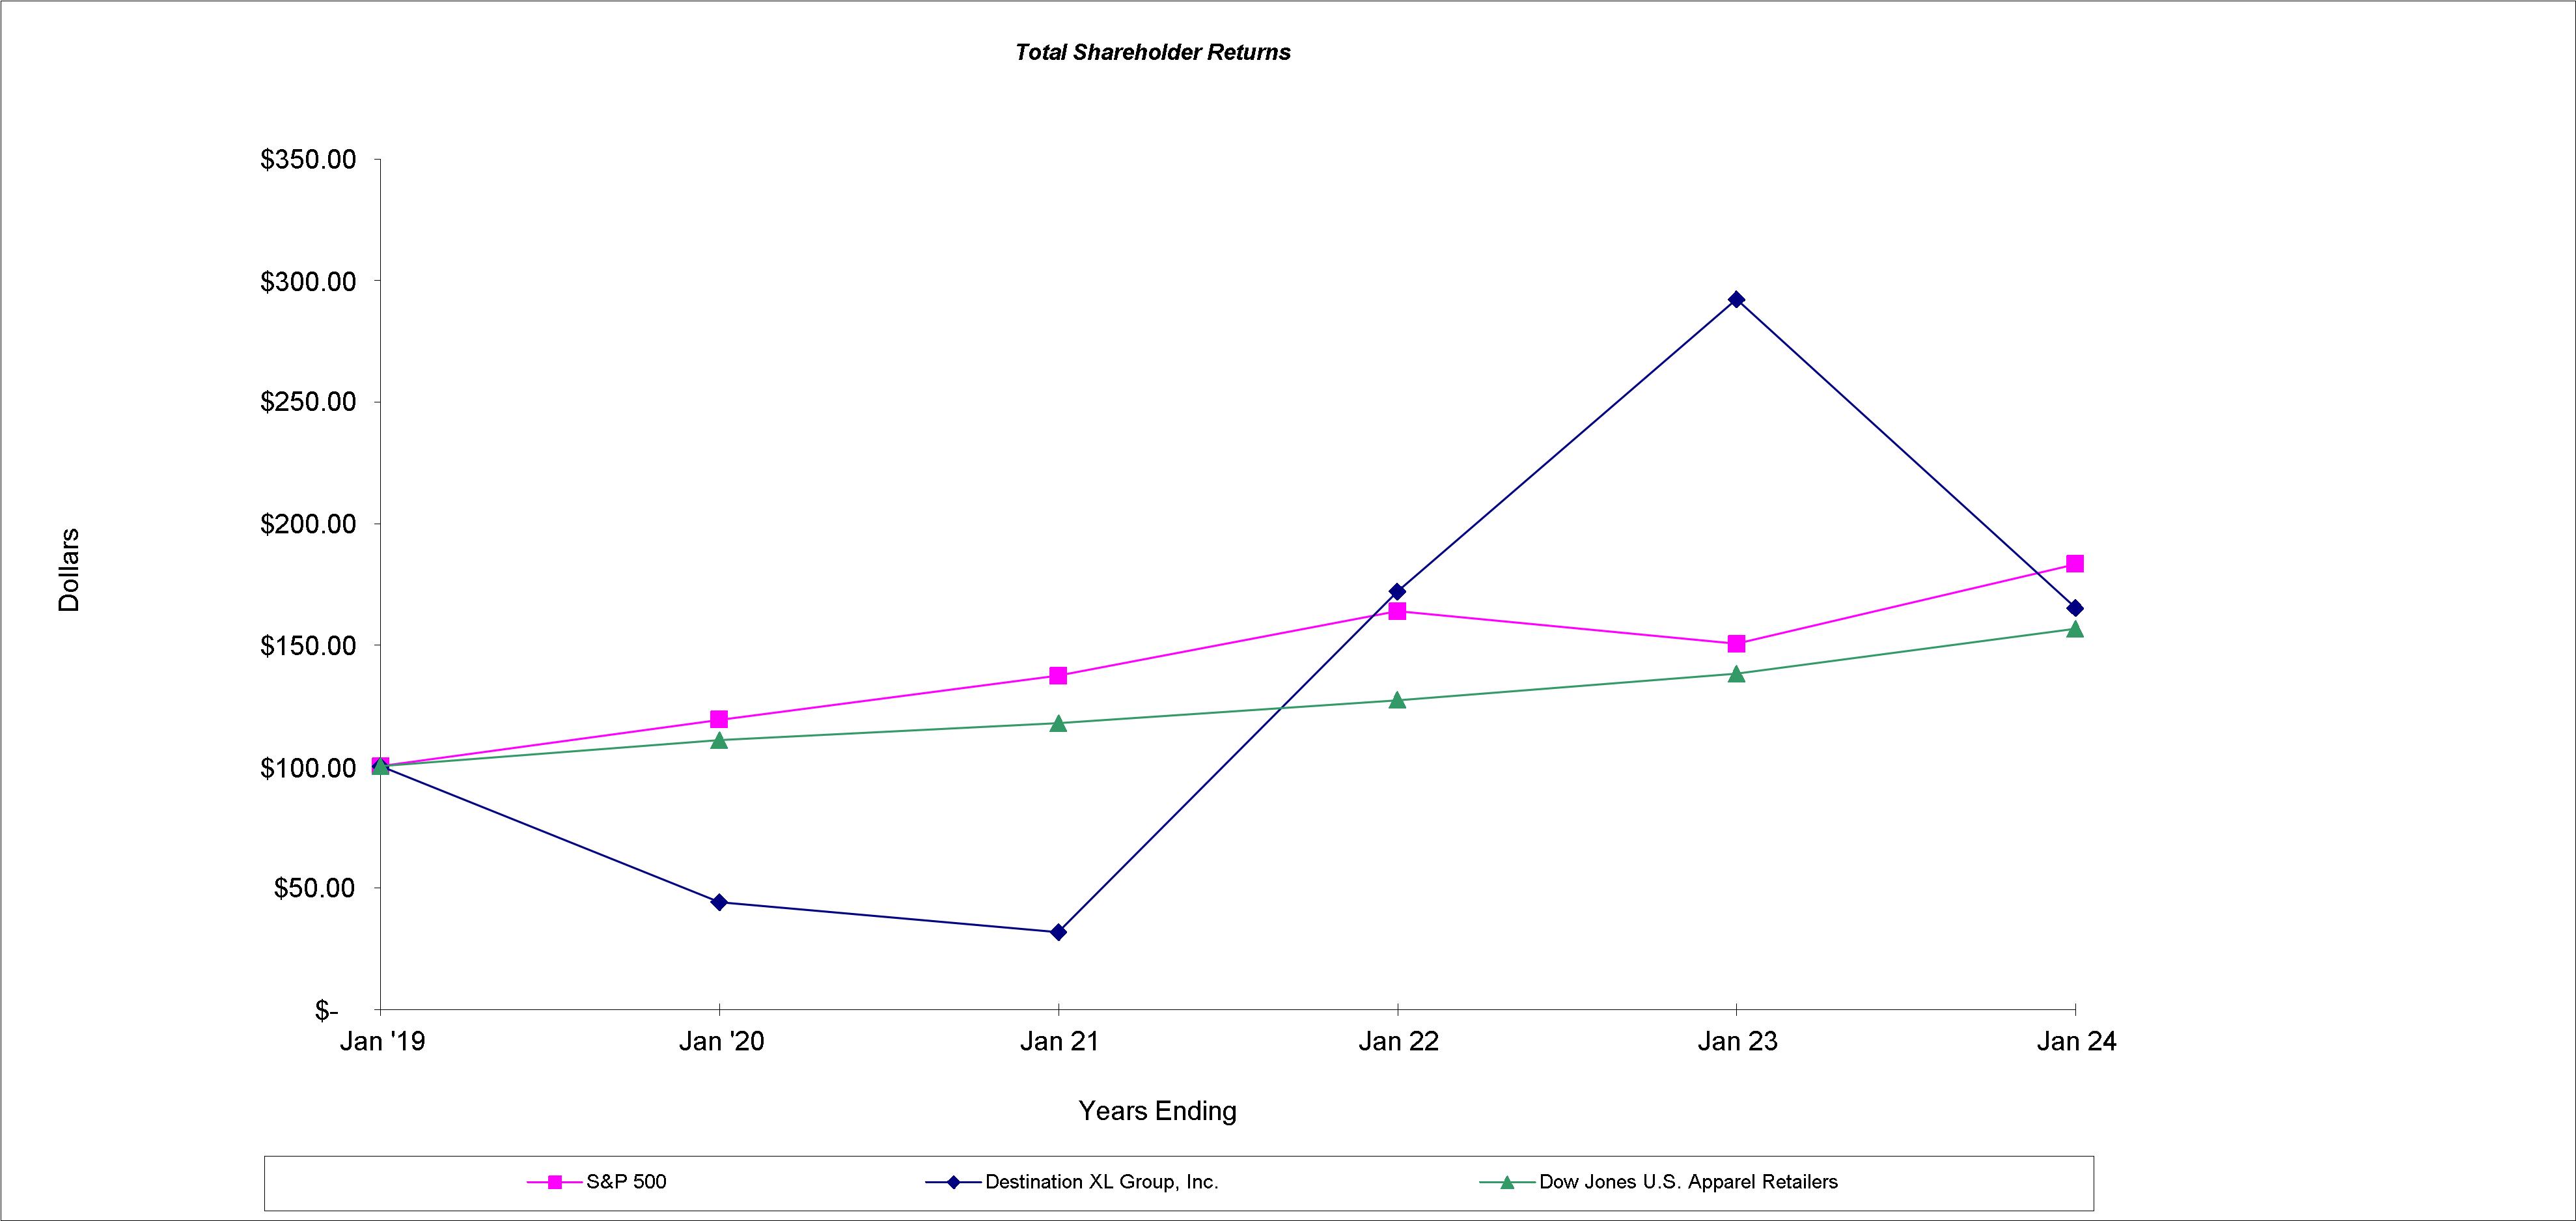
Annual Return Percentage
|
| Year ended |
| |||||||||||||||||||
Company/Index |
|
|
| Jan 20 |
|
| Jan 21 |
|
| Jan 22 |
|
| Jan 23 |
|
| Jan 24 |
| |||||
DXLG |
|
| (56.0 | %) |
|
| (27.9 | %) |
|
| 441.3 | % |
|
| 70.0 | % |
|
| (43.5 | %) | ||
S&P 500 |
|
| 19.2 | % |
|
| 15.2 | % |
|
| 19.3 | % |
|
| (8.2 | %) |
|
| 21.8 | % | ||
Dow Jones U.S. Apparel Retailers |
|
| 10.8 | % |
|
| 6.2 | % |
|
| 8.1 | % |
|
| 8.6 | % |
|
| 13.4 | % | ||
Indexed Returns
|
| Base Period |
|
|
|
| ||||||||||||||||||
|
| Jan 19 |
|
| Jan 20 |
|
| Jan 21 |
|
| Jan 22 |
|
| Jan 23 |
|
| Jan 24 |
| ||||||
Company/Index |
|
|
|
|
|
|
|
|
|
|
|
|
|
|
|
|
|
| ||||||
DXLG |
| $ | 100 |
|
| $ | 44.05 |
|
| $ | 31.75 |
|
| $ | 171.83 |
|
| $ | 292.06 |
|
| $ | 165.08 |
|
S&P 500 |
| $ | 100 |
|
| $ | 119.18 |
|
| $ | 137.23 |
|
| $ | 163.75 |
|
| $ | 150.40 |
|
| $ | 183.21 |
|
Dow Jones U.S. Apparel Retailers |
| $ | 100 |
|
| $ | 110.85 |
|
| $ | 117.75 |
|
| $ | 127.23 |
|
| $ | 138.11 |
|
| $ | 156.55 |
|
The performance graph above shall not be deemed “filed” for purposes of Section 18 of the Securities Exchange Act of 1934, as amended (the “Exchange Act”), requires our executive officers and directors, and persons who own more than 10%or otherwise subject to the liability of a registered class of our equity securities (collectively, the “Reporting Persons”), to file reports of ownership and changes in ownership withthat section. This graph will not be deemed incorporated by reference into any filing under the Securities and Exchange Commission (the “SEC”). The Reporting Persons are required to furnish us with copiesAct of all Section 16(a) reports they file. Based solely upon a review of Forms 3, 4 and 5 and amendments thereto furnished to us by our officers and directors during fiscal 2022, we believe that the Reporting Persons complied with all applicable Section 16(a) reporting requirements and that all required reports were filed in a timely manner. However, on October 5, 2022, we reported the late filing for each of Messrs. Chane, Cooney, Gaeta, Kanter, Molloy and Stratton and Mses. Surette and Jones of stock options granted by the Board on March 9, 2021, subject to shareholder approval at the Company's Annual Meeting of Stockholders on August 5, 2021.
5
Code of Ethics
We have adopted a Code of Ethics for Directors, Officers and Financial Professionals (the “Code of Ethics”). The full text of the Code of Ethics can be found under “Corporate Governance –Charters & Policies” on the Investor Relations page of our corporate web site, which is at https://investor.dxl.com. We intend to satisfy the disclosure requirement under Item 5.05 of Form 8-K regarding any amendment to,1933, as amended, or waiver from, a provision of our Code of Ethics by posting such information on our website. We also have a Code of Ethics for all of our associates. Annually, our directors and associates, including our officers, certify that they have read and are in compliance with our Code of Ethics.
Audit Committee
We have a separately-designated standing Audit Committee established in accordance with section 3(a)(58)(A) of the Exchange Act. The Audit Committee is currently comprisedAct, whether made before or after the date hereof, regardless of Messrs. Conacher and Mesdag and Ms. Ross. Each of the members of the Audit Committee is independent, as independence for Audit Committee members is defined under the rules of Nasdaq. Messrs. Conacher and Mesdag each qualify as an audit committee financial expert under the rules of the Securities Exchange Commission (the “SEC”).
Director Nominations
No material changes have been made to the procedures by which security holders may recommend nominees to our Board from those that were describedany general incorporation language in our Definitive Proxy Statement for our 2022 Annual Meeting of Stockholders that was filed with the SEC on June 30, 2022.such filing.
6Item 6.Reserved.
25
Item 11. 7.Executive Compensation Management’s Discussion and Analysis of Financial Condition and Results of Operations
Compensation
The following is a discussion and analysis of our financial condition and results of operations for fiscal 2023 as compared to fiscal 2022. Our Annual Report on Form 10-K for the year ended January 28, 2023 (fiscal 2022) includes a discussion and analysis of our financial condition and results of operations comparing fiscal 2022 to fiscal 2021 in Item 7 of Part II, “Management’s Discussion and Analysis of Financial Condition and Results of Operations.”
Executive SummaryAs noted above in Part 1, this section also contains forward-looking statements that reflect the Company’s plans, estimates and beliefs. The Company's actual results could materially differ from those discussed in these forward-looking statements. Factors that could cause or contribute to those differences include, but are not limited to, those discussed below and elsewhere in this report, particularly in “Risk Factors” and “Forward-Looking Statements.” The following discussion and analysis of our financial condition and results of operations should be read in light of those risks and uncertainties and in conjunction with our accompanying Consolidated Financial Statements and Notes thereto.
This Compensation DiscussionCertain figures discussed below may not foot due to rounding.
Segment Reporting
We have two principal operating segments: our stores and Analysis providesdirect business. We consider our stores and direct business segments to be similar in terms of economic characteristics, production processes and operations, and have therefore aggregated them into one reportable segment, retail segment, consistent with our integrated commerce approach. The Company’s wholesale business was a summarythird operating segment until the first quarter of fiscal 2022, when the Company ended its relationship with its primary wholesale customer. Due to the immateriality of the wholesale segment’s revenues, profits and assets, its operating results were aggregated with the retail segment in fiscal 2022.
Comparable Sales and E-Commerce (Direct) Sales Definition
Our 2023 fiscal year included 53 weeks compared with 52 weeks in fiscal 2022. Accordingly, year-over-year comparisons of total sales for the fourth quarter and full year are affected by an extra week of sales in fiscal 2023. However, for comparable sales, the Company is reporting on a comparable weeks basis (i.e. the 14 and 53 weeks ended February 3, 2024 compared with the 14 and 53 weeks ended February 4, 2023, respectively).
Our customer’s shopping experience continues to evolve across multiple channels and we are continually adapting to meet the customer's needs. The majority of our executive compensation philosophystores have the capability of fulfilling online orders if merchandise is not available in the warehouse. As a result, we continue to see more transactions that begin online but are ultimately completed at the store level. Similarly, if a customer visits a store and programs,the item is out of stock, the associate can order the item through our website. A customer also has the ability to order online and discussespick-up in a store or at curbside. We define store sales as sales that originate and are fulfilled directly at the compensation paidstore level. E-commerce sales, which we also refer to as direct sales, are defined as sales that originate online, whether through our Chief Executive Officer (“CEO”),website, at the store level, our Chief Financial Officer (“CFO”)Guest Engagement Center, or through a third-party marketplace.
Stores that have been open for 13 months are included in comparable sales. Stores that have been remodeled or re-located during the period are also included in our determination of comparable stores sales. Stores that have been expanded by more than 25% are considered non-comparable for the first 13 months. The method of calculating comparable sales varies across the retail industry and, as a result, our calculation of comparable sales is not necessarily comparable to similarly titled measures reported by other retailers.
Non-GAAP Measures
We monitor certain non-GAAP financial measures on a regular basis in order to track the progress of our other executive officers who servedbusiness. These measures include free cash flow, adjusted net income, adjusted net income per share, adjusted EBITDA and adjusted EBITDA margin. We believe these measures provide helpful information with respect to the Company’s operating performance and that the inclusion of these non-GAAP measures is important to assist investors in comparing our performance in fiscal 2022 (collectively, our “Named Executive Officers”).2023 to fiscal 2022. However, these measures may not be comparable to similar measures used by other companies and should not be considered superior to or as a substitute for net income, net income per diluted share or cash flow from operating activities in accordance with GAAP. See “Non-GAAP Reconciliations” below for additional information on these non-GAAP financial measures and reconciliations to comparable GAAP measures.
RESULTS OF OPERATIONS
Our Named Executive Officers forfiscal year is a 52- or 53-week period ending on the Saturday closest to January 31. Fiscal 2023 was a 53-week period and fiscal 2022 were:was a 52-week period.
➣
26
➣EXECUTIVE OVERVIEW
|
| Fiscal 2023 |
|
| Fiscal 2022 |
|
| ||
|
| (in millions, except for percentage of sales and per share data) | |||||||
Sales |
| $ | 521.8 |
|
| $ | 545.8 |
|
|
Net income |
|
| 27.9 |
|
|
| 89.1 |
|
|
Adjusted net income (Non-GAAP) |
|
| 32.3 |
|
|
| 42.5 |
|
|
Adjusted EBITDA (Non-GAAP) |
|
| 55.9 |
|
|
| 73.8 |
|
|
|
|
|
|
|
|
|
| ||
Per diluted share: |
|
|
|
|
|
|
| ||
Net income |
| $ | 0.43 |
|
| $ | 1.33 |
|
|
Adjusted net income (Non-GAAP) |
| $ | 0.50 |
|
| $ | 0.63 |
|
|
|
|
|
|
|
|
|
| ||
As a percentage of sales: |
|
|
|
|
|
|
| ||
Gross margin |
|
| 48.4 | % |
|
| 49.9 | % |
|
SG&A expenses |
|
| 37.7 | % |
|
| 36.4 | % |
|
Operating margin |
|
| 8.0 | % |
|
| 10.7 | % |
|
Adjusted EBITDA margin (Non-GAAP) |
|
| 10.7 | % |
|
| 13.5 | % |
|
|
|
|
|
|
|
|
| ||
Liquidity: |
|
|
|
|
|
|
| ||
Cash flow from operating activities |
| $ | 49.6 |
|
| $ | 59.9 |
|
|
Free cash flow (Non-GAAP) |
| $ | 32.2 |
|
| $ | 50.3 |
|
|
|
|
|
|
|
|
|
| ||
Fiscal 2022 Financial2023 proved to be a challenging year and Executive Compensation Highlights
Fiscal 2022 marked our results fell short of our expectations. Our comparable sales for fiscal year 2023 decreased 4.6%, with comparable sales from our stores down 4.5% and our direct business down 4.8%. Despite the year-over-year decline in sales, fiscal 2023 proved to be the second record-breakinghighest year of sales resulting in eight consecutive quartersthe history of positive comparable sales growthour Company, only behind fiscal 2022. We were pleased with our operational discipline which allowed us to maintain a solid gross margin, manage our operating expenses, and the second year of double-digit adjusted EBITDA margins. Total comparable sales growth was 10.9%, as compared to fiscal 2021. We reportedgenerate net income of $89.1$0.43 per diluted share and an adjusted EBITDA margin (a non-GAAP measure) of 10.7%.
Net income for fiscal 2023 of $0.43 per diluted share included a non-recurring pretax charge of $5.7 million recognized in connection with our decision to terminate our frozen retirement plans during fiscal 2023. Given the high interest rates, we saw this as an opportunistic use of excess cash to eliminate these variable liabilities. Net income for fiscal 2022 included a tax benefit of $31.6 million, or $1.33$0.47 per diluted shares, attributable to the release of substantially all of the valuation allowance against our deferred tax assets. Assuming a normalized tax rate of 27% for both fiscal years and adjusting for the loss from the retirement plan terminations, asset impairments (gains) and tax benefits or gains, if any, adjusted net income for fiscal 2023, was $0.50 per diluted share as compared to adjusted net income of $56.7 million, or $0.83$0.63 per diluted share for fiscal 2022.
We continued to strengthen our financial position in fiscal 2021. 2023, as we generated cash flow from operations of $49.6 million and free cash flow of $32.2 million. We used $24.5 million of that free cash flow to repurchase 5.4 million shares of our common stock. We successfully managed our inventory levels, which were down 12.9% as compared to the end of fiscal 2022. We ended fiscal 2023 with cash and investments totaling $60.0 million as compared to $52.1 million at January 28, 2023. We had no borrowings under our credit facility during fiscal 2023 and at February 3, 2024 our availability under our credit facility was $69.8 million. As we transition into fiscal 2024, we are focused on our long-term growth initiatives that we announced earlier in the year and are discussed above in Part I, Item 1, Business Strategy. Fiscal 2024 will be a year of investment and learning, but we feel strongly that the investments we are making in marketing, store expansion and digital are necessary to change the growth trajectory of our company and gain greater market share. We have selected creative and media agencies to help us curate and execute our vision and are planning a multi-channel campaign, with a multi-market test launch expected in early summer of 2024. We have also identified lease locations for another 8
27
DXL stores in addition to the three new stores we opened this year. Building stronger brand awareness is our overarching goal and we believe we need to invest in these initiatives to achieve that goal.
SALES
(in thousands) |
| Fiscal 2023 |
|
|
| Fiscal 2022 |
|
| ||
Store sales |
| $ | 358,710 |
| 68.7% |
| $ | 375,618 |
| 68.9% |
Direct sales |
|
| 163,105 |
| 31.3% |
|
| 169,821 |
| 31.1% |
Retail segment |
|
| 521,815 |
| 100.0% |
|
| 545,439 |
| 100.0% |
Wholesale segment |
|
| — |
|
|
|
| 399 |
|
|
Total sales |
| $ | 521,815 |
|
|
| $ | 545,838 |
|
|
For fiscal 2023, total sales decreased 4.4% to $521.8 million from $545.8 million for fiscal 2022. Comparable sales decreased 4.6%, with stores down 4.5% and the direct business down 4.8%. During fiscal 2023, we saw a gradual slowdown in store traffic across all regions of the country as consumer spending continued to be negatively impacted by the economic uncertainty and inflationary pressures. The decrease in comparable sales was partially offset by sales for the 53rd week of $7.1 million.
GROSS MARGIN
For fiscal 2023, gross margin, inclusive of occupancy costs, was 48.4% compared to 49.9% for fiscal 2022. The decrease of 150 basis points was due to a decrease in merchandise margins of 70 basis points and an 80 basis point increase in occupancy costs. The decrease in merchandise margin was due to cost pressures on certain private-label merchandise, increased direct-to-consumer shipping costs and costs related to our loyalty program. The 80 basis point increase in occupancy costs was due to a combination of the deleveraging of sales and increased rents as a result of lease extensions. For 2024, we expect our gross margin rate to experience some occupancy deleverage in the first half due to lower sales expectations and for the year we expect gross margin rates to be approximately 30 to 40-basis points lower than fiscal 2023.
SELLING, GENERAL AND ADMINISTRATIVE EXPENSES
SG&A expenses as a percentage of sales were 37.7% for fiscal 2023, as compared to 36.4% in fiscal 2022.
On a dollar basis, SG&A expenses decreased by $2.3 million for fiscal 2023 as compared to fiscal 2022. The decrease was primarily due to a decrease in marketing costs and a decrease in performance-based incentive accruals, partially offset by an increase in payroll-related costs from new positions added in the past year to support our long-range growth initiatives and costs for the 53rd week of approximately $2.7 million.
Management views SG&A expenses through two primary cost centers: Customer Facing Costs and Corporate Support Costs. Customer Facing Costs, which include store payroll, marketing and other store operating costs, represented 21.3% of sales for fiscal 2023 as compared to 20.8% of sales for fiscal 2022. Corporate Support Costs, which include the distribution center and corporate overhead costs, represented 16.4% of sales for fiscal 2023 as compared to 15.6% of sales for fiscal 2022. Marketing costs for fiscal 2023 were 5.9% of sales.
IMPAIRMENT (GAIN) OF ASSETS
Asset impairment charges primarily represent the write-down of operating lease right-of-use assets and the write-down of store property and equipment, where the carrying value exceeds fair value. In addition, any subsequent gains recognized in connection with a store closure related to a previously recorded operating lease right-of-use asset impairment will be included as an offset to impairment charges, with the remainder of the gain included as a reduction in store occupancy costs.
For fiscal 2023, the Company recorded a total asset impairment charge of $0.1 million, which included a write-down for certain store property and equipment and operating lease right-of-use assets.
For fiscal 2022, the Company recorded a non-cash gain of $0.6 million on the reduction of its operating lease liability in connection with its decision to close certain retail stores, which resulted in a revaluation of the lease liability. Of the total non-cash gain of $0.6 million, $0.4 million related to leases where the right-of-use assets had previously been impaired, and therefore was recorded as a reduction of the previously recorded impairment charge with the remaining $0.2 million recorded as a reduction to occupancy costs.
The fiscal 2022 impairment gain of $0.4 million was partially offset by a $0.2 million impairment charge for the write-down of store property and equipment. The net gain of $0.2 million is included as Impairment (Gain) of Assets on the Consolidated Statement of Operations for fiscal 2022.
28
DEPRECIATION AND AMORTIZATION
Depreciation and amortization expense for fiscal 2023 was $13.8 million, as compared to $15.4 million in fiscal 2022. Our depreciation expense decreased over the past few years, as many of our assets have become fully depreciated and we have had modest capital spending over the past several years.
LOSS FROM TERMINATION OF RETIREMENT PLANS
During fiscal 2023, we identified an opportunity to eliminate a variable liability by taking advantage of the high-interest rate environment and terminate the frozen pension plan and SERP. Through the purchase of nonparticipating annuities, we completed a final settlement of the SERP in the third quarter and a final settlement of the pension plan in the fourth quarter.
For fiscal 2023, we recognized a charge of $5.7 million representing the recognition of the unrealized loss that was part of Accumulated Other Comprehensive Loss on the Consolidated Balance Sheet.
INTEREST INCOME/EXPENSE, NET
Net interest income for fiscal 2023 was $2.1 million, as compared to net interest expense of $0.3 million for fiscal 2022. We started investing excess cash in short-term, US government-backed investments in the fourth quarter of fiscal 2022, includedwhich generated a net interest income position in fiscal 2023. Interest costs for both fiscal years were immaterial because we had no outstanding debt and no borrowings under our credit facility during any period.
INCOME TAXES
As a result of releasing substantially all of the releasevaluation allowance against our deferred tax assets during fiscal 2022, we have returned to a normal tax provision for fiscal 2023.
Since the end of fiscal 2013, we had maintained a full valuation allowance against our deferred tax assets. During the second quarter of fiscal 2022, we determined that it was more likely than not that we would be able to realize the benefit of substantially all of our deferred tax assets in the United States. In reaching this determination, we considered the cumulative three years of profitability, our expectations regarding the generation of future taxable income as well as the overall improvement in our business and our current market position. As a result, in fiscal 2022, the valuation allowance against the Company's deferred tax assets decreased by $47.6 million, of which $31.6 million was recorded as a non-recurring tax benefit related to the release of the valuation allowance on deferred tax assets expected to be realized in future periods,periods.
At February 3, 2024, we continued to provide a valuation allowance of $2.2 million, primarily against certain state and foreign net operating losses ("NOLs").
Realization of our deferred tax assets, which resultedrelate principally to federal net operating loss carryforwards, of which approximately $3.6 million will expire in fiscal 2037, is dependent on generating sufficient taxable income. In addition, there are $39.9 million of federal net operating loss carryforwards that do not expire. For state income tax purposes, we have $51.8 million of net operating losses that are available to offset future taxable income, the majority of which will expire from fiscal 2024 through fiscal 2045. The utilization of our NOLs reduces our taxable income and, as a result, we have minimal cash taxes.
For fiscal year 2023, the Company’s effective tax rate was 27.4%. For fiscal 2022, we recorded an income tax benefit of $30.8 million, which included a current income tax provision of $0.8 million, primarily related to income tax in states with statutory limitations on the usage of NOLs, and a non-recurring tax benefit of $31.6 million related to the release of the valuation allowance against the deferred tax assets. See Note F to the Consolidated Financial Statements.
NET INCOME
Net income for fiscal 2023 was $27.9 million, or $0.43 per diluted share, as compared to a net income for fiscal 2022 of $89.1 million, or $1.33 per diluted share.
Net income for fiscal year 2023 included net income for the 53rd week, which was approximately $1.2 million, and also included a loss from the termination of retirement plans of $5.7 million.
Net income for fiscal 2022 included the reversal of $31.6 million, or $0.47 per diluted share. Adjusted EBITDA,share, of our deferred tax asset valuation allowance.
On a non-GAAP measure,basis, assuming a normalized tax rate of 27% and adjusting for the loss from the termination of the retirement plans, actual income tax provision (benefit) and asset impairment (gain), if any, adjusted net income for fiscal year 2023 was $73.8$32.3 million, or $0.50 per diluted share, as compared to $76.9adjusted net income of $42.5 million, or $0.63 per diluted share for fiscal 2021.2022.
29
SEASONALITY
A comparison of sales in each quarter of the past two fiscal years is presented below. The slight decrease in adjusted EBITDA for fiscal 2022 as compared to fiscal 2021 wasamounts shown are also not necessarily indicative of actual trends, because such amounts also reflect the addition of new stores and the remodeling and closing of other stores during these periods. Consistent with the retail apparel industry, our business is seasonal. (Certain columns may not foot due to deliberate investmentsrounding.)
(in millions, except percentages) |
| Fiscal 2023 |
|
| Fiscal 2022 |
| ||||||||||
First quarter |
| $ | 125.4 |
|
|
| 24.0 | % |
| $ | 127.7 |
|
|
| 23.4 | % |
Second quarter |
| $ | 140.0 |
|
|
| 26.8 | % |
|
| 144.6 |
|
|
| 26.5 | % |
Third quarter |
| $ | 119.2 |
|
|
| 22.8 | % |
|
| 129.7 |
|
|
| 23.8 | % |
Fourth quarter |
| $ | 137.1 |
|
|
| 26.3 | % |
|
| 143.9 |
|
|
| 26.4 | % |
|
| $ | 521.8 |
|
|
| 100.0 | % |
| $ | 545.8 |
|
|
| 100.0 | % |
EFFECTS OF INFLATION
During fiscal 2023, we continued to see the effect of inflationary pressures on raw materials, services and labor. While there seems to be improvement, we cannot be certain of the effect inflation (or deflation) may have on our results of operations in our business, specifically in marketing, as well as attracting and retaining talent, to drive the transformation of digital and our brand repositioning to support sales growth.future.
LIQUIDITY AND CAPITAL RESOURCES
Our fiscal 2022 results exceededprimary sources of liquidity are our plan. When settingcash and cash equivalents, cash generated from operations and availability under our plan for 2022, there was continuing uncertainty with respectcredit facility, which is discussed below. We believe these sources of liquidity will be sufficient to inflation, labor shortages, COVID-19 impacts, supply chain issuesfund our working capital requirements, commitments, capital expenditures and geopolitical instability from the Russian invasionour stock repurchase program. Cash that is in excess of Ukraine. However, through much of fiscal 2022 our sales outperformed both our planforecasted needs may be invested in money market accounts and fiscal 2021 results, with increases in both our stores as well as our direct business. U.S. government-backed securities.
We believe that our brand repositioning resonated withcash, investments, cash generated from operations, and borrowings available to us under our customercredit facility will be adequate to meet our liquidity needs and enabled uscapital expenditure requirements for at least the next 12 months. We also believe that cash flows from operating activities and cash on hand will be sufficient to grow sales while maintaining strong margins, but believesatisfy our capital requirements in the longer-term, however, to the extent future capital requirements exceed cash on hand plus cash flows from operating activities, we also benefited from some level of pent-up consumer demand and the fiscal stimulus policy in fiscal 2021. The compensation earnedanticipate that working capital will be financed by our Named Executive Officerscredit facility.
At February 3, 2024 our material contractual obligations primarily consisted of our operating lease obligations, as disclosed in fiscal 2022 was directly tiedNote E, Leases, to the Consolidated Financial Statements. In addition to our lease obligations, at February 3, 2024, we were also contractually committed pursuant to a merchandise purchase obligation to meet minimum purchases of $10.0 million annually through fiscal 2022 financial results.2028.
The following table shows total compensation earned and total realized pay for eachsets forth financial data regarding our liquidity position at the end of the Named Executive Officers (NEOs) inpast two fiscal 2022years:
(in millions) |
| Fiscal 2023 |
|
| Fiscal 2022 |
|
| ||
Cash flow from operating activities |
| $ | 49.6 |
|
| $ | 59.9 |
|
|
Capital expenditures |
|
| (17.4 | ) |
|
| (9.6 | ) |
|
Free Cash Flow (Non-GAAP) |
| $ | 32.2 |
|
| $ | 50.3 |
|
|
|
|
|
|
|
|
|
| ||
Cash, cash equivalents and short-term investments, at year end |
| $ | 60.0 |
|
| $ | 52.1 |
|
|
Total debt, net of unamortized debt issuance costs |
| $ | - |
|
| $ | - |
|
|
Unused excess availability under Credit Facility |
| $ | 69.8 |
|
| $ | 78.4 |
|
|
For fiscal 2023, cash flow from operations decreased to $49.6 million as compared to $59.9 million for fiscal 2021:
|
| Total Compensation(1) |
|
| Total Realized Pay (2) |
| ||||||||||||||||||
Named Executive Officer |
| Fiscal 2022 |
|
| Fiscal 2021 |
|
| % Change |
|
| Fiscal 2022 |
|
| Fiscal 2021 |
|
| % Change |
| ||||||
Harvey S. Kanter |
| $ | 4,221,881 |
|
| $ | 3,616,278 |
|
|
| 16.7 | % |
| $ | 6,881,634 |
|
| $ | 8,410,773 |
|
|
| (18.2 | )% |
Peter H. Stratton, Jr. |
| $ | 1,153,866 |
|
| $ | 1,068,604 |
|
|
| 8.0 | % |
| $ | 1,287,281 |
|
| $ | 1,040,363 |
|
|
| 23.7 | % |
Anthony J. Gaeta |
| $ | 831,020 |
|
| $ | 725,294 |
|
|
| 14.6 | % |
| $ | 899,072 |
|
| $ | 663,061 |
|
|
| 35.6 | % |
Robert S. Molloy |
| $ | 1,014,167 |
|
| $ | 980,419 |
|
|
| 3.4 | % |
| $ | 1,088,916 |
|
| $ | 947,702 |
|
|
| 14.9 | % |
Allison Surette |
| $ | 818,948 |
|
| $ | - |
|
| - |
|
| $ | 850,290 |
|
| $ | - |
|
| - |
| ||
7
Cash flow used for investing activities increased by $39.5 million for fiscal 2023 as compared fiscal 2022, primarily due to the purchase of short-term investments, net of maturities, of $31.9 million and an increase in total compensationcapital expenditures of $7.8 million.
Cash flow used for financing activities for fiscal 2023 and fiscal 2022 of $24.9 million and $13.7 million, respectively, was primarily relatedfor the repurchase of our common stock.
30
Credit Facility
On October 28, 2021, we entered into a $125.0 million revolving credit agreement with Citizens Bank, N.A., with a maturity date of October 28, 2026. On April 20, 2023, the Company entered into the First Amendment to his promotionCredit Agreement which provided for the replacement of the London Interbank Offering Rate (“LIBOR”) interest rate options with the secured overnight financing rate ("SOFR") based options (as amended, the "Credit Facility"). The Credit Facility includes a sublimit of $20.0 million for commercial and standby letters of credit and a sublimit of up to Chief Stores Officer in March 2022.
We had no outstanding borrowings under the Credit Facility at February 3, 2024. At February 3, 2024, outstanding standby letters of any options exercised or stock awards that vested, as reflectedcredit were $4.3 million and outstanding documentary letters were credit of $1.0 million. The Credit Facility was not utilized during the year, resulting in average unused excess availability during fiscal 2022 of $84.5 million. Unused excess availability at February 3, 2024 was $69.8 million. Our obligations under the “Option Exercises and Stock Vested” table for eachCredit Facility are secured by a lien on substantially all of our assets. The Company was subject to an unused line fee of 0.25% of the respective years. Mr. Kanter's realized pay for fiscal 2021 included 480,000 PSUs that vested during fiscal 2021 as a resulttotal commitment less average outstanding letters of the Company's common stock achieving the related performance metric, which was a 90-day volume-weighted average closing price of $4.00 and $6.00 per share. The PSUs were granted to Mr. Kanter when he was hired in February 2019.credit.
Executive Compensation Philosophy and Objectives
Our Compensation CommitteeCredit Facility is responsible for establishing, implementing and monitoring adherencedescribed in more detail in Note D to the Board’s compensation philosophy, which isConsolidated Financial Statements.
Stock Repurchase Program
In March 2023, our Board of Directors approved a stock repurchase program. Under the stock repurchase program, we were initially authorized to ensure that executive compensation is fair, reasonable, competitiverepurchase up to $15.0 million of its common stock through open market and consistent withprivately negotiated transactions. In November 2023, the interestsBoard of Directors approved an amendment to the stock repurchase program to increase the amount authorized for repurchase from $15.0 million to $25.0 million.
During fiscal 2023, we repurchased 5.4 million shares at a total cost, including fees, of $24.5 million. Shares of repurchased common stock are held as treasury stock. The stock repurchase program was completed subsequent to the end of the Company’s stockholders.fiscal year.
INVENTORY
At February 3, 2024, total inventories decreased to $81.0 million from $93.0 million at January 28, 2023. Inventory at February 3, 2024 was approximately 12.9% lower than the prior year. Managing our inventory remains a primary focus for us as we strive to be efficient with our working capital. Based on the unfavorable sales trends we started to see in March 2023, we began taking proactive measures to manage our inventory and adjust our receipt plan. At February 3, 2024, our clearance inventory was 9.5% of our inventory, as compared to 7.9% at January 28, 2023, and below our historical benchmark of approximately 10.0%. Since 2019, we have reduced our inventory by 21% and improved our inventory turnover rate by over 30%. Given the ongoing macro-economic concerns around inflation and consumer spending, managing our inventory will remain a primary focus for us in fiscal 2024.
OFF-BALANCE SHEET ARRANGEMENTS
We have no off-balance sheet arrangements as defined by 303(a)(4) of Regulation S-K.
CAPITAL EXPENDITURES
The Compensation Committee believes that an effective executive compensation program will:following table sets forth the open stores and related square footage at February 3, 2024 and January 28, 2023 respectively:
|
| At February 3, 2024 |
|
| At January 28, 2023 |
| ||||||||||
Store Concept |
| Number of |
|
| Square |
|
| Number of |
|
| Square |
| ||||
(square footage in thousands) |
|
|
|
|
|
|
|
|
|
|
|
| ||||
DXL Retail |
|
| 232 |
|
|
| 1,725 |
|
|
| 218 |
|
|
| 1,663 |
|
DXL Outlet |
|
| 15 |
|
|
| 76 |
|
|
| 16 |
|
|
| 80 |
|
Casual Male XL Retail |
|
| 17 |
|
|
| 55 |
|
|
| 28 |
|
|
| 92 |
|
Casual Male XL Outlet |
|
| 19 |
|
|
| 57 |
|
|
| 19 |
|
|
| 57 |
|
Total Stores |
|
| 283 |
|
|
| 1,913 |
|
|
| 281 |
|
|
| 1,892 |
|
•
31
During fiscal 2023, we opened three new DXL stores, we completed the Number of Stores: DXL Retail DXL Outlet Casual Male Casual Male Total Stores At January 28, 2023 218 16 28 19 281 New stores 3 — — — 3 Conversion in place 11 — (11 ) — — Closed retail stores — (1 ) — — (1 ) At February 3, 2024 232 15 17 19 283 Our capital expenditures for fiscal 2023 were $17.4 million, as compared to $9.6 million in fiscal 2022. The capital expenditures for fiscal 2023 primarily related to stores, information technology projects, distribution center and facilities. We believe that our store portfolio is a vital asset to our business strategy and we expect to invest in stores over the next several years as we strengthen the store portfolio. Over the next three to five years, we believe we could potentially open approximately 50 net new DXL stores across the country, which could average 6,000 square feet or 300,000 sq. ft. in total, a 15% increase over our current square footage. For fiscal 2024, our plan is to open 8 new stores, convert 5 of our remaining Casual Male XL stores to DXL stores and remodel 5 of our existing DXL stores. We expect our capital expenditures to range from $22.0 million to $25.0 million in fiscal 2024. Non-GAAP Reconciliations We monitor certain non-GAAP financial measures on a regular basis in order to track the progress of our business, including the measures below. We believe these measures provide helpful information with respect to the Company’s Free Cash Flow Free cash flow is a metric that management uses to monitor liquidity. Management believes this metric is important to investors, because it demonstrates the Company’s ability to maintain liquidity while supporting its capital projects and new store growth. We calculate free cash flow as cash flow provided by operating activities less capital expenditures. Free cash flow excludes the mandatory and discretionary repayment of debt. The following table provides a reconciliation of free cash flow: (in millions) Fiscal 2023 Fiscal 2022 Cash flow from operating activities (GAAP) $ 49.6 $ 59.9 Capital expenditures (17.4 ) (9.6 ) Free cash flow (non-GAAP) $ 32.2 $ 50.3 Adjusted Net Income and Adjusted Net Income Per Diluted Share Adjusted net income and adjusted net income per diluted share is calculated by excluding any asset impairment charge (gain) and the loss from the termination of retirement plans, subtracting the actual income tax provision (benefit) and applying an effective tax rate of 27%. The Company believes that this comparability is useful in comparing the actual results period to period. Adjusted net income per diluted share is then calculated by dividing the adjusted net income by the weighted average shares outstanding for the respective 32 period, on a diluted basis. The following table is a reconciliation of net income on a GAAP basis to adjusted net income, on a non-GAAP basis, for each fiscal year: Fiscal 2023 Fiscal 2022 $ Per diluted $ Per diluted (in thousands, except per share data) Net income (GAAP basis) $ 27.9 $ 0.43 $ 89.1 $ 1.33 Adjust: Loss from termination of retirement plans 5.7 — Impairment (gain) of assets 0.1 (0.2 ) Add back actual income tax provision (benefit) 10.5 (30.8 ) Income tax provision, assuming normal tax rate of 27% (11.9 ) (15.7 ) Adjusted net income, non-GAAP basis $ 32.3 $ 0.50 $ 42.5 $ 0.63 Weighted average number of common shares 64.3 66.9 Adjusted EBITDA and Adjusted EBITDA Margin Adjusted EBITDA and adjusted EBITDA margin are presented because we believe that these measures are useful to investors in evaluating our performance. Management uses adjusted EBITDA as a key metric to measure profitability and economic productivity. Adjusted EBITDA is calculated as earnings before interest, taxes, depreciation and amortization and before any impairment (gain) of assets and the loss on termination of retirement plans. Adjusted EBITDA margin is calculated as adjusted EBITDA divided by sales. The following table is a reconciliation of net income on a GAAP basis to adjusted EBITDA and adjusted EBITDA margin, on a non-GAAP basis, for each fiscal year: (in thousands, except percentages) Fiscal 2023 Fiscal 2022 Net income, on a GAAP basis $ 27.9 $ 89.1 Add back: Impairment (gain) of assets 0.1 (0.2 ) Loss on termination of retirement plans 5.7 — Provision (benefit) for income taxes 10.5 (30.8 ) Interest (income) expense, net (2.1 ) 0.3 Depreciation and amortization 13.8 15.4 Adjusted EBITDA, on a non-GAAP basis $ 55.9 $ 73.8 Sales $ 521.8 $ 545.8 Adjusted EBITDA margin, on a non-GAAP basis: 10.7 % 13.5 % CRITICAL ACCOUNTING POLICIES; USE OF ESTIMATES Our financial statements are based on the application of significant accounting policies, many of which require our management to make significant estimates and assumptions (see Note A to the Consolidated Financial Statements). We believe that the following items involve some of the more critical judgments in the application of accounting policies that currently affect our financial condition and results of operations. Long-Term Incentive Plans Stock awards are primarily granted pursuant to our Long-Term Incentive Plans (“LTIPs”). During fiscal 2023, we had three active LTIPs: the 2021-2023 LTIP, the 2022-2024 LTIP and the 2023-2025 LTIP. See Note H to the Consolidated Financial Statements for additional discussion of our LTIPs. Awards under each LTIP consist of 50% time-based awards and 50% performance-based awards. All time-based awards are amortized over each LTIP’s respective vesting periods. The performance-based component of each LTIP is a dollar-denominated award, settled in a variable number of equity awards and/or cash awards. Any award will only be granted if such performance targets are achieved. Accordingly, each quarter the Company 33 reviews its expected achievement against such performance targets to assess whether an accrual is necessary. The performance metric for each of these LTIPs is a three-year total shareholder return against peers. As such, the accruals are based on projections that extend beyond a year and are subject to change quarter to quarter based on actual performance. All accruals are recorded as a liability. If performance targets are achieved and equity awards are granted, the related cost of those awards will be reclassified from the accrual to stock-based compensation The performance targets under the 2021-2023 LTIP were achieved at the end of fiscal 2023. Awards granted pursuant to this achievement will be subject to further vesting through August 31, 2024. Accordingly, at February 3, 2024, $2.5 million of the expected $3.0 million award was accrued. With respect to the performance-based component of the 2022-2024 LTIP and the 2023-2025 LTIP, which approximate $2.4 million and $2.5 million, respectively, at target, awards will be granted at the end of the respective performance period if the performance targets are achieved. Through the end of fiscal 2023, we accrued approximately $1.6 million for performance under the 2022-2024 LTIP, and there was no accrual for performance under the 2023-2025 LTIP. Impairment of Long-Lived Assets We evaluate property and equipment and operating lease right-of-use assets for impairment when facts and circumstances indicate that the carrying values of such assets may not be recoverable. Our judgment regarding the identification of impairment indicators is based on operational performance at the store level. Factors considered by us that could result in an impairment triggering event include significant changes in the use of assets, a current period operating or cash flow loss, underperformance of a store relative to historical or expected operating results, and an accumulation of costs significantly in excess of the amount originally expected for the construction of the long-lived store assets. We will recognize an impairment when the undiscounted cash flow estimated to be generated by those assets is less than the assets’ carrying amount. If actual market conditions are less favorable than management’s projections, future write-offs may be necessary. The model for undiscounted future cash flows includes In addition, any subsequent gains recognized in connection with a store closure related to a previously recorded operating lease right-of-use asset impairment will be included as an offset to impairment charges, with the remainder of the gain included as a reduction in store occupancy costs. See Note A to the Consolidated Financial Statements. For fiscal 2023 and fiscal 2022, we recorded an impairment charge (gain) of $0.1 million and $(0.2) million, respectively, within Impairment (Gain) of Assets on the Consolidated Statements of Operations. RECENT ACCOUNTING PRONOUNCEMENTS We have reviewed accounting pronouncements and interpretations thereof that 34 Item 7A. Quantitative and Qualitative Disclosures About Market Risk In the normal course of business, our financial position and results of operations are routinely subject to a variety of risks, including market risk associated with interest rate movements on borrowings. We regularly assess these risks and have established policies and business practices to protect against the adverse effects of these and other potential exposures. Interest Rates Our exposure to market risk for changes in interest rates relates primarily to our investments, which consists of cash equivalents and short-term investments at February 3, 2024. The primary objective of our investment activities is to preserve principal. This is accomplished by investing in money market accounts and U.S. treasury bills. We do not use derivative financial instruments. Due to the nature of our investments, we do not expect our operating results or cash flows to be affected to any significant degree by any change in market interest rates. At February 3, 2024, approximately $6.0 million of our cash equivalents were invested in U.S. treasury bills and $17.2 million in money market accounts. At February 3, 2024, we also had $32.5 million in short-term investments, invested in U.S. treasury bills. During fiscal 2023, we utilized cash from operations to fund our working capital needs. We have a Credit Facility that can also be used, if needed. The Credit Facility is not used for trading or speculative purposes. In addition, under our Credit Facility we have available letters of credit as sources of financing for our 35 Item 8. Financial Statements and Supplementary Data Destination XL Group, Inc. INDEX TO CONSOLIDATED FINANCIAL STATEMENTS Page Report of Independent Registered Public Accounting Firm (KPMG LLP, Boston, MA, Auditor Firm ID: 185) Consolidated Balance Sheets at February 3, 2024 and January 28, 2023 39 40 Consolidated Statements of Comprehensive Income for the Fiscal Years Ended February 3, 2024, 41 Consolidated Statements of Changes in Stockholders’ Equity (Deficit) for the Fiscal Years Ended 42 Consolidated Statements of Cash Flows for the Fiscal Years Ended February 3, 2024, January 28, 2023 43 44 We have audited the accompanying consolidated balance sheets of Destination XL Group, Inc. and We also have audited, in accordance with the standards of the Public Company Accounting Oversight Board (United States) (PCAOB), the Company’s internal control over financial reporting as of February 3, 2024, based on criteria established in Internal Control – Integrated Framework (2013) issued by the Committee of Sponsoring Organizations of the Treadway Commission, and our report dated March 21, 2024 expressed an unqualified opinion on the effectiveness of the Company’s internal control over financial reporting. Basis for Opinion These consolidated financial statements are the responsibility of the Company’s management. Our responsibility is to express an opinion on these consolidated financial statements based on our audits. We are a public accounting firm registered with the PCAOB and are required to be independent with respect to the We conducted our audits in accordance with the standards of the PCAOB. Those standards require that we plan and perform the audit to obtain reasonable assurance about whether the Critical Audit Matter The Impairment of long-lived store assets As discussed in Note A to the consolidated financial statements, the Company reviews its long-lived assets for events or changes in circumstances that might indicate the carrying amount of the We identified the assessment of impairment triggering events related to long-lived store assets, specifically property and equipment and operating lease right-of-use assets, as The Metric Award % for Metric other than Mr. Gaeta and Ms. Surette Award % Weight of Metric for Mr. Gaeta Award % Weight of Metric for Ms. Surette Minimum/Maximum Potential Payout 2022 Target 2022 Actual Payout % earned Corporate Target 1 Sales 40.0% 20.0% 20.0% 100% payout at target, with 50% payout at 96.2% of target and 150% payout at 101.9% of target, with the exception of Mr. Kanter who was eligible for maximum payout of 200% at 101.9% of target. $520.0 million $545.8 million 150.0% (200.0% for Mr. Kanter) Corporate Target 2 Adjusted EBITDA(1) 40.0% 20.0% 20.0% 100% payout at target, with 50% payout at 94.3% of target and 150% payout at 103.9% of target, with the exception of Mr. Kanter who was eligible for a maximum payout of 200% at 103.9% of target. $53.0 million $73.8 million 150.0% (200.0% for Mr. Kanter) Department goals, if applicable Store Operations -- 15.0% -- Store conversion (2) (2) 150.0% 15.0% Payroll as a % of sales (2) (2) 150.0% 10.0% Net promoter score (NPS) 74 76 150.0% Merchandise 10.0% Sales by category (2) (2) 150.0% Planning & Allocations -- -- 10.0% Gross margin by category (2) (2) 139.6% 10.0% Inventory turnover (2) (2) 150.0% 10.0% Store conversion (2) (2) 150.0% Personal Target 3 Discretionary – Personal Goals 20.0% 20.0% 20.0% Discretionary, at target, based upon individual performance, as evaluated by the CEO (except with respect to the CEO whose individual performance was evaluated by the Compensation Committee). Participants were eligible to receive a discretionary award up to 30%, with the exception of Mr. Kanter who was eligible to receive a discretionary award up to 40%. (3) Varies by NEO Varies by NEO 25.0%-30.0% (40.0% for Mr. Kanter) Named Executive Officer Payout at Total Total Cash Payout Harvey S. Kanter $ 830,539 200 % $ 1,661,077 Peter H. Stratton, Jr. $ 241,609 150 % $ 362,413 Anthony J. Gaeta $ 158,221 145 % $ 229,421 Robert S. Molloy $ 192,471 145 % $ 279,083 Allison Surette $ 152,866 149 % $ 227,702 impairment triggering events. This included a control related to the Company’s assessment of (1) stores with current period operating or cash flow losses, and (2) underperforming stores relative to historical operating results. For certain stores, we evaluated the Company’s analysis of potential impairment triggering events by comparing actual operating and cash flow results to historical results and the remaining net book value of store assets. We also reviewed Board of Directors' meeting minutes and available analyst information to assess the Company’s identification and evaluation of potential triggering events. We have served as the Company’s auditor since2013. Boston, Massachusetts March 21, 2024 38 DESTINATION XL GROUP, INC. CONSOLIDATED BALANCE SHEETS February 3, 2024 and January 28, 2023 (In thousands, except share data) February 3, 2024 January 28, 2023 (Fiscal 2023) (Fiscal 2022) ASSETS Current assets: Cash and cash equivalents $ 27,590 $ 52,074 Short-term investments 32,459 — Accounts receivable 3,920 1,720 Inventories 80,968 93,004 Prepaid expenses and other current assets 8,308 7,214 Total current assets 153,245 154,012 Noncurrent assets: Property and equipment, net of accumulated depreciation and amortization 43,238 39,062 Operating lease right-of-use assets 138,118 124,356 Deferred income taxes, net of valuation allowance 21,533 31,455 Intangible assets 1,150 1,150 Other assets 457 563 Total assets $ 357,741 $ 350,598 LIABILITIES AND STOCKHOLDERS' EQUITY Current liabilities: Accounts payable $ 17,353 $ 27,548 Accrued expenses and other current liabilities 35,302 36,875 Operating leases, current 37,221 37,329 Total current liabilities 89,876 101,752 Long-term liabilities: Operating leases, noncurrent 117,316 106,912 Other long-term liabilities 1,596 4,706 Total long-term liabilities 118,912 111,618 Commitments and contingencies Stockholders' equity: Preferred stock, $0.01 par value, 1,000,000 shares authorized, none issued — — Common stock, $0.01 par value, 125,000,000 shares authorized, 79,033,378 and 78,229,861 shares issued at February 3, 2024 and January 28, 2023, respectively 790 782 Additional paid-in capital 325,202 321,516 Treasury stock at cost, 21,041,661 shares and 15,625,172 shares at February 3, 2024 and January 28, 2023, respectively (130,137 ) (105,386 ) Accumulated deficit (46,902 ) (74,756 ) Accumulated other comprehensive loss - (4,928 ) Total stockholders' equity 148,953 137,228 Total liabilities and stockholders' equity $ 357,741 $ 350,598 The accompanying notes are an integral part of the consolidated financial statements. 39 DESTINATION XL GROUP, INC. CONSOLIDATED STATEMENTS OF OPERATIONS For the fiscal years ended February 3, 2024, January 28, 2023 (In thousands, except per share data) February 3, 2024 January 28, 2023 January 29, 2022 (Fiscal 2023) (Fiscal 2022) (Fiscal 2021) Sales $ 521,815 $ 545,838 $ 505,021 Cost of goods sold, including occupancy costs 269,393 273,240 255,197 Gross profit 252,422 272,598 249,824 Expenses: Selling, general and administrative 196,529 198,790 172,962 Impairment (gain) of assets 116 (159 ) (2,344 ) Depreciation and amortization 13,833 15,381 17,226 Total expenses 210,478 214,012 187,844 Operating income 41,944 58,586 61,980 Loss from termination of retirement plans (5,690 ) — — Interest income (expense), net 2,137 (251 ) (4,350 ) Income before provision (benefit) for income taxes 38,391 58,335 57,630 Provision (benefit) for income taxes 10,537 (30,788 ) 917 Net income $ 27,854 $ 89,123 $ 56,713 Net income per share - basic $ 0.46 $ 1.42 $ 0.89 Net income per share - diluted $ 0.43 $ 1.33 $ 0.83 Weighted-average number of common shares outstanding: Basic 61,018 62,825 63,401 Diluted 64,305 66,890 68,031 The accompanying notes are an integral part of the consolidated financial statements. 40 DESTINATION XL GROUP, INC. CONSOLIDATED STATEMENTS OF COMPREHENSIVE INCOME For the fiscal years ended February 3, 2024, January 28, 2023 and January 29, 2022 (In thousands) February 3, 2024 January 28, 2023 January 29, 2022 (Fiscal 2023) (Fiscal 2022) (Fiscal 2021) Net income $ 27,854 $ 89,123 $ 56,713 Other comprehensive income (loss) before taxes: Recognition of accumulated foreign currency translation adjustment — 66 — Foreign currency translation — (7 ) (62 ) Retirement plans (167 ) 704 758 Recognized loss from termination of retirement plans 5,690 — — Other comprehensive income before taxes 5,523 763 696 Tax provision related to items of other comprehensive income (595 ) (166 ) — Other comprehensive income, net of tax 4,928 597 696 Comprehensive income $ 32,782 $ 89,720 $ 57,409 The accompanying notes are an integral part of the consolidated financial statements. 41 DESTINATION XL GROUP, INC. CONSOLIDATED STATEMENTS OF CHANGES IN STOCKHOLDERS’ EQUITY (DEFICIT) For the fiscal years ended February 3, 2024, January 28, 2023 and January 29, 2022 (In thousands) Accumulated Additional Other Common Stock Paid-in Treasury Stock Accumulated Comprehensive Shares Amounts Capital Shares Amounts Deficit Income (Loss) Total Balance at January 30, 2021 64,656 $ 647 $ 314,747 (12,755 ) $ (92,658 ) $ (220,592 ) $ (6,221 ) $ (4,077 ) Issuance of common stock through private direct offering, net of offering costs 11,111 111 4,264 — — — — 4,375 Stock compensation expense — — 1,229 — — — — 1,229 Issuance of common stock, upon RSUs and PSUs release 788 8 (8 ) — — — — — Exercise of stock options 522 5 771 — — — — 776 Shares withheld for taxes related to net share settlement (285 ) (3 ) (1,864 ) — — — — (1,867 ) Board of directors' compensation 233 2 372 — — — — 374 Accumulated other comprehensive income (loss): Unrecognized gain associated with Pension Plan — — — — — — 758 758 Foreign currency — — — — — — (62 ) (62 ) Net income — — — — — 56,713 — 56,713 Balance at January 29, 2022 77,025 $ 770 $ 319,511 (12,755 ) $ (92,658 ) $ (163,879 ) $ (5,525 ) $ 58,219 Stock compensation expense — — 1,384 — — — — 1,384 RSUs granted for achievement of performance-based compensation, reclassified from liability to equity — — 1,138 — — — — 1,138 Issuance of common stock, upon RSUs release 584 6 (6 ) — — — — — Exercise of stock options 907 9 830 — — — — 839 Shares withheld for taxes related to net share settlement (390 ) (4 ) (1,841 ) — — — — (1,845 ) Repurchase of common stock — — — (2,870 ) (12,728 ) — — (12,728 ) Board of directors' compensation 104 1 500 — — — — 501 Accumulated other comprehensive income (loss): Unrecognized gain associated with Pension Plan, net of taxes — — — — — — 538 538 Foreign currency, net of taxes — — — — — — (7 ) (7 ) Recognition of accumulated foreign currency translation adjustment (Note A) — — — — — — 66 66 Net income — — — — — 89,123 — 89,123 Balance at January 28, 2023 78,230 $ 782 $ 321,516 (15,625 ) $ (105,386 ) $ (74,756 ) $ (4,928 ) $ 137,228 Stock compensation expense — — 2,496 — — — — 2,496 RSUs granted for achievement of performance-based compensation, reclassified from liability to equity — — 1,146 — — — — 1,146 Issuance of common stock, upon RSUs release 538 5 (5 ) — — — — — Exercise of stock options 329 3 365 — — — — 368 Shares withheld for taxes related to net share settlement (153 ) (1 ) (758 ) — — — — (759 ) Repurchase of common stock — — — (5,416 ) (24,751 ) — — (24,751 ) Board of directors' compensation 89 1 442 — — — — 443 Other comprehensive income — — — — — — 4,928 4,928 Net income — — — — — 27,854 — 27,854 Balance at February 3, 2024 79,033 $ 790 $ 325,202 (21,041 ) $ (130,137 ) $ (46,902 ) $ — $ 148,953 The accompanying notes are an integral part of the consolidated financial statements. 42 DESTINATION XL GROUP, INC. CONSOLIDATED STATEMENTS OF CASH FLOWS For the fiscal years ended February 3, 2024, January 28, 2023 and January 29, 2022 (In thousands) February 3, 2024 January 28, 2023 January 29, 2022 (Fiscal 2023) (Fiscal 2022) (Fiscal 2021) Cash flows from operating activities: Net income $ 27,854 $ 89,123 $ 56,713 Adjustments to reconcile net income to net cash provided by operating activities: Loss from retirement plan terminations 5,690 — — Recognition of accumulated foreign currency translation adjustment — 66 — Amortization and write-off of deferred debt issuance costs 77 76 1,179 Impairment (gain) of assets 116 (159 ) (2,344 ) Depreciation and amortization 13,833 15,381 17,226 Gain on sale of equipment (107 ) — — Deferred taxes, net of valuation allowance 9,329 (31,624 ) — Stock compensation expense 2,496 1,384 1,229 Board of directors' stock compensation 443 501 374 Changes in operating assets and liabilities: Accounts receivable (2,786 ) 390 4,306 Inventories 12,036 (11,240 ) 3,264 Prepaid expenses and other current assets (1,094 ) (599 ) (2,926 ) Other assets 29 (80 ) 407 Accounts payable (10,195 ) 2,383 (1,926 ) Operating leases, net (3,563 ) (7,510 ) (14,959 ) Accrued expenses and other liabilities (4,564 ) 1,852 12,998 Net cash provided by operating activities 49,594 59,944 75,541 Cash flows from investing activities: Additions to property and equipment, net (17,418 ) (9,642 ) (5,272 ) Proceeds from sale of equipment 145 — — Purchase of short-term investments (79,883 ) — — Maturity of short-term investments 48,010 — — Net cash used for investing activities (49,146 ) (9,642 ) (5,272 ) Cash flows from financing activities: Repurchase of common stock (24,541 ) (12,728 ) — Proceeds from issuance of common stock from private direct offering, net of offering costs — — 4,375 Proceeds from new FILO loan — — 17,500 Repayment of FILO loans — — (32,500 ) Borrowings under credit facility — — 40,297 Repayments under credit facility — — (100,030 ) Debt extinguishment costs — — (1,111 ) Debt issuance costs — — (1,200 ) Proceeds from the exercise of stock options 368 839 776 Tax withholdings paid related to net share settlements (759 ) (1,845 ) (1,867 ) Net cash used for financing activities (24,932 ) (13,734 ) (73,760 ) Net increase (decrease) in cash and cash equivalents (24,484 ) 36,568 (3,491 ) Cash and cash equivalents: Beginning of period 52,074 15,506 18,997 End of period $ 27,590 $ 52,074 $ 15,506 The accompanying notes are an integral part of the consolidated financial statements. 43 DESTINATION XL GROUP, INC. NOTES TO CONSOLIDATED FINANCIAL STATEMENTS FEBRUARY 3, 2024 A. SUMMARY OF SIGNIFICANT ACCOUNTING POLICIES Nature of Business Destination XL Group, Inc. (collectively with its subsidiaries referred to as the “Company”) is the largest specialty retailer in the United States of big & tall men’s clothing and shoes. The Company operates under the trade names of Destination XL®, DXL®, DXL Men’s Apparel, DXL Outlets®, Casual Male XL® and Casual Male XL Outlets. At February 3, 2024, the Company operated 232 DXL stores, 17 Casual Male XL stores, 19 Casual Male XL outlets and 15 DXL outlets located throughout the United States, including an e-commerce site, www.dxl.com, and a mobile app. Basis of Presentation The consolidated financial statements include the accounts of the Company and its subsidiaries. All significant intercompany accounts, transactions and profits are eliminated. The accompanying financial statements have been prepared in accordance with accounting principles generally accepted in the United States. The preparation of financial statements in conformity with generally accepted accounting principles requires management to make estimates and assumptions that affect the reported amounts of assets and liabilities and disclosures of contingent liabilities as of the date of the financial statements and the reported amounts of revenue and expenses during the reporting period. Actual results could differ from estimates. Segment Reporting The Company has two principal operating segments: its stores and its direct business. The Company considers its stores and direct operating segments to be similar in terms of economic characteristics, production processes and operations, and has therefore aggregated them into one reportable segment, retail segment, consistent with its integrated commerce business approach. Fiscal Year The Company’s fiscal year is a 52-week or 53-week period ending on the Saturday closest to January 31. Fiscal 2023 was a 53-week period which ended on February 3, 2024. Fiscal 2022 and fiscal 2021 were each 52-week periods, which ended on January 28, 2023, January 29, 2022, respectively. Cash and Cash Equivalents Cash and cash equivalents consist of cash in banks and short-term investments, which have a maturity of ninety days or less when acquired. Included in cash equivalents are credit card and debit card receivables from banks, which generally settle within two to four business days. Short-Term Investments Short-term investments consist of those investments that have a maturity date, when acquired, that is greater than three months and twelve months or less. These investments are classified as held-to-maturity and are carried at amortized cost, which approximates fair value due to the short period between purchase and maturity. Concentration of Credit Risk Cash and cash equivalents include amounts due from third party financial institutions, which from time to time, may be in excess of the Federal Deposit Insurance Corporation (“FDIC”) insurance limits. The Company is potentially exposed to a concentration of credit risk when cash and cash equivalent deposits in these financial institutions are in excess of FDIC limits. The Company considers the credit risk associated with these financial instruments to be minimal as cash and cash equivalents are held by financial institutions with high credit ratings and it has not historically sustained any credit losses associated with our cash and cash equivalents balances. In addition, its cash and cash equivalents and short-term investments include money market accounts with Citizens Bank, N.A. and investments in U.S. government-backed securities. 44 Accounts Receivable Accounts receivable primarily include amounts due for rebates from certain vendors. For fiscal 2023, fiscal 2022 and fiscal 2021, the Fair Value of Financial Instruments Accounting Standards Codification (“ASC”) Topic 825, Financial Instruments, requires disclosure of the fair value of certain financial instruments. The carrying amounts of cash and cash equivalents, short-term investments, accounts receivable, accounts payable and accrued expenses approximate fair value because of the short maturity of these instruments. See Note K - Fair Value Measurement for information regarding the fair value of certain financial assets. ASC Topic 820, Fair Value Measurements and Disclosures, defines fair value, establishes a framework for measuring fair value and enhances disclosures about fair value measurements. The valuation techniques utilized are based upon observable and unobservable inputs. Observable inputs reflect market data obtained from independent sources, while unobservable inputs reflect internal market assumptions. These two types of inputs create the following fair value hierarchy: Level 1 – Quoted prices in active markets for identical assets or liabilities. Level 2 – Observable inputs other than Level 1 prices such as quoted prices for similar assets or liabilities; quoted prices in markets that are not active or other inputs that are observable or can be corroborated by observable market data for substantially the full term of the related asset or liabilities. Level 3 – Unobservable inputs that are supported by little or no market activity and that are significant to the fair value of assets or liabilities. The Company utilizes observable market inputs (quoted market prices) when measuring fair value whenever possible. Stores that have indicators of impairment and fail the recoverability test (based on undiscounted cash flows) are measured for impairment by comparing the fair value of the assets against their carrying value. Fair value of the assets is estimated using a projected discounted cash flow analysis and is classified within Level 3 of the valuation hierarchy. See Impairment of Long-Lived Assets below. Inventories All inventories are valued at the lower of cost or market, using a weighted-average cost method. Property and Equipment Property and equipment are stated at cost. Major additions and improvements are capitalized while repairs and maintenance are charged to expense as incurred. Upon retirement or other disposition, the cost and related accumulated depreciation of the assets are removed from the accounts and the resulting gain or loss, if any, is reflected in the results of operations. Depreciation is computed on the straight-line method over the assets’ estimated useful lives as follows: Furniture and fixtures Five to ten years Equipment Five to ten years Leasehold improvements Lesser of useful lives or related lease term Hardware and software Three to seven years Intangibles Domain Name In fiscal 2018, the Company purchased the rights to the domain name “dxl.com.” The domain name has a carrying value of $1.2 million and is considered an indefinite-lived asset. At each reporting period, management analyzes current events and circumstances to determine whether the indefinite life classification continues to be valid. 45 Advertising Costs The Company expenses in-store advertising costs as incurred. Creative production costs, if any, are expensed in the period in which the advertising is first aired and media costs are expensed as incurred. Direct response advertising costs, if any, are expensed in the period in which the mailing occurs. There were no deferred direct response costs at February 3, 2024 and January 28, 2023. Advertising expense, which is included in selling, general and administrative expenses, was $30.9 million, $32.5 million and $24.0 million for fiscal 2023, fiscal 2022 and fiscal 2021, respectively. Revenue Recognition The Company’s accounting policies with respect to revenue recognition are discussed in Note B, “Revenue Recognition.” Foreign Currency Translation During fiscal 2022, the Company closed its store located in Toronto, Canada. Assets and liabilities for this store were translated into U.S. dollars at the exchange rates in effect at each balance sheet date. Stockholders’ equity was translated at applicable historical exchange rates. Income, expense and cash flow items were translated at average exchange rates during the period. Resulting translation adjustments were reported as a separate component of stockholders’ equity. Accordingly, in the fourth quarter of fiscal 2022, the Company recognized $66,000 related to the accumulated foreign currency transaction adjustment. See “Accumulated Other Comprehensive Income (Loss) – (“AOCI”)” below. Accumulated Other Comprehensive Income (Loss) – (“AOCI”) Other comprehensive income (loss) includes amounts related to foreign currency and pension plans and is reported in the Consolidated Statements of Comprehensive Income (Loss). Other comprehensive income (loss) and reclassifications from AOCI for fiscal 2023, fiscal 2022 and fiscal 2021 are as follows: Fiscal 2023 Fiscal 2022 Fiscal 2021 (in thousands) Retirement Plans Retirement Plans Foreign Total Retirement Plans Foreign Total Balance at beginning of fiscal year $ (4,928 ) $ (5,466 ) $ (59 ) $ (5,525 ) $ (6,224 ) $ 3 $ (6,221 ) Other comprehensive income (loss) (199 ) 568 (7 ) 561 799 (62 ) 737 Recognition of loss on retirement plan terminations, net of taxes (1) 5,052 — — — — — — Recognition of accumulated foreign currency translation adjustment (2) — — 66 66 — — — Amounts reclassified from accumulated 75 (30 ) — (30 ) (41 ) — (41 ) Other comprehensive income 4,928 538 59 597 758 (62 ) 696 Balance at end of fiscal year $ — $ (4,928 ) $ — $ (4,928 ) $ (5,466 ) $ (59 ) $ (5,525 ) 46 Income Taxes Metric Award % Award % Attributable to Metric for Mr. Gaeta Award % Attributable to Metric for Ms. Surette Minimum/Maximum Potential Payout TIER I - Company's Financial Performance Corporate Target 1 Sales 40.0% 20.0% 20.0% 100% payout at target, with 50% payout at 95.3% of target and 150% payout at 100.5% of target, with the exception of Mr. Kanter who is eligible for a maximum payout of 200% at 100.5% of target. Corporate Target 2 Adjusted EBITDA 40.0% 20.0% 20.0% 100% payout at target, with 50% payout at 91.6% of target and 150% payout at 102.3% of target, with the exception of Mr. Kanter who is eligible for a maximum payout of 200% at 102.3% of target. Personal Target Discretionary- Personal Goals 20.0% 20.0% 20.0% Discretionary, at target, based upon individual performance, as evaluated by the CEO (except with respect to the CEO whose individual performance will be evaluated by the Compensation Committee). Participants are eligible to receive a discretionary award up to 30%, with the exception of Mr. Kanter who is eligible to receive a discretionary award up to 40%. Departmental Goals, if applicable Store Operations - 40.0% - Includes payroll as a percentage of sales target, net promoter score target and store conversion target. Merchandise, Planning and Allocation - - 40.0% Includes targets for sales by category, gross margin rates by category, inventory turnover and store conversion target. Departmental goals payouts range from 50% to 150% dependent upon achievement of the various targets. TIER II - Measured Against the Company's 2023 Peers Corporate - Target 1 Comparable Sales 40.0% 40.0% 40.0% Top Quartile 100%; 2nd Quartile 75%; 3rd Quartile 50%; 4th Quartile no payout. Corporate - Target 2 Adjusted EBITDA Margin 40.0% 40.0% 40.0% Top Quartile 100%; 2nd Quartile 75%; 3rd Quartile 50%; 4th Quartile no payout. Personal Targets Discretionary- Personal Goals 20.0% 20.0% 20.0% Same as discussed above, except that elements of departmental goals will be factored in with respect to participants who have departmental goals under Tier I, including Mr. Gaeta and Ms. Surette. Deferred income taxes are provided to recognize the effect of temporary differences between tax and financial statement reporting. Such taxes are provided for using enacted tax rates expected to be in place when such temporary differences are realized. A valuation allowance is recorded to reduce deferred tax assets if it is determined that it is more likely than not that the full deferred tax asset would not be realized. If it is subsequently determined that a deferred tax asset will more likely than not be realized, a credit to earnings is recorded to reduce the allowance. See Note F, Income Taxes. ASC Topic 740, Income Taxes (“ASC 740”) clarifies a company’s accounting for uncertain income tax positions that are recognized in its financial statements and also provides guidance on a company’s de-recognition of uncertain positions, financial statement classification, accounting for interest and penalties, accounting for interim periods, and disclosure requirements. In accordance with ASC 740, the Company will recognize the benefit from a tax position only if it is more likely than not that the position would be sustained upon audit based solely on the technical merits of the tax position. The Company’s policy is to recognize accrued interest and penalties related to unrecognized tax benefits as income tax expense in its Consolidated Statement of Operations. The Company has not accrued or paid interest or penalties in amounts that were material to its results of operations for fiscal 2023, fiscal 2022 and fiscal 2021. The Net Income Per Share Basic earnings per share are computed by dividing net income by the weighted average number of shares of common stock outstanding during the respective period. Diluted earnings per share is determined by giving effect to unvested shares of deferred stock and restricted stock units (RSUs) and the exercise of stock options using the treasury stock method. The following table provides a reconciliation of the number of shares outstanding for basic and diluted earnings per share: FISCAL YEARS ENDED February 3, 2024 January 28, 2023 January 29, 2022 (in thousands) Common stock outstanding: Basic weighted average common shares 61,018 62,825 63,401 Common stock equivalents – stock options, 3,287 4,065 4,630 Diluted weighted average common shares 64,305 66,890 68,031 The following potential common stock equivalents were excluded from the computation of diluted earnings per share in each year because the exercise price of such options was greater than the average market price per share of common stock for the respective periods or because the unearned compensation associated with either stock options, RSUs, or deferred stock had an anti-dilutive effect. FISCAL YEARS ENDED February 3, 2024 January 28, 2023 January 29, 2022 (in thousands, except exercise prices) Stock options (time-vested) 85 102 302 RSUs (time-vested) 39 104 — Range of exercise prices of such options $4.48 - $6.59 $4.48 - $7.43 $4.19 -$5.50 Excluded from the computation of basic and diluted earnings per share were 573,000 shares for fiscal 2023 and 240,000 shares in fiscal 2022 and fiscal 2021 of unvested performance stock units. These performance-based awards will be included in the computation of basic and diluted earnings per share if, and when, the respective performance targets are achieved. In addition, deferred stock of 435,568 shares for all three fiscal periods were excluded from basic earnings per share. Outstanding shares of deferred stock are not considered 47 issued and outstanding until the vesting date of the deferral period and are excluded from basic earnings per share until such shares are issued. Stock-based Compensation ASC Topic 718, Compensation – Stock Compensation, requires measurement of compensation cost for all stock awards at fair value on the date of grant and recognition of compensation over the service period for awards expected to vest. The fair value of stock options is determined using the Black-Scholes valuation model and requires the input of subjective assumptions. These assumptions include estimating the length of time employees will retain their vested stock options before exercising them (the “expected term”), the estimated volatility of the Company’s common stock price over the expected term and the number of options that will ultimately not complete their vesting requirements (“forfeitures”). As required under the accounting rules, the Company reviews its valuation assumptions at each During fiscal 2023, the Company granted performance stock units. The fair value and derived service periods of the award were calculated using the Monte Carlo model. See Note I "Stock Compensation Plans" for more discussion regarding the performance metrics and the valuation assumptions used to calculate the fair value and derived service periods. The Company recognized total stock-based compensation expense of $2.5 million, $1.4 million and $1.2 million for fiscal 2023, fiscal 2022 and fiscal 2021, respectively. The increase in stock-based compensation in fiscal 2023 was primarily due to the grant of performance stock units in August 2023 that are being expensed over the derived service period, which was determined to be an average of 12.5 months. The total stock-based compensation cost related to time-vested awards not yet recognized as of February 3, 2024 was approximately $3.4 million and will be expensed over a weighted average remaining life of approximately 22 months. The total grant-date fair value of awards vested was $1.2 million, $2.5 million and $1.7 million for fiscal 2023, fiscal 2022 and fiscal 2021, respectively. Any excess tax benefits resulting from the exercise of stock options or the release of restricted shares were recognized as a component of income tax expense in the period in which they occurred. Valuation Assumptions - Stock Compensation The fair value of each option grant is estimated on the date of grant using the Black-Scholes option-pricing model based on the following assumptions in the table. The fair value of each non-vested share is equal to the closing price of the Company’s stock on the date of grant. The weighted-average fair value of options granted and non-vested shares granted shown below does not include shares granted to directors in lieu of compensation. Fiscal years ended: February 3, 2024 January 28, 2023 January 29, 2022 Expected volatility 86.3% - 92.1% 87.9% - 123.7% 97.4% - 104.9% Risk-free interest rate 3.71%-4.42% 2.52% - 4.41% 0.31% - 0.60% Expected life (in years) 2.5 2.0 - 3.5 3.0 - 4.0 Dividend rate - - - Weighted average fair value of options granted $3.24 $3.58 $0.47 Weighted average fair value of non-vested shares granted $4.47 $5.28 $0.66 Expected volatilities are based on historical volatilities of the Company’s common stock; the expected life represents the weighted average period of time that options granted are expected to be outstanding giving consideration to vesting schedules and historical exercise patterns; and the risk-free rate is based on the U.S. Treasury yield curve in effect at the time of grant for periods corresponding with the expected life of the option. Impairment of Long-Lived Assets The Company recorded an impairment charge of $0.1 million in fiscal 2023 and recorded a net gain of $0.2 million and $2.3 million in fiscal 2022 and fiscal 2021, respectively. 48 The Company reviews its long-lived assets for events or changes in circumstances that might indicate the carrying amount of the assets may not be recoverable. The Company’s judgment regarding the identification of impairment indicators is based on operational performance at the store level. Factors considered by the Company that could result in an impairment triggering event include significant changes in the use of assets, a current period operating For fiscal 2023, Leases The Company determines if an arrangement contains a lease at the inception of a contract. Right-of-use assets represent the Company’s right to use an underlying asset for the lease term and lease liabilities represent the Company’s obligation to make lease payments arising from the lease. Right-of-use (“ROU”) assets and lease liabilities are recognized at the commencement date based on the present value of the remaining future minimum lease payments, initial direct costs and any lease incentives are included in the value of those ROU assets. As the interest rate implicit in the Company’s leases is not readily determinable, the Company utilizes its incremental borrowing rate, based on information available at the lease measurement date, to determine the present value of future payments. The Company elected the lessee non-lease component separation practical expedient, which permits the Company to not separate non-lease components from the lease components to which they relate. The Company also made an accounting policy election that the recognition requirement of ASC 842 will The Company’s store leases typically contain options that permit renewals for additional periods of up to five years each. In general, for store leases with an initial term of 10 years or more, the options to extend are not considered reasonably certain at lease commencement. For store leases with an initial term of 5 years, the Company evaluates each lease independently and, when the Company considers it reasonably certain that it will exercise an option to extend, the associated payment of that option will be included in the measurement of the ROU asset and lease liability.Renewal options are not included in the lease term for automobile and equipment leases because they are not considered reasonably certain of being exercised at lease commencement. Renewal options were not considered for the Company’s corporate headquarters and distribution center lease, which was entered into in 2006 and was for an initial 20-year term. At the end of the initial term, the Company will have the opportunity to extend this lease for six additional successive periods of five years. For store leases, the Company accounts for lease components and non-lease components as a single lease component. Certain store leases may require additional payments based on sales volume, as well as reimbursement for real estate taxes, common area maintenance and insurance, and are expensed as incurred as variable lease costs. Other store leases contain one periodic fixed lease payment that includes real estate taxes, common area maintenance and insurance. These fixed payments are considered part of the lease payment and included in the ROU assets and lease liabilities. Tenant allowances are included as an offset to the right-of-use asset and amortized as reductions to rent expense over the associated lease term. See Note E "Leases" for additional information. 49 Recently Issued Accounting Pronouncements - Adopted In September 2022, the FASB issued Accounting Standards Update ("ASU") 2022-04, Liabilities – Supplier Finance Programs, which is intended to enhance the transparency surrounding the use of supplier finance programs in connection with the purchase of goods and services. The guidance requires companies that use supplier finance programs to make annual disclosures about the program’s key terms, the balance sheet presentation of related amounts, the confirmed amount outstanding at the end of the period and associated rollforward information. The new standard does not affect the recognition, measurement, or financial statement presentation of supplier finance program obligations. ASU 2022-04 was adopted in the first quarter of fiscal 2023, with the exception of the rollforward information, which is not effective until fiscal 2024. The adoption of ASU 2022-04 did not have a material effect on the Company's Consolidated Financial Statements as the Company does not participate in supplier finance programs. Recently Issued Accounting Pronouncements - Not Yet Adopted In July 2023, the FASB issued ASU 2023-03, Presentation of Financial Statements (Topic 205), Income Statement - Reporting Comprehensive Income (Topic 220), Distinguishing Liabilities from Equity (Topic 480), Equity (Topic 505), and Compensation - Stock Compensation (Topic 718): Amendments to SEC Paragraphs Pursuant to SEC Staff Accounting Bulletin No. 120, SEC Staff Announcement at In October 2023, the FASB issued ASU 2023-06, Disclosure Improvements: Codification Amendment in Response to the SEC’s Disclosure Update and Simplification Initiative. ASU-2023-06 incorporates several disclosure and presentation requirements currently residing in the SEC Regulations S-X and S-K. The amendments will In November 2023, the FASB issued ASU 2023-07, Segment Reporting (Topic 280), which requires all public entities to provide enhanced disclosures about significant segment expenses. The amendments in this ASU are to be applied retrospectively and are effective for our annual financial statements starting in fiscal 2025 and interim periods starting in fiscal 2026, with early adoption permitted. We are currently evaluating the impact of this accounting standard. In December 2023, the FASB issued ASU 2023-09, Income Taxes (Topic 740), which enhances transparency about income tax information through improvements to income tax disclosures primarily related to the rate reconciliation and income taxes paid and to improve the effectiveness of income tax disclosures. This ASU will be effective for fiscal year 2025, and allows for adoption on a prospective basis, with a retrospective option. Early adoption is permitted. We are currently evaluating the effect of adopting this new accounting standard. No other new accounting pronouncements, issued or effective during fiscal 2023, have had or are expected to have a significant impact on the Company’s Consolidated Financial Statements. B. REVENUE RECOGNITION Revenue is recognized in accordance with ASC 606, Revenue from Contracts with Customers. The Company operates as a retailer of big and tall men’s clothing, which includes sales through its stores and direct channels. Revenue is recognized by the operating segment that initiates a customer’s order. Store sales are defined as sales that originate and are fulfilled directly at Unredeemed Loyalty Coupons. The Company offers a free loyalty program to its customers for which points accumulate based on the purchase of merchandise. Under ASC 606, these loyalty points provide the customer with a material right and 50 Unredeemed Gift Cards, Gift Certificates, and Credit Vouchers. Upon issuance of a gift card, gift certificate, or credit voucher, a liability is established for its cash value. The liability is relieved and net sales are recorded upon redemption by the customer. Based on historical redemption patterns, the Company can reasonably estimate the amount of gift cards, gift certificates, and credit vouchers for which redemption is remote, which is referred to Shipping. Shipping and handling costs are accounted for as fulfillment costs and are included in cost of Disaggregation of Revenue As noted above under Segment Information in Note A, the Company’s business at February 3, 2024 consists of one reportable segment, its retail segment. Substantially all of the Company’s revenue is generated from its stores and direct businesses. In the first quarter of fiscal 2022, the Company ended its relationship with its primary wholesale customer. Accordingly, the Company has determined that the following sales channels depict the nature, amount, timing, and uncertainty of how revenue and cash flows are affected by economic factors for each of the following fiscal years: (in thousands) Fiscal 2023 Fiscal 2022 Fiscal 2021 Store sales $ 358,710 68.7% $ 375,618 68.9% $ 344,761 69.0% Direct sales 163,105 31.3% 169,821 31.1% 154,891 31.0% Retail segment 521,815 100.0% 545,439 100.0% 499,652 100.0% Wholesale segment — 399 5,369 Total sales $ 521,815 $ 545,838 $ 505,021 Property and equipment consisted of the following at the dates indicated: (in thousands) February 3, 2024 January 28, 2023 Furniture and fixtures $ 75,987 $ 74,784 Equipment 25,184 24,035 Leasehold improvements 122,555 115,258 Hardware and software 111,884 106,643 Construction in progress 7,560 5,659 343,170 326,379 Less: accumulated depreciation 299,932 287,317 Total property and equipment, net $ 43,238 $ 39,062 13.8 Additions to property and equipment that were included in accounts payable and accrued expenses at February 3, 2024, January 28, 2023 and January 29, 2022 were $2.3 million, $1.7 million, and $1.1 million, respectively. D. DEBT OBLIGATIONS Credit Agreement with Citizens Bank, N.A. On The 51 Effective April 20, 2023, borrowings under the Credit Facility bear interest at either a The Company’s obligations under the Credit Facility are secured by a lien on substantially all of its assets. If the Company’s availability under the Credit Facility at any time is less than the greater of (i) 10% of the Revolving Loan Cap (the lesser of the aggregate revolving commitments or the borrowing base) and At February 3, 2024, the Company Interest and Fees The Company paid interest and fees totaling $0.3 million, $0.4 million and $3.2 million for fiscal 2023, fiscal 2022 and fiscal 2021, respectively. Included in the $3.2 million for fiscal 2021 was a prepayment penalty of $1.1 million associated with the prepayment of its long-term FILO loan. E. LEASES The Company leases all of its store locations and its corporate headquarters, which also includes its distribution center, under operating leases. The store leases typically have initial terms of 10 years, with options that usually permit renewal for additional five-year periods. The initial term of the lease for the corporate headquarters is for 20 years, with the opportunity to extend for six additional consecutive periods of five years, beginning in fiscal 2026. The Company also leases certain equipment and other assets under operating leases, typically with initial terms of 3 to 5 years. The Company is generally obligated for the cost of property taxes, insurance and common area maintenance fees relating to its leases, which are considered variable lease costs and are expensed as incurred. ASC 842 requires the assessment of any lease modification to determine if the modification should be treated as a separate lease and if not, modification accounting would be applied. Lease modification accounting requires the recalculation of the ROU asset, lease liability and lease expense over the respective lease term. As of February 3, 2024, the Company’s operating leases liabilities represent the present value of the remaining future minimum lease payments updated based on concessions and lease modifications, as applicable. Lease costs related to store locations are included in cost of goods sold including occupancy costs on the Consolidated Statements of Operations, and expenses and lease costs related to the The following table is a Fiscal 2023 Fiscal 2022 Fiscal 2021 (in thousands) Operating lease cost $ 45,018 $ 44,297 $ 43,921 Variable lease costs(1) 12,849 12,885 13,290 Total lease costs $ 57,867 $ 57,182 $ 57,211 Supplemental cash flow and balance sheet information related to leases for fiscal 2023, fiscal 2022 and fiscal 2021 is as follows: 52 (in thousands) Fiscal 2023 Fiscal 2022 Fiscal 2021 Cash paid for amounts included in the measurement of lease liabilities: Operating cash flows for operating leases $ 51,411 $ 55,068 $ 57,816 Non-cash operating activities: Right-of-use assets obtained in exchange for operating lease liabilities $ 46,960 $ 26,239 $ 30,777 Weighted average remaining lease term 4.9 yrs. 4.3 yrs. 4.3 yrs. Weighted average discount rate 6.52 % 6.39 % 6.91 % The table below reconciles the (in thousands) 2024 $ 45,945 2025 42,651 2026 30,181 2027 22,765 2028 14,696 Thereafter 25,049 Total minimum lease payments $ 181,287 Less: amount of lease payments representing interest 26,750 Present value of future minimum lease payments $ 154,537 Less: current obligations under leases 37,221 Noncurrent lease obligations $ 117,316 As of February 3, 2024, the Company had entered into a ten-year store lease that has not yet commenced with aggregated estimated future lease payments of approximately $1.2 million, which are not included in the above table. The lease is expected to commence in the first quarter of fiscal 2024. F. INCOME TAXES The Company accounts for income taxes in accordance with ASC Topic 740, Income Taxes. Under ASC Topic 740, deferred tax assets and liabilities are recognized based on temporary differences between the financial statement and tax basis of assets and liabilities using enacted tax rates in effect in the years in which the differences are expected to reverse. The accounting standards require current recognition of net deferred tax assets to the extent it is more likely than not such net assets will be realized. To the extent that the Company believes its net deferred tax assets will not be realized, a valuation allowance must be recorded against those assets. Until the second quarter of fiscal 2022, the Company had maintained a full valuation allowance against its deferred tax assets since fiscal 2013. During the second quarter of fiscal 2022, the Company determined that it was more likely than not that it would be able to realize the benefit of substantially all of its deferred tax assets in the United States. In reaching this determination, the Company considered the cumulative three years of profitability, its six consecutive quarters of sales growth and profitability at the time of the assessment, its expectations regarding the generation of future taxable income and the ability to utilize the Company’s net operating loss (“NOLs”) carryforwards as well as the overall improvement in the Company's business, brand repositioning and current market position. As a result, for fiscal 2022, the valuation allowance against the Company's deferred tax assets decreased by $47.6 million, of which $31.6 million was recorded as a non-recurring tax benefit in fiscal 2022 related to the release of the valuation allowance on deferred tax assets expected to be realized in future periods. As a result of releasing substantially all of the valuation allowance against its deferred tax assets during fiscal 2022, the Company returned to a normal tax provision for fiscal 2023. At February 3, 2024 and January 28, 2023, the Company continued to provide a valuation allowance of $2.2 million and $2.4 million, respectively, primarily against certain state and foreign NOLs. As of February 3, 2024, for federal income tax purposes, the Company had net operating loss carryforwards of $3.6 million, which will expire in fiscal 2037 and net operating loss carryforwards of $39.9 million that are not subject to expiration. For state income tax purposes, the Company had $51.8 million of net operating losses that are available to offset future taxable income, the majority of which will expire from fiscal 2024 through fiscal 2045. Additionally, the Company has $5.3 million of net operating loss carryforwards related to the Company’s operations in Canada, which will expire from fiscal 2025 through fiscal 2041. The utilization of net operating loss carryforwards and the realization of tax benefits in future years depends predominantly upon having taxable income. Under the provisions of the Internal Revenue Code, certain substantial changes in the Company’s ownership may result in a limitation on the amount of net operating loss carryforwards and tax credit carryforwards, which may be used in future years. As of February 3, 2024, there has been no such ownership change. 53 The components of the net deferred tax assets as of February 3, 2024 and January 28, 2023 were as follows (in thousands): February 3, 2024 January 28, 2023 Deferred tax assets, net: Net operating loss carryforward $ 13,522 $ 21,736 Accrued expenses and other 4,776 5,597 Operating lease liabilities 40,182 37,793 Goodwill and intangibles (103 ) (62 ) Unrecognized loss on pension and pension expense — 1,714 Inventory reserves 866 900 Foreign tax credit carryforward 486 486 Federal wage tax credit carryforward 824 824 State tax credits 147 147 Operating lease right-of-use assets (35,937 ) (32,583 ) Property and equipment (985 ) (2,672 ) Subtotal $ 23,778 $ 33,880 Valuation allowance (2,245 ) (2,425 ) Net deferred tax assets $ 21,533 $ 31,455 For fiscal 2023, the Company had total deferred tax assets of $60.8 million, total deferred tax liabilities of $37.0 million and a valuation allowance of $2.2 million. The FISCAL YEARS ENDED February 3, 2024 January 28, 2023 January 29, 2022 (in thousands) Current: Federal $ — $ — $ — State 1,200 830 912 Foreign 8 6 5 1,208 836 917 Deferred: Federal 7,911 (24,794 ) — State 1,418 (6,830 ) — Foreign — — — 9,329 (31,624 ) — Total provision (benefit) $ 10,537 $ (30,788 ) $ 917 The following is a reconciliation between the statutory and effective income tax rates in dollars for the FISCAL YEARS ENDED February 3, 2024 January 28, 2023 January 29, 2022 (in thousands) Federal income tax at the statutory rate $ 8,086 $ 12,250 $ 12,102 State taxes, net of federal tax benefit 1,000 656 721 State deferred taxes, net of federal benefit 1,418 1,558 — Section 162(m) limitation 746 1,451 1,375 Permanent items (199 ) (1,002 ) (893 ) Taxes stranded in OCI released with termination of retirement plans 890 — — Change in valuation allowance (1) (179 ) (47,594 ) (12,421 ) Adjustment to §382 NOLs (1,159 ) 1,159 — Other, net (66 ) 734 33 Total provision (benefit) $ 10,537 $ (30,788 ) $ 917 Metric Weight of each target Potential Payout Target Actual Payout % 3-yr. relative total shareholder return as compared to 2020 disclosed proxy peers 100.0% 100% payout at target (2nd quartile), with 50% payout (3rd quartile) and 150% payout (1st quartile). No payout in the 4th quartile. 2nd quartile 1st quartile 150.0 % As discussed in Note A, the Company’s financial statements reflect the expected future tax consequences of uncertain tax positions that the Company has taken or expects to take on a tax return, based solely on the The following table shows the liability for unrecognized tax benefits that were associated with a prior tax position related to exiting the FISCAL YEARS ENDED February 3, 2024 January 28, 2023 January 29, 2022 (in thousands) Balance at the beginning of the fiscal year $ 2,000 $ 2,000 $ 2,000 Changes due to tax positions from current year — — — Changes due to tax positions from prior years (2,000 ) — — Changes due to lapsing of statute of limitations — — — Balance at the end of the fiscal year $ — $ 2,000 $ 2,000 The Company made tax payments of $1.6 million, $0.5 million, and $0.6 million for fiscal 2023, fiscal 2022, and fiscal 2021, respectively. The Inflation Reduction Act of 2022, which was signed into law in 2022, contains a provision that includes a 1% excise tax on G. COMMITMENTS AND CONTINGENCIES At February 3, 2024 the Company was obligated under operating leases covering store and office space, and certain equipment for future minimum rentals. See Note E, “Leases” for the schedule of future remaining lease obligations. In addition to its lease obligations, the Company is also contractually committed pursuant to a merchandise purchase obligation to meet minimum purchases of $10.0 million annually through fiscal 2028. The Company is subject to various legal proceedings and claims that arise in the H. LONG-TERM INCENTIVE PLANS The following is a summary of the Company’s Long-Term Incentive Plan (“LTIP”). All equity awards granted under these long-term incentive plans were issued from the Company’s stockholder-approved 2016 Incentive Compensation Plan. See Note I, “Stock Compensation Plans.” At February 3, 2024, the Company has three active LTIPs: 2021-2023 LTIP, 2022-2024 LTIP and 2023-2025 LTIP. Each participant in the plan participates based on that participant’s “Target Cash Value” which is defined as the participant’s annual base salary (on the participant’s effective date) multiplied by his or her LTIP percentage. Under each LTIP, 50% of each participant’s Target Cash Value is subject to Performance targets for the 2021-2023 LTIP, 2022-2024 LTIP and the 2023-2025 LITP were established and approved by the Compensation Committee on March 55 Assuming that the Company achieves the performance targets at target levels and all time-based awards vest, the compensation expense associated with the 2021-2023 LTIP, 2022-2024 LTIP and 2023-2025 LTIP is estimated to be approximately $4.1 million, $4.8 million and $5.1 million, respectively. Approximately half of the compensation expense for each LTIP relates to the time-based awards, which are being expensed straight-line over 49 months, 48 months and 47 months, respectively. The performance targets under the 2021-2023 LTIP were achieved at the end of fiscal 2023. Awards granted pursuant to this achievement will be subject to further vesting through August 31, 2024. Accordingly, at February 3, 2024, $2.5 million of the expected $3.0 million for the performance award has been accrued. At February 3, 2024, the Company accrued $1.6 million for the performance awards under the 2022-2024 LTIP and no accrual for the performance-based awards under the 2023-2025 LTIP. I. STOCK COMPENSATION PLANS The Company has one active stock-based compensation plan: the 2016 Incentive Compensation Plan (as amended, the “2016 Plan”). A grant of a In accordance with the terms of the 2016 Plan, any shares outstanding under the previous 2006 Incentive Compensation Plan (the “2006 Plan”) at August 4, 2016 that subsequently terminate, expire or are cancelled for any reason without having been exercised or paid are added back and become available for issuance under the 2016 Plan, with stock options being added back on a one-for-one basis and full-value awards being added back on a 1 to 1.9 basis. At February 3, 2024, there were 75,487 stock options that remain outstanding under the 2006 Plan. The 2016 Plan is administered by the Compensation Committee. The Compensation Committee is authorized to make all determinations with respect to amounts and conditions covering awards. Options are not granted at a price less than fair value on the date of the grant. Except with respect to 5% of the shares available for awards under the 2016 Plan, no award will become exercisable or otherwise forfeitable unless such award has been outstanding for a minimum period of one year from its date of grant. Stock Option Activity The following tables summarize the stock option activity under the Company’s 2006 Plan and 2016 Plan, on an aggregate basis, for fiscal 2023: Number of Weighted-average Weighted-average Aggregate Stock Options Outstanding options at beginning of year 3,556,434 $ 0.83 $ 23,239 Options granted 1,317 5.91 — Options canceled or expired (47,749 ) 4.32 55 Options exercised (329,263 ) 1.12 1,147 Outstanding options at end of year 3,180,739 $ 0.75 6.4 yrs. $ 10,962 Options exercisable at end of year 1,941,707 $ 0.80 6.2 yrs. $ 6,609 Vested and expected to vest at end of year 3,180,739 $ 0.75 6.4 yrs. $ 10,962 56 Non-Vested Share Activity The following table summarizes activity for non-vested shares under the Company’s 2006 Plan, 2016 Plan and Inducement Awards, on an aggregate basis, for fiscal 2023: RSUs (1) Deferred Performance share Fully-vest Total number Weighted-average Shares Outstanding non-vested shares at beginning of year 520,008 435,568 240,000 — 1,195,576 $ 2.51 Shares granted 607,142 — 573,000 29,650 1,209,792 4.47 Shares forfeited (53,180 ) — — — (53,180 ) 7.22 Shares expired — — (240,000 ) — (240,000 ) 1.07 Shares vested/issued (537,685 ) — — (29,650 ) (567,335 ) 4.07 Outstanding non-vested shares at end of year 536,285 435,568 573,000 — 1,544,853 $ 3.53 Vested and expected to vest at end of year 536,285 435,568 — — 971,853 $ 3.14 Name RSUs Cash Total Award Harvey S. Kanter $ 468,563 $ 468,563 $ 937,126 Peter H. Stratton, Jr. $ 103,688 $ 103,688 $ 207,376 Anthony J. Gaeta $ 77,438 $ 77,438 $ 154,876 Robert S. Molloy $ 98,438 $ 98,438 $ 196,876 Allison Surette $ 74,813 $ 74,813 $ 149,626 Summary of LTIPs 2021-2023 2022-2024 Effective date March 8, 2021 April 9, 2022 Performance period 3yrs 3yrs End of Performance Period February 3, 2024 February 1, 2025 Target cash value Annual Salary * Participation Rate Annual Salary * Participation Rate Time-Based Performance-Based Time-Based Performance-Based Allocation of Target Cash Value 50% 50% 50% 50% Award type at effective date: RSUs, Cash or a combination thereof, when earned at effective date: RSUs, Cash or a combination thereof, when earned Vesting period 25% April 1, 2022 any award earned subject to additional vesting through August 31, 2024 25% April 9, 2023 any award earned subject to additional vesting through August 31, 2025 Performance Targets (1): Target: Min/Max Payout: Target: Min/Max Payout: 3-yr. relative total shareholder return as compared to 2021 disclosed proxy peers (2) 100% payout at target (2nd quartile), with 50% payout (3rd quartile) and 150% payout (1st quartile). No payout in the 4th quartile. 3-yr. relative total shareholder return as compared to 2022 disclosed proxy peers (3) 100% payout at target (2nd quartile), with 50% payout (3rd quartile) and 150% payout (1st quartile). No payout in the 4th quartile. % of Vesting of Awards by Fiscal Year: Approval date Performance Period total award 2022 2023 2024 2025 2026 3/8/2021 2021-2023 LTIP Time-Based Awards, vest April 1 (1), subject to forfeiture 50% 25% 25% 25% 25% — Performance-Based Awards- vest August 31, if achieved 50% — — 100% — — 4/9/2022 2022-2024 LTIP Time-Based Awards, vest April 1 (1), subject to forfeiture 50% — 25% 25% 25% 25% Performance-Based Awards- vest August 31, if achieved 50% — — — 100% — Name and Principal Position Year Salary ($) Bonus ($) Stock Option Non-Equity All Other Total ($) Harvey S. Kanter 2022 $ 830,539 — $ 829,813 — $ 2,402,969 $ 158,560 $ 4,221,881 President and Chief Executive 2021 $ 735,000 $ 73,500 $ 443,260 $ 207,035 $ 2,069,448 $ 88,035 $ 3,616,278 Officer 2020 $ 686,942 — — $ 436,880 $ 902,425 $ 84,682 $ 2,110,929 Peter H. Stratton, Jr. 2022 $ 405,846 — $ 195,263 — $ 526,585 $ 26,172 $ 1,153,866 Executive Vice President, Chief 2021 $ 395,000 $ 39,500 $ 98,088 $ 51,844 $ 458,525 $ 25,647 $ 1,068,604 Financial Officer and Treasurer 2020 $ 369,173 — — $ 61,358 $ 200,022 $ 25,472 $ 656,025 Anthony J. Gaeta 2022 $ 322,115 — $ 134,310 — $ 352,030 $ 22,565 $ 831,020 Chief Stores and Real Estate Officer 2021 $ 295,000 $ 29,500 $ 73,256 $ 38,281 $ 267,217 $ 22,040 $ 725,294 2020 $ 275,711 — — $ 45,824 $ 112,162 $ 21,864 $ 455,561 Robert S. Molloy 2022 $ 384,942 — $ 165,988 — $ 434,942 $ 28,295 $ 1,014,167 General Counsel and Secretary 2021 $ 375,000 $ 37,500 $ 93,122 $ 49,218 $ 397,809 $ 27,770 $ 980,419 2020 $ 350,481 — — $ 58,251 $ 156,598 $ 27,595 $ 592,925 Allison Surette 2022 $ 311,558 — $ 129,763 — $ 346,156 $ 31,471 $ 818,948 Harvey S. Kanter $ 541,875 Peter H. Stratton, Jr. $ 137,363 Anthony J. Gaeta $ 85,313 Robert S. Molloy $ 101,325 Allison Surette $ 82,425 Name 2020-2022 LTIP 2022-2024 LTIP Total Stock Harvey S. Kanter $ 468,563 $ 361,250 $ 829,813 Peter H. Stratton, Jr. $ 103,688 $ 91,575 $ 195,263 Anthony J. Gaeta $ 77,438 $ 56,872 $ 134,310 Robert S. Molloy $ 98,438 $ 67,550 $ 165,988 Allison Surette $ 74,813 $ 54,950 $ 129,763 its LTIPs. See Note H, Name Annual Incentive 2020-2022 LTIP 2019-2021 LTIP 2020-2022 LTIP 2021-2023 LTIP Total Non- Harvey S. Kanter $ 1,661,077 $ 468,563 $ 78,094 $ 78,094 $ 117,141 $ 2,402,969 Peter H. Stratton, Jr. $ 362,413 $ 103,688 $ 17,281 $ 17,281 $ 25,922 $ 526,585 Anthony J. Gaeta $ 229,421 $ 77,438 $ 12,906 $ 12,906 $ 19,359 $ 352,030 Robert S. Molloy $ 279,083 $ 98,438 $ 16,406 $ 16,406 $ 24,609 $ 434,942 Allison Surette $ 227,702 $ 74,813 $ 12,469 $ 12,469 $ 18,703 $ 346,156 Name Auto 401(k) Long-Term Supplemental Travel Allowance Total Harvey S. Kanter $ 10,000 $ 10,675 $ 12,876 $ 5,009 $ 120,000 $ 158,560 Peter H. Stratton, Jr. $ 8,400 $ 10,675 $ 4,034 $ 3,063 $ — $ 26,172 Anthony J. Gaeta $ 8,400 $ 10,675 $ — $ 3,490 $ — $ 22,565 Robert S. Molloy $ 8,400 $ 10,675 $ 4,821 $ 4,399 $ — $ 28,295 Allison Surette $ 8,400 $ 10,675 $ 10,465 $ 1,931 $ — $ 31,471 Value of Initial Fixed $100 Investment Based on: Year Summary Compensation Table Compensation Actually Paid Average Summary Compensation Table Total for Non-PEO NEOs ($)(2) Average Compensation Actually Paid to Non-PEO NEOs ($)(3) Total Shareholder Return Peer Group Total Shareholder Return Net Income Adjusted EBITDA (a) (b) (c) (d) (e) (f) (g) (h) (i) 2022 $ 4,221,881 $ 7,093,048 $ 954,500 $ 1,482,529 $ 663.06 $ 124.59 $ 89,123 $ 73,808 2021 $ 3,616,278 $ 13,729,433 $ 909,752 $ 1,878,242 $ 390.09 $ 114.78 $ 56,713 $ 76,862 2020 $ 2,110,929 $ 2,270,835 $ 579,831 $ 563,984 $ 72.07 $ 106.22 $ (64,538 ) $ (24,197 ) Fiscal Year: 2020 2021 2022 Summary Compensation Table ("SCT") Total for PEO (column b) $ 2,110,929 $ 3,616,278 $ 4,221,881 Deduct - SCT "Stock Award" value — (443,260 ) (829,813 ) Deduct - SCT "Option Award" value (436,880 ) (207,035 ) — Add or Deduct - year-over-year change in fair value of equity awards granted in prior year that vested in current year (81,267 ) 4,203,022 227,798 Add or Deduct - year-over-year change in fair value of equity awards granted in prior year that are outstanding and unvested as of the current year-end (59,872 ) 4,412,134 2,474,982 Add - year-end fair value of equity awards granted in the current year that are outstanding and unvested as of the current year-end 737,926 2,148,295 998,200 Add or Deduct - vesting date fair value of equity awards granted and vested in current year — — — Deduct - fair value as of prior year end of equity awards granted in prior years that failed to vest in the current year — — — Compensation Actually Paid to PEO (column c) $ 2,270,835 $ 13,729,433 $ 7,093,048 Fiscal Year: 2020 2021 2022 Average Summary Compensation Table Total for Non-PEO NEO's (column d) $ 579,831 $ 909,752 $ 954,500 Deduct - SCT "Stock Award" value — (79,352 ) (156,331 ) Deduct - SCT "Option Award" value (53,009 ) (44,496 ) — Add or Deduct - year-over-year change in fair value of equity awards granted in prior year that vested in current year (44,540 ) 122,413 31,521 Add or Deduct - year-over-year change in fair value of equity awards granted in prior year that are outstanding and unvested as of the current year-end (14,636 ) 524,801 464,934 Add - year-end fair value of equity awards granted in the current year that are outstanding and unvested as of the current year-end 96,338 445,124 187,905 Add or Deduct - vesting date fair value of equity awards granted and vested in current year — — — Deduct - fair value as of prior year end of equity awards granted in prior years that failed to vest in the current year — — — Average Compensation Actually Paid to Non-PEO NEO's (column e) $ 563,984 $ 1,878,242 $ 1,482,529 Long-Term Incentive Plan Name Continued Annual Sign-on and Discretionary Awards (3) Time- Performance- Total Harvey S. Kanter Qualifying Termination $ 3,683,333 $ 1,661,077 $ 1,398,179 $ 5,242,927 $ 1,590,929 $ 13,576,445 Qualifying Termination due to change in control $ 3,400,000 $ 1,661,077 $ 1,398,179 $ 5,242,927 $ 1,590,929 $ 13,293,111 Peter H. Stratton, Jr. Qualifying Termination $ 203,500 $ 362,413 $ 70,793 $ 1,169,713 $ 353,158 $ 2,159,577 Qualifying Termination due to change in control $ 407,000 $ 362,413 $ 70,793 $ 1,169,713 $ 353,158 $ 2,363,077 Anthony J. Gaeta Qualifying Termination $ 162,500 $ 229,421 $ 51,075 $ 853,532 $ 261,049 $ 1,557,577 Qualifying Termination due to change in control $ 325,000 $ 229,421 $ 51,075 $ 853,532 $ 261,049 $ 1,720,077 Robert S. Molloy Qualifying Termination $ 193,000 $ 279,083 $ 67,213 $ 1,070,005 $ 328,687 $ 1,937,988 Qualifying Termination due to change in control $ 386,000 $ 279,083 $ 67,213 $ 1,070,005 $ 328,687 $ 2,130,988 Allison Surette Qualifying Termination $ 157,000 $ 227,702 $ 51,075 $ 834,856 $ 252,201 $ 1,522,835 Qualifying Termination due to change in control $ 314,000 $ 227,702 $ 51,075 $ 834,856 $ 252,201 $ 1,679,835 Service Estimated Future Payouts Estimated Future Payouts All Other All Other Exercise Grant Grant Inception Threshold Target Maximum Threshold Target Maximum or Units Options Awards Awards Date Date ($) ($) ($) ($) (1) ($) (1) ($) (1) (#) (#) ($ / Sh) ($) Harvey S. Kanter 2022 AIP (2) 4/9/2022 $ 166,108 $ 830,539 $ 1,661,078 — — — — — — — 2022-2024 LTIP, Time-Based (3) 4/9/2022 1/30/2022 $ - $ 361,250 $ - — — — 71,962 — — $ 361,250 2022-2024 LTIP, Performance-Based (3) 4/9/2022 1/30/2022 $ 90,313 $ 361,250 $ 541,875 $ 90,313 $ 361,250 $ 541,875 — — — — Peter H. Stratton, Jr. 2022 AIP (2) 4/9/2022 $ 48,322 $ 241,609 $ 362,413 — — — — — — — 2022-2024 LTIP, Time-Based (3) 4/9/2022 1/30/2022 — $ 91,575 — — — — 18,242 — — $ 91,575 2022-2024 LTIP, Performance-Based (3) 4/9/2022 1/30/2022 $ 22,894 $ 91,575 $ 137,363 $ 22,894 $ 91,575 $ 137,363 — — — — Anthony J. Gaeta 2022 AIP (2) 4/9/2022 $ 31,644 $ 158,221 $ 237,332 — — — — — — — 2022-2024 LTIP, Time-Based (3) 4/9/2022 1/30/2022 — $ 56,875 — — — — 11,329 — — $ 56,872 2022-2024 LTIP, Performance-Based (3) 4/9/2022 1/30/2022 $ 14,219 $ 56,875 $ 85,313 $ 14,219 $ 56,875 $ 85,313 — — — — Robert S. Molloy 2022 AIP (2) 4/9/2022 $ 38,494 $ 192,471 $ 288,707 — — — — — — — 2022-2024 LTIP, Time-Based (3) 4/9/2022 1/30/2022 — — $ 67,550 — — — — — 13,456 — — $ 67,550 2022-2024 LTIP, Performance-Based (3) 4/9/2022 1/30/2022 $ 16,888 — $ 67,550 — $ 101,325 $ 16,888 $ 67,550 $ 101,325 — — — — Allison Surette 2022 AIP (2) 4/9/2022 $ 30,573 $ 152,866 $ 229,298 — — — — — — — 2022-2024 LTIP, Time-Based (3) 4/9/2022 1/30/2022 — $ 54,950 — — — — 10,946 — — $ 54,950 2022-2024 LTIP, Performance-Based (3) 4/9/2022 1/30/2022 $ 13,738 $ 54,950 $ 82,425 $ 13,738 $ 54,950 $ 82,425 — — — — Option Awards Stock Awards Number of Number of Equity Option Option Number of Market Equity Equity Name Exercisable Unexercisable (#) ($) Date (#) ($)(1) (#) ($)(1) Harvey S. Kanter — — — — — 240,000 (2 ) 1,766,400 — — — 60,000 (3 ) $ 441,600 — — — — — 45,669 (4 ) $ 336,120 — — — — — 71,962 (5 ) $ 529,640 — 150,000 — (6) $ 0.64 6/10/2030 — — — — — — 442,040 (7) $ 0.53 6/11/2030 — — — — — — 251,970 (8) $ 0.69 3/8/2031 — — — — — 70,843 — (9) $ 0.75 3/9/2031 — — — — Peter H. Stratton, Jr. 77,818 — 97,818 (7) $ 0.53 6/11/2030 — — — — 18,586 — 55,758 (8) $ 0.69 3/8/2031 — — — — 12,038 24,078 — (9) $ 0.75 3/9/2031 — — — — — — — 10,106 (4) $ 74,380 — — — — — 18,242 (5) $ 134,261 — — Anthony J. Gaeta 73,054 — 73,054 (7) $ 0.53 6/11/2030 — — — — 13,881 — 41,641 (8) $ 0.69 3/8/2031 — — — — 8,686 17,372 — (9) $ 0.75 3/9/2031 — — — — — — — 7,547 (4 ) $ 55,546 — — — — — 11,329 (5 ) $ 83,381 — — Robert S. Molloy 92,866 — 92,865 (7) $ 0.53 6/11/2030 — — — — 17,645 — 52,934 (8) $ 0.69 3/8/2031 — — — — 11,429 22,858 — (9) $ 0.75 3/9/2031 — — — — — — — 9,594 (4) $ 70,612 — — — — — 13,456 (5) $ 99,036 — — Allison Surette 4,261 — — (10) $ 4.49 9/11/2026 — — — — 70,578 — 70,577 (7) $ 0.53 6/11/2030 — — — — 13,410 — 40,230 (8) $ 0.69 3/8/2031 — — — — 8,686 17,372 — (9) $ 0.75 3/9/2031 — — — — — — — 7,291 (4 ) $ 53,662 — — — — — 10,946 (5 ) $ 80,563 — — Option Awards Stock Awards Name Number of shares Value Realized Number of shares Value Realized Harvey S. Kanter 490,432 $ 2,448,759 194,676 $ 1,040,807 Peter H. Stratton, Jr. 20,000 $ 105,400 41,637 $ 223,278 Anthony J. Gaeta 18,719 $ 37,064 30,798 $ 165,298 Robert S. Molloy 18,317 $ 28,758 39,530 $ 211,979 Allison Surette — $ — 30,043 $ 161,105 The plan The Number of shares of Fair value of Fiscal 2023 59,532 $ 301,578 Fiscal 2022 73,024 $ 359,208 Fiscal 2021 232,910 $ 374,227 57 At February 3, 2024, 634,534 shares remained available for grant under the The Company accounted for its employee benefit plans in accordance with ASC Topic 715, Compensation – Retirement Benefits. ASC Topic 715 requires an employer to: (a) recognize in its statement of financial position an asset for a Noncontributory Pension Plan In connection with the Casual Male acquisition in May 2002, the Company assumed the assets and liabilities of the Casual Male Noncontributory Pension Plan “Casual Male Corp. Retirement Plan”, which was previously known as On May 3, 2023, the Audit Committee $ The following table sets forth the Name Fees Earned or Stock Option All Other Total Lionel F. Conacher, Chairman $ 195,000 $ — — — $ 195,000 Carmen R. Bauza 54,000 80,990 — — 134,990 Jack Boyle 72,500 72,490 — — 144,990 Willem Mesdag — 144,987 — — 144,987 Ivy Ross 77,500 67,495 — — 144,995 Elaine K. Rubin — 134,982 — — 134,982 February 3, 2024 January 28, 2023 in thousands Change in benefit obligation: Balance at beginning of period $ 11,454 $ 14,361 Benefits and expenses paid (347 ) (818 ) Interest costs 294 414 Settlements (10,877 ) (358 ) Actuarial (gain) loss (524 ) (2,145 ) Balance at end of year $ — $ 11,454 Change in fair value of plan assets: Balance at beginning of period $ 9,591 $ 11,293 Actual return on plan assets (34 ) (1,050 ) Employer contributions 2,106 524 Settlements (11,316 ) (358 ) Benefits and expenses paid (347 ) (818 ) Balance at end of period $ — $ 9,591 Reconciliation of funded status: Projected benefit obligation $ — $ 11,454 Fair value of plan assets — 9,591 Unfunded status $ — $ (1,863 ) Balance sheet classification: Other long-term liabilities $ — $ 1,863 58 Total plan expense and other amounts recognized in accumulated other comprehensive loss for the years ended February 3, 2024, January 28, 2023 and January 29, 2022 include the following components: February 3, 2024 January 28, 2023 January 29, 2022 Net pension cost: (in thousands) Interest cost on projected benefit obligation $ 294 $ 414 $ 373 Expected return on plan assets (325 ) (723 ) (728 ) Amortization of unrecognized loss 133 270 314 Net pension cost $ 102 $ (39 ) $ (41 ) Other changes recognized in other comprehensive loss, Unrecognized losses at the beginning of the year $ 5,490 $ 6,132 $ 6,914 Net periodic pension cost (102 ) 39 41 Employer contribution 2,106 524 622 Recognition of the unrealized loss (5,631 ) — — Change in plan assets and benefit obligations (1,863 ) (1,205 ) (1,445 ) Unrecognized losses at the end of year $ — $ 5,490 $ 6,132 In connection with the partial settlement in the second quarter of fiscal 2023, a remeasurement of the pension obligation was completed as of June 30, 2023. Assumptions used to determine the benefit obligations as of February 3, 2024, June 30, 2023 and January 28, 2023 include a discount rate of 5.14%, 5.21% and 4.79%, respectively. Assumptions used to determine the net periodic benefit cost for the six months ended February 3, 2024, for the six months ended June 30, 2023 and for the fiscal years ended January 28, 2023 and January 29, 2022 The expected long-term rate of return for plan assets was assumed to There were no Fair Value Measurement January 28, 2023 (in thousands) Quoted Prices in Active Markets Significant Significant Unobservable Total Asset category: Mutual Funds: U.S. Equity $ 3,743 — — $ 3,743 International Equity 2,592 — — 2,592 Fixed Income 1,333 — — 1,333 Cash 1,923 — — 1,923 Total $ 9,591 $ — $ — $ 9,591 Supplemental Executive Retirement Plan In connection with the Casual Male acquisition, the Company also assumed the liability of the Casual Male Supplemental Retirement Plan (the “SERP”). On May 3, 2023, the Audit Committee approved the termination of the SERP, which was then approved and ratified by the Board of Directors on May 4, 2023. During fiscal 2023, the Company completed the termination of the SERP though the purchase of a nonparticipating annuity. In connection with that termination, the Company made a cash contribution of $0.4 million and recognized a loss on the termination of the plan of $57,000, which included the recognition of the unrealized loss of $31,000 in Accumulated Other Comprehensive Loss. 59 The following table sets forth the SERP’s funded status at February 3, 2024 and January 28, 2023: February 3, 2024 January 28, 2023 in thousands Change in benefit obligation: Balance at beginning of period $ 427 $ 514 Benefits and expenses paid (27 ) (40 ) Settlements (385 ) — Interest costs 13 14 Actuarial (gain) loss (28 ) (61 ) Balance at end of year $ — $ 427 Change in fair value of plan assets: Balance at beginning of period $ — $ — Employer contributions 466 40 Settlements (439 ) — Benefits and expenses paid (27 ) (40 ) Balance at end of period $ — $ — Projected benefit obligation $ — $ 427 Reconciliation of funded status: Projected benefit obligation $ — $ 427 Fair value of plan assets — — Unfunded Status $ — $ (427 ) Balance sheet classification: Other long-term liabilities $ — $ 427 Other changes recognized in other comprehensive loss, before taxes (in thousands): February 3, 2024 January 28, 2023 January 29, 2022 in thousands Other changes recognized in other comprehensive loss, Unrecognized losses at the beginning of the year $ 31 $ 95 $ 120 Net periodic pension cost (13 ) (17 ) (16 ) Recognized loss from settlement (57 ) — — Employer contribution 466 40 40 Change in benefit obligations (427 ) (87 ) (49 ) Unrecognized losses at the end of year $ - $ 31 $ 95 Assumptions used to determine the benefit obligations as of February 3, 2024 and January 28, 2023 included a discount rate of 5.76% for fiscal 2023 and 4.75% for fiscal 2022. Assumptions used to determine the net periodic benefit cost for the years ended February 3, 2024, January 28, 2023 and January 29, 2022 included a discount rate of 4.75% for fiscal 2023, 2.90% for fiscal 2022 and 2.24% for fiscal 2021. 60 Defined Contribution Plan The Company has one defined contribution plan, the Destination XL Group, Inc. 401(k) Savings Plan (the “401(k) Plan”). Under the 401(k) Plan, the Company offers a qualified automatic contribution arrangement (“QACA”) with the Company matching 100% of the first 1% of deferred compensation and 50% of the next 5% (with a maximum contribution of 3.5% of eligible compensation). Employees who are 21 years of age or older are eligible to make deferrals after 6 months of employment and are eligible to receive a Company match after one year of employment and 1,000 hours. The Company recognized $2.4 million, $2.1 million and $2.0 million of expense under the 401(k) Plan in fiscal K. FAIR VALUE MEASUREMENT At February 3, 2024 and January 28, Fair Value (in thousands) Carrying value Quoted Prices Significant Significant Unobservable At February 3, 2024: Cash equivalents 6,047 6,052 — — Short-term investments 32,459 32,479 — — At January 28, 2023 — — Cash equivalents 29,077 29,071 — — During fiscal 2023, the Company repurchased 5.4 million shares at an aggregate cost, plus fees, of $24.5 million, excluding excise taxes. The Inflation Reduction Act of 2022 imposed a nondeductible 1% excise tax on the net value of certain share repurchases made after December 31, 2022. Beginning in fiscal year 2023, the applicable excise tax is being charged to additional paid-in capital in the Company's Consolidated Balance Sheet as part of the 61 Item 9. Changes in and Disagreements with Accountants on Accounting and Financial Disclosure None. Item 9A. Controls and Procedures Management’s Conclusions Regarding the Effectiveness of Disclosure Controls and Procedures As required by Rule 13a-15 under the Securities Exchange Act of 1934, as amended (the “Exchange Act”), our management, under the supervision and with the participation of our Chief Executive Officer and Chief Financial Officer, evaluated the effectiveness of our disclosure controls and procedures (as defined in Rules 13a-15(e) and 15d-15(e) under the Exchange Act) as of February 3, 2024. Based on this evaluation, our Chief Executive Officer and Chief Financial Officer concluded that, as of February 3, 2024, our disclosure controls and procedures were effective. Management’s Annual Report on Internal Control Over Financial Reporting Our management is responsible for establishing and maintaining adequate internal control over financial reporting as defined in Rule 13a-15(f) under the Exchange Act. Our internal control over financial reporting is a process designed under the supervision of our Chief Executive Officer and Chief Financial Officer to provide reasonable assurance regarding the reliability of financial reporting and the preparation of financial statements for external purposes in accordance with generally accepted accounting principles. Our internal control over financial reporting includes those policies and procedures that: (i) pertain to the maintenance of records that, in reasonable detail, accurately and fairly reflect the transactions and dispositions of our assets; (ii) provide reasonable assurance that transactions are recorded as necessary to permit preparation of financial statements in accordance with generally accepted accounting principles, and that our receipts and expenditures are being made only in accordance with authorizations of our management and directors; and (iii) provide reasonable assurance regarding prevention or timely detection of unauthorized acquisition, use or disposition of assets that could have a material effect on the There are inherent limitations in the effectiveness of any Management assessed the design and effectiveness of our Based on management’s assessment and the above mentioned criteria, management determined that we maintained effective internal control over financial reporting as of KPMG LLP, our independent registered public accounting firm, has issued an audit report on our internal control over financial reporting as of 62 REPORT OF INDEPENDENT REGISTERED PUBLIC ACCOUNTING FIRM To the Stockholders and Board of We have audited Destination XL Group, Inc. and subsidiaries' (the Company) internal control over financial reporting as of February 3, 2024, based on criteria established in Internal Control – Integrated Framework (2013) issued by the Committee of Sponsoring Organizations of the Treadway Commission. In our opinion, the Company maintained, in all material respects, effective internal control over financial reporting as of February 3, 2024, based on criteria established in Internal Control – Integrated Framework (2013) issued by the Committee of Sponsoring Organizations of the Treadway Commission. We also have audited, in accordance with the standards of the Public Company Accounting Oversight Board (United States) (PCAOB), the consolidated balance sheets of the Company as of February 3, 2024 and January 28, 2023, the related consolidated statements of operations, comprehensive income, changes in stockholders’ equity (deficit), and cash flows for each of the fiscal years in the three-year period ended February 3, 2024, and the related notes (collectively, the consolidated financial statements), and our report dated March 21, 2024 expressed an unqualified opinion on those consolidated financial statements. Basis for Opinion The Company’s management is responsible for maintaining effective internal control over financial reporting and for its assessment of the effectiveness of internal control over financial reporting, included in the accompanying Management's Annual Report on Internal Control Over Financial Reporting. Our responsibility is to express an opinion on the Company’s internal control over financial reporting based on our audit. We are a public accounting firm registered with the PCAOB and are required to be independent with respect to the Company in accordance with the U.S. federal securities laws and the applicable rules and regulations of the Securities and Exchange Commission and the PCAOB. We conducted our audit in accordance with the standards of the PCAOB. Those standards require that we plan and perform the audit to obtain reasonable assurance about whether effective internal control over financial reporting was maintained in all material respects. Our audit of internal control over financial reporting included obtaining an understanding of internal control over financial reporting, assessing the risk that a material weakness exists, and testing and evaluating the design and operating effectiveness of internal control based on the assessed risk. Our audit also included performing such other procedures as we considered necessary in the circumstances. We believe that our audit provides a reasonable basis for our opinion. Definition and Limitations of Internal Control Over Financial Reporting A company’s internal control over financial reporting is a process designed to provide reasonable assurance regarding the reliability of financial reporting and the preparation of financial statements for external purposes in accordance with generally accepted accounting principles. A company’s internal control over financial reporting includes those policies and procedures that (1) pertain to the maintenance of records that, in reasonable detail, accurately and fairly reflect the transactions and dispositions of the assets of the company; (2) provide reasonable assurance that transactions are recorded as necessary to permit preparation of financial statements in accordance with generally accepted accounting principles, and that receipts and expenditures of the company are being made only in accordance with authorizations of management and directors of the company; and (3) provide reasonable assurance regarding prevention or timely detection of unauthorized acquisition, use, or disposition of the company’s assets that could have a material effect on the financial statements. Because of its inherent limitations, internal control over financial reporting may not prevent or detect misstatements. Also, projections of any evaluation of effectiveness to future periods are subject to the risk that controls may become inadequate because of changes in conditions, or that the degree of compliance with the policies or procedures may deteriorate. /s/ KPMG LLP Boston, Massachusetts 63 Changes in Internal Control Over Financial Reporting There were no changes in our internal control over financial reporting (as defined in Rules 13a-15(f) and 15d-15(f) under the Exchange Act) that occurred during the fourth quarter of fiscal 2023 that has materially affected, or is reasonably likely to materially affect, our internal control over financial reporting. Item 9B. Other Information. (a) Non-Employee Director Compensation Plan On November 2, 2023, the Board of Directors approved the Seventh Amended and Restated Non-Employee Director Compensation Plan, which will be effective for board compensation in fiscal 2024. The plan was amended to, among other things, add the ability for non-employee directors to make an annual election to receive a portion or all of their quarterly board compensation in shares of deferred stock. Shares of deferred stock vest based on the irrevocable election of each director, either (1) three years from the date of grant or separation of service, if earlier or (2) separation of service. Any grant of deferred stock will be granted under the Company's 2016 Incentive Stock Compensation Plan. The Director Plan was also amended to clarify certain administrative language. (b) Rule 10b5-1 Trading Plans During the three months ended February 3, 2024, none of our directors or officers (as defined in Rule 16a-1(f) of the Securities Exchange Act of 1934, as amended) adopted or terminated a Rule 10b5-1 trading arrangement or non-Rule 10b5-1 trading arrangement (as such terms are defined in Item 408 of Regulation S-K of the Securities Act of 1933, as amended). Item 9C. Disclosure Regarding Foreign Jurisdictions that Prevent Inspections. Not applicable. 64 PART III. Pursuant to Paragraph G(3) of the General Instructions to Form 10-K, the information required by Part III (Items 10, 11, 12, 13 and 14) is being incorporated by reference herein from our definitive proxy statement (or an amendment to this Annual Report on Form 10-K) to be filed with the Securities and Exchange Commission within 120 days of the end of the fiscal year ended February 3, 2024 in connection with our 2024 Annual Meeting of Stockholders. Item 10. Directors, Executive Officers and Corporate Governance Information with respect to this item is incorporated by reference from our definitive proxy statement (or amendment to this Annual Report on Form 10-K) to be filed with the SEC within 120 days of the end of the fiscal year ended February 3, 2024. Item 11. Executive Compensation Information with respect to this item is incorporated by reference from our definitive proxy statement (or amendment to this Annual Report on Form 10-K) to be filed with the SEC within 120 days of the end of the fiscal year ended February 3, 2024. Item 12.Security Ownership of Certain Beneficial Owners and Management and Related Stockholder Matters Name and Address of Beneficial Owner Number of Shares Beneficially Owned Percent of Class (1) AWM Investment Company, Inc. 9,399,297 (2) 14.9 % Wolf Hill Capital Management, LP 4,831,340 (3) 7.7 % BlackRock, Inc. 3,681,487 (4) 5.9 % Seymour Holtzman 3,667,591 (5) 5.8 % The Vanguard Group 3,157,073 (6) 5.0 % Name and Title Number of Shares Beneficially Owned Percent of Class (1) Lionel F. Conacher 338,404 (2) * Chairman of the Board Harvey S. Kanter 815,430 (3) 1.3 % President and Chief Executive Officer and Director Peter H. Stratton, Jr. 401,224 (4) * Executive Vice President, Chief Financial Officer and Treasurer Anthony J. Gaeta 285,002 (5) * Chief Stores and Real Estate Officer Robert S. Molloy 418,852 (6) * General Counsel and Secretary Allison Surette 224,578 (7) * Chief Merchandise Officer Jack Boyle, Director 457,745 (2) * Carmen R. Bauza, Director 24,108 * Willem Mesdag, Director 3,028,460 (8) 4.8 % Ivy Ross, Director 187,179 * Elaine K. Rubin, Director 74,783 * Directors and executive officers as a group (15 persons) 6,890,796 (9) 10.6 % Plan category Number of securities to be Weighted-average Number of securities Equity compensation plans approved by security holders (1) 4,752,010 $ 0.83 (2) 3,873,006 Equity compensation plans not approved by security holders (3) — — 694,066 Total 4,752,010 $ 0.83 4,567,072 Item 13.Certain Relationships and Related Transactions, and Director Independence Item 14.Principal Accountant Fees and Services Fiscal 2022 Fiscal 2021 Audit Fees (1) $ 995,000 $ 1,060,500 Audit-Related Fees — — Tax Fees (2) 160,000 125,000 All Other Fees (3) 1,780 1,780 Total Fees $ 1,156,780 $ 1,187,280 PART IV. Item 15.Exhibits and Financial Statement Schedules 15(a)(1) Financial Statements The list of consolidated financial statements and notes required by this Item 15(a)(1) is set forth in the “Index to Consolidated Financial Statements” on page 36 of this Annual Report. 15(a)(2) Financial Statement Schedules All schedules have been omitted because the required information is not applicable or is not present in amounts sufficient to require submission of the schedules, or because the information required is included in the financial statements or notes thereto. 15(a)(3) Exhibits The list of exhibits required by this Item 15(a)(3) is set forth in the “Index to Exhibits” beginning on page 66 of this Annual Report. Item 16. Form 10-K Summary Omitted at registrant’s option. 65 Index to Exhibits Exhibits 3.1 3.2 3.3 4.1 10.1 † 10.2 Company’s 2016 Incentive Compensation Plan, as amended November 2, 2023. †* 10.3 † 10.4 † 10.5 † 10.6 † 10.7 † 10.8 † 10.9 † 10.10 † 10.11 Seventh Amended and Restated Non-Employee Director Compensation Plan. †* 10.12 10.13 66 10.14 † 10.15 † 10.16 † 10.17 † 10.18 Employment Agreement between the Company and Robert Bogan dated as of November 27, 2023. †* 10.19 † 10.19 † 10.20 † 10.21 † 10.22 † 10.23 † 10.24 † 10.25 † 10.26 † 10.27 † 10.28 † 10.29 † 67 10.30 † 10.31 10.32 10.33 10.34 10.35 10.36 21.1 * 23.1 * 31.1 * 31.2 * 32.1 * 32.2 * 97.1 †* 101 The following materials from the Company’s Annual Report on Form 10-K for the year ended February 3, 2024, formatted in Inline XBRL (eXtensible Business Reporting Language): (i) Consolidated Balance Sheets, (ii) Consolidated Statements of Operations, (iii) Consolidated Statements of Changes in Stockholders’ Equity (Deficit), (iv) Consolidated Statements of Comprehensive Income, (v) Consolidated Statements of Cash Flows, and (vi) Notes to Consolidated Financial Statements. * 104 Cover Page Interactive Data File – The cover page interactive data file does not appear in the interactive data file because its XBRL tags are embedded within the Inline XBRL document. * * Filed herewith. † Denotes management contract or compensatory plan or arrangement. SIGNATURES Pursuant to the requirements of Section 13 or 15(d) of the Securities Exchange Act of 1934, the registrant has duly caused this report to be signed on its behalf by the undersigned, thereunto duly authorized. DESTINATION XL GROUP, INC. March 21, 2024 By: Harvey S. Kanter President and Chief Executive Officer Pursuant to the requirements of the Securities Exchange Act of 1934, this report has been signed below by the following persons on behalf of the registrant in the capacities and on the dates indicated. Signatures Title Date /s/ HARVEY S. KANTER Harvey S. Kanter President and Chief Executive Officer (Principal Executive Officer) March 21, 2024 /s/ PETER H. STRATTON, JR. Peter H. Stratton, Jr. Executive Vice President, Chief Financial Officer and Treasurer (Principal Financial Officer) March 21, 2024 /s/ JOHN F. COONEY John F. Cooney Senior Vice President of Finance, Chief Accounting Officer and Corporate Controller (PrincipalAccounting Officer) March 21, 2024 /s/ Lionel F. Conacher Chairman of the Board of Directors March 21, 2024 /s/ CARMEN BAUZA Director March 21, 2024 Carmen Bauza /s/ JACK BOYLE Jack Boyle Director March 21, 2024 /s/ WILLEM MESDAG Willem Mesdag Director March 21, 2024 /s/ IVY ROSS Ivy Ross Director March 21, 2024 /s/ ELAINE RUBIN Elaine Rubin Director March 21, 2024 executive talent the Company requires to perform in line with the Board’s expectations;•Recognize and reward the achievementconversion of specific annual and long-term performance goals through a combination of cash and stock-based compensation; and•Align the Company’s executives’ interests with those of its stockholders.When reviewing compensation, the Compensation Committee emphasizes Direct Compensation, which consists of total cash compensation (base salary and annual performance-based cash incentive awards) plus long-term incentive awards, which, prior11 Casual Male stores to the COVID-19 pandemic, were primarily equity awards. Every year, we assessDXL store format, completed the effectivenessremodel of our compensation plans withone existing DXL store and closed one DXL outlet. Below is a summary of the goal of strengthening our overall compensation program as appropriate, including by setting performance metricsstore activity from January 28, 2023 to ensure that compensation is aligned with performance that drives stockholder value. We also compare our performance metrics to those used by our peers and take into consideration the recommendations of proxy advisory services.Key Features of Our Executive Compensation ProgramFebruary 3, 2024:
XL Retail
XL Outletexecutiveoperating performance to shareholders, investors and analysts, and that the inclusion of these non-GAAP measures is important to assist investors in comparing our performance in fiscal 2023 to fiscal 2022, on a comparable basis. However, these measures may not be comparable to similar measures used by other companies and should not be considered superior to or as a substitute for operating net income, net income per diluted share or cash flows from operating activities in accordance with GAAP. (Certain amounts in the following tables may not foot due to rounding.)
share
share
outstanding on a diluted basisprogramon grant date.key featuresassumptions, at the individual store level, with respect to expectations for future sales and gross margin rates as well as an estimate for occupancy costs used to estimate the fair value of the respective store’s operating lease right-of-use asset. The amount of impairment, if any, is measured based on projected discounted future cash flows using a discount rate reflecting the Company’s average cost of funds.alignhave effective dates during the compensationperiods reported and in future periods. See Note A to the Consolidated Financial Statements included in this report for information on recent accounting pronouncements and the impact of impending standards on our future filings.executive officers withworking capital requirements. Borrowings under the interests of our stockholders.Credit Facility, which expires October 28, 2026, bear interest at variable rates based on the prime rate or Daily Simple SOFR rate, as defined in the Credit Agreement. At February 3, 2024, we had no outstanding borrowings under the Credit Facility.What We DoWhat We Don’t DoFocus on performance-based payNo re-pricing of underwater optionsBalance short-term and long-term incentivesNo hedging of Company stockUse multiple targets for performance awardsNo tax gross-up on severance paymentsProvide executives with very limited perquisitesNo active supplemental executive retirement planRequire “double-trigger” change-in-control provisionsMaintain a “clawback” policy covering incentive cash and equity programsSeek to mitigate undue risk in compensation plansUtilize an independent compensation consultantUse of Compensation ConsultantsThe Compensation Committee has the authority to retain compensation consultants and other outside advisors to assist in carrying out its duties, including the review of compensation of our Named Executive Officers. The Compensation Committee may accept, reject or modify any recommendations by compensation consultants or other outside advisors.The Compensation Committee periodically consults with the Segal Group ("Segal"), formerly Sibson Consulting, an independent firm that specializes in benefits and compensation, with respect to the structure and competitiveness of the Company’s executive8compensation program compared to its proxy peer group. The Compensation Committee has assessed Segal’s independence, and has concluded that no conflict of interest exists with respect to the services that it performs.In February 2022, the Compensation Committee engaged Segal to review Mr. Kanter's base salary and total direct compensation in connection with the amendment of Mr. Kanter’s employment agreement with the Company, as further described below under “Employment Agreement - Harvey S. Kanter, Chief Executive Officer and Director.” Based on market insights from Segal, including information derived from published surveys on CEO compensation in retail companies with annual revenues of up to $500 million and trends in CEO compensation, the Compensation Committee approved an increase in Mr. Kanter's annual base salary from $735,000 to $850,000.Fiscal 2022 Target CompensationCEO Compensation. The Compensation Committee is responsible for determining the target compensation of our CEO. With respect to setting 2022 target compensation, working with Segal, the Compensation Committee compared each element of the CEO’s Direct Compensation to published survey data and data from the Company’s peer group. The Compensation Committee’s objective was that total target compensation should approximate the median target compensation of the Company’s compensation peer group.Other Named Executive Officers. Our CEO is primarily responsible for recommending the compensation paid to our other Named Executive Officers, subject to the review and approval of the Compensation Committee. Our other Named Executive Officers are provided with a competitive base salary and an opportunity to earn performance awards each year, which are driven by our overall financial targets. Compensation to our other Named Executive Officers was most recently reviewed by Segal in May 2019, at which time Segal reported that such compensation was within the median (or 50% percentile) of the Company’s then proxy peer group. See “Compensation Components and Fiscal 2022 Compensation Decisions.”Our PeersWhen determining peer companies for use in reviewing and establishing compensation for our Named Executive Officers, we focus primarily on public companies within the specialty retail apparel business with similar revenue and/or market capitalization. The companies in the fiscal 2022 peer group were:•Boot Barn Holding, Inc.•J.Jill, Inc.•Tilly’s Inc.•Build-A-Bear Workshop, Inc.•Kaspien Holding, Inc.•Vera Bradley37•Cato Group•Kirkland’s, Inc.•Vince Holding Corp.•Citi Trends•Movado Group•Zumiez, Inc.•Delta Apparel, Inc.•Sportsman’s Warehouse•Duluth Holding, Inc.•Tile Shop HoldingsConsolidated Financial Statements:The Compensation Committee engaged Korn Ferry to review its peer group for fiscal 2023. As a result of that review and based on the recommendations of Korn Ferry, for fiscal 2023 the Company has removed Boot Barn Holding, Inc., Sportsman's Warehouse and Kaspien Holding, Inc. due to their annual revenues being outside of the preferred revenue parameters, and will add Shoe Carnival and Big 5 Sporting Goods to its 2023 peer group.In order to develop an appropriate peer group, we consider companies with a range of revenues, assets and market capitalizations that may differ from those included by independent analysts such as Institutional Shareholder Services (ISS). With respect to our fiscal 2022 peers, we fell just below the median of the revenues and assets of our peer group. Our market capitalization was considered in developing our peer group, but due to the fact that our stock is so thinly traded, more weight was given to the revenue and assets. We do so because we believe that companies doing business in specialty retail markets with omni-channel distribution models provide a better benchmark for total shareholder return. An independent analyst may include a company that falls within the same Standard & Poor’s GICS code with similar revenue and market capitalization but with a different business model, business risks, geographic locations, customer base and industry traffic trends and which, consequently, may have nothing in common with our Company. For example, a company that owns automotive dealerships is within the same GICS code as our Company, but clearly has a distinctively different business model and is not affected by the same trends that affect specialty retail apparel.9Say-on-PayAt our 2017 Annual Meeting, stockholders voted on a non-binding advisory proposal as to the frequency with which we should conduct an advisory vote on executive compensation (a "say-on-pay proposal"). At that meeting, and in accordance with the recommendation of our Board, 95.6% of votes cast voted for the “one-year” frequency for advisory votes on executive compensation. We intend to hold such vote every year, until the next “say-on-pay” frequency vote, which will be at our 2023 Annual Meeting.At our 2022 Annual Meeting, stockholders had an opportunity to cast a non-binding advisory vote on executive compensation as disclosed in the 2022 Proxy Statement. Of the votes cast on the say-on-pay proposal, 99.5% voted in favor of the proposal. The Compensation Committee considered the results of the 2022 advisory vote and believes that it affirms support of our stockholders for our approach to executive compensation, namely to align short- and long-term incentives with the Company’s financial performance. We will continue to consider the outcome of subsequent say-on-pay votes when making future compensation decisions for our executive officers.Risk Assessment/ClawbackWe believe that our compensation programs do not provide incentives for unnecessary risk taking by our employees. Our employment agreements with each of our Named Executive Officers include a “clawback” provision that permits us to demand full repayment of certain amounts paid to the executive in the event we learn, after the executive’s termination, that the executive could have been terminated for “justifiable cause.” In addition, in August 2018, our Compensation Committee approved the Executive Incentive Pay Clawback Policy (“Clawback Policy”) that would allow the Company to recover all Excess Incentive-Based Compensation, as defined in the Clawback Policy, from each executive who willfully committed an act of fraud, dishonesty, or recklessness that contributed to any error or noncompliance that resulted in a financial restatement. Incentive-Based Compensation includes all cash and equity awards. In addition, pursuant to Section 10D of the Exchange Act, The Nasdaq Stock Market is required to adopt listing rules requiring the repayment of incentive-based compensation (as defined in Section 10D of the Exchange Act). Therefore, such incentive-based compensation to our Named Executive Officers will be subject to the provisions of any compensation recovery policy adopted by the Company as required by Section 10D of the Exchange Act and any other Company policy that may be adopted regarding compensation recovery, including to comply with any applicable law and government regulation.Our emphasis on performance-based annual and long-term incentive awards is also designed to align executives with preserving and enhancing shareholder value. Based on these considerations, among others, we do not believe that our compensation policies and practices create risks that are likely to have a material adverse effect on our Company.Compensation Components and Fiscal 2022 Compensation DecisionsWe believe that our executive compensation policies and practices appropriately align the interests of our executives with those of our stockholders and emphasize the shared responsibility of our executive officers for the Company’s financial performance. Accordingly, the compensation of our Named Executive Officers is heavily weighted toward “at-risk” performance-based compensation.The primary components of compensation for our Named Executive Officers include base salary (“fixed compensation”), annual performance-based cash incentives and long-term incentives (“at-risk compensation”). The annual weight of each component leads to the following allocation of potential compensation that each executive can earn.

The components of executive compensation are as follows:36•Base salaryBase salary represents the fixed component of an executive’s annual compensation. In order to attract and retain top executive talent, we believe that it is important that our base salary be competitive, generally at or near the median of our industry peers.10Base salaries are reviewed annually and adjustments are influenced by the Company’s performance in the previous fiscal year and the executive’s contribution to that performance. The executive’s performance is measured by various factors, including, but not limited to, achievement of specific individual and department goals. Additionally, adjustments may consider an individual’s promotion that may have occurred during the fiscal year, and any modifications in the individual's level of responsibility.The Compensation Committee expects the CEO’s base salary to be at or near the peer group median, and to approximate 25%-33% of his target Direct Compensation. Our CEO determines the base salary of our other Named Executive Officers, subject to the review and approval of the Compensation Committee, and targets the median of the peer group and published industry compensation surveys.In March 2022, Mr. Gaeta was promoted to Chief Stores Officer and his base salary was increased from $295,000 to $325,000. In March 2022, Ms. Surette was promoted to Chief Merchandise Officer, and her base salary was increased from $285,000 to $314,000. Mr. Kanter's salary for fiscal 2022 was increased from $735,000 to $850,000 effective April 1, 2022, in accordance with the terms of his amended and restated employment agreement, discussed below.RSubsequent to fiscal 2022, Ms. Surette's base salary was adjusted to $350,000, effective January 29, 2023 and was adjusted to $375,000, effective April 16, 2023. Effective April 16, 2023, Mr. Gaeta was named Chief Stores and Real Estate Officer, and his salary was increased from $325,000 to $400,000.EPORT OF INDEPENDENT REG•Performance-based annual incentive planThe Compensation Committee believes that a substantial portion of each Named Executive Officer’s compensation should tie directly to our Company’s financial performance. On April 2, 2022, the Compensation Committee approved our Fifth Amended and Restated Annual Incentive Plan (“AIP”) that provides for an annual performance-based cash incentive for all executives as well as certain non-executive employees, which was effective beginning with our 2022 AIP awards. The AIP was amended, among other things, to change the definition of employees eligible to participate in the AIP, which resulted in increased participation in the AIP.ISTERED PUBLIC ACCOUNTING FIRM2022 AIP AwardsOn April 9, 2022,To the Compensation Committee established the performance metrics for the 2022 AIP. For fiscal 2022, Mr. Kanter’s target participation in the AIP was at 100%Stockholders and Board of his earned salary and Mr. Molloy participated at 50% of his earned salary. Effective March 6, 2022, Mr. Stratton's participation rate increased from 55% to 60% and Mr. Gaeta's and Ms. Surette's participation rates increased from 40% to 50% and therefore resulted in a blended participation rate for each of them.Directors
Destination XL Group, Inc.:The performance metricsOpinion on the Consolidated Financial Statementspotential payout levels were derived fromsubsidiaries (the Company) as of February 3, 2024 and January 28, 2023, the Company’s annual operating plan for fiscal 2022. The Compensation Committee believed that sales growth and profitability (adjusted EBITDA) continued to be the two most significant financial metrics for the 2022 AIP. In addition to the two financial metrics, specific departmental metrics were set for Store Operations, Marketing & Digital, and Merchandise/Planning and Allocation, as well as personal goals. For Messrs. Kanter, Stratton and Molloy, the financial metrics represented 80%related consolidated statements of their AIP, and for Mr. Gaeta and Ms. Surette, these financial metrics represented 40%operations, comprehensive income, changes in stockholders’ equity (deficit), and their respective departmental metrics represented 40% of their AIP. The remaining 20%cash flows for each of the Named Executive Officers was attributablefiscal years in the three-year period ended February 3, 2024, and the related notes (collectively, the consolidated financial statements). In our opinion, the consolidated financial statements present fairly, in all material respects, the financial position of the Company as of February 3, 2024 and January 28, 2023, and the results of its operations and its cash flows for each of the fiscal years in the three-year period ended February 3, 2024, in conformity with U.S. generally accepted accounting principles.achievementCompany in accordance with the U.S. federal securities laws and the applicable rules and regulations of pre-defined personal goals. See footnote 3the Securities and Exchange Commission and the PCAOB.below tableconsolidated financial statements are free of material misstatement, whether due to error or fraud. Our audits included performing procedures to assess the risks of material misstatement of the consolidated financial statements, whether due to error or fraud, and performing procedures that respond to those risks. Such procedures included examining, on a test basis, evidence regarding the amounts and disclosures in the consolidated financial statements. Our audits also included evaluating the accounting principles used and significant estimates made by management, as well as evaluating the overall presentation of the consolidated financial statements. We believe that our audits provide a reasonable basis for a discussion of these personal goals.our opinion.2022 AIP metrics were intendedcritical audit matter communicated below is a matter arising from the current period audit of the consolidated financial statements that was communicated or required to be achievable, with an approximate 50% probabilitycommunicated to the audit committee and that: (1) relates to accounts or disclosures that are material to the consolidated financial statements and (2) involved our especially challenging, subjective, or complex judgments. The communication of achievement; however, givena critical audit matter does not alter in any way our opinion on the uncertainty surroundingconsolidated financial statements, taken as a whole, and we are not, by communicating the durationcritical audit matter below, providing a separate opinion on the critical audit matter or on the accounts or disclosures to which it relates.pandemic, the rollout of vaccines and its impact on our financial results, there was an inherent risk that these metrics mightassets may not be attainable.recoverable. The decreaseCompany’s judgment regarding the identification of impairment indicators is based on operational performance at the store level. Factors considered by the Company that could result in our adjusted EBITDA targetan impairment triggering event include significant changes in the use of assets, a current period operating or cash flow loss, underperformance of a store relative to historical or expected operating results, and an accumulation of costs significantly in excess of the amount originally expected for fiscal 2022the construction of the long-lived store assets. At February 3, 2024, the Company had property and equipment and operating lease right-of-use assets of $43.2 million and $138.1 million, respectively.compareda critical audit matter. A high degree of auditor judgment was required to actual adjusted EBITDA for fiscal 2021 was dueevaluate the Company’s assessment of (1) stores with current period operating or cash flow losses, and (2) underperforming stores based on current period operating or cash flow results relative to planned investments in our business, specifically in marketing and, as we reported, our cost structure in fiscal 2021 was not sustainable to support the current level of sales and future sales growth.their respective historical results.2022 AIP performance metricsfollowing are the primary procedures we performed to address the critical audit matter. We evaluated the design and actual results against these metrics were as follows:11
Weight(1)Adjusted EBITDA is calculated as earnings before interest, taxes and depreciation and amortization, adjusted to add back any asset impairment (gain).(2)The Company does not publicly disclose its store conversion rates, sales by category or gross margin by category. Any discussiontested the operating effectiveness of conversion rates, store payroll as a percentage of sales, and inventory turnover is limitedcertain internal controls related to the percentage and/or dollar increase or decrease over a comparable period.(3)Personal goals are partCompany’s process of the Company’s annual performance review. At the start of the fiscal year, each associate, including each of our Named Executive Officers, develops his/her “SMART” (specific, measurable, achievable, relevantidentifying and time-bound) goals, each containing a quantifiable measure. The personal goals for Messrs. Molloy and Gaeta and Ms. Surette, which are approved by the CEO, consisted of a combination of quantifiable goals specific to their respective corporate function. Mr. Molloy’s personal goals were tied to ensuring strong corporate governance, legal and ethical compliance, and legal support and guidance throughout the organization. Mr. Gaeta’s personal goals were directly tied to the Company's stores achieving their metrics as well as team development. Ms. Surette's personal goals were strategic and tied to inventory management to maximize sales and gross margin growth, brand awareness and team development. The personal goals for our CFO were quantifiable and were tied directly to the Company's performance, as well as team development and professional development of staff. Our CEO’s personal goals were tied to the Company's current performance and development of a long-term strategic plan.12evaluating potentialAs a result of achieving the performance targets for fiscal 2022 pursuant to the 2022 AIP, as shown above, in March 2023 the Compensation Committee approved, upon the completion of the audited financial statements, cash bonus payouts to our NEOs as follows:
Target
Payout %2023 AIP37On April 27, 2023, the Compensation Committee established the financial, operating and performance metrics for the 2023 AIP. Traditionally, the metrics for the AIP have been focused on the financial and operating performance of the Company in relation to our board-approved budget. However, given the significant uncertainty surrounding the U.S. economy, and the retail industry in particular, in 2023, in order to keep employees engaged and motivated to achieve strategic objectives should the macroeconomic situation deteriorate in 2023, the Compensation Committee added a second tier to the 2023 AIP program that would be a relative measure, comparing the Company's financial performance in fiscal 2023 against the financial performance of its 2023 compensation peer group.Under this two-tier structure, the payout, if any, will be determined based on the higher achievement of either TIER I (based on the Company’s approved financial plan) or TIER II (based on the relative financial performance of the Company to its 2023 compensation peers). The maximum payout under TIER I remains 150% (200% for Mr. Kanter); however, the maximum payout under TIER II is capped at 100%.TIER I is structured in the same manner as our 2022 AIP, and consists of two Corporate financial metrics with departmental targets for Store Operations, Marketing & Digital, and Merchandise/Planning and Allocation. Under TIER I, the Company’s financial performance metrics represent 80% for Messrs. Kanter, Stratton and Molloy and 40% for Mr. Gaeta and Ms. Surette. Mr. Gaeta’s performance metrics include specific store operation targets, and Ms. Surette's performance metrics include specific merchandising, planning and allocation targets, and represent 40% of their respective TIER I targets. Discretionary personal goals represent the remaining 20% for each of the Named Executive Officers.TIER II consists of two Corporate financial metrics (Comparable Sales and Adjusted EBITDA Margin), each weighted 40% for each participant, with the remaining 20% representing discretionary personal goals. Our Comparable Sales and Adjusted EBITDA Margin results for fiscal 2023 will be compared to our 2023 compensation peer group on a quartile ranking. For each metric, if the Company ranks in (i) the top quartile, the payout would be 100%; (ii) the second quartile, the payout would be 75%; and (iii) the third quartile, the payout would be 50%. No payout is earned if the Company finishes in the fourth quartile./s/ KPMG LLPAIP performance metrics approvedand January 29, 2022Compensation CommitteeCompany did not incur any losses on its accounts receivable.
Currency
Currency
before reclassifications, net of taxes
other comprehensive income (loss),
net of taxes (3)
(loss) for the period13
Attributable to Metric, other than Mr. Gaeta and Ms. SuretteaboveCompany is subject to U.S. federal income tax as well as income tax of multiple state and foreign jurisdictions. The Company has concluded all U.S. federal income tax matters for years through fiscal 2001, with remaining fiscal years subject to income tax examination by federal tax authorities.
outstanding
deferred stock and RSUs
outstandingmetricgrant date and, as a result, is likely to change its valuation assumptions used to value employee stock-based awards granted in TIER I werefuture periods. The value derived from using the Black-Scholes model is recognized as expense over the vesting period, net of estimated forfeitures. The estimation of stock awards that will ultimately vest requires judgment. Actual results, and future changes in estimates, may differ from the Company’s annualcurrent estimates.planor cash flow loss, underperformance of a store relative to historical or expected operating results, and budgetan accumulation of costs significantly in excess of the amount originally expected for the 2023 fiscal year, and are intended toconstruction of the long-lived store assets. The Company assesses the recoverability of the assets by determining whether the carrying value of such assets over their respective remaining lives can be achievable, with an approximate 50% probability of achievement.recovered through projected undiscounted future cash flows. The likelihood of achievingmodel for undiscounted future cash flows includes assumptions, at the 2023 targets reflects the challenges inherent in achieving the goals and objectives of an ambitious operating plan, given the continuing uncertaintyindividual store level, with respect to expectations for future sales and gross margin rates as well as an estimate for occupancy costs used to estimate the economy, rising costs, and consumer spending. The Compensation Committee's adoptionfair value of the TIER II planrespective store’s operating lease right-of-use asset. The amount of impairment, if any, is measured based on projected discounted future cash flows using a discount rate reflecting the Company’s average cost of funds. With respect to ensure that all participants in the recently expanded AIPimpairment charges taken on operating lease right-of-use assets, if the Company subsequently makes a decision to close previously impaired stores and a gain is realized as a result of the reevaluation of the existing lease liabilities, to the extent the gain related to previously recorded impairment charges against the right-of-use assets, the gain will be motivated, despite any economic headwinds faced byincluded as an offset to asset impairment charges with the Company and,remainder included as a reduction in all likelihood, its 2023 compensation peer group, in fiscal 2023.store occupancy costs.Mr. Kanterthe Company recorded a total asset impairment charge of $0.1 million, which included a write-down for certain store and operating lease right-of-use assets. For fiscal 2022 and fiscal 2021, the Company recognized non-cash gains of $0.6 million and $2.7 million, respectively, related to the Company's decision to close certain retail stores, with $0.4 million and $2.3 million, respectively, of the gains included as an offset to asset impairment charges and the remaining $0.2 million and $0.4 million, respectively, of the gains included as a reduction of store occupancy costs. Partially offsetting the gain of $0.4 million for fiscal 2022, was an impairment charge of $0.2 million related to the write-down of store assets.continuenot be applied to certain, if any, non-store leases, with a term of 12 months or less, recognizing those lease payments on a straight-line basis over the lease term. At February 3, 2024, the Company had no short-term leases.100%the March 24, 2022 EITF Meeting, and Staff Accounting Bulletin Topic 6.B, Accounting Series Release 280 - General Revision of his salary, Mr. StrattonRegulation S-X: Income or Loss Applicable to Common Stock, which amends or supersedes various SEC paragraphs within the Accounting Standards Codification to conform to past SEC announcements and guidance issued by the SEC. The ASU does not provide any new guidance, and as such, there is no transition effective date. ASU 2023-03 is not expected to have a material impact on the Company's Consolidated Financial Statements.continuebe applied prospectively and are effective when the SEC removes the related requirements from Regulations S-X or S-K. Any amendments the SEC does not remove by June 30, 2027 will not be effective. The ASU is not expected to participatehave a material impact on our consolidated financial statements or related disclosures because the Company is currently subjected to the reporting requirements of Regulations S-X and S-K.60%the store level. Direct sales are defined as sales that originate online, including those initiated online at the store level, on its website or on third-party marketplaces. Sales from the wholesale business, which the Company operated until the first quarter of his salary,fiscal 2022, were defined as sales made to wholesale customers pursuant to the terms of each customer’s contract with the Company. Generally, all revenues are recognized when control of the promised goods is transferred to customers, in an amount that reflects the consideration in exchange for those goods. Sales tax collected from customers and Messrs. Molloyremitted to taxing authorities is excluded from revenue and Gaetais included as part of accrued expenses on the Consolidated Balance Sheets.Ms. Surette will continuea distinct performance obligation with revenue deferred and recognized when the points are redeemed. The cycle of earning and redeeming loyalty points is generally under one year in duration. The loyalty accrual, net of breakage, was $1.7 million and $1.6 million at February 3, 2024 and January 28, 2023, respectively.participateas "breakage". Breakage is recognized over two years in proportion to historical redemption trends and is recorded as sales in the Consolidated Statements of Operations. The gift card liability, net of breakage, was $3.2 million and $3.4 million at 50%February 3, 2024 and January 28, 2023, respectively.their respective salaries.sales for all periods presented. Amounts related to shipping and handling that are billed to customers are recorded in sales, and the related costs are recorded in cost of goods sold including occupancy costs, in the Consolidated Statements of Operations.•C. PROPERTY AND EQUIPMENTLong-term incentive plans14Depreciation expense was $The Company’s long-term incentive plan is designed to ensure that the interests of our executives are aligned with those of our stockholders to create sustainable shareholder value million, $15.4 million and to promote executive retention.$17.2 million for fiscal 2023, fiscal 2022, and fiscal 2021, respectively.March 30, 2022,October 28, 2021, the Compensation Committee approvedCompany entered into a credit facility with Citizens Bank, N.A. On April 20, 2023, the Fourth Amended and Restated Long-Term Incentive Plan (the "LTIP"),Company entered into the First Amendment to Credit Agreement which was effective beginningprovided for the replacement of the London Interbank Offering Rate (“LIBOR”) interest rate options with the 2022-2024 LTIP. secured overnight financing rate ("SOFR") based options (as amended, the "Credit Facility").LTIP was amendedCredit Facility provides for a $125.0 million secured, asset-based credit facility with a maturity date of October 28, 2026. The maximum committed borrowing of $125.0 million includes a sublimit of $20.0 million for commercial and standby letters of credit and a sublimit of up to among other things, add$15.0 million for swing line loans. The Company’s ability to borrow under the Credit Facility is determined using an availability formula based on eligible assets.definition for "Structured Retirement"Base Rate or Daily Simple SOFR rate, at the Company's option. Base Rate loans will bear interest at a rate equal to (i) the greater of: (a) the Prime Rate, (b) the Federal Funds effective rate plus 0.50% per annum and (c) the related vestingDaily Simple SOFR rate plus 1.00% per annum (provided the Base Rate shall never be less than the Floor (as defined in the Credit Facility)), plus (ii) a varying percentage, based on the Company’s average excess availability, of both time-basedeither 0.25% or 0.50% (the “Applicable Margin”). Daily Simple SOFR loans will bear interest at a rate equal to (i) the Daily Simple SOFR rate plus an adjustment of 0.10% (provided the Daily Simple SOFR rate shall never be less than the Floor), plus (ii) the Applicable Margin. Any swingline loan will continue to bear interest at a rate equal to the Base Rate plus the Applicable Margin. The Company is subject to an unused line fee of 0.25%.performance-based awards under such Structured Retirement. The addition of Structured Retirement provides an opportunity for greater vesting upon retirement where the participant assists(ii) $7.5 million, then the Company in ensuringis required to maintain a minimum consolidated fixed charge coverage ratio of 1.0:1.0 until such time as availability has exceeded the successiongreater of (1) 10% of the participant’s position withinRevolving Loan Cap and (2) $7.5 million for 30 consecutive days. priorhad no borrowings outstanding and availability of $69.8 million under the Credit Facility. There were no borrowings under the Credit Facility during fiscal 2023, resulting in an average unused excess availability of approximately $84.5 million. Outstanding standby letters of credit were $4.3 million and outstanding documentary letters were $1.0 million at February 3, 2024. At February 3, 2024, the Company's prime interest rate was 8.75%.participant’s retirement. In order to be eligible to participatecorporate headquarters and equipment leases are included in selling, general and administrative expenses on the Consolidated Statements of Operations.Structured Retirement, the participant must terminate employment after meeting the age and service requirements set forth in the LTIP, the Compensation Committee must confirm through proper corporate action that the participant has met allsummary of the succession planning objectives set byCompany’s components of lease costs for fiscal 2023, fiscal 2022 and fiscal 2021:Compensation Committeecost of property taxes, insurance and common area maintenance fees related to its leases.participant, the participant must continue to work until the date required by the Compensation Committee (which may not be more than 60 days after the Compensation Committee confirms that the objectives have been met), and the participant must execute a release of claims in favorundiscounted cash flows for each of the Company. The final determinationnext five years and thereafter to the operating lease liabilities recorded on the Consolidated Balance Sheet as to whether the requirements of a Structured Retirement have been met is in the sole discretion of the Compensation Committee.February 3, 2024:2020-2022 LTIPperformance periodprovision (benefit) for income taxes consisted of the following:Company’s 2020-2022 LTIP ended on January 28, 2023. The performance target, which was established by the Compensation Committee on June 11, 2020, and the actual performance achieved was as follows:provision (benefit) for income tax:2020-2022 LTIP Performance PeriodBased54above achievement, subsequenttechnical merits of the tax position.endCompany’s direct business in Europe during fiscal 2013. The amount of unrecognized tax benefits was presented as a reduction in the reported amounts of the Company’s federal and state net operating losses carryforwards. No penalties or interest were accrued on this liability. In fiscal 2023, the Company changed this position in its tax return and determined that the liability was no longer necessary.March 6, 2023,certain stock buybacks after December 31, 2022. At February 3, 2024, the Compensation Committee approved,Company has accrued $0.2 million for excise taxes payable.Audit Committee's approvalordinary course of business. When a loss is considered probable, the Company records an accrual based on the reasonably estimable loss or range of loss. Costs related to such legal proceedings are expensed and reported in selling, general and administrative expenses in the Consolidated Statements of Operations. The Company believes its accruals at February 3, 2024 are adequate in light of the Company's auditedprobable and estimable liabilities. The Company does not believe that any identified claims or litigation will be material to its results of operations, cash flows, or financial results, a total performance award of $2.8 million to be granted on March 23, 2023, in a combination of 50% cash and 50% RSUs. All awards are subject to further vesting through August 31, 2023. Approximately $1.6 million of the $2.8 million of the 2020-2022 LTIP award was earned by the Named Executive Officers.condition.our Named Executive Officerstime-based vesting and 50% is subject to performance-based vesting. The time-based awards under the 2021-2023 LTIP were granted in a combination of 25% stock options and 75% cash, and the time-based awards under the 2022-2024 LTIP and the 2023-2025 LTIP were granted in a combination of 50% RSUs and 50% cash. 23,8, 2021, April 9, 2022 and May 1, 2023, asrespectively. The performance period for each LTIP is three years. Awards for any achievement of performance targets will not be granted until the performance targets are achieved and then will be subject to additional vesting through August 31, 2024, August 31, 2025 and August, 31, 2026, respectively. The time-based awards under the 2021-2023 LTIP, 2022-2024 LTIP and 2023-2025 LTIP vest in four equal installments through April 1, 2025, April 1, 2026, and April 1, 2027, respectively. resultstock option award or stock appreciation right will reduce the outstanding reserve on a one-for-one basis, meaning one share for every share granted. A grant of achievinga full-value award, including, but not limited to, restricted stock, restricted stock units and deferred stock, will reduce the outstanding reserve by a fixed ratio of 1.9 shares for every share granted. At February 3, 2024, 15,120,538 shares were authorized under the 2016 Plan, of which 2,177,876 shares remain available for grant.
Shares
exercise price
per option
remaining
contractual term
intrinsic value
(000's)
shares (2)
units (3)
shares (4)
of shares
grant-date
fair valueLTIP:2021-2023 LTIP and 2022-2024 LTIPThe following is a summary of the 2021-2023 LTIP and 2022-2024 LTIP in effect, but not completed, during fiscal 2022:15
25% Options
75% Cash
50% RSUs
75% Cash
25% April 1, 2023
25% April 1, 2024
25% April 1, 2025
25% April 1, 2024
25% April 1, 2025
25% April 1, 2026
(100% weight)
(100% weight)(1)The Compensation Committee established just one performance metric, “Three-Year Relative Total Shareholder Return”, for both LTIPs and believed that this metric appropriately aligned management with the interests of our stockholders. The use of stock options for the 2021-2023 LTIP helped to preserve share availability under the Company’s 2016 Incentive Compensation Plan, as amended (the “2016 Plan”) given the depressed stock price at the time these LTIPs were approved. The issuance of only 25% Options in connection with the 2021-2023 LTIP was a direct result of the then-share price and share availability.(2)For the Company and each of its 2021 disclosed proxy peers, the three-year relative total shareholder return will be calculated as the percentage change in the 30-day trailing volume-weighted average closing stock price at January 29, 2021 and February 2, 2024, adjusted for any dividends paid.(3)For the Company and each of its 2022 disclosed proxy peers, the three-year relative total shareholder return will be calculated as the percentage change in the 30-day trailing volume-weighted average closing stock price at January 28, 2022 and January 31, 2025, adjusted for any dividends paid.At the time of establishing the performance targets, the Compensation Committee believed that the above metrics reflected the Company’s primary objective of returning to profitability in fiscal 2021 and, in both instances, driving shareholder return.The following table illustrates the components of the LTIPs with the respective vesting dates, illustrating that the time-based portion of the LTIP acts as a retention tool:(1)The first tranche of time-based awards vest on April 1 following the end of the first year of the performance period or one year from the date of grant, whichever is later.2023-2025 LTIPEffective May 1, 2023, the Compensation Committee established and approved the metric for the 2023-2025 LTIP. Consistent with the past three years, the Compensation Committee established a 3-year relative total shareholder return ("TSR") as the only metric under the 2023-2025 LTIP. The Compensation Committee believes that the selection of a relative total TSR against the Company’s 2023 compensation peers aligns the interests of the LTIP participants with the interests of the Company’s stockholders. The Compensation Committee granted the time-based awards for the 2023-2025 LTIP in a combination of 50% restricted stock units and 50% cash.•Discretionary Cash and Equity AwardsNo discretionary cash or equity awards were granted to our Named Executive Officers in fiscal 2022.•Other Compensation16We offer our senior executives, including our Named Executive Officers, supplemental disability insurance and long-term care and pay a portion of the premiums, which we do not do for our other employees.Our Named Executive Officers also receive benefits under certain group health, long-term disability and life insurance plans that are generally available to all of our eligible employees.After six months of service with us, all of our employees, including our Named Executive Officers, are eligible to participate in our 401(k) Plan, and after one year of employment are eligible for a Company match. For the 2021 plan year, the Company suspended its QACA ("Qualified Automatic Contribution Arrangement") safe harbor and, while not required, the Company made a discretionary employer match for 2021. The Company resumed its QACA safe harbor status for fiscal 2022.We have employment agreements with our CEO and all of our other Named Executive Officers. Upon termination of employment, each executive is entitled to receive severance payments under his or her employment agreement(s) and under the Company’s incentive programs in the event of a termination without justifiable cause. These employment agreements and incentive programs, as they relate to terminations, are discussed in detail below in the section “Employment Agreements” following the “Summary Compensation Table.” Our employment agreements do not contain any tax gross-ups pursuant to Section 280(g) of the Internal Revenue Code.17COMPENSATION COMMITTEE REPORTThe Compensation Committee has reviewed and discussed the Compensation Discussion and Analysis required by Item 402(b) of Regulation S-K with management and, based on this review and discussion, recommended to the Board of Directors that the Compensation Discussion and Analysis be included in this Form 10-K/A. The Compensation Committee Willem Mesdag, Chair Jack Boyle Lionel F. Conacher18Summary Compensation Table. The following Summary Compensation Table sets forth certain information regarding compensation paid or accrued by us with respect to our Named Executive Officers for fiscal 2022.SUMMARY COMPENSATION TABLE
Awards
($) (1) (2)
Awards
($) (1)
Incentive Plan
Compensation
($)(3)
Compensation
($)(4)(1)The amounts reflect the fair value, as of grant date, of awards computed in accordance with FASB ASC Topic 718, and not the actual amounts paid to or realized by the Named Executive Officers during the applicable fiscal year. The fair value of stock option awards was estimated as of the date of grant using a Black-Scholes valuation model. Additional information regarding the assumptions used to estimate the fair value of all awards is included in Note A and Note I to Consolidated Financial Statements contained in our Annual Report on Form 10-K for the fiscal year ended January 28, 2023.(2)See the table "Stock Awards" below for a breakdown of 2022 amounts reflected in this column. The amounts reflected under "Stock Awards" include the grant of restricted stock units on March 22, 2023 as a result of the Company's achieving its performance targets under the 2020-2022 LTIP. The potential value of the award at threshold, target and maximum was previously reported in the "2020 Grants of Plan-Based Awards" under "Estimated Future Payouts Under Equity Incentive Plan Awards."The fair value associated with the performance-based component of the equity awards under the 2022-2024 LTIP was determined based on the probable outcome of the performance conditions as of the service-inception date. Because the achievement of the performance targets under the 2022-2024 LTIP was not deemed probable as of the service-inception date, no value was attributed to the performance-based portion of these awards. The following reflects the fair values of the performance-based equity portion of the 2022-2024 LTIP assuming the highest level of performance conditions will be achieved for each of the Named Executive Officers:(3)Represents cash awards earned under the 2022 AIP, cash earned under the performance-based component of the 2020-2022 LTIP, the third tranche of time-vested cash of the 2019-2020 LTIP, the second tranche of time-vested cash under the 2020-2022 LTIP and the first tranche of time-vested cash under the 2021-2023 LTIP. See table “2022 Non-Equity (Cash) Incentive Plan Compensation” below for additional detail.(4)See table “All Other Compensation” below for a breakdown of 2022 amounts reflected in this column.The following table provides a breakdown of the amounts in fiscal 2022 in the "Stock Awards" column of the Summary Compensation Table above:
Performance-Based (1)
Time-Based (2)
Awards19(1)Represents the grant-date fair value of restricted stock units granted on March 22, 2023, as a result of the Company's achieving its performance targets under the 2020-2022 LTIP. The RSUs are subject to additional vesting through August 31, 2023.(2)Represents the grant-date fair value of2023 and time-based RSUs issued under the 2022-2024 LTIP, which vest in four tranches with the first 25% vesting on April 9, 2023 and the remaining tranches vesting on April 1, 2024, April 1, 2025 and April 1, 2026.The following table providesLong-Term Incentive Plans. As a breakdownresult of net share settlements, of the amounts for fiscal 2022 in the “2022 Non-Equity (Cash) Incentive Plan Compensation” 537,685column RSUs that vested, only 385,073 shares of the Summary Compensation Table above:
Plan (1)
Performance-Based(2)
Time-Based(3)
Time-Based (3)
Time-Based (3)
Equity (Cash)(1)Each Named Executive Officer earned a cash bonus under the 2022 AIP. See “Compensation, Discussion and Analysis-Compensation Components and Fiscal 2022 Compensation Decisions, Performance-based annual incentive plan and Long-term incentive plans” for more information about the payouts under the 2022 AIP.common stock were issued.thecompensation to certain directors, in lieu of cash, portion of the award earned under the performance-based component of the 2020-2022 LTIP that was granted on March 22, 2023, with additional vesting through August 31, 2023.(3)Represents the vesting of the third tranche of the time-based cash award granted in August 2019 under the 2019-2021 LTIP, the second tranche of the time-based cash award granted in June 2020 under the 2020-2022 LTIP and the first tranche of the time-based cash award granted in March 2021 under the 2021-2023 LTIP. See “Compensation, Discussion and Analysis-Compensation Components and Fiscal 2022 Compensation Decisions, Performance-based annual incentive plan and Long-term incentive plans” for more information.The following table provides a breakdown of the amounts for fiscal 2022 in the “All Other Compensation” of the Summary Compensation Table above:
Allowance
Healthcare
Premiums
Disability
Insurance
Other
CompensationCEO Pay RatioAs required by Section 953(b) of the Dodd-Frank Wall Street Reform and Consumer Protection Act, the Company is providing the following information about the relationship between the annual total compensation of the Company’s employees and the annual total compensation of the Company’s CEO. Our CEO-to-employee pay ratio has been calculated in accordance with Item 402(u) of Regulation S-K under the Exchange Act.Under Instruction 2 to Item 402(u), the median-paid employee maytheir irrevocable elections. The outstanding deferred shares will be identified once every three years if there is no impact to the pay ratio disclosure. We last identified our median employee on December 31, 2020. There has been no change in our employee population or employee compensation arrangements since that time that we believe would significantly impact the pay ratio disclosure for 2022 and require the calculation of a new median employee. However, the employee we identified as our median employee at that time terminated employment with us during fiscal 2022 and as a result, as permitted by SEC rules for fiscal 2022, we have replaced this employee with another full-time employee who earns substantially the same annual compensation.The total annual compensation for our CEO, Mr. Kanter, for fiscal 2022, as shown in the “Summary Compensation Table”, was $4,221,881. The total annual compensation for our new median employee, who is a full-time employee, was $40,361, calculated20using the same methodology as used in the “Summary Compensation Table”. Based on this information, for fiscal 2022 the ratio of the annual total compensation of Mr. Kanter, our CEO, to the median of the annual total compensation of all employees was 105 to 1.The methodology used to identify the median employee in 2020 was to evaluate all employees, other than our CEO, employed by the Company as of December 31, 2020, including those employees who were furloughed for any period of time, and performed the following:•We determined that, as of December 31, 2020, our employee population consisted of approximately 1,171 individuals, with 1,161 of these individuals located in the U.S. and 10 of these individuals located outside the U.S. This population includes our full-time, part-time, and seasonal employees. Approximately 81% of our total employee population at December 31, 2020 was considered full-time employees.•To identify the “median employee” from our employee population, we compared the amount of compensation of our employees as reflected in our payroll records as reported to the Internal Revenue Service on Form W-2 for the year ended December 31, 2020.•Because substantially all of our employees either took a temporary reduction in base salary during fiscal 2020 or were furloughed for a period of time, we did not annualize any compensation for any permanent full-time or part-time employees, who started employment at the Company during calendar 2020. We also did not annualize compensation for any seasonal or temporary employees. Our median employee was not furloughed and did not take any temporary reduction in base salary.•We excluded employees located outside of the U.S. under the de minimis exception to the pay ratio rule, which permits exclusion if a company’s non-U.S. employees account for 5% or less of total employees. The jurisdictions and approximate number of employees excluded were Canada (8) and Hong Kong (2).PAY VERSUS PERFORMANCEPay Versus Performance TableIn accordance with rules adopted by the SEC pursuant to the Dodd-Frank Act, below is disclosure regarding executive compensation for Harvey Kanter, our principal executive officer (“PEO”), our non-PEO NEOs, and our Company financial performance for the fiscal years listed below. The Compensation Committee did not consider the payversusperformance disclosure below in making its pay decisions for any of the years shown. The amounts shown for “Compensation Actually Paid” have been calculated in accordance with Item 402(v) of Regulation and do not reflect compensation actually earned, realized, or received by our NEO's. These amounts reflect total compensation per the Summary Compensation Table with certain adjustments as described in the following table and footnotes.For more information concerning our philosophy of how we align compensation for our NEOs to certain performance metrics, refer to the “Compensation Discussion and Analysis” above.
Total for PEO
($)(1)
to PEO
($)(1)
($)
($)(4)
($)(000's)
(Non-GAAP)
($)(000's)(5)21(1)For each fiscal year, the following table is a reconciliation of the adjustments between the compensation for our PEO per the Summary Compensation Table (column (b)) and Compensation Actually Paid (column c)):(2)Our Non-PEOs NEOs for fiscal 2022 were Peter H. Stratton, Anthony J. Gaeta, Robert S. Molloy and Allison Surette. For fiscal 2021 and fiscal 2020 our Non-PEO NEOs were Ujjwal Dhoot, our former Chief Marketing Officer, and Messrs. Stratton, Molloy and Gaeta.(3)For each fiscal year, the following table is a reconciliation of the adjustments between the average compensation for our Non-PEO NEO's per the Summary Compensation Table (column d)) and Average Compensation Actually Paid to Non-PEO NEO's (column e)):(4)The Peer Group TSR used in this table is the Dow Jones U.S. Apparel Retailers Index (assuming reinvestment of all dividends), which we also utilize in the stock performance graph required by Item 201(e) of Regulation S-K, included in our Annual Report on Form 10-K for the year ended January 28, 2023. The comparison assumes $100 was invested for the period starting January 31, 2020, through the end of each fiscal year.(5)We have identified Adjusted EBITDA as our Company Selected Measure. Adjusted EBITDA is a Non-GAAP financial measure. For our Company, Adjusted EBITDA represents earnings before interest, taxes and depreciation and amortization and is adjusted to add back any asset impairment (gain).Pay Versus Performance Relationships DescriptionsThe following charts depict the relationships between PEO and non-PEO NEO Compensation Actually Paid ("CAP") and the financial metrics included in the table above. The key factor that drove the change in CAP for our PEO and non-PEO NEOs as compared to these financial metrics was the increase in our stock price over the periods reflected, as our LTIP awards are based solely on Company22relative TSR. In addition, in fiscal 2021, the CAP for our PEO reflects the value of performance stock units that vested when our stock price reached certain thresholds in fiscal 2021.Description of Relationship Between PEO and Non-PEO Compensation Actually Paid and Company's TSRThe following chart sets forth the relationship between CAP to our PEO, the average of CAP to our Non-PEO NEOs, and the Company’s cumulative TSR over the three most recently completed fiscal years.
Description of Relationship Between the Company TSR and Peer Group Cumulative TSRThe following chart shows the cumulative TSR of the Company, assuming an initial fixed $100 investment and computed in accordance with the requirements of Item 402(v) of Regulation S-K, versus the Dow Jones U.S. Apparel Retailers, assuming an initial fixed $100 investment on February 1, 2020 (end of fiscal 2019) and computed in accordance with the requirements of Item 402(v) of Regulation S-K.
Description of Relationship Between PEO and Non-PEO NEO Compensation Actually Paid and Net Income (Loss)23The following chart sets forth the relationship between CAP to our PEO, the average of CAP to our Non-PEO NEOs and net income (loss) during the three most recently completed fiscal years. Net income for fiscal 2022 included a non-recurring tax benefit related to the release of our tax valuation allowance of $31.6 million. The net loss for fiscal 2020 included a $14.8 million asset impairment charge.
Description of Relationship Between PEO and Non-PEO NEO Compensation Actually Paid and Company-Selected MeasureThe following chart sets forth the relationship between CAP to our PEO, the average of CAP to our Non-PEO NEOs, and Adjusted EBITDA, a non-GAAP measure (our Company-Selected Measure) during the three most recently completed fiscal years.
Tabular List of Most Important Performance MeasuresAs discussed above in more detail under "Compensation Discussion and Analysis - Compensation Components and Fiscal 2022 Compensation Decisions," the Compensation Committee uses several financial and operational performance measures in making its compensation decisions. The following list represents the most important financial performance measures used by the Company to link Compensation Actually Paid to our PEO and other NEOs to Company performance for fiscal 2022.•Adjusted EBITDA (a non-GAAP measure)•TSR•Sales Growth24Employment AgreementsHarvey S. Kanter, President, Chief Executive Officer and DirectorOn February 19, 2019, we entered into an employment agreement with Mr. Kanter (the “Employment Agreement”). Pursuant to the terms of the Employment Agreement, Mr. Kanter was appointed President, Chief Executive Officer and a director of the Company effective April 1, 2019. From February 19, 2019 to March 31, 2019, Mr. Kanter served as an Advisor to the Acting CEO. The initial term of the Employment Agreement was three years, and could be automatically renewed,issued upon the same terms and conditions, for successive periods of one year, unless either party terminated the agreement in accordance with its terms.In February 2022, the Compensation Committee engaged Segal to review Mr. Kanter’s direct compensation. Effective April 1, 2022, the Company and Mr. Kanter entered into an amended employment agreement (the "Amended Employment Agreement"). The initial term of the Amended Employment Agreement is for three years, unless terminated earlier in accordance with its terms (the "Initial Term"). At the expiration of the Initial Term, the Amended Employment Agreement will automatically renew, upon the same terms and conditions, for successive periods of one year, unless either party provides advance written notice in accordance with the agreement.Pursuant to his Amended Employment Agreement, Mr. Kanter receives an annual base salary of $850,000 as President and Chief Executive Officer with an annual automobile allowance of $10,000. Mr. Kanter receives a quarterly travel allowance in the amount of $30,000, which is intended to be used for travel between Mr. Kanter's home and the Company’s corporate offices.Under Mr. Kanter's initial Employment Agreement, Mr. Kanter was granted 720,000 PSUs. Of the 720,000 PSUs, 480,000 vested in fiscal 2021, and 240,000 PSUs expired unvested on April 1, 2023. Under the terms of the Amended Employment Agreement, the Company agreed to grant Mr. Kanter a new performance share award after April 1, 2023 (but not later than December 31, 2023), if the remaining 240,000 PSUs did not vest. The amount and terms of such award will be determined by the Board in its sole discretion.Mr. Kanter is eligible to participate in our annual incentive plan at a target rate of 100% of his earned salary, up to a maximum payout of up to 200% of target. Mr. Kanter is also eligible to participate in our long-term incentive plans at a target bonus equal to 170% of his base salary in effect on the effective date of participation. Pursuant to the terms of the LTIP, 50% of any award will be time-based compensation and 50% will be performance-based compensation. Maximum payout of performance-based compensation is 150% of target.Pursuant to the Amended Employment Agreement, if Mr. Kanter terminates his employment for Good Reason (as defined in the Amended Employment Agreement) or the Company terminates his employment without Justifiable Cause (as defined in the Amended Employment Agreement):(i)During the Initial Term of the Amended Employment Agreement, Mr. Kanter will be eligible to receive, subject to certain requirements described in the Employment Agreement, a severance payment equal to (x) the base salary he would have been paid through the end of the Initial Term plus (y) bonuses under the AIP for the remaining partial and complete fiscal years in the Initial Term as if Mr. Kanter had remained employed through the end of the Initial Term. Bonuses will be calculated assuming target and any partial year will be prorated. The severance payment will be paid in 24 monthly installments; and(ii)During any one-year period that commences after the end of the Initial Term, Mr. Kanter will be eligible to receive a payment equal to (x) his then current base salary plus (y) the then value of his target bonus under the AIP, payable in 24 monthly installments, and,(iii)If the Company timely elects not to renew the Amended Employment Agreement after the Initial Term, Mr. Kanter will be eligible to receive a payment equal to (i) three months of his then current base salary plus (ii) the then value of 25% of his target bonus under the AIP, payable in 24 monthly installments.If Mr. Kanter’s employment is terminated by him for Good Reason or by the Company without Justifiable Cause during the one-year period following a Change in Control (as defined in the 2016 Plan), then Mr. Kanter will be eligible to receive, subject to certain requirements described in the Employment Agreement, a payment equal to (i) two times his then current base salary plus (ii) the then value of two times his target bonus under the AIP, generally payable in a lump sum within 60 days of the termination of his employment following a Change in Control.In addition, if a termination of Mr. Kanter’s employment prior to the expiration of the Initial Term meets the requirements of a Structured Retirement (as defined in the LTIP, as described above) such termination will be deemed to be a termination by the Company without Justifiable Cause. Additionally, for purposes of the AIP, a termination of his employment that meets the requirements of a Structured Retirement and that occurs at any time during the employment term (including after the Initial Term) will be deemed to be a termination by the Company without Justifiable Cause under the AIP.25Employment Agreements with Other Named Executive OfficersWe have employment agreements with each of Named Executive Officers other than our CEO (the “NEO Employment Agreements”). The term of each NEO Employment Agreement begins on the respective effective date and continues until terminated by either party. Our Named Executive Officers are eligible to participate in our AIP. Each Named Executive Officer is entitled to vacation and to participate in and receive any other benefits customarily provided by us to our senior executives.Each of the NEO Employment Agreements provide that, if the executive officer’s employment is terminated by us at any time for any reason other than “justifiable cause” (as defined in the NEO Employment Agreements), disability or death, we are required to pay the executive the executive's then current base salary for five months after the effective date of such termination. This severance benefit is conditioned upon the executive’s execution of a general release. These payments are not made if the executive is terminated with “justifiable cause,” the executive resigns, or the executive dies or becomes disabled. The Named Executive Officers would also be entitled to additional payments or acceleration of awards under the AIP and LTIP programs, in accordance with the terms of those plans.If the Named Executive Officer’s employment is terminated at any time within one year following a Change of Control (as defined in the NEO Employment Agreements) other than for "justifiable cause," or if the executive resigns for “good reason” (as defined in the NEO Employment Agreements), then we will be obligated to pay the executive an amount equal to twelve months of the executive’s highest base salary in effect at any time during the six-month period ending on the date of the Change of Control. This payment also is conditioned upon the executive’s execution of a general release. Payments made under this provision are to be reduced if and to the extent necessary to avoid any payments or benefits to the executive being treated as “excess parachute payments” within the meaning of Internal Revenue Code Section 280G(b)(i).The NEO Employment Agreements contain confidentiality provisions pursuant to which each executive agrees not to disclose confidential information regarding our Company. The NEO Employment Agreements also contain covenants pursuant to which each executive agrees, during the term of his employment and for a one-year period following the termination of his employment, not to have any connection with any business which is a specialty retailer that primarily distributes, sells or markets so-called “big and tall” apparel of any kind for men or which utilizes the “big and tall” retail or wholesale marketing concept as part of its business.Estimated Potential Payments to Named Executive OfficersThe following table shows the payments that would be made to our Named Executive Officers assuming a “termination without cause” or a “resignation for good reason” (each a “Qualifying Termination”) or a Qualifying Termination following a Change in Control, as described in the employment agreements, as of January 28, 2023 (the last day of fiscal year 2022).
Base
Salary(1)
Incentive
Plan (2)
Based
Awards (4)
Based
Compensation (5)
Potential
Payments(1)Because Mr. Kanter was in the Initial Term of his Amended Employment Agreement as of January 28, 2023, for a Qualifying Termination, Mr. Kanter would have been entitled to receive, as continued base salary, the sum of the remaining base salary and annual incentive payout, assuming target, that he would have received during the Initial Term of his employment. For the other Named Executive Officers, continued base salary for Qualifying Termination assumes six months of salary, which includes one month for notice. Continued base salary for Qualifying Termination due to change in control is the sum of two times base salary plus the then-amount of the annual incentive payout at target for Mr. Kanter and one-year base salary for the other Named Executive Officers.(2)The amounts represent the actual incentive earned for 2022 AIP. See "Compensation Discussion and Analysis - Compensation Components and Fiscal 2022 Compensation Decisions - Discretionary Cash and Equity Awards" for more information regarding this award.(3)Represents the prorated vesting of a discretionary grant of stock options granted on March 9, 2021 to Mr. Kanter and all then-active participants of the 2018-2020 LTIP. The table also includes a prorated vesting of Mr. Kanter’s RSUs that were granted to him in connection with his hiring.26(4)Time-based awards under our LTIPs represent time-based RSUs and Stock options under our 2019-2021 LTIP, 2020-2022 LTIP, 2021-2023 LTIP and 2022-2024 LTIP. Because the respective performance periods for the 2019-2021 LTIP and the 2020-2022 LTIP would have been complete as of January 28, 2023, all outstanding awards would have become fully vested under both a Qualifying Termination and Qualifying Termination due to a change in control. Because the 2021-2023 LTIP would have completed the second year of its performance period and the 2022-2024 LTIP would have completed the first year of its performance period, as of January 28, 2023, each participant would have vested in RSUs and stock options based on a pro-rata vesting percentage, which is calculated based on the number of effective days of participation over the total number of days in the performance period.(5)Includes the actual performance award earned under the 2020-2022 LTIP. Because the performance periods for the 2021-2023 LTIP and the 2022-2024 LTIP were not complete as of January 28, 2023, for a Qualifying Termination, each participant would be entitled to receive a pro-rated vesting percentage, at the end of the performance period for each of the respective LTIPs based on the actual performance level achieved. The above table assumes the performance level achieved is at target. For a Qualifying Termination due to a change in control, each participant would be entitled to receive a pro-rated vesting percentage, at the date of the change in control at target. Mr. Kanter’s remaining 240,000 PSUs would forfeit unexercised unless, during the thirty-days following his termination, a performance target is achieved. In such case, he would be entitled to any unvested PSUs that would have vested as though he had not been terminated. The respective PSUs expired on April 1, 2023.(6)All time-based RSUs awards that would vest upon an assumed termination on January 28, 2023 were valued using the closing stock price of our stock on January 28, 2023 of $7.36 per share. The value of all outstanding stock options that would become exercisable upon an assumed termination on January 28, 2023 were valued using the spread between the closing stock price of our stock on January 28, 2023 and the respective exercise price of such stock option.Clawback PolicyOur employment agreements with our executives, including our CEO and our other Named Executive Officers, contain a “clawback” provision that provides for remedies in the event we learn, after the executive’s termination by us, other than for “justifiable cause,” that his or her termination could have been terminated for “justifiable cause.” Pursuant to the employment agreements, an executive shall be required to pay to the Company all amounts paid to the executive other than such portion of an executive’s base salary and reimbursement of expenses accrued through the date of the termination; all vested and unvested awards, as defined therein, held by the executive shall immediately expire; and the executive shall be required to pay to the Company an amount equal to any gains resultingdirector’s separation from the exercise or payment of any awards.In addition, in August 2018, our Compensation Committee approved a clawback policy that requires our Named Executive Officers to reimburse the Company for bonuses and other incentive compensation and stock sale profits if the Company is required to restate its financial statements, as a result of misconduct, due to material noncompliance with the financial reporting requirements of the securities laws. Finally, pursuant to Section 10D of the Exchange Act, The Nasdaq Stock Market is required to adopt listing rules requiring the repayment of incentive-based compensation (as defined in Section 10D of the Exchange Act). Therefore, such incentive-based compensation to our Named Executive Officers will be subject to the provisions of any compensation recovery policy adopted by the Company as required Section 10D of the Exchange Act and any other Company policy that may be adopted regarding compensation recovery, including to comply with any applicable law and government regulation.Grants of Plan-Based Awards. The following table sets forth certain information with respect to plan-based awards granted to the Named Executive Officers in fiscal 2022.2022 GRANTS OF PLAN-BASED AWARDS
Under Non-Equity
Incentive Plan Awards
Under Equity
Incentive Plan Awards
Stock
Awards:
Number
of Shares
of Stock
Option
Awards:
Number of
Securities
Underlying
or Base
Price
of
Option
Date
Fair
Value of
Stock
and
Option27(1)Performance-based awards under the LTIP plans are denominated in dollars at the service inception date. The actual grant date of equity awards will occur only if the performance targets are achieved. See footnote 3 below for additional information on the 2022-2024 LTIP.(2)The threshold payout for each executive assumes the achievement of only the individual personal goals, target payout assumes 100%, and the maximum payout assumes 150% of the payout targets under the 2022 AIP, with the exception of the maximum payout for Mr. Kanter which is 200%. See “Compensation Components and Fiscal 2022 Compensation Decisions - Performance-based annual incentive plan – 2022 AIP” for more information on the targets set under the 2022 AIP. The respective actual cash payment made to each of the Named Executive Officers under the 2022 AIP is included in the “Summary Compensation Table” for fiscal 2022.service.April 9, 2022,August 11, 2023, the Compensation Committee approvedCompany granted 573,000 performance share units ("PSUs") in connection with the performance target for the 2022-2024 LTIP. extension of Mr. Kanter's employment agreement. The performance-based awards represent 50%award consists of the total potential payout under the 2022-2024 LTIP, and assumes that 50% is payable in cash and 50% payable in equity. The amounts in the above table represent the dollar value of any future grant of cash and equity assuming a potential payout at threshold, target and maximum for each executive estimated based on achieving 50%, 100% and 150%, respectively, of the payout targets set by the Compensation Committee. The actual grant of equity will occur only if the performance targets are achieved. The remaining 50% of the total potential payout under the 2022-2024 LTIP represents time-based awards, which were granted 50% cash and 50% in RSUs. The above table reflects the cash award and the RSUs that were granted on April 9, 2022. The cash award and the RSUs vest in four equalnine tranches, with the first tranche vesting on April 9, 2023,if and when the remaining tranches vesting on April 1, 2024, April 1, 2025, and April 1, 2026. See “Compensation Components and Fiscal 2022 Compensation Decisions - Long-term incentive plans - 2022-2024 Performance Period30-day” above for more information on the targets.28Outstanding Equity Awards at Fiscal Year-End. The following table sets forth certain information with respect to outstanding equity awards held by the Named Executive Officers at the end of fiscal 2022.2022 OUTSTANDING EQUITY AWARDS AT FISCAL YEAR-END
Securities
Underlying
Unexercised
Options
(#)
Securities
Underlying
Unexercised
Options (#)
Incentive
Plan
Awards:
Number of
Securities
Underlying
Unexercised
Unearned
Options
Exercise
Price
Expiration
Shares or
Units of
Stock
That
Have Not
Vested
Value of
Shares
or Units
of Stock
That
Have
Not Vested
Incentive
Plan
Awards:
Number of
Unearned Shares,
Units or
Other
Rights That
Have Not
Vested
Incentive
Plan
Awards:
Market or
Payout
Value of
Unearned
Shares,
Units or
Other
Rights
That Have
Not
Vested(1)The value of shares was calculated using the volume-weighted closing price of ourthe Company's common stock is equal to or greater than $6.50 per share. Each subsequent tranche will vest upon achievement of $7.36the 30-day volume-weighted closing price of the Company's common stock in $0.25 installments with the ninth tranche vesting when such price is equal to or greater than $8.50 per share. The PSUs are subject to a one-year minimum vesting period, and any unvested PSUs will expire on January 27, 2023.(2)This award represents a sign-on award granted The respective fair value and derived service period assigned to Mr. Kanter in Fiscal 2019. The original award was a grant of 720,000 PSUs that would vest in installments when the following milestones were met: one-thirdeach tranche of the PSUs vest when the trailing 90-day volume-weighted average closingwere determined using a Monte Carlo model based on: a weighted historical volatility of 57.8%, a term of 3 years, stock price (“VWAP”) is $4.00, one-third of the PSUs vest when the VWAP is29$6.00 and one-third when the VWAP is $8.00. The first two tranches of the PSUs vested in fiscal 2021. The remaining 240,000 PSUs expired on April 1, 2023.(3)This award represents a sign-on award granted to Mr. Kanter in fiscal 2019. The original award consisted of a grant of 240,000 RSUs that vested ratably over four years, with the remaining tranche vesting on April 1, 2024.(4)These awards represent the unvested portion of RSUs granted on August 7, 2019 in connection with our 2019-2021 LTIP. These awards vested on April 1, 2023.(5)These awards represent the unvested portion of RSUs granted on April 9, 2023 in connection with our 2022-2024 LTIP. These awards vest in four equal tranches on April 9, 2023, April 1, 2024, April 1, 2025 and April 1, 2026.(6)This award represents a discretionary grant of stock options to Mr. Kanter in fiscal 2020 that originally vested in three equal tranches. The remaining tranche vested on April 1, 2023.(7)These awards represent stock options granted on June 11, 2020 in connection with the time-based portion of our 2020-2022 LTIP. The awards vest in four equal tranches on June 11, 2021, April 1, 2022, April 1, 2023 and April 1, 2024.(8)These awards represent stock options granted on March 8, 2021 in connection with the time-based portion of our 2021-2023 LTIP. The awards vest in four equal tranches on April 1, 2022, April 1, 2023, April 1, 2024 and April 1, 2025.(9)These awards represent a discretionary grant of stock options on March 9, 2021 to Mr. Kanter and the active members of management who were participants in the 2018-2020 LTIP. The awards vest in three equal tranches on March 9, 2022, March 9, 2023 and March 9, 2024.(10)This award represents a pro-rata grant of stock options issued to Ms. Surette in connection with her promotion in fiscal 2016 in accordance with the terms of the LTIP.Option Exercises and Stock Vested Table. The following table sets forth information for the Named Executive Officers with respect to the exercise of option awards and the vesting of stock awards during fiscal 2022.2022 OPTION EXERCISES AND STOCK VESTED
Acquired
on Exercise
(#)
on Exercise
($)(1)
Vested
(#)(2)
on Vesting
($) (3)(1)The “Value Realized on Exercise” is the market price of the underlying security on the date of exercise, minusgrant of $4.98 per share, a risk-free rate of 4.6% and a cost of equity of 11.0%. The $2.4 million fair value is being expensed over the exercise cost. The value realized is for informational purposes only and does not purportrespective derived service periods of each tranche which range from 12 to represent that such individual actually sold the underlying shares, or that the underlying shares were sold on the date of exercise. Furthermore, such value realized does not take into consideration individual income tax consequences.13 months.(2)(4)The stock awards that vested during fiscal 2022 include the time-based awards grantedRepresents compensation, with a fair value of $141,742, to certain directors, who are required to receive shares, in lieu of cash, in order to satisfy their minimum equity ownership under the 2019-2021 LTIP as well as the RSUs granted for the performance-based compensationNon-Employee Director Plan. Voluntary shares received, in lieu of cash, are reported below under the 2019-2021 LTIP which vested on August 31, 2022.Non-Employee Director Compensation Plan.(3)The “Value Realized on Vesting” is the market price of the underlying security on the date of vesting. The value realized is for informational purposes only and does not purport to represent that such individual actually sold the underlying shares, or that the underlying shares were sold on the date of vesting. Furthermore, such value realized does not take into consideration individual income tax consequences.Pension BenefitsNone of our Named Executive Officers was a participant in any pension plan and, therefore, none has accumulated benefits.Non-Qualified DeferredNon-Employee Director Compensation PlanWe do not offerIn January 2010, the Company established a Non-Employee Director Stock Purchase Plan to our executive officers or employees any defined contribution or similar plan that providesprovide a convenient method for its non-employee directors to acquire shares of the deferral of compensation on a basis that is not tax-qualified. We offer a 401(k) savings plan to all of our employees eligible to participate, as further described below.30401(k) PlanThe Company has one defined contribution plan, the Destination XL Group, Inc. 401(k) Savings Plan (the “401(k) Plan”). Employees who are 21 years of age or older are eligible to make deferrals after 6 months of employment and are eligibleCompany’s common stock at fair market value by voluntarily electing to receive shares of common stock in lieu of cash for service as a match fromdirector. The substance of this plan is now encompassed within the Company after one year of employmentCompany’s Seventh Amended and 1,000 hours. Our Named Executive Officers are eligible to participate in the 401(k) Plan, and the amount of any Company match to our Named Executive Officers is set forth above in the “All Other Compensation” table.The Company suspended its QACA safe harbor during the 2021 plan year and, while not required, the Company made a discretionary employer match for 2021. The Company resumed its QACA status for fiscal 2022.Director CompensationThe Compensation Committee is responsible for reviewing and making recommendations to our Board with respect to the compensation paid to our non-employee directors.The Company'sRestated Non-Employee Director Compensation Plan, as amended, to date, sets forth the compensation to be paid to our non-employee directors, including in the form of equity. "Non-Employee Director Compensation Plan."hasrequires a minimum equity ownership requirement thatwhich requires each director to receive at least 60%60% of their annual retainers in shares of common stock until the value of their equity ownership is equal to at least three times the annual retainer. Any shares issued to satisfy the minimum equity ownership requirement are issuedwere granted from the 2016 Plan. All other shares were granted under the Company’s 2016 IncentiveNon-Employee Director Compensation Plan, as amended (the “2016 Plan”). Plan.plan also permits the Company’s non-employee directors to acquire shares of the Company’s common stock at fair market value by voluntarily electing to receivefollowing shares of common stock, in lieu of cash fees for service as a director. The plan is a stand-alone plan and is not a sub-plan under our 2016 Plan. Accordingly, shares issued under the plan for voluntary elections to receive shares of common stock in lieu of cash fees do not reduce the shares available for issuance under the 2016 Plan. The maximum number of shares that can be issued in any quarter pursuant to the plan is limited to 250,000 shares in the aggregate, with the shortfall paid in cash.We believe that ourrespective fair value, were issued from the Non-Employee Director Compensation Plan will support our ongoing efforts to attract and retain exceptional directors to provide strategic guidance to our Company. We believe that the total compensation that ourits non-employee directors receive is in line with our current peer group. Our non-employee directors were compensatedas compensation for fiscal 2023, fiscal 2022 and fiscal 2021:
common stock issued
common stock issuedplan as follows in fiscal 2022:Non-Employee Director Compensation Plan.•J. EMPLOYEE BENEFIT PLANSeach independent director receivedquarterly retainer of $33,750;•the Chairmanplan’s over-funded status or a liability for a plan’s under-funded status; (b) measure a plan’s assets and its obligations that determine its funded status as of the Board or Lead Director,end of the employer’s fiscal year (with limited exceptions); and (c) recognize changes in the funded status of a defined benefit postretirement plan in the year in which the changes occur.applicable, received a quarterly retainer of $10,000;•Chairperson ofJ. Baker, Inc. Qualified Plan (the “Pension Plan”). Casual Male Corp. froze all future benefits under this plan on May 1, 1997.receivedapproved the termination of the Pension Plan, which was then approved and ratified by the Board of Directors on May 4, 2023 with a quarterly retainerfinal termination approval on June 8, 2023. By the end of $5,000; and•ChairpersonCompany completed the settlement of each other Board committee receivedall plan assets. Results for fiscal 2023, included a quarterly retainercharge of $2,500.Director Compensation Table5.6 million, representing recognition of the of the unrealized loss in "Accumulated Other Comprehensive Loss" on the Consolidated Balance Sheet.compensation paid to our directors during fiscal 2022. Mr. Kanter is not included in the following table as he is a Named Executive OfficerPension Plan’s funded status at February 3, 2024 and accordingly, received no compensation for his services as a director. Compensation earned by Mr. Kanter is included above in the “January 28, 2023:Summary Compensation Table.”2022 DIRECTOR COMPENSATION TABLE
Paid in Cash
($)(1)
Awards
($)(2)
Awards
($)(3)
Compensation
($)
($)(1)For
before taxes:Mr. Mesdagincluded a discount rate of 5.21%, 4.79%, 3.00% and Ms. Rubin elected2.39%, respectively.receive all compensation in unrestricted shares of common stock. Mr. Conacher elected to receive 100% of his compensation in cash. Mr. Boyle elected to receive 50% of his compensation in unrestricted shares of common stockbe 5.10% and 50% in cash. Ms. Ross elected to receive 50% of her retainer in cash and 50% in unrestricted shares of common stock, with any chairperson fees in cash. Until Ms. Bauza reaches the required minimum ownership threshold, she was required to elect 60% of her retainer in unrestricted shares of common stock and she elected the balance in cash. The number of shares issued as payment for an earned director fee is determined by taking the director fee earned and dividing by the consolidated closing price of our common stock on the grant date. Payments are made6.50% at the beginning of fiscal 2023 and fiscal 2022, respectively. The expected long-term rate of return for plan assets was assumed to be 6.00% at June 30, 2023. The expected long-term rate of return assumption was developed considering historical and future expectations for returns for each quarter, with the grant date being the first business day of each respective quarter.31asset class.(2)Plan AssetsRepresents the portion of each director’s compensation that was paid in the form of equity through the issuance of unrestricted shares of common stock. The fractional share value is forfeited.(3)stock option grants to anyplan assets at the end of fiscal 2023. The fair values of the directorsCompany’s noncontributory defined benefit retirement plan assets at the end of fiscal 2022, by asset category, was as follows:
for Identical
Assets (Level 1)
Observable
Inputs (Level 2)
Inputs (Level 3)
before taxes:2022. The following directors had the respective number of stock options outstanding at2023, 2022 and 2021, respectively.2023: Mr. Boyle: 15,000; Mr. Conacher: 15,000;2023, the Company held U.S. treasury bills which were classified as held-to maturity and Mr. Mesdag: 15,000.carried at amortized cost.
in Active
Markets for
Identical Assets
(Level 1)
Observable
Inputs
(Level 2)
Inputs (Level 3)Compensation Committee Interlocks and Insider ParticipationL. STOCK REPURCHASE PROGRAMNoneOn March 14, 2023, the Company's Board of Directors (“Board”) approved a stock repurchase program, effective March 16, 2023. Under the program, the Company was initially authorized to repurchase up to $15.0 million of its common stock, including excise tax, through open market and privately negotiated transactions. The Company completed the initial authorization during the third quarter of fiscal 2023. On November 15, 2023, the Board approved an amendment to the stock repurchase program to increase the amount authorized under the program from $15.0 million to $25.0 million. Subsequent to the end of fiscal 2023, the stock repurchase program was completed.memberscost basis of the Compensation Committee who servedshares repurchased, with the corresponding liability for the excise tax payable recorded in accrued expenses and other current liabilities until paid. This liability is partially offset by a 1% credit permitted under the rules for the fair value of shares issued by the Company. At February 3, 2024, the Company has accrued $0.2 million for the payment of excise taxes.Compensation Committee during fiscal 2022 was atfinancial statements.time during fiscal 2022internal control, including the possibility of human error and the circumvention or atoverriding of controls. Accordingly, even effective internal controls can provide only reasonable assurances with respect to financial statement preparation. Also, projections of any other time an officerevaluation of effectiveness to future periods are subject to the risk that controls may become inadequate because of changes in conditions, or employeethat the degree of compliance with the policies or procedures may deteriorate.Company. During fiscal 2022, noneinternal control over financial reporting as of our executive officers served as a memberFebruary 3, 2024. In making this assessment, management used the criteria set forth by the Committee of Sponsoring Organizations of the boardTreadway Commission (COSO) in Internal Control-Integrated Framework (2013).directors or compensation committeeFebruary 3, 2024.any other entity that had one or more executive officers serving as a memberFebruary 3, 2024, which appears below.our Board or Compensation Committee.Directors
Destination XL Group, Inc.:32Opinion on Internal Control Over Financial Reporting
March 21, 2024Security Ownership of Certain Beneficial OwnersThe following table sets forth certain informationInformation with respect to persons knownthis item is incorporated by reference from our definitive proxy statement (or amendment to usthis Annual Report on Form 10-K) to be filed with the beneficial owners of more than five percentSEC within 120 days of the issued and outstanding shares of our common stock as of May 12, 2023. We were informed that, except as indicated, each person has sole voting and investment power with respect to all shares of our common stock shown as beneficially owned by such person, subject to community property laws where applicable.
c/o Special Situations Funds
527 Madison Avenue, Suite 2600
New York, New York 10022
35 Mason Street
2nd Floor
Greenwich, Connecticut 06830
55 East 52nd Street
New York, New York 10055
100 N Wilkes Barre Blvd.
Wilkes Barre, PA 18702
100 Vanguard Blvd.
Malvern, Pennsylvania 19355(1)Beneficial ownership is determined in accordance with the rulesend of the SEC and generally includes voting or investment power with respect to securities. In computing the number of shares beneficially owned by a person and the percentage ownership of that person, shares of our common stock subject to options and warrants held by that person that are currently exercisable, or that become exercisable within 60 days, and shares of deferred stock are deemed outstanding. Such shares, however, are not deemed outstanding for the purpose of computing the percentage ownership of any other person. Percentage ownership is based on 62,895,439shares of our common stock outstanding as of May 12, 2023.(2)Based on a Form 4 filed on March 17, 2023. AWM Investment Company, Inc. is the investment adviser to Special Situations Fund III QP, L.P. (“SSFQP”), Special Situations Cayman Fund, L.P. (“SSCF”) and Special Situations Private Equity Fund, L.P. (“SSPE,” and together with SSFQP and SSCF, “the Funds”). Of the shares reflected in the table, (i) 5,729,930 shares are held directly by SSFQP, (ii) 1,799,797 shares are held directly by SSCF and (iii) 1,869,570 shares are held directly by SSPE. As the investment adviser to the Funds, AWM holds sole voting and investment power over these shares.(3)Based on Schedule 13G, dated May 23, 2023. Wolf Hill Capital Management, LP (“Wolf Hill Capital”) is the investment manager of, and may be deemed to indirectly beneficially own, (i) 3,663,323 shares owned by Wolf Hill Partners, LP (the “Fund”) and (ii) 1,168,017 shares held in certain separate managed accounts for whom Wolf Hill Capital acts as sub-advisor ("Managed Accounts"). Wolf Hill General Partner, LLC is the general partner of both Wolf Hill Capital and the Fund and may be deemed to beneficially own securities owned by each of them. Mr. Gary Lehrman is the managing member of, and may be deemed to beneficially own, securities owned by Wolf Hill General Partner, LLC. The Fund disclaims beneficial ownership of the shares held by the Managed Accounts, and the Managed Accounts disclaim beneficial ownership of the shares held by the Fund.(4)Based on Schedule 13G, datedfiscal year ended February 3, 2023. BlackRock Inc. and its subsidiaries BlackRock Advisors, LLC, Aperio Group, LLC, BlackRock Asset Management Canada Limited, BlackRock Fund Advisors, BlackRock Institutional Trust Company, National Association, BlackRock Financial Management, Inc. and BlackRock Investment Management, LLC reported beneficial ownership of an aggregate of 3,681,487 shares of common stock for which they possess sole dispositive power, and an aggregate of 3,631,970 shares of common stock for which they possess sole voting power.(5)2024.Based on Amendment No. 63 to Schedule 13D dated January 12, 2023. Of these shares, 278,733 shares are held by Jewelcor Management, Inc. Mr. Holtzman is the chairman, chief executive officer and president and, together with his wife, indirectly, the majority shareholder of Jewelcor Management, Inc.(6)Based on Schedule 13G, dated February 9, 2023. Of the shares reflected in the table, The Vanguard Group possesses shared dispositive power for 140,471 shares of common stock, sole dispositive power for 3,016,602 shares of common stock and shared voting power of 121,161 shares of common stock.33The following table sets forth certain information as of May 12, 2023, with respect to our directors, our Named Executive Officers (as defined above under “Executive Compensation”) and our directors and executive officers as a group. Except as indicated, each person has sole voting and investment power with respect to all shares of our common stock shown as beneficially owned by such person, subject to community property laws where applicable.* Less than 1%(1)Beneficial ownership is determined in accordance with the rules of the SEC and generally includes voting or investment power with respect to securities. In computing the number of shares beneficially owned by a person and the percentage ownership of that person, shares of our common stock subject to options and warrants held by that person that are currently exercisable, or that become exercisable within 60 days, and shares of deferred stock are deemed outstanding. Such shares, however, are not deemed outstanding for the purpose of computing the percentage ownership of any other person. Percentage ownership is based on 62,895,439 shares of our common stock outstanding as of May 12, 2023.(2)Includes 15,000 shares subject to stock options exercisable within 60 days.(3)Includes 490,431 shares subject to stock options exercisable within 60 days.(4)Includes 187,977 shares subject to stock options exercisable within 60 days.(5)Includes 144,714 shares subject to stock options exercisable within 60 days.(6)Includes 197,446 shares subject to stock options exercisable within 60 days.(7)Includes 154,319 shares subject to stock options exercisable within 60 days.(8)Includes 15,000 shares subject to stock options exercisable within 60 days and 435,568 shares of deferred stock receivable upon Mr. Mesdag’s separation from the Board. Mr. Mesdag is the president, sole executive officer, sole director and sole shareholder of Red Mountain Capital Management, Inc. Of the 2,569,765 shares owned (i) 420,286 shares are held by the Mesdag Family Limited Partnership, (ii) 97,529 shares are held by the Mesdag Family Foundation, (iii) 44,746 shares are held by the 2012 Mesdag Trust, (iv) 1,763,373 shares are held by Red Mountain Capital Partners LLC, and (v) 243,831 shares are held by Red Mountain Capital Management Inc. Mr. Mesdag disclaims beneficial ownership of the reported securities, except to the extent of his pecuniary interest therein. With the exception of the stock options and deferred stock, these shares are held in a margin account. There are currently no margin borrowings on the account, nor have there ever been, and the shares are not otherwise pledged.(9)Includes 1,538,878 shares subject to stock options exercisable within 60 days and 435,568 shares of deferred stock.34EQUITY COMPENSATION PLAN INFORMATIONThe following is a summary of information with respect to our equity compensation plans as of January 28, 2023:
issued upon exercise of
outstanding options,
warrants and rights
(a)
exercise price of
outstanding
options, warrants
and rights
(b)
remaining available for
future issuance under
equity compensation plans
(excluding securities
reflected in column (a))
(c)(1)Includes 3,556,434 outstanding stock options, 520,008 outstanding RSUs, 240,000 outstanding PSUs and 435,568 outstanding deferred stock awards.(2)The weighted-average exercise price is calculated solely based upon outstanding stock options and excludes RSUs, PSUs and deferred stock awards.(3)Pursuant to the Non-Employee Director Compensation Plan, we have 1,500,000 shares authorized for stock issuances in lieu of cash director fees, of which 694,066 shares were available at January 28, 2023.Review, Approval or Ratification of TransactionsInformation with Related PersonsPursuantrespect to its charter, the Audit Committee reviews all related-party transactionsthis item is incorporated by reference from our definitive proxy statement (or amendment to this Annual Report on an ongoing basis and,Form 10-K) to the extent required by the Sarbanes−Oxley Act of 2002,be filed with the SEC or Nasdaq, all such transactions must be approved by the Audit Committee except as otherwise delegated by the Audit Committee to another independent bodywithin 120 days of the Board.There have been no related party transactions since January 30, 2022, in which the Company was a participant and in which any director or executive officerend of the Company, any known 5% or greater stockholder of the Company or any immediate family member of any of the foregoing persons, had a direct or indirect material interest as defined in Item 404(a) of Regulation S-K. As permitted by SEC rules, discussion of employment relationships or transactions involving the Company’s executive officers and directors, and compensation solely resulting from such employment relationships or transactions, or service as a director of the Company, as the case may be, has been omitted to the extent disclosed in the Executive Compensation or the Director Compensation section of this Amendment, as applicable.Director IndependenceOur Board is currently comprised of seven members, all of whom are independent, under the rules for Nasdaq, other than Mr. Kanter, the Company’s CEO.fiscal year ended February 3, 2024.The Audit Committee engaged KPMG LLPInformation with respect to serve asthis item is incorporated by reference from our independent registered public accounting firm duringdefinitive proxy statement (or amendment to this Annual Report on Form 10-K) to be filed with the SEC within 120 days of the end of the fiscal year ended January 28, 2023. KPMG LLP has served as the Company’s independent registered public accounting firm since June 6, 2013.February 3, 2024.Principal Accounting Fees and ServicesThe following table sets forth the fees accrued or paid to the Company’s independent registered accounting firm for the fiscal years ended January 28, 2023 ("fiscal 2022") and January 29, 2022 (“fiscal 2021”):35(1)Audit Fees related to professional services rendered in connection with the audits of our financial statements included in our Annual Reports on Form 10-K and services performed related to compliance with Section 404 of the Sarbanes-Oxley Act of 2002, reviews of the financial statements included in each of our Quarterly Reports on Form 10-Q, and services normally provided by the independent auditor in connection with statutory and regulatory filings in both fiscal years. (2)Tax fees related to professional services rendered in connection with income tax return preparation and compliance services. Tax fees for fiscal 2021 include an adjustment of $25,000 for out of scope fees that were subsequently paid but were within the amounts preapproved by the audit committee.(3)All Other Fees related to an annual fee for access to an online accounting research tool.Pre-Approval of Services by Independent AuditorsThe Audit Committee has adopted a policy governing the provision of audit and non-audit services by our independent registered public accounting firm. Pursuant to this policy, the Audit Committee will consider annually and approve the provision of audit services (including audit, review and attest services) by our independent registered public accounting firm and consider and pre-approve the provision of certain defined permitted non-audit services within a specified dollar limit. It will also consider on a case-by-case basis and approve specific engagements that do not fit within the definition of pre-approved services or established fee limits, if appropriate. The policy provides that any proposed engagement that does not fit within the definition of a pre-approved service or is not within the fee limits must be presented to the Audit Committee for consideration at its next regular meeting or to the Chair of the Audit Committee in time sensitive cases. The Audit Committee will regularly review summary reports detailing all services (and related fees and expenses) being provided to us by the independent registered public accounting firm.All of the services provided in fiscal 2022 and fiscal 2021 under Audit Fees, Tax Fees and All Other Fees were pre-approved by the Audit Committee.363768DESTINATION XL GROUP, INC.May 30, 2023/s/ HARVEY S. KANTERHarvey/s/ HARVEY S. KanterKPresident and Chief Executive OfficerANTERPETER H. STRATTON, JR.LIONEL F. CONACHERPeter H. Stratton, Jr.Executive Vice President, Chief Financial Officer and Treasurer3869