UNITED STATES SECURITIES AND EXCHANGE COMMISSION
WASHINGTON, D. C. 20549
FORM 10-K/A
(Mark One)
[ X ] ANNUAL REPORT PURSUANT TO SECTION 13 OR 15(d) OF THE SECURITIES
EXCHANGE ACT OF 1934 [FEE REQUIRED]
For the fiscal year ended December 31, 2005.
OR
[ ] TRANSITION REPORT PURSUANT TO SECTION 13 OR 15(d) OF THE SECURITIES
EXCHANGE ACT OF 1934 [NO FEE REQUIRED]
For the transition period from __________________ to ______________________
Commission file number 0-13089
-------
10-K
x | ANNUAL REPORT PURSUANT TO SECTION 13 OR 15(d) OF THE SECURITIES EXCHANGE ACT OF 1934 |
For the fiscal year ended December 31, 2007. | |
OR | |
o | TRANSITION REPORT PURSUANT TO SECTION 13 OR 15(d) OF THE SECURITIES EXCHANGE ACT OF 1934 |
Commission file number 0-13089 | |
Hancock Holding Company
- --------------------------------------------------------------------------------------------
(Exact
(Exact name of registrant as specified in its charter)
Mississippi 64-0693170
- -------------------------------- ------------------------------------------
(State or other jurisdiction of (I.R.S. Employer Identification Number)
incorporation or organization)
One Hancock Plaza, Gulfport, Mississippi 39501
- ------------------------------------------ ------------
(Address of principal executive offices) (Zip Code)
Registrant's telephone number, including area code (228) 868-4727
--------------
Securities registered pursuant to Section 12(b) of the Act:
Name of Each Exchange on
Title of Each Class Which Registered
------------------- -------------------------
NONE NONE
Mississippi | 64-0693170 | |
(State or other jurisdiction of incorporation or organization) | (I.R.S. Employer Identification Number) | |
One Hancock Plaza, Gulfport, Mississippi 39501 | (228) 868-4727 | |
(Address of principal executive offices) (Zip Code) | Registrant’s telephone number, including area code | |
Securities registered pursuant to Section 12(b) of the Act: | ||
COMMON STOCK, $3.33 PAR VALUE | The NASDAQ Stock Market, LLC | |
(Title of Class) | (Name of Exchange on Which Registered) | |
Securities registered pursuant to Section 12(g) of the Act: COMMON STOCK, $3.33 PAR VALUE
- -------------------------------------------------------------------------------------------
(Title of Class)
NONE
Indicate by check mark if the registrant is a well-known seasoned issuer, as defined in Rule 405 of the Securities Act. Yes Xx No ------ ------
o
Indicate by check mark if the registrant is not required to file reports pursuant to Section 13 or Section 15(d) of the Act. Yes oNo X
------ ------
Continued
xIndicate by check mark whether the registrant (1) has filed all reports required to be filed by Section 13 or 15(d) of the Securities Exchange Act of 1934 during the preceding 12 months (or for such shorter period that the registrant was required to file such reports) and (2) has been subject to such filing requirements for the past 90 days. Yes
Xx No------ ------oIndicate by check mark if disclosure of delinquent filers pursuant to Item 405 of Regulation S-K is not contained herein, and will not be contained, to the best of
registrant'sregistrant’s knowledge, in definitive proxy or information statements incorporated by reference in Part III of this Form 10-K or any amendment to this Form 10-K.------Yes o No xIndicate by check mark whether the registrant is a large accelerated filer, an accelerated filer, or a non-accelerated filer. See definition of
"accelerated“accelerated filer and large acceleratedfiler"filer” in Rule 12b-2 of the Exchange Act. (Check One):Large accelerated filer X Accelerated filer Non-accelerated filer ------ ------ ------
Large accelerated filer x | Accelerated filer o | Non-accelerated filer o |
Indicate by check mark whether the registrant is a shell company (as defined in Rule 12b-2 of the Act).
Yes oNo X
------ ------
x
The aggregate market value of the voting common stock held by non-affiliatesnonaffiliates of the registrant as of February 28, 2006June 30, 2007 was approximately $1,088,719,828 (based on an average$1,010,432,173 based upon the closing market price on NASDAQ as of $44.66).such date. For purposes of this calculation only, shares held by non-affiliatesnonaffiliates are deemed to consist of (a) shares held by all shareholders other than directors and executive officers of the registrant plus (b) shares held by directors and officers as to which beneficial ownership has been disclaimed.
On December 31, 2005,February 8, 2007, the registrant had outstanding 32,301,12331,361,048 shares of common stock for financial statement purposes.
DOCUMENTS INCORPORATED BY REFERENCE
Portions of the Registrant’s Annual Report to Stockholders for the year ended December 31, 20052007 are incorporated by reference into Part I and Part II of this report.
Portions of the definitive Proxy Statement used in connection with the Registrant’s Annual Meeting of Shareholders to be held on March 30, 2006, filed by the Registrant on March 3, 2006,27, 2008 are incorporated by reference into Part III of this report.
Hancock Holding Company
Form 10-K
Index
CONTENTSPART I
Item 1. Business 4 Item 1A. Risk Factors 32 Item 1B. Unresolved Staff Comments 36 Item 2. Properties 37 Item 3. Legal Proceedings 38 Item 4. Submission of Matters to a Vote of Security Holders 38 PART II Item 5. Market for the Registrant's Common Stock and Related Stockholder Matters 38 Item 6. Selected Financial Data 39 Item 7. Management's Discussion and Analysis of Financial Condition and Results of Operations 39 Item 7A. Quantitative and Qualitative Disclosures About Market Risk 44 Item 8. Financial Statements and Supplementary Data 44 Item 9. Changes in and Disagreements with Accountants on Accounting and Financial Disclosure 44 Item 9A. Controls and Procedures 45 PART III Item 10. Directors and Executive Officers of the Registrant 46 Item 11. Executive Compensation 48 Item 12. Security Ownership of Certain Beneficial Owners and Management 48 Item 13. Certain Relationships and Related Transactions 49 Item 14. Principal Accountant Fees and Services 49 PART IV Item 15. Exhibits and Financial Statement Schedules 49
BUSINESS |
ORGANIZATION AND CURRENT OPERATIONS
Hancock Holding Company (the Company), organized in 1984 as a bank holding company registered under the Bank Holding Company Act of 1956, as amended, is headquartered in Gulfport, Mississippi. In 2002, the Company qualified as a financial holding company giving it broader powers. At December 31, 2005,2007, the Company operated 100more than 162 banking and financial services offices and more than 120132 automated teller machines (ATMs) in the states of Mississippi, Louisiana, Florida and FloridaAlabama through threefour wholly-owned bank subsidiaries, Hancock Bank, Gulfport, Mississippi (Hancock Bank MS), Hancock Bank of Louisiana, Baton Rouge, Louisiana (Hancock Bank LA) and, Hancock Bank of Florida, Tallahassee, Florida (Hancock Bank FL). and Hancock Bank MS also operates a loan production office in the State of Alabama.Alabama, Mobile, Alabama (Hancock Bank AL). Hancock Bank MS, Hancock Bank LA, Hancock Bank FL and Hancock Bank FLAL are referred to collectively as the “Banks”.
The Banks are community oriented and focus primarily on offering commercial, consumer and mortgage loans and deposit services to individuals and small to middle market businesses in their respective market areas. The Company’s operating strategy is to provide its customers with the financial sophistication and breadth of products of a regional bank, while successfully retaining the local appeal and level of service of a community bank. At December 31, 2005,2007, the Company had total assets of $5.95$6.1 billion and employed1,888 employees on a full-time equivalent basis 1,203 persons in Mississippi, 495 persons in Louisiana and 37 persons in Florida.basis.
Hancock Bank MS was originally chartered as Hancock County Bank in 1899. Since its organization, the strategy of Hancock Bank MS has been to achieve a dominant market share on the Mississippi Gulf Coast. Prior to a series of acquisitions begun in 1985, growth was primarily internal and was accomplished by branch expansions in areas of population growth where no dominant financial institution previously served the market area. Economic expansion on the Mississippi Gulf Coast has resulted primarily from growth of military and government-related facilities, tourism, port facility activities, industrial complexes and the gaming industry. Based on the most current available published data, Hancock Bank MS has the largest deposit market share in each of the following fourfive counties: Harrison, Hancock, Jackson, Lamar and Pearl River. In addition, Hancock Bank MS has a significant presence in the following counties: Lamar, Forrest and Jefferson Davis. With assets of $3.6 billion atAt December 31, 2005,2007, Hancock Bank MS was ranked the third largest bank in Mississippi.had total assets of $3.4 billion and 1,259 employees on a full-time equivalent basis.
In August 1990, the Company formed Hancock Bank LA to assume the deposit liabilities and acquire the consumer loan portfolio, corporate credit card portfolio and non-adversely classified securities portfolio of American Bank and Trust, Baton Rouge, Louisiana, (AmBank), from the Federal Deposit Insurance Corporation (FDIC). Economic expansion in East Baton Rouge Parish has resulted from growth in state government and related service industries, educational and medical complexes, petrochemical industries, port facility activities and transportation and related industries. With assets of $2.2 billion atAt December 31, 2005,2007, Hancock Bank LA was ranked the fourth largest bank in Louisiana.
Hurricane Katrina made landfall along the coasts of Mississippi$2.5 billion and Louisiana544 employees on August 29, 2005 and significantly impacted the operating region of the Company. Specifically, the storm caused widespread damage in the Company’s primary operating region in the Coastal Mississippi counties of Hancock, Harrison, Pearl River and Jackson. While Louisiana also suffered widespread damage from the storm, the Company’s base of operation in Louisiana is primarily in the Baton Rouge region, Central Louisiana, the communities on the North Shore of Lake Pontchartrain and Jefferson Parish (suburb of New Orleans). Due to the Company’s limited footprint in the more severely affected areas of Louisiana, damage to the Company’s facilities there was limited.
The Company implemented its disaster response plan as Hurricane Katrina approached the coast line. This plan consisted of alerting and readying key personnel to be transported to the Company’s disaster recovery site in Chicago, Illinois. Additional personnel were moved to Company-owned sites in Baton Rouge, Louisiana and Tallahassee, Florida. The Company continued to operate in a disaster recovery mode until such time it was safe and practical to resume full operations in the Gulfport, Mississippi area. As of December 31, 2005, essentially all disaster recovery operations have ceased and the Company had resumed full operations in the Gulfport, Mississippi area. See analysis of allowance for loan losses in Item 1, Item 2 and Item 7 for further discussion.
On July 1, 2005, Hancock Insurance Agency acquired 100% of the stock of J Everett Eaves, Inc., a well-known commercial insurance agency operating in the New Orleans, Louisiana market. The transaction resulted in recording intangibles of approximately $4.7 million. Upon completion of an intangibles valuation to be performed by an independent third party, the intangibles will be reallocated among goodwill (its current classification), value of insurance expirations and non-compete agreements. The latter two categories are amortizable intangibles and will be assigned appropriate lives based on valuations.
An intangibles valuation relating to the intangibles recorded in the acquisition of Ross King Walker, Inc. in late 2004 was completed during 2005. The reallocation of intangibles resulted in the recording of three separate categories of intangible assets: value of insurance expirations, $1.1 million; non-compete agreements, $0.2 million and goodwill of $1.3 million. The value of insurance expirations and non-compete agreement assets are being amortized over 10 year and 5 year lives, respectively, on an acceleratedfull-time equivalent basis.
During March 2004, the Company acquired the majority of loans, securities and deposits of the former Guaranty National Bank (GNB) of Tallahassee, Florida. The Office of the Comptroller of Currency (OCC) closed all locations of GNB on March 12, 2004. With the transaction, the Company acquired five locations with approximately $40.0 million in performing loans and approximately $69.0 million in deposits from the FDIC for a premium of $12.6 million, or 18% of acquired deposits. The Company acquired $77.4 million in assets, net of related deposit liabilities. In accounting for the transaction, management considered it to be an “acquisition of business” and, accordingly, accounted for it under the purchase method of accounting pursuant to Statement of Financial Accounting Standards (SFAS) No. 141. Final allocations of asset and liability fair values have been recorded based on an analysis performed by an independent third party, of deposit balances acquired in this transaction. In addition to adjustments to properly allocate asset fair values, an adjustment to reduce goodwill by approximately $1.1 million was recorded in association with the sale of a building acquired through a subsequent settlement activity related to this transaction.CURRENT OPERATIONS
Loan Production and Credit Review:Review
The Banks’ primary lending focus is to provide commercial, consumer, commercial leasing and real estate loans to consumers and to small and middle market businesses in their respective market areas. The Banks have no significant concentrations of loans to particular borrowers or industries or loans to any foreign entities. Each loan officer has Board approved loan limits on the principal amount of secured and unsecured loans that can be approved for a single borrower without prior approval of a loan committee.one or more Regional Credit Officers. All loans, however, must meet the credit underwriting standards and loan policies of the Banks.
All loans over an individual loan officer’s Board approved lending authority must be approved by one of the Bank’s centralized loan committee, the region’s loan committeeunderwriting units, by a senior lender or by another loan officer with greater lending authority. Both the regional loan committee and the Bank’s senior loan committee must review and approve any loan for a borrower whose total indebtedness exceeds the region’s approved limit.one or more Regional Credit Officers. Each loan file is reviewed by the Bank’s loan operations quality assurance function, a component of its loan review system, to ensure
proper documentation and asset quality.
Loan Review and Asset Quality:Quality
Each Bank’s portfolio of loan relationships aggregating $500,000 or more is reviewed every 12 to 18 months by the respective BankBank’s Loan Review staff to identify any deficiencies and report them to management to take corrective actions as necessary. Periodically, selected loan relationships aggregating less than $500,000 are also reviewed. As a result of such reviews, each Bank places on its WatchlistWatch list, loans requiring close or frequent review. All loans over $100,000 classified by a regulatory auditor are also placed on the Watchlist.Watch list. All WatchlistWatch list and past due loans are reviewed monthly by the Banks’ senior lending officersofficers. All Watch list loans are reviewed monthly by the Bank’s Asset Quality Committee and quarterly by the Banks’ Board of Directors.Directors’ Loan Oversight Committee.
In addition, in the approval process, all loans to a particular borrower are considered, regardless of classification, each time such borrower requests a renewal or extension of any loan or requests a new loan. All lines of credit are reviewed annually before renewal. The Banks currently have mechanisms in place that allow for at least anrequire borrowers to submit annual review of the financial statements, and the financial condition of all borrowers, except borrowers with secured installment and residential mortgage loans.
Consumer loans, which become 6030 days delinquent, are reviewed regularly by management. Generally, a consumer loan, which is delinquent 120 days, is in process of collection through repossession and liquidation of collateral or has been deemed currently uncollectible. Loans deemed currently uncollectible are charged-off. As a matter of policy, loans are placed on a nonaccrual status when the loan is 1) maintained on a cash basis due to the deterioration in the financial condition of the borrower, 2) payments,(1) payment in full, of principal or interest areis not expected or 3)(2) the principal or interest has been in default for a period of 90 days, unless the loan is well secured and in the process of collection.
The Banks follow the standard FDIC loan classification system. This system provides management with (1) a general view of the quality of the overall loan portfolio (each branch’sBank’s loan portfolio and each commercial loan officer’s loan portfolio) and (2) information on specific loans that may need individual attention.
The Bank’s nonperforming assets, consisting of real property, vehicles and other items held for resale, which were acquired generally through the process of foreclosure. At December 31, 2005,2007, the book value of real estatethose assets held for resale was approximately $1.8$2.2 million.
Securities Portfolio:Portfolio
The Banks maintain portfolios of securities consisting primarily of U.S. Treasury securities, U.S. government agency issues, mortgage-backed securities, CMOs and tax-exempt obligations of states and political subdivisions. The portfolios are designed to enhance liquidity while providing acceptable rates of return. Therefore, the Banks invest only in high quality securities of investment grade quality and with a target duration, for the overall portfolio, generally between two to five years.
The Banks’ policies limit investments to securities having a rating of no less than “Baa”, or its equivalent by a Nationally Recognized Statistical Rating Agency, except for certain obligations of Mississippi, Louisiana, Florida or FloridaAlabama counties, parishes and municipalities.
Deposits
The Banks have several programs designed to attract depository accounts offered to consumers and to small and middle market businesses at interest rates generally consistent with market conditions. Additionally, the Banks offer 120 ATMs:operate more than 130 ATMs at the Company’s banking offices andas well as free-standing ATMs at other locations. As members of regional and international ATM networks such as “STAR”, “PLUS” and “CIRRUS”, the Banks offer customers access to their depository accounts from regional, national and international ATM facilities. Deposit flows are controlled by the Banks primarily through pricing, and to a certain extent, through promotional activities. Management believes that the rates it offers, which are posted weekly on deposit accounts, are generally competitive with other financial institutions in the Banks’ respective market areas.
Trust Services:
The Banks, through their respective Trust Departments, offer a full range of trust services on a fee basis. The Banks act as executor, administrator or guardian in administering estates. Also provided are investment custodial services for individuals, businesses and charitable and religious organizations. In their trust capacities, the Banks provide investment management services on an agency basis and act as trustee for pension plans, profit sharing plans, corporate and municipal bond issues, living trusts, life insurance trusts and various other types of trusts created by or for individuals, businesses and charitable and religious organizations. As of December 31, 2005,2007, the Trust Departments of the Banks had approximately $5.5$8.3 billion of assets under administration compared to $5.1$7.1 billion as of December 31, 2004.2006. As of December 31, 2005, $3.32007, $4.7 billion of administered assets were corporate trust accounts and the remaining balances were personal, employee benefit, estate and other trust accounts.
Operating Efficiency Strategy:Strategy
The primary focus of the Company’s operating strategy is to increase operating income and to reduce operating expense. A Company’s operating efficiency ratio indicates the percentage of each dollar of net revenue that is used to fund operating expensesexpenses. Net revenue for a financial institution is the total of net interest income plus non-interest income, excluding securities transactions gains or losses. Operating expenses exclude the amortization of intangibles.
Other Activities:Activities
Hancock Bank MS has 6 subsidiaries through which it engages in the following activities: providing consumer financing services; mortgage lending; owning, managing and maintaining certain real property; providing general insurance agency services; holding investment securities; marketing credit life insurance; and providing discount investment brokerage services. The income of these subsidiaries generally accounts for less than 10% of the Company’s total net earnings.
In 1994, the Company began offering alternative investments through a third party vendor. The investment centers are now located in several branch locations in Mississippi and Louisiana to accommodate the investment needs of customers whose financial portfolio requirements fall outside the traditional commercial bank product line. During 1999, the investment sales force was internalized and the management structure reorganized in order to align sales activity with Company objectives.
During 2001, the Company began servicing mortgage loans for the Federal National Mortgage Association. At that time the loans serviced were originated and closed by the Company’s mortgage subsidiary. The servicing activity was also performed by this same subsidiary. In the middle of 2003, however, the Company modified its strategy and reverted to selling the majority of its conforming loans with servicing released. In December 2004, the Company’s mortgage subsidiary merged with Hancock Bank MS, its parent. Currently all mortgage activity is being reported by Hancock Bank, (MS), Hancock Bank of Louisiana, Hancock Bank of Florida and Hancock Bank of Florida.Alabama.
In July 2003, Hancock Bank MS opened a loan production office in Mobile, Alabama. Until September 2005, no deposits were accepted at this location. Subsequent to Hurricane Katrina the State of Alabama granted the Company an emergency temporary charter The Company is evaluating the possibility of requesting that the temporary charter be changed to permanent status.
Hancock Bank MS also owns approximately 3,700 acres of timberland in Hancock County, Mississippi, most of which was acquired through foreclosure in the 1930‘s.1930’s. Timber sales and oil and gas leases on this acreage generate less than 1% of the Company’s annual net income.
Competition
The deregulation of the financial services industry, the elimination of many previous distinctions between commercial banks and other financial institutions andas well as legislation enacted in Mississippi, Louisiana and other states allowing state-wide branching, multi-bank holding companies and regional interstate banking has createdhave all served to foster a highly competitive environment for commercial banking in the Company’sour market area. The principal competitive factors in the markets for deposits and loans are interest rates paid and charged. The Companyfee structures associated with the various products offered. We also competescompete through the efficiency, quality, range of services and products it provides, as well as the convenience provided by an extensive network of officecustomer access channels including local branch offices, ATM’s, online banking, and ATMtelebanking centers. Access to the bank’s extensive network of customer access points is further enhanced by convenient hours including Saturday banking at selected branch locations and office hours.through the bank’s telebanking service center.
In attracting deposits and in itsour lending activities, the Company competeswe generally compete with other commercial banks, savings associations, credit unions, mortgage banking firms, consumer finance companies, securities brokerage firms, mutual funds and insurance companies and other financial institutions. Many of these institutions have greater available resources than the Company.us.
Available Information
The Company maintains We maintain an internet website at www.hancockbank.com. The Company makeswww.hancockbank.com. We make available free of charge on the website itsour annual reports on Form 10-K, quarterly reports on Form 10-Q, current reports on Form 8-K, and amendments to those reports filed with the Securities and Exchange Commission. The Company’sOur Annual Report to Stockholders is also available on the Company’sour website. These reports are made available on the Company’sour website as soon as reasonably practical after the reports are filed with the Commission. Information on the Company’sour website is not incorporated into this Form 10-K or the Company’sour other securities filings and is not part of them.
SUPERVISION AND REGULATION
Bank Holding Company RegulationGeneral:
General
The Company is subject to extensive regulation by the Board of Governors of the Federal Reserve System (the Federal Reserve) pursuant to the Bank Holding Company Act of 1956, as amended (the Bank Holding Company Act). On January 26, 2002 the Company qualified as a financial holding company, giving it broader powers as discussed below. To date, the Company has exercised its powers as a financial holding company to acquire a non-controlling interest in a third party service provider for insurance companies and, in December 2003, acquired Magna Insurance Company. The Company also is required to file certain reports with, and otherwise complies with the rules and regulations of, the Securities and Exchange Commission (the Commission) under federal securities laws.
Federal Regulation:Regulation
The Bank Holding Company Act generally prohibits a corporation owning a bank from engaging in activities other than banking, managing or controlling banks or other permissible subsidiaries. Acquiring or obtaining control of more than 5% of the voting shares of any company engaged in activities other than those activities determined by the Federal Reserve to be so closely related to banking, managing or controlling banks as to be proper incident thereto is also prohibited. In determining whether a particular activity is permissible, the Federal Reserve considers whether the performance of the activity can reasonably be expected to produce benefits to the public that outweigh possible adverse effects. For example: making, acquiring or servicing loans; leasing personal property; providing certain investment or financial advice; performing certain data processing services; acting as agent or broker in selling credit life insurance, and performing certain insurance underwriting activities have all been determined by regulations of the Federal Reserve to be permissible activities. The Bank Holding Company Act does not place territorial limitations on permissible bank-related activities of bank holding companies. Despite prior approval, however, the Federal Reserve has the power to order a holding company or its subsidiaries to terminate any activity or its control of any subsidiary when it has reasonable cause to believe that continuation of such activity or control of such subsidiary constitutes a serious risk to the financial safety, soundness or stability of any bank subsidiary of that holding company.
The Bank Holding Company Act requires every bank holding company to obtain the prior approval of the Federal Reserve: (1) before it may acquire ownership or control of any voting shares of any bank if, after such acquisition, such bank holding company will own or control more than 5% of the voting shares of such bank, (2) before it or any of its subsidiaries other than a bank may acquire all of the assets of a bank, (3) before it may merge with any other bank holding company, or (4) before it may engage in permissible non-banking activities. In reviewing a proposed acquisition, the Federal Reserve considers financial, managerial and competitive aspects. The future prospects of the companies and banks concerned and the convenience and needs of the community to be served must also be considered. The Federal Reserve also reviews the indebtedness to be incurred by a bank holding company in connection with the proposed acquisition to ensure that the holding company can service such indebtedness without adversely affecting the capital requirements of the holding company or its subsidiaries. The Bank Holding Company Act further requires that consummation of approved bank holding company or bank acquisitions or mergers must be delayed for a period of not less than 15 noror more than 30 days following the date of approval. During such 15 to 30-day period, complaining parties may obtain a review of the Federal Reserve’s order granting its approval by filing a petition in the appropriate United States Court of Appeals petitioning that the order be set aside.
On November 12, 1999, President Clinton signed into law the Gramm-Leach-Bliley Act of 1999 (the “Financial Services Modernization Act”). The Financial Services Modernization Act repeals the two affiliation provisions of the Glass-Steagall Act: Section 20, which restricted the affiliation of Federal Reserve Member Banks with firms “engaged principally” in specified securities activities; and Section 32, which restricts officer, director, or employee interlocks between a member bank and any company or person “primarily engaged” in specified securities activities. In addition, the Financial Services Modernization Act also contains provisions that expressly preempt any state law restricting the establishment of financial affiliations, primarily related to insurance. The general effect of the law is to establish a comprehensive framework to permit affiliations among qualified bank holding companies, commercial banks, insurance companies, securities firms, and other financial service providers by revising and expanding the Bank Holding Company Act framework to permit a holding company system to engage in a full range of financial activities through a new entity known as a Financial Holding Company. “Financial activities” is broadly defined to include not only banking, insurance, and securities activities, but also merchant banking and additional activities that the Federal Reserve, in consultation with the Secretary of the Treasury, determines to be financial in nature, incidental to such financial activities, or complementary activities that do not pose a substantial risk to the safety and soundness of depository institutions or the financial system generally.
Generally, the Financial Services Modernization Act:
• Repeals historical restrictions on, and eliminates many federal and state law barriers to, affiliations among banks, securities firms, insurance companies, and other financial service providers;
• Provides a uniform framework for the functional regulation of the activities of banks, savings institutions, and their holding companies;
• Broadens the activities that may be conducted by national banks, banking subsidiaries of bank holding companies, and their financial subsidiaries;
• Provides an enhanced framework for protecting the privacy of consumer information;
• Adopts a number of provisions related to the capitalization, membership, corporate governance, and other measures designed to modernize the Federal Home Loan Bank system;
• Modifies the laws governing the implementation of the Community Reinvestment Act
("CRA"(“CRA”); and• Addresses a variety of other legal and regulatory issues affecting both day-to-day operations and long-term activities of financial institutions.
The Financial Services Modernization Act requires that each bank subsidiary of a financial holding company be well capitalized and well managed as determined by the subsidiary bank’s principal regulator. To be considered well managed, the bank must have received at least a satisfactory composite rating and a satisfactory management rating at its last examination. To be well capitalized, the bank must have a leverage capital ratio of 5%, a Tier 1 Risk-based capital ratio of 6% and a total risk-based capital ratio of 10%. These ratios are discussed further below. In the event a financial holding company becomes aware that a subsidiary bank ceases to be well capitalized or well managed, it must notify the Federal Reserve and enter into an agreement to cure such condition. The consequences of a failure to cure such condition are that the Federal Reserve Board may order divestiture of the bank. Alternatively, a financial holding company may comply with such order by ceasing to engage in the financial holding company activities that are unrelated to banking or otherwise impermissible for a bank holding company.
The Federal Reserve has adopted capital adequacy guidelines for use in its examination and regulation of bank holding companies and financial holding companies. The regulatory capital of a bank holding company or financial holding company under applicable federal capital adequacy guidelines is particularly important in the Federal Reserve’s evaluation of a holding company and any applications by the bank holding company to the Federal Reserve. If regulatory capital falls below minimum guideline levels, a financial holding company may lose its status as a financial holding company and a bank holding company or bank may be denied approval to acquire or establish additional banks or non-bank businesses or to open additional facilities. In addition, a financial institution’s failure to
meet minimum regulatory capital standards can lead to other penalties, including termination of deposit insurance or appointment of a conservator or receiver for the financial institution. There are two measures of regulatory capital presently applicable to bank holding companies, (1) risk-based capital and (2) leverage capital ratios.
The Federal Reserve rates bank holding companies by a component and composite 1-5 rating system. This system is designed to help identify institutions, which require special attention. Financial institutions are assigned ratings based on evaluation and rating of their financial condition and operations. Components reviewed include capital adequacy, asset quality, management capability, the quality and level of earnings, the adequacy of liquidity and sensitivity to interest rate fluctuations.
The leverage ratios adopted by the Federal Reserve require all but the most highly rated bank holding companies to maintain Tier 1 Capital at 4% of total assets. Certain bank holding companies having a composite 1 rating and not experiencing or anticipating significant growth may satisfy the Federal Reserve guidelines by maintaining Tier 1 Capital of at least 3% of total assets. Tier 1 Capital for bank holding companies includes: stockholders’ equity, minority interest in equity accounts of consolidated subsidiaries and qualifying perpetual preferred stock. In addition, Tier 1 Capital excludes goodwill and other disallowed intangibles. The Company’s leverage capital ratio at December 31, 20052007 was 7.85%8.51% and 8.97%8.63% at December 31, 2004.2006.
The risk-based capital guidelines are designed to make regulatory capital requirements more sensitive to differences in risk profiles among banks and bank holding companies, to account for off-balance sheet exposure and to minimize disincentives for holding liquid assets. Under the risk-based capital guidelines, assets are assigned to one of four risk categories: 0%, 20% 50% and 100%. As an example, U.S. Treasury securities are assigned to the 0% risk category while most categories of loans are assigned to the 100% risk category. A two-step process determines the risk weight of off-balance sheet items such as standby letters of credit. First, the amount of the off-balance sheet item is multiplied by a credit conversion factor of either 0%, 20%, 50% or 100%. The result is then assigned to one of the four risk categories. At December 31, 2005,2007, the Company’s off-balance sheet items aggregated $608.4 million;$1.4 billion; however, after the credit conversion these items represented $191.5$270.2 million of balance sheet equivalents.
The primary component of risk-based capital is Tier 1 Capital, which for the Company is essentially equal to common stockholders’ equity, less goodwill and other intangibles. Tier 2 Capital, which consists primarily of the excess of any perpetual preferred stock, mandatory convertible securities, subordinated debt and general allowances for loan losses, is a secondary component of risk-based capital. The risk-weighted asset base is equal to the sum of the aggregate dollar values of assets and off-balance sheet items in each risk category, multiplied by the weight assigned to that category. A ratio of Tier 1 Capital to risk-weighted assets of at least 4% and a ratio of Total Capital (Tier 1 and Tier 2) to risk-weighted assets of at least 8% must be maintained by bank holding companies. At December 31, 2005,2007, the Company’s Tier 1 and Total Capital ratios were 11.47%11.03% and 12.73%12.07%, respectively. At December 31, 2004,2006, the Company’s Tier 1 and Total Capital ratios were 12.39%12.46% and 13.58%13.60%, respectively.
The prior approval of the Federal Reserve must be obtained before the Company may acquire substantially all the assets of any bank, or ownership or control of any voting shares of any bank, if, after such acquisition, it would own or control, directly or indirectly, more than 5% of the voting shares of such bank. In no case, however, may the Federal Reserve approve an acquisition of any bank located outside Mississippi unless such acquisition is specifically authorized by the laws of the state in which the bank to be acquired is located. The banking laws of Mississippi presently permit out-of-state banking organizations to acquire Mississippi banking organizations, provided the out-of-stateMississippi banking organization’s home state grants similar privileges to banking organizations in Mississippi.organization has been operating for at least five years. In addition, Mississippi banking organizations were granted similar powers to acquire certain out-of-state financial institutions pursuant to the Interstate Bank Branching Act, which was adopted in 1996.1994.
With the passage of The Interstate Banking and Branching Efficiency Act of 1994, adequately capitalized and managed bank holding companies are permitted to acquire control of banks in any state, subject to federal regulatory approval, without regard to whether such a transaction is prohibited by the laws of any state. Beginning June 1, 1997, federal banking regulators may approve merger transactions involving banks located in different states, without regard to laws of any state prohibiting such transactions; except that, mergers may not be approved with respect to banks located in states that, before June 1, 1997, enacted legislation prohibiting mergers by banks located in such state with out-of-state institutions. Federal banking regulators may permit an out-of-state bank to open new branches in another
state if such state has enacted legislation permitting interstate branching. The legislation further provides that a bank holding company may not, following an interstate acquisition, control more than 10% of nationwide insured deposits or 30% of deposits in the relevant state. States have the right to adopt legislation to lower the 30% limit. Additional provisions require that interstate activities conform to the Community Reinvestment Act.
The Company is required to give the Federal Reserve prior written notice of any purchase or redemption of its outstanding equity securities if the gross consideration for the purchase or redemption, when combined with the net consideration paid for all such purchases or redemptions during the preceding 12 months, is equal to 10% or more of the Company’s consolidated net worth. The Federal Reserve may disapprove such a transaction if it determines that the proposal constitutes an unsafe or unsound practice, would violate any law, regulation, Federal Reserve order or directive or any condition imposed by, or written agreement with, the Federal Reserve.
In November 1985, the Federal Reserve adopted its Policy Statement on Cash Dividends Not Fully Covered by Earnings (the Policy Statement). The Policy Statement sets forth various guidelines that the Federal Reserve believes that a bank holding company should follow in establishing its dividend policy. In general, the Federal Reserve stated that bank holding companies should pay dividends only out of current earnings. It also stated that dividends should not be paid unless the prospective rate of earnings retention by the holding company appears consistent with its capital needs, asset quality and overall financial condition.
The Company is a legal entity separate and distinct from the Banks. There are various restrictions that limit the ability of the Banks to finance, pay dividends or otherwise supply funds to the Company or other affiliates. In addition, subsidiary banks of holding companies are subject to certain restrictions on any extension of credit to the bank holding company or any of its subsidiaries, on investments in the stock or other securities thereof and on the taking of such stock or securities as collateral for loans to any borrower. Further, a bank holding company and its subsidiaries are prohibited from engaging in certain tie-in arrangements in connection with extensions of credit, or leases or sales of property or furnishing of services.
Bank Regulation
The operations of the Banks are subject to state and federal statutes applicable to state banks and the regulations of the Federal Reserve and the FDIC,FDIC. The operation of the Banks may also be subject to applicable OCC regulation, to the extent states banks are granted parity with national banks. Such statutes and regulations relate to, among other things, required reserves, investments, loans, mergers and consolidations, issuance of securities, payment of dividends, establishment of branches and other aspects of the Banks’ operations.
Hancock Bank MS is subject to regulation and periodic examinations by the FDIC and the State of Mississippi Department of Banking and Consumer Finance. Hancock Bank LA is subject to regulation and periodic examinations by the FDIC and the Office of Financial Institutions, State of Louisiana. Hancock Bank FL is subject to regulation and periodic examinations by the FDIC and the Florida Department of Financial Services. Hancock Bank AL is subject to regulation and periodic examinations by the FDIC and the Alabama State Banking Department. These regulatory authorities examine such areas as reserves, loan and investment quality, management policies, procedures and practices and other aspects of operations. These examinations are designed for the protection of the Banks’ depositors, rather than their stockholders. In addition to these regular examinations, the Company and the Banks must furnish periodic reports to their respective regulatory authorities containing a full and accurate statement of their affairs.
As a result of the enactment of the Financial Institutions Reform, Recovery, and Enforcement Act of 1989 (FIRREA), a financial institution insured by the FDIC can be held liable for any losses incurred by, or reasonably expected to be incurred by, the FDIC in connection with (1) the default of a commonly controlled FDIC-insured financial institution or (2) any assistance provided by the FDIC to a commonly controlled financial institution in danger of default.
The Banks are members of the FDIC, and their deposits are insured as provided by law by the BankDeposit Insurance Fund (BIF)(DIF). On December 19, 1991, the Federal Deposit Insurance Corporation Improvement Act of 1991 (FDICIA) was enacted. The Federal Deposit Insurance Act, as amended by Section 302 of FDICIA, calls for risk-related deposit insurance assessment rates. The risk classification of an institution will determine its deposit insurance premium. Assignment to oneThe
Federal Deposit Insurance Reform act of three capital groups, coupled with assignment to one of three supervisory sub-groups, determines which of2005 created a new risk differentiation system and established a new base assessment rate schedule, effective January 1, 2007. The final rule consolidates the existing nine risk classifications is appropriate for an institution.
Effective incategories into four and names them Risk Categories I, II, III, and IV. Risk Category I replaces the first quarter of 1996, the FDIC lowered banks’ deposit insurance premiums1A risk category. The annual rates (in basis points) are now from 45 cents to 31 cents per hundred dollars in insured deposits to a rate of 0 to 27 cents. The Banks have received a risk classification of 1A for assessment purposes. In 1997 an assessment for the Financing Corporation’s debt service was added to the FDIC quarterly premium payment. That assessment averaged 3.4643 cents per hundred dollars of insured deposits, during 2005 and 3.30 (annualized)with category I rates having a range of 5 cents to 7 cents per hundred dollars of insured deposits.
In 2007, the Banks received a risk classification of I for the first quarter of 2006.assessment purposes. Total FICO assessments paid to the FDIC amounted to $516$587.6 thousand in 2005. For2007 and $614.6 thousand in 2006. That assessment averaged 1.1 cents (annualized) per hundred dollars of insured deposits for the year ended December 31,first quarter of 2008, 1.2 cents during 2007 and 1.3 cents during 2006.
Under the provisions of the Federal Deposit Insurance Reform Act of 2005, premiums on OAKAR deposits fromHancock Bank MS and Hancock Bank LA received a one-time FDIC assessment credit of $1.9 million and $1.3 million, respectively, to be used against deposit insurance assessments beginning January 1, 2007. This credit has offset the acquisitionsentire FDIC assessment for 2007. The credit will be used up completely during the second quarter of Peoples Federal Savings Association, Lamar Bank, two Dryades Savings Bank branches and Guaranty National Bank totaled $24 thousand.2008.
In general, FDICIA subjects banks and bank holding companies to significantly increased regulation and supervision. FDICIA increased the borrowing authority of the FDIC in order to recapitalize the BIF,DIF, and the future borrowings are to be repaid by increased assessments on FDIC member banks. Other significant provisions of FDICIA require a new regulatory emphasis linking supervision to bank capital levels. Also, federal banking regulators are required to take prompt regulatory action with respect to depository institutions that fall below specified capital levels and to draft non-capital regulatory measures to assure bank safety.
FDICIA contains a “prompt corrective action” section intended to resolve problem institutions at the least possible long-term cost to the deposit insurance funds. Pursuant to this section, the federal banking agencies are required to prescribe a leverage limit and a risk-based capital requirement indicating levels at which institutions will be deemed to be “well capitalized,” “adequately capitalized,” “undercapitalized,” “significantly undercapitalized” and “critically undercapitalized.” In the case of a depository institution that is “critically undercapitalized” (a term defined to include institutions which still have positive net worth),; the federal banking regulators are generally required to appoint a conservator or receiver.
FDICIA further requires regulators to perform annual on-site bank examinations, places limits on real estate lending and tightens audit requirements. The new legislation eliminated the “too big to fail” doctrine, which protects uninsured deposits of large banks, and restricts the ability of undercapitalized banks to obtain extended loans from the Federal Reserve Board discount window. FDICIA also imposes new disclosure requirements relating to fees charged and interest paid on checking and deposit accounts. Most of the significant changes brought about by FDICIA required new regulations.
In addition to regulating capital, the FDIC has broad authority to prevent the development or continuance of unsafe or unsound banking practices. Pursuant to this authority, the FDIC has adopted regulations that restrict preferential loans and loan amounts to “affiliates” and “insiders” of banks, require banks to keep information on loans to major stockholders and executive officers and bar certain director and officer interlocks between financial institutions. The FDIC is also authorized to approve mergers, consolidations and assumption of deposit liability transactions between insured banks and between insured banks and uninsured banks or institutions to prevent capital or surplus diminution in such transactions where the resulting, continuing or assumed bank is an insured nonmember state bank, like Hancock Bank MS, Hancock Bank LA, Hancock Bank FL and Hancock Bank LA.AL.
Although Hancock Bank MS, Hancock Bank LA, Hancock Bank FL and Hancock Bank FLof AL are not members of the Federal Reserve System, they are subject to Federal Reserve regulations that require the Banks to maintain reserves against transaction accounts (primarily checking accounts). Because reserves generally must be maintained in cash or in noninterest-bearing accounts, the effect of the reserve requirements is to increase the cost of funds for the Banks. The Federal Reserve regulations currently require that reserves be maintained against net transaction accounts in the amount of 3% of the aggregate of such accounts up to $40.5$34.6 million, or, if the aggregate of such accounts exceeds $40.5$34.6 million, $1.215$1.038 million plus 10% of the total in excess of $40.5$34.6 million. This regulation is subject to an exemption from reserve requirements on a limited amount of an institution’s transaction accounts.
The Financial Services Modernization Act also permits national banks, and through state parity statutes, state banks, to engage in expanded activities through the formation of financial subsidiaries. A state bank may have a subsidiary engaged in any activity authorized for state banks directly or any financial activity, except for insurance underwriting, insurance investments, real estate investment or development, or merchant banking, which may only be conducted through a subsidiary of a Financial Holding Company. Financial activities include all activities permitted under new sections of the Bank Holding Company Act or permitted by regulation.
A state bank seeking to have a financial subsidiary, and each of its depository institution affiliates, must be “well-capitalized” and “well-managed.” The total assets of all financial subsidiaries may not exceed the lesser of 45% of a bank’s total assets, or $50 billion. A state bank must exclude from its assets and equity all equity investments, including retained earnings, in a financial subsidiary. The assets of the subsidiary may not be consolidated with the bank’s assets. The bank must also have policies and procedures to assess financial subsidiary risk and protect the bank from such risks and potential liabilities.
The Financial Services Modernization Act also includes a new section of the Federal Deposit Insurance Act governing subsidiaries of state banks that engage in “activities as principal that would only be permissible” for a national bank to conduct in a financial subsidiary. It expressly preserves the ability of a state bank to retain all existing subsidiaries. Because Mississippi permits commercial banks chartered by the state to engage in any activity permissible for national banks, the Bank will be permitted to form subsidiaries to engage in the activities authorized by the Financial Services Modernization Act. In order to form a financial subsidiary, a state bank must be well-capitalized, and the state bank would be subject to the same capital deduction, risk management and affiliate transaction rules as applicable to national banks.
In 2001, the Uniting and Strengthening America by Providing Appropriate Tools Required to Intercept and Obstruct Terrorism Act of 2001 (USA Patriot Act) was signed into law. The USA Patriot Act broadened the application of anti-money laundering regulations to apply to additional types of financial institutions, such as broker-dealers, and strengthened the ability of the U.S. Government to detect and prosecute international money laundering and the financing of terrorism. The principal provisions of Title III of the USA Patriot Act require that regulated financial institutions, including state member banks: (i) establish an anti-money laundering program that includes training and audit components; (ii) comply with regulations regarding the verification of the identity of any person seeking to open an account; (iii) take additional required precautions with non-U.S. owned accounts; and (iv) perform certain verification and certification of money laundering risk for their foreign correspondent banking relationships. The USA Patriot Act also expanded the conditions under which funds in a U.S. interbank account may be subject to forfeiture and increased the penalties for violation of anti-money laundering regulations. Failure of a financial institution to comply with the USA Patriot Act’s requirements could have serious legal and reputational consequences for the institution. The Bank has adopted policies, procedures and controls to address compliance with the requirements of the USA Patriot Act under the existing regulations and will continue to revise and update its policies, procedures and controls to reflect changes required by the USA Patriot Act and implementing regulations.
In July 2002, Congress enacted the Sarbanes-Oxley Act of 2002, which addresses, among other issues, corporate governance, auditing and accounting, executive compensation, and enhanced and timely disclosure of corporate information. Section 404 of the Sarbanes-Oxley Act requires the Company to include in its Annual Report, a report stating management’s responsibility to establish and maintain adequate internal control over financial reporting and management’s conclusion on the effectiveness of the internal controls at year end. Additionally, the Company’s independent registered public accounting firm is required to attest to and report on management’s evaluation of internal control over financial reporting.
Summary
The foregoing is a brief summary of certain statutes, rules and regulations affecting the Company and the Banks. It is not intended to be an exhaustive discussion of all the statutes and regulations having an impact on the operations of such entities.
The Company’s management has exercised its powers as a financial holding company to acquire a non-controlling interest in a third party service company for the insurance industry and, in December 2003, acquired Magna Insurance Company. Management continues to examine its strategic business plan to determine whether, based on market conditions, the relative financial conditions of the Banks, regulatory capital requirements, general economic conditions, and other factors, the Company or Banks desire to further utilize any of their expanded powers provided in the Financial Services Modernization Act.
The Company does We do not believe that the Financial Services Modernization Act will have a material adverse effect on the Company’s our
operations in the near-term. However, to the extent that it permits holding companies, banks, securities firms, and insurance companies to affiliate, the financial services industry may experience further consolidation. The Financial Services Modernization Act is intended to grant to community banks certain powers as a matter of right that larger institutions have accumulated on an ad hoc basis. Nevertheless, this act may have the result of increasing the amount of competition that the Company and the Banks face from larger institutions and other types of companies offering financial products, some of which may have substantially more financial resources than the Company and the Banks.us.
Finally, additional bills may be introduced in the future in the United States Congress and state legislatures to alter the structure, regulation and competitive relationships of financial institutions. It cannot be predicted whether and what form any of these proposals will be adopted or the extent to which the business of the Company and the Banks may be affected thereby.
Effect of Governmental Policies:Policies
The difference between the interest rate paid on deposits and other borrowings and the interest rate received on loans and securities comprise most of a bank’s earnings. In order to mitigate the interest rate risk inherent in the industry, the banking business is becoming increasingly dependent on the generation of fee and service charge revenue.
The earnings and growth of a bank will be affected by both general economic conditions and the monetary and fiscal policy of the United States Government and its agencies, particularly the Federal Reserve. The Federal Reserve sets national monetary policy such as seeking to curb inflation and combat recession. This is accomplished by its open-market operations in United States government securities, adjustments in the amount of reserves that financial institutions are required to maintain and adjustments to the discount rates on borrowings and target rates for federal funds transactions. The actions of the Federal Reserve in these areas influence the growth of bank loans, investments and deposits and also affect interest rates on loans and deposits. The nature and timing of any future changes in monetary policies and their potential impact on the Company cannot be predicted.
The following tables and other material present certain statistical information regarding the Company. This information is not audited and should be read in conjunction with the Company’s consolidated financial statements and the accompanying notes.
Net interest income, the difference between interest income and interest expense, is the most significant component of the Banks’ earnings. For internal analytical purposes, management adjusts net interest income to a “taxable equivalent” basis using a 35% federal tax rate on tax exempt items (primarily interest on municipal securities and loans).
Another significant statistic in the analysis of net interest income is the effective interest differential (also referred to as the net interest margin), which is the average of net interest earned, net interest income (te) less net interest expense, on the Company’s average earning assets. The difference between the average yield on earning assets and the effective rate paid for all deposits and borrowed funds, non-interest-bearing as well as interest-bearing, is the net interest spread. Since a portion of the Bank’s deposits does not bear interest, such as demand accounts, the rate paid for all funds is lower than the rate on interest-bearing liabilities alone. The net interest margin (te) for the years 2005 and 2004 was 4.40% and 4.44%, respectively.
Recognizing the importance of interest differential to total earnings, management places great emphasis on managing interest rate spreads. Although interest differential is affected by national, regional, and area economic conditions, including the level of loan demand and interest rates, there are opportunities to influence interest differential through appropriate loan and investment policies. These policies are designed to maximize interest differential while maintaining sufficient liquidity and availability of funds for purposes of meeting existing commitments and for investment in loans and other investment opportunities that may arise.
“Table 11 - Summary of Average Balance Sheets, Net Interest Income (te) & Interest Rates” included under the caption “Results of Operations” on pages 62 and 63 of the Company’s 2005 Annual Report to Stockholders is incorporated herein by reference.
The following table is a summary of average balance sheets that reflects average taxable and non-taxable investment income.
SUMMARY OF AVERAGE BALANCE SHEETS NET INTEREST INCOME (te)* & INTEREST RATES - ----------------------------------------------------------------------------------------------------------------------------------- (dollars in thousands) 2005 2004 2003 - ----------------------------------------------------------------------------------------------------------------------------------- Average Average Average Balance Interest Rate Balance Interest Rate Balance Interest Rate - ----------------------------------------------------------------------------------------------------------------------------------- ASSETS EARNING ASSETS Loans** (te) $2,883,020 $201,446 6.99% $2,599,561 $172,868 6.65% $2,238,245 $161,850 7.23% - ----------------------------------------------------------------------------------------------------------------------------------- Investments: Taxable 1,279,001 54,181 4.24% 1,178,810 48,921 4.15% 1,277,108 49,440 3.87% Tax-exempt * 155,414 10,822 6.96% 166,540 11,874 7.13% 189,048 13,393 7.08% - ----------------------------------------------------------------------------------------------------------------------------------- Total investment in securities 1,434,415 65,003 4.53% 1,345,350 60,795 4.52% 1,466,156 62,833 4.29% - ----------------------------------------------------------------------------------------------------------------------------------- Federal funds sold and short-term investments 129,629 4,479 3.46% 27,670 310 1.12% 51,850 597 1.15% Interest bearing deposits with other banks 8,192 80 0.98% 7,241 74 1.02% 6,136 40 0.65% - ----------------------------------------------------------------------------------------------------------------------------------- Total earning assets (te) 4,455,256 271,008 6.08% 3,979,822 234,047 5.88% 3,762,387 225,320 5.99% - ----------------------------------------------------------------------------------------------------------------------------------- NON-EARNING ASSETS Other assets 525,881 482,629 384,953 Allowance for loan losses (50,107) (38,117) (35,391) - ----------------------------------------------------------------------------------------------------------------------------------- Total assets $4,931,030 $4,424,334 $4,111,949 - ----------------------------------------------------------------------------------------------------------------------------------- LIABILITIES, PREFERRED STOCK AND COMMON STOCKHOLDERS' EQUITY INTEREST-BEARING LIABILITIES Interest-bearing transaction deposits $1,384,605 9,203 0.66% $1,360,198 8,191 0.60% $1,303,441 10,461 0.80% Time deposits 1,149,239 40,654 3.54% 1,018,165 35,056 3.44% 980,703 34,429 3.51% Public funds 644,849 17,724 2.75% 574,266 9,323 1.62% 518,613 9,301 1.79% - ----------------------------------------------------------------------------------------------------------------------------------- Total interest-bearing deposits 3,178,693 67,581 2.13% 2,952,629 52,570 1.78% 2,802,757 54,191 1.93% - ----------------------------------------------------------------------------------------------------------------------------------- Customer repurchase agreements 224,842 4,351 1.94% 195,470 1,909 0.98% 177,535 1,446 0.81% Other interest-bearing liabilities 69,057 2,887 4.18% 69,960 2,791 3.99% 56,672 2,324 4.10% - ----------------------------------------------------------------------------------------------------------------------------------- Total interest-bearing liabilities 3,472,592 74,819 2.15% 3,218,059 57,270 1.78% 3,036,964 57,961 1.91% - ----------------------------------------------------------------------------------------------------------------------------------- NON-INTEREST BEARING LIABILITIES, PREFERRED STOCK AND COMMON STOCKHOLDERS' EQUITY Demand deposits 822,733 650,106 604,448 Other liabilities 160,004 106,545 37,434 Preferred stockholders' equity - 2,240 37,069 Common stockholders' equity 475,701 447,384 396,034 - ----------------------------------------------------------------------------------------------------------------------------------- Total liabilities, preferred stock & common stockholders' equity $4,931,030 $4,424,334 $4,111,949 - ----------------------------------------------------------------------------------------------------------------------------------- Net interest income and margin (te) $196,189 4.40% $176,777 4.44% $167,359 4.45% Net earning assets and spread $982,664 3.93% $761,763 4.10% $725,423 4.08% - ----------------------------------------------------------------------------------------------------------------------------------- *Tax-equivalent and tax-effected (te) amounts are calculated using a marginal federal tax income tax rate of 35%. **Loan interest income includes loan fees of $9.2 million, $11.1 million and $9.5 million for each of the three years ended December 31, 2004. Non-accrual loans in average balances and income on such loans, if recognized, is recorded on a cash basis.
Information regarding the changes in interest income on interest-earning assets and interest expense on interest-bearing liabilities relating to rate and volume variances is included in “Table 12 - Summary of Changes in Net Interest Income (te)” under the caption “Results of Operations” on pages 62 through 64 of the Company’s 2005 Annual Report to Stockholders is incorporated herein by reference.
To control interest rate risk, management regularly monitors the volume of interest sensitive assets compared with interest sensitive liabilities over specific time intervals. The Company’s interest rate risk management policy is designed to reduce the exposure to changes in its net interest margin in periods of interest rate fluctuations. Interest rate risk is monitored, quantified and managed to produce an acceptable impact on short-term earnings.
The interest sensitivity gap is the difference between total interest sensitive assets and liabilities that reprice within a given time period. At December 31, 2005, the Company’s cumulative repricing gap in the one year interval was 0% or relatively evenly gapped. The neutral position represents a balance between the Company’s floating rate loan portfolio, securities portfolio cash flows and the level of short-term deposits at year end. Management believes it is well positioned for the current rate environment.
The following tables set forth the scheduled re-pricing or maturity of the Company’s assets and liabilities at December 31, 2005 and December 31, 2004. The assumed prepayment of investments and loans were based on the Company’s assessment of current market conditions on such dates. Estimates have been made for the re-pricing of savings, NOW and money market accounts. Actual prepayments and deposit withdrawals will differ from the following analysis due to variable economic circumstances and consumer behavior. Although assets and liabilities may have similar maturities or re-pricing periods, reactions will vary as to timing and degree of interest rate change.
Analysis of Interest Sensitivity at December 31, 2005 Within 6 months 1 to 3 > 3 Non-Sensitive Overnight 6 months to 1 year years years Balance Total ----------- ----------- ---------------- ----------- ----------- ---------- ----------- (amounts in thousands) Assets Securities $ - $ 321,224 $ 396,374 $ 544,557 $ 685,504 $ 11,602 $1,959,261 Federal funds sold & short-term investments 402,968 - 7,258 - - - 410,226 Loans 43,145 1,413,210 240,200 634,416 583,657 - 2,914,628 Other assets - - - - - 666,072 666,072 ----------- ----------- -------------- ----------- ----------- ---------- ------------ Total Assets $446,113 $1,734,434 $643,832 $1,178,973 $1,269,161 $677,674 $5,950,187 =========== =========== ============== =========== =========== ========== ============ Liabilities Interest bearing transaction deposits $ - $ 776,515 $ 309,737 $ 923,166 $ 155,417 $ - $2,164,835 Time deposits - 410,815 495,558 452,356 141,318 - 1,500,047 Non-interest bearing deposits - 425,444 159,876 533,352 206,266 - 1,324,938 Federal funds purchased 1,475 - - - - - 1,475 Borrowings 250,807 9 3 21 50,233 - 301,073 Other liabilities - - - - - 180,404 180,404 Shareholders' Equity - - - - - 477,415 477,415 ----------- ----------- -------------- ----------- ----------- ---------- ------------ Total Liabilities & Equity $ 252,282 $1,612,783 $ 965,174 $1,908,895 $ 553,234 $657,819 $5,950,187 =========== =========== ============== =========== =========== ========== ============ Interest sensitivity gap $ 193,831 $ 121,651 $(321,342) $ (729,922) $ 715,927 $ 19,855 Cumulative interest rate sensitivity gap $ 193,831 $ 315,482 $ (5,860) $ (735,782) $ (19,855) $ - Cumulative interest rate sensitivity gap as a percentage of total earning assets 4.0% 6.0% (0.1)% (14.0)% (0.4)% Analysis of Interest Sensitivity at December 31, 2004 Within 6 months 1 to 3 > 3 Non-Sensitive Overnight 6 months to 1 year years years Balance Total ----------- ----------- ---------------- ----------- ----------- ---------- ----------- (amounts in thousands) Assets Securities $ - $ 216,564 $ 130,944 $ 371,665 $ 583,196 $ - $1,302,369 Federal funds sold & short-term investments 142,135 - 8,126 - - - 150,261 Loans 39,370 1,327,083 214,990 583,394 543,041 - 2,707,878 Other assets - - - - - 504,218 504,218 ----------- ----------- -------------- ----------- ----------- ---------- ----------- Total Assets $ 181,505 $1,543,647 $ 354,060 $ 955,059 $1,126,237 $ 504,218 $4,664,726 =========== =========== ============== =========== =========== ========== =========== Liabilities Interest bearing transaction deposits $ - $ 867,682 $ 249,596 $ 703,988 $ 68,429 $ - $1,889,695 Time deposits - 418,642 116,162 436,094 239,999 - 1,210,897 Non-interest bearing deposits - - - - 697,353 - 697,353 Federal funds purchased 800 - - - - - 800 Borrowings 200,036 3 3 17 50,250 - 250,309 Other liabilities - - - - - 151,090 151,090 Shareholders' Equity - - - - - 464,582 464,582 ----------- ----------- -------------- ----------- ----------- ---------- ----------- Total Liabilities & Equity $ 200,836 $1,286,327 $ 365,761 $1,140,099 $1,056,031 $ 615,672 $4,664,726 =========== =========== ============== =========== =========== ========== =========== Interest sensitivity gap $ (19,331) $ 257,320 $ (11,701) $ (185,040) $ 70,206 $(111,454) Cumulative interest rate sensitivity gap $ (19,331) $ 237,989 $ 226,288 $ 41,248 $ 111,454 $ - Cumulative interest rate sensitivity gap as a percentage of total earning assets 0.0% 6.0% 5.0% 1.0% 3.0%
Income tax expense was $18.9 million in 2005, $26.6 million in 2004 and $24.6 million in 2003. Income tax expense decreased because of the lower level of pretax income in 2005. The effective income tax rate of the Company continues to be less than the statutory rate of 35%, due primarily to tax-exempt interest income. The effective tax rates for 2005, 2004 and 2003 were 26%, 30% and 31%, respectively. The 4% decrease in the Company’s effective tax rate was due to a variety of factors including an increase in tax exempt income as a percentage of pre-tax income to 17% in 2005 from 13% in 2004, Hurricane Katrina tax credits available in 2005 and relief of a tax contingency reserve for non-taxable income primarily related to bank owned life insurance. The Company expects its effective tax rate to be approximately 29% for the year 2006.
Information regarding performance and equity ratios is as follows:
December 31, -------------------------------------------------------------- 2005 2004 2003 2002 2001 ---------- ---------- ---------- ---------- ---------- Return on average assets 1.10% 1.39% 1.34% 1.32% 1.15% Return on average common equity 11.36% 13.79% 13.88% 13.13% 10.93% Dividend payout ratio 43.11% 30.37% 25.88% 25.97% 31.78% Average common equity to average assets ratio 9.65% 10.11% 9.63% 10.08% 10.51%
Additional performance ratios are contained in the “Financial Highlights” on pages 14 and 15 of the Company’s 2005 Annual Report to Stockholders incorporated herein by reference.
The Company’s general investment objective is to purchase securities that provide stable cash flows for liquidity purposes while limiting the amount of prepayment risk. Securities have been classified into one of two categories: held to maturity or available for sale.
Securities classified as held-to-maturity are carried at amortized cost.
Certain securities have been classified as available for sale based on Management’s internal assessment of the portfolio after considering the Company’s liquidity requirements and the portfolio’s exposure to changes in market interest rates, portfolio prepayment activity and balance sheet strategy. The fair value of the available-for-sale portfolio balance was approximately $2.0 billion at December 31, 2005.
The amortized costs of securities classified as available-for-sale at December 31, 2005, 2004 and 2003, were as follows (in thousands):
December 31, ---------------------------------------------------- 2005 2004 2003 --------------- ---------------- --------------- U.S. Treasury $ 50,883 $ 9,985 $ 9,966 U.S. government agencies 1,029,656 413,419 346,836 Municipal obligations 165,180 60,956 70,070 Mortgage-backed securities 484,131 352,510 348,266 CMOs 194,899 263,471 321,324 Other debt securities 48,476 7,056 7,219 Equity securities 7,520 11,225 11,723 --------------- ---------------- --------------- $ 1,980,745 $ 1,118,622 $ 1,115,404 =============== ================ ===============
The amortized cost, yield and fair value of debt securities classified as available-for-sale at December 31, 2005, by contractual maturity, were as follows (amounts in thousands):
Over One Over Five One Year Year Years Over Weighted or Through Through Ten Fair Average Less Five Years Ten Years Years Total Value Yield -------------- ------------ ------------ ------------ ------------- -------------- ------------ U.S. Treasury $ 49,563 $ 497 $ 823 $ - $ 50,883 $ 50,870 4.34% U.S. government agencies 568,433 323,876 136,193 1,154 1,029,656 1,019,260 4.41% Municipal obligations 31,763 101,936 29,713 1,768 165,180 168,207 4.44% Other debt securities 148 9,240 26,481 12,607 48,476 47,211 5.74% -------------- ------------ ------------ ------------ ------------- -------------- $ 649,907 $ 435,549 $ 193,210 $ 15,529 $ 1,294,195 $ 1,285,548 4.46% ============== ============ ============ ============ ============== ============== Fair Value $ 648,929 $ 432,026 $ 189,475 $ 15,118 $ 1,285,548 ============== ============ ============ ============ ============== Weighted Average Yield 4.63% 4.11% 4.62% 5.60% 4.46% Mortgage-backed securities & CMOs $ 679,030 $ 665,616 4.76% ============== ==============
During 2005, securities classified as held to maturity in the portfolio of one of the Company’s subsidiaries were sold. A determination was made that this action tainted the investment portfolio of the entire Company. As a result of this action and determination, all securities held by the Company have been classified to available for sale and the carrying value of those securities are adjusted to market as prescribed in Statement of Financial Accounting Standards No. 115,Accounting for Certain Investments in Debt and Equity Securities.
The amortized cost of securities classified as held-to-maturity at December 31, 2004 and 2003 were as follows (in thousands):
December 31, ----------------------------------- 2004 2003 ---------------- ---------------- U.S. Treasury $ 1,057 $ 574 U.S. government agencies 13,160 14,737 Municipal obligations 103,914 117,484 Mortgage-backed securities 23,058 18,727 CMOs 602 1,403 Other debt securities 46,110 7,058 ---------------- ---------------- $ 187,901 $ 159,983 ================ ================
The Banks’ primary lending focus is to provide commercial, consumer and real estate loans to consumers and to small and middle market businesses in their respective market areas. Diversification in the loan portfolio is a means of reducing the risks associated with economic fluctuations. The Banks have no significant concentrations of loans to particular borrowers or loans to any foreign entities.
Loan underwriting standards reduces the impact of credit risk to the Company. Loans are underwritten on the basis of cash flow capacity and collateral fair value. Generally, real estate mortgage loans are made when the borrower produces sufficient cash flow capacity and equity in the property to offset historical market devaluations. The loan loss allowance adequacy is tested quarterly based on historical losses through different economic cycles and anticipated losses specifically identified.
The following table sets forth, for the periods indicated, the composition of the loan portfolio of the Company:
Loan Portfolio ------------------ December 31, ------------------------------------------------------------------------------------- 2005 2004 2003 2002 2001 ------------------ --------------- ---------------- --------------- ---------------- (in thousands) Real estate: Residential mortgages 1-4 family $ 703,769 $ 713,266 $ 645,123 $ 539,808 $ 458,372 Residential mortgages multifamily 40,678 25,544 22,803 20,305 21,875 Home equity lines/loans 133,823 134,405 110,634 86,609 56,887 Construction and development 391,194 296,114 235,049 197,166 184,750 Nonresidential 609,647 595,013 536,389 445,733 398,704 Commercial, industrial and other 546,635 437,670 395,678 346,808 308,306 Consumer 512,549 496,926 463,642 434,407 435,205 Lease financing and depository Institutions 48,007 44,357 34,388 29,565 23,632 Credit cards and other revolving credit 14,316 16,970 15,437 14,085 12,333 ------------------ --------------- ---------------- --------------- ---------------- 3,000,618 2,760,265 2,459,143 2,114,486 1,900,064 Less, unearned income 11,432 11,705 10,499 9,504 10,025 ------------------ --------------- ---------------- --------------- ---------------- Net loans $ 2,989,186 $ 2,748,560 $ 2,448,644 $ 2,104,982 $ 1,890,039 ================== =============== ================ =============== ================
The following table sets forth, for the periods indicated, the approximate contractual maturity by type of the loan portfolio of the Company:
Loan Maturity Schedule December 31, 2005 December 31, 2004 ----------------------------------------------------- ------------------------------------------------- Maturity Range Maturity Range ----------------------------------------------------- ------------------------------------------------- After One After One Within Through After Five Within Through After Five One Year Five Years Years Total One Year Five Years Years Total -------------- ------------- ---------- ------------ ----------- ------------ ---------- ------------- (in thousands) Commercial, industrial and other $ 258,333 $ 247,378 $ 40,924 $ 546,635 $ 196,348 $ 209,179 $ 32,143 $ 437,670 Real estate - construction 252,395 120,933 17,866 391,194 168,631 114,805 12,678 296,114 All other loans 218,950 1,170,336 673,502 2,062,789 211,409 1,114,048 701,024 2,026,481 -------------- ------------- ---------- ------------ ----------- ------------ ---------- ------------- Total loans $ 729,679 $ 1,538,647 $ 732,292 $ 3,000,618 $ 576,388 $ 1,438,032 $ 745,845 $ 2,760,265 ============== ============= ========== ============ =========== ============ ========== =============
The sensitivity to interest rate changes of that portion of the Company’s loan portfolio that matures after one year is shown below:
Loan Sensitivity to Changes in Interest RatesDecember 31, ---------------------------------------- 2005 2004 ------------------- ------------------ (in thousands) Commercial, industrial, and real estate construction maturing after one year: Fixed rate $ 332,032 $ 233,589 Floating rate 126,213 135,216 Other loans maturing after one year: Fixed rate 1,320,456 1,258,394 Floating rate 492,238 556,678 ------------------- ------------------ Total $ 2,270,939 $ 2,183,877 =================== ==================
The following table sets forth nonperforming assets by type for the periods indicated, consisting of nonaccrual loans, restructured loans and real estate owned. Loans past due 90 days or more and still accruing are also disclosed.
December 31, --------------------------------------------------------------------------- 2005 2004 2003 2002 2001 ------------- ------------- ------------- ------------- ------------- (Amounts in thousands) Nonaccrual loans: Real estate $ 9,433 $ 6,945 $ 10,031 $ 10,521 $ 14,358 Commercial, industrial and other 1,185 535 2,088 1,276 2,877 Consumer, credit card and other revolving credit - - 42 73 93 ------------- ------------- ------------- ------------- ------------- Total nonperforming loans 10,617 7,480 12,161 11,870 17,328 Acquired other real estate - - - - 1,330 Foreclosed assets 1,898 3,513 5,809 5,936 1,673 ------------- ------------- ------------- ------------- ------------- Total nonperforming assets $ 12,515 $ 10,993 $ 17,970 $ 17,806 $ 20,331 ============= ============= ============= ============= ============= Loans 90+ days past due and still accruing $ 25,622 $ 5,160 $ 3,682 $ 6,407 $ 12,591 ============= ============= ============= ============= ============= Ratios (%): Nonperforming loans to net loans 0.36% 0.27% 0.50% 0.56% 0.92% Nonperforming assets to net loans and foreclosed assets 0.42% 0.40% 0.73% 0.84% 1.07% Nonperforming loans to average net loans 0.37% 0.29% 0.54% 0.61% 0.97% Allowance for loan losses to nonperforming loans 702% 544% 302% 293% 199%
The amount of interest that would have been recorded on nonaccrual loans had the loans not been classified as “nonaccrual” was $747,000, $574,000, $762,000, $662,000 and $735,000 for the years ended December 31, 2005, 2004, 2003, 2002 and 2001, respectively.
Interest actually received on nonaccrual loans was not material. The amount of interest recorded on restructured loans did not differ significantly from the interest that would have been recorded under the original terms of those loans.
The allowance for loan losses is a valuation account available to absorb losses on loans. All losses are charged to the allowance for loan losses when the loss actually occurs or when a determination is made that a loss is likely to occur; recoveries are credited to the allowance for loan losses at the time of receipt. Periodically, management estimates the probable level of losses to determine whether the allowance is adequate to absorb reasonably foreseeable, anticipated losses in the existing portfolio based on the Company’s past loan loss experience, known and inherent risks in the portfolio, adverse situations that may affect the borrowers’ ability to repay, and the estimated value of any underlying collateral and current economic conditions. All commercial loans in lending relationships with an aggregate balance of $500,000 or more are risk rated and evaluated on an individual basis, as well as, all consumer and mortgage real estate loans with a balance of $100,000 or more. All consumer and mortgage real estate loans under $100,000 are risk rated as pools of homogeneous loans and classified according to past due status. Commercial loans are reviewed for impairment at the time a loan is no longer current or at the time management is made aware of a degradation in a borrower’s financial status or a deficiency in collateral. Loss factors, indicative of the Banks’ inherent loss, are applied to loans graded by standard loan classifications in determining a general allowance. Unclassified loans are categorized and reserved for at the greater of a five-year average net charge-off ratio or a minimum threshold stated as a percentage of loans outstanding. The allowance for loan loss stated as a percentage of period end loans, used in conjunction with the evaluation of current and anticipated economic conditions, composition of the Company’s present loan portfolio, and trends in both delinquencies and nonaccruals, is a measurement standard utilized by management in determining the adequacy of the allowance. The unallocated portion of the allowance for loan losses is available to compensate for uncertainties in the process of estimating inherent losses.
During 2005, the Company’s management was presented with the challenge of developing estimates for the impact of Hurricane Katrina on the Company’s credit quality. The Company’s Chief Credit Policy Officer undertook a detailed process to review the impact of the storm on its credit customers and to develop a process to estimate the Company’s credit losses. In establishing the special allowance for the loss exposure created by Hurricane Katrina, commercial and direct installment loans were segmented by division and loss factors applied based on the estimated percentage of loans affected by the storm. The result of the aforementioned credit review process was that, on September 30, 2005, the Company established a $35.2 million specific allowance for estimated credit losses related to the impact of Hurricane Katrina on its loan portfolio. The Company is continuously reviewing the adequacy of the special storm-related allowance and views the current level to be adequate and, as such, expects no material deviations once all storm-related net charge-offs are known. Net charge-offs amounted to $8.8 million in 2005, as compared to $12.6 million in 2004. The $3.8 million decrease in net charge-offs from 2004 was related to decreases in each net charge-off category. The Company recorded storm-related net charge-offs of $2.4 million that were charged directly against the storm-related allowance of $35.2 million. As a result, the storm-related allowance was reduced by $2.4 million and as of December 31, 2005 stands at $32.9 million. Overall, the allowance for loan losses was 196% of non-performing loans and accruing loans 90 days past due at year-end 2005, compared to 252% at year-end 2004. Management utilizes several quantitative methodologies for determining the adequacy of the allowance for loan losses and is of the opinion that the allowance at December 31, 2005 is adequate.
The following table sets forth, for the periods indicated, average net loans outstanding, allowance for loan losses, amounts charged-off and recoveries of loans previously charged-off:
At and For The Years Ended December 31, -------------------------------------------------------------------------------- 2005 2004 2003 2002 2001 --------------- --------------- -------------- --------------- --------------- (in thousands) Net loans outstanding at end of period $2,989,186 $2,748,560 $2,448,644 $2,104,982 $1,890,039 =============== =============== ============== =============== =============== Average net loans outstanding $2,883,020 $2,599,561 $2,238,245 $1,961,299 $1,792,559 =============== =============== ============== =============== =============== Balance of allowance for loan losses at beginning of period $ 40,682 $ 36,750 $ 34,740 $ 34,417 $ 28,604 --------------- --------------- -------------- --------------- --------------- Loans charged-off: Real estate 226 403 291 109 45 Commercial 4,001 5,381 4,868 9,143 6,386 Consumer, credit cards and other revolving credit 11,537 14,383 14,311 14,291 9,853 Lease financing 47 261 73 10 14 --------------- --------------- -------------- --------------- --------------- Total charge-offs 15,811 20,428 19,543 23,553 16,298 --------------- --------------- -------------- --------------- --------------- Recoveries of loans previously charged-off: Real estate 33 179 180 7 2 Commercial 2,757 1,957 1,112 639 319 Consumer, credit cards and other revolving credit 4,258 5,687 5,103 5,135 4,365 Lease financing 4 - 4 - 1 --------------- --------------- -------------- --------------- --------------- Total recoveries 7,052 7,823 6,399 5,781 4,687 --------------- --------------- -------------- --------------- --------------- Net charge-offs 8,759 12,605 13,144 17,772 11,611 Provision for loan losses 42,635 16,537 15,154 18,495 9,082 Balance acquired through acquisition & other - - - (400) 8,342 --------------- --------------- -------------- --------------- --------------- Balance of allowance for loan losses at end of period $ 74,558 $ 40,682 $ 36,750 $ 34,740 $ 34,417 =============== =============== ============== =============== ===============
The following table sets forth, for the periods indicated, certain ratios related to the Company’s charge-offs, allowance for loan losses and outstanding loans:
At and For The Years Ended December 31, ---------------------------------------------------------------------- 2005 2004 2003 2002 2001 ------------ ----------- ------------ ------------ ----------- Ratios: Net charge-offs to average net loans 0.30% 0.48% 0.59% 0.91% 0.65% Net charge-offs to period-end net loans 0.29% 0.46% 0.54% 0.84% 0.61% Allowance for loan losses to average net loans 2.59% 1.56% 1.64% 1.77% 1.92% Allowance for loan losses to period-end net loans 2.49% 1.48% 1.50% 1.65% 1.82% Net charge-offs to loan loss allowance 11.75% 30.98% 35.77% 51.16% 33.74% Loan loss provision to net charge-offs 486.75% 131.19% 115.29% 104.07% 78.22%
An allocation of the loan loss allowance by major loan category is set forth in the following table. There were no relevant variations in loan concentrations, quality or terms, except for an increase in the outstanding loan portfolio balance and a decrease in the unallocated amount. The unallocated portion of the allowance is necessary given the estimates which are inherently a part of this process and is available to address inherent loss which has been previously identified. The allocation is not necessarily indicative of the category of future losses, and the full allowance at December 31, 2005 is available to absorb losses occurring in any category of loans.
December 31, --------------------------------------------------------------------------------------------- 2005 2004 2003 2002 2001 ----------------- ------------------ ------------------ ------------------ ------------------ Allowance % of Allowance % of Allowance % of Allowance % of Allowance % of for Loans for Loans for Loans for Loans for Loans Loan to Total Loan to Total Loan to Total Loan to Total Loan to Total Losses Loans Losses Loans Losses Loans Losses Loans Losses Loans -------- ------- --------- -------- --------- -------- --------- -------- --------- -------- (amounts in thousands) Real estate $23,042 62.86 $11,253 64.19 $ 9,711 63.30 $ 7,664 61.26 $ 6,701 59.29 Commercial, industrial and other 34,128 19.74 14,974 17.37 15,311 17.41 11,610 17.72 14,380 17.56 Consumer and other revolving credit 15,812 17.40 11,453 18.44 10,718 19.29 10,174 21.02 9,848 23.15 Unallocated 1,576 - 3,002 - 1,010 - 5,292 - 3,488 - -------- ------- --------- -------- --------- -------- --------- -------- --------- -------- $74,558 100.00 $40,682 100.00 $36,750 100.00 $34,740 100.00 $34,417 100.00 ======== ======= ========= ======== ========= ======== ========= ======== ========= ========
The following table sets forth the distribution of the average deposit accounts for the periods indicated and the weighted average interest rate paid on each category of deposits:
2005 2004 2003 --------------------------------- ------------------------------- -------------------------------- Percent Percent Percent Average of Rate Average of Rate Average of Rate Balance Deposits (%) Balance Deposits (%) Balance Deposits (%) ------------- ---------- ------- ------------ --------- ------- ------------- ---------- ------ (amounts in thousands) Non-interest bearing accounts $ 822,733 20.56 - $ 650,106 18.04 - $ 604,448 17.74 - NOW accounts 893,521 22.33 1.55 798,286 22.16 1.01 694,681 20.39 1.14 Money market and other savings accounts 966,636 24.16 0.83 1,007,366 27.96 0.75 984,667 28.90 0.99 Time deposits 1,318,536 32.95 3.47 1,146,976 31.84 3.23 1,123,409 32.97 3.25 ------------- -------- ------------- ---------- ------------- ---------- $ 4,001,426 100.00 $ 3,602,734 100.00 $ 3,407,205 100.00 ============= ======== ============= ========== ============= ==========
The Banks traditionally price their deposits to position themselves competitively with the local market. The Banks’ policy is not to accept brokered deposits.
Time certificates of deposit of $100,000 and greater at December 31, 2005 had maturities as follows:
December 31, 2005 ----------------- (in thousands) Three months or less $ 150,900 Over three through six months 75,311 Over six months through one year 195,381 Over one year 212,033 --------------- Total $ 633,625 ===============
The following table sets forth certain information concerning the Company’s short-term borrowings, which consist of federal funds purchased and Federal Home Loan Bank (“FHLB”) advances as well as securities sold under agreements to repurchase.
Years Ended December 31, --------------------------------------------- 2005 2004 2003 ------------- ------------- ------------- (amounts in thousands) Federal funds purchased and FHLB advances: Amount outstanding at period-end $1,475 $800 $0 Weighted average interest at period-end 3.95% 2.15% 0.00% Maximum amount at any month-end during period $55,120 $41,852 $37,000 Average amount outstanding during period $10,262 $14,181 $5,335 Weighted average interest rate during period 3.27% 1.64% 1.19% Securities sold under agreements to repurchase: Amount outstanding at period-end $250,807 $195,478 $150,096 Weighted average interest at period-end 4.29% 1.13% 0.80% Maximum amount at any month end during-period $258,508 $243,101 $105,641 Average amount outstanding during period $224,842 $195,470 $177,535 Weighted average interest rate during period 1.94% 0.98% 0.81%
Liquidity management encompasses the Company’s ability to ensure that funds are available to meet the cash flow requirements of depositors and borrowers, while also ensuring that the Company has adequate cash flow to meet it’s various needs, including operating, strategic and capital. Without proper liquidity management, the Company would not be able to perform the primary function of a financial intermediary and would not be able to meet the needs of the communities in which it has a presence and serves. In addition, the parent holding company’s principal source of liquidity is dividends from its subsidiary banks. Liquidity is required at the parent holding company level for the purpose of paying dividends to stockholders, servicing of any debt the Company may have, business combinations as well as general corporate expenses.
The asset portion of the balance sheet provides liquidity primarily through loan principal repayments, maturities of investment securities and occasional sales of various assets. Short-term investments such as federal funds sold, securities purchased under agreements to resell and maturing interest-bearing deposits with other banks are additional sources of liquidity funding. As of December 31, 2005 and 2004, free securities stood at 41.8% or $819.0 million and 28.0% or $362.8 million, respectively.
The liability portion of the balance sheet provides liquidity through various customers’ interest-bearing and non-interest-bearing deposit accounts. Purchases of federal funds, securities sold under agreements to repurchase and other short-term borrowings are additional sources of liquidity and represent the Company’s incremental borrowing capacity. These sources of liquidity are short-term in nature and are used as necessary to fund asset growth and meet short-term liquidity needs. The Company’s short-term borrowing capacity includes an approved line of credit with the Federal Home Loan Bank of $323 million and borrowing capacity at the Federal Reserve’s Discount Window in excess of $100 million. As of December 31, 2005 and 2004, the Company’s core deposits were $4.304 billion and $3.050 billion, respectively, and Net Wholesale Funding stood at $514.0 million and $480.1 million, respectively.
The Consolidated Statements of Cash Flows, (included on page 24 and 25 of the Company’s 2005 Annual Report to Stockholders, which is incorporated herein by reference), provide an analysis of cash from operating, investing, and financing activities for each of the three years in the period ended December 31, 2005. Cash flows from operations are a significant part of liquidity management, contributing significant levels of funds in 2005, 2004 and 2003.
Cash flows from operations decreased to $70.5 million in 2005 from $153.2 million in 2004 primarily due to activity related to Magna Insurance Company and lower net earnings (as a direct result of Hurricane Katrina). Net cash used by investing activities increased to $1,171.8 million in 2005 from $511.8 million in 2004 due to securities transactions, the increase in federal funds sold and sales/purchase of branches. In 2005, securities transaction activity resulted in a net use of funds, while in 2004 proceeds from the sales and maturities of securities were greater than purchases of securities. Federal funds sold increased to $260.8 million during 2005 and increased $136.4 million during 2004. The Company paid approximately $3.9 million in connection with the acquisition of a business combination in 2005 and paid approximately $29.4 million in connection with sale/purchase transactions in 2004. Cash flows from financing activities increased to $1,216.6 million in 2005 from $336.4 million in 2004 primarily due to deposit growth.
Cash flows from operations increased to $153.3 million in 2004 from $86.8 million in 2003. Net cash used by investing activities increased to $511.8 million in 2004 from $172.8 million in 2003 due to securities transactions. In 2004, securities transaction activity resulted in a net use of funds, while in 2003 proceeds from the sales and maturities of securities exceeded purchases of securities. During 2003, the Company experienced increased loan growth, which resulted in an increase in cash used by investing activities when comparing 2004 to 2003. Cash flows from financing activities increased to $336.4 million in 2004 from $76.3 million in 2003 primarily due to a net increase in deposits.
More information on liquidity can be found under the caption “Liquidity” - Table 6. Liquidity Ratios on pages 57 and 58 of the Company’s 2005 Annual Report to Stockholders, which is incorporated herein by reference.
The information under the caption “Notes to Consolidated Financial Statements”, Note 12 - Common Stockholders’ Equity on pages 38 and 39 of the Company’s 2005 Annual Report to Stockholders is incorporated herein by reference.
The Company’s non-interest Our noninterest income and expenses can be affected by increasing rates of inflation; however, unlike most industrial companies, the assets and liabilities of financial institutions such as the Banks are primarily monetary in nature. Interest rates, therefore, have a more significant impact on the Banks’ performance than the effect of general levels of inflation on the price of goods and services.
RISK FACTORS |
Congress passed the Private Securities Litigation Act of 1995 in an effort to encourage corporations to provide information about a company’s anticipated future financial performance. This act provides a safe harbor for such disclosure, which protects the companies from unwarranted litigation, if actual results are different from management expectations. In addition to historical information, this report contains forward-looking statements and information, which are based on management’s beliefs, plans, expectations and assumptions and on information currently available to management. Forward-looking statements and information presented reflects management’s views and estimates of future economic circumstances, industry conditions, Company performance and financial results. The words “may”, “should”, “expect”, “anticipate”, “intend”, “plan”, “continue”, “believe”, “seek”, “estimate” and similar expressions used in this report do not relate to historical facts and are intended to identify forward-looking statements. These statements appear in a number of places in this report, including, but not limited to, statements found in Item 1 “Business” and in Item 7 “Management’s Discussion and Analysis”. All phases of the Company’s operations are subject to a number of risks and uncertainties. Investors are cautioned that any such forward-looking statements are not guarantees of future performance and involve risks and uncertainties, and that actual results may differ materially from those projected in the forward-looking statements. Among the factors that could cause actual results to differ materially are the risks and uncertainties discussed in this report, including, without limitation, the portions referenced above, and the uncertainties set forth from time to time in the Company’s other public reports and filings and public statements, many of which are beyond the control of the Company, and any of which, or a combination of which, could materially affect the results of the Company’s operations and whether forward-looking statements made by the Company ultimately prove accurate.
Making or continuing an investment in securities issued by the Company,us, including the Company'sour common stock, involves certain risks that you should carefully consider. The risks and uncertainties described below are not the only risks that may have a material adverse effect on the Company.us. Additional risks and uncertainties also could adversely affect the Company’sour business and results of operations. If any of the following risks actually occur, the Company’sour business, financial condition or results of operations could be negatively affected, the market price for your securities could decline, and you could lose all or a part of your investment. Further, to the extent that any of the information contained in this Annual Report on Form 10-K constitutes forward-looking statements, the risk factors set forth below also are cautionary statements identifying important factors that could cause the Company’sour actual results to differ materially from those expressed in any forward-looking statements made by or on behalf of the Company.us.
The CompanyWe may be vulnerable to certain sectors of the economy.economy.
A portion of the Company’sour loan portfolio is secured by real estate. If the economy deteriorated and depressed real estate values beyond a certain point, that collateral value of the portfolio and the revenue stream from those loans could come under stress and possibly require additional provision to the allowance for loan losses. The Company’sOur ability to dispose of foreclosed real estate at prices above the respective carrying values could also be impinged, causing additional losses.
General economic conditions in the areas where the Company'sour operations or loans are concentrated may adversely affect our customers'customers’ ability to meet their obligations.
A sudden or severe downturn in the economy in the geographic markets served by the Companyus in the states of Mississippi, Louisiana, Alabama, and Florida may affect the ability of the Company’sour customers to meet loan payment obligations on a timely basis. The local economic conditions in these areas have a significant impact on the Company’sour commercial, real estate, and construction loans, the ability of borrowers to repay these loans and the value of the collateral securing such loans. Changes resulting in adverse economic conditions of the Company’sour market areas could negatively impact the financial results of the Company’sour banking operations and itsour profitability. Additionally, adverse economic changes may cause customers to withdraw deposit balances, thereby causing a strain on our liquidity.
We were not adversely affected by the Company’s liquidity.subprime market problems that arose nationwide during 2007 and which continued to deteriorate through the remainder of the year. It is not possible to predict whether the subprime issues will result in a spillover effect into the prime market, such as through a slowdown in general lending activity.
We are subject to a risk of rapid and significant changes in market interest rates.
The Company’s Our assets and liabilities are primarily monetary in nature, and as a result the Company iswe are subject to significant risks tied to changes in interest rates. The Company’sOur ability to operate profitably is largely dependent upon net interest income. Unexpected movement in interest rates markedly changing the slope of the current yield curve could cause the Company’sour net interest margins to decrease, subsequently decreasing net interest income. In addition, such changes could adversely affect the valuation of the Company’sour assets and liabilities.
At present the Company’sour one-year interest rate sensitivity position is effectively neutral,liability sensitive, such that a gradual increase in interest rates during the next twelve months should not have a significant impact on net interest income during that period. However, as with most financial institutions, the Company’sour results of operations are affected by changes in interest rates and the Company’sour ability to manage this risk. The difference between interest rates charged on interest-earning assets and interest rates paid on interest-bearing liabilities may be affected by changes in market interest rates, changes in relationships between interest rate indices, and/or changes in the relationships between long-term and short-term market interest rates. A change in this difference might result in an increase in interest expense relative to interest income, or a decrease in the Company’sour interest rate spread. More detailed discussion of this risk may be found under the caption “Interest Rate Sensitivity” at “Item 1. Business” above.
Certain changes in interest rates, inflation, or the financial markets could affect demand for the Company’sour products and the Company’sour ability to deliver products efficiently.
Loan originations, and potentially loan revenues, could be adversely impacted by sharply rising interest rates. Conversely, sharply falling rates could increase prepayments within the Company’sour securities portfolio lowering interest earnings from those investments. An underperforming stock market could reduce brokerage transactions, therefore reducing investment brokerage revenues; in addition, wealth management fees associated with managed securities portfolios could also be adversely affected. An unanticipated increase in inflation could cause the Company’sour operating costs related to salaries & benefits, technology, &and supplies to increase at a faster pace than revenues.
The fair market value of the Company’sour securities portfolio and the investment income from these securities also fluctuate depending on general economic and market conditions. In addition, actual net investment income and/or cash flows from investments that carry prepayment risk, such as mortgage-backed and other asset-backed securities, may differ from those anticipated at the time of investment as a result of interest rate fluctuations.
Changes in the policies of monetary authorities and other government action could adversely affect the Company'sour profitability.
The results of operations of the Company are affected by credit policies of monetary authorities, particularly the Federal Reserve Board. The instruments of monetary policy employed by the Federal Reserve Board include open market operations in U.S. government securities, changes in the discount rate or the federal funds rate on bank borrowings and changes in reserve requirements against bank deposits. In view of changing conditions in the national economy and in the money markets, particularly in light of the continuing threat of terrorist attacks and the current military operations in the
Middle East, we cannot predict possible future changes in interest rates, deposit levels, loan demand or the Company’sour business and earnings. Furthermore, the actions of the United States government and other governments in responding to such terrorist attacks or the military operations in the Middle East may result in currency fluctuations, exchange controls, market disruption and other adverse effects.
Natural disasters could affect the Company'sour ability to operateoperate.
The Company’s Our market areas are susceptible to hurricanes. Natural disasters, such as hurricanes, can disrupt the Company’sour operations, result in damage to properties and negatively affect the local economies in which the Company operates.we operate.
On August 29, 2005, the Company realized such a risk when Hurricane Katrina made landfall along the coasts of Mississippi and Louisiana and significantly impacted the operating region of the Company. The pretax negative impact of the storm on 2005 earnings was $32.4 million. The $32.4 million net pretax negative impact included the following items: $35.2 million (pretax) to establish a storm-related provision for credit losses, a $7.6 million charge (pretax) related to direct expenses incurred, and approximately $3.8 million (pretax) of fees and service charges that were waived to assist affected individuals and businesses. Also included in the $32.4 million impact was a pretax gain of $14.1 million on net property and casualty insurance proceeds, which had either been received or where their receipt was considered substantially assured.
The Company We cannot predict whether or to what extent damage caused by future hurricanes will affect the Company’sour operations or the economies in the Company’sour market areas, but such weather events could cause a decline in loan originations, a decline in the value or destruction of properties securing the loans and an increase in the risk of delinquencies, foreclosures or loan losses.
Insurance
As a result of Hurricane Katrina and other storms, windstorm insurance costs have increased during the past years regionally, and have also increased for all of our properties. Currently we have total windstorm coverage on our branches and subsidiaries with property values of over $100 million subject to a $5 million deductible per occurrence and $100,000 per location, with other wind losses subject to a $250,000 per occurrence deductible. We also have separate flood coverage on the branches that flooded during Hurricane Katrina. On our corporate headquarters and new data center buildings in Gulfport, during 2007 the wind and hail deductible was reduced from $15 million to $5 million and we were able to include flood and earthquake insurance coverage. We also maintain business interruption insurance. We rely on our own liquidity during the hurricane season to cover two to three months of overhead costs, and we maintain additional capital to satisfy any emergency repairs before insurance recoveries are received. During 2007 we were able to negotiate more favorable deductibles and coverage options as compared to 2006 due in part to another relatively quiet hurricane season in the Gulf Coast region. While future availability and costs of windstorm and flood insurance are unknown, this factor may result in additional insurance costs to us depending on future hurricane activity.
Greater loan losses than expected may adversely affect the Company'sour earnings.
The Company We, as lender islenders, are exposed to the risk that itsour customers will be unable to repay their loans in accordance with their terms and that any collateral securing the payment of their loans may not be sufficient to assure repayment. Credit losses are inherent in the business of making loans and could have a material adverse effect on the Company’sour operating results. The Company’sOur credit risk with respect to itsour real estate and construction loan portfolio will relate principally to the creditworthiness of corporations and the value of the real estate serving as security for the repayment of loans. The Company’sOur credit risk with respect to itsour commercial and consumer loan portfolio will relate principally to the general creditworthiness of businesses and individuals within the Company’sour local markets.
The Company makes We make various assumptions and judgments about the collectibility of itsour loan portfolio and provide an allowance for estimated loan losses based on a number of factors. The Company believesWe believe that itsour current allowance for loan losses is adequate. However, if the Company’sour assumptions or judgments prove to be incorrect, the allowance for loan losses may not be sufficient to cover actual loan losses. The CompanyWe may have to increase itsour allowance in the future in response to the request of one of itsour primary banking regulators, to adjust for changing conditions and assumptions, or as a result of any deterioration in the quality of the Company’sour loan portfolio. The actual amount of future provisions for loan losses cannot be determined at this time and may vary from the amounts of past provisions.
The projected benefit obligations of the Company'sour pension plan exceed the fair market value of its assetsthe Plan’s assets.
Investments in the portfolio of the Company’sour pension plan may not provide adequate returns to fully fund benefits as they come due, thus causing higher annual plan expenses and requiring additional contributions by the Company.us.
We may need to rely on the financial markets to provide needed capital
The Company’s Our stock is listed and traded on the NASDAQ National Market System.Global Select. Although the Company anticipateswe anticipate that itsour capital resources will be adequate for the foreseeable future to meet itsour capital requirements, at times the Companywe may depend on the liquidity of the NASDAQ market to raise equity capital. If the market should fail to operate, or if conditions in the capital markets are adverse, the Companywe may be constrained in raising capital. The Company maintainsWe maintain a consistent analyst following; therefore, downgrades in the Company’sour prospects by an analyst(s) may cause the Company’sour stock price to fall and significantly limit the Company’sour ability to access the markets for additional capital requirements. Should these risks materialize, the Company’sour ability to further expand itsour operations through internal growth may be limited.
We are subject to regulation by various Federal and State entitiesentities.
The Company is We are subject to the regulations of the Securities and Exchange Commission (“SEC”), the Federal Reserve Board, the Federal Deposit Insurance Corporation, the Mississippi Department of Banking and Consumer Finance, the Louisiana Office of Financial Institutions, , the Florida Office of Financial Regulation, the Alabama Banking Department and the Mississippi Department of Insurance. New regulations issued by these agencies may adversely affect the Company’sour ability to carry on itsour business activities. The Company isWe are subject to various Federal and State laws and certain changes in these laws and regulations may adversely affect the Company’sour operations. NoncomplianceNon compliance with certain of these regulations may impact the Company'sour business plans, including ability to branch, offer certain products, or execute existing or planned business strategies.
The Company is We are also subject to the accounting rules and regulations of the SEC and the Financial Accounting Standards Board. Changes in accounting rules could adversely affect the reported financial statements or our results of operations of the Company and may also require extraordinary efforts or additional costs to implement.
Any of these laws or regulations may be modified or changed from time to time, and the Companywe cannot be assured that such modifications or changes will not adversely affect the Company. The Company’s regulatory status is discussed in more detail under “Item 1. Business. Supervision and Regulation” above.us.
We engage in acquisitions of other businesses from time to time.
On occasion, the Companywe will engage in acquisitions of other businesses. Inability to successfully integrate acquired businesses can pose varied risks to the Company,us, including customer and employee turnover, thus increasing the cost of operating the new businesses. The acquired companies may also have legal contingencies, beyond those that the Company iswe are aware of, that could result in unexpected costs. Moreover, there can be no assurance that acquired businesses will achieve prior or planned results of operations.
We are subject to industry competition which may have an impact upon itsour success.
The Our profitability of the Company depends on itsour ability to compete successfully. The Company operatesWe operate in a highly competitive financial services environment. Certain competitors are larger and may have more resources than the Company does. The Company faceswe do. We face competition in itsour regional market areas from other commercial banks, savings and loan associations, credit unions, internet banks, finance companies, mutual funds, insurance companies, brokerage and investment banking firms, and other financial intermediaries that offer similar services. Some of the Company’sour nonbank competitors are not subject to the same extensive regulations that govern the Companyus or the Bank and may have greater flexibility in competing for business.
Another competitive factor is that the financial services market, including banking services, is undergoing rapid changes with frequent introductions of new technology-driven products and services. The Company’sOur future success may depend, in part, on itsour ability to use technology competitively to provide products and services that provide convenience to customers and create additional efficiencies in the Company’sour operations.
Future issuances of additional securities could result in dilution of shareholders'shareholders’ ownership.
The Company We may determine from time to time to issue additional securities to raise additional capital, support growth, or to make acquisitions. Further, the Companywe may issue stock options or other stock grants to retain and motivate the Company’sour employees. Such issuances of Companyour securities will dilute the ownership interests of the Company’sour shareholders.
Anti-takeover laws and certain agreements and charter provisions may adversely affect share value.
Certain provisions of state and federal law and the Company’sour articles of incorporation may make it more difficult for someone to acquire control of the Company.us. Under federal law, subject to certain exemptions, a person, entity, or group must notify the federal banking agencies before acquiring 10% or more of the outstanding voting stock of a bank holding company, including the Company’sour shares. Banking agencies review the acquisition to determine if it will result in a change of control. The banking agencies have 60 days to act on the notice, and take into account several factors, including the resources of the acquirer and the antitrust effects of the acquisition. There also are Mississippi statutory provisions and provisions in the Company’sour articles of incorporation that may be used to delay or block a takeover attempt. As a result, these statutory provisions and provisions in the Company’sour articles of incorporation could result in the Companyour being less attractive to a potential acquirer.
Securities issued by the Company,us, including the Company'sour common stock, are not FDIC insured.
Securities issued by the Company,us, including the Company’sour common stock, are not savings or deposit accounts or other obligations of any bank and are not insured by the FDIC, the Bank Insurance Fund, or any other governmental agency or instrumentality, or any private insurer, and are subject to investment risk, including the possible loss of principal.
UNRESOLVED STAFF COMMENTS |
None.
PROPERTIES |
The Company’s Our main offices areoffice is located at One Hancock Plaza, in Gulfport, Mississippi. The building has fourteen stories,
We operate 162 banking and financial services offices and 132 automated teller machines across south Mississippi, Louisiana, south Alabama and the Florida Panhandle. We lease 69 of which seven are utilized by the Company. The remaining seven stories are presently leased to outside parties.162 locations with the remainder being owned.
Title to the following banking offices in Mississippi and Louisiana is owned in fee (number of locations shown in parenthesis):
Albany, LA (1) Mandeville, LA (1) Alexandria, LA (2) Metairie, LA (2) Baker, LA (1) Moss Point, MS (1) Baton Rouge, LA (13) Ocean Springs, MS (2) Bay St. Louis, MS (2) Opelousas, LA (1) Biloxi, MS (4) Pascagoula, MS (2) Bogalusa, LA (1) Pass Christian, MS (1) Covington, LA (1) Petal, MS (1) Denham Springs, LA (3) Picayune, MS (1) D'Iberville, MS (1) Pineville, LA (1) Escatawpa, MS (1) Poplarville, MS (1) Eunice, LA (1) Prentiss, MS (1) Franklinton, LA (1) Purvis, MS (2) Gautier, MS (1) St. Francisville, LA (1) Gonzales, LA (1) Sumrall, MS (1) Gulfport, MS (5) Tallahassee, FL (4) Hammond, LA (3) Vancleave, MS (1) Hattiesburg, MS (3) Ville Platte, LA (1) Independence, LA (1) Walker, LA (1) Long Beach, MS (1) Waveland, MS (1) Loranger, LA (1) Zachary, LA (1) Lyman, MS (1)
The following banking offices in Mississippi and Louisiana are leased under agreements with unexpired terms from four to forty-nine years including renewal options (number of locations shown in parenthesis):
Baton Rouge, LA (4) Pascagoula, MS (2) Bay St. Louis, MS (3) Picayune, MS (2) Diamondhead, MS (1) Ponchatoula, LA (1) Gulfport, MS (5) Saucier, MS (1) Kiln, MS (1) Slidell, LA (1) Kenner, LA (1) Springfield, LA (1) Long Beach, MS (1) Tallahassee, FL (1)
In addition to the above, Hancock Bank MS owns land and other properties acquired through foreclosures of loan collateral. The major item is approximately 3,700 acres of timber land in Hancock County, Mississippi, which Hancock Bank MS acquired by foreclosure in the 1930‘s.1930’s.
LEGAL PROCEEDINGS |
Hurricane Katrina inflicted significant damage to many of the Company’s facilities. Of the Company’s 104 branch facilities, 40 sustained at least some damage. There were 9 branches that sustained damage between 50 and 90 percent, while an additional 7 branches were essentially 100% damaged. In addition, the Company’s main headquarters building in Gulfport, Mississippi sustained significant damage and will be uninhabitable until repairs We are complete in late summer 2006. Management has identified specific fixed asset impairment costs due to the storm totaling $8.8 million through December 31, 2005.
The Company is very well insured against property and casualty and other related losses associated with natural disasters, such as hurricanes. Through property and casualty, flood, business interruption and other forms of insurance, the Company filed insurance claims with its various providers totaling $44.0 million. Based on management’s best estimate of claims for which collection was received or substantially assured, a receivable related to insurance proceeds of $23.5 million was booked on September 30, 2005. Additional insurance proceeds are considered contingent upon reaching further agreement on claims and may be recognized as gains upon their receipt.
The Company is party to various legal proceedings arising in the ordinary course of business. In the opinion of management, after consultation with legal counsel, all such matters are adequately covered by insurance or, if not so covered, are not expected to have a material adverse effect on theour financial statements of the Company.statements.
SUBMISSION OF MATTERS TO A VOTE OF SECURITY HOLDERS |
There were no matters submitted to a vote of security holders during the quarter ended December 31, 2005.2007.
MARKET FOR THE REGISTRANT’S COMMON EQUITY, RELATED | |
STOCKHOLDER MATTERS AND ISSUER PURCHASES OF EQUITY SECURITIES | |
Market Information
Our common stock trades on the NASDAQ Stock Split:Market under the symbol “HBHC” and is quoted in publications under “HancHd.” The following table sets forth the high and low sale prices of our common stock as reported on the NASDAQ Stock Market. These prices do not reflect retail mark-ups, mark-downs or commissions.
|
|
|
|
|
|
|
|
|
|
|
|
|
|
|
|
|
|
|
|
|
|
| High |
| Low |
| Cash |
| |||||||||
|
|
|
|
|
|
| ||||||||||||
2007 |
|
|
|
|
|
|
|
|
|
|
|
|
|
|
|
|
|
|
|
| 4th quarter |
|
| $ | 43.47 |
|
|
| $ | 33.35 |
|
|
| $ | 0.240 |
|
|
|
| 3rd quarter |
|
|
| 43.90 |
|
|
|
| 32.78 |
|
|
|
| 0.240 |
|
|
|
| 2nd quarter |
|
|
| 44.37 |
|
|
|
| 37.50 |
|
|
|
| 0.240 |
|
|
|
| 1st quarter |
|
|
| 54.09 |
|
|
|
| 41.88 |
|
|
|
| 0.240 |
|
|
|
|
|
|
|
|
|
|
|
|
|
|
|
|
|
|
|
|
|
2006 |
|
|
|
|
|
|
|
|
|
|
|
|
|
|
|
|
|
|
|
| 4th quarter |
|
| $ | 56.00 |
|
|
| $ | 50.85 |
|
|
| $ | 0.240 |
|
|
|
| 3rd quarter |
|
|
| 56.79 |
|
|
|
| 49.71 |
|
|
|
| 0.240 |
|
|
|
| 2nd quarter |
|
|
| 57.19 |
|
|
|
| 44.02 |
|
|
|
| 0.220 |
|
|
|
| 1st quarter |
|
|
| 46.67 |
|
|
|
| 37.75 |
|
|
|
| 0.195 |
|
|
There were 5,847 registered holders and approximately 6,438 unregistered holders of common stock of the Company at February 8, 2007 and 31,361,048 shares issued. On February 26, 2004,8, 2007, the Company’s Board of Directors declared a two-for-one stock split in the form of 100% common stock dividend. The additional shares were payable March 18, 2004 to stockholders of record at the close of business on March 8, 2004.
All balanceshigh and information concerning earnings per share, dividends per share, and number of shares outstanding have been adjusted to give effect to this split.
The information under the caption “Market Information” on page 16low sale prices of the Company’s 2005 Annual Reportcommon stock as reported on the NASDAQ Stock Market were $41.54 and $39.92, respectively. The principal source of funds to Stockholdersthe Company to pay cash dividends is incorporated hereinthe dividends received from Hancock Bank, Gulfport, Mississippi, Hancock Bank of Louisiana, Baton Rouge, Louisiana, Hancock Bank of Alabama, Mobile, Alabama, and Hancock Bank of Florida, Tallahassee, Florida. Consequently, dividends are dependent upon earnings, capital needs, regulatory policies and statutory limitations affecting the banks. Federal and state banking laws and regulations restrict the amount of dividends and loans a bank may make to its parent company. Dividends paid to the Company by reference.
The information underHancock Bank are subject to approval by the caption “Notes to Consolidated Financial Statements”, Note 15 - Employee Stock Plans on pages 44 through 46Commissioner of Banking and Consumer Finance of the Company’s 2005 Annual ReportState of Mississippi and those paid by Hancock Bank of Louisiana are subject to Stockholders is incorporated hereinapproval by reference.
The information under the caption “Financial Highlights” on pages 14 and 15Commissioner for Financial Institutions of the State of Louisiana. Dividends paid by Hancock Bank of Florida are subject to approval by the Florida Department of Financial Services. The Company’s 2005 Annual Reportmanagement does not expect regulatory restrictions to Stockholdersaffect its policy of paying cash dividends. Although no assurance can be given that Hancock Holding Company will continue to declare and pay regular quarterly cash dividends on its common stock, the Company has paid regular cash dividends since 1937.
Stock Performance Graph
The following is incorporated hereina line graph presentation comparing cumulative, five-year shareholder returns on an indexed basis with a performance indicator of the overall stock market and an index of peer companies selected by reference.us. The broad market index used in the graph is the NASDAQ Market Index. The peer group index is a group of financial institutions in the Southeast with approximate market capitalization ranging from $1.0 billion to $2.0 billion; a list of the Companies included in the index follows the graph.
ITEM 7 - MANAGEMENT'S DISCUSSIONCOMPARE 5-YEAR CUMULAIVE TOTAL RETURN
AMONG HANCOCK HOLDING CO.,
NASDAQ MARKET INDEX AND ANALYSIS OFPEER GROUP INDEX
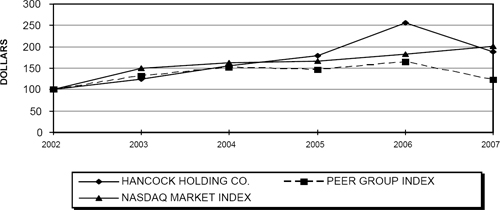
ASSUMES $100 INVESTED ON DEC. 31, 2002
ASSUMES DIVIDEND REINVESTED
FISCAL YEAR ENDING DEC. 31, 2007
AMCORE FINANCIAL INC | FIRST MIDWEST BANCORP | STERLING BANCSHARES |
BANCORPSOUTH | FIRSTMERIT CORP | SUSQUEHANNA BANCSHARES |
BANKATLANTIC BANCORP A | FNB CORPORATION FL | TRUSTMARK CORP |
BANKUNITED FINANCIAL A | IBERIA BANCORPORATION | UNITED BANCSHARES INC WV |
CAPITAL CITY BANK GROUP | PARK NATIONAL CORP | UNITED COMMUNITY BANKS |
COLONIAL BANGROUP CL A | PROSPERITY BANCSHARES | WESBANCO |
CULLEN FROST BANKERS INC | SOUTH FINANCIAL GROUP | WHITNEY HOLDING CORP |
Issuer Purchases of Equity Securities
The following table provides information underwith respect to purchases made by the caption “Management’sissuer or any affiliated purchaser of the issuer’s equity securities.
|
|
|
|
|
|
|
|
|
|
|
|
|
|
|
|
|
| (a) |
| (b) |
| (c) |
| (d) |
| ||||||
|
|
|
|
|
| ||||||||||
|
|
|
|
|
|
|
|
|
|
|
|
|
|
|
|
Oct. 1, 2007 - Oct. 31, 2007 |
| 200,868 |
|
|
| $ | 36.73 |
|
| 200,868 |
|
| 340,571 |
|
|
Nov. 1, 2007 - Nov. 30, 2007 |
| 340,571 |
|
|
|
| 36.07 |
|
| 340,571 |
|
| 3,000,000 |
|
|
Dec.1, 2007 - Dec. 31, 2007 |
| 10,842 |
|
|
|
| 38.84 |
|
| 10,842 |
|
| 2,989,158 |
|
|
|
|
|
|
|
|
|
|
|
|
|
| ||||
Total |
| 552,281 |
|
|
| $ | 36.36 |
|
| 552,281 |
|
|
|
|
|
|
|
|
|
|
|
|
|
|
|
|
| ||||
(1) | The Company publicly announced its stock buy-back program on July 18, 2000. That plan was completed in November 2007. The Company publicly announced its new stock buy-back program on November 13, 2007. |
SELECTED FINANCIAL DATA |
The following tables set forth certain selected historical consolidated financial data and should be read in conjunction with “Item 7. Management’s Discussion and Analysis of Financial Condition and Resultsresults of Operations” and the consolidated Financial Statements and Notes thereto included elsewhere herein. The following information may not be deemed indicative of our future operating results.
|
|
|
|
|
|
|
|
|
|
|
|
|
|
|
|
|
|
| At and For the Years Ended December 31, |
| |||||||||||||
|
|
| ||||||||||||||
|
| 2007 |
| 2006 |
| 2005 |
| 2004 |
| 2003 |
| |||||
|
|
|
|
|
|
| ||||||||||
|
| (Unaudited, in thousands) |
| |||||||||||||
Period-End Balance Sheet Data: |
|
|
|
|
|
|
|
|
|
|
|
|
|
|
|
|
| ||||||||||||||||
Securities |
| $ | 1,677,621 |
| $ | 1,903,658 |
| $ | 1,959,261 |
| $ | 1,302,369 |
| $ | 1,278,049 |
|
Short-term investments |
|
| 126,281 |
|
| 222,439 |
|
| 410,226 |
|
| 150,261 |
|
| 11,288 |
|
Loans, net of unearned income |
|
| 3,615,514 |
|
| 3,266,584 |
|
| 2,989,186 |
|
| 2,748,560 |
|
| 2,448,644 |
|
Total earning assets |
|
| 5,419,416 |
|
| 5,392,681 |
|
| 5,358,673 |
|
| 4,201,191 |
|
| 3,737,981 |
|
Allowance for loan losses |
|
| 47,123 |
|
| 46,772 |
|
| 74,558 |
|
| 40,682 |
|
| 36,750 |
|
Total assets |
|
| 6,055,979 |
|
| 5,964,565 |
|
| 5,950,187 |
|
| 4,664,726 |
|
| 4,150,358 |
|
Total deposits |
|
| 5,009,534 |
|
| 5,030,991 |
|
| 4,989,820 |
|
| 3,797,945 |
|
| 3,447,847 |
|
Short-term notes |
|
| — |
|
| — |
|
| — |
|
| — |
|
| 9,400 |
|
Long-term notes |
|
| 793 |
|
| 258 |
|
| 50,266 |
|
| 50,273 |
|
| 50,428 |
|
Total preferred stockholders’ equity |
|
| — |
|
| — |
|
| — |
|
| — |
|
| 37,067 |
|
Total common stockholders’ equity |
|
| 554,187 |
|
| 558,410 |
|
| 477,415 |
|
| 464,582 |
|
| 397,814 |
|
| ||||||||||||||||
Average Balance Sheet Data: |
|
|
|
|
|
|
|
|
|
|
|
|
|
|
|
|
| ||||||||||||||||
Securities |
| $ | 1,734,552 |
| $ | 2,228,822 |
| $ | 1,434,415 |
| $ | 1,345,350 |
| $ | 1,466,156 |
|
Short-term investments |
|
| 117,158 |
|
| 211,511 |
|
| 137,821 |
|
| 34,911 |
|
| 57,986 |
|
Loans, net of unearned income |
|
| 3,428,009 |
|
| 3,062,222 |
|
| 2,883,020 |
|
| 2,599,561 |
|
| 2,238,245 |
|
Total earning assets |
|
| 5,279,719 |
|
| 5,502,555 |
|
| 4,455,256 |
|
| 3,979,822 |
|
| 3,762,387 |
|
Allowance for loan losses |
|
| 46,443 |
|
| 64,285 |
|
| 50,107 |
|
| 38,117 |
|
| 35,391 |
|
Total assets |
|
| 5,851,889 |
|
| 6,031,800 |
|
| 4,931,030 |
|
| 4,424,334 |
|
| 4,111,949 |
|
Total deposits |
|
| 4,929,176 |
|
| 5,069,427 |
|
| 4,001,426 |
|
| 3,602,734 |
|
| 3,407,205 |
|
Short-term notes |
|
| — |
|
| 1,068 |
|
| 3,836 |
|
| 2,311 |
|
| 26 |
|
Long-term notes |
|
| 254 |
|
| 13,278 |
|
| 50,275 |
|
| 50,312 |
|
| 50,677 |
|
Total preferred stockholders’ equity |
|
| — |
|
| — |
|
| — |
|
| 2,240 |
|
| 37,069 |
|
Total common stockholders’ equity |
|
| 562,383 |
|
| 513,656 |
|
| 475,701 |
|
| 447,384 |
|
| 396,034 |
|
|
|
|
|
|
|
|
|
|
|
|
|
|
|
|
|
|
|
| At and For the Years Ended December 31, |
| |||||||||||||
|
|
| ||||||||||||||
|
| 2007 |
| 2006 |
| 2005 |
| 2004 |
| 2003 |
| |||||
|
|
|
|
|
|
| ||||||||||
|
| (Unaudited, in thousands) |
| |||||||||||||
Performance Ratios: |
|
|
|
|
|
|
|
|
|
|
|
|
|
|
|
|
| ||||||||||||||||
Return on average assets |
|
| 1.26 | % |
| 1.69 | % |
| 1.10 | % |
| 1.39 | % |
| 1.34 | % |
Return on average common equity |
|
| 13.14 | % |
| 19.82 | % |
| 11.36 | % |
| 13.79 | % |
| 13.88 | % |
Net interest margin (te)* |
|
| 4.08 | % |
| 4.23 | % |
| 4.40 | % |
| 4.44 | % |
| 4.45 | % |
Average loans to average deposits |
|
| 69.55 | % |
| 60.41 | % |
| 72.05 | % |
| 72.16 | % |
| 65.69 | % |
Noninterest income excluding storm-related insurance gain, gain on sale of branches and credit card merchant, and securities transactions, as a percent of total |
|
| 35.38 | % |
| 30.87 | % |
| 31.86 | % |
| 33.77 | % |
| 30.40 | % |
Noninterest expense as a percent of total revenue (te) before amortization of purchased intangibles, storm-related insurance gain, gains on sale of branches and credit card merchant, and securities transactions |
|
| 63.88 | % |
| 58.99 | % |
| 58.82 | % |
| 57.33 | % |
| 57.83 | % |
Allowance for loan losses to period-end loans |
|
| 1.31 | % |
| 1.43 | % |
| 2.49 | % |
| 1.48 | % |
| 1.50 | % |
Non-performing assets to loans plus other real estate |
|
| 0.43 | % |
| 0.13 | % |
| 0.42 | % |
| 0.40 | % |
| 0.73 | % |
Allowance for loan losses to |
|
| 241.43 | % |
| 694.67 | % |
| 195.50 | % |
| 251.85 | % |
| 169.73 | % |
Net charge-offs to average loans |
|
| 0.21 | % |
| 0.23 | % |
| 0.30 | % |
| 0.48 | % |
| 0.59 | % |
FTE employees (period-end) |
|
| 1,888 |
|
| 1,848 |
|
| 1,735 |
|
| 1,767 |
|
| 1,734 |
|
| ||||||||||||||||
Capital Ratios: |
|
|
|
|
|
|
|
|
|
|
|
|
|
|
|
|
Common stockholders’ equity to total assets |
|
| 9.15 | % |
| 9.36 | % |
| 8.02 | % |
| 9.96 | % |
| 9.59 | % |
Tier 1 leverage |
|
| 8.51 | % |
| 8.63 | % |
| 7.85 | % |
| 8.97 | % |
| 9.29 | % |
Tier 1 risk-based |
|
| 11.03 | % |
| 12.46 | % |
| 11.47 | % |
| 12.39 | % |
| 13.65 | % |
Total risk-based |
|
| 12.07 | % |
| 13.60 | % |
| 12.73 | % |
| 13.58 | % |
| 14.88 | % |
| ||||||||||||||||
Income Data: |
|
|
|
|
|
|
|
|
|
|
|
|
|
|
|
|
Interest income |
| $ | 345,865 |
| $ | 344,330 |
| $ | 263,631 |
| $ | 226,774 |
| $ | 218,149 |
|
Interest expense |
|
| 140,236 |
|
| 119,863 |
|
| 74,819 |
|
| 57,270 |
|
| 57,961 |
|
Net interest income |
|
| 205,629 |
|
| 224,467 |
|
| 188,812 |
|
| 169,504 |
|
| 160,188 |
|
Net interest income (te) |
|
| 215,167 |
|
| 232,730 |
|
| 196,189 |
|
| 176,777 |
|
| 167,358 |
|
Provision for (reversal of) loan losses |
|
| 7,593 |
|
| (20,762 | ) |
| 42,635 |
|
| 16,537 |
|
| 15,154 |
|
Noninterest income excluding storm-related insurance gain, gains on sale of branches and credit card merchant and securities transactions |
|
| 117,821 |
|
| 103,918 |
|
| 91,738 |
|
| 84,860 |
|
| 73,089 |
|
Net storm-related items |
|
| — |
|
| 5,084 |
|
| 6,584 |
|
| — |
|
| — |
|
Gains/(losses) on sales of securities, net |
|
| 308 |
|
| (5,169 | ) |
| (53 | ) |
| 163 |
|
| 1,667 |
|
Gains on sales of branches |
|
| — |
|
| — |
|
| — |
|
| 2,258 |
|
| — |
|
Gain on sale of credit card merchant services business |
|
| — |
|
| — |
|
| — |
|
| 3,000 |
|
| — |
|
Noninterest expense excluding amortization of intangibles |
|
| 212,703 |
|
| 198,591 |
|
| 169,349 |
|
| 153,006 |
|
| 139,060 |
|
Amortization of intangibles |
|
| 1,651 |
|
| 2,125 |
|
| 2,194 |
|
| 1,945 |
|
| 1,148 |
|
Net income before income taxes |
|
| 101,811 |
|
| 148,346 |
|
| 72,903 |
|
| 88,297 |
|
| 79,582 |
|
Net income |
|
| 73,892 |
|
| 101,802 |
|
| 54,032 |
|
| 61,704 |
|
| 54,955 |
|
Net income available to common stockholders |
|
| 73,892 |
|
| 101,802 |
|
| 54,032 |
|
| 61,704 |
|
| 52,302 |
|
* | Tax Equivalent (te) amounts are calculated using a marginal federal income tax rate of 35%. |
|
|
|
|
|
|
|
|
|
|
|
|
|
|
|
|
|
|
| At and For the Years Ended December 31, |
| |||||||||||||
|
|
| ||||||||||||||
|
| 2007 |
| 2006 |
| 2005 |
| 2004 |
| 2003 |
| |||||
|
|
|
|
|
|
| ||||||||||
|
| (Unaudited, in thousands, except per share data) |
| |||||||||||||
Per Common Share Data: |
|
|
|
|
|
|
|
|
|
|
|
|
|
|
|
|
Basic earnings per share |
| $ | 2.31 |
| $ | 3.13 |
| $ | 1.67 |
| $ | 1.91 |
| $ | 1.70 |
|
Diluted earnings per share |
| $ | 2.27 |
| $ | 3.06 |
| $ | 1.64 |
| $ | 1.87 |
| $ | 1.64 |
|
Cash dividends paid |
| $ | 0.960 |
| $ | 0.895 |
| $ | 0.72 |
| $ | 0.58 |
| $ | 0.44 |
|
Book value |
| $ | 17.71 |
| $ | 17.09 |
| $ | 14.78 |
| $ | 14.32 |
| $ | 13.06 |
|
Dividend payout ratio |
|
| 41.56 | % |
| 28.59 | % |
| 43.11 | % |
| 30.37 | % |
| 25.88 | % |
Weighted average number of shares outstanding |
|
|
|
|
|
|
|
|
|
|
|
|
|
|
|
|
Basic |
|
| 32,000 |
|
| 32,534 |
|
| 32,365 |
|
| 32,390 |
|
| 30,714 |
|
Diluted |
|
| 32,545 |
|
| 33,304 |
|
| 32,966 |
|
| 33,052 |
|
| 33,410 |
|
Number of shares outstanding (period-end) |
|
| 31,295 |
|
| 32,666 |
|
| 32,301 |
|
| 32,440 |
|
| 30,455 |
|
Market data: |
|
|
|
|
|
|
|
|
|
|
|
|
|
|
|
|
High closing price |
| $ | 54.09 |
| $ | 57.19 |
| $ | 39.90 |
| $ | 34.83 |
| $ | 29.25 |
|
Low closing price |
| $ | 32.78 |
| $ | 37.75 |
| $ | 28.25 |
| $ | 25.00 |
| $ | 21.00 |
|
Period-end closing price |
| $ | 38.20 |
| $ | 52.84 |
| $ | 37.81 |
| $ | 33.46 |
| $ | 27.29 |
|
Trading volume |
|
| 48,169 |
|
| 27,275 |
|
| 22,404 |
|
| 11,572 |
|
| 11,410 |
|
MANAGEMENT’S DISCUSSION AND ANALYSIS OF FINANCIAL CONDITION AND RESULTS OF OPERATIONS |
The purpose of this discussion and analysis is to focus on Pages 52 through 66significant changes and events in the financial condition and results of operations of Hancock Holding Company and our subsidiaries (Hancock) during 2007 and selected prior periods. This discussion and analysis is intended to highlight and supplement data and information presented elsewhere in this report, including the consolidated financial statements and related notes. Certain information relating to prior years has been reclassified to conform to the current year’s presentation.
FORWARD-LOOKING STATEMENTS
Congress passed the Private Securities Litigation Act of 1995 in an effort to encourage corporations to provide information about a company’s anticipated future financial performance. This act provides a safe harbor for such disclosure, which protects us from unwarranted litigation, if actual results are different from management expectations. This discussion and analysis contains forward-looking statements and reflects management’s current views and estimates of future economic circumstances, industry conditions, company performance and financial results. The words “may,” “should,” “expect,” “anticipate,” “intend,” “plan,” “continue,” “believe,” “seek,” “estimate” and similar expressions are intended to identify forward-looking statements. These forward-looking statements are subject to a number of factors and uncertainties, which could cause our actual results and experience to differ from the anticipated results and expectations, expressed in such forward-looking statements.
EXECUTIVE OVERVIEW
Net income for the year ended December 31, 2007 was $73.9 million. Diluted earnings per share were $2.27 for the year. Our results were impacted by several unusual charges that occurred in the fourth quarter. During the third quarter of 2007, we committed to an action plan to reduce operating costs across all aspects of operations. As part of this initiative, we recorded $1.1 million in severance charges in the fourth quarter related to the elimination of 50 positions. Also in the quarter we recorded a $2.5 million pretax charge to earnings for liabilities relating to the Visa USA Inc. antitrust lawsuit settlement with American Express and other pending Visa litigation (reflecting our share as a Visa member). We expect that proceeds from an anticipated share redemption related to our ownership interest in Visa’s planned initial public offering will more than offset our recorded Visa-related liabilities.
RESULTS OF OPERATIONS
Net Interest Income
Net interest income (te) is the primary component of our earnings and represents the difference, or spread, between revenue generated from interest-earning assets and the interest expense related to funding those assets. For internal analytical purposes, management adjusts net interest income to a “taxable equivalent” basis using a 35% federal tax rate on tax exempt items (primarily interest on municipal securities and loans). Fluctuations in interest rates, as well as volume and mix changes in earning assets and interest-bearing liabilities can materially impact net interest income (te).
Another significant statistic in the analysis of net interest income is the effective interest differential (also referred to as the net interest margin), which is the average of net interest earned, net interest income (te) less net interest expense, on our average earning assets. The difference between the average yield on earning assets and the effective rate paid for all deposits and borrowed funds, non-interest-bearing as well as interest-bearing is the net interest spread. Since a portion of the Bank’s deposits does not bear interest, such as demand accounts, the rate paid for all funds is lower than the rate on interest-bearing liabilities alone. The net interest margin (te) for the years 2007 and 2006 was 4.08% and 4.23%, respectively.
Net interest income (te) of $215.2 million was recorded for the year 2007, a decrease of $17.6 million, or 8%, from 2006. We experienced a significant increase of $36.5 million, or 19%, from 2005 to 2006. The factors contributing to the changes in net interest income (te) for 2007, 2006 and 2005 are presented in Tables 1 and 2. Table 1 is an analysis of the components of average balance sheets, levels of interest income and expense and the resulting earning asset yields and liability rates. Table 2 details the overall changes in the level of net interest income into rate and volume.
When comparing 2007 to 2006, the primary driver of the $17.6 million, or 8% decrease, in net interest income (te) was a $222.8 million, or 4%, decrease in average earning assets. In 2007, our average loan growth increased $366 million offset by a decrease in average securities of $493 million. There was an unfavorable change in 2007 in our average funding mix with higher levels of more costly time deposits of $60 million and lower levels of transaction deposits of $201 million. The average loan-to-deposit ratio at December 31, 2007 was 69.55% compared to 60.41% in 2006. The impact of this change on net interest margin was being managed by reducing rates paid on the interest bearing deposits.
Recognizing the importance of interest differential to total earnings, management places great emphasis on managing interest rate spreads. Although interest differential is affected by national, regional and area economics, our loan and investment policies are designed to maximize interest differential while maintaining sufficient liquidity and availability of funds for purposes of meeting existing commitments and for investing in loans and other investment opportunities that may arise.
The following table is a summary of average balance sheets that reflects average interest earned, average interest paid, average yield and average rate:
TABLE 1. Summary of Average Balance Sheets (w/Net Interest Income (te) & Interest Rates) |
|
|
|
|
|
|
|
|
|
|
|
|
|
|
|
|
|
|
|
|
|
|
|
|
|
|
|
|
| |
|
| Years Ended December 31, |
| ||||||||||||||||||||||||||
|
| 2007 |
| 2006 |
| 2005 |
| ||||||||||||||||||||||
|
|
| |||||||||||||||||||||||||||
|
| Average |
| Interest |
| Rate |
| Average |
| Interest |
| Rate |
| Average |
| Interest |
| Rate |
| ||||||||||
|
|
| |||||||||||||||||||||||||||
|
| (In thousands) |
| ||||||||||||||||||||||||||
Assets |
|
|
|
|
|
|
|
|
|
|
|
|
|
|
|
|
|
|
|
|
|
|
|
|
|
|
|
| |
Interest-Earnings Assets: |
|
|
|
|
|
|
|
|
|
|
|
|
|
|
|
|
|
|
|
|
|
|
|
|
|
|
|
| |
Loans* (te) |
| $ | 3,428,009 |
| $ | 261,944 |
|
| 7.64 | % | $ | 3,062,222 |
| $ | 235,067 |
|
| 7.68 | % | $ | 2,883,020 |
| $ | 201,446 |
|
| 6.99 | % | |
U.S. Treasury securities |
|
| 29,095 |
|
| 1,379 |
|
| 4.74 | % |
| 63,668 |
|
| 3,018 |
|
| 4.74 | % |
| 16,838 |
|
| 532 |
|
| 3.16 | % | |
U.S. agency securities |
|
| 810,300 |
|
| 41,112 |
|
| 5.07 | % |
| 1,270,128 |
|
| 60,701 |
|
| 4.78 | % |
| 514,834 |
|
| 21,499 |
|
| 4.18 | % | |
CMOs |
|
| 94,731 |
|
| 3,997 |
|
| 4.22 | % |
| 154,673 |
|
| 6,142 |
|
| 3.97 | % |
| 241,473 |
|
| 9,492 |
|
| 3.93 | % | |
Mortgage-backed securities |
|
| 534,893 |
|
| 27,190 |
|
| 5.08 | % |
| 491,130 |
|
| 23,313 |
|
| 4.75 | % |
| 437,037 |
|
| 19,407 |
|
| 4.44 | % | |
Obligations of states and political subdivisions: |
|
|
|
|
|
|
|
|
|
|
|
|
|
|
|
|
|
|
|
|
|
|
|
|
|
|
|
| |
taxable |
|
| 50,944 |
|
| 1,189 |
|
| 2.33 | % |
| 20,205 |
|
| 350 |
|
| 1.73 | % |
| 6,050 |
|
| 428 |
|
| 7.08 | % | |
nontaxable (te) |
|
| 146,060 |
|
| 9,590 |
|
| 6.57 | % |
| 151,681 |
|
| 10,416 |
|
| 6.87 | % |
| 155,414 |
|
| 10,823 |
|
| 6.96 | % | |
FHLB stock and other corporate securities |
|
| 68,529 |
|
| 3,389 |
|
| 4.95 | % |
| 77,337 |
|
| 3,826 |
|
| 4.95 | % |
| 62,769 |
|
| 2,822 |
|
| 4.50 | % | |
Total investment in securities |
|
| 1,734,552 |
|
| 87,846 |
|
| 5.06 | % |
| 2,228,822 |
|
| 107,766 |
|
| 4.84 | % |
| 1,434,415 |
|
| 65,003 |
|
| 4.53 | % | |
Federal funds sold and short-term investments |
|
| 117,158 |
|
| 5,613 |
|
| 4.79 | % |
| 211,511 |
|
| 9,760 |
|
| 4.61 | % |
| 137,821 |
|
| 4,559 |
|
| 3.31 | % | |
|
| ||||||||||||||||||||||||||||
Total interest-earning assets (te) |
|
| 5,279,719 |
|
| 355,403 |
|
| 6.73 | % |
| 5,502,555 |
|
| 352,593 |
|
| 6.41 | % |
| 4,455,256 |
|
| 271,008 |
|
| 6.08 | % | |
|
| ||||||||||||||||||||||||||||
Non-earning assets: |
|
|
|
|
|
|
|
|
|
|
|
|
|
|
|
|
|
|
|
|
|
|
|
|
|
|
|
| |
Other assets |
|
| 618,613 |
|
|
|
|
|
|
|
| 593,530 |
|
|
|
|
|
|
|
| 525,881 |
|
|
|
|
|
|
| |
Allowance for loan losses |
|
| (46,443 | ) |
|
|
|
|
|
|
| (64,285 | ) |
|
|
|
|
|
|
| (50,107 | ) |
|
|
|
|
|
| |
|
|
|
|
|
|
|
|
|
|
|
|
|
|
|
|
|
|
|
|
|
|
| |||||||
Total assets |
| $ | 5,851,889 |
|
|
|
|
|
|
| $ | 6,031,800 |
|
|
|
|
|
|
| $ | 4,931,030 |
|
|
|
|
|
|
| |
|
|
|
|
|
|
|
|
|
|
|
|
|
|
|
|
|
|
|
|
|
|
| |||||||
|
|
|
|
|
|
|
|
|
|
|
|
|
|
|
|
|
|
|
|
|
|
|
|
|
|
|
|
| |
Liabilities and Stockholder’s Equity |
|
|
|
|
|
|
|
|
|
|
|
|
|
|
|
|
|
|
|
|
|
|
|
|
|
|
|
| |
Interest-bearing Liabilities: |
|
|
|
|
|
|
|
|
|
|
|
|
|
|
|
|
|
|
|
|
|
|
|
|
|
|
|
| |
Interest-bearing transaction deposits |
| $ | 1,419,078 |
|
| 18,135 |
|
| 1.28 | % | $ | 1,623,597 |
|
| 14,931 |
|
| 0.92 | % | $ | 1,384,605 |
|
| 9,203 |
|
| 0.66 | % | |
Time deposits |
|
| 1,778,854 |
|
| 81,224 |
|
| 4.57 | % |
| 1,545,834 |
|
| 62,807 |
|
| 4.06 | % |
| 1,149,239 |
|
| 40,654 |
|
| 3.54 | % | |
Public funds |
|
| 803,589 |
|
| 33,561 |
|
| 4.18 | % |
| 771,146 |
|
| 32,354 |
|
| 4.20 | % |
| 644,849 |
|
| 17,724 |
|
| 2.75 | % | |
|
| ||||||||||||||||||||||||||||
Total interest-bearing deposits |
|
| 4,001,521 |
|
| 132,920 |
|
| 3.32 | % |
| 3,940,577 |
|
| 110,092 |
|
| 2.79 | % |
| 3,178,693 |
|
| 67,581 |
|
| 2.13 | % | |
|
| ||||||||||||||||||||||||||||
Customer repurchase agreements |
|
| 216,730 |
|
| 8,023 |
|
| 3.70 | % |
| 250,603 |
|
| 9,060 |
|
| 3.62 | % |
| 224,842 |
|
| 4,351 |
|
| 1.94 | % | |
Other interest-bearing liabilities |
|
| 11,280 |
|
| 288 |
|
| 2.55 | % |
| 30,580 |
|
| 1,517 |
|
| 4.96 | % |
| 69,057 |
|
| 2,887 |
|
| 4.18 | % | |
Capitalized Interest |
|
| — |
|
| (995 | ) |
| — |
|
| — |
|
| (806 | ) |
| — |
|
| — |
|
| — |
|
| — |
| |
|
| ||||||||||||||||||||||||||||
Total interest-bearing liabilities |
|
| 4,229,530 |
| $ | 140,236 |
|
| 3.32 | % | $ | 4,221,760 |
| $ | 119,863 |
|
| 2.84 | % | $ | 3,472,592 |
| $ | 74,819 |
|
| 2.15 | % | |
|
| ||||||||||||||||||||||||||||
Non-interest bearing: |
|
|
|
|
|
|
|
|
|
|
|
|
|
|
|
|
|
|
|
|
|
|
|
|
|
|
|
| |
Demand deposits |
|
| 927,655 |
|
|
|
|
|
|
|
| 1,128,850 |
|
|
|
|
|
|
|
| 822,733 |
|
|
|
|
|
|
| |
Other liabilities |
|
| 132,320 |
|
|
|
|
|
|
|
| 167,534 |
|
|
|
|
|
|
|
| 160,004 |
|
|
|
|
|
|
| |
Stockholders’ equity |
|
| 562,383 |
|
|
|
|
|
|
|
| 513,656 |
|
|
|
|
|
|
|
| 475,701 |
|
|
|
|
|
|
| |
|
| ||||||||||||||||||||||||||||
Total liabilities & stockholders’ equity |
| $ | 5,851,888 |
|
|
|
|
| 2.66 | % | $ | 6,031,800 |
|
|
|
|
| 2.18 | % | $ | 4,931,030 |
|
|
|
|
| 1.68 | % | |
|
|
|
|
|
|
|
|
|
|
|
|
|
|
| |||||||||||||||
Net interest income and margin (te) |
|
|
|
| $ | 215,167 |
|
| 4.07 | % |
|
|
| $ | 232,730 |
|
| 4.23 | % |
|
|
| $ | 196,189 |
|
| 4.40 | % | |
Net earning assets and spread |
| $ | 1,050,188 |
|
|
|
|
| 3.41 | % | $ | 1,280,795 |
|
|
|
|
| 3.57 | % | $ | 982,664 |
|
|
|
|
| 3.93 | % | |
|
|
|
|
|
|
|
|
|
|
|
|
|
|
| |||||||||||||||
* Loan interest income includes loan fees of $11.9 million, $9.0 million and $9.0 million for each of the three years ended December 31, 2007, 2006 and 2005. Non-accrual loans in average balances and income on such loans, if recognized, is recorded on a cash basis. Tax equivalent (te) amounts are calculated using a marginal federal income tax rate of 35%.
The following table presents the change in interest income and the change in interest expense:
|
|
|
|
|
|
|
|
|
|
|
|
|
|
|
|
|
|
|
|
TABLE 2. Summary of Changes in Net Interest Income (te) | |||||||||||||||||||
| |||||||||||||||||||
|
| 2007 Compared to 2006 |
| 2006 Compared to 2005 |
| ||||||||||||||
|
| ||||||||||||||||||
|
| Due to |
| Total |
| Due to |
| Total |
| ||||||||||
|
|
|
|
|
| ||||||||||||||
|
|
|
|
|
| ||||||||||||||
|
| Volume |
| Rate |
|
| Volume |
| Rate |
|
| ||||||||
|
|
| |||||||||||||||||
|
| (In thousands) |
| ||||||||||||||||
Interest Income (te) |
|
|
|
|
|
|
|
|
|
|
|
|
|
|
|
|
|
|
|
Loans |
| $ | 30,204 |
| ($ | 3,327 | ) | $ | 26,877 |
| $ | 14,008 |
| $ | 19,612 |
| $ | 33,620 |
|
|
|
|
|
|
|
|
|
|
|
|
|
|
|
|
|
|
|
|
|
U.S. Treasury securities |
|
| (1,639 | ) |
| — |
|
| (1,639 | ) |
| 2,107 |
|
| 379 |
|
| 2,486 |
|
U.S. agency securities |
|
| (17,270 | ) |
| (2,319 | ) |
| (19,589 | ) |
| 35,684 |
|
| 3,517 |
|
| 39,201 |
|
CMOs |
|
| (1,902 | ) |
| (243 | ) |
| (2,145 | ) |
| (3,273 | ) |
| (76 | ) |
| (3,349 | ) |
Mortgage-backed securities |
|
| 2,157 |
|
| 1,720 |
|
| 3,877 |
|
| 2,504 |
|
| 1,402 |
|
| 3,906 |
|
Obligations of states and political subdivisions: |
|
|
|
|
|
|
|
|
|
|
|
|
|
|
|
|
|
|
|
Taxable |
|
| 684 |
|
| 155 |
|
| 839 |
|
| 271 |
|
| (349 | ) |
| (78 | ) |
Nontaxable (te) |
|
| (528 | ) |
| (298 | ) |
| (826 | ) |
| (251 | ) |
| (155 | ) |
| (406 | ) |
FHLB stock and other corporate securities |
|
| (437 | ) |
| — |
|
| (437 | ) |
| 701 |
|
| 304 |
|
| 1,005 |
|
Total investment in securities |
|
| (18,935 | ) |
| (985 | ) |
| (19,920 | ) |
| 37,743 |
|
| 5,022 |
|
| 42,765 | �� |
|
|
|
|
|
|
|
|
|
|
|
|
|
|
|
|
|
|
|
|
Federal funds and short-term investments |
|
| (4,507 | ) |
| 361 |
|
| (4,146 | ) |
| 2,991 |
|
| 2,209 |
|
| 5,200 |
|
|
|
| |||||||||||||||||
Total interest income (te) |
| $ | 6,762 |
| ($ | 3,951 | ) | $ | 2,811 |
| $ | 54,742 |
| $ | 26,843 |
| $ | 81,585 |
|
|
|
| |||||||||||||||||
|
|
|
|
|
|
|
|
|
|
|
|
|
|
|
|
|
|
|
|
Interest-bearing transaction deposits |
| $ | 2,060 |
| ($ | 5,264 | ) | ($ | 3,204 | ) | $ | 1,777 |
| $ | 3,951 |
| $ | 5,728 |
|
Time deposits |
|
| (10,112 | ) |
| (8,305 | ) |
| (18,417 | ) |
| 15,486 |
|
| 6,668 |
|
| 22,154 |
|
Public funds |
|
| (1,356 | ) |
| 149 |
|
| (1,207 | ) |
| 3,967 |
|
| 10,663 |
|
| 14,630 |
|
|
|
| |||||||||||||||||
Total interest-bearing deposits |
|
| (9,408 | ) |
| (13,420 | ) |
| (22,828 | ) |
| 21,230 |
|
| 21,282 |
|
| 42,512 |
|
|
|
| |||||||||||||||||
|
|
|
|
|
|
|
|
|
|
|
|
|
|
|
|
|
|
|
|
Securities sold under repurchase agreements |
|
| 1,250 |
|
| (213 | ) |
| 1,037 |
|
| 550 |
|
| 4,159 |
|
| 4,709 |
|
Other interest-bearing liabilities |
|
| 1,095 |
|
| 323 |
|
| 1,418 |
|
| (2,175 | ) |
| (2 | ) |
| (2,177 | ) |
|
|
| |||||||||||||||||
Total interest expense |
|
| (7,063 | ) |
| (13,310 | ) |
| (20,373 | ) | $ | 19,605 |
| $ | 25,439 |
| $ | 45,044 |
|
|
|
| |||||||||||||||||
|
|
|
|
|
|
|
|
|
|
|
|
|
|
|
|
|
|
|
|
Change in net interest income (te) |
| ($ | 301 | ) | ($ | 17,261 | ) | ($ | 17,562 | ) | $ | 35,137 |
| $ | 1,404 |
| $ | 36,541 |
|
|
|
| |||||||||||||||||
Provision for Loan Losses
Net charge-offs increased $218 thousand, or 3.1%, from 2006 to 2007 and were $7.2 million for 2007. The provision for loan losses reflects management’s assessment of the adequacy of the allowance for loan losses to absorb probable losses in the loan portfolio. The amount of provision for each period is dependent on many factors, including loan growth, net charge-offs, changes in the composition of the loan portfolio, delinquencies, identified loan impairment, management’s assessment of the loan portfolio quality, the value of collateral, as well as, overall economic factors. Our allowance for loan losses as a percent of period-end loans was 1.31% at December 31, 2007, a decrease of 12 basis points from the 1.43% at December 31, 2006. In 2006, we reversed $20.0 million of the allowance for loan losses related to Hurricane Katrina due to better than expected loss experience with storm impacted credits.
Noninterest Income
Table 3 presents a three-year analysis of the components of noninterest income. Overall, noninterest income of $118.1 million was reported in 2007, as compared to $103.8 million for 2006 and $98.3 million for 2005. This represents an increase of $14.3 million, or 14%, from 2006 to 2007 and an increase of $5.5 million, or 6%, from 2005 to 2006. Included in noninterest income in 2006 and 2005 are net storm-related gains of $5.1 and $6.6 million, respectively. These represent gains on involuntary conversions of assets lost in Hurricane Katrina for which insurance proceeds had been received net of certain direct costs. Excluding the impact of net storm-related gains and securities transactions, noninterest income for 2006 was $103.9 million compared to noninterest income in 2005 of $91.7 million. This represents an increase of $12.2 million, or 13% as compared to 2005.
TABLE 3. Noninterest Income |
|
|
|
|
|
|
|
|
|
|
|
|
|
|
|
|
|
|
| 2007 |
| % Change |
| 2006 |
| % Change |
| 2005 |
| |||||
|
| |||||||||||||||
|
| (In thousands) |
| |||||||||||||
Service charges on deposit accounts |
| $ | 41,929 |
| 16 | % |
| $ | 36,228 |
| 4 | % |
| $ | 34,773 |
|
Trust fees |
|
| 15,902 |
| 20 | % |
|
| 13,286 |
| 20 | % |
|
| 11,107 |
|
Investment and annuity fees |
|
| 8,746 |
| 46 | % |
|
| 5,970 |
| 18 | % |
|
| 5,076 |
|
Insurance commissions and fees |
|
| 19,219 |
| 0 | % |
|
| 19,246 |
| 13 | % |
|
| 17,099 |
|
Debit card and merchant fees |
|
| 8,065 |
| 11 | % |
|
| 7,298 |
| 50 | % |
|
| 4,878 |
|
ATM fees |
|
| 5,656 |
| 13 | % |
|
| 5,005 |
| 19 | % |
|
| 4,202 |
|
Secondary mortgage market operations |
|
| 3,723 |
| 6 | % |
|
| 3,528 |
| 59 | % |
|
| 2,221 |
|
Other fees and income |
|
| 14,581 |
| 9 | % |
|
| 13,357 |
| 8 | % |
|
| 12,382 |
|
|
| |||||||||||||||
Total recurring non-interest income |
|
| 117,821 |
| 13 | % |
|
| 103,918 |
| 13 | % |
|
| 91,738 |
|
Net storm-related gains |
|
| — |
| N/M | * |
|
| 5,084 |
| -23 | % |
|
| 6,584 |
|
Securities gains/(losses) |
|
| 308 |
| N/M | * |
|
| (5,169 | ) | N/M | * |
|
| (53 | ) |
|
| |||||||||||||||
Total non-interest income |
| $ | 118,129 |
| 14 | % |
| $ | 103,833 |
| 6 | % |
| $ | 98,269 |
|
|
| |||||||||||||||
* | Not meaningful |
Increases in noninterest income, when comparing 2007 to 2006, were experienced in service charges on deposit accounts, trust fees, investment and annuity fees, debit card and merchant fees, and other income. Service charges on deposit accounts increased $5.7 million, or 16%, when compared to 2006. This was caused by service charge fee increases in 2007 on consumer and business accounts and an increase in accounts from the expanding Alabama market. Trust fee income increased $2.6 million, or 20%, when compared to the previous year as a result of increases in the value of assets under care (either managed or in custody). Investment and annuity fees increased $2.8 million, or 47%, from 2006 to 2007 and there were higher levels of other income (up $1.2 million or 9%).
Considerable increases in noninterest income, when comparing 2006 to 2005, were experienced in trust fees, debit card and merchant fees, insurance commission fees, and service charges on deposit accounts. Trust fee income increased $2.2 million, or 20%, when compared to the previous year as a result of increases in the value of assets under care (either managed or in custody). Debit card and merchant fees increased $2.4 million, or 50%, from 2005 to 2006 and there were higher levels of insurance commissions and fees (up $2.1 million or 13%). Securities losses increased $5.1 million from losses of $53,000 in 2005 to losses of $5.2 million in 2006.
Noninterest Expense
Table 4 presents an analysis of the components of noninterest expense for the years 2007, 2006 and 2005. The level of operating expenses increased $13.6 million, or 7%, from 2006 to 2007 and $29.2 million, or 17%, from 2005 to 2006.
TABLE 4. Noninterest Expense |
|
|
|
|
|
|
|
|
|
|
|
|
|
|
|
|
|
|
| 2007 |
| % Change |
| 2006 |
| % Change |
| 2005 |
| |||||
|
|
| ||||||||||||||
|
| (In thousands) |
| |||||||||||||
Employee compensation |
| $ | 84,654 |
| 0 | % |
| $ | 84,569 |
| 10 | % |
| $ | 76,602 |
|
Employee benefits |
|
| 22,305 |
| 16 | % |
|
| 19,184 |
| 9 | % |
|
| 17,556 |
|
|
|
| ||||||||||||||
Total personnel expense |
|
| 106,959 |
| 3 | % |
|
| 103,753 |
| 10 | % |
|
| 94,158 |
|
Equipment and data processing expense |
|
| 25,660 |
| 15 | % |
|
| 22,327 |
| 28 | % |
|
| 17,377 |
|
Net occupancy expense |
|
| 19,435 |
| 46 | % |
|
| 13,350 |
| 22 | % |
|
| 10,926 |
|
Postage and communications |
|
| 10,453 |
| 8 | % |
|
| 9,649 |
| 23 | % |
|
| 7,820 |
|
Ad valorem and franchise taxes |
|
| 3,514 |
| 5 | % |
|
| 3,346 |
| -7 | % |
|
| 3,607 |
|
Legal and professional services |
|
| 15,234 |
| 9 | % |
|
| 13,968 |
| 34 | % |
|
| 10,410 |
|
Printing and supplies |
|
| 2,252 |
| 13 | % |
|
| 1,997 |
| 12 | % |
|
| 1,787 |
|
Amortization of intangible assets |
|
| 1,651 |
| -22 | % |
|
| 2,125 |
| -3 | % |
|
| 2,194 |
|
Advertising |
|
| 7,032 |
| 6 | % |
|
| 6,642 |
| 27 | % |
|
| 5,232 |
|
Deposit insurance and regulatory fees |
|
| 1,039 |
| 10 | % |
|
| 946 |
| 16 | % |
|
| 814 |
|
Training expenses |
|
| 656 |
| 16 | % |
|
| 564 |
| 57 | % |
|
| 359 |
|
Other real estate owned expense/(income) |
|
| (497 | ) | 27 | % |
|
| (390 | ) | 178 | % |
|
| (140 | ) |
Other expense |
|
| 20,966 |
| -7 | % |
|
| 22,439 |
| 32 | % |
|
| 16,999 |
|
|
|
| ||||||||||||||
Total noninterest expense |
| $ | 214,354 |
| 7 | % |
| $ | 200,716 |
| 17 | % |
| $ | 171,543 |
|
|
|
| ||||||||||||||
The significant factors driving the increase in operating expenses from 2006 to 2007 included an increase in net occupancy expense ($6.1 million, or 46%) due to reoccupying One Hancock Plaza, our corporate headquarters, in 2007, the opening of our data center and the opening of new branches, legal and professional services ($1.3 million, or 9.1%), personnel expense ($3.2 million, or 3%) and equipment and data processing expense ($3.3 million, or 15%).
In 2006, operating expenses increased $29.2 million, or 17%, over 2005. Increases were reflected in personnel expense ($9.6 million, or 10%), net occupancy expense ($2.4 million, or 22%), legal and professional services ($3.6 million, or 34%), equipment and data processing expense ($5.0 million, or 28%), postage and communication expense, ($1.8 million, or 23%) and advertising expense ($1.4 million, or 27%).
Income Taxes
Income tax expense was $27.9 million in 2007, $46.5 million in 2006 and $18.9 million in 2005. Income tax expense decreased due to a lower level of pretax income in 2007. Our effective income tax rate continues to be less than the statutory rate of 35%, due primarily to tax-exempt interest income and tax credits. The effective tax rates for 2007, 2006 and 2005 were 27%, 31% and 26%, respectively. The 4% decrease in our effective tax rate was due primarily to the increase in the percentage of tax-exempt income as it relates to pre-tax book income.
SEGMENT REPORTING
See Note 17 to our Consolidated Financial Statements included elsewhere in this report.
BALANCE SHEET ANALYSIS
Securities Available for Sale
Our investment in securities was $1.68 billion at December 31, 2007, compared to $1.90 billion at December 31, 2006. At December 31, 2007, 88.23% of the portfolio was comprised of securities classified as available for sale, 11.77% of the securities were classified as trading while none were classified as held to maturity. At December 31, 2006, the composition of the securities portfolio was 100% classified as available for sale and none were classified as either trading or held to maturity. Average investment securities were $1.73 billion for 2007 as compared to $2.23 billion for 2006.
The vast majority of securities in our portfolio are fixed rate and there were no investments in securities of a single issuer, other than U.S. Treasury and U.S. government agency securities and mortgage-backed securities issued or guaranteed by U.S. government agencies that exceeded 10% of stockholders’ equity. At December 31, 2007, the average maturity of the portfolio was 4.84 years with an effective duration of 2.56 and an average yield of 5.12%.
Our securities portfolio is an important source of liquidity and earnings for us. A stated objective in managing the securities portfolio is to provide consistent liquidity to support balance sheet growth but also to provide a safe and consistent stream of earnings. To that end, management is open to opportunities that present themselves which enables us to improve the structure and earnings potential of the securities portfolio. During the fourth quarter of 2007, the economic environment, the slope of the yield curve and the expectations of future interest rate movements presented us with an opportunity to reclassify $195.2 million (11.64% of the portfolio balance) of securities from available for sale to trading. This reclassification provides us the flexibility to restructure the portfolio as conditions warrant.
The amortized costs of securities classified as available for sale and trading at December 31, 2007, 2006 and 2005, were as follows (in thousands):
|
|
|
|
|
|
|
|
|
|
|
TABLE 5. Securities by Type | ||||||||||
| ||||||||||
|
| Years Ended December 31, |
| |||||||
|
|
| ||||||||
|
| 2007 |
| 2006 |
| 2005 |
| |||
|
|
|
|
| ||||||
Available for sale securities |
|
|
|
|
|
|
|
|
|
|
U.S. Treasury |
| $ | 11,353 |
| $ | 60,231 |
| $ | 50,883 |
|
U.S. government agencies |
|
| 431,772 |
|
| 1,016,811 |
|
| 1,029,656 |
|
Municipal obligations |
|
| 197,596 |
|
| 200,891 |
|
| 165,180 |
|
Mortgage-backed securities |
|
| 637,578 |
|
| 443,410 |
|
| 484,131 |
|
CMOs |
|
| 143,639 |
|
| 116,161 |
|
| 194,899 |
|
Other debt securities |
|
| 49,653 |
|
| 44,664 |
|
| 48,476 |
|
Equity securities |
|
| 8,372 |
|
| 34,677 |
|
| 7,520 |
|
|
|
|
|
| ||||||
|
| $ | 1,479,963 |
| $ | 1,916,845 |
| $ | 1,980,745 |
|
|
|
|
|
| ||||||
|
|
|
|
|
|
|
|
|
|
|
|
|
|
| Years Ended December 31, |
| |||||||||
|
|
| ||||||||||
|
| 2007 |
| 2006 |
| 2005 |
| |||||
|
|
|
|
| ||||||||
Trading securities |
|
|
|
|
|
|
|
|
|
|
|
|
U.S. Treasury |
| $ | — |
|
| $ — |
|
|
| $ — |
|
|
U.S. government agencies |
|
| 69,793 |
|
| — |
|
|
| — |
|
|
Municipal obligations |
|
| — |
|
| — |
|
|
| — |
|
|
Mortgage-backed securities |
|
| 125,387 |
|
| — |
|
|
| — |
|
|
CMOs |
|
| — |
|
| — |
|
|
| — |
|
|
Other debt securities |
|
| — |
|
| — |
|
|
| — |
|
|
Equity securities |
|
| 2,245 |
|
| — |
|
|
| — |
|
|
|
|
|
|
|
|
|
|
| ||||
|
| $ | 197,425 |
|
| $ — |
|
|
| $ — |
|
|
|
|
|
|
|
|
|
|
| ||||
The amortized cost, yield and fair value of debt securities at December 31, 2007, by contractual maturity, were as follows (amounts in thousands):
TABLE 6. Securities Maturities by Type |
|
|
|
|
|
|
|
|
|
|
|
|
|
|
|
|
|
|
|
|
|
|
|
Available for sale |
| One Year |
| Over One |
| Over Five |
| Over |
| Total |
| Fair |
| Weighted |
| |||||||
|
|
|
|
|
|
|
|
| ||||||||||||||
U.S. Treasury |
| $ | 9,977 |
| $ | 1,068 |
| $ | 308 |
| $ | — |
| $ | 11,353 |
| $ | 11,394 |
| 3.79 | % |
|
U.S. government agencies |
|
| 49,998 |
|
| 142,499 |
|
| 189,225 |
|
| 50,050 |
|
| 431,772 |
|
| 433,664 |
| 5.26 | % |
|
Municipal obligations |
|
| 78,031 |
|
| 64,289 |
|
| 41,930 |
|
| 13,346 |
|
| 197,596 |
|
| 198,582 |
| 4.63 | % |
|
Other debt securities |
|
| 1,991 |
|
| 11,073 |
|
| 17,521 |
|
| 19,068 |
|
| 49,653 |
|
| 48,398 |
| 5.27 | % |
|
|
|
|
|
|
|
|
|
|
|
| ||||||||||||
|
| $ | 139,997 |
| $ | 218,929 |
| $ | 248,984 |
| $ | 82,464 |
| $ | 690,374 |
| $ | 692,038 |
| 5.05 | % |
|
|
|
|
|
|
|
|
|
|
|
| ||||||||||||
|
|
|
|
|
|
|
|
|
|
|
|
|
|
|
|
|
|
|
|
|
|
|
Fair Value |
| $ | 140,396 |
| $ | 221,941 |
| $ | 247,680 |
| $ | 82,021 |
| $ | 692,038 |
|
|
|
|
|
|
|
|
|
|
|
|
|
|
|
|
|
|
|
| ||||||||||
| ||||||||||||||||||||||
Weighted Average Yield |
|
| 4.59 | % |
| 4.78 | % |
| 5.38 | % |
| 5.57 | % |
| 5.05 | % |
|
|
|
|
|
|
|
|
|
| �� |
|
|
|
|
|
|
|
|
|
|
|
|
|
|
|
|
|
|
Mortgage-backed securities & CMOs |
|
|
|
|
|
|
|
|
|
|
|
|
| $ | 781,217 |
| $ | 779,192 |
| 5.43 | % |
|
|
|
|
|
|
|
|
|
|
|
|
|
|
|
|
|
|
|
| ||||
Total available for sale securities |
|
|
|
|
|
|
|
|
|
|
|
|
| $ | 1,471,591 |
| $ | 1,471,230 |
| 5.25 | % |
|
|
|
|
|
|
|
|
|
|
|
|
|
|
|
|
|
|
|
| ||||
Trading securities |
|
|
|
|
|
|
|
|
|
|
|
|
| $ | 195,180 |
| $ | 195,180 |
| 4.92 | % |
|
|
|
|
|
|
|
|
|
|
|
|
|
|
|
|
|
|
|
| ||||
Loan Portfolio
We experienced an increase in loan growth during 2007 as our efforts to generate loan volume continue. As indicated by Table 8, commercial and real estate loans increased $279.2 million, or 16%, from 2006. Included in this category are commercial real estate loans, which are secured by properties, used in commercial or industrial operations. We originate commercial and real estate loans to a wide variety of customers in many different industries and, as such, no single industry concentrations existed at December 31, 2007.
Mortgage loans of $435.0 million were $16.7 million, or 4%, higher than in 2006. We originate both fixed-rate and adjustable-rate mortgage loans. Certain types of mortgage loans are sold in the secondary mortgage market, while Hancock retains other types. We also originate home equity loans. This product offers customers the opportunity to leverage rising home values and equity to obtain tax-advantaged consumer financing.
Direct consumer loans, which include loans and revolving lines of credit made directly to consumers, were up $21.4 million, or 5%, from 2006. We also originate indirect consumer loans, which consist primarily of consumer loans originated through third parties such as automobile dealers or other point-of-sale channels.
Indirect consumer loans of $369.1 million for 2007 were up $19.6 million, or 6%, from 2006. We own a finance company subsidiary, which originates both direct and indirect consumer loans. Finance company loans increased approximately $28.9 million, or 38%, at December 31, 2007, compared to the subsidiary’s outstanding loans on December 31, 2006. The loan growth in the finance company was mainly due to continued growth in direct consumer loans.
The following table shows average loan growth for the three-year period ended December 31, 2007:
TABLE 7. Average Loans |
|
|
|
|
|
|
|
|
|
|
|
|
|
|
|
|
|
|
|
|
|
|
|
|
|
|
|
| 2007 |
| 2006 |
| 2005 |
| ||||||||||||||||||
|
| ||||||||||||||||||||||||
|
| Balance |
| TE Yield |
| Mix |
| Balance |
| TE Yield |
| Mix |
| Balance |
| TE Yield |
| Mix |
| ||||||
|
| (In thousands) |
| ||||||||||||||||||||||
| |||||||||||||||||||||||||
Commercial & R.E. Loans |
| $ | 2,027,016 |
| 7.35 | % |
| 59.1 | % | $ | 1,747,816 |
| 7.21 | % |
| 57.0 | % | $ | 1,565,369 |
| 6.40 | % |
| 54.3 | % |
Mortgage loans |
|
| 434,981 |
| 6.15 | % |
| 12.7 | % |
| 418,273 |
| 5.93 | % |
| 13.7 | % |
| 424,654 |
| 5.56 | % |
| 14.7 | % |
Direct consumer loans |
|
| 492,298 |
| 8.03 | % |
| 14.4 | % |
| 470,942 |
| 8.17 | % |
| 15.4 | % |
| 501,677 |
| 7.51 | % |
| 17.4 | % |
Indirect consumer loans |
|
| 369,147 |
| 6.68 | % |
| 10.8 | % |
| 349,518 |
| 6.21 | % |
| 11.4 | % |
| 328,679 |
| 5.91 | % |
| 11.4 | % |
Finance company loans |
|
| 104,567 |
| 19.89 | % |
| 3.0 | % |
| 75,673 |
| 19.98 | % |
| 2.5 | % |
| 62,641 |
| 19.03 | % |
| 2.2 | % |
|
| ||||||||||||||||||||||||
Total average loans (net of unearned) |
| $ | 3,428,009 |
| 7.64 | % |
| 100.0 | % | $ | 3,062,222 |
| 7.68 | % |
| 100.0 | % | $ | 2,883,020 |
| 6.99 | % |
| 100.0 | % |
|
| ||||||||||||||||||||||||
The following table sets forth, for the periods indicated, the composition of our loan portfolio:
TABLE 8. Loans Outstanding by Type |
|
|
|
|
|
|
|
|
|
|
|
|
|
|
|
|
|
|
| Loan Portfolio |
| |||||||||||||
|
|
| ||||||||||||||
|
| 2007 |
| 2006 |
| 2005 |
| 2004 |
| 2003 |
| |||||
|
|
|
|
|
|
| ||||||||||
|
| (In thousands) |
| |||||||||||||
| ||||||||||||||||
Real estate: |
|
|
|
|
|
|
|
|
|
|
|
|
|
|
|
|
Residential mortgages 1-4 family |
| $ | 717,346 |
| $ | 714,126 |
| $ | 703,769 |
| $ | 713,266 |
| $ | 645,123 |
|
Residential mortgages multifamily |
|
| 53,442 |
|
| 69,296 |
|
| 40,678 |
|
| 25,544 |
|
| 22,803 |
|
Home equity lines/loans |
|
| 214,528 |
|
| 133,540 |
|
| 133,823 |
|
| 134,405 |
|
| 110,634 |
|
Construction and development |
|
| 628,037 |
|
| 534,460 |
|
| 391,194 |
|
| 296,114 |
|
| 235,049 |
|
Nonresidential |
|
| 731,318 |
|
| 666,593 |
|
| 609,647 |
|
| 595,013 |
|
| 536,389 |
|
Commercial, industrial and other |
|
| 627,015 |
|
| 551,484 |
|
| 546,635 |
|
| 437,670 |
|
| 395,678 |
|
Consumer |
|
| 572,046 |
|
| 530,756 |
|
| 512,549 |
|
| 496,926 |
|
| 463,642 |
|
Lease financing and depository institutions |
|
| 72,717 |
|
| 69,487 |
|
| 48,007 |
|
| 44,357 |
|
| 34,388 |
|
Credit cards and other revolving credit |
|
| 15,391 |
|
| 14,262 |
|
| 14,316 |
|
| 16,970 |
|
| 15,437 |
|
|
|
|
|
|
|
| ||||||||||
|
|
| 3,631,840 |
|
| 3,284,004 |
|
| 3,000,618 |
|
| 2,760,265 |
|
| 2,459,143 |
|
Less, unearned income |
|
| 16,326 |
|
| 17,420 |
|
| 11,432 |
|
| 11,705 |
|
| 10,499 |
|
|
|
|
|
|
|
| ||||||||||
Net loans |
| $ | 3,615,514 |
| $ | 3,266,584 |
| $ | 2,989,186 |
| $ | 2,748,560 |
| $ | 2,448,644 |
|
|
|
|
|
|
|
| ||||||||||
The following table sets forth, for the periods indicated, the approximate contractual maturity by type of the loan portfolio:
TABLE 9. Loans Maturities by Type |
|
|
|
|
|
|
|
|
|
|
|
|
|
|
|
| December 31, 2007 |
| ||||||||||
|
| Within |
| After One |
| After Five |
| Total |
| ||||
|
|
| |||||||||||
|
| (In thousands) |
| ||||||||||
|
|
|
|
|
|
|
|
|
|
|
|
|
|
Commercial, industrial and other |
| $ | 300,764 |
| $ | 221,265 |
| $ | 101,460 |
| $ | 623,489 |
|
Real estate - construction |
|
| 421,694 |
|
| 182,200 |
|
| 26,875 |
|
| 630,769 |
|
All other loans |
|
| 366,251 |
|
| 1,059,813 |
|
| 951,518 |
|
| 2,377,582 |
|
|
|
|
|
|
| ||||||||
|
|
|
|
|
|
|
|
|
|
|
|
|
|
Total loans |
| $ | 1,088,709 |
| $ | 1,463,278 |
| $ | 1,079,853 |
| $ | 3,631,840 |
|
|
|
|
|
|
| ||||||||
The sensitivity to interest rate changes of that portion of our loan portfolio that matures after one year is shown below:
TABLE 10. Loans Sensitivity to Changes in Interest Rates |
|
|
|
|
|
|
|
|
| December 31, |
| |||
|
|
| ||||
|
| (In thousands) |
| |||
|
|
|
|
| ||
Commercial, industrial, and real estate construction maturing after one year: |
|
|
|
| ||
Fixed rate |
|
| $ | 420,207 |
|
|
Floating rate |
|
|
| 111,593 |
|
|
Other loans maturing after one year: |
|
|
|
|
|
|
Fixed rate |
|
|
| 1,543,256 |
|
|
Floating rate |
|
|
| 468,075 |
|
|
|
|
|
|
| ||
|
|
|
|
|
|
|
Total |
|
| $ | 2,543,131 |
|
|
|
|
|
|
| ||
Non-performing Assets
The following table sets forth non-performing assets by type for the periods indicated, consisting of non-accrual loans, restructured loans and real estate owned. Loans past due 90 days or more and still accruing are also disclosed:
TABLE 11. Non-performing Assets |
|
|
|
|
|
|
|
|
|
|
|
|
|
|
|
|
|
|
| December 31, |
| |||||||||||||
|
|
| ||||||||||||||
|
| 2007 |
| 2006 |
| 2005 |
| 2004 |
| 2003 |
| |||||
|
|
| ||||||||||||||
|
| (In thousands) |
| |||||||||||||
Loans accounted for on a non-accrual basis |
| $ | 13,067 |
| $ | 3,500 |
| $ | 10,617 |
| $ | 7,480 |
| $ | 12,161 |
|
Restructured loans |
|
| — |
|
| — |
|
| — |
|
| — |
|
| — |
|
|
|
| ||||||||||||||
Total non-performing loans |
|
| 13,067 |
|
| 3,500 |
|
| 10,617 |
|
| 7,480 |
|
| 12,161 |
|
Foreclosed assets |
|
| 2,297 |
|
| 681 |
|
| 1,898 |
|
| 3,513 |
|
| 5,809 |
|
|
|
| ||||||||||||||
Total non-performing assets |
| $ | 15,364 |
| $ | 4,181 |
| $ | 12,515 |
| $ | 10,993 |
| $ | 17,970 |
|
|
| |||||||||||||||
Loans 90 days past due still accruing |
| $ | 4,154 |
| $ | 2,552 |
| $ | 25,622 |
| $ | 5,160 |
| $ | 3,682 |
|
|
| |||||||||||||||
Ratios |
|
|
|
|
|
|
|
|
|
|
|
|
|
|
|
|
Non-performing assets to loans plus other real estate |
|
| 0.42 | % |
| 0.13 | % |
| 0.42 | % |
| 0.40 | % |
| 0.73 | % |
Allowance for loan losses to non-performing loans and accruing loans 90 days past due |
|
| 241 | % |
| 695 | % |
| 196 | % |
| 252 | % |
| 170 | % |
Loans 90 days past due still accruing to loans |
|
| 0.11 | % |
| 0.08 | % |
| 0.86 | % |
| 0.19 | % |
| 0.15 | % |
The amount of interest that would have been recorded on non-accrual loans had the loans not been classified as “non-accrual” was $498,000, $759,000, $747,000, $574,000 and $762,000 for the years ended December 31, 2007, 2006, 2005, 2004 and 2003, respectively. Interest actually received on non-accrual loans was not material.
Non-performing assets consist of loans accounted for on a non-accrual basis, restructured loans and foreclosed assets. Table 11 presents information related to non-performing assets for the five years ended December 31, 2007. Total non-performing assets at December 31, 2007 were $15.4 million, an increase of $11.2 million, or 267%, from December 31, 2006. Loans that are over 90 days past due but still accruing were $4.2 million at December 31, 2007. This compares to $2.6 million at December 31, 2006. The non-performing assets result at year end 2007 is higher than the previous year end; however, it is consistent when compared with the same measure for years 2003 through 2005. The loans contributing to the increase have been identified, and appropriate write-downs or allowances have been made based on underlying collateral values and those relationships have been placed in the hands of special asset personnel for handling. Management believes that the loans included in the non-performing assets total are being handled appropriately.
Allowance for Loan and Lease Losses
Management and the Audit Committee are responsible for maintaining an effective loan review system, and internal controls, which include an effective risk rating system that identifies, monitors, and addresses asset quality problems in an accurate and timely manner. The allowance is evaluated for adequacy on at least a quarterly basis.
The Company’s loan loss reserve methodology is established and maintained at an amount sufficient to cover the estimated credit loss associated with the loan and lease portfolios of the Bank as of the date of determination. Credit losses arise not only from credit risk, but also from other risks inherent in the lending process including, but not limited to, collateral risk, operational risk, concentration risk, and economic risk. As such, all related risks of lending are considered when assessing the adequacy of the Allowance for Loan and Lease Losses (ALLL).
The methodology for determining the allowance for loan and lease losses involves significant judgment. Therefore the Company has established a methodology for measuring the adequacy of the ALLL, which is systematic and consistently applied each quarter. The analysis and methodology include three primary segments: (1) a specific reserve analysis for those loans considered impaired under Statement of Financial Accounting Standards (SFAS) No. 114; (2) a pool analysis of groups of loans within the portfolio that have similar characteristics; and (3) qualitative risk factors and general economic conditions.
A SFAS No. 114 reserve analysis is completed on all loans that have been determined to be impaired by Management. When a loan is determined to be impaired, the amount of that impairment must be measured by either the loan’s observable market price, the fair value of the collateral of the loan, less liquidation costs, if it is collateral dependent, or by calculating the present value of expected future cash flows discounted at the loan’s effective interest rate. If the value of the impaired loan is less than the current balance of the loan, the Company must recognize the impairment by creating a specific reserve allowance for the shortfall.
The second reserve segment, the pool analysis methodology is governed by SFAS No. 5, Accounting for Contingencies. A historical loss rate is calculated for each loan type over the 12 prior quarters to determine the 3 year average loss rate. As circumstances dictate, Management will make adjustments to the loss history to reflect significant changes in the Company’s loss history.
The third segment relates to risks not captured elsewhere. Adjustments are made to historical loss rates to cover risks associated with trends in delinquencies, non-accruals, current economic conditions, credit administration/ underwriting practices, and borrower concentrations.
At December 31, 2007, the allowance for loan losses was $47.1 million, or 1.31%, of year-end loans, compared to $46.8 million, or 1.43%, of year-end loans for 2006. In 2005, Annual Reportwe established a $35.2 million specific allowance for estimated credit losses related to Stockholdersthe impact of Hurricane Katrina on our loan portfolio. In 2005, we reduced the allowance by $2.4 million for storm-related net charge-offs. As a result, the storm-related allowance was $32.9 million as of December 31, 2005. During 2006 we reversed $20.0 million from the storm-related allowance for loan losses due to better than expected loss experience with storm impacted credits.
Net charge-offs remained relatively constant amounting to $7.2 million in 2007, as compared to $7.0 million in 2006. Overall, the allowance for loan losses was 241% of non-performing loans and accruing loans 90 days past due at year-end 2007, compared to 695% at year-end 2006. As discussed on the previous page, the ratio of allowance for loan losses to non-performing loans and accruing loans 90 days past due at December 31, 2007 represents a return to our historic levels. We utilize quantitative methodologies and modeling to determine the adequacy of the allowance for loan and lease losses and are of the opinion that the allowance at December 31, 2007 is incorporated hereinadequate.
The following table sets forth, for the periods indicated, average net loans outstanding, allowance for loan losses, amounts charged-off and recoveries of loans previously charged-off:
TABLE 12. Summary of Activity in the Allowance for Loan Losses |
|
|
|
|
|
|
|
|
|
|
|
|
|
|
|
|
|
|
| At and For The Years Ended December 31, |
| |||||||||||||
|
|
| ||||||||||||||
|
| 2007 |
| 2006 |
| 2005 |
| 2004 |
| 2003 |
| |||||
|
|
|
|
|
|
| ||||||||||
|
| (In thousands) |
| |||||||||||||
| ||||||||||||||||
Net loans outstanding at end of period |
| $ | 3,615,514 |
| $ | 3,266,583 |
| $ | 2,989,186 |
| $ | 2,748,560 |
| $ | 2,448,644 |
|
|
|
|
|
|
|
| ||||||||||
|
|
|
|
|
|
|
|
|
|
|
|
|
|
|
|
|
Average net loans outstanding |
| $ | 3,428,009 |
| $ | 3,062,222 |
| $ | 2,883,020 |
| $ | 2,599,561 |
| $ | 2,238,245 |
|
|
|
|
|
|
|
| ||||||||||
Balance of allowance for loan losses at beginning of period |
| $ | 46,772 |
| $ | 74,558 |
| $ | 40,682 |
| $ | 36,750 |
| $ | 34,740 |
|
|
|
|
|
|
|
| ||||||||||
Loans charged-off: |
|
|
|
|
|
|
|
|
|
|
|
|
|
|
|
|
Real estate |
|
| 530 |
|
| 758 |
|
| 226 |
|
| 403 |
|
| 291 |
|
Commercial |
|
| 2,597 |
|
| 3,676 |
|
| 4,001 |
|
| 5,381 |
|
| 4,868 |
|
Consumer, credit cards and other revolving credit |
|
| 11,159 |
|
| 14,712 |
|
| 11,537 |
|
| 14,383 |
|
| 14,311 |
|
Lease financing |
|
| 166 |
|
| 369 |
|
| 47 |
|
| 261 |
|
| 73 |
|
|
|
|
|
|
|
| ||||||||||
Total charge-offs |
|
| 14,452 |
|
| 19,515 |
|
| 15,811 |
|
| 20,428 |
|
| 19,543 |
|
|
|
|
|
|
|
| ||||||||||
Recoveries of loans previously charged-off: |
|
|
|
|
|
|
|
|
|
|
|
|
|
|
|
|
Real estate |
|
| 188 |
|
| 263 |
|
| 33 |
|
| 179 |
|
| 180 |
|
Commercial |
|
| 2,774 |
|
| 4,729 |
|
| 2,757 |
|
| 1,957 |
|
| 1,112 |
|
Consumer, credit cards and other revolving credit |
|
| 4,205 |
|
| 7,489 |
|
| 4,258 |
|
| 5,687 |
|
| 5,103 |
|
Lease financing |
|
| 43 |
|
| 10 |
|
| 4 |
|
| — |
|
| 4 |
|
|
|
|
|
|
|
| ||||||||||
Total recoveries |
|
| 7,210 |
|
| 12,491 |
|
| 7,052 |
|
| 7,823 |
|
| 6,399 |
|
|
|
|
|
|
|
| ||||||||||
Net charge-offs |
|
| 7,242 |
|
| 7,024 |
|
| 8,759 |
|
| 12,605 |
|
| 13,144 |
|
Provision for (recovery of) loan losses |
|
| 7,593 |
|
| (20,762 | ) |
| 42,635 |
|
| 16,537 |
|
| 15,154 |
|
Balance acquired through acquisition & other |
|
| — |
|
| — |
|
| — |
|
| — |
|
| — |
|
|
|
|
|
|
|
| ||||||||||
Balance of allowance for loan losses at end of period |
| $ | 47,123 |
| $ | 46,772 |
| $ | 74,558 |
| $ | 40,682 |
| $ | 36,750 |
|
|
|
|
|
|
|
| ||||||||||
Ratios |
|
|
|
|
|
|
|
|
|
|
|
|
|
|
|
|
Gross charge-offs to average loans |
|
| 0.42 | % |
| 0.64 | % |
| 0.55 | % |
| 0.79 | % |
| 0.87 | % |
Recoveries to average loans |
|
| 0.21 | % |
| 0.41 | % |
| 0.24 | % |
| 0.30 | % |
| 0.29 | % |
Net charge-offs to average loans |
|
| 0.21 | % |
| 0.23 | % |
| 0.30 | % |
| 0.48 | % |
| 0.59 | % |
Allowance for loan losses to year end loans |
|
| 1.31 | % |
| 1.43 | % |
| 2.49 | % |
| 1.48 | % |
| 1.50 | % |
Net charge-offs to period-end net loans |
|
| 0.21 | % |
| 0.22 | % |
| 0.29 | % |
| 0.46 | % |
| 0.54 | % |
Allowance for loan losses to average net loans |
|
| 1.37 | % |
| 1.53 | % |
| 2.59 | % |
| 1.56 | % |
| 1.64 | % |
Net charge-offs to loan loss allowance |
|
| 15.37 | % |
| 15.02 | % |
| 11.75 | % |
| 30.98 | % |
| 35.77 | % |
An allocation of the loan loss allowance by reference.major loan category is set forth in the following table. There were no relevant variations in loan concentrations, quality or terms, except for an increase in the outstanding loan portfolio balance. The unallocated portion of the allowance represents supportable estimates of probable losses inherent in the loan portfolio but not specifically related to one category of the portfolio. The allocation is not necessarily indicative of the category of future losses, and the full allowance at December 31, 2007 is available to absorb losses occurring in any category of loans.
|
|
|
|
|
|
|
|
|
|
|
|
|
|
|
|
|
|
|
|
|
|
|
|
|
|
|
|
|
|
|
|
|
|
|
|
|
|
|
|
|
|
TABLE 13. Allocation of Loan Loss by Category |
| ||||||||||||||||||||||||||||||||||||||||
| |||||||||||||||||||||||||||||||||||||||||
|
| ||||||||||||||||||||||||||||||||||||||||
|
| For Years Ended December 31, |
| ||||||||||||||||||||||||||||||||||||||
|
| 2007 |
| 2006 |
| 2005 |
| 2004 |
| 2003 |
| ||||||||||||||||||||||||||||||
|
|
|
|
|
|
| |||||||||||||||||||||||||||||||||||
|
| Allowance |
| % of |
| Allowance |
| % of |
| Allowance |
| % of |
| Allowance |
| % of |
| Allowance |
| % of |
| ||||||||||||||||||||
|
|
|
|
|
|
|
|
|
|
|
| ||||||||||||||||||||||||||||||
|
|
|
|
|
|
|
|
|
| (In thousands) |
|
|
|
|
|
|
|
|
| ||||||||||||||||||||||
| |||||||||||||||||||||||||||||||||||||||||
Real estate |
|
| $ | 1,998 |
|
| 64.85 |
|
|
| $ | 1,697 |
|
| 64.84 |
|
|
| $ | 23,042 |
|
| 62.86 |
|
|
| $ | 11,253 |
|
| 64.19 |
|
|
| $ | 9,711 |
|
| 63.30 |
|
|
Commercial, industrial and other |
|
|
| 27,546 |
|
| 19.15 |
|
|
|
| 27,838 |
|
| 18.77 |
|
|
|
| 34,128 |
|
| 19.74 |
|
|
|
| 14,974 |
|
| 17.37 |
|
|
|
| 15,311 |
|
| 17.41 |
|
|
Consumer and other revolving credit |
|
|
| 16,111 |
|
| 16.00 |
|
|
|
| 15,363 |
|
| 16.39 |
|
|
|
| 15,812 |
|
| 17.40 |
|
|
|
| 11,453 |
|
| 18.44 |
|
|
|
| 10,718 |
|
| 19.29 |
|
|
Unallocated |
|
|
| 1,468 |
|
| — |
|
|
|
| 1,874 |
|
| — |
|
|
|
| 1,576 |
|
| — |
|
|
|
| 3,002 |
|
| — |
|
|
|
| 1,010 |
|
| — |
|
|
|
|
|
|
|
|
|
|
|
|
|
|
|
|
|
|
|
|
|
|
|
|
|
|
|
|
| |||||||||||||||
|
|
|
|
|
|
|
|
|
|
|
|
|
|
|
|
|
|
|
|
|
|
|
|
|
|
|
|
|
|
|
|
|
|
|
|
|
|
|
|
|
|
|
|
| $ | 47,123 |
|
| 100.00 |
|
|
| $ | 46,772 |
|
| 100.00 |
|
|
| $ | 74,558 |
|
| 100.00 |
|
|
| $ | 40,682 |
|
| 100.00 |
|
|
| $ | 36,750 |
|
| 100.00 |
|
|
|
|
|
|
|
|
|
|
|
|
|
|
|
|
|
|
|
|
|
|
|
|
|
|
|
|
| |||||||||||||||
(1) | Loans used in the calculation of “allowance for loan losses” are grouped according to loan purpose. |
(2) | Loans used in the calculation of “% of loans to total loans” are grouped by collateral type. |
Deposits
Our deposit base declined slightly in 2007 after experiencing significant growth in 2006 due to Hurricane Katrina. Deposits decreased to $5.009 billion at December 31, 2007 from $5.031 billion at December 31, 2006, a decrease of $21.5 million, or approximately 0.43%. The year-end deposit decrease was primarily driven by declines in both non-interest bearing deposits of $149.5 million and interest-bearing transaction deposits of $124.5 million. These declines were off-set by an increase in time deposits by $252.6 million. Total average deposits decreased by $140.3 million, or 2.77%, from $5.069 billion at December 31, 2006 to $4.929 billion at December 31, 2007.
Over the course of 2007, we continued our focus on multiple account, core deposit relationships and strategic placement of time deposit campaigns to stimulate overall deposit growth. In addition, we keep as our highest priority, continued customer demand for safety and liquidity of deposit products. However, the rebuilding efforts of our customer base after Hurricane Katrina and competitive forces resulted in a slight decline in our deposit base during 2007, as noted above. The composition of our deposit mix changed during 2007, and ended with a less favorable funding mix than in 2006. As a percent of our average deposit mix, time deposits increased to 40% from 34% while low cost interest bearing transaction accounts and demand deposits decreased from 50% to 44%, and Public Fund account balances increased slightly to 17% from 16%. The Banks traditionally price their deposits to position themselves competitively with the local market.
Borrowings consist primarily of sales of securities under repurchase agreements. In total, borrowings increased to $386.3 million at December 31, 2007 from $227.0 million at December 31, 2006, an increase of $159.2 million. The primary driver of the increase were two leverage transactions undertaken during the fourth quarter of 2007 that management feels will insulate the income statement from lower rates. In addition, at December 31, 2007, federal funds purchased totaled $4.1 million while purchases of federal funds outstanding at December 31, 2006 totaled $3.8 million.
Table 14 shows average deposits for a three-year period.
|
|
|
|
|
|
|
|
|
|
|
|
|
|
|
|
|
|
|
|
|
|
|
|
|
|
|
|
|
TABLE 14. Average Deposits |
|
|
|
|
| |||||||||||||||||||||||
| ||||||||||||||||||||||||||||
|
| |||||||||||||||||||||||||||
|
| 2007 |
| 2006 |
| 2005 |
| |||||||||||||||||||||
|
|
| ||||||||||||||||||||||||||
|
| Balance |
| Rate |
| Mix |
| Balance |
| Rate |
| Mix |
| Balance |
| Rate |
| Mix |
| |||||||||
|
|
|
|
|
|
|
| (In thousands) |
|
|
|
|
|
|
| |||||||||||||
| ||||||||||||||||||||||||||||
Non-interest bearing demand deposits |
| $ | 927,655 |
| 0.00 | % |
| 19 | % |
| $ | 1,128,850 |
| 0.00 | % |
| 22 | % |
| $ | 822,733 |
| 0.00 | % |
| 21 | % |
|
NOW account deposits |
|
| 1,067,775 |
| 2.52 | % |
| 22 | % |
|
| 1,167,047 |
| 2.45 | % |
| 23 | % |
|
| 893,521 |
| 1.55 | % |
| 22 | % |
|
Money market deposits |
|
| 529,976 |
| 2.50 | % |
| 11 | % |
|
| 517,542 |
| 1.74 | % |
| 10 | % |
|
| 445,134 |
| 0.96 | % |
| 11 | % |
|
Savings deposits |
|
| 428,599 |
| 0.61 | % |
| 8 | % |
|
| 564,177 |
| 0.63 | % |
| 11 | % |
|
| 521,502 |
| 0.70 | % |
| 13 | % |
|
Time deposits |
|
| 1,975,171 |
| 4.56 | % |
| 40 | % |
|
| 1,691,811 |
| 4.08 | % |
| 34 | % |
|
| 1,318,536 |
| 3.47 | % |
| 33 | % |
|
|
|
|
|
| ||||||||||||||||||||||||
Total average deposits |
| $ | 4,929,176 |
|
|
|
| 100 | % |
| $ | 5,069,427 |
|
|
|
| 100 | % |
| $ | 4,001,426 |
|
|
|
| 100 | % |
|
|
|
|
|
|
|
|
|
|
|
|
|
|
|
|
|
| ||||||||||||
Time certificates of deposit of $100,000 and greater at December 31, 2007 had maturities as follows:
|
|
|
|
|
|
|
TABLE 15. Maturity of Time Deposits greater than or equal to $100,000 |
| |||||
| ||||||
|
|
|
|
| ||
|
| December 31, 2007 |
| |||
|
|
| ||||
|
| (In thousands) |
| |||
|
|
|
|
| ||
Three months |
|
| $ | 377,860 |
|
|
Over three through six months |
|
|
| 279,492 |
|
|
Over six months through one year |
|
|
| 211,289 |
|
|
Over one year |
|
|
| 66,654 |
|
|
|
|
|
|
| ||
Total |
|
| $ | 935,295 |
|
|
|
|
|
|
| ||
Short-Term Borrowings
The following table sets forth certain information concerning our short-term borrowings, which consist of federal funds purchased and securities sold under agreements to repurchase.
|
|
|
|
|
|
|
|
|
|
|
| ||
| TABLE 16. Short-Term Borrowings |
|
|
|
|
|
|
|
|
|
| ||
|
| ||||||||||||
|
|
|
|
| |||||||||
|
|
| Years Ended December 31, |
| |||||||||
|
|
|
| ||||||||||
|
|
| 2007 |
| 2006 |
| 2005 |
| |||||
|
|
|
|
|
| ||||||||
|
|
|
|
| (In thousands) |
|
|
| |||||
| Federal funds purchased: |
|
|
|
|
|
|
|
|
|
| ||
| Amount outstanding at period-end |
| $ | 4,100 |
|
| $ | 3,800 |
|
| $ | 1,475 |
|
| Weighted average interest at period-end |
|
| 4.02 | % |
|
| 4.95 | % |
|
| 3.95 | % |
| Maximum amount at any month-end during period |
| $ | 4,100 |
|
| $ | 49,160 |
|
| $ | 55,120 |
|
| Average amount outstanding during period |
| $ | 4,174 |
|
| $ | 11,557 |
|
| $ | 10,262 |
|
| Weighted average interest rate during period |
|
| 4.99 | % |
|
| 5.38 | % |
|
| 3.27 | % |
|
|
|
|
|
|
|
|
|
|
|
|
|
|
| Securities sold under agreements to repurchase: |
|
|
|
|
|
|
|
|
|
|
|
|
| Amount outstanding at period-end |
| $ | 371,604 |
|
| $ | 218,591 |
|
| $ | 250,807 |
|
| Weighted average interest at period-end |
|
| 3.63 | % |
|
| 3.72 | % |
|
| 4.29 | % |
| Maximum amount at any month end during-period |
| $ | 371,604 |
|
| $ | 425,753 |
|
| $ | 258,508 |
|
| Average amount outstanding during period |
| $ | 216,730 |
|
| $ | 250,603 |
|
| $ | 224,842 |
|
| Weighted average interest rate during period |
|
| 3.70 | % |
|
| 3.62 | % |
|
| 1.94 | % |
Return on Equity and Assets
Information regarding performance and equity ratios is as follows:
|
|
|
|
|
|
|
|
|
|
|
TABLE 17. Return on Equity and Assets |
| |||||||||
| ||||||||||
| ||||||||||
|
| Years Ended December 31, |
| |||||||
|
|
| ||||||||
|
| 2007 |
| 2006 |
| 2005 |
| |||
|
|
|
|
| ||||||
Return on average assets |
| 1.26 | % |
| 1.69 | % |
| 1.10 | % |
|
Return on average common equity |
| 13.14 | % |
| 19.82 | % |
| 11.36 | % |
|
Dividend payout ratio |
| 41.56 | % |
| 28.59 | % |
| 43.11 | % |
|
Average common equity to average assets ratio |
| 9.61 | % |
| 8.52 | % |
| 9.65 | % |
|
COMMITMENTS AND CONTINGENCIES
Loan Commitments and Letters of Credit
In the normal course of business, the Company enterswe enter into financial instruments, such as commitments to extend credit and letters of credit, to meet the financing needs of itsour customers. Such instruments are not reflected in the accompanying consolidated financial statements until they are funded and involve, to varying degrees, elements of credit risk not reflected in the consolidated balance sheets. The contract amounts of these instruments reflect the Company’sour exposure to credit loss in the event of non-performance by the other party on whose behalf the instrument has been issued. The Company undertakesWe undertake the same credit evaluation in making commitments and conditional obligations as it doeswe do for on-balance-sheet instruments and may require collateral or other credit support for off-balance-sheet financial instruments.
At December 31, 2005 the Company2007, we had $550.9 million$1.1 billion in unused loan commitments outstanding, of which approximately $348.9$524.7 million were at variable rates and the remainder was at fixed rates. A commitment to extend credit is an agreement to lend to a customer as long as the conditions established in the agreement have been satisfied. A commitment to extend credit generally has a fixed expiration date or other termination clauses and may require payment of a fee by the borrower. Since commitments often expire without being fully drawn, the total commitment amounts do not necessarily represent our future cash requirements of the Company. The Companyrequirements. We continually evaluatesevaluate each customer’s credit worthiness on a case-by-case basis. Occasionally, a credit evaluation of a customer requesting a commitment to extend credit results in the Companyour obtaining collateral to support the obligation.
Letters of credit are conditional commitments issued by the Companyus to guarantee the performance of a customer to a third party. The credit risk involved in issuing a letter of credit is essentially the same as that involved in extending a loan. At December 31, 2005 the Company2007, we had $57.4$87.0 million in letters of credit issued and outstanding.
The following table shows the commitments to extend credit and letters of credit at December 31, 20052007 according to expiration date.
|
|
|
|
|
|
|
|
|
|
|
|
|
|
|
|
|
|
|
|
|
TABLE 18. Commitments and Letters of Credit |
| |||||||||||||||||||
| ||||||||||||||||||||
| ||||||||||||||||||||
|
|
|
|
| Expiration Date |
| ||||||||||||||
|
|
|
|
|
| |||||||||||||||
|
| Total |
| Less than |
| 1-3 |
| 3-5 |
| More than |
| |||||||||
|
|
|
|
|
|
| ||||||||||||||
|
|
|
|
|
|
|
| (In thousands) |
|
|
|
|
|
|
| |||||
December 31, 2007 |
|
|
|
|
|
|
|
|
|
|
|
|
|
|
| |||||
Commitments to extend credit |
| $ | 1,110,935 |
| $ | 744,412 |
|
| $ | 46,759 |
|
| $ | 69,008 |
|
| $ | 250,756 |
|
|
Letters of credit |
|
| 86,969 |
|
| 25,225 |
|
|
| 48,983 |
|
|
| 12,761 |
|
|
| — |
|
|
|
|
|
|
|
|
|
|
|
|
| ||||||||||
Total |
| $ | 1,197,904 |
| $ | 769,637 |
|
| $ | 95,742 |
|
| $ | 81,769 |
|
| $ | 250,756 |
|
|
|
|
|
|
|
|
|
|
|
|
| ||||||||||
|
|
|
|
|
|
|
|
|
|
|
|
|
|
|
|
|
|
|
|
|
|
|
|
|
| Expiration Date |
| ||||||||||||||
|
|
|
|
|
| |||||||||||||||
|
| Total |
| Less than |
| 1-3 |
| 3-5 |
| More than |
| |||||||||
|
|
|
|
|
|
| ||||||||||||||
|
|
|
|
|
| (In thousands) |
|
|
|
|
| |||||||||
December 31, 2006 |
|
|
|
|
|
|
|
|
|
|
|
|
|
|
|
| ||||
Commitments to extend credit |
| $ | 963,098 |
| $ | 648,802 |
|
| $ | 38,204 |
|
| $ | 38,164 |
|
| $ | 237,928 |
|
|
Letters of credit |
|
| 69,468 |
|
| 20,235 |
|
|
| 40,174 |
|
|
| 9,059 |
|
|
| — |
|
|
|
|
|
|
|
|
|
|
|
|
| ||||||||||
Total |
| $ | 1,032,566 |
| $ | 669,037 |
|
| $ | 78,378 |
|
| $ | 47,223 |
|
| $ | 237,928 |
|
|
|
|
|
|
|
|
|
|
|
|
| ||||||||||
Visa Litigation
In October 2007, Hancock Bank, as a member of 54
Expiration Date ---------------------------------------------Visa U.S.A. Inc. “Visa U.S.A.”, received shares of restricted stock in Visa, Inc. “Visa” as a result of its participation in the global restructuring of Visa U.S.A., Visa Canada Association, and Visa International Service Association in preparation for an initial public offering. On November 7, 2007, Visa announced that it had reached a settlement with American Express related to an antitrust lawsuit in the amount of $2.065 billion. As reported by Visa in a Current Report on Form 8-K filed with the Securities and Exchange Commission on November 13, 2007, the settlement became effective upon receipt of the requisite approval of Visa U.S.A. members on November 9, 2007. Hancock Bank and other Visa U.S.A. member banks are obligated to share in potential losses resulting from this and certain other litigation. In consideration of the announced American Express settlement and additional VISA litigation disclosed in VISA’s 2007 Form10-K, and our proportionate membership share of Visa U.S.A., we recorded in the fourth quarter of 2007 in accordance with FASB Interpretation 45,(dollarsGuarantors Accounting and Disclosure Requirements, Including Indirect Guarantees of Indebtedness of Others, a liability and corresponding pre-tax expense of approximately $2.45 million. The expense is included inthousands)LessOther Expenses on the Consolidated Statement of Income and the liability is included in Other Liabilities on the Consolidated Balance Sheet. As disclosed in Visa’s Form 8-K filed with the SEC on November 7, 2007, Visa intends that payments related to the above litigation matters will be funded from an escrow account to be established with a portion of the proceeds from its planned initial public offering. We currently anticipate that our proportional share of the proceeds of the planned initial public offering by Visa will more than1-3 3-5 More than Total 1 year years years 5 years -------------- -------------- ------------- -------------- ------------- Commitmentsoffset any liabilities related toextend credit $ 550,948 $ 284,249 $ 34,999 $ 25,815 $ 205,885 LettersVisa litigation.RISK MANAGEMENT
Credit Risk
The Banks’ primary lending focus is to provide commercial, consumer and real estate loans to consumers and to small and middle market businesses in their respective market areas. Diversification in the loan portfolio is a means of reducing the risks associated with economic fluctuations. The Banks have no significant concentrations of loans to particular borrowers or loans to any foreign entities. There have been increases in some categories of loans – home equity, real estate construction/term and C&I loans are examples. These are principally within and in support of the markets that are continuing to rebuild and repair since Hurricane Katrina. Loan demand continues to be strong within those markets. Loan underwriting standards reduce the impact of credit
57,427 34,261 1,287 21,397 483 -------------- -------------- ------------- -------------- ------------- Total $ 608,375 $ 318,510 $ 36,286 $ 47,212 $ 206,368 ============== ============== ============= ============== =============
Allowance for Loan and Lease Losses
The allowance for loan and lease losses “ALLL” is a valuation account available to absorb losses on loans. The ALLL is established and maintained at an amount sufficient to cover the estimated credit loss associated with the loan and lease portfolios as of the date of the determination. Credit losses arise not only from credit risk, but also from other risks inherent in the lending process including, but not limited to, collateral risk, operational risk, concentration risk, and economic risk. As such, all related risks of lending are considered when assessing the adequacy of the allowance for loan and lease losses. Quarterly, we estimate the probable level of losses to determine whether the allowance is adequate to absorb reasonably foreseeable, anticipated losses in the existing portfolio based on our past loan loss and delinquency experience, known and inherent risks in the portfolio, adverse situations that may affect the borrowers’ ability to repay, and the estimated value of any underlying collateral and current economic conditions. The analysis and methodology include three primary segments. These segments include a pool analysis of various retail loans based upon loss history, a pool analysis of commercial and commercial real estate loans based upon loss history by loan type, and a specific reserve analysis for those loans considered impaired under SFAS No. 114. All commercial and commercial real estate loans with an outstanding balance of $100,000 or greater are individually reviewed for impairment; substandard mortgage loans with balances of $100,000 or greater are also included in the analysis. All losses are charged to the allowance for loan and lease losses when the loss actually occurs or when a determination is made that a loss is likely to occur; recoveries are credited to the allowance for loan losses at the time of receipt.
Commercial loans are considered impaired when it is probable (the future event or events are likely to occur) that the bank will be unable to collect all amounts due (including principal and interest) according to the contractual terms of the loan agreement. In order to ensure consideration of all possible impairments, for purposes of the model the Banks consider all loans that are risk rated substandard as impaired. When a loan is determined to be impaired, the amount of that impairment must be measured by either the loan’s observable market price, the fair value of the collateral of the loan (less liquidation costs) if it is collateral dependent, or by calculating the present value of expected future cash flows discounted at the loan’s effective interest rate. If the value of the impaired loan is less than the current balance of the loan, the impairment is recognized by creating a specific reserve allowance for the shortfall. If the value is greater or equal to the loan balance, then no reserve allocation may be made for the loan. In addition, any loans included in the impairment review should not be incorporated into the pool analysis to avoid double counting.
Pool analysis is applied for all retail loans. The retail loans are subdivided into three groups, which currently include: mortgage real estate, indirect loans and direct consumer loans. A historical loss rate is calculated for each group over the twelve prior quarters to determine the three year average loss rate. As circumstances dictate, management will make adjustments to the loss history to reflect significant changes in our loss history. Adjustments will also be made to historical loss rates to cover risks associated with trends in delinquencies, non-accruals, current economic conditions and credit administration/ underwriting practices and policies.
A historical loss ratio is applied to all commercial loans, commercial real estate loans and leases grouped by product type for which SFAS No. 5 exposure can best be evaluated collectively due to similar attributes. A historical loss rate is calculated for each group over the twelve prior quarters to determine the three year average loss rate. As circumstances dictate, we will make adjustments to the loss history to reflect significant changes in our loss history. Adjustments will also be made to historical loss rates to cover risks associated with trends in delinquencies, non-accruals, current economic conditions and credit administration/ underwriting practices and policies and borrower concentrations.
Asset/Liability Management
Our asset liability management (ALM) process consists of quantifying, analyzing and controlling interest rate risk (IRR) to maintain stability in net interest income (NII) under varying interest rate environments. The principal objective of ALM is to maximize net interest income while operating within acceptable limits established for interest rate risk and maintaining adequate levels of liquidity. Our net earnings are dependent on our net interest income. Net interest income is susceptible to IRR to the degree that interest-bearing liabilities mature or reprice on a different basis and timing than interest-earning assets. This timing difference represents a potential risk to our future earnings. When interest-bearing liabilities mature or reprice more quickly than interest-earning assets in a given period, a significant
increase in market rates of interest and the subsequent impact on customer behavior could adversely affect NII. Similarly, when interest-earning assets mature or reprice more quickly than interest-bearing liabilities, falling interest rates and changes in customer behavior could result in a decrease in NII.
Management and the Asset/Liability Committee (ALCO) direct our IRR management through a Risk Management policy that is designed to produce a stable net interest margin (NIM) in periods of interest rate fluctuation. In adjusting our asset/liability position, the board of directors and management attempt to direct our IRR while enhancing the NIM. At times, depending on the general level of interest rates, the relationship between long-term and short-term interest rates, market conditions and competitive factors, we may determine strategies that could add to the level of IRR in order to increase its NIM. Not withstanding our IRR management activities, the potential for changing interest rates is an uncertainty that can have an adverse effect on net earnings.
To control interest rate risk, we regularly monitor the volume of interest sensitive assets compared with interest sensitive liabilities over specific time intervals. Interest-sensitive assets and liabilities are those that are subject to maturity or repricing within a given time period. We also administer this sensitivity through the development and implementation of investment, lending, funding and pricing strategies designed to achieve NII performance goals while minimizing the potential negative variations in NII under different interest rate scenarios. Investment strategies, including portfolio durations and cash flows, are formulated and continually adjusted during the implementation to assure attainment of objectives in the most effective manner. Loan and deposit pricing are adjusted weekly to reflect current interest rate and competitive market environments, with duration targets on both reviewed monthly.
The static gap report shown in Table 19 measures the net amounts of assets and liabilities that reprice within a given time period over the remaining lives of those instruments. At December 31, 2007, our cumulative repricing gap in the one year interval was -6%. The liability sensitive position represents a deposit funding mix of significant balances in short term contractual CDs. The earning asset position is strategically managed with a balance in our loan growth (fixed versus floating and duration targets) and securities portfolio cash flows. We believe we are well positioned for the current rate environment.
To further control IRR, we structure our loan portfolio to provide appropriate investment opportunities while minimizing potential volatility in earnings from extension risk. Deposit strategies continue to emphasize a mix of non-certificate of deposit core accounts and consumer time deposits. However, the 2007 yield curve environment has created more demand on consumer time deposits with maturities less than one year.
The following table sets forth the scheduled re-pricing or maturity of our assets and liabilities at December 31, 2007 and December 31, 2006. The assumed prepayment of investments and loans were based on our assessment of current market conditions on such dates. Estimates have been made for the re-pricing of savings, NOW and money market accounts. Actual prepayments and deposit withdrawals will differ from the following analysis due to variable economic circumstances and consumer behavior. Although assets and liabilities may have similar maturities or repricing periods, reactions will vary as to timing and degree of interest rate change.
|
|
|
|
|
|
|
|
|
|
|
|
|
|
|
|
|
|
|
|
|
|
| ||
TABLE 19. Analysis of Interest Sensitivity |
| |||||||||||||||||||||||
| ||||||||||||||||||||||||
|
| |||||||||||||||||||||||
|
| December 31, 2007 |
| |||||||||||||||||||||
|
|
|
|
|
|
|
|
|
|
|
|
|
|
|
|
|
|
|
|
|
|
| ||
|
| Overnight |
| Within |
| 6 months |
| 1 to 3 |
| > 3 |
| Non-Sensitive Balance |
| Total |
| |||||||||
|
|
|
|
|
|
|
|
| ||||||||||||||||
|
| (In thousands) |
| |||||||||||||||||||||
Assets |
|
|
|
|
|
|
|
|
|
|
|
|
|
|
|
|
|
|
|
|
|
| ||
Securities |
| $ | 2,003 |
| $ | 513,981 |
| $ | 188,854 |
| $ | 412,428 |
| $ | 530,680 |
|
| $ | 29,675 |
|
| $ | 1,677,621 |
|
Federal funds sold & short-term investments |
|
| 126,281 |
|
| — |
|
| — |
|
| — |
|
| — |
|
|
| — |
|
|
| 126,281 |
|
Loans |
|
| — |
|
| 1,811,351 |
|
| 289,337 |
|
| 745,239 |
|
| 722,464 |
|
|
| — |
|
|
| 3,568,391 |
|
Other assets |
|
| — |
|
| — |
|
| — |
|
| — |
|
| — |
|
|
| 683,686 |
|
|
| 683,686 |
|
|
|
|
|
|
|
|
|
|
|
| ||||||||||||||
Total Assets |
| $ | 128,284 |
| $ | 2,325,332 |
| $ | 478,191 |
| $ | 1,157,667 |
| $ | 1,253,144 |
|
| $ | 713,361 |
|
| $ | 6,055,979 |
|
|
|
|
|
|
|
|
|
|
|
| ||||||||||||||
Liabilities |
|
|
|
|
|
|
|
|
|
|
|
|
|
|
|
|
|
|
|
|
|
|
|
|
Interest bearing transaction deposits |
| $ | — |
| $ | 652,915 |
| $ | 299,590 |
| $ | 875,616 |
| $ | 139,795 |
|
| $ | — |
|
| $ | 1,967,916 |
|
Time deposits |
|
| — |
|
| 1,414,005 |
|
| 511,260 |
|
| 144,284 |
|
| 64,195 |
|
|
| — |
|
|
| 2,133,744 |
|
Non-interest bearing deposits |
|
| — |
|
| — |
|
| — |
|
| 45,402 |
|
| 862,472 |
|
|
| — |
|
|
| 907,874 |
|
Federal funds purchased |
|
| 4,100 |
|
| — |
|
| — |
|
| — |
|
| — |
|
|
| — |
|
|
| 4,100 |
|
Borrowings |
|
| 371,604 |
|
| 11 |
|
| — |
|
| 30 |
|
| 10,518 |
|
|
| — |
|
|
| 382,163 |
|
Other liabilities |
|
| — |
|
| — |
|
| — |
|
| — |
|
| — |
|
|
| 105,995 |
|
|
| 105,995 |
|
Stockholders’ Equity |
|
| — |
|
| — |
|
| — |
|
| — |
|
| — |
|
|
| 554,187 |
|
|
| 554,187 |
|
|
|
|
|
|
|
|
|
|
|
| ||||||||||||||
Total Liabilities & Equity |
| $ | 375,704 |
| $ | 2,066,931 |
| $ | 810,850 |
| $ | 1,065,332 |
| $ | 1,076,980 |
|
| $ | 660,182 |
|
| $ | 6,055,979 |
|
|
|
|
|
|
|
|
|
|
|
| ||||||||||||||
Interest sensitivity gap |
| $ | (247,420 | ) | $ | 258,401 |
| $ | (332,659 | ) | $ | 92,335 |
| $ | 176,164 |
|
| $ | 53,179 |
|
|
|
|
|
Cumulative interest rate sensitivity gap |
| $ | (247,420 | ) | $ | 10,981 |
| $ | (321,678 | ) | $ | (229,343 | ) | $ | (53,179 | ) |
| $ | — |
|
|
|
|
|
Cumulative interest rate sensitivity gap as a percentage of total earning assets |
|
| (4.6 | )% |
| 0.2 | % |
| (5.9 | )% |
| (4.2 | )% |
| (1.0 | )% |
|
|
|
|
|
|
|
|
|
|
|
|
|
|
|
|
|
|
|
|
|
|
|
|
|
|
|
|
|
|
|
|
|
| December 31, 2006 | |||||||||||||||||||||||
|
| |||||||||||||||||||||||
|
| Overnight |
| Within |
| 6 months |
| 1 to 3 |
| > 3 |
| Non-Sensitive |
|
| Total |
| ||||||||
|
|
|
|
|
|
|
|
|
| |||||||||||||||
|
| (In thousands) | ||||||||||||||||||||||
Assets |
|
|
|
|
|
|
|
|
|
|
|
|
|
|
|
|
|
|
|
|
|
|
|
|
Securities |
| $ | — |
| $ | 531,640 |
| $ | 325,198 |
| $ | 424,694 |
| $ | 586,372 |
|
| $ | 35,754 |
|
| $ | 1,903,658 |
|
Federal funds sold & short-term investments |
|
| 222,122 |
|
| — |
|
| 317 |
|
| — |
|
| — |
|
|
| — |
|
|
| 222,439 |
|
Loans |
|
| 60,762 |
|
| 1,563,794 |
|
| 297,791 |
|
| 671,158 |
|
| 626,307 |
|
|
| — |
|
|
| 3,219,812 |
|
Other assets |
|
| — |
|
| — |
|
| — |
|
| — |
|
| — |
|
|
| 618,656 |
|
|
| 618,656 |
|
|
|
|
|
|
|
|
|
|
|
| ||||||||||||||
Total Assets |
| $ | 282,884 |
| $ | 2,095,434 |
| $ | 623,306 |
| $ | 1,095,852 |
| $ | 1,212,679 |
|
| $ | 654,410 |
|
| $ | 5,964,565 |
|
|
|
|
|
|
|
|
|
|
|
| ||||||||||||||
Liabilities |
|
|
|
|
|
|
|
|
|
|
|
|
|
|
|
|
|
|
|
|
|
|
|
|
Interest bearing transaction deposits |
| $ | — |
| $ | 694,677 |
| $ | 315,933 |
| $ | 926,668 |
| $ | 155,172 |
|
| $ | — |
|
| $ | 2,092,450 |
|
Time deposits |
|
| — |
|
| 1,071,192 |
|
| 464,663 |
|
| 281,425 |
|
| 63,903 |
|
|
| — |
|
|
| 1,881,183 |
|
Non-interest bearing deposits |
|
| — |
|
| — |
|
| — |
|
| 52,868 |
|
| 1,004,490 |
|
|
| — |
|
|
| 1,057,358 |
|
Federal funds purchased |
|
| 3,800 |
|
| — |
|
| — |
|
| — |
|
| — |
|
|
| — |
|
|
| 3,800 |
|
Borrowings |
|
| 222,976 |
|
| — |
|
| — |
|
| 24 |
|
| 227 |
|
|
| — |
|
|
| 223,227 |
|
Other liabilities |
|
| — |
|
| — |
|
| — |
|
| — |
|
| — |
|
|
| 148,137 |
|
|
| 148,137 |
|
Stockholders’ Equity |
|
| — |
|
| — |
|
| — |
|
| — |
|
| — |
|
|
| 558,410 |
|
|
| 558,410 |
|
|
|
|
|
|
|
|
|
|
|
| ||||||||||||||
Total Liabilities & Equity |
| $ | 226,776 |
| $ | 1,765,869 |
| $ | 780,596 |
| $ | 1,260,985 |
| $ | 1,223,792 |
|
| $ | 706,547 |
|
| $ | 5,964,565 |
|
|
|
|
|
|
|
|
|
|
|
| ||||||||||||||
Interest sensitivity gap |
| $ | 56,108 |
| $ | 329,565 |
| $ | (157,290 | ) | $ | (165,133 | ) | $ | (11,113 | ) |
| $ | (52,137 | ) |
|
|
|
|
Cumulative interest rate sensitivity gap |
| $ | 56,108 |
| $ | 385,673 |
| $ | 228,383 |
| $ | 63,250 |
| $ | 52,137 |
|
| $ | — |
|
|
|
|
|
Cumulative interest rate sensitivity gap as a percentage of total earning assets |
|
| 1.0 | % |
| 7.2 | % |
| 4.2 | % |
| 1.2 | % |
| 1.0 | % |
|
|
|
|
|
|
|
|
Net Interest Income at Risk
NII at risk measures the risk of a decline in earnings due to changes in interest rates. Table 20 presents an analysis of our IRR as measured by the estimated changes in NII resulting from an instantaneous and sustained parallel shift in the yield curve at December 31, 2007. Shifts are measured in 100 basis point increments (+ 200 through - 200 basis points,) from base case. Base case encompasses key assumptions for asset/liability mix, loan and deposit growth, pricing, prepayment speeds, deposit decay rates, securities portfolio cash flows and reinvestment strategy, and the market value of certain assets under the various interest rate scenarios. The base case scenario assumes that the current
interest rate environment is held constant throughout the forecast period; the instantaneous shocks are performed against that yield curve.
TABLE 20. Net Interest Income (te) at Risk | ||||||
|
|
|
|
|
|
|
|
|
|
|
| ||
| Change in |
| Estimated Increase |
| ||
|
|
| ||||
| (basis points) |
|
|
| ||
|
|
|
|
| ||
| -200 |
|
| -6.7% |
|
|
| -100 |
|
| -2.9% |
|
|
| Stable |
|
| 0.0% |
|
|
| +100 |
|
| 0.0% |
|
|
| +200 |
|
| -0.8% |
|
|
| ||||||
| Most Likely |
|
| -2.7% |
|
|
Additionally, we have forecasted a Most Likely NII scenario based on its conservative projection of yield curve changes for the coming 12 month period. This scenario utilizes all base case assumptions, applying those assumptions against a yield curve forecast that incorporates the current interest rate environment and projects certain strategic pricing changes over the forecast period. Table 20 indicates that our level of NII is relatively unchanged under rising rates and declines under falling rates. The most likely scenario for interest rates projects net interest income to be relatively flat to declining with base case falling by 2.7% indicating that the balance sheet is appropriately structured for the current rate environment.
The increasing rate scenarios show relatively flat levels of net interest income while the decreasing scenarios show higher levels of volatility and subsequently lower levels of NII. These scenarios are instantaneous shocks that assume balance sheet management will mirror base case. Should the yield curve begin to rise or fall, management has several strategies available to maximize earnings opportunities or offset the negative impact to earnings. For example, in a falling rate environment, deposit pricing strategies could be adjusted to further incent customer behavior to non-contractual or short term (less than 12 months) contractual deposit products which would reset downward with the changes in the yield curve and prevailing market rates. Another opportunity at the start of such a cycle would be reinvesting the securities portfolio cash flows into longer term, non-callable bonds that would lock in higher yields. Finally, there are a number of hedge strategies by which management could use derivatives, including swaps and purchased floors, to lock in net interest margin protection; to date, we have not entered into any hedge transactions for the purpose of earnings protection.
Even if interest rates change in the designated amounts, there can be no assurance that our assets and liabilities would perform as anticipated. Additionally, a change in the U.S. Treasury rates in the designated amounts accompanied by a change in the shape of the U.S. Treasury yield curve would cause significantly different changes to NII than indicated above. Strategic management of our balance sheet and earnings is fluid and would be adjusted to accommodate these movements. As with any method of measuring IRR, certain shortcomings are inherent in the methods of analysis presented above. For example, although certain assets and liabilities may have similar maturities or periods to repricing, they may react in different degrees to changes in market interest rates. Also, the interest rates on certain types of assets and liabilities may fluctuate in advance of changes in market interest rates, while interest rates on other types may lag behind changes in market rates. Certain assets such as adjustable-rate loans have features which restrict changes in interest rates on a short-term basis and over the life of the asset. Also, the ability of many borrowers to service their debt may decrease in the event of an interest rate increase. We consider all of these factors in monitoring its exposure to interest rate risk.
LIQUIDITY
Liquidity Management
Liquidity management encompasses our ability to ensure that funds are available to meet the cash flow requirements of depositors and borrowers, while also ensuring that we have adequate cash flow to meet our various needs, including operating, strategic and capital. Without proper liquidity management, we would not be able to perform the primary function of a financial intermediary and would not be able to meet the needs of the communities in which we have a presence and serve. In addition, the parent holding company’s principal source of liquidity is dividends from its subsidiary banks. Liquidity is required at the parent holding company level for the purpose of paying dividends to stockholders, servicing of any debt we may have, business combinations as well as general corporate expenses.
The asset portion of the balance sheet provides liquidity primarily through loan principal repayments, maturities of investment securities and occasional sales of various assets. Short-term investments such as federal funds sold, securities purchased under agreements to resell and maturing interest-bearing deposits with other banks are additional sources of liquidity funding. As shown in Table 21 below, our liquidity ratios as of December 31, 2007 and 2006 for free securities stood at 17% or $286.9 million and 35% or $661.3 million, respectively.
|
|
|
|
|
|
|
|
TABLE 21. Liquidity Ratios |
|
|
|
|
|
|
|
| |||||||
|
| 2007 |
| 2006 |
| ||
|
|
| |||||
|
| (In thousands) | |||||
Free securities |
|
| 17.10 | % |
| 34.50 | % |
Free securities-net wholesale funds/core deposits |
|
| -7.40 | % |
| 5.40 | % |
|
| ||||||
Wholesale funding diversification |
|
|
|
|
|
|
|
Certificate of deposits > $100,000 (excluding public funds) |
|
| 11.10 | % |
| 9.80 | % |
Brokered certificate of deposits |
|
| 0.00 | % |
| 0.40 | % |
Public fund certificate of deposits |
| $ | 220,942 |
| $ | 126,493 |
|
|
| ||||||
Net wholesale funding maturity concentrations |
|
|
|
|
|
|
|
Overnight |
|
| 0.10 | % |
| 0.10 | % |
Up to 3 months |
|
| 6.00 | % |
| 3.50 | % |
Up to 6 months |
|
| 3.80 | % |
| 3.70 | % |
Over 6 months |
|
| 7.30 | % |
| 6.60 | % |
|
| ||||||
Net wholesale funds |
| $ | 1,037,475 |
| $ | 826,082 |
|
Core deposits |
| $ | 4,158,189 |
| $ | 4,242,726 |
|
|
| ||||||
The liability portion of the balance sheet provides liquidity through various customers’ interest-bearing and non-interest-bearing deposit accounts. Purchases of federal funds, securities sold under agreements to repurchase and other short-term borrowings are additional sources of liquidity and represent our incremental borrowing capacity. These sources of liquidity are short-term in nature and are used as necessary to fund asset growth and meet short-term liquidity needs. Our short-term borrowing capacity includes an approved line of credit with the Federal Home Loan Bank of $359.8 million and borrowing capacity at the Federal Reserve’s Discount Window in excess of $100 million. As of December 31, 2007 and 2006, our core deposits were $4.158 billion and $4.242 billion, respectively, and Net Wholesale Funding stood at $1.038 billion and $826.1 million, respectively.
The Consolidated Statements of Cash Flows provide an analysis of cash from operating, investing, and financing activities for each of the three years in the period ended December 31, 2007. Cash flows from operations are a significant part of liquidity management, contributing significant levels of funds in 2007, 2006 and 2005.
Cash flows from operations decreased to $54.2 million in 2007 from $82.2 million in 2006. Net cash used by investing activities increased to $105.5 million in 2007 from $104.9 million in 2006. Federal funds sold decreased $94.5 million during 2007 and $190.7 million during 2006. Cash flows provided by financing activities were $43.7
million in 2007, primarily from the increase in federal funds purchased compared to cash flows used for financing activities of $58.3 million in 2006.
Contractual Obligations
We have contractual obligations to make future payments on certain debt and lease agreements. Table 22 summarizes all significant contractual obligations at December 31, 2007, according to payments due by period.
|
|
|
|
|
|
|
|
|
|
|
|
|
|
|
|
| ||
TABLE 22. Contractual Obligations |
|
|
|
|
|
|
|
|
|
|
|
|
|
|
|
| ||
|
|
|
| |||||||||||||||
|
| Payment due by period |
| |||||||||||||||
|
|
| ||||||||||||||||
|
| Total |
| Less than |
| 1-3 |
| 3-5 |
| More than |
| |||||||
|
|
| ||||||||||||||||
|
| (in thousands) |
| |||||||||||||||
Certificates of deposit |
| $ | 2,133,744 |
| $ | 1,925,265 |
| $ | 144,284 |
| $ | 64,195 |
|
| $ | — |
|
|
Short-term debt obligations |
|
| 375,704 |
|
| 375,704 |
|
| — |
|
| — |
|
|
| — |
|
|
Long-term debt obligations |
|
| 248 |
|
| 10 |
|
| 25 |
|
| 35 |
|
|
| 178 |
|
|
Capital lease obligations |
|
| 545 |
|
| 144 |
|
| 233 |
|
| 54 |
|
|
| 114 |
|
|
Operating lease obligations |
|
| 21,670 |
|
| 4,823 |
|
| 7,769 |
|
| 3,986 |
|
|
| 5,092 |
|
|
|
|
| ||||||||||||||||
Total |
| $ | 2,531,911 |
| $ | 2,305,946 |
| $ | 152,311 |
| $ | 68,270 |
|
| $ | 5,384 |
|
|
|
|
| ||||||||||||||||
|
|
|
|
|
|
|
|
|
|
|
|
|
|
|
|
|
|
|
CAPITAL RESOURCES
A strong capital position, which is vital to continued profitability, also promotes depositor and investor confidence and provides a solid foundation for future growth. Composite ratings by the respective regulatory authorities of the Company and the Banks establish minimum capital levels. Currently, we are required to maintain minimum Tier 1 leverage ratios of at least 3%, subject to an increase up to 5%, depending on the composite rating. At December 31, 2007, our capital balances were in excess of current regulatory minimum requirements. As indicated in Table 23 below, our regulatory capital ratios far exceed the minimum required ratios, and we have been categorized as “well capitalized” in the most recent notice received from their regulators.
We remain very well capitalized. As of December 31, 2007, our Leverage (tier one) Ratio stands at 8.51%, while the Tangible Equity Ratio is 8.08% (see below in Table 23). While we remain very well capitalized, so that we maintain flexibility for future capital needs, including acquisitions, we may consider raising additional capital at some point in the future.
|
|
|
|
|
|
|
|
|
|
|
|
|
|
|
|
| |||
TABLE 23. Risk-Based Capital and Capital Ratios |
| ||||||||||||||||||
| |||||||||||||||||||
|
| 2007 |
| 2006 |
| 2005 |
| 2004 |
| 2003 |
| ||||||||
|
| ||||||||||||||||||
|
| (In thousands) |
| ||||||||||||||||
Tier 1 regulatory capital |
| $ | 498,731 |
| $ | 510,639 |
| $ | 420,283 |
| $ | 399,320 |
| $ | 378,262 |
| |||
Tier 2 regulatory capital |
|
| 47,447 |
|
| 46,583 |
|
| 46,218 |
|
| 38,161 |
|
| 34,175 |
| |||
|
| ||||||||||||||||||
Total regulatory capital |
| $ | 546,178 |
| $ | 557,222 |
| $ | 466,501 |
| $ | 437,481 |
| $ | 412,437 |
| |||
|
| ||||||||||||||||||
Risk-weighted assets |
| $ | 4,523,479 |
| $ | 4,097,400 |
| $ | 3,665,722 |
| $ | 3,222,554 |
| $ | 2,770,904 |
| |||
|
| ||||||||||||||||||
Ratios |
|
|
|
|
|
|
|
|
|
|
|
|
|
|
|
| |||
Leverage (Tier 1 capital to average assets) |
|
| 8.51 | % |
| 8.63 | % |
| 7.85 | % |
| 8.97 | % |
| 9.29 | % | |||
Tier 1 capital to risk-weighted assets |
|
| 11.03 | % |
| 12.46 | % |
| 11.47 | % |
| 12.39 | % |
| 13.65 | % | |||
Total capital to risk-weighted assets |
|
| 12.07 | % |
| 13.60 | % |
| 12.73 | % |
| 13.58 | % |
| 14.88 | % | |||
Common stockholders’ equity to total assets |
|
| 9.15 | % |
| 9.36 | % |
| 8.02 | % |
| 9.96 | % |
| 9.59 | % | |||
Tangible common equity to total assets |
|
| 8.08 | % |
| 8.24 | % |
| 6.89 | % |
| 8.58 | % |
| 8.32 | % | |||
|
| ||||||||||||||||||
In November 2007, the board of directors approved the 2007 Stock Repurchase Plan, authorizing the repurchase of 3,000,000 shares, or approximately 10% of our outstanding common stock. Subject to market conditions, repurchases will be conducted solely through a Rule 10b-1 repurchase plan. Shares repurchased under this plan will be held in
treasury and used for general corporate purposes as determined by our board of directors. We purchased 10,842 shares of common stock under this plan at an aggregate price of $421 thousand, or approximately $38.84 per share.
During 2007, we completed the July 2000 common stock buyback program, which provided for the repurchase of 3,320,000 shares or 10% of the outstanding common stock at that time. In 2007, we purchased the remaining 1,545,378 shares of common stock available to be repurchased under this plan at an aggregate price of $60.0 million, or approximately $38.84 per share.
During 2007, we purchased a total of 1,556,220 shares of common stock at an aggregate price of $60.4 million, or approximately $38.84 per share. In 2006, we purchased 33,409 shares under the 2000 plan at an aggregate price $1.7 million, or approximately $50.30 per share.
CRITICAL ACCOUNTING POLICIES AND ESTIMATES
The accounting principles we follow and the methods for applying these principles conform with accounting principles generally accepted in the United States of America and with general practices followed by the banking industry. Certain critical accounting policies affect the more significant judgments and estimates used in the preparation of the consolidated financial statements.
Allowance for Loan Losses
Our most critical accounting policy relates to our allowance for loan losses, which reflects the estimated losses resulting from the inability of our borrowers to make loan payments. If the financial condition of its borrowers were to deteriorate, resulting in an impairment of their ability to make payments, the estimates of the allowance would be updated, and additional provisions for loan losses may be required.
The allowance for loan and lease losses (ALLL) is a valuation account available to absorb losses on loans. The ALLL is established and maintained at an amount sufficient to cover the estimated credit loss associated with the loan and lease portfolios of the Banks as of the date of the determination. Credit losses arise not only from credit risk, but also from other risks inherent in the lending process including, but not limited to, collateral risk, operational risk, concentration risk, and economic risk. As such, all related risks of lending are considered when assessing the adequacy of the allowance for loan and lease losses. Quarterly, management estimates the probable level of losses to determine whether the allowance is adequate to absorb reasonably foreseeable, anticipated losses in the existing portfolio based on our past loan loss and delinquency experience, known and inherent risks in the portfolio, adverse situations that may affect the borrowers’ ability to repay, and the estimated value of any underlying collateral and current economic conditions. The analysis and methodology include three primary segments. These segments include a pool analysis of various retail loans based upon loss history, a pool analysis of commercial and commercial real estate loans based upon loss history by loan type, and a specific reserve analysis for those loans considered impaired under SFAS No. 114. All commercial and commercial real estate loans with an outstanding balance of $100,000 or greater are individually reviewed for impairment; substandard mortgage loans with balances of $100,000 or greater are also included in the analysis. All losses are charged to the allowance for loan and lease losses when the loss actually occurs or when a determination is made that a loss is likely to occur; recoveries are credited to the allowance for loan losses at the time of receipt.
Retirement Employee Benefit Plans
Retirement and employee benefit plan assets, liabilities and pension costs are determined utilizing actuarially determined present value calculations. The valuation of the benefit obligation and net periodic expense is considered critical, as it requires management and its actuaries to make estimates regarding the amount and timing of expected cash outflows including assumptions about mortality, expected service periods, rate of compensation increases and the long-term return on plan assets. Note 10 – Retirement and Employee Benefit Plans, included in the accompanying Notes to the Consolidated Financial Statements, provides further discussion on the accounting for Hancock’s retirement and employee benefit plans and the estimates used in determining the actuarial present value of the benefit obligations and the net periodic benefit expense.
Fair Value Accounting Estimates
Generally accepted accounting principles require the use of fair values in determining the carrying values of certain assets and liabilities, as well as for specific disclosures. The most significant include securities, loans held for sale, mortgage servicing rights and net assets acquired in business combinations. Certain of these assets do not have a readily available market to determine fair value and require an estimate based on specific parameters. When market prices are unavailable, we determine fair values utilizing parameters, which are constantly changing, including interest rates, duration, prepayment speeds and other specific conditions. In most cases, these specific parameters require a significant amount of judgment by management.
Income Taxes
We use the asset and liability method of accounting for income taxes. Determination of the deferred and current provision requires analysis by management of certain transactions and the related tax laws and regulations. Management exercises significant judgment in evaluating the amount and timing of recognition of the resulting tax liabilities and assets. Those judgments and estimates are re-evaluated on a continual basis as regulatory and business factors change.
RECENT ACCOUNTING PRONOUNCEMENTS
See Note 1 to our Consolidated Financial Statements included elsewhere in this report.
ITEM 7A. | QUANTITATIVE AND QUALITATIVE DISCLOSURES ABOUT MARKET RISK |
The information required for this item is included in the section entitled “Asset/Liability Management” in “Management’s Discussion and Analysis of Financial Condition and Results of Operations” that appears in Item 7 of this Form 10-K and is incorporated here by reference.
ITEM 8. | FINANCIAL STATEMENTS AND SUPPLEMENTARY DATA |
Index to Financial Statements and Financial Statement Schedule
Page | |
Management’s Report on Internal Control Over Financial Reporting | 46 |
47 | |
48 | |
Consolidated Balance Sheets as of December 31, 2007 and 2006 | 49 |
50 | |
51 | |
52 | |
54 |
MANAGEMENT’S REPORT ON INTERNAL CONTROL OVER FINANCIAL REPORTING |
The management of Hancock Holding Company has prepared the consolidated financial statements and other information in our Annual Report in accordance with accounting principles generally accepted in the United States of America and is responsible for its accuracy. The financial statements necessarily include amounts that are based on management’s best estimates and judgments.
In meeting its responsibility, management relies on internal accounting and related control systems. The internal control systems are designed to ensure that transactions are properly authorized and recorded in the Company’s financial records and to safeguard the Company’s assets from material loss or misuse. Such assurance cannot be absolute because of inherent limitations in any internal control system.
The Company’s primary segmentsmanagement is responsible for establishing and maintaining adequate internal control over financial reporting, as such term is defined in the Exchange Act Rules 13(a) – 15(f). Under the supervision and with the participation of management, including the Company’s principal executive officers and principal financial officer, the Company conducted an evaluation of the effectiveness of internal control over financial reporting based on the framework in Internal Control – Integrated Framework issued by the Committee of Sponsoring Organizations of the Treadway Commission. Management also conducted an assessment of requirements pertaining to Section 112 of the Federal Deposit Insurance Corporation Improvement Act (FDICIA). This section relates to management’s evaluation of internal control over financial reporting, including controls over the preparation of the schedules equivalent to the basic financial statements and compliance with laws and regulations. Our evaluation included a review of the documentation of controls, evaluations of the design of the internal control system and tests of the effectiveness of internal controls.
Based on the Company’s evaluation under the framework in Internal Control – Integrated Framework, management concluded that internal control over financial reporting was effective as of December 31, 2007.
Carl J. Chaney | John M. Hairston | Michael M. Achary |
Chief Executive Officer | Chief Executive Officer | Chief Financial Officer |
February 27, 2008 | February 27, 2008 | February 27, 2008 |
Report of Independent Registered Public Accounting Firm |
The Board of Directors and Stockholders
Hancock Holding Company:
We have audited Hancock Holding Company’s internal control over financial reporting as of December 31, 2007, based on criteria established in Internal Control - Integrated Framework issued by the Committee of Sponsoring Organizations of the Treadway Commission. Hancock Holding Company’s management is responsible for maintaining effective internal control over financial reporting and for its assessment of the effectiveness of internal control over financial reporting, included in the accompanying Management’s Report on Internal Control over Financial Reporting. Our responsibility is to express an opinion on Hancock Holding Company’s internal control over financial reporting based on our audit.
We conducted our audit in accordance with the standards of the Public Company Accounting Oversight Board (United States). Those standards require that we plan and perform the audit to obtain reasonable assurance about whether effective internal control over financial reporting was maintained in all material respects. Our audit included obtaining an understanding of internal control over financial reporting, assessing the risk that a material weakness exists, and testing and evaluating the design and operating effectiveness of internal control based on the assessed risk. Our audit also included performing such other procedures as we considered necessary in the circumstances. We believe that our audit provides a reasonable basis for our opinion.
A company’s internal control over financial reporting is a process designed to provide reasonable assurance regarding the reliability of financial reporting and the preparation of financial statements for external purposes in accordance with generally accepted accounting principles. Because management’s assessment and our audit were conducted to also meet the reporting requirements of Section 112 of the Federal Deposit Insurance Corporation Improvement Act (FDICIA), management’s assessment and our audit of Hancock Holding Company’s internal control over financial reporting included controls over the preparation of the schedules equivalent to the basic financial statements in accordance with the instructions to the Consolidated Financial Statements for Bank Holding Companies (Form FR Y-9 C). A company’s internal control over financial reporting includes those policies and procedures that (1) pertain to the maintenance of records that, in reasonable detail, accurately and fairly reflect the transactions and dispositions of the assets of the company; (2) provide reasonable assurance that transactions are geographically divided intorecorded as necessary to permit preparation of financial statements in accordance with generally accepted accounting principles, and that receipts and expenditures of the company are being made only in accordance with authorizations of management and directors of the company; and (3) provide reasonable assurance regarding prevention or timely detection of unauthorized acquisition, use, or disposition of the company’s assets that could have a material effect on the financial statements.
Because of its inherent limitations, internal control over financial reporting may not prevent or detect misstatements. Also, projections of any evaluation of effectiveness to future periods are subject to the risk that controls may become inadequate because of changes in conditions, or that the degree of compliance with the policies or procedures may deteriorate.
In our opinion, Hancock Holding Company maintained, in all material respects, effective internal control over financial reporting as of December 31, 2007, based on criteria established in Internal Control - Integrated Framework issued by the Committee of Sponsoring Organizations of the Treadway Commission.
We do not express an opinion or any other form of assurance on management’s statement referring to compliance with laws and regulations.
We also have audited, in accordance with the standards of the Public Company Accounting Oversight Board (United States), the consolidated balance sheets of Hancock Holding Company and subsidiaries as of December 31, 2007 and 2006, and the related consolidated statements of income, stockholders’ equity, and cash flows for each of the years in the three-year period ended December 31, 2007, and our report dated February 27, 2008 expressed an unqualified opinion on those consolidated financial statements.
/s/ KPMG LLP
Birmingham, Alabama
February 27, 2008
Report of Independent Registered Public Accounting Firm |
The Board of Directors and Stockholders
Hancock Holding Company:
We have audited the accompanying consolidated balance sheets of Hancock Holding Company and subsidiaries as of December 31, 2007 and 2006, and the related consolidated statements of income, stockholders’ equity and cash flows for each of the years in the three-year period ended December 31, 2007. These consolidated financial statements are the responsibility of the Company’s management. Our responsibility is to express an opinion on these consolidated financial statements based on our audits.
We conducted our audits in accordance with the standards of the Public Company Accounting Oversight Board (United States). Those standards require that we plan and perform the audit to obtain reasonable assurance about whether the financial statements are free of material misstatement. An audit includes examining, on a test basis, evidence supporting the amounts and disclosures in the financial statements. An audit also includes assessing the accounting principles used and significant estimates made by management, as well as evaluating the overall financial statement presentation. We believe that our audits provide a reasonable basis for our opinion.
In our opinion, the consolidated financial statements referred to above present fairly, in all material respects, the financial position of Hancock Holding Company and subsidiaries as of December 31, 2007 and 2006, and the results of their operations and their cash flows for each of the years in the three-year period ended December 31, 2007 in conformity with U.S. generally accepted accounting principles.
We also have audited, in accordance with the standards of the Public Company Accounting Oversight Board (United States), Hancock Holding Company’s internal control over financial reporting as of December 31, 2007, based on criteria established in Internal Control - Integrated Framework issued by the Committee of Sponsoring Organizations of the Treadway Commission (COSO), and our report dated February 27, 2008 expressed an unqualified opinion on the effectiveness of the Company’s internal control over financial reporting.
As discussed in Note 1 to the consolidated financial statements, the Company changed its method of accounting for share based payments and evaluating prior year misstatements effective January 1, 2006 and, effective December 31, 2006, its method of accounting for defined benefit pension postretirement benefit plans.
/s/ KPMG LLP
Birmingham, Alabama
February 27, 2008
Hancock Holding Company and Subsidiaries
Consolidated Balance Sheets
|
|
|
|
|
|
|
|
|
|
|
|
|
| December 31, |
| ||||||||
|
|
| |||||||||
|
| 2007 |
| 2006 |
| ||||||
|
|
|
| ||||||||
|
| (In thousands, except share data) |
| ||||||||
Assets: |
|
|
|
|
|
|
| ||||
Cash and due from banks (non-interest bearing) |
|
| $ | 182,615 |
|
|
| $ | 190,114 |
|
|
Interest-bearing time deposits with other banks |
|
|
| 8,560 |
|
|
|
| 10,197 |
|
|
Federal funds sold |
|
|
| 117,721 |
|
|
|
| 212,242 |
|
|
Trading securities |
|
|
| 197,425 |
|
|
|
| — |
|
|
Securities available for sale, at fair value (amortized cost of $1,479,963 and $1,916,845) |
|
|
| 1,480,196 |
|
|
|
| 1,903,658 |
|
|
Loans held for sale |
|
|
| 18,957 |
|
|
|
| 16,946 |
|
|
Loans |
|
|
| 3,612,883 |
|
|
|
| 3,267,058 |
|
|
Less: Allowance for loan losses |
|
|
| (47,123 | ) |
|
|
| (46,772 | ) |
|
Unearned income |
|
|
| (16,326 | ) |
|
|
| (17,420 | ) |
|
|
|
|
|
|
|
|
| ||||
Loans, net |
|
|
| 3,549,434 |
|
|
|
| 3,202,866 |
|
|
Property and equipment, net of accumulated depreciation of $87,160 and $85,397 |
|
|
| 200,566 |
|
|
|
| 143,462 |
|
|
Other real estate, net |
|
|
| 2,172 |
|
|
|
| 568 |
|
|
Accrued interest receivable |
|
|
| 35,117 |
|
|
|
| 33,700 |
|
|
Goodwill, net |
|
|
| 62,277 |
|
|
|
| 62,277 |
|
|
Other intangible assets, net |
|
|
| 8,298 |
|
|
|
| 10,355 |
|
|
Life insurance contracts |
|
|
| 139,421 |
|
|
|
| 110,751 |
|
|
Reinsurance receivables |
|
|
| 34,827 |
|
|
|
| 38,042 |
|
|
Deferred tax asset, net |
|
|
| 3,976 |
|
|
|
| 16,544 |
|
|
Other assets |
|
|
| 14,417 |
|
|
|
| 12,843 |
|
|
|
|
|
|
|
|
|
| ||||
Total assets |
|
| $ | 6,055,979 |
|
|
| $ | 5,964,565 |
|
|
|
|
|
|
|
|
|
| ||||
|
|
|
|
|
|
|
|
|
|
|
|
Liabilities and Stockholders’ Equity: |
|
|
|
|
|
|
|
|
|
|
|
Deposits: |
|
|
|
|
|
|
|
|
|
|
|
Non-interest bearing demand |
|
| $ | 907,874 |
|
|
| $ | 1,057,358 |
|
|
Interest-bearing savings, NOW, money market and time |
|
|
| 4,101,660 |
|
|
|
| 3,973,633 |
|
|
|
|
|
|
|
|
|
| ||||
Total deposits |
|
|
| 5,009,534 |
|
|
|
| 5,030,991 |
|
|
Federal funds purchased |
|
|
| 4,100 |
|
|
|
| 3,800 |
|
|
Securities sold under agreements to repurchase |
|
|
| 371,604 |
|
|
|
| 218,591 |
|
|
Long-term notes |
|
|
| 793 |
|
|
|
| 258 |
|
|
Policy reserves and liabilities |
|
|
| 58,489 |
|
|
|
| 93,669 |
|
|
Other liabilities |
|
|
| 57,272 |
|
|
|
| 58,846 |
|
|
|
|
|
|
|
|
|
| ||||
Total liabilities |
|
|
| 5,501,792 |
|
|
|
| 5,406,155 |
|
|
|
|
|
|
|
|
|
|
|
|
|
|
Stockholders’ Equity |
|
|
|
|
|
|
|
|
|
|
|
Common stock-$3.33 par value per share; 350,000,000 shares authorized, 31,294,607 and 32,666,052 issued and outstanding, respectively |
|
|
| 104,211 |
|
|
|
| 108,778 |
|
|
Capital surplus |
|
|
| 87,122 |
|
|
|
| 139,099 |
|
|
Retained earnings |
|
|
| 377,481 |
|
|
|
| 334,546 |
|
|
Accumulated other comprehensive loss, net |
|
|
| (14,627 | ) |
|
|
| (24,013 | ) |
|
|
|
|
|
|
|
|
| ||||
Total stockholders’ equity |
|
|
| 554,187 |
|
|
|
| 558,410 |
|
|
|
|
|
|
|
|
|
| ||||
|
|
|
|
|
|
|
|
|
|
|
|
Total liabilities and stockholders’ equity |
|
| $ | 6,055,979 |
|
|
| $ | 5,964,565 |
|
|
|
|
|
|
|
|
|
| ||||
See accompanying notes to consolidated financial statements.
Hancock Holding Company and Subsidiaries
Consolidated Statements of Income
|
|
|
|
|
|
|
|
|
|
|
|
| Years Ended December 31, |
| |||||||
|
|
| ||||||||
|
| 2007 |
| 2006 |
| 2005 |
| |||
|
|
|
|
| ||||||
|
| (In thousands, except per share data) |
| |||||||
Interest income: |
|
|
|
|
|
|
|
|
|
|
Loans, including fees |
| $ | 255,761 |
| $ | 230,450 |
| $ | 197,857 |
|
Securities-taxable |
|
| 78,256 |
|
| 93,525 |
|
| 51,360 |
|
Securities-tax exempt |
|
| 6,234 |
|
| 6,770 |
|
| 7,034 |
|
Federal funds sold |
|
| 5,458 |
|
| 9,657 |
|
| 4,447 |
|
Other investments |
|
| 156 |
|
| 3,928 |
|
| 2,933 |
|
|
|
|
|
| ||||||
Total interest income |
|
| 345,865 |
|
| 344,330 |
|
| 263,631 |
|
|
|
|
|
| ||||||
Interest expense: |
|
|
|
|
|
|
|
|
|
|
Deposits |
|
| 132,920 |
|
| 110,092 |
|
| 67,581 |
|
Federal funds purchased and securities sold under agreements to repurchase |
|
| 8,231 |
|
| 9,682 |
|
| 4,687 |
|
Long-term notes and other interest expense |
|
| 80 |
|
| 895 |
|
| 2,551 |
|
Capitalized interest |
|
| (995 | ) |
| (806 | ) |
| — |
|
|
|
|
|
| ||||||
Total interest expense |
|
| 140,236 |
|
| 119,863 |
|
| 74,819 |
|
|
|
|
|
| ||||||
Net interest income |
|
| 205,629 |
|
| 224,467 |
|
| 188,812 |
|
Provision for (reversal of) loan losses |
|
| 7,593 |
|
| (20,762 | ) |
| 42,635 |
|
|
|
|
|
| ||||||
Net interest income after provision for (reversal of) loan losses |
|
| 198,036 |
|
| 245,229 |
|
| 146,177 |
|
|
|
|
|
| ||||||
Noninterest income: |
|
|
|
|
|
|
|
|
|
|
Service charges on deposit accounts |
|
| 41,929 |
|
| 36,228 |
|
| 34,773 |
|
Trust fees |
|
| 15,902 |
|
| 13,286 |
|
| 11,107 |
|
Insurance commissions and fees |
|
| 19,219 |
|
| 19,246 |
|
| 17,099 |
|
Investment and annuity fees |
|
| 8,746 |
|
| 5,970 |
|
| 5,076 |
|
Debit card and merchant fees |
|
| 8,065 |
|
| 7,298 |
|
| 4,878 |
|
ATM fees |
|
| 5,656 |
|
| 5,005 |
|
| 4,202 |
|
Secondary mortgage market operations |
|
| 3,723 |
|
| 3,528 |
|
| 2,221 |
|
Securities gains (losses), net |
|
| 308 |
|
| (5,169 | ) |
| (53 | ) |
Net storm-related gain |
|
| — |
|
| 5,084 |
|
| 6,584 |
|
Other income |
|
| 14,581 |
|
| 13,357 |
|
| 12,382 |
|
|
|
|
|
| ||||||
Total noninterest income |
|
| 118,129 |
|
| 103,833 |
|
| 98,269 |
|
|
|
|
|
| ||||||
Noninterest expense: |
|
|
|
|
|
|
|
|
|
|
Salaries and employee benefits |
|
| 106,959 |
|
| 103,753 |
|
| 94,158 |
|
Net occupancy expense |
|
| 19,435 |
|
| 13,350 |
|
| 10,926 |
|
Equipment rentals, depreciation and maintenance |
|
| 10,465 |
|
| 10,796 |
|
| 9,553 |
|
Amortization of intangibles |
|
| 1,651 |
|
| 2,125 |
|
| 2,194 |
|
Other expense |
|
| 75,844 |
|
| 70,692 |
|
| 54,712 |
|
|
|
|
|
| ||||||
Total noninterest expense |
|
| 214,354 |
|
| 200,716 |
|
| 171,543 |
|
|
|
|
|
| ||||||
Income before income taxes |
|
| 101,811 |
|
| 148,346 |
|
| 72,903 |
|
Income taxes |
|
| 27,919 |
|
| 46,544 |
|
| 18,871 |
|
|
|
|
|
| ||||||
Net income |
| $ | 73,892 |
| $ | 101,802 |
| $ | 54,032 |
|
|
|
|
|
| ||||||
Basic earnings per common share |
| $ | 2.31 |
| $ | 3.13 |
| $ | 1.67 |
|
|
|
|
|
| ||||||
Diluted earnings per common share |
| $ | 2.27 |
| $ | 3.06 |
| $ | 1.64 |
|
|
|
|
|
| ||||||
See accompanying notes to consolidated financial statements.
Hancock Holding Company and Subsidiaries
Consolidated Statements of Stockholders’ Equity
|
|
|
|
|
|
|
|
|
|
|
|
|
|
|
|
|
|
|
|
|
|
|
|
|
|
|
|
|
|
|
|
|
|
|
|
| Accumulated |
|
|
|
|
| |||||||||||
|
|
|
|
|
|
|
|
|
| Other |
|
|
|
|
| |||||||||||
|
| Common Stock |
| Capital |
| Retained |
| Comprehensive |
| Unearned |
|
|
| |||||||||||||
|
| Shares |
| Amount |
| Surplus |
| Earnings |
| Loss, net |
| Compensation |
| Total |
| |||||||||||
|
|
|
|
|
|
|
|
| ||||||||||||||||||
|
| (In thousands, except share and per share data) |
| |||||||||||||||||||||||
| ||||||||||||||||||||||||||
Balance, January 1, 2005 |
|
| 32,439,702 |
| $ | 108,024 |
| $ | 134,905 |
| $ | 234,423 |
|
| $ | (11,121 | ) |
|
| $ | (1,649 | ) |
| $ | 464,582 |
|
Comprehensive income: |
|
|
|
|
|
|
|
|
|
|
|
|
|
|
|
|
|
|
|
|
|
|
|
|
|
|
Net income per consolidated statements of income |
|
| — |
|
| — |
|
| — | �� |
| 54,032 |
|
|
| — |
|
|
|
| — |
|
|
| 54,032 |
|
Net change in fair value of securities available for sale, net of tax |
|
| — |
|
| — |
|
| — |
|
| — |
|
|
| (10,983 | ) |
|
|
| — |
|
|
| (10,983 | ) |
Net change in unfunded accumulated benefit obligation, net of tax |
|
| — |
|
| — |
|
| — |
|
| — |
|
|
| 38 |
|
|
|
| — |
|
|
| 38 |
|
|
|
|
|
|
|
|
|
|
|
|
|
|
|
|
|
|
|
|
|
|
|
|
|
| ||
Comprehensive income |
|
|
|
|
|
|
|
|
|
|
|
|
|
|
|
|
|
|
|
|
|
|
|
| 43,087 |
|
Cash dividends paid ($0.72 per share) |
|
| — |
|
| — |
|
| — |
|
| (23,416 | ) |
|
| — |
|
|
|
| — |
|
|
| (23,416 | ) |
Common stock issued, long - term incentive plan |
|
| 142,684 |
|
| 475 |
|
| 2,288 |
|
| — |
|
|
| — |
|
|
|
| (1,425 | ) |
|
| 1,338 |
|
Compensation expense, long - term incentive plan |
|
| — |
|
| — |
|
| — |
|
| — |
|
|
| — |
|
|
|
| 731 |
|
|
| 731 |
|
Repurchase and retirement of common stock |
|
| (295,849 | ) |
| (985 | ) |
| (8,564 | ) |
| — |
|
|
| — |
|
|
|
| — |
|
|
| (9,549 | ) |
Other stock transactions |
|
| 14,586 |
|
| 49 |
|
| 593 |
|
| — |
|
|
| — |
|
|
|
| — |
|
|
| 642 |
|
|
|
|
|
|
|
|
|
|
|
|
|
| ||||||||||||||
Balance, December 31, 2005 |
|
| 32,301,123 |
|
| 107,563 |
|
| 129,222 |
|
| 265,039 |
|
|
| (22,066 | ) |
|
|
| (2,343 | ) |
|
| 477,415 |
|
SAB No.108 adjustments, net of tax |
|
| — |
|
| — |
|
| — |
|
| (2,984 | ) |
|
| — |
|
|
|
| — |
|
|
| (2,984 | ) |
|
|
|
|
|
|
|
|
|
|
|
|
| ||||||||||||||
Balance, December 31, 2005, as adjusted |
|
| 32,301,123 |
|
| 107,563 |
|
| 129,222 |
|
| 262,055 |
|
|
| (22,066 | ) |
|
|
| (2,343 | ) |
|
| 474,431 |
|
Comprehensive income: |
|
|
|
|
|
|
|
|
|
|
|
|
|
|
|
|
|
|
|
|
|
|
|
|
|
|
Net income per consolidated statements of income |
|
| — |
|
| — |
|
| — |
|
| 101,802 |
|
|
| — |
|
|
|
| — |
|
|
| 101,802 |
|
Net change in fair value of securities available for sale, net of tax |
|
| — |
|
| — |
|
| — |
|
| — |
|
|
| 4,940 |
|
|
|
| — |
|
|
| 4,940 |
|
Net change in unfunded accumulated benefit obligation, net of tax |
|
| — |
|
| — |
|
| — |
|
| — |
|
|
| 1,057 |
|
|
|
| — |
|
|
| 1,057 |
|
|
|
|
|
|
|
|
|
|
|
|
|
|
|
|
|
|
|
|
|
|
|
|
|
| ||
Comprehensive income |
|
|
|
|
|
|
|
|
|
|
|
|
|
|
|
|
|
|
|
|
|
|
|
| 107,799 |
|
Adoption of SFAS No. 158, net of tax |
|
| — |
|
| — |
|
| — |
|
| — |
|
|
| (7,944 | ) |
|
|
| — |
|
|
| (7,944 | ) |
Cash dividends paid ($0.895 per share) |
|
| — |
|
| — |
|
| — |
|
| (29,311 | ) |
|
| — |
|
|
|
| — |
|
|
| (29,311 | ) |
Common stock issued, long - term incentive plan, including excess income tax benefit of $3,493 |
|
| 398,338 |
|
| 1,326 |
|
| 10,169 |
|
| — |
|
|
| — |
|
|
|
| — |
|
|
| 11,495 |
|
Compensation expense, long - term incentive plan |
|
| — |
|
| — |
|
| 3,690 |
|
| — |
|
|
| — |
|
|
|
| — |
|
|
| 3,690 |
|
SFAS No. 123(R) reclass of unearned compensation |
|
| — |
|
| — |
|
| (2,343 | ) |
| — |
|
|
| — |
|
|
|
| 2,343 |
|
|
| — |
|
Repurchase and retirement of common stock |
|
| (33,409 | ) |
| (111 | ) |
| (1,639 | ) |
| — |
|
|
| — |
|
|
|
| — |
|
|
| (1,750 | ) |
|
|
|
|
|
|
|
|
|
|
|
|
| ||||||||||||||
Balance, December 31, 2006 |
|
| 32,666,052 |
|
| 108,778 |
|
| 139,099 |
|
| 334,546 |
|
|
| (24,013 | ) |
|
|
| — |
|
|
| 558,410 |
|
Comprehensive income: |
|
|
|
|
|
|
|
|
|
|
|
|
|
|
|
|
|
|
|
|
|
|
|
|
|
|
Net income per consolidated statements of income |
|
| — |
|
| — |
|
| — |
|
| 73,892 |
|
|
| — |
|
|
|
| — |
|
|
| 73,892 |
|
Net change in fair value of securities available for sale, net of tax |
|
| — |
|
| ��� |
|
| — |
|
| — |
|
|
| 8,846 |
|
|
|
| — |
|
|
| 8,846 |
|
Net change in unfunded accumulated benefit obligation, net of tax |
|
| — |
|
| — |
|
| — |
|
| — |
|
|
| 540 |
|
|
|
| — |
|
|
| 540 |
|
|
|
|
|
|
|
|
|
|
|
|
|
|
|
|
|
|
|
|
|
|
|
|
|
| ||
Comprehensive income |
|
|
|
|
|
|
|
|
|
|
|
|
|
|
|
|
|
|
|
|
|
|
|
| 83,278 |
|
Cash dividends paid ($0.960 per share) |
|
| — |
|
| — |
|
| — |
|
| (30,957 | ) |
|
| — |
|
|
|
| — |
|
|
| (30,957 | ) |
Common stock issued, long - term incentive plan, including excess income tax benefit of $345 |
|
| 184,775 |
|
| 615 |
|
| 2,134 |
|
| — |
|
|
| — |
|
|
|
|
|
|
|
| 2,749 |
|
Compensation expense, long - term incentive plan |
|
| — |
|
| — |
|
| 1,155 |
|
| — |
|
|
| — |
|
|
|
| — |
|
|
| 1,155 |
|
Repurchase and retirement of common stock |
|
| (1,556,220 | ) |
| (5,182 | ) |
| (55,266 | ) |
| — |
|
|
| — |
|
|
|
| — |
|
|
| (60,448 | ) |
|
|
|
|
|
|
|
|
|
|
|
|
| ||||||||||||||
Balance, December 31, 2007 |
|
| 31,294,607 |
| $ | 104,211 |
| $ | 87,122 |
| $ | 377,481 |
|
| $ | (14,627 | ) |
|
| $ | — |
|
| $ | 554,187 |
|
|
|
|
|
|
|
|
|
|
|
|
|
| ||||||||||||||
See accompanying notes to consolidated financial statements.
Hancock Holding Company and Subsidiaries
Consolidated Statements of Cash Flows
|
|
|
|
|
|
|
|
|
|
|
|
| Years Ended December 31, |
| |||||||
|
|
| ||||||||
|
| 2007 |
| 2006 |
| 2005 |
| |||
|
|
|
|
| ||||||
|
| (In thousands) |
| |||||||
Operating Activities: |
|
|
|
|
|
|
|
|
|
|
Net income |
| $ | 73,892 |
| $ | 101,802 |
| $ | 54,032 |
|
Adjustments to reconcile net income to net cash provided by operating activities: |
|
|
|
|
|
|
|
|
|
|
Depreciation and amortization |
|
| 14,041 |
|
| 10,443 |
|
| 8,717 |
|
Provision for (reversal of) loan losses, net |
|
| 7,593 |
|
| (20,762 | ) |
| 42,635 |
|
(Gains) losses on other real estate owned, net |
|
| (732 | ) |
| 79 |
|
| (444 | ) |
Deferred tax expense (benefit) |
|
| 7,560 |
|
| 24,599 |
|
| (18,401 | ) |
Increase in cash surrender value of life insurance contracts |
|
| (5,397 | ) |
| (4,090 | ) |
| (3,450 | ) |
(Gain) loss on sales/paydowns of securities available for sale, net |
|
| (273 | ) |
| 5,169 |
|
| 53 |
|
Loss on disposal of other assets |
|
| 193 |
|
| — |
|
| — |
|
Gain on involuntary conversion of assets, net |
|
| — |
|
| (5,084 | ) |
| (14,135 | ) |
Gain on sale of loans held for sale |
|
| (583 | ) |
| (564 | ) |
| (417 | ) |
Loss on trading securities |
|
| 114 |
|
| — |
|
| — |
|
Purchase of trading securities, net |
|
| (10 | ) |
| — |
|
| — |
|
Accretion of securities premium/discount, net |
|
| (1,773 | ) |
| (11,300 | ) |
| (1,847 | ) |
Amortization of mortgage servicing rights |
|
| 345 |
|
| 549 |
|
| 818 |
|
Amortization of intangible assets |
|
| 1,651 |
|
| 2,125 |
|
| 2,194 |
|
Stock-based compensation expense |
|
| 1,155 |
|
| 3,690 |
|
| 1,289 |
|
(Increase) decrease in accrued interest receivable |
|
| (1,417 | ) |
| 1,346 |
|
| (11,263 | ) |
(Decrease) increase in accrued expenses |
|
| (12,197 | ) |
| (30,133 | ) |
| 28,349 |
|
Increase in other liabilities |
|
| 4,430 |
|
| 2,636 |
|
| 1,625 |
|
Increase in interest payable |
|
| 883 |
|
| 2,341 |
|
| 521 |
|
Decrease in policy reserves and liabilities |
|
| (35,180 | ) |
| (11,699 | ) |
| (5,739 | ) |
Decrease in reinsurance receivables |
|
| 3,215 |
|
| 11,410 |
|
| 9,738 |
|
Increase in other assets |
|
| (1,574 | ) |
| (1,917 | ) |
| (26,154 | ) |
Proceeds from sale of loans held for sale |
|
| 251,684 |
|
| 238,045 |
|
| 203,239 |
|
Originations of loans held for sale |
|
| (253,112 | ) |
| (230,208 | ) |
| (209,557 | ) |
Excess tax benefit from share based payments |
|
| (345 | ) |
| (3,493 | ) |
| — |
|
Other, net |
|
| 60 |
|
| (2,790 | ) |
| 2,516 |
|
|
|
|
|
| ||||||
Net cash provided by operating activities |
|
| 54,223 |
|
| 82,194 |
|
| 64,319 |
|
|
|
|
|
| ||||||
See accompanying notes to consolidated financial statements.
Hancock Holding Company and Subsidiaries
Consolidated Statements of Cash Flows (continued)
|
|
|
|
|
|
|
|
|
|
|
|
| Years Ended December 31, |
| |||||||
|
|
| ||||||||
|
| 2007 |
| 2006 |
| 2005 |
| |||
|
|
|
|
| ||||||
|
| (In thousands) |
| |||||||
Investing Activities: |
|
|
|
|
|
|
|
|
|
|
Net (increase) decrease in interest-bearing time deposits |
| $ | 1,637 |
| $ | (2,939 | ) | $ | 868 |
|
Proceeds from maturities, calls or prepayments of securities held to maturity |
|
| — |
|
| — |
|
| 195,599 |
|
Purchase of securities held to maturity |
|
| — |
|
| — |
|
| (7,736 | ) |
Proceeds from sales of securities available for sale |
|
| 9,222 |
|
| 157,300 |
|
| 133,800 |
|
Proceeds from maturities of securities available for sale |
|
| 1,272,142 |
|
| 1,086,070 |
|
| 378,105 |
|
Purchases of securities available for sale |
|
| (1,038,175 | ) |
| (1,169,592 | ) |
| (1,354,864 | ) |
Net decrease (increase) in federal funds sold |
|
| 94,521 |
|
| 190,726 |
|
| (260,833 | ) |
Net increase in loans |
|
| (356,787 | ) |
| (293,117 | ) |
| (248,056 | ) |
Purchases of property and equipment |
|
| (70,267 | ) |
| (76,943 | ) |
| (15,486 | ) |
Proceeds from sales of property and equipment |
|
| 497 |
|
| 4,097 |
|
| 591 |
|
Premiums paid on life insurance contracts |
|
| (20,000 | ) |
| (20,000 | ) |
| — |
|
Proceeds from sales of other real estate |
|
| 1,753 |
|
| 1,749 |
|
| 4,338 |
|
Proceeds from insurance settlements |
|
| — |
|
| 22,469 |
|
| 12,562 |
|
Purchase of interest in unconsolidated joint venture |
|
| — |
|
| (4,710 | ) |
| — |
|
Net cash paid in business combinations |
|
| — |
|
| — |
|
| (3,922 | ) |
|
|
|
|
| ||||||
Net cash used in investing activities |
|
| (105,457 | ) |
| (104,890 | ) |
| (1,165,034 | ) |
|
|
|
|
| ||||||
|
|
|
|
|
|
|
|
|
|
|
Financing Activities: |
|
|
|
|
|
|
|
|
|
|
Net (decrease) increase in deposits |
|
| (21,457 | ) |
| 41,171 |
|
| 1,191,875 |
|
Net increase (decrease) in federal funds purchased and securities sold under agreements to repurchase |
|
| 153,313 |
|
| (29,891 | ) |
| 56,004 |
|
(Proceeds) repayments of long-term notes |
|
| 535 |
|
| (50,008 | ) |
| (7 | ) |
Dividends paid |
|
| (30,957 | ) |
| (29,311 | ) |
| (23,416 | ) |
Proceeds from exercise of stock options |
|
| 2,404 |
|
| 8,002 |
|
| 1,115 |
|
Repurchase/retirement of common stock |
|
| (60,448 | ) |
| (1,750 | ) |
| (9,549 | ) |
Excess tax benefit from stock option exercises |
|
| 345 |
|
| 3,493 |
|
| — |
|
|
|
|
|
| ||||||
Net cash provided by (used in) financing activities |
|
| 43,735 |
|
| (58,294 | ) |
| 1,216,022 |
|
|
|
|
|
| ||||||
(Decrease) increase in cash and cash equivalents |
|
| (7,499 | ) |
| (80,990 | ) |
| 115,307 |
|
Cash and cash equivalents at beginning of year |
|
| 190,114 |
|
| 271,104 |
|
| 155,797 |
|
|
|
|
|
| ||||||
Cash and cash equivalents at end of year |
| $ | 182,615 |
| $ | 190,114 |
| $ | 271,104 |
|
|
|
|
|
| ||||||
|
|
|
|
|
|
|
|
|
|
|
Supplemental Information |
|
|
|
|
|
|
|
|
|
|
|
|
|
|
|
|
|
|
|
|
|
Income taxes paid |
| $ | 29,209 |
| $ | 55,503 |
| $ | 12,500 |
|
|
|
|
|
|
|
|
|
|
|
|
Interest paid, including capitalized interest of $995 and $806, respectively |
|
| 139,353 |
|
| 112,447 |
|
| 74,300 |
|
|
|
|
|
|
|
|
|
|
|
|
Supplemental Information for Non-Cash |
|
|
|
|
|
|
|
|
|
|
Investing and Financing Activities |
|
|
|
|
|
|
|
|
|
|
Transfers from loans to other real estate |
| $ | 2,694 |
| $ | 1,304 |
| $ | 2,703 |
|
Financed sale of foreclosed property |
|
| 339 |
|
| 741 |
|
| 1,300 |
|
Restricted stock issued to employees of Hancock |
|
| 2,495 |
|
| 2,518 |
|
| 1,490 |
|
See accompanying notes to consolidated financial statements.
HANCOCK HOLDING COMPANY AND SUBSIDIARIES
NOTES TO CONSOLIDATED FINANCIAL STATEMENTS
Note 1. Summary of Significant Accounting Policies | |
Description of Business
Hancock Holding Company “the Company” or “Hancock” is a financial holding company headquartered in Gulfport, Mississippi (MS),operating in the states of Mississippi, Louisiana, (LA)Alabama and Florida. Hancock Holding Company, the Parent Company operates through four wholly-owned bank subsidiaries, Hancock Bank, Gulfport, Mississippi, Hancock Bank of Louisiana, Baton Rouge, Louisiana, Hancock Bank of Florida, (FL) markets. Each segment offers the same productsTallahassee, Florida and services but is managed separately due to different pricing, product demand,Hancock Bank of Alabama, Mobile, Alabama “the Banks.” The Banks are community oriented and consumer markets. Each segment offersfocus primarily on offering commercial, consumer and mortgage loans and deposit services. Inservices to individuals and small to middle market businesses in their respective market areas. The Company’s operating strategy is to provide its customers with the following tables,financial sophistication and breadth of products of a regional bank, while successfully retaining the column “Other” includes additionallocal appeal and level of service of a community bank.
Consolidation
The consolidated subsidiariesfinancial statements include the accounts of the Company: Hancock Mortgage Corporation, Hancock Investment Services, Inc., Hancock Insurance Agency, Inc., Harrison Finance Company, Magna Insurance Company and three real estate corporations owning landall other entities in which the Company has a controlling interest. Significant inter-company transactions and buildingsbalances have been eliminated in consolidation.
Use of Estimates
The consolidated financial statements have been prepared in conformity with U.S. generally accepted accounting principles. The preparation of financial statements in conformity with accounting principles generally accepted in the United States requires management to make estimates and assumptions that house bank branches and other facilities. Following is selected information foraffect the Company’s segments:
Year ended(amountsin thousands)December 31, 2005 MS LA FL Other Eliminations Consolidated ------------ ------------ ------------ --------------- --------------- --------------- Interest income $ 140,583 $ 109,248 $ 6,563 $ 13,136 $ (5,899) $ 263,631 Interest expense 45,392 33,184 1,796 - (5,553) 74,819 ------------ ------------ ------------ --------------- --------------- --------------- Net interest income 95,191 76,064 4,767 13,136 (346) 188,812 Provisionreported. On an ongoing basis, the Company evaluates its estimates, including those related to the allowance for loan losses,24,744 14,836 493 2,562 - 42,635 Non-interestintangible assets and goodwill, income46,197 28,061 476 23,670 (135) 98,269taxes, pension and postretirement benefit plans and contingent liabilities. The Company bases its estimates on historical experience and on various other assumptions that are believed to be reasonable under the circumstances, the results of which form the basis for making judgments about the carrying values of assets and liabilities not readily apparent from other sources. Actual results could differ significantly from those estimates.Reclassifications
Certain reclassifications have been made to prior periods to conform to the current year presentation.
Securities
Securities have been classified into one of two categories: available for sale or trading. Management determines the appropriate classification of debt securities at the time of purchase and re-evaluates this classification periodically.
Available for sale securities are stated at fair value with unrealized gains and losses, net of income taxes, reported as a separate component of stockholders’ equity until realized. Trading securities are stated at fair value with unrealized gains and losses reported in results of operations.
The amortized cost of debt securities classified as available for sale is adjusted for amortization of premiums and accretion of discounts to maturity or, in the case of mortgage-backed securities, over the estimated life of the security using the constant-yield method. The prepayment speed chosen to determine the estimated life of a mortgage-backed security is the security’s historical 3-month prepayment speed. When prepayment speeds are faster than expected, the average life of the mortgage-backed security is shorter than the original estimate. Amortization, accretion and accrued interest are included in interest income on securities. Realized gains and losses, and declines in value judged to be other than temporary, are included in net securities gains and losses. Gains and losses on the sales of securities available for sale are determined using the specific-identification method. Using this basis results in the most accurate reporting of gains and losses realized on these sales, as well as the appropriate adjustment to accumulated other
HANCOCK HOLDING COMPANY AND SUBSIDIARIES
NOTES TO CONSOLIDATED FINANCIAL STATEMENTS
Note 1. Summary of Significant Accounting Policies (continued)
comprehensive income. A decline in the fair value of securities below cost that is deemed to be other than temporary results in a charge to earnings and the establishment of a new cost basis for the security. Gains and losses on the sales of trading securities are also determined using the specific-identification method with the gain or loss reported in the results of operations.
Loans
Non-refundable loan origination fees and certain direct origination costs are recognized as an adjustment to the yield on the related loan. Interest on loans is recorded to income as earned. Where doubt exists as to collectibility of a loan, the accrual of interest is discontinued, all unpaid accrued interest is reversed and payments subsequently received are applied first to principal. Interest income is recorded after principal has been satisfied and as payments are received.
Generally, loans of all types which become 90 days delinquent are reviewed relative to collectibility. Unless such loans are in the process of terms revision to bring to a current status, collection through repossession or foreclosure, those loans deemed uncollectible are charged off against the allowance account. As a matter of policy, loans are placed on a non-accrual status when doubt exists as to collectibility.
Loans held for sale are stated at fair value on the consolidated balance sheets with changes in value reported in the statements of income.
Allowance for Loan Losses
The allowance for loan and lease losses “ALLL” is a valuation account available to absorb losses on loans. The ALLL is established and maintained at an amount sufficient to cover the estimated credit loss associated with the loan and lease portfolios of the Company as of the date of the determination. Credit losses arise not only from credit risk, but also from other risks inherent in the lending process including, but not limited to, collateral risk, operational risk, concentration risk, and economic risk. As such, all related risks of lending are considered when assessing the adequacy of the allowance for loan and lease losses. Quarterly, management estimates the probable level of losses to determine whether the allowance is adequate to absorb reasonably foreseeable, anticipated losses in the existing portfolio based on the Company’s past loan loss and delinquency experience, known and inherent risks in the portfolio, adverse situations that may affect the borrowers’ ability to repay, and the estimated value of any underlying collateral and current economic conditions. The analysis and methodology include three primary segments. These segments include a pool analysis of various retail loans based upon loss history, a pool analysis of commercial and commercial real estate loans based upon loss history by loan type, and a specific reserve analysis for those loans considered impaired under Statement of Financial Accounting Standards (SFAS) No. 114, Accounting by Creditors for Impairment of a Loan. All commercial and commercial real estate loans with an outstanding balance of $100,000 or greater are individually reviewed for impairment; substandard mortgage loans with balances of $100,000 or greater are also included in the analysis. All losses are charged to the allowance for loan and lease losses when the loss actually occurs or when a determination is made that a loss is likely to occur; recoveries are credited to the allowance for loan losses at the time of receipt.
The Company considers a loan to be impaired when, based upon current information and events, it believes it is probable that the Company will be unable to collect all amounts due according to the contractual terms of the loan agreement. The Company’s impaired loans include troubled debt restructurings, and performing and non-performing major loans for which full payment of principal or interest is not expected. Categories of non-major homogeneous loans, which are evaluated on an overall basis, generally include all loans under $500,000. The Company calculates an allowance required for impaired loans based on the present value of expected future cash flows discounted at the loan’s effective interest rate, the loan’s observable market price or the fair value of its collateral. If the recorded investment in the impaired loan exceeds the measure of fair value, a valuation allowance is required as a component of the allowance for loan losses.
HANCOCK HOLDING COMPANY AND SUBSIDIARIES
NOTES TO CONSOLIDATED FINANCIAL STATEMENTSNote 1. Summary of Significant Accounting Policies (continued)
Property and Equipment
Property and equipment are recorded at cost, less accumulated depreciation and amortization. Depreciation is charged to expense over the estimated useful lives of the assets, which are up to 39 years for buildings and three to seven years for furniture and equipment. Leasehold improvements are amortized over the terms of the respective leases or the estimated useful lives of the improvements, whichever is shorter. In cases where Hancock has the right to renew the lease for additional periods, the lease term for the purpose of calculating amortization of the capitalized cost of the leasehold improvements is extended when Hancock is “reasonably assured” that it will renew the lease. Depreciation and amortization
5,299 2,467 454 497 - 8,717expenses are computed using a straight-line basis for assets set up after January 1, 2006 and the double declining balance basis for assets set up prior to January 1, 2006. Hancock continually evaluates whether events and circumstances have occurred that indicate that such long-lived assets have been impaired. Measurement of any impairment of such long-lived assets is based on those assets’ fair values. There were no impairment losses on property and equipment recorded during 2007, 2006, or 2005.Other
non-interest expense 73,725 56,065 4,349 28,820 (133) 162,826 ------------ ------------ ------------ --------------- --------------- --------------- Earnings before income taxes 37,620 30,757 (53) 4,927 (348) 72,903 Income tax expense 16,673 (191) 170 2,260 (41) 18,871 ------------ ------------ ------------ --------------- --------------- --------------- Net earnings $ 20,947 $ 30,948 $ (223) $ 2,667 $ (307) $ 54,032 ============ ============ ============ =============== =============== =============== Year ended(amountsReal EstateOther real estate owned includes assets that have been acquired in
thousands)December 31, 2004 MS LA FLsatisfaction of debt through foreclosure. OtherEliminations Consolidated ------------ ------------ ------------ --------------- --------------- --------------- Interest income $ 120,197 $ 91,148 $ 3,089 $ 14,673 $ (2,333) $ 226,774 Interest expense 37,953 20,385 922 65 (2,055) 57,270 ------------ ------------ ------------ --------------- --------------- --------------- Net interest income 82,244 70,763 2,167 14,608 (278) 169,504 Provisionreal estate owned is reported in other assets and is recorded at the lower of cost or estimated fair value less the estimated cost of disposition. Valuation adjustments required at foreclosure are charged to the allowance for loan losses. Subsequent to foreclosure, losses5,564 6,429 928 3,616 - 16,537 Non-interest income 39,894 33,255 445 19,084 (2,397) 90,281 Depreciation and amortization 5,879 2,648 67 563 - 9,157 Other non-interest expense 67,370 51,348 3,047 24,157 (128) 145,794 ------------ ------------ ------------ --------------- --------------- --------------- Earnings before income taxes 43,325 43,593 (1,430) 5,356 (2,547) 88,297 Income tax expense 12,808 13,213 (547) 1,913 (794) 26,593 ------------ ------------ ------------ --------------- --------------- --------------- Net earnings $ 30,517 $ 30,380 $ (883) $ 3,443 $ (1,753) $ 61,704 ============ ============ ============ =============== =============== =============== Year ended(amounts in thousands)December 31, 2003 MS LA FL Other Eliminations Consolidated ------------- ------------ ------------ --------------- --------------- --------------- Interest income $ 121,664 $ 83,368 $ - $ 13,648 $ (531) $ 218,149 Interest expense 38,982 19,301 - (2) (320) 57,961 ------------- ------------ ------------ --------------- --------------- --------------- Net interest income 82,682 64,067 - 13,650 (211) 160,188 Provision for loan losses 7,385 5,720 - 2,049 - 15,154 Non-interest income 37,497 26,725 - 10,563 (29) 74,756 Depreciation and amortization 6,335 3,053 - 494 - 9,882 Other non-interest expense 64,358 51,493 - 14,504 (29) 130,326 ------------- ------------ ------------ --------------- --------------- --------------- Earnings before income taxes 42,101 30,526 - 7,166 (211) 79,582 Income tax expense 12,780 9,226 - 2,621 - 24,627 ------------- ------------ ------------ --------------- --------------- --------------- Net earnings $ 29,321 $ 21,300 $ - $ 4,545 $ (211) $ 54,955 ============= ============ ============ =============== =============== ===============
The following table provides information with respect to purchases made byon the issuer or any affiliated purchaserperiodic revaluation of the issuer’s equity securities.
(a) (b) (c) (d) Total numberproperty are charged to net income as other expense. Costs ofMaximum number shares purchased of shares Total numberoperating and maintaining the properties are included in other noninterest expenses, while gains (losses) on their disposition are charged to other income asa part of publicly that may yet be of shares or Average Price announced plans purchased under units purchased Paid per Share or programs (1) Plans or Programs -------------------- -------------------- --------------------- -------------------- Jan. 1, 2005 - Mar. 31, 2005 44,413 (2) $ 31.6290 40,009 681,301 Apr. 1, 2005 - Jun. 30, 2005 189,508 (3) 31.7650 96,100 585,201 Jul. 1, 2005 - Sep. 30, 2005 28,929 (4) 32.3294 11,800 573,401 Oct. 1, 2005 - Dec. 31, 2005 32,999 (5) 39.0339 - 573,401 ------------------- -------------------- --------------------- Total as of Dec. 31, 2005 295,849 $ 26.0194 147,909 =================== ==================== ===================== (1) The Company publicly announced its stock buy-back program on July 18, 2000. (2) 4,404 shares were purchased onincurred. Improvements made to properties are capitalized if theopen market from January through March in order to satisfy obligations pursuant to the Company's long term incentive plan that was established in 1996. (3) 93,408 shares were purchased on the open market from April through June in order to satisfy obligations pursuant to the Company's long term incentive plan that was established in 1996. (4) 17,129 shares were purchased on the open market from July through September in order to satisfy obligations pursuant to the Company's long term incentive plan that was established in 1996. (5) 32,999 shares were purchased on the open market from October through December in order to satisfy obligations pursuant to the Company's long term incentive plan that was established in 1996.
In October 2003, the American Institute of Certified Public Accountants (AICPA) issued Statement of Accounting Position (SOP) 03-03, which addresses accounting for differences between contractual cash flowsexpenditures are expected to be collectedrecovered upon the sale of the properties.
Goodwill and Other Intangible Assets
Goodwill, which represents the excess of cost over the fair value of the net assets of an acquired business, is not amortized but tested for impairment on an annual basis, or more often if events or circumstances indicate there may be impairment.
Identifiable intangible assets are acquired assets that lack physical substance but can be distinguished from goodwill because of contractual or legal rights or because the assets are capable of being sold or exchanged either on their own on in combination with a related contract, asset, or liability. Hancock’s identifiable intangible assets primarily relate to core deposits, insurance customer relationships, non-compete agreements and trade name. These intangibles, which have definite useful lives, are amortized based on the sum-of-the-years-digits method over their estimated useful lives for assets acquired prior to January 1, 2006 and on a straight-line basis for assets acquired subsequent to January 1, 2006. In addition, these intangibles are evaluated annually for impairment or whenever events and changes in circumstances indicate that the carrying amount should be reevaluated.
Mortgage Servicing Rights
The Company adopted SFAS No. 156, Accounting for Servicing of Financial Assets on January 1, 2007 without material impact. SFAS No. 156 requires all separately recognized servicing assets and servicing liabilities to be initially measured at fair value, if practicable, and permits an investor’s initial investmententity to subsequently measure those servicing assets and servicing liabilities at fair value. Under SFAS. No. 156, the Company decided to continue to use the amortization method instead of adopting the fair value method. Management has determined that it has one class of servicing rights which is based on the type of loan.
HANCOCK HOLDING COMPANY AND SUBSIDIARIES
NOTES TO CONSOLIDATED FINANCIAL STATEMENTS
Note 1. Summary of Significant Accounting Policies (continued)
Reinsurance Receivables
Certain premiums and losses are assumed from and ceded to other insurance companies under various reinsurance agreements. Reinsurance premiums, loss reimbursement, and reserves related to reinsurance business are accounted for on a basis consistent with that used in accounting for the original policies issued and the terms of the reinsurance contract. The Company may receive a ceding commission in connection with ceded reinsurance. If so, the ceding commission is earned on a monthly pro rata basis in the same manner as the premium and is recorded as a reduction of other operating expenses.
Derivative Instruments
The Company does not have any accounting hedges under the guidelines of SFAS No. 133, Accounting for Derivative Instruments and Hedging. The Company does have certain Interest Rate Lock Commitments “IRLC’s” that are reported on the consolidated balance sheets at fair value with changes in fair value reported in statements of income. These represent forward commitments to fund customer mortgage loans that will be sold, servicing released upon funding.
Income Taxes
Hancock accounts for deferred income taxes using the liability method. Deferred tax assets and liabilities are based on temporary differences between the financial statement carrying amounts and the tax basis of Hancock’s assets and liabilities. Deferred tax assets and liabilities are measured using the enacted tax rates expected to apply to taxable income in the years in which those temporary differences are expected to be realized or debt securities (loans)settled.
Pension Accounting
The Company has accounted for its defined benefit pension plan using the actuarial model required by SFAS No. 87, Employers’ Accounting for Pensions. The compensation cost of an employee’s pension benefit is recognized on the projected unit credit method over the employee’s approximate service period. The aggregate cost method is utilized for funding purposes. The Company also sponsors two defined benefit postretirement plans, which provide medical benefits and life insurance benefits. The Company has accounted for these plans using the actuarial computations required by SFAS No. 106, Employers Accounting for Postretirement Benefits Other Than Pensions as amended by SFAS No. 132. The cost of the defined benefit postretirement plan has been recognized on the projected unit credit method over the employee’s approximate service period. Effective December 31, 2006, the Company adopted SFAS No. 158, Employers’ Accounting for Defined Benefit Pension and Other Postretirement Plans – an amendment of FASB Statements No. 87, 88, 106 and 132(R); which required the recognition of the over funded or under funded status of a defined benefit postretirement plan as an asset or liability on the balance sheet.
Policy Reserves and Liabilities
Unearned premium reserves are based on the assumption that the portion of the original premium applicable to the remaining term and amount of insurance will be adequate to pay future benefits. The reserve is calculated by multiplying the original gross premium times an unearned premium factor. Factors are developed which represent the proportion of the remaining coverage compared to the total coverage provided over the entire term of insurance.
Policy reserves for future life and health claims not yet incurred are based on assumed mortality and interest rates. For disability, the reserves are based upon unearned premium, which is the portion of the original premium applicable to the remaining term and amount of insurance that will be adequate to pay future benefits. Present value of amounts not yet due is an amount for disability claims already reported and incurred and represents the present value of all the
HANCOCK HOLDING COMPANY AND SUBSIDIARIES
NOTES TO CONSOLIDATED FINANCIAL STATEMENTS
Note 1. Summary of Significant Accounting Policies (continued)
future benefits using actuarial disability tables. IBNR “Incurred But Not Reported” is an estimate of claims incurred but not yet reported, and is based upon historical analysis of claims payments.
Stock-Based Compensation
Effective January 1, 2006, Hancock adopted the provisions of SFAS No. 123(R), Share-Based Payment. This statement establishes fair value as the measurement objective in accounting for stock awards and requires the application of a fair value based measurement method in accounting for compensation cost, which is recognized over the requisite service period. Hancock implemented the provisions of this statement using the modified prospective approach, which applies to new awards. Prior period amounts have not been restated to reflect the impact of the adoption of SFAS No. 123(R).
Earnings Per Share
Basic earnings per share “EPS” excludes dilution and is computed by dividing net income by the weighted-average shares outstanding. Diluted EPS is computed by dividing net income, adjusted for the effect of potentially dilutive stock options outstanding during the period by the weighted-average stock outstanding.
Recent Accounting Pronouncements
New Accounting Standards
In December 2007, the Financial Accounting Standards Board (“FASB”) issued SFAS No. 141R, Business Combinations (“SFAS No. 141R”) which applies to all business combinations. The statement requires most identifiable assets, liabilities, noncontrolling interests, and goodwill acquired in a transfer if those differences are attributable,business combination to be recorded at least in part,“full fair value.” All business combinations will be accounted for by applying the acquisition method (previously referred to credit quality. This SOP prohibits “carry over” or creation of valuation allowancesas the purchase method.) Companies will have to identify the acquirer; determine the acquisition date and purchase price; recognize at their acquisition-date fair values the identifiable assets acquired, liabilities assumed, and any noncontrolling interests in the initial accountingacquiree, and recognize goodwill or, in the case of all loans acquired in a transfer that are withinbargain purchase, a gain. SFAS No. 141R is effective for periods beginning on or after December 15, 2008, and early adoption is prohibited. It will be applied to business combinations occurring after the scope of this SOP. The prohibition of the valuation allowance carryover applies to the purchase of an individual loan, a pool of loans, a group of loans, and loans acquired in a purchase business combination.effective date. The Company adopted this SOP duringwill adopt the provisions of SFAS No. 141R in the first quarter of 20052009, as required, and its effectbut does not expect the impact to be material to the Company’s financial condition or results of operations.
In November 2007, the SEC issued Staff Accounting Bulletin No. 109, Written Loan Commitments Recorded at Fair Value Through Earnings (“SAB No. 109”). SAB No. 109 rescinds SAB No. 105’s prohibition on inclusion of expected net future cash flows related to loan servicing activities in the consolidatedfair value measurement of a written loan commitment. SAB No. 109 applies to any loan commitments for which fair value accounting is elected under SFAS No. 159. SAB No. 109 is effective prospectively for derivative loan commitments issued or modified in fiscal quarters beginning after December 15, 2007. The Company will adopt the provisions of SAB No. 109 in the first quarter of 2008, but does not expect the impact to be material to the Company’s financial statements, to date, has not been material.
operations.
The guidance in In June 2007, the FASB ratified Emerging Issues Task Force (EITF) 03-1,(“EITF”) Issue No. 06-11, Accounting for Income Tax Benefits of Dividends on Share-Based Payment Award.The Meaningobjective of Other-Than-Temporary Impairmentthis issue is to determine the accounting for the income tax benefits of dividend or dividend equivalents when the dividends or dividend equivalents are: (a) linked to equity-classified nonvested shares or share units or equity-classified outstanding share options and Its Application(b) charged to Certain Investmentsretained earnings under SFAS Statement No. 123 (Revised 2004), was originallyShare-Based Payment. The Task Force reached a consensus that EITF No. 06-11 should be applied prospectively to the income tax benefits of dividends on equity-classified employee share-based payment awards that are declared in fiscal years beginning after September 15, 2007. The Company will adopt the provisions of EITF No. 06-11 in the first quarter of 2008, but does not expect the impact to be material to the Company’s financial condition or results of operations.
HANCOCK HOLDING COMPANY AND SUBSIDIARIES
NOTES TO CONSOLIDATED FINANCIAL STATEMENTS
Note 1. Summary of Significant Accounting Policies (continued)
In March 2007, the FASB ratified EITF No. 06-10, Accounting for Collateral Assignment Split-Dollar Life Insurance Arrangements. One objective of EITF No. 06-10 is to determine whether a liability for future benefits under a collateral assignment split-dollar life insurance arrangement that provides a benefit to an employee that extends into postretirement periods should be recognized in accordance with SFAS No. 106 or APB Opinion 12, as appropriate, based on the substantive agreement with the employee. Another objective of EITF No. 06-10 is to determine how the asset arising from a collateral assignment split-dollar life insurance arrangement should be recognized and measured. EITF No. 06-10 is effective for other-than-temporary impairment evaluations made in reporting periodsfiscal years beginning after JuneDecember 15, 2004. However,2007. The Company will adopt the guidance contained in paragraphs 10-20 of the Issue was delayed by FASB Staff Position (FSP) EITF Issue 03-1-1,The Effective Date of Paragraphs 10-20provisions of EITF Issue No. 03-1, posted on September 30, 2004. The disclosure requirements continue06-10 in the first quarter of 2008, as required, but does not expect the impact to be effective and have been implemented bymaterial to the Company.Company’s financial condition or results of operations.
In November 2005,February 2007, the FASB issued Staff Position (FSP) FAS 115-1SFAS No. 159, The Fair Value Option for Financial Assets and FAS 124-1,The Meaning of Other-Than-Temporary Impairment and Its Application to Certain Investments, which amendsFinancial Liabilities - Including an Amendment SFAS No. 115 (“SFAS No. 159”) which permits an entity to choose to measure many financial instruments and certain other items at fair value. Most of the provisions in SFAS No. 159 are elective; however, the amendment to FASB Statement No. 115, Accounting for Certain Investments in Debt and Equity Securities, applies to all entities with available-for-sale and trading securities. The fair value option established by SFAS No. 124,Accounting159 permits all entities to choose to measure eligible items at fair value at specified election dates. A business entity will report unrealized gains and losses on items for Certain Investments Heldwhich the fair value option has been elected in earnings (or another performance indicator if the business entity does not report earnings) at each subsequent reporting date. The fair value option: (a) may be applied instrument by Notinstrument, with a few exceptions, such as investments otherwise accounted for Profit Organizationsby the equity method; (b) is irrevocable (unless a new election date occurs); and APB Opinion No. 18,The Equity Method(c) is applied only to entire instruments and not to portions of Accounting for Investments in Common Stock. This FSP addresses the determination as to when an investment is considered impaired, whether the impairment is other than temporary, and the measurement of an impairment loss. FSP FAS 115-1 and FAS 124-1 also includes accounting considerations subsequent to the recognition of an other-than-temporary impairment and requires certain disclosures about unrealized losses that have not been recognized as other-than-temporary impairments. The guidance in this FSP is effective for reporting periods beginning after December 15, 2005.instruments. The Company will adopt the provisions of SFAS No. 159 in the first quarter of 2008, as required, but does not expect the adoption of FAS 115-1 and FAS 124-1 will have aimpact to be material impact on itsto the Company’s financial condition or results of operations.
On December 16, 2004, In September 2006, the FASB publishedissued SFAS No. 123(R),157, Share-Based PaymentsFair Value Measurements (“SFAS No. 157”). This Statementstandard defines fair value, establishes a framework for measuring fair value in accounting principles generally accepted in the United States of America, and expands disclosure about fair value measurements. This pronouncement applies to other accounting standards that require or permit fair value measurements. Accordingly, this statement does not require any new fair value measurement. This statement is effective for fiscal years beginning after November 15, 2007, and interim periods within those fiscal years. At the November 14, 2007 Board meeting, the Board decided to defer the effective date for all nonfinancial assets and nonfinancial liabilities, except those that are recognized or disclosed at fair value in the financial statements on a revisionrecurring basis (at least annually). The Company will adopt the provisions of SFAS No. 123,157 in the first quarter of 2008, as required, but does not expect the impact to be material to the Company’s financial condition or results of operations.
Accounting Standards Adopted in 2007
In September 2006, the FASB ratified the consensus the EITF reached regarding EITF No.06-5, Accounting for Purchases of Life Insurance - Determining the Amount that Could Be Realized in Accordance with FASB Technical Bulletin 85-4 (“EITF 06-5”). The EITF concluded that a policyholder should consider any additional amounts included in the contractual terms of the life insurance policy in determining the “amount that could be realized under the insurance contract.” For group policies with multiple certificates or multiple policies with a group rider, the Task Force also tentatively concluded that the amount that could be realized should be determined at the individual policy or certificate level, i.e., amounts that would be realized only upon surrendering all of the policies or certificates would not be included when measuring the assets. The Company adopted EITF No 06-5 effective January 1, 2007. The adoption of EITF No. 06-5 did not have a material impact on the Company’s financial condition or results of operations.
HANCOCK HOLDING COMPANY AND SUBSIDIARIES
NOTES TO CONSOLIDATED FINANCIAL STATEMENTS
Note 1. Summary of Significant Accounting Policies (continued)
In September 2006, the FASB issued SFAS No. 158, Employers’ Accounting for Defined Benefit Pension and OtherPostretirement Plans – An Amendment of FASB Statements No. 87, 88, 106, and 132(R) (“SFAS No. 158”). This pronouncement requires an employer to recognize the over funded or under funded status of a defined benefit postretirement plan (other than a multiemployer plan) as an asset or liability on its statement of financial position. SFAS No. 158 also requires an employer to recognize changes in that funded status in the year in which the changes occur through comprehensive income effective for fiscal years ending after December 15, 2006. In addition, this statement requires an employer to measure the funded status of a plan as of the date of its year-end statement of financial position effective for fiscal years ended after December 15, 2008. The Company adopted the requirement to recognize the funded status of the benefit plans and related disclosure requirements as of December 31, 2006. In 2008, the Company will change the measurement date of the funded status of the plan from September 30 to December 31. With the change in measurement date, the Company will record an $815,107 adjustment to beginning 2008 retained earnings.
In June 2006, the FASB issued Interpretation No. 48, Accounting for Uncertainty in Income Taxes, An Interpretation of FASB Statement No. 109 (“FIN 48”). FIN 48 clarifies that the benefit of a position taken or expected to be taken in a tax return should be recognized in a company’s financial statements in accordance with SFAS No.109, Accounting for Income Taxes, when it is more likely than not that the position will be sustained based on its technical merits. FIN 48 also prescribes how to measure the tax benefit recognized and provides guidance on when a tax benefit should be derecognized as well as various other accounting, presentation and disclosure matters. The adoption of FIN 48 during the first quarter of 2007 did not have a material impact on the Company’s results of operations and financial position.
In March 2006, the FASB issued SFAS No. 156, Accounting for Servicing of Financial Assets (“SFAS No. 156”). SFAS No. 156 requires all separately recognized servicing assets and servicing liabilities to be initially measured at fair value, if practicable, and permits an entity to subsequently measure those servicing assets and servicing liabilities at fair value. This pronouncement was effective for the Company beginning in fiscal year 2007. The Company is using the amortization method and the adoption of SFAS No. 156 did not have a material impact on its results of operations and financial position.
In September 2005, the American Institute of Certified Public Accountants (“AICPA”) issued Statement of Position (SOP) 05-1, Accounting by Insurance Enterprises for Deferred Acquisition Costs in Connection with Modifications or Exchanges of Insurance Contracts (“SOP 05-1”). SOP 05-1 provides guidance on accounting by insurance enterprises for deferred acquisition costs on internal replacements of insurance and investment contracts other than those specifically described in FASB Statement No. 97, Accounting and Reporting by Insurance Enterprises for Certain Long-Duration Contracts and for Realized Gains and Losses from the Sale of Investments. The Company adopted SOP 05-1 effective January 1, 2007. The adoption of SOP 05-1 did not have a material impact on the Company’s financial condition or results of operations.
HANCOCK HOLDING COMPANY AND SUBSIDIARIES
NOTES TO CONSOLIDATED FINANCIAL STATEMENTS
Note 2. Securities
The amortized cost and fair value of securities classified as available for sale follow (in thousands):
|
|
|
|
|
|
|
|
|
|
|
|
|
|
|
|
|
|
|
|
|
|
|
|
|
|
|
|
|
|
|
|
|
|
|
| December 31, 2007 |
| December 31, 2006 |
| ||||||||||||||||||||||||||||
|
|
|
| ||||||||||||||||||||||||||||||
|
| Amortized |
| Gross |
| Gross |
| Fair |
| Amortized |
| Gross |
| Gross |
| Fair |
| ||||||||||||||||
|
|
|
|
|
|
|
|
|
| ||||||||||||||||||||||||
U.S. Treasury |
| $ | 11,353 |
|
| $ | 41 |
|
|
| $ | — |
|
| $ | 11,394 |
| $ | 60,231 |
|
| $ | 17 |
|
|
| $ | 57 |
|
| $ | 60,191 |
|
U.S. government agencies |
|
| 431,772 |
|
|
| 1,999 |
|
|
|
| 107 |
|
|
| 433,664 |
|
| 1,016,811 |
|
|
| 172 |
|
|
|
| 6,054 |
|
|
| 1,010,929 |
|
Municipal obligations |
|
| 197,596 |
|
|
| 2,347 |
|
|
|
| 1,361 |
|
|
| 198,582 |
|
| 200,891 |
|
|
| 3,556 |
|
|
|
| 430 |
|
|
| 204,017 |
|
Mortgage-backed securities |
|
| 637,578 |
|
|
| 3,519 |
|
|
|
| 4,717 |
|
|
| 636,380 |
|
| 443,410 |
|
|
| 995 |
|
|
|
| 9,978 |
|
|
| 434,427 |
|
CMOs |
|
| 143,639 |
|
|
| 392 |
|
|
|
| 1,219 |
|
|
| 142,812 |
|
| 116,161 |
|
|
| — |
|
|
|
| 1,991 |
|
|
| 114,170 |
|
Other debt securities |
|
| 49,653 |
|
|
| 342 |
|
|
|
| 1,597 |
|
|
| 48,398 |
|
| 44,664 |
|
|
| 282 |
|
|
|
| 926 |
|
|
| 44,020 |
|
Federal Home Loan Bank stock |
|
| 2,306 |
|
|
| — |
|
|
|
| — |
|
|
| 2,306 |
|
| 3,198 |
|
|
| — |
|
|
|
| — |
|
|
| 3,198 |
|
Other equity securities |
|
| 6,066 |
|
|
| 613 |
|
|
|
| 19 |
|
|
| 6,660 |
|
| 31,479 |
|
|
| 1,247 |
|
|
|
| 20 |
|
|
| 32,706 |
|
|
|
|
|
|
|
|
|
|
|
|
|
|
|
|
|
|
| ||||||||||||||||
|
| $ | 1,479,963 |
|
| $ | 9,253 |
|
|
| $ | 9,020 |
|
| $ | 1,480,196 |
| $ | 1,916,845 |
|
| $ | 6,269 |
|
|
| $ | 19,456 |
|
| $ | 1,903,658 |
|
|
|
|
|
|
|
|
|
|
|
|
|
|
|
|
|
|
| ||||||||||||||||
The amortized cost and fair value of securities classified as available for sale at December 31, 2007, by contractual maturity, (expected maturities will differ from contractual maturities because of rights to call or repay obligations with or without penalties), and the amortized cost and fair value of trading securities were as follows (in thousands):
|
|
|
|
|
|
|
|
|
| Amortized |
| Fair |
| ||
|
|
|
| ||||
Due in one year or less |
| $ | 139,997 |
| $ | 140,396 |
|
Due after one year through five years |
|
| 218,929 |
|
| 221,941 |
|
Due after five years through ten years |
|
| 248,984 |
|
| 247,680 |
|
Due after ten years |
|
| 82,464 |
|
| 82,021 |
|
|
|
|
| ||||
|
|
| 690,374 |
|
| 692,038 |
|
|
|
|
|
|
|
|
|
Mortgage-backed securities & CMOs |
|
| 781,217 |
|
| 779,192 |
|
Equity securities |
|
| 8,372 |
|
| 8,966 |
|
|
|
|
| ||||
Total available for sale securities |
|
| 1,479,963 |
|
| 1,480,196 |
|
Total trading securities |
|
| 197,425 |
|
| 197,425 |
|
|
|
|
| ||||
|
| $ | 1,677,388 |
| $ | 1,677,621 |
|
|
|
|
| ||||
The Company held no securities classified as held to maturity at December 31, 2007 or 2006. During the fourth quarter of 2007, the economic environment, the slope of the yield curve and the expectation of future interest rate movements presented the Company with an opportunity to reclassify $195.2 million (11.64% of the portfolio) of securities from available for sale to trading. This reclassification provides flexibility to the Company to restructure the portfolio as conditions warrant.
HANCOCK HOLDING COMPANY AND SUBSIDIARIES
NOTES TO CONSOLIDATED FINANCIAL STATEMENTS
Note 2. Securities (continued)
The details concerning securities classified as available for sale with unrealized losses as of December 31, 2007 follow (in thousands):
|
|
|
|
|
|
|
|
|
|
|
|
|
|
|
|
|
|
|
|
|
|
|
|
|
|
|
| Losses < 12 months |
| Losses 12 months or > |
| Total |
| ||||||||||||||||||
|
|
| |||||||||||||||||||||||
|
| Fair |
| Gross |
| Fair |
| Gross |
| Fair |
| Gross |
| ||||||||||||
|
|
|
|
|
|
|
| ||||||||||||||||||
U.S. Treasury |
| $ | — |
|
| $ | — |
|
| $ | — |
|
| $ | — |
|
| $ | — |
|
| $ | — |
|
|
U.S. government agencies |
|
| 29,893 |
|
|
| 107 |
|
|
| — |
|
|
| — |
|
|
| 29,893 |
|
|
| 107 |
|
|
Municipal obligations |
|
| 4,946 |
|
|
| 17 |
|
|
| 37,327 |
|
|
| 1,344 |
|
|
| 42,273 |
|
|
| 1,361 |
|
|
Mortgage-backed securities |
|
| — |
|
|
| — |
|
|
| 206,894 |
|
|
| 4,717 |
|
|
| 206,894 |
|
|
| 4,717 |
|
|
CMOs |
|
| — |
|
|
| — |
|
|
| 117,489 |
|
|
| 1,219 |
|
|
| 117,489 |
|
|
| 1,219 |
|
|
Other debt securities |
|
| 4,177 |
|
|
| 147 |
|
|
| 23,230 |
|
|
| 1,450 |
|
|
| 27,407 |
|
|
| 1,597 |
|
|
Equity securities |
|
| — |
|
|
| — |
|
|
| 17 |
|
|
| 19 |
|
|
| 17 |
|
|
| 19 |
|
|
|
|
|
|
|
|
|
|
|
|
|
|
|
| ||||||||||||
|
| $ | 39,016 |
|
| $ | 271 |
|
| $ | 384,957 |
|
| $ | 8,749 |
|
| $ | 423,973 |
|
| $ | 9,020 |
|
|
|
|
|
|
|
|
|
|
|
|
|
|
|
| ||||||||||||
The details concerning securities classified as available for sale with unrealized losses as of December 31, 2006 were as follows (in thousands):
|
|
|
|
|
|
|
|
|
|
|
|
|
|
|
|
|
|
|
|
|
|
|
|
|
|
|
| Losses < 12 months |
| Losses 12 months or > |
| Total |
| ||||||||||||||||||
|
|
| |||||||||||||||||||||||
|
| Fair |
| Gross |
| Fair |
| Gross |
| Fair |
| Gross |
| ||||||||||||
|
|
|
|
|
|
|
| ||||||||||||||||||
U.S. Treasury |
| $ | 59,194 |
|
| $ | 49 |
|
| $ | 500 |
|
| $ | 8 |
|
| $ | 59,694 |
|
| $ | 57 |
|
|
U.S. government agencies |
|
| 465,684 |
|
|
| 1,344 |
|
|
| 440,711 |
|
|
| 4,710 |
|
|
| 906,395 |
|
|
| 6,054 |
|
|
Municipal obligations |
|
| 2,070 |
|
|
| 14 |
|
|
| 36,568 |
|
|
| 416 |
|
|
| 38,638 |
|
|
| 430 |
|
|
Mortgage-backed securities |
|
| 1,729 |
|
|
| 1 |
|
|
| 343,494 |
|
|
| 9,977 |
|
|
| 345,223 |
|
|
| 9,978 |
|
|
CMOs |
|
| 8 |
|
|
| — |
|
|
| 114,018 |
|
|
| 1,991 |
|
|
| 114,026 |
|
|
| 1,991 |
|
|
Other debt securities |
|
| 914 |
|
|
| 4 |
|
|
| 32,033 |
|
|
| 922 |
|
|
| 32,947 |
|
|
| 926 |
|
|
Equity securities |
|
| 3 |
|
|
| 1 |
|
|
| 19 |
|
|
| 19 |
|
|
| 22 |
|
|
| 20 |
|
|
|
|
|
|
|
|
|
|
|
|
|
|
|
| ||||||||||||
|
| $ | 529,602 |
|
| $ | 1,413 |
|
| $ | 967,343 |
|
| $ | 18,043 |
|
| $ | 1,496,945 |
|
| $ | 19,456 |
|
|
|
|
|
|
|
|
|
|
|
|
|
|
|
| ||||||||||||
As of December 31, 2007, the securities portfolio totaled $1.68 billion. Of the total portfolio, $424.0 million of securities were in an unrealized loss position of $9.0 million. Management and the Asset/Liability Committee continually monitor the securities portfolio and management is able to effectively measure and monitor the unrealized loss position on these securities. The Company has adequate liquidity and therefore has the ability and additionally the intent to hold these securities to recovery. Accordingly, the unrealized loss of these securities has been determined to be temporary.
The Company’s securities portfolio is an important source of liquidity and earnings for the Company. A stated objective in managing the securities portfolio is to provide consistent liquidity to support balance sheet growth but also to provide a safe and consistent stream of earnings. To that end, management is open to opportunities that present themselves which enables the Company to improve the structure and earnings potential of the securities portfolio.
HANCOCK HOLDING COMPANY AND SUBSIDIARIES
NOTES TO CONSOLIDATED FINANCIAL STATEMENTS
Note 2. Securities (continued)
Proceeds from sales and pay downs of available for sale securities were approximately $9.2 million in 2007, $157.3 million in 2006 and $133.8 million in 2005. Gross gains of $388,000 in 2007, $309,000 in 2006 and $781,000 in 2005 and gross losses of $115,000 in 2007, $5.5 million in 2006 and $834,000 in 2005 were realized on such sales and pay downs. In the first quarter of 2007, a subsidiary of the Company, Magna Insurance Company, sold thirty securities out of its portfolio to provide liquidity for surrenders of annuities for Magna Insurance Company. These securities had a gross loss of $37,164.
Securities with an amortized cost of approximately $1.145 billion at December 31, 2007 and $1.213 billion at December 31, 2006, were pledged primarily to secure public deposits and securities sold under agreements to repurchase. The Company has approximately $6.4 million and $10.0 million of securities pledged with various state regulatory authorities to secure reinsurance receivables as of December 31, 2007 and 2006, respectively.
Note 3. Loans
Loans, net of unearned income, consisted of the following (in thousands):
|
|
|
|
|
|
|
|
|
| December 31, |
| ||||
|
|
| |||||
|
| 2007 |
| 2006 |
| ||
|
|
|
| ||||
Loans held for sale |
| $ | 18,957 |
| $ | 16,946 |
|
Real estate loans |
|
| 2,332,891 |
|
| 2,106,659 |
|
Commercial and industrial loans |
|
| 359,519 |
|
| 317,630 |
|
Loans to individuals for household, family and other consumer expenditures |
|
| 571,349 |
|
| 529,762 |
|
Leases and other loans |
|
| 332,798 |
|
| 295,587 |
|
|
|
|
| ||||
|
| $ | 3,615,514 |
| $ | 3,266,584 |
|
|
|
|
| ||||
The Company generally makes loans in its market areas of South Mississippi, South Alabama, South and Central Louisiana and Northwest Florida. Loans are made in the normal course of business to its directors, executive officers and their associates on substantially the same terms, including interest rates and collateral, as those prevailing at the time for comparable transactions with other persons. Such loans did not involve more than normal risk of collectibility. Balances of loans to the Company’s directors, executive officers and their affiliates at December 31, 2007 and 2006 were approximately $13.0 million and $14.4 million, respectively. New loans, repayments and changes of directors and executive officers and their affiliates on these loans for 2007 were $3.7 million, $1.6 million and $3.5 million, respectively. New loans, repayments and changes of directors and executive officers and their affiliates on these loans for 2006 were $7.0 million, $1.8 million and $6.0 million, respectively.
Changes in the allowance for loan losses follow (in thousands):
|
|
|
|
|
|
|
|
|
|
|
|
| 2007 |
| 2006 |
| 2005 |
| |||
|
|
|
|
| ||||||
Balance at January 1 |
| $ | 46,772 |
| $ | 74,558 |
| $ | 40,682 |
|
Recoveries |
|
| 7,210 |
|
| 12,491 |
|
| 7,052 |
|
Loans charged off |
|
| (14,452 | ) |
| (19,515 | ) |
| (15,811 | ) |
Provision for (reversal of) loan losses |
|
| 7,593 |
|
| (20,762 | ) |
| 42,635 |
|
|
|
|
|
| ||||||
Balance at December 31 |
| $ | 47,123 |
| $ | 46,772 |
| $ | 74,558 |
|
|
|
|
|
| ||||||
HANCOCK HOLDING COMPANY AND SUBSIDIARIES
NOTES TO CONSOLIDATED FINANCIAL STATEMENTS
Note 3. Loans (continued)
In 2005, the Company established a $35.2 million specific allowance for estimated credit losses related to the impact of Hurricane Katrina on its loan portfolio. In 2005, the Company reduced the allowance by $2.4 million for storm-related net charge-offs. As a result, the storm-related allowance was $32.9 million as of December 31, 2005. Of this remaining amount, the Company reversed $20.0 million of the allowance to income in 2006. While management determined that the potential for further storm-related charge-offs is present, the levels are projected to be lower than originally anticipated. The Company reviewed the asset quality of significant credits included in the original $35.2 million storm-related allowance and determined that this reversal was appropriate.
In some instances, loans are placed on non-accrual status. All accrued but uncollected interest related to the loan is deducted from income in the period the loan is assigned a non-accrual status. For such period as a loan is in non-accrual status, any cash receipts are applied first to principal, second to expenses incurred to cause payment to be made and lastly to the recovery of any reversed interest income and interest that would be due and owing subsequent to the loan being placed on non-accrual status.
The Company’s investments in impaired loans at December 31, 2007 and December 31, 2006 were $43.5 million and $26.8 million, respectively. Non-accrual and renegotiated loans amounted to approximately 0.36% and 0.11% of total loans at December 31, 2007 and 2006, respectively. In addition, the Company’s other individually evaluated impaired loans amounted to approximately 0.12% and 0.08% of total loans at December 31, 2007 and 2006, respectively. The average amounts of impaired loans carried on the Company’s books for 2007, 2006 and 2005 were $7.7 million, $7.4 million and $9.3 million, respectively, all of which are completely reserved. The amount of interest that would have been recorded on non-accrual loans had the loans not been classified as non-accrual in 2007, 2006 or 2005, was $498,000, $759,000 and $747,000, respectively.
As of December 31, 2007 and 2006, the Company had $18.8 million and $17.2 million, respectively, in loans carried at fair value. The Company held $19.0 million and $16.9 million in loans held for sale at December 31, 2007 and 2006 carried at lower of cost or market. These loans are originated on a best-efforts basis, whereby a commitment by a third party to purchase the loan has been received concurrent with the Banks’ commitment to the borrower to originate the loan.
Note 4. Property and Equipment
Property and equipment stated at cost, less accumulated depreciation and amortization, consisted of the following (in thousands):
|
|
|
|
|
|
|
|
|
| December 31, |
| ||||
|
|
| |||||
|
| 2007 |
| 2006 |
| ||
|
|
|
| ||||
Land and land improvements |
| $ | 32,679 |
| $ | 26,738 |
|
Buildings and leasehold improvements |
|
| 156,666 |
|
| 72,410 |
|
Furniture, fixtures and equipment |
|
| 59,837 |
|
| 60,411 |
|
Construction in progress |
|
| 14,836 |
|
| 47,038 |
|
Software |
|
| 23,708 |
|
| 22,262 |
|
|
|
|
| ||||
|
|
| 287,726 |
|
| 228,859 |
|
Accumulated depreciation and amortization |
|
| (87,160 | ) |
| (85,397 | ) |
|
|
|
| ||||
Property and equipment, net |
| $ | 200,566 |
| $ | 143,462 |
|
|
|
|
| ||||
Depreciation and amortization expense was $14.0 million, $10.4 million and $8.7 million for the years ended December 31, 2007, 2006 and 2005, respectively. Capitalized interest was $1.0 million and $0.8 million for the years ended December 31, 2007 and 2006.
HANCOCK HOLDING COMPANY AND SUBSIDIARIES
NOTES TO CONSOLIDATED FINANCIAL STATEMENTS
Note 5. Goodwill and Other Intangible Assets
Goodwill represents costs in excess of the fair value of net assets acquired in connection with purchase business combinations. In accordance with the provisions of SFAS No. 142, Goodwill and Other Intangibles, the Company tests its goodwill for impairment annually. No impairment charges were recognized during 2007, 2006, or 2005. The carrying amount of goodwill was $62.3 million at both December 31, 2007 and 2006. During 2006, the Company recorded reallocations of goodwill to other intangible assets and the final purchase price for the acquisition of J. Everett Eaves, Inc. The changes in the carrying amount of goodwill for 2007 and 2006 follow (in thousands):
|
|
|
|
|
|
|
|
|
| December 31, |
| ||||
|
|
| |||||
|
| 2007 |
| 2006 |
| ||
|
|
|
| ||||
Balance at January 1 |
| $ | 62,277 |
| $ | 61,418 |
|
Reallocation based on subsequent valuation |
|
| — |
|
| 859 |
|
|
|
|
| ||||
Balance at December 31 |
| $ | 62,277 |
| $ | 62,277 |
|
|
|
|
| ||||
The following tables present information regarding the components of the Company’s other intangible assets, and related amortization for the dates indicated (in thousands):
|
|
|
|
|
|
|
|
|
|
|
|
|
|
|
|
|
|
| December 31, 2007 |
| |||||||||||||
|
|
| ||||||||||||||
|
| Gross Carrying |
| Accumulated |
| Net Carrying |
| |||||||||
|
|
|
|
| ||||||||||||
Core deposit intangibles |
|
| $ | 14,137 |
|
|
| $ | 8,500 |
|
|
| $ | 5,637 |
|
|
Value of insurance business acquired |
|
|
| 3,757 |
|
|
|
| 1,807 |
|
|
|
| 1,950 |
|
|
Non-compete agreements |
|
|
| 368 |
|
|
|
| 252 |
|
|
|
| 116 |
|
|
Trade name |
|
|
| 100 |
|
|
|
| 50 |
|
|
|
| 50 |
|
|
|
|
|
|
|
|
|
|
|
|
| ||||||
|
|
| $ | 18,362 |
|
|
| $ | 10,609 |
|
|
| $ | 7,753 |
|
|
|
|
|
|
|
|
|
|
|
|
| ||||||
|
|
|
|
|
|
|
|
|
|
|
|
|
|
|
|
|
|
| December 31, 2006 |
| |||||||||||||
|
|
| ||||||||||||||
|
| Gross Carrying |
| Accumulated |
| Net Carrying |
| |||||||||
|
|
|
|
| ||||||||||||
Core deposit intangibles |
|
| $ | 14,137 |
|
|
| $ | 7,290 |
|
|
| $ | 6,847 |
|
|
Value of insurance business acquired |
|
|
| 3,767 |
|
|
|
| 1,459 |
|
|
|
| 2,308 |
|
|
Non-compete agreements |
|
|
| 368 |
|
|
|
| 179 |
|
|
|
| 189 |
|
|
Trade name |
|
|
| 100 |
|
|
|
| 30 |
|
|
|
| 70 |
|
|
|
|
|
|
|
|
|
|
|
|
| ||||||
|
|
| $ | 18,372 |
|
|
| $ | 8,958 |
|
|
| $ | 9,414 |
|
|
|
|
|
|
|
|
|
|
|
|
| ||||||
|
|
|
|
|
|
|
|
|
|
|
|
|
|
|
|
|
|
| Years Ended December 31, |
| |||||||||||||
|
|
| ||||||||||||||
|
| 2007 |
| 2006 |
| 2005 |
| |||||||||
|
|
|
|
| ||||||||||||
Aggregate amortization expense for: |
|
|
|
|
|
|
|
|
|
|
|
|
|
|
|
|
Core deposit intangibles |
|
| $ | 1,210 |
|
|
| $ | 1,366 |
|
|
| $ | 1,654 |
|
|
Value of insurance business acquired |
|
|
| 348 |
|
|
|
| 626 |
|
|
|
| 471 |
|
|
Non-compete agreements |
|
|
| 73 |
|
|
|
| 103 |
|
|
|
| 69 |
|
|
Trade name |
|
|
| 20 |
|
|
|
| 30 |
|
|
|
| — |
|
|
|
|
|
|
|
|
|
|
|
|
| ||||||
|
|
| $ | 1,651 |
|
|
| $ | 2,125 |
|
|
| $ | 2,194 |
|
|
|
|
|
|
|
|
|
|
|
|
| ||||||
HANCOCK HOLDING COMPANY AND SUBSIDIARIES
NOTES TO CONSOLIDATED FINANCIAL STATEMENTS
Note 5. Goodwill and Other Intangible Assets (continued)
The amortization period used for core deposit intangibles and value of insurance business acquired is 10 years. The amortization period used for non-compete agreements and trade name intangibles is 5 years. The following table shows estimated amortization expense of other intangible assets for the five succeeding years and thereafter, calculated based on current amortization schedules (in thousands):
|
|
|
2008 | $ | 1,518 |
2009 |
| 1,484 |
2010 |
| 1,425 |
2011 |
| 1,177 |
2012 |
| 953 |
Thereafter |
| 1,196 |
| ||
| $ | 7,753 |
|
Note 6. Mortgage Banking (including Mortgage Servicing Rights)
The changes in the carrying amounts of mortgage servicing rights for the years ended December 31, 2007, 2006, and 2005 are as follows (in thousands):
|
|
|
|
|
|
|
|
|
|
|
|
|
|
|
|
|
|
| Gross Carrying |
| Valuation |
| Net Carrying |
| |||||||||
|
|
|
|
| ||||||||||||
Balance as of December 31, 2005 |
|
| $ | 4,292 |
|
|
| $ | (2,716 | ) |
|
| $ | 1,576 |
|
|
Additions |
|
|
| 21 |
|
|
|
| — |
|
|
|
| 21 |
|
|
Disposals |
|
|
| (475 | ) |
|
|
| 368 |
|
|
|
| (107 | ) |
|
Amortization |
|
|
| — |
|
|
|
| (549 | ) |
|
|
| (549 | ) |
|
|
|
|
|
|
|
|
|
|
|
| ||||||
Balance as of December 31, 2006 |
|
|
| 3,838 |
|
|
|
| (2,897 | ) |
|
|
| 941 |
|
|
Additions |
|
|
| 9 |
|
|
|
| — |
|
|
|
| 9 |
|
|
Disposals |
|
|
| (342 | ) |
|
|
| 282 |
|
|
|
| (60 | ) |
|
Amortization |
|
|
| — |
|
|
|
| (345 | ) |
|
|
| (345 | ) |
|
|
|
|
|
|
|
|
|
|
|
| ||||||
Balance as of December 31, 2007 |
|
| $ | 3,505 |
|
|
| $ | (2,960 | ) |
|
| $ | 545 |
|
|
|
|
|
|
|
|
|
|
|
|
| ||||||
Amortization expense was $345, $549, and $818 for years ended December 31, 2007, 2006 and 2005. The following table shows estimated amortization expense of mortgage servicing rights for the five succeeding years and thereafter, calculated based on current amortization schedules (in thousands):
|
|
|
2008 | $ | 219 |
2009 |
| 152 |
2010 |
| 99 |
2011 |
| 53 |
2012 |
| 16 |
Thereafter |
| 6 |
| ||
| $ | 545 |
|
HANCOCK HOLDING COMPANY AND SUBSIDIARIES
NOTES TO CONSOLIDATED FINANCIAL STATEMENTS
Note 6. Mortgage Banking (including Mortgage Servicing Rights) (continued)
The assumptions underlying these estimates are subject to modification based on changes in market conditions and portfolio behavior (such as prepayment speeds). Variable prepayment speeds were used in this projection and are based on coupon stratification, age and type of loans in this portfolio under the current interest rate environment. As a result, these estimates are subject to change in a manner and amount that is not presently determinable by management.
Impairment for mortgage servicing rights occurs when the estimated fair value falls below amortized cost. Fair value is determined utilizing specific risk characteristics of the mortgage loan, current interest rates and current prepayments speeds. The Company had no impairment for mortgage servicing rights in 2007, 2006 and 2005.
At December 31, 2007, the fair value of mortgage servicing rights was $1.8 million, with a weighted average coupon of 5.73%. At December 31, 2006, the fair value of mortgage servicing rights was $2.2 million, with a weighted average coupon of 5.73%.
Note 7. Deposits
The maturities of time deposits at December 31, 2007 follow (in thousands):
|
|
|
2008 | $ | 1,925,265 |
2009 |
| 106,742 |
2010 |
| 37,542 |
2011 |
| 26,832 |
2012 |
| 37,355 |
Thereafter |
| 8 |
| ||
| $ | 2,133,744 |
|
Time deposits of $100,000 or more totaled approximately $935.3 million and $735.6 million at December 31, 2007 and 2006, respectively.
HANCOCK HOLDING COMPANY AND SUBSIDIARIES
NOTES TO CONSOLIDATED FINANCIAL STATEMENTS
Note 8. Borrowings
Short-Term Borrowings
The following table presents information concerning federal funds purchased and sold and securities sold under agreements to repurchase (in thousands):
|
|
|
|
|
|
|
|
|
| December 31, |
| ||||
|
|
| |||||
|
| 2007 |
| 2006 |
| ||
|
|
|
| ||||
Federal funds sold |
|
|
|
|
|
|
|
Amount outstanding at period-end |
| $ | 117,721 |
| $ | 212,242 |
|
Weighted average interest rate at period-end |
|
| 4.32 | % |
| 5.09 | % |
|
|
|
|
|
|
|
|
Federal funds purchased |
|
|
|
|
|
|
|
Amount outstanding at period-end |
| $ | 4,100 |
| $ | 3,800 |
|
Weighted average interest rate at period-end |
|
| 4.02 | % |
| 4.95 | % |
Weighted average interest rate during the year |
|
| 4.99 | % |
| 5.38 | % |
Average daily balance during the year |
| $ | 4,174 |
| $ | 11,557 |
|
Maximum month end balance during the year |
| $ | 4,100 |
| $ | 49,160 |
|
|
|
|
|
|
|
|
|
Securities sold under agreements to repurchase |
|
|
|
|
|
|
|
Amount outstanding at period-end |
| $ | 371,604 |
| $ | 218,591 |
|
Weighted average interest rate at period-end |
|
| 3.63 | % |
| 3.72 | % |
Weighted average interest rate during the year |
|
| 3.70 | % |
| 3.62 | % |
Average daily balance during the year |
| $ | 216,730 |
| $ | 250,603 |
|
Maximum month end balance during the year |
| $ | 371,604 |
| $ | 425,753 |
|
The contractual maturity of federal funds purchased and securities sold under agreements to repurchase is demand or due overnight.
Specific U. S. Treasury and U. S. Government agencies with carrying values of $371.6 million at December 31, 2007 and $218.6 million at December 31, 2006 collateralized the repurchase agreements. The fair value of this collateral approximated $375.6 million at December 31, 2007 and $216.6 million at December 31, 2006.
Long-Term Borrowings
As of December 31, 2007, the Company had $199.2 million in long-term borrowings classified as securities sold under agreements to repurchase. Combined with short-term borrowings of $172.4 million, the Company’s total position in securities sold under agreements to repurchase was $371.6 million. On April 6, 2006, the Company completed an early retirement of its $50.0 million debt obligation to the Federal Home Loan Bank (FHLB). This obligation was recorded as a long-term liability in the Consolidated Balance Sheets as of December 31, 2005. As a result of this transaction, a $41,000 loss on early extinguishment of debt was recognized in 2006. The Company has an approved line of credit with the FHLB of approximately $346.8 million, which is secured by a blanket pledge of certain residential mortgage loans. This line of credit had no outstanding balances at December 31, 2007 and 2006.
HANCOCK HOLDING COMPANY AND SUBSIDIARIES
NOTES TO CONSOLIDATED FINANCIAL STATEMENTS
Note 9. Stockholders’ Equity
Regulatory Capital
Common stockholders’ equity of the Company includes the undistributed earnings of the bank subsidiaries. Dividends are payable only out of undivided profits or current earnings. Moreover, dividends to the Company’s stockholders can generally be paid only from dividends paid to the Company by the Banks. Consequently, dividends are dependent upon earnings, capital needs, regulatory policies and statutory limitations affecting the Banks. Federal and state banking laws and regulations restrict the amount of dividends and loans a bank may make to its parent company. Dividends paid by Hancock Bank are subject to approval by the Commissioner of Banking and Consumer Finance of the State of Mississippi and those paid by Hancock Bank of Louisiana are subject to approval by the Commissioner of Financial Institutions of the State of Louisiana. Dividends paid by Hancock Bank of Florida are subject to approval by the Florida Department of Financial Services and those paid by Hancock Bank of Alabama are subject to approval by Alabama State Banking Department. The amount of capital of the subsidiary banks available for dividends at December 31, 2007 was approximately $78.7 million.
Risk-based capital requirements are intended to make regulatory capital more sensitive to risk elements of the Company. Currently, the Company and its bank subsidiaries are required to maintain minimum risk-based capital ratios of 8.0%, with not less than 4.0% in Tier 1 capital. In addition, the Company and its bank subsidiaries must maintain minimum Tier 1 leverage ratios (Tier 1 capital to total average assets) of at least 3.0% based upon the regulators latest composite rating of the institution.
The Federal Deposit Insurance Corporation Improvement Act of 1991 (FDICIA) required each federal banking agency to implement prompt corrective actions for institutions that it regulates. The rules provide that an institution is “well capitalized” if its total risk-based capital ratio is 10.0% or greater, its Tier 1 risked-based capital ratio is 6.0% or greater, its leverage ratio is 5.0% or greater and the institution is not subject to a capital directive. Under this regulation, all of the subsidiary banks were deemed to be “well capitalized” as of December 31, 2007 and 2006 based upon the most recent notifications from their regulators. There are no conditions or events since those notifications that management believes would change these classifications.
The Company and its bank subsidiaries are required to maintain certain minimum capital levels. At December 31, 2007 and 2006, the Company and the Banks were in compliance with their respective statutory minimum capital requirements. Following is a summary of the actual capital levels at December 31, 2007 and 2006 (amounts in thousands):
HANCOCK HOLDING COMPANY AND SUBSIDIARIES
NOTES TO CONSOLIDATED FINANCIAL STATEMENTS
Note 9. Stockholders’ Equity (continued)
|
|
|
|
|
|
|
|
|
|
|
|
|
|
|
|
|
|
|
| ||
|
| Actual |
| Required for |
| To Be Well |
| ||||||||||||||
|
|
|
|
| |||||||||||||||||
|
| Amount |
| Ratio % |
| Amount |
| Ratio % |
| Amount |
| Ratio % |
| ||||||||
|
|
|
|
|
|
|
| ||||||||||||||
At December 31, 2007 |
|
|
|
|
|
|
|
|
|
|
|
|
|
|
|
|
|
|
| ||
Total capital (to risk weighted assets) |
|
|
|
|
|
|
|
|
|
|
|
|
|
|
|
|
|
|
| ||
Company |
| $ | 546,178 |
|
| 12.07 |
|
| $ | 361,878 |
|
| 8.00 |
| $ | N/A |
|
| N/A |
|
|
Hancock Bank |
|
| 286,646 |
|
| 12.26 |
|
|
| 187,098 |
|
| 8.00 |
|
| 233,873 |
|
| 10.00 |
|
|
Hancock Bank of Louisiana |
|
| 208,285 |
|
| 10.46 |
|
|
| 159,317 |
|
| 8.00 |
|
| 199,147 |
|
| 10.00 |
|
|
Hancock Bank of Florida |
|
| 26,928 |
|
| 18.08 |
|
|
| 11,912 |
|
| 8.00 |
|
| 14,890 |
|
| 10.00 |
|
|
Hancock Bank of Alabama* |
|
| 9,571 |
|
| 19.90 |
|
|
| 3,848 |
|
| 8.00 |
|
| 4,810 |
|
| 10.00 |
|
|
|
|
|
|
|
|
|
|
|
|
|
|
|
|
|
|
|
|
|
|
|
|
Tier 1 capital (to risk weighted assets) |
|
|
|
|
|
|
|
|
|
|
|
|
|
|
|
|
|
|
|
|
|
Company |
| $ | 498,731 |
|
| 11.03 |
|
| $ | 180,939 |
|
| 4.00 |
| $ | N/A |
|
| N/A |
|
|
Hancock Bank |
|
| 260,240 |
|
| 11.13 |
|
|
| 93,549 |
|
| 4.00 |
|
| 140,324 |
|
| 6.00 |
|
|
Hancock Bank of Louisiana |
|
| 189,324 |
|
| 9.51 |
|
|
| 79,659 |
|
| 4.00 |
|
| 119,488 |
|
| 6.00 |
|
|
Hancock Bank of Florida |
|
| 25,384 |
|
| 17.05 |
|
|
| 5,956 |
|
| 4.00 |
|
| 8,934 |
|
| 6.00 |
|
|
Hancock Bank of Alabama |
|
| 9,209 |
|
| 19.15 |
|
|
| 1,924 |
|
| 4.00 |
|
| 2,886 |
|
| 6.00 |
|
|
|
|
|
|
|
|
|
|
|
|
|
|
|
|
|
|
|
|
|
|
|
|
Tier 1 leverage capital |
|
|
|
|
|
|
|
|
|
|
|
|
|
|
|
|
|
|
|
|
|
Company |
| $ | 498,731 |
|
| 8.51 |
|
| $ | 175,801 |
|
| 3.00 |
| $ | N/A |
|
| N/A |
|
|
Hancock Bank |
|
| 260,240 |
|
| 7.97 |
|
|
| 97,968 |
|
| 3.00 |
|
| 163,281 |
|
| 5.00 |
|
|
Hancock Bank of Louisiana |
|
| 189,324 |
|
| 7.55 |
|
|
| 75,225 |
|
| 3.00 |
|
| 125,374 |
|
| 5.00 |
|
|
Hancock Bank of Florida |
|
| 25,384 |
|
| 16.79 |
|
|
| 4,536 |
|
| 3.00 |
|
| 7,560 |
|
| 5.00 |
|
|
Hancock Bank of Alabama |
|
| 9,209 |
|
| 25.33 |
|
|
| 1,091 |
|
| 3.00 |
|
| 1,818 |
|
| 5.00 |
|
|
|
|
|
|
|
|
|
|
|
|
|
|
|
|
|
|
|
|
|
|
|
|
At December 31, 2006 |
|
|
|
|
|
|
|
|
|
|
|
|
|
|
|
|
|
|
|
|
|
Total capital (to risk weighted assets) |
|
|
|
|
|
|
|
|
|
|
|
|
|
|
|
|
|
|
|
|
|
Company |
| $ | 557,222 |
|
| 13.60 |
|
| $ | 327,792 |
|
| 8.00 |
| $ | N/A |
|
| N/A |
|
|
Hancock Bank |
|
| 307,655 |
|
| 14.33 |
|
|
| 171,729 |
|
| 8.00 |
|
| 214,661 |
|
| 10.00 |
|
|
Hancock Bank of Louisiana |
|
| 200,829 |
|
| 11.23 |
|
|
| 143,037 |
|
| 8.00 |
|
| 178,797 |
|
| 10.00 |
|
|
Hancock Bank of Florida |
|
| 27,414 |
|
| 20.08 |
|
|
| 10,920 |
|
| 8.00 |
|
| 13,651 |
|
| 10.00 |
|
|
|
|
|
|
|
|
|
|
|
|
|
|
|
|
|
|
|
|
|
|
|
|
Tier 1 capital (to risk weighted assets) |
|
|
|
|
|
|
|
|
|
|
|
|
|
|
|
|
|
|
|
|
|
Company |
| $ | 510,639 |
|
| 12.46 |
|
| $ | 163,896 |
|
| 4.00 |
| $ | N/A |
|
| N/A |
|
|
Hancock Bank |
|
| 280,773 |
|
| 13.08 |
|
|
| 85,864 |
|
| 4.00 |
|
| 128,796 |
|
| 6.00 |
|
|
Hancock Bank of Louisiana |
|
| 182,835 |
|
| 10.23 |
|
|
| 71,519 |
|
| 4.00 |
|
| 107,278 |
|
| 6.00 |
|
|
Hancock Bank of Florida |
|
| 25,707 |
|
| 18.83 |
|
|
| 5,460 |
|
| 4.00 |
|
| 8,190 |
|
| 6.00 |
|
|
|
|
|
|
|
|
|
|
|
|
|
|
|
|
|
|
|
|
|
|
|
|
Tier 1 leverage capital |
|
|
|
|
|
|
|
|
|
|
|
|
|
|
|
|
|
|
|
|
|
Company |
| $ | 510,639 |
|
| 8.63 |
|
| $ | 177,575 |
|
| 3.00 |
| $ | N/A |
|
| N/A |
|
|
Hancock Bank |
|
| 280,773 |
|
| 7.98 |
|
|
| 105,513 |
|
| 3.00 |
|
| 175,855 |
|
| 5.00 |
|
|
Hancock Bank of Louisiana |
|
| 182,835 |
|
| 7.69 |
|
|
| 71,348 |
|
| 3.00 |
|
| 118,913 |
|
| 5.00 |
|
|
Hancock Bank of Florida |
|
| 25,707 |
|
| 17.77 |
|
|
| 4,340 |
|
| 3.00 |
|
| 7,233 |
|
| 5.00 |
|
|
* Hancock Bank of Alabama opened in April 2007.
2006 SAB No. 108 Adjustment to Beginning Retained Earnings
In September 2006, the SEC issued Staff Accounting Bulletin (SAB) No. 108, Considering the Effects of Prior Year Misstatements when quantifying Misstatements in Current Year Financial Statements. SAB No. 108 requires companies to evaluate the materiality of identified unadjusted errors on each financial statement and related financial
HANCOCK HOLDING COMPANY AND SUBSIDIARIES |
NOTES TO CONSOLIDATED FINANCIAL STATEMENTS |
Note 9. Stockholders’ Equity (continued) |
statement disclosure using both the rollover approach and the iron curtain approach, as those terms are defined in SAB No.108. The rollover approach quantifies misstatements based on the amount of the error in the current year consolidated statement of income, whereas the iron curtain approach quantifies misstatements based on the effects of correcting the misstatement existing in the balance sheet at the end of the current year, irrespective of the misstatement’s year(s) of origin. Financial statements would require adjustment when either approach results in quantifying a misstatement that is material. Correcting prior year financial statements for immaterial errors would not require previously filed reports to be amended. The Company elected to record the effects of applying SAB No. 108 using the cumulative effect transition method as an adjustment to fiscal 2006 beginning retained earnings. This resulted in a $2.9 million adjustment to the 2006 beginning balance of retained earnings. These adjustments related to net deferred loan fees, accrued interest receivable, equity investment in subsidiary, franchise tax payable, and income tax expense.
Note 10. Retirement and Employee Benefit Plans
At December 31, 2007, the Company had a pension plan and two postretirement plans for employees, which are described more fully below. The Company has accounted for its defined benefit pension plan using the actuarial model required by SFAS No. 87, Employers’ Accounting for Pensions. The compensation cost of an employee’s pension benefit has been recognized on the projected unit credit method over the employee’s approximate service period. The aggregate cost method has been utilized for funding purposes. The Company also sponsors two defined benefit postretirement plans, which provide medical benefits and life insurance benefits. The Company has accounted for these plans using the actuarial computations required by SFAS No. 106, Employers Accounting for Postretirement Benefits Other Than Pensions as amended by SFAS No. 132. The cost of the defined benefit postretirement plan has been recognized on the projected unit credit method over the employee’s approximate service period.
Effective December 31, 2006, the Company adopted certain requirements of SFAS No. 158, Employers’ Accounting for Defined Benefit Pension and Other Postretirement Plans – An Amendment of FASB Statements No. 87, 88, 106, and 132(R). Under SFAS No. 158, the Company is required to recognize the over funded or under funded status of a defined benefit postretirement plan as an asset or liability on its balance sheet. This pronouncement also requires the Company to recognize changes in that funded status in the year in which the changes occur through comprehensive income effective for years ending after December 15, 2006. In addition, this statement requires an employer to measure the funded status of a plan as of the date of its year-end statement of financial position effective for fiscal years ending after December 15, 2008. With the adoption of the change in measurement date of SFAS No. 158, the Company will record an $815,107 adjustment to beginning 2008 retained earnings. Results for prior periods have not been restated.
Defined Benefit Plan - Pension
The Company has a noncontributory defined benefit pension plan covering employees who have been employed by the Company one year and who have worked a minimum of 1,000 hours during the calendar year. The Company’s current policy is to contribute annually the minimum amount that can be deducted for federal income tax purposes. The benefits are based upon years of service and the employee’s compensation during the last five years of employment. The measurement date for the pension plan is September 30, 2007. Data relative to the pension plan is as follows (in thousands):
HANCOCK HOLDING COMPANY AND SUBSIDIARIES |
NOTES TO CONSOLIDATED FINANCIAL STATEMENTS |
Note 10. Retirement and Employee Benefit Plans (continued) |
|
|
|
|
|
|
|
|
|
| September 30, |
| ||||
|
|
| |||||
|
| 2007 |
| 2006 |
| ||
|
|
|
| ||||
Change in benefit obligation |
|
|
|
|
|
|
|
Benefit obligation, beginning of year |
| $ | 68,293 |
| $ | 65,191 |
|
Service cost |
|
| 2,656 |
|
| 2,304 |
|
Interest cost |
|
| 3,834 |
|
| 3,499 |
|
Actuarial loss |
|
| 1,331 |
|
| 53 |
|
Benefits paid |
|
| (2,911 | ) |
| (2,754 | ) |
|
|
|
| ||||
Benefit obligation, end of year |
| $ | 73,203 |
| $ | 68,293 |
|
|
|
|
| ||||
| |||||||
Change in plan assets |
|
|
|
|
|
|
|
Fair value of plan assets, beginning of year |
| $ | 51,935 |
| $ | 48,509 |
|
Actual return on plan assets |
|
| 6,275 |
|
| 2,584 |
|
Employer contributions |
|
| 4,695 |
|
| 3,854 |
|
Benefit payments |
|
| (2,911 | ) |
| (2,754 | ) |
Expenses |
|
| (253 | ) |
| (258 | ) |
|
|
|
| ||||
Fair value of plan assets, end of year |
| $ | 59,741 |
| $ | 51,935 |
|
|
|
|
| ||||
| |||||||
Funded status at end of year - net liability |
| $ | (13,462 | ) | $ | (16,358 | ) |
|
|
|
| ||||
| |||||||
Amounts recognized in accumulated other comprehensive income |
|
|
|
|
|
|
|
Unrecognized loss at beginning of year |
| $ | 20,307 |
| $ | 19,868 |
|
Amount of (gain)/loss recognized during the year |
|
| (1,122 | ) |
| 1,062 |
|
Gain due to changes in actuarial assumptions |
|
| (486 | ) |
| (623 | ) |
|
|
|
| ||||
Unrecognized loss at end of year |
| $ | 18,699 |
| $ | 20,307 |
|
|
|
|
| ||||
|
|
|
|
|
|
|
|
Net periodic expense is as follows (in thousands):
|
|
|
|
|
|
|
|
|
|
|
|
| Years Ended December 31, |
| |||||||
|
|
| ||||||||
|
| 2007 |
| 2006 |
| 2005 |
| |||
|
|
|
|
| ||||||
Net periodic benefit cost |
|
|
|
|
|
|
|
|
|
|
Service cost |
| $ | 2,656 |
| $ | 2,304 |
| $ | 2,153 |
|
Interest cost |
|
| 3,834 |
|
| 3,499 |
|
| 3,395 |
|
Expected return on plan assets |
|
| (4,206 | ) |
| (3,867 | ) |
| (3,410 | ) |
Amortization of prior service cost |
|
| — |
|
| — |
|
| 26 |
|
Recognized net amortization and deferral |
|
| 1,122 |
|
| 1,062 |
|
| 999 |
|
|
|
|
|
| ||||||
Net pension benefit cost |
| $ | 3,406 |
| $ | 2,998 |
| $ | 3,163 |
|
|
|
|
|
| ||||||
Other changes in plan assets and benefit obligations |
|
|
|
|
|
|
|
|
|
|
recognized in other comprehensive income, before taxes |
|
|
|
|
|
|
|
|
|
|
Net (gain)/loss |
| $ | (1,122 | ) | $ | 1,062 |
| $ | — |
|
Gain due to changes in actuarial assumptions |
|
| (486 | ) |
| (623 | ) |
| — |
|
|
|
|
|
| ||||||
Total recognized in other comprehensive income |
| $ | (1,608 | ) | $ | 439 |
| $ | — |
|
|
|
|
|
| ||||||
| ||||||||||
Total recognized in net periodic benefit cost |
|
|
|
|
|
|
|
|
|
|
and other comprehensive income |
| $ | 1,798 |
| $ | 3,437 |
| $ | 3,163 |
|
|
|
|
|
| ||||||
| ||||||||||
Weighted average assumptions as of measurement date |
|
|
|
|
|
|
|
|
|
|
Discount rate for benefit obligations |
|
| 6.31 | % |
| 5.75 | % |
| 5.50 | % |
Discount rate for net periodic benefit cost |
|
| 6.31 | % |
| 5.75 | % |
| 5.50 | % |
Expected long-term return on plan assets |
|
| 8.00 | % |
| 8.00 | % |
| 8.00 | % |
Rate of compensation increase |
|
| 4.00 | % |
| 4.00 | % |
| 3.00 | % |
HANCOCK HOLDING COMPANY AND SUBSIDIARIES
NOTES TO CONSOLIDATED FINANCIAL STATEMENTS
Note 10. Retirement and Employee Benefit Plans (continued)
The long term rate of return is determined by using the weighted-average of historical real returns for major asset classes based on target asset allocations. The result is then adjusted for inflation. The Company changed to the Citigroup Discount Pension Curve in 2007 from the Aa Seasoned Moody Twenty Year Bond Rate which was used in 2006. The Company used the Citigroup Discount Pension Curve discount rate at September 30, 2007. This curve had a duration of 15.32 years, which closely aligned with the duration of the Company’s benefit obligation of 16.22 years.
The Company has been making the contributions required by the Internal Revenue Service. The Company’s contributions to this plan were $4.6 million in 2007, $4.7 million in 2006 and $2.7 million in 2005. The Company expects to contribute $3.1 million to the pension plan in 2008. The following pension plan benefit payments, which reflect expected future service, are expected to be made (in thousands):
|
|
|
|
|
2008 |
| $ | 3,119 |
|
2009 |
|
| 3,197 |
|
2010 |
|
| 3,229 |
|
2011 |
|
| 3,405 |
|
2012 |
|
| 3,578 |
|
2013 - 2017 |
|
| 22,716 |
|
|
|
| ||
|
| $ | 39,244 |
|
|
|
|
The expected benefits to be paid are based on the same assumptions used to measure the Company’s benefit obligation at December 31, 2007.
The Company’s pension plan weighted-average asset allocations and target allocations at December 31, 2007 and 2006, by asset category, are as follows:
|
|
|
|
|
|
|
|
|
|
|
|
|
|
|
| Plan Assets |
| Target Allocation |
| ||||||||
|
|
|
| ||||||||||
Asset category |
| 2007 |
| 2006 |
| 2007 |
| 2006 |
| ||||
|
|
|
|
|
| ||||||||
Equity securities |
| 51 | % |
| 54 | % |
| 30-60 | % |
| 30-60 | % |
|
Fixed income securities |
| 44 | % |
| 45 | % |
| 40-70 | % |
| 40-70 | % |
|
Cash equivalents |
| 5 | % |
| 1 | % |
| 0-10 | % |
| 0-10 | % |
|
|
|
|
|
|
|
|
|
|
|
|
| ||
|
| 100 | % |
| 100 | % |
|
|
|
|
|
|
|
|
|
|
|
|
|
|
|
|
|
|
| ||
The investment strategy of the pension plan is to emphasize a balanced return of current income and growth of principal while accepting a moderate level of risk. The investment goal of the plan is to meet or exceed the return of balanced market index comprised of 50% of the S&P 500 Index and 50% Lehman Brothers Intermediate Aggregate Index. The pension plan investment committee meets periodically to review the policy, strategy and performance of the plan. The pension plan’s assets do not include any of the Company’s common stock at December 31, 2007 or 2006.
Defined Benefit Plan - Postretirement
The Company sponsors two defined benefit postretirement plans, other than the pension plan, that cover full-time employees who have reached 55 years of age with fifteen years of service, age 62 with twelve years of service or age 65 with ten years of service. One plan provides medical benefits and the other provides life insurance benefits. The postretirement health care plan is contributory, with retiree contributions adjusted annually and subject to certain employer contribution maximums; the life insurance plan is noncontributory.
HANCOCK HOLDING COMPANY AND SUBSIDIARIES
NOTES TO CONSOLIDATED FINANCIAL STATEMENTS
Note 10. Retirement and Employee Benefit Plans (continued)
The measurement date for the plans is December 31, 2007. The Company used a 6.40% and 5.75% discount rate for the determination of the projected postretirement benefit obligation as of December 31, 2007 and 2006, respectively. The discount rate is based on the published Aa Seasoned Moody Twenty Year Bond Rate as of the measurement date, adjusted within a band of 25 basis points. The adjustment reflects the general longer duration of liabilities under the Hancock Bank Pension Plan since the Plan does not pay lump sums in excess of $6,000.
Data relative to these postretirement benefits is as follows (in thousands):
|
|
|
|
|
|
|
|
|
| Years Ended December 31, |
| ||||
|
|
| |||||
|
| 2007 |
| 2006 |
| ||
|
|
|
| ||||
Change in postretirement benefit obligation |
|
|
|
|
|
|
|
Projected postretirement benefit obligation, beginning of year |
| $ | 7,438 |
| $ | 7,517 |
|
Service cost |
|
| 168 |
|
| 315 |
|
Interest cost |
|
| 485 |
|
| 393 |
|
Plan participants’ contributions |
|
| 286 |
|
| 156 |
|
Actuarial (gain)/loss |
|
| 1,012 |
|
| (425 | ) |
Benefit payments |
|
| (908 | ) |
| (518 | ) |
|
|
|
| ||||
Projected postretirement benefit obligation, end of year |
| $ | 8,481 |
| $ | 7,438 |
|
|
|
|
| ||||
| |||||||
Change in plan assets |
|
|
|
|
|
|
|
Plan assets, beginning of year |
| $ | — |
| $ | — |
|
Employer contributions |
|
| 622 |
|
| 362 |
|
Plan participants’ contributions |
|
| 286 |
|
| 156 |
|
Benefit payments |
|
| (908 | ) |
| (518 | ) |
|
|
|
| ||||
Plan assets, end of year |
| $ | — |
| $ | — |
|
|
|
|
| ||||
| |||||||
Funded status at end of year - net liability |
| $ | (8,481 | ) | $ | (7,438 | ) |
|
|
|
| ||||
| |||||||
Amounts recognized in other comprehensive income |
|
|
|
|
|
|
|
Net loss |
| $ | 2,476 |
| $ | 1,712 |
|
Prior service cost |
|
| (261 | ) |
| (314 | ) |
Net obligation |
|
| 21 |
|
| 26 |
|
|
|
|
| ||||
|
| $ | 2,236 |
| $ | 1,424 |
|
|
|
|
| ||||
HANCOCK HOLDING COMPANY AND SUBSIDIARIES
NOTES TO CONSOLIDATED FINANCIAL STATEMENTS
Note 10. Retirement and Employee Benefit Plans (continued)
The following table shows the composition of net period postretirement benefit cost (in thousands):
|
|
|
|
|
|
|
|
|
|
|
|
| Years Ended December 31, |
| |||||||
|
|
| ||||||||
|
| 2007 |
| 2006 |
| 2005 |
| |||
|
|
|
|
| ||||||
|
|
|
|
|
|
|
|
|
|
|
Net periodic postretirement benefit cost |
|
|
|
|
|
|
|
|
|
|
Service cost |
| $ | 168 |
| $ | 315 |
| $ | 269 |
|
Interest costs |
|
| 485 |
|
| 393 |
|
| 380 |
|
Amortization of net loss |
|
| 249 |
|
| 116 |
|
| 86 |
|
Amortization of transition obligation |
|
| 5 |
|
| 5 |
|
| 5 |
|
Amortization of prior service cost |
|
| (53 | ) |
| (53 | ) |
| (53 | ) |
|
|
|
|
| ||||||
Net periodic postretirement benefit cost |
| $ | 854 |
| $ | 776 |
| $ | 688 |
|
|
|
|
|
| ||||||
|
|
|
|
|
|
|
|
|
|
|
Other changes in plan assets and benefit obligations recognized in other comprehensive income, before taxes |
|
|
|
|
|
|
|
|
|
|
Amount of gain recognized during the year |
| $ | (249 | ) | $ | (115 | ) | $ | — |
|
(Gain)/loss due to changes in actuarial assumption |
|
| 1,012 |
|
| (426 | ) |
| — |
|
|
|
|
|
| ||||||
Total recognized in other comprehensive income |
| $ | 763 |
| $ | (541 | ) | $ | — |
|
|
|
|
|
| ||||||
|
|
|
|
|
|
|
|
|
|
|
|
|
|
|
| ||||||
Total recognized in net periodic benefit cost and other comprehensive income |
| $ | 1,617 |
| $ | 235 |
| $ | 688 |
|
|
|
|
|
| ||||||
For measurement purposes in 2007, an 8.0% annual rate of increase in the over age 65 per capita costs of covered health care benefits was assumed for 2008. The rate was assumed to decrease gradually to 5.00% over 3 years and remain at that level thereafter. In 2006, a 9.0% annual rate of increase in the over age 65 per capita costs of covered health care benefits was assumed. The rate was assumed to decrease gradually to 5.00% over 4 years and remain at that level thereafter. The health care cost trend rate assumption has an effect on the amounts reported. The following table illustrates the effect on the postretirement benefit obligation of a 1% increase or 1% decrease in the assumed health care cost trend rates:
|
|
|
|
|
|
|
|
|
|
|
|
|
|
|
|
|
|
| 1% Decrease |
| Assumed |
| 1% Increase |
| |||||||||
|
|
|
|
| ||||||||||||
Aggregated service and interest cost |
|
| $ | 585 |
|
|
| $ | 653 |
|
|
| $ | 737 |
|
|
Postretirement benefit obligation |
|
|
| 7,767 |
|
|
|
| 8,481 |
|
|
|
| 9,342 |
|
|
The Company expects to contribute $734,000 to the plans in 2008. Expected benefits to be paid over the next ten years and are reflected the following table (in thousands):
|
|
|
|
|
2008 |
| $ | 734 |
|
2009 |
|
| 675 |
|
2010 |
|
| 693 |
|
2011 |
|
| 712 |
|
2012 |
|
| 596 |
|
2013 - 2017 |
|
| 2,368 |
|
|
|
| ||
|
| $ | 5,778 |
|
|
|
|
HANCOCK HOLDING COMPANY AND SUBSIDIARIES
NOTES TO CONSOLIDATED FINANCIAL STATEMENTS
Note 10. Retirement and Employee Benefit Plans (continued)
The following table shows the amounts in accumulated other comprehensive loss that the Company expects to be recognized as net periodic benefit cost during the year ending December 31, 2008 (in thousands):
|
|
|
|
|
Prior service cost |
| $ | (53 | ) |
Net transition obligation |
|
| 5 |
|
Net loss |
|
| 136 |
|
|
|
| ||
Total |
| $ | 88 |
|
|
|
|
Defined Contribution Plan – 401(k)
The Company has a 401(k) retirement plan covering substantially all employees who have been employed 90 days excluding on call, temporary, and seasonal employees and meet certain other requirements. Under this plan, employees can contribute a portion of their salary within limits provided by the Internal Revenue Code into the plan. The Company’s contributions to this plan were $1.5 million in 2007, $1.4 million in 2006 and $1.2 million in 2005.
Nonqualified Deferred Compensation Plans
The Company has two nonqualified deferred compensation plans covering key employees who have met certain requirements. The Company’s contributions to this plan were $536,000 in 2007. There were no contributions to this plan in 2006 or 2005.
Employee Stock Purchase Plan
The Company has an employee stock purchase plan that is designed to provide the employees of the Company a convenient means of purchasing common stock of the Company. Substantially all salaried, full time employees, with the exception of Leo W. Seal, Jr., President, who have been employed by the Company 90 days excluding on call, temporary, and seasonal employees, are eligible to participate. The Company makes no contribution to each participant’s contribution. The numbers of shares purchased under this plan were 11,623 in 2007, 7,213 in 2006 and 10,461 in 2005.
The postretirement plans relating to health care payments and life insurance and the stock purchase plan are not guaranteed and are subject to immediate cancellation and/or amendment. These plans are predicated on future Company profit levels that will justify their continuance. Overall health care costs are also a factor in the level of benefits provided and continuance of these post-retirement plans. There are no vested rights under the postretirement health or life insurance plans.
Note 11. Stock-Based CompensationPayment Arrangements
At December 31, 2007, the Company had two share-based payment plans for employees, which are described below. Prior to January 1, 2006, the Company accounted for those plans under the recognition and supersedes APBmeasurement provisions of Accounting Principles Board (APB) Opinion No. 25,Accounting for Stock Issued to Employees, and its related implementation guidance. It will provide investors and other usersInterpretations, as permitted by SFAS No. 123, Accounting for Stock-Based Compensation. Compensation cost for stock options was not recognized in our Condensed Consolidated Statements of financial statements with more complete and neutral financial information by requiring thatIncome until December 2005, when the Board approved accelerated vesting for all outstanding unvested options granted to employees. No compensation cost relatingwas recognized prior to share-based payment transactions be2006 as all options granted under those plans had an exercise price equal to the market value of the underlying common stock on the date of the grant. Prior to January 1, 2006, compensation cost was recognized for restricted share awards. Effective January 1, 2006, the Company adopted the fair value recognition provisions of SFAS No. 123(R), Share-Based Payment, using the modified-prospective method. Under this method, compensation cost recognized in financial statements2006 includes: (1) compensation cost for all the Company’s share-based payments granted prior to, but not yet vested as of December 31, 2005, based on the grant date fair value estimated in accordance
HANCOCK HOLDING COMPANY AND SUBSIDIARIES
NOTES TO CONSOLIDATED FINANCIAL STATEMENTS
Note 11. Stock-Based Payment Arrangements (continued)
with the original provisions of SFAS No. 123, and (2) compensation cost for all the Company’s share-based payments granted subsequent to December 31, 2005, based on the grant date fair value estimated in accordance with the provisions of SFAS No. 123(R). Results for prior periods have not been restated.
For the years ended December 31, 2007, 2006, and 2005 total compensation cost for share-based compensation recognized in income was $1,155,000, $3,690,000, and $1,289,000, respectively. The total recognized tax benefit related to the share-based compensation was $316,000, $1,158,000, and $334,000, respectively, for years 2007, 2006 and 2005.
As a result of the equity or liability instruments issued. The Company will adoptadoption SFAS No.123(R) effectiveNo. 123(R) on January 1, 2006. The estimated effect on 2006, the Company’s income before income taxes and net income for December 31, 2006, are $3,690,000 and $2,532,000 lower, respectively, than if it had continued to account for share-based compensation under APB No. 25. Basic earnings is an increase in compensation expenseper share for 2006 would have been $3.21 if the Company had not adopted SFAS No. 123(R), compared to reported basic earnings per share of $900,000, or a reduction in$3.13. Diluted earnings per share for 2006 would have been $3.13 if the Company had not adopted SFAS No. 123(R), compared to reported diluted earnings per share of $0.03.$3.06.
Prior to the adoption of SFAS No. 123(R), the Company presented all tax benefits of deductions resulting from the exercise of stock options as operating cash flows in the Consolidated Statement of Cash Flows. SFAS 123(R) requires the cash flows resulting from the tax benefits resulting from tax deductions in excess of the compensation cost recognized for those options (excess tax benefits) to be classified as financing cash flows. The excess tax benefit classified as a financing cash inflow and classified as an operating cash outflow for the years ended December 31, 2007 and 2006 was $345,000 and $3,493,000, respectively.
The following table illustrates the effect on net income if the Company had applied the fair value recognition provisions of SFAS No. 123 to options granted in 2005. For purposes of this pro forma disclosure, the value of the options was estimated using a Black-Scholes-Merton option pricing formula and amortized to expense over the options’ vesting periods (in thousands, except per share amounts).
|
|
|
|
|
|
|
|
| Year Ended | ||||
|
| |||||
|
| December 31, 2005 |
| |||
|
|
| ||||
|
|
|
|
| ||
Net income, as reported |
|
| $ | 54,032 |
|
|
Add: stock-based employee compensation expense included in reported net income, net of related tax effects |
|
|
| 558 |
|
|
Deduct: total stock-based employee compensation expense determined under fair value based method for all awards, net of related tax effects |
|
|
| (8,954 | ) |
|
|
|
|
|
| ||
Pro forma net income |
|
| $ | 45,636 |
|
|
|
|
|
|
| ||
|
|
|
|
|
|
|
Earnings per share |
|
|
|
|
|
|
Basic - as reported |
|
| $ | 1.67 |
|
|
|
|
|
|
| ||
Basic - pro forma |
|
| $ | 1.41 |
|
|
|
|
|
|
| ||
|
|
|
|
|
|
|
Diluted - as reported |
|
| $ | 1.64 |
|
|
|
|
|
|
| ||
Diluted - pro forma |
|
| $ | 1.38 |
|
|
|
|
|
|
| ||
HANCOCK HOLDING COMPANY AND SUBSIDIARIES
NOTES TO CONSOLIDATED FINANCIAL STATEMENTS
In May 2005,Note 11. Stock-Based Payment Arrangements (continued)
Stock Option Plans
The 1996 Hancock Holding Company Long-Term Incentive Plan (the “1996 Plan”) that was approved by the FASB issued SFAS No. 154,Accounting Changes and Error Corrections. This Statement is a replacement of APB Opinion No. 20,Accounting Changes, and SFAS No. 3,Reporting Accounting ChangesCompany’s shareholders in Interim Financial Statements, and changes the requirements for the accounting for and reporting of a change in accounting principle. This Statement applies1996 was designed to all voluntary changes in accounting principle and to changes required by an accounting pronouncementprovide annual incentive stock awards. Awards as defined in the unusual instance that the pronouncement does not1996 Plan include, specific transition provisions. This statement requires retrospective application to prior periods’ financial statementswith limitations, stock options (including restricted stock options), restricted and performance shares, and performance stock awards, all on a stand-alone, combination or tandem basis. A total of changes in accounting principle, unless it is impracticable to determine period-specific effects of an accounting change on one or more individual prior periods presented. Then the new accounting principle is applied to the balances of assets and liabilities as of the beginning of the earliest period for which retrospective application is practicable and that a corresponding adjustmentfifteen million (15,000,000) common shares can be made to the opening balance of retained earnings for that period rather that being reported in an income statement. Further, the accounting principle is to be applied prospectively from the earliest date when it is impracticable to determine the effect to all prior periods. This Statement is effective for the Company as of January 1, 2006. Adoption of this statement could have an impact if there are future voluntary accounting changes and correction of errors.
The informationgranted under the caption “Asset/Liability Management” on pages 58 through 601996 Plan with an annual grant maximum of two percent (2%) of the Company’s 2005 Annual Report to Stockholders is incorporated herein by reference.
The following consolidated financial information of the Company and subsidiaries, and the report of independent registered public accounting firm, appearing on Pages 14 through 66 of the Company’s 2005 Annual Report to Stockholders is incorporated herein by reference:
Financial Highlights on Pages 14 and 15 Summary of Quarterly Operating Results and Market Information on Page 16 Management's Report on Internal Control over Financial Reporting on Page 17 Reports of Independent Registered Public Accounting Firm on Pages 18 and 19 Consolidated Balance Sheets on Page 20 Consolidated Statements of Earnings on Page 21 Consolidated Statements of Common Stockholders' Equity on Page 22 Consolidated Statements of Comprehensive Earnings on Page 23 Consolidated Statements of Cash Flows on Page 24 and 25 Notes to Consolidated Financial Statements on Pages 26 through 51 Management's Discussion and Analysis of Financial Condition And Results of Operations on Pages 52 through 66
On January 20, 2004 the Company dismissed Deloitte & Touche LLPoutstanding common stock as its independent auditors, after Deloitte & Touche LLP completed its audit of the financial statements of the Companyreported for the fiscal year endedending immediately prior to such plan year. Grants of restricted stock awards are limited to one-third of the grant totals.
The exercise price is equal to the market price on the date of grant, except for certain of those granted to major stockholders where the option price is 110 percent of the market price. Option awards generally vest based on five years of continuous service and have ten-year contractual terms. The Company’s policy is to issue new shares upon share option exercise and issue treasury shares upon restricted stock award vesting. The 1996 Long-Term Incentive Plan expired in 2006.
In March of 2005, the stockholders of the Company approved Hancock Holding Company’s 2005 Long-Term Incentive Plan (the “2005 Plan”) as the successor plan to the 1996 LTIP. The 2005 Plan is designed to enable employees and directors to obtain a proprietary interest in the Company and to attract and retain outstanding personnel.
The 2005 Plan provides that awards for up to an aggregate of five million (5,000,000) shares of the Company’s common stock may be granted during the term of the 2005 Plan. The 2005 Plan limits the number of shares for which awards may be granted during any calendar year to two percent (2%) of the outstanding Company’s common stock as reported for the fiscal year ending immediately prior to such plan year.
The fair value of each option award is estimated on the date of grant using Black-Scholes-Merton option valuation model that uses the assumptions noted in the following table. Expected volatilities are based on implied volatilities from traded options on the Company’s stock, historical volatility of the Company’s stock and other factors. The expected term of options granted is derived from the output of the option valuation model and represents the period of time that options granted are expected to be outstanding. The risk-free rate for periods within the contractual life of the option is based on the U.S. Treasury yield curve in effect at the time of grant.
|
|
|
|
|
|
|
|
|
|
|
|
| Years Ended December 31, |
| |||||||
|
|
| ||||||||
|
| 2007 |
| 2006 |
| 2005 |
| |||
|
|
|
|
| ||||||
Expected volatility |
|
| 29.02% - 30.89% |
|
| 29.87% |
|
| 31.33% |
|
Expected dividends |
|
| 2.47% - 2.52% |
|
| 1.61% - 1.96% |
|
| 2.12% |
|
Expected term (in years) |
|
| 5.6 - 9 |
|
| 5 - 8 |
|
| 5 - 8 |
|
Risk-free rates |
|
| 3.87% - 5.10% |
|
| 4.30% - 4.54% |
|
| 4.00% |
|
HANCOCK HOLDING COMPANY AND SUBSIDIARIES
NOTES TO CONSOLIDATED FINANCIAL STATEMENTS
Note 11. Stock-Based Payment Arrangements (continued)
A summary of option activity and changes under the plans for 2007 is presented below:
|
|
|
|
|
|
|
|
|
|
|
|
|
|
|
|
|
|
|
|
|
Options |
| Number of |
| Weighted- |
| Weighted- |
| Aggregate |
| |||||||||||
|
|
|
|
| ||||||||||||||||
|
|
|
|
|
|
|
|
|
|
|
|
|
|
| ||||||
Outstanding at January 1, 2007 |
|
| 1,509,948 |
|
|
| $ | 27.04 |
|
|
|
|
|
|
|
|
|
|
|
|
Granted |
|
| 99,407 |
|
|
| $ | 38.86 |
|
|
|
|
|
|
|
|
|
|
|
|
Exercised |
|
| (232,382 | ) |
|
| $ | 19.23 |
|
|
|
|
|
|
|
| $ | 5,151 |
|
|
Forfeited or expired |
|
| (31,640 | ) |
|
| $ | 36.44 |
|
|
|
|
|
|
|
|
|
|
|
|
|
|
|
|
|
|
|
|
|
|
|
|
|
|
|
|
|
|
| ||
Outstanding at December 31, 2007 |
|
| 1,345,333 |
|
|
| $ | 29.04 |
|
|
|
| 6.1 |
|
|
| $ | 13,432 |
|
|
|
|
|
|
|
|
|
|
|
|
|
|
| ||||||||
Exercisable at December 31, 2007 |
|
| 1,001,360 |
|
|
| $ | 25.03 |
|
|
|
| 5.2 |
|
|
| $ | 13,432 |
|
|
|
|
|
|
|
|
|
|
|
|
|
|
| ||||||||
Share options expected to vest |
|
| 297,874 |
|
|
| $ | 40.70 |
|
|
|
| 8.6 |
|
|
| $ | 123 |
|
|
|
|
|
|
|
|
|
|
|
|
|
|
| ||||||||
The weighted-average grant-date fair values of options granted during 2007, 2006, and 2005 were $12.14, $14.21, and $13.43, respectively, per optioned share. The total intrinsic value of options exercised during 2007, 2006 and 2005 was $5.2 million, $8.2 million, and $2.3 million, respectively.
A summary of the status of the Company’s nonvested shares as of December 31, 2003.2007, and changes during 2007, is presented below:
|
|
|
|
|
|
|
|
|
|
|
|
| Number of |
| Weighted- |
| |||||
|
|
|
| |||||||
|
|
|
|
|
| |||||
Nonvested at January 1, 2007 |
|
| 522,520 |
|
|
| $ | 20.42 |
|
|
Granted |
|
| 167,035 |
|
|
| $ | 22.66 |
|
|
Vested |
|
| (75,955 | ) |
|
| $ | 15.23 |
|
|
Forfeited |
|
| (26,535 | ) |
|
| $ | 20.51 |
|
|
|
|
|
|
|
|
|
|
| ||
Nonvested at December 31, 2007 |
|
| 587,065 |
|
|
| $ | 21.72 |
|
|
|
|
|
|
|
|
|
|
| ||
As of December 31, 2007, there was $7.9 million of total unrecognized compensation cost related to nonvested share-based compensation arrangements granted under the plans. That cost is expected to be recognized over a weighted-average period of 3.3 years. The Audit Committeetotal fair value of shares which vested during 2007 and 2006 was $1.2 million and $153 thousand, respectively.
During 2005, the Board of Directors of the Company approved the decisionaccelerated vesting of all outstanding unvested options granted to change auditors.employees. The Company used guidance provided in FASB Interpretation No. 44 (FIN 44), Accounting for Certain Transactions Involving Stock Compensation, in the determination of the expense associated with the accelerated vesting of the unvested options outstanding. Compensation expense was calculated as the difference between the grant price and the current market price on the date of the vesting. Forfeiture rates were calculated based on observation of historical trends. The impact of this action was a reduction in 2005 pretax income of approximately $558,000. The acceleration of the vesting of these options allowed the Company to avoid future compensation expense estimated to be approximately $6.4 million.
HANCOCK HOLDING COMPANY AND SUBSIDIARIES
NOTES TO CONSOLIDATED FINANCIAL STATEMENTS
DuringNote 12. Fair Value of Financial Instruments
The following methods and assumptions were used to estimate the two fiscal years endedfair value of each class of financial instruments for which it is practicable to estimate:
Cash, Short-Term Investments and Federal Funds Sold - For those short-term instruments, the carrying amount is a reasonable estimate of fair value.
Securities - Estimated fair values for securities are based on quoted market prices where available. If quoted market prices are not available, estimated fair values are based on market prices of comparable instruments.
Loans, Net of Unearned Income - The fair value of loans is estimated by discounting the future cash flows using the current rates for similar loans with the same remaining maturities.
Accrued Interest Receivable and Accrued Interest Payable– The carrying amounts are a reasonable estimate of their fair values.
Deposits – SFAS No. 107 requires that the fair value of deposits with no stated maturity, such as noninterest-bearing demand deposits, interest-bearing checking and savings accounts, be assigned fair values equal to amounts payable upon demand (carrying amounts). The fair value of fixed-maturity certificates of deposit is estimated using the rates currently offered for deposits of similar remaining maturities.
Federal Funds Purchased - For these short-term liabilities, the carrying amount is a reasonable estimate of fair value.
Securities Sold under Agreements to Repurchase and Federal Funds Purchased – For these short-term liabilities, the carrying amount is a reasonable estimate of fair value.
Long-Term Notes - Rates currently available to the Company for debt with similar terms and remaining maturities are used to estimate fair value of existing debt. The fair value is estimated by discounting the future contractual cash flows using current market rates at which similar Notes over the same remaining term could be obtained.
Commitments - The fair value of loan commitments and letters of credit approximate the fees currently charged for similar agreements or the estimated cost to terminate or otherwise settle similar obligations. The fees associated with these financial instruments, or the estimated cost to terminate, as applicable are immaterial.
HANCOCK HOLDING COMPANY AND SUBSIDIARIES
NOTES TO CONSOLIDATED FINANCIAL STATEMENTS
Note 12. Fair Value of Financial Instruments (continued)
The estimated fair values of the Company’s financial instruments were as follows (in thousands):
|
|
|
|
|
|
|
|
|
|
|
|
|
|
|
| December 31, |
| ||||||||||
|
|
| |||||||||||
|
| 2007 |
| 2006 |
| ||||||||
|
|
|
| ||||||||||
|
| Carrying |
| Fair |
| Carrying |
| Fair |
| ||||
|
|
|
|
|
| ||||||||
Financial assets: |
|
|
|
|
|
|
|
|
|
|
|
|
|
Cash, interest-bearing deposits and federal funds sold |
| $ | 308,896 |
| $ | 308,896 |
| $ | 412,553 |
| $ | 412,553 |
|
Securities |
|
| 1,677,621 |
|
| 1,677,621 |
|
| 1,903,658 |
|
| 1,903,658 |
|
Loans, net of unearned income |
|
| 3,615,514 |
|
| 3,828,989 |
|
| 3,266,584 |
|
| 3,360,368 |
|
Accrued interest receivable |
|
| 35,117 |
|
| 35,117 |
|
| 33,700 |
|
| 33,700 |
|
|
|
|
|
|
|
|
|
|
|
|
|
|
|
Financial liabilities: |
|
|
|
|
|
|
|
|
|
|
|
|
|
Deposits |
| $ | 5,009,534 |
| $ | 5,026,639 |
| $ | 5,030,991 |
| $ | 5,021,479 |
|
Federal funds purchased |
|
| 4,100 |
|
| 4,100 |
|
| 3,800 |
|
| 3,800 |
|
Securities sold under agreements to repurchase |
|
| 371,604 |
|
| 371,604 |
|
| 218,591 |
|
| 218,591 |
|
Long-term notes |
|
| 793 |
|
| 793 |
|
| 258 |
|
| 258 |
|
Accrued interest payable |
|
| 9,105 |
|
| 9,105 |
|
| 8,222 |
|
| 8,222 |
|
Note 13. Commitments and Contingencies
Lending Related
In the normal course of business, the Company enters into financial instruments, such as commitments to extend credit and letters of credit, to meet the financing needs of its customers. Such instruments are not reflected in the accompanying consolidated financial statements until they are funded and involve, to varying degrees, elements of credit risk not reflected in the consolidated balance sheets. The contract amounts of these instruments reflect the Company’s exposure to credit loss in the event of non-performance by the other party on whose behalf the instrument has been issued. The Company undertakes the same credit evaluation in making commitments and conditional obligations as it does for on-balance sheet instruments and may require collateral or other credit support for off-balance sheet financial instruments. These obligations are summarized below (in thousands):
|
|
|
|
|
|
|
|
|
| December 31, |
| ||||
|
|
| |||||
|
| 2007 |
| 2006 |
| ||
|
|
|
| ||||
Commitments to extend credit |
| $ | 1,110,935 |
| $ | 963,098 |
|
Letters of credit |
|
| 86,969 |
|
| 69,468 |
|
Approximately $524.7 million and $455.6 million of commitments to extend credit at December 31, 20032007 and 20022006, respectively, were at variable rates and the interim period from January 1, 2004remainder was at fixed rates. A commitment to January 20, 2004, there were no disagreements betweenextend credit is an agreement to lend to a customer as long as the conditions established in the agreement have been satisfied. A commitment to extend credit generally has a fixed expiration date or other termination clauses and may require payment of a fee by the borrower. Since commitments often expire without being fully drawn, the total commitment amounts do not necessarily represent future cash requirements of the Company. The Company continually evaluates each customer’s credit worthiness on a case-by-case basis. Occasionally, a credit evaluation of a customer requesting a commitment to extend credit results in the Company obtaining collateral to support the obligation.
HANCOCK HOLDING COMPANY AND SUBSIDIARIES
NOTES TO CONSOLIDATED FINANCIAL STATEMENTS
Note 13. Commitments and Deloitte & Touche LLP on any matterContingencies (continued)
Letters of accounting principles or practices, financial statement disclosure, or auditing scope or procedure, which disagreements, ifcredit are conditional commitments issued by the Company to guarantee the performance of a customer to a third party. The credit risk involved in issuing a letter of credit is essentially the same as that involved in extending a loan. The Company accounts for these commitments under the provisions of the FASB Interpretation No. 45, Guarantors Accounting and Disclosure Requirements, Including Indirect Guarantees of Indebtedness of Others. The liability associated with letters of credit is not resolved to Deloitte & Touche LLP’s satisfaction, would have caused Deloitte & Touche LLP to make a referencematerial to the subject matterCompany’s consolidated financial statements. Letters of credit are supported by collateral or borrower guarantee sufficient to cover any draw on the letter that would result in an outstanding loan.
Visa Litigation
In October 2007, Hancock Bank, as a member of Visa U.S.A. Inc. “Visa U.S.A.”, received shares of restricted stock in Visa, Inc. “Visa” as a result of its participation in the global restructuring of Visa U.S.A., Visa Canada Association, and Visa International Service Association in preparation for an initial public offering. On November 7, 2007, Visa announced that it had reached a settlement with American Express related to an antitrust lawsuit in the amount of $2.065 billion. As reported by Visa in a Current Report on Form 8-K filed with the Securities and Exchange Commission on November 13, 2007, the settlement became effective upon receipt of the disagreementsrequisite approval of Visa U.S.A. members on November 9, 2007. Hancock Bank and other Visa U.S.A. member banks are obligated to share in their reportspotential losses resulting from this and certain other litigation. In consideration of the announced American Express settlement and additional VISA litigation disclosed in VISA’s 2007 Form 10-K, and Hancock Bank’s proportionate membership share of Visa U.S.A., Hancock Bank recorded in the fourth quarter of 2007 in accordance with FASB Interpretation No. 45, Guarantors Accounting and Disclosure Requirements, Including Indirect Guarantees of Indebtedness of Others, a liability and corresponding pre-tax expense of approximately $2.45 million. The expense is included in Other Expense on the financial statements for such years.
DuringConsolidated Statement of Income and the two most recent fiscal years priorliability is included in Other Liabilities on the Consolidated Balance Sheet. As disclosed in Visa’s Form 8-K filed with the SEC on November 7, 2007, Visa intends that payments related to the dismissalabove litigation matters will be funded from an escrow account to be established with a portion of Deloitte & Touche, LLP and the interim periodproceeds from January 1, 2004its planned initial public offering. Hancock Bank currently anticipates that its proportional share of the proceeds of the planned initial public offering by Visa will more than offset any liabilities related to January 20, 2004, Deloitte & Touche LLP’s reportsVisa litigation.
Legal Proceedings
The Company is party to various legal proceedings arising in the ordinary course of business. In the opinion of management, after consultation with legal counsel, all such matters are not expected to have a material adverse effect on the financial statements of the Company did not contain an adverse opinionCompany.
Lease Commitments
Hancock currently has capital and operating leases for buildings and equipment that expire from 2008 to 2049. It is expected that certain leases will be renewed or equipment replaced as leases expire. Certain of these leases have escalation clauses that are being amortized on a disclaimer of opinion, and were not qualified or modified to uncertainty, audit scope, or accounting principles.
Duringstraight-line basis over the two most recent fiscal years and the interim period from January 1, 2006 to February 23, 2006, the Company did not consult with Deloitte & Touche LLP regarding anyterm of the matterslease as required by SFAS No. 13, Accounting for Leases. Future minimum lease payments for all non-cancelable capital and operating leases with initial or events set forth in Item 304(a)(1)(v)remaining terms of Regulation S-K.
On January 20, 2004,one year or more consisted of the Board of Directors appointed KPMG LLP, an independent registered public accounting firm, as auditors for the fiscal year endingfollowing at December 31, 2004,2007 (in thousands):
HANCOCK HOLDING COMPANY AND SUBSIDIARIES
NOTES TO CONSOLIDATED FINANCIAL STATEMENTS
Note 13. Commitments and until their successors are selected. The Audit Committee ofContingencies (continued)
|
|
|
|
|
|
|
|
|
|
|
|
|
| Captial Leases |
| Operating Leases |
| ||||||
|
|
|
| ||||||||
2008 |
|
| $ | 144 |
|
|
| $ | 4,823 |
|
|
2009 |
|
|
| 152 |
|
|
|
| 4,268 |
|
|
2010 |
|
|
| 81 |
|
|
|
| 3,501 |
|
|
2011 |
|
|
| 26 |
|
|
|
| 2,248 |
|
|
2012 |
|
|
| 28 |
|
|
|
| 1,738 |
|
|
Thereafter |
|
|
| 114 |
|
|
|
| 5,092 |
|
|
|
|
|
|
|
|
|
| ||||
Total minimum lease payments |
|
|
| 545 |
|
|
| $ | 21,670 |
|
|
|
|
|
|
|
|
|
|
|
| ||
Amounts representing interest |
|
|
| 147 |
|
|
|
|
|
|
|
|
|
|
|
|
|
|
|
|
| ||
Present value of net minimum lease |
|
| $ | 398 |
|
|
|
|
|
|
|
|
|
|
|
|
|
|
|
|
| ||
Rental expense approximated $6.4 million, $5 million, and $4.1 million for the Company’s Board of Directors approved the decision to change auditors.
The Company has been advised that neither KPMG LLP nor any of its partners has any direct or any material indirect financial interest in the securities of the Company or any of its subsidiaries, except as auditors and consultants on accounting procedures and tax matters. Additionally, during the two fiscal years ended December 31, 20032007, 2006, and 2002, there2005, respectively.
Note 14. Other Noninterest Income and Other Noninterest Expense
The components of other noninterest income and other noninterest expense are as follows (in thousands):
|
|
|
|
|
|
|
|
|
|
|
|
| Years Ended December 31, |
| |||||||
|
|
| ||||||||
|
| 2007 |
| 2006 |
| 2005 |
| |||
|
|
|
|
| ||||||
Other noninterest income: |
|
|
|
|
|
|
|
|
|
|
Income from bank owned life insurance |
| $ | 4,912 |
| $ | 4,091 |
| $ | 3,449 |
|
Outsourced check income |
|
| 2,288 |
|
| 2,801 |
|
| 1,345 |
|
Income on real estate option |
|
| — |
|
| 859 |
|
| 1,145 |
|
Safety deposit box income |
|
| 794 |
|
| 842 |
|
| 807 |
|
Appraisal fee income |
|
| 926 |
|
| 852 |
|
| 694 |
|
Other |
|
| 5,661 |
|
| 3,912 |
|
| 4,942 |
|
|
|
|
|
| ||||||
Total other noninterest income |
| $ | 14,581 |
| $ | 13,357 |
| $ | 12,382 |
|
|
|
|
|
| ||||||
|
|
|
|
|
|
|
|
|
|
|
Other noninterest expense: |
|
|
|
|
|
|
|
|
|
|
Postage |
| $ | 3,851 |
| $ | 3,731 |
| $ | 3,780 |
|
Communication |
|
| 6,602 |
|
| 5,918 |
|
| 4,040 |
|
Data processing |
|
| 15,195 |
|
| 11,531 |
|
| 7,824 |
|
Professional fees |
|
| 15,234 |
|
| 13,968 |
|
| 10,410 |
|
Taxes and licenses |
|
| 3,514 |
|
| 3,346 |
|
| 3,607 |
|
Printing and supplies |
|
| 2,252 |
|
| 1,997 |
|
| 1,787 |
|
Marketing |
|
| 7,032 |
|
| 6,642 |
|
| 5,232 |
|
Regulatory and other fees |
|
| 4,433 |
|
| 5,513 |
|
| 3,663 |
|
Miscellaneous expense |
|
| 10,522 |
|
| 9,927 |
|
| 8,578 |
|
Other expense |
|
| 7,209 |
|
| 8,119 |
|
| 5,791 |
|
|
|
|
|
| ||||||
Total other noninterest expense |
| $ | 75,844 |
| $ | 70,692 |
| $ | 54,712 |
|
|
|
|
|
| ||||||
HANCOCK HOLDING COMPANY AND SUBSIDIARIES
NOTES TO CONSOLIDATED FINANCIAL STATEMENTS
Note 15. Income Taxes
Income taxes consisted of the following components (in thousands):
|
|
|
|
|
|
|
|
|
|
|
|
| Years Ended December 31, |
| |||||||
|
|
| ||||||||
|
| 2007 |
| 2006 |
| 2005 |
| |||
|
|
|
|
| ||||||
Current federal |
| $ | 19,150 |
| $ | 19,879 |
| $ | 34,183 |
|
Current state |
|
| 1,209 |
|
| 2,066 |
|
| 3,089 |
|
|
|
|
|
| ||||||
Total current provision |
|
| 20,359 |
|
| 21,945 |
|
| 37,272 |
|
|
|
|
|
| ||||||
|
|
|
|
|
|
|
|
|
|
|
Deferred federal |
|
| 6,264 |
|
| 22,641 |
|
| (14,864 | ) |
Deferred state |
|
| 1,296 |
|
| 1,958 |
|
| (3,537 | ) |
|
|
|
|
| ||||||
Total deferred provision (benefit) |
|
| 7,560 |
|
| 24,599 |
|
| (18,401 | ) |
|
|
|
|
| ||||||
Total tax expense |
| $ | 27,919 |
| $ | 46,544 |
| $ | 18,871 |
|
|
|
|
|
| ||||||
Deferred income taxes reflect the net tax effects of temporary differences between the carrying amounts of assets and liabilities for financial reporting purposes and the amounts used for income tax reporting purposes. Significant components of the Company’s deferred tax assets and liabilities were as follows (in thousands):
|
|
|
|
|
|
|
|
|
| December 31, |
| ||||
|
|
| |||||
|
| 2007 |
| 2006 |
| ||
|
|
|
| ||||
Deferred tax assets |
|
|
|
|
|
|
|
Pension liability |
| $ | 8,787 |
| $ | 9,123 |
|
Postretirement benefit obligation |
|
| 3,084 |
|
| 2,187 |
|
Allowance for loan losses |
|
| 17,420 |
|
| 17,321 |
|
Deferred compensation |
|
| 3,725 |
|
| 1,658 |
|
Unrealized loss on securities available for sale |
|
| — |
|
| 4,579 |
|
VISA settlement |
|
| 858 |
|
| — |
|
Stock compensation |
|
| 1,151 |
|
| 812 |
|
Other |
|
| 644 |
|
| — |
|
|
|
|
| ||||
Gross deferred tax assets |
|
| 35,669 |
|
| 35,680 |
|
|
|
|
| ||||
|
|
|
|
|
|
|
|
Deferred tax liabilities |
|
|
|
|
|
|
|
Pension contribution |
|
| (2,938 | ) |
| (2,486 | ) |
Loan servicing assets |
|
| (209 | ) |
| (360 | ) |
Property and equipment depreciation |
|
| (22,862 | ) |
| (7,552 | ) |
Other intangible assets |
|
| (2,770 | ) |
| (2,984 | ) |
Discount accretion on securities, net |
|
| (656 | ) |
| (3,412 | ) |
Prepaid expenses |
|
| (2,164 | ) |
| (1,525 | ) |
Unrealized (gain) on securities available for sale |
|
| (94 | ) |
| — |
|
Other |
|
| — |
|
| (817 | ) |
|
|
|
| ||||
Gross deferred tax liabilities |
|
| (31,693 | ) |
| (19,136 | ) |
|
|
|
| ||||
Net deferred tax asset |
| $ | 3,976 |
| $ | 16,544 |
|
|
|
|
| ||||
The deferred tax assets above are net of an immaterial valuation allowance due to miscellaneous state net operating losses. Other than these items, no valuation allowance related to deferred tax assets has been recorded on December 31, 2007 and 2006, as management believes it is more likely than not that the remaining deferred tax assets will be fully utilized.
HANCOCK HOLDING COMPANY AND SUBSIDIARIES
NOTES TO CONSOLIDATED FINANCIAL STATEMENTS
Note 15. Income Taxes (continued)
The reason for differences in income taxes reported compared to amounts computed by applying the statutory income tax rate of 35% to earnings before income taxes were as follows (in thousands):
|
|
|
|
|
|
|
|
|
|
|
|
|
|
|
|
|
|
|
|
|
|
|
|
|
|
|
| Years Ended December 31, |
| ||||||||||||||||||||||
|
|
| |||||||||||||||||||||||
|
| 2007 |
| 2006 |
| 2005 |
| ||||||||||||||||||
|
|
|
|
| |||||||||||||||||||||
|
| Amount |
| % |
| Amount |
| % |
| Amount |
| % |
| ||||||||||||
|
|
|
|
|
|
|
| ||||||||||||||||||
Taxes computed at statutory rate |
| $ | 35,634 |
|
|
| 35 | % |
| $ | 51,921 |
|
|
| 35 | % |
| $ | 25,526 |
|
|
| 35 | % |
|
Increases (decreases) in taxes resulting from: |
|
|
|
|
|
|
|
|
|
|
|
|
|
|
|
|
|
|
|
|
|
|
|
|
|
State income taxes, net of federal income tax benefit |
|
| 1,628 |
|
|
| 2 | % |
|
| 2,616 |
|
|
| 2 | % |
|
| 1,059 |
|
|
| 1 | % |
|
Tax-exempt interest |
|
| (5,072 | ) |
|
| -5 | % |
|
| (4,311 | ) |
|
| -3 | % |
|
| (4,105 | ) |
|
| -5 | % |
|
Bank owned life insurance |
|
| (1,807 | ) |
|
| -2 | % |
|
| (1,417 | ) |
|
| -1 | % |
|
| (1,279 | ) |
|
| -2 | % |
|
Tax credits |
|
| (3,510 | ) |
|
| -3 | % |
|
| (2,357 | ) |
|
| -2 | % |
|
| (674 | ) |
|
| -1 | % |
|
Other, net |
|
| 1,046 |
|
|
| 1 | % |
|
| 92 |
|
|
| — |
|
|
| (1,656 | ) |
|
| -2 | % |
|
|
|
|
|
|
|
|
|
|
|
|
|
|
| ||||||||||||
Income tax expense |
| $ | 27,919 |
|
|
| 28 | % |
| $ | 46,544 |
|
|
| 31 | % |
| $ | 18,871 |
|
|
| 26 | % |
|
|
|
|
|
|
|
|
|
|
|
|
|
|
| ||||||||||||
Due to recent tax legislation following Hurricane Katrina, tax credits available to the Company for the 2007 and 2006 tax years include the Worker’s Opportunity Tax Credit and the Gulf Tax Credit.
FIN 48
The Company adopted FASB Interpretation No. 48, Accounting for Uncertainty in Income Taxes, An Interpretation of FASB Statement No. 109 (“FIN 48”), on January 1, 2007 and determined that no adjustment was required to retained earnings due to the adoption of this Interpretation. There were no consultations betweenmaterial uncertain tax positions at December 31, 2007. The Company does not expect that unrecognized tax benefits will significantly increase or decrease within the Company and KPMG LLP regarding application of accounting principles, the type of audit opinion that might be issued onnext 12 months.
It is the Company’s financial statements, or on any other matter.
Although not requiredpolicy to do so,recognize interest and penalties accrued relative to unrecognized tax benefits in income tax expense. As of December 31, 2007, the Board of Directors chose to submit its appointment of KPMG LLP for ratification by the Company’s shareholders. This matter was submittedinterest accrued is considered immaterial to the Company’s shareholdersconsolidated balance sheet.
The Company and its subsidiaries file a consolidated U.S. federal income tax return, as well as filing various returns in the states where its banking offices are located. Its filed income tax returns are no longer subject to examination by taxing authorities for ratification duringyears before 2004.
HANCOCK HOLDING COMPANY AND SUBSIDIARIES
NOTES TO CONSOLIDATED FINANCIAL STATEMENTS
Note 16. Earnings Per Share
Following is a summary of the information used in the computation of earnings per common share (in thousands):
|
|
|
|
|
|
|
|
|
|
|
|
| Years Ended December 31, |
| |||||||
|
|
| ||||||||
|
| 2007 |
| 2006 |
| 2005 |
| |||
|
|
|
|
| ||||||
Net income available to common stockholders - used in computation of basic and diluted earnings per common share |
| $ | 73,892 |
| $ | 101,802 |
| $ | 54,032 |
|
|
|
|
|
| ||||||
Weighted average number of common shares outstanding - used in computation of basic earnings per common share |
|
| 32,000 |
|
| 32,534 |
|
| 32,365 |
|
|
|
|
|
|
|
|
|
|
|
|
Effect of dilutive securities |
|
| 545 |
|
| 770 |
|
| 601 |
|
|
|
|
|
| ||||||
Weighted average number of common shares outstanding plus effect of dilutive securities - used in computation of diluted earnings per common share |
|
| 32,545 |
|
| 33,304 |
|
| 32,966 |
|
|
|
|
|
| ||||||
The Company had no shares of anti-dilutive options in 2007 and 55,398 anti-dilutive options in 2006. There were no anti-dilutive options in 2005.
Note 17. Segment Reporting
The Company’s primary segments are geographically divided into the Mississippi (MS), Louisiana (LA), Florida (FL) and Alabama (AL) markets. Each segment offers the same products and services but is managed separately due to different pricing, product demand and consumer markets. The three segments offer commercial, consumer and mortgage loans and deposit services. In all tables, the column “Other” includes additional consolidated subsidiaries of the Company: Hancock Investment Services, Inc., Hancock Insurance Agency, Inc., Harrison Finance Company, Magna Insurance Company and three real estate corporations owning land and buildings that house bank branches and other facilities. Following is selected information for the Company’s annual meeting heldsegments (in thousands):
HANCOCK HOLDING COMPANY AND SUBSIDIARIES
NOTES TO CONSOLIDATED FINANCIAL STATEMENTS
Note 17. Segment Reporting (continued)
|
|
|
|
|
|
|
|
|
|
|
|
|
|
|
|
|
|
|
|
|
|
|
|
|
|
|
|
| Year Ended |
| |||||||||||||||||||||||
|
|
| ||||||||||||||||||||||||
|
| MS |
| LA |
| FL |
| AL |
| Other |
| Eliminations |
| Consolidated |
| |||||||||||
|
|
|
|
|
|
|
|
| ||||||||||||||||||
|
| (In thousands) |
| |||||||||||||||||||||||
Interest income |
| $ | 179,930 |
| $ | 148,721 |
| $ | 9,583 |
| $ | 1,238 |
| $ | 25,769 |
|
| $ | (19,376 | ) |
|
| $ | 345,865 |
|
|
Interest expense |
|
| 79,189 |
|
| 66,699 |
|
| 5,023 |
|
| 462 |
|
| 7,779 |
|
|
| (18,916 | ) |
|
|
| 140,236 |
|
|
|
|
|
|
|
|
|
|
|
|
|
|
| ||||||||||||||
Net interest income |
|
| 100,741 |
|
| 82,022 |
|
| 4,560 |
|
| 776 |
|
| 17,990 |
|
|
| (460 | ) |
|
|
| 205,629 |
|
|
Provision for (reversal of) loan losses |
|
| (22 | ) |
| 3,744 |
|
| 427 |
|
| 400 |
|
| 3,044 |
|
|
| — |
|
|
|
| 7,593 |
|
|
Noninterest income |
|
| 51,433 |
|
| 36,875 |
|
| 849 |
|
| 47 |
|
| 28,967 |
|
|
| (42 | ) |
|
|
| 118,129 |
|
|
Depreciation and amortization |
|
| 9,665 |
|
| 3,323 |
|
| 452 |
|
| 54 |
|
| 545 |
|
|
| — |
|
|
|
| 14,039 |
|
|
Other noninterest expense |
|
| 87,426 |
|
| 70,837 |
|
| 5,576 |
|
| 1,559 |
|
| 36,511 |
|
|
| (1,594 | ) |
|
|
| 200,315 |
|
|
|
|
|
|
|
|
|
|
|
|
|
|
| ||||||||||||||
Income before income taxes |
|
| 55,105 |
|
| 40,993 |
|
| (1,046 | ) |
| (1,190 | ) |
| 6,857 |
|
|
| 1,092 |
|
|
|
| 101,811 |
|
|
Income tax expense (benefit) |
|
| 15,788 |
|
| 10,458 |
|
| (603 | ) |
| (399 | ) |
| 2,675 |
|
|
| — |
|
|
|
| 27,919 |
|
|
|
|
|
|
|
|
|
|
|
|
|
|
| ||||||||||||||
Net income (loss) |
| $ | 39,317 |
| $ | 30,535 |
| $ | (443 | ) | $ | (791 | ) | $ | 4,182 |
|
| $ | 1,092 |
|
|
| $ | 73,892 |
|
|
|
|
|
|
|
|
|
|
|
|
|
|
| ||||||||||||||
|
|
|
|
|
|
|
|
|
|
|
|
|
|
|
|
|
|
|
|
|
|
|
|
|
|
|
Total assets |
| $ | 3,351,986 |
| $ | 2,512,200 |
| $ | 168,790 |
| $ | 48,619 |
| $ | 815,011 |
|
| $ | (840,627 | ) |
|
| $ | 6,055,979 |
|
|
|
|
|
|
|
|
|
|
|
|
|
|
|
|
|
|
|
|
|
|
|
|
|
|
|
|
|
Total interest income from affiliates |
| $ | 19,327 |
| $ | — |
| $ | — |
| $ | 49 |
| $ | — |
|
| $ | (19,376 | ) |
|
| $ | — |
|
|
|
|
|
|
|
|
|
|
|
|
|
|
|
|
|
|
|
|
|
|
|
|
|
|
|
|
|
Total interest income from external customers |
| $ | 160,603 |
| $ | 148,721 |
| $ | 9,583 |
| $ | 1,189 |
| $ | 25,769 |
|
| $ | — |
|
|
| $ | 345,865 |
|
|
|
|
|
|
|
|
|
|
|
|
|
|
|
|
|
|
|
|
|
|
|
|
|
|
|
|
|
(Amortization) & accretion of securities |
| $ | (868 | ) | $ | (974 | ) | $ | 44 |
| $ | 1 |
| $ | 13 |
|
| $ | — |
|
|
| $ | (1,784 | ) |
|
HANCOCK HOLDING COMPANY AND SUBSIDIARIES
NOTES TO CONSOLIDATED FINANCIAL STATEMENTS
Note 17. Segment Reporting (continued)
|
|
|
|
|
|
|
|
|
|
|
|
|
|
|
|
|
|
|
|
|
|
|
|
|
| Year Ended |
| ||||||||||||||||||||
|
|
| |||||||||||||||||||||
|
| MS |
| LA |
| FL |
| Other |
| Eliminations |
| Consolidated |
| ||||||||||
|
|
|
|
|
|
|
| ||||||||||||||||
|
| (In thousands) |
| ||||||||||||||||||||
Interest income |
| $ | 193,698 |
| $ | 136,844 |
| $ | 8,108 |
| $ | 20,270 |
|
| $ | (14,590 | ) |
|
| $ | 344,330 |
|
|
Interest expense |
|
| 72,154 |
|
| 52,833 |
|
| 2,934 |
|
| 6,103 |
|
|
| (14,161 | ) |
|
|
| 119,863 |
|
|
|
|
|
|
|
|
|
|
|
|
|
| ||||||||||||
Net interest income |
|
| 121,544 |
|
| 84,011 |
|
| 5,174 |
|
| 14,167 |
|
|
| (429 | ) |
|
|
| 224,467 |
|
|
Provision for (reversal of) loan losses |
|
| (19,811 | ) |
| (4,446 | ) |
| 834 |
|
| 2,661 |
|
|
| — |
|
|
|
| (20,762 | ) |
|
Noninterest income |
|
| 47,844 |
|
| 29,782 |
|
| 346 |
|
| 25,966 |
|
|
| (105 | ) |
|
|
| 103,833 |
|
|
Depreciation and amortization |
|
| 6,986 |
|
| 2,611 |
|
| 319 |
|
| 527 |
|
|
| — |
|
|
|
| 10,443 |
|
|
Other noninterest expense |
|
| 89,978 |
|
| 61,688 |
|
| 5,172 |
|
| 33,479 |
|
|
| (44 | ) |
|
|
| 190,273 |
|
|
|
|
|
|
|
|
|
|
|
|
|
| ||||||||||||
Income before income taxes |
|
| 92,235 |
|
| 53,940 |
|
| (805 | ) |
| 3,466 |
|
|
| (490 | ) |
|
|
| 148,346 |
|
|
Income tax expense (benefit) |
|
| 23,074 |
|
| 24,035 |
|
| (603 | ) |
| (796 | ) |
|
| 834 |
|
|
|
| 46,544 |
|
|
|
|
|
|
|
|
|
|
|
|
|
| ||||||||||||
Net income (loss) |
| $ | 69,161 |
| $ | 29,905 |
| $ | (202 | ) | $ | 4,262 |
|
| $ | (1,324 | ) |
|
| $ | 101,802 |
|
|
|
|
|
|
|
|
|
|
|
|
|
| ||||||||||||
|
|
|
|
|
|
|
|
|
|
|
|
|
|
|
|
|
|
|
|
|
|
|
|
Total assets |
| $ | 3,454,274 |
| $ | 2,365,422 |
| $ | 158,836 |
| $ | 807,912 |
|
| $ | (821,879 | ) |
|
| $ | 5,964,565 |
|
|
|
|
|
|
|
|
|
|
|
|
|
|
|
|
|
|
|
|
|
|
|
|
|
|
Total interest income from affiliates |
| $ | 13,895 |
| $ | 6 |
| $ | 260 |
| $ | — |
|
| $ | (14,161 | ) |
|
| $ | — |
|
|
|
|
|
|
|
|
|
|
|
|
|
|
|
|
|
|
|
|
|
|
|
|
|
|
Total interest income from external customers |
| $ | 179,803 |
| $ | 136,838 |
| $ | 7,848 |
| $ | 20,270 |
|
| $ | (429 | ) |
|
| $ | 344,330 |
|
|
|
|
|
|
|
|
|
|
|
|
|
|
|
|
|
|
|
|
|
|
|
|
|
|
(Amortization) & accretion of securities |
| $ | 10,287 |
| $ | 1,123 |
| $ | (51 | ) | $ | (59 | ) |
| $ | — |
|
|
| $ | 11,300 |
|
|
|
|
|
|
|
|
|
|
|
|
|
|
|
|
|
|
|
|
|
|
|
|
|
|
|
|
|
|
|
|
|
|
|
|
|
|
|
|
|
|
|
|
|
|
|
|
|
|
|
| Year Ended |
| ||||||||||||||||||||
|
|
| |||||||||||||||||||||
|
| MS |
| LA |
| FL |
| Other |
| Eliminations |
| Consolidated |
| ||||||||||
|
|
|
|
|
|
|
| ||||||||||||||||
|
| (In thousands) |
| ||||||||||||||||||||
Interest income |
| $ | 140,583 |
| $ | 109,248 |
| $ | 6,563 |
| $ | 17,037 |
|
| $ | (9,800 | ) |
|
| $ | 263,631 |
|
|
Interest expense |
|
| 45,392 |
|
| 33,184 |
|
| 1,796 |
|
| 3,902 |
|
|
| (9,455 | ) |
|
|
| 74,819 |
|
|
|
|
|
|
|
|
|
|
|
|
|
| ||||||||||||
Net interest income |
|
| 95,191 |
|
| 76,064 |
|
| 4,767 |
|
| 13,135 |
|
|
| (345 | ) |
|
|
| 188,812 |
|
|
Provision for loan losses |
|
| 24,744 |
|
| 14,836 |
|
| 494 |
|
| 2,561 |
|
|
| — |
|
|
|
| 42,635 |
|
|
Noninterest income |
|
| 46,197 |
|
| 28,061 |
|
| 476 |
|
| 23,671 |
|
|
| (135 | ) |
|
|
| 98,270 |
|
|
Depreciation and amortization |
|
| 5,299 |
|
| 2,467 |
|
| 453 |
|
| 498 |
|
|
| — |
|
|
|
| 8,717 |
|
|
Other noninterest expense |
|
| 73,725 |
|
| 56,065 |
|
| 4,349 |
|
| 28,819 |
|
|
| (131 | ) |
|
|
| 162,827 |
|
|
|
|
|
|
|
|
|
|
|
|
|
| ||||||||||||
Income before income taxes |
|
| 37,620 |
|
| 30,757 |
|
| (53 | ) |
| 4,928 |
|
|
| (349 | ) |
|
|
| 72,903 |
|
|
Income tax expense (benefit) |
|
| 16,673 |
|
| (191 | ) |
| 170 |
|
| 2,260 |
|
|
| (41 | ) |
|
|
| 18,871 |
|
|
|
|
|
|
|
|
|
|
|
|
|
| ||||||||||||
Net income (loss) |
| $ | 20,947 |
| $ | 30,948 |
| $ | (223 | ) | $ | 2,668 |
|
| $ | (308 | ) |
|
| $ | 54,032 |
|
|
|
|
|
|
|
|
|
|
|
|
|
| ||||||||||||
|
|
|
|
|
|
|
|
|
|
|
|
|
|
|
|
|
|
|
|
|
|
|
|
Total assets |
| $ | 3,546,748 |
| $ | 2,138,894 |
| $ | 122,845 |
| $ | 697,548 |
|
| $ | (555,848 | ) |
|
| $ | 5,950,187 |
|
|
|
|
|
|
|
|
|
|
|
|
|
|
|
|
|
|
|
|
|
|
|
|
|
|
Total interest income from affiliates |
| $ | 9,334 |
| $ | — |
| $ | 121 |
| $ | — |
|
| $ | (9,455 | ) |
|
| $ | — |
|
|
|
|
|
|
|
|
|
|
|
|
|
|
|
|
|
|
|
|
|
|
|
|
|
|
Total interest income from external customers |
| $ | 131,249 |
| $ | 109,248 |
| $ | 6,442 |
| $ | 17,037 |
|
| $ | (345 | ) |
|
| $ | 263,631 |
|
|
|
|
|
|
|
|
|
|
|
|
|
|
|
|
|
|
|
|
|
|
|
|
|
|
(Amortization) & accretion of securities |
| $ | (477 | ) | $ | (1,228 | ) | $ | (81 | ) | $ | (61 | ) |
| $ | — |
|
|
| $ | (1,847 | ) |
|
HANCOCK HOLDING COMPANY AND SUBSIDIARIES
NOTES TO CONSOLIDATED FINANCIAL STATEMENTS
Note 17. Segment Reporting (continued)
The Company allocated administrative charges between its Louisiana, Florida, Alabama and Other segments and its Mississippi segment and the Parent Company. This allocation was based on February 26,an analysis of costs for 2007. The administrative charges allocated to the Louisiana segment were $18.0 million in 2007, $11.8 million in 2006, and $11.6 million in 2005. The Florida segment received $221,000 in allocated administrative charges in 2007, $210,000 in 2006, and $200,000 in 2005. The Other segments allocated charges were $997,300 in 2007, $708,760 in 2006 and $150,000 in 2005. The aforementioned administrative charges were allocated from the Mississippi segment ($19.2 million in 2007, $12.7 million in 2006, and $11.6 million in 2005). Subsidiaries of the Mississippi segment were included in the cost allocation process beginning in 2004. Administrative charges allocated from the Parent Company were $88,000 in 2007, $315,000 in 2006 and $300,000 in 2005.
Goodwill and other intangible assets assigned to the Mississippi segment totaled approximately $13.5 million, of which $12.1 million represented goodwill and $1.4 million represented core deposit intangibles at December 31, 2007. At December 31, 2006, goodwill and other intangible assets assigned to the Mississippi segment totaled approximately $13.9 million, of which $12.1 million represented goodwill and $1.8 million represented core deposit intangibles. The related core deposit amortization was approximately $409,000 in 2007, $409,000 in 2006, and $518,000 in 2005.
Goodwill and other intangible assets assigned to the Louisiana segment totaled approximately $37.3 million, of which $33.8 million represented goodwill and $3.5 million represented core deposit intangibles at December 31, 2007. Goodwill and other intangible assets assigned to the Louisiana segment totaled approximately $38.0 million, of which $33.8 million represented goodwill and $4.2 million represented core deposit intangibles at December 31, 2006. The related core deposit amortization was approximately $680,000 in 2007, $815,000 in 2006, and $977,000 in 2005.
Goodwill and other intangible assets assigned to the Florida segment totaled approximately $12.0 million, of which $11.3 million represented goodwill and $0.7 million represented core deposit intangibles, at December 31, 2007. At December 31, 2006, goodwill and other intangible assets assigned to the Florida segment totaled approximately $12.1 million, of which $11.3 million represented goodwill and $0.8 million represented core deposit intangibles. The related core deposit amortization was approximately $121,000 in 2007, $142,000 in 2006 and $160,000 in 2005.
Other intangible assets are also assigned to subsidiaries that are included in the “Other” category in the table above and totaled $7.2 million at December 31, 2007 and $7.7 million at December 31, 2006. Those intangibles consist of goodwill, $5.1 million; non-compete agreements, approximately $116,000; value of insurance expirations, approximately $1.9 million and trade name of $50,000.
The segments performed a fair value based impairment test of goodwill and determined that the fair values of these reporting units exceeded their carrying values at December 2007, 2006 and 2005. No impairment loss, therefore, was recorded.
ITEM 9AHANCOCK HOLDING COMPANY AND SUBSIDIARIES
NOTES TO CONSOLIDATED FINANCIAL STATEMENTS
Note 18. Condensed Parent Company Information
The following condensed financial information reflects the accounts and transactions of Hancock Holding Company (parent company only) for the dates indicated (in thousands):
Condensed Balance Sheets
|
|
|
|
|
|
|
|
|
| December 31, |
| ||||
|
|
| |||||
|
| 2007 |
| 2006 |
| ||
|
|
|
| ||||
Assets: |
|
|
|
|
|
|
|
Cash |
| $ | 3,843 |
| $ | 6,669 |
|
Investment in bank subsidiaries |
|
| 540,071 |
|
| 537,890 |
|
Investment in non-bank subsidiaries |
|
| 10,552 |
|
| 11,101 |
|
Due from subsidiaries and other assets |
|
| 1,616 |
|
| 3,299 |
|
|
|
|
| ||||
|
| $ | 556,082 |
| $ | 558,959 |
|
|
|
|
| ||||
|
|
|
|
|
|
|
|
Liabilities and Stockholders’ Equity: |
|
|
|
|
|
|
|
Due to subsidiaries |
| $ | 1,281 |
| $ | 2 |
|
Other liabilities |
|
| 614 |
|
| 547 |
|
Stockholders’ equity |
|
| 554,187 |
|
| 558,410 |
|
|
|
|
| ||||
|
| $ | 556,082 |
| $ | 558,959 |
|
|
|
|
| ||||
Condensed Statements of Income
|
|
|
|
|
|
|
|
|
|
|
|
| Years Ended December 31, |
| |||||||
|
|
| ||||||||
|
| 2007 |
| 2006 |
| 2005 |
| |||
|
|
|
|
| ||||||
Operating Income |
|
|
|
|
|
|
|
|
|
|
From subsidiaries |
|
|
|
|
|
|
|
|
|
|
Dividends received from bank subsidiaries |
| $ | 90,400 |
| $ | 19,416 |
| $ | 34,900 |
|
Dividends received from non-bank subsidiaries |
|
| — |
|
| 537 |
|
| — |
|
Equity in earnings of subsidiaries greater than (less than) dividends received |
|
| (18,214 | ) |
| 80,523 |
|
| 20,702 |
|
|
|
|
|
| ||||||
Total operating income |
|
| 72,186 |
|
| 100,476 |
|
| 55,602 |
|
Other (expense) income |
|
| 1,473 |
|
| (407 | ) |
| 512 |
|
Income tax provision (benefit) |
|
| (233 | ) |
| (1,733 | ) |
| 2,082 |
|
|
|
|
|
| ||||||
Net income |
| $ | 73,892 |
| $ | 101,802 |
| $ | 54,032 |
|
|
|
|
|
| ||||||
HANCOCK HOLDING COMPANY AND SUBSIDIARIES
NOTES TO CONSOLIDATED FINANCIAL STATEMENTS
Note 18. Condensed Parent Company Information (continued)
Condensed Statements of Cash Flows
|
|
|
|
|
|
|
|
|
|
|
|
| Years Ended December 31, |
| |||||||
|
|
| ||||||||
|
| 2007 |
| 2006 |
| 2005 |
| |||
|
|
|
|
| ||||||
Cash flows from operating activities - principally dividends received from subsidiaries |
| $ | 93,886 |
| $ | 26,567 |
| $ | 50,670 |
|
|
|
|
|
| ||||||
Cash flows from investing activities - principally Contribution of capital to subsidiary |
|
| (10,000 | ) |
| — |
|
| (20,000 | ) |
|
|
|
|
| ||||||
Net cash used by investing activities |
|
| (10,000 | ) |
| — |
|
| (20,000 | ) |
|
|
|
|
| ||||||
Cash flows from financing activities: |
|
|
|
|
|
|
|
|
|
|
Dividends paid to stockholders |
|
| (30,957 | ) |
| (29,311 | ) |
| (23,416 | ) |
Stock transactions, net |
|
| (55,755 | ) |
| 6,252 |
|
| (7,876 | ) |
|
|
|
|
| ||||||
Net cash used by financing activities |
|
| (86,712 | ) |
| (23,059 | ) |
| (31,292 | ) |
|
|
|
|
| ||||||
Net increase (decrease) in cash |
|
| (2,826 | ) |
| 3,508 |
|
| (622 | ) |
Cash, beginning of year |
|
| 6,669 |
|
| 3,161 |
|
| 3,783 |
|
|
|
|
|
| ||||||
Cash, end of year |
| $ | 3,843 |
| $ | 6,669 |
| $ | 3,161 |
|
|
|
|
|
| ||||||
Note 19. Summary of Quarterly Operating Results (Unaudited)
|
|
|
|
|
|
|
|
|
|
|
|
|
|
|
| 2007 |
| ||||||||||
|
|
| |||||||||||
|
| First |
| Second |
| Third |
| Fourth |
| ||||
|
|
|
|
|
| ||||||||
|
| (In thousands, except per share data) |
| ||||||||||
|
|
|
| ||||||||||
Interest income (te) |
| $ | 88,124 |
| $ | 87,204 |
| $ | 90,033 |
| $ | 90,041 |
|
Interest expense |
|
| (34,308 | ) |
| (33,394 | ) |
| (36,467 | ) |
| (36,067 | ) |
|
|
|
|
|
| ||||||||
Net interest income (te) |
|
| 53,816 |
|
| 53,810 |
|
| 53,566 |
|
| 53,974 |
|
(Provision for) reversal of loan losses |
|
| (1,211 | ) |
| (1,238 | ) |
| (1,554 | ) |
| (3,590 | ) |
Noninterest income |
|
| 25,895 |
|
| 30,227 |
|
| 30,519 |
|
| 31,489 |
|
Noninterest expense |
|
| (49,140 | ) |
| (51,857 | ) |
| (55,196 | ) |
| (58,162 | ) |
Taxable equivalent adjustment |
|
| (2,416 | ) |
| (2,267 | ) |
| (2,372 | ) |
| (2,482 | ) |
|
|
|
|
|
| ||||||||
Income before income taxes |
|
| 26,944 |
|
| 28,675 |
|
| 24,963 |
|
| 21,229 |
|
Income tax expense |
|
| (7,715 | ) |
| (8,352 | ) |
| (7,224 | ) |
| (4,628 | ) |
|
|
|
|
|
| ||||||||
Net income |
| $ | 19,229 |
| $ | 20,323 |
| $ | 17,739 |
| $ | 16,601 |
|
|
|
|
|
|
| ||||||||
|
|
|
|
|
|
|
|
|
|
|
|
|
|
Earnings per share |
|
|
|
|
|
|
|
|
|
|
|
|
|
Basic |
| $ | 0.59 |
| $ | 0.63 |
| $ | 0.55 |
| $ | 0.53 |
|
Diluted |
| $ | 0.58 |
| $ | 0.62 |
| $ | 0.55 |
| $ | 0.53 |
|
HANCOCK HOLDING COMPANY AND SUBSIDIARIES
NOTES TO CONSOLIDATED FINANCIAL STATEMENTS
Note 19. Summary of Quarterly Operating Results (Unaudited) (continued)
|
|
|
|
|
|
|
|
|
|
|
|
|
|
|
| 2006 |
| ||||||||||
|
|
| |||||||||||
|
| First |
| Second |
| Third |
| Fourth |
| ||||
|
|
|
|
|
| ||||||||
|
| (In thousands, except per share data) |
| ||||||||||
| |||||||||||||
Interest income (te) |
| $ | 83,570 |
| $ | 88,382 |
| $ | 91,275 |
| $ | 89,366 |
|
Interest expense |
|
| (25,273 | ) |
| (28,636 | ) |
| (31,988 | ) |
| (33,966 | ) |
|
|
|
|
|
| ||||||||
Net interest income (te) |
|
| 58,297 |
|
| 59,746 |
|
| 59,287 |
|
| 55,400 |
|
(Provision for) reversal of loan losses |
|
| 705 |
|
| — |
|
| 20,000 |
|
| 57 |
|
Noninterest income |
|
| 25,008 |
|
| 25,942 |
|
| 25,737 |
|
| 27,146 |
|
Noninterest expense |
|
| (49,165 | ) |
| (51,172 | ) |
| (50,337 | ) |
| (50,042 | ) |
Taxable equivalent adjustment |
|
| (1,980 | ) |
| (1,979 | ) |
| (2,042 | ) |
| (2,262 | ) |
|
|
|
|
|
| ||||||||
Income before income taxes |
|
| 32,865 |
|
| 32,537 |
|
| 52,645 |
|
| 30,299 |
|
Income tax expense |
|
| (10,854 | ) |
| (10,539 | ) |
| (16,614 | ) |
| (8,537 | ) |
|
|
|
|
|
| ||||||||
Net income |
| $ | 22,011 |
| $ | 21,998 |
| $ | 36,031 |
| $ | 21,762 |
|
|
|
|
|
|
| ||||||||
| |||||||||||||
Earnings per share |
|
|
|
|
|
|
|
|
|
|
|
|
|
Basic |
| $ | 0.68 |
| $ | 0.68 |
| $ | 1.11 |
| $ | 0.67 |
|
Diluted |
| $ | 0.67 |
| $ | 0.66 |
| $ | 1.08 |
| $ | 0.65 |
|
Unaudited - CONTROLS AND PROCEDURES
Net interest income (te) is the primary component of earnings and represents the difference, or spread, between revenue generated from interest-earning assets and the interest expense related to funding those assets.
CHANGES IN AND DISAGREEMENTS WITH ACCOUNTANTS ON ACCOUNTING | |
AND FINANCIAL DISCLOSURE | |
None
CONTROLS AND PROCEDURES |
Evaluation of Disclosure Controls and Procedures
As defined by the Securities and Exchange Commission in Exchange Act Rules 13a-14(c) and 15d-14(c), a company’s “disclosure controls and procedures” means controls and other procedures of an issuer that are designed to ensure that information required to be disclosed by the issuer in the reports that it files or submits under the Exchange Act is recorded, processed, summarized and reported, within the time periods specified in the Commission’s rules and forms.
As of December 31, 2005,2007, (the “Evaluation Date”), the Company’sour Chief Executive OfficerOfficers and Chief Financial Officer have evaluated the effectiveness of the Company’sour disclosure controls and procedures as defined in the Exchange Act Rules. Based on their evaluation, the Company’sour Chief Executive OfficerOfficers and Chief Financial Officer have concluded the Company’sHancock’s disclosure controls and procedures are sufficiently effective to ensure that material information relating to the Companyus and required to be disclosed by the Companyus in the reports that it fileswe file or submitssubmit under the Exchange Act is recorded, processed, summarized and reported within the time periods specified in the Commission’s rules and forms.
Internal Control over Financial Reporting
The management of Hancock Holding Company has prepared the consolidated financial statements and other information in our Annual Report in accordance with accounting principles generally accepted in the United States of America and is responsible for its accuracy. The financial statements necessarily include amounts that are based on management’s best estimates and judgments.
In meeting its responsibility, management relies on internal accounting and related control systems. The internal control systems are designed to ensure that transactions are properly authorized and recorded in the Company’sour financial records and to safeguard the Company’sour assets from material loss or misuse. Such assurance cannot be absolute because of inherent limitations in any internal control system.
The Company’s management Management is responsible for establishing and maintaining the adequate internal control over financial reporting, as such term is defined in the Exchange Act Rules 13(a) -13 – 15(f). Under the supervision and with the participation of management, including the Company’sour principal executive officerofficers and principal financial officer, the Companywe conducted an evaluation of the effectiveness of internal control over financial reporting based on the framework inInternal Control -– Integrated Framework issued by the Committee of Sponsoring Organizations of the Treadway Commission. Management also conducted an assessment of requirements pertaining to Section 112 of the Federal Deposit Insurance Corporation Improvement Act (FDICIA). This section relates to management’s evaluation of internal control over financial reporting including controls over the preparation of the schedules equivalent to the basic financial statements and compliance with laws and regulations. Our evaluation included a review of the documentation of controls, evaluations of the design of the internal control system and tests of the effectiveness of internal controls.
Based on the Company’sour evaluation under the framework inInternal Control -– Integrated Framework, management concluded that internal control over financial reporting was effective as of December 31, 2005. Management’s2007. KPMG, under Auditing Standard No. 5, does not express an opinion on management’s assessment as occurred under Auditing Standard No. 2. Under Auditing Standard No. 5 management is responsible for maintaining effective internal control over financial reporting and for its assessment of the effectiveness of internal control over financial reporting. KPMG’s responsibility is to express an opinion on the effectiveness of the Company’s internal control over financial reporting as of December 31, 2005 has been audited by KPMG, LLP, an independent registered public accounting firm, as stated inbased on their report which is incorporated herein by reference.audit.
OTHER INFORMATION |
None
DIRECTORS, EXECUTIVE OFFICERS AND CORPORATE GOVERNANCE |
For Pursuant to General Instruction G (3), information concerningon directors who are not alsoand executive officers of the registrant, see “Directors of HHC” (page 9) inRegistrant will be incorporated by reference from the Company’s Definitive Proxy Statement for the Annual Meeting of Shareholders to be held March 30, 2006, which was filed by the Registrant in definitive form with the Commission on March 3, 2006 and is incorporated herein by reference.
Information concerning executive officers of the registrant is listed below.
Director of the Company since 1984. President, Hancock Bank, Gulfport, Mississippi from 1963 to 1990; President of Hancock Holding Company since 1984, Chief Executive Officer from 1984 to 2000, Advisory Director, Hancock Bank of Louisiana since 1993. Mr. Seal has been employed with Hancock Bank since 1947. He was elected to the Board of Directors of Hancock Bank in 1961 and named President in 1963 and in 1977 he was named Chief Executive Officer.
Director of the Company since 1984. President, Hancock Bank, Gulfport, Mississippi, since 1990, Vice Chairman of the Board of Hancock Holding Company since 1984 and named Chief Executive Officer, Hancock Holding Company 2000; Director of Hancock Bank of Louisiana, since 1990 and named President in July 2003; Director of Mississippi Power Company, Gulfport, Mississippi. Mr. Schloegel was employed part-time with Hancock Bank from 1956-1959 and began full-time employment in 1962. He served in various capacities until being named President in 1990.
Chief Credit Officer, Hancock Holding Company since October 2002; Executive Vice President, Hancock Holding Company since February 2003; Mr. Rath has been employed with Hancock Bank since 1969. He served in various capacities until being named Chief Credit Officer in October 2002.
Executive Vice President, Hancock Bank of Louisiana since 1995; President and Chief Executive Officer, First National Bank of Denham Springs from 1981-1996; Chairman of the Board, First National Bank of Denham Springs from 1993-1996; Director, Hancock Bank since 1995.
Chief Financial Officer, Hancock Holding Company and Hancock Bank since 1998; Executive Vice President, Hancock Holding Company and Hancock Bank since 2001; Senior Vice President, Hancock Holding Company and Hancock Bank from 1999 to 2001. Prior to Mr. Chaney joining Hancock, he was Director and Shareholder of the law firm, Watkins Ludlam Winter & Stennis, P.A., Jackson Mississippi from 1995 to 1998, where he specialized in Investment Banking and Merger and Acquisitions in the Banking Industry.
Chief Operating Officer, Hancock Holding Company and Hancock Bank since 1997; Executive Vice President, Hancock Holding Company and Hancock Bank since 2001; Senior Vice President, Hancock Holding Company and Hancock Bank from 1996 to 2001; Vice President, Hancock Bank from 1994 to 1995; Senior Operations Officer, Hancock Holding Company from 1994 to 1996. Prior to Mr. Hairston joining Hancock, he was a Manager with Financial Services Consulting, a Division of Andersen Consulting, headquartered in Chicago, Illinois.
Executive Vice President, Hancock Holding Company, since February 2002; Senior Vice President and Louisiana Retail Banking Executive, Hancock Bank of Louisiana, from June 1998 to January 2002; Executive Vice President and Retail Banking Executive, City National Bank (a subsidiary of First Commerce Corporation), November 1993 -June 1998.
Executive Vice President, Hancock Holding Company, since February 2002; Senior Vice President and Director, Trust and Financial Services Group, Hancock Bank from July 1998 to January 2002. Prior to coming to Hancock Bank, Mr. Saik served in the following capacities at First Commerce Corporation, New Orleans, Louisiana: Executive Vice President and Director, Card Services; CEO, Marquis Insurance Agency, L.L.C.; and Member, Marquis Investments, L.L.C. Management Committee, June 1997 - June 1998; Executive Vice President and Director, Trust and Retail Brokerage Services Group, Senior Vice President and Director, Trust Group; October 1994 to June 1997; Senior Vice President and Senior Trust Officer, October 1992 to October 1994.
For information concerning compliance with Section 16(a) of the Exchange Act, see “Section 16(a) Beneficial Ownership Reporting Compliance” (pages 8-16) in the Proxy Statement for the Annual Meeting of Shareholdersannual meeting to be held on March 30, 2006, which was filed27, 2008.
EXECUTIVE COMPENSATION |
Pursuant to General Instructions G (3), information on executive compensation will be incorporated by reference from the Registrant in definitive form with the Commission on March 3, 2006 and is incorporated herein by reference.
For information concerning the Audit Committee, its members and its financial expert, see “Audit Committee” (page 18) in theCompany’s Definitive Proxy Statement for the Annual Meeting of Shareholdersannual meeting to be held on March 30, 2006, which was filed by the Registrant in definitive form with the Commission27, 2008.
SECURITY OWNERSHIP OF CERTAIN BENEFICIAL OWNERS AND MANAGEMENT | |
AND RELATED STOCKHOLDER MATTERS | |
Pursuant to General Instructions G (3), information on March 3, 2006security ownership of certain beneficial owners and is incorporated herein by reference.
The Company’s Board of Directors has adopted a Code of Ethics that applies to the Company’s principal executive officer, principal financial officer, principal accounting officer, or persons performing similar functions. A copy of this Code of Ethics canmanagement will be found at the Company’s internet website at www.hancockbank.com. The Company intends to disclose any amendments to its Code of Ethics, and any waiver from a provision of the Code of Ethics granted to the Company’s principal executive officer, principal financial officer, principal accounting officer, or persons performing similar functions, on the Company’s internet website within five business days following such amendment or waiver. The information contained on or connected to the Company’s internet website is not incorporated by reference into this Form 10-K and should not be considered part of this or any other report that we file with or furnish tofrom the SEC.
For information concerning this item see “Executive Compensation” (page 10) in theCompany’s Definitive Proxy Statement for the Annual Meeting of Shareholdersannual meeting to be held on March 30, 2006, which was filed27, 2008.
Equity Compensation Plan Information
|
|
|
|
|
|
|
|
|
|
|
|
|
Plan Category |
| Number of securities to be issued upon exercise of outstanding options, warrants and rights |
| Weighted-average exercise price of outstanding options, warrants and rights |
| Number of securities remaining available for future issuance under equity compensation plans (excluding securities reflected in column (a)) |
| |||||
Equity compensation plans approved by security holders |
|
| 1,588,425 |
|
| $ | 23.81 |
|
|
| 4,827,798 |
|
Equity compensation plans not approved by security holders |
|
| — |
|
|
| — |
|
|
| — |
|
Total |
|
| 1,588,425 |
|
| $ | 23.81 |
|
|
| 4,827,798 |
|
CERTAIN RELATIONSHIPS AND RELATED TRANSACTIONS, AND DIRECTOR | |
INDEPENDENCE | |
Pursuant to General Instructions G (3), information on certain relationships and related transactions will be incorporated by reference from the Registrant in definitive form with the Commission on March 3, 2006 and is incorporated herein by reference.
For information concerning this item see “Security Ownership of Certain Beneficial Owners” (page 8) and “Security Ownership of Management” (pages 9-10) in theCompany’s Definitive Proxy Statement for the Annual Meeting of Shareholdersannual meeting to be held March 30, 2006, which was filed by the Registrant in definitive form with the Commission on March 3, 200627, 2008.
PRINCIPAL ACCOUNTANT FEES AND SERVICES |
Pursuant to General Instructions G (3), information on principal accountant fees and isservices will be incorporated herein by reference.
For information concerning this item see “Certain Transactions and Relationships” (page 16) inreference from the Company’s Definitive Proxy Statement for the Annual Meeting of Shareholdersannual meeting to be held March 30, 2006, which was filed by the Registrant in definitive form with the Commission on March 3, 2006 and is incorporated herein by reference.27, 2008.
For information concerning this item, see “Principal Accounting Firm Fees” on Page 20 of the Company’s Proxy Statement for the Annual Meeting of Shareholders to be held March 30, 2006, which was filed by the Registrant in definitive form with the Commission on March 3, 2006 and is incorporated herein by reference.
EXHIBITS, FINANCIAL STATEMENT SCHEDULES |
(a) | The following documents are filed as part of this report: | ||
1. | The following consolidated financial statements of Hancock Holding Company and subsidiaries are filed as part of this report under Item 8 – Financial Statements and Supplementary Data: | ||
Consolidated balance sheets – December 31, 2007 and 2006 | |||
Consolidated statements of income – Years ended December 31, 2007, 2006, and 2005 | |||
Consolidated statements of stockholders’ equity – Years ended December 31, 2007, 2006, and 2005 | |||
Consolidated statements of cash flows –Years ended December 31, 2007, 2006, and 2005 | |||
Notes to consolidated financial statements – December 31, 2007 (pages 54 to 92) | |||
2. | Financial schedules required to be filed by Item 8 of this form, and by Item 15(d) below: | ||
The schedules to the consolidated financial statements set forth by Article 9 of Regulation S-X are not required under the related instructions or are inapplicable and therefore have been omitted. | |||
3. | Exhibits required to be filed by Item 601 of Regulation S-K, and by Item 15(b) below. | ||
The following have been incorporated herein from the Company’s 2005 Annual Report to Stockholders and are incorporated herein by reference:(b) Exhibits:
- - Management's Report on Internal Control over Financial Reporting - - Reports of Independent Registered Public Accounting Firm - - Consolidated Balance Sheets as of December 31, 2005 and 2004 - - Consolidated Statements of Earnings for the three years ended December 31, 2005 - - Consolidated Statements of Common Stockholders' Equity for the three years ended December 31, 2005 - - Consolidated Statements of Comprehensive Earnings for the three years ended December 31, 2005 - - Consolidated Statements of Cash Flows for the three years ended December 31, 2005 - - Notes to Consolidated Financial Statements for the three years ended December 31, 2005 - - Financial Highlights at and as of each of the five years ended December 31, 2005
All other financial statements and schedules are omitted as the required information is inapplicable or the required information is presented in the consolidated financial statements or related notes.
(a) 3.
ExhibitsExhibits:: (2.1) Agreement and Plan of Merger between Hancock Holding Company and Lamar Capital Corporation dated February 21, 2001 (Appendix C to the Prospectus contained in the S-4 Registration Statement 333-60280 filed on May 4, 2001 and incorporated by reference herein). (3.1) Amended and Restated Articles of Incorporation dated November 8, 1990 (filed as Exhibit 3.1 to the Registrant's Form 10-K for the year ended December 31, 1990 and incorporated herein by reference). (3.2) Amended and Restated Bylaws dated November 8, 1990 (filed as Exhibit 3.2 to the Registrant's Form 10-K for the year ended December 31, 1990 and incorporated herein by reference). (3.3) Articles of Amendment to the Articles of Incorporation of Hancock Holding Company, dated October 16, 1991 (filed as Exhibit 4.1 to the Registrant's Form 10-Q for the quarter ended September 30, 1991). (3.4) Articles of Correction, filed with Mississippi Secretary of State on November 15, 1991 (filed as Exhibit 4.2 to the Registrant's Form 10-Q for the quarter ended September 30, 1991). (3.5) Articles of Amendment to the Articles of Incorporation of Hancock Holding Company, adopted February 13, 1992 (filed as Exhibit 3.5 to the Registrant's Form 10-K for the year ended December 31, 1992 and incorporated herein by reference).
Exhibit | Description |
2.1 | Agreement and Plan of Merger between Hancock Holding Company and Lamar Capital Corporation dated February 21, 2001 (Appendix C to the Prospectus contained in the S-4 Registration Statement 333-60280 filed on May 4, 2001 and incorporated by reference herein). |
3.1 | Amended and Restated Articles of Incorporation dated November 8, 1990 (filed as Exhibit 3.1 to the Registrant’s Form 10-K for the year ended December 31, 1990 and incorporated herein by reference). |
3.2 | Amended and Restated Bylaws dated November 8, 1990 (filed as Exhibit 3.2 to the Registrant’s Form 10-K for the year ended December 31, 1990 and incorporated herein by reference). |
3.3 | Articles of Amendment to the Articles of Incorporation of Hancock Holding Company, dated October 16, 1991 (filed as Exhibit 4.1 to the Registrant’s Form 10-Q for the quarter ended September 30, 1991). |
3.4 | Articles of Correction, filed with Mississippi Secretary of State on November 15, 1991 (filed as Exhibit 4.2 to the Registrant’s Form 10-Q for the quarter ended September 30, 1991). |
3.5 | Articles of Amendment to the Articles of Incorporation of Hancock Holding Company, adopted February 13, 1992 (filed as Exhibit 3.5 to the Registrant’s Form 10-K for the year ended December 31, 1992 and incorporated herein by reference). |
3.6 | Articles of Correction, filed with Mississippi Secretary of State on March 2, 1992 (filed as Exhibit 3.6 to the Registrant’s Form 10-K for the year ended December 31, 1992 and incorporated herein by reference). |
3.7 | Articles of Amendment to the Articles of Incorporation adopted February 20, 1997 (filed as Exhibit 3.7 to the Registrant’s Form 10-K for the year ended December 31, 1996 and incorporated herein by reference). |
(3.6) Articles of Correction, filed with Mississippi Secretary of State on March 2, 1992 (filed as Exhibit 3.6 to the Registrant's Form 10-K for the year ended December 31, 1992 and incorporated herein by reference). (3.7) Articles of Amendment to the Articles of Incorporation adopted February 20, 1997 (filed as Exhibit 3.7 to the Registrant's Form 10-K for the year ended December 31, 1996 and incorporated herein by reference). (4.1) Specimen stock certificate (reflecting change in par value from $10.00 to $3.33, effective March 6, 1989) (filed as Exhibit 4.1 to the Registrant's Form 10-Q for the quarter ended March 31, 1989 and incorporated herein by reference). (4.2) By executing this Form 10-K, the Registrant hereby agrees to deliver to the Commission upon request copies of instruments defining the rights of holders of long-term debt of the Registrant or its consolidated subsidiaries or its unconsolidated subsidiaries for which financial statements are required to be filed, where the total amount of such securities authorized thereunder does not exceed 10 percent of the total assets of the Registrant and its subsidiaries on a consolidated basis. (10.1) 1996 Long Term Incentive Plan (filed as Exhibit 10.1 to the Registrant's Form 10-K for the year ended December 31, 1995, and incorporated herein by reference). (10.2) Description of Hancock Bank Executive Supplemental Reimbursement Plan, as amended (filed as Exhibit 10.2 to the Registrant's Form 10-K for the year ended December 31, 1996, and incorporated herein by reference). (10.3) Description of Hancock Bank Automobile Plan (filed as Exhibit 10.3 to the Registrant's Form 10-K for the year ended December 31, 1996, and incorporated herein by reference). (10.4) Description of Deferred Compensation Arrangement for Directors (filed as Exhibit 10.4 to the Registrant's Form 10-K for the year ended December 31, 1996, and incorporated herein by reference). (10.5) Site Lease Agreement between Hancock Bank and City of Gulfport, Mississippi dated as of March 1, 1989 (filed as Exhibit 10.4 to the Registrant's Form 10-K for the year ended December 31, 1989 and incorporated herein by reference). (10.6) Project Lease Agreement between Hancock Bank and City of Gulfport, Mississippi dated as of March 1, 1989 (filed as Exhibit 10.5 to the Registrant's Form 10-K for the year ended December 31, 1989 and incorporated herein by reference). (10.7) Deed of Trust dated as of March 1, 1989 from Hancock Bank to Deposit Guaranty National Bank as trustee (filed as Exhibit 10.6 to the Registrant's Form 10-K for the year ended December 31, 1989 and incorporated herein by reference). (10.8) Trust Indenture between City of Gulfport, Mississippi and Deposit Guaranty National Bank dated as of March 1, 1989 (filed as Exhibit 10.7 to the Registrant's Form 10-K for the year ended December 31, 1989 and incorporated herein by reference). (10.9) Guaranty Agreement dated as of March 1, 1989 from Hancock Bank to Deposit Guaranty National Bank as trustee (filed as Exhibit 10.8 to the Registrant's Form 10-K for the year ended December 31, 1989 and incorporated herein by reference). (10.10) Bond Purchase Agreement dated as of February 23, 1989 among Hancock Bank, J. C. Bradford & Co. and City of Gulfport, Mississippi (filed as Exhibit 10.9 to the Registrant's Form 10-K for the year ended December 31, 1989 and incorporated herein by reference). (13) Annual Report to Stockholders for year ending December 31, 2005 furnished for the information of the Commission only and not deemed "filed" except for those portions which are specifically incorporated herein by reference).
4.1 | Specimen stock certificate (reflecting change in par value from $10.00 to $3.33, effective March 6, 1989) (filed as Exhibit 4.1 to the Registrant’s Form 10-Q for the quarter ended March 31, 1989 and incorporated herein by reference). |
4.2 | By executing this Form 10-K, the Registrant hereby agrees to deliver to the Commission upon request copies of instruments defining the rights of holders of long-term debt of the Registrant or its consolidated subsidiaries or its unconsolidated subsidiaries for which financial statements are required to be filed, where the total amount of such securities authorized there under does not exceed 10 percent of the total assets of the Registrant and its subsidiaries on a consolidated basis. |
*10.1 | 1996 Long Term Incentive Plan (filed as Exhibit 10.1 to the Registrant’s Form 10-K for the year ended December 31, 1995, and incorporated herein by reference). |
*10.2 | Description of Hancock Bank Executive Supplemental Reimbursement Plan, as amended (filed as Exhibit 10.2 to the Registrant’s Form 10-K for the year ended December 31, 1996, and incorporated herein by reference). |
*10.3 | Description of Hancock Bank Automobile Plan (filed as Exhibit 10.3 to the Registrant’s Form 10-K for the year ended December 31, 1996, and incorporated herein by reference). |
*10.4 | Description of Deferred Compensation Arrangement for Directors (filed as Exhibit 10.4 to the Registrant’s Form 10-K for the year ended December 31, 1996, and incorporated herein by reference). |
*10.5 | Hancock Holding Company 2005 Long-Term Incentive Plan, filed as Appendix “A” to the Company’s Definitive Proxy Statement filed with the Commission on February 28, 2005 and incorporated herein by reference. |
*10.6 | Hancock Holding Company Nonqualified Deferred Compensation Plan, filed as Exhibit 99.1 to the Company’s Current Report on Form 8-K filed with the Commission on December 21, 2005 and incorporated herein by reference. |
10.7 | Shareholder Rights Agreement dated as of February 21, 1997, between Hancock Holding Company and Hancock Bank, as Rights Agent as extended by the Company. |
21 | Subsidiaries of Hancock Holding Company. |
22 | Proxy Statement for the Registrant’s Annual Meeting of Shareholders on March 27, 2008 (deemed “filed” for the purposes of this Form 10-K only for those portions which are specifically incorporated herein by reference). |
23 | Consent of KPMG LLP. |
31.1 | Certification of Chief Executive Officers pursuant to Rule 13a-14(a) and Rule 15d-14(a) of the Securities Exchange Act, as amended. |
31.2 | Certification of Chief Financial Officer pursuant to Rule 13a-14(a) and Rule 15d-14(a) of the Securities Exchange Act, as amended. |
32.1 | Certification of Chief Executive Officers Pursuant to 18 U.S.C. 1350, as adopted pursuant to Section 906 of the Sarbanes-Oxley Act of 2002. |
32.2 | Certification of Chief Financial Officer Pursuant to 18 U.S.C. 1350, as adopted pursuant to Section 906 of the Sarbanes-Oxley Act of 2002. |
* Compensatory plan or arrangement. |
(21) Proxy Statement for the Registrant's Annual Meeting of Shareholders on March 30, 2006 (deemed "filed" for the purposes of this Form 10-K only for those portions which are specifically incorporated herein by reference). (22) Subsidiaries of the Registrant. Jurisdiction Holder of Name of Incorporation Outstanding Stock * ---- ---------------- ------------------- Hancock Bank Mississippi Hancock Holding Company Hancock Bank of Louisiana Louisiana Hancock Holding Company HBLA Properties, LLC Louisiana Hancock Bank of Louisiana Hancock Bank of Florida Florida Hancock Holding Company Magna Insurance Company Mississippi Hancock Holding Company Harrison Life Insurance Company Mississippi Magna Insurance Co. Hancock Bank Securities Corp., LLC Mississippi Hancock Bank Hancock Insurance Agency Mississippi Hancock Bank Hancock Insurance Agency of AL, Inc. Alabama Hancock Insurance Agency Hancock Investment Services, Inc. Mississippi Hancock Bank Hancock Investment Services of MS, Inc. Mississippi Hancock Investment Services, Inc. Hancock Investment Services of LA, Inc. Louisiana Hancock Investment Services, Inc. Hancock Investment Services of FL, Inc. Florida Hancock Investment Services, Inc. Town Properties, Inc. Mississippi Hancock Bank The Gulfport Building, Inc. Mississippi Hancock Bank Harrison Finance Company Mississippi Hancock Bank * All are 100% owned except as indicated. (23) Consent of Independent Registered Public Accounting Firm - KPMG LLP (23.1) Consent of Independent Registered Public Accounting Firm - Deloitte & Touche LLP (23.2) Report of Independent Registered Public Accounting Firm - Deloitte & Touche LLP (31) Rule 13a-14(a)/15d-14(a) - Certifications of George A. Schloegel and Carl J. Chaney (32) Section 1350 Certifications of George A. Schloegel and Carl J. Chaney
SIGNATURES
Pursuant to the requirements of Section 13 or 15(d) of the Securities Exchange Act of 1934, the Registrant has duly caused this report to be signed on its behalf by the undersigned, thereunto duly authorized.
HANCOCK HOLDING COMPANY ------------------------------------------ Registrant March 15, 2006 By: /s/ George A. Schloegel - ------------------ ------------------------------------- Date George A. Schloegel Vice-Chairman of the Board & Chief Executive Officer March 15, 2006 By: /s/ Carl J. Chaney - ------------------ ------------------------------------- Date Carl J. Chaney Executive Vice President &
HANCOCK HOLDING COMPANY | |||
Registrant | |||
February 27, 2008 | By: | /s/ Carl J. Chaney | |
Date | Carl J. Chaney | ||
Chief Executive Officer | |||
Director | |||
February 27, 2008 | By: | /s/ John M. Hairston | |
Date | John M. Hairston | ||
Chief Executive Officer | |||
Director | |||
February 27, 2008 | By: | /s/ Michael M. Achary | |
Date | Michael M. Achary | ||
Chief Financial Officer | |||
Pursuant to the requirements of the Securities Exchange Act of 1934, this report has been signed below by the following persons on behalf of the Registrant and in the capacities and on the dates indicated.
/s/ Leo W. Seal, Jr. President, March 15, 2006
- --------------------------------
Leo W. Seal, Jr. Director
/s/ Joseph F. Boardman, Jr. Chairman of the Board, March 15, 2006
- --------------------------------
Joseph F. Boardman, Jr. Director
/s/ George A. Schloegel Vice Chairman of the Board, March 15, 2006
- --------------------------------
George A. Schloegel Director,
Chief Executive Officer
/s/ James B. Estabrook, Jr. Director March 15, 2006
- --------------------------------
James B. Estabrook, Jr.
Director March 15, 2006
- --------------------------------
Charles H. Johnson
/s/ Alton G. Bankston Director March 15, 2006
- --------------------------------
Alton G. Bankston
/s/ Don P. Descant Director March 15, 2006
- --------------------------------
Don P. Descant
/s/ Leo W. Seal, Jr. | President, | February 27, 2008 | ||
Director | ||||
Leo W. Seal, Jr. | ||||
/s/ George A. Schloegel | Chairman of the Board, | February 27, 2008 | ||
Director | ||||
George A Schloegel | ||||
/s/ Alton G. Bankston | Director | February 27, 2008 | ||
Alton G. Bankston | ||||
/s/ Frank E. Bertucci | Director | February 27, 2008 | ||
Frank E. Bertucci | ||||
/s/ Joseph F. Boardman, Jr. | Director | February 27, 2008 | ||
Joseph F. Boardman, Jr. | ||||
/s/ Don P. Descant | Director | February 27, 2008 | ||
Don P. Descant | ||||
/s/ James B. Estabrook, Jr. | Director | February 27, 2008 | ||
James B. Estabrook, Jr. |
(signatures continued) | ||||
/s/ James H. Horne | Director | February 27, 2008 | ||
James H. Horne | ||||
/s/ John H. Pace | Director | February 27, 2008 | ||
John H. Pace | ||||
/s/ Christine L. Pickering | Director | February 27, 2008 | ||
Christine L. Pickering | ||||
/s/ Robert W. Roseberry | Director | February 27, 2008 | ||
Robert W. Roseberry | ||||
/s/ Anthony J. Topazi | Director | February 27, 2008 | ||
Anthony J. Topazi |
(signatures continued) /s/ Christine L. Smilek Director March 15, 2006 - -------------------------------- Christine L. Smilek Director March 15, 2006 - -------------------------------- Frank E. Bertucci /s/ James H. Horne Director March 15, 2006 - -------------------------------- James H. Horne /s/ Carl J. Chaney Executive Vice President and March 15, 2006 - -------------------------------- Carl J. Chaney Chief Financial Officer Director March 15, 2006 - -------------------------------- Robert W. Roseberry Director March 15, 2006 - -------------------------------- John H. Pace
EXHIBIT INDEX
Exhibit | Description | |
2.1 | Agreement and Plan of Merger between Hancock Holding Company and Lamar Capital Corporation dated February 21, 2001 (Appendix C to the Prospectus contained in the S-4 Registration Statement 333-60280 filed on May 4, 2001 and incorporated by reference herein). | |
3.1 | Amended and Restated Articles of Incorporation dated November 8, 1990 (filed as Exhibit 3.1 to the Registrant’s Form 10-K for the year ended December 31, 1990 and incorporated herein by reference). | |
3.2 | Amended and Restated Bylaws dated November 8, 1990 (filed as Exhibit 3.2 to the Registrant’s Form 10-K for the year ended December 31, 1990 and incorporated herein by reference). | |
3.3 | Articles of Amendment to the Articles of Incorporation of Hancock Holding Company, dated October 16, 1991 (filed as Exhibit 4.1 to the Registrant’s Form 10-Q for the quarter ended September 30, 1991). | |
3.4 | Articles of Correction, filed with Mississippi Secretary of State on November 15, 1991 (filed as Exhibit 4.2 to the Registrant’s Form 10-Q for the quarter ended September 30, 1991). | |
3.5 | Articles of Amendment to the Articles of Incorporation of Hancock Holding Company, adopted February 13, 1992 (filed as Exhibit 3.5 to the Registrant’s Form 10-K for the year ended December 31, 1992 and incorporated herein by reference). | |
3.6 | Articles of Correction, filed with Mississippi Secretary of State on March 2, 1992 (filed as Exhibit 3.6 to the Registrant’s Form 10-K for the year ended December 31, 1992 and incorporated herein by reference). | |
3.7 | Articles of Amendment to the Articles of Incorporation adopted February 20, 1997 (filed as Exhibit 3.7 to the Registrant’s Form 10-K for the year ended December 31, 1996 and incorporated herein by reference). | |
4.1 | Specimen stock certificate (reflecting change in par value from $10.00 to $3.33, effective March 6, 1989) (filed as Exhibit 4.1 to the Registrant’s Form 10-Q for the quarter ended March 31, 1989 and incorporated herein by reference). | |
4.2 | By executing this Form 10-K, the Registrant hereby agrees to deliver to the Commission upon request copies of instruments defining the rights of holders of long-term debt of the Registrant or its consolidated subsidiaries or its unconsolidated subsidiaries for which financial statements are required to be filed, where the total amount of such securities authorized there under does not exceed 10 percent of the total assets of the Registrant and its subsidiaries on a consolidated basis. | |
*10.1 | 1996 Long Term Incentive Plan (filed as Exhibit 10.1 to the Registrant’s Form 10-K for the year ended December 31, 1995, and incorporated herein by reference). | |
*10.2 | Description of Hancock Bank Executive Supplemental Reimbursement Plan, as amended (filed as Exhibit 10.2 to the Registrant’s Form 10-K for the year ended December 31, 1996, and incorporated herein by reference). | |
*10.3 | Description of Hancock Bank Automobile Plan (filed as Exhibit 10.3 to the Registrant’s Form 10-K for the year ended December 31, 1996, and incorporated herein by reference). | |
*10.4 | Description of Deferred Compensation Arrangement for Directors (filed as Exhibit 10.4 to the Registrant’s Form 10-K for the year ended December 31, 1996, and incorporated herein by reference). | |
*10.5 | Hancock Holding Company 2005 Long-Term Incentive Plan, filed as Appendix “A” to the Company’s Definitive Proxy Statement filed with the Commission on February 28, 2005 and incorporated herein by reference. | |
*10.6 | Hancock Holding Company Nonqualified Deferred Compensation Plan, filed as Exhibit 99.1 to the Company’s Current Report on Form 8-K filed with the Commission on December 21, 2005 and incorporated herein by reference. | ||
10.7 | Shareholder Rights Agreement dated as of February 21, 1997, between Hancock Holding Company and Hancock Bank, as Rights Agent as extended by the Company. | ||
22 | Proxy Statement for the Registrant’s Annual Meeting of Shareholders on March 27, 2008 (deemed “filed” for the purposes of this Form 10-K only for those portions which are specifically incorporated herein by reference). | ||
* Compensatory plan or arrangement. | |||