| (Mark One) | ||
ANNUAL REPORT PURSUANT TO SECTION 13 OR 15(d) OF THE SECURITIES EXCHANGE ACT OF 1934 | ||
For the fiscal year ended December 31, | ||
OR | ||
o | TRANSITION REPORT PURSUANT TO SECTION 13 OR 15(d) OF THE SECURITIES EXCHANGE ACT OF 1934 | |
For the transition period from to | ||
Commission File No. 1-13906 | ||
Item 1. Unresolved Staff Comments Item 2. Item 3. Legal Proceedings Item 4. PART II Item 5. Market for Item 6. Selected Financial Data Item 7. Item 7A. Quantitative and Qualitative Disclosures about Market Risk Item 8. Financial Statements and Supplementary Data Item 9. Changes in and Disagreements with Accountants on Accounting and Financial Disclosure Item 9A. Controls and Procedures Item 9B. Other Information PART III Item 10. Directors, Executive Officers and Corporate Governance Item 11. Executive Compensation Item 12. Security Ownership of Certain Beneficial Owners and Management and Related Stockholder Matters Item 13. Certain Relationships and Related Transactions, and Director Independence Item 14. Principal Accounting Fees and Services PART IV Item 15. Exhibits, Financial Statement Schedules 2013. for digital menu boards and other digital signage on ad hoc, as-needed basis. We also offer long term contractual service packages for maintenance and repairs to a wide range of installed digital equipment for customers including equipment originally installed by our competitors. These long term service packages provide our Company with recurring revenue. Digital BARCO and can distribute NEC products in Hong Kong and certain other areas of Asia. We do not have any territorial restrictions for any of our other products and services. America. We also distribute their servers in certain other areas of the world under less formal arrangements. In addition, we distribute servers for other server manufacturers including those manufactured by Doremi. Digital servers and the related integrated media block are used by our customers for the storage and delivery of digital content. The significant accessories include, but are not limited to: 1) library management systems; 2) automation products; 3) pedestals; 4) 3D accessories; 5) lenses; and 6) lamps. We market and sell our products directly to end users Digital Equipment—The markets for our products in the theatre segment have been highly competitive during the analog-to-digital cinema conversion. The primary competitive factors are Under the trademark We sell our lighting products through a combination of a small direct sales force, dealer network and commissioned sales representatives to arenas, stadiums, theme parks, theatres, auditoriums, film and digital marketplace. a/k/a American West Beijing Trading Company, Ltd. is located in Beijing, China and is our sales and service We are one of the only screen manufacturers in the world with Silver Screen technologies capable of supporting RealD projections. We own or otherwise have rights to agreement. 2010. 2012. industry which result in continued exposure to Ballantyne. Company sells its products. December 31, 2012. We believe this facility is well maintained and adequate for future needs. The leases expire between August and December 2013. retaining occupancy of any leased facilities, either by renewing leases prior to expiration or replacing them with equivalent leased facilities. 4, 2013. Equity compensation plans approved by security holders Equity compensation plans not approved by security holders Total December 31, 2012. Ballantyne Strong, Inc. S&P 500 RDG SmallCap Technology SIC: 3861—PHOTOGRAPHIC EQUIPMENT & SUPPLIES Statement of operations data Net revenue Gross profit Net earnings (loss) Net earnings (loss) per share Basic Diluted Balance sheet data Working capital Total assets Total debt Stockholders' equity We are a manufacturer, distributor, integrator and service provider needs. Net revenue Cost of revenues Gross profit Selling and administrative expenses(1) Income (loss) from operations Net earnings (loss) 2010 Theatre Products Services Total theatre revenues Lighting Other Total net revenues 2010. being substantially completed. 2010 period. We sell screens for both digital cinema and film applications. In some instances, a screen can be used interchangeably with either a digital projector or a film projector. However, there are certain digital 3D applications such as the technology by RealD that require special projection equipment declined to $5.7 million from $10.9 million. 2010. historically carry strong margins. 2011. due to a favorable product mix. expense. dollar from year-to-year. income (losses)) was approximately 31.3% for 2011 and 31.9% certain Canadian tax credits. respectively. Borrowings available under the Credit Agreement were temporarily reduced to $19.6 million at December 31, 2012 due to outstanding standby letters of credit of $0.4 million. change is primarily due to a $13.7 million decrease in inventory and increases in customer deposits/deferred revenue and current income taxes payable partially offset by a $12.0 million increase in accounts, unbilled and notes receivables and increases in other current assets. Changes in receivables, inventory, unbilled revenue and customer deposits primarily resulted from the sale to a significant theatre customer recorded in the latter part of the third quarter of 2011. working capital used cash of Investing Activities our new corporate headquarters. share-based arrangements. share-based arrangements. 2010, respectively. 2012. Non-competition agreement Postretirement benefits Postretirement benefits Operating leases Operating leases Contractual cash obligations We have issued a July-08 November-08 November-08 January-09 April-09 September-09 October-09 March-10 March-10 March-10 March-10 seasonality. product returns. We currently have long-term notes receivables bearing interest rates of 15% which are recorded at fair value. A change in long-term interest rates for comparable types of instruments would have the effect of us recording changes in fair value through our statement of operations. Report of Independent Registered Public Accounting Firm Consolidated Balance Sheets—December 31, Consolidated Statements of Operations—Years Ended December 31, Consolidated Statements of 30 Notes to Consolidated Financial Statements—Years Ended December 31, Financial Statement Schedule Supporting Consolidated Financial Statements Schedule II—Valuation and Qualifying Accounts Assets Current assets: Cash and cash equivalents Restricted cash Accounts receivable (less allowance for doubtful accounts of $306,133 in 2010 and $205,314 in 2009) Unbilled revenue Inventories, net Recoverable income taxes Deferred income taxes Consignment inventory Other current assets Total current assets Investment in joint venture Property, plant and equipment, net Intangible assets, net Other assets Deferred income taxes Total assets Liabilities and Stockholders' Equity Current liabilities: Accounts payable Other accrued expenses Customer deposits Income tax payable Total current liabilities Deferred income taxes Other accrued expenses, net of current portion Total liabilities Commitments and contingencies Stockholders' equity: Preferred stock, par value $.01 per share; Authorized 1,000,000 shares, none outstanding Common stock, par value $.01 per share; Authorized 25,000,000 shares; Additional paid-in capital Accumulated other comprehensive loss: Foreign currency translation Minimum pension liability Retained earnings Less 2,139,982 of common shares in treasury, at cost Total stockholders' equity Total liabilities and stockholders' equity Net revenues Cost of revenues Gross profit Selling and administrative expenses: Selling Administrative Goodwill impairment Total selling and administrative expenses Gain on transfer of assets Gain (loss) on sale or disposal of assets Income (loss) from operations Interest income Interest expense Equity in income (loss) of joint venture Other income (expense), net Earnings (loss) before income taxes Income tax benefit (expense) Net earnings (loss) Basic earnings (loss) per share Diluted earnings (loss) per share Weighted average shares outstanding: Basic Diluted Balance at December 31, 2007 Comprehensive Loss: Net loss Foreign currency translation Unrealized loss on investments in securities, net of tax Adjustment to minimum pension liability Comprehensive Loss Issuance of 123,625 shares of common stock upon exercise of stock options Issuance of 69,000 shares of common stock under the restricted stock plan Issuance of 19,642 shares of common stock under the employees stock purchase plan Stock Buyback Income tax benefit related to stock option plans Stock compensation expense Balance at December 31, 2008 Comprehensive Income: Net income Foreign currency translation Unrealized gain on investments in securities, net of tax Adjustment to minimum pension liability Comprehensive income Issuance of 99,615 shares of common stock under the restricted stock plans Issuance of 15,551 shares of common stock under the employees stock purchase plan Stock compensation expense Balance at December 31, 2009 Comprehensive Income: Net income Foreign currency translation Unrealized gain on investments in securities, net of tax Adjustment to minimum pension liability Comprehensive income Issuance of 105,875 shares of common stock upon exercise of stock options Issuance of 51,230 shares of common stock under the restricted stock plans Issuance of 12,359 shares of common stock under the employees stock purchase plan Income tax benefit related to stock option plans Stock compensation expense Balance at December 31, 2010 Cash flows from operating activities: Net earnings (loss) Adjustments to reconcile net earnings (loss) to net cash provided by operating activities: Provision for doubtful accounts Provision for obsolete inventory Provision for warranty Depreciation of other assets Depreciation of property, plant and equipment Amortization of intangibles Equity in (income) loss of joint venture Goodwill impairment Loss on forward contracts Loss (gain) on the sale of assets Loss (gain) on disposal of assets Deferred income taxes Share-based compensation expense Excess tax benefits from share-based arrangements Changes in assets and liabilities: Accounts receivable Unbilled revenue Inventories Consignment inventory Other current assets Accounts payable Other accrued expenses Customer deposits Current income taxes Other assets Net cash provided by operating activities Cash flows from investing activities: Acquisitions, net of cash acquired Investment in joint venture/return of investment Decrease in restricted investments Capital expenditures Proceeds from sale of assets Proceeds from sales of investments in securities Net cash provided by (used in) investing activities Cash flows from financing activities: Increase in checks outstanding in excess of bank balances Proceeds from employee stock purchase plan Payments under share repurchase program Proceeds from exercise of stock options Excess tax benefits from stock options exercised Net cash provided by financing activities Effect of exchange rate changes on cash and cash equivalents Net increase (decrease) in cash and cash equivalents Cash and cash equivalents at beginning of year Cash and cash equivalents at end of year per share amounts) Presentation product returns. The Company the notes receivables, based on ongoing monitoring of the counterparty’s financial position and results of operations. Digital and lighting equipment on consignment amounted to approximately $0.06 million and $0.5 million at December 31, 2012 and 2011, respectively. equipment over their fair value. Basic earnings (loss) per share: Earnings (loss) applicable to common stock Weighted average common shares outstanding Basic earnings (loss) per share Diluted earnings (loss) per share: Earnings (loss) applicable to common stock Weighted average common shares outstanding Assuming conversion of options and restricted stock awards outstanding Weighted average common shares outstanding, as adjusted Diluted earnings (loss) per share Warranty accrual at December 31, 2007 Charged to expense Amounts written off, net of recoveries Foreign currency translation adjustment Warranty accrual at December 31, 2008 Charged to expense Amounts written off, net of recoveries Foreign currency translation adjustment Warranty accrual at December 31, 2009 Charged to expense Amounts written off, net of recoveries Foreign currency translation adjustment Warranty accrual as of December 31, 2010 Comprehensive income (loss): Net income (loss) Other comprehensive income (loss): Unrealized gain (loss) on investment in securities Foreign currency translation adjustment Adjustment to minimum pension liability Total comprehensive income (loss) Current assets Non-current assets Current liabilities Non-current liabilities Equity Revenue Cost of sales Selling and administrative expenses Operating income (loss) Other expense Net income (loss) July-08 November-08 November-08 January-09 April-09 September-09 October-09 March-10 March-10 March-10 March-10 Raw materials and components Work in process Finished goods Land Buildings and improvements Machinery and equipment Office furniture and fixtures Total properties cost Less accumulated depreciation Net property, plant and equipment Intangible assets subject to amortization: Customer relationships Trademarks Non-competition agreement Total Intangible assets subject to amortization: Customer relationships Trademarks Non-competition agreement Intangible assets not subject to amortization: Trademark Total 2011 2012 2013 2014 2015 Employee related Interest and taxes Acquisition and related accruals Post-retirement benefit obligation Legal and professional fees Warranty obligation Other Total Acquisition and related accruals Post-retirement benefit obligation Other Total United States Foreign Current: Federal expense (benefit) State expense (benefit) Foreign expense Deferred: Federal expense (benefit) State expense (benefit) Foreign expense (benefit) Expected tax expense (benefit) State income taxes, net of federal effect Foreign tax rates varying from 34% Tax-exempt interest Non-deductible goodwill Other Deferred tax assets: Non-deductible accruals Inventory reserves Warranty reserves Net operating losses Uncollectible receivable reserves Accrued group health insurance claims AMT credit carry forward Stock compensation expense Depreciation and amortization Other Net deferred tax assets Deferred tax liability—equity in loss of joint venture Net deferred tax assets Cash paid during the year for: Interest Income taxes 2012. Options the options at the date of grant. The expected life of options is the average number of years the Company estimates that options will be outstanding. The Company considers groups of associates that have similar historical exercise behavior separately for valuation purposes. Outstanding at December 31, 2007 Granted Exercised Forfeited Outstanding at December 31, 2008 Granted Exercised Forfeited Outstanding at December 31, 2009 Granted Exercised Forfeited Outstanding at December 31, 2010 Exercisable at December 31, 2010 date indicated. $0.62 $4.25 $8.32 $0.62 to 8.32 2.8 years. 2.4 years. Nonvested at December 31, 2008 Granted Shares vested Shares forfeited Nonvested at December 31, 2009 Granted Shares vested Shares forfeited Nonvested at December 31, 2010 Risk-free interest rate Dividend yield Expected volatility Expected term (years) Estimated grant date fair value contracts to manage a portion of this risk. The Company has recorded expenses related to the Plan of approximately $0.6 million, The following table sets forth the Reconciliation of benefit obligation Benefit obligation at January 1 Interest cost Benefits paid, net of contributions Actuarial gain Benefit obligation at December 31 Fair value of plan assets at December 31 Funded status at end of year Amounts recognized in the balance sheet consist of: Noncurrent assets Current liabilities Noncurrent liabilities Accumulated other comprehensive income Net amount recognized Net actuarial gain Total accumulated other comprehensive income Interest cost Amortization of gain Net periodic benefit cost recognized was: Net actuarial gain (loss) Amortization of (gain) loss Total recognized in accumulated other comprehensive income Total recognized in net periodic benefit cost and accumulated other comprehensive income year is expected to be insignificant. Discount rate Rate of compensation increase Health care cost trend rate Discount rate Expected long-term rate of return on plan assets Rate of compensation increase Health care cost trend rate Effect on total service and interest cost components of periodic postretirement health care benefit cost Effect on the health care component of the accumulated postretirement benefit obligation For measurement purposes, a Benefit cost Employer contribution Plan participants' contributions Benefits paid The Company expects to contribute 2013. 2011 2012 2013 2014 2015 2016 - 2020 service, if any. Operating leases Net revenue Theatre Products Services Total theatre Lighting Other Total revenue Operating income (loss) Theatre Products Services Total theatre Lighting Other Total segment operating income Unallocated general and administrative expenses Gain on disposal or transfer of assets Interest, net Equity in loss of joint venture Other income (loss) Income (loss) before income taxes Expenditures on capital equipment Theatre Products Services Total theatre Lighting Total Depreciation, amortization and impairment Theatre Products Services Total theatre Lighting Total Gain (loss) on disposal of long-lived assets Theatre Products Services Total theatre Lighting Other Total Identifiable assets Theatre Products Services Total theatre Lighting Total Summary by Geographical Area Net revenue United States Canada China Asia (excluding China) Mexico South America Europe Other Total Identifiable assets United States China Asia (excluding China) Canada Total 2010: Net revenue Gross profit Net earnings Basic and diluted earnings per share: Basic(2) Diluted(2) Stock price: High Low 2009: Net revenue Gross profit Net earnings(1) Basic and diluted earnings per share: Basic(2) Diluted(2) Stock price: High Low Allowance for doubtful accounts and notes Year ended December 31, 2010— Allowance for doubtful accounts Year ended December 31, 2009— Allowance for doubtful accounts Year ended December 31, 2008— Allowance for doubtful accounts Inventory reserves Year ended December 31, 2010— Inventory reserves Year ended December 31, 2009— Inventory reserves Year ended December 31, 2008— Inventory reserves 2012. 2010. By: By: By: By: Assets Current assets: Cash and cash equivalents Accounts receivable Total current assets Digital equipment Total assets Liabilities and Members' Equity Current liabilities: Accounts payable Current portion of long-term debt Deferred revenue Accrued property taxes Due to related parties Other accrued expenses Total current liabilities Virtual print fees Customer deposits Deferred revenue, net of current portion Long-term debt, net of current portion Total liabilities Members' equity Total liabilities and members' equity Digital equipment revenues Installation revenues Total revenues Cost of revenues Gross profit (loss) Operating expenses Selling and marketing expenses Administrative expenses Income (loss) from operations Interest expense, net Income (loss) before income taxes Income tax expense Net income (loss) Cash flows from operating activities: Net income (loss) Adjustments to reconcile net income (loss) to net provided by operating activities: Depreciation of digital equipment Interest on long-term debt Non-cash effect of digital equipment sold Changes in assets and liabilities: Accounts receivable Accounts payable Accrued property tax Due to related parties Other accrued expenses Deferred revenue Customer deposits Virtual print fees Net cash provided by operating activities Cash flows from investing activities: Purchases of digital equipment Net cash used in investing activities Cash flows from financing activities: Payments on long-term debt Proceeds from the issuance of long-term debt Proceeds from member contributions Distribution to members Net cash provided by (used in) financing activities Net increase in cash and cash equivalents Cash and cash equivalents at beginning of year Cash and cash equivalents at end of year Trade accounts receivable Accounts receivable from Digital Link I, LLC Digital equipment Less accumulated depreciation Net digital equipment Members' equity at March 31, 2008 Capital contributions Net loss Members' equity at March 27, 2009 Net loss Members' equity at March 26, 2010 Capital Distributions (unaudited) Net income (unaudited) Members' equity at March 25, 2011 (Unaudited) Cash paid during the period for: Interest Taxes
incorporation or organization)4350 McKinley Street, 68112Registrant'sRegistrant’s telephone number, including area code:(402) 453-4444Common Stock, $0.01 par value NYSE AmexMKTýxýxýx No oox No oRegistrant'sRegistrant’s knowledge, in definitive proxy or information statements incorporated by reference in Part III of this Form 10-K or any amendment to this Form 10-K. ýx"accelerated filer"“accelerated filer”, "large“large accelerated filer"filer” and "smaller“smaller reporting company"company” in Rule 12b-2 of the Exchange Act.ýxýxCompany'sCompany’s voting common stock held by non-affiliates, based upon the closing price of the stock on the NYSE AMEX (formerly the American Stock Exchange)MKT on June 30, 20102012 was approximately $103.3 million.$83,974,933. The Company does not have any non-voting common equity. As of March 8, 2011, 14,334,1174, 2013, 14,050,797 shares of common stock of Ballantyne Strong, Inc., were outstanding.Company'sCompany’s Proxy Statement for its Annual Meeting of Stockholders to be held on May 4, 20119, 2013 are incorporated by reference in Part III, Items 10, 11, 12, 13 and 14. Ballantyne Strong Inc. (the "Company") is filing this Amendment No. 1 to its Annual Report on Form 10-K for the fiscal year ended December 31, 2010 to reflect the inclusion under Part IV, Item 15 of this report, of separate financial statements of Digital Link II, LLC, a fifty percent or less owned entity of the Company, as required under SEC Rule 3-09 of Regulation S-X. Pursuant to Rule 3-09, Digital Link II, LLC was not a "significant subsidiary" at December 31, 2010. Therefore, the financial statements for Digital Link II, LLC's fiscal year ended March 25, 2011 are unaudited. However, audited financial statements for Digital Link II, LLC's prior two fiscal years are included as required. This Amendment No. 1 did not impact the Company's revenue, net earnings, total assets, stockholders' equity or earnings per share. Except as stated above, no other information included in the original Form 10-K is being amended. The remaining items contained within this Amendment No. 1 consist of all other items contained in the original Form 10-K, and are included for the convenience of the reader. This Amendment No. 1 continues to speak as of the date of the original Form 10-K and the Company has not updated the disclosures in this Amendment No. 1 to speak as of any later date. Accordingly, this Amendment No. 1 should be read in conjunction with Company filings made with the Securities and Exchange Commission subsequent to the filing of the original Form 10-K.Page No. PART IItem 1. Business 3Item 1A. Risk Factors13PART I Business 1 Item 1A. Risk Factors 7 Item 1B. 1810 Properties Properties1810 1810 Mine Safety Disclosures Removed and Reserved1810 Registrant'sRegistrant’s Common Equity, Related Stockholder Matters and Issuer Purchases of Equity Securities1910 2213 Management'sManagement’s Discussion and Analysis of Financial Condition and Results of Operations2213 3423 3524 7253 7253 7455 7455 7455 7455 7455 7455 55 Signatures 74 Signatures7556 Company'sCompany’s worldwide web site, or otherwise, by or on behalf of the Company. For these statements, the Company claims the protection of the safe harbor for forward-looking statements contained in the Private Securities Litigation Reform Act of 1995."Risk Factors"“Risk Factors” section contained in Item 1A. Given the risks and uncertainties, readers should not place undue reliance on any forward-looking statements and should recognize that the statements are predictions of future results which may not occur as anticipated. Actual results could differ materially from those anticipated in the forward-looking statements and from historical results, due to the risks and uncertainties described herein, as well as others not now anticipated. New risk factors emerge from time to time and it is not possible for management to predict all such risk factors, nor can it assess the impact of all such factors on our business or the extent to which any factor, or combination of factors, may cause actual results to differ materially from those contained in the forward-looking statements. Except as required by law, the Company assumes no obligation to update forward-looking statements to reflect actual results or changes in factors or assumptions affecting such forward-looking statements.(a) (a) General Description of Business Description of BusinessGeneralCorporationcorporation and maintain our corporate office and primary manufacturing facilitiesoffices in Omaha, Nebraska. We were founded in 1932 as a designer and manufacturer of film projectors. Over the past 80 years, we have expanded our product lines and services to meet the needs of the ever-changing and technologically-advancing theatre exhibition industry. Further, we have broadened our offerings through acquisitions to include a lighting division that services architectural, entertainment, and other commercial needs. We went public in 1995.1995 and now primarily operate within two business segments: theatre and lighting. Approximately 98%, 98% and 97% of our sales were from theatre products for the years ended 2012, 2011 and 2010, respectively. Our shares are traded on the NYSE AmexMKT under the symbol BTN. We primarily operatetwo business segments, theatretheir reach. Our NOC remotely monitors, tracks, programs, upgrades, and lighting. Approximately 97%fixes a full range of fiscal year 2010 sales were from theatre productssystems for all makes of digital projection, audio systems, menu display boards, and approximately 3% were from lightingthe associated network systems. It is complemented by a responsive team of on-the-ground service technicians spread across North America and Asia who install and service digital and audio equipment and products. exhibition industry on a worldwide basis. Through our Strong® trademark,Strong® branding, we can fully outfit and automate all aspects of a cinematic theatre including digital projection, booth for both filmcinema screens, library management systems, smart digital signage, flat panels and digital projection. Our portfoliocomplete state of cinema trademarks include: Apogee®, Century®, Optimax®the art sound systems, including Dolby Surround, Barco Auro 11.1, and Strong Digital Systems®. Our lighting brands include: Gladiator®, Radiance®, Sky-Tracker®, Solutions™, Strong Britelight® and Technobeam®.QSC Sound Systems. We have sales and service offices in Hong Kong, Beijing and Shanghai, China. We also manufacture cinema screens in Joliette, Canada, through our Strong/MDI Screens Systems, Inc. subsidiary. We have a centralized Network Operating Center to tracksales and services offices across North America and Asia.all makesthe transaction were $2.0 million. The strategic initiative is expected to be completed by the end of digital projection and audio systems, flat panels and the associated network systems. We also have an extended network of service technicians located throughout the country to install and service film, digital and other cinema and non-cinema products. We also design, develop, manufacture and distribute lighting systems to the worldwide entertainment lighting industry through our Strong Entertainment lighting division.Divestitures During the second quarter of 2008, we sold our coater and marinade product line in exchange for $0.3 million in cash. The product line was sold to a former Chief Financial Officer of the Company.(b) Operating Segments (b) Operating Segments and service of film and digital projection equipment, screens and accessories primarily for the movietheatre exhibition industry.distributionservice of lighting systems to the worldwide industries for architectural, entertainment and other commercial lighting industry.needs.2320 of our consolidated financial statements for further information concerning the amounts of revenues, profits and total assets attributable to each segment for the last three fiscal years.(c) Narrative Description of Business (c) Narrative Description of Business theour Company. According toNational Associationtheatre exhibition industry. The systems include a wide spectrum of Theatre Owners, there are approximately 107,000premier audio-visual products and accessories such as: digital projectors, state of the art projection screens, worldwide that play major movie releases, with approximately 39,000 screens located inservers and library management systems, digital signage and menu boards, flat panels, and sound systems. Services provided include: the United States. The industry is inmonitoring, upgrade, and repair and maintenance of existing systems; the midstinstallation of a significant transformation from film to digital equipment. Theatrenew theatre exhibition companies aresystems and related equipment; and complete film-to-digital theatre conversion services, retrofitting their existing complexes by removing the film equipmentprojectors and replacing itthem with digital equipment. The monitoring, upgrade, maintenance and repair of networked systems are performed by our Network Operations Center (“NOC”) using, as much as possible, remote, smart technology to identify and troubleshoot software and other system issues. Hardware upgrades, installations, maintenance and repair services are performed onsite by on-the-ground technicians.an opportunityproactive solutions to systems issues before they cause system failures. Our remote services include systems monitoring and maintenance, software upgrades, and system repairs. By utilizing NOC personnel to solve customer issues whenever possible, we eliminate travel time and expenses normally incurred by sending a technician onsite for usrepairs. Many issues that don’t involve parts replacements or physical contact with the hardware can be handled remotely using our remote assistance technologies.deliverresolve systems issues that cannot be fixed remotely; they are certified to install and service digital products and audio equipment for all manufacturers including the equipment of our competitors. We offer cabling, wiring, and installation and maintenance services as this conversion continues.ProductsEquipmentProjectors—Through distribution agreements with NEC and its subsidiaries,BARCO, we distribute DLP Cinema projectors. NEC offers the NC3200S for large screen multiplexes, the NC2000C for medium- sized screens and the NC1200C for small theatres. AllBoth manufacturers of the projectors use the DLP cinema technology from Texas Instruments. The Starus NC3200SNEC offers DLP Cinema projectors ranging from their NC900 projector for screens up to 31 feet wide to the NC3240S which is a 4K projector designed for multiplexes with large screens up to 105 feet wide. TheBARCO offers DLP Cinema projectors ranging from their DP2K-10SX projector delivers 2K (2048 × 1080) resolution, 3D capabilities and high contrast images (>2200:1). The NC2000 projector is designed for medium sized screens up to 65 feet wide. The projector delivers 2K (2048 × 1080) resolution, 3D capabilities and high contrast images (>2200:1). The NC1200C projector is designed for screens up to 4633 feet wide to employ DC 2K DMD technology at 2048 × 1080 pixel native resolution. Prior to the release of the updated series ofDP4K-32B cinema projector which is an ultra-bright enhanced 4K cinema projector for screens up to 105 feet.2010, we sold NEC's first series of projectorsNorth and South America, including the Starus NC 2500S-A, NC 1600C-ACaribbean. In China we have distribution rights to sell NEC and the NC 800C.the Company distributes GDC'swe distribute GDC’s line of digital cinema servers in North and South America; however, we also distribute servers of certain of GDC's competitors as well.for digitalwhich, coupled with the cinema projectors including, but not limited to, replacement parts, lenses, lampsprojector, server and automations, among other items. The digital equipment we manufacture and distributeintegrated media block, can fully outfit and automate a movie projection booth. Motion Picture Projection EquipmentDigital Audio Systems——We aredistribute a manufacturer and distributorrange of commercial motion picture projection equipment worldwide. Our commercial motion picture projection equipment can fully outfit and automate a motion picture projection booth and consists of 35mm and 70mm motion picture projectors, xenon lamphouses and power supplies, a console system combining a lamphouse and power supply into a single cabinet, soundhead reproducers and related products such as sound systems. The commercial motion picture projection equipment is marketed under the industry-wide recognized trademarks of Strong® and Simplex®. We manufacture the majoritystate of the motion picture projectionart digital audio systems, in-house, except forincluding surround and 3D sound technologies from the following manufacturers: Dolby, Barco and QSC. Our technicians are certified by each manufacturer to install, service and maintain these audio rack components, lamps and lenses. This equipment may be sold individually or as an integrated system with other components manufactured by us.systems. We also distribute film handling equipment consisting of a three-deck or five-deck platter and a make-up table, which allows the reels of a full-length motion picture to be spliced together, thereby eliminating the need for an operator to change reels during the showing of the motion picture. Our film transport systems are sold under the Strong® name. In most instances, a screen can be used interchangeably with either a digital or film projector. There are certain digital 3D applications, such as the technology by RealD, that require special "silver"unique “silver” screens that we manufacture and were specially designed for digital or 35mm projection.manufacture. We manufacture screens for the IMAX Corporation that are primarily used in large-format applications.applications on a global basis.Phillips. Replacement Parts—We have a significant installed base of 35,000 to 40,000 motion picture projection systems. Although these products have an average useful life in excess of 20 years, periodic replacement of components is required as a matter of routine maintenance, in most cases with parts manufactured by us.Philips. We also distribute parts to the growing digital cinema baseother brands of projectors.xenon lamps as requested by our customers.selldistribute digital and film projection lenses throughout the world. Service & Maintenance—Through our wholly owned subsidiary, Strong Technical Services, Inc. (STS) we are a national provider of cinema services including film and digital projector maintenance, repair, installations, site surveys and other services. In response to increased demand for service we opened a state-of-the-art Network Operating Center in October 2010. This facility is capable of tracking a full range of digital equipment from all makes of digital projection and audio systems, flat panels and the associated network systems through our staff of hardware, network and engineering professionals. Our technicians are certified to install and service all digital, film and audio equipment, and related peripherals including the equipment of our competitors. We also offer service contracts to the theatre exhibition industry whereby for an agreed upon fee, a series of maintenance or repair services will be performed.Markets Our theatre business was founded in 1932. Our broad range of both standard and custom-made equipment along with other ancillary equipment can completely outfit and automate a digital or film movie projection booth.andas well as through a network ofcertain domestic and international dealers primarily to major theatre exhibitors. During the past few years we have increasingly solddirectly to the end-users thereby bypassing this distribution network. We believe this trend will continueexhibitors in the future and is changing how we market our products to the industry due in large part to the shift to digital cinema.cinema world. Sales and marketing professionals target new business opportunities and principally develop business by maintaining regular personal customer contact including conducting site visits, while customer service and technical support functions are dispatched when needed. In addition, we market our products in trade publications such asFilm Journal and andBox Office and by participating in annual industry trade shows such as CinemaCon, ShowEast, CineAsia in Asia and Cinema Expo in Europe, among others.and other regional exhibitions. Our sales and marketing professionals have extensive experience with the Company'sCompany’s product lines and have long-term relationships with many current and potential customers.throughout the industry.current non-exclusive master reseller distribution agreements with NEC and BARCO allow us to market digital projectors in North and South America, including the Caribbean. In addition,China we have distribution rights to sell NEC and BARCO and can distribute NEC products in China, Hong Kong and certain other areas of Asia. We do not have any territorial restrictions for any of our other products and services.Competitionhighly competitive.price, product quality, features and customer support. Competition in the digital cinema equipment market includes twoone other licensed OEM'sOEM of the Texas Instruments' 2KInstruments’ DLP Cinemacinema technology besides our partner, NEC;partners NEC and BARCO: Christie Digital Systems and Barco.Systems. We also compete with SONY, which uses its own 4K digital cinema technology. During 2009, SONY made significant inroads into gaining market share when they announced agreements with Regal Cinemas, Inc. and AMC Entertainment, Inc. to deploy their 4K digital cinema projectors into these two large circuits. In response to this threat, Texas Instruments developed their own 4K resolution solution which will be ready during 2011. We believe that once the DLP 4K solution is ready for sale; the perceived difference in resolution will diminish. We compete in the digital marketplace primarily on the basis of fulfillment and delivery, price and after-sale technical support.technologyourselves and Christie Digital Cinema.Cinema and ourselves. There are several other smaller scale providers in the market. Film Equipment—Major competitors for our products in the film cinema marketplace include We compete with Christie Digital Systems, Cinemeccanica SpABARCO, and Kinoton GmbH. The marketConvergent and other providers for film products in the U.S. primarily comes from the sale of replacement parts and lenses due to the transition to digital cinema, which has significantly affected the sale of film projectors. We continue to sell film projectors to other parts of the world that are not as advanced regarding digital cinema. We compete overseas based on price, product name and customization capabilities.NOC services. We cannot assure that our equipment, whether it is film or digital equipment will not eventually become obsolete as technology advances. For a further discussion of potential new competition, see the "Business Strategy" section of this report under the caption "Expand Digital Opportunities". The majority of our competitors for film and digital equipment have significantly greater resources than Ballantyne.OverviewStrong®Strong®, we are a developer, manufacturer and supplier of long-range followspots andas well as other entertainment and architectural lighting products for architectural, theatrical, promotional, stage and studio purposes. Our products include an ever-expanding line of LED lighting, which are usedmore effective, efficient and environmentally sound. We provide installation and maintenance services for our lighting product lines for both permanent and touring applications.Table Our lighting is installed to accentuate premier architectural sites, in sporting arenas and facilities, theatres, auditoriums, theme parks, amphitheaters, stadiums, music venues, and is used in touring applications for the entertainment and other industries. While the majority of Contentsour lighting products are mass-produced and fitted to our clients’ project and property needs, we do perform commissioned work for one-of-a-kind lighting needs. For these projects, we can provide project management services, including design, engineering, manufacture, installation, and continued service. Our most notable lighting commission to date is the beacon light atop of Freedom Tower at the new World Trade Center, which will be placed in 2013.ProductsFollowspots Followspots—We have been a developer, manufacturer and distributor of long-range followspots since 1950. Our followspots are primarily marketed under the Strong®Strong® trademark and include recognized trademarked models such as Super Trouper®Trouper® and Gladiator®Gladiator®. The Super Trouper® followspot has been the industry standard since 1958. Our long-range followspots are high-intensity general usegeneral-use illumination products designed for both permanent installations, such as indoor arenas, theatres, auditoriums, theme parks, amphitheatres and stadiums, and touring applications. Our manufactured followspot line consists of six basic models ranging in output from 850 watts to 4,500 watts.installations. Lower wattage models which have a range of 20 to 110 feet, are compact, portable and appropriate for small venues and truss mounting. The 4,500-watt model, which has a range of 300 to 600 feet, is amounting; high-intensity xenon light followspotmodels are appropriate for large theatres, arenas and stadiums. Most of our followspots employ a variable focal length lens system which increases the intensity of the light beam as it is narrowed from flood to spot.sectionsegment of the marketplace demanding less expensive, smaller and more user-friendlyuser and environmentally friendly products, we have introduced certain new spotlightsfollowspots over the last few years. We distribute an Italian manufacturedyears, including the Canto, Solutions™ and Neeva™ product lines. Canto, the Italian-manufactured followspot line called Canto. The Canto spotlight product line, consists of seven basic models ranging in output from 250 watts to 2,000 watts. Promotional and Other Lighting Products—We are a supplier of high intensity promotional searchlights and lighting systems for the motion picture production, television, live entertainment, theme park and architectural markets. Strong Britelight® specialty illumination products have been used in numerous feature films and have also been used at live performances such as Super Bowl half-time shows, the opening and closing ceremonies of the Winter Olympics and are currently illuminating such venues as the Luxor Hotel and Casino and the Stratosphere Hotel and Casino in Las Vegas, Nevada.models. Our Sky-Tracker® high intensity promotional searchlights come in single or multiple head configurations, primarily for use at outside venues requiring extremely bright lighting that can compete with other forms of outdoor illumination. These high intensity promotional searchlights have been used at Walt Disney World, Universal Studios, various Olympic Games and grand openings. We purchased a product line during 2007 called Technobeam® which projects logos, images and textures. This product is used in a variety of entertainment establishments. In 2008 we expanded our effort to add new distribution lines to our lighting offerings. These new lines include a broad set of LED products marketed under the Litetude™ that are made for us in China and expanded offerings from our Italian supplier of Canto. In 2010 we signed an agreement to be the exclusive distributor of the DTS line of lighting products. DTS is another Italian manufacturer that supplies us with a wide-range of entertainment and architectural lighting products. LED Products—During 2010, we introduced two new lines of LED lighting fixtures. The first product line will be marketed under the trademark namefixtures, introduced during 2010, include both Solutions™. The line primarily is made up of two 650 watt fixtures. One, the Solutions 650, is a white LED fixture and the second, the 650C, is a color mixing RGB fixture.Neeva™. These lights are designed to fill a demand for efficient long-throw LED basedLED-based lighting solutions for the entertainment lighting marketplace. We also intend to market these products to theand architectural lighting markets. The second new product line is marketed undermarketplaces.trademark name Neeva™. Neeva isfixture(s) and can provide project management services to clients from inception to installation. We can also work as a unique product that fulfills the promisemember of a larger project management team for highly controllable LEDcomplex jobs. Jobs of note to date include the beacon light source that is positionedatop Freedom Tower at a modest cost.the new World Trade Center, NASA Space Shuttle lighting, and the beacon light atop the iconic pyramid-shaped Luxor Hotel and Casino in Las Vegas, Nevada.Marketsand equipment rental companies.companies, entertainers and managers and owners of premier architectural sites worldwide. Our followspot products are marketed using the Strong®Strong® trademark and are used in over 100 major arenas throughout the world. Our high intensity promotional searchlightsare marketed under the Sky-Tracker® trademark. We expect to market our new LED products primarily through our existing sales channels.Strategy Our goal is to increase revenues using the remaining product lines within the segment and by increased emphasis on expanding our product offerings by developing and introducing new products such our new LED product offerings. Many of our competitors have significantly greater resources than Ballantyne.Business Digital Opportunities.Service and Network Operations Center within our current market and to other strategic growth markets. We currently are a partyhave made significant investments in capital and technical resources over the past several years in strengthening our core service capabilities which include monitoring, installation and repair of equipment, cabling, and wiring. These strengths along with our strong customer relationships, will allow us to distribution agreements with NEC and their subsidiaries whereby we distribute their line of DLP Cinema projectors to certain areas of the world. We intend to gain market shareexpand our core service offerings not only in the digital cinema marketplace by leveraging our currenttheater industry leadership and relationships and gaining additional territoriesbut in to distribute product under our distribution agreements with NEC. We believe we can be a successful participant in the marketplace due to our agreements with NEC, our long term industry relationships, and the industry's familiarity with our Company and its large installed base worldwide. However, no assurance can be given that we will continue to be a part of the digital cinema marketplace. If we are unable to take advantage of future digital cinema opportunities or respond to the new competitive pressures, the result could have a material adverse effect on our business, financial condition, and operating results.other markets as well. In addition, the current relationships with NEC are through non-exclusive distributorship agreements, some of which can be terminated by either party upon 90 days notice. In addition, the gross margin we generate based on these distribution agreements is lower than the margin we experience on our film projectors. We have experienced an increase in price points and sales volume that has partially offset the lower margin; however, we cannot provide assurance that this trend will continue as the digital rollout continues to progress. Expand Service Company. Our service subsidiary, Strong Technical Services, Inc. (STS) installed approximately 2,000 digital units in 2010, cementing our presence as the leader in digital installations. We have also entered into agreements to perform cabling and electrical installations for theatres throughout the country, establishing STS as a major force in digital rollouts for the entire industry. Capitalizing on our growth, capabilities and strategic partnerships, we have expanded our offerings to include cabling, wiring, digital menu boards, and digital signage. As a result of the above mentioned development and growth, we are in a position to increase our services contracts by 300 new digital locations including Barco, Sony, and Christie equipment. Building off the great reputation of the entire Ballantyne Strong, Inc. company we are able to work with industry leaders and we are currently working on major contracts to expand our services. It is our belief that with our capabilities in the field and corporate offices, we will expand our reach into the technology field of many organizations beyond the cinema world. Network Operations Center. We completed the build-out of a Network Operations Center (NOC) in October 2010. Our business strategy associated with this development was to leverage our technical capabilities while meetingwithin our NOC allow us to meet industry demands for remote systems monitoring for digital systems monitoring. The NOC operates 24/7/365 utilizing Level Iequipment and Level II engineers to monitor our customers' equipment across securevirtual private network ("VPN") links. High priority notifications automatically generate trouble tickets with the appropriate escalation procedures. Normal incident tracking procedures ensure the timely resolution of trouble tickets. When one of our NOC personnel observes an issue, the customer is proactively notified to explain the issue and begin the resolution process. Many issues are addressed by our NOC engineering team without having to dispatch a technician to the customer's location. By utilizing NOC personnel to solve customer issues whenever possible, we eliminate travel time and expenses normally incurred by sending a technician on site for repairs. Nearly any issue that doesn't involve parts replacements or physical contact with the hardware can be handled remotely using the available remote assistance technologies. We are anticipating growth in NOC revenues from monitoring digital cinema equipment, back room operations and from industriesin other markets outside cinema. Transition from a Manufacturer to a Distributor.Expand Product Sales Opportunities. We believe that the digital transition taking place within the theatre industry will continue to substantially reduce the demand for the products we manufacturebundle and that we will transition to more of a distributionaggressively cross sell all product and service business model. However, we believe thatofferings to existing market channels tapping into our solid customer relationships in the Company will continue to manufacture film equipment parts for a period of time. We will also continue to manufacture cinema screens through our screen subsidiary and will also manufacture lighting products for our lighting segment. We continue to reduce costs at our Omaha manufacturing facility through a cost and inventory reduction program designed to bring costs and inventory in line with declining revenues and production. Expand Screen Business. Our screen production facilities have been expanded to provide increased capacity to support the market demand for silver (3D) screens and jumbo screens, as well as serving the needs of the growing international markets. The plant has been refitted with state of the art radio frequency PVC welders and coating automation and application equipment, which has been specifically engineered to meet the high tolerance demands of our product lines while improving production efficiencies. The expanded production capabilities also provide an opportunity for our company to expedite screen deliveries through our "Fast-Track" service and capitalize on immediate demand orders. Strong/MDI is also developing new silver and gain coating formulations to enhance screen performance and expand our product offerings. Growth Strategy. The management team is aggressively pursuing all growth opportunities as outlined in these respective areas.segments. In addition, we are looking for new product offerings either through distribution channels or via in-house development that fit well with our current product portfolio and our current markets as well as adjacent markets such as security and energy management which lend themselves well to our technical capabilities and expertise.when appropriate will dynamically pursue acquisition targets that will complementcompleting acquisitions within areas where we can effectively leverage our strategies. Expand International Presence. We believe that internationalstrong competences as an organization, including customer service, global sales, will continue to account for a significant portion of our digital sales. We also believe that film-related sales will continue for a longer period of time than for the U.S. as the full scale rollout of digital cinema is expected to lag behind. We continue to expand ouroperations management, distribution capabilities by allocating more resourcesand channel management, and proven skill in international countries. We are also working with NEC to expand our distribution territories for selling their digital projector line beyond Northintegrating, installing and South America, Hong Kong, Chinasupporting advanced electronic components and certain other areas of Asia.software applications. Expand Lighting Segment. Our goal is to increase revenues by aggressively marketing existing product lines, while adding complementary products through exclusive distribution agreements. In addition, our engineering group has partnered with product design firms to develop new technology lighting products such as the Solutions™ LED product line.wholly ownedwholly-owned operational subsidiaries: Strong Westrex, Inc., Strong Technical Services, Inc., Strong/MDI Screen Systems, Inc., Strong Westrex, Inc. and Strong Westrex (Beijing) Trading Inc.American West Beijing Trading Company, Ltd.Kong and owns 100% of the American West BeijingKong.Company, Ltd. Strong Technical Services, Inc. was formed in 2006 upon the purchase of National Cinema Service Corp. ("NCSC") to service the film and digital marketplace. Strong/MDI Screen Systems, Inc. manufactures cinema screens and related accessories.officebusiness for China.Backlog At December 31, 2010 and 2009, we had backlogs of $24.0 million and $4.4 million, respectively. Such backlogs mainly consisted of orders received with a definite shipping date within twelve months; however, these orders are subject to cancellation. Our products are generally shipped within a few weeks following receipt of orders. The dollar amount of our order backlog is therefore not considered by management to be a leading indicator of our expected sales in any particular fiscal period. Our manufacturing operations are conducted in Omaha, Nebraska and Joliette, Canada. The Omaha facilities encompass design, fabrication, assembly and shipping of our various product lines excluding the majority of digital product lines. This central location reduces our transportation costs and delivery times of products throughout the United States. Our manufacturing strategy is to minimize costs through manufacturing efficiencies and reduce fixed costs pertaining to manufacturing film projection equipment. believe that the digital transition taking place within the theatre industry has and will substantially reduce the demand for the products we manufacture and that we will transition to more of a distribution and service business model. However, we believe that the Company will continue to manufacture film equipment parts for a period of time. We will also continue to manufacture cinema screens through our screen subsidiary in Joliette, Canada and also manufacture lighting products for our lighting segment. We are implementing programs at our Omaha facility to reduce costs through a cost and inventory reduction program designed to bring costs and inventory in line with revenues. TheQuebec, Canada. These manufacturing operations in Joliette, Canada consist of a 75,000 square-foot facility for the manufacture of cinema screen systems. These facilities include expanded PVC welding operations with programmable automations, as well as two 90-foot high screen coating towers with state of the art precision coating application software and painting systems. This world class ISO certified operation has the capability of manufacturing multiple standard screens simultaneously to large format 2D and 3D screens for cinema and special venue applications. design standards, quality control procedures and the quality standards for the material and components used in our products we manufacture, distribute or service have contributed significantly to theour reputation of the products for high performance and reliability. InspectionThe inspection of incoming materialmaterials and components as well as the testing of all of the Company'sour products during various stages of assemblythe sales and service cycle are key elements of this program.Warranty Policy We generally provide a warranty to end users for substantially all of our products, which normally covers a period of 12 months, but is extended under certain circumstances and for certain products. In most instances, our digital products are covered by the manufacturing firm's OEM warranty; however, there are certain customers where we grant warranties in excess of this warranty. Under our warranty policy, we will repair or replace defective products or components at our election. Costs of warrantyservice and product replacements were approximately $0.8, $0.3 and $0.6 million for the years ended December 31, 2010, 2009 and 2008, respectively.Patents and Trademarksnumerousvarious trademarks and trade names used in conjunction with the sale of our products. We currently own one patent. We believe our success will not be dependent upon patent or trademark protection, but rather upon our scientific and engineering capabilities and research and production techniques.Employees As We consider the following trademarks to be of March 1, 2011, we hadvalue to our business: Strong®, Radiance®, Sky-Tracker®, Super Trouper®, Gladiator®, and Solutions™.total of 289 employees.full-time basis at December 31, 2012. Of these employees, 14056 were considered manufacturing, 45 were executive, 7185 were considered service related and 7465 were considered sales and administrative. We are not a party to any collective bargaining agreement and believe that the relationship with our employees is strong.Environmental Matters We are subject to various federal, state and local laws and regulations pertaining to environmental protection and the discharge of material into the environment. During 2001, we were informed by a neighboring company of likely contaminated soil on certain parcels of land adjacent to Ballantyne's main manufacturing facility in Omaha, Nebraska. The Environmental Protection Agency ("EPA") and the Nebraska Department of Health and Human Services subsequently determined that certain parcels of Ballantyne property had various levels of contaminated soil relating to a former pesticide company which previously owned the property and that burned down in the 1960's. During October 2004, Ballantyne agreed to enter into an Administrative Order on Consent ("AOC") to resolve the matter. The AOC holds Ballantyne and two other parties jointly and severally responsible for the cleanup. In this regard, the three parties have also entered into a Site Allocation Agreement by which they will divide past, current and future costs of the EPA, the costs of remediation and cost of long term maintenance. In connection with the AOC, we have paid our share of the costs. At December 31, 2010, we have provided for management's estimate of any future payments relating to this matter which are not material to the consolidated financial statements.Stockholder Rights Plan The Company's Stockholders Rights Plan expired on June 9, 2010 in accordance with the terms of the Plan.61,63, has been our President, CEO and a member of the Board of Directors since November 2010. Mr. Cavey succeeded John Wilmers, age 66, who has retired as President, CEO and member of the Board of Directors. Mr. Wilmers will remain with Ballantyne over the next twelve months to assist in the transition and to help the business pursue opportunities in Asia.50,52, assumed the responsibilities of VP-Operations in May of 2007 and is currently Senior Vice President and Chief Operating Officer.61,63, has been Senior Vice President since 1997. Mr. Boegner joined us in 1985 and has acted in various sales roles. Kevin S. Herrmann,roles for our Company.45,56, serves as Senior Vice President, Chief Financial Officer and Treasurer. Ms. Carstens assumed the responsibilitiesrole of CFO, Corporate SecretaryChief Financial Officer in July of 2011.TreasurerSecretary. Mr. Anderson assumed the roles in November 2006. Prior to the appointment, Mr. Herrmann had been our Corporate Controller since 1997.(www.ballantyne-strong.com)(www.strong-world.com) through a link to the Securities and Exchange Commission ("SEC"(“SEC”) website, our annual report on Form 10-K, quarterly reports on Form 10-Q, current reports on Form 8-K, and amendments to those reports filed or furnished pursuant to Section 13(a) or 15(d) of the Securities and Exchange Act of 1934, as amended, as soon as reasonably practical after we electronically file such material with, or furnish it to, the SEC. However, information posted on our website is not part of the Form 10-K. The Board of Directors has adopted the following governance documents which are also posted on our website:•••••The4350 McKinley Street6811268154 2320 of our consolidated financial statements in this report.NYSE Amex Stock Exchange Certification On June 30, 2010, our Chief Financial Officer certified to the NYSE Amex that he was not aware of any violation by the Company of the NYSE Amex Corporate governance listing standards as of that date. This certification is an annual certification required by the NYSE Amex.NECsole supplierlower demand for our digital products and installation services.projectors we distributeequipment. This required the Company to commit substantial resources to the process of retrofitting existing theatre industry. Through distribution agreementscomplexes by removing the film equipment and replacing it with NEC,digital equipment, and have thusly experienced significant financial gains from this work. As the theatre exhibition industry nears the completion of this digital conversion process in 2013, we distribute their DLP Cinema projectorswill no longer be able to North and South America, the Caribbean, Hong Kong, China and certain other areasrely on that income as a major portion of Asia. These agreements are non-exclusive distributorship agreements, some of which could be terminated with 90 days advance notice.our earnings. If we are unable to maintainexpand our relationshiprevenue streams with NEC,other products and services, our future growth would be significantly curtailed.resultshealth of the theatre exhibition industry.impacteffect on our business, financial condition and operating results until we could find an alternative source of digital equipment to distribute. Further, there can be no assurance that an alternative source of digital equipment could be found on favorable terms. We are also dependent on NEC to supply us digital products in a timely manner and if there were delays in receiving product, we could lose market share which would negatively affect our operations. In addition, while the current relationship with NEC is a non-exclusive distributorship agreement and as suchhealth of the gross margin is and will be lower thantheatre exhibition industry has improved significantly over the margin we currently experience on our film projectors. We have experienced lower margins that have been partially offset by increased price points and sales volume; however, we cannot provide assurance that this trend will continuepast few years, there are still risks in the future.NEC and other vendorsour suppliers may affect our results of operations and financial performance. Weour vendors and suppliers for certainthe distribution of products in addition to the digital products we purchase from NEC.supplied by various key suppliers. We believe we have good vendorsupplier relationships and that we are generally able to obtain adequate pricing and other terms from vendors andour suppliers. However, if we fail to maintain satisfactory relationships with our vendors and suppliersthem or if our vendors and suppliers experience significant financial problems, we could experience difficulty in obtaining needed goods and services. Some vendorssuppliers could also decide to reduce inventories or increaseraise prices to increase cash flow given current economic conditions. We utilize a single contract manufacturer for each of our intermittent movement components, lenses and xenon lamps on the film side and as already discussed, NEC is currently the sole supplier for the digital projectors we distribute to the theatre industries.flow. The loss of any one or more of the contract manufacturersour suppliers could have an adverse effect on our business unless alternative manufacturing arrangements are secured. We are not dependent upon any one contract manufacturer or supplier for the balance of our raw materials and components. The industry transition to digital cinema is currently underway and during this time, there could be pricing pressures placed upon us as we market the NEC line of digital equipment. While our partnership with NEC to-date has been to strategically price the NEC projectors to the market-place, there is no assurance that if future pricing pressures arise NEC will drop their prices to allow us to remain competitive. In addition, volatility in the price for certain raw materials and components such as steel and fuel could adversely affect our financial results.Our gross margins are subject to fluctuation We expect our gross margin as a percentage of revenues to decrease in the future primarily due to increased sales of digital projection equipment which carry lower margins compared to the film products we previously manufactured. However, the sales price on the digital projectors is higher than what we receive on film projectors which offsets gross margin dollars to a degree. Gross margins could also be impacted in the future by higher film manufacturing costs pertaining to lower demand for manufactured film products. We expect to purchase film inventory components in lower quantities resulting in some raw material price increases and to experience less manufacturing throughput in the Omaha plant to cover fixed overhead costs. As sales of film projectors continue to decline, our revenues become more reliant on these lower margin digital sales completed as a distributor. To-date, we have been able to offset this with cost reductions and growing our higher margin screen manufacturing business. However, if we are unable to further lower costs as our film manufacturing decreases or there is a significant drop in demand for our higher margin screen sales, our gross margins and profits will be adversely impacted.If the current digital technology changes to a format not supported by the DLP cinema technology from Texas Instruments, we could lose our ability to participate fully in the digital cinema market place. We cannot provide assurance that there will be a continued demand for the digital cinema products we distribute. There can be no assurance that other technologies developed, or being developed, by competing companies will not gain traction in the exhibition industry which could affect our ability to fully participate in the digital cinema market place. If we were forced to participate in digital cinema in ways other than being a distributor and service provider, we may have to leverage the Company. There is no assurance that we would be able to access sufficient capital given the tightening of the global credit markets.Our 44.4% ownership in our joint venture with RealD is subject to credit and concentration risk. Digital Link II, LLC, ("Digital Link II") was formed between Ballantyne and RealD for the purposes of commercializing certain 3D technology and to fund the deployment of digital projection systems to third party exhibitors. As of December 31, 2010, Digital Link II has deployed $9.4 million of such projection equipment, net of accumulated depreciation of $1.7 million. Such equipment is subject to system use agreements with certain exhibitors whereby the exhibitors must purchase the equipment upon the occurrence of certain triggering events. However, if any of these exhibitors would file for bankruptcy protection or be unable to fulfill their commitments in other ways, Digital Link II would be forced to remove the equipment and attempt to resell such equipment. At this time, it is unclear what the financial impact would be to the joint venture, however, it would likely have a material adverse effect on Digital Link II and also our financial condition and results of operations. In addition, Digital Link II has entered into notes payable arrangements to finance a portion of the deployments. Ballantyne and RealD have provided guarantees for such notes in the event that Digital Link II would be unable to fulfill the principal and interest obligations under such notes based on their respective ownership shares. As of December 31, 2010, we have outstanding guarantees of $1.2 million (excluding interest) for our 44.4% share.increasecontinue in the future. CompetitorsCertain of the competitors for our digital equipment have significantly greater resources than we do. In addition, many of our competitors are manufacturing their own digital equipment, whereas, we employ a distribution business model through our distribution agreements withNEC. NEC, BARCO and certain other suppliers. As a result, we may suffer from pricing pressures that could adversely affect our ability to generate revenues. If we lose market share due to these issues, we may be unable to lower our cost structure quickly enough to offset the lost revenue. If we are unable to compete successfully, our business and results of operations will be seriously harmed. NEC, along with two other licensed OEM's of the Texas Instruments' DLP Cinema technology historically have held the majority of the market share for digital projection equipment. However, there are also other companies such as SONY using different digital technologies in the marketplace. During 2009, SONY made significant inroads into gaining market share when they announced agreements with Regal Cinemas, Inc. and AMC Entertainment, Inc. to display their 4K digital cinema projectors into these two large circuits. While we believe Texas Instruments is taking steps to respond to the SONY threat, there can be no assurances that they will be successful.44%approximately 19% of consolidated sales in fiscal 2010.2012, which include $15.7 million of sales in China. This compared to 22% in 2011 and $26.0 million of sales in China. We are seeking to expand our share of foreign sales, which we expect will continue to account for a significant portion of our revenues. Foreign sales are subject to political and economic risks, including political instability, currency controls, fluctuating exchange rates with respect to sales not denominated in U.S. dollars, changes in import/export regulations, tariffs and freight rates. An increasingA significant amount of our foreign sales are being denominated in foreign currencies. During 2010, such sales rosecurrencies and amounted to $22.7 million compared to $18.5$23.3 million in 2009.2012. To the extent that orders are denominated in foreign currencies, our reported sales and earnings are more subject to foreign exchange fluctuations. In addition, there can be no assurance that our remaining international customers will continue to accept orders denominated in U.S. dollars. In addition, forFor those sales which are denominated in U.S. sales,dollars, a weakening in the value of foreign currencies relative to the U.S. dollar could have a material adverse impact on us by increasing the effective price of our products in international markets. Certain areas of the world are also more cost conscious than the U.S. market and there are instances where our products are priced higher than local manufacturers. We are also exposed to foreign currency fluctuations between the Canadian and U.S. dollar due to our screen manufacturing facility in Canada where a majority of their sales are denominated in the U.S. dollar while their expenses are denominated in Canadian currency. We cannot assure that these factors will not adversely affect our foreign activities in the future.weakerweak worldwide economies may continue to negatively impact the Theatretheatre and Lightinglighting markets we serve. This environment could serve to reduce demand for our products and adversely affect our operating results. These economic conditions may also impact the financial condition of one or more of our key suppliers, including NEC and BARCO, which could affect our ability to secure product to meet our customers'customers’ demand.Our financial results and growth depend largely on the health of the theatre exhibition industry. In 2010, approximately 97% of our revenues resulted from sales to the theatre exhibition industry. From fiscal years 2000 to 2002, this industry experienced an unprecedented three-year decline. Several exhibition companies filed for federal bankruptcy protection. This resulted in our revenues declining from $83.4 million in fiscal 1999 to $33.8 million in fiscal 2002. While the health of the theatre exhibition industry has improved significantly, there are still risks in the industry which result in continued exposure to Ballantyne. In addition, growth in the number of new movie screens may The Company could also be adversely affected by such factors as changes in foreign currency rates and weak economic and political conditions in each of the economy or other factors such ascountries in which the global credit situation as the industry is very capital intensive. A lack of movie screen growth would have a material adverse effect on our business, financial condition and results of operations. The industry is in the midst of a significant transformation from film to digital equipment. Theatre exhibition companies are retrofitting their existing complexes by removing the film equipment and replacing it with digital equipment. This transformation requires significant investment and there can be no assurance that our customers will be able to obtain a sufficient amount of this capital to continue the transformation. Without access to this capital, our theatre customers would be unable to purchase our products which would have a material adverse effect on our business, financial condition and results of operations. In addition, while we expect the conversion to digital cinema to continue for a period of time, there is no assurance that once the first conversion cycle is over, there will be additional replacements of existing digital systems. If we are unable to expand our revenues streams with other products and services, our future growth could be significantly curtailed. Our42%47% of 20102012 consolidated net revenues.revenues and were from the theatre segment. Trade accounts receivable from these customers represented approximately 36% of net consolidated receivables at December 31, 2012. Sales to CDF2 Holdings represented approximately 12% of total 2012 sales and account receivable from CDF2 represented 5% of net consolidated receivables. The note receivable from CDF2 had an outstanding balance of $2.2 million at December 31, 2012. Additionally, receivables from Belmont Capital Group represented approximately 17% of net consolidated receivables at December 31, 2012. While we believe ourthe Company believes its relationships with such customers are stable, most arrangements are made by purchase order and are terminable at will by either party. A significant decrease or interruption in business from thesethe Company’s significant customers could have a material adverse effect on ourthe Company’s business, financial condition and results of operations.2010,2012, we have recorded net deferred tax assets of $1.9$3.1 million. In assessing the ability to realize the deferred tax assets, management considers whether it is more likely than not that some portion or all of the deferred tax assets will not be realized. If managementit would determinebe determined that some or all of these assets would not be realized, valuation reserves would be required which would have a material adverse affecteffect on our results of operations.Difficulty in recruiting and retaining qualified technicians could hamper our business model pertaining to our service business. We have experienced an increased demand for service due to the start of the digital conversion as theatre operators in many instances have not had the necessary technical expertise to maintain the more technical nature of digital projectors and accessories. The competition for qualified technicians isincreasing and we cannot predict whether we will experience future technician shortages. If such a shortage were to occur, we could be unable to properly provide the necessary services to our customers and subsequently lose market share. In addition, if technician salary increases were necessary to attract and retain them, our results of operations would be negatively impacted to the extent we could not pass those additional costs to our customers. We also cannot provide assurance that we will be able to successfully operate the service business in a profitable manner as we have limited experience with the volume of work that will be necessary. Our efforts to take care of our customers' needs could lead to increased and unplanned operating and capital costs.Growth through acquisition is a part of our business plan and we may not be able to successfully identify, finance or integrate acquisitions. As discussed in further detail in the "Business Strategy" portion of Item 1, our strategy is to pursue acquisitions that would fit in our business plans. We expect to make acquisitions in the future. However, we cannot assure that we will be able to locate appropriate acquisition candidates, that any identified candidates will be acquired or that acquired operations will be effectively integrated or prove profitable. Additionally, our credit facility with Wells Fargo currently prohibits Ballantyne from making acquisitions over $7.5 million without the bank's consent.Our Board of Directors recently elected a new Chief Executive Officer, President and Director On November 1, 2010, our Board elected Gary L. Cavey to the positions of Chief Executive Officer, President and Director. Mr. Cavey replaced John C. Wilmers who had served in those positions for 13 years and retired. Mr. Wilmers will remain with the Company to assist in transitioning Mr. Cavey into his new position as Mr. Cavey is new to the Company and our business. Mr. Wilmers will also focus on the Company's growing business opportunities in Asia. While the Board believes that Mr. Cavey is well qualified and will function well in the new positions, there is no guarantee that this will be the case. Mr. Cavey's failure to perform as expected may have a material adverse effect on our business, financial condition, results of operations and stock price.Shares eligible for future sale could have a possible adverse effect on the market price. Future sales of common stock in the public market, or the perception that such sales could occur, could adversely affect the market price of the common stock or our ability to raise additional capital through sales of our equity securities. As of December 31, 2010, we had: i) 14,313,158 shares owned by stockholders and ii) 956,349 shares of common stock reserved for issuance under stock plans, of which 222,250 shares are issuablepursuant to currently outstanding options, and 74,691 shares of common stock issued but unvested pursuant to our restricted stock plans. Of the shares outstanding, subject to outstanding options and reserved for issuance under the employee stock purchase plan, 14,238,467 shares are immediately eligible for resale in the public market without restriction. We are unable to predict the effect that the sales of these shares may have on the prevailing market price of the common stock.main manufacturingand NOC are located at 13710 FNB Parkway, Omaha, Nebraska, where we lease office space. The premises are used for offices and operating the NOC. The lease expires in April 2023. Our primary distribution facility and Network Operating Center ("NOC") areis located at 4350 McKinley Street, Omaha, Nebraska, where we ownlease, on a building consisting ofmonth-by-month basis, approximately 166,00020,000 square feet on approximately 12.0 acres.of our previously owned facility. The premises are used for offices,distribution and manufacture of certain products. In addition, our subsidiaries owned or leased the manufacture, assembly and distributionfollowing facilities as of our products, and operating the NOC.purchased the existing 50,000owns a 75,000 square-foot manufacturing plant in Joliette, Canada and constructed a 25,000 square-foot addition, nearly doubling the production capacity.Quebec, Canada. The expanded facilities are used for offices, manufacturing, assembly and distribution of the cinema screens.American West BeijingStrong Westrex (Beijing) Trading Company Ltd.Inc. subsidiary leases sales and service officesoffice space in Beijing and Shanghai,certain other cities in China.also lease a sales and service officedo not anticipate any difficulty in Hong Kong. The Company is currently a defendantan asbestos case entitled Manuel H. Chinea and Janet M. Chinea v. American Optical Company, Ballantyne Strong, Inc. a/k/a Ballantyne of Omaha, Inc. et al, filed August 17, 2010certain legal disputes. No such disputes, individually or in the Superior Court of the State of New York. The Company is one of twenty-five defendants. The Plaintiffsaggregate, are expected to have agreed to dismiss the Company. The dismissal will be final assuming no defendant objects. During December 2009, the Company settled an asbestos case entitledLarry C. Stehman and Leila Stehman v. Asbestos Corporation, Limited and Ballantyne Strong, Inc. individually and as successor in interest to Strong International, Strong Electric Corporation and Century Projector Corporation, et al, originally filed in the Superior Court of the State of California, County of San Francisco. The settlement, including legal fees, resulted in charges of approximately $0.4 million during 2009.Removed and Reserved
Mine Safety DisclosuresRegistrant'sRegistrant’s Common Equity, Related Stockholder Matters and Issuer Purchases of Equity SecuritiesAmexMKT under the symbol "BTN"“BTN”. The following table sets forth the high and low per share sale price for the common stock as reported by the NYSE Amex.MKT. 2012 First Quarter $ 5.37 $ 4.06 Second Quarter 6.48 5.26 Third Quarter 6.02 4.03 Fourth Quarter 4.54 3.09 2011 First Quarter $ 8.01 $ 6.18 Second Quarter 7.28 4.69 Third Quarter 4.77 3.08 Fourth Quarter 4.23 2.76 2010 First Quarter $ 5.89 $ 3.10 Second Quarter 9.00 5.45 Third Quarter 9.66 6.91 Fourth Quarter 9.74 6.48 High Low 2010 First Quarter $ 5.89 $ 3.10 Second Quarter 9.00 5.45 Third Quarter 9.66 6.91 Fourth Quarter 9.74 6.48
2009
First Quarter
$
2.42
$
0.88
Second Quarter 3.27 1.80 Third Quarter 3.88 2.02 Fourth Quarter 3.98 3.08
2008
First Quarter
$
5.97
$
4.02
Second Quarter 5.20 3.85 Third Quarter 4.70 1.55 Fourth Quarter 2.23 0.99 Our common stock was held by approximately 167as of our common stock on March 8, 2011.4, 2013. Because brokers and other institutions hold many of our shares of common stock are held by brokers and other institutions on behalf of stockholders, we are unable to estimate the total number of stockholders.stockholders represented by these record holders. The last reported per share sale price for the common stock on March 8, 20114, 2013 was $7.12.$3.73. We had 14,334,11714,050,797 shares of common stock outstanding on March 8, 2011.November 12, 2008,December 22, 2011, we announced that our Board of Directors approvedadopted a stock repurchase program authorizing the repurchase of up to $1.0$8 million of our outstanding Common Stock pursuant to a plan adopted under Rule 10b5-1 of the Securities Exchange Act of 1934 (as amended). On August 7, 2012, the Company discontinued the Plan prior to repurchasing the full amount of common stock.stock originally authorized. No sharesrepurchases were repurchasedmade during the fourth quarter of 2012, as reflected in 2009 or 2010. Approximately $0.9 million remains available for repurchase as of March 7, 2011. The Company may purchase shares from time to time depending on market, economic and other factors.Equity Compensation Plan Information Thethe following table sets forth information regarding our Stock Option, Restricted Stock and Stock Purchase Plan Agreements as of December 31, 2010. October 1 – October 31, 2012 — $ 0.00 — $ 0 November 1 – November 30, 2012 — $ 0.00 — $ 0 December 1 – December 31, 2012 — $ 0.00 — $ 0 Number of securities to be
issued upon exercise of
outstanding options,
warrants and rights Weighted average exercise
price of outstanding options,
warrants and rights Number of securities
remaining available
for future issuance
under equity
compensation plans
excluding securities
reflected in column (a) (a) (b) (c) 172,250 $ 1.62 956,349 (1) — — — 172,250 $ 1.62 956,349 (1) (1) Information for Stock Repurchase Program announced December 22, 2011, in maximum amount of $8 million. (1)Includes 76,194 securities for the 2005 Stock Purchase Plan, 280,155 securities for our employee and director Restricted Stock Plans and 600,000 securities for our 2010 Long-Term Incentive Plan.Board, and our credit facility contains certain prohibitions on the payment of cash dividends.Board. Any determination by the Board as to the payment of dividends in the future will depend upon, among other things, business conditions, our financial condition and capital requirements, as well as any other factors deemed relevant by the Board. We have not paid cash dividends since we went public in 1995.TableContentsPlan Category (a) (b) (c) Equity compensation plans approved by security holders 139,000 4.70 676,539 (1) Equity compensation plans not approved by security holders — — — Total 139,000 4.70 676,539 (1) (1) Includes 65,753 securities for the 2005 Stock Purchase Plan, 190,186 securities for our employee and director Restricted Stock Plans and 405,000 securities for our 2010 Long-Term Incentive Plan. Strong'sStrong’s cumulative total stockholder return over the last five fiscal years with the Standard and Poor'sPoor’s 500 Index® ("Index® (“S&P 500"500”), the Research Data Group, Inc. ("RDG"(“RDG”) SmallCap Technology Index and a peer group consisting of the following issuers: American Tonerserve Corporation, Avid Technology, Inc., Chyron Corporation,Corp., Eastman Kodak Company, Ikonics Corporation, MDI, Inc.Corp., Swordfish Financial, Inc, RealD Inc. and X-Rite, Inc.XRX International Entertainment Holding Group. The Company has in good faith selected these peer issuers on the basis of their sharing the same SIC code (3861, Photographic Equipment & Supplies). The peer group total return was calculated using a weighted average market value. The graph assumes $100 was invested on December 31, 2005,2007, and assumes reinvestment of all dividends.Ballantyne Strong, Inc.Comparison of Five-Year Cumulative Total Return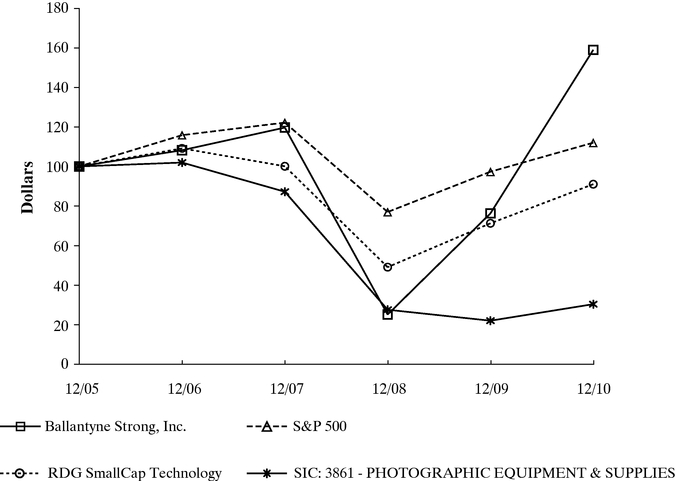
Copyright© 2011 Standard & Poor's, a division of The McGraw-Hill Companies Inc. All rights reserved. (www.researchdatagroup.com/S&P.htm) 12/05 12/06 12/07 12/08 12/09 12/10 100.00 108.18 119.63 25.15 76.28 158.90 100.00 115.80 122.16 76.96 97.33 111.99 100.00 109.12 100.08 49.10 71.26 91.02 100.00 101.96 87.21 27.58 22.04 30.39 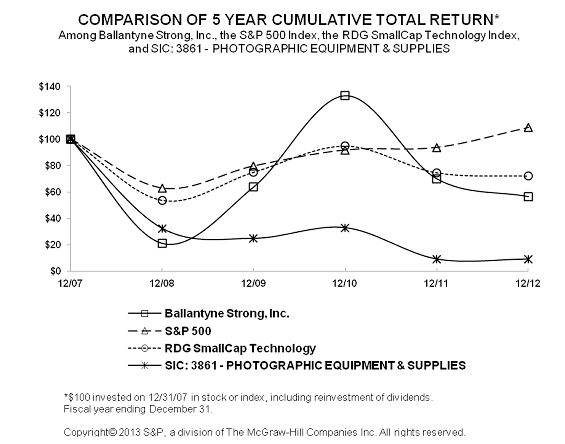
12/07 12/08 12/09 12/10 12/11 12/12 Ballantyne Strong, Inc. 100.00 21.03 63.76 132.82 69.91 56.41 S&P 500 100.00 63.00 79.67 91.67 93.61 108.59 RDG SmallCap Technology 100.00 53.51 74.86 94.66 74.41 71.91 SIC: 3861 - PHOTOGRAPHIC EQUIPMENT & SUPPLIES 100.00 32.34 24.78 32.89 9.07 9.02 (1) Years Ended December 31, 2010 2009 2008 2007 2006 $ 136,335 $ 72,146 $ 54,815 $ 51,486 49,732 $ 24,739 $ 14,732 $ 8,794 $ 9,456 10,826 $ 8,433 $ 2,071 $ (3,034 ) $ 228 1,568 $ 0.60 $ 0.15 $ (0.22 ) $ 0.02 0.12 $ 0.59 $ 0.15 $ (0.22 ) $ 0.02 0.11 $ 40,401 $ 35,805 $ 21,810 $ 32,390 34,974 $ 92,031 $ 60,210 $ 51,113 $ 54,140 49,908 $ — $ — $ — $ — 15 $ 52,377 $ 42,518 $ 38,835 $ 43,042 42,389 (1)All amounts in thousands (000's) except per share data (in thousands, except per share data) Statement of operations data Net revenue $ 169,084 $ 184,433 $ 136,335 $ 72,146 $ 54,815 Gross profit $ 22,594 $ 30,213 $ 24,739 $ 14,732 $ 8,794 Net earnings (loss) $ 5,542 $ 10,347 $ 8,434 $ 2,071 $ (3,034 ) Net earnings (loss) per share Basic $ 0.39 $ 0.72 $ 0.60 $ 0.15 $ (0.22 ) Diluted $ 0.39 $ 0.71 $ 0.59 $ 0.15 $ (0.22 ) Balance sheet data Working capital $ 56,897 $ 50,504 $ 40,400 $ 35,805 $ 21,810 Total assets $ 99,546 $ 113,456 $ 92,031 $ 60,210 $ 51,113 Total debt $ — $ — $ — $ — $ — Stockholders’ equity $ 66,916 $ 63,223 $ 52,376 $ 42,518 $ 38,835 Management'sManagement’s Discussion and Analysis of Financial Condition and Results of OperationsManagement'sManagement’s discussion and analysis contains not only historical information, but also forward-looking statements within the meaning of Section 27A of the Securities Act of 1933 and Section 21E of the Securities Exchange Act of 1934. Statements that are not historical are forward- lookingforward-looking and reflect expectations for future Company performance. For these statements, the Company claims the protection of the safe harbor for forward-looking statements contained in the Private Securities Litigation Reform Act of 1995."Risk Factors"“Risk Factors” section contained in Item 1A. Given the risks and uncertainties, readers should not place undue reliance on any forward-looking statement and should recognize that the statements are predictions of future results which may not occur as anticipated. Actual results could differ materially from those anticipated in the forward-looking statements and from historical results, due to the risks and uncertainties described herein, as well as others not now anticipated. New risk factors emerge from time to time and it is not possible for management to predict all such risk factors, nor can it assess the impact of all such factors on our business or the extent to which any factor, or combination of factors, may cause actual results to differ materially from those contained in any forward-looking statements. Except as required by law, the Company assumes no obligation to update forward-looking statements to reflect actual results or changes in factors or assumptions affecting such forward-looking statements.Overviewforto the exhibition theatre exhibition industry on a worldwide basis. Through our Strong® branding, we can fully outfit and automate all aspects of a cinematic theatre including digital projection, cinema screens, library management systems, smart digital signage, flat panels and complete state of the art sound systems. We alsomanufacture cinema screens in Joliette, Quebec, Canada, through our Strong/MDI Screens Systems, Inc. subsidiary.distributeservice lighting systems tofor premier architectural sites as well as for a full range of needs for the worldwide entertainment and various other industries worldwide. This includes followspots and other specialty lighting industry through our Strong Entertainmentfor event centers, arenas, exhibit halls, places of worship, concert tours, staged theatrical performances, and music, dance and various other venues with theatric lighting segment.core operating segments: theatre and lighting. Our segments were determined based on the manner in which management organizes segments for making operating decisions and assessing performance. Approximately 97%98% of fiscal year 2010 sales2012 revenues were from theatre products and services and approximately 3%2% were lighting products. Additional information related to our reporting segments can be found in the notes to the consolidated financial statements. Net revenue 100.0 % 100.0 % 100.0 % 100.0 % 100.0 % Cost of revenues 86.6 83.6 81.9 79.6 84.0 Gross profit 13.4 16.4 18.1 20.4 16.0 Selling and administrative expenses(1)(2) 9.4 7.5 9.5 15.3 19.7 Income (loss) from operations 4.7 8.2 8.8 5.1 (7.4 ) Net earnings (loss) 3.3 5.6 6.2 2.9 (5.5 ) Years Ended December 31, 2010 2009 2008 2007 2006 100.0 % 100.0 % 100.0 % 100.0 % 100.0 % 81.9 79.6 84.0 81.6 78.2 18.1 20.4 16.0 18.4 21.8 9.5 15.3 19.7 18.1 16.3 8.8 5.1 (7.4 ) (0.8 ) 3.0 6.2 2.9 (5.5 ) 0.4 3.2 (1)(1) Amounts exclude goodwill impairment charges of $2.3 million for the year ended December 31, 2008. (2) Amounts for the years ended December 31, 2012 and 2011 exclude severance charges of $0.1 million and $1.3 million, respectively. $2.3, $0.6 andapproximately $1.4 million, including $1.3 million in 2011 and $0.1 million in 2012. Severance of $0.3 million was paid in 2011 and $1.0 million was paid in 2012. The remaining $0.1 million will result in future cash expenditures in 2013. In March 2012 we sold the analog projector manufacturing machinery and equipment previously identified as available for sale for $1.0 million, resulting in a gain of $0.9 million. In May, 2012, we completed the yearssale of the corporate headquarters in a sale leaseback transaction, resulting in a gain of $0.5 million. As part of this transaction, rental expense of $0.2 million was recorded through November 2012. The net cash proceeds from the transaction were $2.0 million. The strategic initiative is expected to be completed by the end of the second quarter of 2013.2008, 2007 and 2006, respectively.Twelve Months Ended2012 decreased 8.3% to $169.1 million from $184.4 million in the year ended December 31, 20102011. (in thousands) Theatre Products $ 151,688 $ 167,017 Services 14,591 14,157 Total theatre revenues 166,279 181,174 Lighting 2,805 3,259 Total net revenues $ 169,084 $ 184,433 the Twelve Months Ended December 31, 2009 and December 31, 200820102011 rose 35.3% to $184.4 million from $136.3 million from $72.1 million in 2009. Twelve Months Ended December 31, 2010 2009 2008 $ 125,043,983 $ 65,186,543 $ 47,158,724 7,881,593 3,810,626 3,186,650 132,925,576 68,997,169 50,345,374 3,409,041 3,121,840 4,260,868 — 26,748 208,319 $ 136,334,617 $ 72,145,757 $ 54,814,561 (in thousands) Theatre Products $ 167,017 $ 125,044 Services 14,157 7,882 Total theatre revenues 181,174 132,926 Lighting 3,259 3,409 Total net revenues $ 184,433 $ 136,335 2010 from $69.0 million in 2009 and $50.4 million in 2008.from $27.9 milliondue to the following:2009 as the industry change from analog to digital projection increased during 2010, primarilysales volume in the U.S. and China. The growth in business in the U.S. is primarily being driven by customers taking advantage of the opportunities that digital technology offers such as the abilitytheatre exhibition companies continued to show 3D movies among other items. The growth in China is resulting not only from converting analog equipment to digital but also due to the construction of newconvert their theatre complexes in China. The majorityto digital-based projection equipment.the increase in digital sales resultedlamps rose to $15.3 million from sales of digital projectors and certain accessories; however, sales of digital lamps also rose from $3.0 million in 2009 to $5.8 million in 2010 while sales of digital servers rose to $14.3 million from $7.4 million from $1.2 million a year-ago. in 2010.begancontinued to integrate projection equipment in our Omaha plantwhere we consolidate and test digital equipment. for a large exhibition customer. Revenues generated from the product sold as part of this business wasaccessories we sell with the integration services increased to $8.6 million in 2011 from $5.0 million duringin 2010. Sales of digital products rose We do expect this integration business to $27.9 million in 2009 from $12.6 million in 2008 as the industry change to digital projection equipment began to accelerate during 2009. The increased demand resulted from movie exhibitors wanting to show movies in 3D digital format as they believed that 3D movies result in higher box office receipts. The demand for digital equipment increased not only for the 3D benefits but also for such potential benefits as additional advertising and being able to project more alternative entertainment at the movie theatres. The majority of the increase in digital sales resulted from sales of digital projectors; however, sales of digital lamps also rose from $0.9 million in 2008 to $3.0 million in 2009.Film Product Sales Sales of film projection equipment declined to $10.9 million in 2010 from $12.0 million a year-agosubstantially decline after fiscal 2012 due to the theatre exhibition industry's transition to digital based systems. Sales of film projection equipment declined to $12.0 million in 2009 from $14.0 million in 2008 due to the theatre exhibition industry's transition to digital-based systems discussed above, coupled with a slowdown in new theatre construction in the United States and worldwide largely due to the economic and credit market conditions. Included in film equipment revenues were sales of used film equipment which amounted to $0.3 million in 2009 compared to $1.4 million in 2008. These used units were obtained from theatre chains which had converted their film auditoriums to digital and had no further use for the film projectors. The decrease in used equipment sales during 2009 resulted from the lack of quality used equipment in the market. While we anticipated a short-term opportunity to buy, refurbish and resell the suitably conditioned units as they became available, we have not seen a significant change in used equipment sales as a result of movie theatre complexes converting from film to digital equipment and only recorded immaterial sales related to these activities in 2010. Sales of replacement parts declined to $4.7 million during 2010 from $6.8 million during 2009 and $7.4 million in 2008. We expect sales of film replacement parts to decrease over time as film equipment is replaced by digital units. Sales will depend on the pace of our film customers retrofitting their film projection theatres to digital cinema projection theatres and we continue to be unsure as to what extent our replacement part sales will be impacted by this activity and also by the increased availability of used parts. Sales of film lenses were insignificant in 2010 compared to $0.4 million in each of 2009 and 2008. Sales of xenon lamps were $3.4 million in 2010 compared to $6.0 million in each of 2009 and 2008. The decrease is mainly attributable to the loss of sales to a significant lamp customer coupled with thecustomer’s digital conversion taking place creating less demand for film products.rosedecreased 7.9% to $17.4 million in 2011 compared to $18.9 million in 2010 compared to $12.2 million a year-agoprimarily due to the substantiallower demand for digital 3D screens as theatres expanded the number of screens that can project 3D images.screens. Sales were at record levels for this product line duein 2010 as exhibition companies pushed to capture the higher demand for special "silver" screens needed for certain digitalrelative new 3D applications. This demand ismovie Box Office during the result of both our customers wanting to show more movies in digital 3D coupled with more 3D movies being available from the Hollywood studios. In addition, sales of large format screens to IMAX were also higher than a year-ago. We generated screen sales of $12.2 million in 2009 compared to $6.8 million in 2008. The increase year over year was primarily driven by higher demand for special "silver" screens coupled with more 3D movies being produced. Sales of large format screens to IMAX were also higher in 2009 than 2008."silver"“silver” screens that we manufacturemanufacture.whichreplacement parts and these products are driving the growthexpected to further decline in future periods. As expected, sales declined year-over-year as follows:the product line.duringin 2010 resulting from $3.8increased demand for installation, maintenance and other services pertaining to the digital conversion. Digital service revenues rose to $13.1 million a year-ago. Revenues generated from servicing film equipment were $2.3 million during 2010 compared to $2.6 million during 2009 while revenues generated from servicing digital equipment increased to $5.6 million in 2010 comparedas the rollout is creating opportunities for our service group to $1.2 million in 2009. The results reflect increased demand for installation and maintenancesell a range of services pertaining to the conversion from analog to digital projectors by our customers primarily in the U.S. As discussed in relation to digital product sales, we recognized service revenues of $0.3 million associated with the integration of digital projection equipment in the Omaha plant during 2010. Service revenues increased in 2009 to $3.8 million from $3.2 million in 2008 due to the increase in digital projectors being sold in the industry and which require installation and maintenance services.Lighting Segment Sales of lighting products rose to $3.4 million during 2010 from $3.1 million in 2009. Sales of follow spotlights rose to $2.0 million from $1.8 million a year-ago. Sale of skytrackers rose to $0.2 million from $0.1 million in 2009, while replacement part sales rose from $0.6 million in 2009 to $0.7 million in 2010. Sales of all other lighting products, including, but not limited to, xenon lamps, britelightsinstallations, after-sale maintenance, repairs, cabling, wiring and LED products amountedNOC services.$0.5digital is affecting revenues from servicing film equipment which declined to $1.1 million from $2.3 million in 2010 compared to $0.7 million in 2009.felldeclined slightly to $3.1$3.2 million from $3.4 million during 2009 from $4.3 million in 2008. Sales of2010 due to lower demand for follow spotlights fell to $1.8 million from $2.5 million in 2008. Sale of skytrackers fell to $0.1 million in 2009 from $0.4 million in 2008, while replacement part sales fell from $0.7 million in 2008 to $0.6 million in 2009. Sales of all other lighting products, including but not limited to xenon lamps, britelights and nocturns amounted to $0.7 million in 2009 compared to $0.6 million in 2008.spotlights. Lighting products werehave been impacted by the effects of the troubled credit marketseconomic conditions as a significant portion of the business is dependent on the construction or improvements of stadiums and auditoriums around the world.Exportincreased(primarily from the theatre segment) fell to $41.1 million from $60.1 million in 2010 resulting in large part to sales volume in Mainland China decreasing to $26.0 million from $33.2$34.9 million in 2009 resulting primarily from2010. The results out of China reflect increased demand in Chinacompetition and South America wherethe shifting of scheduled installations due to changing theatre construction timelines. We also experienced lower sales increased by $23.4 million and $5.6 million, respectively. The increased demand in China results from theatres chains retrofitting their current operations with digital equipment as well as the growth of new theatre complexes. Salesvolume in South America, Canada, Mexico and Europe. The results were driven primarily by existing theatre complexes retrofitting their equipmentdue to digital in order to take advantagethe timing of the 3D technology. Thesedigital cinema rollout in these countries coupled with lower sales were partially offset by a decrease in sales in Mexico of $2.6 million year over year. Sales in all other regions including Canada, Europe, Asia (excluding China) and all other regions were relatively flat year over year all together driving a net increase of $0.5 million in sales.film equipment. Export sales are sensitive to worldwide economic and political conditions that can lead to volatility. Certain areas of the world are more cost conscious than the U.S. market and there are instances where our products are priced higher than local manufacturers making it more difficult to generate sufficient profit to justify selling into these regions. Additionally, foreign exchange rates and excise taxes sometimes make it difficult to market our products overseas at reasonable selling prices. Sales outside the United States (mainly theatre sales) increased to $33.2 million in 2009 from $18.2 million in 2008 resulting primarily from increased sales in China where sales increased from$5.7 million in 2008 to $11.5 million in 2009. Sales into Mexico and South America were also higher than in 2008 increasing by $4.4 million and $2.5 million, respectively. Sales in Canada increased to $4.3 million in 2009 compared to $1.7 million in 2008 due to an increase in 3D silver screens. Sales into Europe reflected increased business for film products increasing to $2.7 million from $1.6 million in 2008. Sales into Asia declined to $1.4 million from $2.0 million in 2008. from $14.7 million a year-ago but as a percent of total revenue decreased to 16.4% from 18.1% from 20.4% in 2009.2010. Gross profit in the theatre segment increased to $29.2 million from $23.8 million in 2010 from $13.8 million in 2009 but as a percentage of theatre sales decreased to 17.9%16.1% from 20.0%17.9% a year-ago. The decreasehigher gross profit was due to the increase in sales volume while the decline in gross margin resulted from increasedis reflective of:projection equipmentproducts which carry lower margins but substantially higher revenue price points but lower gross margins than our other products. The lower digital projection margins were offset to a degree by improved margins from ourproducts and services.and service business due primarily to the increased volume of sales from these businesses due the conversion to digital cinema. We expect our gross margin as a percentage of revenues to decrease in the future primarily due to increased sales of digital projection equipment which carry lower margins compared tohigher manufacturing margins.equipment we manufacture. However, the sales price on the digital projectors is higher than what we receive on film projectorsreplacement parts which offsets gross margin dollars to a degree. Gross margins will also be impacted in the future by higher film manufacturing costs pertaining to lower demand for manufactured film products. We expect to purchase film inventory components in lower quantities resulting in some raw material price increases and to experience less manufacturing throughput in the Omaha plant to cover fixed overhead costs.$0.9$1.0 million or 27.4%a gross margin of lighting revenues in 201030.9% compared to $0.9 million or 28.5%a gross margin of lighting revenues in 2009.27.4% during 2010. The results primarily reflect relatively flat sales year over year. Consolidated gross profit increased to $14.7 million in 2009 from $8.8 million in 2008 and as a percent of total revenue increased to 20.4% from 16.0% in 2008. Gross profit in the theatre segment increased to $13.8 million in 2009 from $7.5 million in 2008 and as a percentage of theatre sales increased to 20.0% from 14.9% in 2008. The increase in gross profit and gross profit as a percentage of revenues resulted from improved margins from our screen business. We also cut costs from our primary manufacturing operations in Omahafavorable product mix during 2009. Margins were higher from our service business due to revenues increasing 20% from 2008 resulting in margins increasing $1.0 million. The service business relating to servicing film projection equipment is in a mature industry but we grew the infrastructure in anticipation of the digital cinema rollout which took on momentum in 2010. These factors resulted in the service division experiencing negative margins putting pressure on our overall margin. The gross profit in the lighting segment amounted to $0.9 million or 28.5% as a percentage of revenues in 2009 compared to $1.2 million or 28.0% as a percentage of revenues in 2008. The results reflect lower sales levels in the segment.from $2.9 million in 20092010 but as a percent of total revenue declined to 2.1% from 2.8% from 4.0% a year-ago.in 2010. The results principally reflect an increase inadditional personnel and their associated costs coupled with increasesto expand our domestic sales and service marketing efforts and to expand our sales offices in commissionMainland China.duerose 22.5% to the increase in product and services demand. Selling expenses decreased to $2.9$11.1 million in 2009 compared to $3.3 million in 2008 and as a percent of total revenue declined to 4.0%2011 from 6.1% in 2008. The results reflect cutbacks in payrollwhich also resulted in lower travel and tradeshow expenditures. In addition, the 2008 results reflected higher health insurance costs.Administrative Expenses Administrative costs rose to $9.1 million in 2010 from $8.1 million in 2009 but as a percent of total revenue decreased to 6.0% from 6.7% in 2010 from 11.3% in 2009.2010. The increase in expenses is primarilywas due to severance charges of $1.3 million during the growth inyear coupled with additional personnel and related costs necessary to manage the significant growth in revenue experienced during the year. Administrative costs rose to $8.1 Approximately $1.0 million in 2009 from $7.5 million in 2008 but as a percent of total revenue decreased to 11.3% in 2009 from 13.7% in 2008. The increase in expenses was related tothe severance charges settlement of an asbestos lawsuit, outside consulting expenses, bonuses and stock compensation expenses, coupled with additional costs pertaining to the growth of our officeoccurred in Beijing, China. During the first quarter of 2009 we incurred $0.2 million of severance charges due to the layoff of personnel as we began the transition to more of a distribution model due to lower production needed for digital projects. We also settled an asbestos lawsuit resulting in additional legal costs of $0.4 million. We experienced higher consulting fees during the year pertaining to the Board of Directors performing a search for the successor to the then Chief Executive Officer before his retirement. Management achieved more targets under the Company's bonus plan resulting in higher bonus expenses compared to 2008. Stock compensation expenses rose due to the Company having more unvested restricted stock in 2009 compared to 2008. We first began granting restricted stock in 2008 and thus 2009 was the first full year of stock expense. We cut back in certain other administrative areas such as bank fees, audit and compliance costs, and payroll costs which were also lower due to the layoffs in the first quarter of 2009.Goodwill Impairment During the fourth quarter of 2008, we recorded a goodwill impairment charge of $2.3 million within our Theatre and Lighting segments based on an impairment analyses which took into consideration the ongoing transition taking place in our strategy and operations, moving from the manufacture of traditional film equipment to a business model focused on the distribution and service of digital projectors. Aswere a result of a strategic initiative to refocus certain key areas of our Company as discussed throughout this document.impairment analysis performed, we determinedtheatre segment of $22.8 million in 2011 compared to $17.8 million in 2010. The results reflect an increase in business where product revenues rose 33.6%. We also generated significantly higher operating profit from our service business which increased to $2.4 million from $0.6 million in 2010 on a revenue increase of 79.6%.book value of goodwill was impaired. No such charges took placelighting segment rose to $0.2 million from less than $0.1 million in 2009 or 2010 as we no longer have any goodwill.20102011 reflect a gain of $0.6 million pertaining to our 44.4% share of equity in the income from Digital Link II, LLC. This gain compares to the loss of $0.9 million a year-ago and was due to the sale of equipment by the LLC to customers for projectors previously held in the LLC. Our results for 2009 reflect the loss of $0.9$0.2 million pertaining to our 44.4% share of equity in the loss from Digital Link II, LLC compared to income of $0.6 million in 2010. The change from 2010 reflects less sales of equipment by the 2008LLC to customers for projectors previously held in the LLC compared to 2010. The loss in 2011 primarily was a result of $0.7 million. The increase was due to more depreciation and interest costs resulting from additional deployments.expenseincome amounted to $0.07 million in 2011 compared to expense of $0.2 million in 2010 compared to $0.1 million in 2009 and other income of $0.3 million in 2008.2010. The results primarily reflect the impact of transaction losses arising from foreign exchange fluctuations during the yeargains and losses due primarily to the U.S. dollar weakeningfluctuating against the Canadian dollar.2010 compared to $0.7 million in 2009 and an income tax benefit of $0.9 million in 2008.2010. The effective tax rate (calculated as a ratio of income tax benefit (expense)expense to pretax earnings, (loss), inclusive of equity method investment earningsfor 2010, 24.7% in 2009 and 23.1% in 2008.2010. The effective tax rate changediffers from year to year resultsthe statutory rates primarily fromas a result of differing foreign and U.S. tax rates applied to respective pre-tax earnings (loss) amounts by tax jurisdiction. We recorded net interest expense of $0.03 million In addition, our effective rate was lower than the prior year period in 2010 comparedpart due to net interest income of $0.05 million during 2009 and $0.5 million in 2008. This decrease is the result of the sales of our auction-rate securities in 2009 which carried much higher interest rates compared to the interest-bearing cash in which we are currently investing. During 2008, we sold our coater and marinade product lineestimates for approximately $0.3 million resulting in a net gain of approximately $0.3 million. The product line was sold to a former Chief Financial Officer of the Company.respectively, compared to net earnings of $2.1 million during 2009 and basic and diluted earnings per share of $0.15 a year-ago and a net loss of $3.0 million during 2008 and basic and diluted loss per share of $0.22.20102012 with total cash and cash equivalents of $22.3$40.2 million compared to $23.6$39.9 million at December 31, 2009. Effective June 30, 2010, we entered into2011. The Company reported negative operating cash flows for the year ended December 31, 2012. This is largely due to the timing of payments related to the higher volume of business in the latter part of 2011. The Company believes that our existing sources of liquidity, including cash and cash equivalents, borrowing availability, and operating cash flow will be sufficient to meet our projected capital needs for the foreseeable future."Revolving Credit Agreement"“Credit Agreement”), each effective as of June 30, 2010, with Wells Fargo Bank, N.A. ("(“Wells Fargo"Fargo”). We may request an increase in the Revolving Credit Agreement of up to an additional $5 million; however, any advances on the additional $5 million are subject to approval of Wells Fargo. The borrowings from the Revolving Credit Agreement will primarilyare to be used for working capital purposes and for other general corporate purposes. Our accounts receivable, general intangibles and inventory secure the Revolving Credit Agreement. Revolving Credit Agreement bear interest at a rate equal to LIBOR plus 125 basis points.points (1.534% at December 31, 2012). Interest is paid on a monthly basis. We will pay a fee of 0.15% per annum on any unused portion. The Revolving Credit Agreement expires on June 30, 20112014 at which time all unpaid principal and interest iswould be due. Revolving Credit Agreement contains certain covenants, including those relating to our financial condition and limitations on our ability to pay dividends.condition. The primary financial condition covenant pertainscovenants pertain to our maintaining a minimumratio of total liabilities to tangible net profitworth of less than 2 to 1 and net income before taxes plus or minus non-cash equity in income of the Digital Link II, LLC joint venture, plus any non-cash charges related to the legacy film projector business, of $1 measured quarterly, on a rolling 4-quarter basis.basis, as defined in the Credit Agreement. Other covenants pertain to items such as certain limits on incurring additional debt or lease obligations, certain limits on issuing guarantees and certain limits on loans, advances and investments with third parties. Upon the occurrence of any event of default specified in the Revolving Credit Agreement, including a change in control of the Company, (asas defined, in the Revolving Credit Agreement), all amounts due there under may be declared to be immediately due and payable. No amounts are currently outstanding onSince the inception of the Revolving Credit Agreement. We were previouslyAgreement, no amounts have been borrowed.partyportion of these funds when repatriated back to the U.S.revolving credit facility with First National Bankdecrease in accounts payable, as well as accruals and timing of Omaha.tax deposits, partially offset by a decrease in the balance of accounts, unbilled and notes receivables and other current assets. Accounts payable decreased $15.5 million as the Company paid for fourth quarter 2011 inventory purchases. Accounts receivable balances decreased $6.6 million due to collections of the higher sales volume of the prior fourth quarter 2011 as compared to the fourth quarter of 2012.revolving credit facility expired on July 1, 2010.compared to $2.4 million in 2009. The increase in operating cash primarily resulted from the increase in earningswhich included net income of $8.4 million plus net non-cash charges of $2.7 million. Changes in 2010 compared to $2.1 million in 2009. This was largely offset by cash used in net$7.4$7.5 million, compared to $4.3 million in 2009. The increase in our working capital needs was mainly driven by increases in accounts receivable, unbilled revenue, inventory and other assets of $7.3 million, $5.2 million, $15.3 million and $2.1 million, respectively,partially offset by a $20.8 million increaseincreases in account payable and a $2.2 million increase in income taxes.taxes payable. These working capital needs are resultingchanges resulted from the significant increase in business we are experiencing coupled with the significantly higher price point of the digital equipment we are currently purchasingpurchased and distributing. We expect our working capital needs to continue to fluctuatedistributed.period to period during the industry transition to digital cinema.operatinginvesting activities amounted to $2.4$3.3 million in 2009 compared to $4.42012. Cash was provided by a $2.5 million distribution from our joint venture investment in Digital Link II and proceeds from the sale of assets of $3.3 million in 2008. Despite generating earnings of approximately $2.12012, including $3.0 million during 2009, the decreasefrom assets previously classified as available for sale. Capital expenditures in operating cash flow from fiscal 2008 resulted2012 amounted to $2.5 million. The 2012 capital expenditures primarily from receivables, inventory and other current assets increasing $3.8, $3.9 and $0.3 million respectively. These working capital needs were offsetrelate to a degree by increases in accounts payable and customer balances of $3.3 and $1.1 million, respectively resulting in a net working capital increase of $3.6 million for these five working capital items. The increase in accounts receivable, inventory and accounts payable pertained to increased purchases and sales of digital products which carry a higher price point reflecting the transition that was beginning in the industry. The increase in other current assets and customer deposits primarily pertained to prepayments of digital product from vendors and where we required prepayments from customers in certain instances primarily in certain parts of China and Asia.2010 compared to cash provided by investing of $9.4 million in 2009. The decrease of $15.1 million is attributable to the liquidation of $10.0 million in investments in 2009 that did not recur in 2010 as well as the increase in capital2010. Capital expenditures of $6.8 million in 2010 compared to $0.9 million in 2009. Capital expenditures in 2010 primarily included the purchase of the land and building at our screen business in Canada, the expansion of that facility and the construction of the Network Operating Center at our headquarters. Net cash provided by investing activities amounted to $9.4 million in 2009 compared to $2.8 million in 2008. The increase resulted from the liquidation, at par, of approximately $10.0 million of our auction-rate securities. During 2008, we liquidated at par, approximately $3.0 million of these securities. During 2009, we made capital expenditures Cash of $0.9 million which comparedwas provided by distributions from our unconsolidated joint venture, Digital Link II and $0.2 million was provided from our investment.$0.8$2.7 million in 2008. Other items affecting investing activities included decreases2012, reflecting $2.8 million for the purchase of restricted investments of $0.3 million in 2009treasury stock, offset slightly for proceeds related to the stock purchase plan and $0.5 million in 2008. These resultedcertain tax benefits from payments of deferred balances owed for acquisitions. The 2008 results also reflected $0.3 million of proceeds from the sale of our coater and marinade product line during that year.in 2010 comparedduring 2011. The activities were due to $0.03 million a year-ago. The increase is primarily attributable to proceeds received for the exercise ofcommon stock options during 2010. Cash from financing activities in 2010 also benefited from excessissuances under our equity compensation plans coupled with certain tax benefits recorded and proceeds from our employee stock purchase plan.fellamounted to $0.03$0.6 million in 20092010. The activities were due to common stock issuances under our equity compensation plans coupled with certain tax benefits from $0.3share-based arrangements.2008. The transactions in 2009 consisted solely of proceeds from our employee stock purchase plan. The transactions in 2008 consisted of proceeds from our various stock plans, the purchase of shares under our Board approved share repurchase program,years ended December 31, 2012, 2011 and an increase in checks outstanding in excess of bank balances of approximately $0.1 million. During 2008, we sold our coatermarinade product line in exchange for $0.3 million in cash. In connection with the sale, we recorded a pre-tax net gain of approximately $0.3 million (estimated $0.2 million after-tax) which is net of related costs to sell. The product line was sold to a former Chief Financial Officer of the Company. We sell digital theatre projection equipment to our joint venture, Digital Link II, LLC ("LLC") in the normal course of business. The LLC in turn provides the digital theatre projection equipment to third party customers under system use agreements. Revenue recognized by the Company on the sale transaction to the LLC is limited by its 44.4% ownership in the joint venture which will be recognized upon sale of the equipment to the third parties. Revenue recognizedcertain other parties during the years ended December 31, 2010, 2009 and 2008 amounted to approximately $4.1 million, $1.2 million and $2.1 million, respectively. Our42%47% of 20102012 consolidated net revenues and were primarily from the theatre segment. Trade accounts receivable from these customers represented approximately 40%36% of net consolidated receivables at December 31, 2010.2012. Sales to China Film Jingdian Cinema Investment Company, Ltd.CDF2 Holdings represented approximately 8%12% of total 2012 sales while sales to Regal Cinemas, Inc. was the next highestand accounts receivable from CDF2 represented 5% of net consolidated receivables. The note receivable from CDF2 had an outstanding balance of $2.2 million at 7%.December 31, 2012. Additionally, receivables from China Film Jingdian Cinema Investment Company, Ltd. and Kasima, LLCBelmont Capital Group represented approximately 14% and 8%17% of net consolidated receivables at December 31, 2010, respectively.2012. While the Company believes its relationships with such customers are stable, most arrangements are made by purchase order and are terminable at will by either party. A significant decrease or interruption in business from the Company'sCompany’s significant customers could have a material adverse effect on the Company'sCompany’s business, financial condition and results of operations. The Company could also be adversely affected by such factors as changes in foreign currency rates and weak economic and political conditions in each of the countries in which the Company sells its products.customers'customers’ financial condition or use letters of credit.Company'sCompany’s primary exposure to foreign currency fluctuations pertains to its subsidiarysubsidiaries in Canada.Canada and China. In certain instances, the Company may enter into foreign exchange contracts to manage a portion of this risk. For the periodyear ended December 31, 2010,2012, the Company had recorded approximately $0.03$0.1 million of realized and unrealized gaingains associated with these open contracts in its consolidated statement of operations. (In thousands) Payments Due by Period Total 2011 2012 2013 2014 2015 Thereafter $ 50,000 50,000 — — — — — 185,160 17,011 17,914 18,821 19,727 20,626 91,061 $ 192 $ 19 $ 42 $ 46 $ 85 272,711 183,572 44,420 36,829 7,890 — — 4,052 503 866 712 1,971 $ 507,871 250,583 62,334 55,650 27,617 20,626 91,061 Contractual cash obligations $ 4,244 $ 522 $ 908 $ 758 $ 2,056 (1) The schedule above excludes the following items: Table of Contentscontractual obligation$0.4 million standby financial letter of credit to pay up to $50,000 to High End Systems, Inc. Payment is contingent on satisfaction of certain future salesour landlord as we completed the buildout of the product line purchased as partnew office space which expires in early 2013. We do not expect to make any future payments pertaining to the letter of the business. In addition, we credit.$0.1$0.2 million of unrecognized tax benefits recorded in the financial statements as tax liability, including interest and penalties, in accordance with FIN 48 as of December 31, 2012. Amounts for which the estimated underpaymentyear of income taxes we are obligated to pay. The accrual is primarily related to state tax matters. settlement occurs cannot be reasonably estimated. The Company has entered into agreements with third-party film exhibitors which provide for the use of digital theatre projection equipment with a purchase option in the future. Certain operating lease agreements entered into by the Company required the third-party exhibitors to make a deposit on the digital projection equipment provided for use. The customer deposits collected are recorded as a non-current liability within the balance sheet. During 2010 and 2009, the Company and RealD provided guarantees to notes entered into by Digital Link II, LLC to finance digital projection equipment deployed in the normal course of business. The notes bear interest at rates ranging from 7.0% to 7.46%. The following table summarizes the Company's guarantees: Interest Rate Original Notes Payable Balance Ballantyne
Ownership Original Guarantee Remaining
Guarantee
as of 12/31/10 7.0 % $ 626,663 44.40 % $ 278,238 $ 58,837 7.2 % 756,440 44.40 % 335,860 — 7.0 % 1,142,239 44.40 % 507,154 120,799 7.2 % 265,538 44.40 % 117,899 10,493 7.2 % 1,039,646 44.40 % 461,603 22,326 7.0 % 184,098 44.40 % 81,739 45,403 7.25 % 152,850 44.40 % 67,865 32,143 7.46 % 1,824,774 44.40 % 810,200 520,719 7.46 % 749,308 44.40 % 332,693 223,288 7.46 % 423,224 44.40 % 187,912 135,626 7.46 % 216,141 44.40 % 95,966 74,161 $ 7,380,921 $ 3,277,129 $ 1,243,795 Under terms of the guarantees, the Company and RealD would be required to fulfill the guarantee should the joint venture be in default of its loans or contract terms. The Company has recorded an insignificant liability at December 31, 2010 for the fair value of the obligations undertaken by issuing the guarantees. The Guarantees will expire by the end of June 2012. There were no other contractual obligations other than inventory and property, plant and equipment purchases in the ordinary course of business.seasonality as sales of theatre products typically increase during the third and fourth quarters. We believe that such increased sales reflect seasonal increases in the construction of new motion picture screens in anticipation of the holiday movie season.2217 to the consolidated financial statements, and Item 3 of this report, for a description of legal matters.We did experience higher than normal prices on certain raw materials during the year coupled with higher freight costs as freight companies passed on a portion of higher gas and oil costs. Historically, we have been able to offset any inflationary effects by either increasing prices or improving cost efficiencies. Ballantyne manufactures or distributes and sells projectors which are highly complex and have many components that make up a complete system, which is referred to as an "integrated system." Each customer selects options for certain components in determining the integrated system they chose to purchase. Towe followwhen all of the requirements of ASC Subtopic 605-10,Revenue Recognition—General, which consists of determining that:•••seller'sseller’s price to the buyer is fixed or determinable• Oncecustomer hascustomer. If an arrangement involves multiple deliverables, the items are considered separate units of accounting if the items have value on a stand-alone basis and there is objective and reliable evidence of their fair values. Revenues from the arrangement are allocated to the separate units of accounting based on their objectively determined fair value. For services, revenue is recognized when the featuresservices have been rendered. Revenues from service and support contracts is deferred and recognized as earned ratably over the service coverage periods. Unbilled revenue represents revenue recognized in accordance with the Company’s revenue recognition policy for their integrated system, we either manufacture or integratewhich the systeminvoice had not been processed and sent to their preference and then ship the system when it is complete.customer. Revenue is generally recognized upon shipment of the product, to the third party. In those limited situationshowever, there are certain instances where the shipping terms are FOB destination point, we recognize revenue whenis deferred and recognized upon delivery or customer acceptance of the product is delivered. For services, primarily installationas the Company legally retains the risk of loss on these transactions until such time. Estimates used in the recognition of revenues and maintenance related, revenue is recognized when the services have been rendered.Allowance for Doubtful Accounts We make judgments about the credit worthinesscost of both current and prospective customers based on ongoing credit evaluations performed by our credit department. These evaluationsrevenues include, but are not limited to, reviewing customers' prior payment history, analyzing credit applications, monitoring the aging of receivables from current customersestimates for product warranties, price allowances and reviewing financial statements, if applicable. The allowance for doubtful accounts is developed based on several factors including overall customer credit quality, historical write-off experience and a specific account analysis that project the ultimate collectability of the accounts. These factors may change over time causing the reserve levelproduct returns.adjust accordingly. When it is determined that a customer is unlikely to pay, a charge is recorded to bad debtexpenserevenues are recognized in the consolidated statementssame period in which the specific revenues are recorded. Shipping and handling fees billed to customers are reported in revenue. Shipping and handling costs incurred by the Company are included in cost of operations and the allowance for doubtful accounts is increased. When it becomes certain the customer cannot pay, the receivable is written off by removing the accounts receivable amount and reducing the allowance for doubtful accounts accordingly. At December 31, 2010, there were approximately $23.7 million in gross outstanding receivables and $0.3 million recordedsales. Estimates used in the allowancerecognition of revenues and cost of revenues include, but are not limited to, estimates for doubtful accounts to cover potential future customer non-payments. At December 31, 2009, there were approximately $11.0 million in gross outstanding accounts receivableproduct warranties, price allowances and $0.2 million recorded in the allowance for doubtful accounts. If economic conditions deteriorate significantly or if one of our large customers were to declare bankruptcy, a larger allowance for doubtful accounts might be necessary.management'smanagement’s estimates related to our future manufacturing schedules, customer demand and the development of digitalnew technology, which could make our theatre and lighting products obsolete, among other items. Management has managed these risks in the past and believes that it can manage them in the future; however, operating margins may suffer if they are unable to effectively manage these risks.20102012, we hadhave recorded gross inventorynet deferred tax assets of approximately $30.9 million and $2.9 million$3.1 million. If it would be determined that some or all of inventory reserves. This compared to $15.7 million and $2.7 million, respectively, at December 31, 2009.Warranty Our products must meet certain product quality and performance criteria. In addition to known claims or warranty issues,these assets would not be realized, valuation reserves would be required which would have a material adverse affect on our results of operations.estimate future claimsdetermine whether it is more likely than not that the tax positions will be sustained based on recent sales and the lengthtechnical merits of the warranty period. We rely on historical product claims data to estimateposition and 2) for those tax positions that meet the costmore likely than not recognition threshold, we would recognize the largest amount of product warranties at the time revenue is recognized. In determining the accrual for the estimated cost of warranty claims, we consider experience with: 1) costs for replacement parts; 2) costs of scrapping defective products; 3) the number of product units subject to warranty claims 4) length of the warranty period and 5) other direct costs associated with warranty claims. If the cost to repair a product or the number of products subject to warranty claimstax benefit that is greater than originally estimated, our accrued cost for warranty claims would increase. At December 31, 2010,fifty percent likely to be realized upon ultimate settlement with the warranty accrual amounted to $0.8 million and amounts charged to expense were $0.8 million. At December 31, 2009, the warranty accrual amounted to $0.4 million and amounts charged to expense were $0.3 million. The increase in expense during 2010 pertains primarily to the increasing business in our China subsidiaries.Recent Accounting Pronouncements In June 2009, the Financial Accounting Standards Board ("FASB") issued authoritative guidancerelated tax authority. Our uncertain tax positions are related to tax years that remain subject to examination by the accounting for variable interest entities ("VIE's"). The guidance requires reporting entities to evaluate former Qualifying Special Purpose Entities ("QSPE's") for consolidation and changes the approach to determining a VIE's primary beneficiary from a quantitative assessment to a qualitative assessment designed to identify a controlling financial interest. The guidance was effective as of the beginning of a Company's first fiscal year that begins after November 15, 2009. The adoption did not impact the condensed consolidated financial statements. In June 2009, the FASB issued authoritative guidance related to accounting for multiple-deliverable revenue arrangements. This guidance amends ASC 605-25 to eliminate the requirement that all undelivered elements have vendor specific objective evidence ("VSOE") or third-party evidence("TPE") before an entity can recognize the portion of the overall arrangement fee that is attributable to items that already have been delivered. The guidance is effective prospectively for revenue arrangements entered into or materially modified in fiscal years beginning on or after June 15, 2010. Early adoption is permitted. The adoption did not materially impact the condensed consolidated financial statements. In January 2010, the FASB issued authoritative guidance on the accounting for fair value measurements and disclosures (Topic 820). The guidance enhances disclosure requirements related to fair value measurements. Certain provisions of the guidance are effective for annual and interim periods beginning after December 15, 2009 and others for fiscal years beginning after December 15, 2010. Beginning with the quarter ended March 31, 2010 we provided new disclosures, as applicable, to the fair value instruments discussion. The disclosures required for fiscal periods beginning after December 15, 2010 are currently not applicable to our financial statements.2010.2012. If we would borrow up to the maximum amount available under these facilities, a one percent increase in the interest rate would increase interest expense by $0.2 million per annum. Interest rate risks from our other interest related accounts such as our postretirement obligations are not deemed significant.a currencycurrencies other than the entity'sentity’s functional currency are primarily related to our China and Canadian subsidiaries. Fluctuations in the value of foreign currencies create exposures, which can adversely affect our results of operations. From time to time, as market conditions indicate, we will enter into foreign currency contracts to manage the risks associated with forecasted transactions. At December 31, 2012, we had no such foreign currency contracts outstanding.$0.2$0.4 million.Page No.Management'sManagement’s Responsibility for Consolidated Financial Statements3625 26 37Consolidated Financial Statements Consolidated Financial Statements20102012 and 20093827 2010, 20092012, 2011 and 20083928 Stockholders' Equity and Comprehensive Income (Loss)—Income—Years Ended December 31, 2010, 20092012, 2011 and 20084029 Consolidated Statements of Stockholders’ Equity—Years Ended December 31, 2012, 2011 and 2010 Consolidated Statements of Cash Flows—Years Ended December 31, 2010, 20092012, 2011 and 200820104131 2010, 20092012, 2011 and 20084232 7152 MANAGEMENT'Smanagement'smanagement’s best estimates and judgments.fourfive non-employee directors, is responsible for recommending to the Board of Directors the independent accounting firm to be retained each year. The Audit Committee meets regularly and when appropriate separately, with the independent auditors and management to review the Company'sCompany’s performance. The independent auditors and the Audit Committee have unrestricted access to each other in the discharge of their responsibilities.GARY L. CAVEY
Gary L. Cavey KEVIN S. HERRMANN
Mary A. CarstensKevin S. HerrmannSecretary/
20102012 and 2009,2011, and the related consolidated statements of operations, stockholders' equity and comprehensive income, (loss),stockholders’ equity, and cash flows for each of the years in the three-year period ended December 31, 2010.2012. In connection with our audits of the consolidated financial statements, we also have audited financial statement scheduleSchedule II. These consolidated financial statements and financial statement schedule are the responsibility of the Company'sCompany’s management. Our responsibility is to express an opinion on these consolidated financial statements and financial statement schedule based on our audits.20102012 and 2009,2011, and the results of itstheir operations and itstheir cash flows for each of the years in the three-year period ended December 31, 2010,2012, in conformity with U.S. generally accepted accounting principles. Also in our opinion, the related financial statement schedule, when considered in relation to the basic consolidated financial statements taken as a whole, presents fairly, in all material respects, the information set forth therein. �� We also have audited, in accordance with the standards of the Public Company Accounting Oversight Board (United States), the Company'sCompany’s internal control over financial reporting as of December 31, 2010,2012, based on criteria established inInternal Control—Control – Integrated Framework issued by the Committee of Sponsoring Organizations of the Treadway Commission (COSO), and our report dated March 16, 201111, 2013 expressed an unqualified opinion on the effectiveness of the Company'sCompany’s internal control over financial reporting./s/ KPMG LLP16, 201111, 2013December 31, 20102009 2010 2009 $ 22,250,154 $ 23,589,025 208,855 442,766 16,379,492 8,877,980 7,057,331 1,894,075 27,940,237 12,987,048 4,930 1,850,699 2,127,911 1,943,679 662,795 486,527 2,780,517 667,592 79,412,222 52,739,391 2,070,576 2,216,638 9,750,047 3,612,935 700,888 1,103,128 22,000 17,257 75,698 520,951 $ 92,031,431 $ 60,210,300 $ 30,751,310 $ 9,768,896 3,889,836 3,623,143 2,849,555 2,295,946 1,520,769 1,246,247 39,011,470 16,934,232 266,439 274,977 376,703 483,425 39,654,612 17,692,634 — —
issued 16,453,140 shares at December 31, 2010 and 16,283,676 shares at December 31, 2009. 164,531 162,836 36,241,154 35,332,787 259,833 (286,086 ) 80,384 110,665 31,013,597 22,580,144 67,759,499 57,900,346 (15,382,680 ) (15,382,680 ) 52,376,819 42,517,666 $ 92,031,431 $ 60,210,300 Assets Current assets: Cash and cash equivalents $ 40,168 $ 39,889 Accounts receivable (less allowance for doubtful accounts of $487 in 2012 and $142 in 2011) 26,227 30,579 Unbilled revenue — 2,586 Inventories, net 10,971 14,920 Recoverable income taxes 2,069 793 Deferred income taxes 1,724 1,961 Other current assets 2,948 5,692 Total current assets 84,107 96,420 Investment in joint venture — 1,849 Property, plant and equipment, net 11,105 9,419 Property held for sale — 1,810 Intangible assets, net 105 262 Notes receivable 2,232 2,062 Deferred income taxes 1,936 1,596 Other assets 61 38 Total assets $ 99,546 $ 113,456 Liabilities and Stockholders’ Equity Current liabilities: Accounts payable $ 16,646 $ 31,924 Accrued expenses 5,313 4,820 Customer deposits/deferred revenue 5,251 5,037 Income tax payable — 4,135 Total current liabilities 27,210 45,916 Deferred revenue 3,302 3,569 Deferred income taxes 580 397 Other accrued expenses, net of current portion 1,538 351 Total liabilities 32,630 50,233 Commitments and contingencies Stockholders’ equity: Preferred stock, par value $.01 per share; Authorized 1,000 shares, none outstanding — — Common stock, par value $.01 per share; Authorized 25,000 shares; issued 16,782 and 16,667 shares at December 31, 2012 and December 31, 2011, respectively; 14,051 and 14,512 shares outstanding at December 31, 2012 and 2011, respectively 167 167 Additional paid-in capital 37,770 37,234 Accumulated other comprehensive income (loss): Foreign currency translation 269 (137 ) Postretirement benefit obligation 46 81 Retained earnings 46,903 41,361 85,155 78,706 Less 2,731 and 2,155 of common shares in treasury, at December 31, 2012 and 2011, respectively, at cost (18,239 ) (15,483 ) Total stockholders’ equity 66,916 63,223 Total liabilities and stockholders’ equity $ 99,546 $ 113,456 Years Ended December 31, 2010, 2009 and 2008 2010 2009 2008 $ 136,334,617 $ 72,145,757 $ 54,814,561 111,596,028 57,413,724 46,021,049 24,738,589 14,732,033 8,793,512 3,822,494 2,914,019 3,327,967 9,068,557 8,147,861 7,487,172 — — 2,314,282 12,891,051 11,061,880 13,129,421 172,332 — — (21,675 ) (16,911 ) 275,406 11,998,195 3,653,242 (4,060,503 )
20,873
87,203
513,990 (45,890 ) (33,316 ) (35,437 ) 581,495 (889,997 ) (683,311 ) (163,224 ) (67,156 ) 320,530 12,391,449 2,749,976 (3,944,731 ) (3,957,996 ) (679,458 ) 911,041 $ 8,433,453 $ 2,070,518 $ (3,033,690 )
$
0.60
$
0.15
$
(0.22
) $ 0.59 $ 0.15 $ (0.22 ) 14,163,088 14,002,985 13,914,743 14,371,430 14,161,255 13,914,743 Net revenues $ 169,084 $ 184,433 $ 136,335 Cost of revenues 146,490 154,220 111,596 Gross profit 22,594 30,213 24,739 Selling and administrative expenses: Selling 4,467 3,935 3,822 Administrative 11,456 11,106 9,069 Total selling and administrative expenses 15,923 15,041 12,891 Gain on transfer of assets — — 172 Gain (loss) on sale or disposal of assets 1,332 11 (22 ) Income from operations 8,003 15,183 11,998 Equity in income (loss) of joint venture 10 (189 ) 582 Other income (expense), net 137 71 (188 ) Earnings before income taxes 8,150 15,065 12,392 Income tax expense (2,608 ) (4,718 ) (3,958 ) Net earnings $ 5,542 $ 10,347 $ 8,434 Basic earnings per share $ 0.39 $ 0.72 $ 0.60 Diluted earnings per share $ 0.39 $ 0.71 $ 0.59 Weighted average shares outstanding: Basic 14,038 14,427 14,163 Diluted 14,115 14,485 14,371 Stockholders' Equity and Comprehensive Income (Loss) Years Ended December 31, 2012 2011 2010 Net earnings $ 5,542 $ 10,347 $ 8,434 Adjustment to postretirement benefit obligation: Net actuarial gain (loss) (35 ) 1 (31 ) Currency translation adjustment: Unrealized net change arising during period 406 (397 ) 546 Other comprehensive gain (loss) 371 (396 ) 515 Comprehensive income $ 5,913 $ 9,951 $ 8,949 2010, 20092012, 2011 and 2008 Common
Stock Additional
Paid-In
Capital Comprehensive
Income (Loss) Retained
Earnings Treasury
Stock Accumulated
Other
Comprehensive
Income
(Loss) Total
Stockholders'
Equity $ 159,562 34,637,868 23,543,316 (15,315,454 ) 16,406 43,041,698 — — (3,033,690 ) (3,033,690 ) — — (3,033,690 ) — — (831,424 ) — (831,424 ) (831,424 ) — — (742,027 ) — (742,027 ) (742,027 ) — — 17,825 — 17,825 17,825 (4,589,316 ) 1,236 88,187 — — — 89,423 690 — — — — 690 197 34,766 — — — 34,963 — — — (67,226 ) — (67,226 ) — 92,362 — — — 92,362 — 232,045 — — 232,045 $ 161,685 35,085,228 20,509,626 (15,382,680 ) (1,539,220 ) 38,834,639 — — 2,070,518 2,070,518 2,070,518 — — 604,765 604,765 604,765 — — 742,027 742,027 742,027 — — 17,007 17,007 17,007 3,434,317 996 34,259 — — — 35,255 155 27,837 — — — 27,992 — 185,463 — — 185,463 $ 162,836 35,332,787 22,580,144 (15,382,680 ) (175,421 ) 42,517,666 8,433,453 8,433,453 8,433,453 545,919 545,919 545,919 — — — — — — (30,281 ) (30,281 ) (30,281 ) 8,949,091 1,059 357,648 358,707 512 151,095 151,607 124 36,459 36,583 155,804 155,804 207,361 207,361 $ 164,531 36,241,154 31,013,597 (15,382,680 ) 340,217 52,376,819 Balance at December 31, 2009 $ 163 $ 35,333 $ 22,580 $ (15,383 ) $ (175 ) $ 42,518 Net income — — 8,434 — — 8,434 Other comprehensive gain — — — — 515 515 Issuance of 106 shares of common stock upon exercise of stock options 1 358 — — — 359 Issuance of 51 shares of common stock under the restricted stock plans — 151 — — — 151 Issuance of 12 shares of common stock under the employees stock purchase plan — 36 — — — 36 Income tax benefit related to stock option plans — 156 — — — 156 Share-based compensation expense — 207 — — — 207 Balance at December 31, 2010 164 36,241 31,014 (15,383 ) 340 52,376 Net income — — 10,347 — — 10,347 Other comprehensive (loss) — — — — (396 ) (396 ) Treasury share purchase of 15 shares — — — (100 ) — (100 ) Issuance of 172 shares of common stock upon exercise of stock options 2 276 — — — 278 Issuance of 34 shares of common stock under the restricted stock plans 1 163 — — — 164 Issuance of 8 shares of common stock under the employees stock purchase plan — 25 — — — 25 Income tax benefit related to stock option plans — 359 — — — 359 Share-based compensation expense — 170 — — — 170 Balance at December 31, 2011 167 37,234 41,361 (15,483 ) (56 ) 63,223 Net income — — 5,542 — — 5,542 Other comprehensive gain — — — — 371 371 Treasury share purchase of 576 shares — — — (2,756 ) — (2,756 ) Issuance of 112 shares of common stock under the restricted stock plans — 213 — — — 213 Issuance of 2 shares of common stock under the employees stock purchase plan — 7 — — — 7 Share-based compensation expense — 316 — — — 316 Balance at December 31, 2012 $ 167 $ 37,770 $ 46,903 $ (18,239 ) $ 315 $ 66,916 Years Ended December 31, 2010, 2009 and 2008 2010 2009 2008 $ 8,433,453 $ 2,070,518 $ (3,033,690 ) 127,893 32,358 44,602 395,308 523,015 1,246,867 844,476 289,150 594,421 171,348 516,811 993,602 884,378 837,097 924,247 434,520 398,642 421,113 (581,495 ) 889,997 683,311 — — 2,314,282 106,413 47,752 — 21,675 1,482 (258,170 ) (172,332 ) 15,429 (17,236 ) 242,467 708,846 (1,224,685 ) 381,129 379,325 271,498 (155,804 ) — (92,362 ) (7,272,972 ) (1,875,812 ) 665,543 (5,163,256 ) (1,894,075 ) — (15,308,266 ) (3,930,485 ) (1,024,226 ) (347,616 ) (476,311 ) 1,247,472 (2,111,796 ) (306,993 ) (34,666 ) 20,774,007 3,320,026 293,331 (842,673 ) (201,312 ) (784,381 ) 548,103 1,071,716 253,022 2,239,015 (50,009 ) 841,301 (4,743 ) — 28,393 3,643,232 2,367,167 4,353,589 — — (8,751 ) 888,000 — (94,395 ) 238,677 258,732 490,249 (6,811,667 ) (907,659 ) (818,626 ) 25,539 2,222 271,369 — 10,025,000 2,975,000 (5,659,451 ) 9,378,295 2,814,846 — — 106,782 36,583 27,992 34,963 — — (67,226 ) 358,707 — 90,113 155,804 — 92,362 551,094 27,992 256,994 126,254 390,587 (220,800 ) (1,338,871 ) 12,164,041 7,204,629 23,589,025 11,424,984 4,220,355 $ 22,250,154 $ 23,589,025 $ 11,424,984 Years Ended December 31, 2012 2011 2010 Cash flows from operating activities: Net earnings $ 5,542 $ 10,347 $ 8,434 Adjustments to reconcile net earnings to net cash provided by operating activities: Provision for doubtful accounts 626 (14 ) 128 Provision for obsolete inventory (350 ) (216 ) 395 Provision for warranty 538 418 844 Depreciation and amortization 1,268 1,757 1,490 Equity in (income) loss of joint venture (10 ) 189 (582 ) (Gain) loss on forward contracts (145 ) 306 106 (Gain) loss on disposal or transfer of assets (1,332 ) (11 ) (150 ) Deferred income taxes 71 (1,211 ) 242 Share-based compensation expense 393 373 381 Excess tax benefits from share-based arrangements — (359 ) (156 ) Changes in operating assets and liabilities: Accounts, unbilled and notes receivable 6,402 (12,009 ) (12,436 ) Inventories 4,265 13,684 (15,656 ) Other current assets 2,605 (2,761 ) (2,112 ) Accounts payable (15,534 ) 1,418 20,774 Accrued expenses 572 197 (843 ) Customer deposits/deferred revenue (88 ) 5,774 548 Current income taxes (5,382 ) 2,133 2,239 Other assets 130 37 (3 ) Net cash (used in) provided by operating activities (429 ) 20,052 3,643 Cash flows from investing activities: Distribution from joint venture 2,509 — 888 Decrease in restricted investments — — 239 Capital expenditures (2,541 ) (2,886 ) (6,812 ) Proceeds from sales of assets 3,334 88 26 Net cash provided by (used in) investing activities 3,302 (2,798 ) (5,659 ) Cash flows from financing activities: Purchase of treasury stock (2,756 ) — — Proceeds from employee stock purchase plan 8 25 36 Proceeds from exercise of stock options — 178 359 Excess tax benefits from share-based arrangements 2 359 156 Net cash (used in) provided by financing activities (2,746 ) 562 551 Effect of exchange rate changes on cash and cash equivalents 152 (177 ) 126 Net increase (decrease) in cash and cash equivalents 279 17,639 (1,339 ) Cash and cash equivalents at beginning of year 39,889 22,250 23,589 Cash and cash equivalents at end of year $ 40,168 $ 39,889 $ 22,250 Supplemental disclosure of cash paid for: Interest $ 22 $ 36 $ 16 Income Taxes $ 4,469 $ 4,233 $ 3,117 Supplemental disclosure of non-cash activities: Common stock exchanged for stock options $ — $ 100 $ — Years ended December 31, 2010, 20092008NatureBasis of Operations("Ballantyne"(“Ballantyne” or the "Company"“Company”), a Delaware corporation, and its wholly owned subsidiaries Strong Westrex, Inc., Strong Technical Services, Inc., Strong/MDI Screen Systems, Inc., and the American West BeijingStrong Westrex (Beijing) Trading Company, Ltd.Inc., design, develop, manufacture, servicedistribute, integrate and distributeservice theatre and lighting systems. systems on a worldwide basis.Company'sCompany’s products are distributed to movie exhibition companies, sports arenas, auditoriums, amusement parks and special venues.2. Summary of Significant Accounting PoliciesBasis of Presentation and 20102012 presentation. Ballantyne sells movie projectors whichhighly complex and have many components that make up a complete system, which is referred to as an "integrated system." Each customer selects options for certain components in determining the integrated system they chose to purchase. To recognize revenue, the Company follows the requirements of Accounting Standards Codification (ASC) Subtopic 605-10,Revenue Recognition—General, which consists of determining that:seller'sseller’s price to the buyer is fixed or determinable Once the customer has determined the features for their integrated system, the Company either manufactures or integrates the system to their preference and then ships the system when it is complete. Revenue is generally recognized upon shipment of the product to the third party. In those limited situations where the shipping terms are FOB destination point, theproductcustomer. If an arrangement involves multiple deliverables, the items are considered separate units of accounting if the items have value on a stand-alone basis and there is delivered.objective and reliable evidence of their fair values. Revenues from the arrangement are allocated to the separate units of accounting based on their objectively determined fair value. For services, primarily installation and maintenance related, revenue is recognized when the services have been rendered. Revenues from service and support contracts is deferred and recognized as earned ratably over the service coverage periods. Unbilled revenue represents revenue recognized in accordance with ourthe Company’s revenue recognition policy for which the invoice had not been processed and sent to the customer. Revenue is generally recognized upon shipment of the product, however, there are certain instances where revenue is deferred and recognized upon delivery or customer acceptance of the product as the Company legally retains the risk of December 31, 2010loss on these transactions until such time. Estimates used in the recognition of revenues and 2009.Ballantyne Strong, Inc.revenues include, but are not limited to, estimates for product warranties, price allowances and Subsidiariesto the Consolidated Financial Statements (Continued)Years ended December 31, 2010, 2009 and 2008Trade Accounts Receivablemaintained andetermines the allowance for doubtful accounts of $0.3 million and $0.2 million at December 31, 2010 and 2009, respectively. This allowance is developed based on several factors including overall customer credit quality, historical write-off experience and a specific analysis that projects the ultimate collectability of the account. As such, these factors may change over time causing the reserve level to adjust accordingly.Consignment Inventory Digital and film projection equipment is provided to potential customers for consignment and demonstration purposes under customer use agreements. The Company considered the guidance contained within ASC Subtopic 605-10 to determine the proper accounting treatment for these agreements. Consignment inventory is reviewed for impairment by comparing the inventory to thefuture usage and sales. Digital and film projection equipment on consignment amounted to approximately $0.7 millionfair value at December 31, 2010 compared2012 and accrue interest at 15%. The Company estimates allowances for doubtful accounts based on the Company’s best estimates of the amount of probable credit losses pertaining to $0.5 million at December 31, 2009.management'smanagement’s review of inventories on hand compared to estimated future usage and sales, technological changes and product pricing.the carrying value of our indefinite-lived intangible assets for impairment at least annually as well as when events and circumstances indicate impairment may have occurred. We evaluate our other tangible and intangible assets for impairment when there is evidence that events or circumstances indicate that the carrying amount of these assets may not be recoverable. Intangible assets with definite lives are amortized over their respective estimateestimated useful lives to their estimated residual values. Significant judgments and assumptions are required in the impairment evaluations.Ballantyne Strong, Inc.an asset may not be recoverable. The recoverability of property, plant and SubsidiariesNotesequipment is based on management’s estimates of future undiscounted cash flows and these estimates may vary due to a number of factors, some of which may be outside of management’s control. To the Consolidated Financial Statements (Continued)Years ended December 31, 2010, 2009extent that the Company is unable to achieve management’s forecasts of future income, it may become necessary to record impairment losses for any excess of the net book value of property, plant and 2008Major Maintenance ActivitiesOther Taxes Sales taxes assessed by governmental authorities including sales, use, and excise taxes are on a net basis and therefore the presentation of these taxes is excluded from revenues and is shown as a liability on the balance sheet until remitted to the appropriate taxing authorities.Research and Development Research and development related costs are charged to operations in the period incurred. Such costs amounted to approximately $1.2, $0.7 and $0.6 million for the years ended December 31, 2010, 2009 and 2008, respectively.Advertising Costs Advertising and promotional costs are expensed as incurred and amounted to approximately $0.8 million for each of the years ended December 31, 2010, 2009 and 2008.Fair Value of Financial and Derivative InstrumentsCompany follows the FASB issued authoritative guidance with regards to accounting for fair value measurements and disclosures. The carrying values of cash and cash equivalents, receivables, accounts payable and accrued expenses reported in the consolidated balance sheets equal or approximate their fair values due to the short-term nature of these instruments. The Company follows the FASB issued authoritative guidance with regards to accounting for derivatives whereby the Company recognizes all derivative financial instruments as either assets or liabilities at their fair value. During 2010, the Company maintained forward contracts to hedge its exposure to foreign currency risk related to transactions being conducted at the Company's Canadian subsidiary. The contracts did not have a material impact on the Company's statement of operations.Ballantyne Strong, Inc. and SubsidiariesNotes to the Consolidated Financial Statements (Continued)Years ended December 31, 2010, 2009 and 2008Cash and Cash Equivalents All short-term, highly liquid financial instruments are classified as cash equivalents in the consolidated balance sheets and statements of cash flows. Generally, these instruments have maturities of three months or less from date of purchase.Earnings (loss) Per Common Share Basic earnings (loss) per share have been computed on the basis of the weighted average number of shares of common stock outstanding. Diluted earnings (loss) per share has been computed on the basis of the weighted average number of shares of common stock outstanding after giving effect to potential common shares from dilutive stock options. The following table provides reconciliation between basic and diluted earnings (loss) per share: Years Ended December 31, 2010 2009 2008 $ 8,433,453 $ 2,070,518 $ (3,033,690 ) 14,163,088 14,002,985 13,914,743 $ 0.60 $ 0.15 $ (0.22 ) $ 8,433,453 $ 2,070,518 $ (3,033,690 ) 14,163,088 14,002,985 13,914,743 208,342 158,270 — 14,371,430 14,161,255 13,914,743 $ 0.59 $ 0.15 $ (0.22 ) Options to purchase 50,000 and 118,125 shares of common stock at a weighted average price of $8.32 and $4.55 were outstanding as of December 31, 2010 and 2009, respectively, but were not included in the computation of diluted earnings per shares as the option's exercise price was greater than the average market price of the common shares for the respective period. These instruments expire between May 2011 and November 2020. In addition, 10,200 shares of restricted stock were excluded from the diluted EPS calculation as these shares were anti-dilutive as of December 31, 2010. At December 31, 2008, options and restricted stock outstanding were not included in the computation of diluted earnings (loss) per share as the Company reported a loss from continuing operations available to common stockholders.Stock Compensation Plans The Company recognizes compensation expense for all share-based payment awards made to employees and directors based on estimated values. The Company uses the straight-line amortization method over the vesting period of the awards. The Company has historically issued shares upon exercise of stock options or vesting of restricted stock from new stock issuances. Share-based compensation cost that has been included in income (loss) from operations amounted to $0.4 million for each of the twelve months ended December 31, 2010 and 2009 and $0.3 million forBallantyne Strong, Inc. and SubsidiariesNotes to the Consolidated Financial Statements (Continued)Years ended December 31, 2010, 2009 and 2008the twelve months ended December 31 2008. No share-based compensation cost was capitalized as a part of inventory as of December 31, 2010 and 2009.Impairment of Long-Lived Assets and Amortizable Intangibles The Company reviews long-lived assets and amortizable intangibles, exclusive of goodwill, for impairment whenever events or changes in circumstances indicate that the carrying amount of an asset may not be recoverable in accordance with ASC 360-10 "Property, Plant and Equipment". The Company's most significant long-lived assets subject to these periodic assessments of recoverability are property, plant and equipment, which have a net book value of $9.8 million at December 31, 2010. The Company's amortizable intangibles which are subject to recovery consist of trademarks, customer relationships and non-competition agreements which have a carrying value of $0.7 million at December 31, 2010. The recoverability of property, plant and equipment and intangibles is based on management's estimates of future undiscounted cash flows, these estimates may vary due to a number of factors, some of which may be outside of management's control. To the extent that the Company is unable to achieve management's forecasts of future income, it may become necessary to record impairment losses for any excess of the net book value of property, plant and equipment or intangibles over their fair value. In addition, the Company has long-lived assets which consist of the Company's equity method investment in a joint venture. The Company would recognize a loss when there is a loss in value of the equity method investment which is other than a temporary decline. No impairment existed at December 31, 2010.Retirement Benefits The Company follows the FASB issued authoritative guidance with regards to postretirement defined benefit plans. The guidance requires the recognition of the overfunded or underfunded position of a defined benefit postretirement plan as an asset or liability in the balance sheet, the measurement of a plan's assets and its obligations that determine its funded status as of the end of the employer's fiscal year, and the recognition of changes in the funded status through comprehensive income in the year in which the changes occur.Foreign Currency Translation For foreign subsidiaries, the environment in which the business conducts operations is considered the functional currency, generally the local currency. The assets and liabilities of foreign subsidiaries are translated into the United States dollar at the foreign exchange rates in effect at the end of the period. Revenue and expenses of foreign subsidiaries are translated using an average of the foreign exchange rates in effect during the period. Translation adjustments are not included in determining net earnings (loss) but are presented in comprehensive income (loss) within the consolidated statements of changes in shareholder's equity and comprehensive income (loss). Transaction gains and losses that arise from foreign exchange rate fluctuations on transactions denominated in a currency other than the functional currency are included in the statements of operations as incurred.Ballantyne Strong, Inc. and SubsidiariesNotes to the Consolidated Financial Statements (Continued)Years ended December 31, 2010, 2009 and 2008Warranty Reserves The Company generally grants a warranty to its customers for a one-year period following the sale of all new equipment, and on selected repaired equipment for a one-year period following the repair. The warranty period is extended under certain circumstances and for certain products. In most instances the digital products are covered by the manufacturing firm's OEM warranty; however, there are certain customers where the Company may grant warranties in excess of the manufacturer's warranty. The Company accrues for these costs at the time of sale or repair, when events dictate that additional accruals are necessary. The following table summarizes warranty activity for the three years ended December 31, 2010. $ 381,710 594,421 (429,666 ) (54,909 ) $ 491,556 289,150 (417,937 ) 15,376 $ 378,145 841,068 (378,302 ) 7,446 $ 848,357 Recently Issued Accounting Pronouncements In June 2009, the Financial Accounting Standards Board ("FASB") issued authoritative guidance related to the accounting for variable interest entities ("VIE's"). The guidance requires reporting entities to evaluate former Qualifying Special Purpose Entities ("QSPE's") for consolidation and changes the approach to determining a VIE's primary beneficiary from a quantitative assessment to a qualitative assessment designed to identify a controlling financial interest. The guidance was effective as of the beginning of a Company's first fiscal year that begins after November 15, 2009. The adoption did not impact the condensed consolidated financial statements.Ballantyne Strong, Inc. and SubsidiariesNotes to the Consolidated Financial Statements (Continued)Years ended December 31, 2010, 2009 and 2008 In June 2009, the FASB issued authoritative guidance related to accounting for multiple-deliverable revenue arrangements. This guidance amends ASC 605-25 to eliminate the requirement that all undelivered elements have vendor specific objective evidence ("VSOE") or third-party evidence ("TPE") before an entity can recognize the portion of the overall arrangement fee that is attributable to items that already have been delivered. The guidance is effective prospectively for revenue arrangements entered into or materially modified in fiscal years beginning on or after June 15, 2010. Early adoption is permitted. The adoption did not materially impact the condensed consolidated financial statements. In January 2010, the FASB issued authoritative guidance on the accounting for fair value measurements and disclosures (Topic 820). The guidance enhances disclosure requirements related to fair value measurements. Certain provisions of the guidance are effective for annual and interim periods beginning after December 15, 2009 and others for fiscal years beginning after December 15, 2010. Beginning with the quarter ended March 31, 2010 we provided new disclosures, as applicable, to the fair value instruments discussion. The disclosures required for fiscal periods beginning after December 15, 2010 are currently not applicable to our financial statements.3. Comprehensive Income (Loss) The accumulated other comprehensive income (loss), net, shown in the Company's consolidated balance sheets includes the unrealized loss on investments in securities, pension liability adjustments and the accumulated foreign currency translation adjustments. The following table shows the difference between the Company's reported net earnings (loss) and its comprehensive income (loss): Years Ended December 31, 2010 2009 2008 $ 8,433,453 $ 2,070,518 $ (3,033,690 ) — 742,027 (742,027 ) 545,919 604,765 (831,424 ) (30,281 ) 17,007 17,825 $ 8,949,091 $ 3,434,317 $ (4,589,316 ) Included in unrealized gain (loss) on investment in securities for the twelve months ended December 31, 2009 are realized holding losses of approximately $1.1 million less a reclassification adjustment for gains recorded on the settlement of the securities included in net earnings of approximately $1.1 million. No such losses were incurred during the year ended December 31, 2010.4. Digital Link II Joint VentureInvestment in Digital Link II On March 6, 2007, the Company entered into an agreement with RealD to form an operating entity Digital Link II, LLC (the "LLC"). Under the agreement, the LLC was formed with the Company and RealD as the only two members with membership interests of 44.4% and 55.6%, respectively. The LLC was formed for purposes of commercializing certain 3D technology and to fundBallantyne Strong, Inc. and SubsidiariesNotes to the Consolidated Financial Statements (Continued)Years ended December 31, 2010, 2009 and 2008the deployment of digital projector systems and servers to exhibitors. Summarized financial data for the LLC is as follows (unaudited), in thousands: December 31,
2010 December 31,
2009 $ 3,316 $ 877 9,419 12,935 3,011 3,047 5,361 5,574 $ 4,363 $ 5,191 Twelve months ended December 31, 2010 2009 2008 $ 8,240 $ 22 $ (29 ) (6,455 ) (1,553 ) (1,064 ) (258 ) (295 ) (274 ) 1,527 (1,826 ) (1,367 ) (358 ) (270 ) (54 ) $ 1,169 $ (2,096 ) $ (1,421 ) The Company accounts for its investment by the equity method. Under this method, the Company recorded its proportionate share of LLC net income or loss based on the LLC's financial statements as of December 24, 2010. The LLC uses four 13-week periods for a total of 52 weeks to align its fiscal year end with that of its majority interest holder, RealD. The Company's portion of income of the LLC was $0.6 million for the year ended December 31, 2010 as compared to the portion of loss of the LLC of approximately $0.9 million and $0.7 million for the years ended December 31, 2009 and 2008, respectively. The Company sold digital theatre projection equipment, in the normal course of business, to the LLC for approximately $4.7 million, $2.2 million and $3.7 million during the twelve months ended December 31, 2010, 2009 and 2008, respectively. The LLC in turn provides and sells the digital projection equipment to third party customers under system use agreements or through sales agreements. Revenue recognized by the Company was $4.1 million, $1.2 million and $2.1 million during the twelve months ended December 31, 2010, 2009 and 2008, respectively. Revenue recognized by the Company on the sale transaction to the LLC is limited by its 44.4% ownership in the joint venture which will be recognized upon sale of the equipment to the third parties. The total receivable balance due from the LLC was insignificant at December 31, 2010 and $0.2 million at December 31, 2009. During the second quarter of 2010, the LLC made a significant sale of equipment to a third party customer that resulted in the LLC recording a gain on the sale of assets of approximately $2.8 million. During the third quarter of 2010 the Company received a $0.9 million return of the investment in the LLC. The Company received no other distributions from the LLC.Ballantyne Strong, Inc. and SubsidiariesNotes to the Consolidated Financial Statements (Continued)Years ended December 31, 2010, 2009 and 2008Guarantees During 2010 and 2009, the Company and RealD provided guarantees to notes payable entered into by Digital Link II, LLC to finance digital projection equipment deployed in the normal course of business. The notes bear interest at rates ranging from 7.0% to 7.46%. The following table summarizes the Company's guarantees: Interest Rate Original Notes
Payable Balance Ballantyne
Ownership Original
Guarantee Remaining
Guarantee as of
12/31/10 7.0 % $ 626,663 44.40 % $ 278,238 $ 58,837 7.2 % 756,440 44.40 % 335,860 — 7.0 % 1,142,239 44.40 % 507,154 120,799 7.2 % 265,538 44.40 % 117,899 10,493 7.2 % 1,039,646 44.40 % 461,603 22,326 7.0 % 184,098 44.40 % 81,739 45,403 7.25 % 152,850 44.40 % 67,865 32,143 7.46 % 1,824,774 44.40 % 810,200 520,719 7.46 % 749,308 44.40 % 332,693 223,288 7.46 % 423,224 44.40 % 187,912 135,626 7.46 % 216,141 44.40 % 95,966 74,161 $ 7,380,921 $ 3,277,129 $ 1,243,795 Under terms of the guarantees, the Company and RealD would be required to fulfill the guarantee should the joint venture be in default of its loans or contract terms. The Company has recorded an insignificant liability for the fair value of the obligations undertaken by issuing the guarantees at December 31, 2010. The guarantees will expire at the time each loan is paid off.5. Sale of Product Line During 2008, the Company sold its coater and marinade product line in exchange for $0.3 million in cash. In connection with the sale, the Company recorded a pre-tax net gain of approximately $0.3 million (estimated $0.2 million after-tax) which is net of related costs to sell.6. Investments Prior to 2010, the Company had certain investments in auction-rate securities which were classified as available-for-sale securities and accounted for in accordance with SFAS No. 115, "Accounting for Certain Investments in Debt and Equity Securities." In June 2009, the Company entered into a settlement agreement with a financial institution with whom the Company had a banking relationship to sell, at the Company's option, all or a portion of its outstanding auction-rate securities ("ARS") at par, plus accrued interest. The settlement agreement provided for a provision on confidentiality and a release of the financial institution from claims related to the Company's purchase, ownership and sale of the securities. Subsequently, in June 2009, the Company sold its remaining outstanding ARS under the terms of the settlement agreement which amounted to $9.4 million plus interest accrued. During 2009, the Company also liquidated, at par, outstanding ARS which amounted to $0.7 million of whichBallantyne Strong, Inc. and SubsidiariesNotes to the Consolidated Financial Statements (Continued)Years ended December 31, 2010, 2009 and 2008$0.05 million were sold through the normal auction process and $0.6 million were redeemed by the fund itself. The Company previously recorded a temporary impairment as an unrealized loss on the outstanding ARS in other comprehensive income (loss) prior to settlement of the ARS. As a result of entering into the settlement agreement, the Company recorded the temporary impairment as a realized loss of approximately $1.1 million within other income (expense). The Company also recorded an offsetting gain on the settlement in the amount of $1.1 million which was recorded in other income (expense) during twelve months ended December 31, 2009. No such investments were acquired or sold during the year ended December 31, 2010.7. Fair Value of Financial Instruments The fair value of the Company's cash and cash equivalents, accounts receivable, accounts payable and accrued expenses equal or approximate their fair values due to the short-term nature of these instruments. The estimated fair values and related assumptions used to estimate fair value of the Company's financial instruments are disclosed below. ASC 820 "Fair Value Measurements and Disclosures" establishes a hierarchy for fair value measurements based upon observable independent market inputs and unobservable market assumptions. Inputs refer broadly to the assumptions that market participants would use in pricing the assets or liability, including assumptions about risk. Considerable judgment is required in interpreting market data used to develop the estimates of fair value. The following represents the three categories of inputs used in determining the fair value of financial assets and liabilities:Level 1:Quoted market prices in active markets for identical assets or liabilities.Level 2:Observable market based inputs or unobservable inputs that are corroborated by market data.Level 3:Unobservable inputs that are used in the measurement of assets and liabilities. Unobservable inputs require management to make certain projections and assumptions about the information that would be used by market participants in pricing the asset or liability. The Company held no assets or liabilities measured at fair value on a recurring basis with the use of significant unobservable inputs (Level 3) during the years ended December 31, 2010 and 2009.Ballantyne Strong, Inc. and SubsidiariesNotes to the Consolidated Financial Statements (Continued)Years ended December 31, 2010, 2009 and 20088. Inventories Inventories consist of the following: December 31, 2010 December 31, 2009 $ 5,651,083 $ 4,714,956 431,962 169,707 21,857,192 8,102,385 $ 27,940,237 $ 12,987,048 The inventory balances are net of reserves of approximately $2.9 million and $2.7 million as of December 31, 2010 and December 31, 2009, respectively.9. Property, Plant and Equipment Property, plant and equipment include the following: December 31, 2010 December 31, 2009 $ 378,195 $ 313,500 8,955,504 4,106,869 8,182,312 5,802,596 1,659,920 2,196,827 19,175,931 12,419,792 (9,425,884 ) (8,806,857 ) $ 9,750,047 $ 3,612,935 Depreciation expense amounted to approximately $0.9 million, $0.8 million and $0.9 million for the years ended December 31, 2010, 2009 and 2008, respectively.10. Intangible Assets As of December 31, 2010 and December 31, 2009, the Company had unamortized identifiable net assets of $0.7 million and $1.1 million, respectively. The following table details amounts relating to those assets as of December 31, 2010: Useful life Gross Accumulated
amortization Net (Years) 3 - 40 $ 1,801,055 $ (1,209,358 ) $ 591,697 2 - 23 270,576 (178,409 ) 92,167 167,528 (150,504 ) 17,024 $ 2,239,159 $ (1,538,271 ) $ 700,888 Ballantyne Strong, Inc. and SubsidiariesNotes to the Consolidated Financial Statements (Continued)Years ended December 31, 2010, 2009 and 2008 The following table details amounts relating to those assets as of December 31, 2009: Useful life Gross Accumulated
amortization Net (Years) 4 - 5 $ 1,706,003 $ (741,061 ) $ 964,942 3 227,470 (165,066 ) 62,404 3 - 5 166,158 (116,376 ) 49,782 Indefinite 26,000 — 26,000 $ 2,125,631 $ (1,022,503 ) $ 1,103,128 The increase in the cost of the identifiable assets is due to certain intangibles recorded in a foreign currency and therefore affected by fluctuations in the exchange rate. Intangible assets, other than goodwill, with definitive lives are amortized over their useful lives. The Company recorded amortization expense relating to other identifiable intangible assets of $0.4 million during each of the years ended December 31, 2010, 2009 and 2008. The difference between the amortization expense recorded and the change in accumulated amortization is the result of translating the intangible assets carried in Canadian dollars at each period end. The following table shows the Company's estimated future amortization expense related to intangible assets for the next five years. Amount $ 420,665 $ 175,154 $ 43,474 $ 43,474 $ 18,110 11. Goodwill During 2008 the Company recorded a non-cash impairment charge for the entire carrying value of goodwill or $2.3 million. After this charge no goodwill balance remains on the books for the years ended December 31, 2010 and 2009.Ballantyne Strong, Inc. and SubsidiariesNotes to the Consolidated Financial Statements (Continued)Years ended December 31, 2010, 2009 and 200812. Other Accrued Expenses The major components of other current accrued expenses are as follows: December 31, 2010 2009 $ 2,050,494 $ 1,809,825 590,461 571,366 — 233,874 15,054 17,342 116,992 495,844 848,357 378,145 268,478 116,747 $ 3,889,836 $ 3,623,143 The major components of long-term accrued expenses are as follows: December 31, 2010 2009 $ — $ 92,371 357,639 342,669 19,064 48,385 $ 376,703 $ 483,425 13. Debt Effective June 30, 2010, the Company entered into a $20 million Revolving Credit Agreement and Note (collectively, the "Revolving Credit Agreement"), each effective as of June 30, 2010, with Wells Fargo Bank, N.A. ("Wells Fargo"). The Company may request an increase in the Revolving Credit Agreement of up to an additional $5 million; however, any advances on the additional $5 million are subject to approval of Wells Fargo. The borrowings from the Revolving Credit Agreement will primarily be used for working capital purposes and for other general corporate purposes. The Company's accounts receivable, general intangibles and inventory secure the Revolving Credit Agreement. Borrowings under the Revolving Credit Agreement bear interest at a rate equal to LIBOR plus 125 basis points. Interest is paid on a monthly basis. The Company will pay a fee of 0.15% per annum on any unused portion. The Revolving Credit Agreement expires on June 30, 2011 at which time all unpaid principal and interest is due. The Revolving Credit Agreement contains certain covenants, including those relating to the Company's financial condition and limitations on the ability of the Company to pay dividends. The primary financial condition covenant pertains to the Company maintaining a minimum net profit before taxes plus or minus non-cash equity in income of the Digital Link II, LLC joint venture, plus any non-cash charges related to the legacy film projector business, of $1, measured quarterly, on a rolling 4-quarter basis. Other covenants pertain to items such as certain limits on incurring additional debt or lease obligations, certain limits on issuing guarantees and certain limits on loans, advances and investments with third parties. Upon the occurrence of any event of default specified in the RevolvingBallantyne Strong, Inc. and SubsidiariesNotes to the Consolidated Financial Statements (Continued)Years ended December 31, 2010, 2009 and 2008Credit Agreement, including a change in control of the Company (as defined in the Revolving Credit Agreement), all amounts due there under may be declared to be immediately due and payable. No amounts are currently outstanding on the Revolving Credit Agreement. The Company previously was a party to a revolving credit facility with First National Bank of Omaha. This revolving credit facility expired on July 1, 2010.14. Income Taxes Income (loss) before income taxes consists of: Years Ended December 31, 2010 2009 2008 $ 1,021,373 $ (3,382,912 ) $ (5,670,768 ) 11,370,076 6,132,888 1,726,037 $ 12,391,449 $ 2,749,976 $ (3,944,731 ) Income tax expense (benefit) attributable to income from continuing operations consists of: Years Ended December 31, 2010 2009 2008 $ 543,970 $ (1,763,604 ) $ (815,539 ) 11,089 (65,085 ) 4,286 3,150,454 1,799,301 1,201,317 233,059 727,052 (845,050 ) 32,044 (3,750 ) (120,286 ) (12,620 ) (14,456 ) (335,769 ) $ 3,957,996 $ 679,458 $ (911,041 ) Income tax expense attributable to income (loss) from continuing operations differed from the amounts computed by applying the U.S. Federal income tax rate of 34 percent to pretax income (loss) from continuing operations as follows: Years Ended December 31, 2010 2009 2008 $ 4,213,093 $ 934,992 $ (1,341,208 ) 28,468 (45,431 ) (76,560 ) (372,628 ) (263,203 ) — — (12,252 ) (103,198 ) — — 557,305 89,063 65,352 52,620 $ 3,957,996 $ 679,458 $ (911,041 ) Ballantyne Strong, Inc. and SubsidiariesNotes to the Consolidated Financial Statements (Continued)Years ended December 31, 2010, 2009 and 2008 Deferred tax assets and liabilities were comprised of the following: December 31, 2010 2009 $ 270,541 $ 292,049 1,448,570 1,448,463 147,055 126,564 114,619 157,455 308,831 247,038 112,369 59,313 87,956 161,886 144,311 69,404 476,564 310,979 174,119 176,659 3,284,935 3,049,810 (1,347,765 ) (860,157 ) $ 1,937,170 $ 2,189,653 Federal and state income taxes have not been provided on accumulated but undistributed earnings of foreign subsidiaries aggregating approximately $12.4 million at December 31, 2010 as these earnings have been permanently reinvested in the business. The determination of the amount of the unrecognized deferred tax liability related to the undistributed earnings is not practicable. The Company follows the guidance in ASC 740Income Taxes as it pertains to uncertain tax positions. The guidance requires thatCompany’s uncertain tax positions are evaluated in a two-step process, whereby 1) the Company determines whether it is more likely than not that the tax positions will be sustained based on the technical merits of the position and 2) for those tax positions that meet the more likely than not recognition threshold, the Company would recognize the largest amount of tax benefit that is greater than fifty percent likely to be realized upon ultimate settlement with the related tax authority. The Company'sCompany accrues interest and penalties related to uncertain tax positions in the statements of income as income tax expense. Level 1 Level 2 Level 3 Total (in thousands) Cash and cash equivalents $ 40,168 $ — $ — $ 40,168 Notes Receivable $ — $ — $ 2,232 $ 2,232 Level 1 Level 2 Level 3 Total ( in thousands) Cash and cash equivalents $ 39,889 $ — $ — $ 39,889 Foreign currency forward contracts $ — $ 4,723 $ — $ 4,723 Notes Receivable $ — $ — $ 2,062 $ 2,062 Fair Value Valuation Technique Unobservable input Range (in thousands) Notes Receivable $ 2,232 Discounted cash flow Probability of Default 0 % Prepayment rates 0 % Loss severity 0 % 2012 2011 (in thousands) Notes Receivable balance, beginning of period $ 2,062 $ — Issuance of new notes 170 2,062 Notes Receivable balance, end of period $ 2,232 $ 2,062 ( in thousands, except per share amounts) Basic earnings per share: Earnings applicable to common stock $ 5,542 $ 10,347 $ 8,434 Weighted average common shares outstanding 14,038 14,427 14,163 Basic earnings per share $ 0.39 $ 0.72 $ 0.60 Diluted earnings per share: Earnings applicable to common stock $ 5,542 $ 10,347 $ 8,434 Weighted average common shares outstanding 14,038 14,427 14,163 Assuming conversion of options and restricted stock awards outstanding 77 58 208 Weighted average common shares outstanding, as adjusted 14,115 14,485 14,371 Diluted earnings per share $ 0.39 $ 0.71 $ 0.59 2012 2011 2011 (in thousands) Warranty accrual at beginning of period $ 1,028 $ 848 $ 378 Charged to expense 416 546 841 Amounts written off, net of recoveries (688 ) (379 ) (378 ) Foreign currency translation adjustment 14 13 7 Warranty accrual at end of period $ 770 $ 1,028 $ 848 taxits fair value measurements. This update did not have a material effect on the condensed consolidated financial statements.remainresulted in a pre-tax gain of approximately $0.8 million. During the second quarter of 2010, the LLC made a significant sale of equipment to a third party customer that resulted in the LLC recording a pre-tax gain on the sale of assets of approximately $2.8 million. (in thousands) Raw materials and components $ 3,247 $ 5,270 Work in process 1,018 301 Finished goods 6,706 9,349 $ 10,971 $ 14,920 (in thousands) Land $ 65 $ 63 Buildings and improvements 7,528 5,896 Machinery and equipment 4,858 4,680 Office furniture and fixtures 2,404 1,988 Total properties cost 14,855 12,627 Less accumulated depreciation (3,750 ) (3,208 ) Net property, plant and equipment $ 11,105 $ 9,419 2012 2011 (in thousands) Accrued severance, beginning of period $ 963 $ — Severance expense included in Administrative Expenses 107 1,261 Severance paid (982 ) (298 ) $ 88 $ 963 (In thousands) Real Estate $ — $ 1,696 Machinery and Equipment — 114 Total $ — $ 1,810 (Years) ( in thousands) Intangible assets subject to amortization: Customer relationships 4 - 9 $ 1,720 $ (1,615 ) $ 105 Trademarks 3 239 (239 ) — Non-competition agreement 3 - 5 155 (155 ) — Total $ 2,114 $ (2,009 ) $ 105 (Years) ( in thousands) Intangible assets subject to amortization: Customer relationships 4 - 9 $ 1,720 $ (1,476 ) $ 244 Trademarks 3 239 (222 ) 17 Non-competition agreement 3 - 5 155 (154 ) 1 Total $ 2,114 $ (1,852 ) $ 262 (in thousands) 2013 $ 43 2014 43 2015 19 (in thousands) Employee related $ 2,091 $ 1,775 Legal and professional fees 293 117 Outside commissions 471 26 Warranty obligation 770 1,028 Joint venture excess distributions 650 — Interest and taxes 734 789 Post-retirement benefit obligation 19 17 Severance and benefits 88 963 Other 197 105 Total $ 5,313 $ 4,820 (in thousands) Post-retirement benefit obligation $ 328 $ 300 Employee related 212 — Rent and leasehold improvements 972 — Other 26 51 Total $ 1,538 $ 351 examinationapproval of Wells Fargo. The borrowings from the Credit Agreement are to be used for working capital purposes and for other general corporate purposes. The Company’s accounts receivable, general intangibles and inventory secure the Credit Agreement. 2012 2011 2010 (in thousands) United States $ 4,783 $ 7,351 $ 1,022 Foreign 3,367 7,714 11,370 $ 8,150 $ 15,065 $ 12,392 2012 2011 2010 (in thousands) Federal: Current $ 1,257 $ 3,802 $ 544 Deferred 317 (1,338 ) 233 Total 1,574 $ 2,464 777 State: Current 153 324 11 Deferred 29 (104 ) 32 Total 182 220 43 Foreign: Current 1,118 1,814 3,151 Deferred (266 ) 220 (13 ) Total 852 2,034 3,138 $ 2,608 $ 4,718 $ 3,958 relevant taxable authorities. U.S. Federal income tax rate to pretax income from continuing operations as follows: 2012 2011 2010 Amount % Amount % Amount % (amounts in thousands) Expected federal income tax expense $ 2,771 34.0 $ 5,122 34.0 $ 4,213 34.0 State income taxes, net of federal benefit 120 1.5 145 0.9 28 0.2 Foreign tax rates varying from 34% (204 ) (2.5 ) (589 ) (3.9 ) (373 ) (3.0 ) Other (79 ) (1.0 ) 40 0.3 90 0.7 Total $ 2,608 32.0 $ 4,718 31.3 $ 3,958 31.9 December 31 2012 2011 (in thousands) Deferred tax assets: Deferred revenue $ 1,462 $ 1,495 Non-deductible accruals 621 290 Inventory reserves 573 1,050 Stock compensation expense 243 49 Warranty reserves 220 102 Uncollectible receivable reserves 211 404 Accrued group health insurance claims 150 86 Restructuring reserves 32 337 Net operating losses — 219 Depreciation and amortization 148 86 Net deferred tax assets 3,660 4,118 Deferred tax liabilities: Depreciation and amortization 578 — Equity in loss of joint venture 2 914 Other — 44 Net deferred tax liabilities 580 958 Net deferred tax assets $ 3,080 $ 3,160 20062005 through 2009.2012. In most cases, the Company has examinations open for State or local jurisdictions based on the particular jurisdiction'sjurisdiction’s statute of limitations. The Company does not currently have any examinations in process. As of December 31, 2010 and 2009, total unrecognized tax benefits amounted to approximately $0.1 million.(benefit) expense in the consolidated statements of operations and were not material for the yearyears ended December 31, 2012, 2011 and 2010. Amounts accrued for estimated underpayment of income taxes amounted to $0.1$0.2 million as of December 31, 2010.2012 and 2011. The accruals largely relatedrelate to state tax matters.15.July 2006,2011, the Company entered into a notecertain unsecured notes receivable arrangementarrangements with Digital LinkCDF2 Holdings, LLC (Digital Link) pertaining to the sale and installation of digital projectors.projection equipment. The sale amounted toTablenotes receivable accrue interest at a rate of ContentsBallantyne Strong, Inc. and SubsidiariesNotes to the Consolidated Financial Statements (Continued)Years ended December 31, 2010, 2009 and 2008$0.8 million of15% per annum which 25% was due upon installation and was collected. The remaining amounts are due over a 5-year period at an 8% interest rate. The costs incurred with the sale of projectors to Digital Link were expensed during 2006 with no future associated costsis to be incurred. During 2010 the remaining $0.2 million owed under the note receivable was received from Digital Link and recorded to revenue.16. Supplemental Cash Flow Information Supplemental disclosures to the consolidated statements of cash flows are as follows: Years Ended December 31, 2010 2009 2008 $ 16,496 $ 9,964 $ 7,411 $ 3,117,344 $ 1,456,741 $ 683,491 17. Stock Compensation The Company accounts for awards of share-based compensationpaid in accordance with ASC 718,an agreed-upon cash flow schedule, as defined. Interest not paid in any particular year is added to the principal and accrues interest at 15%. The Company has recorded the notes receivable at their fair value. See note 2 for additional information on the fair value of the notes. (in thousands) Extended warranty deferrals expected to be recognized within one year $ 221 $ 74 Extended warranty deferrals expected to be recognized after one year 3,347 3,568 Total revenue deferred for extended warranty $ 3,568 $ 3,642 Compensation—Overall, which requires the measurement and recognition ofCompensationrecorded amounted to $0.4 million for each ofincluded in selling and administrative expenses approximates the years ended December 31, 2010 and 2009 and $0.3 million for the year ended December 31, 2008. During the second quarter of 2010, the Company adopted and, at the 2010 Annual Meeting of Stockholders, the stockholders approved thefollowing: 2012 2011 2010 (in thousands) Share based compensation expense $ 393 $ 373 $ 381 ("(“2010 Plan"Plan”). Subject to the terms of the 2010 Plan, provides the Compensation Committee hasof the Board of Directors with the discretion to determine the terms of each award, including which award, if any, may be subject to vesting upon a "change in control" of the Company. The Committee may grant stock options, stock appreciation rights, restricted shares, restricted stock units, performance shares, or performance units. Vesting terms vary with each grant and may be subject to vesting upon a “change in control” of the Company. The total number of shares reserved for issuance under the 2010 Plan was 600,000 shares. During 2012, the Company awarded 139,000 options and 56,000 restricted stock shares under the 2010 Plan. No shares were granted during 2011 or 2010. At December 31, 2012, 405,000 shares were reserved for granting under the twelve months2010 Plan.2010. The Company currently maintains a 2005 Outside Directors Stock Option Plan which was approved by the Company's stockholders. During fiscal 2008, the Board to purchase shares of Directors made the decision to discontinue granting furthercommon stock options under this plan, however, there are outstanding stock options remaining under this plan. The Company also maintained a 1995 Employee Stock Option Plan which expired in 2005, however, there are outstanding stock options remaining under this expired plan. All past and future grants under the Company's stock option plans were granted atwith exercise prices based onequal to the fair market value of the Company's common stock on the date of grant. The outstanding options generally vestedgrant and vest over periods ranging from zero to three years from the grant date and expired between 5 and 10 years after the grant date. No stock options were granted under these plans during the years ended December 31, 2010 and 2009, respectively.Ballantyne Strong, Inc. SubsidiariesNotes to the Consolidated Financial Statements (Continued)Years ended December 31, 2010, 2009 and 2008 During the fourth quarter of fiscal 2010, the Board of Directors granted the Company's President and CEO 50,000 non-qualified stock options to purchase 2,200 shares and 50,000 shares, respectively of the Company’s common stock upon his being hired by the Company.hiring members of management. The options vest over periods of one to three years. The options were grantedissued at an exercise price based on the fair market value of the Company'sCompany’s common stock on the date of grant and expire 10 years after the date of grant. These options were granted outside of any of the Company'sCompany’s existing stock compensation plans pursuant to applicable regulations allowing for such a grant.estimatedweighted average grant date fair value of thestock options granted duringin 2012, 2011 and 2010 was $2.51, $2.00 and $5.12, respectively. The fair value of each stock option granted is estimated on the twelve months ended December 31, 2010date of $5.12 was calculatedgrant using thea Black-Scholes option-pricingvaluation model usingwith the following weighted average assumptions:2010Expected dividend yield0.0%Risk-free interest rate0.50%Expected volatility67.30%Expected life (in years)6.5 2012 2011 2010 Expected dividend yield at date of grant 0.00 % 0.00 % 0.00 % Risk-free interest rate 1.30 % 1.09 % 0.50 % Expected stock price volatility 57.00 % 64.51 % 67.30 % Expected life of options (in years) 6.0 4.0 6.5 share-based compensation expense related to stock options includedrisk-free interest rate assumptions were based on the U.S. Treasury yield curve in earnings (loss) before income taxes included an insignificant amount foreffect at the year ended December 31, 2010; no expense in the year ended December 31, 2009 and an insignificant amount for the year ended December 31, 2008. Likewise, the associated tax benefits in eachtime of the three years ended December 31, 2010, 2009 and 2008grant. The expected volatility was insignificant. All stock options outstanding pursuant tobased on historical monthly price changes of the Company's stock option plans were fully vested asbased on the expected life of January 1, 2009.Company'sCompany’s activities with respect to its stock options: Number of
Options Weighted
Average
Exercise Price
Per Share Weighted
Average
Remaining
Contractual
Term Aggregate
Intrinsic
Value 443,750 2.33 — — (123,625 ) 0.73 (42,000 ) 7.30 278,125 2.29 2.69 $ 113,250 — — — — — — 278,125 2.29 1.69 $ 480,450 50,000 8.32 (105,875 ) 3.39 — — 222,250 $ 3.12 3.05 $ 1,071,464 172,250 $ 1.62 1.08 $ 1,090,214 (in years) (in thousands) Outstanding at December 31, 2011 52,200 8.14 8.86 — Granted 139,000 4.70 Exercised — — Forfeited — — Outstanding at December 31, 2012 191,200 $ 5.64 8.69 — Exercisable at December 31, 2012 35,533 $ 8.06 7.88 — December 31, 2010.Ballantyne Strong, Inc. and SubsidiariesNotes to the Consolidated Financial Statements (Continued)Years ended December 31, 2010, 2009 and 20082010: Options Outstanding at
December 31, 2010 Options Exercisable at
December 31, 2010 Number of
options Weighted
average
remaining
contractual
life Weighted
average
exercise price
per option Number of
options Weighted
average
remaining
contractual
life Weighted
average
exercise price
per option 125,000 1.33 $ 0.62 125,000 1.33 $ 0.62 47,250 0.42 $ 4.25 47,250 0.42 $ 4.25 50,000 9.83 8.32 — — — 222,250 3.05 $ 3.12 172,250 1.08 $ 1.62 Range of option exercise price $4.07 to $8.32 191,200 8.69 $ 5.64 35,533 7.88 $ 8.06 2010, 50,0002012, 155,667 stock option awards were non-vested. Unrecognized compensation costcosts related to non-vestedall stock option awards was $0.2options outstanding amounted to $0.4 million for the twelve months endedat December 31, 2010. No unrecognized compensation cost related2012, which is expected to non-vested stock option awards existed asbe recognized over a weighted-average period of the years ended December 31, 2009 and 2008. During 2005, the Company adopted and the stockholders approved, thePlan. Under termsPlan (the “2005 Plan”) provides for the grant of the plan, the Compensation Committee of the Board of Directors selects which employees of the Company are to receive restricted stock awards and the termsawards. A total of such awards. The total number of250,000 shares were reserved for issuance under the plan was 250,000 shares. The plan was2005 Plan, which is set to expire in September 2010; however, at the 2010 Annual Meeting of Stockholders, the stockholders of the Company adopted an amendment to extend the duration of the Plan until September 1, 2013. These shares are subject to restrictions on transferability and other restrictions, if any, as the Compensation Committee may impose. During May 2008,2012 the Company granted 54,000awarded 28,210 restricted shares to certain employees. A portion ofunder the shares vested on January 1, 2009 with2005 Plan as partial payment under the remaining shares vesting on January 1,Company’s 2010 as the Company achieved certain earning thresholds, as defined within the restricted stock agreements.Short-Term Incentive Plan. During February of 2009, 64,4912011, 20,959 shares of restricted stock were granted under this planPlan as partial payment under the Company's 2008Company’s 2010 Short-Term Incentive Plan. Additionally, during February of 2010, 41,030The shares of restricted stock were granted under this plan as partial paymentissued in 2012 and 2011 under the Company's 2009 Short-Term Incentive Plan.2005 Plan vested and became unrestricted immediately. At December 31, 2010, 90,4792012, 41,310 shares remain available for issuance under the 2005 Plan. During 2008, the Company adopted and the stockholders approved, theDirectors'Director’s Restricted Stock Plan (Non-Employee Plan)(the “Non-Employee Plan”) provides for the award of restricted shares to replace the 2005 Outside Directors' Stock Option Plan. Theoutside directors. A total number of 250,000 shares are reserved for issuance under the Non-Employee Plan was increased from 120,000 shares to 250,000 by a vote of the stockholders at the 2009 Annual Stockholders Meeting.Plan. During May 2008,2012, 2011 and 2010, the Company granted 15,000 restricted28,200, 12,600 and 10,200 shares under the Non-Employee Plan to the Board of Directors. These shares vested on May 21, 2009. During May 2009, the Company granted 27,000 restricted sharesPlan. Shares issued under the Non-Employee Plan to the Board of Directors. These shares vested on May 20, 2010. Additionally, in April 2009, 18,889 restricted shares were issued in conjunction with an agreement entered into with a member of the Company's Board of Directors to provide consulting services. Subsequently, in September 2009, the consulting agreement was mutually terminated as the objectives of the agreement were achieved. As a result, 8,124 shares vested on the date of the termination agreement and the remaining 10,765 shares were cancelled andBallantyne Strong, Inc. and SubsidiariesNotes to the Consolidated Financial Statements (Continued)Years ended December 31, 2010, 2009 and 2008made available for future issuance in accordance with the Non-Employee Plan. In May 2010, the Company granted 10,200 restricted shares under the Non-Employee Plan to the Board of Directors. These shares will vest the day afterpreceding the Company's 2011Company’s Annual Stockholder Meeting.Meeting of Stockholders in the year following issuance. At December 31, 2010, 189,6762012, 148,876 shares remain available for issuance under the Plan.is accruingaccrues compensation expense based on the estimated number of shares expected to be issued utilizing the most current information available to the Company at the date of the financial statements. The Company estimates the fair value of restricted stock awards based upon the market price of the underlying common stock on the date of grant.2010,2012, the total unrecognized compensation cost related to non-vested restricted stock awarded was insignificant andapproximately $0.3 million which is expected to be recognized over a weighted average period of 5.5 months.activity for the years ended December 31: Number of
Restricted Stock
Shares Weighted Average
Grant Price Fair
Value 69,000 $ 4.48 110,380 1.88 (52,124 ) 4.11 (10,765 ) 2.25 116,491 $ 2.38 51,230 4.88 (93,030 ) 3.65 — 74,691 $ 2.51 Nonvested at December 31, 2011 12,600 $ 5.93 Granted 112,410 5.16 Shares vested (40,810 ) 5.22 Shares forfeited — — Nonvested at December 31, 2012 84,200 $ 5.24 Company'sCompany’s Employee Stock Purchase Plan approved by the stockholders, provides for the purchase of shares of BallantyneCompany common stock by eligible employees at a per share purchase price equal to 85% of the fair market value of a share of BallantyneCompany common stock at either the beginning or end of the offering period, as defined, whichever is lower. Purchases are made through payroll deductions of up to 10% of each participating employee'semployee’s salary. The maximum number of shares that can be purchased by participants in any offering period is 2,000 shares. Additionally, the Plan has set certain limits, as defined, in regard to the number of shares that may be purchased by all eligible employees during an offering period. At December 31, 2010, 76,1942012, 65,753 shares of common stock remained available for issuance under the Plan. The Plan, waswhich is set to expire in October 2010; however, at the 2010 Annual Meeting of Stockholders, the stockholders of the Company adopted an amendment to extend the duration of the Plan until October 31, 2013.Ballantyne Strong, Inc. and SubsidiariesNotes to the Consolidated Financial Statements (Continued)Years ended December 31, 2010, 2009 and 2008 total estimated grant date fair value of purchase rights outstanding under the Employee Stock Purchase Plan of $4.04 was calculated using the Black-ScholesBlack- Scholes option pricing model using weighted average assumptions as follows: For the years ended December 31, 2010 2009 2008 0.30 % 0.47 % 0.37 % — % — % — % 56.94 % 69.95 % 86.09 % 1.0 1.0 1.0 $ 4.04 $ 2.05 $ 0.91 The Company 2012 2011 2010 Expected dividend yield at date of grant 0.00 % 0.00 % 0.00 % Expected stock price volatility 15.90 % 39.72 % 56.94 % Risk-free interest rate 0.15 % 0.12 % 0.30 % Expected term (in years) 1.0 1.0 1.0 Estimated grant date fair value $ 0.88 $ 1.81 $ 4.04 approximately $0.07 million, $0.03 millionduring 2012, 2011 and an insignificant amount of share-based compensation expense pertaining2010 related to the stock purchase plan during the years ended December 31, 2010, 2009 and 2008, respectively. The associated tax benefits recorded in 2010, 2009 and 2008 wereEmployee Stock Purchase Plan was insignificant. At December 31, 2010,2012, the total unrecognized estimated compensation cost was $0.02 million which is expected to be recognized over a period of 10 months.18. Share Repurchase Program On November 12, 2008, the Company's Board of Directors approved a share repurchase program. Under the share repurchase program, the Company may repurchase up to $1.0 million of the Company's outstanding shares of common stock. As of December 31, 2010, the Company has repurchased 42,177 shares at a weighted average cost of approximately $1.59 per share for a total cost of $0.07 million which were recorded to treasury stock. No repurchases were made during fiscal 2010 or 2009. At December 31, 2010, $0.9 million remains available under the authorized program.19. Stockholder Rights Plan The Company's Stockholders Rights Plan expired on June 9, 2010 in accordance with the terms of the Plan.20. Related Party Transactions The Company sold digital projection equipment, in the normal course of business, to its joint venture, Digital Link II, LLC for approximately $4.7 million, $2.2 million and $3.7 million for the years ended December 31, 2010, 2009 and 2008, respectively. The LLC in turn provides the digital projection equipment to third party customers under system use agreements. Revenue recognized by the Company was $4.1 million, $1.2 million and $2.1 million for the years ended December 31, 2010, 2009 and 2008, respectively. Revenue recognized by the Company on the sale transaction to the LLC is limited by its 44.4% ownership in the joint venture which will be recognized upon sale of the equipment to the third parties. The total receivable balance due from the LLC was insignificant at December 31, 2010 and $0.2 million at December 31, 2009.21.insignificant.Company'sCompany’s primary exposure to foreign currency fluctuations pertains to its subsidiaries in Canada and China. In certain instances the Company may enter into foreign exchange forwardBallantyne Strong, Inc. and SubsidiariesNotes to the Consolidated Financial Statements (Continued)Years ended December 31, 2010, 2009 and 2008At December 31, 2010, 2009 and 2008, theThe Company had openhas not designated its foreign exchange forward exchange contracts to purchase Canadian dollars at a fixed rate of U.S. dollars with notional amounts totaling $3.1 million, $3.2 million and $0.6 million, respectively. as hedges.the open contracts amounted to approximately $3.1 million and $3.0 millionderivative instruments, none of which are designated as hedging instruments consisted of: Asset Derivatives (in thousands) Classification Foreign exchange forward contracts Other current liabilities $ — $ 4,723 20102011 is offset against $4.7 million in other current liabilities, resulting in an immaterial net liability. All cash flows related to our foreign currency exchange contracts are classified as operating cash flows. We recognized in other income, the following realized and 2009, respectively. The Company recorded insignificant unrealized gains (losses) associated with these open contracts in its consolidated statement of operations at December 31, 2010, 2009from foreign currency forward exchange contracts:(in thousands) Classification 2012 2011 2010 Foreign exchange forward contracts Other Income (Loss) $ 145 $ (349 ) $ (49 ) 2008.22. Commitments, Contingencies and Concentrationsa."Plan"“Plan”). The Plan is an annual incentive program that provides certain officers and key employee'semployee’s bonuses in the form of cash or restricted stock or a combination of both if the Company achieves certain financial goals. Each payout is further subject to the achievement of certain individual goals, as defined in the Plan.$0.4$0.5 million and $0.1$0.6 million for the years ended December 31,in 2012, 2011 and 2010, 2009 and 2008.respectively. The bonuses are generally paid through a distribution of cash and restricted stock.b."Plan"“Plan”) for all eligible employees. Pursuant to the provisions of the Plan, employees may defer up to 100% of their compensation. The Company will match 50% of the amount deferred up to 6% of their compensation. The contributions made to the Plan by the Company was approximately $0.2 million for each of the years ended December 31, 2010, 20092012, 2011 and 2008.c."Plan"“Plan”) for certain current andtwo former executives and their spouses. The Company'sCompany’s policy is to fund the cost of the Plan as expenses are incurred. The costs of the postretirement benefits arewere accrued over the employees'employees’ service lives. The Company accounts for this plan in accordance with ASC 715Compensation—Retirement Benefits. The guidance requires companies to recognize the funded status of defined benefit pension and other postretirement plans as a net asset or liability on its balance sheet. Actuarial gains and losses are generally amortized subject to the corridor, over the average remaining service life of the Company's active employees.Ballantyne Strong, Inc. and SubsidiariesNotes to the Consolidated Financial Statements (Continued)Years ended December 31, 2010, 2009 and 2008Plan'sPlan’s benefit obligations, fair value of plan assets, and funded status at December 31, 20102012 and 2009: 2012 2011 (in thousands) Reconciliation of benefit obligation Benefit obligation at January 1 $ 315 $ 318 Interest cost 13 14 Benefits paid (17 ) (10 ) Contributions by plan participants 4 2 Actuarial (gain) loss 32 (9 ) Benefit obligation at December 31 347 315 Fair value of plan assets at December 31 — — Funded status at end of year $ (347 ) $ (315 ) Amounts recognized in the balance sheet consist of: Noncurrent assets $ — $ — Current liabilities (19 ) (17 ) Noncurrent liabilities (328 ) (300 ) Accumulated other comprehensive income (46 ) (81 ) Net amount recognized $ (393 ) $ (398 ) 2010 2009 $ 293,851 $ 304,713 15,245 16,567 (12,220 ) (4,429 ) 20,822 (23,000 ) 317,698 293,851 — — $ (317,698 ) $ (293,851 ) $ — $ — (17,011 ) (17,342 ) (300,687 ) (276,509 ) (80,384 ) (110,665 ) $ (398,082 ) $ (404,516 ) consists of: 2010 2009 $ 80,384 $ 110,665 $ 80,384 $ 110,665 The accumulated benefit obligation for the Plan was $318,000 and $294,000 at December 31 20102012 and 2009, respectively. 2011 consists of: 2012 2011 (in thousands) Net actuarial gain $ 46 $ 81 Total accumulated other comprehensive income $ 46 $ 81 2010, 2009 and 2008 was: 2010 2009 2008 $ 15,245 $ 16,567 $ 17,128 (9,459 ) (5,993 ) (4,128 ) $ 5,786 $ 10,574 $ 13,000 Ballantyne Strong, Inc. and SubsidiariesNotes to the Consolidated Financial Statements (Continued)Yearsyears ended December 31, 2012, 2011 and 2010 2009 and 2008 2012 2011 2010 (in thousands) Interest cost $ 13 $ 14 $ 15 Amortization of gain (3 ) (9 ) (9 )) ) Net periodic benefit cost recognized $ 10 $ 5 $ 6 2010, 20092012, 2011 and 20082010 are as follows: 2010 2009 2008 $ (20,822 ) $ 23,000 $ 21,953 (9,459 ) (5,993 ) (4,128 ) $ (30,281 ) $ 17,007 $ 17,825 $ (24,495 ) $ 27,581 $ 30,825 2012 2011 2010 (in thousands) Net actuarial gain (loss) $ (32 ) $ 10 $ (21 ) Amortization of (gain) loss (3 ) (9 ) (9 ) Total recognized in accumulated other comprehensive income (loss) $ (35 ) $ 1 $ (30 ) Total recognized in net periodic benefit cost and accumulated other comprehensive income $ 45 $ 4 $ (25 ) in the amount of $4,419 is expected to be recognized in the next fiscal year.2010, 20092012, 2011 and 20082010 were as follows: 2010 2009 2008 5.25 % 5.75 % 5.75 % N/A N/A N/A 9.0 % 6.5 % 7.00 % Discount rate 3.60 % 4.25 % 5.25 % Rate of compensation increase N/A N/A N/A Health care cost trend rate 7.0 % 8.0 % 9.0 % 2010, 20092012, 2011 and 20082010 were as follows: 2010 2009 2008 5.75 % 5.75 % 5.75 % N/A N/A N/A N/A N/A N/A 9.0 % 6.5 % 7.00 % Discount rate 4.25 % 5.25 % 5.75 % Expected long-term rate of return on plan assets N/A N/A N/A Rate of compensation increase N/A N/A N/A Health care cost trend rate 8.0 % 9.0 % 9.0 % ( in thousands) Effect on total service and interest cost components of periodic postretirement health care benefit cost $ 2 $ (1 ) Effect on the health care component of the accumulated postretirement benefit obligation $ 42 $ (38 ) 1%
Increase 1%
Decrease $ 1,810 $ (1,607 ) $ 36,828 $ (32,945 ) Table of ContentsBallantyne Strong, Inc. and SubsidiariesNotes to the Consolidated Financial Statements (Continued)Years ended December 31, 2010, 2009 and 20089.0%7.0% annual rate of increase in the per capita cost of covered health care benefits was assumed for 2010.2012. The rate was assumed to decrease gradually to 6.0% through 2014 and remain at that level thereafter. 2010 2009 2008 $ 5,786 $ 10,574 $ 13,000 — — — 1,800 1,800 1,800 14,020 6,229 5,774 $17,011$0.02 million to its postretirement benefit plan in 2011. Amount $ 17,011 $ 17,914 $ 18,821 $ 19,727 $ 20,626 $ 91,061 2018-2021 (in thousands) Benefits expected to be paid $ 19 $ 20 $ 21 $ 22 $ 23 $ 85 Company'sCompany’s benefit obligation at December 31, 20102012 and include estimated future employee service.d.ConcentrationsCompany'sCompany and its subsidiaries lease plant and office facilities, autos and equipment under operating leases expiring through 2023. These leases generally contain renewal options and the Company expects to renew or replace certain of these leases in the ordinary course of business. Rent expense under operating lease agreements amounted to approximately $0.6 million, $0.4 million and $0.4 million for the years ended December 31, 2012, 2011 and 2010, respectively. (in thousands) Operating lease payments due $ 4,052 $ 503 $ 524 $ 342 $ 353 $ 359 $ 1,971 42%47% of 20102012 consolidated net revenues and were primarily from the theatre segment. Trade accounts receivable from these customers represented approximately 40%36% of net consolidated receivables at December 31, 2010.2012. Sales to China Film Jingdian Cinema Investment Company, Ltd.CDF2 Holdings represented approximately 8%12% of total 2012 sales while sales to Regal Cinemas, Inc. were the next highestand account receivable from CDF2 represented 5% of net consolidated receivables. The note receivable from CDF2 had an outstanding balance of $2.2 million at 7%.December 31, 2012. Additionally, receivables from China Film Jingdian Cinema Investment Company, Ltd. and Kasima, LLCBelmont Capital Group represented approximately 14% and 8%17% of net consolidated receivables at December 31, 2010, respectively.2012. While the Company believes its relationships with such customers are stable, most arrangements are made by purchase order and are terminable at will by either party. A significant decrease or interruption in business from the Company'sCompany’s significant customers could have a material adverse effect on the Company'sCompany’s business, financial condition and results of operations. The Company could also be adversely affected by such factors as changes in foreign currency rates and weak economic and political conditions in each of the countries in which the Company sells its products. Financial instruments that potentially expose the Company to a concentration of credit risk principally consist of accounts receivable. The Company sells product to a large number of customers in many different geographic regions. To minimize credit concentration risk, the Company performs ongoing credit evaluations of its customers' financial condition. Through distribution agreements with NEC, the Company distributes Starus DLP Cinema projectors to North and South America, the Caribbean, Hong Kong, China and certain other areas of Asia. These agreements are non-exclusive distributorship agreements and some of which can beBallantyne Strong, Inc. and SubsidiariesNotes to the Consolidated Financial Statements (Continued)Years ended December 31, 2010, 2009 and 2008terminated with 90 day advance notice. NEC is the primary supplier of the digital products the Company distributes to the Theatre Industry. If the Company is unable to maintain its relationship with NEC, the results would have a material adverse impact on its business, financial condition and operating results until the Company could find an alternative source of digital equipment to distribute. The principal raw materials and components used in the Company's manufacturing processes include aluminum, reflectors, electronic subassemblies and sheet metal. The Company uses a single manufacturer for each of its intermittent movement components, reflectors, aluminum castings, lenses and xenon lamps. Although the Company has not to-date experienced a significant difficulty in obtaining these components, no assurance can be given that shortages will not arise in the future. The loss of any one or more of such contract manufacturers could have a short-term adverse effect on the Company until alternative manufacturing arrangements are secured.e.Leases The Company and its subsidiaries lease plant and office facilities, furniture, autos and equipment under operating leases expiring through 2012. These leases generally contain renewal options and the Company expects to renew or replace certain of these leases in the ordinary course of business. Rent expense under operating lease agreements amounted to approximately $0.4 million, $0.4 million and $0.3 million for the years ended December 31, 2010, 2009 and 2008, respectively. On June 29, 2010 the Company purchased the land and building facility in Joliette, Province of Quebec in Canada that was previously being leased. The Company has future minimum lease payments for operating leases having initial or remaining non-cancelable lease terms as follows: Payments due by period Total Less than 1 year 1 - 3 years 3 - 5 years More than 5 years 272,711 183,572 81,249 7,890 — f.20102012 and 20092011 are included in accrued group health insurance claimsexpenses in the accompanying consolidated balance sheets. The Company'sCompany’s policy is to accrue the employee health benefit accruals based on historical information along with certain assumptions about future events.g.currently a defendantinvolved, from time to time, in an asbestos case entitled Manuel H. Chinea and Janet M. Chinea v. American Optical Company, Ballantyne Strong, Inc. a/k/a Ballantyne of Omaha, Inc. et al, filed August 17, 2010certain legal disputes in the Superior Courtordinary course of business. No such disputes, individually or in the aggregate, are expected to have a material effect on its business or financial condition at December 31, 2012.StateCompany’s outstanding common stock pursuant to a plan adopted under Rule 10b5-1 of New York. The Company is onethe Securities Exchange Act of twenty-five defendants. The Plaintiffs have agreed to dismiss the Company. The dismissal will be final assuming no defendant objects. During December 2009,1934 (as amended). On August 7, 2012, the Company settled an asbestos case entitledLarry C. Stehman and Leila Stehman v. Asbestos Corporation, Limited and Ballantyneannounced that its Board discontinued the repurchase program prior to having repurchased the full amount of Omaha, Inc. individually and as successor in interest to Strong International, Strong Electric Corporation and Century Projector Corporation, et al,common stock originally authorized.Superior Courtdifferent components of Accumulated Other Comprehensive Income (loss) for the State of California, County of San Francisco. The settlement, including legal fees resulted in charges of $0.4 million during the yearthree years ended December 31, 2009.2012. Postretirement Benefit Obligation Foreign Currency Translation Total (in thousands) Accumulated other comprehensive income (loss) at December 31, 2009 $ 111 $ (286 ) $ (175 ) Other comprehensive gain (loss) (31 ) 546 515 Accumulated other comprehensive income at December 31, 2010 80 260 340 Other comprehensive gain (loss) 1 (397 ) (396 ) Accumulated other comprehensive income (loss) at December 31, 2011 81 (137 ) (56 ) Other comprehensive gain (loss) (35 ) 406 371 Accumulated other comprehensive income at December 31, 2012 $ 46 $ 269 $ 315 Ballantyne Strong, Inc. and SubsidiariesNotes to the Consolidated Financial Statements (Continued)Years ended December 31, 2010, 2009 and 200823. The presentation of segment information reflects the manner in which management organizes segments for making operating decisions and assessing performance.2010,2012, the Company'sCompany’s operations were conducted principally through two business segments: Theatre and Lighting. Theatre operations include the design, manufacture, assembly, sale and service of motion picture projectors, xenon lamphouses and power supplies. Theatre operations also include the sale and service of digital projection equipment, and accessories, sound systems, xenon lamps, lenses and lenses.other accessories. The lighting segment operations include the design, manufacture, assembly and sale of follow spotlights, stationary searchlights and computer operated lighting systems for the motion picture production, television, live entertainment, theme parks and architectural industries. The Company allocates resources to business segments and evaluates the performance of these segments based upon reported segment operating profit. The Company previously evaluated the performance of the segments based on reported segment gross profit. Prior year amounts have been reclassified to conform to the 2010 presentation. All significant intercompany sales are eliminated in consolidation.Ballantyne Strong, Inc. and SubsidiariesNotes to the Consolidated Financial Statements (Continued)Years ended December 31, 2010, 2009 and 2008 Year ended December 31, 2012 2011 2010 (in thousands) Net revenue Theatre Products $ 151,688 $ 167,017 $ 125,044 Services 14,591 14,157 7,882 Total theatre 166,279 181,174 132,926 Lighting 2,805 3,259 3,409 Total revenue $ 169,084 $ 184,433 $ 136,335 2010 2009 2008 $ 125,043,983 $ 65,186,543 $ 47,158,724 7,881,593 3,810,626 3,186,650 132,925,576 68,997,169 50,345,374 3,409,041 3,121,840 4,260,868 — 26,748 208,319 $ 136,334,617 $ 72,145,757 $ 54,814,561 $ 17,187,174 $ 9,993,972 $ 3,232,948 611,632 (451,392 ) (1,907,083 ) 17,798,806 9,542,580 1,325,865 39,694 69,702 189,714 — 13,100 89,651 17,838,500 9,625,382 1,605,230 (5,990,962 ) (5,955,229 ) (5,941,139 ) 150,657 (16,911 ) 275,406 (25,017 ) 53,887 478,553 581,495 (889,997 ) (683,311 ) (163,224 ) (67,156 ) 320,530 $ 12,391,449 $ 2,749,976 $ (3,944,731 ) $ 6,193,349 $ 844,121 $ 511,568 604,956 59,698 282,911 6,798,305 903,819 794,479 13,362 3,840 24,147 $ 6,811,667 $ 907,659 $ 818,626 $ 1,249,384 $ 1,471,600 $ 4,312,839 207,595 242,618 265,818 1,456,979 1,714,218 4,578,657 33,267 38,332 74,587 $ 1,490,246 $ 1,752,550 $ 4,653,244 Year ended December 31, 2012 2011 2010 (in thousands) Operating income (loss) Theatre Products $ 12,582 $ 20,394 $ 17,187 Services 2,116 2,430 612 Total theatre 14,698 22,824 17,799 Lighting (227 ) 165 40 Total segment operating income 14,471 22,989 17,839 Unallocated general and administrative expenses (7,800 ) (7,817 ) (5,991 ) Gain on sale of assets 1,332 11 150 Income from operations 8,003 15,183 11,998 Equity income (loss) of joint venture 10 (189 ) 582 Other income (loss) 137 71 (188 ) Income before income taxes $ 8,150 $ 15,065 $ 12,392 Expenditures on capital equipment: Theatre Products $ 1,437 $ 2,808 $ 6,193 Services 1,243 71 605 Total theatre $ 2,680 $ 2,879 6,798 Lighting 48 7 14 Total capital equipment expenditures $ 2,728 $ 2,886 $ 6,812 Depreciation, amortization and impairment: Theatre Products $ 1,066 $ 1,545 $ 1,249 Services 137 179 208 Total theatre 1,203 1,724 1,457 Lighting 65 33 33 Total depreciation, amortization and impairment $ 1,268 $ 1,757 $ 1,490 Gain on disposal or transfer of long-lived assets: Theatre Products $ 1,245 $ 10 $ 138 Services 87 1 12 Total theatre 1,332 11 150 Lighting — — — $ 1,332 $ 11 $ 150 (in thousands) Identifiable assets Theatre Products $ 92,525 $ 107,016 Services 4,484 3,508 Total theatre 97,009 110,524 Lighting 2,537 2,932 Total $ 99,546 $ 113,456 Ballantyne Strong, Inc. and SubsidiariesNotes to the Consolidated Financial Statements (Continued)Years ended December 31, 2010, 2009 and 2008 2010 2009 2008 $ 138,266 $ (16,911 ) $ 15,285 12,391 — — 150,657 (16,911 ) 15,285 — — 1,951 — — 258,170 $ 150,657 $ (16,911 ) $ 275,406 December 31,
2010 December 31,
2009 $ 86,156,070 $ 55,720,203 3,358,154 1,225,122 89,514,224 56,945,325 2,517,207 3,264,975 $ 92,031,431 $ 60,210,300 2010 2009 2008 $ 76,209,618 $ 38,963,004 $ 36,587,451 4,447,992 4,285,478 1,694,384 34,914,017 11,531,934 5,648,450 1,677,650 1,404,476 2,028,579 5,721,885 8,323,095 3,938,821 10,073,442 4,444,458 1,906,745 2,787,309 2,646,155 1,620,346 502,704 547,157 1,389,785 $ 136,334,617 $ 72,145,757 $ 54,814,561 December 31, 2010 December 31, 2009 $ 59,972,216 $ 43,982,105 11,908,572 4,030,131 5,781,015 4,029,054 14,369,628 8,169,010 $ 92,031,431 $ 60,210,300 (in thousands) Net revenue United States $ 137,105 $ 143,353 $ 76,210 China 15,697 25,968 34,914 South America 7,250 4,485 10,073 Canada 3,883 2,376 4,448 Asia (excluding China) 2,341 3,453 1,678 Mexico 1,458 2,579 5,722 Europe 721 1,325 2,787 Other 629 894 503 Total $ 169,084 $ 184,433 $ 136,335 (in thousands) Identifiable assets United States $ 65,868 $ 80,885 Canada 21,092 17,671 Asia (excluding China) 7,337 6,963 China 5,249 7,937 Total $ 99,546 $ 113,456 Ballantyne Strong, Inc. and SubsidiariesNotes to the Consolidated Financial Statements (Continued)Years ended December 31, 2010, 2009 and 200824.20102012 and 2009.2011. (in thousands, except per share data) Net revenue $ 44,019 $ 46,708 $ 39,260 $ 39,097 $ 31,874 $ 37,595 $ 63,437 $ 51,527 Gross profit 6,339 6,358 3,721 6,176 6,053 6,784 10,050 7,326 Net earnings (loss) 2,447 1,803 (268 ) 1,560 1,517 2,476 4,739 1,615 Basic and diluted earnings (loss) per share: Basic(1) 0.17 0.13 (0.02 ) 0.11 0.11 0.17 0.33 0.11 Diluted(1) 0.17 0.13 (0.02 ) 0.11 0.11 0.17 0.33 0.11 Stock price: High 5.37 6.48 6.02 4.54 8.01 7.28 4.77 4.23 Low 4.06 5.26 4.03 3.09 6.18 4.69 3.08 2.76 First Quarter Second Quarter Third Quarter Fourth Quarter $ 25,337,509 $ 32,748,573 $ 32,929,645 $ 45,318,890 4,295,536 5,970,945 6,468,301 8,003,807 998,850 2,778,109 2,320,721 2,335,773 0.07 0.20 0.16 0.16 0.07 0.19 0.16 0.16 5.89 9.00 9.66 9.74 3.1 5.45 6.91 6.48 $ 17,143,453 $ 19,602,707 $ 16,552,036 $ 18,847,561 3,379,070 4,252,593 3,555,283 3,545,087 541,719 933,921 543,096 51,782 0.04 0.07 0.04 0.00 0.04 0.07 0.04 0.00 2.42 3.27 3.88 3.98 0.88 1.80 2.02 3.08 During the fourth quarter of 2009, the Company settled a lawsuit resulting in a charge of approximately $0.3 million during the quarter.(2)(loss) per share may not equal the total for the year.
and Subsidiaries Allowance for doubtful accounts and notes: Year ended December 31, 2012 $ 142 $ 626 $ (283 ) $ 2 $ 487 Year ended December 31, 2011 306 (14 ) (150 ) — 142 Year ended December 31, 2010 205 128 (27 ) — 306 Inventory reserves: Year ended December 31, 2012 $ 2,542 $ (350 ) $ (942 ) $ — $ 1,250 Year ended December 31, 2011 2,921 (216 ) (163 ) — 2,542 Year ended December 31, 2010 2,665 395 (139 ) — 2,921 Balance at
beginning of
year Charged to
costs and
expenses Amounts
Written
off(1) Balance at
end of
year $ 205,314 135,428 (34,609 ) 306,133 $ 195,141 32,358 (22,185 ) 205,314 $ 534,526 44,602 (383,987 ) 195,141 $ 2,665,436 448,770 (193,041 ) 2,921,165 $ 2,791,644 523,015 (649,223 ) 2,665,436 $ 1,901,038 1,246,867 (356,261 ) 2,791,644 Company'sCompany’s management, including the Company'sCompany’s Chief Executive Officer and Chief Financial Officer, of the effectiveness of the design and operation of the Company'sCompany’s disclosure controls and procedures, as defined in Exchange Act Rules 13a-15 (e) and 15d-15(e) and internal control over financial reporting, as defined in Exchange Act Rules 13a-15(f) and 15d-15(f). Based upon that evaluation, the Company'sCompany’s Chief Executive Officer and Chief Financial Officer concluded that the Company'sCompany’s disclosure controls and procedures are effective.Management'sManagement’s Report on Internal Control over Financial ReportingCompany'sCompany’s management is responsible for establishing and maintaining adequate internal control over financial reporting as such term is defined in Securities Exchange Act Rule 13a-15(f). The Company carried out an evaluation under the supervision and with the participation of the Company'sCompany’s management, including the Company'sCompany’s Chief Executive Officer and Chief Financial Officer, of the effectiveness of the Company'sCompany’s internal control over financial reporting. The Company'sCompany’s management used the framework in Internal Control-Integrated Framework issued by the Committee of Sponsoring Organizations (COSO) to perform this evaluation. Based on that evaluation, the Company'sCompany’s management concluded that the Company'sCompany’s internal control over financial reporting was effective as of December 31, 2010.Company'sCompany’s internal control over financial reporting as of December 31, 20102012 has been audited by KPMG LLP, an independent registered public accounting firm, as stated in their report, a copy of which is included in this Annual Report on Form 10-K.theBallantyne Strong, Inc. and subsidiaries’ (the Company) internal control over financial reporting of Ballantyne Strong, Inc. and subsidiaries (the Company) as of December 31, 2010,2012, based on criteria established inInternal Control—Control – Integrated Framework issued by the Committee of Sponsoring Organizations of the Treadway Commission (COSO). The Company'sCompany’s management is responsible for maintaining effective internal control over financial reporting and for its assessment of the effectiveness of internal control over financial reporting, included in the accompanyingManagement'sManagement’s Report on Internal Control over Financial Reporting. Our responsibility is to express an opinion on the Company'sCompany’s internal control over financial reporting based on our audit.company'scompany’s internal control over financial reporting is a process designed to provide reasonable assurance regarding the reliability of financial reporting and the preparation of financial statements for external purposes in accordance with generally accepted accounting principles. A company'scompany’s internal control over financial reporting includes those policies and procedures that (1) pertain to the maintenance of records that, in reasonable detail, accurately and fairly reflect the transactions and dispositions of the assets of the company; (2) provide reasonable assurance that transactions are recorded as necessary to permit preparation of financial statements in accordance with generally accepted accounting principles, and that receipts and expenditures of the company are being made only in accordance with authorizations of management and directors of the company; and (3) provide reasonable assurance regarding prevention or timely detection of unauthorized acquisition, use, or disposition of the company'scompany’s assets that could have a material effect on the financial statements.2010,2012, based on criteria established inInternal Control—Control – Integrated Framework issued by the Committee of Sponsoring Organizations of the Treadway Commission.20102012 and 2009,2011, and the related consolidated statements of operations, stockholders' equity and comprehensive income, (loss) ,stockholders’ equity, and cash flows for each of the years in the three-year period ended December 31, 2010,2012, and the related financial statement schedule and our report dated March 16, 201111, 2013 expressed an unqualified opinion on those consolidated financial statements and related financial statement schedule./s/ KPMG LLP16, 201111, 201320092012 that have materially affected, or are reasonably likely to materially affect, our internal control over financial reporting.4, 2011.4, 2011.4, 2011.4, 2011.4, 2011.a.The following documents are filed as part of this report on Form 10-K:1.Consolidated Financial Statements:a. The following documents are filed as part of this report on Form 10-K: 1. Consolidated Financial Statements: 2.Financial Statement Schedules:2. Financial Statement Schedules: 2010, 20092012, 2011 and 2008.Registrant'sRegistrant’s subsidiaries are omitted because the Registrant is primarily an operating company and the subsidiaries are wholly owned.3.Exhibit list.b.Filed as Financial Statement Schedules beginning on page 76, are the separate Financial Statements of Digital Link II, a fifty percent or less owned entity of the Registrant.3. Exhibit list. Ballantyne Strong, Inc. BALLANTYNE STRONG, INC.
By:GARYGary L. CAVEY
Cavey
By:KEVIN S. HERRMANN Mary A. Carstens Kevin S. Herrmann, Secretary/Treasurerand
Date:June 23, 2011March 11, 2013
June 23, 2011March 11, 2013By: By:/s/ WILLIAM F. WELSH, II (1)
William F. Welsh, II, Chairman
Date:
March 11, 2013June 23, 2011
By:/s/ ALVIN ABRAMSON (1)Alvin Abramson, DirectorDate:June 23, 2011By:Donde Plowman, DirectorDate:By:/s/ MARC E. LEBARON (1)Marc E. LeBaron, DirectorDate:June 23, 2011By:/s/ MARK D. HASEBROOCK (1)Mark D. Hasebroock, DirectorDate:June 23, 2011By:Samuel L. Freitag, DirectorDate:(1) By:/s/ KEVIN S. HERRMANNKevin S. Herrmann,Attorney-In-FactDate:June 23, 2011YEARS ENDED MARCH 25, 2011 (Unaudited), MARCH 26, 2010 AND MARCH 27, 2009DIGITAL LINK II, LLCTABLE OF CONTENTSPage No.Financial Statements Report of Independent Registered Public Accounting FirmJames C. Shay, Director Date: March 11, 2013 78Balance Sheets, /s/ Donde Plowman (1)Donde Plowman, Director Date: March 25, 2011 (Unaudited) and March 26, 201011, 2013 79Statements of Operations, Years Ended /s/ Marc E. LeBaron (1)Marc E. LeBaron, Director Date: March 25, 2011 (Unaudited), March 26, 2010 and March 27, 200911, 2013 80Statements of Cash Flows, Years Ended /s/ Mark D. Hasebroock (1)Mark D. Hasebroock, Director Date: March 25, 2011 (Unaudited), March 26, 2010 and March 27, 200911, 2013 81Notes to the Financial Statements, Years Ended /s/ Samuel C. Freitag (1)Samuel C. Freitag, Director Date: March 25, 2011 (Unaudited), March 26, 2010 and March 27, 200911, 2013 82(1) By: Date: March 11, 2013 Report of Independent Registered Public Accounting FirmTo the Members ofDigital Link II, LLC We have audited the accompanying balance sheet of Digital Link II, LLC, a California limited liability company, as of March 26, 2010, and the related statements of operations and cash flows for each of the two years in the period ended March 26, 2010. These financial statements are the responsibility of the Company's management. Our responsibility is to express an opinion on these financial statements based on our audits. We conducted our audits in accordance with the standards of the Public Company Accounting Oversight Board (United States). Those standards require that we plan and perform the audit to obtain reasonable assurance about whether the financial statements are free of material misstatement. We were not engaged to perform an audit of the Company's internal control over financial reporting. Our audits included consideration of internal control over financial reporting as a basis for designing audit procedures that are appropriate in the circumstances, but not for the purpose of expressing an opinion on the effectiveness of the Company's internal control over financial reporting. Accordingly, we express no such opinion. An audit also includes examining, on a test basis, evidence supporting the amounts and disclosures in the financial statements, assessing the accounting principles used and significant estimates made by management, and evaluating the overall financial statement presentation. We believe that our audits provide a reasonable basis for our opinion. In our opinion, the financial statements referred to above present fairly, in all material respects, the financial position of Digital Link II, LLC at March 26, 2010, and the results of its operations and its cash flows for each of the two years in the period ended March 26, 2010, in conformity with U.S. generally accepted accounting principles./s/ ERNST & YOUNG LLPLos Angeles, CaliforniaJune 24, 2010Digital Link II, LLCBalance Sheet(in 000's) March 25, 2011 March 26, 2010 (Unaudited) $ 2,365 $ 784 328 438 2,693 1,222
9,142
15,847 $ 11,835 $ 17,069 $ 6 $ 2 2,173 3,673 3 4 522 531 1,295 1,761 141 51 4,140 6,022
880
2,751 2,780 1,581 33 37 19 1,867 7,852 12,258
3,983
4,811
$
11,835
$
17,069 See accompanying notes to the financial statements.Digital Link II, LLCStatements of Operations(in 000's) Year Ended
March 25, 2011 Year Ended
March 26, 2010 Year Ended
March 27, 2009 (Unaudited) $ 9,299 $ 1,019 $ — 4 4 3 9,303 1,023 3
7,576
2,450
1,154 1,727 (1,427 ) (1,151 ) 21 94 107 196 209 260 1,510 (1,730 ) (1,518 )
(300
)
(288
)
(98
) 1,210 (2,018 ) (1,616 )
38
2
1 $ 1,172 $ (2,020 ) $ (1,617 ) See accompanying notes to the financial statementsDigital Link II, LLCStatements of Cash Flows(in 000's) Year ended
March 25, 2011 Year ended
March 26, 2010 Year ended
March 27, 2009 (Unaudited) $ 1,172 $ (2,020 ) $ (1,617 ) 1,123 1,579 1,154 — 33 30 6,424 845 — 110 1,129 (1,308 ) 4 2 (12 ) (9 ) 162 248 (466 ) 113 1,616 90 51 — (5 ) — 9 1,199 165 1,415 (1,871 ) 773 1,778 7,771 2,832 3,313 (842 ) (4,623 ) (5,949 ) (842 ) (4,623 ) (5,949 ) (4,014 ) (1,835 ) (481 ) 666 3,951 3,493 — — 15 (2,000 ) — — (5,348 ) 2,116 3,027 1,581 325 391 784 459 68 $ 2,365 $ 784 $ 459 See accompanying notes to the financial statements.Digital Link II, LLCNotes to the Financial StatementsYears ended March 25, 2011 (Unaudited), March 26, 2010 and March 27, 2009(in 000's)1. Nature of OperationsCompany On March 6, 2007, Digital Link II, LLC (the "Company") was formed between Ballantyne Strong, Inc. and RealD with member interests of 44.4% and 55.6%, respectively. The Company was formed for purposes of commercializing certain 3D technology and to fund the deployment of digital projector systems and servers to third-party exhibitors.Fiscal Period The Company's fiscal year consists of four 13-week periods for a total of 52 weeks to align its year end with that of RealD, the majority interest holder in the Company. As a result, the Company's year-end for the fiscal years ended 2011, 2010, and 2009 were March 25, 2011, March 26, 2010 and March 27, 2009, respectively.2. Summary of Significant Accounting PoliciesUse of Estimates The preparation of financial statements in conformity with U.S. GAAP requires management to make estimates and assumptions that affect the reported amounts of assets and liabilities and disclosure of contingent assets and liabilities at the date of the financial statements and the reported amounts of revenues and expenses during the reporting period. Actual results and changes in facts and circumstances may alter such estimates and affect results of operations and financial position in future periods.Cash and Cash Equivalents All highly liquid financial instruments with maturities of three months or less from date of purchase are classified as cash equivalents in the accompanying balance sheets and statements of cash flows.Trade Accounts Receivable Trade accounts receivable are recorded at the invoiced amount and do not bear interest. The Company continually monitors the trade accounts receivable to determine if an allowance for doubtful accounts is necessary. This allowance is developed based on several factors including overall customer credit quality, historical write-off experience and a specific analysis that projects the ultimate collectibility of the account. As such, these factors may change over time causing the reserve level to adjust accordingly. No allowance for doubtful accounts exists at March 25, 2011 or March 26, 2010.Digital Equipment Digital equipment also includes digital servers, lenses and accessories and are stated at cost. Depreciation is computed using the straight-line method over the estimated useful life of 10 years. Upon installation at the customer location, the Company retains title to the digital equipment which is held and used by customers. The digital equipment is held for sale at either a specified date or upon occurrence of certain contingent events. As of March 25, 2011, digital equipment scheduled to be purchased within the next twelve months had a carrying value of $3.8 million (unaudited). Depreciation is included in cost of revenue.Digital Link II, LLCNotes to the Financial Statements (Continued)Years ended March 25, 2011 (Unaudited), March 26, 2010 and March 27, 2009(in 000's)Revenue Recognition The Company has entered into various system use agreements with third-party exhibitors which provide for the use of digital projection equipment with a purchase option in the future. In accordance with the requirements of Accounting Standards Codification (ASC) subtopic 605-10,Revenue Recognition-General, the Company recognizes revenue when title has transferred to the exhibitor and collectibility is reasonably assured if the option to purchase is made by the exhibitor. Revenues recognized by the Company under the system use agreements consist of installation fees received from these exhibitors. The Company recognizes these revenues over the terms of the use agreements.Repairs and Maintenance Repair and maintenance costs are expensed as incurred.Fair Value of Financial Instruments The Company's financial assets and liabilities are measured and reported in accordance with Accounting Standards Codification Topic (ASC) 820-10,Fair Value Accounting (ASC 820), which provides a common definition of fair value and establishes a framework to make the measurement of fair value in U.S. GAAP more consistent and comparable. This guidance also requires expanded disclosures to provide information about the extent to which fair value is used to measure assets and liabilities, the methods and assumptions used to measure fair value, and the effect of fair value measures on earnings. Fair value is defined as the amount that would be received for selling an asset or paid to transfer a liability in an orderly transaction between market participants and requires that assets and liabilities carried at fair value be classified and disclosed in the following three categories:•Level 1—Quoted prices for identical instruments in active markets.•Level 2—Quoted prices for similar instruments in active markets; quoted prices for identical or similar instruments in markets that are not active; and model-derived valuations in which all significant inputs and significant value drivers are observable in active markets.•Level 3—Valuations derived from valuation techniques in which one or more significant inputs or significant value drivers are unobservable. The Company's financial assets and liabilities, which include financial instruments as defined by ASC 820, include cash and cash equivalents, accounts receivable, accounts payable and long-term debt. The carrying amounts of cash and cash equivalents, accounts receivable and accounts payable are a reasonable approximation of fair value due to the short maturities of these instruments. The carrying amount of long-term debt approximates fair value based on borrowing rates currently available to the Company.Impairment of Long-Lived Assets The Company reviews long-lived assets for impairment whenever events or changes in circumstances indicate that the carrying amount of an asset may not be recoverable. Factors or circumstances that could indicate the occurrence of such events include current period operating or cash flow losses combined with a history of operating or cash flow losses, a projection or forecast that demonstrates continuing operating or cash flow losses, or incurring costs in excess of amounts originally expected to acquire or construct an asset. If the asset is not recoverable, an impairment loss is recognized as the amount by which the carrying amount of the asset exceeds its fair value. TheDigital Link II, LLCNotes to the Financial Statements (Continued)Years ended March 25, 2011 (Unaudited), March 26, 2010 and March 27, 2009(in 000's)Company's most significant long-lived assets subject to these periodic assessments of recoverability are digital equipment, which have a net book value of $9,142 (unaudited) and $15,847 at March 25, 2011 and March 26, 2010, respectively. As of March 25, 2011 and March 26, 2010 the Company concluded that no impairments related to long-lived assets exist.Income Taxes The Company is treated as a limited liability company for federal and state income tax purposes. Under this treatment, state and federal income taxes are the responsibility of the Company's members. The Company is also subject to minimum and capital tax requirements in certain states.Reclassifications Certain prior year amounts in the accompanying consolidated financial statements have been reclassified to conform to the current year presentation.Recent Accounting Pronouncements In January 2010, Accounting Standards Update 2010-6,Fair Value Measurements and Disclosures: Improving Disclosures About Fair Value Measurements (ASU 2010-6) was issued which requires entities to make new disclosures about recurring or nonrecurring fair value measurements including significant transfers into and out of Level 1 and Level 2 fair value measurements and information on purchases, sales, issuances and settlements on a gross basis in the reconciliation of Level 3 fair value measurements. The Company adopted ASU 2010-6 beginning in the first quarter of fiscal 2010, except for level 3 reconciliation disclosures which are effective for the Company beginning in the first quarter of fiscal 2011. The adoption of disclosure requirements for fair value measurements did not affect the disclosures because the Company did not transfer financial assets or liabilities between levels in the fair value hierarchy. In October 2009, ASU No. 2009-13,Revenue Recognition (Topic 605)-Multiple—Deliverable Revenue Arrangements-a consensus of the Emerging Issues Task Force (ASU 2009-13) amends Accounting Standards Codification Subtopic 605-25,Revenue Recognition-Multiple-Element Arrangements (ASC 605-25). The amendments in ASU 2009-13 enable vendors to account for products or services separately rather than as a combined unit upon meeting certain criteria and establish a hierarchy for determining the selling price of a deliverable. In addition, a vendor can determine a best estimate of the selling price, in a manner that is consistent with that used to determine the price to sell the deliverable on a standalone basis, if a vendor does not have vendor specific objective evidence or third-party evidence of selling price. ASC 605-25 is also amended to eliminate the use of the residual method and requires a vendor to allocate revenue using the relative selling price method. The amendments in ASU 2009-13 will be effective prospectively, with an option for retrospective restatement of the financial statements, for revenue arrangements entered into or materially modified in fiscal years beginning on or after June 15, 2010 with early adoption permitted at the beginning of an entity's fiscal year. The Company expects to prospectively adopt the amendments in ASU 2009-13 beginning in the first quarter of fiscal 2012. The company is currently evaluating the impact the adoption of the new guidance will have on its consolidated financial statements.Digital Link II, LLCNotes to the Financial Statements (Continued)Years ended March 25, 2011 (Unaudited), March 26, 2010 and March 27, 2009(in 000's)3. Accounts Receivable Accounts receivable consist of the following: March 25,
2011 March 26,
2010 (Unaudited) $ 180 $ 307 148 131 $ 328 $ 438 Accounts receivable from RealD and Digital Link I, LLC, a wholly-owned subsidiary of RealD, consist of virtual print fees collected from third-party studios by RealD on the Company's behalf.4. Digital Equipment Digital equipment includes the following: March 25,
2011 March 26,
2010 (Unaudited) $ 11,075 $ 19,224 (1,933 ) (3,377 ) $ 9,142 $ 15,847 Depreciation expense amounted to approximately $1,123 (unaudited) and $1,579 for the twelve months ended March 25, 2011 and March 26, 2010, respectively.5. Virtual Print Fees The Company has entered into customer use agreements with third-party film exhibitors which provide for the use of digital equipment with a purchase option in the future. Under the terms of the agreement, the studios have agreed to pay the Company a Virtual Print Fee for every print shown on the projection equipment. If the option to purchase is made by the exhibitor, the overall purchase price to the exhibitor will be reduced by the Virtual Print Fees paid by the studios and collected by the Company. Therefore, the Virtual Print Fees collected are recorded as a non-current liability within the Balance Sheet.6. Customer Deposits The Company has entered into customer use agreements with third-party film exhibitors which provide for the use of digital theatre projection equipment with a purchase option in the future. Certain operating lease agreements entered into by the Company required the third-party exhibitors to make a deposit on the digital projection equipment provided for use. The customer deposits collected are recorded as a non-current liability within the Balance Sheet.Digital Link II, LLCNotes to the Financial Statements (Continued)Years ended March 25, 2011 (Unaudited), March 26, 2010 and March 27, 2009(in 000's)7. Debt The Company has entered into various loan financing agreements with NEC Financial Corporation to fund the purchase of digital projection equipment. Pursuant to the terms of the agreement, the loans are to be repaid over periods ranging from 22 to 36 months and bear interest rates ranging from 7.0% to 7.46% per annum. Equal payments of principal and interest are due on a monthly basis. The loans are guaranteed by Ballantyne Strong, Inc. and RealD in proportion to each member's respective ownership interests. The loans are secured by a security interest on the digital equipment. At March 25, 2011, the loan agreements with NEC Financial Corporation had a balance of $2,192 (unaudited). The final loan agreement payment is due on June 1, 2012. Total remaining payments due and outstanding in aggregate by fiscal year are as follows (unaudited): 2012—$2,173; 2013—$19.8. Members' Equity All contributions are to be made in proportion to the members' respective ownership interests. For financial reporting and income tax purposes, all items of income and loss are allocated to the members in accordance with their respective ownership interests. The following table summarizes the changes in members' equity for the 3-year period: Ballantyne
Strong, Inc. RealD Total $ 3,745 $ 4,689 $ 8,434 5 9 14 (718 ) (899 ) (1,617 ) $ 3,032 $ 3,799 $ 6,831 (897 ) (1,123 ) (2,020 ) $ 2,135 $ 2,676 $ 4,811 (888 ) (1,112 ) (2,000 ) 521 651 1,172 $ 1,768 $ 2,215 $ 3,983 9. Supplemental Cash Flow Information Supplemental disclosures to the statement of cash flows are as follows: March 25, 2011 March 26, 2010 March 27, 2009 (Unaudited) $ 300 $ 255 $ 68 $ 38 $ 2 $ 1 Digital Link II, LLCNotes to the Financial Statements (Continued)Years ended March 25, 2011 (Unaudited), March 26, 2010 and March 27, 2009(in 000's)10. Related Party Certain digital and theatre projection equipment held by the Company and provided to third-party exhibitors was purchased in an arm's length transaction from Ballantyne Strong Inc. ("Ballantyne"), who holds a 44.4% equity interest in the Company. During 2011, 2010 and 2009, the Company purchased $841 (unaudited), $4,623 and $5,949, respectively of projection equipment and related services from Ballantyne. As of March 25, 2011 and March 26, 2010, approximately $471 (unaudited) and $1,587 was outstanding and due to Ballantyne for the purchases made. The amounts due are recorded as due to related parties and classified as a current liability within the Balance Sheet. During 2010 and 2009, the Company collected maintenance fees from exhibitors on behalf of Strong Technical Services, Inc., a subsidiary of Ballantyne Strong, Inc. As of March 25, 2011 and March 26, 2010 approximately $2 (unaudited) and $66 were due and outstanding for services rendered at March 26, 2010. The amounts due are recorded as due to related parties and classified as a current liability within the Balance Sheet. Total current receivables from Digital Link I, LLC, a wholly-owned subsidiary of RealD, was approximately $148 (unaudited) and $131 as of March 25, 2011 and March 26, 2010, respectively. The outstanding receivables consist of virtual print fees collected from third-party studios by RealD on the Company's behalf. The amounts due from Digital Link I, LLC are recorded in total accounts receivable within the Balance Sheet. Total due to RealD was approximately $1,295 (unaudited) and $108 as of March 25, 2011 and March 26, 2010, respectively. The outstanding payable consists of virtual print fees collected from third-party studios by the Company on RealD's behalf coupled with management and administration services provided by RealD. The amount due is recorded in due to related parties and classified as a current liability within the Balance Sheet.11. Commitments During the ordinary course of business, the Company makes certain indemnities and commitments under which it may be required to make payments in relation to certain transactions. These indemnities include indemnities of certain customers and licensees of its marketed product. The duration of these indemnities and commitments vary, and in certain cases, is indefinite. The majority of these indemnities and commitments do not provide for any limitation of the maximum potential future payments the Company could be obligated to make. The Company has not recorded any liability for these indemnities and commitments in the accompanying balance sheet. The Company does, however, accrue for losses for any known contingent liability, including those that may arise from indemnification provisions, when future payment is probable. 3.1 Certificate of Incorporation as amended S-8 3.1 December 7, 2006 3.1.1 First Amendment to the Certificate of Incorporation S-8 3.1.1 December 7, 2006 3.1.2 Second Amendment to the Certificate of Incorporation S-8 3.1.2 December 7, 2006 3.1.3 Third Amendment to the Certificate of Incorporation S-8 3.1.3 December 7, 2006 3.1.4 Fourth Amendment to the Certificate of Incorporation 10-Q 3.1.4 August 7, 2009 3.2 Bylaws of the Company S-8 3.2 December 7, 2006 3.2.1 First Amendment to Bylaws of the Company S-8 3.2.1 December 7, 2006 3.2.2 Second Amendment to Bylaws of the Company S-8 3.2.2 December 7, 2006 3.2.3 Third Amendment to the Bylaws of the Company S-8 3.2.3 December 7, 2006 3.2.4 Fourth Amendment to the Bylaws of the Company 8-K 99.1 May 1, 2007 4.1 Credit Agreement, dated June 30, 2010 between the Company and Wells Fargo, N.A. 8-K 4.1 July 7, 2010 4.2 First Amendment to Credit Agreement, dated June 28, 2011, by and between the Company and Wells Fargo Bank, N.A 8-K 4.2 June 30, 2011 4.3 Second Amendment to Credit Agreement, dated May 8, 2012, by and between the Company and Wells Fargo Bank, N.A. 8-K 4.3 May 11, 2012 4.4 Revolving Line of Credit Note, dated May 8, 2012, by and between the Company and Wells Fargo Bank, N.A. 8-K 4.4 May 11, 2012 10.1* Ballantyne of Omaha, Inc. Restricted Stock Plan Schedule 14A Appendix D April 26, 2005 10.2* Ballantyne of Omaha, Inc. 2005 Outside Directors’ Stock Option Plan Schedule 14A Appendix C April 26, 2005 10.3* Ballantyne of Omaha, Inc. Non-Employee Directors Restricted Stock Plan Schedule 14A Appendix A April 21, 2008 10.4* Ballantyne of Omaha, Inc. 2005 Employee Stock Purchase Plan Schedule 14A Appendix B April 26, 2005 10.5* Amendment No. 4 to Executive Employment Agreement dated September 23, 2009 between the Company and Mr. John Wilmers 10-Q 10.5 May 14, 2010 10.5.1* Employment Agreement dated September 23, 2009 between the Company and Mr. John Wilmers 10-Q 10.5.1 May 14, 2010 10.6* 2009 Short-Term Incentive Plan 10-Q 10.1 May 11, 2009 10.8 Operating Agreement of Digital Link II, LLC, dated March 6, 2007, between the Company and RealD 10-K 10.8 April 2, 2007 10.10 Authorized Digital Cinema Reseller Master Agreement dated January 21, 2010 between the Company and NEC Display Solutions of America, Inc. 10-K 10.10 March 23, 2010 10.11 Definitive Agreement dated October 1, 2006 between the Company and NEC Viewtechnology Ltd. 10-Q 10.1 November 14, 2006 10.16* Ballantyne of Omaha, Inc. Non-Employee Directors’ Restricted Stock Plan dated March 31, 2008 Schedule 14A Appendix A April 21, 2008 10.18* Amendment No. 1 to the Ballantyne Strong, Inc. Non-Employee Directors Restricted Stock Plan dated May 21, 2009 10-K 10.18 March 23, 2010 10.21* Ballantyne Strong, Inc. 2010 Long Term Incentive Plan Schedule 14A Exhibit A April 20, 2010 Incorporated by Reference Exhibit
Number
Document Description
Form
Exhibit Filing
Date Filed
Herewith 3.1 Certificate of Incorporation as amended S-8 3.1 December 7, 2006
3.1.1
First Amendment to the Certificate of Incorporation
S-8
3.1.1
December 7,
2006
3.1.2
Second Amendment to the Certificate of Incorporation
S-8
3.1.2
December 7,
2006
3.1.3
Third Amendment to the Certificate of Incorporation
S-8
3.1.3
December 7,
2006
3.1.4
Fourth Amendment to the Certificate of Incorporation
10-Q
3.1.4
August 7,
2009
3.2
Bylaws of the Company
S-8
3.2
December 7,
2006
3.2.1
First Amendment to Bylaws of the Company
S-8
3.2.1
December 7,
2006
3.2.2
Second Amendment to Bylaws of the Company
S-8
3.2.2
December 7,
2006
3.2.3
Third Amendment to the Bylaws of the Company
S-8
3.2.3
December 7,
2006
3.2.4
Fourth Amendment to the Bylaws of the Company
8-K
99.1
May 1,
2007
3.3
Stockholder Rights Agreement dated May 25, 2000 between the Company and Mellon Investor Services, L.L.C. (formerly Chase Mellon Shareholder Services, L.L.C.)
8-A12B
1
May 26,
2000
3.3.1
First Amendment dated April 30, 2001 to Rights Agreement dated as of May 25, 2000 between the Company and Mellon Investor Services, L.L.C. as Rights Agent
8-K
99.1
May 7,
2001
3.3.2
Second Amendment dated July 25, 2001 to Rights Agreement dated as of May 25, 2000 between the Company and Mellon Investor Services, L.L.C., as Rights Agent
10-Q
3.3.2
November 14,
2001
3.3.3
Third Amendment dated October 2, 2001 to Rights Agreement dated as of May 25, 2001 between the Company and Mellon Investor Services, L.L.C. as Rights Agent
10-Q
3.3.3
November 14,
2001
4.2
Revolving Credit Agreement dated March 10, 2003 between the Company and First National Bank of Omaha, Inc.
10-K
4.2
March 31,
2003
4.2.1
First Amendment to Revolving Credit Agreement dated August 31, 2003 between the Company and First National Bank of Omaha, Inc.
10-Q
4.2.1
November 14,
2003
4.2.2
Second Amendment to Revolving Credit Agreement dated February 27, 2004 between the Company and First National Bank of Omaha, Inc.
10-K
4.2.2
March 30,
2004
4.2.3
Third Amendment to Revolving Credit Agreement dated August 30, 2004 between the Company and First National Bank of Omaha, Inc.
10-Q
4.2.2
November 12,
2004
Incorporated by Reference Exhibit
Number
Document Description
Form
Exhibit Filing
Date Filed
Herewith 4.2.4 Fourth Amendment to Revolving Credit Agreement dated August 24, 2005 between the Company and First National Bank of Omaha, Inc.
10-Q
4.2.4
November 4,
2005
4.2.5
Fifth Amendment to the Revolving Credit Agreement dated August 28, 2006 between the Company and First National Bank of Omaha, Inc.
10-Q
4.2.5
November 14,
2006
4.2.6
Consent and Waiver Agreement dated September 29, 2006 between the Company and First National Bank of Omaha, Inc.
10-Q
4.2.6
November 14,
2006
4.2.7
Sixth Amendment to the Revolving Credit Agreement dated August 29, 2007 between the Company and First National Bank of Omaha, Inc.
10-Q
4.2.5
November 13,
2007
4.2.8
Seventh Amendment to the Revolving Credit Agreement dated March 31, 2008 between the Company and First National Bank of Omaha, Inc.
8-K
4.1
April 4,
2008
4.2.9
Eighth Amendment to the Revolving Credit Agreement dated August 29, 2008 between the Company and First National Bank of Omaha, Inc.
10-Q
4.2.9
November 10,
2008
4.2.10
Ninth Amendment to the Revolving Credit Agreement dated September 26, 2008 between the Company and First National Bank of Omaha, Inc.
8-K
4.1
October 2,
2008
4.2.11
Tenth Amendment to the Revolving Credit Agreement dated August 30, 2009 between the Company and First National Bank of Omaha, Inc.
10-Q
4.2.12
November 9,
2009
4.2.12
Eleventh Amendment to the Revolving Credit Agreement dated November 30, 2009 between the Company and First National Bank of Omaha, Inc
10-Q
4.2.13
May 14,
2010
4.2.13
Twelfth Amendment to the Revolving Credit Agreement dated March 30, 2010 between the Company and First National Bank of Omaha, Inc
10-Q
4.2.14
May 14,
2010
4.2.14
Thirteenth Amendment to the Revolving Credit Agreement dated May 31, 2010 with First National Bank of Omaha, Inc
10-Q
4.1
August 12,
2010
4.3
Revolving Credit Agreement and Note between the Company and Wells Fargo, N.A., effective June 30, 2010
8-K
4.1 and
4.2
July 7,
2010
10.1*
Ballantyne of Omaha, Inc. Restricted Stock Plan
Schedule
14A
Appendix
D
April 26,
2005
10.2*
Ballantyne of Omaha, Inc. 2005 Outside Directors' Stock Option Plan
Schedule
14A
Appendix
C
April 26,
2005
10.3*
Ballantyne of Omaha, Inc. Non-Employee Directors Restricted Stock Plan
Schedule
14A
Appendix
A
April 21,
2008
10.4*
Ballantyne of Omaha, Inc. 2005 Employee Stock Purchase Plan
Schedule
14A
Appendix
B
April 26,
2005
10.5*
Amendment No. 4 to Executive Employment Agreement dated September 23, 2009 between the Company and Mr. John Wilmers
10-Q
10.5
May 14,
2010
Incorporated by Reference Exhibit
Number
Document Description
Form
Exhibit Filing
Date Filed
Herewith 10.5.1* Employment Agreement dated September 23, 2009 between the Company and Mr. John Wilmers
10-Q
10.5.1
May 14,
2010
10.6*
2009 Short-Term Incentive Plan
10-Q
10.1
May 11,
2009
10.6.2
Share Repurchase Program
8-K
99.1
November 13,
2008
10.8
Operating Agreement of Digital Link II, LLC, dated March 6, 2007, between the Company and RealD
10-K
10.8
April 2,
2007
10.9
Asset Purchase Agreement between the Company and National Cinema Service Corp. dated June 30, 2006
10-Q
4.1
August 14,
2006
10.10
Authorized Digital Cinema Reseller Master Agreement dated January 21, 2010 between the Company and NEC Display Solutions of America, Inc.
10-K
10.10
March 23,
2010
10.11
Definitive Agreement dated October 1, 2006 between the Company and NEC Viewtechnology Ltd.
10-Q
10.1
November 14,
2006
10.12
Equipment Purchase Agreement dated July 21, 2006 between the Company and Digital Link, LLC
10-Q
10.2
November 14,
2006
10.13
Amendment No. 1 to Equipment Purchase Agreement dated October 27, 2006 between the Company and Digital Link, LLC
10-Q
10.2.1
November 14,
2006
10.14
Asset Purchase Agreement between the Company and Brian Hendricks dated December 1, 2007
8-K/A
99.3
December 20,
2007
10.15
Purchase Agreement between the Company and Les Éclairages Noram Inc. dated October 10, 2007
8-K/A
2.1
December 28,
2007
10.16*
Ballantyne of Omaha, Inc. Non-Employee Directors' Restricted Stock Plan dated March 31, 2008
Schedule
14A
Appendix
A
April 21,
2008
10.17
Guaranty Agreement between Digital Link II, LLC and NEC Financial Services, LLC
10-K
10.17
March 16,
2009
10.18*
Consulting Agreement entered into between the Company and Christopher E. Beach dated April 1, 2009
10-Q
10.18
August 7,
2009
10.18
Amendment No. 1 to the Ballantyne Strong, Inc. Non-Employee Directors Restricted Stock Plan dated May 21, 2009
10-K
10.18
March 23,
2010
10.19
Agreement entered into by Company for sale of remaining outstanding auction-rate securities dated June 2, 2009
10-Q
10.19
August 7,
2009
10.20*
Termination agreement entered into between the Company and Christopher E. Beach dated September 4, 2009
10-Q
10.20
November 9,
2009
10.21*
Ballantyne Strong, Inc. 2010 Long Term Incentive Plan
Schedule
14A
Exhibit
A
April 20,
2010
10.22* Amendment No. 1 to the Ballantyne Strong, Inc. 2005 Employee Stock Purchase Plan Schedule 14A Exhibit B April 20, 2010 10.23* Amendment No. 1 to the Ballantyne Strong, Inc. 2005 Restricted Stock Plan Schedule 14A Exhibit C April 20, 2010 10.24 Asset Purchase Agreement between the Company and Gestion Noram Inc. dated June 29, 2010 10-Q 10.4 August 12, 2010 10.25* Executive Employment Agreement between the Company and Gary L. Cavey dated November 1, 2010 10-Q 10.1 November 15, 2010 10.26* Executive Employment Agreement between the Company and Mary A. Carstens dated July 26, 2011 10-Q 10.26 November 9, 2011 10.27* Executive Employment Agreement between the Company and Ray F. Boegner dated February 14, 2012 10-Q 10.27 May 4, 2012 21 Subsidiaries of the Registrant are as follows: Incorporated by Reference Exhibit
Number
Document Description
Form
Exhibit Filing
Date Filed
Herewith 10.22* Amendment No. 1 to the Ballantyne Strong, Inc. 2005 Employee Stock Purchase Plan
Schedule
14A
Exhibit
B
April 20,
2010
10.23*
Amendment No. 1 to the Ballantyne Strong, Inc. 2005 Restricted Stock Plan
Schedule
14A
Exhibit
C
April 20,
2010
10.24
Asset Purchase Agreement between the Company and Gestion Noram Inc. dated June 29, 2010
10-Q
10.4
August 12,
2010
10.25*
Executive Employment Agreement between the Company and Gary L. Cavey dated November 1, 2010
10-Q
10.1
November 15,
2010
21
Registrant owns 100% of the outstanding capital stock of the following subsidiaries:
Namea. Strong Westrex, Inc. Nebraska b. Strong Technical Services, nb]Inc.Nebraska c. Strong/MDI Screen Systems, Inc. Canada d. Strong Westrex (Beijing) Trading Inc. American West Beijing Trading Company, Ltd.
China23 Consent of KPMG LLP X
2423.1Consent of Ernst & Young LLPX24
The Power of Attorney authorizing Gary L. Cavey and/or Kevin S. HerrmannMary A. Carstens to sign the Annual Report on Form 10-K, and any amendments thereto, for fiscal 20102012 on behalf of non-management directors
X
31.131.1
Rule 13a-14(a) Certification of Chief Executive Officer
X
31.231.2
Rule 13a-14(a) Certification of Chief Financial Officer
X
32.132.1
18 U.S.C. Section 1350 Certification of Chief Executive Officer
X
32.232.2
18 U.S.C. Section 1350 Certification of Chief Financial Officer
X101 The following materials from Ballantyne Strong’s, Inc.’s Annual Report on Form 10-K for the year ended December 31, 2012, formatted in XBRL (Extensible Business Reporting Language): (i) the Consolidated Balance Sheets, (ii) the Consolidated Statements of Operations, (iii) the Consolidated Statements of Stockholders’ Equity and Comprehensive Income (loss), (iv) the Consolidated Statements of Cash Flows and (v) the Notes to Consolidated Financial Statements. X *Management contract or compensatory plan.* Management contract or compensatory plan.