[X]ANNUAL REPORT PURSUANT TO SECTION 13 OR 15(d) OF THE SECURITIES EXCHANGE ACT OF 1934
| ☒ | ANNUAL REPORT PURSUANT TO SECTION 13 OR 15(d) OF THE SECURITIES EXCHANGE ACT OF 1934 |
[ ]
| ☐ | TRANSITION REPORT PURSUANT TO SECTION 13 OR 15(d) OF THE SECURITIES EXCHANGE ACT OF 1934 |
| For the transition period from ________________ to ________________ |
For the transition period from ________________to ________________
Commission file number:001-33706
Nevada | 98-0399476 | |
| (State or other jurisdiction of incorporation of organization) | (I.R.S. Employer Identification No.) |
500 North Shoreline, Ste. 800, Corpus Christi, Texas, U.S.A. | 78401 | |
| (U.S. corporate headquarters) | (Zip Code) |
1111 West Hastings Street, Suite 320, Vancouver, British Columbia, Canada V6E 2J31830 – 1188 West Georgia Street
Vancouver, British Columbia, CanadaV6E 4A2(Canadian corporate headquarters) (Zip Code) (Address of principal executive offices)(604) 682-9775(Registrant's telephone number, including area code)(361) 888-8235(Registrant’s telephone number, includingarea code)Securities registered pursuant to Section 12(b) of the Act:Title of each class: Trading Symbol(s) Name of each exchange on which registered: Common Stock Par Value $0.001 per shareUECNYSE MKT Equities ExchangeAmerican
Yes [ ]☒ No [X]
☐
Yes [ ]☐ No [X]
☒
Yes [X]☒ No [ ]
Indicate by check mark if disclosure of delinquent filers pursuant to Item 405 of Regulation S-K (§229.405 of this chapter) is not contained herein, and will not be contained, to the best of the registrant's knowledge, in definitive proxy or information statements incorporated by reference in Part III of this Form 10-K or any amendment to this Form 10-K. [ ]
☐
| ☐ Non-accelerated filer | ☐ Smaller reporting company | ||
| ☐ Emerging growth company | |||
Yes [ ]☐ No [X]
☒
$1,479,408,555.
__________
Explanatory Note:
September 28, 2023.
For the conveniencestaff (the “Staff”) of the reader, this Form 10-K/A sets forthSEC in connection with the Company’s annual report in its entirety, not just those portions that have been amended since the filing of the Original Report. Other than the amendments noted above, none of the disclosure contained in any other ItemStaff’s review of the Original Report, has been amended, updated or otherwise revised. Furthermore, noneincluding the Staff’s review of the Items, including the amendments as noted above, have been amended, updated or otherwise revised to reflect material subsequent events occurring after the filing date ofproperty disclosure requirements for registrants engaged in mining operations and reflected in the Original Report on October 15, 2012.
Pursuant to the requirements of the SEC, Report.
ii
FORWARD-LOOKING STATEMENTS
This annual report contains forward-looking statements
Country | State/Province | Project | Location (Latitude) | Location (Longitude) | Equity Interest | Operator | Stage | Mining Method | Mineralization Style |
| Allemand-Ross | 43.3101 | -105.7787 | 100% | UEC | Exploration Stage | ISR | Roll-Front | ||
| Antelope | 42.2263 | -107.9095 | 100% | UEC | Exploration Stage | ISR | Roll-Front | ||
| Barge | 43.2729 | -105.5905 | 100% | UEC | Exploration Stage | ISR | Roll-Front | ||
| Black Hills | 44.7764 | -104.8831 | 100% | UEC | Exploration Stage | ISR | Roll-Front | ||
| Brown Ranch | 43.7377 | -105.9684 | 100% | UEC | Exploration Stage | ISR | Roll-Front | ||
| Bull Springs | 42.1584 | -107.6305 | 100% | UEC | Exploration Stage | ISR | Roll-Front | ||
| Central Shirley Basin | 42.3378 | -106.4100 | 100% | UEC | Exploration Stage | ISR | Roll-Front | ||
| Charlie | 43.8274 | -106.0594 | 100% | UEC | Exploration Stage | ISR | Roll-Front | ||
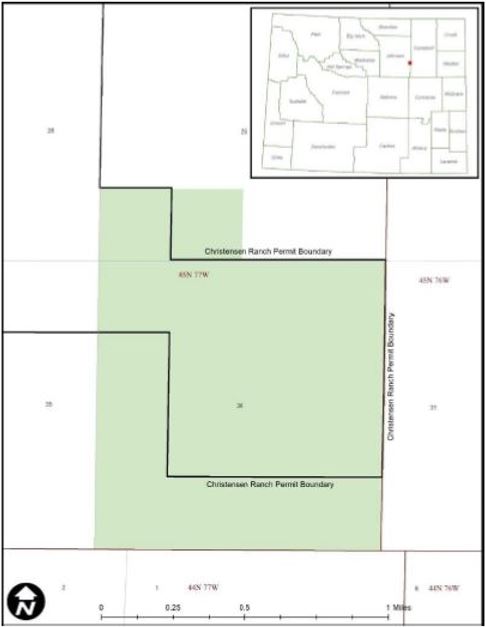
| Christensen Ranch | 43.7982 | -106.0235 | 100% | UEC | Exploration Stage | ISR | Roll-Front | ||
| Clarkson Hills | 42.6593 | -106.7006 | 100% | UEC | Exploration Stage | ISR | Roll-Front | ||
| Crooks Creek | 42.2867 | -107.7660 | 100% | UEC | Exploration Stage | ISR | Roll-Front | ||
| Crook's Mountain | 42.3840 | -107.9060 | 100% | UEC | Exploration Stage | ISR | Roll-Front | ||
| Crossroads | 43.0040 | -105.6364 | 100% | UEC | Exploration Stage | ISR | Roll-Front | ||
| Cyclone Rim | 42.2943 | -108.3332 | 100% | UEC | Exploration Stage | ISR | Roll-Front | ||
| East Shirley Basin | 42.3192 | -106.1616 | 100% | UEC | Exploration Stage | ISR | Roll-Front | ||
| Gas Hills | 42.7094 | -107.6521 | 100% | UEC | Exploration Stage | ISR | Roll-Front | ||
| United States | Wyoming | Horse Creek | 42.5957 | -106.9867 | 100% | UEC | Exploration Stage | ISR | Roll-Front |
| Irigaray | 43.8683 | -106.1186 | 100% | UEC | Exploration Stage | ISR | Roll-Front | ||
| Jab/West Jab | 42.2209/42.2611 | -108.0439/ -108.1225 | 100% | UEC | Exploration Stage | ISR | Roll-Front | ||
| Ludeman | 42.9119 | -105.6277 | 100% | UEC | Exploration Stage | ISR | Roll-Front | ||
| Moore Ranch | 43.5652 | -105.8480 | 100% | UEC | Exploration Stage | ISR | Roll-Front | ||
| Mule Creek | 42.2118 | -105.8143 | 100% | UEC | Exploration Stage | ISR | Roll-Front | ||
| Niles Ranch | 43.8024 | -105.7961 | 100% | UEC | Exploration Stage | ISR | Roll-Front | ||
| Nine Mile Lake | 42.9807 | -106.3278 | 100% | UEC | Exploration Stage | ISR | Roll-Front | ||
| Pine Ridge | 43.4591 | -106.0725 | 100% | UEC | Exploration Stage | ISR | Roll-Front | ||
| Pine Tree U1 | 43.6173 | -105.7860 | 100% | UEC | Exploration Stage | ISR | Roll-Front | ||
| Pumpkin Creek | 43.8163 | -105.8955 | 100% | UEC | Exploration Stage | ISR | Roll-Front | ||
| Red Rim | 41.6502 | -107.5755 | 100% | UEC | Exploration Stage | ISR | Roll-Front | ||
| Reno Creek | 43.6796 | -105.7226 | 100% | UEC | Exploration Stage | ISR | Roll-Front | ||
| Ross Flats | 43.5224 | -105.8861 | 100% | UEC | Exploration Stage | ISR | Roll-Front | ||
| Sand Creek | 42.7007 | -105.2645 | 100% | UEC | Exploration Stage | ISR | Roll-Front | ||
| South Pine Ridge | 43.1204 | -105.9251 | 100% | UEC | Exploration Stage | ISR | Roll-Front | ||
| South Reno Creek | 43.6440 | -105.6199 | 100% | UEC | Exploration Stage | ISR | Roll-Front |
Country | State/Province | Project | Location (Latitude) | Location (Longitude) | Equity Interest | Operator | Stage | Mining Method | Mineralization Style |
Uranium Projects | |||||||||
| South Sweetwater | 41.9694 | -107.9820 | 100% | UEC | Exploration Stage | ISR | Roll-Front | ||
| Stewart Creek | 43.3124 | -105.7342 | 100% | UEC | Exploration Stage | ISR | Roll-Front | ||
| Taylor Ranch | 43.5578 | -106.0098 | 100% | UEC | Exploration Stage | ISR | Roll-Front | ||
| Twin Buttes | 42.2316 | -107.7205 | 100% | UEC | Exploration Stage | ISR | Roll-Front | ||
| West Beaver Rim | 42.5967 | -108.1568 | 100% | UEC | Exploration Stage | ISR | Roll-Front | ||
| West Crook's Creek | 42.2984 | -107.8603 | 100% | UEC | Exploration Stage | ISR | Roll-Front | ||
| West Sweetwater | 42.1318 | -108.0931 | 100% | UEC | Exploration Stage | ISR | Roll-Front | ||
| Burke Hollow | 27.6756 | -97.5176 | 100% | UEC | Exploration Stage | ISR | Roll-Front | ||
| Goliad | 28.8686 | -97.3433 | 100% | UEC | Exploration Stage | ISR | Roll-Front | ||
| Texas | La Palangana | 28.2638 | -98.3959 | 100% | UEC | Exploration Stage | ISR | Roll-Front | |
| Salvo | 28.2632 | -97.7889 | 100% | UEC | Exploration Stage | ISR | Roll-Front | ||
| Longhorn | 28.1700 | -98.1200 | 100% | UEC | Exploration Stage | ISR | Roll-Front | ||
| Anderson | 34.1829 | -113.1632 | 100% | UEC | Exploration Stage | Conventional | Tabular | ||
| Arizona | Los Cuatros | 33.548 | -112.322 | 100% | UEC | Exploration Stage | Conventional | Tabular | |
| Workman Creek | 33.50 | -110.57 | 100% | UEC | Exploration Stage | Conventional | Tabular | ||
| New Mexico | C de Baca | 34.18 | -107.15 | 100% | UEC | Exploration Stage | Conventional | Tabular | |
| Dalton Pass | 35.40 | -108.14 | 100% | UEC | Exploration Stage | Conventional | Tabular | ||
| Alexandra | 58.023 | -109.789 | 21.05% | Orano Canada Inc. | Exploration Stage | Conventional | Unconformity Related | ||
| Axis Lake | 59.304 | -106.136 | 100.00% | UEC | Exploration Stage | Conventional | Unconformity Related | ||
| Beatty River | 57.897 | -109.542 | 32.76% | Orano Canada Inc. | Exploration Stage | Conventional | Unconformity Related | ||
| Black Lake | 59.1167 | -105.905 | 51.43% | UEC | Exploration Stage | Conventional | Unconformity Related | ||
| Brander Lake | 58.2895 | -109.888 | 49.10% | Orano Canada Inc. | Exploration Stage | Conventional | Unconformity Related | ||
| Candle Lake | 57.9969 | -104.93 | 12.50% | Denison Mines Corp. | Exploration Stage | Conventional | Unconformity Related | ||
| Christie Lake | 57.8128 | -104.86 | 82.77% | UEC | Exploration Stage | Conventional | Unconformity Related | ||
| Close Lake | 57.9729 | -105.082 | 5.16% | Orano Canada Inc. | Exploration Stage | Conventional | Unconformity Related | ||
| Canada | Saskatchewan | Cree Extension | 57.5881 | -105.551 | 15.05% | Cameco Corporation | Exploration Stage | Conventional | Unconformity Related |
Diabase Peninsula | 57.4294 | -106.913 | 100.00% | UEC | Exploration Stage | Conventional | Unconformity Related | ||
| Erica | 58.1465 | -109.731 | 49.10% | Orano Canada Inc. | Exploration Stage | Conventional | Unconformity Related | ||
| Hidden Bay | 58.157 | -103.88 | 100.00% | UEC | Exploration Stage | Conventional | Unconformity Related | ||
| Horseshoe-Raven | 58.1331 | -103.76 | 100.00% | UEC | Exploration Stage | Conventional | Unconformity Related | ||
| Key West | 57.2731 | -106.217 | 100.00% | UEC | Exploration Stage | Conventional | Unconformity Related | ||
| Laurie | 57.6579 | -108.721 | 32.99% | Orano Canada Inc. | Exploration Stage | Conventional | Unconformity Related | ||
| Millennium | 57.5138 | -105.639 | 15.05% | Cameco Corporation | Exploration Stage | Conventional | Unconformity Related | ||
| Mirror River | 57.6078 | -108.423 | 32.34% | Orano Canada Inc. | Exploration Stage | Conventional | Unconformity Related | ||
| Moon Lake | 57.4669 | -105.634 | 10.07% | Orano Canada Inc. | Exploration Stage | Conventional | Unconformity Related | ||
| Moore Tomblin | 57.4512 | -105.135 | 6.80% | Orano Canada Inc. | Exploration Stage | Conventional | Unconformity Related | ||
| Nikita | 58.0107 | -109.574 | 12.72% | Orano Canada Inc. | Exploration Stage | Conventional | Unconformity Related | ||
Country | State/Province | Project | Location (Latitude) | Location (Longitude) | Equity Interest | Operator | Stage | Mining Method | Mineralization Style |
Uranium Projects | |||||||||
| Riou Lake | 59.0491 | -106.156 | 100.00% | UEC | Exploration Stage | Conventional | Unconformity Related | ||
| Roughrider | 58.3374 | -104.021 | 100.00% | UEC | Exploration Stage | Conventional | Unconformity Related | ||
| Shea Creek | 58.1804 | -109.49 | 49.10% | Orano Canada Inc. | Exploration Stage | Conventional | Unconformity Related | ||
| Uchrich | 57.7196 | -108.483 | 30.48% | Orano Canada Inc. | Exploration Stage | Conventional | Unconformity Related | ||
Waterfound River | 58.4588 | -104.548 | 12.90% | Orano Canada Inc. | Exploration Stage | Conventional | Unconformity Related | ||
| West Bear | 57.8744 | -103.975 | 100.00% | UEC | Exploration Stage | Conventional | Unconformity Related | ||
| Wheeler River | 57.5000 | -105.421 | 5.00% | Denison Mines Corp. | Development | Conventional | Unconformity Related | ||
| Wolly | 58.3927 | -103.799 | 6.38% | Orano Canada Inc. | Exploration Stage | Conventional | Unconformity Related | ||
| Nunavut | Kiggavik | 64.3752 | -97.7685 | 16.91% | Orano Canada Inc. | Exploration Stage | Conventional | Unconformity Related | |
| Paraguay | Yuty | 25.2702 | 56.3125 | 100.00% | UEC | Exploration Stage | ISR | Roll-Front | |
| Oviedo | 25.2702 | 56.2828 | 100.00% | UEC | Exploration Stage | ISR | Roll-Front | ||
Titanium Projects | |||||||||
| Paraguay | Alto Parana | 24.8147 | 54.9083 | 100.00% | UEC | Exploration Stage | Conventional | Surficial | |
Acres | Hectares | State Leases | Fee Mineral Leases | Federal Lode Mining Claims | Provincial Mineral Dispositions | Provincial Mining Leases | |||||||||||||
Country | State/Province | Project | Total | Total | Number | Acres | Expiration Date | Number | Acres | Expiration Date | Number | Acres | Expiration Date | Number | Hectares | Expiration Date | Number | Hectares | Expiration Date |
Uranium Projects | |||||||||||||||||||
| Allemand-Ross | 13,331.72 | 5,395.16 | 3 | 958 | Annual | 7 | 3,333.72 | July 2025 - Feb 2029 (variable | 452 | 9,040 | Annual | ||||||||
| Antelope | 13,220 | 5,349.94 | 1 | 640 | Annual | 629 | 12,580 | Annual | |||||||||||
| Barge | 7,480 | 3,027.05 | 1 | 640 | Annual | 342 | 6,840 | Annual | |||||||||||
| Black Hills | 1,280 | 518.00 | 1 | 640 | Annual | 32 | 640 | Annual | |||||||||||
| Brown Ranch | 3,640 | 1,473.06 | 1 | 640 | Annual | 150 | 3,000 | Annual | |||||||||||
| Bull Springs | 5,702.8 | 2,307.84 | 2 | 1,922.8 | Annual | 189 | 3,780 | Annual | |||||||||||
| Central Shirley Basin | 2,380 | 963.15 | 2 | 760 | Annual | 81 | 1,620 | Annual | |||||||||||
| Charlie | 820 | 331.84 | 1 | 720 | Annual | 5 | 100 | Annual | |||||||||||
| United States | Wyoming | Christensen Ranch | 11,140 | 4,508.20 | 1 | 1,280 | Annual | 1 | 720 | Annual | 358 | 9,140 | Annual | ||||||
| Clarkson Hills | 400 | 161.87 | 20 | 400 | Annual | ||||||||||||||
| Crooks Creek | 6,979.25 | 2,824.40 | 6 | 2,599.25 | Annual | 219 | 4,380 | Annual | |||||||||||
| Crook's Mountain | 2,480 | 1,003.62 | 2 | 1,280 | Annual | 60 | 1,200 | Annual | |||||||||||
| Crossroads | 5,680 | 2,298.61 | 2 | 1,280 | Annual | 220 | 4,400 | Annual | |||||||||||
| Cyclone Rim | 4,280 | 1,732.06 | 0 | 0 | 214 | 4,280 | Annual | ||||||||||||
| East Shirley Basin | 4,599.90 | 1,861.51 | 4 | 2,099.9 | Annual | 125 | 2,500 | Annual | |||||||||||
| Gas Hills | 6,114.76 | 2,474.56 | 5 | 3,394.76 | Annual | 136 | 2,720 | Annual | |||||||||||
| Acres | Hectares | State Leases | Fee Mineral Leases | Federal Lode Mining Claims | Provincial Mineral Dispositions | Provincial Mining Leases | |||||||||||||
Country | State/Province | Project | Total | Total | Number | Acres | Expiration Date | Number | Acres | Expiration Date | Number | Acres | Expiration Date | Number | Hectares | Expiration Date | Number | Hectares | Expiration Date |
| Horse Creek | 540 | 218.53 | 27 | 540 | Annual | ||||||||||||||
| Irigaray | 2,320 | 938.87 | 2 | 480 | Annual | 92 | 1,840 | Annual | |||||||||||
| Jab/West Jab | 5,300 | 2,144.83 | 3 | 960 | Annual | 217 | 4,340 | Annual | |||||||||||
| Ludeman | 18,101.89 | 7,325.57 | 4 | 1,440 | Annual | 2 | 1,741.89 | Sept. 2026 and Jan. 2029 | 746 | 14,920 | Annual | ||||||||
| Moore Ranch | 4,180 | 1,691.59 | 3 | 1,280 | Annual | 4 | 1,180 | Aug. 2025 through Mar. 2027 (variable) | 86 | 1,720 | Annual | ||||||||
| Mule Creek | 260 | 105.22 | 13 | 260 | Annual | ||||||||||||||
| Niles Ranch | 3,560 | 1,440.68 | 6 | 2,560 | Annual | 50 | 1,000 | Annual | |||||||||||
| Nine Mile Lake | 2,620 | 1,060.28 | 3 | 1,280 | Annual | 67 | 1,340 | Annual | |||||||||||
| Pine Ridge | 3,780 | 1,529.71 | 2 | 720 | Annual | 153 | 3,060 | Annual | |||||||||||
| Pine Tree U1 | 1,540 | 623.22 | 1 | 80 | Annual | 73 | 1,460 | Annual | |||||||||||
| Pumpkin Creek | 1,000 | 404.69 | 50 | 1,000 | Annual | ||||||||||||||
| Red Rim | 680 | 275.19 | 34 | 680 | Annual | ||||||||||||||
| Reno Creek | 18,763 | 7,593.12 | 4 | 3,200 | Annual | 36 | 4,583 | Variable | 549 | 10,980 | Annual | ||||||||
| Ross Flats | 5,480 | 2,217.68 | 3 | 1,040 | Annual | 3 | 1,680 | Mar. 2027 | 138 | 2,760 | Annual | ||||||||
| Sand Creek | 3,000 | 1,214.06 | 3 | 1,920 | Annual | 54 | 1,080 | Annual | |||||||||||
| South Pine Ridge | 4,020 | 1,626.84 | 5 | 2,360 | Annual | 83 | 1,660 | Annual | |||||||||||
| South Reno Creek | 2,580 | 1,044.09 | 1 | 80 | Annual | 125 | 2,500 | Annual | |||||||||||
| South Sweetwater | 1,120 | 453.25 | 1 | 640 | Annual | 24 | 480 | Annual | |||||||||||
| Stewart Creek | 2,460 | 995.53 | 1 | 640 | Annual | 91 | 1,820 | Annual | |||||||||||
| Taylor Ranch | 3,940 | 1,594.46 | 7 | 2,880 | Annual | 53 | 1,060 | Annual | |||||||||||
| Twin Buttes | 7,740 | 3,132.27 | 3 | 1,600 | Annual | 307 | 6,140 | Annual | |||||||||||
| West Beaver Rim | 1,900 | 768.90 | 1 | 640 | Annual | 63 | 1,260 | Annual | |||||||||||
| West Crook's Creek | 1,520 | 615.12 | 1 | 640 | Annual | 44 | 880 | Annual | |||||||||||
| West Sweetwater | 1,080 | 437.06 | 54 | 1,080 | Annual | ||||||||||||||
| Burke Hollow | 17,511 | 7,086 | 1 | 17,511 | 2032 | ||||||||||||||
| Goliad | 636 | 257 | 7 | 636 | 2024 & 2025 | ||||||||||||||
| Texas | Palangana | 6,969 | 2,820 | 12 | 6,969 | 2025 thru 2032 | |||||||||||||
| Salvo | 800 | 324 | 2 | 800 | 2026 & 2027 | ||||||||||||||
| Longhorn | 594 | 240 | 40 | 594 | 2027 thru 2028 | ||||||||||||||
| Arizona | Anderson | 8,268 | 3,346 | 1 | 640 | 2024 | 386 | 7,628 | 2024 | ||||||||||
| Los Cuatros | 640 | 259 | 1 | 640 | 2024 | ||||||||||||||
| Acres | Hectares | State Leases | Fee Mineral Leases | Federal Lode Mining Claims | Provincial Mineral Dispositions | Provincial Mining Leases | |||||||||||||
Country | State/Province | Project | Total | Total | Number | Acres | Expiration Date | Number | Acres | Expiration Date | Number | Acres | Expiration Date | Number | Hectares | Expiration Date | Number | Hectares | Expiration Date |
| Workman Creek | 4,036 | 1,374 | 198 | 4,036 | 2024 | ||||||||||||||
New Mexico | C de Baca | 600 | 243 | 30 | 600 | 2024 | |||||||||||||
| Dalton Pass | 1,020 | 413 | 51 | 1,020 | 2024 | ||||||||||||||
| Alexandra | 36,485 | 14,765 | 6 | 14,765 | Oct. 4042 | ||||||||||||||
| Axis Lake | 13,045 | 5,279 | 3 | 5,279 | Aug. 2023 | ||||||||||||||
| Beatty River | 16,526 | 6,688 | 7 | 6,688 | Sept. 2027 | ||||||||||||||
| Canada | Saskatchewan | Black Lake | 78,335 | 31,701 | 13 | 31,701 | Nov. 2024 | ||||||||||||
| Brander Lake | 34,577 | 13,993 | 9 | 13,993 | Apr. 2035 | ||||||||||||||
| Candle Lake | 6,412 | 2,595 | 1 | 2,595 | Oct. 2038 | ||||||||||||||
| Christie Lake | 19,575 | 7,922 | 6 | 7,922 | Mar. 2044 | ||||||||||||||
| Christie West | 813 | 329 | 2 | 329 | Jun. 2023 | ||||||||||||||
| Close Lake | 95,578 | 38,679 | 21 | 38,679 | Oct. 2023 | ||||||||||||||
| Cree Extension | 30,115 | 12,187 | 11 | 12,187 | Aug. 2040 | ||||||||||||||
| Diabase Peninsula | 77,164 | 31,227 | 22 | 31,227 | |||||||||||||||
| Erica | 91,409 | 36,992 | 20 | 36,992 | Nov. 2036 | ||||||||||||||
| Hidden Bay | 126,933 | 51,368 | 45 | 51,368 | Aug. 2037 | ||||||||||||||
| Horseshoe-Raven | 11,085 | 4,486 | 1 | 4,486 | Feb. 2041 | ||||||||||||||
| Key West | 31,827 | 12,880 | 4 | 12,880 | Apr. 2024 | ||||||||||||||
| Laurie | 21,691 | 8,778 | 4 | 8,778 | May 2027 | ||||||||||||||
| Millennium | 1,458 | 590 | 1 | 590 | Feb. 2039 | ||||||||||||||
| Mirror River | 42,996 | 17,400 | 5 | 17,400 | Apr. 2024 | ||||||||||||||
| Moon Lake | 9,385 | 3,798 | 5 | 3,798 | Oct. 2039 | ||||||||||||||
| Moore Tomblin | 3,249 | 1,315 | 2 | 1,315 | May 2028 | ||||||||||||||
| Nikita | 37,390 | 15,131 | 6 | 15,131 | Jun. 2043 | ||||||||||||||
| Riou Lake | 27,634 | 11,183 | 14 | 11,183 | Nov. 2023 | ||||||||||||||
| Roughrider | 1,475 | 597 | 1 | 597 | Jan. 2028 | ||||||||||||||
| Shea Creek | 81,451 | 32,962 | 18 | 32,962 | Mar. 2035 | ||||||||||||||
| Uchrich | 5,592 | 2,263 | 1 | 2,263 | May 2027 | ||||||||||||||
| Waterfound River | 28,837 | 11,670 | 25 | 11,670 | Jul. 2031 | ||||||||||||||
| West Bear | 27,439 | 11,104 | 26 | 10,807 | Feb 2043 | 1 | 297 | June 2035 | |||||||||||
| Wheeler River | 28,961 | 11,720 | 19 | 11,720 | Oct. 2041 | ||||||||||||||
| Wolly | 58,564 | 23,700 | 17 | 23,700 | Nov. 2038 | ||||||||||||||
| Nunavut | Kiggavik | 45,638 | 18,469 | 37 | 18,469 | Oct. 2038 | |||||||||||||
| Paraguay | Yuty | 289,687 | 117,232 | ||||||||||||||||
| Oviedo | 223,754 | 90,550 | |||||||||||||||||
Titanium Projects | |||||||||||||||||||
| Paraguay | Alto Parana | 174,204 | 70,498 | ||||||||||||||||
Uranium Projects | ||||||||||
Texas | ||||||||||
Property | Fully Permitted to Mine | Partially Permitted to Mine | Not Permitted to Mine | RRC Exploration Permit | TCEQ Class 1 Well Permits | TCEQ Injection Control Permit | TCEQ Area Permit | TCEQ/EPA Aquifer Exemption | TCEQ Radioactive Materials License | Notes |
| Burke Hollow | X | Yes | 2 | Yes | Yes | Yes | Yes | Has all major permits, waiting on final production authorization | ||
| Goliad | X | Yes | 2 | Yes | Yes | Yes | Yes | Has all major permits and first production authorization | ||
| La Palangana | X | Yes | 2 | Yes | Yes | Yes | Yes | Has all major permits and four production authorizations | ||
| Salvo | X | No | 0 | No | No | No | No | |||
| Longhorn | X | No | 0 | No | No | No | No | |||
Wyoming | ||||||||||
Property | Fully Permitted to Mine | Partially Permitted to Mine | Not Permitted to Mine | Class III UIC Permit to Mine | WDEQ Class 1 Well Permits | Source and Byproduct Materials License | BLM Plan of Operations | WDEQ/EPA Aquifer Exemption | Notes | |
| Allemand-Ross | X | Drilling Notification DN339 | ||||||||
| Antelope | X | Yes | Drilling Notification DN353 | |||||||
| Barge | X | |||||||||
| Black Hills | X | |||||||||
| Brown Ranch | X | |||||||||
| Bull Springs | X | |||||||||
| Central Shirley Basin | X | |||||||||
| Charlie | X | Permitted as an open pit mine not ISR | ||||||||
| Christensen Ranch | X | Yes | Yes | Yes | Yes | |||||
| Clarkson Hill | X | |||||||||
| Crooks Creek | X | |||||||||
| Crook's Mountain | X | |||||||||
| Crossroads | X | |||||||||
| Cyclone Rim | X | |||||||||
| East Shirley Basin | X | |||||||||
| Gas Hills | X | |||||||||
| Horse Creek | X | |||||||||
| Irigaray Project | X | Yes | Yes | Yes | Yes | Irigaray mine expansion to north and south will require a permit revision. Drilling Notification DN342 | ||||
| Jab/West Jab | X | Drilling Notification DN353 | ||||||||
| Ludeman | X | Yes | Yes | Yes | ||||||
| Moore Ranch | X | Yes | Yes | Yes | Yes | |||||
| Mule Creek | X | |||||||||
| Niles Ranch | X | |||||||||
| Nine Mile Lake | X | Drilling Notification DN339 | ||||||||
| Pine Ridge | X | Drilling Notification DN342 | ||||||||
| Pine Tree U1 | X | Drilling Notification DN342 | ||||||||
| Pumpkin Creek | X | Drilling Notification DN342 | ||||||||
| Red Rim | X | |||||||||
| Reno Creek | X | Yes | Yes | Yes | Yes | North Reno Creek and SW Reno Creek Resource areas are permitted. | ||||
| Ross Flat | X | Drilling Notification DN342 | ||||||||
| Sand Creek | X | |||||||||
| South Pine Ridge | X | |||||||||
| South Reno Creek | X | |||||||||
| South Sweetwater | X | |||||||||
| Stewart Creek | X | |||||||||
| Taylor Ranch | X | Drilling Notification DN342 | ||||||||
| Twin Buttes | X | |||||||||
| West Beaver Rim | X | |||||||||
| West Crook's Creek | X | |||||||||
| West Sweetwater | X | |||||||||
Arizona | ||||||||||
Property | Fully Permitted to Mine | Partially Permitted to Mine | Not Permitted to Mine | Class III UIC Permit to Mine | WDEQ Class 1 Well Permits | Source and Byproduct Materials License | BLM Plan of Operations | WDEQ/EPA Aquifer Exemption | Notes | |
| Anderson | X | |||||||||
| Los Cuatros | X | |||||||||
| Workman Creek | X | |||||||||
New Mexico | ||||||||||
Property | Fully Permitted to Mine | Partially Permitted to Mine | Not Permitted to Mine | Class III UIC Permit to Mine | WDEQ Class 1 Well Permits | Source and Byproduct Materials License | BLM Plan of Operations | WDEQ/EPA Aquifer Exemption | Notes | |
| C de Baca | X | |||||||||
| Dalton Pass | X | |||||||||
Canada | ||||||||||
Property | Fully Permitted to Mine | Partially Permitted to Mine | Not Permitted to Mine | Notes | ||||||
| Alexandra | X | Exploration-Stage Project with no resources | ||||||||
| Axis Lake | X | Exploration-Stage Project with no resources | ||||||||
| Beatty River | X | Exploration-Stage Project with no resources | ||||||||
| Black Lake | X | Exploration-Stage Project with no resources | ||||||||
| Brander Lake | X | Exploration-Stage Project with no resources | ||||||||
| Candle Lake | X | Exploration-Stage Project with no resources | ||||||||
| Christie Lake | X | Exploration-Stage Project with resources | ||||||||
| Christie West | X | Exploration-Stage Project with no resources | ||||||||
| Close Lake | X | Exploration-Stage Project with no resources | ||||||||
| Cree Extension | X | Exploration-Stage Project with no resources | ||||||||
| Diabase Peninsula | X | Exploration-Stage Project with no resources | ||||||||
| Erica | X | Exploration-Stage Project with no resources | ||||||||
| Hidden Bay | X | Exploration-Stage Project with no resources | ||||||||
| Horseshoe-Raven | X | Exploration-Stage Project with resources | ||||||||
| Key West | X | Exploration-Stage Project with no resources | ||||||||
| Laurie | X | Exploration-Stage Project with no resources | ||||||||
| Millennium | X | Exploration-Stage Project with resources | ||||||||
| Mirror River | X | Exploration-Stage Project with no resources | ||||||||
| Moon Lake | X | Exploration-Stage Project with no resources | ||||||||
| Moore Tomblin | X | Exploration-Stage Project with no resources | ||||||||
| Nikita | X | Exploration-Stage Project with no resources | ||||||||
| Riou Lake | X | Exploration-Stage Project with no resources | ||||||||
| Roughrider | X | Exploration-Stage Project with resources | ||||||||
| Shea Creek | X | Exploration-Stage Project with resources | ||||||||
| Uchrich | X | Exploration-Stage Project with no resources | ||||||||
| Waterfound River | X | Exploration-Stage Project with no resources | ||||||||
| West Bear | X | Exploration-Stage Project with no resources |
| Wheeler River | X | Feasibility Field Test mining completed | ||||||||
| Wolly | X | Exploration-Stage Project with no resources | ||||||||
| Kiggavik | X | Development-Stage, not permitted to mine | ||||||||
Paraguay | ||||||||||
Property | Fully Permitted to Mine | Partially Permitted to Mine | Not Permitted to Mine | Notes | ||||||
| Yuty | X | Exploration-Stage Project with resources | ||||||||
| Oviedo | X | Exploration-Stage Project with no resources | ||||||||
Titanium Projects | ||||||||||
Paraguay | ||||||||||
Property | Fully Permitted to Mine | Partially Permitted to Mine | Not Permitted to Mine | Notes | ||||||
| Alto Parana | X | Exploration-Stage Project with no resources | ||||||||
State/Province | Plant | Location (Latitude) | Location (Longitude) | Equity Interest | Operator | Status | Annual Permitted Production Capacity | Fully Permitted to Mine | Partially Permitted to Mine | Not Permitted to Mine | WDEQ Class 1 Well Permits | TCEQ Radioactive Materials License |
| Wyoming | Irigaray Central Processing Plant | 100% | UEC | Production Suspended | 2.5 Mlb/year | X | 2 | Yes | ||||
| Christensen Ranch Satellite Production Plant | 100% | UEC | Standby | 9,000 gpm | X | 4 | Yes | |||||
State/Province | Plant | Location (Latitude) | Location (Longitude) | Equity Interest | Operator | Status | Annual Permitted Production Capacity | Fully Permitted to Mine | Partially Permitted to Mine | Not Permitted to Mine | TCEQ Class 1 Well Permits | TCEQ Radioactive Materials License |
| Texas | Hobson Central Processing Plant | 28.945 | -97.989 | 100% | UEC | Production Suspended | 4.0 Mlb/year | X | 2 | Yes |
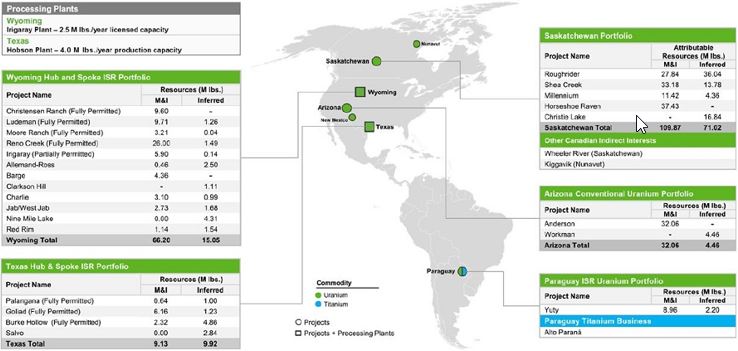
Uranium Oxide Mineral Resources | ||||||||||||||
Country | State/Province | Project | Measured | Indicated | Inferred | |||||||||
Tons ('000's) | Tonnes ('000's) | Grade (% U3O8) | Pounds U3O8 ('000's) | Tons ('000's) | Tonnes ('000's) | Grade (% U3O8) | Pounds U3O8 ('000's) | Tons ('000's) | Tonnes ('000's) | Grade (% U3O8) | Pounds U3O8 ('000's) | |||
| Allemand-Ross | 246 | 223 | 0.09% | 417 | 32 | 29 | 0.07% | 42 | 1,275 | 1,157 | 0.10% | 2,496 | ||
| Barge | 4,301 | 3,902 | 0.05% | 4,361 | ||||||||||
| Charlie | 1,255 | 1,139 | 0.12% | 3,100 | 411 | 373 | 0.12% | 988 | ||||||
| Christensen Ranch | 6,555 | 5,947 | 0.07% | 9,596 | ||||||||||
| Clarkson Hill | 957 | 868 | 0.06% | 1,113 | ||||||||||
| Irigaray | 3,881 | 3,521 | 0.08% | 5,899 | 104 | 94 | 0.07% | 141 | ||||||
| Wyoming | Jab/West Jab | 1,621 | 1,471 | 0.07% | 2,335 | 253 | 230 | 0.08% | 392 | 1,402 | 1,272 | 0.06% | 1,677 | |
| Ludeman | 2,674 | 2,426 | 0.09% | 5,017 | 2,660 | 2,413 | 0.09% | 4,697 | 866 | 786 | 0.07% | 1,258 | ||
| Moore Ranch | 2,675 | 2,427 | 0.06% | 3,210 | 46 | 42 | 0.05% | 44 | ||||||
| Nine Mile Lake | 3,405 | 3,089 | 0.04% | 4,308 | ||||||||||
| Red Rim | 337 | 306 | 0.17% | 1,142 | 473 | 429 | 0.16% | 1,539 | ||||||
| United States | Reno Creek | 14,990 | 13,599 | 0.04% | 12,920 | 16,980 | 15,404 | 0.04% | 13,070 | 1,920 | 1,742 | 0.04% | 1,490 | |
Wyoming Total | 22,206 | 20,145 | 0.05% | 23,899 | 36,254 | 32,889 | 0.06% | 42,299 | 10,859 | 9,851 | 0.07% | 15,054 | ||
| Burke Hollow | 70 | 64 | 0.08% | 115 | 1,337 | 1,213 | 0.09% | 2,209 | 2,494 | 2,263 | 0.10% | 4,859 | ||
| Goliad | 1,595 | 1,447 | 0.05% | 2,668 | 1,504 | 1,364 | 0.10% | 3,492 | 333 | 302 | 0.20% | 1,225 | ||
| Texas | Palangana | 232 | 210 | 0.13% | 643 | 302 | 274 | 0.18% | 1,001 | |||||
| Salvo | 1125 | 1,020 | 0.09% | 2,839 | ||||||||||
Texas Total | 1,665 | 1,510 | 0.08% | 2,783 | 3,073 | 2,788 | 0.10% | 6,344 | 5,469 | 4,961 | 0.09% | 9,924 | ||
| Anderson | 16,175 | 14,674 | 0.10% | 32,055 | ||||||||||
| Arizona | Workman Creek | 1,981 | 1,797 | 0.11% | 4,459 | |||||||||
Arizona Total | 16,175 | 14,674 | 0.10% | 32,055 | 1,981 | 1,797 | 0.11% | 4,459 | ||||||
United States Total | 23,871 | 21,655 | 0.06% | 26,682 | 55,502 | 50,351 | 0.07% | 80,698 | 18,309 | 16,610 | 0.08% | 29,437 | ||
| Christie Lake | 537 | 488 | 1.57% | 16,836 | ||||||||||
| Roughrider | 429 | 389 | 3.25% | 27,842 | 396 | 359 | 4.55% | 36,043 | ||||||
| Canada | Saskatchewan | Horseshoe-Raven | 11,412 | 10,353 | 0.16% | 37,426 | ||||||||
| Shea Creek | 1,113 | 1,009 | 1.49% | 33,175 | 679 | 616 | 1.02% | 13,775 | ||||||
| Millennium | 239 | 217 | 2.39% | 11,423 | 68 | 62 | 3.19% | 4,364 | ||||||
Canada Total | 13,192 | 11,968 | 0.42% | 109,867 | 1,681 | 1,525 | 2.11% | 71,019 | ||||||
| Paraguay | Yuty | 9,074 | 8,232 | 0.05% | 8,962 | 2,733 | 2,479 | 0.04% | 2,203 | |||||
Total Resources | 23,871 | 21,655 | 0.06% | 26,682 | 77,768 | 70,550 | 0.13% | 199,527 | 22,797 | 20,681 | 0.23% | 102,658 | ||
| 1. | The Mineral Resource estimates in this table meet S-K 1300 definitions. | |
| 2. | Mineral Resources are not Mineral Reserves and do not have demonstrated economic viability. | |
| 3. | The point of reference for mineral resources is in-situ at the Project. | |
| 4. | Mineral Resources are estimated using a long-term uranium price of $40 per pound for ISR projects and $65 per pound for conventional projects, except for the Canadian projects where a price of $56 per pound was used for the Roughrider Project, a price of $75 per pound was used for the Horseshoe-Raven Project, a price of $50 per pound was used for the Shea Creek Project, a price of $50 per pound was used for the Christie Lake Project and a price of $62 per pound was used for the Millennium Project. | |
| 5. | Mineral Resources in the table above are 100% attributable to the Company. Where JV projects have resources that are attributable to other companies, these resources are not listed in this table. | |
| 6. | Numbers may not add due to rounding. |
Uranium Oxide Resources | |||||||||||
FY 2022 | FY 2023 | YOY Change | |||||||||
Country | State/Province | Project | Measured Pounds U3O8 ('000's) | Indicated Pounds U3O8 ('000's) | Inferred Pounds U3O8 ('000's) | Measured Pounds U3O8 ('000's) | Indicated Pounds U3O8 ('000's) | Inferred Pounds U3O8 ('000's) | % Change in Measured Pounds | % Change in Indicated Pounds | % Change in Inferred Pounds |
| Allemand-Ross | 417 | 42 | 2,496 | 417 | 42 | 2,496 | 0% | 0% | 0% | ||
| Barge | 4,361 | 4,361 | 0% | ||||||||
| Charlie | 3,100 | 988 | 3,100 | 988 | 0% | 0% | |||||
| Christensen Ranch | 9,596 | 9,596 | 0% | ||||||||
| Clarkson Hill | 1,113 | 1,113 | 0% | ||||||||
| Irigaray | 5,899 | 141 | 5,899 | 141 | 0% | 0% | |||||
| Wyoming | Jab/West Jab | 2,335 | 392 | 1,677 | 2,335 | 392 | 1,677 | 0% | 0% | 0% | |
| Ludeman | 5,017 | 4,697 | 1,258 | 5,017 | 4,697 | 1,258 | 0% | 0% | 0% | ||
| Moore Ranch | 3,210 | 44 | 3,210 | 44 | 0% | 0% | |||||
| United States | Nine Mile Lake | 4,308 | 4,308 | 0% | |||||||
| Red Rim | 1,142 | 1,539 | 1,142 | 1,539 | 0% | 0% | |||||
| Reno Creek | 12,920 | 13,070 | 1,490 | 12,920 | 13,070 | 1,490 | 0% | 0% | 0% | ||
Wyoming Total | 23,899 | 42,299 | 15,054 | 23,899 | 42,299 | 15,054 | 0% | 0% | 0% | ||
| Burke Hollow | 115 | 2,209 | 4,859 | 115 | 2,209 | 4,859 | 0% | 0% | 0% | ||
| Texas | Goliad | 2,668 | 3,492 | 1,225 | 2,668 | 3,492 | 1,225 | 0% | 0% | 0% | |
| Palangana | 643 | 1,001 | 643 | 1,001 | 0% | 0% | |||||
| Salvo | 2,839 | 2,839 | 0% | ||||||||
Texas Total | 2,783 | 6,344 | 9,924 | 2,783 | 6,344 | 9,924 | 0% | 0% | 0% | ||
| Anderson | 32,055 | 32,055 | 0% | ||||||||
| Arizona | Workman Creek | 4,459 | 4,459 | 0% | |||||||
Arizona Total | 32,055 | 4,459 | 32,055 | 4,459 | 0% | 0% | |||||
United States Total | 26,682 | 80,698 | 29,437 | 26,682 | 80,698 | 29,437 | 0% | 0% | 0% | ||
| Christie Lake | 16,836 | 100% | |||||||||
| Roughrider | 27,842 | 36,043 | 100% | 100% | |||||||
| Canada | Saskatchewan | Horseshoe-Raven | 37,426 | 100% | |||||||
| Shea Creek | 33,175 | 13,775 | 100% | 100% | |||||||
| Millennium | 11,423 | 4,364 | 100% | 100% | |||||||
Canada Total | 109,867 | 71,019 | 100% | 100% | |||||||
| Paraguay | Yuty | 8,962 | 2,203 | 8,962 | 2,203 | 0% | 0% | ||||
Total Resources | 26,682 | 89,660 | 31,640 | 26,682 | 199,527 | 102,658 | 0% | 123% | 224% | ||
| 1. | The Mineral Resource estimates in this table meet S-K 1300 definitions. | |
| 2. | Mineral Resources are not Mineral Reserves and do not have demonstrated economic viability. | |
| 3. | The point of reference for mineral resources is in-situ at the Project. | |
| 4. | Mineral Resources are estimated using a long-term uranium price of $40 per pound for ISR projects and $65 per pound for conventional projects, except for the Canadian projects where a price of $56 per pound was used for the Roughrider Project, a price of $75 per pound was used for the Horseshoe-Raven Project, a price of $50 per pound was used for the Shea Creek Project, a price of $50 per pound was used for the Christie Lake Project and a price of $62 per pound was used for the Millennium Project.. | |
| 5. | Mineral Resources are 100% attributable to the Company. Where JV projects have resources that are attributable to other companies, these resources are not listed in this table. | |
| 6. | Numbers may not add due to rounding. |
our capital needs;
business plans; and
expectations.
While these forward-looking statements, and any assumptions upon which they are based, are made in good faith and reflect our current judgment regarding future events, our actual results will likely vary, sometimes materially, from any estimates, predictions, projections, assumptions or other future performance suggested herein. Some of the risks and assumptions include:
our need for additional financing;
our exploration activities may not result in commercially exploitable quantities of ore on our mineral properties;
the risks inherentprompt fission neutron (“PFN”) techniques. This technology has been employed in the exploration and development of sandstone uranium deposits in the U.S. since the 1950s. QA/QC of gamma-ray and PFN probes from each logging truck are required to maintain calibration by regular cross-checking the probes at a U.S. Department of Energy test pits located in George West, Texas, or Casper, Wyoming. The pit is set up for mineralslogging units to calibrate the probes with a known radioactive source. Each test run generates calibration files for the operator to review and make necessary tool adjustments. Calibration runs typically are made on a one- or two-month interval, and files with the test pit run results are maintained by the operator. The available data indicate that the logging provided by the Company and contract probe trucks at the various U.S. projects have maintained industry standard calibration procedures for their probes.
| ● | The Tullock member consists of sandstone, siltstone and sparse coal and carbonaceous shale; |
| ● | The Lebo member consists of abundant drab gray mudstone, minor siltstone and sandstone and sparse coal and carbonaceous shale beds; and |
| ● | The Tongue River member consists of interbedded sandstone, conglomerate, siltstone, mudstone, limestone, anomalously thick coal beds and carbonaceous shale beds. This member has been mined extensively for its coal beds, which can be hundreds of feet thick. |
our limited operating history;
ourconsists of sandstone, siltstone, shale, coal and local conglomerates. The Fort Union is overlain, often unconformably, by the Eocene Wind River Formation, which consists of sandstones, conglomerates, siltstones and shale. Overlying the Wind River Formation is the Oligocene White River Formation. The White River Formation also consists of sandstones, siltstone and shale, however, along with fluvial deposition of the sands and clays, substantial volumes of windblown volcanic ash (tuffs) were also deposited. This volcanic ash is regarded by many as the source of uranium for many Wyoming sandstone uranium deposits. Economic uranium deposits in the WRB typically occur as roll-front deposits in porous sandstones within the Wind River and Fort Union Formations.
commercial production.
our lack of insurance coverage;
the competitive environment in which we operate;
the level of government regulation, including environmental regulation;
changes in governmental regulationapproximately 14 miles then exit left onto Irigaray Road and administrative practices;
our dependence on key personnel;
conflicts of interest of our directors and officers;
our ability to fully implement our business plan;
our ability to effectively manage our growth; and
other regulatory, legislative and judicial developments.
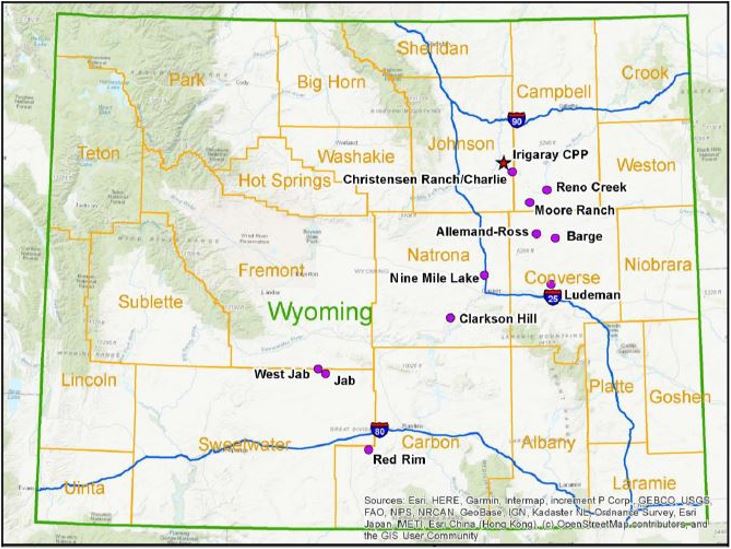
We advise the reader that these cautionary remarks expressly qualify in their entirety all forward-looking statements attributable to us or persons acting on our behalf. Important factors that you should also consider, include, but are not limitedfollow signs to the factors discussedIrigaray site. For access from Gillette, take State Highway 50 south approximately 25 miles exit right onto Black and Yellow Road, travel for approximately 20 miles and follow signs to Irigaray. The Irigaray Project Area is primarily located on private surface land, federal BLM land and a portion located on one section of state-managed land.
Year | Company | Operations/Activity | Amount (No. of Drill holes) | Results of Work |
1969 | Homestake Mining (“Homestake”) | Original controller of the Irigaray Project Area. | Approximately 1,340 | Right to mine secured. Preliminary delineation of mineralized areas. |
1975 | Westinghouse Electric Corporation (“Westinghouse”) | Acquired property from Homestake. The project was licensed for ISR production in 1978 and was operated by Wyoming Mineral Corporation, a subsidiary of Westinghouse. Operations ceased in 1982 due to market trends. | Approximately 470 | Delineation of mineralized areas. Began ISR production. |
1987 | Malapai Resources Company (“Malapai”) | Acquired property from Westinghouse. | None | Ownership transition. |
1990 | Total Minerals Corporation (“TOMIN”) and Électricité de France (“EDF”) | Acquired property from Malapai. TOMIN acted as project operator. | None | Ownership transition. |
1993 | COGEMA Resources, Inc. (“COGEMA”) (now Orano S.A.)/Areva | Replaced TOMIN as project operator in partnership with EDF. COGEMA acquired interests from TOMIN. | Approximately 20 | 0.74 million lb. of U3O8 produced from 1978 through 2000. |
2010 | Uranium One | Dried many millions of pounds from Christensen Ranch and through toll milling. | N/A | Decommissioned Irigaray wellfields. |
2021 | UEC | Irigaray Project Area acquired by UEC from Uranium One. | N/A | Ownership transition. |
2018. Permit to Mine No. 478 and Radioactive Materials License WYSUA-1341 are in good standing, with no violations of permit or license conditions. Mining permit requirements can be found in Wyoming Statutes §35-11-400 through 437, with specific laws for ISR mining in sections 426 – 436. Conditions of the Radioactive Materials License applicable to ISR mining are generally standard for all licensees. Requirements of Radioactive Materials Licenses are found in WDEQ, LQD/Uranium Recovery Program Chapter 4 Rules and Regulations for Licensing of Source and Byproduct Material. There are no materially significant encumbrances on the Irigaray Project. Standard encumbrances include reclamation bonding, mining and surface lease royalties.
Classification | Tons Ore (000’s) | Tonnes Ore (1000’s) | Average Grade (% eU3O8) | Pounds eU3O8 (000’s) |
| Measured | - | - | - | - |
| Indicated | 3,881 | 3,521 | 0.076 | 5,899.0 |
Total M&I | 3,881 | 3,521 | 0.076 | 5,899.0 |
| Inferred | 104 | 94 | 0.068 | 141.0 |
Total Resources | 3,985 | 3,615 | 0.076 | 6,040.0 |
| 1. | The sum of resource tons and lbs. may not add up to the reported total due to rounding. | |
| 2. | Measured, indicated and inferred mineral resources as defined in 17 CFR § 229.1300. | |
| 3. | GT Cutoff = 0.25 ft% eU3O8. | |
| 4. | All reported resources occur below the static water table. | |
| 5. | The point of reference for mineral resources is in-situ at the Project. | |
| 6. | Mineral resources that are not mineral reserves do not have demonstrated economic viability. | |
| 7. | A long-term uranium price of $40/lb U3O8 and an 80% metallurgical recovery factor were considered for the purposes of determining the reasonable prospect of economic extraction. |

iii
REFERENCES
As used in this annual report: (i)PRB.
iv
1
PART I
Corporate Organization
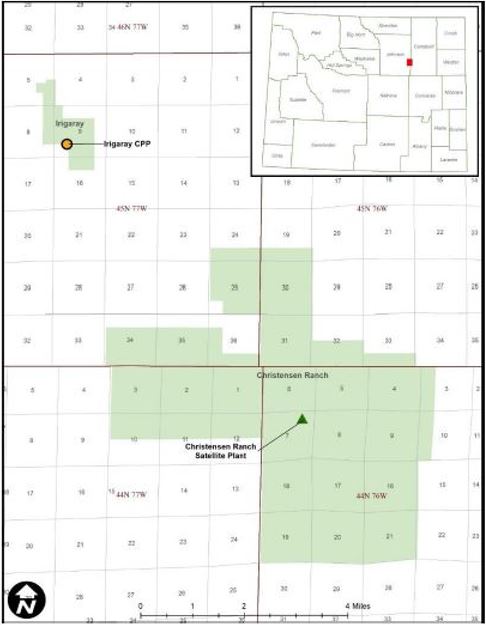
Uranium Energy Corp. was incorporated under the lawssoutheast of the Irigaray Central Processing Plant and is accessed by travelling west on Black and Yellow Road to Irigaray Road. The Christensen Ranch Project Area is primarily located on private surface land, with two portions located on federal BLM-managed land.
On December 31, 2007, we incorporated a wholly-owned subsidiary, UEC Resources Ltd., under the laws of the Province of British Columbia, Canada. Effective December 18, 2009, we acquired a 100% interestlate 1950s, small open pit mine operations were established in the South Texas Mining Venture, L.L.P. ("STMV"), a Texas limited liability partnership, from each of URN Resources Inc., a subsidiary of Uranium One Inc.,PRB. Early prospecting and Everest Exploration, Inc. (“STMV Acquisition”). On September 3, 2010, we incorporated a wholly-owned subsidiary, UEC Paraguay Corp., under the laws of the State of Nevada. Effective May 24, 2011, we acquired a 100% in interest in Piedra Rica Mining S.A., a private company incorporated in Paraguay. Effective September 9, 2011, we acquired a 100% interest in Concentric Energy Corp., a private company incorporated in the State of Nevada. Effective March 30, 2012, we acquired a 100% interest in Cue Resources Ltd., a publicly-traded company incorporated in the Province of British Columbia, Canada.
Our principal offices are located at 500 North Shoreline Boulevard, Suite 800N, Corpus Christi, Texas 78401exploration included geologic mapping and 1111 West Hastings Street, Suite 320, Vancouver, British Columbia, Canada V6E 2J3.
General Business
We are engaged in uranium mining and related activities, including exploration, pre-extraction, extraction and processing of uranium concentrates, on projects located in the United States and Paraguay. Our fully-licensed and 100%-owned Hobson Processing Facility (“Hobson” or the “Hobson Facility”) forms the basis for our regional operating strategy in the State of Texas, specifically the South Texas Uranium Belt, utilizing in-situ recovery mining. As a central processing site, Hobson processes uranium-loaded resins from our Palangana Mine and has the additional capacitygamma surveys, which led to process uranium-loaded resins from other satellite mining activities within the South Texas Uranium Belt as they enter uranium recovery. Since the commencement of uranium extraction in November 2010 to July 31, 2012, the Hobson Facility has processed 323,000 pounds of uranium concentrates.
At July 31, 2012, we had mineral rights located in the States of Arizona, Colorado, New Mexico, Texas and Wyoming and in Paraguay. We acquired these mineral rights for the purposes of uranium mining and related activities, including exploration, pre-extraction, extraction and processing of uranium concentrates. Many of the areas in which the Company has interests in have been the subject of historical exploration by other mining companies. Specific exploration targets may be identified internally by our geological team by utilizing this prior exploration work combined with our extensive exploration database.
Fiscal 2012
The following is a list of the material transactions for the fiscal year ended July 31, 2012:
Effective September 9, 2011, we acquired a 100% interest in the Anderson Project located in the State of Arizona through the acquisition of Concentric Energy Corp., a private company incorporated in the State of Nevada;
2
Effective November 30, 2011, we acquired a 100% interest in the Workman Creek Project located in the State of Arizona;
Effective March 30, 2012, we acquired a 100% interest in the Yuty Project located in the Republic of Paraguay through the acquisition of Cue Resources Ltd., a publicly-traded company incorporated in the Province of British Columbia, Canada;
Effective March 31, 2012, we acquired a 100% interest in a further two prospecting permits in the area of Coronel Oviedo, Paraguay, adjacent to the Company’s existing Coronel Oviedo Project;
On April 10, 2012, we closed a public offering of its common stock for gross proceeds of $22.5 million (net proceeds of $21.0 million) through the sale of 6,246,078 shares of the Company at a price of $3.60 per share;
Effective May 23, 2012, we acquired uranium rights through a mineral lease on the Slick Rock Project located in the State of Colorado;
During Fiscal 2012, we acquired uranium rights through a mineral lease on the Burke Hollow Project located in the State of Texas; and
During Fiscal 2012, we acquired uranium rights through a mineral lease on the Channen Project located in the State of Texas.
Background of the Uranium Industry
A relatively small number of companies operating in only a few countries are engaged in uranium production, with only five producers marketing 61% of the estimated world production in 2011. Roughly 73% of the world’s production in 2011 came from four countries: Kazakhstan, Canada, Australia and Niger. In 2009, Kazakhstan surpassed Canada as the largest global producer, a title Canada had held for 17 years.
Between 1960 and 1985, a significant amount of uranium exploration was conducted in the United States. In 2011, the United States was the largest consumerdiscoveries of uranium in the worldWasatch and Fort Union Formations. Extensive drill hole exploration has been utilized to locate deeper uranium mineralization since the 1960s to progress geologic models.
Year | Company | Operations/Activity | Amount (No. of Drill holes) | Results of Work |
1967 | Independent Operators | Assembled as a large land package by independent operators. | Approximately 4,860 | Right to mine secured. Preliminary delineation of mineralized areas. |
1979 | Arizona Public Services (“APS”), parent company of Malapai | APS became a 50% partner in 1979. | Approximately 2,220 | Delineation of mineralized areas. |
1981 | Malapai | Malapai assumed sole ownership of the Christensen Ranch Project Area by acquiring the interests of Wold Energy (“Wold”) and Western Nuclear Corporation (“WNC”). Malapai purchased the Irigaray Project Area from Westinghouse in 1987, and the Christensen Ranch Project Area was licensed for operations under the Irigaray U.S. NRC and Wyoming Department of Environmental Quality (“WDEQ”) license/permit in 1988. Uranium production by ISR was started by Malapai in 1989 and was placed on standby in 1990. | Approximately 1,460 | Delineation of mineralized areas. Began ISR production. |
1990 | TOMIN and EDF | EDF acquired the Irigaray and Christensen Ranch Project Areas from Malapai in 1990. TOMIN acted as project operator for EDF under a joint participation agreement. TOMIN restarted ISR operations in 1991. | Approximately 2,270 | Delineation of mineralized areas. Restarted ISR production. |
1993 | COGEMA and EDF | In 1993, COGEMA acquired the assets of TOMIN and changed the name of the operating entity to COGEMA Mining, Inc. EDF (now Malapai) was still owner of 29%, COGEMA, as operator, owned 71% through the joint participation agreement. | Approximately 3,690 | 3.70 million lbs of U3O8 produced from 1989 through 2000. |
2000 | COGEMA and Malapai | Groundwater restoration of Mine Units 2 through 6 was completed. The Christensen Ranch Project Area was placed on standby from 2006 through 2010, at which time COGEMA and Malapai sold the project to Uranium One and Uranium One USA, Inc. (collectively, “Uranium One”). | N/A | 188,000 lbs of U3O8 produced during restoration. |
2010 | Uranium One | Mine Units 7, 8 and 10 were installed and operated. A ramp up occurred in 2011, and a ramp down occurred in 2013 (all wellfield development ceased). Low production mode occurred in 2014 through 2018, and production ended in 2018, at which time the Christensen Ranch Project Area was placed on care and maintenance. | N/A | 2.6 million lbs of U3O8 produced. |
2021 | UEC | The Christensen Ranch Project Area acquired by UEC from Uranium One. | N/A | Ownership transition. |
Classification | Tons Ore (000’s) | Tonnes Ore (1000’s) | Average Grade (% eU3O8) | Pounds eU3O8 (000’s) |
| Measured | - | - | - | - |
| Indicated | 6,555 | 5,947 | 0.073 | 9,596 |
Total M&I | 6,555 | 5,947 | 0.073 | 9,596 |
| Inferred | - | - | - | - |
Total Resources | 6,555 | 5,947 | 0.073 | 9,596 |
| 1. | The sum of resource tons and lbs. may not add up to the reported total due to rounding. | |
| 2. | Measured, indicated, and inferred mineral resources as defined in 17 CFR § 229.1300. | |
| 3. | GT Cutoff = 0.25 ft% eU3O8. | |
| 4. | All reported resources occur below the static water table. | |
| 5. | The point of reference for mineral resources is in-situ at the Project. | |
| 6. | Mineral resources that are not mineral reserves do not have demonstrated economic viability. | |
| 7. | A long-term uranium price of $40/lb U3O8 and an 80% metallurgical recovery factor were considered for the purposes of determining the reasonable prospect of economic extraction. |
Year | Company | Operations/Activity | Amount (No. of Drill holes) | Results of Work |
1971 | Conoco Minerals (“Conoco”) and Kerr-McGee Corporation (“Kerr-McGee”) | Conoco and Kerr-McGee operated as a joint venture. Of the joint venture, Conoco controlled 50% of the Moore Ranch Project Area and served as the operator. | Approximately 2,700 rotary drill holes Approximately 130 core holes | Discovery and delineation of mineralized areas. Permitting and licensing of a proposed uranium processing facility known as Sand Rock Mill was completed through the WDEQ/LQD and the NRC. |
1983 | Wold and Kerr-McGee | Conoco sold its interests to Wold in 1983. Kerr-McGee retained the rights with Wold. Assessment drilling was conducted. | None | Retained mining claims. Mining claim assessment drilling. |
1989 | Rio Algom Mining Corp. (“Rio Algom”) | Rio Algom acquired the project in 1989. Rio Algom conducted mining claim assessment drilling to retain mining claims through 1992, which was the last year to allow mining claim assessment drilling. | None | Retained mining claims. Mining claim assessment drilling. |
1992 | Rio Algom | Claim maintenance paid directly to the BLM. No further drilling conducted. | None | Mining claims retained through payment. |
2002 | Power Resources, Inc. (“PRI”) (now Cameco Resources) | Rio Algom acquired by PRI. | None | Ownership transition. |
2004 | Energy Metals Corporation (“EMC”) | EMC acquired most of the mining claims and state leases. | N/A | Secured right to mine. |
2007 | Uranium One | Uranium One acquired EMC and all rights to the Moore Ranch Project Area. Uranium One completed verification and resource enhancement drilling, coring, baseline monitor wells, and pump test wells. The Moore Ranch Project Area is fully permitted by WDEQ/LQD in 2011 and the NRC in 2013. | Approximately 800 | Exploration efforts focused on developing and upgrading mineral resources. |
2021 | UEC | Moore Ranch Project Area acquired by UEC from Uranium One. | N/A | Ownership transition. |
Classification | Tons Ore (000’s) | Tonnes Ore (1000’s) | Average Grade (% eU3O8) | Pounds eU3O8 (000’s) |
| Measured | 2,675 | 2,427 | 0.06 | 3,210.0 |
| Indicated | - | - | - | - |
Total M&I | 2,675 | 2,427 | 0.06 | 3,210.0 |
| Inferred | 46 | 42 | 0.047 | 43.7 |
Total Resources | 2,721 | 2,469 | 0.06 | 3,253.7 |
| 1. | The sum of resource tons and lbs. may not add up to the reported total due to rounding. | |
| 2. | Measured, indicated, and inferred mineral resources as defined in 17 CFR § 229.1300. | |
| 3. | GT Cutoff = 0.3 ft% eU3O8. | |
| 4. | All reported resources occur below the static water table. | |
| 5. | The point of reference for mineral resources is in-situ at the Project. | |
| 6. | Mineral resources that are not mineral reserves do not have demonstrated economic viability. | |
| 7. | A long-term uranium price of $40/lb U3O8 and an 80% metallurgical recovery factor were considered for the purposes of determining the reasonable prospect of economic extraction. |
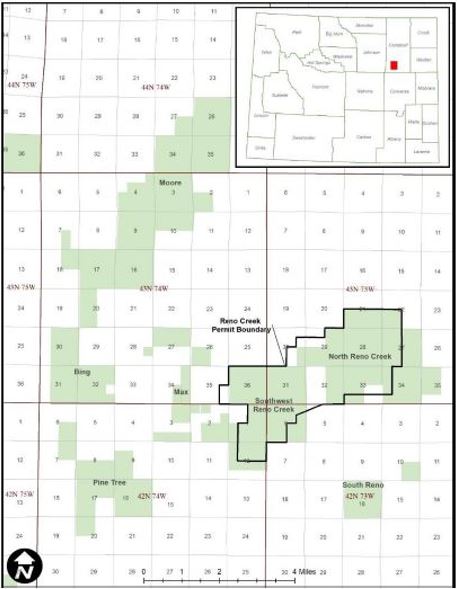
Year | Company | Operations/Activity | Amount (No. of Drill holes) | Results of Work |
Reno Creek – North Reno Creek | ||||
Late 1960s | Rocky Mountain Energy Company (“RME”) | Drilled exploration holes at and around North Reno Creek resource area. | Approximately 5,800 | Delineated Approximately 10 miles of roll-front deposits. |
Mid 1970s | RME, Mono Power Company (“Mono”) and Halliburton Services | Partnership formed to develop North Reno Creek Resource Area using ISR methods. | N/A | Acquisition of the Reno Creek Project Area. |
1992 | Energy Fuels Nuclear Inc./International Uranium Corporation | Energy Fuels Nuclear Inc. acquired RME’s North Reno Creek Resource Area and later became International Uranium Corporation. | N/A | Acquisition of the Reno Creek Project Area. |
2001 | Rio Algom | Rio Algom acquired International Uranium Corporation’s property. | N/A | Acquisition of the Reno Creek Project Area. |
2001 | PRI | PRI acquired North Reno Creek Area and dropped claims in 2003. | N/A | Acquisition of the Reno Creek Project Area and mining claims dropped. |
2004 | Strathmore Minerals Corporation and American Uranium Corporation (“AUCA”) | Re-staked and filed new mining claims on approximately 16,000 acres. | N/A | Refiled mining claims and secured right to mine. |
2007 | AUCA | Advanced project through acquisition of most major permits and required authorizations. | N/A | Acquisition of the Reno Creek Project Area and secured permits and authorizations. |
2017 | UEC | Consolidated ownership of multiple resource areas and oversaw technical reporting and auditing of Project resources. | N/A | Consolidation of ownership. Auditing of project resources. |
Reno Creek – Southwest Reno Creek | ||||
Pre-2007 | AUCA and Tennessee Valley Authority JV | Controlled Southwest Reno Creek and drilled exploration holes. | Approximately 700 | Delineation of mineralized areas. |
2007 | AUCA | Advanced project through acquisition of most major permits and required authorizations. | N/A | Secured permits and required authorizations. |
2017 | UEC | Consolidated ownership of multiple Resource Areas and oversaw technical reporting and auditing of Project resources. | N/A | Consolidation of ownership. Auditing of the Reno Creek Project Area resources. |
Reno Creek – Moore, Pine Tree, and Bing | ||||
1960s | Utah International Mining Company | Exploration on Moore and Pine Tree Resource Areas. | N/A | Delineation of mineralized areas. |
Late 1970s | Pathfinder Mines, Inc. | Utah International Mining Company becomes Pathfinder Mines, Inc. and continues exploration on Moore and Pine Tree Resource Areas. | >1,560 | Delineation of mineralized areas. |
1980s | RME | Obtained ownership of Moore Area, continued exploration drilling until the 1990s. | >400 | Acquired the Reno Creek Project Area. Delineation of mineralized areas. |
1960s | Cleveland-Cliffs Iron Company | Exploration of Bing Area, drilled several hundred exploration holes and conducted limited hydrologic testing in the 1970s. | 177 | Delineation of mineralized areas through drilling and conducted hydrologic testing. |
2007 | AUCA | Consolidated the Resource Areas under one owner. | N/A | Consolidated ownership. |
2017 | UEC | Oversaw technical reporting and auditing of project resources. | N/A | Auditing of the Reno Creek Project Area resources. |
Classification | Tons Ore (000’s) | Tonnes Ore (1000’s) | Average Grade (% eU3O8) | Pounds eU3O8 (000’s) |
| Measured | 14,990 | 13,599 | 0.043 | 12,920.0 |
| Indicated | 16,980 | 15,404 | 0.039 | 13,070.0 |
Total M&I | 31,970 | 29,003 | 0.041 | 25,990.0 |
| Inferred | 1,920 | 1,742 | 0.039 | 1,490.0 |
Total Resources | 33,890 | 30,745 | 0.041 | 27,480.0 |
| 1. | The sum of resources tons and lbs. may not add up to the reported total due to rounding. | |
| 2. | Measured, indicated, and inferred mineral resources as defined in 17 CFR § 229.1300. | |
| 3. | GT Cutoff = 0.20 ft% eU3O8. | |
| 4. | All reported resources occur below the static water table. | |
| 5. | The point of reference for mineral resources is in-situ at the Project. | |
| 6. | Mineral resources that are not mineral reserves do not have demonstrated economic viability. | |
| 7. | A long-term uranium price of $40/lb U3O8 and an 80% metallurgical recovery factor were considered for the purposes of determining the reasonable prospect of economic extraction. |
Year | Company | Operations/Activity | Amount (No. of Drill holes) | Results of Work |
1960s-1970s | Cordero Mining | Numerous exploration companies including Teton Exploration (“Teton”), PRI, Uranium Resources, Inc. (“URI”) and Malapai (a subsidiary of APS) collectively explored in the Ludeman Project Area. | Approximately 5,420 | Explored for uranium roll-front mineralization and delineated deposits in the Ludeman Project Area. |
1980 | United Nuclear Corp. (“UNC”) and partner Teton | Constructed and operated the Leuenberger ISR pilot test facility for 12 months. Groundwater restoration was completed following production and a commercial permit to mine was granted. Due to a decline in the market, the permitted mine was not placed into commercial operation and the permit expired. | N/A | Produced 12,800 lbs of U3O8 from the pilot facility. |
1981 | URI | Constructed and operated the North Platte ISR project on a portion of the Ludeman Project Area. The pilot test facility produced for five months during 1982. | N/A | Produced 1,515 lbs of U3O8 from the pilot facility. |
1980s | Malapai | Permitted the Peterson Project for pilot operations but was never operated. | N/A | Facility was never operated. |
1985-Early 1990s | Central Electrical Generating Board of England (known as PRI) | Nedco and Union Pacific properties were consolidated into the Teton Leuenberger Project. PRI purchased the property and added to the acreage through the purchase of adjacent claim blocks owned by Kerr-McGee. | N/A | Ownership transition and growth in acreage through acquisitions. |
Late 1990s | PRI | Leuenberger properties were released due to declining market trends. Some claims reverted to previous owners. | N/A | Decrease in claims and generally the Ludeman Project Area. |
Early to Mid- 2000s | High Plains Uranium (“HPU”) and EMC | HPU held most claims and leases in the Ludeman Project Area. Energy Metals held the remaining claims in the Ludeman Project Area. | N/A | Claims and leases increased in the Ludeman Project Area. |
2007 | EMC | EMC acquired HPU. | N/A | Consolidation through acquisition. |
2007 | Uranium One | Uranium One acquired Energy Metals in late 2007 and continued exploration of the Ludeman Project Area from 2007 through 2012. The primary goals of drilling included exploration to establish continuity of regional ore trends, development drilling to determine the lateral extents of the ore body, stratigraphic investigation, confirmation of the location and nature of mineralization, and collection of cores for leach testing and analysis of uranium, mineralogy, trace metals, disequilibrium, permeability, porosity and density. Acquired the WDEQ/LQD mine permit and NRC license. | Approximately 2,180 | Continued exploration of the Ludeman Project Area. Additional holes included boreholes, core holes, and monitor wells. |
2021 | UEC | The Ludeman Project Area acquired by UEC from Uranium One. | N/A | Ownership transition. |
Classification | Tons Ore (000’s) | Tonnes Ore (1000’s) | Average Grade (% eU3O8) | Pounds eU3O8 (000’s) |
| Measured | 2,674 | 2,426 | 0.094 | 5,016.9 |
| Indicated | 2,660 | 2,413 | 0.088 | 4,696.9 |
Total M&I | 5,334 | 4,839 | 0.091 | 9,713.8 |
| Inferred | 866 | 786 | 0.073 | 1,258.0 |
Total Resources | 6,200 | 5,625 | 0.088 | 10,971.8 |
| 1. | The sum of measured and indicated tons and lbs. may not add up to the reported total due to rounding. | |
| 2. | Measured and indicated mineral resources as defined in 17 CFR § 229.1300. | |
| 3. | GT Cutoff = 0.25 ft% eU3O8. | |
| 4. | All reported resources occur below the static water table. | |
| 5. | The point of reference for mineral resources is in-situ at the Project. | |
| 6. | Mineral resources that are not mineral reserves do not have demonstrated economic viability. | |
| 7. | A long-term uranium price of $40/lb U3O8 and an 80% metallurgical recovery factor were considered for the purposes of determining the reasonable prospect of economic extraction. |
Year | Company | Operations/Activity | Amount (No. of Drill holes) | Results of Work |
1967 | Kerr-McGee, Homestake, Teton | Early uranium exploration was completed by the three companies in the Allemand-Ross Project Area. Exploration was typically for shallower mineralization (<1,000 ft). | Approximately 100 | Exploration of shallow mineralization (<1,000 ft). |
1971 | Conoco | Conoco staked lode mining claims in 1969. In 1970, Conoco entered an agreement with National Resources Corporation to earn in on the Allemand-Ranch land holdings. National Resources Corporation’s interests were acquired by Pioneer Nuclear in 1972 and the joint venture partnership was maintained until 1975. In 1979, Conoco continued to operate the drilling program. Conoco closed its mineral department in 1984. | Approximately 1,180 | A significant amount of the mineralization within the Allemand-Ross Project Area was delineated. |
1984 | Power Reactor and Nuclear Fuel Development Corporation (“PNC”) | PNC assumed control of the Allemand-Ross Project Area and continued exploration. | Approximately 50 | Additional exploration completed by PNC. |
Early 1990s | PNC | Mineral rights were allowed to lapse due to further declining uranium market conditions. | N/A | Lost mineral rights. |
Early 2000s-2005 | HPU and EMC | Claims and leases were acquired during the uranium market upswing. HPU held most claims and leases and EMC holding the remainder of the Allemand-Ross Project Area. | N/A | Mineral rights were acquired. |
2007 | EMC | EMC acquired HPU. The properties were consolidated. | N/A | Properties consolidated. |
2007 | Uranium One | Uranium One acquired EMC. Uranium One proceeded to conduct verification and resource enhancement drilling. Most drilling was completed between 2008 and 2010. | Approximately 300 | Additional exploration completed within the Allemand-Ross Project Area with average depths ranging from 1,118 ft to 1,546 ft. |
2021 | UEC | The Allemand-Ross Project Area acquired by UEC from Uranium One. | N/A | Ownership transition. |
Classification | Tons Ore (000’s) | Tonnes Ore (1000’s) | Average Grade (% eU3O8) | Pounds eU3O8 (000’s) |
| Measured | 246 | 223 | 0.085 | 417.0 |
| Indicated | 32 | 29 | 0.066 | 42.4 |
Total M&I | 278 | 252 | 0.083 | 459.4 |
| Inferred | 1,275 | 1,157 | 0.098 | 2,496.0 |
Total Resources | 1,553 | 1,409 | 0.095 | 2,955.4 |
| 1. | The sum of resource tons and lbs. may not add up to the reported total due to rounding. | |
| 2. | Measured and indicated mineral resources as defined in 17 CFR § 229.1300. | |
| 3. | GT Cutoff = 0.25 ft% eU3O8. | |
| 4. | All reported resources occur below the static water table. | |
| 5. | The point of reference for mineral resources is in-situ at the Project. | |
| 6. | Mineral resources that are not mineral reserves do not have demonstrated economic viability. | |
| 7. | A long-term uranium price of $40/lb U3O8 and an 80% metallurgical recovery factor were considered for the purposes of determining the reasonable prospect of economic extraction. |
Year | Company | Operations/Activity | Amount (No. of Drill holes) | Results of Work |
1969 | Mono and RME | Under a joint venture, Mono and RME conducted the initial exploration program through drilling. Upon successful exploration, the Bear Creek Uranium Company was formed under general partnership between Mono and RME. | Unspecified and included in the total estimate. | Successful exploration led to joint venture and mill construction. |
1975-1982 | Bear Creek Uranium Company | A mill was constructed in 1975. Open pit mining operations began in 1977 until 1982. Mining claims were dropped after 1982. | Approximately 6,880 | 4.7 million tons of material from open pit mining processed at the Bear Creek mill. |
2006 | EMC | EMC located the unpatented mining claims and acquired the state mineral leases. | N/A | Lapsed mineral leases acquired. |
2007 | Uranium One | Uranium One acquired EMC and all rights to the Barge Project Area. | None as of 2019. | No exploration had been completed. |
2021 | UEC | Barge Project Area acquired by UEC from Uranium One. | N/A | Ownership. |
Classification | Tons Ore (000’s) | Tonnes Ore (1000’s) | Average Grade (% eU3O8) | Pounds eU3O8 (000’s) |
| Measured | - | - | - | - |
| Indicated | 4,301 | 3,902 | 0.051 | 4,361.0 |
Total M&I | 4,301 | 3,902 | 0.051 | 4,361.0 |
| Inferred | - | - | - | - |
Total Resources | 4,301 | 3,902 | 0.051 | 4,361.0 |
| 1. | The sum of measured and indicated tons and lbs. may not add up to the reported total due to rounding. | |
| 2. | Measured and indicated mineral resources as defined in 17 CFR § 229.1300. | |
| 3. | GT Cutoff = 0.25 ft% eU3O8. | |
| 4. | All reported resources occur below the static water table. | |
| 5. | The point of reference for mineral resources is in-situ at the Project. | |
| 6. | Mineral resources that are not mineral reserves do not have demonstrated economic viability. | |
| 7. | A long-term uranium price of $40/lb U3O8 and an 80% metallurgical recovery factor were considered for the purposes of determining the reasonable prospect of economic extraction. |
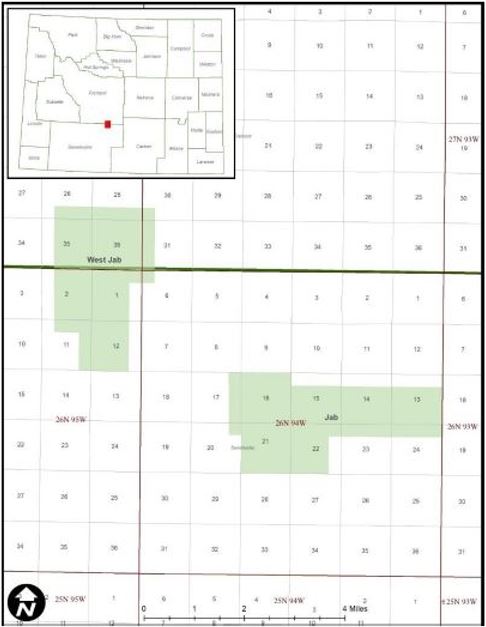
Year | Company | Operations/Activity | Amount (No. of Drill holes) | Results of Work |
Jab | ||||
Unspecified | Silverbell Industries | Originator of the Jab/West Jab Project Area. | Not specified. | The Jab/West Jab Project Area initially developed. |
1972 | Union Carbide Corporation (“UCC”) | Delineated an area of shallow oxidized mineralization and completed feasibility studies for open pit mining. The plan was not executed, and a mining permit was prepared for the WDEQ/LQD. The permit was withdrawn due to the declining uranium market in 1982. | Approximately 1,830 | Delineation of shallow oxidized material. |
1985-2000 | Yellowstone Fuels | Property held until a decline in the uranium market in 2000. No data developed by Yellowstone Fuels were available for evaluation. | No data available. | The Jab/West Jab Project Area held but not substantially developed. |
West Jab | ||||
Unspecified | AMAX Petroleum Company | Originator of the Jab/West Jab Project Area. | Not specified. | The Jab/West Jab Project Area initially developed. |
1975-1983 | WNC | WNC drilled the Jab/West Jab Project Area until 1983 when uranium markets had dropped. WNC terminated claim. AMAX Petroleum Company regained control until the claims were dropped. | Approximately 1,020 | Exploration completed by WNC. |
Jab/West Jab | ||||
2006 | EMC | Identified the unpatented mining claims and acquired the state mineral leases. | N/A | Secured right to mine. |
2007 | Uranium One | Uranium One acquired EMC and all rights to the Jab/West Jab Project Area. | None as of 2019 | No exploration had been completed. Right to mine secured. |
2021 | UEC | The Jab/West Jab Project Area acquired by UEC from Uranium One. | N/A | Ownership transition. |
Classification | Tons Ore (000’s) | Tonnes Ore (1000’s) | Average Grade (% eU3O8) | Pounds eU3O8 (000’s) |
| Measured | 1,621 | 1,471 | 0.072 | 2,335.0 |
| Indicated | 253 | 230 | 0.077 | 392.0 |
Total M&I | 1,874 | 1,701 | 0.073 | 2,727.0 |
| Inferred | 1,402 | 1,272 | 0.06 | 1,677.0 |
Total Resources | 3,276 | 2,973 | 0.067 | 4,404.0 |
| 1. | The sum of resource tons and lbs. may not add up to the reported total due to rounding. | |
| 2. | Measured, indicated, and inferred mineral resources as defined in 17 CFR § 229.1300. | |
| 3. | GT Cutoff = 0.25 ft% eU3O8. | |
| 4. | Measured and indicated resources occur below the static water table. The inferred resources at Jab/West Jab occur above the water table and may not be amenable to ISR. | |
| 5. | The point of reference for mineral resources is in-situ at the Project. | |
| 6. | Mineral resources that are not mineral reserves do not have demonstrated economic viability. | |
| 7. | A long-term uranium price of $40/lb U3O8 and an 80% metallurgical recovery factor were considered for the purposes of determining the reasonable prospect of economic extraction. |
Year | Company | Operations/Activity | Amount (No. of Drill holes) | Results of Work |
1966 | Preston Oil Co. (“Preston Oil”) | Awarded the state lease for 720 acres. | None. | Right to mine secured. |
1966 | Inexco Oil Company (“Inexco”) | Inexco assigned lease from Preston Oil in 1966 and conducted exploration drilling program in 1969 and 1970. | 215 | Delineation of mineralized areas. |
1974 | Uranerz USA | Inexco formed a joint venture with Uranerz USA who became the operator. Over the next two years, Uranerz expanded the drilling program, including core drilling. | 715 | Delineation of mineralized areas. |
Not specified | Cotter Corporation (“Cotter”) | Cotter acquired the property and evaluated both conventional open pit and in situ mining methods. Cotter obtained a surface mining permit in 1979. A 200-foot-deep test pit was excavated in 1981 in a small mineralization area. The pit was subsequently reclaimed, but the state mining permit remains active. | Not specified | Falling uranium prices in the 1980’s halted further development. |
1994 | Cotter and PRI | PRI entered a joint venture agreement with Cotter and completed a feasibility study for development as an ISR mine (PRI, 1995). Completed additional drilling in 1994. | Not specified | The feasibility study was positive; however, the Charlie Project Area did not proceed, and the joint venture agreement expired. |
2014 | Cotter | In 2014 Cotter sought to convert the permit to ISR mining; however, that process has not been completed. | None | Unknown. |
2018 | Anfield Energy Inc. (“Anfield”) | Anfield acquired the Charlie Project Area from Cotter. | None | Oversaw technical reporting and auditing of Charlie Project Area resources. |
2021 | UEC | UEC acquired the Charlie Project Area from Anfield. | N/A | Ownership transition. |
Classification | Tons Ore (000’s) | Tonnes Ore (1000’s) | Average Grade (% eU3O8) | Pounds eU3O8 (000’s) |
| Measured | - | - | - | - |
| Indicated | 1,255 | 1,139 | 0.123 | 3,100.0 |
Total M&I | 1,255 | 1,139 | 0.123 | 3,100.0 |
| Inferred | 411 | 373 | 0.120 | 988.0 |
Total Resources | 1,666 | 1,512 | 0.123 | 4,088.0 |
| 1. | The sum of resource tons and lbs. may not add up to the reported total due to rounding. | |
| 2. | Measured, indicated, and inferred mineral resources as defined in 17 CFR § 229.1300. | |
| 3. | GT Cutoff = 0.20 ft% eU3O8. | |
| 4. | All reported resources occur below the static water table. | |
| 5. | The point of reference for mineral resources is in-situ at the Project. | |
| 6. | Mineral resources that are not mineral reserves do not have demonstrated economic viability. | |
| 7. | A long-term uranium price of $40/lb U3O8 and an 80% metallurgical recovery factor were considered for the purposes of determining the reasonable prospect of economic extraction. |
Year | Company | Operations/Activity | Amount (No. of Drill holes) | Results of Work |
Early 1950s | Independent operator | An internal report from 1969 states a Mr. Vickers reportedly discovered surficial mineralization and mined approximately 100 tons U3O8 at an average grade of 0.30%. Uranium was shipped to the AEC buying station at Edgemont, South Dakota. | None | Exploration and production of 100 tons U3O8. |
1972 | RME | RME acquired interest in the project in 1972 and conducted extensive drilling through 1978. Pilot scale ISR mining was conducted using four seven-spot patterns with a 50-foot radius. The first 3 patterns used sulfuric acid as the primary lixiviant and the fourth sodium carbonate-bicarbonate as the primary lixiviant. The U.S. Bureau of Mines assisted RME in conducting the pilot testing and documented the results in a publication titled “Case History of a Pilot-Scale Acidic In Situ Uranium Leaching Experiment” (Nigbor, N. T., et al, 1982). RME controlled the project until the late 1980s when the mineral interests were dropped due to declining uranium prices. | Approximately 1,100 | Exploration and pilot scale ISR mining. |
2005 and 2006 | EMC | EMC located unpatented mining lode claims and secured mineral leases and surface agreements within the area formerly held by RME. EMC conducted exploratory drilling and compiled previous data and maps for the project. | Approximately 45 | Secured right to mine. |
2008 | Uranium One | EMC was acquired by Uranium One. | None | Ownership transition. |
2016 | Anfield | Anfield purchased Nine Mile Lake Project from Uranium One. | None | Oversaw technical reporting and auditing of project resources. |
2022 | UEC | UEC acquired the Nine Mile Lake Project from Anfield. | N/A | Ownership transition. |
Classification | Tons Ore (000’s) | Tonnes Ore (1000’s) | Average Grade (% eU3O8) | Pounds eU3O8 (000’s) |
| Measured | - | - | - | - |
| Indicated | - | - | - | - |
Total M&I | - | - | - | - |
| Inferred | 3,405 | 3,089 | 0.036 | 4,308.0 |
Total Resources | 3,405 | 3,089 | 0.036 | 4,308.0 |
| 1. | The sum of resource tons and lbs. may not add up to the reported total due to rounding. | |
| 2. | Measured, indicated, and inferred mineral resources as defined in 17 CFR § 229.1300. | |
| 3. | GT Cutoff = 0.25 ft% eU3O8. | |
| 4. | All reported resources occur below the static water table. | |
| 5. | The point of reference for mineral resources is in-situ at the Project. | |
| 6. | Mineral resources that are not mineral reserves do not have demonstrated economic viability. | |
| 7. | A long-term uranium price of $40/lb U3O8 and an 80% metallurgical recovery factor were considered for the purposes of determining the reasonable prospect of economic extraction. |
The unprecedented earthquake and tsunami that struck Japan’s Fukushima nuclear reactors in March 2011 have had a major impactpart on the nuclear industry, withTRS titled “S-K 1300 Mineral Resource Report Wyoming Assets ISR Hub and Spoke Project, WY USA”, dated March 31, 2022, as prepared by WWC, a qualified firm (the “QP” herein). The Red Rim Project Area does not have mineral reserves and is therefore considered an Exploration Stage property under S-K 1300 definitions.

Despite all of this, there are signs of improvement as evidenced byearly 1950s. The Schoekingerite deposits were exposed at the many uranium stocks that have started recovering from their post-Fukushima lows. Positive news have come out of China, India, South Koreasurface along the Lost Creek drainage and Russia announcing their planswere located using radiometric surveys. The USGS used shallow exploration to move forward with ambitious domestic nuclear plans after a safety review of their nuclear plants. According to Ux Consulting (UxC), a uranium market information source, existing mine production plus new planned and potential mine production is estimated to increase primary uranium supply from 139.8 million pounds in 2011 to 185.9 million pounds in 2020, while secondary sources of supply is estimated to fall from 45.5 million pounds to 16.6 million pounds annually duringfurther evaluate the same period. UxC has estimated in its “Uranium Market Outlook - Q3 2012” that uranium demand will grow from 179.5 million pounds in 2011 to 219.4 million pounds in 2020.
3
Rising global demand for electricity is an important driver for the projected long term upswing in uranium demand. According to the International Energy Outlook 2011 reference case forecast, world net electricity consumption is expected to increase by 87% by 2035. Total demand for electricity is projected to increase on average by 2.4% per year from 17.2 trillion kilowatt hours in 2009 to 31.7 trillion kilowatt hours in 2035. According to the World Nuclear Association, there are 65 reactors under construction globally (including 26 in China, ten in Russia and seven in India). Several of the Arab states are starting the transition away from fossil fuels towards nuclear, with Saudi Arabia planning to build up to 16 reactors and the United Arab Emirates with contracts for four reactors.
The price for uranium will be driven by supply and demand fundamentals and there is potential for further increasesdeposits. As in the price based upon currentPRB, drilling for deeper deposits began in the 1960s and expected imbalanceexploration since that time has primarily consisted of supplydrilling.
Year | Company | Operations/Activity | Amount (No. of Drill holes) | Results of Work |
1970 | Kerr McGee Corp. and UCC | Both companies located claims in the vicinity and conducted exploration and drilling programs. The claims were dropped by 1973. | Not specified. | Exploration is reported to have encountered alteration and mineralization at depth. |
1974 | Timberline Minerals and Wold | Both companies located claims in the vicinity. | None. | Secured federal mining claims. |
1976 | UCC | UCC leased the Timberline Minerals property and entered a joint venture agreement with RME, a subsidiary of the Union Pacific Railroad, for the alternate sections of railroad grant lands in the area. UCC relinquished their mineral interests at Red Rim in 1986 and the mining claims reverted to Timberline Minerals, which subsequently dropped the claims. | 138 | Conducted an exploration and drilling program. Of the 138 drill holes on the current Red Rim Project Area, 42 are barren or contain trace mineralization and the remaining 96 are mineralized. |
2004 | EMC | Located 49 unpatented mining lode claims that comprise the current Red Rim Project Area. | None. | Secured federal mining claims. |
2007 | Uranium One | Uranium One Inc. acquired EMC. Through subsequent transactions, Uranium One Inc. became Uranium One Americas, Inc. | None. | Ownership transition. |
2016 | Anfield | Anfield purchased Red Rim Project from Uranium One. | None. | Oversaw technical reporting and auditing of project resources. |
2022 | UEC | UEC acquired the Red Rim project from Anfield. | N/A | Ownership transition. |
In-Situ Recovery Mining
We utilize in-situ (“ISR”) recovery uranium mining for our Palangana Mine and will continue to utilize ISR mining whenever such alternative is available to conventional mining. When compared to conventional mining, ISR mining requires lower capital expenditures and has a reduced impactUnderground Development
ISRWDEQ LQD Drilling Notification. There are no materially significant encumbrances on the Red Rim Project. Standard encumbrances include reclamation bonding for drilling, mining involves circulating oxidized water through an underground uranium deposit, dissolving the uranium and then pumping the uranium-rich solution to the surface for processing. Leaching solution enters the formation through a series of injection wellslease royalties.
Deposit
Each project is divided into a mining unit known as a Production Area Authorization (“PAA”) which lies inside an approved Mine Permit Boundary. Each PAA will be developed, extracted and restored as one unit and have its own set of monitor wells. It is common to have multiple PAAs in extraction at any one time with additional units in various states of exploration, pre-extraction and/or restoration.
After mining is complete in a PAA, aquifer restoration will begin as soon as practicable and will continue until the groundwater is restored to pre-mining conditions. Once restoration is complete, a stability period of no less than one year is scheduled with quarterly baseline and monitor well sampling. Wellfield reclamation will follow after aquifer restoration is complete and the stability period has passed.
4
Hobson Processing Facility
Hobson is located about 100 miles northwest of Corpus Christi in Karnes County, Texas. Hobson was originally licensed and constructed in 1978, serving as the hub for several satellite mining projects until 1996, and was subsequently completely refurbished in 2008.
With a physical capacity of two million pounds of U3O8 annually and a license to process up to one million pounds annually, Hobson is a central processing site designed to process uranium-loaded resins from the Palangana Mine and has the additional capacity to process uranium-loaded resins from other satellite mining activities within the South Texas Uranium Belt as they enter uranium extraction. The Company utilizes a “hub-and-spoke” strategy in South Texas whereby Hobson acts as its central uranium processing site (the “hub”) for the Palangana Mine and for future satellite ISR mines, such as the Goliad Project, (the “spokes”) located within the South Texas Uranium Belt.
Palangana Mine
PalanganaWB portion of the GGRB. Together, the GDB and WB compromise the eastern portion of the GGRB. Mineralization at the Red Rim project area occurs in the Fort Union Formation.
In November 2010, Palangana commenced uranium extraction using ISR mining. In January 2011, Hobson began processing resins received from Palangana. During Fiscal 2012, the Palangana Mine yielded 183,000 pounds of uranium concentrates. Since the commencement of uranium extraction in November 2010 to July 31, 2012, the Hobson Facility has processed 323,000 pounds of uranium concentrates.
Material Relationships Including Long-Term Delivery Contracts
The Company entered into a multi-year uranium sales contract in June 2011,Red Rim Project as amended in January 2012, requiring the delivery of a total 320,000 pounds of U3O8 by the Company over a three-year period starting in August 2011. The sales price will be based on published market price indicators at the timedate of delivery. This contract representsthis Annual Report
Classification | Tons Ore (000’s) | Tonnes Ore (1000’s) | Average Grade (% eU3O8) | Pounds eU3O8 (000’s) |
| Measured | - | - | - | - |
| Indicated | 337 | 306 | 0.170 | 1,142.0 |
Total M&I | 337 | 306 | 0.170 | 1,142.0 |
| Inferred | 473 | 429 | 0.163 | 1,539.0 |
Total Resources | 810 | 735 | 0.165 | 2,681.0 |
| 1. | The sum of resource tons and lbs. may not add up to the reported total due to rounding. | |
| 2. | Measured, indicated, and inferred mineral resources as defined in 17 CFR § 229.1300. | |
| 3. | GT Cutoff = 0.25 ft% eU3O8. | |
| 4. | All reported resources occur below the static water table. | |
| 5. | The point of reference for mineral resources is in-situ at the Project. | |
| 6. | Mineral resources that are not mineral reserves do not have demonstrated economic viability. | |
| 7. | A long-term uranium price of $40/lb U3O8 and an 80% metallurgical recovery factor were considered for the purposes of determining the reasonable prospect of economic extraction. |
During Fiscal 2012, the Company sold 270,000 pounds of U3O8 at an average price of $51 per pound, of which 120,000 pounds of U3O8 were sold under this contract fulfilling its first-year delivery obligations, with the remaining 150,000 pounds soldClarkson Hill Project area (the “Clarkson Hill Project Area”) is based in part on the spot market.
Given that there are up to approximately 60 different companiesTRS titled “S-K 1300 Mineral Resource Report Wyoming Assets ISR Hub and Spoke Project, WY USA”, dated March 31, 2022, as potential buyers in the uranium market, the Companyprepared by WWC, a qualified firm (the “QP” herein). The Clarkson Hill Project Area does not have mineral reserves and is not substantially dependent upon any single customer in the uranium market to purchase the uranium extracted by the Company.
Seasonality
The timingtherefore considered an Exploration Stage property under S-K 1300 definitions.
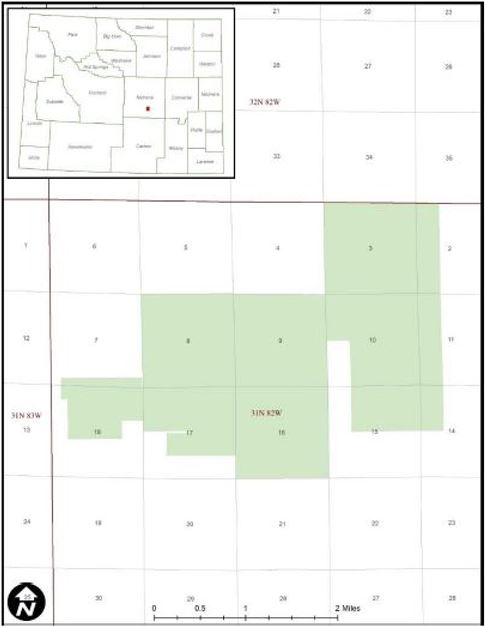
Goliad Project
The GoliadClarkson Hill Project is located in GoliadNatrona County, Texas approximately 95Wyoming, about 20 air miles northsouthwest of Corpus ChristiCasper, Wyoming, at latitude 42.6593 and 55 miles east of Hobson.longitude -106.7006 in decimal degrees. The Company anticipates that any uranium identified at Goliad will be extracted using ISR mining and processed at Hobson.
Salvo Project
The Salvo Projectproperty is located in Beeon portions of sections 7, 17, and 18 of T31N R82W. Land ownership consists of federal lands administered by the BLM, state lands and private lands. The Clarkson Hill Project Area is accessible from either Highway 220 or from the Oregon Trail Road, a Natrona County Texasimproved gravel road. From Highway 220, the site is approximately 60four miles northwest of Corpus Christithe junction of the highway with Natrona County Road 318. From the Oregon Trail Road, the site is approximately three miles to the southeast. Site access from either route will require an arrangement with intervening private landowners for ingress/egress. The communities of Alcova and 45Bessemer Bend are located 10 and 13 miles southeastaway, respectively, and have limited services. The east-west BNSF railway in Casper is approximately 25 miles northeast of Hobson. Itthe Clarkson Hill Project Area.
Burke Hollow Project
During Fiscal 2012,“small amounts of ore were mined and shipped for treatment from the Company entered into a mining lease and surface use agreement granting the Company the exclusive right to explore, develop and mine for uranium on the Burke Hollow Project, a 17,510-acre propertyold pit area located in Bee County, Texas. Total consideration paid by the Company was $1,313,250 in cash.
Channen Project
During Fiscal 2012, the Company entered into a lease option agreement granting the Company the exclusive right to explore for uraniumSection 17, T31N, R82W” (Ljung et al, March 1974). However, USGS and enter into a mining lease and surface use agreement on the Channen Project, a 10,704-acre property located in Goliad County, Texas. The lease option agreement is subject to minimum exploration expenditures totaling $1.75 million over a two-year period ending December 31, 2013. Total consideration paid by the Company was $428,164 in cash.
5
Anderson Project
Pursuant to a Merger Agreement and Plan of Merger dated May 5, 2011 and effective September 9, 2011 (the “Merger Agreement”), the Company merged with Concentric Energy Corp. (“Concentric”) resulting in the acquisition of an undivided 100% interest in the 9,852-acre Anderson Project located in Yavapai County, Arizona. In accordance with the Merger Agreement, Concentric’s shareholders received 0.1075 of one share of the Company’s common stock for every one share of Concentric common stock, resulting in the issuance of 1,253,440 shares of the Company to the former Concentric shareholders. In addition, holders of Concentric share purchase warrants received 0.1075 of one share purchase warrant of the Company for every one Concentric share purchase warrant, resulting in the issuance of share purchase warrants representing 375,834 shares of the Company exercisable at prices ranging from $9.30 to $65.12 per share to the former holders of Concentric share purchase warrants.
Pursuant to an Acquisition Agreement dated April 11, 2011, as amended on June 24, 2011, and effective September 9, 2011 (the “Acquisition Agreement”) concurrently with the Merger Agreement, the Company was assigned all of Global Uranium Corp.’s (“Global”) rights and interests under the terms and conditions of an Option and Joint Venture Agreement dated April 13, 2010 between Concentric and Global with respect to the Anderson Project. In accordance with the Acquisition Agreement, the Company provided an initial cash payment of $150,000, a further cash payment of $200,000 representing repayment in full of a secured loan between Global and Concentric, and a final cash payment of $150,000 and the issuance of 350,000 restricted shares of the Company.
At July 31, 2012, capitalized costs for the Anderson Project totaled $9,154,268.
Workman Creek Project
Pursuant to a Property Acquisition Agreement dated November 7, 2011, as amended on November 25, 2011, and effective November 30, 2011, the Company acquired from Cooper Minerals, Inc. an undivided 100% interest in the 4,192-acre Workman Creek Project located in Gila County, Arizona. The Workman Creek Project is subject to a 3.0% net smelter revenue royalty requiring an annual advance royalty payment of $100,000. The Company has an exclusive right and option to acquire one-half (1.5%) of the net smelter revenue royalty for $1,000,000 at any time until January 21, 2024. Additionally, certain individuals hold an option to acquire a 0.5% net smelter revenue royalty exercisable by paying the Company the sum of $333,340 at any time until January 21, 2024. At July 31, 2012, capitalized costs for the Workman Creek Project totaled $1,187,158.
Slick Rock Project
Pursuant to a Uranium Mining Lease dated May 23, 2012, the Company acquired from URenergy, LLC a mining lease for uranium on the Slick Rock Project located in San Miguel and Montrose Counties, Colorado. The Slick Rock Project is subject to a 3.0% production royalty requiring an annual advance royalty payment of $30,000 beginning on November 30, 2017. As consideration for this acquisition, the Company paid $100,000 in cash.
Coronel Oviedo Project
Pursuant to a Share Exchange Agreement dated May 11, 2011 and effective May 24, 2011, the Company acquired a 100% interest in Piedra Rica Mining S.A., a private Paraguayan company, which holds an undivided 100% interest in two prospecting permits in the area of Coronel Oviedo, Paraguay (the “Coronel Oviedo Project”), subject to a 1.5% gross overriding royalty. The Company has an exclusive right and option at any time to acquire one-half percent (0.5%) of the gross overriding royalty for $500,000. The Company also has a right of first refusal to acquire all or any portion of the remaining one percent (1.0%) royalty interest. As consideration for this acquisition, the Company issued 225,000 shares.
6
Pursuant to a Property Acquisition Agreement dated October 14, 2011, as amended on February 28, 2012 and March 31, 2012, between the Company and three private Paraguayan companies (the “Property Acquisition Agreement”), the Company acquired a 100% interest in a further two prospecting permits in the area of Coronel Oviedo, Paraguay, adjacent to the Coronel Oviedo Project, subject to a 1.5% gross overriding royalty. The Company has an exclusive right and option at any time to acquire one-half percent (0.5%) of the gross overriding royalty for $166,667. The Company also has a right of first refusal to acquire all or any portion of the remaining one percent (1.0%) royalty interest. As consideration for this acquisition, the Company made a cash payment of $7,500 and issued 100,000 shares.
At July 31, 2012, capitalized costs for the Coronel Oviedo Project totaled $1,133,412.
Yuty Project, Paraguay
Pursuant to an Arrangement Agreement dated January 20, 2012 and effective March 30, 2012 (the “Arrangement Agreement”), the Company acquired all of the outstanding common shares of Cue Resources Ltd. (“Cue”) by way of a plan of arrangement, resulting in the acquisition of an undivided 100% interest in the 230,650-hectare Yuty Project located in southeastern Paraguay. In accordance with the Arrangement Agreement, Cue’s shareholders received 0.0195 of one share of the Company’s common stock for every one share of Cue common stock, resulting in the issuance of 2,345,926 shares of the Company to the former Cue shareholders in exchange for 120,304,067 shares of Cue. Holders of Cue share purchase warrants, stock options and broker options received equivalent securities of the Company at the 0.0195 ratio in exchange for their Cue securities, resulting in the issuance of share purchase warrants, stock options and broker options to purchase an aggregate 987,967 shares of the Company exercisable at prices ranging from $3.59 to $23.08 per share. At July 31, 2012, capitalized costs for the Yuty Project totaled $11,947,144.
Pursuant to a Settlement and Release Agreement dated and effective August 7, 2012 (the “Settlement Agreement”), the Company renegotiated certain acquisition and royalty agreement terms previously agreed to between Cue and the original property vendors of the Yuty Project. The Settlement Agreement confirms an overriding royalty payable to the property vendors of $0.21 for each pound of uranium produced from the Yuty Project, and supersedes all prior agreements entered into between Cue and the property vendors. As consideration for the Settlement Agreement, the Company paid $50,000 in cash and issued 75,000 restricted common shares in the capital of the Company.
Mineral Rights
In Texas, our mineral rights are held exclusively through private leases from the owners of the land/mineral/surface rights with varying terms. In general, these leases provide for uranium and certain other specified mineral rights only including surface access rights for an initial term of five years and renewal for a second five-year term. Production royalties apply which are calculated on a sliding-scale basis tied to the gross sales price of uranium. Remediation of the property is required in accordance with regulatory standards, which may include the posting of reclamation bonds.
In Arizona, Colorado, New Mexico and Wyoming, our mineral rights are held either exclusively or through a combination of federal mining claims and state and private mineral leases. Remediation of the property is required in accordance with regulatory standards, which may include the posting of reclamation bonds. Our federal mining claims consist of both unpatented lode and placer mining claims registered with the U.S. Bureau of Land Management ("BLM")Mines databases list the Clarkson Hill Project Area claims as a surface mine prospect with no reported production. The surface disturbance, based on site observation by the QP of the TRS, is shallow (less than 20 feet in depth) and limited in aerial extent. Surface disturbance is limited and there is no known infrastructure, tailings or mine waste apparent at the site. Drill data utilized in the estimation of mineral resources at the Clarkson Hill Project Area Claims in the TRS reflect a deeper horizon and is not affected by the presence of “old pit”. Surface disturbance from past exploration and/or limited mining activities at the site are readily apparent from current aerial views and on the ground.
Year | Company | Operations/Activity | Amount (No. of Drill holes) | Results of Work |
1959 | Utah Construction and Mining | Conducted uranium exploration drilling. | Not specified. | Unknown. |
1968 | Minerals Exploration Company (“MEC”) and Nuclear Reserves Inc. | MEC performed exploratory drilling between 1968 and 1981. In 1969, MEC and Nuclear Reserves Inc. entered into a joint venture. MEC held the Clarkson Hill Project Area through the mid-1980s, when they dropped the claims due to declining uranium prices. | 250 | Delineation of mineralized areas. Falling uranium prices in the 1980’s halted further development. |
Unknown | EMC | EMC performed initial staking of 14 claims and compiled relevant data for the Clarkson Hill Project Area. EMC optioned the Clarkson Hill Project Area to Artha Resources, who conducted limited verification drilling during 2008. The Clarkson Hill Project Area reverted from Artha to EMC. | 5 | Unknown. |
2008 | Uranium One | EMC was acquired by Uranium One Inc. Through subsequent transactions Uranium One Inc. became Uranium One Americas Inc. | None. | Ownership transition. |
2016 | Anfield Resources, Inc. (now Anfield Energy, Inc.) | Anfield purchased the Clarkson Hill Project Area from Uranium One. | None. | Oversaw technical reporting and auditing of the Clarkson Hill Project Area resources. |
2022 | UEC | UEC acquire the Clarkson Hill Project Area from Anfield. | N/A | Ownership transition. |
Classification | Tons Ore (000’s) | Tonnes Ore (1000’s) | Average Grade (% eU3O8) | Pounds eU3O8 (000’s) |
| Measured | - | - | - | - |
| Indicated | - | - | - | - |
Total M&I | - | - | - | - |
| Inferred | 957 | 868 | 0.058 | 1,113.0 |
Total Resources | 957 | 868 | 0.058 | 1,113.0 |
| 1. | The sum of resource tons and lbs. may not add up to the reported total due to rounding. | |
| 2. | Measured, indicated, and inferred mineral resources as defined in 17 CFR § 229.1300. | |
| 3. | GT Cutoff = 0.25 ft% eU3O8. | |
| 4. | All reported resources occur below the static water table. | |
| 5. | The point of reference for mineral resources is in-situ at the Project. | |
| 6. | Mineral resources that are not mineral reserves do not have demonstrated economic viability. | |
| 7. | A long-term uranium price of $40/lb U3O8 and an 80% metallurgical recovery factor were considered for the purposes of determining the reasonable prospect of economic extraction. |

7
Under(v) the mining laws ofSalvo Project. Production from existing wellfields at the Republic of Paraguay, title to mineral rights is held through a “Mineral Concession Contract” approved by the National Congress and signed between the Government of the Republic of ParaguayPalangana Project ceased in 2016 and the Company. These mineral rights provideproject was put in care and maintenance mode. In order for Palangana to engage in future uranium production, the exploration of metallicCompany will need to incur capital expenditures to restart idled wellfields.
Environmental Regulation
Our activities will be subject to existing federal, state and local laws and regulations governing environmental quality and pollution control. Our operations will be subject to stringent environmental regulation by state and federal authorities including the Railroad Commission of Texas (“RCT”),mine. The Salvo Project still requires all mining permits. Regulatory agencies include the Texas Commission on Environmental Quality (“TCEQ”), the Railroad Commission of Texas (“RRC”) and the Environmental Protection Agency ("EPA"(“EPA”).
| ● | the TCEQ will require UEC to apply for and obtain a radioactive material license pursuant to Title 30 Texas Administrative Code Chapters 305 and 336. The application must address a number of matters including, but not limited to, site characteristics (ecology, geology, topography, hydrology, meteorology, historical and cultural landmarks and archaeology), radiological and non-radiological impacts, environmental effects of accidents, decommissioning, decontamination and reclamation; |
| ● | to produce uranium from subsurface deposits, an operator must obtain an area permit and production area authorization (PAA) pursuant to the Texas Water Code, Chapter 27. Underground injection activities cannot commence until the TCEQ has issued an area permit and PAA to authorize such activities. In addition, all portions of the proposed production zone in groundwater with a total dissolved solids concentration less than 10,000 mg/L, which will be affected by mining solutions, are included within an aquifer exemption approved by TCEQ and the EPA. The PAA application may be developed concurrently with or after the area permit application. As additional production areas are proposed to be activated within the area permit, additional PAA applications must be submitted to the TCEQ for processing and issuance before injecting within the production area; |
| ● | in 1975, the Texas Legislature gave the RRC jurisdiction to regulate surface mining for coal and uranium. No surface mining for uranium is currently conducted at the Project, but uranium exploration for ISR operations is administered by the Surface Mining and Reclamation Division of the RRC. Active uranium exploration sites are inspected monthly (RRC, 2023). The RRC requires exploration permits for any uranium exploration in the state; |
| ● | Texas state law does not provide any agency with the authority to regulate the use or production of groundwater unless the location lies within a water conservation district (WCD). Burke Hollow and Salvo are both located in the Bee County WCD, Goliad is located in the Goliad County WCD and Palangana resides in the Duval County WCD. Prior to initiating uranium recovery at the Project, UEC will need to acquire industrial permits to withdraw groundwater from the host sandstones. Please refer to the TRS report for the Texas Hub and Spoke Project for further details.; and |
| ● | Class I and III injection wells are also regulated by the TCEQ. Therefore, UEC will need to acquire the appropriate permits in order to construct and operate these wells. |
Before uranium extraction can begin in Texas, a number of permits must be granteddrill holes completed during each period.
Year | Company | Operations/Activity | Amount (No. of Drill holes) | Results of Work |
1979-1988 | Everest Minerals Corporation (later Everest Exploration, Inc. (EEI)) | Hobson facility constructed. | N/A | N/A |
2005 | Standard Uranium | N/A | N/A | N/A |
2006 | EMC | Standard Uranium and EMC merger. Extensive renovation of the plant. | N/A | N/A |
2007 | Uranium One | Renovation of the plant. | N/A | CPP capable of processing 1.5 million lbs per year. |
2009 | UEC | Acquires the Hobson Plant through acquisition of South Texas Mining Venture (STMV)/Uranium One. | N/A | N/A |
A Mine Area Permit application is required for submission to the TCEQ to establish a specific permit area boundary, aquifer exemption boundary and the mineral zonesTexas Bureau of interests or production zones. The application also includes a financial surety plan to ensure funding for all plugging and abandonment requirements. Funding for surety isEconomic Geology (“BEG”) in the form of cash, including an excess of 15% for contingencies and 10% for overhead, adjusted annually for inflation. At July 31, 2012, the Company held two Mine Area Permits, one for the Palangana Mine and another for1992 classifies the Goliad Project.
A Radioactive Material License (“RML”) application is also required for submission to the TCEQ for authorization to operate a uranium recovery facility. The application includes baseline environmental data for soil, vegetation, surface water and groundwater along with operational sampling frequencies and locations. A Radiation Safety Manual is a key componentas Miocene in age.
Production Area Authorization (“PAA”) applications are also required for submission to the TCEQ to establish specific extraction areas inside the Mine Area Permit boundary. These are typically 30 to 100 acre units that have been delineated and contain producible quantities of uranium.
A Class I disposal well permit application is also requiredarea (the “Palangana Project Area”) has been prepared for submissionUEC, under the supervision of WWC (the “QP” herein), pursuant to S-K 1300. This TRS identifies and summarizes the TCEQ for authorization for deep underground wastewater injection. It is the primary method for disposing of excess fluidscientific and technical information and conclusions reached from the extraction areas and for reverse osmosis concentrate during the restoration phase. This permit authorizes injection into a specific injection zone within a designated injection interval. The permit requires continuous monitoringIA to support disclosure of numerous parameters including injection flow rate, injection pressure, annulus pressure and injection/annulus differential pressure. Mechanical integrity testing is required initially and annually to ensure the well is mechanically sound. Surety funding for plugging and abandonment of each well is in the form of cash, including 15% for contingencies and 10% for overhead, adjusted annually for inflation. At July 31, 2012, the Company held a Class I disposal well permit for its Palangana Mine, the Hobson Facility and the Goliad Project.
8
The federal Safe Drinking Water Act (“SDWA”) creates a regulatory program to protect groundwater and is administered by the United States Environmental Protection Agency (“EPA”). The SDWA allows states to issue underground injection control (“UIC”) permits under two conditions: the state’s program must have been granted primacy and the EPA must have granted an aquifer exemption upon the state’s request. Texas, being a primacy state, is therefore authorized to grant UIC permits and makes the official requests for an aquifer exemption to the EPA. The aquifer exemption request is submitted by the Company to the TCEQ, and once approved, is then submitted by the TCEQ to the EPA for concurrence and final issuance. At July 31, 2012, the Company held one aquifer exemption formineral resources on the Palangana Mine and is awaiting concurrence from the EPA for another on the Goliad Project.
Waste Disposal
The Resource Conservation and Recovery Act ("RCRA") and comparable state statutes affect minerals exploration and production activities by imposing regulations on the generation, transportation, treatment, storage, disposal and cleanup of "hazardous wastes" and on the disposal of non-hazardous wastes. Under the auspicesProject Area.
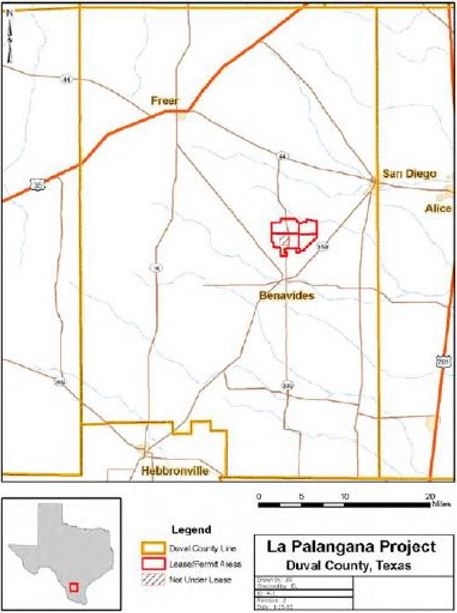
Comprehensive Environmental Response, Compensation and Liability Act
The federal Comprehensive Environmental Response, Compensation and Liability Act ("CERCLA") imposes joint and several liability for costs of investigation and remediation and for natural resource damages, without regard to fault or the legality of the original conduct, on certain classes of persons with respect to the release into the environment of substances designated under CERCLA as hazardous substances ("Hazardous Substances"). These classes of persons or potentially responsible parties include the current and certain past owners and operators of a facility or property where there is or has been a release or threat of release of a Hazardous Substance and persons who disposed of or arranged for the disposal of the Hazardous Substances found at such a facility. CERCLA also authorizes the EPA and, in some cases, third parties, to take actions in response to threats to the public health or the environment and to seek to recover the costs of such action. We may also in the future become an owner of facilities on which Hazardous Substances have been released by previous owners or operators. We may in the future be responsible under CERCLA for all or part of the costs to clean up facilities or property at which such substances have been released and for natural resource damages.
Air Emissions
Our operations are subject to local, state and federal regulations for the control of emissions of air pollution. Major sources of air pollutants are subject to more stringent, federally imposed permitting requirements. Administrative enforcement actions for failure to comply strictly with air pollution regulations or permits are generally resolved by payment of monetary fines and correction of any identified deficiencies. Alternatively, regulatory agencies could require us to forego construction, modification or operation of certain air emission sources. In Texas, the TCEQ issues an exemption for those processes that meet the criteria for low to zero emission by issuing a Permit by Rule. Presently the Palangana Mine, the Hobson Facility and the Goliad Project all have Permit by Rule covering air emissions.
Clean Water Act
The Clean Water Act ("CWA") imposes restrictions and strict controls regarding the discharge of wastes, including mineral processing wastes, into waters of the United States, a term broadly defined. Permits must be obtained to discharge pollutants into federal waters. The CWA provides for civil, criminal and administrative penalties for unauthorized discharges of hazardous substances and other pollutants. It imposes substantial potential liability for the costs of removal or remediation associated with discharges of oil or hazardous substances. State laws governing discharges to water also provide varying civil, criminal and administrative penalties and impose liabilities in the case of a discharge of petroleum or it derivatives, or other hazardous substances, into state waters. In addition, the EPA has promulgated regulations that may require us to obtain permits to discharge storm water runoff. In the event of an unauthorized discharge of wastes, we may be liable for penalties and costs. Management believes that we are in substantial compliance with current applicable environmental laws and regulations.
9
Competition
The uranium industry is highly competitive, and our competition includes larger, more established companies with longer operating histories that not only explore for and produce uranium, but also market uranium and other products on a regional, national or worldwide basis. Due to their greater financial and technical resources, we may not be able to acquire additional uranium projects in a competitive bidding process involving such companies. Additionally, these larger companies have greater resources to continue with their operations during periods of depressed market conditions.
Research and Development Activities
No research and development expenditures have been incurred, either on our account or sponsored by customers for the past three years.
Employees
Amir Adnani is our President and Chief Executive Officer, Harry Anthony is our Chief Operating Officer and Mark Katsumata is our Chief Financial Officer. These individuals are primarily responsible for all our day-to-day operations. Other services are provided by outsourcing and consultant and special purpose contracts. As of July 31, 2012, we had 98 persons employed on a full-time basis and seven individuals on a full-time contract basis providing ongoing services to the Company.
Available Information
The Company’s website address iswww.uraniumenergy.com and our annual reports on Form 10-K and quarterly reports on Form 10-Q, and amendments to such reports, are available free of charge on our website as soon as reasonably practicable after such materials are filed or furnished electronically with the United States Securities and Exchange Commission (the "SEC"). These same reports, as well as our current reports on Form 8-K, and amendments to those reports, filed or furnished electronically with the SEC are available for review at the SEC’s website atwww.sec.gov. Printed copies of the foregoing materials are available free of charge upon written request by email atinfo@uraniumenergy.com. Additional information about the Company can be found at our website, however, such information is neither incorporated by reference nor included as part of this or any other report or information filed with or furnished to the SEC.
10
In addition to the information contained in this Form 10-K Annual Report, the following list of material risks and uncertainties should be carefully reviewed by our stockholders and any potential investors in evaluating our Company, our business and the market value of our common stock. Any one of these risks and uncertainties has the potential to cause material adverse effects on our business, prospects, financial condition and operating results which could cause actual results to differ materially from any forward-looking statements expressed by us and a significant decrease in the market price of our common stock. Refer to “Forward-Looking Statements”.
There is no assurance that we will be successful in preventing the material adverse effects that any of the following risks and uncertainties may cause, or that these potential risks and uncertainties are a complete list of the risks and uncertainties facing us. Furthermore, there may be additional risks and uncertainties that we are presently unaware of, or presently consider immaterial, that may become material in the future and have a material adverse effect on us. You could lose all or a significant portion of your investment due to any of these risks and uncertainties.
Risks Related to our Company and Business
Evaluating our future performance may be difficult since we have a limited financial and operating history, with significant negative cash flow and net losses to date. Furthermore, the success of the Company will depend ultimately on our ability to achieve and maintain profitability from our mining activities.
As more fully described under Corporate Organization of ITEM 1. BUSINESS, Uranium Energy Corp. was incorporated under the laws of the State of Nevada on May 16, 2003. Since 2004 and as more fully described under General Business of ITEM 1. BUSINESS, we have been engaged in uranium exploration and pre-extraction programs and mining activities on properties located in the United States and Paraguay. We commenced uranium extraction for the first time at our Palangana Mine in November 2010 and generated revenue from sales of uranium concentrates during Fiscal 2012. We also hold certain mineral property interests in various stages of exploration and pre-extraction in the States of Arizona, Colorado, New Mexico, Texas and Wyoming and in Paraguay. The Company has not established proven or probable reserves on any of its mineral properties.
The Company has a history of significant negative cash flow and accumulated deficit since its inception to July 31, 2012 of $120.8 million. For Fiscal 2012, 2011 and 2010, we incurred net losses of $25.1 million, $27.4 million and $14.5 million, respectively. Although we generated revenue of $13.8 million from sales of uranium concentrates during Fiscal 2012, we do not expect to achieve profitability or develop positive cash flow from operations in the near term. Historically, we have been reliant primarily on equity financings to fund our ongoing operations and we expect this reliance to continue for the foreseeable future.
As a result of our limited financial and operating history, including significant negative cash flow and net losses to date, it may be difficult to evaluate the future performance of the Company. Furthermore, the long-term success of the Company’s business including its ability to acquire additional uranium projects and continue with its exploration, pre-extraction and mining activities on existing uranium projects will depend ultimately on our ability to achieve and maintain profitability and to develop positive cash flow from operations.
The uranium industry is capital intensive, and we will require significant additional financing to acquire additional uranium projects and continue with our exploration and pre-extraction programs and mining activities on our existing uranium projects.
The uranium industry is capital intensive, and we will require significant additional financing to acquire additional uranium projects and continue with our exploration and pre-extraction programs and mining activities on our existing uranium projects. Without such additional financing, we will be required to curtail or abandon any one or all of these activities.
11
Historically, we have relied on equity financing as our primary source of financing. Our ongoing reliance on equity financing and its availability whenever such additional financing is required will be dependent on many factors, including but not limited to general market conditions and the market value of our common stock. We may also be required to seek other forms of financing such as joint ventures, debt financing or other arrangements. We also filed a Form S-3 “Shelf” Registration Statement that became effective September 2, 2011 which provides for the offer and sale of certain securities of the Company from time to time, at its discretion, up to an aggregate public offering of $50 million (of which approximately $22.5 million was sold in our public offering that closed on April 10, 2012). However, there is no assurance that we will be successful in securing any form of additional financing when required and on terms favorable to us.
Uranium exploration and pre-extraction programs and mining activities are inherently subject to many significant risks and uncertainties and actual results may differ significantly from estimated amounts.
Uranium exploration and pre-extraction programs and mining activities are inherently subject to many significant risks and uncertainties.
Uranium exploration is frequently non-productive, in which case the uranium project may be abandoned and written-off. Furthermore, we will not be able to recover the funds that we incur on our exploration programs if we do not establish ore bodies that contain commercially recoverable uranium on our mineral projects and develop these into profitable mining activities. There is no assurance that we will be successful in establishing ore bodies that contain commercially recoverable uranium.
Whether an ore body contains commercially recoverable uranium depends on many factors including, without limitation: (i) the particular attributes of the deposit such as size, grade and proximity to infrastructure; (ii) the market price of uranium, which may be volatile; and (iii) government regulations and regulatory requirements including, without limitation, those relating to environmental protection, permitting and land use, taxes, land tenure and transportation. We have neither established nor have plans on establishing proven and probable reserves through the completion of feasibility studies in accordance with SEC Industry Guide 7 on our mineral projects on which we are currently utilizing or planning on utilizing in-situ recovery mining.
Our long-term success will depend on our ability to establish ore bodies that contain commercially recoverable uranium and to develop these into profitable mining activities. Mining activities have many risks and uncertainties including, but not limited to: (i) significantly higher than expected capital costs to construct the mine; (ii) significantly higher than expected actual extraction costs; and (iii) mine extraction being below expectations. There is no assurance that any ore body that we may develop into a mine will become profitable.
Uranium exploration and pre-extraction programs and mining activities are subject to many risks beyond our control including, but not limited to: (i) unanticipated ground and water conditions and adverse claims to water rights; (ii) unusual or unexpected geological formations; (iii) metallurgical and other processing problems; (iv) the occurrence of unusual weather or operating conditions and other force majeure events; (v) lower than expected ore grades; (vi) industrial accidents; (vii) delays in the receipt of or failure to receive necessary government permits; (viii) delays in transportation; (ix) availability of contractors and labor; (x) government permit restrictions and regulation restrictions; (xi) unavailability of materials and equipment; and (xii) the failure of equipment or processes to operate in accordance with specifications or expectations. These risks could result in damage to, or destruction of, mineral properties, extraction facilities or other properties; personal injury; environmental damage; delays in mining; increased extraction costs; monetary losses; and legal claims.
If we become subject to liability, we may not be able or may elect not to insure against such risk due to high insurance premiums or other reasons. Where coverage is available and not prohibitively expensive relative to the perceived risk, we will maintain insurance against such risk, subject to exclusions and limitations. However, we cannot provide any assurance that such insurance will continue to be available at reasonable premiums or that such insurance will be adequate to cover any resulting liability.
12
Further exploration by our Company may not result in economically viable mining activities or yield new reserves.
Exploration for uranium involves many risks and uncertainties and success in exploration is dependent on a number of factors, including the quality of management, quality and availability of geological expertise and the availability of exploration capital. Major expenses may be required to establish reserves by drilling, constructing mining or processing facilities at a site, developing metallurgical processes and extracting uranium from ore. Also, substantial expenses may be incurred on exploration projects which are subsequently abandoned due to poor exploration results or the inability to define reserves which can be mined economically.
Even if an exploration program is successful and economically recoverable uranium is found, it can take a number of years from the initial phases of drilling and identification of the mineralization until extraction is possible, during which time the economic feasibility of extraction may change and uranium that was economically recoverable at the time of discovery ceases to be economically recoverable. There can be no assurance that uranium recovered in small scale tests will be duplicated in large scale tests under onsite conditions or in actual operations, and material changes in geological resources or recovery rates may affect the economic viability of uranium projects.
We cannot assure that exploration and pre-extraction programs will result in profitable commercial mining activities. The economics of developing uranium properties are affected by many factors including the cost of operations, fluctuations in the price of uranium, costs of processing equipment and such other factors as government regulations. In addition, the quantity of uranium ultimately extracted may differ from that indicated by drilling results and such differences could be material.
We have limited uranium extraction and sales history.
We have a limited history in extraction of mineralized materials. Ongoing uranium extraction and commissioning of staged expansions to uranium extraction may not proceed as planned, with potential for delay in the timing of targeted uranium extraction and/or a failure to achieve the level of targeted uranium extraction. In extreme circumstances, these potential delays or difficulties may necessitate additional funding which could lead to additional equity or debt requirements for our Company. In addition to potential delays, there is a risk that capital and/or operating costs will be higher than expected or there will be other unexpected changes in variables upon which expansion and commissioning decisions were made. These potential scope changes and/or cost overruns may lead also to additional funding requirements. Our activities may be affected by numerous other factors beyond our control. Mechanical failure of our operating plant and equipment, and general unanticipated operational and technical difficulties may adversely affect our operations. Operating risks beyond our control may expose our Company to uninsured liabilities. The business of mining, exploration and pre-extraction is subject to a variety of risks and hazards such as cave-ins and other accidents, flooding, environmental hazards, the discharge of toxic chemicals and other hazards. Such occurrences may delay uranium extraction, increase extraction costs or result in damage to and destruction of, mineral properties or extraction facilities, personal injury, environmental damage and legal liability.
In addition, we have a limited history of selling our uranium product and inventories. We may experience difficulty in marketing and/or selling our uranium product and inventories which may adversely impact our revenues and operating cash flows.
Acquisitions that we may make from time to time could have an adverse impact on us.
From time to time, we examine opportunities to acquire additional mining assets and businesses. Any acquisition that we may choose to complete may be of a significant size, may change the scale of our business and operations, and may expose us to new geographic, political, operating, financial and geological risks. Our success in our acquisition activities depends on our ability to identify suitable acquisition candidates, negotiate acceptable terms for any such acquisition, and integrate the acquired operations successfully with those of our Company. Any acquisitions would be accompanied by risks which could have a material adverse effect on our business. For example, there may be a significant change in commodity prices after we have committed to complete the transaction and established the purchase price or exchange ratio; a material ore body may prove to be below expectations; we may have difficulty integrating and assimilating the operations and personnel of any acquired companies, realizing anticipated synergies and maximizing the financial and strategic position of the combined enterprise, and maintaining uniform standards, policies and controls across the organization; the integration of the acquired business or assets may disrupt our ongoing business and our relationships with employees, customers, suppliers and contractors; and the acquired business or assets may have unknown liabilities which may be significant. In the event that we choose to raise debt capital to finance any such acquisition, our leverage will be increased. If we choose to use equity as consideration for such acquisition, existing shareholders may suffer dilution. Alternatively, we may choose to finance any such acquisition with our existing resources. There can be no assurance that we would be successful in overcoming these risks or any other problems encountered in connection with such acquisitions.
13
The uranium industry is subject to numerous stringent laws, regulations and standards, including environmental protection laws and regulations. If any changes occur that would make these laws, regulations and standards more stringent, it may require capital outlays in excess of those anticipated or cause substantial delays, which would have a material adverse effect on our operations.
Uranium exploration and pre-extraction programs and mining activities are subject to numerous stringent laws, regulations and standards at the federal, state, and local levels governing permitting, pre-extraction, extraction, exports, taxes, labor standards, occupational health, waste disposal, protection and reclamation of the environment, protection of endangered and protected species, mine safety, hazardous substances and other matters. Our compliance with these requirements requires significant financial and personnel resources.
The laws, regulations, policies or current administrative practices of any government body, organization or regulatory agency in the United States or any other applicable jurisdiction, may change or be applied or interpreted in a manner which may also have a material adverse effect on our operations. The actions, policies or regulations, or changes thereto, of any government body or regulatory agency or special interest group, may also have a material adverse effect on our operations.
Uranium exploration and pre-extraction programs and mining activities are subject to stringent environmental protection laws and regulations at the federal, state, and local levels. These laws and regulations, which include permitting and reclamation requirements, regulate emissions, water storage and discharges and disposal of hazardous wastes. Uranium mining activities are also subject to laws and regulations which seek to maintain health and safety standards by regulating the design and use of mining methods. Various permits from governmental and regulatory bodies are required for mining to commence or continue, and no assurance can be provided that required permits will be received in a timely manner.
Our compliance costs including the posting of surety bonds associated with environmental protection laws and regulations and health and safety standards have been significant to date, and are expected to increase in scale and scope as we expand our operations in the future. Furthermore, environmental protection laws and regulations may become more stringent in the future, and compliance with such changes may require capital outlays in excess of those anticipated or cause substantial delays, which would have a material adverse effect on our operations.
To the best of our knowledge, our operations are in compliance, in all material respects, with all applicable laws, regulations and standards. If we become subject to liability for any violations, we may not be able or may elect not to insure against such risk due to high insurance premiums or other reasons. Where coverage is available and not prohibitively expensive relative to the perceived risk, we will maintain insurance against such risk, subject to exclusions and limitations. However, we cannot provide any assurance that such insurance will continue to be available at reasonable premiums or that such insurance will be adequate to cover any resulting liability.
We may not be able to obtain or maintain necessary licenses.
Our exploration and mining activities are dependent upon the grant of appropriate authorizations, licences, permits and consents, as well as continuation of these authorizations, licences, permits and consents already granted, which may be granted for a defined period of time, or may not be granted or may be withdrawn or made subject to limitations. There can be no assurance that all necessary authorizations, licences, permits and consents will be granted to us, or that authorizations, licences, permits and consents already granted will not be withdrawn or made subject to limitations.
14
Major nuclear incidents may have adverse effects on the nuclear and uranium industries.
The nuclear incident that occurred in Japan in March 2011 had significant and adverse effects on both the nuclear and uranium industries. If another nuclear incident were to occur, it may have further adverse effects for both industries. Public opinion of nuclear power as a source of electricity generation may be adversely affected, which may cause governments of certain countries to further increase regulation for the nuclear industry, reduce or abandon current reliance on nuclear power or reduce or abandon existing plans for nuclear power expansion. Any one of these occurrences has the potential to reduce current and/or future demand for nuclear power, resulting in lower demand for uranium and lower market prices for uranium, adversely affecting the Company’s operations and prospects. Furthermore, the growth of the nuclear and uranium industries is dependent on continuing and growing public support of nuclear power as a source of electricity generation.
The marketability of uranium concentrates will be affected by numerous factors beyond our control which may result in our inability to receive an adequate return on our invested capital.
The marketability of uranium concentrates produced by us will be affected by numerous factors beyond our control. These factors include macroeconomic factors, fluctuations in the market price of uranium, governmental regulations, land tenure and use, regulations concerning the importing and exporting of uranium and environmental protection regulations. The future effects of these factors cannot be accurately predicted, but any one or a combination of these factors may result in our inability to receive an adequate return on our invested capital.
The uranium industry is highly competitive and we may not be successful in acquiring additional projects.
The uranium industry is highly competitive, and our competition includes larger, more established companies with longer operating histories that not only explore for and produce uranium, but also market uranium and other products on a regional, national or worldwide basis. Due to their greater financial and technical resources, we may not be able to acquire additional uranium projects in a competitive bidding process involving such companies. Additionally, these larger companies have greater resources to continue with their operations during periods of depressed market conditions.
We hold mineral rights in foreign jurisdictions which could be subject to additional risks due to political, taxation, economic and cultural factors.
We hold certain mineral rights located in Paraguay through the acquisition of Piedra Rica Mining S.A. and Transandes Paraguay S.A., both companies incorporated in Paraguay. Operations in foreign jurisdictions outside of the U.S. and Canada, especially in developing countries, may be subject to additional risks as they may have different political, regulatory, taxation, economic and cultural environments that may adversely affect the value or continued viability of our rights. These additional risks include, but are not limited to: (i) changes in governments or senior government officials; (ii) changes to existing laws or policies on foreign investments, environmental protection, mining and ownership of mineral interests; (iii) renegotiation, cancellation, expropriation and nationalization of existing permits or contracts; (iv) foreign currency controls and fluctuations; and (v) civil disturbances, terrorism and war.
In the event of a dispute arising at our foreign operations in Paraguay, we may be subject to the exclusive jurisdiction of foreign courts or may not be successful in subjecting foreign persons to the jurisdiction of the courts in the United States or Canada. We may also be hindered or prevented from enforcing our rights with respect to a government entity or instrumentality because of the doctrine of sovereign immunity. Any adverse or arbitrary decision of a foreign court may have a material and adverse impact on our business, prospects, financial condition and results of operations.
There is no guarantee that title to our mineral property interests will not be challenged.
Although we have taken reasonable measures to ensure proper title to our interests in mineral properties and other assets, there is no guarantee that the title to any of such interests will not be challenged. No assurance can be given that we will be able to secure the grant or the renewal of existing mineral rights and tenures on terms satisfactory to us, or that governments in the jurisdictions in which we operate will not revoke or significantly alter such rights or tenures or that such rights or tenures will not be challenged or impugned by third parties, including local governments, aboriginal peoples or other claimants. Our mineral properties may be subject to prior unregistered agreements, transfers or claims, and title may be affected by, among other things, undetected defects. A successful challenge to the precise area and location of our claims could result in us being unable to operate on our properties as permitted or being unable to enforce our rights with respect to our properties.
15
Due to the nature of our business, we may be subject to legal proceedings.
Due to the nature of our business, we may be subject to numerous regulatory investigations, civil claims, lawsuits and other proceedings in the ordinary course of our business. The results of these legal proceedings cannot be predicted with certainty due to the uncertainty inherent in litigation, the difficulty of predicting decisions of regulators, judges and juries and the possibility that decisions may be reversed on appeal. There can be no assurances that these matters will not have a material adverse effect on our business and/or financial position.
We depend on certain key personnel, and our success will depend on our continued ability to retain and attract such qualified personnel.
Our success is dependent on the efforts, abilities and continued service of certain senior officers and key employees and consultants, especially Amir Adnani, our President and Chief Executive Officer, and Harry Anthony, our Chief Operating Officer. A number of our key employees and consultants have significant experience in the uranium industry. A loss of service from any one of these individuals may adversely affect our operations, and we may have difficulty or may not be able to locate and hire a suitable replacement.
Certain directors and officers may be subject to conflicts of interest.
The majority of our directors and officers are involved in other business ventures including similar capacities with other private or publicly-traded companies. Such individuals may have significant responsibilities to these other business ventures, including consulting relationships, which may require significant amounts of their available time. Conflicts of interest may include decisions on how much time to devote to our business affairs and what business opportunities should be presented to us. Our Code of Business Conduct for Directors, Officers and Employees provides for guidance on conflicts of interest.
Nevada law and our Articles of Incorporation may protect our directors and officers from certain types of lawsuits.
Nevada law provides that our directors and officers will not be liable to the Company or its stockholders for monetary damages for all but certain types of conduct as directors and officers. Our Bylaws provide for broad indemnification powers to all persons against all damages incurred in connection with our business to the fullest extent provided or allowed by law. These indemnification provisions may require us to use our limited assets to defend our directors and officers against claims, and may have the effect of preventing stockholders from recovering damages against our directors and officers caused by their negligence, poor judgment or other circumstances.
Several of our directors and officers are residents outside of the U.S., and it may be difficult for stockholders to enforce within the U.S. any judgments obtained against such directors or officers.
Several of our directors and officers are nationals and/or residents of countries other than the U.S., and all or a substantial portion of such persons' assets are located outside of the U.S. As a result, it may be difficult for investors to effect service of process on such directors and officers, or enforce within the U.S. any judgments obtained against such directors and officers, including judgments predicated upon the civil liability provisions of the securities laws of the U.S. or any state thereof. Consequently, stockholders may be effectively prevented from pursuing remedies against such directors and officers under U.S. federal securities laws. In addition, stockholders may not be able to commence an action in a Canadian court predicated upon the civil liability provisions under U.S. federal securities laws. The foregoing risks also apply to those experts identified in this document that are not residents of the U.S.
16
Disclosure controls and procedures and internal control over financial reporting, no matter how well designed and operated, are designed to obtain reasonable, and not absolute, assurance as to its reliability and effectiveness.
Management’s evaluation on the effectiveness of disclosure controls and procedures is designed to ensure that information required for disclosure in our public filings is recorded, processed, summarized and reported on a timely basis to our senior management, as appropriate, to allow timely decisions regarding required disclosure. Management’s report on internal control over financial reporting is designed to provide reasonable assurance that transactions are properly authorized, assets are safeguarded against unauthorized or improper use and transactions are properly recorded and reported. Any system of controls, no matter how well designed and operated, is based in part upon certain assumptions designed to obtain reasonable, and not absolute, assurance as to its reliability and effectiveness.
Risks Related to the Company’s Common Stock
Historically, the market price of our common stock has been and may continue to fluctuate significantly.
On September 28, 2007, our common stock commenced trading on the NYSE MKT Equities Exchange (formerly known as the American Stock Exchange and the NYSE Amex Equities Exchange) and prior to that, traded on the OTC Bulletin Board. The global stock markets have experienced significant and increased volatility, especially over the last few years. Although this volatility is often unrelated to specific company performance, it can have an adverse effect on the market price of our common stock. Historically, the market price of our common stock has fluctuated significantly, and may continue to do so in the future.
In addition to the volatility associated with general economic trends and market conditions, the market price of our common stock could decline significantly due to the impact of any one or more events, including, but not limited to, the following: (i) volatility in the uranium market; (ii) occurrence of a major nuclear incident; (iii) changes in the outlook for the nuclear power and uranium industries; (iv) failure to meet market expectations on our exploration, pre-extraction or mining activities, including abandonment of key uranium projects; (v) sales of a large number of our common stock held by certain stockholders including institutions and insiders; (vi) downward revisions to estimates on us by securities analysts; (vii) removal from market indices; (viii) legal claims brought forth against us; and (ix) introduction of technological innovations by competitors or in competing technologies.
A prolonged decline in the market price of our common stock could affect our ability to obtain additional financing which would adversely affect our operations.
During the recent past, the global markets have been impacted by the effects of mass sub-prime mortgage defaults and liquidity problems of the asset-backed commercial paper market, which have resulted in a number of large financial institutions requiring government bailouts or filing for bankruptcy. The effects of these past events and any similar events in the future may continue to or further affect the global markets, which may directly affect the market price of our common stock and our accessibility for additional financing.
Historically, we have relied on equity financing as our primary source of financing. A prolonged decline in the market price of our common stock or a reduction in our accessibility to the global markets may result in our inability to secure additional financing which would have an adverse effect on our operations.
Additional issuances of our common stock may result in significant dilution to our existing stockholders and reduce the market value of their investment.
Issuances of our common stock for additional financing, mergers and acquisitions and for other reasons may result in significant dilution to our existing stockholders, including a reduction in the proportionate ownership and voting power and a decrease in the market price of our common stock. We also filed a Form S-3 “Shelf” Registration Statement that became effective September 2, 2011 which provides for the offer and sale of certain securities of the Company from time to time, at its discretion, up to an aggregate public offering of $50 million of which approximately $22.5 million has been utilized.
17
Our common stock is currently classified as a "penny stock" under SEC rules which may limit the market for our common stock.
Under SEC rules, a "penny stock" generally refers to securities of companies that trade below $5.00 per share. Historically, the trading price of our common stock has fluctuated significantly and has traded above and below $5.00 per share. At July 31, 2012, the trading price of our common stock closed at $2.00 per share and was therefore classified as a penny stock. SEC Rule 15g-9 of the Exchange Act imposes additional sales practice requirements on broker-dealers that recommend the purchase or sale of penny stocks to persons other than those who qualify as an "established customer" or an "accredited investor." This includes the requirement that a broker-dealer must make a determination that investments in penny stocks are suitable for the customer and must make special disclosures to the customers concerning the risk of penny stocks. Many broker-dealers decline to participate in penny stock transactions because of the extra requirements imposed on penny stock transactions. Application of the penny stock rules to our common stock from time to time may limit our market liquidity, which in turn affects the ability of our stockholders to resell their shares at prices at or above their cost.
None.
18
General
At July 31, 2012, we held mineral rights in the U.S. States of Arizona, Colorado, New Mexico, Texas and Wyoming and in the Republic of Paraguay by way of federal mining claims, state and private mineral leases and mineral concessions.
We have not established proven or probable reserves, as defined by the SEC under Industry Guide 7, through the completion of a “final” or “bankable” feasibility study for any of our uranium projects, including the Palangana Mine. Furthermore, we have no plans to establish proven or probable reserves for any of our uranium projects for which we plan on utilizing ISR mining, such as the Palangana Mine.
Texas Projects
The following map shows the location of our main projects in Texas:

19
Palangana Mine, Duval County, Texas

Mineral Titles
At July 31, 2012, there were 12 leases covering 9,601 acres at the Palangana Mine. The PAA-1 deposit is on the DeHoyos leases while the PAA-2 deposit, the PAA-3 deposit and Dome trend are on the Palangana Ranch Management, LLC lease. Bordering the east side of the Palangana Ranch Management, LLC lease is the White Bell Ranch lease, comprised of 1,000 acres, which contains the Jemison Fence and Jemison East trends. The fourth major lease is the Garcia/Booth lease which borders the east side of the De Hoyos property. It contains the NE Garcia and SW Garcia trends.
Lease ownership is held by STMV, which is wholly-owned by the Company.
20
Accessibility, Climate, Local Resources, Infrastructure and Physiography
Topography, Elevation and Vegetation
Elevations of the Palangana Mine deposits from the surface range from about 410 feet to 500 feet above sea level.
Climate and Length of Operating Season
The region's subtropical climate allows uninterrupted, year-round mining activities. Temperatures during the summer range from 75°F to 95°F, although highs above 100°F are common while winter temperatures range from 45°F to 65°F. Humidity is generally over 85% year-round and commonly exceeds 90% during the summer months. Average annual rainfall is 30 inches. The climate is characterized by a warm desert-like to subtropical climate and low gentle relief with elevations of 300 to 500 feet above sea level.
Physiography
The dome area to the west of the PAA-1 and PAA-2 deposits is a concentric collapsed area with the surrounding landscape being hilly and elevated. Surface water generally drains away from the dome area although no prominent creeks or rivers are evident.
Access to Property
The Palangana Mine occurs in the South Texas, Uranium Belt between San Antonio and Corpus Christi in Duval County. Corpus Christi the largest nearby metropolitan district, is about 65 miles to the east of Palangana. It can be accessed off Texas Highway 44 toward Freer. Halfway between San Diegothe Palangana Project Area. The Palangana Project Area has been developed by several operators since the 1950s and Freerhas several wellfields that are drilled and ready for operations. In addition, the Palangana Project Area produced 563,600 pounds U3O8 from 2010 to 2016 and currently has the infrastructure to begin mining immediately. No resources are reported in areas outside of the Palangana Project Area boundary. There are no reserves associated with the Palangana Project Area and it is considered a remote ‘satellite’ to the Hobson CPP.
Surface Rights
The uranium leaseholders under most of the current leasesongoing. No recent regulatory violations or fines have conveyed the surface rights under certain conditions of remuneration. These conditions essentially require payments for surface area taken out of usage.
Local Resources and Infrastructure
The entire infrastructurebeen levied. A surety bond is in place including office buildings, access roads, electrical powerfor the Palangana Project’s restoration, reclamation and maintenance faculties. Each property has sources of water for drilling operations for both explorationdecommissioning requirements and extraction drilling.
Manpower
A nearby workforce of field technicians, welders, electricians, drillers and pipefitters exists in the local communities. The technical workforce for facility operations has largely disappeared from the area although ample qualified resources can be found in the South Texas area from the petrochemical industry.
is updated annually.
21
Union Carbide
Union Carbidedome and is not part of this resource estimate.
Year | Company | Operations/Activity | Amount (# of Drill holes) | Results of Work |
1952 | CSI | Original controller of Palangana Project Area. | Records of CSI’s exploration work was unavailable | Right to mine secured. Uranium mineralization was discovered during potash exploration drilling of the Palangana Dome in 1952 by CSI. CSI conducted active uranium exploration drilling on the property starting in March 1956. CSI and the AEC estimated underground mineable uranium resources. The estimation method included identifying 0.15% eU3O8, a minimum mining thickness of 3 ft, and exploration was widely spaced drilling on a nominal 200 ft exploration grid. |
1958 | UCC | UCC acquired the Palangana Project Area in 1958 and ceased operations shortly after until 1967, when operations resumed for over a decade due to new technology. UCC placed the Palangana Project Area up for lease in 1980. | Over 1,000 exploration and development holes in 1960s and 70s (296 cores) Over 3,000 injection-production holes | Early development work was quickly abandoned because of concentrations of Hydrogen Sulfide (H2S) gas. The property was reacquired in 1967 after emerging ISR mining technologies were available. ISR operation occurred from 1977 through 1979. About 340,000 lbs of U3O8 were produced from portions of a 31-acre wellfield block. The production pounds indicate a 32% to 34% recovery rate. The ISR work was conducted at a research level in contrast to the current level of knowledge. Historic production lies on the western flank of the dome and is not part of this resource estimate. |
1981 – Unknown | Chevron | Chevron acquired the UCC leases and conducted their own resource evaluation. | N/A | Chevron resource evaluation indicated that an estimated 8 million lbs (non-CIM compliant) of eU3O8 existed on the entire site within unclassified material containing 0.125% eU3O8. |
Unknown to late 1990’s | General Atomics | General Atomics acquired the Palangana Project Area for restoration work. | N/A | General Atomics acquired the property and dismantled the process plant in a property-wide restoration effort. Upon formal approval of the clean up by the Texas Natural Resources Conservation Commission and the NRC, the property was returned to the landowners in the late 1990s. |
Late 1990’s to 2005 | N/A | The Palangana Project Area returned to surface rights landowners. | N/A | N/A |
2005 | EEI and Energy Metals/Uranium One | EEI acquires Palangana and joint ventured with Energy Metals by forming the STMV. In 2008, Energy Metals was acquired by Uranium One. | Approximately 236 exploration and confirmation holes. | Blackstone (2005) estimated 5.7 million lbs of inferred resources in the area referred to as the Dome trend proximal to the dome on the west side, north of the prior UCC leach field. In 2006 and 2007, Energy Metals drilled approximately 200 additional confirmation and delineation holes. The PA-1 and PA-2 areas were delineated during this drilling program. During 2008 and 2009, the remainder of the holes were drilled by Uranium One. During this time, five exploration trends on the east side of the dome were identified and partially delineated. |
2009 | UEC | Palangana Project Area acquired by UEC from Uranium One. | N/A | UEC acquires Palangana. SRK was retained by UEC in 2010 to provide an independent resource and reserve evaluation on PA-1 and PA-2 and adjacent exploration areas. SRK concluded the sandstone, roll-front deposits on the east side of the Palangana Dome contain significant resources of eU3O8. Specifically, PA-1 and PA-2 bodies are adequately delineated for the calculation of Measured and Indicated Resources. SRK developed resource estimates within distinct sand and roll-front zones utilizing detailed computer block modeling of grade and GT modeling. The results of the resource estimation are complex and presented in more detail in this report. In 2010, UEC resumed production at Palangana. Approximately 563,600 pounds were produced from 2010 to 2016 in PA-1, PA-2 and PA-3. |
South Texas
Classification | Tons Ore (000’s) | Tonnes Ore (1000’s) | Average Grade (% eU3O8) | Pounds eU3O8 (000’s) |
| Measured | - | - | - | - |
| Indicated | 232 | 210 | 0.134 | 643.1 |
Total M&I | 232 | 210 | 0.134 | 643.1 |
| Inferred – PA-1 and PA-2 | 96 | 87 | 0.100 | 192.5 |
| Inferred – Dome, NE Garcia, SW Garcia, CC Brine, Jemison Fence, Jemison East | 206 | 187 | 0.110 – 0.300 | 808.8 |
Total Resources | 534 | 484 | 0.154 | 1,644.4 |
| 1. | Pounds reported with Disequilibrium Factor (DEF) applied. | |
| 2. | A range of grades is presented for the Palangana inferred mineral because the resource estimation methods differed between PA-1/PA-2 and the rest of the trends. There was no cutoff for PA-1 and PA-2 block models. See Section 11.1 of the Texas Hub and Spoke TRS for a more detailed explanation. | |
| 3. | The sum of resource tons and lbs may not add up to the reported total due to rounding. | |
| 4. | Measured, indicated, and inferred mineral resources as defined in 17 CFR § 229.1300. | |
| 5. | Delineation drilling conducted at Palangana after 2010 was not incorporated into the resource estimate as in the experience of the QP, this type of drilling does not generally substantially change the resource estimates. | |
| 6. | All reported resources occur below the static water table. | |
| 7. | The point of reference for mineral resources is in-situ at the Project. | |
| 8. | Mineral resources that are not mineral reserves do not have demonstrated economic viability. | |
| 9. | A long-term uranium price of $40/lb U3O8 and an 80% metallurgical recovery factor were considered for the purposes of determining the reasonable prospect of economic extraction. |
Geological Model
Uranium mineralization inscientific and technical information and conclusions reached from the South Texas Uranium Belt occurs as sandstone-hosted roll-front deposits. The depositsIA to support disclosure of mineral resources on the Burke Hollow Project Area. There are strata-bound, elongate, and often, but not necessarily, occur in the classic “C” or truncated “C” roll configuration. They can beno reserves associated with an oxidation front or can be found in a re-reduced condition where an overprintthe Burke Hollow Project Area.
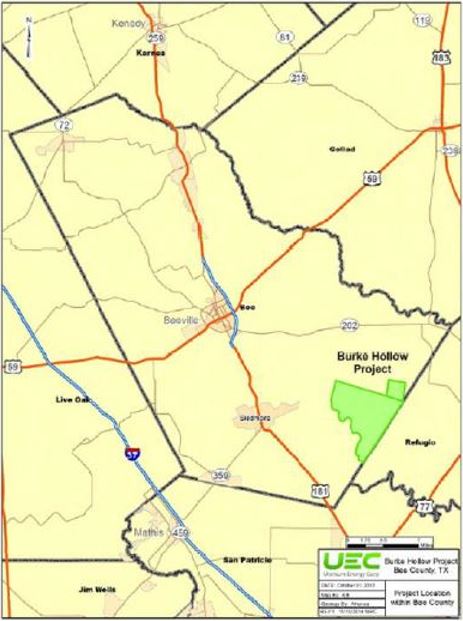
The generally accepted origintown of uranium mineralization in the Goliad Formation is from leaching of intraformational tuffaceous material or erosion of older uranium-bearing strata. The leached uranium was carried by oxygenated ground water in a hexavalent state and deposited where a suitable reductant was encountered. The oxidation/reduction (redox) fronts are often continuous for miles, although minable grade uranium mineralization is not nearly as continuous. The discontinuous nature of uranium mineralization is often characterized as “beads on a string”Beeville and is due to sinuous verticallocated on the western side of US 77 and lateral fluvial facies changesnortheasterly of US 181, which links with US 59 in the permeable sandstone host horizons, coupled with ground water movements and the presence or absence of reducing material.
22

Figure 2: Schematic view of a typical uranium roll-front configuration
Beeville. The red area is the uranium mineralization deposited at the interface between the oxidized (up gradient) sand shown in yellow and the reduced (down gradient) sand shown in gray. The up gradient sand has been altered by oxidizing groundwater that carried the uranium that was deposited in the roll-front at the oxidation/reduction (redox) interface. The uranium mineralization is hydrologically confined by an upper and lower confining layer of shale or mudstone. At wellfields, extraction (pumping) wells have been completed near theapproximate center of the roll-frontBurke Hollow Project lease is located at latitude 28.2638 and longitude -97.5176, in decimal degrees. Site drilling roads are fed lixiviate (leach solutions) by injection wells on each sideentirely composed of the front.
Mineralized Zonescaliche and Historical Drilling Results
As stated previously, mineralization does not occurgravel, allowing access for trucks and cars in all of the Goliad sands nor does it persist in the same sand intervals across the dome area. On the west half of the dome near what is referred to as the Dome trend, Union Carbide developed the “C” sand zone. most weather conditions. Four-wheel drive vehicles may be needed during high rainfall periods.
23
The table below summarizes the historical drilling results at the Palangana Mine prior to its acquisition by the Company effective December 18, 2009:
| Trend | Total # DHs | Max. Depth (feet) | Avg. Depth (feet) | #of Mineralized Intervals | Interval Thickness Range (feet) | Interval Thickness Avg. (feet) |
| PAA-1 | 518 | 660 | 565 | 389 | 0.5 – 13.5 | 5.24 |
| PAA-2 | 239 | 600 | 337.5 | 186 | 0.5 – 13.5 | 5.79 |
| PAA-3 | 69 | 520 | 417 | 49 | 2.0 – 18.5 | 5.9 |
| Jemison East | 53 | 560 | 434 | 17 | 1.0 – 11.0 | 4.4 |
| NE Garcia | 186 | 600 | 344 | 158 | 0.5 – 20.0 | 4.6 |
| SW Garcia | 84 | 600 | 367 | 45 | 0.5 – 11.0 | 4.6 |
| Dome | 231 | 600 | 346 | 239 | 0.5 – 12.5 | 4.1 |
Update to July 31, 2012
Since commencing uranium extraction at the Palangana Mine in November 2010 to July 31, 2012, the Hobson Facility has processed 323,000 pounds of uranium concentrates. A status summary by production area is provided below:
| ||
| ||
| ||
| ||
|
The following table summarizes the Palangana Mine uranium extraction results for Fiscal 2012 and 2011:
| Average | Average | |||
| Fiscal | Flow | Extracted | Grade | Recovery |
| Year | (Gallons) | (lbs U308) | (% U308) | (% U308)(1) |
| 2012 | 539,467,600 | 198,000 | 0.0044 | 19%(2) |
| 2011 | 248,211,400 | 125,000 | 0.0058 | 14%(3) |
| ||
| ||
| ||
| ||
| ||
| ||
| ||
The following table summarizes the drill holes completed by the Company during Fiscal 2012:
| Trend | Total # DHs | Max. Depth (feet) | Avg. Depth (feet) |
| PAA-1 | 19 | 574 | 506.2 |
| PAA-2 | 58 | 520 | 312.4 |
| PAA-3 | 51 | 450 | 372.0 |
| Jemison East | 43 | 520 | 428.3 |
| NE Garcia | 2 | 400 | 360.0 |
24
The following table summarizes the drill holes completed by the Company from December 18, 2009, the date of the STMV Acquisition, to July 31, 2012:
| Trend | Total # DHs | Max. Depth (feet) | Avg. Depth (feet) |
| PAA-1 | 74 | 584 | 516.9 |
| PAA-2 | 58 | 370 | 304.6 |
| PAA-3 | 340 | 620 | 402.0 |
| Jemison East | 182 | 640 | 458.5 |
| NE Garcia | 40 | 520 | 369.6 |
| SW Garcia | 6 | 620 | 568.3 |
| Dome | 56 | 500 | 355.4 |
We have not established proven or probable reserves, as defined by the SEC under Industry Guide 7, through the completion of a “final” or “bankable” feasibility study for the Palangana Mine. Furthermore, we have no plans to establish proven or probable reserves for any of our uranium projects for which we plan on utilizing ISR mining, such as the Palangana Mine. Since we commenced extracting mineralized materials at the Palangana Mine without having established proven and probable reserves, any mineralized materials established or extracted from the Palangana Mine should not be in any way associated with having established or produced from proven or probable reserves.
Goliad Project, Goliad County, Texas
Property Description and Location
The Goliad Project is comprised of 20 leases covering 2,242 acres located in Texas near the northeast end of the extensive South Texas Uranium Trend. The GoliadBurke Hollow Project consists of multipleone fee (private) mineral leases thatcomprised of 17,511 acres. This lease area would allow for the mining of uranium by ISR methods while utilizing the land surface (with variable conditions) as needed, for mining wells and abovegroundabove ground surface facilities for fluid processing and ore captureuranium production during the mining and groundwater restoration phases of the Burke Hollow Project. All payments for the private lease are up to date. No mineral resources are reported in areas outside of the Burke Hollow Project boundary.
Year | Company | Operations/Activity | Amount (No. of Drill holes) | Results of Work |
1982 | Nufuels | Original controller of the Burke Hollow Project Area. | 18 exploration holes on or nearby the Welder Lease | Nufuels drilled 18 exploration holes on or nearby UEC’s 1,825-acre Welder lease in conjunction with a larger regional program, which was conducted by Nufuels. Exploration holes were drilled to approximately 1,100 ft bgs and tested the entire prospective Goliad Formation. Results showed the presence of a reduction-oxidation interface in sands of the lower Goliad Formation, but there was insufficient data to link economically viable uranium mineralization. |
1993 | TOMIN | Exploration program. | 12 exploration holes on or near the Thomson-Barrow Lease. | TOMIN conducted a short reconnaissance exploration drilling program on the Thomson-Barrow lease. TOMIN drilled a total of 12 holes on permitted acreage that they negotiated for exploration. 11 of the 12 drill holes intersected anomalous gamma ray log signatures indicative of uranium mineralization, but there was insufficient data to link economically viable uranium mineralization. |
2011 | UEC | The Burke Hollow Project Area was acquired by UEC from TOMIN. | From 2012-2017, 707 uranium exploration drill holes, including 30 monitor wells completed at the Welder lease (Kurrus et al. 2014). | The historic data package was obtained and reviewed by UEC for portions of the current Burke Hollow Project Area (Kurrus and Yancy, 2017). Based on the limited number of drill holes, no meaningful resource or reserve determination was made using the historic exploration data. However, the actual drilling and geophysical logging results were determined to be properly conducted, per industry standards. UEC completed two drilling campaigns to delineate the opened ended Lower B1 and B2 trends (Carothers et al., 2013). The results of historic and contemporary borehole gamma-ray, SP and resistance logs, as well as PFN logs indicate that uranium mineralization occurs in the upper to lower Goliad Formation sand/sandstone units below the water table at depths from approximately 180 to 1,100 ft bgs. Evidence indicate ISR would likely be the most suitable mining method for this project. In 2017, UEC estimated an Inferred Mineral Resource of 4,064,575 tons grading 0.088% pU3O8 (PFN determination) containing approximately 7.09 million pounds U3O8 in the combined Graben and Eastern Lower B trends. |
2019 | UEC | Exploration program. | In 2019, 129 delineation holes were drilled. From 2021-2022, 168 delineation and exploration holes were drilled. | In 2019, UEC completed 129 drill holes, mostly focusing on delineating the Lower B1 and Lower B2 sands in the proposed PA-1. In addition, UEC began installing perimeter monitor wells in proposed PA-1. In total, 57 holes were drilled solely for delineation and exploration purposes and 72 holes were drilled for monitoring purposes. From 2021 to 2022, UEC conducted another drilling program to upgrade a portion of their resources from inferred to measured and indicated, to better define the ore body in proposed PA-1 and to install monitor wells. 168 delineation and exploration holes were drilled as of March 7, 2022. 24 of these holes were also used as monitor wells. This drilling program is ongoing for the purpose of completing more monitor wells. The first production area authorization application has been submitted and 533 exploration and delineation holes have been drilled within PA-2 area as of July 31, 2023. |
Classification | Tons Ore (000’s) | Tonnes Ore (1000’s) | Average Grade (% eU3O8) | Pounds eU3O8 (000’s) |
| Measured | 70 | 64 | 0.082 | 114.7 |
| Indicated | 1,337 | 1,213 | 0.087 | 2,209.0 |
Total M&I | 1,407 | 1,277 | 0.083 | 2,323.7 |
| Inferred | 2,494 | 2,263 | 0.095 | 4,859.0 |
Total Resources | 3,901 | 3,540 | 0.092 | 7,182.7 |
| 1. | Pounds reported with Disequilibrium Factor (DEF) applied. | |
| 2. | The sum of resource tons and lbs. may not add up to the reported total due to rounding. | |
| 3. | Measured, indicated, and inferred mineral resources as defined in 17 CFR § 229.1300. | |
| 4. | GT Cutoff = 0.30 ft% eU3O8. | |
| 5. | All reported resources occur below the static water table. | |
| 6. | The point of reference for mineral resources is in-situ at the Project. | |
| 7. | Mineral resources that are not mineral reserves do not have demonstrated economic viability. | |
| 8. | A long-term uranium price of $40/lb U3O8 and an 80% metallurgical recovery factor were considered for the purposes of determining the reasonable prospect of economic extraction. |
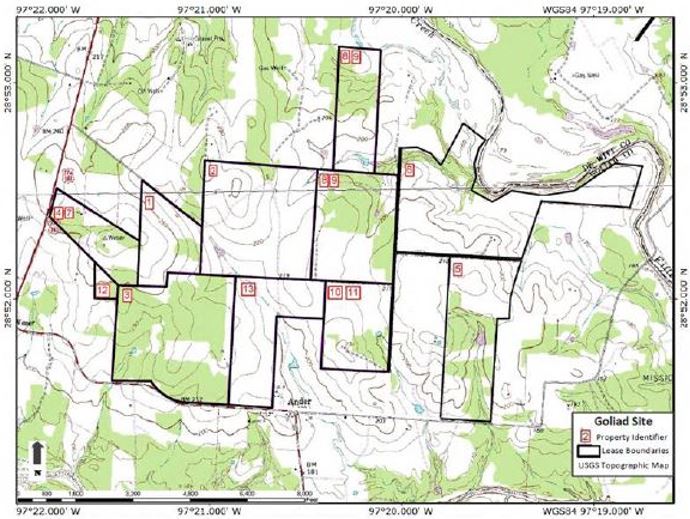
25
Virtually all mining in Texas is onArea. Payments for the private lands with leases negotiated with each individual landowner/mineral owner. Moore Energy Corporation (“Moore Energy”) obtained leases for exploration work in the project area in the early 1980s and completed an extensive drilling program resulting in a historic uranium mineral estimate in 1985. Weare up to date. UEC obtained mining leases from individuals and by assignment from a private entity (Brad A. Moore) in 2006.
At July 31, 2012, we held 20 leases ranging No resources are reported in size from 14 acres to 293 acres, for a total of 2,242 acres. The majority of the leases have starting dates in 2005 or 2006 with an initial term of five years and a five-year renewal option. The various lease fees and royalty conditions are negotiated with individual lessors and terms may vary from lease to lease.
No historic uranium mining is known to have occurred on anyareas outside of the Goliad Project lease properties and only state permitted uranium exploration drillingArea boundary. UEC has taken place. There are believedcompleted all the required permitting in order to be no existing environmental liabilities at the property leases. Prior to any mining activitymine at the Goliad Project we are requiredArea.
Accessibility, Climate, Local Resources, Infrastructure and Physiography
The Goliad Project area is situated in the interior portion of the Gulf Coastal Plain physiographic province. The area is characterized by rolling topography with parallel to sub-parallel ridges and valleys. There is about 130 feet of relief at the site with ground surface elevations ranging from a low of 150 to a high of 280 feet above mean sea level. The leased propertyproperty. A surety estimate for the Goliad Project is used mostly for livestock grazing pastureProject’s restoration, reclamation and woodland. The overall property area is shown as having a Post Oak Woods, Forest, and Grassland Mosaic vegetation/cover type.
26
The site property is accessed from combined route US 77A/183 that trends north-south to the west of the property. Highway FM 1961 intersects with 77A-183 at the crossroad town of Weser. Highway FM 1961 to the east of the intersection trends along the south side of the property. Access from either of these roads into the property is via vehicular traffic on private gravel roads.
The property is in a rural setting at the north end of Goliad County. The nearest population centers are Goliad (14 miles south), Cuero (18 miles north) and Victoria (about 30 miles east). While Goliad and Cuero are relatively small towns, they provide basic needs for food and lodging and some supplies. Victoria is a much larger city and provides a well-developed infrastructure that has resulted from being a regional center to support oil and gas exploration and production. The Goliad Project site area generally has very good accessibility for light to heavy equipment. There is an excellent network of county, state and federal highways that serve the region and the moderate topography, with dominantly sandy, well-drained soils, provides good construction conditions for building gravel site roads necessary for site access.
The climate in Goliad County is mild with hot summers and cool to warm winters. The moderate temperatures and precipitation result in excellent conditions for developing an ISR mine. Periods of freezing temperatures are generally very brief and infrequent. Tropical weather from the Gulf of Mexico can occur during the hurricane season and may affect the site area with large rain storms. The periodic freezing weather and abnormally large rainfalls are the primary conditions that can cause temporary shutdowns. Otherwise there is not a regular non-operating season.
The necessary rights for constructing needed surface processing facilities are in-place on selected lease agreements. Sufficient electric power is believed to be available in the area; however, new lines may be needed to bring additional service to the plant site and wellfields. We believe that within a 30 mile radius of the planned Goliad Project facility there is located sufficient population to supply the necessary number of suitable mining personnel.
History
Ownership History of the Property
The Goliad Project site is located in the north-central portion of Goliad County to the east and north of the intersection of U.S. Routes 77A/183 and Farm to Market Route 1961. Theredecommissioning has been a long history of oilprepared and gas exploration and production in the area and oil and gas is still a primary part of the economy for the relatively lightly populated county. In the period from October 1979 to June 1980, as a part of a large oil, gas and other minerals lease holding (approximately 55,000 acres), Coastal Uranium utilized the opportunity to drill several widely spaced exploration holes in the region. There were reported to be eight holes drilled at or near the Goliad Project area.
In the early 1980s Moore Energy obtained access to review some of the Coastal States wide-spaced drilling exploration data. The review resulted in Moore Energy obtaining several leases from Coastal Uranium, including several of the current Goliad Project leases. During the period from March 1983 through August 1984, Moore Energy conducted an exploration program in the Goliad Project area. No further drilling was done at the Goliad Project area until we obtained the leases through assignment from a private entity and from individual mineral owners.
Exploration and Pre-Extraction Work Undertaken
This description of previous exploration and pre-extraction work undertaken at the Goliad Project is based primarily on electric logs and maps producedapproved by Moore Energy during the period 1983 to 1984. Moore Energy completed 479 borings on various leases. Eight widespread exploration borings were completed by Coastal Uranium in 1980. We obtained leases through an assignment from a private entity in 2006 and from individual mineral owners thereafter, and began confirmation drilling in May 2006. At July 31, 2012, approximately 958 confirmation-delineation holes totaling 338,615 feet have been drilled by the Company to confirm and expand the mineralization base at the Goliad Project. During Fiscal 2012, no exploration, pre-extraction or extraction drilling activities were conducted on the Goliad Project.
27
In December 2010, the Texas Commission on Environmental Quality (“TCEQ”) approved the mine permit and the production area authorization for Production Area 1 and granted the request(TCEQ). A surety bond for the designationcurrent restoration, reclamation and decommissioning requirements will be in place at least 60 days prior to production.
A Technical Report dated March 7, 2008 for Goliad, prepared in accordance with the provisions of National Instrument 43-101, Standards of Disclosure for Mineral Projects of the Canadian Securities Administrators (“NI 43-101”), was completed by Thomas A. Carothers, P.G., a consulting geologist, and filed by the Company on the public disclosure website of the Canadian Securities Administrators atwww.sedar.com. As required by NI 43-101, the Technical Report contains certain disclosure relating to measured, indicated and inferred mineral resource estimates for the Company's Goliad Project. Such mineral resources have been estimated in accordance with the definition standards on mineral resources of the Canadian Institute of Mining, Metallurgy and Petroleum referred to in NI 43-101. Measured mineral resources, indicated mineral resources and inferred mineral resources, while recognized and required by Canadian regulations, are not defined terms under the SEC's Industry Guide 7, and are normally not permitted to be used in reports and registration statements filed with the SEC. Accordingly, we have not reported them in this annual report or otherwisesmaller uranium mining companies from participating in the United States. Investors are cautioned not to assume that any part or all of the mineral resources in these categories will ever be converted into mineral reserves. These terms have a great amount of uncertainty as to their existence, and great uncertainty as to their economic and legal feasibility. In particular, it should be noted that mineral resources, which are not mineral reserves, do not have demonstrated economic viability. It cannot be assumed that all or any part of measured mineral resources, indicated mineral resources or inferred mineral resources discusseddown-dip, deeper undrilled trend extensions. Uranium had been mined by several major oil companies in the Technical Report will ever be upgraded to a higher category. In accordance with Canadian rules, estimates of inferred mineral resources cannot form the basis of feasibility or other economic studies. Investors are cautioned not to assume that any part of the reported measured mineral resources, indicated mineral resources or inferred mineral resources referred topast in South Texas, including Conoco, Mobil, Humble (later Exxon), ARCO and others. Mobil had found numerous deposits in South Texas in the Technical Report are economically or legally mineable.
past, including the O’Hern, Holiday-El Mesquite and several smaller deposits, mostly in Oligocene-age Catahoula Formation tuffaceous sands. ARCO discovered several Oakville Formation (Miocene-age) uranium-bearing deposits and acquired other deposits located nearby in Live Oak County. They were exploring deeper extensions of Oakville Formation trends when they discovered the Mt. Lucas Goliad Formation deposit, located near Lake Corpus Christi in Live Oak County near the Bee County line.
Year | Company | Operations/Activity | Amount (No. of Drill holes) | Results of Work |
1979 | Coastal Uranium, Inc. (Coastal Uranium) | Exploration program. | 12 exploration holes. | Coastal Uranium drilled widely spaced exploration holes in the region as part of the Coastal States wide-spaced drilling exploration effort. Eight of these holes were drilled at or near the Goliad Project Area. Additional information on the exploration is described below. |
1980 | Moore Energy Corporation | Review of data and leases from Coastal Uranium and exploration program. | 479 exploration and delineation holes. | Moore Energy Corporation reviewed the Coastal States exploration data and soon after acquired several leases from Coastal Uranium, including several in the Goliad Project Area. From March 1983 through August 1984, Moore Energy Corporation conducted an exploration program at Goliad. All of the boreholes were drilled using truck-mounted drilling rigs contracted with various drilling companies. Samples were taken by the driller for review and logged by a geologist. The holes were logged for gamma ray, self-potential and resistance by contract logging companies. No down-hole deviation tool was available. Historical resource estimates were prepared by Moore Energy Corporation from data gathered in 1983-1985. For each drill hole, a Grade x Thickness (GT) was determined, and the mineral was outlined with a 0.3 GT contour. The average GT of the holes within the contoured outline was used to estimate the resources meeting the specified criteria. Moore Energy Corporation’s historical resource estimated approximately 3,366,000 tons at an average grade of 0.05% (eU3O8 and an average DEF of 1.494 (Moore, 1986). This equates to approximately 5.2 million lbs of uranium. |
2006 | UEC | Exploration program. | 360 exploration and delineation holes. | UEC obtained mine leases by assignment from Brad A. Moore for the current Goliad Project Area in 2006. UEC drilled 360 more holes at the property from May 2006 through June 2007. These holes include closer-spaced delineation work on the areas drilled by Moore Energy Corporation. Additionally, several of the UEC holes were drilled to further exploration on contiguous leases to the east of the property. A 2007/2008 report by Thomas Carothers, PG estimated historical mineral resources based on the UEC 2006-2007 confirmation drilling results and the Moore Energy Corporation historical estimate. The author concluded that significant uranium resources from the work in 1983-85 described by Moore Energy Corporation appears to be backed and supported by the more recent UEC exploration data. |
2014 | UEC | Exploration and water well program. | 33 exploration holes and two water wells drilled. | In 2014, UEC conducted a drilling program at the Goliad Project Area for exploration and water wells. 35 holes were drilled and logged for exploration and water supply purposes with a majority of the holes being drilled in PA-1 and PA-2. |
Regional Geology
28
Local and Property Geology
TheGoliad Formation occurs at surface of the property is all within the outcrop area ofon the Goliad Formation (Figure 4-3).Project Area. The mineralized units are sands and sandstonesandstones within the Goliad Formation and are designated by usUEC as the A through D sands from younger (upper) to older (lower), respectively. The sand units are generally fine to medium grainedmedium-grained sands with silt and varying amounts of secondary calcite. The sand units vary in color depending upon the degree of oxidation-reduction and could be from light brown-tan to grays.gray. The sandssand units are generally separated from each other by silty clay or clayey silts that serve as confining units between the sand units.

29
The Goliad Formation at the project site occurs from the surface to a depth of about 500 feet. Depending upon the land surface elevation, groundwater occurs in the sands of the formation below depths of about 30 to 60 feet.
Groundwater from sands of the Goliad Formation is used for water supplies over much of the northern portion of Goliad County. Water quality in the
The site area structures include two faults that intersect and offset the mineralized units. These faults are normal faults, with one downthrown toward the coast and one downthrown toward the northwest. The fault throws range from about 40 to 80 feet.
Project Type
Classification | Tons Ore (000’s) | Tonnes Ore (1000’s) | Average Grade (% eU3O8) | Pounds eU3O8 (000’s) |
| Measured | 1,595 | 1,447 | 0.053 | 2,667.9 |
| Indicated | 1,504 | 1,364 | 0.102 | 3,492.0 |
Total M&I | 3,099 | 2,811 | 0.085 | 6,159.9 |
| Inferred | 333 | 302 | 0.195 | 1,224.8 |
Total Resources | 3,432 | 3,113 | 0.079 | 7,384.7 |
| 1. | Pounds reported with Disequilibrium Factor (DEF) applied. | |
| 2. | The sum of resource tons and lbs. may not add up to the reported total due to rounding. | |
| 3. | Measured, indicated, and inferred mineral resources as defined in 17 CFR § 229.1300. | |
| 4. | GT Cutoff = 0.20 ft% eU3O8. | |
| 5. | All reported resources occur below the static water table. | |
| 6. | The point of reference for mineral resources is in-situ at the Project. | |
| 7. | Mineral resources that are not mineral reserves do not have demonstrated economic viability. | |
| 8. | A long-term uranium price of $40/lb U3O8 and an 80% metallurgical recovery factor were considered for the purposes of determining the reasonable prospect of economic extraction. |
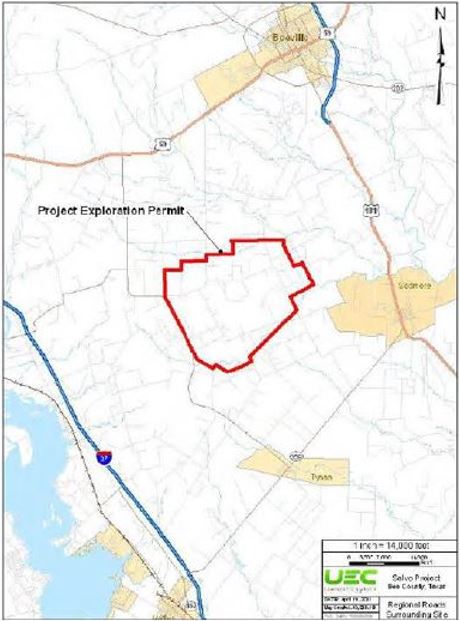
Year | Company | Operations/Activity | Amount (No. of Drill holes) | Results of Work |
Unknown to 1983 | Nufuels | Original controller of the Salvo Project Area. | 111 exploration holes. | Nufuels discovered uranium mineralization in La Para sands of the Miocene-aged Goliad Formation in 1982 in Bee County, Texas. Mobil’s reconnaissance drilling located two areas of interest, known as the Salvo and Segar projects. Mobil had drilled a total of 111 exploration holes at Salvo and Seger in 1982. Shortly after conducting their exploration drilling in this area, Mobil elected to discontinue their uranium exploration efforts and sell their uranium production facilities. The early Salvo exploration drilling conducted by Nufuels indicated significant uranium mineralization was present. |
1983 | URI joint venture with Saaberg Interplan Uran Gmbh (“SIPU”) (“URI/SIPU”) | URI formed a joint venture exploration program with SIPU, a German utility. URI/SIPU acquired Salvo from Mobil, along with the Seger Project, an eastward extension along the same geochemical roll-front system. URI/SIPU leased the property until about 1993 when secondary lease expired. | 295 exploration and delineation holes in 1984. 19 exploration holes at the nearby Seger Project. | URI/SIPU calculated a resource of approximately 1.5 million pounds U3O8 at Salvo using a 0.5 GT cutoff in 1984. Average GT was modeled at 0.989, with a ratio of 0.194, width of 45 ft, length of 140 ft, and tonnage factor of 1.236 lbs/ft2. Due to low uranium prices, URI/SIPU elected not to permit the project at that time (R.B. Smith, unpublished report, 2005). URI utilized a Monte Carlo-based computer simulation to calculate the historic resource (URI, 1984). |
2005 | R.B. Smith & Associates Inc. (“R.B. Smith”) | Review of past exploration data. | N/A | R.B. Smith (2005) completed an evaluation of the Goliad Formation trend project data at the Salvo and Seger projects. Data were on loan from URI/SIPU. Smith did not retain copies of maps or electric logs, and the original data set of logs and maps was returned to URI. URI held the data in storage until 2010. |
2010 | UEC | The Salvo Project Area was acquired by UEC from URI/SIPU. UEC negotiated a purchase of available data from URI. URI and UEC reached agreement on sales of Salvo and Seger project data in 2010. The adjacent Seger property is no longer included in UEC’s Salvo leases. | N/A | Ownership transition. UEC received 425 exploration log files, and several drill hole location maps and land maps. The 425 log files include good quality electric logs from Mobil’s activities at Seger and Salvo in 1982, as well as URI/SIPU’s drill hole logs from exploration activities in 1984. Each log file also contains a detailed lithological report based on drill hole cuttings prepared by Mobil’s and later by URI’s field geologists supervising and monitoring drilling activity. Four core holes were drilled by URI, and core analysis reports were included in the appropriate log files. Eight holes were logged by Princeton Gamma-Tech (PGT, and early form of PFN), a logging company which specialized in uranium chemical assay logging. The PGT logs were utilized and verified as having excellent correlation to actual chemical uranium content by several south Texas ISR mining operations. These results are believed to be pertinent to the understanding of this deposit and indicated a generally positive DEF like other known Goliad Formation sandstones in the region. The historic mineralized intercepts from URI exploration boreholes were presented in the initial NI 43-101 UEC Salvo Project TRS dated July 16, 2010. The estimated historic uranium resource (URI 1984 classification only) of approximately 1.5 million pounds eU3O8 was determined but was not verified independently. However, it was presented in the initial 43-101 TRS. |
The other Goliad projects in the region include the Palangana Mine, the Kingsville Dome mine southeast of Kingsville, the Rosita mine west of Alice, the Mestena mine in Brooks County and the former Mt. Lucas mine at Lake Corpus Christi. These mines are all located south of the Goliad Project from about 60 to 160 miles. The average tons and uranium grade information for these mines is not known, but all these ISR projects mining Goliad Formation sand units have been very successful with the following characteristics in common: excellent leaching characteristics rate, and favorable hydraulic conductivity of host sands.
30
Mineralization
The Goliad Project uranium-bearing units occur as multiple roll front type structures in vertically stacked sands and sandstones. Groundwater flowing from northwest to southeast in the Goliad sands likely contained low concentrationsGeologic Atlas of dissolved uranium resulting from oxidizing conditions and the relatively short distance from the recharge area. The geochemical conditions in the sands near our property changed from oxidizing to reducing due to an influx of reductants. Hydrogen sulfide and/or methane dissolved in groundwater are likely sources of creating a reduction-oxidation boundary in the area with consequent precipitation and concentration of uranium mineralization.
Specific identification of the uranium minerals has not been done at the Goliad Project. The very fine uranium minerals found coating quartz grains and within the interstices in most south Texas, sand and sandstone roll-front deposits has generally been found to be dominantly uraninite. No uraninite has been identified on the Goliad Project and the presence of uraninite on other propertiesBeeville-Bay City Sheet does not mean that such mineralization will be found on the Goliad Project. Detailed petrographic examination of disseminated uranium mineralization within sands/sandstones is generally not suitable for identification of the specific uranium minerals. Laboratory equipment such as x-ray diffraction units may be used to identify the minerals, however the specific mineral species typically found in reduced sands are generally similar in south Texas ISR projects and leaching characteristics are also similar. Based on the experience of the ISR mines throughout south Texas, the use of gamma-ray logging with a calibrated logging probe has become the standard method to determine the thickness and estimated grade of uranium bearing minerals.
At the project site the Goliad Formation is exposedshow any faulting at the surface in the Salvo Project Area.
Classification | Tons Ore (000’s) | Tonnes Ore (1000’s) | Average Grade (% eU3O8) | Pounds eU3O8 (000’s) |
| Measured | - | - | - | - |
| Indicated | - | - | - | - |
Total M&I | - | - | - | - |
| Inferred | 1,125 | 1,020 | 0.091 | 2,839.0 |
Total Resources | 1,125 | 1,020 | 0.091 | 2,839.0 |
| 1. | Pounds reported with Disequilibrium Factor (DEF) applied. | |
| 2. | The sum of resource tons and lbs. may not add up to the reported total due to rounding. | |
| 3. | Measured, indicated, and inferred mineral resources as defined in 17 CFR § 229.1300. | |
| 4. | GT Cutoff = 0.30 ft% eU3O8. | |
| 5. | All reported resources occur below the static water table. | |
| 6. | The point of reference for mineral resources is in-situ at the Project. | |
| 7. | Mineral resources that are not mineral reserves do not have demonstrated economic viability. | |
| 8. | A long-term uranium price of $40/lb U3O8 and an 80% metallurgical recovery factor were considered for the purposes of determining the reasonable prospect of economic extraction. |
Leach Amenability
Mineral processing or metallurgical testing was not reported as being conducted on any of the samples drilled or recovered during the Moore Energy exploration in the mid-1980s. We submitted selected core samples from our core hole # 30892-111C to Energy Laboratories, Inc. in Casper, Wyoming, in January 2007. These samples from the Goliad Project were sent to the laboratory for leach amenability studies intended to demonstrate that uranium mineralization at the property was capable of being leached using conventional in situ leach chemistry. The tests do not approximate other in-situ variables (permeability, porosity, and pressure) but provide an indication of a sample's reaction rate and the potential chemical recovery.
Split sections of core were placed in laboratory containers and a lixiviate solution with 2.0grams per liter HCO3(NaHCO3) and either 0.50 or 0.25 g/L of H2O2(hydrogen peroxide) was added to each test container. The containers were then rotated at 30 rpm for 16 hours. The lixiviate was then extracted from each test container and analyzed for uranium, molybdenum, sodium, sulfate, alkalinity (bicarbonate, carbonate), pH and conductance. A clean charge of lixiviate was added and the container rotated another 16 hours. Each sample rotation and lixiviate charge cycle was representative of five pore volumes with chemical analyses after each cycle. The cycle was repeated for a total of six cycles or the equivalent of 30 pore volumes.
The four core samples subjected to the leach amenability tests were determined to contain from 0.04% to 0.08% cU3O8 before testing. Leach tests conducted on the core samples from the A Zone indicate leach efficiencies of 60 to 80% U3O8 extraction, while the tails analyses indicate efficiencies of 87-89%. The differences between the two calculations involve the loss of solid clay based materials during multiple filtrations. Based on post leach solids analysis, the core intervals were leachable to a very favorable 86 to 89%. After tests the tails were reanalyzed for uranium concentration to determine the recovery, which ranged on the four samples using two methods from 60% to 89%.
31
Laboratory amenability testing of the cores samples indicated the uranium (dissolved elemental U) recoveries ranged from 86.4% to 88.9% in the four tests. These results show that the mineralized intervals at the Goliad Project are very amenable to ISR mining even when exposed to only one-half of the oxidant concentration normally used in the Leach Amenability test. Based on the Company's experience with ISR mining of Catahoula and Oakville uranium deposits, as well as discussions with other Goliad deposit mining personnel, the geologically younger deposits in Texas (Goliad formation) have been the most amenable to in situ leaching. The uranium recovery is generally more complete (% recovery) and occurs in a shorter time period. Both of these factors are important for ISR mine pre-extraction economics.
Based on the amenability test results, the size of the mineralization at the Goliad Project, the geologic setting and the current and projected future demand and price of uranium, the most feasible and cost effective mining method for the Goliad property uranium iscompilation produced by ISR. This method is most suitable for the size and grade of the deposits in sands that are below the water table and situated at depths that would be prohibitive for open pit or underground mining.
The amenability testing described above was conducted on core recovered from four depth intervals from one boring. While this was a limited sampling for this property, the samples are believed to be generally representative of the characteristics of the mineralized intervals and the determined recovery ranges for these intervals is considered to be reliable. Two of the four samples tested contained approximately 0.08%cU3O8and two contained lower grades of uranium (~0.04% cU3O8). Energy Laboratories, Inc. in Casper, Wyoming, conducted the laboratory testing for this project. The laboratory has been in business since 1952, is fully certified, but not ISO certified. Certifications include the US Environmental Protection Agency, US Nuclear Regulatory Commission and the following US states: Arizona, California, Colorado, Florida, Indiana, Nevada, Oregon, South Dakota, Texas, Utah and Washington.
Update to July 31, 2012
Goliad’s Waste Disposal Well Permit was issued by the TCEQ on May 25, 2010;
Goliad’s Mine Area Permit was issued by the TCEQ on April 29, 2011;
Goliad’s PAA-1 Permit was issued by the TCEQ on April 29, 2011;
Goliad’s Radioactive Materials License was issued by the TCEQ on December 20, 2011; and
EPA continues to review the Aquifer Exemption which is the last and final permit needed to begin uranium extraction.
We have not established proven or probable reserves, as defined by the SEC under Industry Guide 7, through the completion of a “final” or “bankable” feasibility study for the Goliad Project. Furthermore, we have no plans to establish proven or probable reserves for any of our uranium projects for which we plan on utilizing ISR mining, such as the Goliad Project.
Mineral Exploration Projects
We hold mineral rights in the U.S. States of Arizona, Colorado, New Mexico, Texas and Wyoming and in Paraguay by way of federal mining claims, state and private mineral leases and mineral concessions.
We plan to conduct exploration programs on these mineral exploration properties with the objective of determining the existence of economic concentrations of uranium. We have not established proven or probable reserves, as defined by the SEC under Industry Guide 7, through the completion of a “final” or “bankable” feasibility study for any of the uranium projects discussed below. Furthermore, we have no plans to establish proven or probable reserves for any of our uranium projects for which we plan on utilizing ISR mining.
Arizona
All of our Arizona claims and state leases were previously the subject of exploration drilling for the search of uranium by companies such as Noranda, Inc., Uranerz Energy Corp., Homestake Mining Co., Occidental Minerals and Oklahoma Public Services ("OPS"). We have acquired a 1979 OPS geologic report contiguous to our claims (Artillery Peak), as well as gamma-ray logs from Homestake, which indicates the possibility of the occurrence of uranium. OPS drilling continued on to our claims as evidenced by drill holes verified on the ground, and such drill cuttings were found to be radioactive. Close spaced developmental drilling is indicated on our claims located at Artillery Peak.
32
Other claims staked by us (Dry Mountain) in Arizona were staked on known uranium occurrences as shown on Arizona State publication, "Occurrences of Uranium in Miscellaneous Sedimentary Formations, Diatremes and Pipes and Veins". Additionally, these claims were previously drilled by companies including Homestake Mining Co., Uranerz Energy Corp. and Noranda, Inc. in the 1970s during the uranium boom. Our management has confirmed prior claim ownership as verified with the U.S. Department of Interior - BLM. In addition, ground surveys completed by us have located various previous drill locationsEnergy in 1980 estimated that over 18 Mlb. of uranium oxide was produced out of Arizona between 1948 and radioactive anomalies as evidenced1970. (Scarborough, R.B., 1981)
| ● | all exploration and mining activities must comply with the National Environmental Policy Act (NEPA); and |
| ● | required environmental permits and licenses would include but may not be limited to: |
| ● | Mine Land Reclamation Plan; Arizona State Mine Inspector; |
| ● | Exploration Permit; Arizona State Land Department; |
| ● | Plan of Operations; Bureau of Land Management; |
| ● | Source Material License; U.S. Nuclear Regulatory Commission; |
| ● | Water Wells and Appropriations; Arizona Department of Water Resources; |
| ● | Dams and Impoundments; Arizona Department of Water Resources; |
| ● | Air Quality Control Permit; Arizona Department of Environmental Quality; |
| ● | Water and Stormwater Discharge Permits; Arizona Department of Environmental Quality; |
| ● | Hazardous Waste; Arizona Department of Environmental Quality and EPA; |
| ● | Solid Waste; Arizona Department of Environmental Quality; |
| ● | Mine Safety and Health; Arizona State Mine Inspector and MSHA; and |
| ● | County Zoning and Construction Permits. |
Arizona:north and northeast, and the Rawhide, Buckskin and McCracken Mountains, to the west. To the south and southeast the basin is bordered by a low drainage divide imposed by the Harcuvar and the Black Mountains. The margins of the basin are filled with early Paleogene volcanic flows and volcaniclastic sediments. The basin itself is filled with Oligocene to Miocene lacustrine and deltaic sediments covered by a thick mantle of Quaternary valley fill.
| ● | Precambrian or Jurassic granitic basement complex; |
| ● | Lacustrine clastic and volcanic members of the Palaeocene-Eocene Artillery Peak Formation; |
| ● | Arrastra Volcanic Complex, including dacitic intrusions, andesitic flows and volcaniclastic members of Paleogene age; |
| ● | Chapin Wash Formation, Anderson Mine lacustrine sediments of Miocene age; |
| ● | Conglomeratic-sandstone unit, possibly equivalent to upper Chapin Wash Formation; |
| ● | Miocene basalt; |
| ● | Pliocene-Pleistocene conglomerate; and |
| ● | Quaternary alluvium. |
A Technical Report dated June 19, 2012 forwest-central Arizona, approximately 75 miles northwest of Phoenix and 43 miles northwest of Wickenburg (latitude 34°18'29" N and longitude 113°16'32" W, datum WGS84). The general area is situated along the northeast margin of the Date Creek Basin. The Anderson Project prepared in accordance with NI 43-101, was completed by Bruce Davis and Robert Simm, consulting geologists, and filed by the CompanyArea is located on the public disclosure websitesouth side of the Canadian Securities Administrators atwww.sedar.comSanta Maria River, approximately 13 miles west of State Highway 93 (refer to Project Location Map). The Technical Report contains certain disclosure relating to inferred and indicated mineral resource estimates for the Anderson Project. Such mineral resources have been estimated in accordance with the definition standards on mineral resources of the Canadian Institute of Mining, Metallurgy and Petroleum referred to in NI 43-101. Inferred and indicated mineral resources, while recognized and required by Canadian regulations, are not defined terms under the SEC's Industry Guide 7, and are normally not permitted to be used in reports and registration statements filed with the SEC. Accordingly, we have not reported them in this annual report or otherwise in the United States. Investors are cautioned not to assume that anyProject Area occupies part or all of Sections 1 and 3, 9 through 16, 21 through 27, and 34 of Township 11 North, Range 10 West and portions of Sections 18, 19, and 30 of Township 11 North, Range 9 West of the Gila and Salt River Base Meridian.
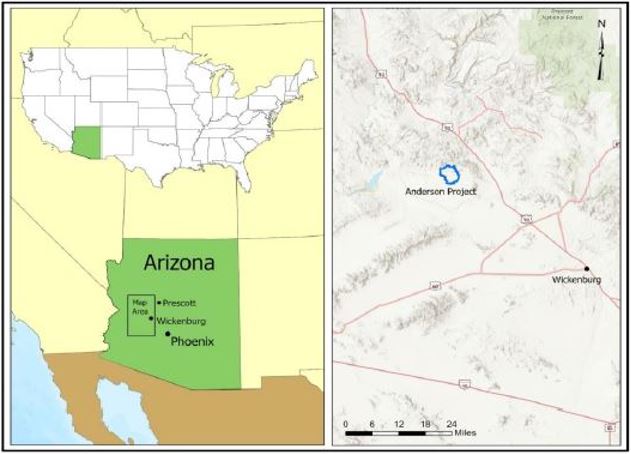
| ● | Crystalline Intrusive Rocks: coarse-grained to pegmatitic Precambrian granite; |
| ● | Felsic to Intermediate Volcanic: flows, breccias, tuffs and minor intrusive; |
| ● | Felsic to Intermediate Volcaniclastic: ash flows, tuffaceous beds and arkosic sandstone; |
| ● | Andesitic Volcanic: porphyritic andesitic flows with a paleosurface and locally reddish-brown paleosols; |
| ● | Lacustrine Sedimentary rocks: micaceous siltstones and mudstone, calcareous siltstones and silty limestone, thin beds of carbonaceous siltstone and lignitic material and host of uranium mineralization, averaging about 60 to 100 meters thick; |
| ● | Lower Sandstone Conglomerate: arkosic sandstones and conglomerate, averaging about 60 to 100 meters thick; |
| ● | Basaltic Flows and Dikes: amygdular basalt, averaging about 20 meters thick; |
| ● | Upper Conglomerate: cobble and boulder conglomerate, partly indurate and locally calcite cemented, averaging about zero to 60 meters thick; and |
| ● | Quaternary Alluvium: unconsolidated sand and gravel, caliche formed where calcite cemented. |
Classification | Tons Ore (000’s) | Tonnes Ore (1000’s) | Average Sum Thickness (ft) | Average Grade (% eU3O8) | Pounds eU3O8 (000’s) |
| Measured | - | - | - | - | - |
| Indicated – Zone A | 862 | 782 | 3.8 | 0.111 | 1,907 |
| Indicated – Zone B | 7,347 | 6,665 | 9.5 | 0.108 | 15,816 |
| Indicated – Zone C | 6,211 | 5,634 | 10.4 | 0.094 | 11,730 |
| Indicated – Zone D | 760 | 689 | 3.2 | 0.093 | 1,421 |
| Indicated – Zone E | 911 | 826 | 7.6 | 0.060 | 1,095 |
| Indicated – Zone F | 84 | 76 | 4.6 | 0.051 | 86 |
Total M&I | 16,175 | 14,673 | 8.2 | 0.099 | 32,055 |
| Inferred | - | - | - | - | - |
Total Resources | 16,175 | 14,673 | 8.2 | 0.099 | 32,055 |
| 1. | The sum of resource tons and lbs. may not add up to the reported total due to rounding. | |
| 2. | Measured, indicated, and inferred mineral resources as defined in 17 CFR § 229.1300. | |
| 3. | GT Cutoff = 0.1 ft% eU3O8 and metallurgical Recovery estimated at 90%. | |
| 4. | Economic factors have been applied to the estimates in consideration of reasonable prospects for economic extraction. | |
| 5. | The point of reference for mineral resources is in-situ at the Project. | |
| 6. | Mineral resources that are not mineral reserves do not have demonstrated economic viability. | |
| 7. | A long-term uranium price of $65/lb U3O8 was considered for the purposes of determining the reasonable prospect of economic extraction. |
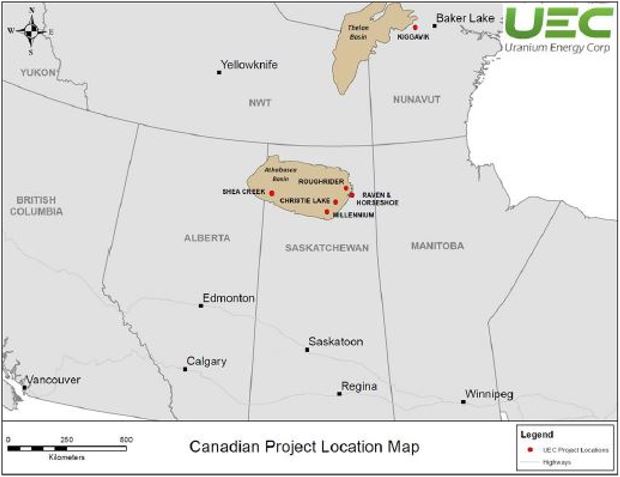
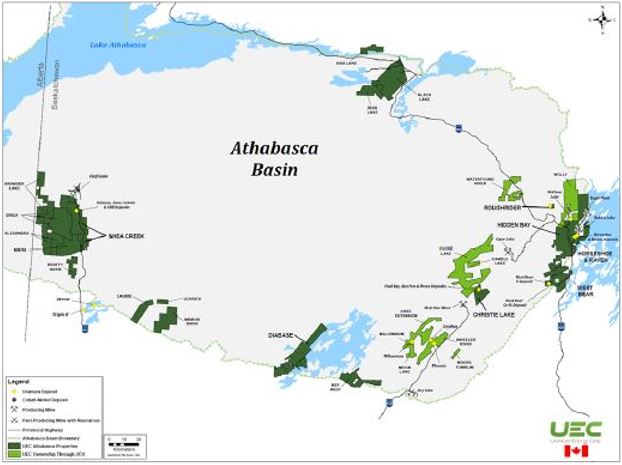
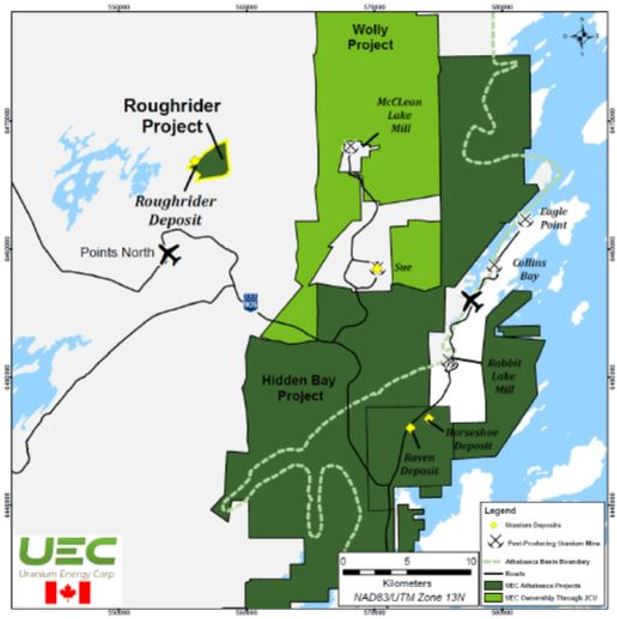
Arizona: Workman Creekeastern Athabasca basin of northern Saskatchewan, Canada. The Roughrider Project
Area is approximately 440 kms north of La Ronge, and 700 kms north of Saskatoon, at the coordinates 556,545E and 6,466,820N UTM. The Workman CreekRoughrider Project Area is an Exploration Stage property within the 597-hectare mineral lease ML-5547, which is 100% held by UEC. The Roughrider Project Area site comprises core logging, office and storage facilities.
A Technical Report dated July 7, 2012 for the Workman Creek Project, preparedAthabasca Basin, Saskatchewan, of which 90% of the remaining 92% working interest was held by Hathor. One of the claims was S-107243. Terra’s interest was to be carried in accordance with NI 43-101, was completed by Neil G. McCallum, P.G.all respects through to the completion of a feasibility study and Gary H. Giroux, P.E., a consulting geologist and engineer, respectively, and filed by the Company on the public disclosure websiteannouncement that the claims will be put into commercial production. On March 24, 2008, Terra announced that it had closed its agreement with Bullion Fund to purchase Bullion Fund’s remaining 2% of the Canadian Securities Administrators atwww.sedar.com. The Technical Report contains certain disclosure relating to inferred mineral resource estimates for the Workman Creek Project. Such mineral resources have been estimated in accordance with the definition standards on mineral resources of the Canadian Institute of Mining, Metallurgy and Petroleum referred to in NI 43-101. Inferred mineral resources, while recognized and required by Canadian regulations, is not a defined term under the SEC's Industry Guide 7, and are normally not permitted to be used in reports and registration statements filed with the SEC. Accordingly, we have not reported them in this annual report or otherwiseHathor’s carried working interest in the United States. Investors are cautioned notproject. This purchase increased Terra’s holding to assumea 10% carried working interest through to the completion of a feasibility study and the public announcement that any part orthe claims will be put into commercial production.
Mining Scenario | Deposit | Classification | Tons (‘000’s) | Tonnes (‘000s) | Grade (% U3O8) | Pounds U3O8 (‘000s) |
| Cut & Fill | RRW | Indicated | 44 | 40 | 3.38 | 3,000 |
| Inferred | 12 | 11 | 3.64 | 800 | ||
Long Hole Open Stope | RRW | Indicated | 176 | 160 | 4.62 | 16,200 |
| Inferred | 75 | 68 | 6.06 | 9,100 | ||
| RRE | Indicated | - | - | - | - | |
| Inferred | 256 | 232 | 4.41 | 22,600 | ||
| RRFE | Indicated | 208 | 189 | 2.07 | 8,600 | |
| Inferred | 53 | 48 | 3.26 | 3,500 | ||
| Combined RRW, RRE, and RRFE | ||||||
| Total | Indicated | 429 | 389 | 3.25 | 27,800 | |
| Inferred | 396 | 359 | 4.55 | 36,000 | ||
| 1. | Mineral Resources are not Mineral Reserves and do not have demonstrated economic viability. | |
| 2. | Mineral Resources are reported exclusive of Mineral Reserves. There are no Mineral Reserves for the Project. | |
| 3. | Mineral Resources are reported on a 100% ownership basis. | |
| 4. | Mineral Resources are reported diluted within the MSO shapes based on a U3O8 price of US$56/1b of U3O8 and metallurgical recovery of 97%. Cut and Fill (“C&F”) and long-hole open stoping (“LHOS”) scenario cut-off grades are 0.52% U3O8 and 0.45% U3O8 respectively. | |
| 5. | The Mineral Resources were estimated by SRK, a third-party QP under the definitions defined by S-K 1300.The tonnage (presented in metric tonnes), grade (%), and contained metal (metric tonnes and imperial pounds) have been rounded to reflect the accuracy of the estimates. |
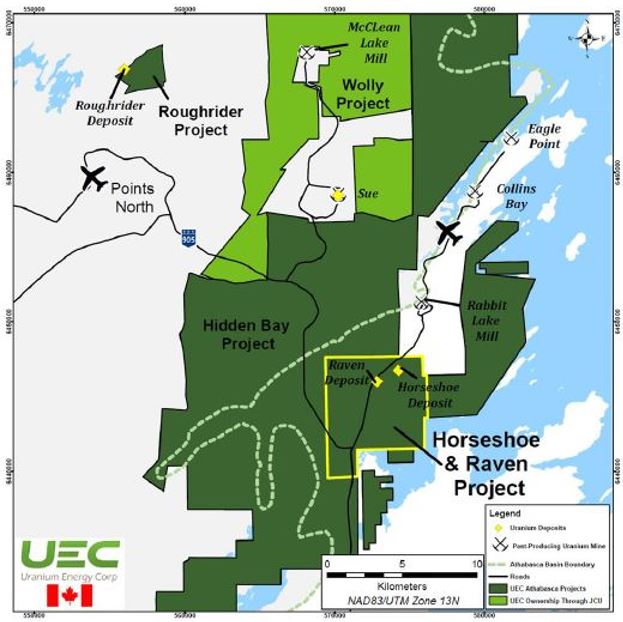
33
owned by the Crown and managed by the Saskatchewan Ministry of the Economy through the Crown Minerals Act and the Mineral Tenure Registry Regulations, 2012. Staking for mineral dispositions in Saskatchewan is conducted through the online staking system, Mineral Administration Registry Saskatchewan (“MARS”). The following table provides information relatingmineral disposition for the Horseshoe-Raven Project Areay was staked in 1977. Accordingly, ground staking methods were employed prior to ourthe initiation of staking by the MARS system. These dispositions give the stakeholders the right to explore the lands within the disposition area for economic mineral rights located in Arizona:
Colorado
Claims and leases acquired by us in Colorado have historical production tonnages and grades published
Pursuant to a Uranium Mining Lease dated May 23, 2012,Horseshoe-Raven Project Area and over the Company acquired from URenergy, LLC a mining lease for uranium on the Slick Rock Project located in San Miguel and Montrose Counties, Colorado. The Slick Rock Project is subject to a 3.0% production royalty requiring an annual advance royalty payment of $30,000 beginning on November 30, 2017.
Since January 2011, the Company has staked a total of 129 claims in the Slick Rock district of the Uravan Mineral Belt. In June 2011, the Company acquired 103 claims from Spider Rock Mining also in the Slick Rock District for a one-time payment of $500,000. As a result, the Company now holds a total of 293 contiguous claims in the Slick Rock District.
The following table provides information relating to our mineral rights located in Colorado:
New Mexico
The West Ranch Project consists of approximately 7,000 acres made up of lode mining claims and private leases in northwestern New Mexico, on the northwestwest end of the historically uraniferous Ambrosia Lake trendRaven Deposit. Year-round access is possible by truck. The topography of the Grants Uranium District.Horseshoe-Raven Project Area is relatively flat characterized by undulating glacial moraine, outwash and lacustrine plains. There is no permanent infrastructure on the project, a temporary work camp and core logging facility are the only infrastructure on the project area. Access to electricity is by diesel generator, but future mining operations would utilize the Saskatchewan Power grid that is nearby the project. Personnel can be drawn from local communities of Wollaston, Black Lake, Stony Rapids, Fond du Lac, that have supplied personnel for mining operations in the eastern Athabasca Basin for decades. Sources of water near the project area are plentiful and should not be a constraining factor. The property was drillednearest airport for public use is at Points North Landing, approximately 40 kilometres (25 miles) by United Nuclear Corporation and, more recently, by Kerr McGee. Historical wide-spacedroad to the northwest of the project area. There are no rail lines or port facilities near the project area.
Grants Ridge is a Todilto Formation targetmixed sequence of metamorphosed arkosic sandstones and pelitic to semi-pelitic gneisses that make up four successive lithostratigraphic units, of which the upper three are present in the Grantsdeposit area:
| ● | a basal pelitic gneiss composed of coarse, mature quarzitic to arkosic metasedimentary rocks; |
| ● | a meta-pelite, commonly graphitic and interlayered with quartzitic semi-pelite and calc-silicate; |
| ● | a thick meta-arkose interlayered with minor calc-silicate and pelite; and |
| ● | upper amphibole-quartzite interlayered with calcareous metasedimentary rocks and graphitic pelite, known as the Hidden Bay assemblage. |
34
the uranium mineralization occurs in two sub-horizontal tabular zones that are oriented parallel to the axial plane of the folded arkose-quartzite package.
Deposit | Classification | Tons (‘000s) | Tonnes (‘000s) | Grade (% U3O8) | Pounds U3O8 (‘000s) |
| Horseshoe | Indicated | 5,493 | 4,983 | 0.215 | 23,600 |
| Raven | Indicated | 5,919 | 5,370 | 0.117 | 13,800 |
Resources were estimated using a COG of 0.05% U3O8. COG was determined using a uranium price of $75 / lb and metallurgical recovery of 95%. | ||
sale. Project Area, drill data from 543 drill holes, including hole location and radiometric equivalent data in 0.1 m downhole increments, were available for the preparation of the TRS. the mining canon equivalent to $2.5 per hectare, equivalent to a final amount of $293,080 and to make minimum investments equivalent to $690,000 per year during the phase of exploitation. In addition, the Company’s subsidiary must report quarterly to the Enforcement Authority on the progress of the project, as well as once the production stage has begun. TPSA must also pay a 2.5% royalty to the Republic on all production, based on the production at the point of sale according to the Law 3575/2008.- 90 -Shea Creek ProjectAn independent TRS for the Shea Creek Project area (the “Shea Creek Project Area”) has been prepared for UEC, under the supervision of Chris Hamel, David Alan Rhys, and James Gray (the “QPs” herein), pursuant to S-K 1300. This TRS identifies and summarizes the scientific and technical information and conclusions reached from the IA to support disclosure of mineral resources on the Shea Creek Project Area.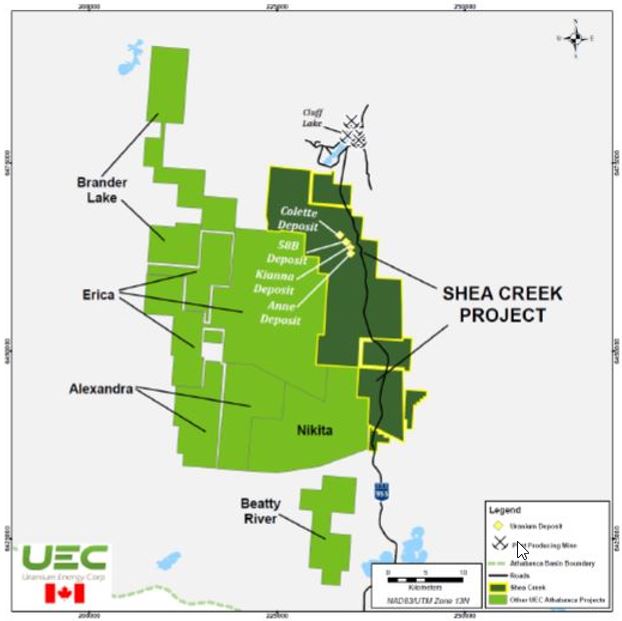 Figure 2.24 – Location of the Shea Creek Project
TexasProperty DescriptionWe currently own ten exploration leasesThe Shea Creek Project Area comprises 18 mineral dispositions totaling 32,962 hectares (“ha”) (330 km2), which are registered to and administered by ORANO. ORANO acts as project operator.UEX Corporation (“UEX Corp.”; having amalgamated with UEX, UEC’s wholly-owned subsidiary now) acquired its interest in the Shea Creek Project Area through an option agreement that was signed in March 2004 (the “2004 Agreement”). Under the 2004 Agreement, UEX Corp. was granted an option to acquire a 49% interest in eight uranium projects located in the South Texas Uranium Trend.Western Athabasca Basin that included the Shea Creek Project Area, from COGEMA Resources Inc. (“COGEMA”), the predecessor to AREVA, which subsequently became ORANO. To acquire the initial 49% interest, UEX Corp. was required to fund C$30 million in exploration expenditures over an 11-year period. UEX Corp. fulfilled the option terms of the 2004 Agreement well ahead of the maximum 11-year period by December 31, 2007. Under the terms of the 2004 Agreement, UEX Corp. granted AREVA (now ORANO) a royalty in an amount equal to US$0.212 per pound of future uranium in concentrate produced from the Anne and Colette deposits to a maximum total royalty of $10.0 million.In April 2013, AREVA granted UEX Corp. an option to increase UEX Corp’s interest in the nine Western Athabasca Projects (the “Projects”), which include the Shea Creek Project Area, to 49.9% through the expenditure by UEX Corp. of an aggregate of C$18.0 million (the "Additional Expenditures") on exploration drilling intended to advance the four known Shea Creek deposits (the “2013 Agreement”). This 2013 Agreement expired on December 31, 2018, with exploration expenditures of C$1,949,275 attributed to the option that earned UEX Corp. the additional equity above the 2004 Agreement to attain a 49.0975% equity interest in the Shea Creek Project Area.- 91 -In Saskatchewan, mineral resources are owned by the Crown and managed by the Saskatchewan Ministry of the Economy through the Crown Minerals Act and the Mineral Tenure Registry Regulations, 2012. Staking for mineral dispositions in Saskatchewan is conducted through the online staking system, MARS. Accordingly, ground staking methods were employed prior to the initiation of staking by the MARS system. These dispositions give the stakeholders the right to explore the lands within the disposition area for economic mineral deposits.Access to the property is by highway 955, approximately 230 km north of the community of La Loche and 5 km south of the formerly producing Cluff Lake mine, the highway passes through the property and within about 2 km of the deposit area. Much of the deposit area is below areas of dry ground, and accessible year-round. There is an unmaintained airstrip at the former Cluff Lake mine. Water is abundant in the area and is not perceived to be a constraint on project development. Personnel to operate future operations could be drawn from the local communities of La Loche, Buffalo Narrows, and several other communities in the area that have people experienced in uranium mining operations. There is currently no grid power supply to the Property. The locationelectrical grid power source is approximately 300 km away at the Key Lake switching station. No buildings or ancillary facilities are currently present at the site of the Property.HistoryThe western portions of the Athabasca Basin were initially explored in the 1960s as exploration activities expanded outward from the established Beaverlodge uranium district. After airborne radiometric surveys in the late 1960s, ground prospecting followed by drilling led to the discovery of the Cluff Lake deposits. Production from the Cluff Lake deposits commenced in 1980 and acquisitionoperations continued until 2002. Total production from the Cluff Lake mine site amounted to 64.2 million pounds U3O8 at an average grade of these leases are based0.92% U3O8, from several deposits.Despite its proximity to Cluff Lake, systematic exploration on historical information contained within our extensive database,the Shea Creek Project Area did not commence until 1990 when Amok Limited (“Amok”) conducted an airborne GEOTEM EM survey, which identified conductive north-northwest trending zones underlying the Athabasca sandstone sequence. Subsequent follow-up with ground EM surveys further refined the position of the conductors, prompting Amok to reduce their mineral permit area claim to claims that now comprise the Shea Creek Project Area. Amok drilled several of the EM conductors in 1992, intersecting narrow intervals of uranium mineralization in northern parts of the Shea Creek Project Area near the sub-Athabasca unconformity. In 1993, ownership of the Shea Creek Project Area was transferred to COGEMA (now ORANO), who continued exploration by drilling to the north the same conductive basement unit – now known as well as current, ongoing geologic analyses by our exploration staff.Texas: Salvo ProjectThe Salvo Project is a 5,340-acre property locatedthe Saskatoon Lake Conductor (“SLC”) – and between 1994 and 2000, drilled more than 95,000 meters in Bee County, Texas.A Phase I exploration drill program156 drillholes. These resulted in the discovery of the Anne and Colette deposits. Between 2000 and 2003, no drilling was completed, but additional airborne and ground EM surveys were undertaken to further enhance targeting.In March 2004, COGEMA (subsequently AREVA and now ORANO) and UEX Corp. signed the 2004 Agreement. Drilling re-commenced and was funded by UEX Corp., and between 2004 and December 2012, approximately 141,317 meters of drilling in April 2011307 diamond drillholes was completed under management by AREVA (now ORANO). The drill programs during this period resulted in the discovery and partial delineation of the Kianna Deposit between the Colette and Anne deposits and discovery of new areas of mineralization along the prospective corridor between Anne and Colette (e.g. Colette South mineralization, 58B Deposit and Kianna South). Exploration during this period also included a MEGATEM survey of the Shea Creek Project Area and ground-based geophysical surveys, which included a DC Resistivity survey in 2005 that outlined several significant untested or poorly tested resistivity lows and a Tensor Magnetotelluric survey in 2008. In total, 278,889 meters of drilling in 563 drillholes have been completed on the Shea Creek Project Area since systematic exploration began in 1992, up to December 31, 2021.Permitting and LicensingMineral exploration on land administered by the Saskatchewan Ministry of Environment requires that surface disturbance permits be obtained before any exploration or development work is performed. The Saskatchewan Mineral Exploration and Government Advisory Committee has developed the Mineral Exploration Guidelines for Saskatchewan to mitigate environmental impacts from industry activity and facilitate government approval for such activities (SMEGAC, 2016). Applications to conduct an exploration work program need only to address the relevant topics of those listed in the guidelines. The types of activities are listed under the guide’s BMPs.There are no environmental encumbrances on the project. The approximate timeline for projects in Saskatchewan for EA baseline work with a total 105 holes drilled. Phase II drilling resumedpermitting and licensing following that is 5-10 years once they are at the Salvostage of having indicated resources. There have been no violations or fines associated with the project. Future requirements with respect to permitting and licensing are with both the federal and provincial governments, the Government of Saskatchewan Ministry of Environment, and the Canadian Nuclear Safety Commission to obtain environmental permits, and construction and operating licenses. - 92 -Geologic Setting, Mineralization, and DepositLocal geology at the Shea Creek Project Area comprises 400 to 800 meters of Athabasca Group sandstone, which unconformably overlie Lloyd Domain amphibolite-grade granitic and pelitic gneisses. The latter includes the SLC, a 40- to 80-meter-thick north-northwest trending and west-southwest dipping graphitic pelitic gneiss unit that is spatially associated with mineralization. The gneiss sequence is affected by penetrative syn-metamorphic deformation that occurred in October 2011,at least two foliation forming phases during the 1950-1900 Ma Taltson orogeny. These peak metamorphic fabrics are overprinted by northeast-trending, right-lateral/oblique, retrograde mylonitic shear zones (D3; probable Hudsonian age) including the regional Beatty River Shear zone and northeast-trending second and third order narrow mylonitic shear zones that offset the SLC. Post-Athabasca faulting remobilizes these mylonites and is also associated with two drilling rigs targeting Lower Goliad Pup to 50 meters of reverse displacement of the unconformity along the R3 fault at the base of the SLC. Textural and Q sand objectives. Interpretationgeometrical relationships suggest that uranium mineralization was coeval with the late faulting, and that the architecture of previous drilling by the Companyolder D3 shear zones may have had a fundamental control on the position of mineralization.To date, four uranium deposits have been discovered over a three km strike length along the SLC in 2010northern parts of the Shea Creek Project Area: Kianna; Anne; Colette; and 58B. Uranium mineralization in these deposits occurs in three stacked styles that encompass the full range of types of unconformity uranium deposits. Most extensive is flat-lying, massive pitchblende-hematite and chlorite-matrix-breccia-hosted mineralization which straddles the unconformity along, with historic data from 1982-84 exploration drilling by Mobil and URI, revealedimmediately east of, the existencetrace of three ore-bearing redox boundaries within the area, which is planned to become Production Area-1. A significant under-explored extension to this area which exhibits strongSLC. Breccia mineralization remains open-ended. A totaloccurs both as pitchblende-coffinite fragments and as matrix replacement, suggesting it may have occurred in pulses that temporally spanned brecciation. Continuous unconformity mineralization occurs along the SLC for much of 122 exploration and delineation holes were drilled during Phase II which was concluded in May 2012 for a total 70,760 feet. Twenty-nine holes (23%) met or exceeded a grade-thickness (GT) cutoff of 0.3 GT. Future plans would include further exploration/delineation drilling in this area in order to fully identify the 2.5 km known strike extent of the mineralizedShea Creek Project Area deposits and is thickest and highest grade where basement mineralization lies beneath it. Basement mineralization forms a significant portion of the Shea Creek Project Area’s uranium inventory and is most extensive at the Kianna Deposit. It comprises: a) concordant-reverse-fault-hosted mineralization that often extends from the unconformity downward into granitic gneiss in the immediate footwall of the SLC; and b) discordant fault, vein and replacement pitchblende mineralization that occurs in steep east-west to west-northwest trending zones in Production Area-1.A Technical Report dated July 16, 2010that may extend for several hundred meters below the unconformity, and which occurs along or beside remobilized mylonitic shear zones. Basement mineralization thickens where concordant and discordant faults intersect, forming west-plunging ore shoots. Lensoidal zones of perched mineralization are locally present up to several tens of meters above the unconformity and are often where reduced, pyritic chlorite alteration extends into the Athabasca sandstone above areas of basement and thicker unconformity mineralization.Table 2.43 – Mineral Resources for the SalvoShea Creek Project as at the date of this Annual ReportDepositClassificationTons (000’s)Tonnes(‘000s)Grade
(% U3O8)PoundsU3O8 (‘000s)Collette Indicated 360 327 0.787 2,786 Inferred 542 492 0.717 3,814 58B Indicated 156 142 0.773 1,188 Inferred 89 81 0.510 445 Kianna Indicated 1,132 1,027 1.535 17,058 Inferred 603 547 1.390 8,235 Anne Indicated 617 560 2.002 12,144 Inferred 148 134 0.883 1,282 TOTALIndicated2,2662,0561.49133,175 Inferred1,3821,2541.01513,775Notes:1. Mineral resources are not mineral reserves and have not demonstrated economic viability. 2. There is no certainty that all or any part of the mineral resource will be converted into mineral reserves. 3. Figures are rounded to reflect the relative accuracy of the estimates. 4. Resources were estimated using a cut-off grade of 0.30% U3O8, a $50 uranium price, and a metallurgical recovery of 95% was used.5. UEC's share of mineral resources is calculated based on UEC's 49.0975% equity in the project. - 93 -South American Uranium PropertiesParaguay ISR PropertiesBelow is a map showing the location for the Company’s uranium projects in Paraguay.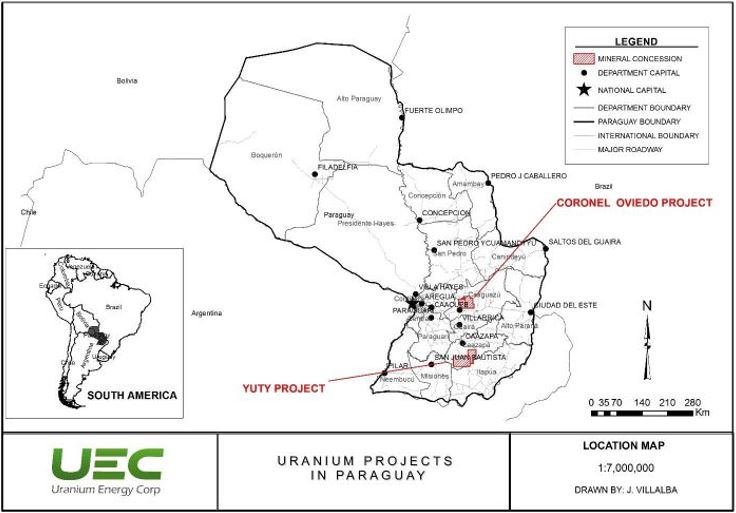 Figure 2.25 – Uranium Project Locations in ParaguayOur Material Paraguay ISR PropertiesYuty ISR ProjectAn independent TRS for the Yuty Project area (the “Yuty Project Area”) has been prepared
 in accordance with NI 43-101, was completed by Thomas A. Carothers, P.G.for UEC, under the supervision of BRS Inc. Engineering (“BRS”) (the “QP” herein), a consulting geologist,pursuant to S-K 1300. This TRS identifies and filed bysummarizes the Companyscientific and technical information and conclusions reached from the IA to support disclosure of mineral resources on the CSA’s public disclosure website atwww.sedar.comYuty Project Area. There are no mineral reserves associated with this Yuty Project Area. The Yuty Project is an exploration stage phase project.- 94 -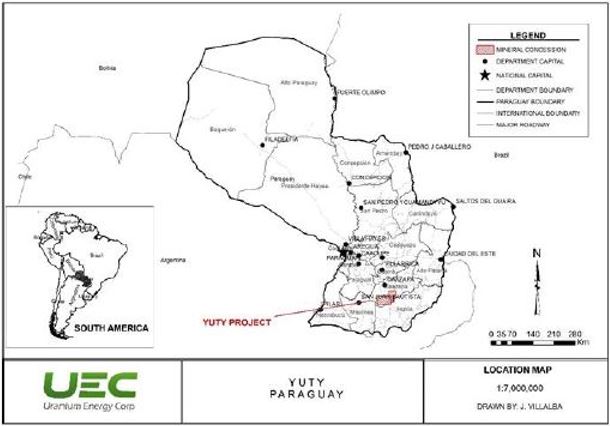 Figure 2.26 – Location of the Yuty Project- 95 -Property DescriptionThe Yuty Project Area is located in Paraguay, South America. UEC operates the Yuty Project Area through its wholly-owned subsidiary, Transandes Paraguay S.A. (“TPSA”), which holds a 100% interest in the Yuty Mining Exploration and Exploitation Concession (the “Yuty Concession”) Contract (the “Contract”).
 A further Technical Report dated March 31, 2011The planned mining method for the SalvoYuty Project prepared in accordance with NI 43-101, was completedArea is by Thomas A. Carothers, P.G., a consulting geologist, and filed by the Company on the CSA’s public disclosure website atwww.sedar.com. ISR mining.The March 31, 2011 Technical Report contains certain disclosure relating to inferred mineral resource estimates for the Salvo Project. Such mineral resources have been estimated in accordance with the definition standards on mineral resourcesYuty Project Area covers an area of the Canadian Institute of Mining, Metallurgy and Petroleum referred to in NI 43-101. Inferred mineral resources, while recognized and required by Canadian regulations, is not a defined term under the SEC's Industry Guide 7, and are normally not permitted to be used in reports and registration statements filed with the SEC. Accordingly, we have not reported them in this annual report or otherwise in the United States. Investors are cautioned not to assume that any part or all of the mineral resources in this category will ever be converted into mineral reserves. Inferred resources have a great amount of uncertainty as to their existence, and great uncertainty as to their economic and legal feasibility. In particular, it should be noted that mineral resources which are not mineral reserves do not have demonstrated economic viability. It cannot be assumed that all or any part of inferred mineral resources discussed in the Technical Report will ever be upgraded to a higher category. In accordance with Canadian rules, estimates of inferred mineral resources cannot form the basis of feasibility or other economic studies. Investors are cautioned not to assume that any part of the reported inferred mineral resources referred to in the Technical Report are economically or legally mineable.35Texas: Burke Hollow ProjectThe Burke Hollow Project is a 17,510-acre property located in Bee County, Texas.In March 2012, a two-acre site situated within the northwest quarter of the area was selected for construction of a field office complex consisting of a large caliche pad containing two drilling supply water wells, tanks and other storage facilities. Initial exploration drilling at the Burke Hollow Project began in May 2012 with four drilling rigs, with two additional rigs added in mid-June 2012. A planned 41 hole, wide-spaced statistical grid based on 6,400-foot spacing of holes covering the entire project is currently in progress, and eleven of these holes have been completed to date. A total of 115 exploration and offset delineation holes have been drilled for a total footage of 61,200 feet, targeting the Goliad Formation sands located from approximately 50’ to 900’ in depth. To date, UEC has explored approximately 20% of the 17,510 acre lease, and five uranium trends have been discovered. These are the 180’289,687 acres (117,232 hectares), the 220’, the 240’, the 370’ and the Eastern 180’/220’ trends of the Goliad Formation. Twenty-one holes (18%) met or exceeded an ore grade cutoff criterion of 0.3 grade-thickness factor (GT) to date at Burke Hollow Project.Future plans include further delineation and exploration for extensions of known trends, and to begin delineation of the lightly-drilled Eastern 180’/220’ trend. In addition, the eastern one-half of the Burke Hollow lease area remains virtually unexplored at this time, and the remainder of the 6400’ statistical grid remains incomplete in this area.Texas: Channen ProjectThe Channen Project is a 10,704-acre property located in Goliad County, Texas.A one-acre field office site with an adjacent caliche pad for storage was constructed in June 2012, prior to drilling two drilling water supply wells. Drilling operations began at the Channen Project in July 2012 with two drilling rigs targeting both the upper and the lower Goliad Formation sands located from the surface to 920’ in depth. As of July 31, 2012, three holes were completed for a total footage of 1,920 feet.Future plans for the Channen Project include continuing to expedite drilling progress of a statistical grid based on 6,400-foot centers which encompasses the entire leased acreage. A large area located proximal to petroleum wells exhibiting gamma-ray shows in the Lower Goliad sands is included within this grid. In addition, a second staging area is planned for construction in order to accommodate drilling activities.The following table provides information relating to our main mineral rights located in the South Texas Uranium Trend, excludingeastern region of the Palangana Mine and the Goliad Project:PropertyNumber of Claimsor Leases HeldGross AcresNichols7 leases1,041Salvo33 leases5,340Burke Hollow1 lease17,510Channen2 leases10,704WyomingOur four Wyoming uranium mineral property areas total 3,065 acres.The Burnt Wagon/East Poison Spider project, located 35 miles west of Casper, Wyoming, was acquired from North American Mining and Minerals Company (Kirkwood) in 2006. Previous operations defined shallow uranium mineralizationcountry in the Wind River formationDepartment of early Eocene age, at 50 to 200 foot depths, from 500 drill holes and 16,000 feetCaazapá, 167 miles northeast of electric logging data.36Situated in the Lower Eocene Wasatch formation of the southwest Powder River Basin is our Powder River Basin LO-Herma uranium property. The exploration data was acquired from H. Brenniman as a part of the Pioneer Nuclear, Inc., package in 2006. The 29 mining claims total 592 acres and are contiguous to the Uranium One (formerly Energy Metals Corp.) property.The DL Prospect was assessed and acquired by using Pioneer Nuclear, Inc., 1970 uranium exploration data from the H. Brenniman database.The following table provides information relating to our mineral rights located in Wyoming:Wyoming PropertyNumber of Claimsor Leases HeldGross AcresBurnt Wagon30 claims and 1 lease1,038DL Prospect1 lease1,275East Poison Spider3 leases160LO-Herma29 claims592ParaguayThe Company acquired two projects within the South American country of Paraguay. The following map shows the location of both projects, Coronel Oviedo and Yuty.![]()
Coronel Oviedo ProjectProperty Description and LocationThe Coronel Oviedo Project is located in southeastern Paraguay, approximately 95 miles east of Asuncion, the capital of Paraguay. The Coronel Oviedogeographic coordinates of the central part of the Yuty Project consistsArea, where the bulk of a large mineral concession covering a totalpast exploration has been carried out (San Antonio area ofin Block 1), are approximately 100,000 ha (247,000 acres). The property can be classified as an early to intermediate stage exploration project. Several areas have undergone drilling in the past by The Anschutz Company of Denver, CO (early 1980s)26°37’S and recently by Crescent Resources in 2007. Anschutz was backed at the time by both Korean and Taiwanese-based power consortiums. 56°20’W.Access to the projectYuty Project is byvia road PY-08, a paved roads from Asuncionroad that borders the town of San Antonio, through the district of the city of Yuty, and through the north portion of the Yuty Deposit area. Very close to the Citymentioned route, the town of Coronel Oviedo and other populated areas. There is good access into the interiorSan Antonio has storage of the concession mainly by unpaved secondary roads. The terrain is rolling hills with areas of forest, small farms, and some large cattle ranches.37
Prior ExplorationThe Coronel Oviedo Project, covering over 247,000 acres in central Paraguay, was subject to reconnaissancedeposit samples containing material from an extensive uranium exploration between 1976(2007 to 2014), and 1983hosts logging calibration wells, modest field office facilities, and facilities for staff accommodation. All facilities are kept in good condition through ongoing maintenance work. The Yuty project area is characterized by Anschutz Corporation of Denver, Colorado,being primarily a rural area with well-maintained internal dirt roads, electricity, potable water service, hotels, and by Crescent Resources of Vancouver, Canada between 2006supplies and 2008. Most of the uranium occurrences in this environment are “roll front” type deposits similar to those currently being produced by low-cost ISR methods in Texas, the western United States, Central Asia and Australia. The work by Anchustz and Crescent was centered on a large belt of Permo-Carboniferous age continental sandstones that represent the western flank of the Parana Basin. According to the Geological Survey of Brazil or CPRM, these same sandstones within the Brazilian section of the Parana Basin contain numerous uranium occurrences including the Figueira Mine.From 2006 to 2008, the Coronel Oviedo Project was optioned to Crescent Resources. During this period, a total of 24 holes were drilled and loggedpublic services in the southern portion, offsetting mineralized holes drilled by Anschutz. A NI 43-101 Technical Report reported that 14 of the 24 holes had a grade-thickness (“GT”) product (in feet) equal to or greater than 0.30GT. GT values equal to and above 0.30 are typically considered producible under ISR production methodology. The known uranium mineralization on the Coronel Oviedo Project intersected by the past drilling is at depths between 450 and 750 feet. Crescent dropped the option on the Coronel Oviedo Project in 2008.Aquifer TestDuring 2010, and prior to the acquisition of the Coronel Oviedo Project, the Company conducted a 24-hour aquifer test in theurban area of the resource trend identified bycity of Yuty.Title to the combined Anschutz-Crescent drilling programs.Yuty Concession is now held through the Contract with the Republic of Paraguay (the “Republic”), which grants mining rights for a minimum period of 20 years, renewable every five years. The testContract was designed to assess aquifer propertiessigned into Law 3575/08 (the “Law”) as an Act of the lower massive sand,Paraguayan Congress in August 2008. The Law calls for payment of a uranium-bearing sandstone within2.5% royalty to the San Miguel Formation. The focusRepublic on all production, based on the production at the point of the test was to determine if the aquifer could sustain extraction rates typical of ISR mining of uranium.38Results of the test indicate that the uranium-bearing unit has aquifer characteristics that would support operational rates for ISR mining. The aquifer properties determined from the hydrologic test fall within the range of values determined at other uranium ISR projects located in Wyoming, Texas and Nebraska.
During Fiscal 2012, the Company completed a 10,000-meter drilling program. A total of 35 holes were drilled, averaging 950 feet in depth. The holes were drilled on east to west lines across known geologic structures believed to be integral in controlling uranium occurrence. The holes were drilled on wide spacings, approximately one to 1.5 miles apart (see map above). The data has been compiled and will be presented in a NI 43-101 Technical Report, anticipated for release by December 2012.39Yuty Project, ParaguayProperty Description and LocationThe Yuty Project covers 569,936 acres and is located approximately 125 miles east and southeast of Asunción, the capital of Paraguay. ItArea is located within the Paraná Basin and is underlain by predominantly sedimentary rocks of undivided upper Permo-Carboniferous age. Uranium mineralization is sandstone hosted roll-front type.The Yuty Project Area was explored extensively by Anschutz Corporation (“Anschutz”) of Denver, Colorado in the late 1970s and early 1980s. Cue Resources Ltd. (“CUE”) controlled the Yuty Project Area prior to acquisition by UEC and conducted exploration and verification drilling projects circa 2007 through 2011. UEC possesses the original drill data, from which is host to a numberdrill hole database has been developed and verified. Samples from Anschutz were not preserved, however, core samples from areas in the possession of known uranium deposits, including FigueiraUEC and Amorinópolis in Brazil. Preliminary studies indicate amenability to extraction by in situ recovery methods, which is the same process currently usedhave been reviewed by the Company at its Texas operations. Cue has spent over CAD$16 million developingTRS QP. Within the Yuty since 2006. HistoryExploration for uranium in Southeastern Paraguay was started in 1976 by Anschutz, after signing of the Concession Agreement between the Government of Paraguay and Anschutz in December 1975.
 ThisThe agreement allowed Anschutz to explore for “all minerals, excluding oil, gas and construction materials.” materials”. Previously intermittent exploration had been carried out by international oil companies, with insignificant results. The region, however, is known for its limited mining activities and production of high-grade iron ore, mineral pigments, clays, limestone, sandstone, sand and gravel by indigenous people.In early 1976, a number of reports by Anschutz consultants, A.F. Renfro, D.G. Bryant and G.E. Thomas, covered the geology of eastern Paraguay based on reconnaissance field trips made through the southern Precambrian area, the sedimentary section from north to south, and the alkalic intrusions in the north-central part of a large concession. From field examinations of various rock types and airborne radiometric data, Renfro concluded that the Anschutz concession contained areas with good potential for uranium mineralization. The regional correlation of stratigraphic horizons favorable for uranium mineralization is shown in various figures of that report.The initial uranium exploration by Anschutz in 1976 covered an exclusive exploration exploitation concession of somecovering approximately 162,700 km2,km2, virtually the whole eastern half of Paraguay. This included geological mapping, water sampling, soil sampling and a broad reconnaissance Track Etch program, with stations spaced 10 kms apart. The station spacing for the Track Etch survey was subsequently reduced to five kms in the southern part of the concession. The reconnaissance program outlined large anomalous zones and Anschutz concluded that the concession in Paraguay constituted a new uranium province in an area underlain by granitic rocks and sandstones.The initial reconnaissance program by Anschutz was followed by a program of diamond drillingairborne radiometric and rotary drilling over selected target areas. In total, some 75,000 mmagnetic surveys, a detailed Track Etch survey with station spacing of drilling were completed from 1976 to1983. Data is available100 to 200 meters and geochemical stream sediment and soil sampling. Flight line spacing for the airborne radiometric survey was five kms with a totalclearance of 257 drill holes in100 meters above the San Antonio area.surface. Anschutz carried out exploration on behalf of a joint venture with Korea Electric Power Corporation and Taiwan Power Company. Anschutz intersected uranium mineralizationIn 2006, TPSA resumed exploratory activities in San Antonio, a district of the town of Yuty in the Department of Caazapa, Paraguay, by virtue of a prospecting permit granted by the MOPC that enabled the start of the mining exploration phase in May 2007 in four blocks (Blocks I, II, III and IV), encompassing a total of 787,401 acres. In June 2008, with four mining blocks in the exploration phase, the Contract was approved by the Law, and signed between the Government of the Republic and TPSA for the exploration and exploitation of metallic and non-metallic minerals, precious and semiprecious gems.- 96 -In March 2012, UEC acquired Cue Resources Inc. (“CUE”). At the time of the acquisition, the Yuty Project Area consisted of four blocks with a total area now reduced to 492,234 acres (199,200 hectares). Data from 323 drill holes ranging from 0.115% U3O8 over 10.2 m to 0.351% U3O8 over 0.3 m in sandstones and siltstones. Work was suspended in1983 due to the slumptotaling 33,491 meters of the price of uranium, and no further work was done at that time.During the exploration programs by Anschutz, airborne radiometric surveys, regional geological mapping and geochemical sampling were the main exploration tools for uranium exploration in the southeastern part of Paraguay. This was followed-up by core and rotary drilling in two phases. The initial phase was available and a technical report was completed.Permitting and LicensingIn summary, all financial and other obligations related to drill wide-spaced reconnaissance diamond drill holes along fences spaced approximately ten miles apart. The objective of this initial phase was to obtain stratigraphic information across an inferred host trend. The second phase was to drill rotary holes, spaced approximately 1,000 feet apart, within and between the fences of reconnaissance holes, to establish and outline target areas. All drill holes were logged and probed by gamma, neutron and resistivity surveys.40Exploration work by Anschutz outlined several large target areas including what is nowmineral concession for the Yuty Project. These includeProject Area have been met. All environmental licenses and permits are in good standing. Except for the San Antonio area, the Yuty Project Area is at an early-to intermediate stage of exploration. The Yuty Project does not have mineral reserves and is therefore considered an exploration stage property under S-K 1300 definitions. The San Miguel, TypychatyAntonio area is at a more advanced stage since it has received considerable drilling in the past by Anschutz and Yarati-ítargets nearrecently by CUE.In 2015, the Ministry of Public Works and aroundCommunications (MOPC), which is the villageenforcement authority for mining activities in Paraguay, approved the exploitation phase carried out in the period (2007-2014). However, in 2018, the mining enforcement authority in a previous administration took the position that the Yuty concession was not eligible to continue with the exploitation phase, despite the fact that exploitation phase activities were suspended based on the Company’s subsidiary’s, Transandes Paraguay S.A. (“TPSA”), requests provided for in the concession contract and approved by the MOPC. TPSA initiated legal actions to protect its mining rights and entered into conversations in 2019 with the MOPC and other institutions of the executive branch. TPSA reached an out-of-court agreement in 2022 that suspends the ongoing litigation and begins the re-instatement of the TPSA’s mining rights, however, during the process of finalization, the Administrative Court was not in a position to approve the aforementioned agreement and TPSA has now filed an appeal with the Supreme Court in connection with the same.Once the re-instatement process of these concession rights regarding the extrajudicial agreement signed with the executive branch is complete, the Yuty approximately 125 miles southeastproject is committed to making annual payments of Asunción.The processing of environmental licenses for the new stages of the exploitation phase will require updating and compliance with management plans approved by the licenses in the future.Geologic Setting, Mineralization and MineralizationDepositThe Yuty Uranium Project areaArea is situated within the western part of the Paraná Basin in Southeastern Paraguay,Paraguay. The Yuty Project Area is located on the western end of the Paraná Basin, which also hosts the Figueira uranium deposit in Brazil. The area is underlain by upper Permian-Carboniferous (“UPC”)Upper Permian to Carboniferous continental sedimentary rocks, and is known for uranium occurrences, such as the San Pedro, Santa Barbara, Yarati-í and San Antonio occurrences. Significant radiometric anomalies also occur in Precambrian igneous and metamorphic rocks, Cambrian limestone, Silurian sandstone and Cretaceous to Tertiary carbonatites and alkaline intrusive rocks.The exploration methodology applied during past programs has been to determine the favorable host rocks of the UPCUpper Permian-Carboniferous (“UPC”) sequence and to exploredetermine favorable areas of the host sandstone.The stratigraphic sequence of the lithologies in the Yuty Project Area has been divided into the Southern UPC rocks and Lower Permian-Carboniferous (“LPC”) rocks. The Southern UPC contains the sequence of rocks as follows:● Cabacua Formation: 200 meters thick; ● Tapyata Formation: 125 meters thick; ● Tacuary Formation: 280 meters thick; and ● San Miguel Formation: 20 to 90 meters thick. Local sandstone units in descending stratigraphic order are:● Upper Sand Unit: Estimated to be approximately 50 meters thick; ● Alternating Sandstone and Shale Unit: Estimated to be approximately 150 meters thick; ● Massive Sand Unit: Estimated to be 60 to 100 meters thick; ● Fine-grained Sand Unit: Estimated to be up to 15 meters thick; and ● Wavy Unit: Estimated to be up to 20 meters thick. - 97 -The Massive Sand Unit, Fine-Grained Unit and the Wavy Unit are collectively referred to as the San Miguel Formation and are host to the uranium mineralization at the Yuty Project Area. At the Yuty Project Area, soils are typically 5 to 15 meters thick. There is a diabase sill between the upper sand unit and the Massive Sand Unit. Within the Massive Sand Unit there is a distinctive marker shale that is typically above the mineralization.The rocks of the UPC are sub-horizontal (dipping 1° to 5° to the east) and cover the western flank of the Paraná Basin. Data from reconnaissance drilling indicates that “the basin margin is cut by a series of west and northwest trending faults, with displacements ranging from a few metres to several hundred metres”.Continental sedimentary units of the Independencia Formation (of the UPC) are known to have high potential for uranium exploration in eastern Paraguay. Earlier work also suggests that the basal sandstone, a 20- to 90-meter-thick unit known as the San Miguel Formation (within the Independencia Formation), is the best host for uranium mineralization in the Yuty Project Area. Earlier work further suggests that the San Miguel Formation can be correlated with the Rio Benito Formation in the uranium-bearing Permian rocks near Figueira, in the Paraná Basin in Brazil. The source of the uranium is thought to be the Lower Permian-Carboniferous Coronel Oviedo Formation, which is correlated with the Itataré Formation underlying the Rio Benito Formation in Brazil. Occasional diabase sills and dikes intrude the sedimentary rocks, such as at the San Antonio area near the village of Yuty. Outcrops are rare, mostly along road cuts, and mapping is done by drilling.The rocksLower Permian Coronel Oviedo Formation underlies the UPC rocks. This glacial marine sequence of the Yuty area are very gently east dippingblack shales, glacial sands and undeformed. Occasional northwest and northeast trending normal faults cut the sedimentary units. Exploration work to date suggests that the uraniumdiamictites is generally characterized by a high radioactive background.Uranium mineralization within the San Miguel Formation is stratabound and possibly syngenetic or diagenetic in origin. Recent interpretation of exploration data suggests that areas of limonite+limonite and hematite alteration within the grey-green, fine-grained sandstones in the San Antonio area have some characteristics similar to the alteration assemblages present at roll front-typeroll-front-type uranium deposits of the Powder River basinBasin, Wyoming.Uranium mineralization within the UPC rocks is present in other parts of the United States.
Geologic SettingParaná Basin, such as at Figueira, Brazil, as noted above. In a 1982 publication, S. Saad proposed a model of mineralization for Figueira-type mineralization. This model suggests that the uranium mineralization is predominantly of epigenetic type, and consists of five phases covering the source, sedimentation, precipitation, remobilization and enrichment of uranium along the more permeable coarser fluvio-deltaic channel sediments.Past exploration has identified pitchblende or coffinite (or both) as the uranium minerals that are likely to occur in the Yuty Project ParaguayRecent ExplorationIn late July 2006, Cue signed an agreementArea. Honea (1981) examined three sandstone samples in a polished section under the scanning electron microscope. He reported that “pyrite is confirmed as the sulphide mineral phase present both alone and with clays as partial to complete filling of interstices between clasts… and occurs as relatively well-formed cubic crystals, as anhedral aggregates… grain size varies from less than one micron to almost one millimetre”. Honea further reported that the shareholders of Transandes Paraguay S.A.“uranium-bearing phase(s) could not be isolated even at high magnification but is shown by composition spectra to option the Yuty Property, followed by a formal earn-in agreement signed on November 6, 2007,be present with clay and started a systematic uranium exploration program. This included a compilation of all previous exploration data, including lithologic and radiometric logs, stored at Ministry of Public Works (the “MOPC”) in Asunción. Since June 2007, Cue has been carrying on a drilling program at San Antonio as well as evaluating other uranium target areas on the Yuty Property.The most recent drilling completedpyrite in the San Antonio area was in November and December 2010 at which time 33 holes were completed forinterstitial fillings. Available data indicate a total of 11,500 feet. Of these holes, five were not successfully completed. Ofreduced black opaque mineral (very probably either pitchblende or coffinite – or both) scattered as sub-microscopic particles”.Uranium mineralization hosted by the 28 holes that reached the target, ten had intersections greater than a GT (grade x thickness) of 0.10m% eU3O8, and an additional 13 had intersections exceeding a GT of 0.03 m% eU3O8.41Drilling and SamplingApproximately 240,000 feet of drilling (core as well as rotary) were completed by Anschutz in previous campaigns.The procedures used during the diamond and rotary drilling programs were drafted by Anschutz technical personnel. Healex reviewed all of drill logs at the MOPC in Asunción and is of the opinion that the lithologic logging procedures are comparable to industry standards. Detailed information on sampling methods and approach during the Anschutz drilling campaigns is not available. Nevertheless, previous Technical Reports (Scott Wilson (2008) and Healex (2009)) have concluded that sampling procedures were comparable to industry standards of that time. Mr. Beahm (2011 Technical Report) concurs with this determination. Since mid-July 2007, Cue Resources completed over 100,000 feet of drilling at the San Antonio target area in 256 drill holes. Most of the holes were collared with a rotary drilling rig, surface casing was then installed, and the holes were drilled to completion depth with a diamond rig.To date, diamond drilling totals approximately 52,800 feet, and rotary drilling approximately 50,000 feet. For diamond drill holes, HQ-size core was retrieved and the drilling contractor is Empire Drilling S.A. of Quito, Ecuador. For rotary drilling, the contractor is 9 de Junio S.A. (Primo) of Asunción, Paraguay.Exploration PotentialExcept for the San Antonio area, the Yuty Uranium Project is at an early-to intermediate stage of exploration. A number of areas of anomalous concentrations of uranium occur in UPC sedimentary rocks within the property area. Past work was focused on developing roll front-type targets. Preliminary interpretation of the drill results in the San Antonio area suggests that the basal sandstone unit (San Miguel Formation) is a favorable host for uranium mineralization. These results also suggest that the diabase sill overlying the San Miguel Formation may have acted as a trap for diagenetic fluids and provided a horizontal conduit for the circulation of the diagenetic fluidsUPC is interpreted to represent a variety of the roll-front-type mineralization by the early workers of Anschutz. Sandstone-type deposits are characteristically sedimentary formations of clastic-detrital origin, containing reducing environments. These deposits are usually tabular in shape and emplacementmay occur in continental sandstones, deltaic or shallow marine environments. Typically, roll-front-type uranium deposits have, in the direction of the flow of mineralizing solutions, a barren (oxidized) interior zone surrounded by a (reduced) mineralized zone. Between the barren zone and the mineralized zone is an altered zone. The overall shape of the roll-front is like a crescent with extended tails at each end, which also outlines the barren interior zone, and uranium is deposited at the interface between the oxidized zone and the reduced zone. Ground water flow direction is usually a good guide in detecting roll-front-type deposits in sandstones.The style of mineralization nearwithin the margin of a topographic high (gentle hill) belowsandstones at the diabase sill.42
The Yuty Project showing exploration drill holes.Data received from the Cue transaction is being organized and evaluated at the Company’s Asuncion, Paraguay office. Once this data is compiled, a follow-up drilling program will be designed to further assess the potentialArea includes some characteristics of the Yuty Project.A Technical Report dated August 24, 2011roll-front-type mineralization, as in the Powder River Basin, Wyoming. It is likely that the style of mineralization is a variety of the roll-front-type uranium mineralization.Table 2.44 – Mineral Resources for the Yuty Project prepared in accordance with NI 43-101, was completed by Douglas Beahm, P.G., P.E., Bill Northrup and Andre Deiss consulting geologists, and filed by the Company on the CSA’s public disclosure websiteas atwww.sedar.com. The Technical Report contains certain disclosure relating to measured, indicated and inferred mineral resource estimates for the Yuty Project. Such mineral resources have been estimated in accordance with the definition standards on mineral resources of the Canadian Institute of Mining, Metallurgy and Petroleum referred to in NI 43-101. Measured, indicated and inferred mineral resources, while recognized and required by Canadian regulations, are not defined terms under the SEC's Industry Guide 7, and are normally not permitted to be used in reports and registration statements filed with the SEC. Accordingly, we have not reported them in this annual report or otherwise in the United States. Investors are cautioned not to assume that any part or all of the mineral resources in this category will ever be converted into mineral reserves. Measured, indicated and inferred resources have a great amount of uncertainty as to their existence, and great uncertainty as to their economic and legal feasibility. In particular, it should be noted that mineral resources which are not mineral reserves do not have demonstrated economic viability. It cannot be assumed that all or any part of measured, indicated or inferred mineral resources discussed in the Technical Report will ever be upgraded to a higher category. In accordance with Canadian rules, estimates of inferred mineral resources cannot form the basis of feasibility or other economic studies. Investors are cautioned not to assume that any part of the reported mineral resources referred to in the Technical Report are economically or legally mineable.43Exploration Work ProgramsOur Vice President of Exploration, Clyde Yancey, a Certified Professional Geologist, based on historical data previously outlined and our own work product, has developed exploration programs unique to each state and claim block with the intent of proving or disproving the existence of uranium on these prospects. Exploration plans for Arizona, and Colorado are currently being formulated. There are no current exploration plans for New Mexico or Wyoming. Exploration and land acquisition in the South Texas Uranium Trend and Paraguay will continue in order to support our near term uranium extraction facilities.Other PropertiesWe own 32 acres of real estate located in Goliad County, Texas.We have entered into office rental and service agreements as follows:a project office for our Goliad Project at 138 South Market Street, Goliad, Texas 77963. There is no lease commitment and rent and expenses are paid on a month-to-month basis at $925 per month;an exploration office in New Mexico at 6100 Indian School NE, Suite 225, Albuquerque, New Mexico 87110. There is no lease commitment and rent and expenses are paid on a month-to-month basis at $2,598 per month;an office lease at $8,742 per month for our Corpus Christi administration office at 500 N. Shoreline Blvd., Suite 800N, Corpus Christi, Texas 78471. The lease expires on August 31, 2012; andan office lease at $4,905 per month for our Vancouver administration office at 1111 West Hasting Street, Suite 320, Vancouver, B.C., Canada V6E 2J3. The lease expires on March 31, 2013.”Our DatabasesWe have acquired historical exploration data that will assist in the direction of proposed exploration program on lands held in our current property portfolio. This prior exploration data consists of management information and work product derived from various reports, drill hole assay results, drill hole logs, studies, maps, radioactive rock samples, exploratory drill logs, state organization reports, consultants, geological study and other exploratory information.The following provides information relating to our database:Tronox WorldwideEffective February 20, 2008, we acquired from Tronox Worldwide LLC certain assets, consisting of certain maps, data, exploration results and other information pertaining to lands within the United States (excluding New Mexico and Wyoming), Canada and Australia, and specifically including the former uranium exploration projects by Kerr McGee Corporation. The Tronox database contains records on some of our properties located in Arizona, the Colorado Plateau and Texas.We have exclusive ownership of this database.JebsenThe Jebsen database covers territory in Wyoming and New Mexico, including some of our existing properties. The database belonged to a pioneering uranium developer and represents work conducted from the 1950s through to the present.This database adds over 500 drill holes and over 500,000 feet of drilling data results to the Company's existing library of data. Other than logs, the data set consists of volumes of maps, lithographic logs, geologic reports, and feasibility studies, and many other essential tools for uranium exploration and pre-extraction.44Our geologists have linked contents of the database to some of our existing properties, specifically pertaining to our projects in the Shirley Basin and Powder River Basin of Wyoming, and in the Grants Uranium District of New Mexico.We have exclusive ownership of this database.HaltermanThe Halterman database consists of exploratory and pre-extraction work compiled during the 1970s and 80s, including extensive data on significant prospects and projects in the following known uranium districts in the States of Colorado, New Mexico and Utah, including Grants, San Juan Basin, Chama Basin, Moab, Lisbon Valley, Dove Creek, Slick Rock and Uravan districts.This database includes drilling and logging data from over 200,000 feet of uranium exploration and pre-extraction drilling, resource evaluations and calculations, drill-hole locations and grade thickness maps, competitor activity maps as well as several dozen geological and project evaluation reports covering uranium projects in New Mexico, Colorado, Utah, Texas and California.We have exclusive ownership of this database.BrennimanThe Brenniman database includes drilling and logging data from over two million feet of uranium exploration and pre-extraction drilling, resource calculation reports and various other geological reports, drill hole location maps and other mapping. This database includes approximately 142 drill hole gamma and E-logs. The data was originally compiled from 1972 to 1981 by various exploration companies, and covers over 100 uranium prospects in 15 southern U.S. states. This library will be used by our technical personnel to determine locations of where drill-indicated uranium may exist.We have exclusive ownership of this database.NuecesWe have acquired copies of uranium drill logs from previous uranium exploration drilling projects covering a large area in the South Texas uranium trend. The data consists of approximately 150,000 feet of drill logs from 366 drill holes. This drill data provides regional geologic information and will be used to locate possible mineralized zones within the area of the South Texas uranium trend.The data was acquired from Nueces Minerals Company, a privately-held oil and gas production company which owns the mineral rights to 72,000 contiguous acres covering portions of four counties in south Texas.We do not have ownership or exclusive rights to this data.KirkwoodWe acquired a database of uranium exploration results covering an area of approximately 13,000 acres within the uranium zone known as the Poison Spider area, in central Wyoming. The area covered includes property already held by us, as well as by other publicly-traded uranium exploration companies. The database was compiled by William Kirkwood of North American Mining and Minerals Company, a significant participant in the uranium, coal, gold and oil and gas industries in the western United States since the 1960s. The data acquired was generated from exploration originally conducted by companies such as Homestake Mining, Kennecott Corp, Rampart Exploration and Kirkwood Oil and Gas, largely between 1969 and 1982. The database consists of drill hole assay logs for 470 holes, including 75,200 feet of drilling, 22,000 feet of gamma logs, drill hole location maps, cross sections, geological maps, geological reports, and other assay data and will be used to locate possible mineralized zones in the Poison Spider area in central Wyoming.45We have exclusive ownership of this database.OdellWe acquired the rights to a database containing over 50 years of uranium exploration data for the State of Wyoming. This database consists of 315,000 feet of drill logs, over 400 maps, copies of all US geological survey uranium publications dating back to 1954, and geological reports on uranium ore bodies throughout Wyoming. The database will be used to locate possible mineralized zones. The database is made available to the Company by Robert Odell, the compiler and publisher of the Rocky Mountain Uranium Minerals Scout since 1974.We do not own or have exclusive rights to this database.MooreWe acquired a database of U.S. uranium exploration results from Moore Energy, a private Oklahoma-based uranium exploration company.The Moore Energy U.S. uranium database consists of over 30 years of uranium exploration information in the States of Texas, New Mexico and Wyoming, originally conducted during the 1970s, 80s and 90s. It includes results of over 10,000 drill holes, plus primary maps, and geological reports. It covers approximately one million acres of prospective uranium claims, in the South Texas uranium trend, New Mexico, and Powder River Basin, Wyoming, as well as zones in Texas, and will be used to locate possible mineralized zones.The database also provides the Company with exploration data about its Goliad Project in south Texas, including 250,000 feet of drill logs and further delineates zones of potential uranium mineralization. It also contains drilling results from properties that are being developed by other uranium exploration companies, and also widespread regional data from throughout the South Texas uranium trend.We have exclusive ownership of this database.Uranium Resources Inc.We acquired the full database of historic drill results for the Company’s Salvo in-situ recovery uranium project in Bee County, Texas.The database consists of 433 gamma ray/resistivity and lithology logs, PGT logs and drill plan maps.Uranium One – South Texas Goliad ProjectThe South Texas Goliad database includes raw and interpreted data compiled by Total Minerals (“TOMIN”) and others from the mid 1980’s to 1993. The database is an evaluation of the uranium potential within the Goliad Formation from south of Houston to the Mexican border.Historically, following TOMIN’s purchase of the Holiday - El Mesquite project, located in Duval County, Texas, in 1990, TOMIN found themselves in the possession of the Mobil uranium exploration database. Starting with this data, TOMIN also gathered regional oil and gas logs (included in the database), water well driller logs and other regional information to begin their study of the Goliad Formation along the South TX Uranium Trend. The Company estimates that it represents two to three man years.As a result of the study, TOMIN identified 62 targets and drilled 22 by project end in 1993. Of the 22 drilled, 19 were disproved and the remaining awaits further drilling to develop trends. Another 40 targets remain to be evaluated.46To summarize, the database contains:4,894 South Texas uranium logs – 2.8 million feet of drilling;13,882 South Texas O&G logs – 41.6 million feet;752 maps/sections across South Texas; and 103 documents, reports, analyses documenting the study.47ITEM 3.LEGAL PROCEEDINGSAs of the date of this Annual Report other than as disclosed below, there are no material pending legal proceedings, other than ordinary routine litigation incidental to our business, to which the Company or any of its subsidiaries is a party or of which any of their property is subject, and no director, officer, affiliate or record or beneficial owner of more than 5% of our common stock, or any associate or any such director, officer, affiliate or security holder, is (i) a party adverse to us or any of our subsidiaries in any legal proceeding or (ii) has an adverse interest to us or any of our subsidiaries in any legal proceeding. Other than as disclosed below, management is not aware of any other material legal proceedings pending or that have been threatened against us or our properties.Effective September 9, 2011, as a result of the merger with Concentric Energy Corp. (“Concentric”), the Company assumed the obligations arising from or relating to an involuntary bankruptcy petition filed on June 16, 2010 (the “Petition”) filed by certain holders (the “Petitioners”) of Series “A” convertible debentures (the “Debentures”) against Concentric in the United States Bankruptcy Court in and for the District of Arizona. Prior to and after June 16, 2010, the Petitioners, who had also made equity investments in Concentric prior to the merger, sent letters to Concentric alleging defaults under the Debentures and requesting acceleration of amounts due under the Debentures. Pursuant to a Settlement Agreement and Mutual Release dated October 4, 2011, the Company settled in full all claims and potential claims raised in the Petition, including any and all claims relating to the Debentures, by paying $1,051,854 in cash to the Petitioners. A stipulation to dismiss the Petition was filed, and on October 12, 2011, the United States Bankruptcy Court for the District of Arizona approved the dismissal of the Petition.On or about February 23, 2011, the Company received notification of a lawsuit filed in the State of Texas, in the County Court of Law No. 4 for Nueces County, against the Company by Everest Exploration, Inc. (“Everest”) for an unspecified amount relating to the Asset Purchase Agreement dated November 23, 2009 and effective December 18, 2009 (the “Purchase Agreement”) for the acquisition of South Texas Mining Venture, L.L.P. (“STMV”). Pursuant to the terms of the Purchase Agreement, should actual reclamation costs incurred by the Company on the Mt. Lucas Property, a prior producing project, be less than $2.2 million in total, Everest alleges that it would be entitled to the difference as a cash payment, subject to the prior receipt by STMV of a clearance certificate from the Texas Commission on Environmental Quality (“TCEQ”). The Company believes it has complied with all of the terms under the Purchase Agreement and that no such cash payment is required as the actual reclamation costs associated with the Mt. Lucas Property and incurred by the Company are greater than $2.2 million. Furthermore, the clearance certificate to be provided from the TCEQ has not been issued. On August 12, 2011, a written discovery request was filed by Everest to which the Company responded in full and to which no further response from Everest has been received. The Company intends to vigorously defend against any and all claims under this lawsuit. Any potential judgment against the Company and awarded to the claimant is expected to be immaterial.On or about May 25, 2012, the Company filed a lawsuit in the State of Texas, in the 94th Judicial District Court for Nueces County, against Everest, Everest Resource Company, Thomas M. Crain, Jr. and James T. Clark (collectively, the “Everest Group”) for an unspecified amount of damages as a result of claimed material breaches of their representations, warranties and covenants under the Purchase Agreement. On or about June 19, 2012, the Company received notification of a counterclaim filed by the Everest Group disputing the Company’s claims and asserting certain claims for an unspecified amount of damages as a result of claimed material breaches of the Company’s representations, warranties and covenants under the Purchase Agreement. The Company intends to vigorously defend against any and all claims under this lawsuit. Any potential judgment against the Company and awarded to the claimant is expected to be immaterial.On or about April 3, 2012, the Company received notification of a lawsuit filed in the State of Arizona, in the Superior Court for the County of Yavapai, by certain Petitioners (the “Plaintiffs”) against a group of defendants, including the Company and former management and board members of Concentric. The lawsuit asserts certain claims relating to the Plaintiffs’ equity investments in Concentric, including allegations that the former management and board members of Concentric engaged in various wrongful acts prior to and/or in conjunction with the merger of Concentric. The lawsuit further alleges that the Company is contractually liable for liquidated damages arising from a pre-merger transaction which the Company previously acknowledged and recorded as an accrued liability. Subsequent to July 31, 2012, the Company paid the liquidated damages portion of the lawsuit in full by a cash payment of $149,194 to the Plaintiffs. The Company intends to vigorously defend against any and all remaining claims asserted under this lawsuit. Any potential judgment against the Company and awarded to the claimant is expected to be immaterial.48On or about May 17, 2012, the Company received notification of a lawsuit filed in the State of Texas, in the 229thDistrict Court of Duval County, by an employee of a contractor hired by the Company against a group of defendants, including the Company and the contractor, for unspecified damages as a result of injuries suffered by the plaintiff while on the Company's premises. The contractor’s general liability insurer has confirmed that it will defend and indemnify the Company against this lawsuit subject to available limits under the contractor’s policy.CategoryTons Ore(000’s)Tonnes Ore(1000’s)WeightedAverageGrade(% eU3O8)PoundseU3O8 (000’s)Measured - - - - Indicated – Massive Sand Unit 7,233 6,562 0.048 6,969 Indicated – Fine-Grained and Wavy Sand Units 1,842 1,671 0.054 1,994 Total M&I9,0748,2320.0498,962Inferred – Massive Sand Unit 1690 1533 0.045 1,528 Inferred – Fine Grained and Wavy Sand Units 1043 946 0.032 675 Total Resources2,7332,4790.0402,203Notes:ITEM 4.MINE SAFETY DISCLOSURESNot applicableITEM 5.MARKET FOR REGISTRANT'S COMMON EQUITY,RELATEDSTOCKHOLDERMATTERS AND ISSUER PURCHASES OF EQUITY SECURITIESMarket for Common Equity
Shares of our common stock commenced trading on the OTC Bulletin Board under the symbol “URME” on December 5, 2005. On September 28, 2007, shares of our common stock commenced trading on the NYSE MKT Equities Exchange (formerly known as the American Stock Exchange and the NYSE Amex Equities Exchange) under the symbol “UEC”. The market for our common stock is limited and can be volatile. The following table sets forth the high and low sales prices relating to our common stock on the NYSE MKT Equities Exchange on a quarterly basis for the periods indicated:
| NYSE MKT | ||||||
| Quarter Ended | High | Low | ||||
| July 2012 | $ | 3.08 | $ | 1.75 | ||
| April 2012 | $ | 4.44 | $ | 2.59 | ||
| January 2012 | $ | 4.20 | $ | 2.60 | ||
| October 2011 | $ | 3.53 | $ | 2.20 | ||
| July 2011 | $ | 3.86 | $ | 2.72 | ||
| April 2011 | $ | 7.08 | $ | 3.00 | ||
| January 2011 | $ | 7.48 | $ | 3.76 | ||
| October 2010 | $ | 4.25 | $ | 2.40 |
The last reported sales price for our shares on the NYSE MKT Equities Exchange on October 10, 2012 was $2.37 per share. As of October 10, 2012, we had 308 shareholders of record.
Dividend Policy
No dividends have been declared or paid on our common stock. We have incurred recurring losses and do not currently intend to pay any cash dividends in the foreseeable future.
49
Securities Authorized For Issuance Under Compensation Plans
We have two equity compensation plans, the 2006 Stock Incentive Plan (the "2006 Plan") and the 2009 Stock Incentive Plan (the "2009 Plan"). The table set forth below presents information relating to our equity compensation plans at our fiscal year end July 31, 2012:
| Number of Securities to be | Weighted-Average Exercise | Number of Securities | |
| Issued Upon Exercise of | Price of Outstanding | Remaining Available for | |
| Outstanding Options, | Options, Warrants and | Future Issuance Under | |
| Warrants and Rights | Rights | Equity Compensation Plans | |
| Plan Category | (a) | (b) | (excluding column (a)) |
| Equity Compensation Plans Approved by Security Holders (2006 and 2009 Plans) | 9,471,750(2) | $1.92 | 53,790 |
| Equity Compensation Plans Not Approved by Security Holders | 500,000(1) | $1.00 | Nil |
| |
|
2006 Stock Incentive Plan
On December 19, 2005, our Board of Directors authorized and approved the adoption of the 2005 Stock Option Plan effective December 19, 2005. On October 10, 2006, we adopted the 2006 Plan in place of the 2005 Plan, under which an aggregate of 10,000,000 of our shares may be issued. All securities issued under the 2005 Stock Option Plan are covered by the 2006 Plan. We have registered the shares underlying the 2006 Plan pursuant to a registration statement on Form S-8 with the SEC.
The purpose of the 2006 Plan is to enhance our long-term stockholder value by offering opportunities to our directors, officers, employees and eligible consultants to acquire and maintain stock ownership in order to give these persons the opportunity to participate in our growth and success, and to encourage them to remain in our service.
The 2006 Plan is to be administered by our Board of Directors or a committee appointed by and consisting of two or more members of the Board of Directors, which shall determine, among other things, (i) the persons to be granted awards under the 2006 Plan; (ii) the number of shares or amount of other awards to be granted; and (iii) the terms and conditions of the awards granted. The Company may issue restricted shares, options, stock appreciation rights, deferred stock rights, dividend equivalent rights, among others, under the 2006 Plan. An aggregate of 10,000,000 of our shares may be issued pursuant to the grant of awards under the 2006 Plan.
An award may not be exercised after the termination date of the award and may be exercised following the termination of an eligible participant's continuous service only to the extent provided by the administrator under the 2006 Plan. If the administrator under the 2006 Plan permits a participant to exercise an award following the termination of continuous service for a specified period, the award terminates to the extent not exercised on the last day of the specified period or the last day of the original term of the award, whichever occurs first. In the event an eligible participant's service has been terminated for "cause", he or she shall immediately forfeit all rights to any of the awards outstanding.
The foregoing summary of the 2006 Plan is not complete and is qualified in its entirety by reference to the 2006 Plan, a copy of which has been filed.
2009 Stock Incentive Plan
On June 5, 2009, our Board of Directors adopted the 2009 Plan, under which an aggregate of 5,000,000 shares may be issued, and on July 23, 2009, our shareholders approved the adoption of our 2009 Plan in the amount of 5,000,000 shares.
50
Effective May 25, 2010, our Board of Directors amended the 2009 Plan to increase the number of shares issuable thereunder from 5,000,000 shares to 7,000,000 shares. On July 22, 2010, our shareholders approved an amendment to our 2009 Plan increasing the number of shares available under the Plan from 5,000,000 to 7,000,000.
The purpose of the 2009 Plan is to enhance our long-term stockholder value by offering opportunities to our directors, officers, employees and eligible consultants to acquire and maintain stock ownership in order to give these persons the opportunity to participate in our growth and success, and to encourage them to remain in our service.
The 2009 Plan is to be administered by our Board of Directors or a committee appointed by and consisting of two or more members of the Board of Directors, which shall determine, among other things, (i) the persons to be granted awards under the 2009 Plan; (ii) the number of shares or amount of other awards to be granted; and (iii) the terms and conditions of the awards granted. The Company may issue shares, options, stock appreciation rights, deferred stock rights, dividend equivalent rights, among others, under the 2009 Plan. An aggregate of 7,000,000 of our shares may be issued pursuant to the grant of awards under the 2009 Plan.
An award may not be exercised after the termination date of the award and may be exercised following the termination of an Eligible Participant’s continuous service only to the extent provided by the administrator under the 2009 Plan. If the administrator under the 2009 Plan permits an Eligible Participant to exercise an award following the termination of continuous service for a specified period, the award terminates to the extent not exercised on the last day of the specified period or the last day of the original term of the award, whichever occurs first. In the event an Eligible Participant’s service has been terminated for “cause,” he or she shall immediately forfeit all rights to any of the awards outstanding.
The foregoing summary of the 2009 Plan is not complete and is qualified in its entirety by reference to the 2009 Plan, a copy of which has been filed.
As of October 10, 2012, there were an aggregate of 9,260,000 stock options granted and outstanding under our 2006 and 2009 Plans.
Common Stock Purchase Warrants
As of October 10, 2012, there were an aggregate of 1,558,812 common stock purchase warrants issued and outstanding.
Recent Sales of Unregistered Securities
All of our issuances of unregistered securities during our fiscal year ended July 31, 2012 were previously disclosed in our Quarterly Reports on Form 10-Q for our first, second and third quarters of our fiscal year ended July 31, 2012 and in our current reports on Form 8-K as filed periodically with the SEC, except for the following issuance: on June 29, 2012, the Company issued 100,000 unregistered, restricted shares of common stock to one individual as partial consideration under a property acquisition agreement at a deemed issuance price of $3.25 per share. With respect to such issuance, the Company relied on an exemption from the registration requirements under the Securities Act pursuant to Regulation S and/or Section 4(a)(2).
Comparative Stock Performance
Our shares of common stock commenced trading on the OTC Bulletin Board on December 5, 2005, with the first trade in our common stock occurring on February 17, 2006. Our shares of common stock were subsequently listed for trading on the NYSE MKT Equities Exchange (formerly known as the American Stock Exchange and the NYSE Amex Equities Exchange) on September 28, 2007.
The graph below compares the cumulative total stockholder return on our common stock assuming an investment of $100 and the reinvestment of all dividends, if any, for the years ended July 31, 2007 through to July 31, 2012; with (i) the cumulative total return on the shares of common stock of General Moly, Inc. and Uranerz Energy Corp. (Previous Peers) over the same periods, (ii) the cumulative return on the S&P Index (Previous Index), (iii) the cumulative return on the Russell 2000 (New Index), and (iv) a new peer group index comprising: Denison Mines Corp., Paladin Energy Ltd. and Uranium Resources Inc. (Current Peer Group). The change in peers was made in order to move to a group of uranium producing and development/pre-extraction companies that better compares with our company. The change in overall market indicator was made because our company is included in the Russell 2000 Index and therefore it is a more appropriate indicator than the S&P 500 Index.
51

| 31-Jul-07 | 31-Jul-08 | 31-Jul-09 | 31-Jul-10 | 31-Jul-11 | 31-Jul-12 | |||||||||||||
| UEC | $ | 100.00 | $ | 93.56 | $ | 115.02 | $ | 121.46 | $ | 147.33 | $ | 85.84 | ||||||
| GMO (Previous Peer) | $ | 100.00 | $ | 227.88 | $ | 85.76 | $ | 100.61 | $ | 138.48 | $ | 90.30 | ||||||
| URZ (Previous Peer) | $ | 100.00 | $ | 138.36 | $ | 122.64 | $ | 77.36 | $ | 189.31 | $ | 96.86 | ||||||
| S&P (Previous Index) | $ | 100.00 | $ | 98.45 | $ | 76.69 | $ | 85.63 | $ | 100.39 | $ | 107.15 | ||||||
| Russell 2000 (Current Index) | $ | 100.00 | $ | 97.75 | $ | 76.16 | $ | 89.05 | $ | 108.47 | $ | 105.48 | ||||||
| Current Peers | $ | 100.00 | $ | 109.88 | $ | 78.50 | $ | 75.06 | $ | 82.81 | $ | 55.61 | ||||||
52
The following tables provide selected financial data for each of the past five fiscal years, and should be read in conjunction with, and are qualified in their entirety by reference to, Item 7. Management's Discussion and Analysis of Financial Condition and Results of Operations and the Company’s consolidated financial statements and related notes for the fiscal year ended July 31, 2012 as presented under Item 8. Financial Statements and Supplementary Data. These historical results are not necessarily indicative of the results to be expected for any future period.
Consolidated Balance Sheets
| July 31, 2012 | July 31, 2011 | July 31, 2010 | July 31, 2009 | July 31, 2008 | |||||||||||
| Cash and cash equivalents | $ | 25,015,284 | $ | 30,724,051 | $ | 21,067,662 | $ | 24,265,643 | $ | 13,137,318 | |||||
| Working capital | 22,472,302 | 30,020,926 | 16,243,838 | 23,713,452 | 12,585,424 | ||||||||||
| Total assets | 85,143,395 | 65,390,985 | 47,554,766 | 38,611,555 | 29,131,183 | ||||||||||
| Total liabilities | 9,222,914 | 6,268,194 | 5,518,429 | 761,800 | 865,390 | ||||||||||
| Stockholders' equity | 75,920,481 | 59,122,791 | 42,036,337 | 37,849,755 | 28,265,793 | ||||||||||
| Consolidated Statements of Operations | |||||||||||||||
| Year Ended July 31, | |||||||||||||||
| 2012 | 2011 | 2010 | 2009 | 2008 | |||||||||||
| Sales | $ | 13,757,400 | $ | - | $ | - | $ | - | $ | - | |||||
| Gross profit | 5,645,360 | - | - | - | - | ||||||||||
| Expenses | 30,251,253 | 27,906,601 | 22,431,147 | 12,948,327 | 18,840,129 | ||||||||||
| Loss from continuing operations | (25,083,720 | ) | (27,358,095 | ) | (23,012,750 | ) | (12,883,569 | ) | (18,612,414 | ) | |||||
| Income (loss) from discontinued operations | - | - | 8,534,081 | (620,007 | ) | (428,539 | ) | ||||||||
| Net loss for the year | (25,083,720 | ) | (27,358,095 | ) | (14,478,669 | ) | (13,503,576 | ) | (19,236,124 | ) | |||||
| Net loss per share, basis and diluted | |||||||||||||||
| Continuing operations | $ | (0.32 | ) | $ | (0.40 | ) | $ | (0.39 | ) | $ | (0.27 | ) | $ | (0.48 | ) |
| Discontinued operations | - | - | 0.14 | (0.02 | ) | (0.01 | ) | ||||||||
| Net loss per share, basic and diluted | (0.32 | ) | (0.40 | ) | (0.25 | ) | (0.29 | ) | (0.49 | ) | |||||
53
The following management’s discussion and analysis of the Company’s financial condition and results of operations contain forward-looking statements that involve risks, uncertainties and assumptions including, among others, statements regarding our capital needs, business plans and expectations. In evaluating these statements, you should consider various factors, including the risks, uncertainties and assumptions set forth in reports and other documents we have filed with or furnished to the SEC, including, without limitation, this Form 10-K filing for the fiscal year ended July 31, 2012 including the consolidated financial statements and related notes contained herein. These factors, or any one of them, may cause our actual results to differ materially from any forward-looking statement made in this document. Refer to “Forward-Looking Statements” and “Item 1A. Risk Factors”.
Introduction
The following discussion summarizes the Company’s results of operations for each of the fiscal years ended July 31, 2012, 2011 and 2010 (“Fiscal 2012”, “Fiscal 2011” and “Fiscal 2010”, respectively) and financial condition as at July 31, 2012 and 2011, with a particular emphasis on Fiscal 2012, its most recently completed fiscal year.
Business
The Company operates in a single reportable segment and since 2004, as more fully described under General Business of ITEM 1. BUSINESS, it has been engaged in uranium mining and related activities, including exploration, pre-extraction, extraction and processing, on uranium projects located in the United States and Paraguay.
The Company utilizes in-situ recovery (“ISR”) mining where possible which it believes, when compared to conventional open pit or underground mining, requires lower capital and operating expenditures with a shorter lead time to extraction and a reduced impact on the environment. The Company has one uranium mine located in the State of Texas, the Palangana Mine, which utilizes ISR mining and commenced extraction of triuranium octoxide (“U3O8”), or yellowcake, in November 2010. The Company has one uranium processing facility or mill located in the State of Texas, the Hobson Processing Facility, which processes material from the Palangana Mine into drums of U3O8, its only sales product and source of revenue, for shipping to a third-party storage and sales facility. At July 31, 2012, the Company has one offtake agreement with a remaining delivery commitment of 200,000 pounds of U3O8.
The Hobson Processing Facility has a physical capacity of two million pounds of U3O8 annually and a license to process up to one million pounds annually, which provides for the capacity to process material from a number of ISR mines. The Company utilizes a “hub-and-spoke” strategy in South Texas whereby the Hobson Processing Facility acts as its central uranium processing site (the “hub”) for the Palangana Mine and for future satellite ISR mines, such as the Goliad Project, (the “spokes”) located within the South Texas Uranium Belt.
The Company also holds certain mineral exploration interests in various stages in the States of Arizona, Colorado, New Mexico, Texas and Wyoming and in Paraguay, many of which are located in historically successful mining areas and have been the subject of past exploration activities by other mining companies. The Company does not expect, however, to utilize ISR mining for all of these mineral exploration interests in which case it would expect to rely on conventional open pit and/or underground mining techniques.
The Company’s operating and strategic framework is based on expanding its uranium extraction activities, which includes advancing certain uranium projects with established mineralized materials towards uranium extraction, and establishing additional mineralized materials on its existing uranium projects or through acquisition of additional uranium projects. The following is a list of the material transactions for Fiscal 2012:
54
Effective September 9, 2011, the Company acquired a 100% interest in the Anderson Project located in the State of Arizona through the acquisition of Concentric Energy Corp., a private company incorporated in the State of Nevada;
Effective November 30, 2011, the Company acquired a 100% interest in the Workman Creek Project located in the State of Arizona;
Effective March 30, 2012, the Company acquired a 100% interest in the Yuty Project located in the Republic of Paraguay through the acquisition of Cue Resources Ltd., a publicly-traded company incorporated in the Province of British Columbia, Canada;
Effective March 31, 2012, the Company acquired a 100% interest in a further two prospecting permits in the area of Coronel Oviedo, Paraguay, adjacent to its existing Coronel Oviedo Project;
On April 10, 2012, the Company closed a public offering of its common stock for gross proceeds of $22.5 million (net proceeds of $21.0 million) through the sale of 6,246,078 shares of the Company at a price of $3.60 per share;
Effective May 23, 2012, the Company acquired uranium rights through a mineral lease on the Slick Rock Project located in the State of Colorado;
During Fiscal 2012, the Company acquired uranium rights through a mineral lease on the Burke Hollow Project located in the State of Texas; and
During Fiscal 2012, the Company acquired uranium rights through a mineral lease on the Channen Project located in the State of Texas.
Since commencing uranium extraction at the Palangana Mine in November 2010 to July 31, 2012, the Hobson Processing Facility has processed finished goods representing 323,000 pounds (Fiscal 2012: 198,000; Fiscal 2011: 125,000; Fiscal 2010: Nil) of U3O8 extracted solely from the Palangana Mine, of which 270,000 pounds of U3O8 (Fiscal 2012: 270,000; Fiscal 2011 and 2010: Nil) were sold generating revenue of $13.8 million during Fiscal 2012 (Fiscal 2011 and 2010: $Nil). This revenue was generated solely from the sale of U3O8 extracted from the Palangana Mine, and directly the result of commencing uranium extraction and neither incidental to nor the result of minerals encountered in the course of exploration or pre-extraction activities.
Key Issues
Since commencing uranium extraction at the Palangana Mine in November 2010 to July 31, 2012, the Company has been focused primarily on expanding its South Texas uranium extraction and establishing additional uranium mines through exploration and pre-extraction activities and direct acquisitions, all of which require us to manage numerous challenges, risks and uncertainties inherent in our business and operations as more fully described in Item 1A. Risk Factors.
The Company’s operations are capital intensive, and will require significant additional financing to acquire additional uranium projects and continue with its exploration and pre-extraction activities. Historically, the Company has been reliant primarily on equity financings from the sale of its common stock to fund its operations. The Company has also relied on cash flows generated from its mining activities during Fiscal 2012, however, has yet to achieve profitability or develop positive cash flow from operations. The Company’s reliance on equity financings, and on any other form of financing it decides to pursue in the future such as debt financing, is expected to continue for the foreseeable future, and their availability whenever such additional financing is required, will be dependent on many factors beyond the Company’s control such as the volatility in the global financial markets affecting its stock price, the status of the worldwide economy and the market price of uranium. There is no assurance that the Company will be successful in securing any form of additional financing when required and on terms favorable to us. The Company’s inability to obtain additional financing would have a negative impact on its operations, including delays, curtailment or abandonment of any one or all of the Company’s uranium projects.
55
The Company has not established proven or probable reserves, as defined by the SEC under Industry Guide 7, through the completion of a “final” or “bankable” feasibility study for any of its mineral projects. The Company has established the existence of mineralized materials for certain uranium projects, including the Palangana Mine. Since the Company commenced uranium extraction at the Palangana Mine without having established proven or probable reserves, there may be greater inherent uncertainty as to whether or not any mineralized material can be economically extracted as originally planned and anticipated. The Palangana Mine has been the Company’s sole source for the U3O8 sold to generate its revenue during Fiscal 2012, with no revenues generated prior to Fiscal 2012. The economic viability of the Company’s mining activities, including the expected duration and profitability of the Palangana Mine and of any future satellite ISR mines, such as the Goliad Project, located within the South Texas Uranium Belt, has many risks and uncertainties. These include, but are not limited to: (i) a significant, pro-longed decrease in the market price of uranium; (ii) difficulty in marketing and/or selling uranium concentrates; (iii) significantly higher than expected capital costs to construct the mine and/or processing plant; (iv) significantly higher than expected extraction costs; (v) significantly lower than expected uranium extraction; (vi) significant delays, reductions or stoppages of uranium extraction activities; and (vii) the introduction of significantly more stringent regulatory laws and regulations. The Company’s mining activities may change as a result of any one or more of these risks and uncertainties and there is no assurance that any ore body that we extract mineralized materials from will result in profitable mining activities.
At July 31, 2012, the Company had one multi-year uranium sales agreement based on the uranium spot price at the time of delivery, and since future sales of U3O8 are expected to generally occur under this uranium supply agreement or through the uranium spot market, fluctuations in the spot price of uranium has had and will continue to have a direct impact on the Company’s revenues and cash flows. The table below provides the high/low/average/close for each of the last three fiscal years ended July 31 as obtained from The Ux Consulting Company, LLC:
| Fiscal Year | ||||
| Ending July 31, | High | Low | Average | Close |
| 2012 | $ 55.25 | $ 49.00 | $ 50.69 | $ 49.50 |
| 2011 | 73.00 | 45.00 | 57.23 | 51.50 |
| 2010 | 48.50 | 40.50 | 43.48 | 46.00 |
Historically, the spot price of uranium has been difficult to predict and subject to significant volatility, and will continue to be affected by numerous factors beyond our control.
Exploration Stage
The Company has established the existence of mineralized materials for certain uranium projects, including the Palangana Mine. The Company has not established proven or probable reserves, as defined by the SEC under Industry Guide 7, through the completion of a “final” or “bankable” feasibility study for any of its uranium projects, including the Palangana Mine. Furthermore, the Company has no plans to establish proven or probable reserves for any of its uranium projects for which the Company plans on utilizing ISR mining, such as the Palangana Mine. As a result, and despite the fact that the Company commenced extraction of mineralized materials at the Palangana Mine in November 2010, the Company remains in the Exploration Stage as defined under Industry Guide 7, and will continue to remain in the Exploration Stage until such time proven or probable reserves have been established.
Since the Company commenced extraction of mineralized materials at the Palangana Mine without having established proven and probable reserves, any mineralized materials established or extracted from the Palangana Mine should not be in any way associated with having established or produced from proven or probable reserves.
The Company prepares its consolidated financial statements in accordance with U.S. GAAP under which acquisition costs of mineral rights are initially capitalized as incurred while exploration and pre-extraction expenditures are expensed as incurred until such time the Company exits the Exploration Stage by establishing proven or probable reserves. Expenditures relating to exploration activities such as drill programs to search for additional mineralized material are expensed as incurred. Expenditures relating to pre-extraction activities such as the construction of mine wellfields, ion exchange facilities and disposal wells are expensed as incurred until such time proven or probable reserves are established for that uranium project, after which subsequent expenditures relating to mine development activities for that particular project are capitalized as incurred.
56
Companies in the Production Stage as defined by the SEC under Industry Guide 7, having established proven and probable reserves and exited the Exploration Stage, typically capitalize expenditures relating to ongoing development activities, with corresponding depletion calculated over proven and probable reserves using the units-of-production method and allocated to future reporting periods to inventory and, as that inventory is sold, to cost of goods sold. As the Company is in the Exploration Stage, it has resulted in our reporting of larger losses than if the Company had been in the Production Stage due to the expensing, instead of capitalizing, of expenditures relating to ongoing mill and mine development activities. Additionally, there would be no corresponding amortization allocated to the Company’s future reporting periods since those costs would have been expensed previously, resulting in both lower inventory costs and cost of goods sold and results of operations with higher gross profits and lower losses than if the Company had been in the Production Stage. Any capitalized costs, such as acquisition costs of mineral rights, are depleted over the estimated extraction life using the straight-line method. As a result, the Company’s consolidated financial statements may not be directly comparable to the financial statements of companies in the Production Stage.
Development Stage Entity
Prior to the quarter ended October 31, 2011 (“Fiscal 2012 Q1”), the Company met the definition of a Development Stage Entity as defined under Accounting Standards Codification Section 915: Development Stage Entities (“ASC 915”) and presented the additional financial statement disclosures required by a Development Stage Entity under ASC 915, including the presentation of cumulative amounts since inception for the consolidated statements of operations and comprehensive loss, stockholders’ equity and cash flows. In Fiscal 2012 Q1, during which the Company generated significant revenue from its planned principal operations by completing its first sale of U3O8, the Company no longer met the definition of a Development Stage Entity. Accordingly, and starting with the filing of its Form 10-Q for Fiscal 2012 Q1, the Company no longer presented the additional financial statement disclosures required by a Development Stage Entity under ASC 915.
Results of Operations for the Fiscal Years Ended July 31, 2012, 2011 and 2010
General
The Company recorded a net loss for each of the fiscal years ended July 31, 2012, 2011 and 2010 (“Fiscal 2012”, “Fiscal 2011” and “Fiscal 2010”, respectively) of $25,084,000 ($0.32 per share), $27,358,000 ($0.40 per share) and $14,479,000 ($0.25 per share), respectively. Expenses during Fiscal 2012, Fiscal 2011 and Fiscal 2010 were $30,251,000, $27,907,000 and $22,431,000, respectively. During Fiscal 2012, the Company generated a gross profit of $5,645,000 from sales of uranium concentrates (Fiscal 2011 and Fiscal 2010: $Nil). During Fiscal 2010, the Company recorded income from discontinued operations of $8,534,000 ($0.14 per share) relating to the sale of its 49% interest in Cibola Resources, LLC.
The Company currently operates in a single reportable segment and is focused on uranium mining and related activities, including exploration, pre-extraction, extraction and processing of uranium concentrates.
During the last three fiscal years, the Company acquired the Hobson Processing Facility and the Palangana Mine through the acquisition of South Texas Mining Venture, L.L.P. and in November 2010, the Company commenced uranium extraction at the Palangana Mine and processing of those materials at the Hobson Processing Facility, completed a number of other strategic corporate and project acquisitions and continued with exploration and pre-extraction activities on its various uranium projects.
During Fiscal 2012, the Company continued with uranium extraction and added the PAA-2 wellfield at the Palangana Mine, and processing of those materials at the Hobson Processing Facility. In Paraguay, the Company acquired the Yuty Project, its second major project in that country, through the acquisition of Cue Resources Ltd., a former publicly-traded company, and also acquired an additional two prospecting permits at the Coronel Oviedo Project. In Texas, the Company added the Burke Hollow and Channen Projects to its South Texas project portfolio. In Arizona, the Company acquired the Anderson Project through a merger with Concentric Energy Corp., a private company, and also the Workman Creek Project. In Colorado, the Company acquired the Slick Rock Project.
During Fiscal 2011, the Company commenced uranium extraction at the Palangana Mine beginning with PAA-1 and processing of those materials at the Hobson Processing Facility. In Paraguay, the Company acquired two prospecting permits at the Coronel Oviedo Project.
During Fiscal 2010, the Company acquired the Hobson Processing Facility, the Palangana Mine, interests in other exploration projects including prior exploration data and a Corpus Christi office and existing infrastructure through the acquisition of South Texas Mining Venture, L.L.P.
57
Revenues and Cost of Sales
Since commencing uranium extraction for the first time at its Palangana Mine in November 2010, the Company completed a total of three sales of uranium concentrates to July 31, 2012, all of which were generated during Fiscal 2012. Two sales totaling 120,000 pounds were completed under an existing offtake agreement, fulfilling the Company’s delivery commitments for the first year, and the third sale totaling 150,000 pounds was completed on the spot market. As a result of these sales, gross revenues of $13,757,000 was generated during Fiscal 2012 (Fiscal 2011 and 2010: $Nil) representing a total 270,000 pounds of uranium concentrates sold at an average price of $51 per pound.
For Fiscal 2012, cost of sales was $8,112,000 (Fiscal 2011 and 2010: $Nil) which included royalties of $1,651,000 and depreciation and depletion of $1,486,000. Cost of sales for uranium concentrates is determined using the average cost per pound in inventories at the end of the month prior to the month in which the sale occurs, and includes royalties and other direct selling costs.
For Fiscal 2012, the Company generated a gross profit of $5,645,000 (Fiscal 2011 and 2010: $Nil) from the sale of uranium concentrates.
Expenses
Expenses during Fiscal 2012, Fiscal 2011 and Fiscal 2010 were $30,251,000, $27,907,000 and $22,431,000, respectively, and these year-to-year increases reflect the substantial growth of the Company over the past three fiscal years.
Mineral property expenditures during Fiscal 2012, Fiscal 2011 and Fiscal 2010 were $14,939,000, $11,420,000 and $6,439,000, respectively. These expenditures include amounts relating to property maintenance and exploration and pre-extraction activities including permitting and all other non-production related activities on the Company’s mineral rights and properties. As disclosed under Risk Factors, the Company has not established proven and probable reserves through the completion of feasibility studies for any of its mineral properties in accordance with SEC Industry Guide 7. Accordingly, all expenditures relating to exploration and pre-extraction activities are expensed as incurred.
The following table sets forth the mineral property expenditures incurred on the Company’s projects during the past three fiscal years:
| Year Ended July 31, | |||||||||
| 2012 | 2011 | 2010 | |||||||
| Mineral Property Expenditures | |||||||||
| Palangana Mine | $ | 7,597,102 | $ | 7,859,841 | $ | 3,643,662 | |||
| Goliad Project | 646,314 | 995,849 | 2,353,547 | ||||||
| Burke Hollow Project | 1,176,101 | - | - | ||||||
| Channen Project | 190,009 | - | - | ||||||
| Hobson | 123,005 | 367,904 | 30,300 | ||||||
| Salvo Project | 1,113,659 | 1,268,088 | 83,788 | ||||||
| Nichols Project | 150,000 | 15,496 | 5,976 | ||||||
| Land work - Texas | 423,291 | 388,633 | 164,740 | ||||||
| Anderson Project | 375,058 | 13,707 | - | ||||||
| Workman Creek Project | 50,069 | - | - | ||||||
| Yuty Project | 627,623 | - | - | ||||||
| Coronel Oviedo Project | 2,207,255 | 250,992 | - | ||||||
| Other Mineral Property Expenditures | 259,236 | 259,670 | 156,701 | ||||||
| $ | 14,938,722 | $ | 11,420,180 | $ | 6,438,714 | ||||
58
A breakdown by specific mine/project and major expenditure categories are as follows:
Palangana Mine: Property maintenance (Fiscal 2012: $57,000; Fiscal 2011: $94,000; Fiscal 2010: $214,000), exploration programs (Fiscal 2012: $1,277,000; Fiscal 2011: $954,000; Fiscal 2010: $793,000), plant development (Fiscal 2012: $257,000; Fiscal 2011: $1,027,000; Fiscal 2010: $189,000), wellfield development (Fiscal 2012: $5,530,000; Fiscal 2011: $4,840,000; Fiscal 2010: $801,000) and disposal well development (Fiscal 2012: $476,000; Fiscal 2011: $945,000; Fiscal 2010: $1,647,000);
Goliad Project: Property maintenance (Fiscal 2012: $41,000; Fiscal 2011: $75,000; Fiscal 2010: $47,000), exploration programs (Fiscal 2012: $451,000; Fiscal 2011: $516,000; Fiscal 2010: $2,307,000), plant development (Fiscal 2012: $111,000; Fiscal 2011: $396,000; Fiscal 2010: $Nil) and wellfield development (Fiscal 2012: $43,000; Fiscal 2011: $9,000; Fiscal 2010: $Nil);
Burke Hollow Project: Exploration programs (Fiscal 2012: $1,176,000; Fiscal 2011: $Nil; Fiscal 2010: $Nil);
Channen Project: Exploration programs (Fiscal 2012: $190,000; Fiscal 2011: $Nil; Fiscal 2010: $Nil);
Salvo Project: Property maintenance (Fiscal 2012: $57,000; Fiscal 2011: $59,000; Fiscal 2010: $34,000) and exploration programs (Fiscal 2012: $1,057,000; Fiscal 2011: $1,209,000; Fiscal 2010: $50,000);
Nichols Project: Property maintenance (Fiscal 2012: $150,000; Fiscal 2011: $15,000; Fiscal 2010: $6,000);
Anderson Project: Property maintenance (Fiscal 2012: $74,000; Fiscal 2011: $Nil; Fiscal 2010: $Nil) and exploration programs (Fiscal 2012: $301,000; Fiscal 2011: $14,000; Fiscal 2010: $Nil);
Workman Creek Project: Exploration programs (Fiscal 2012: $50,000; Fiscal 2011: $Nil; Fiscal 2010: $Nil);
Yuty Project: Property maintenance (Fiscal 2012: $583,000; Fiscal 2011: $Nil; Fiscal 2010: $Nil) and exploration programs (Fiscal 2012: $45,000; Fiscal 2011: $Nil; Fiscal 2010: $Nil); and
Coronel Oviedo Project: Property maintenance (Fiscal 2012: $107,000; Fiscal 2011: $251,000; Fiscal 2010: $Nil) and exploration programs (Fiscal 2012: $2,100,000; Fiscal 2011: $Nil; Fiscal 2010: $Nil).
59
General and administrative expenses during Fiscal 2012, Fiscal 2011 and Fiscal 2010 were $14,037,000, $15,187,000 and $15,154,000, respectively. General and administrative expenses were comprised of salaries, management and consulting fees (Fiscal 2012: $3,866,000; Fiscal 2011: $4,001,000; Fiscal 2010: $3,082,000), office, investor relations, communications and travel (Fiscal 2012: $5,836,000; Fiscal 2011: $3,702,000; Fiscal 2010: $4,410,000), stock-based compensation expense (Fiscal 2012: $2,743,000; Fiscal 2011: $6,343,000; Fiscal 2010: $7,029,000) and professional fees (Fiscal 2012: $1,592,000; Fiscal 2011: $1,141,000; Fiscal 2010: $633,000).
The following summary provides a discussion of the major expense categories, including analyses of the factors that caused any significant variances from year-to-year:
During Fiscal 2012, salaries, management and consulting fees totaled $3,866,000 which remained consistent with no significant changes compared to $4,001,000 during Fiscal 2011. During Fiscal 2011, however, such expenses increased by $919,000 compared to Fiscal 2010 due primarily to the continued expansion of the Company’s operations in Texas following the acquisition of South Texas Mining Venture, L.L.P. in December 2009, whereby the Company acquired the Hobson Facility, the Palangana Mine and a Corpus Christi office and existing infrastructure. The Company increased personnel overall to provide additional general and administrative support for the increased operations particularly in Texas;
During Fiscal 2012, office, investor relations, communications and travel expenses totaled $5,836,000, which increased significantly by $2,134,000 compared to $3,702,000 during Fiscal 2011, due primarily to a significant increase in the number of strategic corporate and project acquisitions completed in Paraguay, Texas, Arizona and Colorado. The Company increased general and administrative support overall to accommodate the expansion of its existing operations by the addition of these new projects, including expansion of the New Mexico office. The Company also incurred additional due diligence costs relating to these acquisitions and potential acquisitions that were reviewed. During Fiscal 2011, such expenses decreased by $708,000 compared to $4,410,000 during Fiscal 2010 as finance charges of $517,000 relating to share purchase warrants were incurred in Fiscal 2010, while no such charges were incurred during Fiscal 2011;
During Fiscal 2012, stock-based compensation expense totaled $2,743,000, which decreased significantly by $3,600,000 compared to $6,343,000 during Fiscal 2011. These decreases were primarily the result of a significant decrease in the number of stock options granted during Fiscal 2012 compared to Fiscal 2011 and 2010. Stock-based compensation represents the fair value of stock options granted to employees, directors, management and consultants, including the fair value of common stock issued to consultants; and
During Fiscal 2012, professional fees totaled $1,592,000, which increased by $451,000 compared to $1,141,000 during Fiscal 2011. During Fiscal 2011, professional fees also increased by $508,000 compared to Fiscal 2010. These increases were primarily the result of the number of strategic corporate and project acquisitions completed in Paraguay, Texas, Arizona and Colorado and potential acquisitions that were reviewed.
Depreciation, amortization and accretion during Fiscal 2012, Fiscal 2011 and Fiscal 2010 were $1,276,000, $1,156,000 and $795,000, respectively. Depreciation, amortization and accretion include depreciation and amortization of long-term assets acquired in the normal course of operations and accretion of asset retirement obligations. For the past three fiscal years, these charges have increased overall as a result of the substantial growth experienced by the Company.
Impairment loss on mineral properties during Fiscal 2012, Fiscal 2011 and Fiscal 2010 were $Nil, $143,000 and $44,000, respectively. These charges during the prior years resulted from the abandonment of certain mineral properties that were determined by management to be non-critical within the Company’s portfolio of properties. During Fiscal 2011, the mineral properties abandoned were located in Utah ($15,000) and Texas ($128,000). During Fiscal 2010, the mineral properties abandoned were located in New Mexico ($11,000), Texas ($32,000) and Wyoming ($1,000).
Uranium Extraction and Inventories
During Fiscal 2012, the Company extracted from the Palangana Mine 183,000 pounds of uranium concentrates while the Hobson Facility processed finished goods of 198,000 pounds of uranium concentrates. Since the commencement of uranium extraction in November 2010 to July 31, 2012, the Hobson Facility has processed 323,000 pounds of finished goods-uranium concentrates of which 270,000 pounds have been sold, resulting in a balance of 53,000 pounds of finished goods-uranium concentrates remaining as of July 31, 2012.
60
At July 31, 2012, the total value of inventories was $1,876,000 of which $1,593,000 (85%) represents the value of finished goods-uranium concentrates, $251,000 (13%) represents the value of work-in-progress and $32,000 (2%) represents the value of supplies. The cash component of the total value of inventories was $1,557,000, and the non-cash component of the total value of inventory was $319,000.
At July 31, 2011, the total value of inventories was $2,776,000, of which $2,231,000 (80%) represents the value of finished goods-uranium concentrates, $506,000 (18%) represents the value of work-in-progress and $39,000 (2%) represents the value of supplies. The cash component of the total value of inventories was $2,064,000 and the non-cash component of the total value of inventory was $712,000.
| Liquidity and Capital Resources | |||||||||
| July 31, 2012 | July 31, 2011 | July 31, 2010 | |||||||
| Cash and cash equivalents | $ | 25,015,000 | $ | 30,724,000 | $ | 21,068,000 | |||
| Working capital | 22,472,000 | 30,021,000 | 16,244,000 | ||||||
| Total assets | 85,143,000 | 65,391,000 | 47,555,000 | ||||||
| Total liabilities | 9,223,000 | 6,268,000 | 5,519,000 | ||||||
| Shareholders' equity | 75,920,000 | 59,123,000 | 42,036,000 |
At July 31, 2012, the Company had working capital of $22,472,000, a decrease of $7,549,000 from working capital of $30,021,000 at July 31, 2011. At July 31, 2012, the Company had $25,015,000 in cash and cash equivalents, which represented the largest component of the working capital balance. As a result, the Company’s working capital balance will fluctuate significantly as the Company utilizes its cash and cash equivalents to fund operations including exploration and pre-extraction activities.
Although the Company’s planned principal operations have commenced from which it realized significant gross revenues from sales of U3O8 during Fiscal 2012 of $13,757,400, the Company has yet to achieve profitability and has had a history of operating losses and significant negative cash flow since inception. For Fiscal 2012, the Company’s net losses totaled $25,084,000 (Fiscal 2011: $27,358,000; Fiscal 2010: $14,479,000) and an accumulated deficit balance of $120,824,000 as at July 31, 2012. During Fiscal 2012, net cash flows decreased by $5,709,000 compared to an increase of $9,656,000 during Fiscal 2011 and a decrease of $3,198,000 during Fiscal 2010. The Company does not expect to achieve profitability or develop positive cash flow from operations in the near term.
Historically, the Company has been reliant primarily on equity financings from the sale of its common stock to fund the Company’s operations. The Company has also relied on cash flows generated from its mining activities during Fiscal 2012. The Company’s reliance on equity financings is expected to continue for the foreseeable future, and their availability whenever such additional financing is required, will be dependent on many factors, including but not limited to those factors beyond the Company’s control such as volatility in the global financial markets affecting its stock price, the status of the worldwide economy and the market price of uranium, any one of which may cause significant challenges in the Company’s ability to access additional financing, including access to the equity and credit markets. The Company also filed a Form S-3 “Shelf” Registration Statement that became effective September 2, 2011 which provides for the offer and sale of certain securities of the Company from time to time, at its discretion, up to an aggregate public offering of $50 million, of which approximately $22.5 million was sold in a public offering which closed on April 10, 2012 for net proceeds of $21.0 million through the sale of 6,246,078 shares of the Company at a price of $3.60 per share. The Company may also be required to seek other forms of financing, such as debt financing or joint venture arrangements to continue advancing our uranium projects which would depend entirely on finding a suitable third party willing to enter into such an arrangement, typically involving an assignment of a percentage interest in the mineral project. However, there is no assurance that the Company will be successful in securing any form of additional financing when required and on terms favorable to the Company.
61
The Company’s operations are capital intensive, and will require significant additional financing to acquire additional uranium projects and continue with its exploration and pre-extraction activities. In the absence of such additional financing, the Company would not be able to fund its operations, including continuing with exploration and pre-extraction activities, which may result in delay, curtailment or abandonment of any one or all of the Company’s uranium projects.
Existing cash resources and available sources of financing are expected to provide sufficient funds to carry out the Company’s plan of operations for the fiscal year ended July 31, 2013 (“Fiscal 2013”). For Fiscal 2013, the Company anticipates to further expand uranium extraction activities at the Palangana Mine, with estimated expenditures for permitting of $0.4 million and wellfield development of $3.4 million. For the Goliad Project, the Company anticipates to continue pre-extraction activities during Fiscal 2013, with estimated expenditures from $0.5 million to $1.0 million including procurement of long-lead equipment. For the Burke Hollow Project, the focus will be on permitting and exploration activities during Fiscal 2013, with estimated expenditures of $2.2 million. For the Channen Project, the lease option agreement requires minimum exploration expenditures totaling $0.8 million by December 31, 2012. At July 31, 2012, the Company had mineral rights in the States of Arizona, Colorado, New Mexico, Texas and Wyoming with annual land fees totaling $0.5 million to maintain these rights in good standing. The Company’s mineral rights in Paraguay require annual land fees totaling $0.7 million to maintain these rights in good standing. The Company’s continuation as a going concern for a period beyond Fiscal 2013 will be dependent upon its ability to obtain adequate additional financing, as future capital expenditures are expected to be substantial.
The Company’s long-term success, including the recoverability of the carrying values of its assets and its ability to acquire additional uranium projects and continue with exploration and pre-extraction activities and mining activities on existing uranium projects, will depend ultimately on the Company’s ability to achieve and maintain profitability and to develop positive cash flow from its operations by establishing ore bodies that contain commercially recoverable uranium and to develop these into profitable mining activities. The economic viability of the Company’s mining activities, including the expected duration and profitability of the Palangana Mine and of any future satellite ISR mines, such as the Goliad Project, located within the South Texas Uranium Belt, has many risks and uncertainties. These include, but are not limited to: (i) a significant, pro-longed decrease in the market price of uranium; (ii) difficulty in marketing and/or selling uranium concentrates; (iii) significantly higher than expected capital costs to construct the mine and/or processing plant; (iv) significantly higher than expected extraction costs; (v) significantly lower than expected uranium extraction; (vi) significant delays, reductions or stoppages of uranium extraction activities; and (vii) the introduction of significantly more stringent regulatory laws and regulations. The Company’s mining activities may change as a result of any one or more of these risks and uncertainties and there is no assurance that any ore body that we extract mineralized materials from will result in profitable mining activities.
Operating Activities
Net cash used in operating activities during Fiscal 2012, Fiscal 2011 and Fiscal 2010 was $19,208,000, $23,676,000 and $13,572,000, respectively. During Fiscal 2012, the Company received total cash of $13,757,000 from sales of 270,000 pounds uranium concentrate (Fiscal 2011 and 2010: $Nil) and incurred extraction costs of $4,356,000 (Fiscal 2011:$2,000,000 and Fiscal 2010: $Nil). Other significant operating expenditures included mineral property expenditures and general and administrative costs. In addition, during Fiscal 2012, the Company incurred expenditures totaling $1,064,000 (Fiscal 2011: $1,213,000; Fiscal 2010: $1,369,000) for cash settlement of asset retirement obligations.
62
Financing Activities
Net cash provided by financing activities during Fiscal 2012, Fiscal 2011 and Fiscal 2010 was $20,192,000, $37,115,000, and $1,182,000, respectively. During Fiscal 2012, the Company completed a public offering of its common shares for net cash proceeds of $20,969,000. During Fiscal 2011, the Company completed a private placement offering of its common shares for net cash proceeds of $25,654,000. During Fiscal 2010, no public or private placement offerings were completed. During Fiscal 2012, the Company received net proceeds of $554,000 (Fiscal 2011: $11,452,000 and Fiscal 2010: $1,145,000) from the exercise of stock options and warrants. During Fiscal 2012, the Company paid $1,370,000 in cash for settlement of convertible debentures assumed from the Concentric acquisition.
Investing Activities
Net cash used in investing activities during Fiscal 2012 and Fiscal 2011 was $6,692,000 and $3,782,000 while net cash provided by investing activities in Fiscal 2010 was $9,192,000. During Fiscal 2012, the Company acquired mineral rights and properties totaling $4,184,000 (Fiscal 2011 $1,454,000 and Fiscal 2010: $1,422,000), purchased equipment for $1,322,000 (Fiscal 2011: $719,000 and Fiscal 2010: $167,000), paid $261,000 in cash (Fiscal 2011: $300,000 and Fiscal 2010: $Nil) as loan settlement relating to the acquisition of subsidiaries, and paid $933,000 (Fiscal 2011: $1,869,000 and Fiscal 2010: $223,000) towards reclamation deposits relating to our uranium mining and related activities. During Fiscal 2012, the Company received proceeds from the sale of assets and mineral rights totaling $8,000 (Fiscal 2011: $531,000 and Fiscal 2010: $11,004,000).
Stock Options and Warrants
At July 31, 2012, the Company had stock options outstanding representing 9,559,271 common shares and share purchase warrants outstanding representing 1,558,812 common shares. The outstanding stock options have a weighted-average exercise price of $1.95 per share and the outstanding warrants have a weighted-average exercise price of $4.95 per share. At July 31, 2012, outstanding stock options and warrants represented a total 11,118,083 common shares issuable for gross proceeds of approximately $26,375,000 should these stock options and warrants be exercised in full. At July 31, 2012, outstanding in-the-money stock options and warrants represented a total 3,920,000 common shares exercisable for gross proceeds of approximately $2,070,000 should these stock options and warrants be exercised in full. The exercise of these stock options and warrants is at the discretion of the respective holders and, accordingly, there is no assurance that any of these stock options or warrants will be exercised in the future.
Plan of Operations
Our primary plan of operations for the next 12 months is to expand uranium extraction at the Palangana Mine, continue pre-extraction of the Goliad Project towards uranium extraction and continue with the exploration of the Burke Hollow, Salvo and Channen Projects in Texas and other mineral projects in Arizona and Paraguay.
Material Commitments
The Company is currently renting or leasing office premises in New Mexico, Texas, Vancouver, British Columbia, Canada, as well as Paraguay with total monthly payments of $19,732. Office lease agreements expire between October 2012 and August 2013 for the United States and Canada. The Company also has various consulting agreements which will expire in less than one year.
63
| Payment Due by Period | |||||||||||||||
| Less Than 1 | More Than 5 | ||||||||||||||
| Contractual Obligations | Total | Year | 1-3 Years | 3-5 Years | Years | ||||||||||
| Capital Lease Obligations | $ | - | $ | - | $ | - | $ | - | $ | - | |||||
| Operating Leases Obligations | 580,384 | 433,339 | 147,045 | - | - | ||||||||||
| Purchase Obligations | - | - | - | - | - | ||||||||||
| Other Long-term Liabilities | 3,662,233 | 133,298 | 1,338,919 | - | 2,190,016 | ||||||||||
We are committed to pay our key executives a total of $803,386 per year for management services.
The Company entered into a multi-year uranium sales contract in June 2011, as amended in January 2012, requiringthe delivery of a total 320,000 pounds of U3O8 by the Company over a three-year period starting in August 2011. The sales price will be based on published market price indicators at the time of delivery. During Fiscal 2012, the Company fulfilled its first-year delivery obligations under this contract.
Off-Balance Sheet Arrangements
We do not have any off-balance sheet arrangements that have or are reasonably likely to have a current or future effect on our financial condition, changes in financial condition, revenues or expenses, results of operations, liquidity, capital expenditures or capital resources that are material to investors.
Critical Accounting Policies
The following describes the Company’s critical accounting policies, however, refer to Note 2: Summary of Significant Accounting Policies of the notes to the Company’s consolidated financial statements as presented under Item 8. Financial Statements and Supplementary Data, disclosing all of the Company’s significant accounting policies.
Inventories
Inventories are comprised of supplies, uranium concentrates and work-in-progress. Expenditures include mining and processing activities that will result in future extraction of uranium concentrates and depreciation and depletion charges. Mining and processing costs include labor, chemicals, directly attributable uranium extraction expenditures and overhead related to uranium extraction. Inventories are carried at the lower of cost or net realizable value and are valued and charged to cost of sales using the average costing method.
Mineral Rights and Exploration Stage
Acquisition costs of mineral rights are capitalized as incurred while pre-production expenditures are expensed as incurred until such time the Company exits the Exploration Stage by establishing proven or probable reserves, as defined by the SEC under Industry Guide 7, through the completion of a “final” or “bankable” feasibility study. Expenditures relating to exploration activities are expensed as incurred and expenditures relating to pre-extraction activities are expensed as incurred until such time proven or probable reserves are established for that project, after which subsequent expenditures relating to development activities for that particular project are capitalized as incurred.
Where proven and probable reserves have been established, the project’s capitalized expenditures are depleted over proven and probable reserves upon commencement of production using the units-of-production method. Where proven and probable reserves have not been established, such capitalized expenditures are depleted over the estimated extraction life upon commencement of extraction using the straight-line method. The Company has not established proven or probable reserves for any of its projects.
The carrying values of the mineral rights are assessed for impairment by management on a quarterly basis or when indicators of impairment exist. Should management determine that these carrying values cannot be recovered, the unrecoverable amounts are written off against earnings.
64
Restoration and Remediation Costs (Asset Retirement Obligations)
Various federal and state mining laws and regulations require the Company to reclaim the surface areas and restore underground water quality for its mine projects to the pre-existing mine area average quality after the completion of mining.
Future reclamation and remediation costs, which include extraction equipment removal and environmental remediation, are accrued at the end of each period based on management's best estimate of the costs expected to be incurred at each project. Such estimates are determined by the Company's engineering studies which consider the cost of future surface and groundwater activities, current regulations, actual expenses incurred, and technology and industry standards.
In accordance with ASC 410, Asset Retirement and Environmental Obligations, the Company capitalizes the measured fair value of asset retirement obligations to mineral rights and properties. The asset retirement obligations are accreted to an undiscounted value until the time at which they are expected to be settled. The accretion expense is charged to earnings and actual retirement costs are recorded against the asset retirement obligations when incurred. Any difference between the recorded asset retirement obligations and the actual retirement costs incurred will be recorded as a gain or loss in the period of settlement.
On a quarterly basis, the Company updates cost estimates, and other assumptions used in the valuation of asset retirement obligations at each of its mineral properties to reflect new events, changes in circumstances and any new information that is available. Changes in these costs have a corresponding impact on the asset retirement obligations.
Revenue Recognition
The recognition of revenue from the sale of uranium concentrates is in accordance with the guidelines outlined in ASC Section 605-10-25, Revenue Recognition. The Company delivers its uranium concentrates to a uranium storage facility and once the product is confirmed to meet the required specifications, the Company receives credit for a specified quantity measured in pounds. Future sales of uranium concentrates are expected to generally occur under uranium supply agreements or through the uranium spot market. Once a sale of uranium concentrates is negotiated, the Company will notify the uranium storage facility with instructions for a title transfer to the customer. Revenue is recognized once a title transfer of the uranium concentrates is confirmed by the uranium storage facility at which point the customer is invoiced by the Company.
65
We are subject to market risk related to the market price of uranium. We have one uranium sales agreement based upon the market price of uranium at the time of delivery, and since future sales of uranium concentrates are expected to generally occur under this uranium supply agreement or through the uranium spot market, fluctuations in the market price of uranium would have a direct impact on our revenues and cash flows.
We are subject to market risk related to foreign currency exchange rate fluctuations. Our functional currency is the United States dollar, however, a portion of our business is transacted in other currencies including the Canadian dollar and Paraguayan Guarani. To date, these fluctuations have not had a material impact on our results of operations. We do not use derivative financial instruments for speculative trading purposes, nor do we hedge our foreign currency exposure to manage our foreign currency fluctuation risk.
66
Financial Statements
The financial statement information for the fiscal year ended July 31, 2012 as listed below are included beginning on page F-1 of this Form 10-K:
Reports of Independent Registered Public Accounting Firm;
Consolidated Balance Sheets;
Consolidated Statements of Operations and Comprehensive Loss;
Consolidated Statements of Stockholders’ Equity;
Consolidated Statements of Cash Flows; and
Notes to the Consolidated Financial Statements.
Supplementary Financial Information
The selected financial data for each of the quarters for the two most recent fiscal years are presented below:
| For the Quarters Ended | ||||||||||||
| 31-Jul-12 | 30-Apr-12 | 31-Jan-12 | 31-Oct-11 | |||||||||
| Sales | $ | 7,517,400 | $ | - | $ | 3,120,000 | $ | 3,120,000 | ||||
| Gross profit | 2,566,214 | - | 1,379,232 | 1,699,914 | ||||||||
| Net loss | (4,753,814 | ) | (8,224,351 | ) | (6,547,244 | ) | (5,558,311 | ) | ||||
| Basic and diluted loss per share | (0.06 | ) | (0.10 | ) | (0.09 | ) | (0.07 | ) | ||||
| For the Quarters Ended | ||||||||||||
| 31-Jul-11 | 30-Apr-11 | 31-Jan-11 | 31-Oct-10 | |||||||||
| Sales | $ | - | $ | - | $ | - | $ | - | ||||
| Gross profit | - | - | - | - | ||||||||
| Net loss | (5,563,511 | ) | (6,245,967 | ) | (6,646,957 | ) | (8,901,660 | ) | ||||
| Basic and diluted loss per share | (0.06 | ) | (0.09 | ) | (0.10 | ) | (0.15 | ) | ||||
67
None.
Evaluation of Disclosure Controls and Procedures
Our management, with the participation of our Principal Executive Officer and Principal Financial Officer, has evaluated the effectiveness of our disclosure controls and procedures (as such term is defined in Rules 13a-15(e) and 15d-15(e) under the Exchange Act), as of the end of the period covered by this report. Based on such evaluation, our Principal Executive Officer and Principal Financial Officer have concluded that, as of the end of the period covered by this report, our disclosure controls and procedures were effective.
It should be noted that any system of controls is based in part upon certain assumptions designed to obtain reasonable (and not absolute) assurance as to its effectiveness, and there can be no assurance that any design will succeed in achieving its stated goals.
Management's Report on Internal Control Over Financial Reporting
The management of the Company is responsible for establishing and maintaining adequate internal control over financial reporting, as required by Sarbanes-Oxley (SOX) Section 404(a). The Company's internal control over financial reporting is a process designed under the supervision of the Company's Principal Executive Officer and Principal Financial Officer, and effected by the Company’s board of directors, management and other personnel, to provide reasonable assurance regarding the reliability of financial reporting and the preparation of the Company's financial statements for external purposes in accordance with United States generally accepted accounting principles.
As of July 31, 2012, management assessed the effectiveness of the Company's internal control over financial reporting based on the criteria for effective internal control over financial reporting established in Internal Control -Integrated Framework issued by the Committee of Sponsoring Organizations of the Treadway Commission and SEC guidance on conducting such assessments. Based on that evaluation, the Company’s management concluded that, as at July 31, 2012, such internal control over financial reporting was effective.
The independent registered public accounting firm that audited the financial statements included in this annual report on Form 10-K has issued an attestation report on the Company’s internal control over financial reporting which attestation report has been included in the financial statements.
We will continue to monitor and evaluate the effectiveness of our internal controls and procedures over financial reporting on an ongoing basis and are committed to taking further action by implementing additional enhancements or improvements, or deploying additional human resources as may be deemed necessary.
Changes in Internal Controls
There have been no changes in our internal control over financial reporting (as defined in Rules 13a-15(f) and 15d-15(f) under the Exchange Act) that occurred during the fourth fiscal quarter for the fiscal year ended July 31, 2012 that have materially affected, or are reasonably likely to materially affect, our internal control over financial reporting.
Not applicable
68
|
Our directors and executive officers and their respective ages as of the date hereof are as follows:
The following describes the business experience of each of our directors and executive officers, including other directorships held in reporting companies:
Amir Adnani. Mr. Adnani is a co-founder of our Company and has served as President, Chief Executive Officer, Principal Executive Officer and a director of the Company since January 24, 2005. Mr. Adnani is an entrepreneur with an extensive background in business development and marketing. In September of 2004 he founded and was the sole shareholder, a director and President of Blender Media Inc., a Vancouver based company that provides strategic marketing and financial communications services to public companies and investors in mineral exploration, mining, and energy sectors. Effective October 1, 2006, Mr. Adnani ceased being a director, officer or shareholder of Blender Media Inc. In June of 2001, Mr. Adnani co-founded, and from June 2001 to September 2004, was a director and officer of Fort Sun Investments Inc., a strategic marketing and financial communications services company for public companies. Mr. Adnani has served as a director and chairman of the board of Brazil Resources Inc., a mining company listed on the TSX-V, since August 2010. Mr. Adnani holds a Bachelor of Science degree from the University of British Columbia. Mr. Adnani is not a director or officer of any other U.S. reporting company.
Alan P. Lindsay.Mr. Lindsay, a co-founder of our Company, has served as Chairman of the Company since December 2005. Mr. Lindsay has also served as Chairman and a director of Bullfrog Gold Corp. from July 2011 to date. Mr. Lindsay served as a director of MIV Therapeutics, Inc. (“MIV”), a biomedical company focused on biocompatible coating technology for stents and medical devices, from October 2001 through March 2010, and as Chief Executive Officer of MIV from October 2001 to January 2008. From December 2005 through July 2009, Mr. Lindsay served as Chairman and director of TapImmune Inc., a development stage biotechnology company. Mr. Lindsay was a founding officer and director of Strategic American Oil Corporation (now known as Duma Energy Corp.; “Strategic”), positions that he held from April until July2005. He subsequently served as a director of Strategic from April 2007 until December 2010.
Mr. Lindsay was a founder of Azco Mining Inc., now known as Santa Fe Gold Corp. (“Azco”) and served as Chairman, President and Chief Executive Officer of Azco from 1992 to 2000. Azco was listed on the Toronto Stock Exchange in 1993 and on the American Stock Exchange in 1994. Mr. Lindsay also co-founded Anatolia Minerals Development Limited (now known as Alacer Gold Corp.), a junior resource company that trades on the TSX,and New Oroperu Resources Inc., a junior resource company that also trades on the TSX Venture Exchange. Mr. Lindsay is also a director of Terra Firma Resources Inc., and was a director of Hana Mining Ltd., from 2005 to 2008, both being junior resource companies that trade on the TSX Venture Exchange.
Harry L. Anthony. Mr. Anthony has been our Chief Operating Officer and a director since February 2006. Mr. Anthony has over 40 years of industrial, hydro-metallurigal experience; the past 35 years being in the uranium mining industry. From approximately 1997 to February, 2006, Mr. Anthony had been a consultant through Anthony Engineering Services for several major uranium companies and international agencies, which duties generally include project evaluation, operations “trouble shooter” and technical and financial expert. From approximately 1990 through 1997, Mr. Anthony was a Senior Vice-President of Uranium Resources, Inc. (“URI”), where he managed all facets of operations and technical support to achieve production goals, drilling, ion exchange, reverse osmosis, software development and equipment design. Mr. Anthony’s duties also included oversight of construction, technical aspects, daily operations of plants and wellfields, budget planning and forecasting, property evaluations and reserve estimations. Mr. Anthony also previously served as the Vice-President of Engineering/engineering manager of URI, and a project superintendent and project engineer for Union Carbide Corp. Mr. Anthony was on the board of directors of URI from 1984 through 1994. He is the author of several publications and the recipient of the awards “Distinguished Member of the South Texas Mineral Section of AIME -1987” and “1999 Outstanding Citizen of the Year - Kingsville Chamber of Commerce”. Mr. Anthony received an M.S. in Engineering Mechanics in 1973 and a B.S. in Engineering Mechanics in 1969 from Pennsylvania State University. Mr. Anthony is not a director or officer of any other U.S. reporting company.
69
Mark A. Katsumata.Mr. Katsumata was a director of our Company and the Chairman of our Audit Committee from May 11, 2009 until January 5, 2011. Since January 5, 2011 Mr. Katsumata has served as our Secretary, Treasurer and Chief Financial Officer. Mr. Katsumata has served as a Chief Financial Officer and Vice President, Finance of several NYSE MKT, TSX and TSX Venture Exchange companies. Mr. Katsumata has over 20 years of experience related to the mining industry and has been a member in good standing of the Certified General Accountants’ Association of British Columbia and Canada since 1997. During the past five years, Mr. Katsumata was the Chief Financial Officer of Candente Resource Corp., a TSX listed base and precious metals explorer, and the Chief Financial Officer/Vice President, Finance of each of Denison Mines Corp., an NYSE MKT and TSX listed uranium producer and explorer, and Fortress Minerals Corp., a TSX Venture Exchange listed precious metals explorer.
Ivan Obolensky. Mr. Obolensky has served on our Board of Directors since April 2007. Mr. Obolensky has over 40 years of experience in the investment banking business as a supervisory financial analyst, with specific expertise in the defense, aerospace, oil and gas, nuclear power, metals and mining, publishing and high technology industries. He has also been Senior Executive of several investment banks, including Sterling Grace & Co., Jesup, Josephthal & Co., Dominick and Dominick, Inc., Middendorf Colgate and CB Richard Ellis Moseley Hallgarten. From November, 1990 to date, Mr. Obolensky has been a Senior Vice-President of Wellington Shields & Co. LLC an investment bank and Member of the New York Stock Exchange. Mr. Obolensky is a Registered Investment Advisor and a long-time member of the New York Society of Security Analysts and the CFA Institute. Twenty-year-President of the Josephine Lawrence Hopkins Foundation, he is also a Past Grand Treasurer of the Grand Lodge of the State of New York, where he presently serves as Chairman of its “watchdog” Financial Oversight Committee for the Masonic Brotherhood Foundation. Professionally, he has made frequent appearances as a guest of CNBC, CNNfn and Bloomberg TV. Mr. Obolensky is also a pro-active Board Member of several charitable organizations: The Children’s Cancer & Blood Foundation; The Bouverie Audubon Preserve of Glen Ellen California; The Police Athletic League of New York City; and General “Blackjack” Pershing’s Soldiers’, Sailors’, Marines’, and Airmen’s Club, where he is also Chairman and CEO. He is a graduate of Yale University and a Lieutenant (J.g.) US Naval Air Corps, USNR (Ret.).
Vincent Della Volpe. Mr. Della Volpe has served as a professional money manager for over 35 years, including as a senior portfolio manager of pension funds for Honeywell Corporation and senior vice president of the YMCA Retirement fund in New York. Throughout his career Mr. Della Volpe has particularly focused on the management of energy and utility equity portfolios, and he also has experience managing venture capital investments. Mr. Della Volpe holds a Bachelor of Arts in Accounting and an MBA in finance, both from Seton Hall University. From 2006 to 2011, Mr. Della Volpe served as a director of Gold Canyon Resources, Inc., a junior natural resources company incorporated in British Columbia, Canada, listed on the TSX Venture Exchange. Mr. Della Volpe has been retired since March 2003. During the prior 11 years he was employed by the YMCA Retirement Fund.
David Kong. Mr. Kong became a director of our Company on January 5, 2011. Mr. Kong holds a Bachelor in Business Administration and earned his Chartered Accountant designation in British Columbia in 1978 and U.S. CPA (Illinois) designation in 2002. From 2005 to 2010, Mr. Kong was a partner at Ernst & Young LLP. From 1981 to 2004, Mr. Kong was a partner at Ellis Foster, Chartered Accountants. Currently, Mr. Kong is a director of Hana Mining Ltd., New Pacific Metals Corp., Brazil Resources Inc., Silvercorp Metals Inc., and IDM International Limited. Mr. Kong is a Certified Director (ICD.D) of the Institute of Corporate Directors.
70
Katharine Armstrong. Ms. Armstrong became a director of our Company on June 1, 2012. Ms. Armstrong is highly knowledgeable regarding the natural resources and environment of the state of Texas. She was appointed to the Texas Parks and Wildlife Commission in 1999 by Governor George W. Bush, and was named chairman in 2001 by Governor Rick Perry. The Texas Parks and Wildlife Department is the country’s second-largest wildlife agency. Ms. Armstrong serves on several boards and advisory committees. Earlier she was active with the selection committee for the White House Fellows Program and as vice-chairman of the Dallas Zoological Society. Currently, she is a director of the Texas and Southwestern Cattle Raisers Association and the Texas Wildlife Association. She serves on the advisory board of the Harte Research Institute for Gulf of Mexico Studies at Texas A&M-Corpus Christi, and is a director of the Texas Watershed Management Foundation.
Advisory Board
We have also established an Advisory Board comprised as of July 31, 2012 of Erik Essiger, Jon Indall, Dr. John D. Nelson, Anthony J. Thompson, Tom Pool, Dr. Bernie D. Schmeling and Carlos Figueredo. The purpose of the Advisory Board is to provide support in our search and acquisition of uranium properties, and for the design, permitting and reclamation of our uranium properties.
Erik Essiger has over 25 years of experience in corporate finance, strategy development and restructuring projects across a wide variety of sectors, including industrial, business services, retail and consumer goods. During the past five years, Mr. Erik Essiger has been Chairman and Chief Executive Officer of The Emirates Capital Limited (“Emirates”). Prior to founding Emirates, Mr. Essiger founded SCP Swiss Capital Partners AG, a corporate finance boutique in Switzerland, which has since been integrated into Emirates. Prior to that, Mr. Essiger was Senior Manager at PricewaterhouseCoopers (PwC) Transaction Services Strategy Group in Frankfurt, focusing on commercial due diligence, strategy consulting and lead advisory. He has acted as a board member of a venture capital company and as Managing Director of a number of corporations. Mr. Essiger has extensive international experience in the Middle East, Germany, Russia, Hong Kong and Switzerland, and was previously a member of the German-Russian co-operation council. Mr. Essiger received his MBA in Business Administration from J.W.-Goethe University, Frankfurt, Germany. Mr. Essiger served as a member of the Board of Directors from August 2006 through May 2012.
Jon Indall is a prominent attorney, and an acknowledged expert in representing uranium industry interests in the United States. Mr. Indall currently is and has been a partner at the law firm of Comeau, Maldegen, Templeman & Indall in Santa Fe, New Mexico for over 25 years. Mr. Indall's career in the law and as an authoritative lobbyist spans over 30 years, with specialization in natural resources and environmental law, and with a special focus on the uranium mining industry. Mr. Indall has represented the Uranium Producers of America (the “UPA”) - a trade association of domestic uranium producers - since its inception in 1985. He drafted and successfully assisted in lobbying Title X of the Energy Policy Act of 1992 which has provided over $500 million of federal reimbursements for costs related to reclamation of uranium and thorium mill tailings sites. He was also instrumental in the revitalization of the UPA in 2005, and has been active in negotiations with the US Department of Energy regarding sales of their excess uranium inventories. In court, Mr. Indall has represented senior mining companies including Homestake Mining, Kerr-McGee, Kennecott Corp, and Pennzoil Corp. He has also represented uranium mining and development companies Cameco, Uranium Resources Inc, United Nuclear Corporation, Strathmore Resources and many others. Mr. Indall received his B.A. from the University of Kansas, and his Juris Doctorate from the University of Kansas Law School. He is currently a member of the American Bar Association (Natural Resources Section), the State Bar of New Mexico (Natural Resources Section), and First Judicial District Bar Association.
Dr. John D. Nelson is a professional engineer with licenses in five states, and a long-term professor of civil engineering at Colorado State University. As a professor, he developed a major geotechnical engineering program for the field of mine tailings management, primarily as it relates to uranium mining, and is an industry expert in this specialized field. Dr. Nelson served as the chairman of the Annual Conference on Tailings and Mine Waste for 20 years. He is the senior author of a primary report,Long-Term Stability of Uranium Mill Tailings,prepared for the Nuclear Regulatory Commission (NRC) -- a source document for environmental impact statements in this industry. He also served as a consultant to the NRC, including the review of all uranium tailings management plans for mill licensing applications from 1978 until 1984. Since 1985, he has served as a consulting engineer for the mining industry and has acted as the senior technical engineer for several tailings dam projects including Uravan, Gas Hills, Maybell, and York Canyon. Dr. Nelson received his BSc, MSc and PhD in Civil Engineering from the Illinois Institute of Technology in Chicago. He is Professor Emeritus at Colorado State University.
71
Anthony J. Thompson has been practicing environmental and occupational health and safety law since the mid-1970s. He is the primary outside counsel to the National Mining Association (“NMA”) for uranium issues, and he has represented much of the domestic uranium mining and milling industry either as counsel to NMA or as counsel to individual licensees since the late 1970s. He is the prime author of NMA's White Paper entitled "Recommendations for a Coordinated Approach to Regulating the Uranium Recovery Industry." Mr. Thompson received his BA in History from Princeton University and his law degree from the University of Virginia School of Law. He is a member of the American Nuclear Society, the American Bar Association and the Society for Mining, Metallurgy, and Exploration.
Tom Pool is recognized as an authoritative analyst for the development of new production facilities, evaluation of strategies, and assessment of production costs. He is proficient with preliminary and detailed feasibility studies for new project development and financing. He is highly experienced with valuations of uranium projects and deposits, and with property brokerage. Since 1993, Mr. Pool has served as the Chairman of International Nuclear, Inc., based in Golden, Colorado. Over the past 40 years, his career includes senior management roles with prominent uranium organizations including having served as Vice President Engineering of Nuclear Fuels Corporation, Acting Technical Superintendent for the Beverley in-situ leach uranium mine in South Australia, Manager of Uranium Supply for ConverDyn, Internal Consultant for the CONCORD group of companies, Vice President of Marketing with Energy Fuels Nuclear and Vice President of NUEXCO Information Services. Mr. Pool also served as a Director of Intermountain Resources. He has authored more than fifty papers on key aspects of uranium development, production and markets.
Dr. Bernie D. Schmeling, currently Chief Operating Officer of Semin S.A., is a professional geophysicist and has more than 35 years of experience in exploration programs worldwide and mining projects for uranium and other commodities. Previously, he was a member of the original Uranerz team as a senior and chief geophysicist for 19 years. During this period, he was closely involved, starting in 1975, with the discovery and development of the major uranium deposit at Key Lake in Saskatchewan, Canada. For 13 years, he managed all geophysical programs as well as all contracted work including all drill hole data evaluations and U3O8-grade calculations. This work included studies of radiometric disequilibrium factors and density determinations for the U3O8 resource calculations at diverse sandstone deposits in Texas, Wyoming, Nebraska, Colorado and other states. Since 2006, he has been fully involved in the exploration and development activities of Semin S.A. in Paraguay and other South American countries. Dr. Schmeling is recognized internationally as one of the few leading experts in uranium exploration including ISR exploration.
Carlos Figueredo has 25 years of experience in mineral and oil exploration in Paraguay as Chief Geologist and Assistant Mineral Exploration Manager of Semin S.A. He formerly worked for Anschutz Corporation during its initial exploration efforts in Paraguay. He played a pivotal role in the development of the Coronel Oviedo project, as well as discoveries of other commodities in eastern Paraguay.
Term of Office
All of our directors hold office until the next annual general meeting of the shareholders or until their successors are elected and qualified. Our officers are appointed by our board of directors and hold office until their earlier death, retirement, resignation or removal.
Significant Employees
There are no significant employees other than our executive officers.
Audit Committee
Our board of directors has established an Audit Committee, comprised of David Kong, Vincent Della Volpe and Ivan Obolensky. The Audit Committee operates pursuant to a charter adopted by the board.
72
David Kong, Vincent Della Volpe and Ivan Obolensky are "independent" directors of the Company as that term is defined in Rule 121 of the NYSE MKT Equities Exchange listing standards. The Board of Directors of the Company has determined that David Kong qualifies as an audit committee financial expert pursuant to SEC rules.
Family Relationships
Alan Lindsay is the father-in-law of Amir Adnani.
Involvement in Certain Legal Proceedings
Except as disclosed in this annual report, during the past ten years none of the following events have occurred with respect to any of our directors or executive officers:
| 1. |
| ||
| reported total due to rounding. | |||
| 2. |
| ||
| 17 CFR § 229.1300. | |||
| 3. |
Resources estimated using a 0.02% eU3O8 grade cutoff and a 0.1 ft% GT cutoff. | ||
| |||
| |||
| |||
| 4. |
| ||
| 70%. | |||
| 5. |
| ||
| Project. | |||
| 6. |
|
73
| |||
| |||
| |||
| |||
| |||
There are currently no legal proceedings to which any of our directors or officers is a party adverse to us or in which any of our directors or officers has a material interest adverse to us.
We have adopted a Code of Business Conduct (our Code of Ethics) that applies to all directors and officers. The code describes the legal, ethical and regulatory standards that must be followed by the directors and officers of the Company and sets forth high standards of business conduct applicable to each director and officer. As adopted, our Code of Business Conduct sets forth written standards that are designed to deter wrongdoing and to promote, among other things:
honest and ethical conduct, including the ethical handling of actual or apparent conflicts of interest between personal and professional relationships;
full, fair, accurate, timely and understandable disclosure in reports and documents that the Company files with, or submits to, the SEC and in other public communications made by the Company;
compliance with applicable governmental laws, rules and regulations;
the prompt internal reporting of violations of the code to the appropriate person or persons identified in the code; and
accountability for adherence to the code.
A copy of the Code of Business Conduct and Ethics Policy can be viewed on our website at the following URL: http://www.uraniumenergy.com/about_us/corporate_governance/code_of_ethics/.
74
Compliance with Section 16(a) of the Exchange Act
Section 16(a) of the Exchange Act requires our directors and officers, and the persons who beneficially own more than 10% of our common stock, to file reports of ownership and changes in ownership with the SEC. Copies of all filed reports are required to be furnished to us pursuant to Rule 16a-3 promulgated under the Exchange Act. Based solely on the reports received by us and on the representations of the reporting persons, we believe that these persons have complied with all applicable filing requirements during the year ended July 31, 2012, except as follows:
Compensation Discussion and Analysis
The Compensation Committee of our Board of Directors is responsible for establishing and administering the Company’s executive and director compensation.
The Compensation Committee is composed entirely of independent, non-management members of the Board of Directors. The Board of Directors has determined that none of the Compensation Committee members have any material business relationships with the Company. Independency is re-assessed annually.
The responsibilities of the Compensation Committee, as stated in its charter, include the following:
review and approve the Company’s compensation guidelines and structure;
review and approve on an annual basis the corporate goals and objectives with respect to compensation for the chief executive officer;
review and approve on an annual basis the evaluation process and compensation structure for the Company’s other officers, including salary, bonus, incentive and equity compensation; and
periodically review and make recommendations to the Board of Directors regarding the compensation of non-management directors.
Overview of Executive Compensation Program
The Company recognizes that people are our primary asset and our principal source of competitive advantage. In order to recruit, motivate and retain the most qualified individuals as senior executive officers, the Company strives to maintain an executive compensation program that is competitive in the mining industry which is a competitive, global labor market.
The Compensation Committee’s compensation objective is designed to attract and retain the best available talent while efficiently utilizing available resources. The Compensation Committee compensates executive management primarily through base salary and equity compensation designed to be competitive with comparable companies, and to align management’s compensation with the long-term interests of shareholders. In determining an executive management’s compensation, the Compensation Committee also takes into consideration the financial condition of the Company and discussions with the executive.
75
In order to accomplish our goals and to ensure that the Company’s executive compensation program is consistent with its direction and business strategy, the compensation program for our senior executive officers is based on the following objectives:
encourage and reward performance which supports the Company’s core values and business objectives;
emphasize a “pay for performance” system, in which an individual’s short and long-term compensation and career advancement are dependent upon both individual and Company performance, with an objective of increasing long-term shareholder value; and
provide competitive total compensation and reward programs to enhance the Company’s ability to attract, motivate and retain knowledgeable and experienced senior executive officers.
Review of Senior Executive Officer Performance
The Compensation Committee reviews, on an annual basis, the overall compensation package for our senior executive officers and evaluates executive officer performance relative to corporate goals. The Compensation Committee has the opportunity to meet with the senior executive officers at various times during the year, which assists the Compensation Committee in forming its own assessment of each individual’s performance. The executive officers were not present during voting or deliberations of the Compensation Committee relating to executive compensation.
In determining the compensation for the senior executive officers, the Compensation Committee considers compensation paid to other executive officers of other companies within the industry, the executive’s performance in meeting goals, the complexity of the management position and the experience of the individual.
When reviewing the executive’s performance for the fiscal year ended July 31, 2012, the Compensation Committee took into consideration both individual and corporate performance levels.
This year’s executive performance targets were:
The following milestones were attained by the Company as a result of the success of the executives meeting their performance targets:
76
Compensation Elements and Rationale
There are three basic components to the Company’s executive compensation program: base salary, short term incentive cash awards and long-term incentive equity compensation.
Base Salary
Annual base salary must be considered in the context of the overall compensation package. Generally, the Company will target being competitive within the peer group and market place where we compete for talent, therefore, the Company has conducted an internal survey of companies within our industry and has found our annual base salaries to be aligned with those within the peer group.
Short-Term Incentive (Cash)
The objective of the short-term incentive program is to motivate the executive officers to achieve pre-determined objectives and provide a means to reward the achievement of corporate milestones and fulfillment of the annual business plan.
Long-Term Incentive (Equity)
The Company’s long-term incentive program provides for the granting of stock options to senior executive officers to both motivate executive performance and retention, as well as align executive officer performance to shareholder value. In awarding long-term incentives, the Company compares the long-term incentive program to that of peer group companies and evaluates such factors as the number of options available under its Stock Incentive Plans and the number of options outstanding relative to the number of shares outstanding. The Company has historically sought to award stock options on a competitive basis, therefore, the Company has conducted an internal survey of companies within our industry and has found our long-term incentive program to be aligned with those within the peer group.
Determination of Awards
Historically, the amount of incentive awards paid to the Company’s executive officers has been determined by the Company’s Compensation Committee on a discretionary basis, given the Company’s stage of development and its transitional stage of growth, based on the expected benefits to the Company for meeting its performance targets, the Company’s available resources and market conditions. In fiscal 2012, the Compensation Committee recommended to the Board of Directors to award short-term incentives in the form of an annual bonus and long-term incentives in the form of stock option grants within the range of 15% to 40%, as a proportion of each executive officer’s total compensation, as a result of the overall success of the executives in meeting their performance targets. The Compensation Committee determined that the award of incentives to the executives, in the amounts recommended by the Compensation Committee, were prudent and reasonable.
The Company has not implemented a formula-based approach to determine the amount of short-term incentive awards or long-term incentive awards, although as the Company experiences further growth, it intends to assess quantitative and qualitative economic measurement criteria to develop a more objective approach to determining incentive awards.
The Company has not utilized any specific benchmarking to provide a framework for its compensation decisions however, the Company has conducted an internal survey of companies within our industry and has found our compensation program to be aligned with those within the peer group.
77
To assess the Company’s compensation practices and decisions in fiscal 2012, the Compensation Committee considered recommendations issued by leading independent proxy advisors, (including Institutional Shareholder Services Inc. (ISS)). Based on such advice and recommendations, the Compensation Committee determined that the base salary and incentive award components of its current executive compensation program are reasonable and appropriate. The Company did not make any significant changes to its compensation policies and decisions in fiscal 2012.
The following table summarizes the pay mix by executive and illustrates the percentage of fixed versus at-risk pay over the last three fiscal years:
| Name and Principal Position | Period | Base Salary (%) | Cash Bonus (STIP) (%) | Stock Options (LTIP) (%) | At-Risk Pay (STIP +LTIP) (%) |
| Amir Adnani, President and Chief Executive Officer | 2012 | 46% | 32% | 22% | 54% |
| 2011 | 32% | 24% | 44% | 68% | |
| 2010 | 31% | 15% | 54% | 69% | |
| Harry L. Anthony, Chief Operating Officer | 2012 | 42% | 34% | 24% | 58% |
| 2011 | 28% | 25% | 46% | 72% | |
| 2010 | 29% | 16% | 55% | 71% | |
| Mark Katsumata, Secretary, Treasurer and Chief Financial Officer(1) | 2012 | 51% | 16% | 33% | 49% |
| 2011 | 41% | 0% | 59% | 59% | |
| 2010 | N/A | N/A | N/A | N/A | |
| Pat Obara, former Secretary, Treasurer and Chief Financial Officer(2) | 2012 | N/A | N/A | N/A | N/A |
| 2011 | 17% | 24% | 59% | 83% | |
| 2010 | 30% | 11% | 59% | 70% |
| |
| |
| |
Non-Cash Compensation
The Company provides standard health benefits to its executives. The following table sets forth the compensation paid to our Chief Executive Officer, Chief Operating Officer, ChiefItem 15. Exhibits, Financial Officer and those executive officers that earned in excess of $100,000 during the years ended July 31, 2012, 2011, and 2010 (the "Named Executive Officers"):
78
| Summary Compensation Table | |||||||||||||||||||||||||||
| Name and Principal Position | Year | Salary(1 | ) | Bonus | Stock Awards | Options Awards(2) | Non-Equity Incentive Plan Compensation | Non-Qualified Deferred Compensation Earnings | All Other Compen- sations | Total(3) | |||||||||||||||||
| Amir Adnani, | 2012 | $ | 387,005 | $ | 270,000 | $ | - | $ | 185,382 | $ | - | $ | - | $ | - | $ | 842,387 | ||||||||||
| President and | 2011 | 334,630 | 250,000 | - | 463,737 | - | - | - | 1,048,367 | ||||||||||||||||||
| Chief Executive Officer | 2010 | 279,741 | 140,000 | - | 490,000 | - | - | - | 909,741 | ||||||||||||||||||
| Harry L. Anthony, | 2012 | 327,346 | 270,000 | - | 185,382 | - | - | - | 782,727 | ||||||||||||||||||
| Chief Operating Officer | 2011 | 283,741 | 250,000 | - | 463,737 | - | - | - | 997,478 | ||||||||||||||||||
| 2010 | 258,365 | 140,000 | - | 490,000 | - | - | - | 888,365 | |||||||||||||||||||
| Mark Katsumata,(4) | 2012 | 156,851 | 49,574 | - | 102,990 | - | - | - | 309,415 | ||||||||||||||||||
| Secretary, Treasurer and | 2011 | 88,019 | - | - | 125,209 | - | - | - | 213,228 | ||||||||||||||||||
| Chief Financial Officer | 2010 | - | - | - | - | - | - | - | - | ||||||||||||||||||
| Pat Obara,(5) | 2012 | - | - | - | - | - | - | - | - | ||||||||||||||||||
| Former Secretary, Treasurer | 2011 | 78,347 | 114,677 | - | 278,242 | - | - | - | 471,266 | ||||||||||||||||||
| and Chief Financial Officer | 2010 | 147,774 | 56,000 | - | 294,000 | - | - | - | 497,774 | ||||||||||||||||||
| |
|
Stock Options Grants
We granted options to purchase shares of our common stock to the Named Executive Officers in the fiscal year ended July 31, 2012 as follows:
| Name | Grant Date | Estimated Future Payouts Under Equity Incentive Plan Awards | All Other StockAwards: Numberof Shares of Stock or Units | All Other OptionAwards: Numberof Securities Underlying Options | Exercise Price of Option Awards | Grant DateFair Value ofStock andOption Awards | ||||||||||||||||||
| Maximum | ||||||||||||||||||||||||
| Threshold | Target | |||||||||||||||||||||||
| Amir Adnani, President and Chief Executive Officer | September 26, 2011 | - | - | - | - | 90,000 | $ | 2.78 | $ | 185,382 | ||||||||||||||
| Harry L. Anthony, Chief Operating Officer | September 26, 2011 | - | - | - | - | 90,000 | 2.78 | 185,382 | ||||||||||||||||
| Mark Katsumata, Secretary, Treasurer and Chief Financial Officer | September 26, 2011 | - | - | - | - | 50,000 | 2.78 | 102,990 | ||||||||||||||||
79
The following table sets forth information as of July 31, 2012, relating to options that have been granted to the Named Executive Officers:
| Option Awards | Stock Awards | ||||||||||||||||||||||||||
| Name | Number of Securities Underlying Unexercised Options Exercisable | Number of Securities Underlying Unexercised Options (Unexercisable) | Equity Incentive Plan Awards: Securities Underlying Unexercised Unearned Options | Option Exercise Price | Option Expiration Date | Number of Shares orUnits ofStock That HaveNot Vested | MarketValue of Shares orUnits ofStock That Have NotVested | Equity Incentive Plan Awards: Number of Unearned Shares, Units or other Rights That Have Not Vested | Equity Incentive Plan Awards: Market or PayoutValue of Unearned Shares, Units or other Rights ThatHave Not Vested | ||||||||||||||||||
| Amir Adnani, | 202,500 | - | - | $ | 0.33 | December 20, 2015 | - | $ | - | $ | - | $ | - | ||||||||||||||
| President and | 225,000 | - | - | 0.45 | January 1, 2017 | - | - | - | - | ||||||||||||||||||
| Chief Executive Officer | 250,000 | - | - | 0.45 | April 7, 2018 | - | - | - | - | ||||||||||||||||||
| 250,000 | - | - | 2.40 | August 26, 2019 | - | - | - | - | |||||||||||||||||||
| 250,000 | - | - | 2.43 | August 13, 2020 | - | - | - | - | |||||||||||||||||||
| 90,000 | - | - | 2.78 | September 26, 2021 | - | - | - | - | |||||||||||||||||||
| �� | |||||||||||||||||||||||||||
| Harry L. Anthony, | 202,500 | - | - | 0.33 | December 20, 2015 | - | - | - | - | ||||||||||||||||||
| Chief Operating Officer | 72,500 | - | - | 0.33 | February 1, 2016 | - | - | - | - | ||||||||||||||||||
| 225,000 | - | - | 0.45 | January 1, 2017 | - | - | - | - | |||||||||||||||||||
| 250,000 | - | - | 0.45 | April 7, 2018 | - | - | - | - | |||||||||||||||||||
| 250,000 | - | - | 2.40 | August 26, 2019 | - | - | - | - | |||||||||||||||||||
| 250,000 | - | - | 2.43 | August 13, 2020 | - | - | - | - | |||||||||||||||||||
| 90,000 | - | - | 2.78 | September 26, 2021 | - | - | - | - | |||||||||||||||||||
| Mark Katsumata, | 75,000 | - | - | 1.50 | May 8, 2019 | - | - | - | - | ||||||||||||||||||
| Secretary, Treasurer and | 75,000 | - | - | 2.40 | August 26, 2019 | - | - | - | - | ||||||||||||||||||
| Chief Financial Officer | 67,500 | - | - | 2.43 | August 13, 2020 | - | - | - | - | ||||||||||||||||||
| 50,000 | - | - | 2.78 | September 26, 2021 | - | - | - | - | |||||||||||||||||||
| Pat Obara,(1) | 180,000 | - | - | 0.45 | October 10, 2016 | - | - | - | - | ||||||||||||||||||
| Former Secretary, | 25,000 | - | - | 0.45 | January 1, 2017 | - | - | - | - | ||||||||||||||||||
| Treasurer and | 125,000 | - | - | 0.45 | April 7, 2018 | - | - | - | - | ||||||||||||||||||
| Chief Financial Officer | 150,000 | - | - | 2.40 | August 26, 2019 | - | - | - | - | ||||||||||||||||||
| 150,000 | - | - | 2.43 | August 13, 2020 | - | - | - | - | |||||||||||||||||||
|
All of the options held by our Named Executive Officers are fully-vested. None of our Named Executive Officers exercised any options during our fiscal year ended July 31, 2012.
Long Term Incentive PlansStatement Schedules
The Company does not maintain any long-term incentive plans, including, without limitation, any pension or other contribution plan.
Consideration of Most Recent Shareholder Advisory Vote on Executive Compensation
As required by Section 14A of the Exchange Act, at our 2012 Annual Meeting of Stockholders our stockholders voted, in an advisory manner, on a proposal to approve our named executive officer compensation. This was our most recent stockholder advisory vote to approve named executive officer compensation. The proposal was approved by our stockholders, receiving approximately 94% of the vote of the stockholders present in person or represented by proxy and voting at the meeting. We considered this vote to be a ratification of our current executive compensation policies and decisions and, therefore, did not make any significant changes to our executive compensation policies and decisions based on the vote.
80
Employment and Consulting Agreements with Named Executive Officers
Adnani Executive Services Agreement
On July 1, 2006, our Board of Directors authorized and approved an executive services agreement between us and Amir Adnani, as amended by letter agreement dated July 1, 2007, which provided for an initial term expiring July 1, 2009. On July 23, 2009 our Board of Directors approved the entering into of a further amended and restated executive services agreement (the “Adnani Agreement”) with Amir Adnani Corp. (the “Consultant”) with a term expiring on July 23, 2012. The Adnani Agreement remains in effect, because it is subject to automatic renewal on a three-month to three-month term renewal basis unless either the Company or the Consultant provides written notice not to renew the Adnani Agreement no later than 90 days prior to the end of the then-current term.
Pursuant to the terms and provisions of the Adnani Agreement: (a) through the Consultant, Mr. Adnani shall continue to provide duties to us commensurate with his current executive positions as our President and Chief Executive Officer; and (b) we shall pay to the Consultant a monthly fee of $19,167.
If the Company elects to not renew the Adnani Agreement, and provided that the Consultant is in compliance with the relevant terms and conditions of the Adnani Agreement, the Company shall be obligated to provide a severance package to the Consultant follows: (a) a cash payment equating to an aggregate of four months of the then monthly fee for each full year, and any portion thereof, of the initial term and any renewal period during which the Adnani Agreement was in force and effect and during which the Consultant rendered services thereunder, payable by the Company to the Consultant within 14 calendar days of the effective termination date; (b) any expense payment reimbursements which would then be due and owing by the Company to the Consultant to the effective termination date, payable within 14 calendar days of the effective termination date (the “Adnani Outstanding Expense Reimbursements”); (c) any pro rata and unused vacation pay which would then be due and owing by the Company to Mr. Adnani to the effective termination date and payable within 14 calendar days of the effective termination date (the “Adnani Outstanding Vacation Pay”); (d) subject to applicable provisions of the Adnani Agreement, confirmation that all of the Consultant’s and Mr. Adnani’s then issued and outstanding and vested options in and to the Company as at the effective termination date are exercisable for a period of one year from the effective termination date (the “Adnani Options Extension”); and (e) confirmation that all of Consultant’s and Mr. Adnani’s then benefits coverage would be extended to Mr. Adnani for a period ending two years from the effective termination date (the “Adnani Benefits Extension”).
If the Company elects to terminate the Adnani Agreement without just cause, or if the Consultant terminates the Adnani Agreement for just cause, and provided that the Consultant is in compliance with the relevant terms and conditions of the Adnani Agreement, the Company shall be obligated to provide a severance package to the Consultant as follows: (a) a cash payment equating to an aggregate of 24 months, payable by the Company to the Consultant within 14 calendar days of the effective termination date; (b) all Adnani Outstanding Expense Reimbursements, payable within 14 calendar days of the effective termination date; (c) all Adnani Outstanding Vacation Pay, payable within 14 calendar days of the effective termination date; (d) subject to applicable provisions of the Adnani Agreement, the Adnani Options Extension commencing on the effective termination date; and (e) the Adnani Benefits Extension commencing on the effective termination date.
If the Consultant elects to terminate the Adnani Agreement either (i) in connection with a change in control of the Company or (ii) if Mr. Adnani’s position as Chief Operating Officer of the Company is terminated by the Company, and provided that the Consultant is in compliance with the relevant terms and conditions of the Adnani Agreement, the Company shall be obligated to provide a severance package to the Consultant as follows: (a) a cash payment equating to an aggregate of 18 months, payable by the Company to the Consultant within 14 calendar days of the effective termination date; (b) all Adnani Outstanding Expense Reimbursements, payable within 14 calendar days of the effective termination date; (c) all Adnani Outstanding Vacation Pay, payable within 14 calendar days of the effective termination date; (d) subject to applicable provisions of the Adnani Agreement, the Adnani Options Extension commencing on the effective termination date; and (e) the Adnani Benefits Extension commencing on the effective termination date.
81
If the Consultant elects to terminate the Adnani Agreement, except in connection with a change in control as described above, the Consultant is not entitled to a severance package. In addition, if the Company terminates the Adnani Agreement for just cause, the Consultant is not entitled to a severance package.
The Adnani Agreement will be deemed terminated on the 30th calendar day following the death or disability of Mr. Adnani, in which case the Company shall be obligated to provide a severance package to the Consultant or Mr. Adnani’s estate as follows, provided that the Consultant is or was in compliance with the relevant terms and conditions of the Adnani Agreement: (a) a cash payment equating to an aggregate of 12 months, payable by the Company to the Consultant or Mr. Adnani’s estate within 14 calendar days of the effective termination date; (b) all Adnani Outstanding Expense Reimbursements, payable within 14 calendar days of the effective termination date; (c) all Adnani Outstanding Vacation Pay, payable within 14 calendar days of the effective termination date; and (d) subject to applicable provisions of the Adnani Agreement, the Adnani Options Extension commencing on the effective termination date.
Anthony Executive Services Agreement
On February 15, 2006, our Board of Directors authorized and approved the execution of an employment agreement between us and Harry L. Anthony. On July 1, 2006, our Board of Directors approved an amendment to this agreement, extending the initial term thereunder to July 1, 2008. On July 23, 2009 our Board of Directors approved the entering into of a further amended and restated executive services agreement with Mr. Anthony (the “Anthony Agreement”) with an initial term that expired on July 23, 2012. The Anthony Agreement remains in effect, because it is subject to automatic renewal on a three-month to three-month term renewal basis unless either the Company or Mr. Anthony provides written notice not to renew the Anthony Agreement no later than 90 days prior to the end of the then-current term.
Pursuant to the terms and provisions of the Anthony Agreement: (a) Mr. Anthony shall provide duties to us commensurate with his executive position as our Chief Operating Officer; and (b) we shall pay to Mr. Anthony a monthly fee of $19,167.
If the Company elects to not renew the Anthony Agreement, and provided that Mr. Anthony is in compliance with the relevant terms and conditions of the Anthony Agreement, the Company shall be obligated to provide a severance package to Mr. Anthony as follows: (a) a cash payment equating to an aggregate of four months of the then monthly fee for each full year, and any portion thereof, of the initial term and any renewal period during which the Anthony Agreement was in force and effect and during which Mr. Anthony rendered services thereunder, payable by the Company to Mr. Anthony within 14 calendar days of the effective termination date; (b) any expense payment reimbursements which would then be due and owing by the Company to Mr. Anthony to the effective termination date, payable within 14 calendar days of the effective termination date (the “Anthony Outstanding Expense Reimbursements”); (c) any pro rata and unused vacation pay which would then be due and owing by the Company to Mr. Anthony to the effective termination date and payable within 14 calendar days of the effective termination date (the “Anthony Outstanding Vacation Pay”); (d) subject to applicable provisions of the Anthony Agreement, confirmation that all of Mr. Anthony’s then issued and outstanding and vested options in and to the Company as at the effective termination date are exercisable for a period of one year from the effective termination date (the “Anthony Options Extension”); and (e) confirmation that all of Mr. Anthony’s then benefits coverage would be extended to Mr. Anthony for a period ending two years from the effective termination date (the “Anthony Benefits Extension”).
If the Company elects to terminate the Anthony Agreement without just cause, or if Mr. Anthony terminates the Anthony Agreement for just cause, and provided that Mr. Anthony is in compliance with the relevant terms and conditions of the Anthony Agreement, the Company shall be obligated to provide a severance package to Mr. Anthony as follows: (a) a cash payment equating to an aggregate of 24 months, payable by the Company to Mr. Anthony within 14 calendar days of the effective termination date; (b) all Anthony Outstanding Expense Reimbursements, payable within 14 calendar days of the effective termination date; (c) all Anthony Outstanding Vacation Pay, payable within 14 calendar days of the effective termination date; (d) subject to applicable provisions of the Anthony Agreement, the Anthony Options Extension commencing on the effective termination date; and (e) the Anthony Benefits Extension commencing on the effective termination date.
82
If Mr. Anthony elects to terminate the Anthony Agreement either (i) in connection with a change in control of the Company or (ii) if Mr. Anthony’s position as Chief Operating Officer of the Company is terminated by the Company, and provided that Mr. Anthony is in compliance with the relevant terms and conditions of the Anthony Agreement, the Company shall be obligated to provide a severance package to Mr. Anthony as follows: (a) a cash payment equating to an aggregate of 18 months, payable by the Company to Mr. Anthony within 14 calendar days of the effective termination date; (b) all Anthony Outstanding Expense Reimbursements, payable within 14 calendar days of the effective termination date; (c) all Anthony Outstanding Vacation Pay, payable within 14 calendar days of the effective termination date; (d) subject to applicable provisions of the Anthony Agreement, the Anthony Options Extension commencing on the effective termination date; and (e) the Anthony Benefits Extension commencing on the effective termination date.
If Mr. Anthony elects to terminate the Anthony Agreement, except in connection with a change in control as described above, he is not entitled to a severance package. In addition, if the Company terminates the Anthony Agreement for just cause, Mr. Anthony is not entitled to a severance package.
The Anthony Agreement will be deemed terminated on the 30th calendar day following the death or disability of Mr. Anthony, in which case the Company shall be obligated to provide a severance package to Mr. Anthony or his estate as follows, provided that Mr. Anthony is or was in compliance with the relevant terms and conditions of the Anthony Agreement: (a) a cash payment equating to an aggregate of 12 months, payable by the Company to Mr. Anthony within 14 calendar days of the effective termination date; (b) all Anthony Outstanding Expense Reimbursements, payable within 14 calendar days of the effective termination date; (c) all Anthony Outstanding Vacation Pay, payable within 14 calendar days of the effective termination date; and (d) subject to applicable provisions of the Anthony Agreement, the Anthony Options Extension commencing on the effective termination date.
Katsumata Executive Employment Services Agreement
On January 5, 2011, our Board of Directors approved an executive employment services agreement (the “Katsumata Agreement”) with Mark Katsumata, our Secretary, Treasurer and Chief Financial Officer.
Pursuant to the terms of the Katsumata Agreement, Mr. Katsumata will perform such duties and responsibilities as an executive employee as set out in the Katsumata Agreement. In consideration for Mr. Katsumata’s services, we agreed to: (a) pay Mr. Katsumata a monthly fee in the amount of CAD$12,500; and (b) subject to applicable rules and policies of relevant regulatory authorities and applicable securities legislation and the Company’s Stock Incentive Plan, grant to Mr. Katsumata incentive stock options to purchase not less than 217,500 common shares; at an exercise price of $1.50 per option share with respect to not less than 75,000 of the option shares, at an exercise price of $2.40 per option share with respect to not less than a further 75,000 of the option shares and at an exercise price of $2.43 per option share with respect to the balance of the option shares; and exercisable for a period of not less than ten years from the date of grant in each instance.
Mr. Katsumata’s initial term of employment under the Katsumata Agreement will end on January 5, 2013 (such period, the “Initial Term”). The Katsumata Agreement is subject to automatic renewal unless we provide written notice of an intention not to renew the Katsumata Agreement no later than 90 days prior to the end of the then-current term of the Katsumata Agreement. Mr. Katsumata may terminate the Katsumata Agreement upon 60 days prior written notice to the Company. The Katsumata Agreement provides that the Company may terminate Mr. Katsumata’s employment without cause, in which event Mr. Katsumata will be entitled to continue to receive the compensation he would have been entitled to until the end of the Initial Term. In addition, either the Company or Mr. Katsumata may terminate the Katsumata Agreement for cause upon 14 days prior written notice under certain circumstances described in the Katsumata Agreement.
Obara Builders Ltd. Consulting Services Agreement
On August 15, 2007, with an effective date of July 1, 2007, our Board of Directors authorized and approved a consulting services agreement with Obara Builders Ltd. (the “Obara Agreement”) for an initial term of two years expiring on July 1, 2009. Pursuant to the terms and provisions of the Obara Agreement: (a) Mr. Obara provided duties to us commensurate with his executive positions as our Secretary, Treasurer, Chief Financial Officer and Principal Accounting Officer; (b) we paid to Obara Builders Ltd., a private company controlled by Pat Obara, or to Pat Obara personally, a monthly fee of CAD$10,000; (c) we approved the granting of stock options from time to time to Mr. Obara at such fair market exercise price or prices per option share as determined by our Board of Directors and we confirmed the previous granting of his existing stock options of 200,000 stock options to Mr. Obara to purchase shares of our common stock at $1.30 per share and a further 25,000 stock options to purchase shares of our common stock at $3.30 per share, both for a ten-year term from the date of grant; and (d) the Obara Builders Ltd. Consulting Services Agreement could be terminated without cause by either of us by providing prior written notice of the intention to terminate at least 90 days (in the case of our Company after the initial term) or 30 days (in the case of Mr. Obara) prior to the effective date of such termination.
83
On March 1, 2008, the Compensation Committee ratified the approval of an increase in the monthly service agreement fee for Mr. Obara from CAD$10,000 to CAD$12,500, which was further raised effective August 1, 2010 to CAD$13,750.
Mr. Obara and the Company intend to enter into an amended agreement but such agreement has not yet been finalized. Mr. Obara continues to provide services under the provisions of the original Obara Agreement on a month-to-month basis in connection with his current position at the Company of Vice President Administration.
Directors Compensation Table
The following table sets forth information relating to compensation paid to our directors in the year ended July 31, 2012:
| Non-Qualified | |||||||||||||||||||||
| Fees Earned | Non-Equity | Deferred | |||||||||||||||||||
| Or Paid In | Stock | Options | Incentive Plan | Compensation | All Other | ||||||||||||||||
| Name | Cash | Awards | Awards(1 | ) | Compensation | Earnings | Compensations | Total | |||||||||||||
| Alan P. Lindsay | $ | 108,000 | $ | - | $ | 51,495 | $ | - | $ | - | $ | - | $ | 159,495 | |||||||
| David Kong | 38,439 | - | 51,495 | - | - | - | 89,934 | ||||||||||||||
| Erik Essiger(2) | 36,403 | - | 51,495 | - | - | - | 87,898 | ||||||||||||||
| Ivan Obolensky | 30,000 | - | 51,495 | - | - | - | 81,495 | ||||||||||||||
| Vincent Della Volpe | 30,000 | - | 51,495 | - | - | - | 81,495 | ||||||||||||||
| Katharine Armstrong | 3,333 | - | - | - | - | - | 3,333 |
(1) This amount represents the fair value of options at the date of grant or repriced during the year, estimated using the Black-Scholes option pricing model. See Note 11 to our financial statements contained herein.(2) Erik Essiger resigned from the board effective May 31, 2012.
As of July 31, 2012 our directors held options to acquire an aggregate of 4,430,000 shares of our common stock: Alan P. Lindsay 1,065,000 options, Amir Adnani 1,267,500 options, Harry L. Anthony 1,340,000 options, Erik Essiger 167,500 options, Ivan Obolensky 220,000 options, Vincent Della Volpe 270,000 options, and David Kong 100,000 options.
Alan P. Lindsay serves as the Company’s Chairman and director and is retained accordingly on a yearly basis. Mr. Lindsay is compensated on a monthly basis at a rate of $6,000 per month.
Amir Adnani serves as the Company’s Chief Executive Officer, President and as a director, and Harry L. Anthony serves as the Company’s Chief Operating Officer and a director. Messrs. Adnani and Anthony are retained according to their Executive Services Agreements and their compensation for serving as executive officers of the Company is disclosed above in the “Summary Compensation Table”, and Messrs. Adnani and Anthony do not receive additional compensation in connection with their service as directors of the Company.
Ivan Obolensky, Vincent Della Volpe, David Kong and Katharine Armstrong are independent directors of the Company. Mr. Kong serves as Chairman of the Company’s Audit Committee and Mr. Della Volpe serves as Chairman of the Company’s Compensation Committee. The independent directors are retained on a yearly basis for their services and are paid quarterly based on annual retainer fees as follows:
84
Ivan Obolensky (USD$20,000 per year);
Vincent Della Volpe (USD$20,000 per year);
David Kong (CAD$25,000 per year); and
Katharine Armstrong (USD$20,000 per year).
The amounts listed above are all-inclusive retainer fees; there are no additional committee and/or chairmanship fees or meeting attendance fees above and beyond such annual retainer fees.
In addition to such retainers, from time to time directors may receive bonus payments or options, which are granted on a discretionary basis. The amount of any bonus payments or the number of options granted is based on the experience of the director, time spent on Company matters and the compensation paid to other directors of companies in the industry.
Standard retainer amounts paid to directors, as well as any bonus payments or options, are determined by the Company’s Compensation Committee and ratified by the Board of Directors.
85
The following table sets forth certain information with respect to the beneficial ownership of our common stock by each stockholder known by us to be the beneficial owner of more than 5% of our common stock and by each of our current directors and executive officers. Each person has sole voting and investment power with respect to the shares of common stock, except as otherwise indicated. Beneficial ownership consists of a direct interest in the shares of common stock, except as otherwise indicated. As of October 10, 2012, there were 85,243,155 shares of common stock issued and outstanding.
86
| Amount and Nature of | Percentage of Beneficial | |
| Name and Address of Beneficial Owner(1) | Beneficial Ownership(1) | Ownership |
| Major Shareholders: | ||
| Huber Capital Management LLC. | 10,171,909 | 11.9% |
| 10940 Wilshire Blvd., Suite 925 | ||
| Los Angeles, CA 90024 | ||
| Oppenheimer Funds, Inc. | 4,910,200 | 5.8% |
| Two World Financial Center | ||
| 225 Liberty St., New York, NY 10281 | ||
| * Less than one percent. |
| |
| |
| |
| |
| |
| |
|
Changes in Control
We are unaware of any contract, or other arrangement or provision, the operation of which may at a subsequent date result in a change of control of our company.
87
|
Related Party Transactions
During the fiscal year ended July 31, 2012, the Company was involved in the following transactions or proposed transactions, if any, in an amount exceeding $120,000 in which related persons had or will have a direct or indirect material interest:
incurred $126,373 in general and administrative costs paid to a company controlled by a direct family member of a current officer and director (Mr. Adnani); and
incurred $220,000, with an additional $66,667 in prepaid expenses, in consulting fees paid to a company controlled by a prior director of the Company (Mr. Essiger).
Our Audit Committee is charged with reviewing and approving all related party transactions and reviewing and making recommendations to the board of directors, or approving any contracts or other transactions with any of our current or former executive officers.
Director Independence
The Board of Directors has determined that Ivan Obolensky, Vincent Della Volpe, David Kong and Katharine Armstrong each qualify as independent directors under the listing standards of the NYSE MKT Equities Exchange.
Ernst & Young LLP serve as our independent registered public accounting firm and audited our financial statements for the fiscal years ended July 31, 2012, 2011 and 2010. Aggregate fees for professional services rendered to us by our auditors for our last two years are set forth below:
| Year Ended | Year Ended | |||||
| July 31, 2012 | July 31, 2011 | |||||
| Audit Fees | $ | 422,157 | $ | 307,750 | ||
| Audit Related Fees | - | - | ||||
| Tax Fees | 102,386 | 67,000 | ||||
| Total | $ | 524,544 | $ | 374,750 |
Audit Fees.Audit fees consist of aggregate fees for professional services in connection with the audit of our annual financial statements, quarterly reviews of our financial statements included in our quarterly reports and services in connection with statutory and regulatory filings.
Audit-Related Fees.Audit-related fees consist of aggregate fees for assurance and related services related to the audit or review of our financial statements that are not reported under “Audit Fees” above.
Tax Fees. Tax fees consist of aggregate fees for professional services for tax compliance, tax advice and tax planning, primarily, fees related to tax preparation services.
Pre-Approval of Services by the Independent Auditor
The Audit Committee is responsible for the pre-approval of audit and permitted non-audit services to be performed by the Company's independent auditor, Ernst & Young LLP. The Audit Committee will, on an annual basis, consider and, if appropriate, approve the provision of audit and non-audit services by Ernst & Young LLP. Thereafter, the Audit Committee will, as necessary, consider and, if appropriate, approve the provision of additional audit and non-audit services by Ernst & Young LLP which are not encompassed by the Audit Committee's annual pre-approval and are not prohibited by law. The Audit Committee has delegated to the Chair of the Audit Committee the authority to pre-approve, on a case-by-case basis, non-audit services to be performed by Ernst & Young LLP. The Audit Committee has approved all audit and permitted non-audit services performed by Ernst & Young LLP for the year ended July 31, 2012.
88
Exhibit Number | Description of Exhibit |
| 2.1 | |
| 2.2 | |
| 2.3 | |
| 2.4 | |
| 2.5 | |
| 2.6 | |
| 3.1 | |
| 3.1.1 | |
| 3.2 | |
| |
| |
| 4.3 | |
| 4.4 | |
| 4.5 | |
| 4.6 | |
| |
| |
| |
| |
| |
| |
| |
| |
| |
| |
| |
| |
| |
| |
|
89
| |
| 10.3 | |
| |
| |
| |
| |
| |
| |
| |
| |
| |
| |
| |
| |
| |
90
| 10.19 | |
| 10.21 | |
| 10.22 | |
| 10.23 | |
| 10.25 | |
91
| |
| |
| |
| |
| 10.35 | |
| 10.36 | |
| 10.37 | |
| 10.38 | |
| 10.39 | |
| 10.40 | |
| 10.41 | |
| 10.42 | |
| 10.43 | |
| 10.44 | |
| 10.45 | |
| 10.46 | |
| 10.47 | |
| 10.48 | |
| 10.49 | |
| 10.50 | |
| 10.51 | |
| 10.52 | |
| 10.53 | |
| 10.54 | |
| 10.55 | |
| 10.56 | |
| 10.57 | |
| 10.58 | |
| 10.59 | |
| 10.60 | |
| 10.61 | |
| 10.62 | |
| 10.63 | |
| 10.64 | |
| 10.65 | |
| 10.66 |
| 10.67 | |
| 10.68 | |
| 10.69 | |
| 10.70 | |
| 10.71 | |
| 10.72 | |
| 10.73 | |
| 10.74 | |
| 10.75 | |
| 10.76 | |
| 10.77 | |
| 10.78 | |
| 10.79 | |
| 10.80 | |
| 10.81 |
|
| 10.82 | |
| 10.84 | |
| 10.85 | |
| 10.86 | |
| 10.87 | |
| 10.88 | |
| 10.89 | |
| 21.1 | |
| 23.1 | |
| 23.3 | |
| 23.4 | |
| 23.5 | |
| 23.6 | |
| 23.7 | |
| 23.8 | |
| 23.9 | |
| 23.10 | |
| 23.11 | |
| 23.12 | |
| 23.13 | |
| 23.14 | |
| 31.1 | |
| 31.2 |
| 32.1 | |
| 96.1 | |
| 96.2 | |
| 96.3 | |
| 96.4 | |
| 96.5 | |
| 96.6 | |
| 96.7 | |
| 96.8 | |
| 96.9 | |
| 96.10 | |
| 99.1 | |
| 99.2 | |
| 99.3 | |
| 101.1NS | Inline XBRL Instance Document |
| 101.SCH | Inline XBRL Taxonomy Extension Schema Document |
| 101.CAL | Inline XBRL Taxonomy Extension Calculation Linkbase Document |
| 101.DEF | Inline XBRL Taxonomy Extension Definitions Linkbase Document |
| 101.LAB | Inline XBRL Taxonomy Extension Label Linkbase Document |
| 101.PRE | Inline XBRL Taxonomy Extension Presentation Linkbase Document |
| 104 | Cover Page Interactive Data File (formatted as Inline XBRL and contained in Exhibit 101) |
| * | Filed herewith. |
| † | Previously filed |
| ‡ | Portions of this exhibit have been omitted. |
| (1) | Incorporated by reference to our Registration Statement on Form SB-2 filed with the SEC on August 4, 2005. |
| (2) | Incorporated by reference to our Current Report on Form 8-K filed with the SEC on February 9, 2006. |
| (3) |
|
| |
| |
| |
| |
| |
| |
| |
Incorporated by reference to our Current Report on Form 8-K filed with the SEC on May 4, 2007. | |
| |
Incorporated by reference to our Current Report on Form 8-K filed with the SEC on October 9, 2007. | |
| |
Incorporated by reference to our Current Report on Form 8-K filed with the SEC on November 6, 2007. | |
| |
| |
Incorporated by reference to our Current Report on Form 8-K filed with the SEC on January 16, 2009. | |
Incorporated by reference to our Current Report on Form 8-K filed with the SEC on June 2, 2009. | |
Incorporated by reference to our Current Report on Form 8-K filed with the SEC on June 9, 2009. | |
Incorporated by reference to our Current Report on Form 8-K filed with the SEC on July 27, 2009. | |
| |
Incorporated by reference to our Registration Statement on Form S-8 filed with the SEC on October 1, 2009. | |
Incorporated by reference to our Annual Report on Form 10-K/A filed with the SEC on April 21, 2010. | |
| |
| |
| |
| |
Incorporated by reference to our Current Report on Form 8-K filed with the SEC on February 23, 2010. | |
Incorporated by reference to our Registration Statement on Form S-8 filed with the SEC on February 7, 2011. | |
Incorporated by reference to our Current Report on Form 8-K filed with the SEC on January 10, 2011. | |
Incorporated by reference to our Current Report on Form 8-K filed with the SEC on May 11, 2011. | |
Incorporated by reference to our Current Report on Form 8-K filed with the SEC on May 17, 2011. | |
Incorporated by reference to our Current Report on Form 8-K filed with the SEC on July 11, 2011. | |
| |
Incorporated by reference to our Current Report on Form 8-K filed with the SEC on October 31, 2011. | |
Incorporated by reference to our Current Report on Form 8-K filed with the SEC on November 8, 2011. |
| |
Incorporated by reference to our Current Report on Form 8-K filed with the SEC on March 5, 2012. | |
| (21) | Incorporated by reference to our Current Report on Form 8-K filed with the SEC on August 5, 2013. |
| (22) | Incorporated by reference to our Current Report on Form 8-K filed with the SEC on October 2, 2013. |
| (23) | Incorporated by reference to our Current Report on Form 8-K filed with the SEC on October 23, 2013. |
| (24) | Incorporated by reference to our Registration Statement on Form S-3 filed with the SEC on November 19, 2013. |
| (25) | Incorporated by reference to our Registration Statement on Form S-8 filed with the SEC on November 21, 2013. |
| (26) | Incorporated by reference to our Current Report on Form 8-K/A filed with the SEC on December 6, 2013. |
| (27) | Incorporated by reference to our Registration Statement on Form S-3 filed with the SEC on December 27, 2013. |
| (28) | Incorporated by reference to our Current Report on Form 8-K filed with the SEC on December 31, 2013. |
| (29) | Incorporated by reference to our Current Report on Form 8-K filed with the SEC on March 19, 2014. |
| (30) | Incorporated by reference to our Annual Report on Form 10-K filed with the SEC on October 14, 2014. |
| (31) | Incorporated by reference to our Registration Statement on Form S-8 filed with the SEC on January 9, 2015. |
| (32) | Incorporated by reference to our Quarterly Report on Form 10-Q filed with the SEC on March 12, 2015. |
| (33) | Incorporated by reference to our Schedule 14A Definitive Proxy Statement filed with the SEC on June 19, 2015. |
| (34) | Incorporated by reference to our Current Report on Form 8-K filed with the SEC on June 25, 2015. |
| (35) | Incorporated by reference to our Quarterly Report on Form 10-Q filed with the SEC on December 8, 2015. |
| (36) | Incorporated by reference to our Current Report on Form 8-K filed with the SEC on February 16, 2016 |
| (37) | Incorporated by reference to our Current Report on Form 8-K filed with the SEC on March 10, 2016. |
| (38) | Incorporated by reference to our Current Report on Form 8-K filed with the SEC on March 10, 2016. |
| (39) | Incorporated by reference to our Registration Statement on Form S-8 filed with the SEC on September 2, 2016. |
| (40) | Incorporated by reference to our Registration Statement on Form S-3 filed with the SEC on January 5, 2017. |
| (41) | Incorporated by reference to our Current Report on Form 8-K filed with the SEC on January 17, 2017. |
| (42) | Incorporated by reference to our Current Report on Form 8-K filed with the SEC on March 9, 2017. |
| (43) | Incorporated by reference to our Quarterly Report on Form 10-Q filed with the SEC on June 9, 2017. |
| (44) | Incorporated by reference to our Current Report on Form 8-K filed with the SEC on August 11, 2017. |
| (45) | Incorporated by reference to our Registration Statement on Form S-3 filed with the SEC on September 8, 2017. |
| (46) | Incorporated by reference to our Annual Report on Form 10-K filed with the SEC on October 16, 2017. |
| (47) | Incorporated by reference to our Current Report on Form 8-K filed with the SEC on November 6, 2017. |
| (48) | Incorporated by reference to our Annual Report on Form 10-K filed with the SEC on October 15, 2018. |
| (49) | Incorporated by reference to our Registration Statement on Form S-8 filed with the SEC on August 27, 2018. |
| (50) | Incorporated by reference to our Current Report on Form 8-K filed with the SEC on October 1, 2018. |
| (51) | Incorporated by reference to our Current Report on Form 8-K filed with the SEC on December 7, 2018. |
| (52) | Incorporated by reference to our Current Report on Form 8-K filed with the SEC on March 18, 2019. |
| (53) | Incorporated by reference to our Current Report on Form 8-K filed with the SEC on April |
92
URANIUM ENERGY CORP.
CONSOLIDATED FINANCIAL STATEMENTS
JULY 31, 2012
| Incorporated by reference to our Registration Statement on Form S-8 filed with the SEC on September 12, 2019. | |
| Incorporated by reference to our Current Report on Form 8-K filed with the SEC on March 19, 2020. | |
| Incorporated by reference to our Current Report on Form 8-K filed with the SEC on September 21, 2020. | |
| Incorporated by reference to our Current Report on Form 8-K filed with the SEC on March 19, 2021. | |
| Incorporated by reference to our Current Report on Form 8-K filed with the |
F-1
Report of Independent Registered Public Accounting Firm
The Board of Directors and Shareholders of Uranium Energy Corp.
We have audited the accompanying consolidated balance sheets of Uranium Energy Corp. as of July 31, 2012 and 2011, and the related consolidated statements of operations and comprehensive loss, stockholders’ equity, and cash flows for each of the three years in the period ended July 31, 2012. These financial statements are the responsibility of the Company's management. Our responsibility is to express an opinion on these financial statements based on our audits.
We conducted our audits in accordance with the standards of the Public Company Accounting Oversight Board (United States). Those standards require that we plan and perform the audit to obtain reasonable assurance about whether the financial statements are free of material misstatement. An audit includes examining, on a test basis, evidence supporting the amounts and disclosures in the financial statements. An audit also includes assessing the accounting principles used and significant estimates made by management, as well as evaluating the overall financial statement presentation. We believe that our audits provide a reasonable basis for our opinion.
In our opinion, the financial statements referred to above present fairly, in all material respects, the consolidated financial position of Uranium Energy Corp. at July 31, 2012 and July 31, 2011, and the consolidated results of its operations and comprehensive loss and its cash flows for each of the three years in the period ended July 31, 2012, in conformity with U.S. generally accepted accounting principles.
We have also audited, in accordance with the standards of the Public Company Accounting Oversight Board (United States), Uranium Energy Corp.'s internal control over financial reporting as of July 31, 2012, based on criteria established in Internal Control-Integrated Framework issued by the Committee of Sponsoring Organizations of the Treadway Commission and our report dated October 10, 2012 expressed an unqualified opinion thereon.
/s/ Ernst & Young LLP
Vancouver, British Columbia
October 10, 2012
F-2
Report of Independent Registered Public Accounting Firm
The Board of Directors and Shareholders of Uranium Energy Corp.
We have audited Uranium Energy Corp.’s internal control over financial reporting as of July 31, 2012, based on criteria established in Internal Control—Integrated Framework issued by the Committee of Sponsoring Organizations of the Treadway Commission (the COSO criteria). Uranium Energy Corp.’s management is responsible for maintaining effective internal control over financial reporting, and for its assessment of the effectiveness of internal control over financial reporting included in the accompanying Management’s Report on Internal Control Over Financial Reporting. Our responsibility is to express an opinion on the company’s internal control over financial reporting based on our audit.
We conducted our audit in accordance with the standards of the Public Company Accounting Oversight Board (United States). Those standards require that we plan and perform the audit to obtain reasonable assurance about whether effective internal control over financial reporting was maintained in all material respects. Our audit included obtaining an understanding of internal control over financial reporting, assessing the risk that a material weakness exists, testing and evaluating the design and operating effectiveness of internal control based on the assessed risk, and performing such other procedures as we considered necessary in the circumstances. We believe that our audit provides a reasonable basis for our opinion.
A company’s internal control over financial reporting is a process designed to provide reasonable assurance regarding the reliability of financial reporting and the preparation of financial statements for external purposes in accordance with generally accepted accounting principles. A company’s internal control over financial reporting includes those policies and procedures that (1) pertain to the maintenance of records that, in reasonable detail, accurately and fairly reflect the transactions and dispositions of the assets of the company; (2) provide reasonable assurance that transactions are recorded as necessary to permit preparation of financial statements in accordance with generally accepted accounting principles, and that receipts and expenditures of the company are being made only in accordance with authorizations of management and directors of the company; and (3) provide reasonable assurance regarding prevention or timely detection of unauthorized acquisition, use or disposition of the company’s assets that could have a material effect on the financial statements.
Because of its inherent limitations, internal control over financial reporting may not prevent or detect misstatements. Also, projections of any evaluation of effectiveness to future periods are subject to the risk that controls may become inadequate because of changes in conditions, or that the degree of compliance with the policies or procedures may deteriorate.
In our opinion, Uranium Energy Corp. maintained, in all material respects, effective internal control over financial reporting as of July 31, 2012, based onthe COSO criteria.
We also have audited, in accordance with the standards of the Public Company Accounting Oversight Board (United States), the consolidated balance sheets of Uranium Energy Corp. as of July 31, 2012 and 2011, and the related consolidated statements of operations and comprehensive loss, stockholders’ equity, and cash flows for each of the three years in the period ended July 31, 2012, and our report dated October 10, 2012 expressed an unqualified opinion thereon.
/s/ Ernst & Young LLP
Vancouver, British Columbia
October 10, 2012
F-3
| Notes | July 31, 2012 | July 31, 2011 | |||||||
| CURRENT ASSETS | |||||||||
| Cash and cash equivalents | 14 | $ | 25,015,284 | $ | 30,724,051 | ||||
| Available-for-sale securities | 3 | 41,973 | 79,126 | ||||||
| Accounts and interest receivable | 273,584 | 90,907 | |||||||
| Inventories | 4 | 1,876,100 | 2,775,947 | ||||||
| Prepaid expenses and deposits | 717,260 | 267,158 | |||||||
| 27,924,201 | 33,937,189 | ||||||||
| MINERAL RIGHTS AND PROPERTIES | 5 | 42,594,920 | 17,841,083 | ||||||
| PROPERTY, PLANT AND EQUIPMENT | 6 | 9,081,234 | 8,702,413 | ||||||
| RECLAMATION DEPOSITS | 7 | 5,543,040 | 4,610,300 | ||||||
| LOAN RECEIVABLE | 8 | - | 300,000 | ||||||
| $ | 85,143,395 | $ | 65,390,985 | ||||||
| CURRENT LIABILITIES | |||||||||
| Accounts payable and accrued liabilities | $ | 5,271,158 | $ | 3,232,104 | |||||
| Due to related parties | 9 | 47,443 | 8,287 | ||||||
| Current portion of asset retirement obligations | 10 | 133,298 | 675,872 | ||||||
| 5,451,899 | 3,916,263 | ||||||||
| DEFERRED INCOME TAX LIABILITIES | 5, 12 | 791,939 | - | ||||||
| ASSET RETIREMENT OBLIGATIONS | 10 | 2,979,076 | 2,351,931 | ||||||
| 9,222,914 | 6,268,194 | ||||||||
| STOCKHOLDERS' EQUITY | |||||||||
| Capital stock | |||||||||
| Common stock $0.001 par value: 750,000,000 shares authorized, 84,975,155 shares issued and outstanding (July 31, 2011 - 73,487,337) | 11 | 84,975 | 73,487 | ||||||
| Additional paid-in-capital | 196,486,881 | 154,564,206 | |||||||
| Share issuance obligation | 194,700 | 194,700 | |||||||
| Accumulated deficit | (120,823,948 | ) | (95,740,228 | ) | |||||
| Accumulated other comprehensive income | (22,127 | ) | 30,626 | ||||||
| 75,920,481 | 59,122,791 | ||||||||
| $ | 85,143,395 | $ | 65,390,985 | ||||||
| COMMITMENTS AND CONTINGENCIES | 5, 15 | ||||||||
| SUBSEQUENT EVENTS | 5, 15 |
The accompanying notes are an integral part of these consolidated financial statements
F-4
| Year Ended July 31, | ||||||||||||
| Notes | 2012 | 2011 | 2010 | |||||||||
| SALES | $ | 13,757,400 | $ | - | $ | - | ||||||
| COST OF SALES | 8,112,040 | - | - | |||||||||
| GROSS PROFIT | 5,645,360 | - | - | |||||||||
| EXPENSES | ||||||||||||
| Mineral property expenditures | 5 | 14,938,722 | 11,420,180 | 6,438,714 | ||||||||
| General and administrative | 9, 11 | 14,036,974 | 15,187,066 | 15,154,329 | ||||||||
| Depreciation, amortization and accretion | 6, 10 | 1,275,557 | 1,155,959 | 794,504 | ||||||||
| Impairment loss on mineral properties | - | 143,396 | 43,600 | |||||||||
| 30,251,253 | 27,906,601 | 22,431,147 | ||||||||||
| LOSS BEFORE OTHER ITEMS | (24,605,893 | ) | (27,906,601 | ) | (22,431,147 | ) | ||||||
| OTHER ITEMS | ||||||||||||
| Interest income | 69,328 | 49,058 | 27,600 | |||||||||
| Interest expense | (30,898 | ) | - | - | ||||||||
| Gain (loss) on disposition of assets | 6,999 | (9,234 | ) | (3,677 | ) | |||||||
| Gain on sale of investments | - | 508,682 | - | |||||||||
| Loss on fair value of convertible debentures | 5 | (49,681 | ) | - | - | |||||||
| Loss on settlement of convertible debentures | 5 | (312,207 | ) | - | - | |||||||
| Gain on settlement of accounts payable | 5 | 221,292 | - | - | ||||||||
| Loss on settlement of asset retirement obligations | 10 | (444,448 | ) | - | - | |||||||
| Other income | - | - | 30,549 | |||||||||
| Transaction costs | - | - | (636,075 | ) | ||||||||
| (539,615 | ) | 548,506 | (581,603 | ) | ||||||||
| LOSS FROM CONTINUING OPERATIONS BEFORE INCOME TAXES | (25,145,508 | ) | (27,358,095 | ) | (23,012,750 | ) | ||||||
| DEFERRED INCOME TAX BENEFIT | 12 | 61,788 | - | - | ||||||||
| LOSS FROM CONTINUING OPERATIONS | (25,083,720 | ) | (27,358,095 | ) | (23,012,750 | ) | ||||||
| DISCONTINUED OPERATIONS | ||||||||||||
| Gain on sale of discontinued operations, net of income taxes | 5 | - | - | 8,534,081 | ||||||||
| INCOME FROM DISCONTINUED OPERATIONS | - | - | 8,534,081 | |||||||||
| NET LOSS FOR THE YEAR | (25,083,720 | ) | (27,358,095 | ) | (14,478,669 | ) | ||||||
| OTHER COMPREHENSIVE (LOSS) INCOME,NET OF INCOME TAXES | (52,753 | ) | 25,778 | (5,752 | ) | |||||||
| TOTAL COMPREHENSIVE LOSS FOR THE YEAR | $ | (25,136,473 | ) | $ | (27,332,317 | ) | $ | (14,484,421 | ) | |||
| NET LOSS PER SHARE, BASIC AND DILUTED | ||||||||||||
| Loss from continuing operations | $ | (0.32 | ) | $ | (0.40 | ) | $ | (0.39 | ) | |||
| Income from discontinued operations | $ | - | $ | - | $ | 0.14 | ||||||
| NET LOSS PER SHARE, BASIC AND DILUTED | $ | (0.32 | ) | $ | (0.40 | ) | $ | (0.25 | ) | |||
| WEIGHTED AVERAGE NUMBER OF SHARES OUTSTANDING,BASIC AND DILUTED | 78,325,648 | 68,799,322 | 59,017,166 | |||||||||
The accompanying notes are an integral part of these consolidated financial statements
F-5
| Accumulated | |||||||||||||||||||||
| Other | |||||||||||||||||||||
| Common Stock | Additional Paid-in | Share Issuance | Accumulated | Comprehensive | Stockholders' | ||||||||||||||||
| Shares | Amount | Capital | Obligation | Deficit | Income | Equity | |||||||||||||||
| Balance, July 31, 2009 | 56,237,269 | $ | 56,237 | $ | 91,686,382 | $ | - | $ | (53,903,464 | ) | $ | 10,600 | $ | 37,849,755 | |||||||
| Common stock | |||||||||||||||||||||
| Issued for exercise of stock options and warrants | 1,151,852 | 1,152 | 1,143,603 | - | - | - | 1,144,755 | ||||||||||||||
| Issued for consulting service agreements | 578,632 | 579 | 1,616,506 | - | - | - | 1,617,085 | ||||||||||||||
| Issued for STMV Acquisition | 2,755,000 | 2,755 | 9,749,945 | 194,700 | 9,947,400 | ||||||||||||||||
| Issued for mineral property acquisition | 10,448 | 10 | 32,170 | - | - | - | 32,180 | ||||||||||||||
| Issued for bonuses | 55,136 | 55 | 201,743 | - | - | - | 201,798 | ||||||||||||||
| Warrants issued as penalties pursuant to private placement financing | - | - | 517,273 | - | - | - | 517,273 | ||||||||||||||
| Stock-based compensation | |||||||||||||||||||||
| Options issued for consulting services | - | - | 1,964,006 | - | - | - | 1,964,006 | ||||||||||||||
| Options issued for management fees | - | - | 1,960,000 | - | - | - | 1,960,000 | ||||||||||||||
| Options issued for wages and benefits | - | - | 1,286,506 | - | - | - | 1,286,506 | ||||||||||||||
| Net loss for the year | - | - | - | - | (14,478,669 | ) | - | (14,478,669 | ) | ||||||||||||
| Unrealized loss on available-for-sale securities | - | - | - | - | - | (5,752 | ) | (5,752 | ) | ||||||||||||
| Balance, July 31, 2010 | 60,788,337 | $ | 60,788 | $ | 110,158,134 | $ | 194,700 | $ | (68,382,133 | ) | $ | 4,848 | $ | 42,036,337 | |||||||
| Common stock | |||||||||||||||||||||
| Issued for exercise of stock options and warrants | 4,187,962 | 4,188 | 11,447,707 | - | - | - | 11,451,895 | ||||||||||||||
| Issued for consulting service agreements | 174,725 | 175 | 754,607 | - | - | - | 754,782 | ||||||||||||||
| Issued for private placement financing | 8,111,313 | 8,111 | 25,646,287 | - | - | - | 25,654,398 | ||||||||||||||
| Issued for mineral property acquisition | 225,000 | 225 | 722,025 | - | - | - | 722,250 | ||||||||||||||
| Stock-based compensation | |||||||||||||||||||||
| Options issued for consulting services | - | - | 1,798,833 | - | - | - | 1,798,833 | ||||||||||||||
| Options issued for management fees | - | - | 2,079,707 | - | - | - | 2,079,707 | ||||||||||||||
| Options issued for wages and benefits | - | - | 1,956,906 | - | - | - | 1,956,906 | ||||||||||||||
| Net loss for the year | - | - | - | - | (27,358,095 | ) | - | (27,358,095 | ) | ||||||||||||
| Unrealized gain on available-for-sale securities | - | - | - | - | - | 25,778 | 25,778 | ||||||||||||||
| Balance, July 31, 2011 | 73,487,337 | $ | 73,487 | $ | 154,564,206 | $ | 194,700 | $ | (95,740,228 | ) | $ | 30,626 | $ | 59,122,791 | |||||||
The accompanying notes are an integral part of these consolidated financial statements
F-6
| Accumulated | |||||||||||||||||||||
| Common Stock | Additional Paid-in | Share Issuance | Accumulated | Other | Stockholders' | ||||||||||||||||
| Shares | Amount | Capital | Obligation | Deficit | Comprehensive | Equity | |||||||||||||||
| Balance, July 31, 2011 | 73,487,337 | $ | 73,487 | $ | 154,564,206 | $ | 194,700 | $ | (95,740,228 | ) | $ | 30,626 | $ | 59,122,791 | |||||||
| Common stock | |||||||||||||||||||||
| Issued for public financing | 6,284,770 | 6,285 | 20,962,458 | - | - | - | 20,968,743 | ||||||||||||||
| Issued for exercise of stock options and warrants | 304,323 | 305 | 553,815 | - | - | - | 554,120 | ||||||||||||||
| Issued for consulting service agreement | 50,000 | 50 | 167,324 | - | - | - | 167,374 | ||||||||||||||
| Issued for settlement of convertible debentures | 128,508 | 128 | 699,212 | - | - | - | 699,340 | ||||||||||||||
| Issued for mineral property acquisitions | 4,520,669 | 4,521 | 15,953,311 | - | - | - | 15,957,832 | ||||||||||||||
| Issued for database acquisition | 159,236 | 159 | 510,989 | - | - | - | 511,148 | ||||||||||||||
| Issued for settlement of current liabilities | 40,312 | 40 | 158,386 | - | - | - | 158,426 | ||||||||||||||
| Stock-based compensation | |||||||||||||||||||||
| Options issued for consulting services | - | - | 763,848 | - | - | - | 763,848 | ||||||||||||||
| Options issued for management fees | - | - | 834,219 | - | - | - | 834,219 | ||||||||||||||
| Options issued for wages and benefits | - | - | 1,144,062 | - | - | - | 1,144,062 | ||||||||||||||
| Options issued for mineral property acquisition | - | - | 76,442 | - | - | - | 76,442 | ||||||||||||||
| Broker options issued for mineral property acquisition | - | - | 28,149 | - | - | - | 28,149 | ||||||||||||||
| Warrants issued for mineral property acquisition | - | - | 70,460 | - | - | - | 70,460 | ||||||||||||||
| Net loss for the year | - | - | - | - | (25,083,720 | ) | - | (25,083,720 | ) | ||||||||||||
| Unrealized loss on available-for-sale securities | - | - | - | - | - | (52,753 | ) | (52,753 | ) | ||||||||||||
| Balance, July 31, 2012 | 84,975,155 | $ | 84,975 | $ | 196,486,881 | $ | 194,700 | $ | (120,823,948 | ) | $ | (22,127 | ) | $ | 75,920,481 | ||||||
The accompanying notes are an integral part of these consolidated financial statements
F-7
| Year Ended July 31, | ||||||||||||
| Notes | 2012 | 2011 | 2010 | |||||||||
| CASH (USED IN) PROVIDED BY: | ||||||||||||
| OPERATING ACTIVITIES | ||||||||||||
| Net loss for the year | $ | (25,083,720 | ) | $ | (27,358,095 | ) | $ | (14,478,669 | ) | |||
| Adjustments to reconcile net loss to net cash from operating activities | ||||||||||||
| Stock-based compensation | 11 | 2,909,503 | 6,342,739 | 7,029,390 | ||||||||
| Depreciation, amortization, depletion and accretion | 2,219,924 | 1,155,959 | 794,504 | |||||||||
| Impairment loss on mineral properties | - | 143,396 | 43,600 | |||||||||
| (Gain) loss on disposition of assets | (6,999 | ) | 9,234 | 3,677 | ||||||||
| Gain on sale of investments | - | (508,682 | ) | - | ||||||||
| Loss on fair value of convertible debentures | 5 | 49,681 | - | - | ||||||||
| Loss on settlement of convertible debentures | 5 | 312,207 | - | - | ||||||||
| Gain on settlement of accounts payable | 5 | (221,292 | ) | - | - | |||||||
| Loss on settlement of asset retirement obligations | 10 | 444,448 | - | - | ||||||||
| Gain on sale of discontinued operations, net of income taxes | 5 | - | - | (8,534,081 | ) | |||||||
| Deferred income tax benefit | (61,788 | ) | - | - | ||||||||
| Non-cash financing charges | - | - | 517,273 | |||||||||
| Other non-cash adjustment | - | - | (4,413 | ) | ||||||||
| Changes in operating assets and liabilities | ||||||||||||
| Accounts and interest receivable | (166,626 | ) | (44,457 | ) | (19,555 | ) | ||||||
| Inventories | 4 | 899,847 | (2,063,630 | ) | - | |||||||
| Prepaid expenses and deposits | (433,293 | ) | (96,985 | ) | (30,659 | ) | ||||||
| Accounts payable and accrued liabilities | 993,865 | (42,485 | ) | 2,475,429 | ||||||||
| Settlement of asset retirement obligations | 10 | (1,064,220 | ) | (1,212,942 | ) | (1,368,685 | ) | |||||
| NET CASH FLOWS USED IN OPERATING ACTIVITIES | (19,208,463 | ) | (23,675,948 | ) | (13,572,189 | ) | ||||||
| FINANCING ACTIVITIES | ||||||||||||
| Issuance of shares for cash, net of issuance costs | 21,522,863 | 37,106,294 | 1,144,760 | |||||||||
| Settlement of convertible debentures | 5 | (1,370,486 | ) | - | - | |||||||
| Due to related parties | 9 | 39,156 | 8,287 | 37,360 | ||||||||
| NET CASH FLOWS PROVIDED BY FINANCING ACTIVITIES | 20,191,533 | 37,114,581 | 1,182,120 | |||||||||
| INVESTING ACTIVITIES | ||||||||||||
| Investment in mineral rights and properties | 5, 14 | (4,184,269 | ) | (1,453,767 | ) | (1,421,900 | ) | |||||
| Purchase of property, plant and equipment | (1,321,678 | ) | (719,171 | ) | (166,648 | ) | ||||||
| Settlement of loan assumed from acquisition of subsidiaries | 5 | (260,650 | ) | (300,000 | ) | - | ||||||
| Proceeds from disposition of assets | 7,500 | 530,650 | 11,003,723 | |||||||||
| Proceeds from sale of investments | - | 29,035 | - | |||||||||
| Reclamation deposits | (932,740 | ) | (1,868,991 | ) | (223,087 | ) | ||||||
| NET CASH FLOWS (USED IN) PROVIDED BY INVESTING ACTIVITIES | (6,691,837 | ) | (3,782,244 | ) | 9,192,088 | |||||||
| NET CASH FLOWS | (5,708,767 | ) | 9,656,389 | (3,197,981 | ) | |||||||
| CASH AND CASH EQUIVALENTS, BEGINNING OF YEAR | 30,724,051 | 21,067,662 | 24,265,643 | |||||||||
| CASH AND CASH EQUIVALENTS, END OF YEAR | $ | 25,015,284 | $ | 30,724,051 | $ | 21,067,662 | ||||||
| SUPPLEMENTAL CASH FLOW INFORMATION | 14 | |||||||||||
The accompanying notes are an integral part of these consolidated financial statements
F-8
| Incorporated by reference to our Current Report on Form 8-K filed with the SEC on June 17, 2022. | |
NOTE 1: NATURE OF OPERATIONS
Uranium Energy Corp. was incorporated in the State of Nevada on May 16, 2003. Uranium Energy Corp. and its subsidiary companies and a partnership (collectively, the “Company”) are engaged in uranium mining and related activities, including exploration, pre-extraction, extraction and processing of uranium concentrates, on projects located in the United States and the Republic of Paraguay.
The Company realized revenue from uranium sales during the fiscal year ended July 31, 2012, however, it has a history of operating losses and significant negative cash flow since inception. Although planned principal operations have commenced and existing cash resources are expected to provide sufficient funds for the next twelve months, future capital expenditures of the Company may be substantial and its continuation as a going concern for a period longer than twelve months will be dependent upon the Company’s ability to obtain adequate financing. Historically, the Company has been reliant primarily on equity financing from the sale of its common shares and this reliance is expected to continue for the foreseeable future. Furthermore, the continued operations of the Company, including the recoverability of the carrying values of its assets, are dependent ultimately on the Company’s ability to achieve and maintain profitability and positive cash flow from its operations. At July 31, 2012, the Company had working capital of $22.5 million and an accumulated deficit of $120.8 million. For the fiscal year ended July 31, 2012 (“Fiscal 2012”), the fiscal year ended July 31, 2011 (“Fiscal 2011”) and the fiscal year ended July 31, 2010 (“Fiscal 2010”), the Company recorded a net loss of $25.1 million, $27.4 million and $14.5 million, respectively.
NOTE 2: SUMMARY OF SIGNIFICANT ACCOUNTING POLICIES
Basis of Presentation and Principles of Consolidation
These consolidated financial statements are presented in United States dollars and have been prepared in accordance with U.S. generally accepted accounting principles (“U.S. GAAP”).
The accompanying consolidated financial statements include the accounts of Uranium Energy Corp. and its wholly-owned subsidiaries, UEC Resources Ltd., UEC Paraguay Corp. and its subsidiary, Piedra Rica Mining S.A., Cue Resources Ltd. and its subsidiary, Transandes Paraguay S.A., UEC Concentric Merge Corp., URN Texas GP, LLC, URN South Texas Project, Ltd. and a partnership, South Texas Mining Venture, L.L.P. All significant inter-company transactions and balances have been eliminated upon consolidation.
Comparative figures for stock-based compensation have been reclassified to the general and administrative expenses to conform to the current year’s presentation format.
Exploration Stage
The Company has established the existence of mineralized materials for certain uranium projects, including the Palangana Mine. The Company has not established proven or probable reserves, as defined by the United States Securities and Exchange Commission (the “SEC”) under Industry Guide 7, through the completion of a “final” or “bankable” feasibility study for any of its uranium projects, including the Palangana Mine. Furthermore, the Company has no plans to establish proven or probable reserves for any of its uranium projects for which the Company plans on utilizing ISR mining, such as the Palangana Mine. As a result, and despite the fact that the Company commenced extraction of mineralized materials at the Palangana Mine in November 2010, the Company remains in the Exploration Stage as defined under Industry Guide 7, and will continue to remain in the Exploration Stage until such time proven or probable reserves have been established.
Since the Company commenced extraction of mineralized materials at the Palangana Mine without having established proven and probable reserves, any mineralized materials established or extracted from the Palangana Mine should not be in any way associated with having established or produced from proven or probable reserves.
In accordance with U.S. GAAP, acquisition costs of mineral rights are initially capitalized as incurred while exploration and pre-extraction expenditures are expensed as incurred until such time the Company exits the Exploration Stage by establishing proven or probable reserves. Expenditures relating to exploration activities such as drill programs to search for additional mineralized materials are expensed as incurred. Expenditures relating to pre-extraction activities such as the construction of mine wellfields, ion exchange facilities and disposal wells are expensed as incurred until such time proven or probable reserves are established for that uranium project, after which subsequent expenditures relating to mine development activities for that particular project are capitalized as incurred.
F-9
| Incorporated by reference to our Current Report on Form 8-K filed with the SEC on August 11, 2022. | |
Companies in the Production Stage as defined under Industry Guide 7, having established proven and probable reserves and exited the Exploration Stage, typically capitalize expenditures relating to ongoing development activities, with corresponding depletion calculated over proven and probable reserves using the units-of-production method and allocated to future reporting periods to inventory and, as that inventory is sold, to cost of goods sold. The Company is in the Exploration Stage which has resulted in the Company reporting larger losses than if it had been in the Production Stage due to the expensing, instead of capitalizing, of expenditures relating to ongoing mill and mine development activities. Additionally, there would be no corresponding amortization allocated to future reporting periods of the Company since those costs would have been expensed previously, resulting in both lower inventory costs and cost of goods sold and results of operations with higher gross profits and lower losses than if the Company had been in the Production Stage. Any capitalized costs, such as acquisition costs of mineral rights, are depleted over the estimated extraction life using the straight-line method. As a result, the Company’s consolidated financial statements may not be directly comparable to the financial statements of companies in the Production Stage.
Development Stage Entity
Prior to the quarter ended October 31, 2011 (“Fiscal 2012 Q1”), the Company met the definition of a Development Stage Entity as defined under Accounting Standards Codification Section 915: Development Stage Entities (“ASC 915”) and presented the additional financial statement disclosures required by a Development Stage Entity under ASC 915, including the presentation of cumulative amounts since inception for the consolidated statements of operations and comprehensive loss, stockholders’ equity and cash flows. In Fiscal 2012 Q1, during which the Company generated significant revenue from its planned principal operations by completing its first sale of uranium concentrates, the Company no longer met the definition of a Development Stage Entity. Accordingly, and starting with the filing of its Form 10-Q for Fiscal 2012 Q1, the Company no longer presented the additional financial statement disclosures required by a Development Stage Entity under ASC 915.
Use of Estimates
The preparation of financial statements in conformity with U.S. GAAP requires management to make estimates and assumptions that affect the reported amount of assets and liabilities at the date of the financial statements and revenues and expenses during the period reported. By their nature, these estimates are subject to measurement uncertainty and the effect on the financial statements of changes in such estimates in future periods could be significant. Significant areas requiring management's estimates and assumptions include determining the fair value of transactions involving common stock, valuation and impairment losses on mineral property interests, valuation of stock-based compensation, valuation of available-for-sale securities, net realizable valuation of inventory and valuation of convertible debentures and asset retirement obligations. Other areas requiring estimates include allocations of expenditures to inventories, depletion and amortization of mineral rights and properties and depreciation of property, plant and equipment. Actual results could differ from those estimates.
Foreign Currency Translation
The functional currency of the Company, including its subsidiaries, is the United States dollar. UEC Resources Ltd. and Cue Resources Ltd. maintain their accounting records in their local currency, the Canadian dollar. Piedra Rica Mining S.A. and Transandes Paraguay S.A. maintain their accounting records in their local currency, the Paraguayan Guarani. In accordance with ASC 830, Foreign Currency Matters, the financial statements of the Company's subsidiaries are translated into United States dollars using period-end exchange rates as to monetary assets and liabilities and average exchange rates as to revenues and expenses. Non-monetary assets are translated at their historical exchange rates. Net gains and losses resulting from foreign exchange translations and foreign currency exchange gains and losses on transactions occurring in a currency other than the Company's functional currency are included in the determination of net income (loss) in the period.
F-10
| Incorporated by reference to our Current Report on Form 8-K filed with the SEC on October 13, 2022. | |
Cash and Cash Equivalents
The Company considers all highly-liquid instruments with an original maturity of three months or less at the time of issuance to be cash equivalents.
Financial Instruments
The fair values of cash and cash equivalents, available for sale securities, accounts and interest receivable, accounts payable and accrued liabilities and due to related parties were estimated to approximate their carrying values due to the immediate or short-term maturity of these financial instruments. The reclamation deposits are deposits mainly invested in short-term funds at major financial institutions and their fair value was estimated to approximate their carrying value. The Company's operations and financing activities are conducted primarily in United States dollars and as a result, the Company is not subject to significant exposure to market risks from changes in foreign currency rates. The Company is exposed to credit risk through its cash and cash equivalents, but mitigates this risk by keeping deposits at major financial institutions.
Fair Value Measurements
The Company measures its available-for-sale securities at fair value in accordance with ASC 820, Fair Value Measurements. ASC 820 specifies a valuation hierarchy based on whether the inputs to those valuation techniques are observable or unobservable. Observable inputs reflect market data obtained from independent sources, while unobservable inputs reflect the Company’s own assumptions. These two types of inputs have created the following fair value hierarchy:
Inventories
Inventories are comprised of supplies, uranium concentrates and work-in-progress. Expenditures include mining and processing activities that result in future extraction of uranium concentrates and depreciation and depletion charges. Mining and processing costs include labor, chemicals, directly attributable uranium extraction expenditures and overhead related to uranium extraction. Inventories are carried at the lower of cost or net realizable value and are valued and charged to cost of sales using the average costing method.
Mineral Rights
Acquisition costs of mineral rights are capitalized as incurred while exploration and pre-extraction expenditures are expensed as incurred until such time the Company exits the Exploration Stage by establishing proven or probable reserves, as defined by the SEC under Industry Guide 7, through the completion of a “final” or “bankable” feasibility study. Expenditures relating to exploration activities are expensed as incurred and expenditures relating to pre-extraction activities are expensed as incurred until such time proven or probable reserves are established for that project, after which subsequent expenditures relating to development activities for that particular project are capitalized as incurred.
Where proven and probable reserves have been established, the project’s capitalized expenditures are depleted over proven and probable reserves upon commencement of production using the units-of-production method. Where proven and probable reserves have not been established, such capitalized expenditures are depleted over the estimated extraction life upon commencement of extraction using the straight-line method. The Company has not established proven or probable reserves for any of its projects.
F-11
| Incorporated by reference to our Current Report on Form 8-K filed with the SEC on January 23, 2023. | |
The carrying values of the mineral rights are assessed for impairment by management on a quarterly basis or when indicators of impairment exist. Should management determine that these carrying values cannot be recovered, the unrecoverable amounts are written off against earnings.
Databases
Expenditures relating to mineral property databases are capitalized upon acquisition while those developed internally are expensed as incurred. Mineral property databases are tested for impairment whenever events or changes indicate that the carrying values may not be recoverable. An impairment loss is recognized if it is determined that the carrying value is not recoverable and exceeds fair value. Mineral property databases are amortized using the straight-line method over a five-year period over which management believes these assets will contribute to the Company’s cash flows. Databases are included in Mineral Rights and Properties on the balance sheet.
Land Use Agreements
Expenditures relating to mineral property land use agreements are capitalized upon acquisition. Mineral property land use agreements are tested for impairment whenever events or changes indicate that the carrying values may not be recoverable. An impairment loss is recognized if it is determined that the carrying value is not recoverable and exceeds fair value. Mineral property land use agreements are amortized using the straight-line method over a ten-year period over which management believes these assets will contribute to the Company’s cash flows. Land use agreements are included in Mineral Rights and Properties on the balance sheet.
Property, Plant and Equipment
Property, plant and equipment are recorded at cost and are depreciated to their estimated residual values using the straight-line method over their estimated useful lives as follows:
Impairment of Long-Lived Assets
Long-lived assets are reviewed for impairment whenever events or changes in circumstances indicate the carrying amount of an asset may not be recoverable. Circumstances which could trigger a review include, but are not limited to: significant decreases in the market price of the asset; significant adverse changes in the business climate or legal factors; accumulation of costs significantly in excess of the amount originally expected for the acquisition or construction of the asset; current period cash flow or operating losses combined with a history of losses or a forecast of continuing losses associated with the use of the asset; and current expectation that the asset will more likely than not be sold or disposed of significantly before the end of its estimated useful life. Recoverability of these assets is measured by comparison of the carrying amounts to the future undiscounted cash flows expected to be generated by the assets. An impairment loss is recognized when the carrying amount is not recoverable and exceeds fair value.
Income Taxes
The Company follows the liability method of accounting for income taxes. Under this method, deferred tax assets and liabilities are recognized for the future tax consequences attributable to differences between the financial statement carrying amounts of existing assets and liabilities and their respective tax balances. Deferred tax assets and liabilities are measured using enacted tax rates expected to apply to taxable income for the years in which those differences are expected to be recovered or settled. The effect on deferred tax assets and liabilities of a change in tax rates is recognized in income in the period that includes the date of enactment. The Company recognizes deferred taxes on unrealized gains directly within other comprehensive income, and concurrently releases part of the valuation allowance resulting in no impact within other comprehensive income or on the balance sheet. The Company’s policy is to accrue any interest and penalties related to unrecognized tax benefits in its provision for income taxes. Additionally, ASC 740, Income Taxes, requires that the Company recognize in its financial statements the impact of a tax position that is more likely than not to be sustained upon examination based on the technical merits of the position.
F-12
| Incorporated by reference to our Current Report on Form 8-K filed with the SEC on March 14, 2023. | |
Restoration and Remediation Costs (Asset Retirement Obligations)
Various federal and state mining laws and regulations require the Company to reclaim the surface areas and restore underground water quality for its mine projects to the pre-existing mine area average quality after the completion of mining.
Future reclamation and remediation costs, which include extraction equipment removal and environmental remediation, are accrued at the end of each period based on management's best estimate of the costs expected to be incurred for each project. Such estimates are determined by the Company's engineering studies which consider the costs of future surface and groundwater activities, current regulations, actual expenses incurred, and technology and industry standards.
In accordance with ASC 410, Asset Retirement and Environmental Obligations, the Company capitalizes the measured fair value of asset retirement obligations to mineral rights and properties. The asset retirement obligations are accreted to an undiscounted value until the time at which they are expected to be settled. The accretion expense is charged to earnings and the actual retirement costs are recorded against the asset retirement obligations when incurred. Any difference between the recorded asset retirement obligations and the actual retirement costs incurred will be recorded as a gain or loss in the period of settlement.
On a quarterly basis, the Company updates cost estimates and other assumptions used in the valuation of asset retirement obligations at each of its mineral projects to reflect new events, changes in circumstances and any new information that is available. Changes in these costs have a corresponding impact on the asset retirement obligations.
Convertible Debentures
Pursuant to ASC 815, Derivatives and Hedging, the convertible debentures were initially measured at fair value in its entirety, without separating associated elements such as the convertible feature. Subsequent to the initial recognition, the fair value of the convertible debentures is revalued and recognized in the applicable period as an unrealized change in fair value of the convertible debentures in the consolidated statements of operations and comprehensive loss.
The Company’s fair value measurement for the convertible debentures is calculated using a probability-weighted discounted cash flow model (level 3 fair value measurement) which includes the Company’s assessment of the outstanding principle, the accrued interest and the applicable discount rate.
Upon exercise under the convertible provision, the financial liability is derecognized and common shares of the Company would be issued at the exercise price, with any differences recorded as a gain or loss in the consolidated statements of operations and comprehensive loss.
Upon settlement of the convertible debentures, the financial liability is derecognized and any difference between the carrying value of the financial liability and the settlement amount is recorded as a gain or loss of convertible debenture settlement in the consolidated statements of operations and comprehensive loss.
During Fiscal 2012, the Company settled all outstanding convertible debentures through cash payments and issuance of shares of the Company.
F-13
| Incorporated by reference to our Current Report on Form 8-K filed with the SEC on May 1, 2023. | |
Revenue Recognition
The recognition of revenue from the sale of uranium concentrates is in accordance with the guidelines outlined in ASC Section 605-10-25, Revenue Recognition. The Company delivers its uranium concentrates to a uranium storage facility and once the product is confirmed to meet the required specifications, the Company receives credit for a specified quantity measured in pounds. Future sales of uranium concentrates are expected to generally occur under uranium supply agreements or through the uranium spot market. Once a sale of uranium concentrates is negotiated, the Company will notify the uranium storage facility with instructions for a title transfer to the customer. Revenue is recognized once a title transfer of the uranium concentrates is confirmed by the uranium storage facility at which point the customer is invoiced by the Company.
Stock-Based Compensation
The Company follows ASC 718, Compensation - Stock Compensation, which addresses the accounting for stock-based payment transactions, requiring such transactions to be accounted for using the fair value method. Awards of shares for property or services are recorded at the more readily measurable of the fair value of the stock and the fair value of the service. The Company uses the Black-Scholes option-pricing model to determine the grant date fair value of stock-based awards under ASC 718. The fair value is charged to earnings depending on the terms and conditions of the award, and the nature of the relationship of the recipient of the award to the Company. The Company records the grant date fair value in line with the period over which it was earned. For employees and management, this is typically considered to be the vesting period of the award. For consultants the fair value of the award is recorded over the term of the service period, and unvested amounts are revalued at each reporting period over the service period. The Company estimates the expected forfeitures and updates the valuation accordingly.
Earnings (Loss) per Common Share
Basic earnings (loss) per share includes no potential dilution and is computed by dividing the earnings (loss) attributable to common stockholders by the weighted average number of common shares outstanding for the period. Diluted earnings (loss) per share reflect the potential dilution of securities that could share in the earnings (loss) of the Company. The common shares potentially issuable on the exercise of share purchase warrants and stock options were not included in the calculation of weighted average number of shares outstanding because the effect is anti-dilutive.
New Accounting Standard
On May 12, 2011, the FASB issued ASU 2011-04 to converge U.S. GAAP and IFRS requirements for measuring amounts at fair value as well as disclosures about these measurements. The ASU is effective for the first reporting period (including interim periods) beginning after December 15, 2011. Effective February 1, 2012, the Company adopted this ASU which did not have a material impact on the Company’s consolidated financial statements.
On June 16, 2011, the FASB issued ASU 2011-05 to provide two options of how to present items of net income, items of other comprehensive income and total comprehensive income. Companies can create one continuous statement of comprehensive income or two separate consecutive statements. Companies will no longer be allowed to present other comprehensive income in the statement of stockholders’ equity. The ASU is effective for fiscal years, and interim periods within those years after December 15, 2011. On December 23, 2011, FASB issued ASU 2011-12 to defer the ASU 2011-05 requirement with the same effective date as ASU 2011-12. The Company adopted this guidance effective February 1, 2012.
F-14
| Previously filed as an exhibit to our Annual Report on Form 10-K filed with the SEC on September 29, 2023. | |
NOTE 3: AVAILABLE-FOR-SALE SECURITIES
Available-for-sale securities consist of shares in publicly-traded uranium exploration companies listed on the TSX Venture and Australian Stock Exchanges. For Fiscal 2012, the Company recorded an unrealized loss of $52,753 (Fiscal 2011: unrealized gain of $25,778; Fiscal 2010: unrealized loss of $5,752) in accumulated other comprehensive loss (income) relating to available-for-sale securities.
At July 31, 2012, the fair value of the Company’s available-for-sale securities is as follows:
| |||||||||
- 103 - | |||||||||
At July 31, 2011, the fair value of the Company’s available-for-sale securities is as follows:
| |||||||||
NOTE 4: INVENTORIES
In November 2010, the Company commenced uranium extraction at its Palangana Mine and processing of uranium concentrates at its Hobson Processing Facility. The Company’s inventories consist of the following:
| July 31, 2012 | July 31, 2011 | |||||
| Supplies | $ | 32,489 | $ | 39,263 | ||
| Work-in-progress | 250,951 | 505,446 | ||||
| Finished goods - uranium concentrates | 1,592,660 | 2,231,238 | ||||
| $ | 1,876,100 | $ | 2,775,947 |
At July 31, 2012, the total non-cash component of inventory was $319,024 (July 31, 2011: $712,317). During Fiscal 2012 and 2011, the Company did not record a write-down of inventories to net realizable value.
NOTE 5: MINERAL RIGHTS AND PROPERTIES
Mineral Rights
At July 31, 2012, the Company had mineral rights in the States of Arizona, Colorado, New Mexico, Texas and Wyoming and in the Republic of Paraguay. These mineral rights were acquired for the purposes of uranium mining and related activities, including exploration, pre-extraction, extraction and processing of uranium concentrates, at a cost of $42,425,697, including $33,018,768 representing the fair value of non-cash consideration and $2,365,456 representing the present value of the retirement obligation associated with the Palangana Mine, net of $1,713,504 in impairment charges. These mineral rights were acquired through staking and lease or option agreements and are subject to varying royalty interests, some of which are indexed to the sale price of uranium. At July 31, 2012, annual maintenance payments of approximately $1,186,000 were required to maintain these mineral rights.
F-15
Mineral rights and property acquisition costs consist of the following:
| July 31, 2012 | July 31, 2011 | |||||
| Mineral Rights and Properties, Unproven | ||||||
| Palangana Mine | $ | 6,610,453 | $ | 5,710,187 | ||
| Goliad Project | 8,689,127 | 8,689,127 | ||||
| Burke Hollow Project | 1,313,250 | - | ||||
| Channen Project | 428,164 | - | ||||
| Salvo Project | 363,645 | 303,645 | ||||
| Nichols Project | 154,774 | 154,774 | ||||
| Anderson Project | 9,154,268 | 427,616 | ||||
| Workman Creek Project | 1,187,158 | - | ||||
| Los Cuatros (formerly New River) Project | 257,250 | 257,250 | ||||
| Slick Rock Project | 163,213 | 47,913 | ||||
| Todilto Project | 166,720 | 182,320 | ||||
| Yuty Project | 11,947,144 | - | ||||
| Coronel Oviedo Project | 1,133,412 | 880,579 | ||||
| Other property acquisitions | 857,119 | 789,302 | ||||
| 42,425,697 | 17,442,713 | |||||
| Accumulated depletion | (1,057,495 | ) | (360,418 | ) | ||
| 41,368,202 | 17,082,295 | |||||
| Databases | 2,345,038 | 1,433,890 | ||||
| Accumulated amortization | (1,374,484 | ) | (968,782 | ) | ||
| 970,554 | 465,108 | |||||
| Land Use Agreements | 375,155 | 375,155 | ||||
| Accumulated amortization | (118,991 | ) | (81,475 | ) | ||
| 256,164 | 293,680 | |||||
| $ | 42,594,920 | $ | 17,841,083 |
The Company has not established proven or probable reserves, as defined by the SEC under Industry Guide 7, through the completion of a “final” or “bankable” feasibility study for any of its mineral projects. The Company has established the existence of mineralized materials for certain uranium projects, including the Palangana Mine. Since the Company commenced uranium extraction at the Palangana Mine without having established proven or probable reserves, there may be greater inherent uncertainty as to whether or not any mineralized material can be economically extracted as originally planned and anticipated.
The Palangana Mine has been the Company’s sole source for the U3O8sold to generate its revenue during Fiscal 2012, with no revenues generated prior to Fiscal 2012. The economic viability of the Company’s mining activities, including the expected duration and profitability of the Palangana Mine and of any future satellite ISR mines, such as the Goliad Project, located within the South Texas Uranium Belt, has many risks and uncertainties. These include, but are not limited to: (i) a significant, pro-longed decrease in the market price of uranium; (ii) difficulty in marketing and/or selling uranium concentrates; (iii) significantly higher than expected capital costs to construct the mine and/or processing plant; (iv) significantly higher than expected extraction costs; (v) significantly lower than expected uranium extraction; (vi) significant delays, reductions or stoppages of uranium extraction activities; and (vii) the introduction of significantly more stringent regulatory laws and regulations. The Company’s mining activities may change as a result of any one or more of these risks and uncertainties and there is no assurance that any ore body that we extract mineralized materials from will result in profitable mining activities.
F-16
Pursuant to a Data Purchase and Sale Agreement dated August 19, 2011, the Company purchased certain database covering the Goliad formation from Uranium One Inc. for total consideration of $911,148, comprised of a cash payment of $400,000 and the issuance of 159,236 restricted common shares of the Company with an estimated fair value estimated of $511,148.
The estimated depletion and amortization of mineral rights and properties for the next five fiscal years is as follows:
Mineral property expenditures incurred by major projects are as follows:
| Year Ended July 31, | |||||||||
| 2012 | 2011 | 2010 | |||||||
| Mineral Property Expenditures | |||||||||
| Palangana Mine | $ | 7,597,102 | $ | 7,859,841 | $ | 3,643,662 | |||
| Goliad Project | 646,314 | 995,849 | 2,353,547 | ||||||
| Burke Hollow Project | 1,176,101 | - | - | ||||||
| Channen Project | 190,009 | - | - | ||||||
| Hobson | 123,005 | 367,904 | 30,300 | ||||||
| Salvo Project | 1,113,659 | 1,268,088 | 83,788 | ||||||
| Nichols Project | 150,000 | 15,496 | 5,976 | ||||||
| Land work - Texas | 423,291 | 388,633 | 164,740 | ||||||
| Anderson Project | 375,058 | 13,707 | - | ||||||
| Workman Creek Project | 50,069 | - | - | ||||||
| Yuty Project | 627,623 | - | - | ||||||
| Coronel Oviedo Project | 2,207,255 | 250,992 | - | ||||||
| Other Mineral Property Expenditures | 259,236 | 259,670 | 156,701 | ||||||
| $ | 14,938,722 | $ | 11,420,180 | $ | 6,438,714 | ||||
During Fiscal 2012, the Company did not incur any impairment charges (Fiscal 2011: $143,396; Fiscal 2010: $43,600). During Fiscal 2011, the Company impaired the Monument Canyon property located in Utah and the Carrizo, Devillier and Maetze properties located in Texas.
During Fiscal 2010, the Company sold its 49% interest in Cibola Resources, LLC for a cash payment of $11.0 million. As a result, the Company recorded an $8,534,081 gain on the sale of assets which is reported as discontinued operations.
Palangana Mine, Texas
The Company has various mining lease and surface use agreements granting the Company the exclusive right to explore, develop and mine for uranium at the Palangana Mine, a 9,601-acre property located in Duval County, Texas approximately 100 miles south of the Hobson Processing Facility. Effective December 18, 2009, the Company acquired the Palangana Mine as part of the acquisition of South Texas Mining Venture, L.L.P. (“STMV Acquisition”) with an estimated fair value of $3,911,800 at acquisition.
F-17
Upon commencement of uranium extraction during the second quarter of Fiscal 2011, the Company began depreciating and depleting the capitalized costs of the Palangana Mine over a 30 to 42-month period. At July 31, 2012, capitalized costs of the Palangana Mine was $6,610,453 (July 31, 2011: $5,710,187), less accumulated depletion of $1,057,495 (July 31, 2011: $360,418), a net book value of $5,552,958 (July 31, 2011: $5,349,769). Included in capitalized costs was $2,365,456 of reclamation liability on July 31, 2012 (July 31, 2011: $1,798,387).
Goliad Project, Texas
The Company has various mining lease and surface use agreements granting the Company the exclusive right to explore, develop and mine for uranium on the Goliad Project, a 2,242-acre property located in Goliad County, Texas. The agreements have a minimum term of five years with extension provisions. At July 31, 2012, capitalized costs totaled $8,689,127 (July 31, 2011: $8,689,127).
Burke Hollow Project, Texas
During Fiscal 2012, the Company entered into a mining lease and surface use agreement granting the Company the exclusive right to explore, develop and mine for uranium on the Burke Hollow Project, a 17,510-acre property located in Bee County, Texas.
The acquisition of the Burke Hollow Project was accounted for in accordance with ASC 360, Property, Plant and Equipment as an asset acquisition. Total consideration paid by the Company was $1,313,250 in cash which was capitalized as mineral rights and properties on the Company’s consolidated balance sheet. At July 31, 2012, capitalized costs totaled $1,313,250 (July 31, 2011: $Nil).
Channen Project, Texas
During Fiscal 2012, the Company entered into a lease option agreement granting the Company the exclusive right to explore for uranium and enter into a mining lease and surface use agreement on the Channen Project, a 10,704-acre property located in Goliad County, Texas. The lease option agreement is subject to minimum exploration expenditures totaling $1.75 million over a two-year period ending December 31, 2013.
The acquisition of the Channen Project was accounted for in accordance with ASC 360, Property, Plant and Equipment as an asset acquisition. Total consideration paid by the Company was $428,164 in cash which was capitalized as mineral rights and properties on the Company’s consolidated balance sheet. At July 31, 2012, capitalized costs totaled $428,164 (July 31, 2011: $Nil).
Salvo Project, Texas
The Company has various mining lease and surface use agreements granting the Company the exclusive right to explore, develop and mine for uranium on the Salvo Project, a 5,340-acre property located in Bee County, Texas. The agreements have a minimum term of five years with extension provisions. At July 31, 2012, capitalized costs totaled $363,645 (July 31, 2011: $303,645).
Nichols Project, Texas
The Company has various mining lease and surface use agreements granting the Company the exclusive right to explore, develop and mine for uranium on the Nichols Project, a 1,040-acre property located in Karnes County, Texas. The agreements have a minimum term of five years with extension provisions. At July 31, 2012, capitalized costs totaled $154,774 (July 31, 2011: $154,774).
Anderson Project, Arizona
Pursuant to a Merger Agreement and Plan of Merger dated May 5, 2011 and effective September 9, 2011 (the “Merger Agreement”), the Company merged with Concentric Energy Corp. (“Concentric”) resulting in the acquisition of an undivided 100% interest in the 9,852-acre Anderson Property located in Yavapai County, Arizona.
F-18
In accordance with the Merger Agreement, Concentric’s shareholders received 0.1075 of one share of the Company’s common stock for every one share of Concentric common stock, resulting in the issuance of 1,253,440 shares of the Company to the former Concentric shareholders. In addition, holders of Concentric share purchase warrants received 0.1075 of one share purchase warrant of the Company for every one Concentric share purchase warrant, resulting in the issuance of share purchase warrants representing 375,834 shares of the Company exercisable at prices ranging from $9.30 to $65.12 per share to the former holders of Concentric share purchase warrants.
Pursuant to an Acquisition Agreement dated April 11, 2011, as amended on June 24, 2011, and effective September 9, 2011 (the “Acquisition Agreement”) concurrently with the Merger Agreement, the Company was assigned all of Global Uranium Corp.’s (“Global”) rights and interests under the terms and conditions of an Option and Joint Venture Agreement dated April 13, 2010 between Concentric and Global with respect to the Anderson Project. In accordance with the Acquisition Agreement, the Company provided the following consideration to Global:
The acquisition of the Anderson Project was accounted for in accordance with ASC 360, Property, Plant and Equipment, as an asset acquisition and the respective fair values of the material line items are summarized as follows:
At July 31, 2012, capitalized costs totaled $9,154,268 (July 31, 2011: $427,616).
Effective September 9, 2011 and as part of the merger with Concentric, the Company assumed the obligations of certain Series “A” and “B” convertible debentures previously issued by Concentric with a combined estimated fair value of $1,707,938. The Series “A” convertible debentures were comprised of a total $628,376 in principal accruing interest at 15% annually, convertible into shares of Concentric at $0.90 per share and maturing on December 31, 2012. The Series “B” convertible debentures were comprised of a total $498,644 in principal accruing interest at 15% annually, convertible into shares of Concentric at $1.22 per share and maturing on April 22, 2013 and May 21, 2013.
During Fiscal 2012, the Company settled all of the Series “A” and “B” convertible debentures with an aggregate value of $1,757,619 for cash payments totaling $1,370,486 and the issuance of 128,508 shares of the Company with a fair value of $699,340, resulting in the recognition of a loss on settlement of convertible debentures of $312,207.
During Fiscal 2012, the Company recognized a loss in fair value of convertible debentures of $49,681.
During Fiscal 2012, the Company settled the following accounts payable and accrued liabilities previously incurred by Concentric and assumed by the Company:
F-19
Workman Creek Project, Arizona
Pursuant to a Property Acquisition Agreement dated November 7, 2011, as amended on November 25, 2011, and effective November 30, 2011, the Company acquired from Cooper Minerals, Inc. (“Cooper”) an undivided 100% interest in the 4,192-acre Workman Creek Project located in Gila County, Arizona. The Workman Creek Project is subject to a 3.0% net smelter revenue royalty requiring an annual advance royalty payment of $100,000. The Company has an exclusive right and option to acquire one-half (1.5%) of the net smelter revenue royalty for $1,000,000 at any time until January 21, 2024. Additionally, certain individuals hold an option to acquire a 0.5% net smelter revenue royalty exercisable by paying the Company the sum of $333,340 at any time until January 21, 2024.
As consideration for this acquisition, the Company made cash payments totaling $84,640 and issued 300,000 shares. The acquisition of the Workman Creek Project was accounted for in accordance with ASC 360, Property, Plant and Equipment, as an asset acquisition and the respective fair values of the material line items are summarized as follows:
At July 31, 2012, capitalized costs totaled $1,187,158.
Los Cuatros Project (formerly New River Project), Arizona
On January 25, 2010, the Company acquired 640 acres of mineral exploration claims located in Maricopa County, Arizona, together with database records containing material information regarding the mineral claims. At July 31, 2012, capitalized costs totaled $257,250 (July 31, 2011: $257,250).
Slick Rock Project, Colorado
Pursuant to a Uranium Mining Lease dated May 23, 2012, the Company acquired from URenergy, LLC a mining lease for uranium on the Slick Rock Project located in San Miguel and Montrose Counties, Colorado. The Slick Rock Project is subject to a 3.0% production royalty requiring an annual advance royalty payment of $30,000 beginning on November 30, 2017. As consideration for this acquisition, the Company paid $100,000 in cash. At July 31, 2012, capitalized costs totaled $163,213 (July 31, 2011: $47,913).
Todilto Project, New Mexico
Effective January 14, 2009, the Company entered into an Option and Joint Venture Agreement (the “Agreement”) with Kaboko Mining Limited, formerly Uran Limited, (“Kaboko”) over a certain area of the Company’s Todilto Project located in New Mexico. Kaboko may earn a 65% interest in the area by:
During Fiscal 2012, the Company received an additional 750,000 shares of Kaboko common stock with a fair value of $15,600 which was applied against the capitalized costs of the Todilto Project. At July 31, 2012, capitalized costs totaled $166,720 (July 31, 2011: $182,320).
F-20
Coronel Oviedo Project, Paraguay
Pursuant to a Share Exchange Agreement dated May 11, 2011 and effective May 24, 2011, the Company acquired a 100% interest in Piedra Rica Mining S.A., a private Paraguayan company, which holds an undivided 100% interest in two prospecting permits in the area of Coronel Oviedo, Paraguay (the “Coronel Oviedo Project”), subject to a 1.5% gross overriding royalty. The Company has an exclusive right and option at any time to acquire one-half percent (0.5%) of the gross overriding royalty for $500,000. The Company also has a right of first refusal to acquire all or any portion of the remaining one percent (1.0%) royalty interest. As consideration for this acquisition, the Company issued 225,000 shares. The acquisition of the Coronel Oviedo Project was accounted for in accordance with ASC 360, Property, Plant and Equipment, as an asset acquisition and the respective fair values of the material line items are summarized as follows:
Pursuant to a Property Acquisition Agreement dated October 14, 2011, as amended on February 28, 2012 and March 31, 2012, between the Company and three private Paraguayan companies (the “Property Acquisition Agreement”), the Company acquired a 100% interest in a further two prospecting permits in the area of Coronel Oviedo, Paraguay, adjacent to the Coronel Oviedo Project, subject to a 1.5% gross overriding royalty. The Company has an exclusive right and option at any time to acquire one-half percent (0.5%) of the gross overriding royalty for $166,667. The Company also has a right of first refusal to acquire all or any portion of the remaining one percent (1.0%) royalty interest. As consideration for this acquisition, the Company made a cash payment of $7,500 and issued 100,000 shares. The acquisition of these permits was accounted for in accordance with ASC 360, Property, Plant and Equipment, as an asset acquisition and the respective fair values of the material line items are summarized as follows:
At July 31, 2012, capitalized costs totaled $1,133,412 (July 31, 2011: $880,579).
Yuty Project, Paraguay
Pursuant to an Arrangement Agreement dated January 20, 2012 and effective March 30, 2012 (the “Arrangement Agreement”), the Company acquired all of the outstanding common shares of Cue Resources Ltd. (“Cue”) by way of a plan of arrangement, resulting in the acquisition of an undivided 100% interest in the 539,936 acres Yuty Project located in southeastern Paraguay. In accordance with the Arrangement Agreement, Cue’s shareholders received 0.0195 of one share of the Company’s common stock for every one share of Cue common stock, resulting in the issuance of 2,345,926 shares of the Company to the former Cue shareholders in exchange for 120,304,067 shares of Cue. Holders of Cue share purchase warrants, stock options and broker options received equivalent securities of the Company at the 0.0195 ratio in exchange for their Cue securities, resulting in the issuance of share purchase warrants, stock options and broker options to purchase an aggregate 987,967 shares of the Company exercisable at prices ranging from $3.59 to $23.08 per share.
Pursuant to a Secured Loan Agreement dated January 20, 2012, the Company advanced CAD$335,000 to Cue with interest calculated at 3% per annum in order for Cue to continue meeting its ongoing operational costs incurred prior to the closing which occurred on March 30, 2012. In accordance with the Arrangement Agreement and effective March 30, 2012, the Company settled debts with certain management members and related parties of Cue by payment of an aggregate $30,075 in cash and the issuance of 171,303 shares of UEC.
The acquisition of the Yuty Project was accounted for in accordance with ASC 360, Property, Plant and Equipment, as an asset acquisition and the respective fair values of the consideration paid are summarized as follows:
F-21
The fair value of stock options, broker options and warrants issued by the Company was calculated using the Black-Scholes option pricing model with the following assumptions:
| Stock Options | Broker Options | Warrants | |||||||
| Weighted Average Risk Free Interest Rate | 0.34% | 0.19% | 0.18% | ||||||
| Weighted Average Expected Volatility | 84.92% | 47.49% | 50.95% | ||||||
| Weighted Average Expected Life in Years | 2.83 | 0.62 | 0.50 | ||||||
| Expected Dividend Yield | 0.00% | 0.00% | 0.00% |
The allocation of the respective fair values of the consideration paid and the identifiable assets acquired and liabilities assumed are as follows:
At July 31, 2012, capitalized costs totaled $11,947,144.
F-22
During Fiscal 2012, the Company made cash payments totaling $38,883 as full settlements of a total $70,231 owed to various vendors resulting in the recognition of a gain on settlement of accounts payable of $31,348.
Pursuant to a Settlement and Release Agreement dated and effective August 7, 2012 (the “Settlement Agreement”), the Company renegotiated certain acquisition and royalty agreement terms previously agreed to between Cue and the original property vendors of the Yuty Project. The Settlement Agreement confirms an overriding royalty payable to the property vendors of $0.21 for each pound of uranium produced from the Yuty Project, and supersedes all prior agreements entered into between Cue and the property vendors. As consideration for the Settlement Agreement, the Company paid $50,000 in cash and issued 75,000 restricted shares. This transaction was incurred subsequent to July 31, 2012, and will be recorded on the consolidated financial statements for the three months ending October 31, 2012.
NOTE 6: PROPERTY, PLANT AND EQUIPMENT
Property, plant and equipment consist of the following:
| July 31, 2012 | July 31, 2011 | |||||||||||||||||
| Cost | Accumulated | Net Book | Cost | Accumulated | Net Book | |||||||||||||
| Amortization | Value | Amortization | Value | |||||||||||||||
| Hobson Processing Facility | $ | 6,671,959 | $ | (258,068 | ) | $ | 6,413,891 | $ | 6,529,928 | $ | (106,832 | ) | $ | 6,423,096 | ||||
| Mining equipment | 2,182,251 | (811,016 | ) | 1,371,235 | 1,527,101 | (506,424 | ) | 1,020,677 | ||||||||||
| Vehicles | 1,841,119 | (1,063,240 | ) | 777,879 | 1,615,480 | (746,268 | ) | 869,212 | ||||||||||
| Computer equipment | 636,240 | (378,651 | ) | 257,589 | 376,275 | (272,706 | ) | 103,569 | ||||||||||
| Furniture and fixtures | 193,013 | (108,531 | ) | 84,482 | 183,338 | (72,623 | ) | 110,715 | ||||||||||
| Land | 175,144 | - | 175,144 | 175,144 | - | 175,144 | ||||||||||||
| Leasehold improvements | 9,970 | (8,956 | ) | 1,014 | 8,728 | (8,728 | ) | - | ||||||||||
| $ | 11,709,696 | $ | (2,628,462 | ) | $ | 9,081,234 | $ | 10,415,994 | $ | (1,713,581 | ) | $ | 8,702,413 | |||||
Hobson Processing Facility
On December 18, 2009, the Company acquired the Hobson Processing Facility (“Hobson”) as part of the STMV Acquisition with an estimated fair value of $6,529,928 at acquisition. Hobson is located in Karnes County, Texas about 100 miles northwest of Corpus Christi and was originally licensed and constructed in 1978. Hobson is designed to process uranium-loaded resins from satellite facilities, such as the Palangana Mine, to produce the final product in the form of uranium concentrates.
Upon commencement of processing the uranium-loaded resins from the Palangana Mine in November 2010, the Company began depreciating the capitalized costs of Hobson, which included a reclamation liability of $329,928, on a straight-line basis over a ten-year period.
F-23
NOTE 7: RECLAMATION DEPOSITS
Reclamation deposits include interest and non-interest bearing deposits issued in the States of Arizona, Texas and Wyoming pursuant to exploration, pre-extraction, extraction and reclamation activities in the respective states. Reclamation deposits consist of the following:
| July 31, 2012 | July 31, 2011 | |||||
| Palangana Mine | $ | 3,135,380 | $ | 2,117,011 | ||
| Hobson Processing Facility | 1,910,494 | 1,824,350 | ||||
| Mount Lucas | 472,823 | 672,650 | ||||
| Arizona | 15,000 | 15,000 | ||||
| Wyoming | 813 | 811 | ||||
| 5,534,510 | 4,629,822 | |||||
| Interest (Service Charges) | 8,530 | (19,522 | ) | |||
| $ | 5,543,040 | $ | 4,610,300 |
NOTE 8: LOAN RECEIVABLE
Pursuant to a Secured Loan Agreement dated April 11, 2011, the Company provided a senior secured loan to Concentric in the principal amount of $300,000, subject to interest calculated at 6% per annum, of which $200,000 was utilized to repay a secured loan owed to Global by Concentric, with the remainder for Concentric’s ongoing operational costs incurred prior to the completion of a merger between the Company and Concentric. Effective September 9, 2011, the Company merged with Concentric which resulted in the reclassification of the loan receivable as partial consideration towards the purchase price of the Anderson Project (Note 5).
NOTE 9: DUE TO RELATED PARTIES AND RELATED PARTY TRANSACTIONS
During Fiscal 2012, the Company had transactions with certain officers and directors of the Company as follows:
At July 31, 2012, amounts owed to related parties totaled $47,443 (July 31, 2011: $8,287). These amounts are unsecured, non-interest bearing and due on demand.
F-24
NOTE 10: ASSET RETIREMENT OBLIGATIONS
The Company's asset retirement obligations ("ARO") relates to site restoration for the Hobson Processing Facility, Palangana Mine and Mt. Lucas assumed as part of the STMV Acquisition.
| July 31, 2012 | July 31, 2011 | |||||
| Opening balance | $ | 3,027,803 | $ | 2,243,840 | ||
| Revision in estimate of asset retirement obligations | 567,069 | 126,000 | ||||
| Liabilities assumed | - | 1,798,387 | ||||
| Liabilities settled with cash | (619,772 | ) | (1,212,942 | ) | ||
| Liabilities settled with common shares | - | (54,000 | ) | |||
| Accretion | 137,274 | 126,518 | ||||
| 3,112,374 | 3,027,803 | |||||
| Less: current portion of asset retirement obligations | (133,298 | ) | (675,872 | ) | ||
| Long-term asset retirement obligations | $ | 2,979,076 | $ | 2,351,931 |
| July 31, 2012 | July 31, 2011 | |||||
| Undiscounted amount of estimated cash flows | $ | 3,662,233 | $ | 3,677,822 | ||
| Payable in years | 2.5 to 7.5 | 3.5 to 8.5 | ||||
| Inflation rate | 1.56% to 2.43% | 2.25% | ||||
| Discount rate | 5.00% to 10.5% | 5.00% |
During Fiscal 2012, the Company settled asset retirement obligations of $619,772 with cash of $1,064,220. As a result, a loss on settlement of asset retirement obligations of $444,448 was recorded on the consolidated statements of operations.
The undiscounted amounts of estimated cash flows for the next five years and beyond are as follows:
F-25
NOTE 11: CAPITAL STOCK
Capital Stock
At July 31, 2012, the Company’s capital stock was 750,000,000 authorized common shares with a par value of $0.001 per share.
Equity Financing
On April 10, 2012, the Company completed a public offering of its common stock for net proceeds of $20,968,743 through the sale of 6,246,078 shares of the Company at a price of $3.60 per share. The Company issued an additional 38,692 shares under this financing as share issuance costs.
On October 26, 2010, the Company completed a private placement of 8,111,313 units at a price of $3.40 per unit for net proceeds of $25,654,398. Each unit is comprised of one common share of the Company and one half of one non-transferable share purchase warrant, each whole warrant entitling the holder to purchase an additional common share of the Company at a price of $3.95 per share for a one year period. In accordance with the terms of the private placement, the Company filed a Registration Statement with the SEC which was declared effective on December 9, 2010.
| Share Transactions | ||||||||||||
| Common | Value per Share | |||||||||||
| Period / Description | Shares Issued | Low | High | Issuance Value | ||||||||
| Balance, July 31, 2009 | 56,237,269 | |||||||||||
| STMV and Everest Acquisitions | 2,755,000 | $ | 3.54 | $ | 3.54 | $ | 9,947,400 | |||||
| Options Exercised(1) | 928,391 | 0.33 | 2.40 | 452,026 | ||||||||
| Service Agreements | 578,632 | 2.17 | 3.72 | 1,617,085 | ||||||||
| Warrants Exercised | 223,461 | 3.10 | 3.10 | 692,729 | ||||||||
| Bonus Issuance Resolutions | 55,136 | 3.66 | 3.66 | 201,798 | ||||||||
| Mineral Property Acquisitions | 10,448 | 3.08 | 3.08 | 32,180 | ||||||||
| Balance, July 31, 2010 | 60,788,337 | |||||||||||
| Private Placement | 8,111,313 | 3.40 | 3.40 | 25,654,398 | ||||||||
| Warrants Exercised | 3,163,756 | 3.10 | 3.95 | 7,926,371 | ||||||||
| Options Exercised(2) | 1,024,206 | 0.33 | 3.67 | 3,525,524 | ||||||||
| Mineral Property Acquisitions | 225,000 | 3.21 | 3.21 | 722,250 | ||||||||
| Service Agreements | 174,725 | 2.53 | 7.00 | 754,782 | ||||||||
| Balance, July 31, 2011 | 73,487,337 | |||||||||||
| Equity Financing | 6,284,770 | 3.60 | 3.60 | 20,968,743 | ||||||||
| Mineral Property Acquisition | 4,520,669 | 2.29 | 3.90 | 15,957,832 | ||||||||
| Options Exercised(3) | 191,872 | 0.33 | 3.72 | 198,728 | ||||||||
| Database Acquisition | 159,236 | 3.21 | 3.21 | 511,148 | ||||||||
| Settlement of Convertible Debentures(4) | 128,508 | 3.18 | 3.96 | 699,340 | ||||||||
| Warrants Exercised | 112,451 | 3.10 | 4.25 | 355,392 | ||||||||
| Service Agreements | 50,000 | 2.95 | 4.02 | 167,374 | ||||||||
| Settlement of Accounts Payable | 40,312 | 3.93 | 3.93 | 158,426 | ||||||||
| Balance, July 31, 2012 | 84,975,155 | |||||||||||
(1) 190,000 options were exercised on a cashless basis resulting in 96,391 net shares issued.(2) 268,625 options were exercised on a cashless basis resulting in 123,581 net shares issued.(3) 115,000 options were exercised on a cashless basis resulting in 34,247 net shares issued.(4) Issuance value is calculated at the fair value of the convertible debentures on the settlement date.
F-26
Share Purchase Warrants
A continuity schedule of exercisable and outstanding share purchase warrants for the underlying common shares at July 31, 2012, and the changes during the year, is presented below:
| Number of | Weighted average | Weighted average remaining | |||||||
| Warrants | exercise price | contractual term (years) | |||||||
| Balance, July 31, 2009 | 8,540,819 | $ | 3.00 | 1.80 | |||||
| Issued | 222,926 | 3.45 | 2.00 | ||||||
| Exercised | (223,461 | ) | 3.10 | 0.68 | |||||
| Expired | (3,308,398 | ) | 3.17 | - | |||||
| Balance, July 31, 2010 | 5,231,886 | 2.90 | 1.41 | ||||||
| Issued | 4,055,659 | 3.95 | 1.00 | ||||||
| Exercised | (3,163,756 | ) | 2.51 | 0.18 | |||||
| Expired | (1,774,806 | ) | 3.10 | - | |||||
| Balance, July 31, 2011 | 4,348,983 | 3.57 | 0.79 | ||||||
| Issued | 1,276,280 | 9.36 | 0.75 | ||||||
| Exercised | (112,451 | ) | 3.16 | 1.32 | |||||
| Expired | (3,954,000 | ) | 4.90 | - | |||||
| Balance, July 31, 2012 | 1,558,812 | $ | 4.95 | 1.45 |
Stock Options
At July 31, 2012, the Company has two Stock Option Plans as follows:
F-27
A summary of stock options grant under the Company’s Stock Option Plans for Fiscal 2012 using the Black-Scholes option pricing model is presented below:
| Options | Exercise | Term | Expected | Risk-Free | Dividend | Expected | ||||||||||||||||||
| Date / Period | Issued | Price | (Years) | Fair Value | Life (Years) | Interest Rate | Yield | Volatility | ||||||||||||||||
| August 18, 2011 | 15,000 | $ | 3.15 | 10 | $ | 32,998 | 4 | 0.61% | 0.00% | 102.50% | ||||||||||||||
| September 26, 2011 | 1,005,000 | 2.78 | 10 | 2,070,098 | 4 | 0.65% | 0.00% | 112.05% | ||||||||||||||||
| Three months ended October 31, 2011 | 1,020,000 | 2,103,096 | ||||||||||||||||||||||
| November 2, 2011 | 10,000 | 3.15 | 10 | 20,823 | 4 | 0.63% | 0.00% | 94.77% | ||||||||||||||||
| November 3, 2011 | 15,000 | 3.34 | 10 | 34,991 | 4 | 0.65% | 0.00% | 102.47% | ||||||||||||||||
| November 7, 2011 | 20,000 | 3.21 | 10 | 47,606 | 4 | 0.63% | 0.00% | 112.23% | ||||||||||||||||
| January 10, 2012 | 10,000 | 3.05 | 10 | 20,605 | 4 | 0.53% | 0.00% | 97.83% | ||||||||||||||||
| January 16, 2012 | 50,000 | 3.43 | 10 | 126,743 | 4 | 0.57% | 0.00% | 111.71% | ||||||||||||||||
| Three months ended January 31, 2012 | 105,000 | 250,768 | ||||||||||||||||||||||
| May 4, 2012 | 100,000 | 2.70 | 10 | 182,955 | 4 | 0.57% | 0.00% | 98.20% | ||||||||||||||||
| May 16, 2012 | 10,000 | 2.25 | 10 | 14,567 | 4 | 0.57% | 0.00% | 92.17% | ||||||||||||||||
| May 23, 2012 | 50,000 | 2.25 | 10 | 61,981 | 4 | 0.45% | 0.00% | 91.17% | ||||||||||||||||
| Three months ended July 31, 2012 | 160,000 | 259,503 | ||||||||||||||||||||||
| Total | 1,285,000 | $ | 2,613,367 |
During Fiscal 2012, the weighted average fair value per option granted under the Company’s Stock Option Plans was $2.03.
In addition to the stock option grants presented in the above table, and as a result of the acquisition of Cue effective March 30, 2012, the Company issued the following options, which were not issued pursuant to, and are not subject to the terms and conditions of, the Company’s Stock Option Plans, in exchange for Cue stock options and broker options:
A continuity schedule of outstanding stock options for the underlying common shares at July 31, 2012, and the changes during the period, is presented below:
| Number of Stock | Weighted Average | Weighted Average | |||||||
| Options | Exercise Price | Remaining Contractual | |||||||
| Term (Years) | |||||||||
| Balance, July 31, 2009 | 5,280,500 | $ | 0.57 | 7.54 | |||||
| Issued | 2,897,500 | 2.65 | 10.00 | ||||||
| Exercised | (946,750 | ) | 0.55 | 7.45 | |||||
| Expired | (245,000 | ) | 1.46 | 3.23 | |||||
| Balance, July 31, 2010 | 6,986,250 | 1.41 | 7.67 | ||||||
| Issued | 2,824,500 | 2.77 | 10.00 | ||||||
| Exercised | (1,169,250 | ) | 1.73 | 7.84 | |||||
| Cancelled | (6,250 | ) | 0.45 | 8.00 | |||||
| Forfeited | (55,500 | ) | 2.73 | 9.00 | |||||
| Balance, July 31, 2011 | 8,579,750 | 1.79 | 7.40 | ||||||
| Issued | 1,372,521 | 3.00 | 9.29 | ||||||
| Exercised | (272,625 | ) | 1.93 | 6.21 | |||||
| Forfeited | (120,375 | ) | 3.18 | 9.08 | |||||
| Balance, July 31, 2012 | 9,559,271 | $ | 1.95 | 6.52 |
The aggregate intrinsic value under the provisions of ASC 718 of all outstanding options at July 31, 2012 was estimated at $5,267,333 (vested: $5,267,333 and unvested: $Nil).
F-28
As at July 31, 2012, unrecognized compensation cost related to non-vested stock options granted under the Company’s Stock Option Plans was $817,922, which is expected to be recognized over 1.34 years.
A summary of options outstanding and exercisable at July 31, 2012 is presented below:
| Options Outstanding | Options Exercisable | |||||||||||
| Range of Exercise Prices | Outstanding at | Weighted Average | Exercisable at | Weighted Average | ||||||||
| July 31, 2012 | Exercise Price | July 31, 2012 | Exercise Price | |||||||||
| $0.33 to $0.70 | 3,235,000 | $ | 0.40 | 3,235,000 | $ | 0.40 | ||||||
| $0.71 to $2.45 | 3,721,750 | 2.37 | 3,661,750 | 2.38 | ||||||||
| $2.46 to $23.08(5) | 2,602,521 | 3.28 | 2,006,273 | 3.37 | ||||||||
| 9,559,271 | $ | 1.95 | 8,903,023 | $ | 1.88 | |||||||
(5) Options include 48,748 options and 38,773 broker options issued in connection with the acquisition of Cue, which were not issued pursuant to, and are not subject to the terms and conditions of, the Company’s Stock Option Plans
Stock-Based Compensation
A summary of stock-based compensation expense for Fiscal 2012, 2011 and 2010 is presented below:
| Year Ended | Year Ended | Year Ended | |||||||
| July 31, 2012 | July 31, 2011 | July 31, 2010 | |||||||
| Stock-Based Consulting Fees | |||||||||
| Common stock issued for consulting services | $ | 167,374 | $ | 754,782 | $ | 1,617,085 | |||
| Common stock issued for bonuses | - | - | 58,482 | ||||||
| Options issued to consultants | 763,848 | 1,798,833 | 1,964,006 | ||||||
| 931,222 | 2,553,615 | 3,639,573 | |||||||
| Stock-Based Management Fees | |||||||||
| Common stock issued for bonuses | - | - | 26,564 | ||||||
| Options issued to management | 834,219 | 2,079,707 | 1,960,000 | ||||||
| 834,219 | 2,079,707 | 1,986,564 | |||||||
| Stock-Based Wages and Benefits | |||||||||
| Common stock issued for bonuses | - | - | 116,747 | ||||||
| Options issued to employees | 1,144,062 | 1,956,906 | 1,286,506 | ||||||
| 1,144,062 | 1,956,906 | 1,403,253 | |||||||
| Stock-based compensation charged to inventory | (166,813 | ) | (247,489 | ) | - | ||||
| $ | 2,742,690 | $ | 6,342,739 | $ | 7,029,390 |
NOTE 12: INCOME TAXES
At July 31, 2012, the Company had U.S. and Canadian net operating loss carry-forwards of approximately $61.9 million and Canadian dollar $6.5 million, respectively, that may be available to reduce future years’ taxable income. These carry-forwards will begin to expire, if not utilized, commencing in 2023. Future tax benefits which may arise as a result of these losses have not been recognized in these consolidated financial statements, as their realization has been determined not likely to occur and accordingly, the Company has recorded a full valuation allowance for the deferred tax asset relating to these tax loss carry-forwards.
The Company reviews its valuation allowance requirements on an annual basis based on projected future operations. When circumstances change resulting in a change in management’s judgement about the recoverability of future tax assets, the impact of the change on the valuation allowance will generally be reflected in current income.
F-29
A reconciliation of income tax computed at the federal and state statutory tax rates including the Company’s effective tax rate is as follows:
| Year Ended July 31, | |||||||||
| 2012 | 2011 | 2010 | |||||||
| Federal income tax provision rate | 35.00% | 35.00% | 35.00% | ||||||
| State income tax provision rate, net of federal income tax effect | 0.18% | 0.15% | 0.33% | ||||||
| Total income tax provision rate | 35.18% | 35.15% | 35.33% | ||||||
The actual income tax provisions differ from the expected amounts calculated by applying the combined federal and state corporate income tax rates to the Company’s loss before income taxes. The components of these differences are as follows:
| Year Ended July 31, | |||||||||
| 2012 | 2011 | 2010 | |||||||
| Loss before income taxes | $ | 25,145,508 | $ | 27,358,095 | $ | 14,478,669 | |||
| Corporate tax rate | 35.18% | 35.15% | 35.33% | ||||||
| Expected tax recovery | 8,846,190 | 9,616,370 | 5,115,314 | ||||||
| (Increase) decrease resulting from | |||||||||
| Foreign tax rate differences | (660,185 | ) | (129,492 | ) | (267,337 | ) | |||
| Permanent differences | (864,911 | ) | (1,018,966 | ) | (600,461 | ) | |||
| Prior year true-up | 723,571 | 162,911 | 122,451 | ||||||
| State tax rate true-up | 59,559 | (83,520 | ) | (468,869 | ) | ||||
| Foreign loss true-up | - | (487,224 | ) | (547,449 | ) | ||||
| Other | (2,207 | ) | 18,574 | - | |||||
| Change in valuation allowance | (8,021,670 | ) | (8,069,592 | ) | (3,355,682 | ) | |||
| Tax adjustment from operations | 80,347 | 9,061 | (2,033 | ) | |||||
| Unrealized (loss) gain, other comprehensive income | (18,559 | ) | (9,061 | ) | 2,033 | ||||
| Deferred income tax benefit | $ | 61,788 | $ | - | $ | - | |||
The Company has incurred taxable losses for all years since inception and accordingly, no provision for current income taxes has been recorded for the current or any prior fiscal year. During Fiscal 2012, the Company recorded a deferred income tax benefit of $61,788 on the consolidated statements of operations.
The components of loss (income) from continuing operations before income taxes, by tax jurisdiction, were as follows:
| Year Ended July 31, | |||||||||
| 2012 | 2011 | 2010 | |||||||
| United States | $ | 22,586,744 | $ | 26,063,172 | $ | 20,424,785 | |||
| Canada | (101,683 | ) | 1,294,923 | 2,587,965 | |||||
| Paraguay | 2,660,447 | - | - | ||||||
| $ | 25,145,508 | $ | 27,358,095 | $ | 23,012,750 | ||||
F-30
The Company’s deferred tax assets (liabilities) are as follows:
| July 31, 2012 | July 31, 2011 | |||||
| Deferred tax assets | ||||||
| Mineral property acquisitions | $ | 914,808 | $ | 655,819 | ||
| Exploration costs | 8,108,525 | 3,558,500 | ||||
| Stock option expense | 4,035,761 | 2,878,468 | ||||
| Depreciable property | 278,816 | 216,250 | ||||
| Charitable donations | 30,273 | 22,024 | ||||
| Other | 621,198 | 678,958 | ||||
| Loss carry forward | 23,367,561 | 20,362,187 | ||||
| 37,356,942 | 28,372,206 | |||||
| Valuation allowance | (37,364,728 | ) | (28,361,440 | ) | ||
| Deferred tax assets | (7,784 | ) | 10,766 | |||
| Deferred tax assets (liabilities), other comprehensive income | 7,784 | (10,766 | ) | |||
| Net deferred tax assets | - | - | ||||
| Deferred tax liabilities | ||||||
| Mineral property acquisition | (791,939 | ) | - | |||
| Net deferred tax liabilities | $ | (791,939 | ) | $ | - |
As the criteria for recognizing future income tax assets have not been met due to the uncertainty of realization, a valuation allowance of 100% has been recorded for the current and prior years.
The Company’s U.S. net operating loss carry-forwards expire as follows:
For U.S. federal income tax purposes, a change in ownership under IRC Section 382 may have occurred in a prior year. If an ownership change has occurred, the utilization of these losses against future income would be subject to an annual limitation. The annual limitation would be equal to the value of the Company immediately prior to the change in ownership multiplied by the IRC Section 382 rate in effect during the month of the change.
The Company’s Canadian net operating loss carry-forwards in Canadian dollars expire as follows:
F-31
NOTE 13: SEGMENTED INFORMATION
The Company currently operates in a single reportable segment and is focused on uranium mining and related activities, including exploration, pre-extraction, extraction and processing of uranium concentrates.
As July 31, 2012, long-term assets located in the U.S. were $44,030,506, or 77% of the Company’s total long-term assets of $57,219,194. During Fiscal 2012, the Company completed three sales of uranium concentrates in the U.S. to two customers comprising all of the Company’s external revenue source.
The table below provides a breakdown of the Company’s long-term assets by geographic segment:
| July 31, 2012 | ||||||||||||||||||
| United States | ||||||||||||||||||
| Balance Sheet Items | Texas | Arizona | Other States | Canada | Paraguay | Total | ||||||||||||
| Mineral Rights and Properties | $ | 17,823,405 | $ | 10,612,052 | $ | 1,078,907 | $ | - | $ | 13,080,556 | $ | 42,594,920 | ||||||
| Property, Plant and Equipment | 8,919,784 | 7,331 | 45,987 | 63,476 | 44,656 | 9,081,234 | ||||||||||||
| Reclamation Deposits | 5,527,227 | 15,000 | 813 | - | - | 5,543,040 | ||||||||||||
| Loan Receivable | - | - | - | - | - | - | ||||||||||||
| Total Long-term Assets | $ | 32,270,416 | $ | 10,634,383 | $ | 1,125,707 | $ | 63,476 | $ | 13,125,212 | $ | 57,219,194 | ||||||
| July 31, 2011 | ||||||||||||||||||
| United States | ||||||||||||||||||
| Balance Sheet Items | Texas | Arizona | Other States | Canada | Paraguay | Total | ||||||||||||
| Mineral Rights and Properties | $ | 15,195,697 | $ | 698,241 | $ | 1,066,566 | $ | - | $ | 880,579 | $ | 17,841,083 | ||||||
| Property, Plant and Equipment | 8,614,831 | - | 14,386 | 73,196 | - | 8,702,413 | ||||||||||||
| Reclamation Deposits | 4,594,489 | 15,000 | 811 | - | - | 4,610,300 | ||||||||||||
| Loan Receivable | 300,000 | - | - | - | - | 300,000 | ||||||||||||
| Total Long-term Assets | $ | 28,705,017 | $ | 713,241 | $ | 1,081,763 | $ | 73,196 | $ | 880,579 | $ | 31,453,796 | ||||||
F-32
The table below provides a breakdown of the Company’s operating results by geographic segment. All intercompany transactions have been eliminated.
| Year ended July 31, 2012 | ||||||||||||||||||
| United States | ||||||||||||||||||
| Statement of Operations | Texas | Arizona | Other States | Canada | Paraguay | Total | ||||||||||||
| Sales | $ | 13,757,400 | $ | - | $ | - | $ | - | $ | - | $ | 13,757,400 | ||||||
| Cost of sales | 8,112,040 | - | - | - | - | 8,112,040 | ||||||||||||
| Gross profit | 5,645,360 | - | - | - | - | 5,645,360 | ||||||||||||
| Mineral property expenditures | 11,429,645 | 465,131 | 209,067 | - | 2,834,879 | 14,938,722 | ||||||||||||
| General and administrative | 9,113,348 | 340,879 | 349,203 | 4,179,124 | 54,420 | 14,036,974 | ||||||||||||
| Depreciation, amortization and accretion | 1,105,190 | 1,769 | 110,853 | 49,273 | 8,472 | 1,275,557 | ||||||||||||
| Impairment loss on mineral properties | - | - | - | - | - | - | ||||||||||||
| Other (income) and expenses | 387,344 | 195,342 | - | (11,634 | ) | (31,437 | ) | 539,615 | ||||||||||
| Loss from continuing operations before income taxes | $ | (16,390,167 | ) | $ | (1,003,121 | ) | $ | (669,123 | ) | $ | (4,216,763 | ) | $ | (2,866,334 | ) | $ | (25,145,508 | ) |
| Year ended July 31, 2011 | ||||||||||||||||||
| United States | ||||||||||||||||||
| Statement of Operations | Texas | Arizona | Other States | Canada | Paraguay | Total | ||||||||||||
| Sales | $ | - $ | - | $ | - | $ | - | $ | - | $ | - | |||||||
| Cost of sales | - | - | - | - | - | - | ||||||||||||
| Gross profit | - | - | - | - | - | - | ||||||||||||
| Mineral property expenditures | 10,899,201 | 67,035 | 202,952 | - | 250,992 | 11,420,180 | ||||||||||||
| General and administrative | 10,910,502 | 1,428 | 253,184 | 3,991,219 | 30,733 | 15,187,066 | ||||||||||||
| Depreciation, amortization and accretion | 997,715 | - | 121,718 | 36,526 | - | 1,155,959 | ||||||||||||
| Impairment loss on mineral properties | 128,339 | - | 15,057 | - | - | 143,396 | ||||||||||||
| Other (income) and expenses | (548,501 | ) | - | - | (5 | ) | - | (548,506 | ) | |||||||||
| Loss from continuing operations before income taxes | $ | (22,387,256 | ) | $ | (68,463 | ) | $ | (592,911 | ) | $ | (4,027,740 | ) | $ | (281,725 | ) | $ | (27,358,095 | ) |
| Year ended July 31, 2010 | ||||||||||||||||||
| United States | ||||||||||||||||||
| Statement of Operations | Texas | Arizona | Other States | Canada | Paraguay | Total | ||||||||||||
| Sales | $ | - $ | - | $ | - | $ | - | $ | - $ | - | ||||||||
| Cost of sales | - | - | - | - | - | - | ||||||||||||
| Gross profit | - | - | - | - | - | - | ||||||||||||
| Mineral property expenditures | 6,284,294 | 36,011 | 118,409 | - | - | 6,438,714 | ||||||||||||
| General and administrative | 12,226,413 | 45 | 355,388 | 2,572,483 | - | 15,154,329 | ||||||||||||
| Depreciation, amortization and accretion | 619,386 | - | 159,744 | 15,374 | - | 794,504 | ||||||||||||
| Impairment loss on mineral properties | 31,800 | - | 11,800 | - | - | 43,600 | ||||||||||||
| Other (income) and expenses | 582,227 | - | - | (624 | ) | - | 581,603 | |||||||||||
| Loss from continuing operations before income taxes | $ | (19,744,120 | ) $ | (36,056 | ) | $ | (645,341 | ) | $ | (2,587,233 | ) | $ | - $ | (23,012,750 | ) | |||
F-33
NOTE 14: SUPPLEMENTAL CASH FLOW INFORMATION
| July 31, 2012 | July 31, 2011 | July 31, 2010 | |||||||
| Cash and Cash Equivalents Consist of: | |||||||||
| Cash in bank | $ | 25,015,284 | $ | 4,049,131 | $ | 3,032,802 | |||
| Term deposits | - | 26,674,920 | 18,034,860 | ||||||
| $ | 25,015,284 | $ | 30,724,051 | $ | 21,067,662 |
During Fiscal 2012, the Company issued 159,236 restricted common shares of the Company with a fair value of $511,148 to purchase certain database covering the Goliad formation from Uranium One Inc.
During Fiscal 2012, as a result of the merger with Concentric, the Company issued 1,603,440 shares and share purchase warrants to purchase 375,834 shares with an aggregate fair value of $5,195,797. Additionally, the Company settled with certain Series “A” and “B” convertible debenture holders through a shares-for-debt arrangement whereby a total 128,508 shares with a fair value of $699,340 were issued.
During Fiscal 2012, the Company issued a total 40,312 shares of common stock with a fair value of $158,426 as full settlements for a total $129,000 owed to two former directors of Concentric.
During Fiscal 2012, the Company issued 300,000 shares with a fair value of $915,000 for the acquisition of the Workman Creek Project.
During Fiscal 2012, the Company received 750,000 shares of Kaboko with a fair value of $15,600 which was applied against the capitalized costs of the Todilto Project.
During Fiscal 2012, the Company issued 100,000 shares with a fair value of $229,000 for the acquisition of a further two prospecting permits at the Coronel Oviedo Project.
During Fiscal 2012, in connection of the acquisition of Cue, the Company issued a total 2,517,229 shares, share purchase warrants to purchase 900,446 shares, stock options to purchase 48,748 shares and broker options to purchase 38,773 shares with an aggregate fair value of $9,992,244.
NOTE 15: COMMITMENTS AND CONTINGENCIES
The Company is renting or leasing various office or storage space located in the United States, Canada and Paraguay with total monthly payments of $19,732. Office lease agreements expire between October 2012 and August 2013 for the United States and Canada. The Company also has various consulting agreements which will expire in less than one year.
The aggregate minimum payments over the next five years are as follows:
The Company is committed to pay its key executives a total of $803,386 per year for management services.
The Company entered into a multi-year uranium sales contract in June 2011, as amended in January 2012, requiring the delivery of a total 320,000 pounds of U3O8by the Company over a three-year period starting in August 2011. The sales price will be based on published market price indicators at the time of delivery. During Fiscal 2012, the Company fulfilled its first-year delivery obligations under this contract.
F-34
On or about February 23, 2011, the Company received notification of a lawsuit filed in the State of Texas, in the County Court of Law No. 4 for Nueces County, against the Company by Everest Exploration, Inc. (“Everest”) for an unspecified amount relating to the Asset Purchase Agreement dated November 23, 2009 and effective December 18, 2009 (the “Purchase Agreement”) for the acquisition of South Texas Mining Venture, L.L.P. (“STMV”). Pursuant to the terms of the Purchase Agreement, should actual reclamation costs incurred by the Company on the Mt. Lucas Property, a prior producing project, be less than $2.2 million in total, Everest alleges that it would be entitled to the difference as a cash payment, subject to the prior receipt by STMV of a clearance certificate from the Texas Commission on Environmental Quality (“TCEQ”). The Company believes it has complied with all of the terms under the Purchase Agreement and that no such cash payment is required as the actual reclamation costs associated with the Mt. Lucas Property and incurred by the Company are greater than $2.2 million. Furthermore, the clearance certificate to be provided from the TCEQ has not been issued. On August 12, 2011, a written discovery request was filed by Everest to which the Company responded in full and to which no further response from Everest has been received. The Company intends to vigorously defend against any and all claims under this lawsuit. Any potential judgment against the Company and awarded to the claimant is expected to be immaterial.
On or about May 25, 2012, the Company filed a lawsuit in the State of Texas, in the 94th Judicial District Court for Nueces County, against Everest, Everest Resource Company, Thomas M. Crain, Jr. and James T. Clark (collectively, the “Everest Group”) for an unspecified amount of damages as a result of claimed material breaches of their representations, warranties and covenants under the Purchase Agreement. On or about June 19, 2012, the Company received notification of a counterclaim filed by the Everest Group disputing the Company’s claims and asserting certain claims for an unspecified amount of damages as a result of claimed material breaches of the Company’s representations, warranties and covenants under the Purchase Agreement. The Company intends to vigorously defend against any and all claims under this lawsuit. Any potential judgment against the Company and awarded to the claimant is expected to be immaterial.
On or about April 3, 2012, the Company received notification of a lawsuit filed in the State of Arizona, in the Superior Court for the County of Yavapai, by certain Petitioners (the “Plaintiffs”) against a group of defendants, including the Company and former management and board members of Concentric. The lawsuit asserts certain claims relating to the Plaintiffs’ equity investments in Concentric, including allegations that the former management and board members of Concentric engaged in various wrongful acts prior to and/or in conjunction with the merger of Concentric. The lawsuit further alleges that the Company is contractually liable for liquidated damages arising from a pre-merger transaction which the Company previously acknowledged and recorded as an accrued liability. Subsequent to July 31, 2012, the Company paid the liquidated damages portion of the lawsuit in full by a cash payment of $149,194 to the Plaintiffs. The Company intends to vigorously defend against any and all remaining claims asserted under this lawsuit. Any potential judgment against the Company and awarded to the claimant is expected to be immaterial.
On or about May 17, 2012, the Company received notification of a lawsuit filed in the State of Texas, in the 229th District Court of Duval County, by an employee of a contractor hired by the Company against a group of defendants, including the Company and the contractor, for unspecified damages as a result of injuries suffered by the plaintiff while on the Company's premises. The contractor’s general liability insurer has confirmed that it will defend and indemnify the Company against this lawsuit subject to available limits under the contractor’s policy.
F-35
URANIUM ENERGY CORP.
URANIUM ENERGY CORP. | |||
| By: | /s/Amir Adnani | ||
Amir Adnani, President, Chief Executive Officer and Director | |||
| (Principal Executive Officer) | |||
| Date: | |||
In accordance with the Exchange Act, this report has been signed below by the following persons on behalf of the registrant and in the capacities and on the dates indicated.
| April 2, 2024. | ||
