UNITED STATES
SECURITIES AND EXCHANGE COMMISSION
Washington, D.C. 20549
FORM 10-K/A
AMENDMENT NO. 110-K
(Mark One)
|
x | | |
| ý | ANNUAL REPORT PURSUANT TO SECTION 13 OR 15(d) OF THE SECURITIES EXCHANGE ACT OF 1934 |
For the fiscal year ended AugustDecember 31, 20142017
OR
|
| | |
| o | TRANSITION REPORT PURSUANT TO SECTION 13 OR 15(d) OF THE SECURITIES EXCHANGE ACT OF 1934 |
For the transition period from __________________________________________ to __________________________________________
Commission file number: 001-35245
SYNERGY RESOURCES CORPORATION
SRC ENERGY INC.
(Exact name of registrant as specified in its charter)
COLORADO
|
|
|
| COLORADO | 20-2835920 |
| (State or other jurisdiction of incorporation or organization) | (I.R.S. Employer Identification No.) |
20203 Highway 60, Platteville, CO
| 80651
|
(Address | |
| 1675 Broadway, Suite 2600, Denver, CO | 80202 |
| (Address of principal executive offices) | (Zip(Zip Code) |
Registrant's telephone number, including area code: (970) 737-1073(720) 616-4300
Securities registered pursuant to Section 12(b) of the Act:
|
| | |
| Title of each class | | Name of each exchange on which registered |
Common Stock | | NYSE MKT AMERICAN |
Indicate by check mark if the registrant is a well-known seasoned issuer, as defined in Rule 405 of the Securities Act. Yes ý No o No x
Indicate by check mark if the registrant is not required to file reports pursuant to Section 13 or Section 15(d) of the Act. Yes o No xý
Indicate by check mark whether the registrant (1) has filed all reports to be filed by Section 13 or 15(d) of the Securities Exchange Act of 1934 during the preceding 12 months (or for such shorter period that the registrant was required to file such reports), and (2) has been subject to such filing requirements for the past 90 days. Yes xý No o
Indicate by check mark whether the registrant has submitted electronically and posted on its corporate Website, if any, every Interactive Data File required to be submitted and posted pursuant to Rule 405 of Regulations S-T (§232.405 of this chapter) during the preceding 12 months (or for such shorter period that the registrant was required to submit and post such filing)files). Yes xý No o
Indicate by check mark if disclosure of delinquent filers pursuant to Item 405 of Regulation S-K (§229.405 of this chapter) is not contained herein, and will not be contained, to the best of Registrant's knowledge, in definitive proxy or information statements incorporated by reference in Part III of this Form 10-K or any amendment to this Form 10-K. xý
Indicate by check mark whether the registrant is a large accelerated filer, an accelerated filer, a non-accelerated filer, or a smaller reporting company, or an emerging growth company. See the definitions of “large"large accelerated filer,” “accelerated filer”" "accelerated filer," "smaller reporting company," and “smaller reporting company”"emerging growth company" in Rule 12b-2 of the Exchange Act.
|
| |
Large accelerated filer xý | Accelerated filer o |
| | |
Non-accelerated filer o (Do not check if a smaller reporting company) | Smaller reporting company o |
| |
| Emerging growth company o |
If an emerging growth company, indicate by check mark if the registrant has elected not to use the extended transition period for complying with any new or revised financial accounting standards provided pursuant to Section 13(a) of the Exchange Act. o
Indicate by check mark whether the registrant is a shell company (as defined in Rule 12b-2 of the Act): Yes oNo xý
The aggregate market value of the voting stock held by non-affiliates of the registrant, based upon the closing sale price of the registrant’s common stock on February 28, 2014,June 30, 2017, was approximately $704 million.$1.0 billion. Shares of the registrant’s common stock held by each officer and director and each person known to the registrant to own 10% or more of the outstanding voting power of the registrant have been excluded in that such persons may be deemed to be affiliates. This determination of affiliate status is not a determination for other purposes.
As of October 10, 2014,February 19, 2018, the Registrant had 79,293,688241,786,159 issued and outstanding shares of common stock.
DOCUMENTS INCORPORATED BY REFERENCE
We hereby incorporate by reference into this document the information required by Part III of this Form, which will appear in our definitive proxy statement to be filed pursuant to Regulation 14A for our 2018 Annual Meeting of Stockholders.
Explanatory Note
SRC ENERGY INC.
Index
This Amendment No. 1 to the Synergy Resources Corporation (the “Company”) Annual Report on Form 10-K for the year ended August 31, 2014, reflects revisions to the tabulations
|
| | | |
| | | Page |
| PART I | | |
| Item 1. | Business | | |
| Item 1A. | Risk Factors | | |
| Item 1B. | Unresolved Staff Comments | | |
| Item 2. | Properties | | |
| Item 3. | Legal Proceeding | | |
| Item 4. | Mine Safety Disclosures | | |
| | | |
| PART II | | | |
| Item 5. | Market for Registrant's Common Equity, Related Stockholder Matters, and Issuer Purchases of Equity Securities | | |
| Item 6. | Selected Financial Data | | |
| Item 7. | Management's Discussion and Analysis of Financial Condition and Result of Operations | | |
| Item 7A. | Quantitative and Qualitative Disclosures About Market Risks | | |
| Item 8. | Financial Statements and Supplementary Data | | |
| Item 9. | Changes in and Disagreements with Accountants on Accounting and Financial Disclosure | | |
| Item 9A. | Controls and Procedures | | |
| Item 9B. | Other Information | | |
| | | |
| PART III | | |
| Item 10. | Directors, Executive Officers, and Corporate Governance | | |
| Item 11. | Executive Compensation | | |
| Item 12. | Security Ownership of Certain Beneficial Owners and Management and Related Stockholder Matters | | |
| Item 13. | Certain Relationships and Related Transactions and Director Independence | | |
| Item 14. | Principal Accounting Fees and Services | | |
| | | |
| PART IV | | | |
| Item 15. | Exhibits, Financial Statement Schedules | | |
| | | |
| SIGNATURES | | |
| | |
| GLOSSARY OF UNITS OF MEASUREMENT AND INDUSTRY TERMS | | |
PART I
Glossary of Units of Measurements and descriptionsIndustry Terms
Units of “PV-10” (a non-GAAP measure) in Item 1 originally presentedmeasurements and industry terms are defined in the Company’s 10-K forGlossary of Units of Measurements and Industry Terms, included at the year August 31, 2014 filed on October 30, 2014. These revisions more clearly indicate that certain disclosures represent PV-10 and provides a reconciliationend of PV-10 disclosures to standardized oil and gas measures (the most similar GAAP measure). Likewise, the narratives addressing future cash flows from proved reserves have been revised to maintain consistency with corresponding disclosures in the Notes to the Financial Statements as presented in Item 8 herein.
Except as described above, this amendment does not revise or restate the financial statements or other disclosures included in the original Form 10-K. This amendment does not reflect events occurring after the filing of the original Form 10-K or modify or update disclosures related to subsequent events. Accordingly, this amendment should be read in conjunction with our filings with the SEC subsequent to the filing of the original Form 10-K.
PART Ireport.
Cautionary Statement Concerning Forward-Looking Statements
This report contains “forward-looking statements” within the meaning of the Private Securities Litigation Reform Act of 1995. These statements are subject to risks and uncertainties and are based on the beliefs and assumptions of management and information currently available to management. The use of words such as “believes”, “expects”, “anticipates”, “intends”, “plans”, “estimates”, “should”, “likely”“believes,” “expects,” “anticipates,” “intends,” “plans,” “estimates,” “should,” “likely,” or similar expressions indicates aindicate forward-looking statement.statements. Forward-looking statements included in this report include statements relating to future capital expenditures and projects, the adequacy and nature of future sources of financing, possible future impairment charges, midstream capacity issues, future differentials, and future production relative to volume commitments.
The identification in this report of factors that may affect our future performance and the accuracy of forward-looking statements is meant to be illustrative and by no means exhaustive. All forward-looking statements should be evaluated with the understanding of their inherent uncertainty.
FactorsImportant factors that could cause our actual results to differ materially from those expressed or implied by forward-looking statements include, but are not limited to:
volatility ofdeclines in oil and natural gas prices;
operating hazards that result in losses;adversely affect our ability to conduct business;
uncertainties in the estimates of proved reserves;
the availability and capacity of gathering systems, pipelines, and other midstream infrastructure for our production;
the effect of seasonal weather conditions and wildlife and plant species restrictions on our operations;
our needability to expand ourfund, develop, produce, and acquire additional oil and natural gas reserves;reserves that are economically recoverable;
our ability to obtain adequate financing;
availability and capacity of gathering systems and pipelines for our production;
the effect of local and regional factors on oil and natural gas prices;
incurrence of ceiling test write-downs;
our inability to control operations on properties that we do not operate;
our ability to market our production;
the strength and financial resources of our competitors;
our ability to successfully identify, execute, and integrate acquisitions, including the GCII Acquisition;
the effect of federal, state, and local laws and regulations;
identifying future acquisitions;
uncertainty in global economic conditions;
legal and/the effects of, including costs to comply with, environmental legislation or regulatory compliance requirements;
initiatives, including those related to hydraulic fracturing;our ability to market our production;
the effects of local moratoria or bans on our business;
the effect of environmental liabilities;
the effect of the adoption and implementation of statutory and regulatory requirements for derivative transactions;
changes in U.S. tax laws;
our ability to satisfy our contractual obligations and commitments;
the amount of our indebtedness and our ability to maintain compliance with debt covenants;
key executives allocating a portion of their time to other business interests; and
the effectiveness of our disclosure controls and our internal controls over financial reporting.
reporting;the geographic concentration of our principal properties;
our ability to protect critical data and technology systems;
the availability of water for use in our operations; and
the risks and uncertainties described and referenced in "Risk Factors."
Note Regarding Change in Reserves and Production Volumes
As of January 1, 2017, our natural gas processing agreements with DCP Midstream, L.P. ("DCP Midstream") had been modified to allow us to take title to the NGLs resulting from the processing of our natural gas. Based on this, we began reporting reserves, sales volumes, prices, and revenues for natural gas and NGLs separately for periods after January 1, 2017. For periods
prior to January 1, 2017, we did not separately report reserves, sales volumes, prices, and revenues for NGLs as we did not take title to these NGLs. Instead, the value attributable to these unrecognized NGL volumes was included within natural gas revenues as an increase to the overall price received. This change impacts the comparability of 2017 with prior periods.
Note Regarding Change in Fiscal Year
In February 2016, the Company changed its fiscal year-end to December 31 from August 31. Certain information in this report is presented as of and for the fiscal years ended August 31, 2015, 2014, and 2013.
ITEM 1. BUSINESS
Overview
Overview
We areSRC Energy Inc. ("we," "us," "our," "SRC," or the "Company") is an independent oil and natural gas operator focused oncompany engaged in the acquisition, development, exploitation, exploration and production of oil, and natural gas, properties primarily locatedand NGLs in the Denver-Julesburg Basin (“D-J Basin”), which we believe to be one of the premier, liquids-rich oil and natural gas resource plays in northeast Colorado. We have concentrated onthe United States. It contains hydrocarbon-bearing deposits in several formations, including the Niobrara, Codell, Greenhorn, Shannon, Sussex, J-Sand, and D-Sand. The area has produced oil and natural gas for over fifty years and benefits from established infrastructure including midstream and refining capacity, long reserve life, and multiple service providers.
Our drilling and completing wells locatedcompletion activities are focused in the Wattenberg Field, predominantly in Weld County, Colorado, an area withinthat covers the western flank of the D-J Basin, which has a prolific production history. We serveBasin. Currently, we are focused on the horizontal development of the Codell formation as well as the operator for mostthree benches of ourthe Niobrara formation, all of which are characterized by relatively high liquids content.
In order to maintain operational focus while preserving developmental flexibility, we strive to attain operational control of a majority of the wells and focus our efforts on those prospects in which we have a significantworking interest. We currently operate approximately 78% of our proved producing reserves and anticipate operating substantially all of our future net revenue interest. Fordrilling locations.
During the prospectsyear ended December 31, 2017, we continued to execute our plans for growth through development of our existing oil and gas properties and strategic acquisitions of leasehold and producing properties. Most notably, in whichDecember 2017, we own a minority mineral interest, we participate with other companies that drillclosed on the acquisition of certain undeveloped land and operate wells.
We commenced active operationsnon-operated production in the D-J BasinGreeley-Crescent development area in 2008. ForWeld County for $569.5 million, comprised of $568.1 million in cash and the first four yearsassumption of active operations, our focus was primarily on participatingcertain liabilities. The transaction included approximately 30,200 net acres and approximately 2,500 BOE net daily production from the acquired non-operated properties. The acquired acreage represents a significant increase in the Company’s leasehold and completing vertical wells. Beginningdrillable locations in fiscal 2013, our focus shifted towards drilling and completing horizontal wells. Our use of the term horizontal well includes wells where the productive length of the wellbore is drilled more or less horizontal to the earth’s surface, to intersect the target formation on a parallel basis. In contrast, the term vertical well includes directional wells that are drilled at an angle toward a target area and where the productive length of the wellbore intersects the target formation on a perpendicular basis. The productive length of the wellbore in a horizontal well is much greater than the productive length of a vertical well, whichGreeley-Crescent area. Combined with SRC’s existing acreage, this results in a longer wellboreconsolidated core position of approximately 88,300 net acres. This contiguous footprint creates further opportunities to drive operational efficiencies with over 1,700 identified gross well locations with predominantly mid- and a higher completion volume. long-lateral design.
As of AugustDecember 31, 2014,2017, we had completed, participated in or otherwise acquired an interest in 404 gross (284 net) producing oil and gas wells, of which 334 gross (250 net) were vertical wells and 70 gross (34 net) were horizontal wells. We are the operator of 300572 gross (551 net) producing wells, and participate with other operatorsof which 227 gross (218 net) are Codell or Niobrara horizontal wells. The Company has also participated as a non-operator in 104442 gross (99 net) producing wells. In addition, to the wells that had reached productive status at the end of our fiscal year, there are 53were 51 gross (14(47 net) operated wells in various stages of drilling or completion as of AugustDecember 31, 2014.2017, which excludes 19 gross (16 net) wells for which we have only set surface casings.
OurFor the year ended December 31, 2017, 2016 and 2015, our average net daily production increased significantly during fiscal 2014 as new horizontal wells commenced productive operations. Our average production rate for fiscal 2014 was 4,290 barrels34,194 BOED, 11,670 BOED, and 9,548 BOED, respectively. As of oil equivalent per day (“BOED”). During fiscal 2013, our average production rate was 2,117 BOED. More significantly, our production rate for the fourth quarter of 2014 was 5,894 BOED, compared to 2,479 BOED during the fourth quarter of 2013. By the end of 2014,December 31, 2017, over 80%98% of our daily production was from horizontal wells. At the beginning of 2014, less than 10% of ouroperated production was from horizontal wells.
During fiscal 2014, we also continued to increase our estimated reserves and mineral leasehold acres. At August 31, 2014, our estimated net proved oil and gas reserves, as prepared by our independent reserve engineering firm, Ryder Scott Company, L.P., were 16.3 MMBbls of oil and condensate and 95.2 Bcf of natural gas. As of August 31, 2014, we had 451,000 gross and 309,000 net acres under lease, substantially all of which are located in the D-J Basin. We further classify our acreage into specific areas, including Wattenberg Field (46,000 gross and 31,000 net acres), Northern Extension Area (122,000 gross and 26,000 net acres), Eastern Colorado (90,000 gross and 64,000 net acres), and Western Nebraska (185,000 gross and 183,000 net acres). In addition to the approximately 31,000 net developed and undeveloped acres that we hold in the Wattenberg Field, we hold approximately 26,000 undeveloped acres in an area directly to the north and east of the Wattenberg Field that is considered the Northern Extension area. We are currently permitting twelve wells targeting the Greenhorn formation on our leasehold in this area and plan to spud the first well in early calendar year 2015. We have a significant leasehold of undeveloped acreage in western Nebraska. We have entered into a joint exploration agreement with a private operating company based in Denver to drill up to ten wells in this area. We expect drilling activities to commence in Nebraska before December 31, 2014. We also have mineral assets in Yuma and Washington Counties, Colorado that are in an area that has a history of dry gas production from the Niobrara formation.
Business Strategy
Our primary objective is to enhance shareholder value by increasing our net asset value, net reserves, and cash flow through acquisitions, development, exploitation, exploration, and divestitureacquisitions of oil and gas properties. We intend to follow a balanced risk strategy by allocating capital expenditures in a combination ofto lower risk development and exploitation activities and higher potential exploration prospects.activities. Key elements of our business strategy include the following:
· | Concentrate on our existing core area in and around the D-J Basin, where we have significant operating experience. All of our current wells are located within the D-J Basin and our undeveloped acreage is located either in or adjacent to the D-J Basin.Concentrate on our existing core area in the D-J Basin, where we have significant operating experience. All of our current wells and our proved undeveloped acreage are located either in or adjacent to the Wattenberg Field, and we seek to acquire developed and undeveloped oil and gas properties in the same area. Focusing our operations in this area leverages our management, technical, and operational experience in the basin. |
· | Develop and exploit existing oil and natural gas properties. Since inception our principal growth strategy has been to develop and exploit our acquired and leased properties to add proved reserves. In the Wattenberg Field, we target three benches of the Niobrara, and the Codell formations for horizontal drilling and production. Our plans focus on horizontal development of our assets in the Wattenberg Field as we believe horizontal drilling is the most efficient manner to recover the potential hydrocarbons. We consider the Wattenberg Field to be relatively low-risk because information gained from the large number of existing wells can be applied to potential wells. There is enough similarity between wells in the Field that the exploitation process is generally repeatable.
|
2Develop and exploit existing oil and gas properties. Our principal growth strategy has been to develop and exploit our properties to add reserves. In the Wattenberg Field, we target three benches of the Niobrara formation as well as the Codell formation for horizontal drilling and production. We believe horizontal drilling is the most efficient way to recover the potential hydrocarbons and consider the Wattenberg Field to be relatively low-risk because information gained from the large number of existing wells can be applied to potential future wells. There is enough similarity between wells in the Wattenberg Field that the exploitation process is generally repeatable.
· | Improve hydrocarbon recovery through increased well density.
Use the latest technology to maximize returns and improve hydrocarbon recovery. Our development objective for individual well optimization is to drill and complete wells with lateral lengths of 7,000' to 10,000'. Utilizing petrophysical
and seismic data, a 3-D model is developed for each leasehold section to assist in determining optimal wellbore placement, well spacing, and stimulation design. This process is augmented with formation-specific drilling and completion execution designs and coupled with localized production results to implement a continuous improvement philosophy in optimizing the value per acre of our leasehold throughout our development program.
Operate in a safe manner and seek to minimize our impact on surrounding stakeholders. While our scale of operations has increased significantly, we continue to focus on maintaining a safe workplace for our employees and contractors. Further, as technology for resource development has advanced, we seek to utilize best industry practices to meet or exceed regulatory requirements while reducing our impacts on neighboring communities. Use best available geological practices to determine optimum recovery area for each well. We have identified 932 potential horizontal wells in the Niobrara and Codell formations on existing Wattenberg acreage based on 21 wells per 640 acre sections and over 800 potential horizontal well locations in the Greenhorn and Niobrara formations in the Northern Wattenberg extension area in the D-J Basin. |
· | Complete selective acquisitions.Retain control over the operation of a substantial portion of our production. As operator of a majority of our wells and undeveloped acreage, we control the timing and selection of new wells to be drilled. This allows us to modify our capital spending as our financial resources and underlying lease terms allow and market conditions permit.
Maintain financial flexibility while focusing on operational cost control. We strive to be a cost-efficient operator and to maintain a relatively low utilization of debt, which enhances our financial flexibility. Our high degree of operational control, as well as our focus on operating efficiencies and short return on investment cycle times, is central to our operating strategy.
Acquire and develop assets near established infrastructure. We have made acquisitions of contiguous acreage and aligned our development plans where technically-capable, financially-stable midstream companies have existing assets and plans for additional investment. We work collaboratively with these companies to proactively identify expansion opportunities that complement our development plans while reducing truck traffic. We seek to acquire undeveloped and producing oil and gas properties, primarily in the D-J Basin and certain adjacent areas. We will seek acquisitions of undeveloped and producing properties that will provide us with opportunities for reserve additions and increased cash flow through production enhancement and additional development and exploratory prospect generation opportunities. |
· | Retain control over the operation of a substantial portion of our production. As operator on a majority of our wells and undeveloped acreage, we control the timing and selection of new wells to be drilled or existing wells to be recompleted. This allows us to modify our capital spending as our financial resources allow and market conditions support.
|
· | Maintain financial flexibility while focusing on controlling the costs of our operations. We strive to be, and have historically been, a low-cost operator in the D-J Basin. Central to our operating strategy is maintaining low debt levels, low general and administrative costs and low well completion costs, each of which is enabled by our ability to stay highly involved in our development, our emphasis on short time horizons for returns on our investment, as well as our focus on operating efficiencies and cost reductions. We intend to finance our operations through a mixture of cash from operations, debt and equity capital as market conditions allow.
|
· | Use the latest technology to maximize returns. Beginning in fiscal 2013, we shifted our emphasis away from drilling vertical wells towards drilling horizontal wells. In doing so, we have significantly increased our production and the value of our asset base. While horizontal drilling requires higher up-front costs, these wells ultimately have a higher return on investment. Latest industry practices are drilling horizontal wells in the Wattenberg Field in increasing density and technical advancements in completing these wells is leading to enhanced productivity. We are currently utilizing both “sliding sleeve” and “plug and perf liner” technologies to stimulate multi-stage horizontal wells. Production results from each technique are analyzed and the conclusions from each analysis are factored into future well design, considering the interactions between wellbore conditions, lateral length, timing and economics. Similarly, we evaluate the use of different completion fluids ranging from slick-water to gelled fluids, and different combinations thereof.
|
Competitive Strengths
We believe that we are positioned to successfully execute our business strategy because of the following competitive strengths:
· | Management experience.Core acreage position in the Wattenberg Field. Wells in our core properties in the Wattenberg Field generally exhibit high liquids content, and those properties are generally prospective for Niobrara A, B, and C bench and Codell development. We believe that these factors lead to a high success rate and attractive EURs per acres of leasehold, per unit capital and operating costs, and rates of return. Increased well density within the Codell and Niobrara formations, as well as our acquisition efforts and organic leasing efforts within the core Wattenberg Field, have added to our multi-year drilling inventory. Our core position is situated in an area where there is extensive infrastructure that continues to be expanded. Our key management team possesses an average of thirty years of experience in oil and gas exploration and production, primarily within the Wattenberg Field in the D-J Basin, which is where over 90% of our capital expenditures took place in fiscal 2014. |
· | Balanced oil and natural gas reserves and production. At August 31, 2014, approximately 51% of our estimated proved reserves were oil and condensate and 49% were natural gas and liquids, measured upon a BTU equivalent basis. We believe this balanced commodity mix will provide diversification of sources of cash flow and will lessen the risk of significant and sudden decreases in revenue from short-term commodity price movements.
|
· | Cost efficient operator. We have successfully demonstrated our ability to drill wells for lower costs than our major competitors and to successfully integrate acquired assets without incurring significant increases in overhead.
|
· | High success rate. We have concentrated our drilling in areas that we perceive as low risk and, as a result, have had a very high success rate in our drilling program throughout the Wattenberg Field.
|
3Financial flexibility. Our capital structure, along with our high degree of operational control, continues to provide us with significant financial flexibility. Our modest debt level has enabled us to make capital decisions with limited restrictions imposed by debt covenants, lender oversight, and/or mandatory repayment schedules. Additionally, as the operator of substantially all of our anticipated future drilling locations per our December 31, 2017 reserve report, we control the timing and selection of drilling locations as well as completion schedules. This allows us to modify our capital spending program depending on financial resources, leasehold requirements, and market conditions.
2014 Operational
Management experience. Members of our key management team possess an average of over thirty years of experience in oil and Financial Summarygas exploration and production in multiple resource plays including the Wattenberg Field.
Balanced oil and natural gas reserves and production. At December 31, 2017, approximately 72% of total gross revenues were oil and condensate, 16% were natural gas, and 12% were natural gas liquids. We believe that this balanced commodity mix will provide diversification of sources of cash flow.
Focus on efficiency and cost control. We have continued to demonstrate our ability to drill wells in a cost-efficient and safe way and to successfully integrate acquired assets without incurring significant increases in overhead.
Safe workplace and reduced impact on surrounding areas. Our employees and contractors are important to us, so we strive to maintain a safety-first approach in our operations. Likewise, we seek to incorporate current technologies to meet regulatory requirements while reducing our impact on the environment and neighboring communities. Toward this effort, modern drilling and completion techniques allow us to concentrate our operations on a reduced number of surface
locations. As the new locations are developed, we have decreased the overall number of wells by plugging and abandoning vertical wells, allowing us to return those sites to surface owners.
Properties
As of December 31, 2017, our estimated net proved oil and natural gas reserves, as prepared by Ryder Scott Company, L.P. ("Ryder Scott"), an independent reserve engineering firm, were 69.4 MMBbls of oil and condensate, 559.9 Bcf of natural gas, and 64.0 MMBbls of natural gas liquids. As of December 31, 2017, we had approximately 98,600 gross and 88,300 net acres under lease in the Wattenberg Field. We also have non-core leasehold in other areas of Colorado and southwest Nebraska approximating 238,500 gross and 200,500 net acres.
We continued to expandcurrently operate over 78% of our businessproved producing reserves, and substantially all of our drilling and completion expenditures during the fiscal year ended AugustDecember 31, 2014. During2017 were focused on the Wattenberg Field. Substantially all of our drilling and completion expenditures for the 2018 calendar year we:are anticipated to be focused on the Wattenberg Field. A high degree of operational and capital control gives us both operational focus and development flexibility to maximize returns on our leasehold position.
· | increased production and sale of hydrocarbons by 123%; |
Significant Developments
· | commenced production from 31 new company operated horizontal wells; |
Acquisitions
· | commenced production from 3 (net) non-operated wells; |
· | acquired producing properties and undeveloped acreage in two significant acquisitions described below under “2014 acquisitions”; and |
· | increased reserves by 133% |
These activities were funded with cash on hand atIn December 2017, the beginningCompany completed the purchase of the year and cash flow from operations. Significant developments are described in greater detail below.
Drilling operations
As an operator, we successfully transitioned from a focus on vertical drilling to horizontal drilling. Horizontal wells are significantly more expensive and take longer to drill and complete than vertical wells, but ultimately yield a greater return. As we transitioned toward horizontal drilling, we substantially ceased completion and re-completion of our vertical wells. Accordingly, our cost structure for both our capitalized well costs and our monthly operating costs has transformed significantly over the last two years.
After initiating horizontal drilling in May 2013, production from our first five horizontal wells at our Renfroe location began in September 2013. Subsequently, we drilled, completed and initiated production at the following locations: Leffler (6 wells), Phelps (5 wells), Union (6 wells), Eberle (5 wells) and Kelly Farms (4 wells). As of August 31, 2014, one additional well at Phelps and one additional well at Eberle had been drilled but not reached first production. Both wells began producing during September 2014.
Additionally, as of August 31, 2014, we had two locations where drilling operations are in progress. We have drilled four wells at the Weld 152 location and four wells at the Kiehn location. These eight wells are waiting on completion.
Our horizontal wells are currently being drilled under contracts with Ensign United States Drilling, Inc. (“Ensign”). The initial contract, as amended, covered the use of one rig to drill a total of 25 wells. To date, pricing is on a turn-key basis, with pricing adjustments based upon well location, target formation,approximately 30,200 net acres in the Greeley-Crescent development area in Weld County Colorado, primarily south of the city of Greeley, for $569.5 million, comprised of $568.1 million in cash and other technical details. Based upon our initial success with horizontal drillingthe assumption of certain liabilities ("GCII Acquisition"). Estimated net daily production from the acquired non-operated properties was approximately 2,500 BOE at the Renfroetime we entered into the agreement governing the transaction (the "GCII Agreement"). The effective date of this part of the transaction was November 1, 2017. The GCII Agreement also contemplates a second closing at which we will acquire operated producing properties subject to certain regulatory restrictions. The purchase price payable at the second closing will be determined based on the amount of then-current production from the properties conveyed and Leffler prospects, we negotiated another drilling contract with Ensign to use one automated drilling rig for one year, commencing in January 2014. We contracted a third Ensign rig in September 2014 to drill eight wells on our Wiedeman pad, which is expected to finishbe completed in January 2015.2018. For the second closing, the effective date will be the first day of the calendar month in which the closing for such properties occurs. The second closing is subject to certain closing conditions including the receipt of regulatory approval. Accordingly, the second closing of the transaction may not close in the expected time frame or at all.
In September 2017, we completed the second closing contemplated by the May 2016 purchase and sale agreement (the "GC Agreement") pursuant to which we agreed to acquire a total of approximately 33,100 net acres in the Greeley-Crescent area for $505 million (the "GC Acquisition"). At the conclusion of each contract,second closing, we have the option to continue useacquired 335 operated vertical wells and 7 operated horizontal wells. The effective date of the rigs. As currently structured, our capital expenditure plans for fiscal 2015 contemplate the use of two rigssecond closing was April 1, 2016 for the entire yearhorizontal wells acquired and useSeptember 1, 2017 for the vertical wells acquired. At the second closing, the escrow balance of $18.2 million was released and $11.4 million of that amount was returned to the Company. The total purchase price for the second closing was $30.3 million, composed of cash of $6.3 million and assumed liabilities of $24.0 million. The assumed liabilities included $20.9 million for asset retirement obligations.
In August 2017, we entered into an agreement with a third party to trade approximately 3,200 net acres of the third rigCompany's non-contiguous acreage for partapproximately 3,200 net acres within the Company's core operating area. This transaction closed in the fourth quarter of 2017. We also executed a purchase and sale agreement with a private party for the year.acquisition of approximately 1,000 net acres of developed and undeveloped leasehold and mineral interests, along with the associated production, for a total purchase price of $22.6 million, composed of cash and assumed liabilities.
As a result of our drilling, acquisitionIn March 2017, we acquired developed and participation activities, we increased our estimated proved reserve quantities by 133% during the year. Our August 31, 2014, reserve report indicated that we had estimated proved reserves of 16.3 million barrels ofundeveloped oil and 95.2 billion cubic feetgas leasehold interests for a total purchase price of gas. The estimated present value$25.1 million, composed of future cash flows before tax (discounted at 10%) was $534 million.
During the last three months of the fiscal year ended August 31, 2014, we commenced production on three pads in the Wattenberg field, which significantly increased our daily production rate. Our consolidated daily production from producing wells increased during fiscal 2014 from 2,479 BOED as of August 31, 2013 to 5,894 BOED as of August 31, 2014.and assumed liabilities.
2014 acquisitionsDivestitures
During the year ended December 31, 2017, we completed two significant producing property acquisitions. On November 12, 2013, we acquired 21divestitures of approximately 16,000 net producing oil and gas wellsundeveloped acres, along with leases covering 800 net acres from Trilogy Resources, LLC. Total considerationassociated production, outside of the Company's core development area for the Trilogy assets included $16.0approximately $91.6 million in cash and 301,339the assumption by the buyers of $5.2 million in asset retirement obligations and $22.2 million in other liabilities. In accordance with full cost accounting guidelines, the net proceeds were credited to the full cost pool.
Equity Offering
In November 2017, the Company, in connection with a registered underwritten public offering of its common stock (the “Offering”), entered into an underwriting agreement (the “Underwriting Agreement”) with the several underwriters named therein (the “Underwriters”) and pursuant to which the Company agreed to sell 35,000,000 shares of restrictedits common stock. Onstock to the Underwriters at a price of $7.76 per share. In addition, pursuant to the Underwriting Agreement, the Underwriters were granted an option, exercisable within 30 days, to purchase up to an additional 5,250,000 shares of common stock on the same terms and conditions. The option was exercised in full on November 13, 2013, we acquired 38 operated wells (13 net) producing10, 2017, bringing the total number of shares issued in the Offering to 40,250,000. Net proceeds to the Company, after deduction of underwriting discounts and expenses payable by the Company, were $312.2 million. The Company used the proceeds of the offering to pay a portion of the purchase price of the GCII Acquisition and to repay amounts borrowed under the Revolver.
Revolving Credit Facility
We continue to maintain a borrowing arrangement with our bank syndicate (sometimes referred to as the “Revolver”) to provide us with liquidity that can be used to develop oil and gas wells along with leases covering 1,000 net acres from Apollo Operating LLC. The Apollo assets included non-operating interests in six wells we had drilled and completed and a 25% working interest in a Class II disposal well. Total consideration for the Apollo assets included $11.0 million in cash and 550,518 shares of restricted common stock. In several subsequent transactions, we acquired the remaining 75% interests in the Class II disposal well for cash and stock consideration aggregating $3.9 million.
On November 13, 2013, we acquired 38 wells (13 net) producingproperties, acquire new oil and gas wells along with leases covering 800 net acres from Apollo Operating LLC. The Apollo assets included non-operating interest in six wells we had drilledproperties, and completedfor working capital and a 25% working interest in a Class II disposal well. Total considerationother general corporate purposes. As of December 31, 2017, the Revolver provides for the Apollo assets included $11.0maximum borrowings of $500 million, in cash and 550,518 shares of restricted common stock.
Subsequently, in a separate transaction, we acquired the remaining 75% interests in the Class II disposal well for approximately approximated $3.9 million.
Financing updates
We continue to improve our borrowing arrangement with a bank syndicate led by Community Banks of Colorado. Maximum borrowings are subject to adjustmentadjustments based upon a borrowing base calculation, which will beis re-determined semi-annually using updated reserve reports. The arrangement contains covenants that, among other things, restrict the payment of dividends and require compliance with certain financial ratios. The borrowing arrangementRevolver is collateralized by certain of our assets, including substantially all of our producing properties.wells and developed oil and gas leases, and bears a variable interest rate on borrowings with the effective rate varying with utilization.
In September 2017, the lenders under the Revolver completed their regular semi-annual redetermination of our borrowing base. The borrowing base was increased from $225 million to $400 million. The next semi-annual redetermination is scheduled for April 2018. Due to outstanding letters of credit, approximately $399.5 million of the borrowing base was available to use for future borrowings as of December 31, 2017, subject to our covenant requirements.
2025 Senior Notes
In November 2017, the Company issued $550 million aggregate principal amount of its 6.25% Senior Notes (the "2025 Senior Notes") in a private placement to qualified institutional buyers. The maturity for the payment of principal is December 1, 2025. Interest on the 2025 Senior Notes accrues at 6.25% and began accruing on November 29, 2017. Interest is payable on June 1 and December 1 of each year, beginning on June 1, 2018. The 2025 Senior Notes were issued pursuant to an indenture dated as of November 29, 2017 (the "Indenture") and are guaranteed on a senior unsecured basis by the Company’s existing and future subsidiaries that incur or guarantee certain indebtedness, including indebtedness under the Revolver. The net proceeds from the sale of the 2025 Senior Notes were $538.1 million after deductions of $11.9 million for expenses and underwriting discounts and commissions. The net proceeds were used to fund the GCII Acquisition, repay the 2021 Senior Notes, and pay off the outstanding Revolver balance. The Indenture contains covenants that restrict the Company’s ability and the ability of certain of its subsidiaries to, among other restrictions and limitations: (i) incur additional indebtedness; (ii) incur liens; (iii) pay dividends; (iv) consolidate, merge, or transfer all or substantially all of its or their assets; (v) engage in transactions with affiliates; or (vi) engage in certain restricted business activities. These covenants are subject to a number of exceptions and qualifications.
2021 Senior Notes
In December 2013 and June 2014, we modified our borrowing arrangement to increase2017, the maximum allowable borrowings. In December 2013,Company repurchased all $80 million aggregate principal amount of its 9% Senior Notes (the "2021 Senior Notes"). At the arrangement was modified to increasetime of repurchase, the maximum lending commitment to $300 million from $150 million, to increase the borrowing base to $90Company made a required make whole payment of $8.2 million and to increase the numberwrote-off deferred issuance costs of banks involved in the borrowing arrangement. Based upon the semi-annual redetermination derived from the February 28, 2014 reserve report, the arrangement was further modified in June 2014 to increase the borrowing base to $110 million, to adjust the financial ratio compliance requirements, and to extend the maturity date to May 29, 2019. The next scheduled redetermination is currently in progress and will adjust the borrowing arrangement based upon our August 31, 2014 reserve report.$3.6 million.
Interest accrues at a variable rate equal to or greater than a minimum rate of 2.5%. The interest rate pricing grid contains a graduated escalation in applicable margin for increased utilization. At our option, interest rates will be referenced to the Prime Rate plus a margin of 0.5% to 1.5%, or the London InterBank Offered Rate plus a margin of 1.75% to 2.75%.
Commodity contractsDrilling and Completion Operations
We utilize swaps and collars to reduce the effect of price changes on a portion of our future oil and gas production. Our objective in using derivative financial instruments is to achieve more predictable cash flows in an environment of volatile oil and gas prices and to manage our exposure to commodity price risk. Using swaps and collars, we have contracted for approximately 1.1 million barrels of oil and 1.7 million mcf of gas through December 31, 2016. Since we designed our commodity derivative activity to protect our cash flow during periods of oil and gas price declines, the high average prices experienced during 2014 created a realized loss of $2.1 million for the year. The decline in posted prices at the end of our fiscal year created an unrealized increase in the fair value of our commodity derivatives of $2.5 million.
Well and Production Data
During the periods presented below, we drilled or participated in the drilling of a number of wells that reached productive status in each respective fiscal year.period. During 2014the year ended December 31, 2017, we drilled one test well that was immediately plugged and abandoned. Results fromturned 109 gross operated wells to sales in ten separate spacing units. None of the test well were encouraging and our 2015 plans include additional drilling in that area. We also drilled 11 horizontal wells that are classified as exploratory. Althoughexploratory and 109 of the gross operated wells were drilledare classified as development.
|
| | | | | | | | | | | | | | | | | | | | | | | |
| | Year Ended December 31, | | Four Months Ended December 31, 2015 | | Year Ended August 31, 2015 |
| | 2017 | | 2016 | | |
| | Gross | | Net | | Gross | | Net | | Gross | | Net | | Gross | | Net |
| Development Wells: | | | | | | | | | | | | | | | |
| Productive: | | | | | | | | | | | | | | | |
| Oil | 172 | * | | 112 |
| | 21 | ** | | 18 |
| | 4 |
| | 4 |
| | 8 |
| | 1 |
|
| Gas | — |
| | — |
| | — |
| | — |
| | — |
| | — |
| | 1 |
| | — |
|
| Nonproductive | — |
| | — |
| | — |
| | — |
| | — |
| | — |
| | — |
| | — |
|
| | | | | | | | | | | | | | | | |
| Exploratory Wells: | | | | | | | | | | | | | | | |
| Productive: | | | | | | | | | | | | | | | |
| Oil | — |
| | — |
| | 6 |
| | 5 |
| | 9 |
| | 9 |
| | 67 |
| | 40 |
|
| Gas | — |
| | — |
| | — |
| | — |
| | — |
| | — |
| | — |
| | — |
|
| Nonproductive | — |
| | — |
| | — |
| | — |
| | 1 |
| | — |
| | — |
| | — |
|
* Includes 63 gross (11 net) productive wells which we participated in an area that contained productive vertical wells, the area had not been proved on a horizontalnon-operated basis. Therefore, the new
** Includes 3 gross (0.42 net) productive wells met the definition of exploratory wells. The following table excludes wells that arewhich we participated in the drilling or completion phase and had not reached the point at which they are capable of producing oil and gas as of August 31, 2014.on a non-operated basis.
| Years Ended August 31, |
| 2014 | | 2013 | | 2012 |
| Gross | | Net | | Gross | | Net | | Gross | | Net |
| Development Wells: | | | | | | | | | | | |
| Productive: | | | | | | | | | | | |
| Oil | 47 | | 22 | | 48 | | 32 | | 64 | | 52 |
| Gas | 2 | | 1 | | — | | — | | — | | — |
| Nonproductive | — | | — | | — | | — | | — | | — |
| Exploratory Wells: | | | | | | | | | | | |
| Productive: | | | | | | | | | | | |
| Oil | 11 | | 10 | | — | | — | | — | | — |
| Gas | — | | — | | — | | — | | — | | — |
| Nonproductive | 1 | | — | | — | | — | | — | | — |
There were 53 gross (14.2 net) wells in progress that were not included in the above well counts. All of the oil wells in the table above are located in, or adjacent to, the Wattenberg Field of the D-J Basin. Two gasAs of December 31, 2017, we were the operator of 51 gross (47 net) wells are located in Yuma County, Colorado.
6
progress, which excludes 19 gross (16 net) wells for which we have only set surface casings, that were not included in the above well counts.
Production Data
The following table shows our net production of oil and natural gas, average sales prices, and average production costs for the periods presented:
| | | Years Ended August 31, | |
| | | 2014 | | | 2013 | | | 2012 | |
Production: | | | | | | | | | |
Oil (Bbls1) | | | 941,218 | | | | 421,265 | | | | 235,691 | |
Gas (Mcf2) | | | 3,747,074 | | | | 2,107,603 | | | | 1,109,057 | |
BOE3 | | | 1,565,729 | | | | 772,532 | | | | 420,534 | |
| | | | | | | | | | | | |
Average sales price: | | | | | | | | | | | | |
| Oil ($/Bbl) | | $ | 89.98 | | | $ | 85.95 | | | $ | 87.59 | |
| Gas ($/Mcf) | | $ | 5.21 | | | $ | 4.75 | | | $ | 3.90 | |
| BOE | | $ | 66.56 | | | $ | 59.83 | | | $ | 59.37 | |
| | | | | | | | | | | | |
| Average production cost per BOE | | $ | 5.10 | | | $ | 4.42 | | | $ | 2.73 | |
|
| | | | | | | | | | | |
| | Year Ended December 31, |
| | 2017 | | 2016 | | 2015 |
Production: | | | | | |
| Oil (MBbls) | 5,824 |
| | 2,257 |
| | 2,073 |
|
| Natural Gas (MMcf) | 24,834 |
| | 12,086 |
| | 8,472 |
|
| NGLs (MBbls) | 2,518 |
| | — |
| | — |
|
| MBOE | 12,481 |
| | 4,271 |
| | 3,485 |
|
| BOED | 34,194 |
| | 11,670 |
| | 9,548 |
|
| | | | | | |
| Average sales price: | | | | | |
Oil ($/Bbl) * | $ | 44.35 |
| | $ | 34.43 |
| | $ | 40.08 |
|
| Natural Gas ($/Mcf) | $ | 2.33 |
| | $ | 2.44 |
| | $ | 2.71 |
|
| NGLs ($/MBbls) | $ | 17.10 |
| | $ | — |
| | $ | — |
|
BOE * | $ | 28.79 |
| | $ | 25.09 |
| | $ | 30.43 |
|
| | | | | | |
| Average lease operating expenses ("LOE") per BOE | $ | 1.56 |
| | $ | 4.67 |
| | $ | 4.61 |
|
* Adjusted to include the effect of transportation and gathering expenses.
1
| | “Bbl” refers to one stock tank barrel, or 42 U.S. gallons liquid volume in reference to crude oil or other liquid hydrocarbons. |
2
| | “Mcf” refers to one thousand cubic feet of natural gas. |
3
| | “BOE” refers to barrel of oil equivalent, which combines Bbls of oil and Mcf of gas by converting each six Mcf of gas to one Bbl of oil. |
Production costs generally include pumping fees, maintenance, repairs, labor, utilities and administrative overhead. Taxes on production, including ad valorem and severance taxes, are excluded from production costs. We experienced an increase in production costs as we transitioned to horizontal wells. In their initial months, horizontal wells have been more expensive to operate. We expect the operating costs to stabilize as the wells mature.Major Customers
We are not currently obligatedsell our crude oil, natural gas, and NGLs to provide a fixed and determined quantity ofvarious purchasers under multiple contractual arrangements. For crude oil, or gas to any third party. During the last three fiscal years, we have not had, nor doseveral arrangements, ranging from month-to-month to long-term commitments. Notably, in 2014, we now have, any long-term supply or similar agreementsecured contracts with any government or governmental authority.oil purchasers who transport oil via pipelines. Under these contracts, we entered into delivery commitments covering a portion of our anticipated future production over the next four to five years. Our natural gas is sold under contracts with two midstream gas gathering and processing companies. With current infrastructure and expansion plans, we believe that gas gathering and processing and oil takeaway capacity will be sufficient to meet our anticipated production growth. See further discussion in Note 16 to our consolidated financial statements. For the year ended December 31, 2017, three of our customers account for more than 10% of our revenues.
Oil and Gas Properties, Wells, Operations, and Acreage
We evaluate undeveloped oil and gas prospects and participate in drilling activities on those prospects, which, in the opinion of our management, are favorable for the production of oil or gas. If, through our review, a geographical area indicates geological and economic potential, we will attempt to acquire leases or other interests in the area. We may then attempt to sell portions of our leasehold interests in a prospect to third parties, thus sharing the risks and rewards of the exploration and development of the prospect with the other owners. One or more wells may be drilled on a prospect, and if the results indicate the presence of sufficient oil and gas reserves, additional wells may be drilled on the prospect.
We may also:
· | acquire a working interest in one or more prospects from others and participate with the other working interest owners in drilling, and if warranted, completing oil or gas wells on a prospect, or |
· | purchase producing oil or gas properties. |
We believe that the title to our oil and gas properties is good and defensible in accordance with standards generally accepted in the oil and gas industry, subject to such exceptions which, in our opinion, are not so material as to detract substantially from the use or value of such properties. Our properties are typically subject, in one degree or another, to one or more of the following:
royalties and other burdens and obligations, expressed or implied, under oil and gas leases;
· | royalties and other burdens and obligations, express or implied, under oil and gas leases; |
overriding royalties and other burdens created by us or our predecessors in title;
a variety of contractual obligations (including, in some cases, development obligations) arising under operating agreements, farm-out agreements, production sales contracts, and other agreements that may affect the properties or title thereto;
· | overriding royalties and other burdens created by us or our predecessors in title; |
back-ins and reversionary interests existing as a result of pooling under state orders;
liens that arise in the normal course of operations, such as those for unpaid taxes, statutory liens securing obligations to unpaid suppliers and contractors, and contractual liens under operating agreements;
· | a variety of contractual obligations (including, in some cases, development obligations) arising under operating agreements, farmout agreements, production sales contractspooling, unitization and communitization agreements, declarations, and orders; and other agreements that may affect the properties or their titles;
|
· | back-ins and reversionary interests existing under purchase agreements and leasehold assignments; |
· | liens that arise in the normal course of operations, such as those for unpaid taxes, statutory liens securing obligations to unpaid suppliers and contractors and contractual liens under operating agreements; pooling, unitization and communitization agreements, declarations and orders; and |
· | easements, restrictions, rights-of-way, and other matters that commonly affect property. |
To the extent that such burdens and obligations affect our rights to production revenues, they have been taken into account in calculating our net revenue interests and in estimating the size and value of our reserves. We believe that the burdens and obligations affecting our properties are conventionalcustomary in the industry for properties of the kind that we own.
The following table shows, as of October 10, 2014,December 31, 2017, by state, our producing wells, developed acreage, and undeveloped acreage, excluding service (injection and disposal) wells:acreage:
|
| | | | | | | | | | | | | | | | | | |
| | | Productive Wells | | Developed Acreage | | Undeveloped Acreage 1 |
| State | | Gross | | Net | | Gross | | Net | | Gross | | Net |
| Colorado | | 1,014 |
| | 650 |
| | 32,700 |
| | 26,800 |
| | 157,800 |
| | 119,300 |
|
| Nebraska | | — |
| | — |
| | — |
| | — |
| | 146,600 |
| | 142,700 |
|
| Kansas | | — |
| | — |
| | — |
| | — |
| | 800 |
| | 800 |
|
| Total | | 1,014 |
| | 650 |
| | 32,700 |
| | 26,800 |
| | 305,200 |
| | 262,800 |
|
| | Productive Wells | | | Developed Acreage | | | Undeveloped Acreage 1 | |
| State | | Gross | | | Net | | | Gross | | | Net | | | Gross | | | Net | |
| | | | | | | | | | | | | | | | | | |
| Colorado | | | 404 | | | | 284 | | | | 16,312 | | | | 12,155 | | | | 252,642 | | | | 116,131 | |
| Nebraska | | | — | | | | — | | | | — | | | | — | | | | 185,988 | | | | 183,589 | |
| Wyoming | | | — | | | | — | | | | — | | | | — | | | | 1,143 | | | | 472 | |
| Kansas | | | — | | | | — | | | | — | | | | — | | | | 840 | | | | 840 | |
| Total | | | 404 | | | | 284 | | | | 16,312 | | | | 12,155 | | | | 440,613 | | | | 301,032 | |
1 Undeveloped acreage includes leasehold interests on which wells have not been drilled or completed to the point that would permit the production of commercial quantities of oil and natural gas regardless of whether the leasehold interest is classified as containing proved undeveloped reserves.
The following table shows, as of October 10, 2014,December 31, 2017, the status of our gross acreage:
| State | | Held by Production | | | Not Held by Production | |
| | | | | | |
| Colorado | | | 16,312 | | | | 252,642 | |
| Nebraska | | | — | | | | 185,988 | |
| Wyoming | | | — | | | | 1,143 | |
| Kansas | | | — | | | | 840 | |
| Total | | | 16,312 | | | | 440,613 | |
|
| | | | | | |
| State | | Held by Production | | Not Held by Production |
| Colorado | | 90,900 |
| | 99,600 |
|
| Nebraska | | — |
| | 146,600 |
|
| Kansas | | — |
| | 800 |
|
| Total | | 90,900 |
| | 247,000 |
|
AcresLeases that are Heldheld by Productionproduction generally remain in force so long as oil or natural gas is produced from the well on
the particular lease. Leased acres which are not Held By Productionheld by production may require annual rental payments to maintain the lease until the first to occur of the following: the expiration of the lease or the time oil or natural gas is produced from one or more wells drilled on the leased acreage. At the time oil or natural gas is produced from wells drilled on the leased acreage, the lease is generally considered to be Heldheld by Production.production.
The following table shows the calendar years during which our leases which are not Heldcurrently held by Production,production will expire unless a productive oil or natural gas well is drilled on the lease.lease or the lease is renewed.
| Leased Acres | | Expiration of Lease |
| | |
| 75,196 | | 2015 |
| 45,079 | | 2016 |
| 42,693 | | 2017 |
| 277,645 | | After 2017 |
|
| | |
Leased Acres (Gross) | | Expiration of Lease |
| 63,200 | | 2018 |
| 24,000 | | 2019 |
| 13,800 | | 2020 |
| 91,400 | | 2021 |
| 54,600 | | After 2021 |
The overriding royalty interests that we own are not material to our business.
Oil and Natural Gas Reserves
Our estimated proved reserve quantities increased by 143% from December 31, 2016 to December 31, 2017. At December 31, 2017, we had estimated proved reserves of 69.4 MMBbls of oil and condensate, 559.9 Bcf of natural gas, and 64.0 MMBbls of natural gas liquids. The estimated standardized measure of future net cash flow from our reserves at December 31, 2017 was $1.6 billion and the estimated PV-10 value of our reserves at that date was $1.8 billion. PV-10 is a non-GAAP measure that reflects the present value, discounted at 10%, of estimated future net revenues from our proved reserves. We present a reconciliation of PV-10 value to the standardized measure of discounted future net cash flows in Item 7 under "Non-GAAP Financial Measures." The PV-10 value as of December 31, 2017 increased compared to December 31, 2016 by $1.3 billion. The increase in estimated proved reserve quantities and PV-10 value is primarily due to acquisitions completed during 2017, extensions resulting in new proved undeveloped reserve increases, increased pricing during 2017, and revisions resulting in probable reserves being recognized as proved producing reserves.
Ryder Scott Company, L.P. (“Ryder Scott”) prepared the estimates of our proved reserves, future productionsproduction, and income attributable to our leasehold interests for the year ended Augustas of December 31, 2014.2017. Ryder Scott is an independent petroleum engineering firm that has been providing petroleum consulting services worldwide for over seventy years. The estimates of drilledproved reserves, future production, and income attributable to certain leasehold and royalty interests are based on technical analysisanalyses conducted by teams of geoscientists and engineers employed at Ryder Scott. The office of Ryder Scott that prepared our reserves estimates is registered in the State of Texas (License #F-1580). Ryder Scott prepared our reserve estimate based upon a review of property interests being appraised, historical production, lease operating expenses, and price differentials, for our wells. Additionally, authorizations for expenditure, and geological and geophysical data, and other engineering data that complies with SEC guidelines are among that which we provide to Ryder Scott engineers for consideration in estimating our underground accumulations of crude oil and natural gas.data.
The report of Ryder Scott dated October 9, 2014,January 26, 2018, which contains further discussions of the reserve estimates and evaluations prepared by Ryder Scott, as well as the qualifications of Ryder Scott’s technical personnel responsible for overseeing such estimates and evaluations, is attached as Exhibit 9999.1 to this Annual Report on Form 10-K.
Ed Holloway,Our reserves technical team, which consists of our Co-Chief ExecutiveReservoir Engineering Manager, VP of Exploration, Chief Operations Officer, and Chief Development Officer, oversaw the preparation of the reserve estimates by Ryder Scott to ensure accuracy and completeness of the data prior to and after submission. Mr. HollowayOur technical team has an average of over thirty years of experience in oil and gas exploration and development.
Our proved reserves include only those amounts which we reasonably expect to recover in the future from known oil and natural gas reservoirs under existing economic and operating conditions, at current prices and costs, under existing regulatory practices, and with existing technology. Accordingly, any changes in prices, operating and development costs, regulations, technology, or other factors could significantly increase or decrease estimates of proved reserves.
Estimates of volumes of proved reserves at year end are presented in barrels (Bbls) for oil, andMcf for natural gas, in thousands of cubic feet (Mcf)and barrels for NGL at the official temperature and pressure bases of the areas in which the natural gas reserves are located.
The proved reserves attributable to producing wells and/or reservoirs were estimated by performance methods. These performance methods include decline curve analysis, which utilizedincorporate extrapolations of historical production and pressure data
available through AugustDecember 31, 2014,2017 in those cases where this data was considered to be definitive. The data used in this analysis was obtained from public data sources and werewas considered sufficient for calculating producing reserves.
The proved non-producing and undeveloped reserves were estimated by the analogy method. The analogy method uses pertinent well data obtained from public data sources that werewas available through AugustDecember 31, 2014.
2017.
Below are estimates of our net proved reserves at AugustDecember 31, 2014,2017, all of which are located in Colorado:
| | Oil | | | Gas | | | BOE | |
| | (Bbls) | | | (Mcf) | | | | |
| Proved: | | | | | | | | | |
| Producing | | | 4,537,061 | | | | 25,921,459 | | | | 8,857,304 | |
| Nonproducing | | | 2,079,421 | | | | 12,240,142 | | | | 4,119,445 | |
| Undeveloped | | | 9,708,471 | | | | 57,016,746 | | | | 19,211,262 | |
| Total | | | 16,324,953 | | | | 95,178,347 | | | | 32,188,011 | |
|
| | | | | | | | | | | |
| | Oil (MBbls) | | Natural Gas (MMcf) | | NGL
(MBbl) | | MBOE |
| Proved: | | | | | | | |
| Developed | 26,552 |
| | 219,279 |
| | 24,251 |
| | 87,350 |
|
| Undeveloped | 42,844 |
| | 340,614 |
| | 39,702 |
| | 139,315 |
|
| Total | 69,396 |
| | 559,893 |
| | 63,953 |
| | 226,665 |
|
The following tabulations present the estimatesPV-10 value of our present valueestimated reserves as of estimated future net revenues from such reservesDecember 31, 2017, 2016, and 2015 (in thousands):
|
| | | | | | | | | | | | | | | |
| | Proved - December 31, 2017 |
| | Developed | | | | Total |
| | Producing | | Non-producing | | Undeveloped | | Proved |
| Future cash inflow | $ | 1,804,029 |
| | $ | 291,678 |
| | $ | 3,397,800 |
| | $ | 5,493,507 |
|
| Future production costs | (492,270 | ) | | (63,278 | ) | | (735,821 | ) | | (1,291,369 | ) |
| Future development costs | (47,562 | ) | | (18,384 | ) | | (982,910 | ) | | (1,048,856 | ) |
| Future pre-tax net cash flows | $ | 1,264,197 |
| | $ | 210,016 |
| | $ | 1,679,069 |
| | $ | 3,153,282 |
|
| PV-10 (Non-U.S. GAAP) | $ | 861,685 |
| | $ | 142,996 |
| | $ | 751,603 |
| | $ | 1,756,284 |
|
|
| | | | | | | | | | | | | | | |
| | Proved - December 31, 2016 |
| | Developed | | | | Total |
| | Producing | | Non-producing | | Undeveloped | | Proved |
| Future cash inflow | $ | 414,230 |
| | $ | — |
| | $ | 1,766,443 |
| | $ | 2,180,673 |
|
| Future production costs | (177,138 | ) | | — |
| | (466,955 | ) | | (644,093 | ) |
| Future development costs | (29,634 | ) | | — |
| | (554,903 | ) | | (584,537 | ) |
| Future pre-tax net cash flows | $ | 207,458 |
| | $ | — |
| | $ | 744,585 |
| | $ | 952,043 |
|
| PV-10 (Non-U.S. GAAP) | $ | 154,261 |
| | $ | — |
| | $ | 322,087 |
| | $ | 476,348 |
|
|
| | | | | | | | | | | | | | | |
| | Proved - December 31, 2015 |
| | Developed | | | | Total |
| | Producing | | Non-producing | | Undeveloped | | Proved |
| Future cash inflow | $ | 494,858 |
| | $ | — |
| | $ | 1,215,752 |
| | $ | 1,710,610 |
|
| Future production costs | (172,210 | ) | | — |
| | (289,887 | ) | | (462,097 | ) |
| Future development costs | (32,700 | ) | | — |
| | (307,749 | ) | | (340,449 | ) |
| Future pre-tax net cash flows | $ | 289,948 |
| | $ | — |
| | $ | 618,116 |
| | $ | 908,064 |
|
| PV-10 (Non-U.S. GAAP) | $ | 198,056 |
| | $ | — |
| | $ | 240,086 |
| | $ | 438,142 |
|
The following table presents the prices used to prepare the reserve estimates, which are based upon a PV-10 calculation (a non-U.S. GAAP measure). PV-10 is a financial measure calculated before the imposition of corporate income taxes. It is derived from the standardized measure of discounted future net cash flows relating to proved oil and gas reserves prepared in accordance with the provisions of Accounting Standards Codification Topic 932, Extractive Activities – Oil and Gas. The standardized measure of discounted future net cash flows is determined by using estimated quantities of proved reserves and the periods in which they are expected to be developed and produced based on specified economic conditions. The estimated future production is based upon benchmark prices that reflect the unweighted arithmetic average of the first-day-of-the-monthfirst day of the month price for oileach month within the twelve-month period prior to the end of the respective reporting period presented as adjusted for our differentials:
|
| | | | | | | | | | | |
| | Oil (Bbl) | | Natural Gas (Mcf) | | NGL (Bbl) |
| December 31, 2017 (Average) | $ | 46.57 |
| | $ | 2.21 |
| | $ | 16.06 |
|
| December 31, 2016 (Average) | $ | 36.07 |
| | $ | 2.44 |
| | $ | — |
|
| December 31, 2015 (Average) | $ | 41.33 |
| | $ | 2.60 |
| | $ | — |
|
During the year ended December 31, 2017, the combined effect of our drilling, acquisition, and gas during the years ended August 31, 2014, 2013participation activities and 2012. The resulting estimatedincreased commodity prices generated an increase in projected future cash inflows are then reducedinflow from proved reserves of $3.3 billion and an increase in future pre-tax net cash flow of $2.2 billion from December 31, 2016 to December 31, 2017. During the same period, our PV-10 from proved reserves increased by estimated future costs to develop and produce reserves based on current cost levels. No deduction has been made for$1.3 billion. During the depreciation, depletion or amortizationyear ended December 31, 2017, we incurred capital expenditures of historical costs or for indirect costs, such as general corporate overhead. Present values were computed by discounting future net revenues by 10% per year. We present a reconciliation of PV-10approximately $600.0 million related to the standardized measureacquisition and development of discountedproved reserves.
During the year ended December 31, 2016, the combined effect of our drilling, acquisition, and participation activities partially offset by declining commodity prices generated an increase in projected future cash inflow from proved reserves of $470.1 million and an increase in future pre-tax net cash flows followingflow of $44.0 million from December 31, 2015 to December 31, 2016. During the same period, our PV-10 tables.
As of August 31, 2014, 2013, and 2012, the following tables describe the PV-10 values of ourfrom proved reserves (in thousands):increased by $38.2 million. During the year ended December 31, 2016, we incurred capital expenditures of approximately $283.3 million related to the acquisition and development of proved reserves.
| | | Proved - August 31, 2014 | | | | | | | |
| | | Developed | | | | | | Total | |
| | | Producing | | | Nonproducing | | | Undeveloped | | | Proved | |
| Future cash inflow | | $ | 511,252 | | | $ | 234,452 | | | $ | 1,094,283 | | | $ | 1,839,987 | |
| Future production costs | | | (127,900 | ) | | | (48,990 | ) | | | (218,129 | ) | | | (395,019 | ) |
| Future development costs | | | (13,245 | ) | | | (29,403 | ) | | | (369,869 | ) | | | (412,517 | ) |
| Future pre-tax net cash flows | | | 370,107 | | | | 156,059 | | | | 506,285 | | | | 1,032,451 | |
| PV-10 (Non-U.S. GAAP) | | $ | 250,749 | | | $ | 76,593 | | | $ | 206,356 | | | $ | 533,698 | |
| | | | | | | | | | | | | | | | | |
| | | | | | | | | | | | | | | | | |
| | | Proved - August 31, 2013 | | | | | | | | | |
| | | Developed | | | | | | | Total | |
| | | Producing | | | Nonproducing | | | Undeveloped | | | Proved | |
| Future cash inflow | | $ | 206,065 | | | $ | 286,207 | | | $ | 256,758 | | | $ | 749,030 | |
| Future production costs | | | (46,410 | ) | | | (52,605 | ) | | | (47,337 | ) | | | (146,352 | ) |
| Future development costs | | | - | | | | (26,086 | ) | | | (82,204 | ) | | | (108,290 | ) |
| Future pre-tax net cash flows | | | 159,655 | | | | 207,516 | | | | 127,217 | | | | 494,388 | |
| PV-10 (Non-U.S. GAAP) | | $ | 92,888 | | | $ | 104,392 | | | $ | 38,836 | | | $ | 236,116 | |
| | | | | | | | | | | | | | | | | |
| | | | | | | | | | | | | | | | | |
| | | Proved - August 31, 2012 | | | | | | | | | |
| | | Developed | | | | | | | Total | |
| | | Producing | | | Nonproducing | | | Undeveloped | | | Proved | |
| Future cash inflow | | $ | 120,802 | | | $ | 173,144 | | | $ | 243,516 | | | $ | 537,462 | |
| Future production costs | | | (21,099 | ) | | | (27,709 | ) | | | (36,804 | ) | | | (85,612 | ) |
| Future development costs | | | - | | | | (20,827 | ) | | | (79,994 | ) | | | (100,821 | ) |
| Future pre-tax net cash flows | | | 99,703 | | | | 124,608 | | | | 126,718 | | | | 351,029 | |
| PV-10 (Non-U.S. GAAP) | | $ | 57,797 | | | $ | 56,196 | | | $ | 34,890 | | | $ | 148,883 | |
Our drilling, acquisition, and participation activities during the yearfour months ended AugustDecember 31, 2014, generated increases2015 and changes in commodity prices resulted in a decrease in projected future cash inflow from proved reserves of $1.1 billion and future$336.0 million from August 31, 2015. Future pre-tax net cash flow of $538.1decreased $25.2 million from August 31, 2013.2015 to December 31, 2015. During that same period, when applying a 10% discount rate to our future net cash flows, our PV-10 from proved reserves increaseddecreased by $297.5$0.1 million. During the yearfour months ended AugustDecember 31, 2014,2015, we incurred capital expenditures of approximately $185.1$92.5 million related to the acquisition and developementdevelopment of proved reserves.
Our drilling, acquisition, and participation activities, partially offset by declining commodity prices, during the year ended August 31, 2013,2015 generated increasesan increase in projected future cash inflow from proved reserves of $211.6$206.6 million andcompared to August 31, 2014. However, future pre-tax net cash flow of $143.3decreased $149.6 million from August 31, 2012.2014 to August 31, 2015 as per-unit costs did not decline commensurate with per-unit future cash inflow. During that same period, when applying a 10% discount rate to our future net cash flows, our PV-10 from proved reserves increaseddecreased by $87.2$95.4 million. During the year ended August 31, 2013,2015, we incurred capital expenditures of approximately $104.3$203.2 million related to the acquisition and developementdevelopment of proved reserves.
Our drilling, acquisition, and participation activities during the year ended August 31, 2012, generated increases in projected future cash inflow from proved reserves of $302.2 million and future pre-tax net cash flow of $197.4 million from August 31, 2011. During that same period, when applying a 10% discount rate to our future net cash flows, our PV-10 from proved reserves increased by $77.1 million. During the year ended August 31, 2012, we incurred capital expenditures of approximately $33.5 million related to the acquisition and developement of proved reserves.
Reconciliation of Standardized Measure of Discounted Future Net Cash Flows (U.S. GAAP) to PV-10 (Non-U.S. GAAP)
PV-10 is a non-U.S. GAAP financial measure. We believe that the presentation of PV-10 is relevant and useful to investors because it presents the discounted future net cash flows attributable to our estimated net proved reserves prior to taking into account future corporate income taxes, and it is a useful measure for evaluating the relative monetary significance of our oil and natural gas properties. It is not intended to represent the current market value of our estimated reserves. PV-10 should not be considered in isolation or as a substitute for the standardized measure reported in accordance with U.S. GAAP, but rather should be considered in addition to the standardized measure.
PV-10 is derived from the Standardized Measure, which is the most directly comparable GAAP financial measure. PV-10 is calculated using the same inputs and assumptions as the Standardized Measure, with the exception that it omits the impact of future income taxes. It is considered to be a pre-tax measurement.
The following table provides a reconciliation of the Standardized Measure to PV-10 to at August 31, 2014, 2013, and 2012 (in thousands):
| | | As of August 31, | |
| | | 2014 | | | 2013 | | | 2012 | |
| Standardized measure of discounted future net cash flows: | | $ | 402,699 | | | $ | 181,732 | | | $ | 102,505 | |
| Add: 10 percent annual discount, net of income taxes | | | 376,827 | | | | 199,111 | | | | 139,175 | |
| Add: future undiscounted income taxes | | | 252,925 | | | | 113,545 | | | | 109,349 | |
| Future pre-tax net cash flows | | $ | 1,032,451 | | | $ | 494,388 | | | $ | 351,029 | |
| Less: 10 percent annual discount, pre-tax | | $ | (498,753 | ) | | $ | (258,272 | ) | | $ | (202,146 | ) |
| PV-10 | | $ | 533,698 | | | $ | 236,116 | | | $ | 148,883 | |
In general, the volume of production from our oil and gas properties declines as reserves are depleted. Except to the extentUnless we acquire additional properties containing proved reserves, or conduct successful exploration and development activities, or both, our proved reserves will decline as reserves are produced. Accordingly, volumes generated from our future activities are highly dependent upon the level ofour success in acquiring or finding additional reserves, and the costs incurred in doing so.
|
| | |
| Proved Undeveloped Reserves | | | |
| | | |
| | Net Reserves Boe | (MBOE) |
Beginning September 1, 20122014 | 19,211 | | 4,939,735 |
|
| Converted to proved developed | | | (185,246414 | ) |
Additions from capital programExtensions | 17,633 | | 481,463 |
|
Acquisitions (sales) | 3,780 |
|
| Divestitures | 674,531(1,278 | ) |
Revisions (pricing and engineering) | 2,689 | | (1,051,976 | )
|
Ending August 31, 20132015 | 41,621 | | 4,858,507 |
|
| Converted to proved developed | | | (586,9741,869 | ) |
Additions from capital programExtensions | 17,161 | | 13,436,253 |
|
Acquisitions (sales) | 11,960 |
|
| Divestitures | 1,522,445(4,360 | ) |
Revisions (pricing and engineering) | | | (18,96916,224 | ) |
Ending AugustDecember 31, 20142015 | 48,289 |
|
| Converted to proved developed | 19,211,262(806 | ) |
| Extensions | 3,110 |
|
| Acquisitions | 50,530 |
|
| Divestitures | (6,479 | ) |
| Revisions | (19,155 | ) |
| Ending December 31, 2016 | 75,489 |
|
| Converted to proved developed | (23,781 | ) |
| Extensions | 46,913 |
|
| Acquisitions | 34,867 |
|
| Divestitures | (235 | ) |
| Revisions | 6,062 |
|
| Ending December 31, 2017 | 139,315 |
|
At AugustDecember 31, 2014,2017, our proved undeveloped reserves were 19,211,262 Boe.139,315 MBOE. During 2017, the GCII Acquisition, along with other minor acquisitions, led to an increase of 34,867 MBOE in proved undeveloped reserves. This increase was partially offset by a decrease of 235 MBOE as a result of divestitures. In addition to the 23,781 MBOE of prior year proved undeveloped reserves converted to proved developed reserves, we added 46,913 MBOE of proved undeveloped reserves which were primarily attributable to extending our development plan by a year due to the passage of time as well as the addition of a third rig for the second and third years of our development plan. Further, due to a better commodity market environment, our increase in expected drilling activity positively affected our proved undeveloped reserves. Consistent with prior years, we limited our undeveloped locations related to horizontal wells to be drilled within this three-year horizon.
During the year end December 31, 2017, we converted 23,781 MBOE, or 32%, of our proved undeveloped reserves as of December 31, 2016 into proved developed reserves, requiring $185.2 million of drilling and completion capital expenditures. All proved undeveloped reserves as of December 31, 2017 are expected to be converted to proved producing within three years, and within five years of their initial booking. Based on our current drilling plans for the next three years, we expect to allocate more funds to developmental drilling in areas of established production where ongoing and planned midstream infrastructure buildout continues. None of theour proved undeveloped reserves as of December 31, 2017 have been in this category for more than 5 yearsfive years.
At December 31, 2016, our proved undeveloped reserves were 75,489 MBOE. During 2016, the GC Acquisition, along with other minor acquisitions, led to an increase of 50,530 MBOE in proved undeveloped reserves. These acquisitions allowed for the creation of spacing units with higher working interests, opportunities to drill longer laterals, and all are scheduledincreased focus on our development program in the core Wattenberg area. This increase was partially offset by a decrease of 12,144 MBOE as a result of the GC Acquisition and related changes to beour development plan that resulted in the removal of certain legacy PUD locations from the three-year drilling plan. This significant change to our development plan resulted in many of the legacy proved undeveloped locations being removed from the development plan. Consequently, only 806 MBOE, or 2%, of prior year proved undeveloped
reserves converted to proved developed reserves. During 2016, we also developed 3,217 MBOE of acquired proved undeveloped reserves during the year, and we drilled within five years5.4 net exploratory wells. Further, due to a better commodity market environment, our increase in expected drilling activity positively affected our proved undeveloped reserves. While our 2015 reserves estimate assumed no rig initially then an increase to two rigs during the first year, our 2016 reserves estimate assumed two rigs working continually throughout the three-year plan period.
At December 31, 2015, our proved undeveloped reserves were 48,289 MBOE. We drilled 9 net exploratory wells and 4 net development wells during the four months ended December 31, 2015. This generated proved developed reserves from those exploratory wells as well as new proved undeveloped reserves due to direct offset locations. As a result, we recognized an increase in proved undeveloped reserves from extensions of their initial discovery. During 2014, 586,974 Boe17,161 MBOE. The 4 net development wells converted 1,869 MBOE during the four months ended December 31, 2015, or 12%4%, of our proved undeveloped reserves (5 horizontal wells) were convertedas of August 31, 2015 into proved developed reserves, requiring $14.9$17.7 million of drilling and completion capital expenditures. Executing our 2014 capital program resulted in the addition of 13,436,253 Boe inOur proved undeveloped reserves.conversion rate for this four-month period is not comparable to the conversion rate for the full-year periods discussed above and below.
During 2014, a large percentage of our drilling budget was allocated to exploratory wells. During 2015, we expect to allocate a larger percentage to developmental wells. Additionally, to assist with our 2015 drilling schedule, we added a third rig in September 2014.
At August 31, 2013,2015, our proved undeveloped reserves were 4,858,507 Boe. None of41,621 MBOE. We drilled 40 net exploratory wells and one net development well during the year ended August 31, 2015. This generated proved developed reserves from those exploratory wells, as well as new proved undeveloped reserves have beendue to direct offset locations. In addition, our reserve estimates reflect the positive impact of additional offset operator activities within the Wattenberg Field. As a result, we recognized an increase in this category for more than 5 years and all are scheduled to be drilled within five yearsproved undeveloped reserves from extensions of their initial discovery. During 2013, 185,246 Boe17,633 MBOE. The one net development well converted 414 MBOE during the year ended August 31, 2015, or 4%2%, of our proved undeveloped reserves (6 wells) were convertedas of August 31, 2014 into proved developed reserves, requiring $3.6$5.0 million of drilling and completion capital expenditures. ExecutingOur conversion rate during the fiscal year ended August 31, 2015 was affected by our 2013 capital program resultedfocus at that time on delineation of our leasehold rather than immediate development. As discussed above, our development activities and conversion rate have increased significantly since that time.
Delivery Commitments
See "Volume Commitments" in Note 16 to our consolidated financial statements included elsewhere in this report.
Competition and Marketing
We are faced with strong competition from many other companies and individuals engaged in the additionoil and gas business, many of 481,463 Boewhich are very large, well-established energy companies with substantial capabilities and established earnings records. We may be at a competitive disadvantage in proved undeveloped reserves (5 wells).acquiring oil and gas prospects since we must compete with these companies, many of which have greater financial resources and larger technical staffs. It is nearly impossible to estimate the number of competitors; however, it is known that there are a large number of companies and individuals in the oil and gas business.
The transition from vertical drilling to horizontal drilling resulted in a conversion rate of less than 20% of proved undeveloped reserves to proved developed reserves for the year. In addition, the negative revision of 1,051,976 Boe is primarily the result from eliminating previously planned vertical proved undeveloped locations while planning for horizontal development.
Government Regulation
Our operations are substantially affected by federal, state and local laws and regulations. In particular, oil and natural gas production and related operations are, or have been, subject to price controls, taxes and numerous other laws and regulations. All of the jurisdictions in which we own or operate properties for oil and natural gas production have statutory provisions regulating the explorationExploration for and production of oil and natural gas are affected by the availability of pipe, casing and other tubular goods, and certain other oil field equipment including provisionsdrilling rigs and tools. We depend upon independent contractors to furnish rigs, pressure pumping equipment, and tools to drill and complete our wells. Higher prices for oil and natural gas may result in competition among operators for drilling and completion equipment, tubular goods, and drilling and completion crews, which may affect our ability to drill, complete, and work over wells in a timely and cost-effective manner.
The market for oil and natural gas is dependent upon a number of factors that are beyond our control and the effects of which are difficult to predict. These factors include the proximity of wells to, and the capacity of, oil and natural gas pipelines, the extent of competitive domestic production and imports of oil and gas, the availability of other sources of energy, fluctuations in seasonal supply and demand, and governmental regulation. In addition, new legislation may be enacted that would impose price controls or additional excise taxes on oil, natural gas, or both. Oversupplies of oil and natural gas can be expected to occur from time to time and may result in, among other things, producing wells being shut-in. Imports of oil and natural gas may adversely affect the market for domestic oil and natural gas.
The market price for oil is significantly affected by policies adopted by the member nations of the Organization of the Petroleum Exporting Countries or OPEC. Members of OPEC establish production quotas among themselves for petroleum products from time to time with the intent of influencing the global supply of oil and consequently price levels. We are unable to predict the effect, if any, that OPEC, its members, or other countries will have on the amount of, or the prices received for, oil and natural gas.
Natural gas prices are now largely influenced by competition. Competitors in this market include producers, natural gas pipelines and their affiliated marketing companies, independent marketers, and providers of alternate energy supplies, such as
coal. Changes in government regulations relating to the production, transportation, and marketing of natural gas have also resulted in significant changes in the historical marketing patterns of the industry.
General
Our offices are located at 1675 Broadway Suite 2600, Denver, CO 80202. Our office telephone number is (720) 616-4300, and our fax number is (720) 616-4301.
Our Greeley offices includes field offices and an equipment yard.
As of December 31, 2017, we had 122 full-time employees.
Available Information
We make available on our website, www.srcenergy.com, under “Investor Relations, SEC Filings,” free of charge, our annual and transition reports on Form 10-K, quarterly reports on Form 10-Q, current reports on Form 8-K, and amendments to those reports as soon as reasonably practicable after we electronically file or furnish them to the U.S. Securities and Exchange Commission (“SEC”). You may also read or copy any document we file at the SEC's public reference room in Washington, D.C., located at 100 F Street, N.E., Room 1580, Washington D.C. 20549, or may obtain copies of such documents at the SEC's website at www.sec.gov. Please call the SEC at (800) SEC-0330 for further information on the public reference room.
Governmental Regulation
Our operations are subject to various federal, state, and local laws and regulations that change from time to time. Many of these regulations are intended to prevent pollution and protect environmental quality, including regulations related to permitspermit requirements for the drilling of wells, bonding requirements to drill or operate wells, the location of wells, the method of drilling, completing and casing wells, the surface use and restoration of properties upon which wells are drilled, the sourcing and disposal of water used in the drilling and completion process, groundwater testing, air emissions, noise, lighting and traffic abatement, and the plugging and abandonment of wells. Our operationsOther regulations are also subjectintended to various conservation lawsprevent the waste of oil and regulations.natural gas and to protect the rights of owners in a common reservoir. These include regulation of the size of drilling and spacing units or proration units, the number or density of wells whichthat may be drilled in an area, and the unitization or pooling of oil and natural gas wells, and regulations that generally prohibit the venting or flaring of natural gas and that impose certain requirements regarding the ratability or fair apportionment of production from fields and individual wells. In addition, our operations are subject to regulations governing the pipeline gathering and transportation of oil and natural gas as well as various federal, state, and local tax laws and regulations.
Failure to comply with applicable laws and regulations can result in substantial penalties. Our competitors in the oil and natural gas industry are generally subject to the same regulatory requirements and restrictions similar to those that affect our operations. The regulatory burden on the industry increases the cost of doing business and affects profitability. Although we believe we are in substantial compliance with all applicable laws and regulations, such laws and regulations are frequently amended or reinterpreted. Therefore, weWe are unable to predict the future costs or impact of compliance. Additional proposalscompliance with applicable laws and proceedings that affect the natural gas industry are regularly considered by Congress, the states, the Federal Energy Regulatory Commission (“FERC”), and the courts. We cannot predict when or whether any such proposals or proceedings may become effective.regulations.
Regulation of production
Federal, state, and local agencies have promulgated extensive rules and regulations applicable to our oil and natural gas exploration, production, and related operations. Most states require drilling permits, for drilling operations, drillingand operating bonds, and the filing of various reports, concerning operations and imposethe satisfaction of other requirements relating to the exploration and production of oil and natural gas. Many states also have statutes or regulations addressing conservation matters including provisions forgoverning the size of drilling and spacing units or proration units, the density of wells, and the unitization or pooling of oil and natural gas properties,properties. The number of drilling locations available to us will depend in part on the establishmentspacing of maximum rateswells in our operating areas. An increase in well density in an area could result in additional locations in that area, but a reduced production performance from the area on a per-well basis. In addition, certain of production from oilthe horizontal wells we intend to drill may require pooling of our lease interests with the interests of third parties. Some states like Colorado allow the forced pooling or integration of tracts to facilitate exploration while other states rely primarily or exclusively on the voluntary pooling of lands and gas wells andleases. In areas with voluntary pooling, it may be more difficult to develop a project if the regulationoperator owns less than 100% of spacing, plugging and abandonmentthe leasehold, or one or more of such wells. Thethe leases do not provide the necessary pooling authority. Further, the statutes and regulations of some states limit the rate at which oil and natural gas is produced from properties, prohibit the venting or flaring of natural gas, and impose requirements regarding the ratability of production. This may limit the amount of oil and natural gas that we can produce from our properties.wells and may limit the number of wells or locations at which we can drill. The federal and state regulatory burden on the oil and natural gas industry increases our cost of doing business and affects our profitability. Because these rules and regulations are amended or reinterpreted frequently, we are unable to predict the future cost or impact of complying with these laws.
The Colorado Oil and Gas Conservation Commission (“COGCC”) is the primary regulator of exploration and production of oil and gas resources in the principal area in which we operate. Via the permitting and inspection process,The COGCC regulates oil and gas operators through rules, policies, written guidance, orders, permits, and amonginspections. Among other criteria,things, the COGCC enforces specifications regarding drilling, development, production, abandonment, enhanced recovery, safety, aesthetics, noise, waste, flowlines, and wildlife. In recent years, the mechanical integrity of wells as well as the preventionCOGCC has amended its existing regulatory requirements and mitigation of adverse environmental impacts.adopted new requirements with increased frequency. For example, in August 2013January 2016, the COGCC implementedapproved new setback rules that require local government consultation and certain best management practices for large-scale oil and natural gas wells and production facilities near occupied buildings. The COGCC increased its setback distance to a uniform 500 feet statewide setback from occupied buildings and a uniform 1,000 feet statewide setback from high occupancy building units. The new setbackin certain urban mitigation areas. These rules also require operatorsoperator registration and/or notifications to utilize increased mitigation measures to limit potential drilling impacts to surface owners and the owners of occupied building units. The new rules also require operators to provide advance notice to surface owners within 500 feet of proposed operations, the owners of occupied buildings within 1,000 feet of proposed operations, and local governments priorwith respect to the filing of an Application for Permit to Drill or Oil and Gas Location Assessment. The new rules include expanded outreach and communication efforts by an operator. Additionally, in January 2013, the COGCC also approved two rules that require operators to sample groundwater for hydrocarbons and other indicator compounds both before and after drilling. The new statewide rule requires sampling of up to four water wells within a half mile radius of a newfuture oil and natural gas well before drilling, two samples between six and 12 months after completion, and two more samples between five and six years after completion. The revised rule for the Greater Wattenberg Area requires operators to sample one water well per quarter governmental section before drilling and between six to 12 months after completion.production facility locations. The COGCC also approved new rules in 2013, 2014 and 2015.
Regulation of sales and transportation of natural gas
Historically, the transportation and sales for resale of natural gas in interstate commerce have been regulated pursuant to the Natural Gas Act of 1938 (“NGA”), the Natural Gas Policy Act of 1978, and the Federal Energy Regulatory Commission (“FERC”) regulations. Effective January 1, 1993, the Natural Gas Wellhead Decontrol Act deregulated the price for all “first sales” of natural gas. Thus, all ofAs a result, our sales of natural gas may be made at market prices, subject to applicable contract provisions. Sales of natural gas are affected by the availability, terms and cost of pipeline transportation. Since 1985, the FERC has implemented regulations intended to make natural gas transportation more accessible to gas buyers and sellers on an open-access, non-discriminatory basis. We cannot predict what further action the FERC will take on these matters. Some of the FERC's more recent proposals may, however, adversely affect the availability and reliability of interruptible transportation service on interstate pipelines. Wematters, but we do not believe that we will be affected by any action taken materially differently than other natural gas producers, gatherers, and marketers with which we compete.
Our natural gas sales are generally made at the prevailing market price at the time of sale. Therefore, even though we sell significant volumes to major purchasers, we believe that other purchasers would be willing to buy our natural gas at comparable market prices.
Natural gas continues to supply a significant portion of North America's energy needs and we believe the importance of natural gas in meeting this energy need will continue. The impact of the ongoing economic downturn on natural gas supply and demand fundamentals has resulted in extremely volatile natural gas prices, which is expected to continue.
OnIn August 8, 2005, the Energy Policy Act of 2005 (the “2005 EPA”) was signed into law. This comprehensive act contains many provisions that will encourage oil and gas exploration and development in the U.S. The 2005 EPA directs the FERC Bureau of Ocean Energy Management (“BOEM”) and other federal agencies to issue regulations that will further the goals set out in the 2005 EPA. The 2005 EPA amends the NGA to make it unlawful for “any entity”,entity,” including otherwise non-jurisdictional producers, such as us, to use any deceptive or manipulative device or contrivance in connection with the purchase or sale of natural gas or the purchase or sale of transportation services subject to regulation by the FERC, in contravention of rules prescribed by the FERC. On January 20, 2006, the FERC issued rules implementing this provision. The rulesprovision make it unlawful in connection with the purchase or sale of natural gas subject to the jurisdiction of the FERC, or the purchase or sale of transportation services subject to the jurisdiction of the FERC, for any entity, directly or indirectly, to use or employ any device, scheme, or artifice to defraud; to make any untrue statement of material fact or omit to make any such statement necessary to make the statements made not misleading; or to engage in any act or practice that operates as a fraud or deceit upon any person. The newThis anti-manipulation rule does not apply to activities that relate only to intrastate or other non-jurisdictional sales or gathering, but does apply to activities of otherwise non-jurisdictional entities to the extent the activities are conducted “in connection with” natural gas sales, purchases, or transportation subject to FERC jurisdiction. It therefore reflects a significant expansion of the FERC's enforcement authority. To date, we do not believe we have been, nor do we anticipate we will be affected any differently than other producers of natural gas.
In 2007, the FERC issued a final rule on annual natural gas transaction reporting requirements, as amended by subsequent orders on rehearing (“Order 704”). Under Order 704, wholesale buyers and sellers of more than 2.2 million MMBtu of physical natural gas in the previous calendar year, including interstate and intrastate natural gas pipelines, natural gas gatherers, natural gas processors, and natural gas marketers, are now required to report, on May 1 of each year, beginning in 2009, aggregate volumes of natural gas purchased or sold at wholesale in the prior calendar year to the extent such transactions utilize, contribute to, or may contribute to the formation of price indices. It is the responsibility of the reporting entity to determine which individual transactions should be reported based on the guidance of Order 704. The monitoring and reporting required by these rules have increased our administrative costs. To date, we do
Gathering is exempt from federal regulation under the NGA, but is subject to various state regulations, which include safety, environmental, and in some circumstances, nondiscriminatory take requirements. FERC has in the past reclassified transportation facilities previously considered to be subject to FERC jurisdiction as non-jurisdictional gathering facilities, and conversely, has also reclassified non-jurisdictional gathering facilities as subject to FERC jurisdiction. Any such changes could result in an increase to our costs of transporting gas to point-of-sale locations.
Transportation and safety of natural gas is also subject to other federal and state laws and regulations, including regulation by the Department of Transportation under the Pipeline Inspection, Protection, Enforcement, and Safety Act of 2006 and the Pipeline Safety, Regulatory Certainty, and Job Creation Act of 2012. The failure to comply with these rules and regulations can result in substantial penalties.
Our production and gathering facilities are not believe we have been, nor do we anticipate that we willsubject to jurisdiction of the FERC. Our natural gas sales prices, however, continue to be affected any differently than other producersby intrastate and interstate gas transportation because the cost of transporting the natural gas.gas once sold to the consuming market is a factor in the prices we receive, along with the availability and terms of such transportation. Competition among suppliers has greatly increased in recent years. Our natural gas sales are generally made at the prevailing market price at the time of sale.
Regulation of sales and transportation of oil
Our sales of crude oil are affected by the availability, terms, and cost of transportation. Interstate transportation of oil by pipeline is regulated by the FERC pursuant to the Interstate Commerce Act (“ICA”), the Energy Policy Act of 1992, and the rules and regulations promulgated under those laws. The ICA and its implementing regulations require that tariff rates for interstate service ontransportation of oil, pipelines, including interstate pipelines that transport crude oilnatural gas liquids and refined products (collectively referred to as “petroleum pipelines”) be just and reasonable and non-discriminatory and that such rates and terms and conditions of service be filed with FERC.are subject to FERC regulation.
Intrastate oil pipeline transportation rates are subject to regulation by state regulatory commissions.commissions in some jurisdictions. The basis for intrastate oil pipeline regulation, and the degree of regulatory oversight and scrutiny given to intrastate oil pipeline rates, varies from state to state.
Insofar as effective, interstate and intrastate rates are equally applicable to all comparable shippers, and accordingly, we do not believe that the regulation of oil transportation rates will not affect our operations in any way that is of material difference frommaterially different than those of our competitors who are similarly situated.
Regulation of derivatives and reporting of government payments
The Dodd-Frank Wall Street Reform and Consumer Protection Act (the “Dodd-Frank Act”) was passed by Congress and signed into law in July 2010. The Dodd-Frank Act is designed to provide, among other things, a comprehensive framework for
the regulation of the over-the-counter derivatives market with the intent to provide greater transparency and reduction of risk between counterparties. The Dodd-Frank Act subjects swap dealers and major swapcertain derivative market participants to a variety of capital, margin, and marginother requirements and requires many derivative transactions to be cleared on exchanges. The Dodd-Frank Act provides for a potential exemptionexemptions from certain of these clearing and cash collateral requirements for commercial end-users. In addition, in August 2012, the SEC issued a final rule under Section 1504 of the Dodd-Frank Act, Disclosure of Payment by Resource Extraction Issuers, which would have required resource extraction issuers, such as us, to file annual reports that provide information about the type and total amount of payments made for each project related to the commercial development of oil, natural gas, or minerals to each foreign government and the federal government. In July 2013, the U.S. District Court for the District of Columbia vacated the rule, and the SEC has announced it will not appeal the court's decision. However, the SEC may propose revised resource extraction payments disclosure rules applicable to our business.
Environmental Regulations
As with the oil and natural gas industry in general, our properties are subject to extensive and changing federal, state, and local laws and regulations designed to protect and preserve natural resources and the environment. The recent trendLong-term trends in environmental legislation and regulation isare generally toward stricter standards, and this trend is likely to continue. These laws and regulations often require a permit or other authorization before construction or drilling commences and for certain other activities; limit or prohibit access, seismic acquisition, construction, drilling, and other activities on certain lands lying within wilderness and other protected areas; mandate requirements and standards for operations; impose substantial liabilities and remedial obligations for pollution resulting from our operations;pollution; and require the reclamation of certain lands.
The permits required for many of our operations are subject to revocation, modification, and renewal by issuing authorities. Governmental authorities have the power to enforce compliance with their regulations, and violations are subject to fines, injunctions, or both. In March 2015, the opinion of our management, we are in substantial compliance with current applicable environmental lawsCOGCC implemented regulatory and statutory amendments that significantly increased the potential penalties for violating the Colorado Oil and Gas Conservation Act or its implementing regulations, and we have no material commitments for capital expenditures to comply with existing environmental requirements. Nevertheless, changes in existing environmental laws and regulationsorders, or in their interpretation could have a significant impact on us, as well as the oil and natural gas industry in general.permits.
The Comprehensive Environmental Response, Compensation, and Liability Act (“CERCLA”) and comparable state statutes impose strict and joint and several liabilitiesliability on owners and operators of certain sites and on persons who disposed of or arranged for the disposal of “hazardous substances” found at such sites. Persons responsible for the release or threatened release of hazardous substances under CERCLA may be subject to liability for the costs of cleaning up those substances and for damages to natural resources. It is not uncommon for the neighboring landowners and other third parties to file claims for personal injury and property damage allegedly caused by the hazardous substances released into the environment. The Resource Conservation and Recovery Act (“RCRA”) and comparable state statutes govern the disposal of “solid waste” and “hazardous waste” and authorize imposition of substantial fines and penalties for noncompliance. Although CERCLA currently excludes petroleum from its definition of “hazardous substance,” state laws affecting our operations impose clean-up liability relating to petroleum and petroleum relatedpetroleum-related products. In addition, althoughThe Resource Conservation and Recovery Act (“RCRA”) and comparable state statutes govern the disposal of “solid waste” and “hazardous waste” and authorize the imposition of substantial fines and penalties for noncompliance. Although RCRA classifies certain oil field wastes as “non-hazardous,non-hazardous "solid wastes,” such exploration and production wastes could be reclassified as hazardous wastes, thereby making such wastes subject to more stringent handling and disposal requirements. A proposed consent decree filed in December 2016 between the Environmental Protection Agency ("EPA") and certain environmental groups commits the EPA to deciding whether to revise its RCRA Subtitle D criteria regulations and state plan guidelines for the oil and natural gas sector by March 2019.
Certain of our operations are subject to the federal Clean Air Act (“CAA”) and similar state and local requirements. The CAA may require certain pollution control requirements with respect to air emissions from our operations. The EPA and states continue to develop regulations to implement these requirements. We may be required to incur certain capital expenditures in the next several years for air pollution control equipment in connection with maintaining or obtaining operating permits and approvals addressing other air-emission-related issues. Greenhouse gas recordkeeping and reporting requirements under the CAA took effect in 2011 and impose increased administrative and control costs. Federal agencies are also consideringNew Source Performance Standards regarding oil and gas operations (“NSPS OOOO”) took effect in 2012, with more subsequent amendments, all of which have likewise added administrative and operational costs. In June 2016, EPA finalized new regulations under the CAA to reduce methane emissions from new and modified sources in the oil and natural gas sector (the “NSPS OOOOa”). These new regulations impose, among other things, new requirements for leak detection and repair, control requirements at oil well completions, and additional regulation of hydraulic fracturing.control requirements for gathering, boosting, and compressor stations. The EPA has prepared draft guidance for issuing underground injection permits that would regulate hydraulic fracturing using diesel fuel, whereproposed a two-year stay of the effective dates of several requirements of NSPS OOOOa. Concurrent with the proposed methane rules, the EPA hasalso finalized a new rule regarding source determinations and permitting authorityrequirements for the onshore oil and gas industry under the SDWA; this guidance eventuallyCAA. Colorado adopted new regulations to meet the requirements of NSPS OOOO and promulgated significant new rules in February 2014 relating specifically to oil and natural gas operations that are more stringent than NSPS OOOO and directly regulate methane emissions from affected facilities.
In October 2015, the EPA lowered the national ambient air quality standard (“NAAQS”) for ozone under the CAA from 75 parts per billion to 70 parts per billion. Any resulting expansion of the ozone nonattainment areas in Colorado could encourage other regulatory authoritiescause oil and natural gas operations in such areas to adoptbecome subject to more stringent emissions controls, emission offset requirements, and increased permitting delays and other restrictions on the use of hydraulic fracturing.costs. In addition, on October 21, 2011,the ozone nonattainment status for the Denver Metro North Front Range Ozone 8-Hour Non-Attainment area was bumped up by the EPA announced its intentionfrom “marginal” to propose regulations“moderate” as a result of the area failing to attain the 2008 ozone NAAQS by 2014the applicable attainment date of July 20, 2015. In 2016, the state of Colorado undertook a
rulemaking to address the new “moderate” status, culminating in, among others, the incorporation of two existing state-only requirements for oil and natural gas operations into the federally-enforceable State Implementation Plan ("SIP"). During the fall of 2016, EPA also issued final Control Techniques Guidelines ("CTGs") for reducing volatile organic compound emissions from existing oil and natural gas equipment and processes in ozone non-attainment areas, including the Denver Metro North Front Range Ozone 8-hour Non-Attainment area. In 2017, Colorado adopted new and more stringent air quality control requirements. The Denver Metro/North Front Range NAA is at risk of being reclassified again to “serious” if it does not meet the 2008 NAAQS by 2018 or obtain an extension of the deadline from the EPA. A “serious” classification would trigger significant additional obligations for the state under the CAA and could result in new and more stringent air quality control requirements becoming applicable to our operations and significant costs and delays in obtaining necessary permits. This process could result in new or more stringent air quality control requirements applicable to our operations.
The federal Clean Water Act to regulate wastewater discharges from hydraulic fracturing(“CWA”) and analogous state laws impose requirements regarding the discharge of pollutants into waters of the U.S. and the state, including spills and leaks of hydrocarbons and produced water. The CWA also requires approval for the construction of facilities in wetlands and other waters of the U.S., and it imposes requirements on storm water run-off. In June 2016, the EPA finalized new CWA pretreatment standards that would prevent onshore unconventional oil and natural gas production. Thewells from discharging wastewater pollutants to public treatment facilities. In June 2015, the EPA is also collecting information as partand the U.S. Army Corps of Engineers adopted a nationwide study into the effectsnew regulatory definition of hydraulic fracturing on drinking water. The EPA issued a progress report regarding the study in December 2012, which described generally the continuing focus“waters of the study, but did not provide any data, findings, or conclusions regardingU.S.,” which governs which waters and wetlands are subject to the safetyCWA. This rule has been stayed pending resolution of hydraulic fracturing operations. Theongoing litigation. On January 31, 2018, the EPA intends to issuesigned a final draft report for peer review and comment in 2014. The results of this study, which is still ongoing, could result in additional regulations, which could lead to operational burdens similar to those described above. The EPA also has initiated a stakeholder and potential rulemaking process underrule delaying the Toxic Substances Control Act (“TSCA”) to obtain data on chemical substances and mixtures used in hydraulic fracturing, and recently published in the Federal Register a petition from national environmental advocacy groups seeking to include the oil and gas sector in the Toxics Release Inventory reporting program established for many industries under TSCA. The United States Departmentapplicability date of the Interior has also proposed a new rule regulating hydraulic fracturing activities on federal lands, including requirements for disclosure, well bore integrity and handling of flowback water. In addition, the U.S. Occupational Safety and Health Administration has proposed stricter standards for worker exposure to silica, which would apply to use of sand as a proppant for hydraulic fracturing.
The EPA recently amended the Underground Injection Control, (“UIC”) provisions“waters of the federal Safe Drinking Water Act (the “SDWA”)U.S.” for several years while the EPA continues to exclude hydraulic fracturing fromconduct a substantive re-evaluation of the definition of “underground injection.” However,“waters of the U.S. Senate and House of Representatives are currently considering the Fracturing Responsibility and Awareness of Chemicals Act (the “FRAC Act”), which will amend the SDWA to repeal this exemption. If enacted, the FRAC Act would amend the definition of “underground injection” in the SDWA to encompass hydraulic fracturing activities, which could require hydraulic fracturing operations to meet permitting and financial assurance requirements, adhere to certain construction specifications, fulfill monitoring, reporting, and recordkeeping obligations, and meet plugging and abandonment requirements.”
The FRACEndangered Species Act also proposesrestricts activities that may affect endangered or threatened species or their habitats. Some of our operations may be located in areas that are or may be designated as habitats for threatened or endangered species. Similar protections are offered to requiremigratory birds under the reportingMigratory Bird Treaty Act and public disclosurebald and golden eagles under the Bald and Golden Eagle Protection Act. In such areas, we may be prohibited from conducting operations at certain locations or during certain periods, and we may be required to develop plans for avoiding potential adverse effects. In addition, certain species are subject to varying degrees of chemicals used in the fracturing process, which could make it easier for third parties opposing the hydraulic fracturing process to initiate legal proceedings based on allegations that specific chemicals used in the fracturing process could adversely affect groundwater. While no federal law is presently in place, some states have enacted laws pertaining to chemical disclosure. In December 2011, the State of Colorado approved regulation requiring parties engaged in hydraulic fracturing to disclose the concentrations of the chemicals used in the process. The regulation went into effect in April 2012 and requires the reporting of additives used.protection under state laws.
15
Federal laws including the CWA require certain owners or operators of facilities that store or otherwise handle oil and produced water to prepare and implement spill prevention, control, countermeasure, and response plans addressing the possible discharge of oil into surface waters. The Oil Pollution Act of 1990 (“OPA”) subjects owners and operators of facilities to strict and joint and several liability for all containment and cleanup costs and certain other damages arising from oil spills, including the government’s response costs. Spills subject to the OPA may result in varying civil and criminal penalties and liabilities.On December 15,
In 2009, the EPA published its findings that emissions of carbon dioxide, methane, and other greenhouse gases ("GHGs") present an endangerment to humanpublic health and the environment because emissions of such gases are, according to the EPA, contributing to the warming of the earth’sEarth's atmosphere and other climatic changes. Theseconditions. Based on these findings, by the EPA allowedadopted regulations under the agency to proceed with the adoptionCAA that, among other things, established Prevention of Significant Deterioration (“PSD”), construction and implementation of regulations that would restrict emissions of greenhouse gases under existing provisions of the federal Clean Air Act.
Consequently, the EPA proposed two sets of regulations that would require a reduction in emissions of greenhouse gases from motor vehicles and, also, could triggerTitle V operating permit reviewreviews for greenhouse gasGHG emissions from certain large stationary sources.sources that are already major sources of emissions of regulated pollutants. In addition,a subsequent ruling, the U.S. Supreme Court upheld a portion of EPA’s GHG stationary source program, but invalidated a portion of it. The Court held that stationary sources already subject to the PSD or Title V program for non-GHG criteria pollutants remained subject to GHG best available control technology ("BACT") requirements, but ruled that sources subject to the PSD or Title V program only for GHGs could not be forced to comply with GHG BACT requirements. Upon remand, the D.C. Circuit issued an amended judgment, which, among other things, vacated the PSD and Title V regulations under review in that case to the extent they require a stationary source to obtain a PSD or Title V permit solely because the source emits or has the potential to emit GHGs above the applicable major source thresholds. In October 2016, EPA issued a proposed rule to revise its PSD and Title V regulations applicable to GHGs in accordance with these court rulings, including proposing a de minimis level of GHG emissions below which BACT is not required. Depending on October 30, 2009, thewhat EPA publisheddoes in a final rule, it is possible that any regulatory or permitting obligation that limits emissions of GHGs could extend to smaller stationary sources and require us to incur costs to reduce and monitor emissions of GHGs associated with our operations and also adversely affect demand for the oil and natural gas that we produce.
In addition, the EPA has adopted rules requiring the monitoring and annual reporting of greenhouse gasGHG emissions from specified large greenhouse gasGHG emission sources in the United States, beginningincluding certain onshore oil and natural gas production sources, which include certain of our operations. While Congress has not enacted significant legislation relating to GHG emissions, it may do so in 2012 forthe future and, moreover, several state and regional initiatives have been enacted aimed at monitoring and/or reducing GHG emissions occurring in 2011.through cap and trade programs.
Also,
The adoption of new laws, regulations, or other requirements limiting or imposing other obligations on June 26, 2009,GHG emissions from our equipment and operations, and the U.S. Houseimplementation of Representatives passed the American Clean Energy and Security Act of 2009 (the “ACESA”) which would establish an economy-wide cap-and-trade programrequirements that have already been adopted, could require us to incur costs to reduce United States emissions of greenhouse gases including carbon dioxide and methane that may contribute to the warming of the Earth’s atmosphere andGHGs associated with our operations. In addition, substantial limitations on GHG emissions in other climatic changes. If it becomes law, ACESA would require a 17% reduction in greenhouse gas emissions from 2005 levels by 2020 and just over an 80% reduction of such emissions by 2050. Under this legislation, the EPA would issue a capped and steadily declining number of tradable emissions allowances to certain major sources of greenhouse gas emissions so that such sources could continue to emit greenhouse gases into the atmosphere. These allowances would be expected to escalate significantly in cost over time. The net effect of ACESA will be to impose increasing costs on the combustion of carbon-based fuelssectors, such as oil, refined petroleum products and natural gas.
Climate change has emerged as an important topic in public policy debate regarding our environment. It is a complex issue, with some scientific research suggesting that rising global temperatures are the result of an increase in greenhouse gases, which may ultimately pose a risk to society and the environment. Products produced bypower sector under EPA’s August 2015 Clean Power Plan, could adversely affect demand for the oil and natural gas explorationthat we produce. In March 2017, President Trump signed the Executive Order on Energy Independence which, among other things, called for a review of the Clean Power Plan. The EPA subsequently published a proposed rule to repeal the Clean Power Plan in October 2017. A final rule is expected following a comment period.
Further GHG regulation may result from the December 2015 agreement reached at the United Nations climate change conference in Paris. Pursuant to the agreement, the United States made an initial pledge to a 26-28% reduction in its GHG emissions by 2025 against a 2005 baseline and production industry are a sourcecommitted to periodically update its pledge in five yearly intervals starting in 2020. GHG emissions in the earth’s atmosphere have also been shown to produce climate changes that have significant physical effects, such as increased frequency and severity of certain greenhouse gases, namely carbon dioxidestorms, floods, and methane, and future restrictions on the combustionother climatic events, any of fossil fuels or the venting of natural gaswhich could have a significant impactan adverse effect on our future operations. In June 2017, President Trump announced that the United States would initiate the formal process to withdraw from the Paris Agreement.
Hydraulic Fracturing
We operate primarily in the Wattenberg Field of the D-J Basin where the rock formations are typically tight, and it is a common practice to utilizeuse hydraulic fracturing to allow for or increase hydrocarbon production. Hydraulic fracturing involves the process of forcing a mixture of fluidinjecting substances such as water, sand, and white sandadditives (some proprietary) under pressure into a targeted subsurface formation to create pores and fractures, thus creating a passageway for the release of oil and gas. All of our producing wells were hydraulic fracturedHydraulic fracturing is a technique that we commonly employ and we expect to employ the technique extensively in future wells that we drill and complete.
We outsource all hydraulic fracturing services to service providers with significant experience, and which we deem to be competent and responsible. Our service providers supply all personnel, equipment, and materials needed to perform each stimulation, including the chemical mixtures that are injected into our wells. These mixtures primarily consist of water and sand, with nominal amounts of other ingredients used as accelerants and proppants. The additional ingredients are designed to improve the resulting porosity of the shale and include food based compounds commonly found in consumer products. This mixture is injected into our wells at pressures of 4,500-6,000 psi at injection rates that that range between 25-55 barrels of mixture per minute. On average, a single stage stimulation will utilize approximately 4,500 barrels of water and 150,000 pounds of sand.
We require our service companies to carry adequate insurance covering incidentsvarious losses and liabilities that could occurarise in connection with their activities. Ouractivities; however, insurance may not be available or adequate to cover losses and liabilities incurred, or may be prohibitively expensive relative to the perceived risk. In addition to the drilling permit that we are required to obtain and the notice of intent that we provide the appropriate regulatory authorities, our service providers are responsible for obtaining any regulatory permits necessary for them to perform their services in the respectiverelevant geographic location. We have not had any incidents, citations or lawsuits relating to any environmental issues resulting from hydraulic fracture stimulation and we are not presently aware of any such matters.
In recent years, environmental opposition to hydraulic fracturing has increased, and various governmental and regulatory authorities have adopted or are considering new requirements for this process. To the adequacy of current regulations.extent that these requirements increase our costs or restrict our development activities, our business and prospects may be adversely affected.
The federalEPA has asserted that the Safe Drinking Water Act (“SDWA”) applies to hydraulic fracturing involving diesel fuel, and in February 2014, it issued final guidance on this subject. The guidance defines the term “diesel fuel,” describes the permitting requirements that apply under SDWA comparable state statutes may restrictfor the disposal, treatment or releaseunderground injection of water produced or used during oildiesel fuel in hydraulic fracturing, and gas development. Subsurface emplacement of fluids, primarily via disposal wells or enhanced oil recovery (“EOR”) wells, is governed by federal ormakes recommendations for permit writers. Although the guidance applies only in those states, excluding Colorado, where the EPA directly implements the Underground Injection Control Class II program, it could encourage state regulatory authorities to adopt permitting and other requirements for hydraulic fracturing. In addition, from time to time, Congress has considered legislation that in some cases, include the state oil and gas regulatory or the state's environmental authority. The 2005 EPA amended the UIC, provisions of the SDWA to expressly exclude certain hydraulic fracturing from the definition of "underground injection," but disposalwould provide for broader federal regulation of hydraulic fracturing fluids and produced water or their injection for EOR is not excluded. The U.S. Senate and House of Representatives have considered bills to repeal this SDWA exemption forunder the SDWA. If such legislation were enacted, operators engaged in hydraulic fracturing. If enacted, hydraulic fracturing operations could be required to meet additional federal permitting and financial assurance requirements, adhere to certain construction specifications, fulfill monitoring, reporting, and recordkeeping obligations, meet plugging and abandonment requirements, and provide additional public disclosure of the chemicals used in the fracturing process as a consequence of additional SDWA permitting requirements.process.
Federal agencies are also considering additional regulation of hydraulic fracturing. The EPA has prepared draft guidance for issuing underground injection permits that would regulate hydraulic fracturing using diesel fuel, where the EPA has permitting authority under the SDWA; this guidance eventually could encourage other regulatory authorities to adopt permitting and other restrictions on the use of hydraulic fracturing. In addition, on October 21, 2011, the EPA announced its intention to propose regulations by 2014 under the federal Clean Water Act to regulate wastewater discharges from hydraulic fracturing and other natural gas production. The EPA is also collecting information as part ofconducted a nationwide study into the effects of hydraulic fracturing on drinking water. TheIn June 2015, the EPA issuedreleased a progress report regarding thedraft study in December 2012, which described generally the continuing focus of the study, but did not provide any data, findings, or conclusions regarding the safety of hydraulic fracturing operations. The EPA intends to issue a final draft report for peer review and comment in 2014.comment. The resultsdraft report did not find evidence of this study, which is still ongoing, could result in additional regulations, which could leadwidespread systemic impacts to operational burdens similar to those described above.drinking water, but did find a relatively small number of site-specific impacts. The EPA noted that these results could indicate that such effects are rare or that other limiting factors exist. In December 2016, EPA released the final report on impacts from hydraulic fracturing activities on drinking water, concluding that hydraulic fracturing activities can impact drinking water resources under some circumstances and identifying some factors that could influence these impacts.
Federal agencies have also has initiatedadopted or are considering additional regulation of hydraulic fracturing. In March 2016, the U.S. Occupational Safety and Health Administration (“OSHA”) issued a stakeholderfinal rule, with effective dates of 2018 and potential2021 for the hydraulic fracturing industry, which imposes stricter standards for worker exposure to silica, including worker exposure to sand in hydraulic fracturing. In May 2014, the EPA issued an advance notice of proposed rulemaking process under the Toxic Substances
Control Act (“TSCA”) to obtain data on chemical substances and mixtures used in hydraulic fracturing, and recently published infracturing. In March 2015, the Federal Register a petition from national environmental advocacy groups seeking to include the oil and gas sector in the Toxics Release Inventory reporting program established for many industries under TSCA. The United States DepartmentBureau of the Interior has also proposedLand Management (“BLM”) issued a new rule regulating hydraulic fracturing activities oninvolving federal and tribal lands and minerals, including requirements for chemical disclosure, well borewellbore integrity and handling of flowback and produced water. In addition,The BLM rescinded the U.S. Occupational Safety and Health Administrationrule in December 2017; however, the BLM’s rescission has proposed stricter standards for worker exposure to silica, which would apply to usebeen challenged by several states in the United States District Court of sand as a proppant for hydraulic fracturing.the District of Northern California.
In November 2016, the BLM finalized rules to further regulate venting, flaring, and leaks during oil and natural gas production activities on onshore federal and Indian leases. The rules became effective in January 2017, but are subject to ongoing litigation. In December 2017, the BLM published a rule to temporarily suspend or delay certain rule requirements until January 2019; that rule is also the subject of litigation in federal court.
In Colorado, the primary regulator is the COGCC, which requires parties engaged inhas adopted regulations regarding chemical disclosure, pressure monitoring, prior agency notice, emission reduction practices, and offset well setbacks with respect to hydraulic fracturing to disclose the concentrationsoperations. As part of thethese requirements, operators must report all chemicals used in hydraulically fracturing a well to a publicly searchable registry website developed and maintained by the process. Ground Water Protection Council and the Interstate Oil and Gas Compact Commission.
Apart from these ongoing federal and state initiatives, local governments are adopting new requirements and restrictions on hydraulic fracturing and other oil and gas operations. Some countieslocal governments in Colorado, for instance, have amended their land use regulations to impose new requirements on oil and gas development, while other local governments have entered into memoranda of agreement with oil and gas producers to accomplish the same objective. BeyondIn addition, during the past few years, five Colorado cities have passed voter initiatives temporarily or permanently prohibiting hydraulic fracturing. Local district courts have struck down the ordinances for certain of those Colorado cities, and these decisions were upheld by the Colorado Supreme Court in May 2016. Nevertheless, there is a continued risk that in 2012, Longmont, Colorado prohibitedcities will adopt local ordinances that seek to regulate the usetime, place, and manner of hydraulic fracturing. Thefracturing activities, and oil and gas industry and the Stateoperations generally, within their respective jurisdictions.
During 2014, opponents of hydraulic fracturing also sought statewide ballot initiatives that would have challenged that ban, and the authority of local jurisdictions to regulaterestricted oil and gas development in court. InColorado by, among other things, significantly increasing the setback between oil and natural gas wells and occupied buildings. These initiatives were withdrawn from the November 2013, four other Colorado cities2014 ballot in return for the creation of a task force to craft recommendations for minimizing land use conflicts over the location of oil and counties passed voter initiatives either placing a moratorium onnatural gas facilities.
During 2016, opponents of hydraulic fracturing or banning new oil and gas development. Theseagain advanced various options for ballot initiatives are also the subject of pending legal challenge. While these initiatives cover areas with little recent or ongoingrestricting oil and gas development they could lead opponentsin Colorado. Proponents of hydraulic fracturingtwo such initiatives attempted to pushqualify the initiatives to appear on the ballot for statewide referendums, especially in Colorado.
Competitionthe November 2016 election. One would have amended the Colorado constitution to impose a minimum distance of 2,500 feet between wells and Marketing
We are faced with strong competition from many other companies and individuals engaged inany occupied structures or "areas of special concern". If implemented, this proposal would have made the vast majority of the surface area of the state ineligible for drilling, including substantially all of our planned future drilling locations. The second proposal would have amended the state constitution to give local governmental authorities the ability to regulate, or to ban, oil and gas business, many of which are very large, well established energy companies with substantial capabilities and established earnings records. We may be at a competitive disadvantage in acquiring oil and gas prospects since we must compete with these individuals and companies, many of which have greater financial resources and larger technical staffs. It is nearly impossible to estimate the number of competitors; however, it is known that there are a large number of companies and individuals in the oil and gas business.
Exploration forexploration, development, and production of oilactivities within their boundaries notwithstanding state rules and gas are affected by the availability of pipe, casing and other tubular goods and certain other oil field equipment including drilling rigs and tools. We depend upon independent drilling contractors to furnish rigs, equipment and tools to drill our wells. Higher prices for oil and gas may result in competition among operators for drilling equipment, tubular goods and drilling crews, which may affect our ability expeditiously to drill, complete, recomplete and work-over wells.
The market for oil and gas is dependent upon a number of factors beyond our control, which at times cannot be accurately predicted. These factors include the proximity of wells to, and the capacity of, natural gas pipelines, the extent of competitive domestic production and imports of oil and gas, the availability of other sources of energy, fluctuations in seasonal supply and demand, and governmental regulation. In addition, there is always the possibility that new legislation may be enacted, which would impose price controls or additional excise taxes upon crude oil or natural gas, or both. Oversupplies of natural gas can be expected to recur from time to time and may result in the gas producing wells being shut-in. Imports of natural gas may adversely affect the market for domestic natural gas.
The market price for crude oil is significantly affected by policies adopted by the member nations of Organization of Petroleum Exporting Countries (“OPEC”). Members of OPEC establish prices and production quotas among themselves for petroleum products from time to time with the intent of controlling the current global supply and consequently price levels. We are unable to predict the effect, if any, that OPEC or other countries will have on the amount of, or the prices received for, crude oil and natural gas.
Gas prices, which were once effectively determined by government regulations, are now largely influenced by competition. Competitors in this market include producers, gas pipelines and their affiliated marketing companies, independent marketers, and providers of alternate energy supplies, such as residual fuel oil. Changes in government regulations relatingapprovals to the production, transportation and marketing of natural gas have also resulted in significant changes in the historical marketing patterns of the industry.
Generally, these changescontrary. If implemented, this proposal could have resulted in us becoming subject to onerous, and possibly inconsistent, regulations that vary from jurisdiction to jurisdiction, or to outright bans on our activities in various jurisdictions. In August 2016, the abandonment by many pipelinesColorado Secretary of long-term contracts forState issued a press release and statements of insufficiency of signatures, stating that the purchaseproponents of natural gas, the development by gas producersproposals had failed to collect enough valid signatures to have the proposals included on the ballot. However, similar proposals may be made in 2018 and in subsequent years. Because a substantial portion of their own marketing programsour operations and reserves are located in Colorado, the risks we face with respect to take advantagesuch future proposals are greater than those of new regulations requiring pipelines to transport gas for regulated fees,our competitors with more geographically diverse operations. Although we cannot predict the outcome of future ballot initiatives, statutes, or regulatory developments, such developments could materially impact our results of operations, production, and an increasing tendency to rely on short-term contracts priced at spot market prices.reserves.
General
Our offices are located at 20203 Highway 60, Platteville, CO 80651. Our office telephone number is (970) 737-1073 and our fax number is (970) 737-1045.
Our Platteville offices, including headquarters and field offices, and an equipment yard are rented to us pursuant to a lease with HS Land & Cattle, LLC, a firm controlled by Ed Holloway and William E. Scaff, Jr., our Co-Chief Executive Officers. The 2014 lease, which expired on July 1, 2014, required monthly payments of $15,000. The 2015 lease, which expires on July 1, 2015, also requires monthly payments of $15,000.
We also occupy office space in Denver under a 42 month sublease that requires monthly payments of approximately $4,200. The lease expires on June 1, 2017.
As of October 10, 2014, we had 29 full time employees.
Neither we, nor any of our properties, are subject to any pending legal proceedings.
Available Information
We make available on our website, www.syrginfo.com, under “Investor Relations, SEC Filings,” free of charge, our annual reports on Form 10-K, quarterly reports on Form 10-Q, current reports on Form 8-K, and amendments to those reports as soon as reasonably practicable after we electronically file or furnish them to the U.S. Securities and Exchange Commission (“SEC”).
The “Investor Relations, News / Events” pages on our website contain press releases and investor presentations with more recent information than may have been available at the time of the most recent filing with the SEC.
Our Code of Ethics and Board of Directors Committee Charters (Audit and Compensation Committees) are also available on our website under “Investor Relations, Corporate Governance.”
ITEM 1A. RISK FACTORS
Investors should be aware that any purchase of our securities involves certain risks, including those described below, which could adversely affect the value of our common stock.securities. We do not make, nor have we authorized any other person to make, any representation about the future market value of our common stock.securities. In addition to the other information contained in this annual report, the following factors should be considered carefully in evaluating an investment in our securities.
Risks Related Except where the context indicates otherwise, substantially all of the risks described below relating to Our Business, Industry and Strategy
Oil and natural gas prices are volatile. An extended decline in the prices of oil and natural gas would likely have a material adverse effect on our financial condition, liquidity, abilityand related activities apply to meet our financial obligations and results of operations.NGLs as well.
Risks Relating to Our future financial condition, revenues, results of operations, profitability and future growth,Business and the carrying value of our oil and natural gas properties depend primarily on the prices we receive for our oil and natural gas production. Our ability to maintain or increase our borrowing capacity and to obtain additional capital on attractive terms also substantially depends upon oil and natural gas prices.Industry
These factors include:
relatively minor changes in the supply of or the demand for oil and natural gas;
the condition of the United States and worldwide economies;
market uncertainty;
the level of consumer product demand;
weather conditions in the United States;
the actions of the Organization of Petroleum Exporting Countries;
domestic and foreign governmental regulation and taxes, including price controls adopted by the Federal Energy Regulatory Commission;
political conditions or hostilities in oil and natural gas producing regions, including the Middle East and South America;
the price and level of foreign imports of oil and natural gas; and
the price and availability of alternate fuel sources.
We cannot predict future oil and natural gas prices and such prices may decline. An extendedA decline in oil and natural gas prices may adversely affect our business, financial condition, liquidity,or results of operations and our ability to meet our financial obligationscommitments.
The prices we receive for our oil and resultsnatural gas significantly affect many aspects of operations.our business, including our revenue, profitability, access to capital, quantity and present value of proved reserves, and future rate of growth. Oil and natural gas are commodities, and their prices are subject to wide fluctuations in response to relatively minor changes in supply and demand. Historically, the markets for oil and natural gas have been volatile. In the recent past, benchmark oil prices have fallen from highs of over $100 per Bbl to lows below $30 per Bbl, and natural gas prices have experienced declines of comparable magnitude. Oil and natural gas prices will likely continue to be volatile in the future and will depend on numerous factors beyond our control. These factors include the following:
worldwide and regional economic conditions impacting the global supply and demand for oil and natural gas;
prevailing prices on local oil and natural gas price indexes in the areas in which we operate;
localized supply and demand fundamentals and gathering, processing, and transportation availability;
the actions, or inaction, of OPEC;
the price and quantity of imports of foreign oil and natural gas;
political conditions or hostilities in oil-producing and natural gas-producing regions and related sanctions, including current conflicts in the Middle East and conditions in Africa, South America, and Russia;
the level of global oil and domestic natural gas exploration and production;
the level of global oil and domestic natural gas inventories;
weather conditions and natural disasters;
domestic and foreign governmental regulations;
exports from the United States of liquefied natural gas and oil;
speculation as to the future price of oil and natural gas and the speculative trading of oil and natural gas futures contracts;
price and availability of competitors’ supplies of oil and natural gas;
technological advances affecting energy consumption; and
the price and availability of alternative fuels.
Sustained periods of reduced oil and natural gas prices and the resultant effect such prices have on our drilling economics and our ability to fund our operations could require us to re-evaluate and postpone or eliminate our development drilling, which would make it more difficult for us to achieve expected levels of production. Lower prices have reduced and may furtheralso reduce the amount of oil and natural gas that we can produce economically and has requiredmay cause the value of our estimated proved reserves at future reporting dates to decline, which would likely result in a reduction in our proved undeveloped reserves and PV-10 and standardized measure values.
Lower oil and natural gas prices may require us to record additional ceiling test write-downs. Substantially allalso reduce our borrowing ability. Our borrowing capacity is based substantially on the value of our oil and natural gas salesreserves which are, madein turn, impacted by prevailing oil and natural gas prices. Our actual borrowings may not exceed our borrowing base, which is currently $400 million. The next semi-annual redetermination of the borrowing base is scheduled to occur in April 2018. If our borrowing base were to decline significantly, we could have to either raise additional capital or adjust our drilling plan. In addition, if the lenders reduce the borrowing base below the then-outstanding balance, we will be required to repay the difference between the outstanding balance and the reduced borrowing base, and we may not have or be able to obtain the funds necessary to do so.
We have historically relied on the availability of additional capital, including proceeds from the sale of equity, debt, and convertible securities, to execute our business strategy. Future acquisitions may require substantial additional capital, the availability of which will depend in significant part on current and expected commodity prices. If we are unable to raise capital on acceptable terms in the spot market or pursuantfuture, we may be unable to contracts based on spot market prices. Our sales are not made pursuant to long-term fixed price contracts.pursue future acquisition.
To attempt to reduce our price risk, we periodically enter into hedging transactions with respect to a portion of our expected future production. We cannot assure you that such transactions will reduce the risk or minimize the effect of any decline in oil or natural gas prices. AnyIf oil and natural gas prices decline, we will not be able to hedge future production at the same pricing level as our current hedges, and our results of operations and financial condition would be negatively impacted. In addition, hedging arrangements can expose us to risk of financial loss in some circumstances, including when production is less than expected, a counterparty to a hedging contract fails to perform under the contract, or there is a change in the expected differential between the underlying price in the hedging contract and the actual prices received.
Accordingly, any substantial or extended decline in the prices of or demandthat we receive for oil or natural gasour production would have a material adverse effect on our financial condition, liquidity, ability to meet our financial obligations, and our results of operations.
Operating hazards may adversely affect our ability to conduct business.
Our operations are subject to risks inherent in the oil and natural gas industry, such as:
unexpected drilling conditions including blowouts,loss of well control, loss of drilling fluid circulation, cratering, and explosions;
uncontrollable flows of oil, natural gas, or well fluids;
equipment failures, fires, or accidents;
pollution, releases of hazardous materials, and other environmental risks; and
shortages in experienced labor or shortages or delays in the delivery of equipment.equipment or the performance of services.
These risks could result in substantial losses to us from injury and loss of life, damage to and destruction of property and equipment, pollution and other environmental damage, and suspension of operations. These regulationsWe do not maintain insurance for all of these risks, nor in amounts that cover all of the losses to which we may be subject, and the insurance that we have may not continue to be available on acceptable terms. Moreover, some risks that we face are not insurable. For example, a leak or other pollution event may occur without our knowledge, making it impossible for us to notify the insurer within the time period required by the policy. Also, we could in certainsome circumstances impose stricthave liability for pollution damageactions taken by third parties over which we have no or limited control, including operators of properties in which we have an interest. The occurrence of an uninsured or underinsured loss could result in the interruption or termination of operations.significant costs that could have a material adverse effect on our financial condition and liquidity. In addition, maintenance activities undertaken to reduce operational risks can be costly and can require exploration, exploitation, and development operations to be curtailed while those activities are being completed.
Our actual production, revenues, and expenditures related to our reserves are likely to differ from those underlying our estimates of proved reserves. We may experience production that is less than estimated, and drilling costs that are greater than estimated, in our reserve report. These differences may be material.
Although the estimates of our oil and natural gas reserves and future net cash flows attributable to those reserves were prepared by Ryder Scott Company, L.P., our independent petroleum and geological engineers, we are ultimately responsible for the disclosure of those estimates. Reserve engineering is a complex and subjective process of estimating underground accumulations of oil and natural gas that cannot be measured in an exact manner. Estimates of economically recoverable oil and natural gas reserves and of future net cash flows necessarily depend upon a number of variable factors and assumptions, including:
historical production from the area compared with production from other similar producing wells;
the assumed effects of regulations by governmental agencies;
assumptions concerning future oil and natural gas prices; and
assumptions concerning future operating costs, severance and excise taxes, development costs, and work-overworkover and remedial costs.
Because all reserve estimates are based on assumptions that may prove to be incorrect and are to some degree subjective, each of the following items may differ materially from those assumed in estimating proved reserves:
the quantities of oil and natural gas that are ultimately recovered;
the production and operating costs incurred;
the amount and timing of future development expenditures; and
future oil and natural gas sales prices.
Furthermore, different reserve engineers may make different estimates of reserves and cash flows based onfrom the same available data. development of reserves.
Historically, there has been a difference between our actual production and the production estimated in a prior year’s reserve report. Our 2014 production was approximately 58% greater than amounts projected in our August 31, 2013 reserve report.reports. We cannot assure you that these differences will not be material in the future.
Approximately 60%61% of our estimated proved reserves at AugustDecember 31, 20142017 are undeveloped and 12% were developed, non-producing.undeveloped. Recovery of undeveloped reserves requires significant capital expenditures and successful drilling operations. The reserve data assumes that we willOur estimates of proved undeveloped reserves
reflect our plans to make significant capital expenditures to develop and produce our reserves. Although we have prepared estimates of our oil and natural gasconvert those reserves andinto proved developed reserves, including approximately $982.9 million in estimated capital expenditures during the five years ending December 31, 2022. The estimated development costs associated with these reserves in accordance with industry standards, we cannot assure you that the estimated costs aremay not be accurate, that development willmay not occur as scheduled, or that the actualand results willmay not be as estimated. If we choose not to develop proved undeveloped reserves, or if we are not otherwise able to successfully develop them, we will be required to remove the associated volumes from our reported proved reserves. In addition, under the recovery ofSEC’s reserve reporting rules, proved undeveloped reserves is generally subjectmay be booked only if they relate to wells scheduled to be drilled within five years of the approvaldate of development plansinitial booking, and related activities by applicable state and/we may therefore be required to downgrade to probable or federal agencies. Statutes and regulations may affect both the timing and quantity of recovery of estimated reserves. Such statutes and regulations, and their enforcement, have changed in the past and may change in the future, and may result in upwardpossible any proved undeveloped reserves that are not developed or downward revisionsexpected to current estimated proved reserves.be developed within this five-year time frame.
You should not assume that the standardized measure of discounted cash flows is the current market value of our estimated oil and natural gas reserves. In accordance with SEC requirements, the standardized measure of discounted cash flows from proved reserves at AugustDecember 31, 20142017 is based on twelve-month average prices and costs as of the date of the estimate. These prices and costs will change and may be materially higher or lower than the prices and costs as of the date of the estimate. Any changes in consumption by oil and natural gas purchasers or in governmental regulations or taxation may also affect actual future net cash flows. The timing of both the production and the expenses from the development and production of oil and natural gas properties will affect the timing of actual future net cash flows from proved reserves and their present value. In addition, the 10% discount factor we use when calculating standardized measure of discounted cash flows for reporting requirements in compliance with accounting requirements is not necessarily the most appropriate discount factor. The effective interest rate at various times and the risks associated with our operations or the oil and natural gas industry in general will affect the accuracyEach of the 10% discount factor.foregoing considerations also impacts the PV-10 values of our reserves.
Seasonal weather conditions, wildlife and wildlifeplant species conservation restrictions, and other constraints could adversely affect our ability to conduct operations.
Our operations could be adversely affected by weather conditions and wildlife and plant species conservation restrictions. In the Rocky Mountains,Colorado, certain activities cannot be conducted as effectively during the winter months. Winter and severe weather conditions limit and may temporarily halt the ability to operate during such conditions.operations. These constraints and the resulting shortages or high costs could delay or temporarily halt our operations and materially increase our operationoperational and capital costs, which could have a material adverse effect on our business, financial condition, and results of operations.
Similarly, some of our properties are located in relatively populous areas in the Wattenberg Field, and our operations in those areas may be subject to additional expenses and limitations. For example, we may incur additional expenses in those areas to mitigate visual impacts, noise, and odor issues relating to our operations, and we may find it more difficult to obtain drilling permits and other governmental approvals. In addition, the risk of litigation related to our operations may be higher in those areas. Any of these factors could have a material impact on our operations in the Wattenberg Field and could have a material adverse effect on our business, financial condition, and results of operations.
Furthermore, a critical habitat designation for certain wildlife under the U.S. Endangered Species Act or similar state laws could result in material restrictions to public or private land use and could delay or prohibit land access or development. The listing of certainparticular species as threatened andor endangered could have a material impactadverse effect on our operations in areas where such listedthose species are found.
Our future success depends upon our ability to find, develop, produce, and acquire additional oil and natural gas reserves that are economically recoverable. Drilling activities may be unsuccessful or may be less successful than anticipated.
In order to maintain or increase our reserves, we must constantly locate and develop or acquire new oil and natural gas reserves to replace those being depleted by production. We must do this even during periods of low oil and natural gas prices when it is difficult to raise the capital necessary to finance our exploration, development, and acquisition activities. Without successful exploration, development, or acquisition activities, our reserves and revenues will decline rapidly. We may not be able to find and develop or acquire additional reserves at an acceptable cost or have access to necessary financing for these activities, either of which would have a material adverse effect on our financial condition.
Our management has identified and scheduled drilling locations as an estimation of our future multi-year drilling activities on our existing acreage. These identified drilling locations represent a significant part of our strategy. Our ability to drill and develop these locations depends on a number of uncertainties, including the availability of capital, seasonal conditions, regulatory approvals, oil and natural gas prices, costs, drilling results, and the accuracy of our assumptions and estimates regarding potential well communication issues and other matters affecting the spacing of our wells. Because of these uncertainties, we do not know if the numerous potential drilling locations that we have identified will ever be drilled or if we will be able to produce oil and natural gas from these or any other potential drilling locations.
Drilling for oil and natural gas may involve unprofitable efforts, not only from dry wells but also from wells that are productive but do not produce sufficient quantities to cover drilling, operating, and other costs. In addition, even a commercial well may have production that is less, or costs that are greater, than we projected. The cost of drilling, completing, and operating a well is often uncertain, and many factors can adversely affect the economics of a well or property. There can be no assurance that proved or unproved property acquired by us or undeveloped acreage leased by us will be profitably developed, that new wells drilled by us in prospects that we pursue will be productive, or that we will recover all or any portion of our investment in such proved or unproved property or wells.
Acquisitions we pursue may not achieve their intended results and may result in us assuming unanticipated liabilities. These risks are heightened in the case of the GCII Acquisition due to its size relative to our prior acreage position.
Pursuing acquisitions is an important part of our growth strategy. However, achieving the anticipated benefits of any acquisition is subject to a number of risks and uncertainties. For example, we may discover title defects or adverse environmental or other conditions related to the acquired properties of which we are unaware at the time that we enter into the relevant purchase and sale agreement. Environmental, title, and other problems could reduce the value of the acquired properties to us, and depending on the circumstances, we could have limited or no recourse to the sellers with respect to those problems. We may assume all or substantially all of the liabilities associated with the acquired properties and may be entitled to indemnification in connection with those liabilities in only limited circumstances and in limited amounts. We cannot assure that such potential remedies will be adequate for any liabilities that we incur, and such liabilities could be significant. Even though we perform due diligence reviews (including a review of title and other records) of the major properties that we seek to acquire that we believe are generally consistent with industry practices, these reviews are inherently incomplete. It is typically not feasible for us to perform an in-depth review of every individual property and all records involved in each acquisition. Moreover, even an in-depth review of records and properties may not necessarily reveal existing or potential liabilities or other problems or permit us to become familiar enough with the properties to assess fully their deficiencies and potential. The discovery of any material liabilities associated with our acquisitions could materially and adversely affect our business, financial condition, and results of operations. In addition, completing the integration process for any acquisition may be more expensive than anticipated, and we cannot assure you that we will be able to effect the integration of any acquired operations smoothly or efficiently or that the anticipated benefits of any transaction will be achieved. Further, acquisitions may require additional debt or equity financing, resulting in additional leverage or dilution of ownership.
The success of any acquisition will depend on, among other things, the accuracy of our assessment of the number and quality of the drilling locations associated with the properties to be acquired, future oil and natural gas prices, reserves and production, and future operating costs and various other factors. These assessments are necessarily inexact. Our assessment of certain of these factors will typically be based in part on information provided to us by the seller, including historical production data. Our independent reserve engineers typically will not provide a report regarding the estimated reserves associated with properties to be acquired. The assumptions on which our internal estimates are based may prove to be incorrect in a number of material ways, resulting in our not realizing the expected benefits of the acquisition. As a result, we may not recover the purchase price for the acquisition from the sale of production from the acquired properties or recognize an acceptable return from such sales.
We are subject to all of the foregoing risks with respect to the GCII Acquisition, and these risks are heightened with respect to that acquisition due to the significant amount of acreage acquired relative to our prior acreage position.
We may not be able to obtain adequate financing when the need arises to execute our long-term operating strategy.
Our ability to execute our long-term operating strategy is highly dependent on our having access to capital when the need arises. We historicallyHistorically, we have addressed our long-term liquidity needs through credit facilities, issuances of equity, debt, and debtconvertible securities, sales of assets, joint ventures, and cash provided by operating activities. We will examine the following alternative sources of long-term capital as dictated by currentin light of economic conditions:conditions in existence at the relevant time:
borrowings from banks or other lenders;
the sale of non-core assets;
the issuance of debt securities;
the sale of common stock, preferred stock, or other equity securities;
joint venture financing; and
production payments.
The availability of these sources of capital when the need arises will depend upon a number of factors, some of which are beyond our control. These factors include general economic and financial market conditions, oil and natural gas prices, our
credit ratings, interest rates, market perceptions of us or the oil and gas industry, our market value, and our operating performance. We may be unable to execute our long-term operating strategy if we cannot obtain capital from these sources when the need arises.arises, which would adversely affect our production, cash flows, and capital expenditure plans.
Factors beyond
We are dependent on third party pipeline, trucking, and rail systems to transport our control affectproduction and gathering and processing systems to prepare our production. These systems have limited capacity and, at times, have experienced service disruptions. Curtailments, disruptions, or lack of availability in these systems interfere with our ability to produce and/or market the oil and natural gas.gas we produce and could materially and adversely affect our cash flow and results of operations.
The availability
Market conditions or the unavailability of satisfactory oil and gas transportation and processing arrangements may hinder our access to oil and natural gas markets and the volatility of product prices are beyondor delay our control and represent a significant risk.production. The marketability of our production depends upon the availability and capacity of natural gas gathering systems, pipelines and processing facilities. The unavailability or lack of capacity of these systems and facilities could result in the shut-in of producing wells or the delay or discontinuance of development plans for properties. Our ability to market oil and natural gas alsoproduction depends in part on other factors beyond our control. These factors include:
the level of domestic production and imports of oil and natural gas;
the proximity of natural gas production to natural gas pipelines;
the availability, proximity, and capacity of gathering, processing, pipeline, capacity;
the demand for oiltrucking, and natural gas by utilities and other end users;
the availability of alternate fuel sources;
the effect of inclement weather;
state and federal regulationrail systems. The amount of oil and natural gas marketing;that can be produced and
federal regulation sold is subject to limitation in certain circumstances, such as when pipeline interruptions occur due to scheduled or unscheduled maintenance, accidents, excessive pressure, physical damage to the gathering or transportation system, lack of naturalcontracted capacity on such systems, inclement weather, labor or regulatory issues, or other reasons. A portion of our production may be interrupted, or shut in, from time to time as a result of these factors. Curtailments and disruptions in the systems we use may last from a few days to several months or longer. These risks are greater for us than for some of our competitors because our operations are focused on areas where there has been a substantial amount of development activity in recent years and resulting increases in production, and this has increased the likelihood that there will be periods of time in which there is insufficient midstream capacity to accommodate the increased production. For example, the gas soldgathering systems serving the Wattenberg Field have in recent years experienced high line pressures from time to time, and this has on occasion reduced capacity and caused gas production to be shut in. In addition, we might voluntarily curtail production in response to market conditions. Any significant curtailment in gathering, processing or transportedpipeline system capacity, significant delay in interstate commerce.
If these factors were to change dramatically,the construction of necessary facilities, or lack of availability of transport would interfere with our ability to market the oil and natural gas or obtain favorable prices forthat we produce and could materially and adversely affect our oilcash flow and natural gas could be adversely affected.results of operations and the expected results of our drilling program.
Oil and natural gas prices may be affected by local and regional factors.
The prices to be received for our production will be determined to a significant extent by factors affecting the local and regional supply of and demand for oil and natural gas, including the adequacy of the pipeline and processing infrastructure in the region to process and transport our production and that of other producers. Those factors result in basis differentials between the published indices generally used to establish the price received for regional natural gas production and the actual (frequently lower) price that we receive for our production. Our average differential for the year ended December 31, 2017 was $(6.58) per barrel for oil and $(0.67) per Mcf for natural gas. These differentials are difficult to predict and may widen or narrow in the future based on market forces. The unpredictability of future differentials makes it more difficult for us to effectively hedge our production. Our hedging arrangements are generally based on benchmark prices and therefore do not protect us from adverse changes in the differential applicable to our production.
Lower oil and natural gas prices and other adverse market conditions may cause us to record ceiling test write-downs or other impairments, which could negatively impact our results of operations.
We use the full cost method of accounting to account for our oil and natural gas operations. Accordingly, we capitalize the cost to acquire, explore for, and develop oil and natural gas properties. Under full cost accounting rules, the net capitalized costs of oil and natural gas properties may not exceed a “full cost ceiling” which is based upon the present value of estimated future net cash flows from proved reserves, including the effect of hedges in place, discounted at 10%, plus the lower of cost or fair market value of unproved properties. If, at the end of any fiscal period, we determine that the net capitalized costs of oil and natural gas properties exceed the full cost ceiling, we must charge the amount of the excess to earnings in the period then ended. This is called a “ceiling test write-down.” This charge does not impact cash flow from operating activities, but does reduce our net income and stockholders’ equity. Once incurred, a ceiling test write-down of oil and natural gas properties is not reversible at a later date.
We review the net capitalized costs of our properties quarterly, using a single price based on the beginning of the monthbeginning-of-the-month average of oil and natural gas prices for the priorpreceding 12 months. We also assess investments in unproved properties periodically to determine whether impairment has occurred. The risk that we will be required to further write down the carrying value of our oil and gas properties increases when oil and natural gas prices are low or volatile. In addition, write-downs may occur if we experience substantial downward adjustments to our estimated proved reserves or our unproved property values or if estimated future development costs increase.
The ceiling test calculation as of December 31, 2017 used average realized prices of $46.57 per barrel and $2.21 per Mcf. The oil price used at December 31, 2017 was approximately 29% higher than the December 31, 2016 price of $36.07 per barrel, and the gas price was approximately 9% lower than the December 31, 2016 price of $2.44 Mcf. In addition to our December 31, 2017 ceiling test calculation, we compare our net capitalized costs for oil and gas properties to the ceiling amount at various points during the year. At March 31, 2017, June 30, 2017, September 30, 2017, and December 31, 2017, the ceiling amount exceeded our net capitalized costs for oil and gas properties, and as such, no impairments were necessary. We may experience further ceiling test write-downs or other impairments in the future. In addition, anyAny future ceiling test cushion, wouldand the risk we may incur further write-downs or impairments, will be subject to fluctuation as a result of acquisition or divestiture activity. In addition, declining commodity prices or other adverse market conditions, such as declines in the market price of our common stock, could result in goodwill impairments or reductions in proved reserve estimates that would adversely affect our results of operation or financial condition.
We cannot control the activities on properties that we do not operate, and we are unable to ensure the proper operation and profitability of these non-operated properties.
We do not operate all of the properties in which we have an interest. As a result, we have limited ability to exercise influence over, and control the risks associated with, the operation of these properties. The success and timing of drilling and development activities on our partially owned properties operated by others, therefore, will depend upon a number of factors outside of our control, including the operator’s:
timing and amount of capital expenditures;
expertise and diligence in adequately performing operations and complying with applicable agreements;
agreements, laws, and regulations;
financial resources;
inclusion of other participants in drilling wells; and
use of technology.
As a result of any of the above or an operator’s failure to act in ways that are in our best interest, our allocated production revenues and results of operations could be adversely affected. In addition, our lack of control over non-operated properties makes it more difficult for us to forecast future capital expenditures and production.
We are dependent on third party pipeline, trucking and rail systemsmay be unable to transportsatisfy our production and, in the Wattenberg Field, gathering and processing systemscontractual obligations, including obligations to prepare our production. These systems have limited capacity and at times have experienced service disruptions. Curtailments, disruptions or lack of availability in these systems interfere with our ability to market thedeliver oil and natural gas from our own production or other sources.
We have entered into agreements that require us to deliver minimum amounts of oil to four counterparties that transport oil via pipelines. Pursuant to these agreements, we produce,must deliver specific amounts, either from our own production or from oil we acquire, over the next three years. Since 2016, we have been obligated to deliver a combined volume of 11,157 Bbls of oil per day to three of these counterparties. We also committed to deliver 2,500 Bbls of oil per day to the fourth counterparty for approximately one and could materially and adversely affect our cash flow and resultsa half years beginning in the latter half of operations.
Market conditions or the unavailability of satisfactory oil and natural gas transportation arrangements may hinder our access2018. If we are unable to oil and natural gas markets or delay our production. The marketabilityfulfill all of our oil and natural gas and production, particularlycontractual obligations from our wells located in the Wattenberg Field, depends in part on the availability, proximity and capacity of gathering, processing, pipeline, trucking and rail systems. The amount ofown production or from oil and natural gas that can be produced and sold is subject to limitation in certain circumstances, such as pipeline interruptions due to scheduled and unscheduled maintenance, excessive pressure, physical damage to the gathering or transportation system, or lack of contracted capacity on such systems. A portion of our production may also be interrupted, or shut in,we acquire from time to time for numerous other reasons, including as a result of accidents, excessive pressures, maintenance, weather, field labor issues or disruptions in service. Curtailments and disruptions in these systems may last from a few days to several months. Wethird parties, we may be required to shutpay penalties or damages pursuant to these agreements. We incurred such charges in wells duethe amount of $0.7 million during the year ended December 31, 2017.
Furthermore, in collaboration with several other producers and DCP Midstream, LP ("DCP Midstream"), we have agreed to lackparticipate in the expansion of natural gas gathering and processing capacity in the D-J Basin. The first agreement includes a new 200 MMcf per day processing plant as well as the expansion of a market or inadequacy or unavailabilityrelated gathering system. Both are currently expected to be completed during the third quarter of crude oil or natural gas pipelines or2018, although the start-up date is undetermined at this time. Our share of the commitment will require 46.4 MMcf per day to be delivered after the plant in-service date for a period of seven years. The second agreement also includes a new 200 MMcf per day processing plant as well as the expansion of a related gathering system capacity.system. Both are currently expected to be completed in mid-2019, although the start-up date is undetermined at this time. Our share of the commitment will require 43.8 MMcf per day to be delivered after the plant in-service date for a period of seven years. These risks are greater for us than for some of our competitors because our operations are focused on areas where there is currently a substantial amount of development activity, which increasescontractual obligations can be reduced by the likelihood that there will be periods of time in which there is insufficient midstream capacitycollective volumes delivered to accommodate the resulting increases in production. For example, the gas gathering systems serving the Wattenberg Field recently experienced high line pressures reducing capacity and causing gas production to either be shut in or flared. In addition, we might voluntarily curtail production in response to market conditions. Any significant curtailment in gathering, processing or pipeline system capacity, significant delayplants by other producers in the constructionD-J Basin that are in excess of necessary facilitiessuch producers' total commitment.
Any future penalties or lackdamages of availability of transport, would interfere with our ability to market the oil and natural gas we produce, andtypes described above could materially and adversely affectimpact our cash flowflows, profit margins, net income, and results of operations, and the expected results of our drilling program. We may face similar risks in other areas.reserve values.
22
We face strong competition from larger oil and natural gas companies that may negatively affect our ability to carry on operations.
We operate in the highly competitive areas of oil and natural gas exploration, development, and production. Factors that affect our ability to compete successfully in the marketplace include:
the availability of funds for, and information relating to, a properties;
the standards established by us for the minimum projected return on investment; and
the transportation of natural gas and crude oil.
Our competitors include major integrated oil companies, substantial independent energy companies, affiliates of major interstate and intrastate pipelines, and national and local natural gas gatherers, many of which possess greater financial and other resources than we do. If we are unable to successfully compete against our competitors, our business, prospects, financial condition, and results of operations may be adversely affected.
We may be unable to successfully identify, execute, or effectively integrate future acquisitions, which may negatively affect our results of operations.
Acquisitions of oil and gas businesses and properties have been an important element of our business, and we will continue to pursue acquisitions in the future. In the last several years, we have pursued and consummated acquisitions that have provided us opportunities to grow our production and reserves. Although we regularly engage in discussions with, and submit proposals to, acquisition candidates, suitable acquisitions may not be available in the future on reasonable terms. If we do identify an appropriate acquisition candidate, we may be unable to successfully negotiate the terms of an acquisition, finance the acquisition, or if the acquisition occurs, effectively integrate the acquired business or properties into our existing business. Negotiations of potential acquisitions and the integration of acquired business operationsassets may require a disproportionate amount of management’s attention and our resources. Moreover, our debt agreements contain covenants that may limit our ability to finance an acquisition. Even if we complete additional acquisitions, continued acquisition financing may not be available or available on reasonable terms, any new businessesassets may not generate revenues comparable to our existing business, the anticipated cost efficiencies or synergies may not be realized, and these businessesthe assets may not be integrated successfully or operated profitably. The success of any acquisition will depend on a number of factors, including the ability to estimate accurately the recoverable volumes of reserves, rates of future production and future net revenues attainable from the reserves and to assess possible environmental liabilities. Our inability to successfully identify, execute, or effectively integrate future acquisitions may negatively affect our results of operations.
Even though we perform due diligence reviews (including a review of title and other records) of the major properties we seek to acquire that we believe is consistent with industry practices, these reviews are inherently incomplete. It is generally not feasible for us to perform an in-depth review of every individual property and all records involved in each acquisition. However, even an in-depth review of records and properties may not necessarily reveal existing or potential problems or permit us to become familiar enough with the properties to assess fully their deficiencies and potential. Even when problems are identified, we may assume certain environmental and other risks and liabilities in connection with the acquired businesses and properties. The discovery of any material liabilities associated with our acquisitions could harm our results of operations.
In addition, acquisitions of businesses may require additional debt or equity financing, resulting in additional leverage or dilution of ownership. Our credit facility contains certain covenants that limit, or which may have the effect of limiting, among other things acquisitions, capital expenditures, the sale of assets and the incurrence of additional indebtedness.
Declining general economic, business or industry conditions may have a material adverse effect on our results of operations, liquidity and financial condition.
Concerns over global economic conditions, energy costs, geopolitical issues, inflation, the availability and cost of credit, the United States mortgage market and a declining real estate market in the United States have contributed to increased economic uncertainty and diminished expectations for the global economy. These factors, combined with volatile prices of oil and natural gas, declining business and consumer confidence and increased unemployment, have precipitated an economic slowdown and a recession. Concerns about global economic growth have had a significant adverse impact on global financial markets and commodity prices. If the economic climate in the United States or abroad continues to deteriorate, demand for petroleum products could diminish, which could impact the price at which we can sell our oil, natural gas and natural gas liquids, affect the ability of our vendors, suppliers and customers to continue operations and ultimately adversely impact our results of operations, liquidity and financial condition.
We may incur substantial costs to comply with the various federal, state, and local laws and regulations that affect our oil and natural gas operations.operations, including as a result of the actions of third parties.
We are affected significantly by a substantial amountnumber of governmental regulations that increase costs relatedrelating to, the drilling of wells and the transportation and processing of oil and natural gas. It is possible that the number and extent of these regulations, and the costs to comply with them, will increase significantly in the future. In Colorado, for example, significant governmental regulations have been adopted that are primarily driven by concerns about wildlife and the environment. These government regulatory requirements may result in substantial costs that are not possible to pass through to our customers and which could impact the profitability of our operations.
Our oil and natural gas operations are subject to stringent federal, state and local laws and regulations relating toamong other things, the release or disposal of materials into the environment, or otherwise relating to health and safety, land use, and other matters. A summary of the principal environmental protection or the oilrules and natural gas industry generally. Legislation affecting the industryregulations to which we are currently subject is under constant review for amendment or expansion, frequently increasing our regulatory burden.set forth in “Business and Properties-Governmental Regulation-Environmental Regulations.” Compliance with such laws and regulations often increases our cost of doing business and in turn,thereby decreases our profitability. Failure to comply with these laws and regulations may result in the assessment of administrative, civil, and criminal penalties, the incurrence of investigatory or remedial obligations, or the issuance of cease and desist orders.
The environmental laws and regulations to which we are subject may, among other things:
require applyingus to apply for and receivingreceive a permit before drilling commences;
commences or certain associated facilities are developed;
restrict the types, quantities, and concentrationconcentrations of substances that can be released into the environment in connection with drilling, hydraulic fracturing, and production activities;
limit or prohibit drilling activities on certain lands lying within wilderness, wetlands and other "waters of the United States," threatened and endangered species habitat, and other protected areas;
require remedial measures to mitigate pollution from former operations, such as plugging abandoned wells;
require us to add procedures and/or staff in order to comply with applicable laws and
regulations; and
impose substantial liabilities for pollution resulting from our operations.
Changes in
In addition, we could face liability under applicable environmental laws and regulations occur frequently, and any changes thatas a result in more stringentof the activities of previous owners of our properties or costly waste handling, storage, transport, disposal or cleanup requirements could require us to make significant expenditures to maintain compliance, and may otherwise have a material adverse effect on our earnings, results of operations, competitive position or financial condition. Overother third parties. For example, over the years, we have owned or leased numerous properties for oil and natural gas activities upon which petroleum hydrocarbons or other materials may have been released by us or by predecessor property owners or lessees who were not under our control. Under applicable environmental laws and regulations, including CERCLA, RCRA, and analogous state laws, we could be held strictly liable for the removal or remediation of previously released materials or property contamination at such locations, or at third-party locations to which we have sent waste, regardless of our fault, whether we were responsible for the release or whether the operations at the time of the release were standard industry practice.lawful.
Compliance with, or liabilities associated with violations of or remediation obligations under, environmental laws and regulations could have a material adverse effect on our results of operations and financial condition.
New or amended environmental legislation or regulatory initiatives including those related to hydraulic fracturing, could result in increased costs, and additional operating restrictions, or delays.delays or have other adverse effects on us.
We are subject to extensive federal, state, and localThe environmental laws and regulations concerning health, safety, and environmental protection. Government authoritiesto which we are subject change frequently, addoften to those requirements, and both oil and gas development generally and hydraulic fracturing specifically are receiving increasing regulatory attention. Our operations utilize hydraulic fracturing, an important and commonly used process in the completion of oil and natural gas wells in low-permeability formations. Hydraulic fracturing involves the injection of water, proppant, and chemicals under pressure into rock formationsbecome more burdensome and/or to stimulate hydrocarbon production.
Recently, the EPA issued final rules that establish new air emission controls for natural gas processing operations, as well as for oil and natural gas production. Among other things, the latter rules cover the completion and operation of hydraulically fractured gas wells and associated equipment. After several parties challenged the new air regulations in court, the EPA reconsidered certain requirements and is evaluating whether reconsideration of other issues is warranted. At this point, we cannot predict the final regulatory requirements or the cost to comply with such air regulatory requirements.
Some activists have attempted to link hydraulic fracturing to various environmental problems, including potential adverse effects to drinking water supplies as well as migration of methane and other hydrocarbons. As a result, the federal government is studying the environmental risks associated with hydraulic fracturing and evaluating whether to adopt additional regulatory requirements. For example, the EPA has commenced a multi-year study of the potential impacts of hydraulic fracturing on drinking water resources, and the draft results are expected to be released for public and peer review in 2014. In addition, on October 21, 2011, the EPA announced its intention to propose regulations by 2014 under the federal Clean Water Act to regulate wastewater discharges from hydraulic fracturing and other natural gas production. The EPA also has prepared draft guidance for issuing underground injection permits that would regulate hydraulic fracturing using diesel fuel, where EPA has permitting authority under the SDWA; this guidance eventually could encourage other regulatory authorities to adopt to permitting and other restrictions on the use of hydraulic fracturing. The U.S. Department of Interior, moreover, has proposed new rules for hydraulic fracturing activities on federal lands that, in general, would cover disclosure of fracturing fluid components, well bore integrity, and handling of flowback water. And the U.S. Occupational Safety and Health Administration has proposed stricter standards for worker exposure to silica, which would apply to use of sand as a proppant for hydraulic fracturing.
In the United States Congress, bills have been introduced that would amend the SDWA to eliminate an existing exemption for certain hydraulic fracturing activities from the definition of "underground injection," thereby requiring the oil and natural gas industry to obtain SDWA permits for fracturing not involving diesel fuels, and to require disclosure of the chemicals used in the process. If adopted, such legislation could establish an additional level of regulation and permitting at the federal level, but some form of chemical disclosure is already required by most oil and gas producing states. At this time, it is not clear what action, if any, the United States Congress will take on hydraulic fracturing.
Apart from these ongoing federal initiatives, state governments where we operate have moved to impose stricter requirements on hydraulic fracturing and other aspects of oil and gas production. Colorado, for example, comprehensively updated its oil and gas regulations in 2008 and adopted significant additional amendments in 2011 and 2013. Among other things, the updated and amended regulations require operators to reduce methane emissions associated with hydraulic fracturing, compile and report additional information regarding well bore integrity, publicly disclose the chemical ingredients used in hydraulic fracturing, increase the minimum distance between occupied structures and oil and gas wells, undertake additional mitigation for nearby residents, and implement additional groundwater testing. The State is also considering new regulations for air emissions from oil and gas operations as well as potential legislation increasing the monetary penalties for regulatory violations. Additionally, local governments are adopting new requirements on hydraulic fracturing and other oil and gas operations, including local county and city governments in Colorado.
The adoption of futurerisk that we will be subject to significant liabilities. New or amended federal, state, or local laws or implementing regulations or orders imposing new environmental obligations on, or otherwise limiting, our operations could make it more difficult and more expensive to complete oil and natural gas wells, increase our costs of compliance and doing business, delay or prevent the development of certain resources (including especially(especially from shale formations that are not commercial without the use of hydraulic fracturing), or alter the demand for and consumption of our products and services. We cannot assure you that any such outcome would not be material, and anyproducts. Any such outcome could have a material and adverse impact on our cash flows and results of operations.
Any local moratoria or bans on our activities could have a negative impact on our business, financial conditionFor example, in 2014 and results2016, opponents of operations.
Some local governments are adopting new requirements on hydraulic fracturing and other oil and gas operations. Some countiessought statewide ballot initiatives in Colorado for instance,that would have amended their land use regulations to impose new requirements on oil and gas development, while other local governments have entered memoranda of agreement with oil and gas producers to accomplish the same objective. Beyond that, in 2012, Longmont, Colorado prohibited the use of hydraulic fracturing. The oil and gas industry and the State are challenging that ban, and the authority of local jurisdictions to regulaterestricted oil and gas development in court. In November 2013, four other Colorado cities and counties passed votercould have had materially adverse impacts on us. One of the proposed initiatives either placing a moratorium onwould have made the vast majority of the surface area of the state ineligible for drilling, including substantially all of our planned future drilling locations. Although none of the proposed initiatives were implemented, future initiatives are likely, including in 2018. Similarly, proposals are made from time to time to adopt new, or amend existing, laws and regulations to address hydraulic fracturing or banning new oilclimate change concerns through further regulation of exploration and gas development. These initiatives too aredevelopment activities. The “Business and Properties-Governmental Regulation-Environmental Matters” section of this report includes a discussion of some recent environmental regulatory changes that have affected us. We cannot predict the subject of pending legal challenge. While these initiatives cover areas with little recentnature, outcome, or ongoing oil and gas development, they could lead opponents of hydraulic fracturing to push for statewide referendums, especially in Colorado. If we are required to cease operating in any of the areas in which we now operate as the result of bans or moratoria on drilling or related oilfield services activities, it could have a material effect on us of future regulatory initiatives, but such initiatives could materially impact our business, financial condition and results of operations.
Environmental compliance costs and environmental liabilities could have a material adverse effect on our financial condition and operations.
Our operations, are subject to numerous federal, state and local laws and regulations governing the discharge of materials into the environment or otherwise relating to environmental protection. These laws and regulations may:
require the acquisition of permits before drilling commences;
restrict the types, quantities and concentration of various substances that can be released into the environment from drilling and production, activities;
limit or prohibit drilling activities on certain lands lying within wilderness, wetlandsreserves, and other protected areas;
require remedial measures to mitigate pollution from former operations, such as plugging abandoned wells; and
impose substantial liabilities for pollution resulting from our operations.
The trend toward stricter standards in environmental legislation and regulation is likely to continue. The enactment of stricter legislation or the adoption of stricter regulations could have a significant impact on our operating costs, as well as on the oil and natural gas industry in general.
Our operations could result in liability for personal injuries, property damage, oil spills, discharge of hazardous materials, remediation and clean-up costs and other environmental damages. We could also be liable for environmental damages caused by previous property owners. As a result, substantial liabilities to third parties or governmental entities may be incurred which could have a material adverse effect on our financial condition and results of operations. We maintain insurance coverage for our operations, including limited coverage for sudden and accidental environmental damages, but this insurance may not extend to the full potential liability that could be caused by sudden and accidental environmental damages and further may not cover environmental damages that occur over time. Accordingly, we may be subject to liability or may lose the ability to continue exploration or production activities upon substantial portionsaspects of our properties if certain environmental damages occur.business.
The Oil Pollution Act of 1990 imposes a variety of regulations on “responsible parties” related to the prevention of oil spills. The implementation of new, or the modification of existing, environmental laws or regulations, including regulations promulgated pursuant to the Oil Pollution Act, could have a material adverse impact on us.
The adoption and implementation of new statutory and regulatory requirements for derivative transactions could have an adverse impact on our ability to hedge risks associated with our business and increase the working capital requirementsrequired to conduct these activities.
The Dodd-Frank Act which was signed into law on July 21, 2010, establishes, among other provisions,authorizes federal oversight and regulation of the over-the-counter derivatives market and entities that participate in that market. The Dodd-Frank Act also establishes margin requirements and certain transaction clearing and trade execution requirements. On October 18, 2011, the Commodities Futures Trading Commission (the "CFTC") approved regulations to set position limits for certain futures and option contracts in the major energy markets, which were successfully challenged in federal district court by the Securities Industry Financial Markets Association and the International Swaps and Derivatives Association and largely vacated by the court. The CFTC has filed a notice of appeal with respect to this ruling. Under CFTC final rules promulgatedRegulations under the Dodd-Frank Act we believe our derivatives activity will qualify for the non-financial, commercial end-user exception, which exempts derivatives intended to hedge or mitigate commercial risk from the mandatory swap clearing requirement. The Dodd-Frank Act may, alsoamong other things, require us to comply with margin requirements in connection with our derivative activities, although the applicationactivities. If we are required to post cash collateral in connection with some or all of those provisionsour derivative positions, this would make it difficult or impossible to us is uncertain at this time.pursue our current hedging strategy. The financial reform legislationregulations may also require the counterparties to our derivative instruments to spin off some of their derivatives activities to separate entities, which may not be as creditworthy as the current counterparties.
The Dodd-Frank Act and any new regulations could significantly increasemay also reduce the costnumber of derivative contracts (including through requirements to post collateral,potential counterparties in the market, which could adversely affect our available liquidity), materially alter the terms of derivative contracts, reduce the availability of derivatives to protect against risks we encounter, reduce our ability to monetize or restructure our existing derivative contracts and increase our exposure to less creditworthy counterparties. make hedging more expensive.
If we reduce our use of derivativederivatives as a result of the Dodd-Frank Act and its implementing regulations, our results of operations may be more volatile, and our cash flows may be less predictable, which could adversely affect our ability to plan for and fund capital expenditures. Finally, the Dodd-Frank Act was intended, in part, to reduce the volatility of oil and gas prices, which some legislators attributed to speculative trading in derivatives and commodity instruments related to oil and gas. Our revenues could therefore be adversely affected if a consequence of the Dodd-Frank Act and regulations is to lower commodity prices. Any of these consequences could have a material adverse effect on our consolidated financial position, results of operations, and cash flowsflows. In addition, derivative instruments create a risk of financial loss in some circumstances, including when production is less than the volume covered by the instruments.
Proposed changes to U.S. tax laws, if adopted, could have an adverse effect on our business, financial condition, results of operations, and cash flows.
From time to time, legislative proposals are made that would, if enacted, make significant changes to U.S. tax laws. These proposed changes have included, among others, eliminatingresult in the elimination of the immediate deduction for intangible drilling and development costs, eliminatingthe elimination of the deduction from income for domestic production activities relating to oil and natural gas exploration and development, repealingthe repeal of the percentage depletion allowance for oil and natural gas properties, and extendingan extension of the amortization period for certain geological and geophysical expenditures. Such proposed changes, in the U.S. tax laws, if adopted, or other similar changes that reduce or eliminate deductions currently available with respect to oil and natural gas exploration and development, could adversely affect our business, financial condition, results of operations, and cash flows.
Our indebtedness may adversely affectaffects our cash flow and may adversely affect our ability to operate our business,business. Our ability to remain in compliance with debt covenants and make payments on our debt.debt is subject to numerous risks.
As of AugustDecember 31, 20142017, the aggregate amount of our outstanding indebtedness net of cash on hand, was $2.2 million, which$550 million. Our indebtedness could have important consequences for you,investors, including the following:
the covenants contained in our debt agreements limit our ability to borrow money in the future for acquisitions, capital expenditures, or to meet our operating expenses or other general corporate obligations and may limit our flexibility in operating our business;
the amount of our interest expense may increase because certain ofamounts borrowed under our borrowings in the future may becredit facility bear interest at variable rates of interest, which,rates; if interest rates increase, this could result in higher interest expense;
we may have a higher level of debt than some of our competitors, which may put us at a competitive disadvantage;
we may be more vulnerable to economic downturns and adverse developments in our industry or the economy in general, especially extended or further declines in oil and natural gas prices; and
our debt level could limit our flexibility in planning for, or reacting to, changes in our business and the industry in which we operate.
Our ability to meet our expenses and debt obligations will depend on our future performance, which will be affected by financial, business, economic, regulatory, and other factors. We will not be able to control many of these factors, such as economic conditions and governmental regulation. We cannot be certain that our cash flow from operations will be sufficient to allow us to pay the principal and interest on our debt and meet our other obligations. If we do not have enough cash to service our debt, we may be required to refinance all or part of our existing debt, sell assets, borrow more money, or raise equity. We may not be able to refinance our debt, sell assets, borrow more money, or raise equity on terms acceptable to us, if at all.
To service our indebtedness, we will require a significant amount of cash. Our ability to generate cash depends on many factors beyond our control, and any
Any failure to meet our debt obligations could harm our business, financial condition, and results of operations.
Our ability to make payments on andand/or to refinance our indebtedness and to fund planned capital expenditures will depend on our ability to generate sufficient cash flow from operations in the future. To a certainsignificant extent, this is subject to general economic, financial, competitive, legislative and regulatory conditions, and other factors that are beyond our control, including the prices that we receive for our oil and natural gas production.
We cannot assure you that our business will generate sufficient cash flow from operations or that future borrowings will be available to us under our credit facility in an amount sufficient to enable us to pay principal and interest on our indebtedness or to fund our other liquidity needs. For example, decreases in oil and natural gas prices in the recent past have adversely affected our ability to generate cash flow from operations and future decreases would have similar effects. If our cash flow and existing capital resources are insufficient to fund our debt obligations, we may be forced to reduce our planned capital expenditures, sell assets, seek additional equity or debt capital, or restructure our debt.debt, and any of these actions, if completed, could adversely affect our business and/or the holders of our securities. We cannot assure you that any of these remedies could, if necessary, be affectedeffected on commercially reasonable terms, in a timely manner or at all. In addition, any failure to make scheduled payments of interest and principal on our outstanding indebtedness could harm our ability to incur additional indebtedness on acceptable terms. Our cash flow and capital resources may be insufficient for payment of interest on and principal of our debt in the future, and any such alternative measures may be unsuccessful or may not permit us to meet scheduled debt service obligations, which could cause us to default on our obligations and could impair our liquidity.
Restrictive debt covenants could limit our growth and our ability to finance our operations, fund our capital needs, respond to changing conditions, and engage in other business activities that may be in our best interests.
Our credit facility contains a number of significantand the indenture governing our 2025 Senior Notes contain, and future debt agreements may contain, covenants that among other things, restrict or limit our ability to:
pay dividends or distributions on our capital stock or issue preferred stock;
repurchase, redeem, or retire our capital stock or subordinated debt;
make certain loans and investments;
sell assets;
enter into certain transactions with affiliates;
create or assume certain liens on our assets;
enter into sale and leaseback transactions;
merge or to enter into other business combination transactions; or
engage in certain other corporate activities.
Also, our
Our credit facility also requires us to maintain compliance with specified financial ratios and satisfy certain financial condition tests.tests on an ongoing basis. Our ability to comply with these ratios and financial condition testsrequirements may be affected by events beyond our control, and we cannot assure you that we will meetsatisfy them in the future. In
addition, these ratios and financial condition tests. These financial ratio restrictions and financial condition testsrequirements could limit our ability to obtain future financings, make needed capital expenditures, withstand a future downturn in our business or the economy in general, or otherwise conduct necessary corporate activities. We may also be prevented from taking advantage of business opportunities that arise because of the limitations that the restrictive covenants under our credit facility.debt agreements. Future debt agreements may have similar, or more restrictive, provisions.
A breach of any of thesethe covenants orin our inability to comply with the required financial ratios or financial condition testsdebt agreements could result in a default under our credit facility.the agreement. A default, if not cured or waived, could result in all indebtedness outstanding under our credit facility to becomethe agreement and other debt agreements becoming immediately due and payable. If that should occur, we may not be able to pay all such debt or borrow sufficient funds to refinance it. Even if new financing were then available, it may not be on terms that are acceptable to us. If we were unable to repay those amounts, the lenders could accelerate the maturity of the debt or proceed against any collateral granted to them to secure such defaulted debt.
Our two most senior executivesWe participate in oil and gas leases with third parties who may allocate some portion ofnot be able to fulfill their time to other business interests, which could have a negative impact on our operations.
Our two most senior executives have other business interests to which they allocate a portion of their professional time. Because of this, their employment agreements provide that they are only obligated to devote eighty percent of their timecommitments to our affairs. Whileprojects.
We frequently own less than 100% of the working interest in the past theyoil and gas leases on which we conduct operations. Financial risks are inherent in any operation where the cost of drilling, equipping, completing, and operating wells is shared by more than one person. We could be held liable for joint activity obligations of other working interest owners, such unpaid costs and liabilities arising from the actions of other working interest owners. In addition, declines in commodity prices may increase the likelihood that some of these working interest owners, particularly those that are smaller and less established, will not be able to fulfill their joint activity obligations. A partner may be unable or unwilling to pay its share of project costs, and in some cases, a partner may declare bankruptcy. In the event any of our project partners do not pay their share of such costs, we would likely have devoted substantially all of their time to pay those costs, and we may be unsuccessful in any efforts to recover them from our business, theypartners. This could allocate more of their time to these other interests, which could have a negative impact onmaterially adversely affect our operations.financial position.
Our disclosure controls and procedures may not prevent or detect potential acts of fraud.
Our disclosure controls and procedures are designed to reasonably assureprovide reasonable assurance that information required to be disclosed by us in reports we file or submit under the Exchange Act is accumulated and communicated to management, and recorded, processed, summarized, and reported within the time periods specified in theapplicable SEC rules and forms.
Our management, including our Co-ChiefChief Executive OfficersOfficer and Chief Financial Officer, believes that any disclosure controls and procedures or internal controls and procedures, no matter how well conceived and operated, can provide only reasonable, not absolute, assurance that the objectives of the control system are met. Further, the design of a control system must reflect the fact that there are resource constraints, and the benefits of controls must be considered relative to their costs. Because of the inherent limitations in all control systems, they cannot provide absolute assurance that all control issues and instances of fraud, if any, within our company have been prevented or detected. These inherent limitations include the realities that judgments in decision-making can be faulty, and that breakdowns can occur because of a simple error or mistake. Additionally, controls can be circumvented by the individual acts of some persons, by collusion of two or more people, or by an unauthorized override of the controls. The design of any systemssystem of controls is also is based in part upon certain assumptions about the likelihood of future events, and we cannot assure you that any design will succeed in achieving its stated goals under all potential future conditions. Accordingly, because of the inherent limitations in a cost effective control system, misstatements due to error or fraud may occur and not be detected.
Failure to maintain an effective system of internal control over financial reporting may have an adverse effect on our stock price.
Pursuant to Section 404 of the Sarbanes-Oxley Act of 2002, and the rules and regulations promulgated by the SEC to implement Section 404, we are required to furnish a report by our management to include in our annual reports on Form 10-Kthis report regarding the effectiveness of our internal control over financial reporting. The management report includes, among other things, an assessment of the effectiveness of our internal control over financial reporting as of the end of our fiscal year, including a statement as to whether or not our internal control over financial reporting is effective. This assessment must include disclosure of any material weaknesses in our internal control over financial reporting identified by management. If we are unable to assert that our internal control over financial reporting is effective now or in any future period, or if our auditors are unable to express an opinion on the effectiveness of our internal controls, weinvestors could lose investor confidence in the accuracy and completeness of our financial reports, which could have an adverse effect on our stock price.
Substantially all of our producing properties are located in the D-J Basin in Colorado, making us vulnerable to risks associated with operating in one major geographic area.
Our operations have been focused on the D-J Basin in Colorado, which means our current producing properties and new drilling opportunities are geographically concentrated in that area. Because our operations are not as diversified geographically as many of our competitors, the success of our operations and our profitability may be disproportionately exposed to the effect of regional events, including fluctuations in prices of oil and natural gas produced from the wells in the region, natural disasters, restrictive governmental regulations, transportation capacity constraints, weather, curtailment of production, or interruption of transportation and processing services, and any resulting delays or interruptions of production from existing or planned new wells. For example, bottlenecks in processing and transportation that have occurred in some recent periods in the Wattenberg Field have negatively affected our results of operations. Similarly, the concentration of our producing assets within a small number of producing formations exposes us to risks, such as changes in field-wide rules that could adversely affect development activities or production relating to those formations. In addition, in areas where exploration and production activities are increasing, as has been the case in recent years in the Wattenberg Field, the demand for, and cost of, drilling rigs, equipment, supplies, personnel, and oilfield services increase. Shortages or the high cost of drilling rigs, equipment, supplies, personnel, or oilfield services could delay or adversely affect our development and exploration operations or cause us to incur significant expenditures that are not provided for in our capital forecast, which could have a material adverse effect on our business, financial condition, or results of operations.
The inability of one or more of our customers to meet their obligations may adversely affect our financial results.
Substantially all of our accounts receivable result from oil and natural gas sales or joint interest billings to third parties in the energy industry. We sell production to a small number of customers, as is customary in the industry. For the year ended December 31, 2017, we had three major customers, which represented 33%, 24%, and 17%, respectively, of our revenue during the period. This concentration of customers and joint interest owners may impact our overall credit risk in that these entities may be similarly affected by changes in economic and other conditions. In addition, our oil and natural gas hedging arrangements expose us to credit risk in the event of nonperformance by counterparties.
Failure to adequately protect critical data and technology systems could materially affect our operations.
Information technology solution failures, network disruptions, and breaches of data security could cause delays or cancellation of transactions, impede processing of transactions and reporting financial results, or cause inadvertent disclosure of non-public information or other problems, any of which could result in disruptions to our operations, liability to third parties, or damage to our reputation. A system failure or data security breach may have a material adverse effect on our financial condition, results of operations, or cash flows.
Our operations are substantially dependent on the availability of water. Restrictions on our ability to obtain or dispose of water at a reasonable cost and in compliance with applicable regulations may have a material adverse effect on our financial condition, results of operations, and cash flows.
Water is an essential component of shale oil and natural gas production during both the drilling and hydraulic fracturing processes. Historically, we have been able to purchase water from local land owners for use in our operations. When drought conditions occur, governmental authorities may restrict the use of water subject to their jurisdiction for hydraulic fracturing to protect local water supplies. Colorado has a relatively arid climate and experiences drought conditions from time to time. If we are unable to obtain water to use in our operations from local sources or dispose of or recycle water used in operations, or if the price of water or water disposal increases significantly, we may be unable to produce oil and natural gas economically, which could have a material adverse effect on our financial condition, results of operations, and cash flows.
Our undeveloped acreage must be drilled before lease expiration to hold the acreage by production. In highly competitive markets for acreage, failure to drill sufficient wells to hold acreage could result in a substantial lease renewal cost, or if renewal is not feasible, loss of our lease and prospective drilling opportunities.
Unless production is established within the spacing units covering the undeveloped acres on which some of our drilling locations are identified, our leases for such acreage will expire. The cost to renew such leases may increase significantly, and we may not be able to renew such leases on commercially reasonable terms or at all. As such, our actual drilling activities may differ materially from our current expectations, which could materially and adversely affect our business. The risk of lease expiration typically increases at times when commodity prices are depressed, as the pace of our exploration and development activity tends to slow during such periods. The GCII Acquisition increased these risks for us as a large portion of the acreage we acquired in the transaction is undeveloped.
We may incur losses as a result of title defects in the properties in which we invest.
It is our practice in acquiring oil and gas leases or interests not to incur the expense of retaining lawyers to examine the title to the mineral interest at the time of acquisition. Rather, we rely upon the judgment of oil and gas lease brokers or landmen who perform the fieldwork in examining records in the appropriate governmental office before attempting to acquire a lease in a specific mineral interest. The existence of a material title deficiency can render a lease worthless and can adversely affect our results of operations and financial condition. While we typically obtain title opinions prior to commencing drilling operations on a lease or in a unit, the failure of title may not be discovered until after a well is drilled, in which case we may lose the lease and the right to produce all or a portion of the minerals under the property.
Part of our strategy involves drilling using the latest available horizontal drilling and completion techniques, which involve risks and uncertainties in their application.
Our operations involve utilizing the latest drilling and completion techniques as developed by us and our service providers. As of December 31, 2017, we operated 227 gross horizontal producing wells, with an additional 51 horizontal wells waiting on completion, and therefore are subject to increased risks associated with horizontal drilling as compared to companies that have greater experience in horizontal drilling activities. Risks that we face while drilling include, but are not limited to, failing to land our wellbore in the desired drilling zone, not staying in the desired drilling zone while drilling horizontally through the formation, not running our casing the entire length of the wellbore, and not being able to run tools and other equipment consistently through the horizontal wellbore. Risks that we face while completing our wells include, but are not limited to, not being able to fracture stimulate the planned number of stages, not being able to run tools the entire length of the wellbore during completion operations, and not successfully cleaning out the wellbore after completion of the final fracture stimulation stage. Also, we generally use multi-well pads instead of single-well sites. The use of multi-well pad drilling increases some operational risks because problems affecting the pad or a single well could adversely affect production from all of the wells on the pad. Pad drilling can also make our overall production, and therefore our revenue and cash flows, more volatile, because production from multiple wells on a pad will typically commence simultaneously. Ultimately, the success of new drilling and completion techniques can only be evaluated over time as more wells are drilled and production profiles are established over a sufficiently long time period. If our drilling results are less successful than anticipated or we are unable to execute our drilling program because of capital constraints, lease expirations, access to gathering systems, unfavorable commodity prices, or other factors, the return on our investment in these areas may not be as attractive as we anticipate. Further, as a result of any of these developments, we could incur material write-downs of our oil and gas properties, and the value of our undeveloped acreage could decline.
Risks Relating to our Common Stock
We do not intend to pay dividends on our common stock, and our ability to pay dividends on our common stock is restricted.
Since inception, we have not paid any cash dividends on our common stock. Cash dividends are restricted under the terms of our credit facilitydebt agreements, and we presently intend to continue the policy of using retained earnings for expansion of our business. Any future dividends also may be restricted by our then-existing debtfuture agreements.
Our stock price could be volatile, which could cause you to lose part or all of your investment.
The stock market has from time to time experienced significant price and volume fluctuations that may be unrelated to the operating performance of particular companies. In particular, the market price of our common stock like that of the securities of other energy companies,price has been and may continue to be highly volatile. During the year ended August 31, 2014, the salesvolatile, which may make it difficult for shareholders to sell our common stock when desired or at attractive prices.
The market price of our common stock ranged from a low of $8.11 per share (on January 6, 2014)is highly volatile, and we expect it to a high of $14.11 per share (on June 25, 2014). Factors such as announcements concerning continue to be volatile for the foreseeable future. Adverse events, including, among others:
changes in production volumes, worldwide demand and prices for oil and natural gas;
changes in market prices of oil and natural gas, the successgas;
changes in securities analysts’ estimates of our acquisition, explorationfinancial performance;
fluctuations in stock market prices and development activities,volumes, particularly among securities of energy companies;
changes in market valuations of similar companies;
changes in interest rates;
announcements regarding adverse timing or lack of success in discovering, acquiring, developing, and producing oil and natural gas resources;
announcements by us or our competitors of significant contracts, new acquisitions, discoveries, commercial relationships, joint ventures, or capital commitments;
decreases in the availabilityamount of capital available to us;
operating results that fall below market expectations or variations in our quarterly operating results;
loss of a relationship with a partner;
the identification of and economicseverity of environmental events and governmental and other external factors, as well as period-to-period fluctuations and financial results, may have athird-party responses to the events; or
additions or departures of key personnel,
could trigger significant effect ondeclines in the market price of our common stock.
From time External events, such as news concerning economic conditions, counterparties to time, there has been limited trading volumeour natural gas or oil derivatives arrangements, changes in government regulations impacting the oil and gas exploration and production industries, actual and expected production levels from OPEC members and other oil-producing countries and the movement of capital into or out of our industry, are also likely to affect the price of our common stock, regardless of our operating performance. Furthermore, general market conditions, including the level of, and fluctuations in, the trading prices of stocks generally could affect the price of our common stock.
Additional financings may subject our existing stockholders to significant dilution.
To the extent that we raise additional funds or complete acquisitions by issuing equity securities, our stockholders may experience significant dilution. In addition, debt financing, if available, may involve restrictive covenants. We may seek to access the public or private capital markets whenever conditions are favorable, even if we do not have an immediate need for additional capital at that time. Our access to the financial markets and the pricing and terms that we receive in those markets could be adversely impacted by various factors, including changes in general market conditions and commodity prices.
Equity compensation plans will result in future dilution of our common stock.
To the extent options to purchase common stock under our equity incentive plans are exercised, or shares of restricted stock or other equity awards are issued based on satisfaction of vesting requirements, holders of our common stock will experience dilution.
As of December 31, 2017, there canwere 8,738,146 shares reserved for issuance under our equity compensation plans, of which 1,087,386 restricted shares have been granted and are subject to vesting in the future based on the satisfaction of certain criteria established pursuant to the respective awards, 951,884 performance-vested restricted shares have been granted and are subject to future issuance based on the Company's total shareholder return relative to a selected peer group of companies over the performance period, and 5,636,834 of which are issuable upon the exercise of outstanding options to purchase common stock. Our outstanding options have a weighted average exercise price of $9.38 per share as of December 31, 2017.
Non-U.S. holders of our common stock, in certain situations, could be no assurancesubject to U.S. federal income tax upon sale, exchange, or disposition of our common stock.
It is likely that therewe are, and will continueremain for the foreseeable future, a U.S. real property holding corporation for U.S. federal income tax purposes because our assets consist primarily of "United States real property interests" as defined in the applicable Treasury regulations. As a result, under the Foreign Investment in Real Property Tax Act ("FIRPTA"), certain non-U.S. investors may be subject to U.S. federal income tax on gain from the disposition of shares of our common stock, in which case they would also be a trading market or that any securities research analysts will continuerequired to provide research coveragefile U.S. tax returns with respect to such gain, and may be subject to a withholding tax. In general, whether these FIRPTA provisions apply depends on the amount of our common stock. It is possiblestock that such factors will adversely affectnon-U.S. investors hold and whether, at the market fortime they dispose of their shares, our common stock.
Thestock is regularly traded on an established securities market valuationwithin the meaning of the applicable Treasury regulations. So long as our common stock continues to be regularly traded on an established securities market, only a non-U.S. investor who has owned, actually or constructively, more than 5% of our businesscommon stock at any time during the shorter of (i) the five-year period ending on the date of disposition and (ii) the non-U.S. investor's holding period for its shares may fluctuate duebe subject to factors beyond our control andU.S. federal income tax on the value of the investmentdisposition of our stockholders may fluctuate correspondingly.common stock under FIRPTA.
The market valuation of energy companies, such as us, frequently fluctuate due to factors unrelated to the past or present operating performance of such companies. Our market valuation may fluctuate significantly in response to a number of factors, many of which are beyond our control, including: | • | Changes in securities analysts’ estimates of our financial performance; |
| • | Fluctuations in stock market prices and volumes, particularly among securities of energy companies; |
| • | Changes in market valuations of similar companies; |
| • | Announcements by us or our competitors of significant contracts, new acquisitions, discoveries, commercial relationships, joint ventures or capital commitments; |
| • | Variations in our quarterly operating results; |
| • | Fluctuations in oil and natural gas prices; |
| • | Loss of a major customer; |
| • | Loss of a relationship with a partner; and |
| • | Additions or departures of key personnel. |
As a result, the value of your investment in us may fluctuate.
| |
| ITEM 1B. | UNRESOLVED STAFF COMMENTS |
None.
ITEM 2. PROPERTIES
See Item 1 of this report.
In July 2016, the Company was informed by the Colorado Department of Public Health and Environment's Air Quality Control Commission's Air Pollution Control Division ("CDPHE") that it was expanding its review of the Company's facilities in connection with a Compliance Advisory previously issued by the CDPHE and subsequent inspections conducted by the CDPHE. The Compliance Advisory alleged issues at five Company facilities regarding leakages of volatile organic compounds from storage tanks, all of which were promptly addressed. Subsequent tolling agreements between the Company and CDPHE addressed alleged similar storage tank leakage issues at other Company facilities in Colorado. On February 21, 2018, the Company and CDPHE entered into a Compliance Order on Consent resolving the issues related to leakage of volatile organic compounds at certain of the Company’s facilities in Colorado. The terms of the order do not have a material effect on the Company.
| |
| ITEM 4. | MINE SAFETY DISCLOSURES |
Not applicable.
PART II
| |
| ITEM 5. | MARKET FOR REGISTRANT'S COMMON EQUITY, RELATED STOCKHOLDER MATTERS AND ISSUER PURCHASES OF EQUITY SECURITIES |
Our common stock is listed on the NYSE MKTAmerican under the symbol “SYRG”.“SRCI.”
Trading of our stock on the NYSE Amex (predecessor to the NYSE MKT) began on July 27, 2011. Prior to listing on the NYSE Amex, our stock traded on the OTC Bulletin Board. Shown below is the range of high and low sales prices for our common stock as reported by the NYSE MKTAmerican for the past two fiscal years.
| Quarter Ended | | High | | Low |
| November 30, 2013 | | $11.40 | | $8.86 |
| February 29, 2014 | | $10.69 | | $8.11 |
| May 31, 2014 | | $12.96 | | $9.70 |
| August 31, 2014 | | $14.11 | | $10.13 |
|
| | | | |
| Period Ended | | High | | Low |
| Three Months Ended March 31, 2016 | | $9.09 | | $5.41 |
| Three Months Ended June 30, 2016 | | $8.41 | | $5.60 |
| Three Months Ended September 30, 2016 | | $7.20 | | $5.88 |
| Three Months Ended December 31, 2016 | | $9.85 | | $6.37 |
|
| | | | |
| Period Ended | | High | | Low |
| Three Months Ended March 31, 2017 | | $9.40 | | $7.20 |
| Three Months Ended June 30, 2017 | | $9.07 | | $6.19 |
| Three Months Ended September 30, 2017 | | $9.76 | | $6.61 |
| Three Months Ended December 31, 2017 | | $10.22 | | $7.76 |
| Quarter Ended | | High | | Low |
| November 30, 2012 | | $4.74 | | $2.70 |
| February 28, 2013 | | $7.00 | | $3.75 |
| May 31, 2013 | | $7.78 | | $6.14 |
| August 31, 2013 | | $9.43 | | $6.23 |
As of October 10, 2014,February 19, 2018, the closing price of our common stock on the NYSE MKT was $10.19.$8.92.
As of October 10, 2014,February 19, 2018, we had 79,293,688241,786,159 outstanding shares of common stock and 13180 shareholders of record. The number of beneficial owners of our common stock is in excess of 4,600.
Since inception, we have not paid any cash dividends on common stock. Cash dividends are restricted under the terms of our credit facilitydebt agreements, and we presently intend to continue the policy of using retained earnings for expansion of our business.
Our articlesIssuer Purchases of incorporation authorize our board of directorsEquity Securities
|
| | | | | | | | | | | | | |
| Period | | Total Number of Shares (or Units) Purchased | | Average Price Paid per Share (or Unit) | | Total Number of Shares (or Units) Purchased as Part of Publicly Announced Plans or Programs | | Maximum Number (or Approximate Dollar Value) of Shares (or Units) that May Yet Be Purchased Under the Plans or Programs) |
October 1, 2017 - October 31, 2017 (1) | | 2,161 |
| | $ | 9.42 |
| | — |
| | — |
|
November 1, 2017 - November 30, 2017 (1) | | 4,144 |
| | $ | 8.98 |
| | — |
| | — |
|
December 1, 2017 - December 31, 2017 (1) | | — |
| | $ | — |
| | — |
| | — |
|
(1) Pursuant to issue up to 10,000,000 shares of preferred stock. The provisions in the articles of incorporation relating to the preferred stock allow our directors to issue preferred stock with multiple votes per share and dividend rights, which would have priority over any dividends paid with respect to the holdersstatutory minimum withholding requirements, certain of our common stock. The issuance of preferred stock with these rights may makeemployees and executives exercised their right to "withhold to cover" as a tax payment method for the removal of management difficult even if the removal would be considered beneficial to shareholders generally,vesting and will have the effect of limiting shareholder participation in certain transactions such as mergers or tender offers if these transactions are not favored by our management.
Additional Shares Which May be Issued
The following table lists additional shares of our common stock, which may be issued as of October 10, 2014, upon the exercise of outstanding options or warrants.
| | Number of
Shares
| | Note
Reference
|
Shares issuable upon the exercise of Series C warrants | | 1,240,330 | | A |
| | | | |
Shares issuable upon the exercise of Series D warrants (also described as Placement Agent warrants) | | 1,058 | | A |
| | | | |
Shares issuable upon exercise of options held by our officers and employees | | 2,118,000 | | B |
| | | | |
A. We issued 9,000,000 Series C warrants in connection with the salecertain shares. These elections were outside of 180 Units at a price of $100,000 per Unit to private investors during fiscal year 2010. Each Unit consisted of one $100,000 note and 50,000 Series C warrants. Each Series C warrant entitles the holder to purchase one share of our common stock at a price of $6.00 per share at any time prior to December 31, 2014. As of October 10, 2014, 7,759,670 warrants had been exercised. We received cash proceeds of $46.6 million from the exercise of the warrants.
In connection with the unit offering, we also sold to the placement agent, for a nominal price, warrants to purchase 1,125,000 shares of our common stock at a price of $1.60 per share (these warrants are sometimes described as Series D warrants). The placement agent’s warrants expire on December 31, 2014. As of October 10, 2014, warrants to purchase 1,123,942 shares had been exercised by their holders.publicly announced repurchase plan.
B. See Item 8 of this report for information regarding shares issuable upon exercise of options held by our officers and employees.
Comparison of Cumulative Return
The performance graph below compares the cumulative total return of our common stock over the five-year period ended AugustDecember 31, 2014,2017, with the cumulative total returns for the same period for the Standard and Poor's ("S&P") 500 Index and the companies with a Standard Industrial Code ("SIC") of 1311. The SIC Code 1311 isconsists of a weighted average composite of 254 crude petroleumpublicly traded oil and natural gas companies. The cumulative total shareholder return assumes that $100 was invested, including reinvestment of dividends, if any, in our common stock on September 1, 2009August 31, 2012 and in the S&P 500 Index and all companies with the SIC Code 1311 on the same date. The results shown in the graph below are not necessarily indicative of future performance.
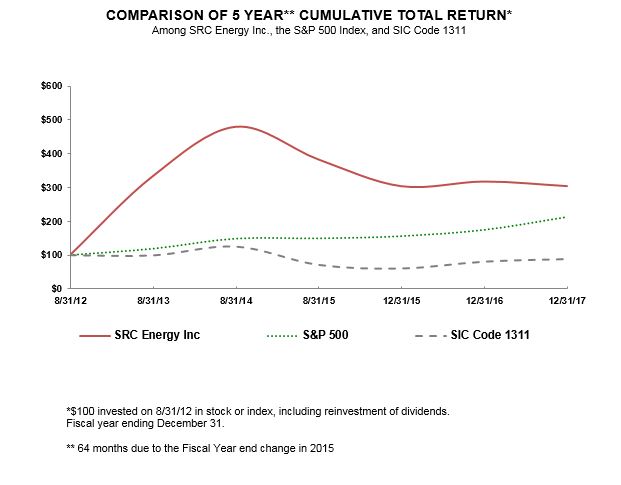
|
| | | | | | | | | | | | | | | | | | | | | |
| | | As of August 31, | | As of December 31, |
| | | 2012 | | 2013 | | 2014 | | 2015 | | 2015 | | 2016 | | 2017 |
| SRC Energy Inc. | | 100.00 |
| | 334.29 |
| | 480.71 |
| | 383.57 |
| | 304.29 |
| | 318.21 |
| | 304.64 |
|
| S&P 500 | | 100.00 |
| | 118.70 |
| | 148.67 |
| | 149.38 |
| | 155.95 |
| | 174.60 |
| | 212.71 |
|
| SIC Code 1311 | | 100.00 |
| | 99.32 |
| | 125.20 |
| | 71.72 |
| | 61.21 |
| | 81.09 |
| | 88.70 |
|
ITEM 6. SELECTED FINANCIAL DATA
| |
| ITEM 6. | SELECTED FINANCIAL DATA |
The selected financial data presented in this item has been derived from our audited consolidated financial statements that are either included in this report or in reports previously filed with the U.S. Securities and Exchange Commission.SEC. The information in this item should be read in conjunction with the consolidated financial statements and accompanying notes and other financial data included in this report.
| | | For the Years Ended August 31, | |
| | | 2014 | | | 2013 | | | 2012 | | | 2011 | | | 2010 | |
Results of Operations (in thousands): | | | | | | | | | | | | | | | |
| Revenues | | $ | 104,219 | | | $ | 46,223 | | | $ | 24,969 | | | $ | 10,002 | | | $ | 2,158 | |
| Net income (loss) | | | 28,853 | | | | 9,581 | | | | 12,124 | | | | (11,600 | ) | | | (10,794 | ) |
| | | | | | | | | | | | | | | | | | | | | |
| Net income (loss) per common share: | | | | | | | | | | | | | | | | | | | | |
| Basic | | $ | 0.38 | | | $ | 0.17 | | | $ | 0.26 | | | $ | (0.45 | ) | | $ | (0.88 | ) |
| Diluted | | $ | 0.37 | | | $ | 0.16 | | | $ | 0.25 | | | $ | (0.45 | ) | | $ | (0.88 | ) |
| | | | | | | | | | | | | | | | | | | | | |
| Certain Balance Sheet Information (in thousands): | | | | | | | | | | | | | | | | | | | | |
| Total Assets | | $ | 448,542 | | | $ | 291,236 | | | $ | 120,731 | | | $ | 63,698 | | | $ | 24,842 | |
| Working Capital | | | (35,338 | ) | | | 50,608 | | | | 10,875 | | | | 685 | | | | 6,237 | |
| Total Liabilities | | | 167,052 | | | | 88,016 | | | | 19,619 | | | | 14,590 | | | | 25,859 | |
| Equity (Deficit) | | | 281,490 | | | | 203,220 | | | | 101,112 | | | | 49,108 | | | | (1,017 | ) |
| | | | | | | | | | | | | | | | | | | | | |
| Certain Operating Statistics: | | | | | | | | | | | | | | | | | | | | |
| Production: | | | | | | | | | | | | | | | | | | | | |
| Oil (Bbls) | | | 941,218 | | | | 421,265 | | | | 235,691 | | | | 89,917 | | | | 21,080 | |
| Gas (Mcf) | | | 3,747,074 | | | | 2,107,603 | | | | 1,109,057 | | | | 450,831 | | | | 141,154 | |
| Total production in BOE | | | 1,565,729 | | | | 772,532 | | | | 420,534 | | | | 165,056 | | | | 44,606 | |
| Average sales price per BOE | | $ | 66.56 | | | $ | 59.83 | | | $ | 59.38 | | | $ | 59.24 | | | $ | 48.39 | |
| LOE per BOE | | $ | 5.10 | | | $ | 4.42 | | | $ | 2.89 | | | $ | 2.94 | | | $ | 1.94 | |
| DDA per BOE | | $ | 21.05 | | | $ | 17.26 | | | $ | 14.29 | | | $ | 16.62 | | | $ | 15.52 | |
|
| | | | | | | | | | | | | | | | | | | | | | | |
| | Year Ended December 31, | | Four Months Ended December 31, 2015 | | Year Ended August 31, |
| | 2017 | | 2016 | | | 2015 | | 2014 | | 2013 |
Results of Operations (in thousands): | | | | | | | | | | | |
| Revenues | $ | 362,516 |
| | $ | 107,149 |
| | $ | 34,138 |
| | $ | 124,843 |
| | $ | 104,219 |
| | $ | 46,223 |
|
| Net income (loss) | 142,482 |
| | (219,189 | ) | | (122,932 | ) | | 18,042 |
| | 28,853 |
| | 9,581 |
|
| | | | | | | | | | | | |
| Net income (loss) per common share: | | | | | | | | | | | |
| Basic | $ | 0.69 |
| | $ | (1.26 | ) | | $ | (1.14 | ) | | $ | 0.19 |
| | $ | 0.38 |
| | $ | 0.17 |
|
| Diluted | $ | 0.69 |
| | $ | (1.26 | ) | | $ | (1.14 | ) | | $ | 0.19 |
| | $ | 0.37 |
| | $ | 0.16 |
|
| | | | | | | | | | | | |
| Certain Balance Sheet Information (in thousands): | | | | | | | | | | | |
| Total Assets | $ | 2,079,564 |
| | $ | 1,024,113 |
| | $ | 672,616 |
| | $ | 746,449 |
| | $ | 448,542 |
| | $ | 291,236 |
|
| Working (Deficit) Capital | (42,272 | ) | | (38,056 | ) | | 24,992 |
| | 93,129 |
| | (35,338 | ) | | 50,608 |
|
| Long-term Obligations | 538,359 |
| | 75,614 |
| | 78,000 |
| | 78,000 |
| | 37,000 |
| | 37,000 |
|
| Total Liabilities | 771,130 |
| | 183,374 |
| | 166,106 |
| | 174,052 |
| | 167,052 |
| | 88,016 |
|
| Equity | 1,308,434 |
| | 840,739 |
| | 506,510 |
| | 572,397 |
| | 281,490 |
| | 203,220 |
|
| | | | | | | | | | | | |
| Certain Operating Statistics: | | | | | | | | | | | |
| Production: | | | | | | | | | | | |
| Oil (MBbls) | 5,824 |
| | 2,257 |
| | 742 |
| | 1,970 |
| | 941 |
| | 421 |
|
| Natural Gas (MMcf) | 24,834 |
| | 12,086 |
| | 3,468 |
| | 7,344 |
| | 3,747 |
| | 2,108 |
|
| NGLs (MBbls) | 2,518 |
| | — |
| | — |
| | — |
| | — |
| | — |
|
| MBOE | 12,481 |
| | 4,271 |
| | 1,320 |
| | 3,194 |
| | 1,566 |
| | 773 |
|
| BOED | 34,194 |
| | 11,670 |
| | 10,822 |
| | 8,750 |
| | 4,290 |
| | 2,117 |
|
Average sales price per BOE 1 | $ | 28.79 |
| | $ | 25.09 |
| | $ | 25.86 |
| | $ | 39.09 |
| | $ | 66.56 |
| | $ | 59.83 |
|
| LOE per BOE | $ | 1.56 |
| | $ | 4.67 |
| | $ | 4.41 |
| | $ | 4.70 |
| | $ | 5.10 |
| | $ | 4.42 |
|
DD&A2 per BOE | $ | 9.00 |
| | $ | 10.93 |
| | $ | 14.22 |
| | $ | 20.62 |
| | $ | 21.05 |
| | $ | 17.26 |
|
1 Adjusted to include the effect of transportation and gathering expenses.
2 Depletion, Depreciation, & Accretion
As of January 1, 2017, our natural gas processing agreements with DCP Midstream have been modified to allow us to take title to the NGLs resulting from the processing of our natural gas. Based on this, we began reporting reserves, sales volumes, prices, and revenues for natural gas and NGLs separately for periods after January 1, 2017. For periods prior to January 1, 2017, we did not separately report reserves, sales volumes, prices, and revenues for NGLs as we did not take title to these NGLs. Instead, the value attributable to these unrecognized NGL volumes was included within natural gas revenues as an increase to the overall price received. This change impacts the comparability of 2017 with prior periods.
The fluctuation in results of operations
On February 25, 2016, we changed our fiscal year from the period beginning on September 1 and ending on August 31 to the period beginning on January 1 and ending on December 31. As a result, the selected financial position is due in partdata above includes financial information for the transition period from September 1, 2015 through December 31, 2015. This financial information may not be directly comparable to acquisitions of producing oil and gas properties coupled with the aggressive drilling program we executed during 2012, 2013 and 2014.prior periods as it covers a shorter time frame.
See Note 1719 to the Financial Statementsconsolidated financial statements included as part of this report for our quarterly financial data. See Note 1 and Note 3 to the consolidated financial statements included as part of this report for information concerning significant accounting policies and acquisitions, respectively.
| |
| ITEM 7. | MANAGEMENT'S DISCUSSION AND ANALYSIS OF FINANCIAL CONDITION AND RESULTS OF OPERATIONS |
Introduction
On February 25, 2016, the Company's board of directors approved a change in fiscal year end from August 31 to December 31. Unless otherwise noted, all references to "years" in this report refer to the twelve-month period which ends on December 31 or August 31 of each year. The following discussion and analysis was prepared to supplement information contained in the accompanying consolidated financial statements and is intended to explain certain items regarding the Company's financial condition as of AugustDecember 31, 2014,2017, and theits results of operations for the years ended AugustDecember 31, 2014, 20132017, December 31, 2016, and 2012.December 31, 2015 (unaudited). It should be read in conjunction with the “Selected Financial Data” and the accompanying audited consolidated financial statements and related notes thereto contained in this Annual Report on Form 10-K. The unaudited results of operations for the year ended December 31, 2015 was derived from data previously reported in the Company's Transition Report on Form 10-K as filed with the SEC on April 22, 2016.
This section and other parts of this Annual Report on Form 10-K contain forward-looking statements that involve risks and uncertainties. See the “Cautionary Note RegardingStatement Concerning Forward-Looking Statements” at the beginning of this Annual Report on Form 10-K. Forward-looking statements are not guarantees of future performance, and our actual results may differ significantly from the results discussed in the forward-looking statements. Factors that might cause such differences include, but are not limited to, those discussed in the subsection entitled “Risk Factors” above, which are incorporated herein by reference.Factors.” We assume no obligation to revise or update any forward-looking statements for any reason, except as required by law.
As of January 1, 2017, our natural gas processing agreements with DCP Midstream were modified to allow us to take title to the NGLs resulting from the processing of our natural gas. Based on this, we began reporting reserves, sales volumes, prices, and revenues for natural gas and NGLs separately for periods after January 1, 2017. For periods prior to January 1, 2017, we did not separately report reserves, sales volumes, prices, and revenues for NGLs as we did not take title to these NGLs. Instead, the value attributable to these unrecognized NGL volumes was included within natural gas revenues as an increase to the overall price received. This change impacts the comparability of 2017 with prior periods.
Overview
We are a growth-orientedSRC Energy Inc. is an independent oil and gas company engaged in the acquisition, development, and production of crudeoil, natural gas, and NGLs in the D-J Basin, which we believe to be one of the premier, liquids-rich oil and natural gas resource plays in and around the Denver-Julesburg Basin (“D-J Basin”) of Colorado. The D-J Basin generally extends from the Denver metropolitan area throughout northeast Colorado into Wyoming, Nebraska and Kansas.United States. It contains hydrocarbon bearinghydrocarbon-bearing deposits in several formations, including the Niobrara, Codell, Greenhorn, Shannon, Sussex, J-Sand, and D-Sand. The area known ashas produced oil and natural gas for over fifty years and benefits from established infrastructure including midstream and refining capacity, long reserve life, and multiple service providers.
Our oil and natural gas activities are focused in the Wattenberg Field, predominantly in Weld County, Colorado, an area that covers the western flank of the D-J basin, particularly in Weld County. The area has produced oil and gas for over fifty years and has a history as oneBasin. Currently, we are focused on the horizontal development of the most prolific production areas inCodell formation as well as the country. Substantially all of our producing wells are either in or adjacent to the Wattenberg Field.
In addition to the approximately 31,000 net developed and undeveloped acres that we hold in the Wattenberg Field, we hold approximately 26,000 undeveloped acres in an area directly to the north and eastthree benches of the Wattenberg Field that is considered the Northern Extension area. WeNiobrara formation, which are currently permitting twelve wells targeting the Greenhorn formation on our leasehold in this area and plan to spud the first well in early calendar year 2015. We have a significant leasehold of undeveloped acreage in western Nebraska. We have entered into a joint exploration agreement with a private operating company based in Denver to drill up to ten wells in this area. We expect drilling activities to commence in Nebraska before December 31, 2014. We also have mineral assets in Yuma and Washington Counties, Colorado that are in an area that has a history of dry gas production from the Niobrara formation.
Since commencing active operations in September 2008, we have undergone significant growth. Our growth was primarily drivenall characterized by (i) our activities as an operator where we drill and complete productive oil and gas wells; (ii) our participation as a part owner in wells drilled by other operating companies; and (iii) our acquisition of producing oil wells from other individuals or companies. As of August 31, 2014, we have completed, acquired, or participated in 404 gross (284 net) successful oil and gas wells. We drilled one exploratory test well during fiscal 2014, which was immediately plugged and abandoned. The following tables summarize activity with respect to operated and non-operated vertical and horizontal wells during the last three years:
| | | VERTICAL WELLS | |
| | | OPERATED WELLS | | | NON-OPERATED WELLS | | | | | | | | | | | | | | |
| | | Completed | | | Participated | | | Acquired | | | Total | |
| Years ended: | | Gross | | | Net | | | Gross | | | Net | | | Gross | | | Net | | | Gross | | | Net | |
| | | | | | | | | | | | | | | | | | | | | | | | | |
| August 31, 2012 | | | 51 | | | | 48 | | | | 8 | | | | 3 | | | | 4 | | | | 4 | | | | 63 | | | | 55 | |
| August 31, 2013 | | | 27 | | | | 26 | | | | 10 | | | | 4 | | | | 36 | | | | 34 | | | | 73 | | | | 64 | |
| August 31, 2014 | | | 1 | | | | 1 | | | | 5 | | | | 1 | | | | 60 | | | | 35 | | | | 66 | | | | 37 | |
| | | | | | | | | | | | | | | | | | | | | | | | | | | | | | | | | |
| Total | | | 79 | | | | 75 | | | | 23 | | | | 8 | | | | 100 | | | | 73 | | | | 202 | | | | 156 | |
| | | HORIZONTAL WELLS | |
| | | OPERATED WELLS | | | NON-OPERATED WELLS | | | | | | | | | | | | | | |
| | | Completed | | | Participated | | | Acquired | | | Total | |
| Years ended: | | Gross | | | Net | | | Gross | | | Net | | | Gross | | | Net | | | Gross | | | Net | |
| | | | | | | | | | | | | | | | | | | | | | | | | |
| August 31, 2012 | | | - | | | | - | | | | 5 | | | | 1 | | | | - | | | | - | | | | 5 | | | | 1 | |
| August 31, 2013 | | | - | | | | - | | | | 11 | | | | 2 | | | | - | | | | - | | | | 11 | | | | 2 | |
| August 31, 2014 | | | 31 | | | | 29 | | | | 23 | | | | 2 | | | | - | | | | - | | | | 54 | | | | 31 | |
| | | | | | | | | | | | | | | | | | | | | | | | | | | | | | | | | |
| Total | | | 31 | | | | 29 | | | | 39 | | | | 5 | | | | - | | | | - | | | | 70 | | | | 34 | |
As is evident in the tables above, we have undergone a shift in focus with respect to the types of wells we are completing. Whereas early development efforts were focused on drilling vertical wells into the Niobrara, Codell, and J-Sand formations, in May 2013, development efforts have shifted to horizontal wells. Horizontal wells are significantly more expensive and take longer to drill and complete than vertical wells, but ultimately generally yield a greater return. We substantially completed five Renfroe wells during 2013 and they commenced production during September 2013. During fiscal 2014, we also commenced production from 26 wells in the Leffler, Phelps, Union, Eberle and Kelly Farms prospects.relatively high liquids content.
In additionorder to the 404 wells that had reached productive status asmaintain operational focus while preserving developmental flexibility, we strive to attain operational control of August 31, 2014, we were the operator of 10 horizontal wells in progress. Two of those wells, including one well on the Eberle prospect and one well on the Phelps prospect, commenced production early in September 2014. We were participating as a non-operator in 43 gross (6 net) horizontal wells that were in various stagesmajority of the drilling or completion process. Generally, horizontal wells on a six well pad are expected to require 120 to 150 days to drill, complete and connect to the gathering system.
As of August 31, 2014, we:
· | were the operator of 31 horizontal wells that were producing oil and gas and we were participating as a non-operating working interest owner in 39 horizontal producing wells; |
· | were the operator of 269 vertical wells that were producing oil and gas and we were participating as a non-operating working interest owner in 65 producing wells; |
· | were the operator of 10 wells in progress and we were participating as a non-operating working interest owner in 43 wells in progress; |
· | held approximately 451,000 gross acres and 309,000 net acres under lease; and |
· | had estimated proved reserves of 16.3 million barrels (“Bbls”) of oil and 95.2 billion cubic feet (“Bcf”) of gas. |
During our fiscal year ended August 31, 2014, we increased our estimated proved reserves by 133% on a BOE equivalent basis and increased our estimated proved reserves by 126% on a PV-10 basis. During the last three months of the fiscal year ended August 31, 2014, we commenced production on three pads in the Wattenberg field, which significantly increased our BOE production. Our consolidated daily production from our producing wells increased during fiscal 2014 from 2,479 BOED as of August 31, 2013 to 5,894 BOED as of August 31, 2014.
Strategy
Our basic strategy for continued growth includes additional drilling activities and acquisition of existing wells in well-defined areas that provide significant cash flow and rapid return on investment. We attempt to maximize our return on assets by drilling in low risk areas and by operating wells in which we have a majorityworking interest. We currently operate approximately 78% of our proved producing reserves, and anticipate operating substantially all of our future net revenue interest. Our drilling efforts have been, and for the foreseeablelocations. Additionally, our current development plan anticipates that all of our future activities will continue to be focused onconcentrated in the Wattenberg Field as it yields consistent results. Our drilling strategy has shifted during the past two years to focus our efforts towards drilling horizontal wells. During the year ended August 31, 2014, we drilled or participated in 31 net horizontal wells and substantially ceased completion and re-completion of our vertical wells. Our plans for 2015 contemplate drilling or participating in 41 to 48 net horizontal wells.Field.
Historically, our cash flow from operations was not sufficient to fund our growth plans and we relied on proceeds from the sale of debt and equity securities. We had also arranged for a bank credit facility to fund our liquidity needs. During fiscal 2014, our primary source of capital resources was cash on hand at the beginning of the year, cash flow from operations and proceeds from the exercise of warrants. We plan to continue to finance an increasing percentage of our growth with internally generated funds. Ultimately, implementation of our growth plans will be dependent upon the success of our operations and the amount of financing we are able to obtain. For more information, see “Liquidity and Capital Resources.”
Significant Developments
Drilling operations
Our significant developments during fiscal 2014 are described in detail in Item 1 “Business” under the heading 2014 Operational and Financial Summary.
Market conditionsConditions
Market prices for our products significantly impact our revenues, net income, and cash flow. The market prices for crude oil, and natural gas, and NGLs are inherently volatile. To provide historical perspective, the following table presents the average annual New York Mercantile Exchange ("NYMEX")NYMEX prices for oil and natural gas for each of the last five fiscal years:years.
| | | Years Ended August 31, | |
| | | 2014 | | | 2013 | | | 2012 | | | 2011 | | | 2010 | |
| Average NYMEX prices | | | | | | | | | | | | | |
| Oil (per bbl) | | $ | 100.39 | | | $ | 94.58 | | | $ | 94.88 | | | $ | 91.79 | | | $ | 76.65 | |
| Natural gas (per mcf) | | $ | 4.38 | | | $ | 3.55 | | | $ | 2.82 | | | $ | 4.12 | | | $ | 4.45 | |
|
| | | | | | | | | | | | | | | | | | | | | | | |
| | Year Ended December 31, | | Year Ended August 31, |
| | 2017 | | 2016 | | 2015 | | 2015 | | 2014 | | 2013 |
| Average NYMEX prices | | | | | (unaudited) | | | | | | |
| Oil (per Bbl) | $ | 50.93 |
| | $ | 43.20 |
| | $ | 48.73 |
| | $ | 60.65 |
| | $ | 100.39 |
| | $ | 94.58 |
|
| Natural gas (per Mcf) | $ | 3.00 |
| | $ | 2.52 |
| | $ | 2.58 |
| | $ | 3.12 |
| | $ | 4.38 |
| | $ | 3.55 |
|
For the periods presented in this report, the following table presents the Reference Price (derived from average NYMEX priceprices) as well as the differential between the NYMEX pricesReference Price and the wellhead prices realized by us.
| Fiscal years ended: | | August 31, | | |
| | | | | Year Ended December 31, |
| | | 2014 | | | 2013 | | | 2012 | | 2017 | | 2016 | | 2015 |
| Oil (NYMEX WTI) | | | | | | | | | | | | | | (unaudited) |
| Average NYMEX Price | | $ | 100.39 | | | $ | 94.58 | | | $ | 94.88 | | $ | 50.93 |
| | $ | 43.20 |
| | $ | 48.73 |
|
| Realized Price | | $ | 89.98 | | | $ | 85.95 | | | $ | 87.59 | | |
| Differential | | $ | (10.41 | ) | | $ | (8.63 | ) | | $ | (7.29 | ) | |
| Realized Price * | | $ | 44.35 |
| | $ | 34.43 |
| | $ | 40.08 |
|
| Differential * | | $ | (6.58 | ) | | $ | (8.77 | ) | | $ | (8.65 | ) |
| | | | | | | | | | | | | | | | | | |
| Gas (NYMEX Henry Hub) | Gas (NYMEX Henry Hub) | | | | | | | | | | | | | | |
| Average NYMEX Price | | $ | 4.38 | | | $ | 3.55 | | | $ | 2.82 | | $ | 3.00 |
| | $ | 2.52 |
| | $ | 2.58 |
|
| Realized Price | | $ | 5.21 | | | $ | 4.75 | | | $ | 3.90 | | $ | 2.33 |
| | $ | 2.44 |
| | $ | 2.71 |
|
| Differential | | $ | 0.83 | | | $ | 1.20 | | | $ | 1.08 | | $ | (0.67 | ) | | $ | (0.08 | ) | | $ | 0.13 |
|
| | | | | | | |
| NGL Realized Price | | $ | 17.10 |
| | $ | — |
| | $ | — |
|
* Adjusted to include the effect of transportation and gathering expenses.
Market conditions in the Wattenberg Field require us to sell oil at prices less than the prices posted by the NYMEX. The negative differential has increased duringbetween the prices received by us at the wellhead and the published indices reflects deductions imposed upon us by the purchasers for location and quality adjustments. With regard to the sale of oil, substantially all of the Company's first quarter 2017 oil production was sold to the counterparties of its firm sales commitments. Beginning in the second quarter of 2017, the Company's oil production exceeded its firm sales commitments, and the surplus oil production was sold at a reduced differential as compared to our 2014 fiscal year. However,committed volumes. Relating to the sale of natural gas, prior to January 1, 2017, the price we are able to sell gas at prices greater than the posted prices, primarily because prices we receive includereceived included payment for a percentage of the value attributable to the natural gas liquids produced with the natural gas. Beginning in the first quarter of 2017, natural gas liquids and dry natural gas volumes are disclosed separately, and NGL revenues will replace the premium to dry natural gas prices that the Company historically realized on its wet natural gas sales volumes.
There has been significant volatility in the price of oil and natural gas since mid-2014. During the year ended December 31, 2017, the NYMEX-WTI oil price ranged from a high of $60.46 per Bbl on December 29, 2017 to a low of $42.48 per Bbl on June 21, 2017, and the NYMEX-Henry Hub natural gas price ranged from a low of $2.56 per MMBtu on February 21, 2017 to a high of $3.42 per MMBtu on May 12, 2017. As reflected in published data, the price for WTI oil settled at $53.75 per Bbl on Friday, December 30, 2016. Comparably, the price of oil settled at $60.46 per Bbl on Friday, December 29, 2017, an increase of 12% from December 31, 2016. Our revenues, results of operations, profitability and future growth, and the carrying value of our oil and gas properties depend primarily on the prices that we receive for our oil, natural gas, and NGL production.
A decline in oil and natural gas prices will adversely affect our financial condition and results of operations. Furthermore, low oil and natural gas prices can result in an impairment of the value of our properties and impact the calculation of the “ceiling test” required under the accounting principles for companies following the “full cost” method of accounting. At December 31, 2017, the calculated value of the ceiling limitation exceeded the carrying value of our oil and gas properties subject to the test, and no impairment was necessary. However, if pricing conditions decline, we may incur a full cost ceiling impairment related to our oil and gas properties in future quarters.
Core Operations
The following table provides details about our ownership interests with respect to vertical and horizontal producing wells as of December 31, 2017:
|
| | | | | | | | | | | | | | | | |
| Vertical Wells |
| Operated Wells | | Non-Operated Wells | | Totals |
| Gross | | Net | | Gross | | Net | | Gross | | Net |
| 345 |
| | 333 |
| | 164 |
| | 49 |
| | 509 |
| | 382 |
|
|
| | | | | | | | | | | | | | | | |
| Horizontal Wells |
| Operated Wells | | Non-Operated Wells | | Totals |
| Gross | | Net | | Gross | | Net | | Gross | | Net |
| 227 |
| | 218 |
| | 278 |
| | 50 |
| | 505 |
| | 268 |
|
In addition to the producing wells summarized in the preceding table, as of December 31, 2017, we were the operator of 51 gross (47 net) wells in progress, which excludes 19 gross (16 net) wells for which we have only set surface casings. As of December 31, 2017, we are participating in 35 gross (6 net) non-operated horizontal wells in progress.
As we develop our acreage through horizontal drilling, we have an active program for plugging and abandoning the vast majority of the operated vertical wellbores. During the year ended December 31, 2017, we plugged 159 wells and returned the associated surface acreage to the property owners.
Properties
As of December 31, 2017, our estimated net proved oil and natural gas reserves, as prepared by Ryder Scott, were 69.4 MMBbls of oil and condensate, 559.9 Bcf of natural gas, and 64.0 MMBbls of natural gas liquids. As of December 31, 2017, we had approximately 98,600 gross and 88,300 net acres under lease in the Wattenberg Field. We also have non-core leasehold in other areas of Colorado and southwest Nebraska approximating 238,500 gross and 200,500 net acres.
Production
For the year ended December 31, 2017, our average net daily production increased to 34,194 BOED as compared to 11,670 BOED for the year ended December 31, 2016. By comparison, our production increased from 9,548 BOED for the year ended December 31, 2015 to 11,670 BOED for the year ended December 31, 2016. As of December 31, 2017, approximately 98% of our daily production was from horizontal wells.
Significant Developments
Acquisitions
In December 2017, the Company completed the purchase of a total of approximately 30,200 net acres in the Greeley-Crescent development area in Weld County Colorado, primarily south of the city of Greeley, for $569.5 million, comprised of $568.1 million in cash and the assumption of certain liabilities ("GCII Acquisition"). Estimated net daily production from the acquired non-operated properties was approximately 2,500 BOE at the time we entered into the agreement governing the transaction (the "GCII Agreement"). The effective date of this part of the transaction was November 1, 2017. The GCII Agreement also contemplates a second closing at which we will acquire operated producing properties subject to certain regulatory restrictions. The purchase price payable at the second closing will be determined based on the amount of then-current production from the properties conveyed and is expected to be completed in 2018. For the second closing, the effective date will be the first day of the calendar month in which the closing for such properties occurs. The second closing is subject to certain closing conditions including the receipt of regulatory approval. Accordingly, the second closing of the transaction may not close in the expected time frame or at all.
In September 2017, we completed the second closing contemplated by the purchase and sale agreement (the "GC Agreement") relating to our 2016 acquisition of approximately 33,100 net acres in the Greeley-Crescent area for $505 million (the "GC Acquisition"). At the second closing, we acquired 335 operated vertical wells and 7 operated horizontal wells. The effective date of the second closing was April 1, 2016 for the horizontal wells acquired and September 1, 2017 for the vertical wells acquired. The purchase and sale agreement for the GC Acquisition was signed in May 2016 and the first closing was
completed in June 2016. At the second closing, the escrow balance of $18.2 million was released and $11.4 million of that amount was returned to the Company. The total purchase price for the second closing was $30.3 million, composed of cash of $6.3 million and assumed liabilities of $24.0 million. The assumed liabilities included $20.9 million for asset retirement obligations.
In August 2017, we entered into an agreement with another party to trade approximately 3,200 net acres of the Company's non-contiguous acreage for approximately 3,200 net acres within the Company's core operating area. This transaction closed in the fourth quarter of 2017. We also executed a purchase and sale agreement with a private party for the acquisition of approximately 1,000 net acres of developed and undeveloped leasehold and mineral interests, along with the associated production, for a total purchase price of $22.6 million, composed of cash and assumed liabilities.
In March 2017, we acquired developed and undeveloped oil and gas leasehold interests for a total purchase price of $25.1 million, composed of cash and assumed liabilities.
Divestitures
During the year ended December 31, 2017, we completed divestitures of approximately 16,000 net undeveloped acres, along with associated production, outside of the Company's core development area for approximately $91.6 million in cash and the assumption by the buyers of $5.2 million in asset retirement obligations and $22.2 million in other liabilities. In accordance with full cost accounting guidelines, the net proceeds were credited to the full cost pool.
Equity Offering
In November 2017, the Company, in connection with a registered underwritten public offering of its common stock (the “Offering”), entered into an underwriting agreement (the “Underwriting Agreement”) with the several underwriters named therein (the “Underwriters”) and pursuant to which the Company agreed to sell 35,000,000 shares of its common stock to the Underwriters at a price of $7.76 per share. In addition, pursuant to the Underwriting Agreement, the Underwriters were granted an option, exercisable within 30 days, to purchase up to an additional 5,250,000 shares of common stock on the same terms and conditions. The option was exercised in full on November 10, 2017, bringing the total number of shares issued in the Offering to 40,250,000. Net proceeds to the Company, after deduction of underwriting discounts and expenses payable by the Company, were $312.2 million. The Company used the proceeds of the offering to pay a portion of the purchase price of the GCII Acquisition and to repay amounts borrowed under the Revolver.
Revolving Credit Facility
In September 2017, the lenders under the Revolver completed their regular semi-annual redetermination of our borrowing base. The borrowing base was increased from $225 million to $400 million. The next semi-annual redetermination is scheduled for April 2018. Due to the outstanding principal balance and letters of credit, approximately $399.5 million of the borrowing base was available to use for future borrowings as of December 31, 2017, subject to our covenant requirements.
2025 Senior Notes
In November 2017, the Company issued $550 million aggregate principal amount of the 2025 Senior Notes in a private placement to qualified institutional buyers. The maturity for the payment of principal is December 1, 2025. Interest on the 2025 Senior Notes accrues at 6.25% and began accruing on November 29, 2017. Interest is payable on June 1 and December 1 of each year, beginning on June 1, 2018. The 2025 Senior Notes were issued pursuant to an indenture dated as of November 29, 2017 (the "Indenture") and are guaranteed on a senior unsecured basis by the Company’s existing and future subsidiaries that incur or guarantee certain indebtedness, including indebtedness under the Revolver. The net proceeds from the sale of the 2025 Senior Notes were $538.1 million after deductions of $11.9 million for expenses and underwriting discounts and commissions. The net proceeds were used to fund the GCII Acquisition, repay the 2021 Senior Notes, and pay off the outstanding Revolver balance. The Indenture contains covenants that restrict the Company’s ability and the ability of certain of its subsidiaries to, among other restrictions and limitations: (i) incur additional indebtedness; (ii) incur liens; (iii) pay dividends; (iv) consolidate, merge, or transfer all or substantially all of its or their assets; (v) engage in transactions with affiliates; or (vi) engage in certain restricted business activities. These covenants are subject to a number of exceptions and qualifications.
2021 Senior Notes
In December 2017, the Company repurchased all $80 million aggregate principal amount of its 2021 Senior Notes. At the time of repurchase, the Company made a required make whole payment of $8.2 million and wrote-off deferred issuance costs of $3.6 million.
Drilling and Completion Operations
Our drilling and completion schedule drives our production forecast and our expected future cash flows. We believe that at current drilling and completion cost levels and with currently prevailing commodity prices, we can achieve reasonable well-level rates of return. Should commodity prices weaken or our costs escalate significantly, our operational flexibility will allow us to adjust our drilling and completion schedule, if prudent. If the well-level internal rate of return is at or below our weighted-average cost of capital, we may choose to delay completions and/or forego drilling altogether. Conversely, if commodity prices move higher, we may choose to accelerate drilling and completion activities.
During the year ended December 31, 2017, we drilled 115 operated horizontal wells and turned 109 operated horizontal wells to sales. As of December 31, 2017, we are the operator of51 gross (47 net) horizontal wells in progress, which excludes 19 gross (16 net) horizontal wells for which we have only set surface casings. For 2018, we expect to drill 117 gross (100 net) operated horizontal wells and complete approximately 116 gross (103 net) operated horizontal wells with mostly mid-length and long laterals targeting the Codell and Niobrara zones.
For the year ended December 31, 2017, we participated in the completion activities on 63 gross (11 net) non-operated horizontal wells. As of December 31, 2017, we are participating in 35 gross (6 net) non-operated horizontal wells in progress. The Company is actively conveying its interests in many of the underlying non-operated wells in progress through signed or anticipated agreements.
Trends and Outlook
Oil traded at $53.75 per Bbl on December 30, 2016, but has since increased approximately 12% as of December 29, 2017 to $60.46. Natural gas traded at $3.72 per Mcf on December 30, 2016, but declined approximately 21% as of December 29, 2017 to $2.95. Although oil prices have increased in the second half of 2017, they continue to be volatile and are out of our control. If oil prices decrease, this could (i) reduce our cash flow which, in turn, could reduce the funds available for exploring and replacing oil and natural gas reserves, (ii) reduce our Revolver borrowing base capacity and increase the difficulty of obtaining equity and debt financing and worsen the terms on which such financing may be obtained, (iii) reduce the number of oil and gas prospects which have reasonable economic returns, (iv) cause us to allow leases to expire based upon the value of potential oil and natural gas reserves in relation to the costs of exploration, (v) result in marginally productive oil and natural gas wells being abandoned as non-commercial, and (vi) cause ceiling test impairments.
Other factors that will most significantly affect our results of operations include (i) activities on properties that we operate, (ii) the marketability of our production, (iii) the availability and capacity of gathering systems, pipelines, and other midstream infrastructure for our production, (iv) our ability to satisfy our financial and volume commitment obligations, (v) completion of acquisitions of additional properties and reserves, and (vi) competition from other oil and gas companies.
We utilize what we believe to be industry best practices in our effort to achieve optimal hydrocarbon recoveries. Currently, our practice is to drill 16 to 24 horizontal wells per 640-acre section depending upon specific geologic attributes and existing vertical wellbore development. Some operators are testing higher density programs, but we believe that it is too early to determine whether the recoveries justify the additional capital cost.
We have been able to reduce drilling and completion costs due to a combination of optimizing well designs, fewer average days to drill, and lower completion costs. This focus on cost reduction has supported well-level economics giving consideration to the current prices of oil and natural gas. We continue to strive to reduce drilling and completion costs going forward, but as commodity prices improve and industry activity increases, we may experience higher service costs, causing well-level rates of return to be lower.
Midstream companies that operate the natural gas processing facilities and gathering pipelines in the Wattenberg Field continue to make significant capital investments to increase the capacity of their systems. From time to time, our production has been adversely impacted by the lack of processing capacity resulting in high natural gas gathering line pressures.
To address the growing volumes of natural gas production in the D-J Basin, DCP Midstream has announced plans for multiple projects including new processing plants, low pressure gathering systems, additional compression, and plant bypass infrastructure. Most notably, in collaboration with DCP Midstream, we and several other producers have agreed to support the expansion of natural gas gathering and processing capacity through agreements that impose baseline and incremental volume commitments, which we are currently exceeding. The initial plan includes a new 200 MMcf per day processing plant as well as
the expansion of a related gathering system, both expected to be completed during the third quarter of 2018. Additionally, through the same framework, all of the parties agreed to a development plan to add another 200 MMcf/d plant in mid-2019.
We have extended the use of oil and water gathering lines to certain production locations. These gathering systems are owned and operated by independent third parties, and we commit specific leases or areas to these systems. We believe these gathering lines have several benefits, including a) reduced need to use trucks, thereby reducing truck traffic and noise in and around our production locations, b) potentially lower gathering costs as pipeline gathering tends to be more efficient, c) reduced on-site storage capacity, resulting in lower production location facility costs, and d) generally improved community relations. As these gathering lines are currently being expanded, we have experienced and expect to continue to experience some delays in placing our pads on production.
Oil transportation and takeaway capacity has increased with the expansion of certain interstate pipelines servicing the Wattenberg Field. This has reversed the prior imbalance of oil production exceeding the combination of local refinery demand and the capacity of pipelines to move the oil to other markets. We strive to reduce the negative differential that we have historically realized on our oil production depending on transportation commitments, local refinery demand, and our production volumes. Further details regarding posted prices and average realized prices are discussed in "-Market Conditions."
As of December 31, 2017, we have identified over 1,700 drilling locations across our acreage position in the core of the Wattenberg Field. For 2018, we expect to drill 117 gross operated horizontal wells with mostly mid-length and long laterals targeting the Codell and Niobrara zones. We anticipate this drilling and completion program will cost between $480 million and $540 million and will lead to a significant increase in production and associated proved developed producing reserves while allowing us to retain significant operational and financial flexibility to reduce or accelerate activity in response to changing economic conditions. Initial estimates place full-year 2018 production to average between 48,000 BOED and 52,000 BOED with oil making up 47% - 50% of production.
Other than the foregoing, we do not know of any trends, events, or uncertainties that have had, during the periods covered by this report, or are reasonably expected to have, a material impact on our sales, revenues, expenses, liquidity, or capital resources.
Results of Operations
Material changes of certain items in our consolidated statements of operations included in our consolidated financial statements for the periods presented are discussed below. All references to the year ended December 31, 2015 are unaudited.
For the year ended AugustDecember 31, 2014,2017 compared to the year ended AugustDecember 31, 20132016
For the year ended AugustDecember 31, 2014,2017, we reported net income of $28.9$142.5 million compared to net incomeloss of $9.6$219.2 million forduring the twelve monthsyear ended AugustDecember 31, 2013. Earnings2016. Net income per basic and diluted share were $0.38was $0.69 for the year ended December 31, 2017 compared to net loss per share per basic and $0.37diluted share of $1.26 for the year ended December 31, 2016. Net income per dilutedbasic share for the year ended AugustDecember 31, 2014 compared2017 increased by $1.95 primarily due to $0.17 per basic and $0.16 per diluted sharethe ceiling test impairment of $215.2 million incurred during the same period one year prior. Rapid growth in reserves, producing wells and daily production totals, as well asended December 31, 2016 (whereas no ceiling test impairment was recognized during the impact of changing prices on our commodity hedge positions drove this increase. The significant variances between the two years were primarily caused by increased revenues and expenses associated with production fromyear ended December 31, new horizontal wells2017) and the acquisition of producing properties included238.3% increase in the Trilogy and Apollo transactions. The following discussion expands upon significant items of inflow and outflow that affected results of operations.
37
revenues period over period as described below.
Oil and Natural Gas Production and Revenues – - For the year ended AugustDecember 31, 2014,2017, we recorded total oil, natural gas, and gasNGL revenues of $104.2$362.5 million compared to $46.2$107.1 million for the year ended AugustDecember 31, 2013,2016, an increase of $58.0$255.4 million or 125%238%. The following table summarizes key production and revenue statistics:
|
| | | | | | | | | | |
| | Year Ended December 31, | | |
| | 2017 | | 2016 | | Change |
| Production: | | | | | |
| Oil (MBbls) | 5,824 |
| | 2,257 |
| | 158 | % |
| Natural Gas (MMcf) | 24,834 |
| | 12,086 |
| | 105 | % |
NGLs (MBbls) 1 | 2,518 |
| | — |
| | nm |
|
| MBOE | 12,481 |
| | 4,271 |
| | 192 | % |
| BOED | 34,194 |
| | 11,670 |
| | 193 | % |
| | | | | | |
| Revenues (in thousands): | | | | | |
| Oil | $ | 261,505 |
| | $ | 77,699 |
| | 237 | % |
| Natural Gas | 57,956 |
| | 29,450 |
| | 97 | % |
NGLs 1 | 43,055 |
| | — |
| | nm |
|
| | $ | 362,516 |
| | $ | 107,149 |
| | 238 | % |
| Average sales price: | | | | | |
Oil 2 | $ | 44.35 |
| | $ | 34.43 |
| | 29 | % |
| Natural Gas | $ | 2.33 |
| | $ | 2.44 |
| | (5 | )% |
NGLs 1 | $ | 17.10 |
| | $ | — |
| | nm |
|
BOE 2 | $ | 28.79 |
| | $ | 25.09 |
| | 15 | % |
1 For periods prior to January 1, 2017, we did not separately report sales volumes, prices, and revenues for NGLs as we did not take title to these NGLs. Instead, the value attributable to these unrecognized NGL volumes was included within natural gas revenues as an increase to the overall price received. This change impacts the comparability of the two periods presented.
2 Adjusted to include the effect of transportation and gathering expenses.
As of August 31, 2014, we owned interests in 404 producing wells. Net oil, natural gas and gasNGL production for the year ended December 31, 2017 averaged 4,290 BOE per day in fiscal 2014, compared to 2,117 BOE per day for 2013, a year-over-year34,194 BOED, an increase of 103%193% over average production of 11,670 BOED in BOEPD production.the year ended December 31, 2016. From December 31, 2016 to December 31, 2017, our well count increased by 140 net horizontal wells, growing our reserves and daily production totals. Additionally, our conversion to three stream accounting positively impacted reported production in the current period. The192% increase in production and the 15% increase in average sales prices resulted in a significant increase in production from the prior year reflects our increased well count and shift to horizontal wells.revenues.
Our rate of growth was even more pronounced at the end of our fiscal year. During the fourth quarter of 2014, we completed 15 new horizontal wells. Production for the fourth fiscal quarter of 2014 averaged 5,894 BOE per day.
Our revenues are sensitive to changes in commodity prices. As shown in the following table, there has been an increase of 11% in average realized sales prices between 2013 and 2014. The following table presents actual realized prices, without the effect of hedge transactions. The impact of hedge transactions is presented later in this discussion.
Key production information is summarized in the following table:
| | | Years Ended August 31, | |
| | | 2014 | | | 2013 | |
| Production: | | | | | | |
Oil (Bbls1) | | | 941,218 | | | | 421,265 | |
Gas (Mcf2) | | | 3,747,074 | | | | 2,107,603 | |
| | | | | | | | | |
Total production in BOE3 | | | 1,565,729 | | | | 772,532 | |
| | | | | | | | | |
| Revenues (in thousands): | | | | | |
| Oil | | $ | 84,693 | | | $ | 36,206 | |
| Gas | | | 19,526 | | | | 10,017 | |
| | | $ | 104,219 | | | $ | 46,223 | |
| Average sales price: | | | | | | | | |
| Oil | | $ | 89.98 | | | $ | 85.95 | |
| Gas | | $ | 5.21 | | | $ | 4.75 | |
| BOE | | $ | 66.56 | | | $ | 59.83 | |
1 | | “Bbl” refers to one stock tank barrel, or 42 U.S. gallons liquid volume in reference to crude oil or other liquid hydrocarbons.
|
2 | | “Mcf” refers to one thousand cubic feet of natural gas.
|
3 | | “BOE” refers to barrel of oil equivalent, which combines Bbls of oil and Mcf of gas by converting each six Mcf of gas to one Bbl of oil. |
Lease Operating Expenses (“LOE”) and Production TaxesLOE – - Direct operating costs of producing oil and natural gas and taxes on production and properties are reported as lease operating expenses as follows (in thousands):
|
| | | | | | | |
| | Year Ended December 31, |
| | 2017 | | 2016 |
| Production costs | $ | 18,900 |
| | $ | 19,251 |
|
| Workover | 596 |
| | 698 |
|
| Total LOE | $ | 19,496 |
| | $ | 19,949 |
|
| | | | |
| Per BOE: | | | |
| Production costs | $ | 1.51 |
| | $ | 4.51 |
|
| Workover | 0.05 |
| | 0.16 |
|
| Total LOE | $ | 1.56 |
| | $ | 4.67 |
|
| | | Years Ended August 31, | |
| | | 2014 | | | 2013 | |
| Production costs | | $ | 7,794 | | | $ | 3,198 | |
| Work-over | | | 197 | | | | 219 | |
| Lifting cost | | | 7,991 | | | | 3,417 | |
| Severance and ad valorem taxes | | | 9,667 | | | | 4,237 | |
| Total LOE | | $ | 17,658 | | | $ | 7,654 | |
| | | | | | | | | |
| Per BOE: | | | | | | | | |
| Production costs | | $ | 4.98 | | | $ | 4.14 | |
| Work-over | | | 0.12 | | | | 0.28 | |
| Lifting cost | | | 5.10 | | | | 4.42 | |
| Severance and ad valorem taxes | | | 6.17 | | | | 5.48 | |
| Total LOE | | $ | 11.27 | | | $ | 9.90 | |
Lease operating and work-overworkover costs tend to increase or decrease primarily in relation to the number and type of wells inand our overall production volumes and, to a lesser extent, on fluctuationfluctuations in oil field service costs and changes in the production mix of crude oil and natural gas. Taxes make upDuring the largest single componentyear ended December 31, 2017, we experienced decreased production expense compared to the year ended December 31, 2016 primarily due to significantly less expense related to environmental remediation and regulatory compliance projects during 2017 and the continued consolidation of directour operations into a more central geographic operating area. Unit operating costs benefited from larger volumes of early production on the 101 net horizontal wells turned to sales during the
year ended December 31, 2017.
Transportation and gathering - During 2017, the Company entered into new gathering agreements which resulted in new transportation and gathering charges. Transportation and gathering was $3.2 million, or $0.26 per BOE, for the year ended December 31, 2017, compared to nil for the year ended December 31, 2016. While reported as an expense, the Company analyzes these charges on a net basis within revenue.
Production taxes - Production taxes are comprised primarily of two elements: severance tax and ad valorem tax. Production taxes were $36.3 million, or $2.91 per BOE, for the year ended December 31, 2017, compared to $5.7 million, or $1.34 per BOE, for the year ended December 31, 2016. Taxes tend to increase or decrease primarily based on the value of oil and gasproduction sold. As a percentage of revenues, production taxes averaged 9.3%were 10.0% and 5.3% for the years ended December 31, 2017 and 2016, respectively. During the year ended December 31, 2017, the Company adjusted its estimates for production taxes to reflect significant increases in 2014 and 9.2%production. During the year ended December 31, 2016, the Company reduced its estimate for ad valorem taxes, resulting in 2013.an approximate $3.6 million reduction to our production taxes.
From 2013 to 2014, we experienced an increase in production cost per BOE in connection with additional costs to bolster output from some of our older wells as well as additional costs to operate horizontal wells. We continue to work diligently to mitigate production difficulties within the Wattenberg Field. Additional wellhead compression has been added at some well locations and older equipment has been replaced or refurbished. During 2014, we incurred additional costs related to the integration of the newly acquired producing properties. In particular, the acquisition of a disposal well in one of the acquisitions added to our average cost per BOE, as the disposal well has a slightly different cost profile than our other wells. As expected, horizontal wells are more costly to operate than vertical wells, especially during the early stages of production. Finally, costs incurred to comply with new environmental regulations are significant.
Depletion, Depreciation and Amortization (“DDA”)DD&A – - The following table summarizes the components of DDA: DD&A:
|
| | | | | | | |
| | Year Ended December 31, |
| (in thousands) | 2017 | | 2016 |
| Depletion of oil and gas properties | $ | 109,287 |
| | $ | 45,193 |
|
| Depreciation and accretion | 3,022 |
| | 1,485 |
|
| Total DD&A | $ | 112,309 |
| | $ | 46,678 |
|
| | | | |
| DD&A expense per BOE | $ | 9.00 |
| | $ | 10.93 |
|
| | | Years ended August 31, | |
| (in thousands) | | 2014 | | | 2013 | |
| Depletion | | $ | 32,132 | | | $ | 13,046 | |
| Depreciation and amortization | | | 826 | | | | 290 | |
| Total DDA | | $ | 32,958 | | | $ | 13,336 | |
| | | | | | | | | |
| DDA expense per BOE | | $ | 21.05 | | | $ | 17.26 | |
For the year ended AugustDecember 31, 2014, depletion of oil and gas properties2017, DD&A was $21.05$9.00 per BOE compared to $17.26$10.93 per BOE for the year ended AugustDecember 31, 2013.2016. The increasedecrease in the DDADD&A rate was the result of an increasea decrease in both the ratio of reserves produced and the total costs capitalized in the full cost pool.pool to the estimated recoverable reserves. This ratio was significantly reduced due to the increase in our total proved reserves and the impairments of our full cost pool that primarily occurred during 2016. These impacts were partially offset by recent drilling and completion activities which increased the amortization base. Capitalized costs of evaluatedproved oil and gas properties are depleted quarterly using the units-of-production method based on estimated reserves, wherein the ratio of production volumes for the quarter to beginning of quarter estimated total reserves determinedetermined the depletion rate. For fiscal
Full cost ceiling impairment - During the year 2014, production represented 4.6% of our reserve baseended December 31, 2017, we had no impairment as compared to 5.2%an impairment of $215.2 million for the year ended AugustDecember 31, 2013. A contributing factor to2016, representing the change inamount by which the ratio was the inclusion of additional horizontal wells in the calculation. Consistent with the expected decline curve for wells targeting the Niobrara and Codell formations, we expect horizontal wells to exhibit robust production during the first few weeks, decline rapidly over the first six months, and eventually stabilize over an expected life in excess of 30 years. However, the initial reserve estimates for horizontal wells have not incorporated all of the reserves that may ultimately be recovered. The initial reserves estimated for horizontal development prospects have been prepared using an average of 80 acre spacing, compared to 20 acre spacing for vertical well development. As we gain more experience with the development of horizontal sections, we believe that spacing units will decrease, effectively increasing the EUR for each section.
In addition to a change in the ratio of production to EUR, our DDA rate was affected by the increasingnet capitalized costs of mineral leases, included as provenour oil and gas properties and the costs associated with the acquisition of producing properties. Leasing costs in the D-J Basin continue to increase with the success of horizontal development. For acquisition of producing properties, substantially all of the costs are allocated to proved reserves and included in theexceeded our full cost pool. The allocation of the purchase price related to the November 2013 Trilogyceiling. See “-Critical Accounting Policies-Oil and Apollo acquisitions was at a higher cost per BOE than our historical cost of acquiring leaseholds and developing our properties. Therefore, the increase in the ratio of costs subject to amortization to the reserves acquired is greater than our internally developed properties. Both of these acquisitions include areas that have the potential for future development. Successful development of these areas that increased proved reserves would have the impact of reducing cost per BOE.Gas Properties, including Ceiling Test.”
General and Administrative (“("G&A”&A") –The - The following table summarizes G&A expenses incurred and capitalized during the last two yearsperiods presented:
| | | Years Ended August 31, | |
| (in thousands) | | 2014 | | | 2013 | |
| G&A costs incurred | | $ | 11,369 | | | $ | 6,325 | |
| Capitalized costs | | | (1,230 | ) | | | (637 | ) |
| Total G&A | | $ | 10,139 | | | $ | 5,688 | |
| | | | | | | | | |
| G&A Expense per BOE | | $ | 6.48 | | | $ | 7.36 | |
|
| | | | | | | |
| | Year Ended December 31, |
| (in thousands) | 2017 | | 2016 |
| G&A costs incurred | $ | 43,338 |
| | $ | 37,619 |
|
| Capitalized costs | (10,373 | ) | | (7,074 | ) |
| Total G&A | $ | 32,965 |
| | $ | 30,545 |
|
| | | | |
| Non-Cash G&A | $ | 11,225 |
| | $ | 9,491 |
|
| Cash G&A | 21,740 |
| | 21,054 |
|
| Total G&A | $ | 32,965 |
| | $ | 30,545 |
|
| | | | |
| Non-Cash G&A per BOE | $ | 0.90 |
| | $ | 2.22 |
|
| Cash G&A per BOE | 1.74 |
| | 4.93 |
|
| G&A Expense per BOE | $ | 2.64 |
| | $ | 7.15 |
|
G&A includes all overhead costs associated with employee compensation and benefits, insurance, facilities, professional fees, and regulatory costs, among others. In an effort to minimize overhead costs, we employ a total staff of 29 employees, and use consultants, advisors, and contractors to perform certain tasks when it is cost-effective. We maintain our corporate office in Platteville, CO partially to avoid higher rents in other areas.
AlthoughTotal G&A costs have increased as we growof $33.0 million for the business, we strive to maintain an efficient overhead structure. For the fiscal year ended AugustDecember 31, 2014,2017 were 8% higher than G&A was $6.48 per BOE compared to $7.36 for the fiscal year ended AugustDecember 31, 2013,2016. This increase is primarily asdue to a result of the27% increase in BOE producedemployee headcount from 96 at December 31, 2016 to 122 at December 31, 2017, which was offset by a reduction in professional fees incurred due to decreased contract services during fiscal 2014.2017.
Our G&A expense for 2014the year ended December 31, 2017 includes share-basedstock-based compensation of $3.0$11.2 million compared to $1.4$9.5 million in 2013. Share-based compensation includes a calculated value for stock options or shares of common stock that we grant for compensatory purposes. It is a non-cash charge, which, for stock options, is calculated using the Black-Scholes-Merton option pricing model to estimate the fair value of options. Amounts are pro-rated over the vesting terms of the option agreement, generally three to five years.year ended December 31, 2016.
Pursuant to the requirements under the full cost accounting method for oil and gas properties, we identify all general and administrative costs that relate directly to the acquisition of undeveloped mineral leases and the exploration and development of properties. Those costs are reclassified from G&A expenses and capitalized into the full cost pool. The increase in capitalized costs from 2013the year ended December 31, 2016 to 2014the year ended December 31, 2017 reflects our increasingincreased headcount of individuals performing activities to maintain and acquire leases and develop theour properties.
Other Income (Expense) – Neither interest expense nor interest income had a significant impact on our results of operations for 2014 or 2013. The interest costs that we incurred under our credit facility were eligible for capitalization into the full cost pool. We capitalize interest costs that are related to the cost of assets during the period of time before they are placed into service.
Commodity derivative gains (losses) – derivatives - As more fully described in the paragraphs titled “Oil“-Liquidity and Capital Resources-Oil and Gas Commodity Contracts” and “Hedge Activity Accounting” located in “Liquidity and Capital Resources,Contracts,” we use commodity contracts to help mitigate the risks inherent in the price volatility of oil and natural gas. Ingas prices. For the year ended AugustDecember 31, 2014,2017, we realized a cash settlement lossgain of $2.1 million related$39.0 thousand, net of previously incurred premiums attributable to contracts thatthe settled during the period. For the year ended August 31, 2013,commodity contracts. In 2016, we realized a cash settlement lossgain of $0.4$2.4 million.
In addition, for the year ended December 31, 2017, we recorded an unrealized gainloss of $2.5$4.3 million to recognize the mark-to-market change in fair value of our futures contracts for the year ended August 31, 2014.commodity contracts. In comparison, in the year ended AugustDecember 31, 20132016, we reported an unrealized loss of $2.6$10.1 million. Unrealized gains and losses are non-cash items.
Income Taxestaxes – - We reported income tax expensebenefit of $15.0$0.1 million for the fiscal year ended AugustDecember 31, 2014,2017, calculated at an effective tax rate of 34%0%. During the comparable prior year,In 2016, we reported income tax expense of $6.9$0.1 million, calculated at an effective tax rate of 42%0%. For both periods, it appears thatAs explained in more detail below, during the tax liability will be substantially deferred into future years. During fiscal year 2014,ended December 31, 2017, the effective tax rate was substantially reduced from the federal and state statutory rate by the impactrecognition of deductions for percentage depletion.a full valuation allowance on the net deferred tax asset.
ForIn assessing the realizability of deferred tax purposes, we have a net operating loss (“NOL”) carryover for federal purposes of $33.2 million and for state tax purposes of approximately $41.1 million, whichassets, management considers whether it is available to offset future taxable income and will expire, if not utilized, beginning in year 2031. For book purposes, the NOL is $22.5 million, as there is a difference of $10.7 million related to deductions for stock based compensation.
Each year, management evaluates all the positive and negative evidence regarding our tax position and reaches a conclusion on the most likely outcome. During 2014 and 2013, we concluded that it was more likely than not that we would be able to realize a benefit fromsome portion or all of the net operating loss carry-forward, and have therefore included it in our inventory of deferred tax assets.assets will be realized. Based on the level of losses in the current period and the level of uncertainty with respect to future taxable income over the period in which the deferred tax assets are deductible, a valuation allowance has been provided as of December 31, 2017. During 2016, we reached the same conclusion; therefore, a valuation allowance has been provided as of December 31, 2016.
For the year ended AugustDecember 31, 2013,2016, compared to the year ended AugustDecember 31, 20122015
For the year ended AugustDecember 31, 2013,2016, we reported net incomeloss of $9.6$219.2 million or $0.17 per basic share, $0.16 per diluted share, compared to net incomeloss of $12.1$131.7 million or $0.26during the year ended December 31, 2015. Net loss per basic share and $0.25 per diluted share was $1.26 for the periodyear ended AugustDecember 31, 2012.2016 compared to net loss per share per basic and diluted share of $1.27 for the year ended December 31, 2015. Revenues increased slightly during the year ended December 31, 2016 compared to the year ended December 31, 2015. As of December 31, 2016, we had 631 gross producing wells, compared to 609 gross producing wells as of December 31, 2015. The decline in net income for 2013 reflects significant non-cash charges for an unrealized lossimpact of $2.6 millionchanging prices on our commodity derivatives and a provision for deferred income taxesderivative positions also drove significant differences in our results of $6.9 million.
There was an improvement in operating income, which increased from $11.8 million in 2012 to $19.5 million. Our 66% improvement in operating profitability was driven by our successful drilling program and integration of producing wells added in the December 2012 Orr Energy acquisition. The significant variancesoperations between the two years were primarily caused by increased revenues and expenses associated with a greater number of producing wells. The following discussion expands upon significant items of inflow and outflow that affected results of operations.periods.
Oil and Natural Gas Production and Revenues – - For the year ended AugustDecember 31, 2013,2016, we recorded total oil, natural gas, and NGL revenues of $46.2$107.1 million compared to $25.0$106.1 million for the year ended AugustDecember 31, 2012, an increase of $21.2 million or 85%. We experienced an overall 84% annual increase in2015. The following table summarizes key production quantities from the prior year having realized a full year of production from wells at the beginning of the year, and the addition of wells, including new wells drilled as well as those acquired with the December 2012 Orr Energy acquisition.revenue statistics:
|
| | | | | | | | | | |
| | Year Ended December 31, | | |
| | 2016 | | 2015 | | Change |
| Production: | | | | | |
| Oil (MBbls) | 2,257 |
| | 2,073 |
| | 9 | % |
| Natural Gas (MMcf) | 12,086 |
| | 8,472 |
| | 43 | % |
| MBOE | 4,271 |
| | 3,485 |
| | 23 | % |
| BOED | 11,670 |
| | 9,548 |
| | 22 | % |
| | | | | | |
| Revenues (in thousands): | | | | | |
| Oil | $ | 77,699 |
| | $ | 83,078 |
| | (6 | )% |
| Natural Gas | 29,450 |
| | 22,972 |
| | 28 | % |
| | $ | 107,149 |
| | $ | 106,050 |
| | 1 | % |
| Average sales price: | | | | | |
| Oil | $ | 34.43 |
| | $ | 40.08 |
| | (14 | )% |
| Natural Gas | 2.44 |
| | 2.71 |
| | (10 | )% |
| BOE | $ | 25.09 |
| | $ | 30.43 |
| | (18 | )% |
| | | Years Ended August 31, | |
| | | 2013 | | | 2012 | |
| Production: | | | | | | |
Oil (Bbls1) | | | 421,265 | | | | 235,691 | |
Gas (Mcf2) | | | 2,107,603 | | | | 1,109,057 | |
| | | | | | | | | |
Total production in BOE3 | | | 772,532 | | | | 420,534 | |
| | | | | | | | | |
| Revenues (in thousands): | | | | | |
| Oil | | $ | 36,206 | | | $ | 20,644 | |
| Gas | | | 10,017 | | | | 4,325 | |
| | | $ | 46,223 | | | $ | 24,969 | |
| Average sales price: | | | | | | | | |
| Oil | | $ | 85.95 | | | $ | 87.59 | |
| Gas | | $ | 4.75 | | | $ | 3.90 | |
| BOE | | $ | 59.83 | | | $ | 59.38 | |
1 | | “Bbl” refers to one stock tank barrel, or 42 U.S. gallons liquid volume in reference to crude oil or other liquid hydrocarbons.
|
2 | | “Mcf” refers to one thousand cubic feet of natural gas.
|
3 | | “BOE” refers to barrel of oil equivalent, which combines Bbls of oil and Mcf of gas by converting each six Mcf of gas to one Bbl of oil. |
As of August 31, 2013, we owned interests in 293 producing wells. Net oil and natural gas production averaged 2,117 BOE per day in 2013, as compared with 1,149 BOE per day for 2012, a year over year increase of 84% in BOEPD production. The significant increase in production from the prior year reflects 84 additional wells that went into productive status during 2013 and a full year of production from the 68 wells that were added over the course of fiscal year 2012. Production for the fourth fiscal quarter of 2013year ended December 31, 2016 averaged 2,479 BOE per day.
Revenues are sensitive to changes in commodity prices. From 2012 to 2013, our realized annual average sales price per barrel of oil decreased 2%; however, we experienced11,670 BOED, an increase of 22% over average production of 9,548 BOED in the year ended December 31, 2015. From December 31, 2015 to December 31, 2016, our realized annualwell count increased by 25 net horizontal wells, growing our reserves and daily production totals. The 18% decline in average sales price per Mcfprices offset the effects of natural gas. Overall on a BOE basis, 99% of the increaseincreased production, resulting in oil and gasrelatively flat revenues was attributed to increased volumes and 1% was attributed to the increase of BOE prices received.overall.
Lease Operating Expenses (“LOE”) and Production TaxesLOE – - Direct operating costs of producing oil and natural gas and taxes on production and properties are summarizedreported as follows (in thousands):
| | | Years Ended August 31, | |
| Lease Operating Expenses | | 2013 | | | 2012 | |
| Lifting costs | | $ | 3,198 | | | $ | 1,146 | |
| Work-over | | | 219 | | | | 66 | |
| Total LOE | | $ | 3,417 | | | $ | 1,212 | |
| LOE per BOE | | $ | 4.42 | | | $ | 2.88 | |
| | | | | | | | | |
| | | Years Ended August 31, | |
| Production Taxes | | | 2013 | | | | 2012 | |
| Severance and ad valorem taxes | | $ | 4,237 | | | $ | 2,436 | |
| Production taxes per BOE | | $ | 5.48 | | | $ | 5.79 | |
|
| | | | | | | |
| | Year Ended December 31, |
| | 2016 | | 2015 |
| Production costs | $ | 19,251 |
| | $ | 14,927 |
|
| Workover | 698 |
| | 1,157 |
|
| Total LOE | $ | 19,949 |
| | $ | 16,084 |
|
| | | | |
| Per BOE: | | | |
| Production costs | $ | 4.51 |
| | $ | 4.28 |
|
| Workover | 0.16 |
| | 0.33 |
|
| Total LOE | $ | 4.67 |
| | $ | 4.61 |
|
Lease operating and work-overworkover costs tend to fluctuate withincrease or decrease primarily in relation to the number of producing wells in production and, to a lesser extent, on variationsfluctuation in oil field service costs and changes in the production mix of crude oil and natural gas. From 2012During the year ended December 31, 2016, we experienced increased production expense primarily due to 2013, we experiencedoperating additional horizontal wells, increased production, and an increase in production cost per BOE in connection with additional costsregulatory compliance projects.
Production taxes - Taxes tend to bolster output from some of our older wells. Taxes, the largest component of lease operating expenses, generally move withincrease or decrease primarily based on the value of oil and natural gas sold. During the year ended December 31, 2016, production taxes were $5.7 million, or $1.34 per BOE, compared to $9.4 million, or $2.70 per BOE, during the prior year comparable period. As a percent of revenues, taxes averaged 9.2%were 5.3% and 8.9% for the years ended December 31, 2016 and 2015, respectively. The decrease in 20132016 is due to a change in estimate for production taxes based on recent historical experience and 9.8%additional information received during the period. Based on this analysis, our production tax accrual was reduced, resulting in 2012.an approximate $3.6 million reduction to our production taxes.
Depletion, Depreciation and Amortization (“DDA”)DD&A – - The following table summarizes the components of DDA. Depletion expense more than doubled, primarily as aDD&A:
|
| | | | | | | |
| | Year Ended December 31, |
| (in thousands) | 2016 | | 2015 |
| Depletion of oil and gas properties | $ | 45,193 |
| | $ | 61,172 |
|
| Depreciation and accretion | 1,485 |
| | 899 |
|
| Total DD&A | $ | 46,678 |
| | $ | 62,071 |
|
| | | | |
| DD&A expense per BOE | $ | 10.93 |
| | $ | 17.81 |
|
For the year ended December 31, 2016, depletion of oil and gas properties was $10.93 per BOE compared to $17.81 per BOE for the year ended December 31, 2015. The decrease in the DD&A rate was the result of growtha decrease in productionthe ratio of total costs capitalized in the full cost pool to the estimated recoverable reserves. This ratio was significantly reduced due to the impairments of our full cost pool, which primarily occurred during the second half of calendar 2015 and producing properties from 2012 to 2013.
| | | Years ended August 31, | |
| (in thousands) | | 2013 | | | 2012 | |
| Depletion | | $ | 13,046 | | | $ | 5,838 | |
| Depreciation and amortization | | | 290 | | | | 172 | |
| Total DDA | | $ | 13,336 | | | $ | 6,010 | |
| | | | | | | | | |
| DDA expense per BOE | | $ | 17.26 | | | $ | 14.29 | |
the first half of 2016, and the increase in our total proved reserves. Capitalized costs of evaluatedproved oil and gas properties are depleted quarterly using the units-of-production method based on estimated reserves, wherein the ratio of production volumes for the quarter to beginning of quarter estimated total reserves determinedetermines the depletion rate. For fiscal year 2013, our depletable reserve base was 14,829,487 BOE. Fiscal year 2013 production represented 5.2% of the reserve base.
Depletion expense per BOE increased 21% from 2012 to 2013. ForFull cost ceiling impairment - During the fiscal year ended AugustDecember 31, 2013, depletion2016, we recognized an impairment of $215.2 million as compared to an impairment of $141.2 million for the year ended December 31, 2015, representing the amount by which the net capitalized costs of our oil and gas properties was $17.26 per BOE compared to $14.29 for the fiscal year ended August 31, 2012. The increase in the DD&A rate was primarily the result of the allocation of the purchase price to proved properties related toexceeded our December 2012 acquisition of Orr Energy. Acquired proved reserves are valued at fair market value on the date of the acquisition, which contributes to a higher amortization base, as compared to our historicalfull cost of acquiring leaseholdsceiling. See “-Critical Accounting Policies-Oil and developing our properties. To date, the fair value of our acquired reserves has been higher than our historical cost of developing our properties even though the resulting EURs are equivalent. Therefore, the increase in the ratio of costs subject to amortization to the reserves acquired is greater than our internally developed properties. We believe that, although initially acquisitions increase our DD&A rate per BOE over the development of the acquired properties, the resulting rates will decline with the drilling of horizontal wells and the addition of the related reserves.Gas Properties, including Ceiling Test.”
General and Administrative (“G&A”)&A –The - The following table summarizes general and administrationG&A expenses incurred and capitalized during the last two years:periods presented:
|
| | | | | | | |
| | Year Ended December 31, |
| (in thousands) | 2016 | | 2015 |
| G&A costs incurred | $ | 37,619 |
| | $ | 33,618 |
|
| Capitalized costs | (7,074 | ) | | (2,426 | ) |
| Total G&A | $ | 30,545 |
| | $ | 31,192 |
|
| | | | |
| Non-Cash G&A | $ | 9,491 |
| | $ | 14,741 |
|
| Cash G&A | $ | 21,054 |
| | $ | 16,451 |
|
| Total G&A | $ | 30,545 |
| | $ | 31,192 |
|
| | | | |
| Non-Cash G&A per BOE | $ | 2.22 |
| | $ | 4.23 |
|
| Cash G&A per BOE | $ | 4.93 |
| | $ | 4.72 |
|
| G&A Expense per BOE | $ | 7.15 |
| | $ | 8.95 |
|
| | | Years Ended August 31, | |
| (in thousands) | | 2013 | | | 2012 | |
| G&A costs incurred | | $ | 6,325 | | | $ | 3,902 | |
| Capitalized costs | | | (637 | ) | | | (345 | ) |
| Total G&A | | $ | 5,688 | | | $ | 3,557 | |
| | | | | | | | | |
| G&A Expense per BOE | | $ | 7.36 | | | $ | 8.46 | |
G&A includes all overhead costs associated with employee compensation and benefits, insurance, facilities, professional fees, and regulatory costs, among others. In an effortWe increased our employee count from 62 at December 31, 2015 to minimize overhead costs, we employ a total staff96 at December 31, 2016, while reducing the number of 16 employees, and use consultants, advisors, and contractors that had historically been used for certain tasks. Additionally, during the year ended December 31, 2015, we awarded bonuses, consisting of cash and restricted stock, to perform certain tasks when it is cost-effective. We maintainmanagement, employees, and directors. Most significantly, bonuses totaling approximately $4.8 million (including restricted stock valued at $4.0 million) were paid to our corporate office in Platteville, CO partially to avoid higher rents in other areas.former co-CEOs, both of whom resigned as of December 31, 2015.
Although G&A costs have increased as we grow the business we strive to maintain an efficient overhead structure. For the fiscal year ended August 31, 2013, G&A was $7.36 per BOE compared to $8.46 for the fiscal year ended August 31, 2012.
Our G&A expense for 2013the year ended December 31, 2016 includes share basedstock-based compensation of $1,362,000. The comparable amount$9.5 million compared to $14.7 million for 2012 was $473,000. Sharethe year ended December 31, 2015. Stock-based compensation is a non-cash charge that is based compensation includes aon the calculated fair value forof stock options, orperformance stock units, restricted share units, and stock bonus shares of common stock that we grant for compensatory purposes. It is a non-cash charge, which, forFor stock options, the fair value is calculatedestimated using the Black-Scholes-Merton option pricing model to estimatemodel. For performance stock units, the fair value of options.is estimated using the Monte Carlo model. For restricted stock units and stock bonus shares, the fair value is estimated using the closing stock price on the grant date. Amounts are pro-rated over the vesting terms of the option agreement,award agreements, which are generally three to five years.
Pursuant to the requirements under the full cost accounting method for oil and gas properties, we identify all general and administrative costs that relate directly to the acquisition of undeveloped mineral leases and the exploration and development of properties. Those costs are reclassified from G&A expenses and capitalized into the full cost pool. The increase in capitalized costs from 2012the year ended December 31, 2015 to 2013the year ended December 31, 2016 reflects our increasingincreased headcount of individuals performing activities to maintain and acquire leases and develop theour properties.
Other Income (Expense)Commodity derivative gains (losses) – Neither interest expense nor interest income had a significant impact on our results of operations for 2013. Substantially all of - As more fully described in “-Liquidity and Capital Resources-Oil and Gas Commodity Contracts,” we use commodity contracts to help mitigate the interest costs incurred under our credit facility were classified as costs related to our unevaluated assets or wellsrisks inherent in progress and were eligible for capitalization into the full cost pool.
Beginning in 2013, we entered into commodity derivative contracts for the future sale of oil. We designed our derivative activity to protect our cash flow during periodsvolatility of oil price declines. Using swaps and collars, we hedged 340,000 barrels of future production for a period of 22 months. Generally, contracts are based upon a reference price indexed to trading of West Texas Intermediate Crude Oil on the NYMEX. Duringnatural gas prices. For the year ended AugustDecember 31, 2013, the average index prices were higher than our average contract prices, and2016, we realized a losscash settlement gain of $0.4$2.4 million, net of previously incurred premiums attributable to the settled commodity contracts. In 2015, we realized a cash settlement gain of $28.4 million.
In addition, for the year. As of Augustyear ended December 31, 2013, the weighted average future index prices were $101.81 per barrel, approximately $7.64 higher than our contract price, creating2016, we recorded an unrealized loss of $2.6$10.1 million atto recognize the end of the year.
Our commodity derivative contracts are revalued atmark-to-market change in fair value for each reporting period, and changesof our commodity contracts. In comparison, in the valueyear ended December 31, 2015, we reported an unrealized loss of the contracts can have a significant impact on reported results of operations$17.3 million. Unrealized losses are non-cash items.
Income Taxestaxes – - We reported income tax expense of $6.9$0.1 million for the fiscal year ended AugustDecember 31, 2013. All of the tax liability will be deferred into future years, and it does not appear that any federal or state payments will be required for 2013. During 2012, we reported a net deferred tax benefit of $332,000, essentially representing a future refund, to record the benefit arising from the net operating loss carry-forward (NOL).
For tax purposes, we have a NOL of $41 million which will begin to expire, if not utilized, in year 2031. For book purposes, the NOL is $31 million, as there is a difference of $10 million related to deductions for stock based compensation.
For 2013, we reported2016, calculated at an effective tax rate of 42%0%. Our estimatedIn 2015, we reported income tax benefit of $14.1 million, calculated at an effective tax rate for future periods, based upon currentof 10%. As explained in more detail below, during the year ended December 31, 2016, the effective tax laws, is 37%. The difference reflects several differences between book income andrate was substantially reduced by the recognition of a full valuation allowance on the net deferred tax income, including adjustments for statutory depletion and an adjustment toasset.
In assessing the stock based compensation component included in our inventoryrealizability of deferred tax assets. During 2013, we reversed the timing difference created for the future deduction of stock based compensation when the underlying options expired. Potential tax deductions for compensation are eliminated whenever options expire without exercise.
Each year,assets, management evaluates all the positive and negative evidence regarding our tax position and reaches a conclusion on the most likely outcome. During 2013 and 2012, we concluded thatconsiders whether it wasis more likely than not that we wouldsome portion or all of the deferred tax assets will be ablerealized. Based on the level of losses in the current period and the level of uncertainty with respect to realizefuture taxable income over the period in which the deferred tax assets are deductible, a benefit from the NOL, and in 2012 we eliminated our entire valuation allowance has been provided as of $4.9 million. Prior to 2012, management concluded that it was more likely than not that our net deferred tax asset would not be realized inDecember 31, 2016. During 2015, we reached the foreseeable future and, accordingly,same conclusion; therefore, a full valuation allowance washas been provided against the net deferred tax asset.as of December 31, 2015.
Liquidity and Capital Resources
Historically, weour primary sources of capital have been reliant on net cash provided by sales and other issuances of equity and debt securities as a source of liquidity. We have also relied on cash flow from operations, proceeds from the sale of properties, the sale of equity and debt securities, and borrowings under bank credit facilities. Our primary use of capital has been for the exploration, development, and acquisition of oil and natural gas properties. Our future success in growing proved reserves and production will be highly dependent on the capital resources available to us.
We believe that in the near future, the combination ofour capital resources, including cash on hand, cash flows from operations andamounts available borrowings under our revolving credit facility, and cash flow from operating activities will providebe sufficient liquidity. However, unforeseento fund our planned capital expenditures and operating expenses for the next twelve months. To the extent actual operating results differ from our anticipated results, available borrowings under our credit facility are reduced, or we experience other unfavorable events, may require us to obtainour liquidity could be adversely impacted. Our liquidity would also be affected if we increase our capital expenditures or complete one or more additional equity or debt financing. We have on file with the SEC an effective universal shelf registration statement that we may use for future securities offerings.acquisitions. Terms of future financings may be unfavorable, and we cannot assure investors that funding will be available on acceptable terms.
As operator of the majority of our wells and undeveloped acreage, we control the timing and selection of new wells to be drilled. This allows us to modify our capital spending as our financial resources allow and market conditions support. Additionally, our relatively low utilization of debt enhances our financial flexibility as it provides a potential source of future liquidity while currently not overly burdening us with restrictive financial covenants and mandatory repayment schedules.
Sources and Uses
Our sources and uses of capital are heavily influenced by the prices that we receive for our production. Oil and gas markets will likely continue to be volatile in the future. To deal with the volatility in commodity prices, we maintain a flexible capital investment program and seek to maintain a high operating interest in our leaseholds with limited long-term capital commitments. This enables us to accelerate or decelerate our activities quickly in response to changing industry environments.
At AugustDecember 31, 2014,2017, we had cash, and cash equivalents, and restricted cash of $34.8$48.8 million, $550.0 million outstanding on our 2025 Senior Notes, and anno balance outstanding balance of $37 million under our revolving credit facility. Our sources and (uses) of funds for the fiscal years ended AugustDecember 31, 2014, 20132017, 2016, and 2012,2015 are summarized below (in thousands):
| | | Years Ended August 31, | |
| | | 2014 | | | 2013 | | | 2012 | |
| Cash provided by operations | | $ | 74,905 | | | $ | 32,120 | | | $ | 21,252 | |
| Capital expenditures | | | (155,602 | ) | | | (80,469 | ) | | | (46,751 | ) |
| Property conveyances | | | - | | | | - | | | | 71 | |
| Cash used by other investing activities | | | 60,722 | | | | (60,000 | ) | | | - | |
| Cash provided by equity financing activities | | | 35,265 | | | | 74,528 | | | | 37,421 | |
| Net borrowings | | | - | | | | 34,000 | | | | (2,200 | ) |
| Net increase in cash and equivalents | | $ | 15,290 | | | $ | 179 | | | $ | 9,793 | |
|
| | | | | | | | | | | |
| | Year Ended December 31, |
| | 2017 | | 2016 | | 2015 |
| Net cash provided by operations | $ | 291,315 |
| | $ | 48,688 |
| | $ | 103,830 |
|
| Capital expenditures | (1,133,879 | ) | | (643,266 | ) | | (202,564 | ) |
| Net cash provided by other investing activities | 93,573 |
| | 25,350 |
| | 6,239 |
|
| Net cash provided by equity financing activities | 312,308 |
| | 542,722 |
| | 187,444 |
|
| Net cash provided by (used in) debt financing activities | 448,621 |
| | (3,159 | ) | | (68,020 | ) |
| Net increase (decrease) in cash, cash equivalents, and restricted cash | $ | 11,938 |
|
| $ | (29,665 | ) | | $ | 26,929 |
|
Net cash provided by operations has improved during each ofoperating activities was $291.3 million, $48.7 million, and $103.8 million for the last three years. The significant improvement reflects the operating contribution from new wells that were drilledyears ended December 31, 2017, 2016, and producing wells that were acquired.2015, respectively. The increase in netcash from operating activities from the year ended December 31, 2016 to the year ended December 31, 2017 reflects the increase in realized commodity prices and production.
Net cash provided by operations allowed us to become less reliant on equity salesother investing activities was $93.6 million, $25.4 million, and $6.2 million for financing our capital expenditures in fiscal 2014.the years ended December 31, 2017, 2016, and 2015, respectively. For the year ended December 31, 2017, we received proceeds from the sale of oil and gas properties and other of $93.6 million. For the year ended December 31, 2016, we received proceeds from the sale of oil and gas properties of $25.4 million.
Credit ArrangementsNet cash provided by equity financing activities was $312.3 million, $542.7 million, and $187.4 million for the years ended December 31, 2017, 2016, and 2015, respectively. Net cash provided by (used in) debt financing activities was $448.6 million, $(3.2) million, and $(68.0) million for the years ended December 31, 2017, 2016, and 2015, respectively. During the year ended December 31, 2017, we received cash proceeds from borrowing $250 million under the Revolver which were primarily used to fund our drilling and completion activities. Additionally, we issued $550 million aggregate principal amount of 2025 Senior Notes in a private placement to qualified institutional buyers. See " - 2025 Senior Notes." The net proceeds from the sale of the 2025 Senior Notes were $538.1 million after deductions of $11.9 million for expenses and underwriting discounts and commissions. Lastly, we received cash proceeds of approximately $312.2 million (after deduction of underwriting discounts and expenses payable by the Company) from our public offering of 40,250,000 shares (including the shares sold pursuant to an over-allotment option exercised by the underwriters) at a price to us of $7.76. The proceeds from the private placement and the public offering were used to repay $250 million of borrowings under the Revolver, fund the GCII Acquisition, and repay the $80 million aggregate principal amount of the 2021 Senior Notes.
InCredit Facility
The Revolver has a maturity date of December 2013 and June 2014, we modified15, 2019. The agreement was most recently amended in September 2017 as a result of the regular semi-annual redetermination of our borrowing arrangements.base. The new revolving lineRevolver has a maximum loan commitment of credit increases$500 million; however, the maximum lending commitment to $300 million,amount that we can borrow at any one time is subject to the limitations of a borrowing base calculation.limitation, which stipulates that we may borrow up to the lesser of the maximum loan commitment or the borrowing base. The bank group providingborrowing base can increase or decrease based upon the facility is led by Community Banksvalue of Colorado, a divisionthe collateral, which secures any amounts borrowed under the Revolver. The value of NBH Bank, NA.the collateral will generally be derived with reference to the estimated discounted future net cash flows from our proved oil and natural gas reserves. The collateral includes substantially all of our producing wells and developed oil and gas leases.
The arrangement contains covenants that, among other things, restrictAs a result of the payment of dividends and require compliance with certain financial ratios. The borrowing arrangement is primarily collateralized by certainregular semi-annual redetermination of our assets, including producing properties. The maximum lending commitment is subject to reduction based upon a borrowing base calculation, which will be re-determined semi-annually using updated reserve reports. Based upon the semi-annual redetermination derived from the February 28, 2014 reserve report, the borrowingon September 27, 2017, the borrowing base was increased from $225 million to $110$400 million.
We currently have approximately $73 As of December 31, 2017, there was no outstanding principal balance and $0.5 million in letters of credit outstanding, leaving $399.5 million available to us for future borrowings if needed. Additional borrowings, if any, are expected to be used to fund acquisitions, expendituresborrowings. The next semi-annual redetermination is scheduled for well drilling and development, and to provide working capital.
April 2018. Interest on our revolving line of creditthe Revolver accrues at a variable rate, which will equal or exceed the minimum rate of 2.5%.rate. The interest rate pricing grid contains a graduated escalation in applicable margin for increased utilization.
The Revolver requires the Company to maintain compliance with certain financial and liquidity ratio covenants. In particular, the Company must not (a) permit its ratio of total funded debt to EBITDAX, as defined in the agreement, to be greater than or equal to 4.0 to 1.0 as of the end of any fiscal quarter or (b) as of the last day of any fiscal quarter permit its current ratio, as defined in the agreement, to be less than 1.0 to 1.0.
2025 Senior Notes
In November 2017, the Company issued $550 million aggregate principal amount of 6.25% Senior Notes in a private placement to qualified institutional buyers. The maturity for the payment of principal is December 1, 2025. Interest on the 2025 Senior Notes accrues at 6.25% and began accruing on November 29, 2017. Interest is payable on June 1 and December 1 of each year, beginning on June 1, 2018. The 2025 Senior Notes were issued pursuant to an indenture dated as of November 29, 2017 and are guaranteed on a senior unsecured basis by the Company’s existing and future subsidiaries that incur or guarantee certain indebtedness, including indebtedness under the Revolver. At any time prior to December 1, 2020, the Company may redeem all or a part of the 2025 Senior Notes at a redemption price equal to 100% of the principal amount plus an Applicable Premium (as defined in the Indenture) plus accrued and unpaid interest. On and after December 1, 2020, the Company may redeem all or a part of the 2025 Senior Notes at the redemption price equal to a specified percentage of the principal amount of the redeemed notes (104.688% for 2020, 103.125% for 2021, 101.563% for 2022, and 100% for 2023 and thereafter, during the twelve-month period beginning on December 1 of each applicable year), plus accrued and unpaid interest. Additionally, prior to December 1, 2020, the Company can, on one or more occasions, redeem up to 35% of the principal amount of the 2025 Senior Notes with all or a portion of the net cash proceeds of one or more Equity Offerings (as defined in the Indenture) at a redemption price equal to 106.25% of the principal amount of the redeemed notes, plus accrued and unpaid interest, subject to certain conditions.
The Indenture contains covenants that restrict the Company’s ability and the ability of certain of its subsidiaries to, among other restrictions and limitations: (i) incur additional indebtedness; (ii) incur liens; (iii) pay dividends; (iv) consolidate, merge, or transfer all or substantially all of its or their assets; (v) engage in transactions with affiliates; or (vi) engage in certain restricted business activities. These covenants are subject to a number of exceptions and qualifications.
2021 Senior Notes
In December 2017, the Company repurchased all $80 million aggregate principal amount of its 2021 Senior Notes. At the time of repurchase, the Company made a required make whole payment of $8.2 million and wrote-off deferred issuance costs of $3.6 million.
Capital Expenditures
Capital expenditures for drilling and completion activities totaled $461.8 million, $130.9 million, and $127.8 million for the year ended December 31, 2017, 2016, and 2015, respectively. The following table summarizes our option, interest rates willcapital expenditures for oil and gas properties (in thousands):
|
| | | | | | | | | | | |
| | Year Ended December 31, |
| | 2017 | | 2016 | | 2015 |
| Capital expenditures for drilling and completion activities* | $ | 461,789 |
| | $ | 130,936 |
| | $ | 127,817 |
|
| Acquisitions of oil and gas properties and leasehold** | 677,643 |
| | 517,911 |
| | 105,670 |
|
| Capitalized interest, capitalized G&A, and other | 26,677 |
| | 18,744 |
| | 8,221 |
|
| Accrual basis capital expenditures*** | $ | 1,166,109 |
| | $ | 667,591 |
| | $ | 241,708 |
|
* Capital expenditures for drilling and completion activities exclude $34.9 million of expenditures that were accrued during the year ended December 31, 2017; however, the properties associated with these expenditures were subsequently traded, and no cash was required to be referencedremitted to the Prime Rate plus a marginoperator of 0.5% to 1.5%, or the London InterBank Offered Rate plus a marginactivities.
**Acquisitions of 1.75% to 2.75%. The amended maturity dateoil and gas properties and leasehold reflects the full purchase price of our various acquisitions which includes non-cash additions for liabilities assumed in the arrangement is May 29, 2019.transaction such as asset retirement obligations.
Reconciliation of Cash Payments to Capital Expenditures
***Capital expenditures reported in the consolidated statement of cash flows are calculated on a strict cash basis, which differs from the “all-inclusive”accrual basis used to calculate other amounts reported in our financial statements. Specifically, cash payments for acquisitionthe capital expenditures.
Excluding the GCII Acquisition, the majority of property and equipment as reflected in the statement of cash flows excludes non-cash capital expenditures during the year ended December 31, 2017 were associated with the costs of drilling and includes an adjustment (plus or minus) to reflect the timing of when the capital expenditure obligations are incurred and when the actual cash payment is made. On the “all-inclusive” basis, capital expenditures totaled $214.0 million and $118.1 million for the years ended August 31, 2014 and 2013, respectively. A reconciliation of the differences between cash payments and the “all-inclusive” amounts is summarized in the following table (in thousands):
| | | Years Ended August 31, | |
| | | 2014 | | | 2013 | | | 2012 | |
| Cash payments for capital expenditures | | $ | 155,602 | | | $ | 80,469 | | | $ | 46,751 | |
| Accrued costs, beginning of period | | | (25,491 | ) | | | (5,733 | ) | | | (4,967 | ) |
| Accrued costs, end of period | | | 71,849 | | | | 25,491 | | | | 5,733 | |
| Non-cash acquisitions, common stock | | | 11,184 | | | | 16,684 | | | | 1,985 | |
| Other | | | 905 | | | | 1,233 | | | | 300 | |
| All inclusive capital expenditures | | $ | 214,049 | | | $ | 118,144 | | | $ | 49,802 | |
Capital Expenditures
completing wells. During the fiscal year ended AugustDecember 31, 2014,2017, we engaged in drilling or completion activities on 31 producingdrilled 115 operated horizontal wells that we will operate, including 26 producing wells on the Leffler, Phelps, Eberle, Union, and Kelly Farms prospects. Furthermore, five wells drilled during 2013 at the Renfroe prospect commenced production during fiscal 2014. Our drilling efforts accelerated in the second half of the year, as five of these wells commenced production during our third fiscal quarter and 15 commenced production during our fourth quarter. During 2014, we expended approximately $130 million onturned 109 operated horizontal wells.wells to sales. As of AugustDecember 31, 2014,2017, we were drilling or completing 10 operatedare the operator of 51 gross (47 net) horizontal wells in progress, that had not reached productive status. Most which excludes 19 gross (16 net) wells for which we have only set surface casings. All of the wells in progress were located at the Weld 152 and Kiehn prospects. We participated in drilling and completion activities on 71 gross (9 net) non-operated wells at a cost of $25 million. As of AugustDecember 31, 2014, 28 gross well (3 net) had commenced2017are scheduled to commence production and 43 gross wells (6 net) were classified as wells in progress. Total capital expenditures classified as wells still in progress at AugustbeforeDecember 31, 2014, was $53.7 million.2018.
We also drilled a test well atFor the Buffalo Run prospect to examine the potential for production from the Niobrara, Codell, Greenhorn and D-Sand formation. Our analysis of core samples from the test well held sufficient potential thatyear ended December 31, 2017, we plan to commence development drilling in the area during 2015. Further, we invested $39 million in the acquisition of assets from Trilogy Resources LLC and Apollo Operating LLC, including approximately $8.3 million paid in the form of our common stock. Other expenditures included $20 million for the acquisition of lands, leases and other mineral assets, including $2.9 million paid in the form of common stock.participated in 35 gross (6 net) non-operated horizontal wells.
Capital Requirements
Our level of exploration, development, and acreage expenditures is largely discretionary, and the amount of funds devoted to any particular activity may increase or decrease significantly depending on available opportunities, commodity prices, cash flows, development results, and downstream commitments, among other factors. Our primary need for cashcapital will be to fund our anticipated drilling and acquisition programs for the fiscal year ending August 31, 2015. Our cash requirements have increased significantly ascompletion activities and any other acquisitions that we implement our horizontal drilling program. Each horizontal well is estimated to cost between $3.6 million and $5.5 million, depending on the length of the lateral wellbore, the number of stages, and other variables. Our preliminary capital expenditure plan for fiscal 2015 provides for spending of $200 million to $225 million for drilling and leasing activities. We are planning to drill 35 to 40 operated wells with costs ranging from $3.6 million to $5.5 million and to participate in six to eight (net) non-operated wells at a per well cost of $4.5 million to $5.0 million. Finally, leasing and other activities are planned at $10 million to $15 million. Our capital expenditure estimate is subject to adjustment for drilling success, acquisition opportunities, operating cash flow, and available capital resources.may complete during 2018.
We plan to generate profits by producing oilanticipate that our 2018 drilling and natural gas fromcompletion capital expenditures for operated wells thatwill cost between $480 million and $540 million for the year. However, should commodity prices and/or economic conditions change, we drillcan reduce or acquire. accelerate our drilling and completion activities, which could have a material impact on our anticipated capital requirements.
For the near term, we believe that we have sufficient liquidity to fund our needs through cash on hand, cash flow from operations, proceeds from the exercise of warrants, and additional borrowings available under our revolving credit facility. However, toshould this not meet all of our long-term goals,needs, we may need to raise some of theadditional funds required to drill new wells through the sale of our securities, from our revolving credit facility or from third parties willing to pay our share of drilling and completing the wells.wells, or from other sources. We may not be successful in raising the capital needed to drill or acquire oil or natural gas wells. Any wells whichWe may seek to raise funds in capital markets transactions from time to time if we believe market conditions to be drilled by us may not produce oil or gas in commercial quantities.favorable.
Oil and Gas Commodity Contracts
We use derivative contracts to hedgehelp protect against the variability in cash flows created by short-term price fluctuations associated with the sale of future oil and natural gas production. Our hedge positions will generally cover a substantial portion of our forecasted production for a period of 24 months. We typically enter into contracts covering between 45% and 85% of anticipated production levels. During the year ended AugustAt December 31, 2014, we realized a cash loss from commodity derivatives of $2.1 million. Our contracts during fiscal 2014 covered crude oil sales of 470,670 bbls and natural gas sales of 390,000 mcf. At October 10, 2014,2017, we had open positions covering of 1.13.7 million bblsbarrels of oil and 1.7 million mcf5,475 MMcf of natural gas. We do not use derivative instruments for tradingspeculative purposes.
Hedge Activity AccountingOur commodity derivative instruments may include but are not limited to “collars,” “swaps,” and “put” positions. Our derivative strategy, including the volumes and commodities covered and the relevant strike prices, is based in part on our view of expected future market conditions and our analysis of well-level economic return potential. In addition, our use of derivative contracts is subject to stipulations set forth in our credit facility.
A “put” option gives the owner the right, but not the obligation, to sell the underlying commodity at a specified price (strike price) within a specific time period. Depending on market conditions, strike prices, and the value of the contracts, we may, at times, purchase put options, which require us to pay premiums at the time that we purchase the contracts. These premiums represent the fair value of the purchased put as of the date of purchase. The ownership of put options is consistent with our derivative strategy inasmuch as the value of the puts will increase as commodity prices decline, helping to offset the cash flow impact of a decline in realized prices for the underlying commodity. However, if the underlying commodity increases in value, there is a risk that the put option will expire worthless, in which case the net premiums paid would be recognized as a loss.
Conversely, a “call” option gives the owner the right, but not the obligation, to purchase the underlying commodity at a specified price (strike price) within a specific time period. Depending on market conditions, strike prices, and the value of the contracts, we may, at times, sell call options in conjunction with the purchase of put options to create “collars.” We regularly utilize “no premium” (a.k.a. zero cost) collars constructed by selling call options while simultaneously buying put options, in which the premiums paid for the puts is offset by the premiums received for the calls. Collars are consistent with our derivative strategy inasmuch as they establish a known range of prices to be received for the associated volume equivalents, being bound at the upper end by the call’s strike price (the “ceiling”) and at the lower end by the put’s strike price (the “floor”).
Additionally, at times, we may enter into swaps. Swaps are derivative contracts which obligate two counterparties to effectively trade the underlying commodity at a set price over a specified term. Swaps are consistent with our derivative strategy inasmuch as they establish a known future price to be received for the associated equivalent volumes.
During periods of significant price declines, for settled contracts structured as “collars,” we will receive settlement payments from the contracts’ counterparties for the difference between the contracted “floor” price and the average posted price for the contract period. For settled “swaps,” we will receive the difference between the contracted swap price and the average posted price for the contract period, if lower. For settled “put” contracts, we will receive the difference between the put’s strike price and the average posted price for the contract period. If we decide to liquidate an “in-the-money” position prior to settlement date, we will receive the approximate fair value of the contract at that time. These realized gains increase our cash flows for the period in which they are recognized.
Conversely, during periods of significant price increases, upon settlement we would be obligated to pay the counterparties the difference between the contract’s “ceiling” and/or swap price and the average posted price for the contract period. If liquidated
prior to settlement, we would pay the approximate fair market value to close the position at that time. These realized losses decrease our cash flows for the period in which they are recognized. Losses associated with puts that expire out-of-the-money are simply the original premiums paid for the contracts and are recognized upon expiration.
The fair values of our open, but not yet settled, derivative contracts are estimated by obtaining independent market quotes as well as using industry standard models that consider various assumptions including quoted forward prices for commodities, risk-free interest rates, and estimated volatility factors as well as other relevant economic measures. We compare the valuations calculated by us to valuations provided by the counterparties to assess the reasonableness of each valuation. The discount rate used in the fair values of these instruments includes a measure of nonperformance risk by the counterparty or us, as appropriate.
The mark-to-market fair value of the open commodity derivative contracts will generally be inversely related to the price movement of the underlying commodity. If commodity price trends reverse from period to period, prior unrealized gains may become unrealized losses and vice versa. Higher underlying commodity price volatility will generally lead to higher volatility in our unrealized gains and losses and, by association, the fair value of our commodity derivative contracts. These unrealized gains and losses will also impact our net income in the period recorded.
We do not designate our commodity contracts as accounting hedges. Accordingly, we use mark-to-market accounting to value the portfolio at the end of each reporting period. Mark-to-market accounting can create non-cash volatility in our reported earnings during periods of commodity price volatility. We have experienced such volatility in the past and are likely to experience it in the future. Mark-to-market accounting treatment results in volatility of our results as unrealized gains and losses from derivatives are reported. As commodity prices increase or decrease, such changes will have an opposite effect on the mark-to-market value of our derivatives. Gains on our derivatives generally indicate lower wellhead revenues in the future while losses indicate higher future wellhead revenues.
During the year ended AugustDecember 31, 2014,2017, we reported an unrealized commodity activity gainloss of $2.5$4.3 million. Unrealized gains and losses are non-cash items. We also reported a realized lossgain of $2.1 million,$39.0 thousand, representing the cash settlement cost forof commodity contracts settled during the period.period, net of previously incurred premiums attributable to the settled commodity contracts.
At AugustDecember 31, 2014,2017, we estimateestimated that the fair value of our various commodity derivative contracts was a net assetliability of $0.2$7.9 million. We value these contracts usingSee Note 8, Commodity Derivative Instruments, for a description of the methods we use to estimate the fair value methodology that considers various inputs including a) quoted forecast prices, b) time value, c) volatility factors, d) counterparty risk, and e) other relevant factors. The fair valuevalues of these contracts as estimated at August 31, 2014 may differ significantly from the realized values at their respective settlement dates.
46
commodity derivative instruments.
Our commodity derivative contracts as of October 10, 2014 as summarized below:
| | | Hedge Volumes | | | Average Collar Prices (1) | | | Average Swap Prices (1) | |
| Month | | Oil (Bbl) | | | Gas (MMBtu) | | | Average Oil (Bbl) Price | | | Average Gas (MMBtu) Price | | | Average Oil (Bbl) Price | | | Average Gas (MMBtu) Price | |
| Oct 1 to Dec 31, 2014 | | | 214,040 | | | | 330,000 | | | | $87.00 -$96.25 | | | | $4.07 - $4.18 | | | | $88.49 | | | | $4.58 | |
| Jan 1 to Dec 31, 2015 | | | 596,000 | | | | 864,000 | | | | $81.52-$96.89 | | | | $4.15 - $4.49 | | | | $85.29 | | | | N/A | |
| Jan 1 to Dec 31, 2016 | | | 304,000 | | | | 480,000 | | | | $77.92 - $98.51 | | | | $3.99 - $4.39 | | | | $85.02 | | | | N/A | |
| | | | | | | | | | | | | | | | | | | | | | | | | |
(1) Hedge price is at NYMEX WTI and NYMEX Henry Hub. | | | | | | | | | | | | | |
Contractual Commitments
The following table summarizes our contractual obligations as of AugustDecember 31, 20142017 (in thousands):
| | | Less than One Year | | | One to Three Years | | | Three to Five Years | | | Total | |
Rig Contract1 | | $ | 24,000 | | | $ | — | | | | — | | | $ | 24,000 | |
| Revolving credit facility | | | — | | | | — | | | | 37,000 | | | | 37,000 | |
| Operating Leases | | | 200 | | | | 88 | | | | — | | | | 288 | |
| Employment Agreements | | | 1,755 | | | | 1,850 | | | | — | | | | 3,605 | |
| Total | | $ | 25,955 | | | $ | 1,938 | | | | 37,000 | | | $ | 64,893 | |
|
| | | | | | | | | | | | | | | | | | | |
| | Less than One Year | | One to Three Years | | Three to Five Years | | More Than Five Years | | Total |
Rig contracts (1) | $ | 8,527 |
| | $ | — |
| | $ | — |
| | $ | — |
| | $ | 8,527 |
|
Volume commitments (2) (3) | 23,961 |
| | 45,796 |
| | 10,032 |
| | — |
| | 79,789 |
|
Notes payable (4) | 34,375 |
| | 68,750 |
| | 68,750 |
| | 653,125 |
| | 825,000 |
|
| Capital leases | 76 |
| | 74 |
| | 63 |
| | — |
| | 213 |
|
| Operating leases | 840 |
| | 1,737 |
| | 1,352 |
| | — |
| | 3,929 |
|
| Total | $ | 67,779 |
| | $ | 116,357 |
| | $ | 80,197 |
| | $ | 653,125 |
| | $ | 917,458 |
|
| |
1 | | Represents an estimate of the remaining commitment under three contracts with Ensign United States Drilling, Inc. forrelated to the use of threetwo rigs. Actual amounts will vary as a result of a number of variables, including target formations, measured depth, and other technical details. |
| |
2 | We have entered into agreements that require us to deliver minimum amounts of oil to certain third parties through 2021. Production can be sourced via third party contract, in-kind agreements, or self-sustained production. We will incur a charge of approximately $5.21 per Bbl if a minimum quantity of oil is not delivered to the pipeline-related counterparties. Amounts reflect the estimated deficiency payments under our pipeline-related commitments assuming no deliveries are made. Potential damages and other charges related to nonperformance under these contracts are not included in the amounts above. See further discussion in Note 16 to our consolidated financial statements. |
| |
3 | In collaboration with several other producers and DCP Midstream, we have agreed to participate in the expansion of natural gas gathering and processing capacity in the D-J Basin under two agreements. For the first agreement, our share of the commitment will require 46.4 MMcf per day to be delivered after the plant in-service date, which is currently expected to be during the third quarter of 2018, for a period of 7 years. For the second agreement, our share of the commitment will require 43.8 MMcf per day to be delivered after the plant in-service date, which is expected to be |
completed in mid-2019, for a period of 7 years. These contractual obligations can be reduced by the collective volumes delivered to the plants by other producers in the D-J Basin that are in excess of such producers' total commitment. While we expect that our development plan will support the utilization of this capacity, we may be required to pay penalties or damages pursuant to this agreement if we are unable to fulfill our contractual obligation from our own production and if the collective volumes delivered by other producers in the D-J Basin are not in excess of the total commitment. At this time, we are unable to reasonably estimate these amounts, and they have therefore not been reflected in the table above. See further discussion in Note 16 to our consolidated financial statements.
| |
4 | Includes interest payments related to the issuance of the 2025 Senior Notes. See further discussion in Note 7 to our consolidated financial statements. |
Off-Balance Sheet Arrangements
We do not have any off-balance sheet arrangements that have or are reasonablereasonably likely to have a current or future material effect on our financial condition, changes in financial condition, revenues or expense, results of operations, liquidity, or capital resources.
Non-GAAP Financial Measures
In addition to financial measures presented on the basis of accounting principles generally accepted in the United States of America ("US GAAP"), we present certain financial measures which are not prescribed by US GAAP ("non-GAAP"). The following is a summary of the measures we currently report.
Adjusted EBITDA
We use "adjusted EBITDA," a non-GAAP financial measure, for internal managerial purposes when evaluating period-to-period comparisons. This measurebecause it allows us to evaluate our operating performance and compare the results of our operations from period to period without regard to our financing methods or capital structure. We exclude the items listed in the table below from net income (loss) in arriving at adjusted EBITDA. We exclude those items because they can vary substantially from company to company within our industry depending upon accounting methods and book values of assets, capital structures, and the method by which the assets were acquired. Adjusted EBITDA is not a measure of financial performance under U.S.US GAAP and should be considered in addition to, not as a substitute for, cash flows from operations, investing, or financing activities, nornet income. We believe that adjusted EBITDA is widely used in our industry as a liquidity measure or indicator of cash flows reported in accordance with U.S. GAAP. The non-GAAP financialoperating performance and may also be used by investors to measure that we useour ability to meet debt covenant requirements. However, our definition of adjusted EBITDA may not be fully comparable to measures with similar titles reported by other companies. Also, in the future, we may disclose different non-GAAP financial measures in order to help our investors more meaningfully evaluate and compare our future results of operations to our previously reported results of operations. We strongly encourage investors to review our financial statements and publicly filed reports in their entirety and to not rely on any single financial measure.
We define adjusted EBITDA as net income (loss) adjusted to exclude the impact of interest expense, interest income, income tax expense, DDA (depreciation, depletion and amortization), stock based compensation, and the plus or minus changeitems set forth in fair value of derivative assets or liabilities.the table below (amounts in thousands):
|
| | | | | | | | | | | |
| | Year Ended December 31, |
| | 2017 | | 2016 | | 2015 |
| Adjusted EBITDA: | | | | | |
| Net income (loss) | $ | 142,482 |
| | $ | (219,189 | ) | | $ | (131,689 | ) |
| Depletion, depreciation, and accretion | 112,309 |
| | 46,678 |
| | 62,071 |
|
| Full cost ceiling impairment | — |
| | 215,223 |
| | 141,230 |
|
| Income tax expense (benefit) | (99 | ) | | 106 |
| | (14,132 | ) |
| Stock-based compensation expense | 11,225 |
| | 9,491 |
| | 15,162 |
|
| Mark-to-market of commodity derivative contracts: | | | | | |
| Total (gain) loss on commodity derivative contracts | 4,226 |
| | 7,750 |
| | (11,037 | ) |
| Cash settlements on commodity derivative contracts | 942 |
| | 5,374 |
| | 29,992 |
|
| Cash premiums paid for commodity derivative contracts | — |
| | — |
| | (5,073 | ) |
| Interest expense, net of interest income | 11,479 |
| | (192 | ) | | 135 |
|
| Adjusted EBITDA | $ | 282,564 |
|
| $ | 65,241 |
| | $ | 86,659 |
|
PV-10
PV-10 is a non-GAAP financial measure. We believe adjusted EBITDAthat the presentation of PV-10 is relevant and useful to investors because it presents the discounted future net cash flows attributable to our estimated net proved reserves prior to taking into account future corporate income taxes, and it is a useful measure of cash flow available to fund our capital expenditures and service our debt and is a widely used industry metric which may provide comparabilityfor evaluating the relative monetary significance of our resultsoil and gas properties. It is not intended to represent the current market value of our estimated reserves. PV-10 should not be considered in isolation or as a substitute for the standardized measure reported in accordance with our peers. The following table presents a reconciliation of adjusted EBITDA, a non-GAAP financial measure,US GAAP, but rather should be considered in addition to net income, its nearest GAAPthe standardized measure.
| | | Years Ended August 31, | |
| | | 2014 | | | 2013 | | | 2012 | |
| Adjusted EBITDA: | | | | | | | | | |
| Net income | | $ | 28,853 | | | $ | 9,581 | | | $ | 12,124 | |
| Depreciation, depletion and amortization | | | 32,958 | | | | 13,336 | | | | 6,010 | |
| Provision for income tax | | | 15,014 | | | | 6,870 | | | | (332 | ) |
| Stock based compensation | | | 2,968 | | | | 1,362 | | | | 473 | |
| Commodity derivative change | | | (2,459 | ) | | | 2,649 | | | | - | |
| Interest expense (income) | | | (82 | ) | | | 50 | | | | (38 | ) |
| Adjusted EBITDA | | $ | 77,252 | | | $ | 33,848 | | | $ | 18,237 | |
Trend and Outlook
As previously disclosed, in fiscal 2014 we focused our capital expenditures on drilling and completing horizontal wells and increasing our leasehold in the Wattenberg Field. Since September 2013 through September 2014 we have increased our leasehold by 81% in the Wattenberg Field. We have done so through organic leasing efforts and the asset purchases discussed earlier. Our operated rig count has expanded from one rig to three rigs in the past twelve months. All of the rigs are drilling multi-well pads in the Wattenberg Field. Our focus on the WattenbergPV-10 is driven by the increasingly compelling results derived from higher density of wells drilled per spacing unit and the optimization of completion techniques. We are currently spacing our well bores to allow for up to 24 wells per section of 640 acres and we are testing drilling patterns that could lead to an even higher number of wells per section. We are also testing longer lateral wells and utilizing different amounts of proppant in order to determinestandardized measure, which is the most efficient recoverydirectly comparable GAAP financial measure. PV-10 is calculated using the same inputs and assumptions as the standardized measure, with the exception that it omits the impact of the hydrocarbons in place.future income taxes. It is considered to be a pre-tax measurement.
The Wattenberg Field continues to experience elevated line pressure in the natural gas and liquids gathering system,following table provides a problem that has persisted since 2012 and has grown along with the expansion of horizontal drilling in the area. High line pressure restricts our ability to produce crude oil and natural gas. As line pressures increase, it becomes more difficult to inject gas produced by our wells into the pipeline. When line pressure is greater than the operating pressure of our wellhead equipment, the wellhead equipment is unable to inject gas into the pipeline, and our production is restricted or shut-in. Since our wells produce a mixture of crude oil and natural gas, restrictions in gas production also restrict oil production. Although various factors can cause increased line pressure, a significant factor in our areareconciliation of the Wattenberg Field is the success of horizontal wells that have been drilled over the last several years. As new horizontal wells come on-line with increased pressures and volumes, they produce more gas than the gathering system was designedstandardized measure to handle. Once a pipeline is at capacity, pressures increase and older wells with less natural pressure are not able to compete with the new wells. The pace of horizontal drilling in the Wattenberg Field continues to accelerate and it appears that it will be some time before the gathering system will have sufficient capacity to eliminate the high line pressure issues.PV-10:
|
| | | | | | | | | | | | | | | |
| | As of December 31, | | As of August 31, 2015 |
| | 2017 | | 2016 | | 2015 | |
| Standardized measure of discounted future net cash flows | $ | 1,600,675 |
| | $ | 434,261 |
| | $ | 390,953 |
| | $ | 365,829 |
|
| Add: 10 percent annual discount, net of income taxes | 1,267,258 |
| | 427,587 |
| | 408,939 |
| | 372,658 |
|
| Add: future undiscounted income taxes | 285,349 |
| | 90,195 |
| | 108,172 |
| | 144,399 |
|
| Future pre-tax net cash flows | $ | 3,153,282 |
| | $ | 952,043 |
| | $ | 908,064 |
| | $ | 882,886 |
|
| Less: 10 percent annual discount, pre-tax | (1,396,998 | ) | | (475,695 | ) | | (469,921 | ) | | (444,605 | ) |
| PV-10 | $ | 1,756,284 |
| | $ | 476,348 |
| | $ | 438,143 |
| | $ | 438,281 |
|
We have taken and are continuing to take steps to mitigate high line pressures. Where it was cost beneficial, we have installed compressors to aid the wellhead equipment in its injection of gas into the system. Compression equipment at the wellhead has proven beneficial, especially at pad sites with multiple vertical wells. Along with our mid-stream service provider, we are evaluating the installation of larger diameter pipe to improve the gas gathering capacity.
In addition, companies that operate the gas gathering pipelines continue to make significant capital investments to increase system capacity. As publicly disclosed, DCP Midstream Partners (“DCP”), the principal third party provide that we employ to gather production from our wells, brought online a 160 Mcf/d gas processing plant in La Salle, CO (the O’Connor plant), which is part of an 8 plant system owned by the DCP enterprise with approximately 600 MMcf/d capacity. The addition of this plant to our area has served primarily to curb the increasing pressure issues, but has not resolved the high line pressure problems in the region. DCP has also announced the building of the Lucerne Plant II, northeast of Greeley in Weld County, with a maximum capacity of approximately 200 mmcf/d. The Lucerne Plant II is estimated to begin operations in the first quarter of 2015. At this time, we do not know how long it will take for the mitigation efforts to remedy the problem.
The success of horizontal drilling techniques in the D-J Basin has significantly increased quantities of oil and natural gas produced in the region. Local refineries do not have sufficient capacity to process all of the crude oil available. The imbalance of supply and demand in the area is expected to result in an increase in oil transported from the D-J Basin to other markets, generally via pipeline or railroad car. The imbalance is having an impact on prices paid by oil purchasers and increased the differential between crude oil prices posted on NYMEX and the average prices realized by us. Further details regarding posted prices and average realized prices are discussed in the section entitled “market conditions,” presented in this Item 7. We continue to explore various alternatives with various oil purchasers, including a local refiner and an oil pipeline, that we believe will provide sufficient take-away capacity for all of our oil production.
Other factors that will most significantly affect our results of operations include (i) activities on properties that we operate, (ii) the marketability of our production, (iii) our ability to satisfy our substantial capital requirements, (iv) completion of acquisitions of additional properties and reserves, (v) competition from larger companies and (vi) prices for oil and gas. Our revenues will also be significantly impacted by our ability to maintain or increase oil or gas production through exploration and development activities.
It is expected that our principal source of future cash flow will be from the production and sale of oil and gas reserves, which are depleting assets. Cash flow from the sale of oil and gas production depends upon the quantity of production and the price obtained for the production. An increase in prices will permit us to finance our operations to a greater extent with internally generated funds, may allow us to obtain equity financing from more sources or on better terms, and lessens the difficulty of obtaining financing. However, price increases heighten the competition for oil and gas prospects, increase the costs of exploration and development, and, because of potential price declines, increase the risks associated with the purchase of producing properties during times that prices are at higher levels.
Since oil prices peaked in June 2014, oil prices have declined more than 23%. A continuing decline in oil and gas prices (i) will reduce our cash flow which, in turn, will reduce the funds available for exploring and replacing oil and gas reserves, (ii) will potentially reduce our current LOC borrowing base capacity and increase the difficulty of obtaining equity and debt financing and worsen the terms on which such financing may be obtained, (iii) will reduce the number of oil and gas prospects which have reasonable economic terms, (iv) may cause us to permit leases to expire based upon the value of potential oil and gas reserves in relation to the costs of exploration, and (v) may result in marginally productive oil and gas wells being abandoned as non-commercial. However, price declines reduce the competition for oil and gas properties and correspondingly reduce the prices paid for leases and prospects.
Other than the foregoing, we do not know of any trends, events or uncertainties that will have had or are reasonably expected to have a material impact on our sales, revenues or expenses.
Critical Accounting Policies
The discussionWe prepare our consolidated financial statements and analysisthe accompanying notes in conformity with US GAAP, which requires management to make estimates and assumptions about future events that affect the reported amounts in the consolidated financial statements and the accompanying notes. We identify certain accounting policies as critical based on, among other things, their impact on the portrayal of our financial condition, and results of operations, are based upon our financial statements, which have been preparedor liquidity and the degree of difficulty, subjectivity, and complexity in accordance with accounting principles generally accepted in the United States of America.
The following paragraphs provide a discussion of our more significanttheir deployment. Critical accounting policies estimatescover accounting matters that are inherently uncertain because the future resolution of such matters is unknown. Management discusses the development, selection, and judgments. We believe these accounting policies reflect our more significant estimates and assumptions used in preparationdisclosure of our financial statements. See Note 1each of the Notes to the Financial Statements for a detailed discussion of the nature of ourcritical accounting practices and additional accounting policies and estimates made by management.policies.
Oil and Natural Gas Sales:Reserves: We derive revenue primarily from the sale of produced crude oil Oil and natural gas. Revenues from production on properties in which we share an economic interest with other owners are recognized on the basis of our interest. Revenues are reported on a gross basis for the amounts received before taking into account production taxes and transportation costs, which are reported as separate expenses. Revenue is recorded and receivables are accrued using the sales method, which occurs in the month production is delivered to the purchaser, at which time ownership of the oil is transferred to the purchaser. Payment is generally received between thirty and ninety days after the date of production. Provided that reasonable estimates can be made, revenue and receivables are accrued to recognize delivery of product to the purchaser. Differences between estimates and actual volumes and prices, if any, are adjusted upon final settlement.
Oil and Gas Reserves: Oil and gas reserves represent theoretical, estimated quantities of crude oil and natural gas which, using geological and engineering data, are estimated with reasonable certainty to be recoverable in future years from known reservoirs under existing economic and operating conditions. ThereNumerous assumptions are numerous uncertainties inherentused in estimating oilthe reserve estimation process. Various engineering and gas reservesgeologic criteria are interpreted to derive volumetric estimates, and their values, including many factors beyond our control. Accordingly, reserve estimatesfinancial assumptions are different frommade with regard to realized pricing, costs to be incurred to develop and operate the properties, and future quantities of oil and gas that are ultimately recovered and the corresponding lifting costs associated with the recovery of these reserves.tax regimes.
In spite of the imprecise nature of reserves estimates, they are a critical component of our consolidated financial statements. The determination of the depletion and amortization expenses,component of our DD&A, as well as the ceiling test calculation, related to the recorded value of our oil and natural gas properties, is highly dependent on estimates of proved oil and natural gas reserves. For example, if estimates of proved reserves decline, our DD&A rate will increase, resulting in a decrease in net income. A decline in estimates of proved reserves may result from a number of factors including lower prices, evaluation of additional operating history, mechanical problems on our wells, and catastrophic events. Lower prices can also make it uneconomical to drill wells or produce from properties with high operating costs.
Oil and Gas Properties:Properties, including Ceiling Test: There are two alternative methods of accounting for enterprises involved in the oil and gas industry: the successful efforts method and the full cost method. We use the full cost method of accounting for costs related to our oil and gas properties.accounting. Accordingly, all costs associated with acquisition, exploration, and development of oil and natural gas reserves (including the costs of unsuccessful efforts)dry holes, abandoned leases, delay rentals, and overhead costs directly related to acquisition, exploration, and development activities) are capitalized into a single full cost pool. These
Under the successful efforts method, exploration costs, include land acquisition costs,including the cost of exploratory wells that do not increase proved reserves, the cost of geological and geophysical activities, seismic costs, and lease rentals, are charged to expense carrying chargesas incurred. Depletion of oil and gas properties and the evaluation for impairment are generally calculated on non-producing properties, costs of drilling and overhead charges directly relateda narrowly defined asset basis compared to acquisition and exploration activities. Underan aggregated "pool" basis under the full cost method, no gain or loss is recognized upon the salemethod. The conveyance or abandonment of oil and gas assets generally
results in recognition of gain or loss. In comparison, the conveyance or abandonment of full cost properties does not generally result in the recognition of gain or loss unless non-recognition of such a gain or loss would significantly alter the relationship between capitalized costs and proved oil and natural gas reserves. Under full cost accounting, recognition of gain or loss is only allowable when the transaction would significantly alter the relationship between capitalized costs and proved reserves.
CapitalizedOur calculation of DD&A expense incorporates all the costs capitalized under full cost accounting plus the estimate of costs to be incurred to develop proved reserves. The sum of historical and future costs is allocated to our estimated quantities of proved oil and natural gas reserves and depleted using the units-of-production method. Changes in commodity prices, as well as associated changes in costs that are affected by commodity prices, can have a significant impact on the estimates used in our calculations.
Companies that use full cost accounting perform a ceiling test each quarter. The full cost ceiling test is the impairment test prescribed by SEC Regulation S-X Rule 4-10. The test compares capitalized costs in the full cost pool less accumulated DD&A and related deferred income taxes to a calculated ceiling amount. The calculated ceiling amount is equal to the sum of the present value of estimated future net revenues, plus the cost of properties not being amortized plus the lower of cost or estimated fair value of unproven properties included in costs being amortized less the income tax effects related to differences between the book and tax basis of the properties. The present value of estimated future net revenues is computed by applying current prices of oil and natural gas reserves (as defined in the SEC rules) to estimated future production of proved oil and natural gas reserves, less estimated future expenditures to be incurred in developing and producing the proved reserves; the result is discounted at 10% and assumes continuation of current economic conditions. Future cash outflows associated with settling accrued asset retirement obligations that have been accrued on the balance sheet are excluded from the calculation of the present value of future net revenues. The calculation of income tax effects takes into account the tax basis of oil and gas properties, are depletednet operating loss carryforwards, and the impact of statutory depletion. In accordance with SEC Staff Accounting Bulletin Topic 12D, the income tax effect is calculated by using the unit-of-production method based upon estimatespresent value of estimated future net revenue as pre-tax income, deducting the aforementioned tax effects, and applying the statutory tax rate. If the net capitalized costs exceed the ceiling amount, the excess must be charged to expense in recognition of the impairment.
Under the ceiling test, the estimate of future revenues is calculated using a current price (as defined in the SEC rules to include data points over a trailing 12-month period). Thus, the full impact of a sudden price decline is not recognized immediately. As prices decline, the economic performance of certain properties in the reserve estimate may deteriorate to the point that they are removed from the proved reserve category, thus reducing the quantity and value of proved reserves. For depletion purposes,The use of a 12-month average will tend to spread the volumeimpact of petroleum reservesthe change on the financial statements over several reporting periods.
During the year ended December 31, 2017, the calculated value of the ceiling limitation exceeded the carrying value of our oil and production is converted into a common unit of measure atgas properties subject to the energy equivalent conversion rate of six thousand cubic feet oftest, and no impairments were necessary. A decline in oil and natural gas prices, or an increase in oil and natural gas prices that is insufficient to one barrelovercome the impact of crude oil. Investmentsprice declines in unevaluated propertiesthe year-ago periods on the ceiling test calculation, could result in ceiling test impairments in future periods.
Oil, Natural Gas, and major development projectsNGL Sales: Our proportionate interests in transactions are not amortized until proved reserves associated with the projects can be determined or until impairment occurs. If the results of an assessment indicate that the propertiesrecorded as revenue when products are impaired, the amount of the impairment is addeddelivered to the capitalized costspurchasers. This method can require estimates of volumes, ownership interests, and settlement prices. Differences between estimates and actual volumes and prices, if any, are adjusted upon final settlement. Historically, such differences have not been material. During periods of increased price volatility, it will be more difficult to be amortized.estimate final settlement prices, and retroactive price adjustments pertaining to prior periods could become significant.
Asset Retirement Obligations ("ARO"):(“ARO”): We are subject to legal and contractual obligations to reclaim, remediate, or otherwise restore properties at the time the asset is permanently removed from service. Calculation of an ARO requires estimates about several future events, including the life of the asset, the costs to remove the asset from service, and inflation factors. The ARO is initially estimated based upon discounted cash flows over the life of the asset and is accreted to full value over time using our credit adjusted risk free interestcredit-adjusted risk-free rate. Estimates are periodically reviewed and adjusted to reflect changes.
The present value of a liability for the ARO is initially recorded when it is incurred if a reasonable estimate of fair value can be made. This is typically when a well is completed, or an asset is placed in service. When the ARO is initially recorded, we capitalize the cost (asset retirement cost or “ARC”) by increasing the carrying value of the related asset. ARCs related to wells are capitalized to the full cost pool and subject to depletion. Over time, the liability increases for the change in its present value (accretion of ARO), while the capitalized cost decreases over the useful life of the asset recognized as depletion.depletion expense is recognized.
Stock-Based Compensation:Commodity Derivative Instruments: Our use of commodity derivative instruments helps us mitigate the cash flow impact of short-term commodity price volatility. We recognize all equity-based compensationtypically enter into contracts covering a portion of our expected oil and natural gas production over 24 months. We record realized gains and losses for contracts that settle during the reporting periods. Contracts
either settle at their scheduled maturity date or settle prior to their scheduled maturity date as stock-based compensation expense, includeda result of our decision to early liquidate an open position. Realized gains and losses represent cash transactions. Under our commodity derivative strategy, we typically receive cash payments when the posted price for the settlement period is less than the derivative price. Conversely, when the posted price for the settlement period is greater than the derivative price, we typically disburse a cash payment to the counterparty. Thus, realized gains and losses tend to offset increases or decreases in generalour revenue stream that are caused by changing prices.
In comparison, unrealized gains and administrative expenses, based onlosses are related to positions that have not yet settled and do not represent cash transactions. At each reporting date, we estimate the fair value of the compensation measuredopen (not settled) commodity contract positions and record a gain or loss based upon the change in fair value since the previous reporting date. The fair values are an approximation of the contracts' values as if we sold them on the reporting date. Since these amounts represent a calculated value for a hypothetical transaction, the actual value realized at the grant date. The expense is recognizedcash settlement date may be significantly different.
A downward trend in commodity prices would generally be expected to result in reduced oil, natural gas, and NGL revenues partially offset realized gains in our hedge transactions. During any reporting period in which commodity prices decline, we expect to report unrealized gains on our open commodity derivative contracts. However, during any period in which the downward trend reverses, we expect to report unrealized losses. Looking forward, we expect current contracts to be settled or liquidated over the vesting periodnext 24 months. We expect to periodically enter into new commodity derivative contracts at then-current prices. Newer commodity derivative contracts at lower prices will reduce the amount of potential price protection provided by the grant.newer contracts.
Commodity Derivative Instruments: Business Combinations:We have entered into commodity derivative instruments, primarily utilizing swaps The Company accounts for certain transactions under Accounting Standards Codification ("ASC") 805, Business Combinations. For each transaction, the Company reviews the transaction to determine whether it involves an asset or “no premium” collars to reducea business. This review requires that we assess various criteria outlined by ASC 805. If the effectcriteria are not met, the transaction is considered an asset acquisition. If the criteria are met, the transaction is considered an acquisition of price changes on a portion of our future oilbusiness which the Company accounts for using the acquisition method. Under the acquisition method, assets acquired and gas production. Our commodity derivative instrumentsliabilities assumed are measured at their fair value. Unrealized gainsvalues, which requires the use of significant judgment since some of the acquired assets and lossesliabilities do not have fair values that are recorded based onreadily determinable. Different techniques may be used to determine fair values, including market prices (when available), appraisals, comparisons to transactions for similar assets and liabilities, and present values of estimated future cash flows, among others. Since these estimates involve the changes inuse of significant judgment, they can change as new information becomes available.
Once the fair values of the derivative instruments.assets acquired and the liabilities assumed are determined, the excess, if any, of the purchase price over the net fair value amounts assigned to assets acquired and liabilities assumed is recognized as goodwill. Conversely, the excess, if any, of the fair value of assets acquired and liabilities assumed over the purchase price of the acquired entity is recognized immediately in earnings as a gain from bargain purchase.
Goodwill: The Company’s goodwill represents the excess of the purchase price over the fair value of net identifiable assets acquired in a business combination. Goodwill is not amortized and is tested for impairment annually or whenever other circumstances or events indicate that the carrying amount of goodwill may not be recoverable. When evaluating goodwill for impairment, the Company may first perform an assessment of qualitative factors to determine if the fair value of the reporting unit is more-likely-than-not greater than its carrying amount. If, based on the review of the qualitative factors, the Company determines it is not more-likely-than-not that the fair value of a reporting unit is less than its carrying value, the required impairment test can be bypassed. If the Company does not perform a qualitative assessment or if the fair value of the reporting unit is not more-likely-than-not greater than its carrying value, the Company must calculate the estimated fair value of the reporting unit. If the carrying value of the reporting unit exceeds the estimated fair value, the Company should recognize an impairment charge. The amount of impairment for goodwill is measured as the amount by which the carrying amount of the reporting unit exceeds the reporting unit's fair value; however, the loss recognized should not exceed the total amount of goodwill. We performed our annual goodwill impairment test as of October 1, 2017. This test did not result in an impairment. The Company utilized a market approach in estimating the fair value our derivative instruments by obtaining independent market quotes, as well as using industry standard models that consider variousof the reporting unit. The primary assumptions including quoted forward prices for commodities, risk free interest rates, and estimated volatility factors, as well as other relevant economic measures. We compare the valuations calculated by us to valuations provided by the counterparties to assess the reasonableness of each valuation. The discount rate used in the fair valuesCompany's impairment evaluations are based on the best available market information at the time and contain considerable management judgments. Changes in these assumptions or future economic conditions could impact the Company's conclusion regarding an impairment of these instruments includesgoodwill and potentially result in a measure of nonperformance risk by the counterparty or us, as appropriate. non-cash impairment loss in a future period.
Income Taxes: Deferred income taxes are recorded for timing differences between items of income or expense reported in the consolidated financial statements and those reported for income tax purposes using the asset/liability method of accounting for income taxes. Deferred income taxes and tax benefits are recognized for the future tax consequences attributable to differences between the financial statement carrying amounts of existing assets and liabilities and their respective tax bases and for tax loss and credit carry-forwards.carryforwards. Deferred tax assets and liabilities are measured using enacted tax rates expected to apply to taxable income in the years in which those temporary differences are expected to be recovered or settled. We provide for deferred taxes
for the estimated future tax effects attributable to temporary differences and carry-forwardscarryforwards when realization is more likely than not. If we conclude that it is more likely than not that some portion, or all, of the net deferred tax asset will not be realized, the balance of net deferred tax assets is reduced by a valuation allowance.
We consider many factors in our evaluation of deferred tax assets, including the following sources of taxable income that may be available under the tax law to realize a portion or all of a tax benefit for deductible timing differences and carry-forwards:carryforwards:
· | Future reversals of existing taxable temporary differences,
|
· | Taxable income in prior carry back years, if permitted,
|
· | Tax planning strategies, and
|
· | Future taxable income exclusive of reversing temporary differences and carry- forwards. |
•Future reversals of existing taxable temporary differences,
•Taxable income in prior carry back years, if permitted,
51
•Tax planning strategies, andRecent•Future taxable income exclusive of reversing temporary differences and carryforwards.
Recently Adopted and Issued Accounting Pronouncements
We evaluateSee Note 1, Organization and Summary of Significant Accounting Policies, to the pronouncements of various authoritativeaccompanying consolidated financial statements included elsewhere in this report for information regarding recently adopted and issued accounting organizations to determine the impact of new pronouncements on US GAAP and the impact on us. pronouncements.
In May 2014, the FASB issued ASU 2014-09, which establishes a comprehensive new revenue recognition standard designed to depict the transfer of goods or services to a customer in an amount that reflects the consideration the entity expects to receive in exchange for those goods or services. In doing so, companies may need to use more judgment and make more estimates than under current revenue recognition guidance. The ASU allows for the use of either the full or modified retrospective transition method, and the standard will be effective for us in the first quarter of our fiscal year 2018; early adoption is not permitted. The Company is currently evaluating which transition approach to use and the impact of the adoption of this standard on its consolidated financial statements.In December 2011, the Financial Accounting Standards Board issued Accounting Standards Update 2011-11, “Disclosures about Offsetting Assets and Liabilities” (“ASU 2011-11”), and issued Accounting Standards Update 2013-01, “Clarifying the Scope of Disclosures about Offsetting Assets and Liabilities” (“ASU 2013-01”) in January 2013. These updates require disclosures about the nature of an entity’s rights of offset and related arrangements associated with its recognized derivative contracts. The new disclosure requirements, which are effective for interim and annual periods beginning on or after January 1, 2013, were implemented by the Company on September 1, 2013. The implementation of ASU 2011-11 and ASU 2013-01 had no impact on the Company’s financial position or results of operations. See Note 7 for the Company’s derivative disclosures.
There were various updates recently issued by the Financial Accounting Standards Board, most of which represented technical corrections to the accounting literature or application to specific industries and are not expected to a have a material impact on the Company's consolidated financial position, results of operations or cash flows.
| |
| ITEM 7A. | QUANTITATIVE AND QUALITATIVE DISCLOSURE ABOUT MARKET RISKS |
Commodity Price Risk- Our primary market risk exposurefinancial condition, results from volatility in the prices we receive for our oilof operations, and natural gas production. Realized commodity pricing for our production is primarily driven bycapital resources are highly dependent upon the prevailing worldwide price formarket prices of oil and spot prices applicable to natural gas. The volatility of oil prices affects our results to a greater degree than the volatility of natural gas prices, as approximately 81%72% of 2014 revenues wereour revenue during year ended December 31, 2017 was from the sale of oil. Although pricingA $5 per barrel change in our realized oil price would have resulted in a $29.1 million change in revenues for oil andthe year ended December 31, 2017, a $0.25 per Mcf change in our realized natural gas production has been less volatileprice would have resulted in recent years, we expect volatility to increasea $6.2 million change in our natural gas revenues, and a $5 per barrel change in our realized NGL price would have resulted in a $12.6 million change in our NGL revenues for the future. year ended December 31, 2017.
During the last three years, the average realized prices per barrel of oil have ranged from $90 to $86. Similarly, the average realized prices per mcf of gas have ranged from $5 to $4. However, a longer term view reveals that since 2008year ended December 31, 2017, the price of oil, has ranged from $145 per bblnatural gas, and NGLs increased relative to $33 per bblthe year ended 2016. These commodity prices are subject to wide fluctuations and market uncertainties due to a variety of factors that are beyond our control. Factors influencing oil, natural gas, and NGL prices include the levels of demand and supply for oil (in global or local markets), the establishment of and compliance with production quotas by oil exporting countries, weather conditions which influence the demand for natural gas, the price and availability of alternative fuels, the strength of the US dollar compared to other currencies, and overall economic conditions. It is impossible to predict future oil, natural gas, has ranged from $13 per mcfand NGLs prices with any degree of certainty. Sustained weakness in oil, natural gas, and NGL prices may adversely affect our financial condition and results of operations and may also reduce the amount of oil, natural gas, and NGL reserves that we can produce economically. Any reduction in our oil, natural gas, and NGL reserves, including reductions due to $2 per mcf.price fluctuations, can have an adverse effect on our ability to obtain capital for our exploration and development activities. Similarly, any improvements in oil, natural gas, and NGL prices can have a favorable impact on our financial condition, results of operations, and capital resources.
We attempt to mitigate fluctuations in short termshort-term cash flow resulting from changes in commodity prices by entering into derivative positions on a portion of our expected oil and natural gas production. WeUnder the Revolver, we can use derivative contracts to cover no less than 45% and no more thanup to 85% of expected hydrocarbonproved developed producing production as projected in our semi-annual reserve report, generally over a period of two years. We do not enter into derivative contracts for speculative or trading purposes. As of AugustDecember 31, 2014,2017, we had open crude oil and natural gas derivatives in a net liability position with a fair value of $0.2$7.9 million. A hypothetical upward shift of 10% in the NYMEX forward curve of crude oil orand natural gas prices would changedecrease the fair value of our position by $(1.1)$9.0 million. A hypothetical downward shift of 10% in the NYMEX forward curve of crude oil orand natural gas prices would changeincrease the fair value of our position by $0.6$3.8 million.
There was no material change in the underlying commodity price risk from 2013 to 2014.
Interest Rate Risk- At AugustDecember 31, 2014,2017, we had no debt outstanding under our bankrevolving credit facility totaling $37.0 million.facility. Interest on our bank credit facility accrues at a variable rate, based upon either the Prime Rate or LIBOR plus an applicable margin. During the London InterBank Offered Rate (LIBOR). At Augustyear ended December 31, 2014,2017, we were incurringincurred interest at aan annualized rate of 2.5%3.4%. We are exposed to interest rate risk on the bank credit facility if the variable reference rates increase. A decrease in the variable interest rates would not have a significant impact on us, as the bank credit facility has a minimum interest rate of 2.5%. If interest rates increase, our monthly interest payments would increase and our available cash flow would decrease. We estimate that if market interest rates increaseincreased or decreased by 1% to an annual percentage rate of 3.5%,for the year ended December 31, 2017, our interest payments would increasehave changed by approximately $0.4$0.6 million.
Under current market conditions, we do not anticipate significant changes in prevailing interest rates for the next year, and we have not undertaken any activities to mitigate potential interest rate risk. There was no material change in interest rate risk from 2013due to 2014.restrictions imposed by the Revolver.
Counterparty Risk –- As described in the discussion about"- Commodity Price Risk,Risk" above, we enter into commodity derivative agreements
to mitigate short termshort-term price volatility. These derivative financial instruments present certain counterparty risks. We are exposed to potential loss if a counterparty fails to perform according to the terms of the agreement. The failure of any of the counterparties to fulfill their obligations to us could adversely affect our results of operations and cash flows. We do not require collateral or other security to be furnished by counterparties. We seek to manage the counterparty risk associated with these contracts by limiting transactions to well capitalized, well established, and well knownwell-known counterparties that have been approved by our senior officers. There can be no assurance, however, that our practice effectively mitigates counterparty risk. There was no material change in
We believe that our exposure to counterparty risk increased slightly during the year ended December 31, 2017 as the amounts due to us from 2013 to 2014.counterparties has increased.
| |
| ITEM 8. | FINANCIAL STATEMENTS AND SUPPLEMENTARY DATA |
See theThe consolidated financial statements and accompanying notes includedsupplementary data are filed with this report.Annual Report in a separate section following Part IV, as shown in the index on page F-1 of this Annual Report.
| |
| ITEM 9. | CHANGES IN AND DISAGREEMENTS WITH ACCOUNTANTS ON ACCOUNTING AND FINANCIAL DISCLOSURE |
None.
| |
| ITEM 9A. | CONTROLS AND PROCEDURES |
Evaluation of Disclosure Controls and Procedures
Our management, with the participation of our Co-ChiefChief Executive OfficersOfficer and Chief Financial Officer, has evaluated the effectiveness of the design and operation of our disclosure controls and procedures, as defined in Rules 13a-15(e) and 15d-15(e) under the Securities Exchange Act of 1934, as amended (the “Exchange Act”) as of the end of the period covered by this report on Form 10-K (the “Evaluation Date”). Based on such evaluation, our Co-ChiefChief Executive OfficersOfficer and Chief Financial Officer concluded that, as of the evaluation date,Evaluation Date, our disclosure controls and procedures were effective.
Changes in Internal Control over Financial Reporting
There have been no changes in the Company’sour internal control over financial reporting (as defined in Rules 13a-15(f) and 15d-15(f) under the Exchange Act) during the most recently completed fiscal quarter that have materially affected, or are reasonably likely to materially affect, the Company’sour internal control over financial reporting.
Management's Report on Internal Control over Financial Reporting
Our management is responsible for establishing and maintaining adequate internal control over financial reporting as defined in Rules 13a-15(f) and 15d-15(f) under the Exchange Act. Because of its inherent limitations, internal control over financial reporting may not prevent or detect misstatements. Also, projections of any evaluation of effectiveness to future periods are subject to the risk that controls may become inadequate because of changes in conditions or that the degree of compliance with the policies or procedures may deteriorate.
Under the supervision and with the participation of our management, including Ed HollowayLynn A. Peterson, our Chief Executive Officer, and William E. Scaff, Jr., our Co-Chief Executive Officers, and Frank L. Jennings,James P. Henderson, our Chief Financial Officer, we conducted an evaluation of the effectiveness of our internal control over financial reporting as of AugustDecember 31, 20142017 based on criteria established in the Internal Control - Integrated Framework (1992)(2013) issued by the Committee of Sponsoring Organizations of the Treadway Commission, or the “COSO Framework.”Commission. Based on this evaluation, management concluded that our internal control over financial reporting was effective as of AugustDecember 31, 2014.2017.
Attestation ReportThe effectiveness of Registered Public Accounting Firmthe Company's internal control over financial reporting as of December 31, 2017, has been audited by Deloitte & Touche LLP, an independent registered public accounting firm, as stated in their report which appears herein.
The attestation report required under this Item 9A is set forth underREPORT OF INDEPENDENT REGISTERED PUBLIC ACCOUNTING FIRM
To the caption "Reportshareholders and the Board of Independent Registered Public Accounting Firm," which is includedDirectors of SRC Energy Inc.
Opinion on Internal Control over Financial Reporting
We have audited the internal control over financial reporting of SRC Energy Inc. and subsidiaries (the “Company”) as of December 31, 2017, based on criteria established in Internal Control - Integrated Framework (2013) issued by the Committee of Sponsoring Organizations of the Treadway Commission (COSO). In our opinion, the Company maintained, in all material respects, effective internal control over financial reporting as of December 31, 2017, based on criteria established in Internal Control - Integrated Framework (2013) issued by COSO.
We have also audited, in accordance with the standards of the Public Company Accounting Oversight Board (United States) (PCAOB), the consolidated financial statements as of and supplemental data required by Item 8.for the year ended December 31, 2017, of the Company and our report dated February 21, 2018, expressed an unqualified opinion on those financial statements.
Basis for Opinion
The Company’s management is responsible for maintaining effective internal control over financial reporting and for its assessment of the effectiveness of internal control over financial reporting, included in the accompanying Management's Report on Internal Control over Financial Reporting. Our responsibility is to express an opinion on the Company’s internal control over financial reporting based on our audit. We are a public accounting firm registered with the PCAOB and are required to be independent with respect to the Company in accordance with the U.S. federal securities laws and the applicable rules and regulations of the Securities and Exchange Commission and the PCAOB.
We conducted our audit in accordance with the standards of the PCAOB. Those standards require that we plan and perform the audit to obtain reasonable assurance about whether effective internal control over financial reporting was maintained in all material respects. Our audit included obtaining an understanding of internal control over financial reporting, assessing the risk that a material weakness exists, testing and evaluating the design and operating effectiveness of internal control based on the assessed risk, and performing such other procedures as we considered necessary in the circumstances. We believe that our audit provides a reasonable basis for our opinion.
Definition and Limitations of Internal Control over Financial Reporting
A company’s internal control over financial reporting is a process designed to provide reasonable assurance regarding the reliability of financial reporting and the preparation of financial statements for external purposes in accordance with generally accepted accounting principles. A company’s internal control over financial reporting includes those policies and procedures that (1) pertain to the maintenance of records that, in reasonable detail, accurately and fairly reflect the transactions and dispositions of the assets of the company; (2) provide reasonable assurance that transactions are recorded as necessary to permit preparation of financial statements in accordance with generally accepted accounting principles, and that receipts and expenditures of the company are being made only in accordance with authorizations of management and directors of the company; and (3) provide reasonable assurance regarding prevention or timely detection of unauthorized acquisition, use, or disposition of the company’s assets that could have a material effect on the financial statements.
Because of its inherent limitations, internal control over financial reporting may not prevent or detect misstatements. Also, projections of any evaluation of effectiveness to future periods are subject to the risk that controls may become inadequate because of changes in conditions, or that the degree of compliance with the policies or procedures may deteriorate.
/s/ DELOITTE & TOUCHE LLP
Denver, Colorado
February 21, 2018
| |
| ITEM 9B. | OTHER INFORMATION |
None.
PART III
| |
| ITEM 10. | DIRECTORS, EXECUTIVE OFFICERS, AND CORPORATE GOVERNANCE |
The information responsive to Items 401, 405, 406, and 407 of Regulation S-K to be included in our definitive Proxy Statement for our Annual Meeting of Shareholders, to be filed within 120 days of AugustDecember 31, 2014,2017, pursuant to Regulation 14A under the Securities Exchange Act of 1934, as amended (the “2014“2018 Proxy Statement”), is incorporated herein by reference.
| |
| ITEM 11. | EXECUTIVE COMPENSATION |
The information responsive to Items 402 and 407 of Regulation S-K to be included in our 20142018 Proxy statementStatement is incorporated herein by reference.
| |
| ITEM 12. | SECURITY OWNERSHIP OF CERTAIN BENEFICIAL OWNERS AND MANAGEMENT AND RELATED STOCKHOLDER MATTERS |
The information responsive to Items 201(d) and 403 of Regulation S-K to be included in our 20142018 Proxy statementStatement is incorporated herein by reference.
| |
| ITEM 13. | CERTAIN RELATIONSHIPS AND RELATED TRANSACTIONS, DIRECTOR INDEPENDENCE |
The information responsive to Items 404 and 407 of Regulation S-K to be included in our 20142018 Proxy statementStatement is incorporated herein by reference.
| |
| ITEM 14. | PRINCIPAL ACCOUNTING FEES AND SERVICES |
For eachThe information responsive to Items 9(e) of the three years ended August 31, 2014, 2013 and 2012, EKS&H, LLLP (“EKS&H”) served as our independent registered public accounting firm. The table below shows the amount we paid EKS&H during these years (in thousands).
| | | Year Ended | | | Year Ended | | | Year Ended | |
| | | August 31, 2014 | | | August 31, 2013 | | | August 31, 2012 | |
| Audit Fees | | $ | 275 | | | $ | 220 | | | $ | 175 | |
| Audit-Related Fees | | | 42 | | | | 84 | | | | 42 | |
| Tax Fees | | | 66 | | | | 65 | | | | 41 | |
| All Other Fees | | | 50 | | | | 25 | | | | — | |
| Total Fees | | | 433 | | | | 394 | | | | 258 | |
Audit fees represent amounts billed for professional services rendered for the audit of our annual financial statements, our system of internal control over financial reporting and the reviews of the financial statementsSchedule 14A to be included in our Form 10-Q and Form 10-K reports. Audit-related fees include amounts billed for the review of our registration statement on Form S-3 and the audits of the historical financial statements of companies acquired. All other fees represent due diligence activities performed on our behalf. Prior to contracting with EKS&H to render audit or non-audit services, each engagement was approved2018 Proxy Statement is incorporated herein by our audit committee.reference.
PART IV
ITEM 15. 15 EXHIBITS, FINANCIAL STATEMENT SCHEDULES
ExhibitsFinancial Statements
See page F-1 for a description of the financial statements filed with this report.
Exhibits
1.1 |
| |
Exhibit Number | Exhibit |
| 3.1 | |
| 3.2 | |
| 4.1 | |
3.1.2 10.1 | Amendment to Articles of Incorporation1
|
4.1 | Form of Common Stock Certificate1
|
5.1 | Opinion of Hart & Trinen, LLP1
|
10.1 | Employment Agreement with Ed Holloway3
|
10.2 | Employment Agreement with William E. Scaff, Jr.3
|
10.3 | Administrative Services Agreement4
|
10.4 | Agreement regarding Conflicting Interest Transactions4
|
10.5 | Consulting Services Agreement with Raymond McElhaney and Bill Conrad 5
|
10.6.1 | Form of Convertible Note 5
|
10.6.2 | Form of Subscription Agreement 5
|
10.6.3 | Form of Series C Warrant 5
|
10.7 | Purchase and Sale Agreement with Petroleum Exploration and Management, LLC (wells, equipment and well bore leasehold assignments) 5
|
10.8 | Purchase and Sale Agreement with Petroleum Management, LLC (operations and leasehold) 5
|
10.9 | Purchase and Sale Agreement with Chesapeake Energy 5
|
10.10 | Lease with HS Land & Cattle, LLC 5
|
10.11 | Employment Agreement with Frank L. Jennings 6
|
10.12 | Purchase and Sale Agreement with Petroleum Exploration and Management, LLC 7
|
10.13 | Loan Agreement with Bank of Choice (presently known as Guarantee Bank of Colorado) 8
|
10.14 | Purchase and Sale Agreement with DeClar Oil & Gas, Inc. and Wolf Point Exploration, LLC 9
|
10.15 | Amendment #1 to Loan Agreement 10
|
10.16 | Amendment #2 to Loan Agreement 12
|
10.17 | Purchase and Sale Agreement with ORR ENERGY LLC (Weld County, Colorado oil and gas property) 12
|
10.18 | Exploration Agreement dated March 1, 2013 (Morgan and Weld Counties Colorado, properties) 13
|
10.19 | Amendment to Drilling Contract with Ensign United States Drilling, Inc. 14
|
10.25 | Employment Agreement with Craig Rasmuson 16
|
10.26 | Employment Agreement with Valerie Dunn 16
|
10.27 | Drilling contract with Ensign United States Drilling, Inc. dated April 19, 2014 17
|
10.28 | Amendment #3 to Loan Agreement datedas of December 20, 2013, 18by and among the Company, Community Banks of Colorado as administrative agent and the lenders party thereto (incorporated by reference to Exhibit 10.22 to the Current Report on Form 8-K of the Company filed on December 26, 2013)
|
| 10.1.2 | |
10.2910.1.3 | |
| 10.1.4 | |
| 10.1.5 | |
| 10.1.6 | |
| 10.1.7 | |
| 10.1.8 | |
| 10.1.9 | |
| 10.2 | |
|
| |
| 10.3 | Purchase and Sale Agreement dated September 16, 2013, with Trilogy Resources,May 2, 2016 between Noble Energy, Inc., NBL Energy Royalties, Inc., and Noble Energy Wyco, LLC, 19as Sellers, and the Company, as Buyer (incorporated by reference to Exhibit 10.1 to the Current Report on Form 8-K of the Company filed on May 3, 2016) |
| 10.4 | |
10.3010.5 | |
| |
10.31 | Amendment #4November 7, 2017, by and between the Company and Noble Energy, Inc. and one of its subsidiaries (incorporated by reference to Loan Agreement dated December 20, 2013 20
|
14 | CodeExhibit 10.1 to the Current Report on Form 8-K of Ethics (as amended) 11the Company filed on November 8, 2017)
|
| 10.6 | |
| 10.7 | |
| 10.8 | |
| 10.8.1 | |
| 10.9 | |
| 10.10 | |
| 10.11 | 2015 Equity Incentive Plan (incorporated by reference to Exhibit 10.18 to the Current Report on Form 8-K of the Company filed on December 17, 2015) + |
| 10.11.1 | |
| 10.11.2 | |
| 21.1 | Subsidiaries of the Company - No significant subsidiaries |
| 23.1 | |
| 23.2 | |
| 23.3 | |
23.2 | |
| * |
| 31.1 | |
| 31.2 | |
| |
31.332.1 | |
| |
32 | Certification18 USC 1350, as adopted, pursuant to Section 906 of the Sarbanes-Oxley Act of 2002 for Ed Holloway, William Scaff, Jr., and Frank L. Jennings ** |
1.101.INS | Incorporated by reference to the same exhibit filed with the Company’s report on Form 8-K filed on December 16, 2011.XBRLInstance Document * |
| 101.SCH | XBRL Taxonomy Extension Schema * |
| 101.CAL | XBRL Taxonomy Extension Calculation Linkbase * |
| 101.DEF | XBRL Taxonomy Extension Definition Linkbase * |
| 101.LAB | XBRL Taxonomy Extension Label Linkbase * |
| 101.PRE | XBRL Taxonomy Extension Presentation Linkbase * |
2. | Incorporated by reference to the same exhibit filed with the Company’s registration statement on Form SB-2, File #333-146561. |
** Furnished herewith3. | Incorporated by reference to the same exhibit filed with the Company’s report on Form 8-K filed on June 7, 2013. |
4. | Incorporated by reference to the same exhibit filed with the Company’s transition report on Form 10-K for the year ended August 31, 2008. |
5. | Incorporated by reference to the same exhibit filed with the Company’s report on Form 10-K/A filed on June 3, 2011. |
SRC ENERGY INC.
6. | Incorporated by reference to the same exhibit filed with the Company’s report on Form 8-K filed on June 24, 2011. |
7. | Incorporated by reference to Exhibit 10.12 filed with the Company’s report on Form 8-K filed on August 5, 2011. |
8. | Incorporated by reference to Exhibit 10.13 filed with the Company’s report on Form 8-K filed on December 2, 2011. |
9. | Incorporated by reference to Exhibit 10.14 filed with the Company’s report on Form 8-K filed on February 23, 2012. |
10. | Incorporated by reference to Exhibit 10.15 filed with the Company’s report on Form 8-K filed on April 25, 2012. |
11. | Incorporated by reference to Exhibit 14 filed with the Company’s report on Form 8-K filed on July 22, 2011. |
12. | Incorporated by reference to the same exhibit filed with the Company’s report on Form 8-K filed on October 25, 2012. |
13. | Incorporated by reference to Exhibit 10.18 filed with the Company’s report on Form 10-Q for the period ended February 28, 2013. |
14. | Incorporated by reference to Exhibit 10.19 filed with the Company’s 8-K report dated July 24, 2013. |
15. | Incorporated by reference to same exhibit filed with the Company’s registration statement on Form S-8, File #333-191684 |
16. | Incorporated by reference to Exhibits 10.24, 10.25 and 10.26 filed with the Company’s report on Form 8-K filed on June 10, 2014. |
17. | Incorporated by reference to Exhibit 10.27 filed with amendment no.1 to the Company’s annual report on Form 10-K/A filed on June 20, 2014. |
18. | Incorporated by reference to Exhibit 10.22 filed with the Company’s current report on Form 8-K filed on December 26, 2013. |
19. | Incorporated by reference to Exhibits 10.18 and 10.19 filed with the Company’s quarterly report on Form 10-Q filed on January 9, 2014. |
20. | Incorporated by reference to Exhibit 10.23 filed with the Company’s current report on Form 8-K filed on June 10, 2014. |
21. | Incorporated by reference to Exhibit 10.21 and 99.1 filed with the Company’s annual report on Form 10-K filed on October 30, 2014. |
SYNERGY RESOURCES CORPORATION
INDEX TO CONSOLIDATED FINANCIAL STATEMENTS
|
| |
| Index to Consolidated Financial Statements | |
| | |
ReportReports of Independent Registered Public Accounting FirmFirms | F-2 |
| | |
Consolidated Balance Sheets as of August 31, 2014 and 2013 | F-3 |
| | |
Consolidated Statements of Operations for the years ended August 31, 2014, 2013 and 2012 | F-4 |
| | |
Consolidated Statements of Changes in Shareholders’ Equity for the years ended August 31, 2014, 2013 and 2012
| F-5 |
| | |
Consolidated Statements of Cash Flows for the years ended August 31, 2014, 2013 and 2012 | F-6 |
| | |
| Notes to Consolidated Financial Statements | F-7 |
| |
REPORT OF INDEPENDENT REGISTERED PUBLIC ACCOUNTING FIRM
To the shareholders and the Board of Directors of SRC Energy Inc.
Opinion on the Financial Statements
F-1
We have audited the accompanying consolidated balance sheets of SRC Energy Inc. and subsidiaries (the "Company") as of December 31, 2017 and 2016, the related consolidated statements of operations, changes in shareholders' equity, and cash flows, for each of the two years in the period ended December 31, 2017, and the related notes (collectively referred to as the "financial statements"). In our opinion, the financial statements present fairly, in all material respects, the financial position of the Company as of December 31, 2017 and 2016, and the results of its operations and its cash flows for each of the two years in the period ended December 31, 2017, in conformity with accounting principles generally accepted in the United States of America.
We have also audited, in accordance with the standards of the Public Company Accounting Oversight Board (United States) (PCAOB), the Company's internal control over financial reporting as of December 31, 2017, based on criteria established in Internal Control - Integrated Framework (2013) issued by the Committee of Sponsoring Organizations of the Treadway Commission and our report dated February 21, 2018, expressed an unqualified opinion on the Company's internal control over financial reporting.
Basis for Opinion
These financial statements are the responsibility of the Company's management. Our responsibility is to express an opinion on the Company's financial statements based on our audits. We are a public accounting firm registered with the PCAOB and are required to be independent with respect to the Company in accordance with the U.S. federal securities laws and the applicable rules and regulations of the Securities and Exchange Commission and the PCAOB.
We conducted our audits in accordance with the standards of the PCAOB. Those standards require that we plan and perform the audit to obtain reasonable assurance about whether the financial statements are free of material misstatement, whether due to error or fraud. Our audits included performing procedures to assess the risks of material misstatement of the financial statements, whether due to error or fraud, and performing procedures that respond to those risks. Such procedures included examining, on a test basis, evidence regarding the amounts and disclosures in the financial statements. Our audits also included evaluating the accounting principles used and significant estimates made by management, as well as evaluating the overall presentation of the financial statements. We believe that our audits provide a reasonable basis for our opinion.
/s/ DELOITTE & TOUCHE LLP
Denver, Colorado
February 21, 2018
We have served as the Company's auditor since 2016.
REPORT OF INDEPENDENT REGISTERED PUBLIC ACCOUNTING FIRM
To the Board of Directors and Shareholders
Synergy Resources CorporationSRC Energy Inc.
Platteville,Denver, Colorado
We have audited the accompanying consolidated balance sheetssheet of SRC Energy Inc. (formerly known as Synergy Resources Corporation (the Company)Corporation) as of AugustDecember 31, 2014 and 2013,2015, and the related statements of operations, changes in shareholders’ equity, and cash flows for each of the years infour months ended December 31, 2015 and for the three-year periodyear ended August 31, 2014. We also have audited the Company’s internal control over financial reporting as of August 31, 2014, based on criteria established in Internal Control – Integrated Framework (1992) issued by the Committee of Sponsoring Organizations of the Treadway Commission (COSO).2015. The Company’s management is responsible for these financial statements, for maintaining effective internal control over financial reporting, and for its assessment of the effectiveness of internal control over financial reporting, included in the accompanying Management’s Report on Internal Control over Financial Reporting.statements. Our responsibility is to express an opinion on these financial statements and an opinion on the Company’s internal control over financial reporting based on our audits.
We conducted our audits in accordance with the standards of the Public Company Accounting Oversight Board (United States). Those standards require that we plan and perform the audits to obtain reasonable assurance about whether the financial statements are free of material misstatement and whether effective internal control over financial reporting was maintained in all material respects. Our audits of the financial statements includedmisstatement. An audit includes examining, on a test basis, evidence supporting the amounts and disclosures in the financial statements,statements. An audit also includes assessing the accounting principles used and significant estimates made by management, andas well as evaluating the overall financial statement presentation. Our audit of internal control over financial reporting included obtaining an understanding of internal control over financial reporting, assessing the risk that a material weakness exists, and testing and evaluating the design and operating effectiveness of internal control based on the assessed risk. Our audits also included performing such other procedures as we considered necessary in the circumstances. We believe that our audits provide a reasonable basis for our opinions.
A company’s internal control over financial reporting is a process designed to provide reasonable assurance regarding the reliability of financial reporting and the preparation of financial statements for external purposes in accordance with generally accepted accounting principles. A company’s internal control over financial reporting includes those policies and procedures that (1) pertain to the maintenance of records that, in reasonable detail, accurately and fairly reflect the transactions and dispositions of the assets of the company; (2) provide reasonable assurance that transactions are recorded as necessary to permit preparation of financial statements in accordance with generally accepted accounting principles, and that receipts and expenditures of the company are being made only in accordance with authorizations of management and directors of the company; and (3) provide reasonable assurance regarding prevention or timely detection of unauthorized acquisition, use, or disposition of the company’s assets that could have a material effect on the financial statements.
Because of its inherent limitations, internal control over financial reporting may not prevent or detect misstatements. Also, projections of any evaluation of effectiveness to future periods are subject to the risk that controls may become inadequate because of changes in conditions, or that the degree of compliance with the policies or procedures may deteriorate.opinion.
In our opinion, the consolidated financial statements referred to above present fairly, in all material respects, the financial position of Synergy Resources CorporationSRC Energy Inc. as of AugustDecember 31, 2014 and 2013,2015, and the results of its operations and its cash flows for each of the years infour months ended December 31, 2015 and for the three-year periodyear ended August 31, 2014,2015, in conformity with accounting principles generally accepted in the United States of America. Also in our opinion, Synergy Resources Corporation maintained, in all material respects, effective internal control over financial reporting as of August 31, 2014, based on criteria established in Internal Control – Integrated Framework (1992), issued by the Committee of Sponsoring Organizations of the Treadway Commission (COSO).
/s/ EKS&H LLLP
October 28, 2014April 22, 2016
Denver, Colorado
SRC ENERGY INC.
● DENVER ● FORT COLLINS ● BOULDER ●
www.EKSH.com
SYNERGY RESOURCES CORPORATION
CONSOLIDATED BALANCE SHEETS
(in(in thousands, except share data)
| | | August 31, | | | August 31, | |
| ASSETS | | 2014 | | | 2013 | |
| Current assets: | | | | | | |
| Cash and cash equivalents | | $ | 34,753 | | | $ | 19,463 | |
| Short-term investments | | | — | | | | 60,018 | |
| Accounts receivable: | | | | | | | | |
| Oil and gas sales | | | 16,974 | | | | 7,361 | |
| Joint interest billing | | | 15,398 | | | | 4,700 | |
| Inventory | | | 310 | | | | 194 | |
| Commodity derivative | | | 365 | | | | — | |
| Other current assets | | | 440 | | | | 239 | |
| Total current assets | | | 68,240 | | | | 91,975 | |
| | | | | | | | | |
| Property and equipment: | | | | | | | | |
| Evaluated oil and gas properties, net | | | 275,018 | | | | 132,979 | |
| Unevaluated oil and gas properties | | | 95,278 | | | | 64,715 | |
| Other property and equipment, net | | | 9,104 | | | | 271 | |
| Property and equipment, net | | | 379,400 | | | | 197,965 | |
| | | | | | | | | |
| Commodity derivative | | | 54 | | | | — | |
| Other assets | | | 848 | | | | 1,296 | |
| | | | | | | | | |
| Total assets | | $ | 448,542 | | | $ | 291,236 | |
| | | | | | | | | |
| LIABILITIES AND SHAREHOLDERS' EQUITY | | | | | | | | |
| Current liabilities: | | | | | | | | |
| Trade accounts payable | | $ | 1,747 | | | $ | 949 | |
| Well costs payable | | | 71,849 | | | | 25,491 | |
| Revenue payable | | | 14,487 | | | | 6,081 | |
| Production taxes payable | | | 14,376 | | | | 6,277 | |
| Other accrued expenses | | | 817 | | | | 254 | |
| Commodity derivative | | | 302 | | | | 2,315 | |
| Total current liabilities | | | 103,578 | | | | 41,367 | |
| | | | | | | | | |
| Revolving credit facility | | | 37,000 | | | | 37,000 | |
| Commodity derivative | | | 307 | | | | 334 | |
| Deferred tax liability, net | | | 21,437 | | | | 6,538 | |
| Asset retirement obligations | | | 4,730 | | | | 2,777 | |
| Total liabilities | | | 167,052 | | | | 88,016 | |
| | | | | | | | | |
| Commitments and contingencies (See Note 14) | | | | | | | | |
| | | | | | | | | |
| Shareholders' equity: | | | | | | | | |
| Preferred stock - $0.01 par value, 10,000,000 shares authorized: | | | | | |
| no shares issued and outstanding | | | — | | | | — | |
| Common stock - $0.001 par value, 200,000,000 shares authorized: | | | | | |
| 77,999,082 and 70,587,723 shares issued and outstanding, | | | | | |
| respectively | | | 78 | | | | 71 | |
| Additional paid-in capital | | | 265,793 | | | | 216,383 | |
| Retained earnings (accumulated deficit) | | | 15,619 | | | | (13,234 | ) |
| Total shareholders' equity | | | 281,490 | | | | 203,220 | |
| | | | | | | | | |
| Total liabilities and shareholders' equity | | $ | 448,542 | | | $ | 291,236 | |
|
| | | | | | | |
| ASSETS | December 31, 2017 | | December 31, 2016 |
| Current assets: | | | |
| Cash and cash equivalents | $ | 48,772 |
| | $ | 18,615 |
|
| Accounts receivable: | | | |
| Oil, natural gas, and NGL sales | 86,013 |
| | 25,728 |
|
| Trade | 18,134 |
| | 6,805 |
|
| Commodity derivative assets | — |
| | 297 |
|
| Other current assets | 7,116 |
| | 2,739 |
|
| Total current assets | 160,035 |
| | 54,184 |
|
| | | | |
| Property and equipment: | | | |
| Oil and gas properties, full cost method: | | | |
| Proved properties, net of accumulated depletion | 970,584 |
| | 424,082 |
|
| Wells in progress | 106,269 |
| | 81,780 |
|
| Unproved properties and land, not subject to depletion | 793,669 |
| | 398,547 |
|
| Oil and gas properties, net | 1,870,522 |
| | 904,409 |
|
| Other property and equipment, net | 6,054 |
| | 4,327 |
|
| Total property and equipment, net | 1,876,576 |
| | 908,736 |
|
| Cash held in escrow and other deposits | — |
| | 18,248 |
|
| Goodwill | 40,711 |
| | 40,711 |
|
| Other assets | 2,242 |
| | 2,234 |
|
| Total assets | $ | 2,079,564 |
| | $ | 1,024,113 |
|
| | | | |
| LIABILITIES AND SHAREHOLDERS' EQUITY | | | |
| Current liabilities: | | | |
| Accounts payable and accrued expenses | $ | 74,672 |
| | $ | 52,453 |
|
| Revenue payable | 64,111 |
| | 16,557 |
|
| Production taxes payable | 52,413 |
| | 17,673 |
|
| Asset retirement obligations | 3,246 |
| | 2,683 |
|
| Commodity derivative liabilities | 7,865 |
| | 2,874 |
|
| Total current liabilities | 202,307 |
| | 92,240 |
|
| | | | |
| Revolving credit facility | — |
| | — |
|
| Notes payable, net of issuance costs | 538,186 |
| | 75,614 |
|
| Asset retirement obligations | 28,376 |
| | 13,775 |
|
| Other liabilities | 2,261 |
| | 1,745 |
|
| Total liabilities | 771,130 |
| | 183,374 |
|
| | | | |
| Commitments and contingencies (See Note 16) |
|
| |
|
|
| | | | |
| Shareholders' equity: | | | |
| Preferred stock - $0.01 par value, 10,000,000 shares authorized: no shares issued and outstanding | — |
| | — |
|
| Common stock - $0.001 par value, 300,000,000 shares authorized: 241,365,522 and 200,647,572 shares issued and outstanding as of December 31, 2017 and 2016, respectively | 241 |
| | 201 |
|
| Additional paid-in capital | 1,474,273 |
| | 1,148,998 |
|
| Retained deficit | (166,080 | ) | | (308,460 | ) |
| Total shareholders' equity | 1,308,434 |
| | 840,739 |
|
| | | | |
| Total liabilities and shareholders' equity | $ | 2,079,564 |
| | $ | 1,024,113 |
|
The accompanying notes are an integral part of these consolidated financial statements
SRC ENERGY INC.
SYNERGY RESOURCES CORPORATION
CONSOLIDATED STATEMENTS OF OPERATIONS
(in(in thousands, except share and per share data)
| | | For the Years Ended August 31, | |
| | | 2014 | | | 2013 | | | 2012 | |
| | | | | | | | | | |
| Oil and gas revenues | | $ | 104,219 | | | $ | 46,223 | | | $ | 24,969 | |
| | | | | | | | | | | | | |
| Expenses | | | | | | | | | | | | |
| Lease operating expenses | | | 7,991 | | | | 3,417 | | | | 1,212 | |
| Production taxes | | | 9,667 | | | | 4,237 | | | | 2,436 | |
| Depreciation, depletion, | | | | | | | | | | | | |
| and amortization | | | 32,958 | | | | 13,336 | | | | 6,010 | |
| General and administrative | | | 10,139 | | | | 5,688 | | | | 3,557 | |
| Total expenses | | | 60,755 | | | | 26,678 | | | | 13,215 | |
| | | | | | | | | | | | | |
| Operating income | | | 43,464 | | | | 19,545 | | | | 11,754 | |
| | | | | | | | | | | | | |
| Other income (expense) | | | | | | | | | | | | |
| Commodity derivative realized loss | | | (2,138 | ) | | | (395 | ) | | | - | |
| Commodity derivative unrealized gain (loss) | | | 2,459 | | | | (2,649 | ) | | | - | |
| Interest expense, net | | | - | | | | (97 | ) | | | - | |
| Interest income | | | 82 | | | | 47 | | | | 38 | |
| Total other income (expense) | | | 403 | | | | (3,094 | ) | | | 38 | |
| | | | | | | | | | | | | |
| Income before income taxes | | | 43,867 | | | | 16,451 | | | | 11,792 | |
| | | | | | | | | | | | | |
| Deferred income tax provision (benefit) | | | 15,014 | | | | 6,870 | | | | (332 | ) |
| Net income | | $ | 28,853 | | | $ | 9,581 | | | $ | 12,124 | |
| | | | | | | | | | | | | |
| Net income per common share: | | | | | | | | | | | | |
| Basic | | $ | 0.38 | | | $ | 0.17 | | | $ | 0.26 | |
| Diluted | | $ | 0.37 | | | $ | 0.16 | | | $ | 0.25 | |
| | | | | | | | | | | | | |
| Weighted average shares outstanding: | | | | | | | | | |
| Basic | | | 76,214,737 | | | | 57,089,362 | | | | 46,587,558 | |
| Diluted | | | 77,808,054 | | | | 59,088,761 | | | | 48,359,905 | |
|
| | | | | | | | | | | | | | | |
| | Year Ended December 31, | | Four Months Ended December 31, 2015 | | Year Ended August 31, 2015 |
| | 2017 | | 2016 | | |
| Oil, natural gas, and NGL revenues | $ | 362,516 |
| | $ | 107,149 |
| | $ | 34,138 |
| | $ | 124,843 |
|
| | | | | | | | |
| Expenses: | | | | | | | |
| Lease operating expenses | 19,496 |
| | 19,949 |
| | 5,812 |
| | 15,017 |
|
| Transportation and gathering | 3,226 |
| | — |
| | — |
| | — |
|
| Production taxes | 36,266 |
| | 5,732 |
| | 3,104 |
| | 11,340 |
|
| Depreciation, depletion, and accretion | 112,309 |
| | 46,678 |
| | 18,776 |
| | 65,869 |
|
| Full cost ceiling impairment | — |
| | 215,223 |
| | 125,230 |
| | 16,000 |
|
| Unused commitment charge | 669 |
| | 597 |
| | 2,802 |
| | — |
|
| General and administrative | 32,965 |
| | 30,545 |
| | 17,875 |
| | 18,995 |
|
| Total expenses | 204,931 |
| | 318,724 |
| | 173,599 |
| | 127,221 |
|
| | | | | | | | |
| Operating income (loss) | 157,585 |
| | (211,575 | ) | | (139,461 | ) | | (2,378 | ) |
| | | | | | | | |
| Other income (expense): | | | | | | | |
| Commodity derivative gain (loss) | (4,226 | ) | | (7,750 | ) | | 6,482 |
| | 32,256 |
|
| Interest expense, net of amounts capitalized | (11,842 | ) | | — |
| | — |
| | (245 | ) |
| Interest income | 363 |
| | 192 |
| | 40 |
| | 86 |
|
| Other income | 503 |
| | 50 |
| | — |
| | — |
|
| Total other income (expense) | (15,202 | ) | | (7,508 | ) | | 6,522 |
| | 32,097 |
|
| | | | | | | | |
| Income (Loss) before income taxes | 142,383 |
| | (219,083 | ) | | (132,939 | ) | | 29,719 |
|
| | | | | | | | |
| Income tax expense (benefit) | (99 | ) | | 106 |
| | (10,007 | ) | | 11,677 |
|
| Net income (loss) | $ | 142,482 |
| | $ | (219,189 | ) | | $ | (122,932 | ) | | $ | 18,042 |
|
| | | | | | | | |
| Net income (loss) per common share: | | | | | | | |
| Basic | $ | 0.69 |
| | $ | (1.26 | ) | | $ | (1.14 | ) | | $ | 0.19 |
|
| Diluted | $ | 0.69 |
| | $ | (1.26 | ) | | $ | (1.14 | ) | | $ | 0.19 |
|
| | | | | | | | |
| Weighted-average shares outstanding: | | | | | | | |
| Basic | 206,167,506 |
| | 173,774,035 |
| | 107,789,554 |
| | 94,628,665 |
|
| Diluted | 206,743,551 |
| | 173,774,035 |
| | 107,789,554 |
| | 95,319,269 |
|
The accompanying notes are an integral part of these consolidated financial statements
SRC ENERGY INC.
SYNERGY RESOURCES CORPORATION
STATEMENTCONSOLIDATED STATEMENTS OF CHANGES IN SHAREHOLDERS' EQUITY
for the years ended August 31, 2014, 2013 and 2012
(in thousands, except share data)
| | | | | | | | | | | | | | | | |
| | | Number of Common | | | Par Value | | | Additional | | | Accumulated Earnings | | | Total Shareholders' | |
| | | Shares | | | Common Stock | | | Paid - In Capital | | | (Deficit) | | | Equity | |
| | | | | | | | | | | | | | | | |
| Balance, August 31, 2011 | | | 36,098,212 | | | $ | 36 | | | $ | 84,011 | | | $ | (34,939 | ) | | $ | 49,108 | |
| | | | | | | | | | | | | | | | | | | | | |
| Shares issued in exchange for mineral leases and services | | | 669,765 | | | | 1 | | | | 1,998 | | | | — | | | | 1,999 | |
| Shares issued for cash at $2.75 per share pursuant to the October 7, 2011 offering memorandum, net of offering costs of $2,028,215 | | | 14,636,363 | | | | 15 | | | | 37,407 | | | | — | | | | 37,422 | |
| Stock based compensation | | | 5,000 | | | | — | | | | 460 | | | | — | | | | 460 | |
| Net income | | | — | | | | — | | | | — | | | | 12,124 | | | | 12,124 | |
| Balance, August 31, 2012 | | | 51,409,340 | | | $ | 52 | | | $ | 123,876 | | | $ | (22,815 | ) | | $ | 101,113 | |
| | | | | | | | | | | | | | | | | | | | | |
| Shares issued for Orr Energy acquisition | | | 3,128,422 | | | | 3 | | | | 13,515 | | | | | | | | 13,518 | |
| Shares issued in exchange for mineral assets | | | 687,122 | | | | 1 | | | | 3,165 | | | | | | | | 3,166 | |
| Shares issued for cash at $6.25 per share pursuant to the June 13, 2013 offering memorandum, net of offering costs of $4.4 million | | | 13,225,000 | | | | 13 | | | | 78,230 | | | | | | | | 78,243 | |
| Shares issued for exercise of warrants | | | 1,052,698 | | | | 1 | | | | 3,274 | | | | | | | | 3,275 | |
| Payment of tax withholdings using withheld shares | | | — | | | | — | | | | (6,990 | ) | | | | | | | (6,990 | |
| Shares issued for exercise of stock option | | | 1,030,057 | | | | 1 | | | | (1 | ) | | | | | | | — | |
| Stock based compensation | | | 55,084 | | | | — | | | | 1,314 | | | | | | | | 1,314 | |
| Net income | | | | | | | | | | | | | | | 9,581 | | | | 9,581 | |
| Balance, August 31, 2013 | | | 70,587,723 | | | $ | 71 | | | $ | 216,383 | | | $ | (13,234 | ) | | $ | 203,220 | |
| | | | | | | | | | | | | | | | | | | | | |
| Shares issued in exchange for mineral assets | | | 357,901 | | | | — | | | | 2,856 | | | | — | | | | 2,856 | |
| Shares issued for Trilogy and Apollo acquisitions | | | 872,483 | | | | 1 | | | | 8,327 | | | | — | | | | 8,328 | |
| Shares issued for exercise of warrants | | | 6,063,801 | | | | 6 | | | | 35,628 | | | | — | | | | 35,634 | |
| Shares issued under stock bonus plan | | | 89,875 | | | | — | | | | 1,201 | | | | | | | | 1,201 | |
| Shares issued for exercise of stock options | | | 27,299 | | | | — | | | | — | | | | — | | | | — | |
| Stock based compensation for vested options | | | — | | | | — | | | | 1,767 | | | | — | | | | 1,767 | |
| Payment of tax withholdings using withheld shares | | | — | | | | — | | | | (369 | ) | | | | | | | (369 | |
| Net income | | | | | | | | | | | | | | | 28,853 | | | | 28,853 | |
| Balance, August 31, 2014 | | | 77,999,082 | | | $ | 78 | | | $ | 265,793 | | | $ | 15,619 | | | $ | 281,490 | |
|
| | | | | | | | | | | | | | | | | | |
| | Number of Common
Shares | | Par Value
Common Stock | | Additional
Paid - In Capital | | Accumulated
Earnings
(Deficit) | | Total Shareholders'
Equity |
| Balance, August 31, 2014 | 77,999,082 |
| | $ | 78 |
| | $ | 265,793 |
| | $ | 15,619 |
| | $ | 281,490 |
|
| Shares issued in equity offering | 18,613,952 |
| | 19 |
| | 190,826 |
| | — |
| | 190,845 |
|
| Shares issued for acquisition | 4,648,136 |
| | 5 |
| | 48,429 |
| | — |
| | 48,434 |
|
| Shares issued in exchange for mineral assets | 995,672 |
| | 1 |
| | 11,786 |
| | — |
| | 11,787 |
|
| Shares issued for exercise of warrants | 2,562,473 |
| | 2 |
| | 15,368 |
| | — |
| | 15,370 |
|
| Shares issued under stock bonus plan | 161,755 |
| | — |
| | 2,950 |
| | — |
| | 2,950 |
|
| Shares issued for exercise of stock options | 118,272 |
| | — |
| | — |
| | — |
| | — |
|
| Stock-based compensation for options | — |
| | — |
| | 4,741 |
| | — |
| | 4,741 |
|
| Payment of tax withholdings using withheld shares | — |
| | — |
| | (1,262 | ) | | — |
| | (1,262 | ) |
| Net income | — |
| | — |
| | — |
| | 18,042 |
| | 18,042 |
|
| Balance, August 31, 2015 | 105,099,342 |
| | 105 |
| | 538,631 |
| | 33,661 |
| | 572,397 |
|
| Shares issued for acquisition | 4,418,413 |
| | 4 |
| | 49,835 |
| | — |
| | 49,839 |
|
| Shares issued in exchange for mineral assets | 37,051 |
| | — |
| | 426 |
| | | | 426 |
|
| Shares issued under stock bonus and equity incentive plans | 422,035 |
| | 1 |
| | 7,162 |
| | — |
| | 7,163 |
|
| Shares issued for exercise of stock options | 56,760 |
| | — |
| | — |
| | — |
| | — |
|
| Stock-based compensation for options | — |
| | — |
| | 2,161 |
| | — |
| | 2,161 |
|
| Payment of tax withholdings using withheld shares | — |
| | — |
| | (2,544 | ) | | — |
| | (2,544 | ) |
| Net loss | — |
| | — |
| | — |
| | (122,932 | ) | | (122,932 | ) |
| Balance, December 31, 2015 | 110,033,601 |
| | 110 |
|
| 595,671 |
|
| (89,271 | ) |
| 506,510 |
|
| Shares issued in equity offerings | 90,275,000 |
| | 90 |
| | 543,321 |
| | — |
| | 543,411 |
|
| Shares issued under stock bonus and equity incentive plans | 321,101 |
| | 1 |
| | 4,231 |
| | — |
| | 4,232 |
|
| Shares issued for exercise of stock options | 17,870 |
| | — |
| | 68 |
| | — |
| | 68 |
|
| Stock-based compensation for options | — |
| | — |
| | 5,417 |
| | — |
| | 5,417 |
|
| Stock-based compensation for performance-vested stock units | — |
| | — |
| | 1,047 |
| | — |
| | 1,047 |
|
| Payment of tax withholdings using withheld shares | — |
| | — |
| | (757 | ) | | — |
| | (757 | ) |
| Net loss | — |
| | — |
| | — |
| | (219,189 | ) | | (219,189 | ) |
| Balance, December 31, 2016 | 200,647,572 |
| | 201 |
| | 1,148,998 |
| | (308,460 | ) | | 840,739 |
|
| Adoption of ASU 2016-09 | — |
| | — |
| | 102 |
| | (102 | ) | | — |
|
| Shares issued in equity offering | 40,250,000 |
| | 40 |
| | 312,131 |
| | — |
| | 312,171 |
|
| Shares issued under stock bonus and equity incentive plans | 280,284 |
| | — |
| | 4,976 |
| | — |
| | 4,976 |
|
| Shares issued for exercise of stock options | 187,666 |
| | — |
| | 740 |
| | — |
| | 740 |
|
| Stock-based compensation for options | — |
| | — |
| | 5,076 |
| | — |
| | 5,076 |
|
| Stock-based compensation for performance-vested stock units | — |
| | — |
| | 2,938 |
| | — |
| | 2,938 |
|
| Payment of tax withholdings using withheld shares | — |
| | — |
| | (688 | ) | | — |
| | (688 | ) |
| Net income | — |
| | — |
| | — |
| | 142,482 |
| | 142,482 |
|
| Balance, December 31, 2017 | 241,365,522 |
| | $ | 241 |
| | $ | 1,474,273 |
| | $ | (166,080 | ) | | $ | 1,308,434 |
|
The accompanying notes are an integral part of these consolidated financial statements
SRC ENERGY INC.
SYNERGY RESOURCES CORPORATION
CONSOLIDATED STATEMENTS OF CASH FLOWS
(in thousands)
| | | | | | | | | | |
| | | For the Years Ended August 31, | |
| | | 2014 | | | 2013 | | | 2012 | |
| Cash flows from operating activities: | | | | | | | | | |
| Net income | | $ | 28,853 | | | $ | 9,581 | | | $ | 12,124 | |
| Adjustments to reconcile net income (loss) to net cash | | | | | | | | | |
| provided by operating activities: | | | | | | | | | | | | |
| Depletion, depreciation, and amortization | | | 32,958 | | | | 13,336 | | | | 6,010 | |
| Provision for deferred taxes | | | 15,014 | | | | 6,870 | | | | (332 | ) |
| Stock-based compensation | | | 2,968 | | | | 1,362 | | | | 473 | |
| Valuation decrease in commodity derivatives | | | (2,459 | ) | | | 2,649 | | | | - | |
| Changes in operating assets and liabilities: | | | | | | | | | | | | |
| Accounts receivable | | | | | | | | | | | | |
| Oil and gas sales | | | (9,613 | ) | | | (3,756 | ) | | | (1,597 | ) |
| Joint interest billing | | | (10,698 | ) | | | (1,432 | ) | | | (685 | ) |
| Inventory | | | (116 | ) | | | (16 | ) | | | 282 | |
| Accounts payable | | | | | | | | | | | | |
| Trade | | | 798 | | | | (550 | ) | | | (155 | ) |
| Revenue | | | 8,406 | | | | 1,921 | | | | 4,161 | |
| Production taxes | | | 8,099 | | | | 2,472 | | | | 2,279 | |
| Accrued expenses | | | 448 | | | | (141 | ) | | | (1,291 | ) |
| Other | | | 247 | | | | (176 | ) | | | (17 | ) |
| Total adjustments | | | 46,052 | | | | 22,539 | | | | 9,128 | |
| Net cash provided by operating activities | | | 74,905 | | | | 32,120 | | | | 21,252 | |
| | | | | | | | | | | | | |
| Cash flows from investing activities: | | | | | | | | | | | | |
| Acquisition of property and equipment | | | (155,602 | ) | | | (80,469 | ) | | | (46,751 | ) |
| Short-term investments | | | 60,018 | | | | (60,000 | ) | | | - | |
| Net proceeds from sales of oil and gas properties | | | 704 | | | | - | | | | 71 | |
| Net cash used in investing activities | | | (94,880 | ) | | | (140,469 | ) | | | (46,680 | ) |
| | | | | | | | | | | | | |
| Cash flows from financing activities: | | | | | | | | | | | | |
| Proceeds from sale of stock | | | - | | | | 82,656 | | | | 40,250 | |
| Offering costs | | | - | | | | (4,413 | ) | | | (2,829 | ) |
| Proceeds from exercise of warrants | | | 35,634 | | | | 3,275 | | | | 3,000 | |
| Shares withheld for payment of employee payroll taxes | | | (369 | ) | | | (6,990 | ) | | | - | |
| Net proceeds from revolving credit facility | | | - | | | | 34,000 | | | | - | |
| Principal repayment of related party notes payable | | | - | | | | - | | | | (5,200 | ) |
| Net cash provided by financing activities | | | 35,265 | | | | 108,528 | | | | 35,221 | |
| | | | | | | | | | | | | |
| Net increase in cash and equivalents | | | 15,290 | | | | 179 | | | | 9,793 | |
| | | | | | | | | | | | | |
| Cash and equivalents at beginning of period | | | 19,463 | | | | 19,284 | | | | 9,491 | |
| | | | | | | | | | | | | |
| Cash and equivalents at end of period | | $ | 34,753 | | | $ | 19,463 | | | $ | 19,284 | |
| | | | | | | | | | |
|
| | | | | | | | | | | | | | | | |
| | Year Ended December 31, | | Four Months Ended December 31, 2015 | | Year Ended August 31, 2015 |
| | 2017 | | 2016 | | |
| Cash flows from operating activities: | | | | | | | |
| Net income (loss) | $ | 142,482 |
| | $ | (219,189 | ) | | $ | (122,932 | ) | | $ | 18,042 |
|
| Adjustments to reconcile net income (loss) to net cash provided by operating activities: | | | | | | | |
| Depletion, depreciation, and accretion | 112,309 |
| | 46,678 |
| | 18,776 |
| | 65,869 |
|
| Full cost ceiling impairment | — |
| | 215,223 |
| | 125,230 |
| | 16,000 |
|
| Settlements of asset retirement obligations | (4,541 | ) | | (228 | ) | | (745 | ) | | — |
|
| Loss on extinguishment of debt | 11,842 |
| | — |
| | — |
| | — |
|
| Provision for deferred taxes | — |
| | — |
| | (10,007 | ) | | 11,679 |
|
| Stock-based compensation expense | 11,225 |
| | 9,491 |
| | 8,431 |
| | 7,691 |
|
| Mark-to-market of commodity derivative contracts: | | | | | | | |
| Total (gain) loss on commodity derivative contracts | 4,226 |
| | 7,750 |
| | (6,482 | ) | | (32,256 | ) |
| Cash settlements on commodity derivative contracts | 942 |
| | 5,374 |
| | 1,954 |
| | 31,721 |
|
| Cash premiums paid for commodity derivative contracts | — |
| | — |
| | (956 | ) | | (4,117 | ) |
| Changes in operating assets and liabilities | 12,830 |
| | (16,411 | ) | | 6,803 |
| 6,803 |
| 10,458 |
|
| Net cash provided by operating activities | 291,315 |
| | 48,688 |
| | 20,072 |
| | 125,087 |
|
| | | | | | | | |
| Cash flows from investing activities: | | | | | | | |
| Acquisitions of oil and gas properties and leaseholds | (661,468 | ) | | (511,173 | ) | | (37,150 | ) | | (82,584 | ) |
| Capital expenditures for drilling and completion activities | (450,384 | ) | | (119,571 | ) | | (41,581 | ) | | (186,135 | ) |
| Other capital expenditures | (17,841 | ) | | (7,044 | ) | | (5,811 | ) | | (6,375 | ) |
| Acquisition of land and other property and equipment | (4,186 | ) | | (5,478 | ) | | (395 | ) | | (714 | ) |
| Proceeds from sales of oil and gas properties and other | 93,573 |
| | 25,350 |
| | — |
| | 6,239 |
|
| Net cash used in investing activities | (1,040,306 | ) | | (617,916 | ) | | (84,937 | ) | | (269,569 | ) |
| | | | | | | | |
| Cash flows from financing activities: | | | | | | | |
| Proceeds from the sale of stock | 322,000 |
| | 565,398 |
| | — |
| | 200,100 |
|
| Offering costs | (9,745 | ) | | (21,987 | ) | | — |
| | (9,255 | ) |
| Proceeds from the employee exercise of stock options | 741 |
| | 68 |
| | — |
| | 15,370 |
|
| Payment of employee payroll taxes in connection with shares withheld | (688 | ) | | (757 | ) | | (2,544 | ) | | (1,262 | ) |
| Proceeds from revolving credit facility | 250,000 |
| | 55,000 |
| | — |
| | 186,000 |
|
| Principal repayments on revolving credit facility | (250,000 | ) | | (133,000 | ) | | — |
| | (145,000 | ) |
| Proceeds from issuance of notes payable | 550,000 |
| | 80,000 |
| | — |
| | — |
|
| Repayment of notes payable | (88,234 | ) | | — |
| | — |
| | — |
|
| Financing fees on issuance of notes payable and amendments to revolving credit facility | (13,145 | ) | | (5,159 | ) | | — |
| | (2,316 | ) |
| Net cash provided by (used in) financing activities | 760,929 |
| | 539,563 |
| | (2,544 | ) | | 243,637 |
|
| | | | | | | | |
| Net increase (decrease) in cash, cash equivalents, and restricted cash | 11,938 |
| | (29,665 | ) | | (67,409 | ) | | 99,155 |
|
| | | | | | | | |
| Cash, cash equivalents, and restricted cash at beginning of period | 36,834 |
| | 66,499 |
| | 133,908 |
| | 34,753 |
|
| | | | | | | | |
| Cash, cash equivalents, and restricted cash at end of period | $ | 48,772 |
| | $ | 36,834 |
| | $ | 66,499 |
| | $ | 133,908 |
|
Supplemental Cash Flow Information (See Note 15)
17)
The accompanying notes are an integral part of these consolidated financial statements
SYNERGY RESOURCES CORPORATIONSRC ENERGY INC.
NOTES TO CONSOLIDATED FINANCIAL STATEMENTS
December 31, 2017, 2016 and 2015, and August 31, 2014, 2013 and 20122015
| |
| 1. | Organization and Summary of Significant Accounting Policies |
Organization: Synergy Resources Corporation (the “Company”)SRC Energy Inc. is an independent oil and natural gas company engaged in oil and gasthe acquisition, exploration, development, and production activities,of oil, natural gas, and NGLs, primarily in the Denver-JulesburgD-J Basin ("D-J Basin") of Colorado. On June 15, 2017, our shareholders approved an amendment to the Amended and Restated Articles of Incorporation of the Company to change the name of the Company from Synergy Resources Corporation to SRC Energy Inc. The Company had been using the new name on a "doing business as" basis since March 6, 2017. In addition to using the new name, the Company’s common stock, which is listed and traded on the NYSE American, changed to the new symbol "SRCI."
Basis of Presentation: The Company has adopted August 31st as the endoperates in one business segment, and all of its fiscal year. The Company does not utilize any special purpose entities.operations are located in the United States of America.
At the directive of the Securities and Exchange Commission ("SEC") to use “plain English”"plain English" in public filings, the Company will use such terms as “we,” “our,” “us”"we," "our," "us," or “the Company”the "Company" in place of Synergy Resources Corporation.SRC Energy Inc. When such terms are used in this manner throughout this document, they are in reference only to the corporation, Synergy Resources Corporation,SRC Energy Inc., and are not used in reference to the Board of Directors, corporate officers, management, or any individual employee or group of employees.
The consolidated financial statements include the accounts of the Company, including its wholly-owned subsidiaries. All significant intercompany balances and transactions have been eliminated in consolidation. The Company prepares its consolidated financial statements in accordance with accounting principles generally accepted in the United States of America (“US GAAP”).
ReclassificationsChange of Year-End:: Certain amounts previously presented for prior periods have been reclassified On February 25, 2016, the Company's Board of Directors approved a change in fiscal year end from August 31 to conformDecember 31. Unless otherwise noted, all references to "years" in this report refer to the current presentation. The reclassifications had no effecttwelve-month fiscal year, which prior to September 1, 2015 ended on net income, working capital or equity previously reported.August 31, and beginning with December 31, 2015 ends on the December 31 of each year.
Use of Estimates:The preparation of consolidated financial statements in conformity with US GAAP requires management to make estimates and assumptions that affect the reported amount of assets and liabilities, including oil and natural gas reserves, andgoodwill, business combinations, derivatives, the disclosure of contingent assets and liabilities at the date of the consolidated financial statements, and the reported amounts of revenues and expenses during the reporting period. Management routinely makes judgments and estimates about the effects of matters that are inherently uncertain. Management bases its estimates and judgments on historical experience and on various other factors that are believed to be reasonable under the circumstances, the results of which form the basis for making judgments about the carrying values of assets and liabilities that are not readily apparent from other sources. Estimates and assumptions are revised periodically, and the effects of revisions are reflected in the consolidated financial statements in the period that it is determined to be necessary. Actual results could differ from these estimates.
Cash and Cash Equivalents: The Company considers cash in banks, deposits in transit, and highly liquid debt instruments purchased with original maturities of less than three months to be cash and cash equivalents.
Short-Term Investments:Cash Held in Escrow: Cash held in escrow includes deposits for purchases of certain oil and gas properties as required under the related purchase and sale agreements. As part of its cash management strategies,December 31, 2016, the Company investshad placed $18.2 million in short-term interest bearing deposits such as certificatesescrow, which was released upon the second closing of deposits with maturities of less than one year.the GC Acquisition. Please refer to Note 3, Acquisitions and Divestitures, for further information.
Inventory: Inventories consist primarilyThe following table provides a reconciliation of tubular goodscash, cash equivalents, and well equipmentrestricted cash reported within the consolidated balance sheets to be used in future drilling operations or repair operations and are carried at the lowerconsolidated statements of cost or marketcash flows:
|
| | | | | | | | | | | | | | | |
| | As of December 31, | | As of August 31, 2015 |
| | 2017 | | 2016 | | 2015 | |
| Cash and cash equivalents | $ | 48,772 |
| | $ | 18,615 |
| | $ | 66,499 |
| | $ | 133,908 |
|
| Restricted cash included in cash held in escrow and other deposits | — |
| | 18,219 |
| | — |
| | — |
|
| | $ | 48,772 |
| | $ | 36,834 |
| | $ | 66,499 |
| | $ | 133,908 |
|
Oil and Gas Properties: The Company uses the full cost method of accounting for costs related to its oil and gas properties. Accordingly, all costs associated with acquisition, exploration, and development of oil and natural gas reserves (including the costs of unsuccessful efforts) are capitalized into a single full cost pool. These costs include land acquisition costs, geological and geophysical expense,expenses, carrying charges on non-producing properties, costs of drilling, and overhead charges directly related to acquisition, exploration, and explorationdevelopment activities. Under the full cost method, no gain or loss is recognized upon the sale or abandonment of oil and gas properties unless non-recognition of such gain or loss would significantly alter the relationship between capitalized costs and proved oil and natural gas reserves.
Capitalized costs of oil and gas properties are depleted using the unit-of-production method based upon estimates of proved reserves. For depletion purposes, the volume of petroleumproved oil and natural gas reserves and production is converted into a common unit of measure at the energy equivalent conversion rate of six thousand cubic feet of natural gas to one barrel of crude oil. Investments in unevaluatedunproved properties and major development projects are not amortized until proved reserves associated with the projects can be determined or until impairment occurs. If the results of an assessment indicate that the properties are impaired, the amount of the impairment is added to the capitalized costs to be amortized.
Wells in progress represent the costs associated with the drilling of oil and gas wells that have yet to be completed as of August 31, 2014. Since the wells had not been completed as of August 31, 2014, they were classified within unevaluated oil and gas properties and were withheld from the depletion calculation and the ceiling test. The costs for these wells will be transferred into proved property when the wells commence production and will become subject to depletion and the ceiling test calculation in subsequent periods.
Under the full cost method of accounting, a ceiling test is performed each quarter. The full cost ceiling test is anthe impairment test prescribed by SEC regulations. The ceiling test determines a limit on the net book value of oil and gas properties. The capitalized costsceiling is calculated as the sum of proved and unproved oil and gas properties, netthe present value of accumulated depreciation, depletion, and amortization, and the related deferred income taxes, may not exceed the estimated future net cash flowsrevenues from proved oil and natural gas reserves, less future cash outflows associated with asset retirement obligations that have been accrued, plus the cost of unproved properties not being amortized, plus the lower of cost or estimated fair value of unproven properties included in the costs being amortized. Prices are held constant foramortized, less the productive lifeincome tax effects related to differences between the book and tax basis of each well. Net cash flows arethe properties. The present value of estimated future net revenues is computed by applying current prices of oil and natural gas reserves to estimated future production of proved oil and natural gas reserves, less estimated future expenditures to be incurred in developing and producing the proved reserves; the result is discounted at 10%. and assumes continuation of current economic conditions. Future cash outflows associated with settling accrued asset retirement obligations that have been accrued on the balance are excluded from the calculation of the present value of future net revenues. The calculation of income tax effects takes into account the tax basis of oil and gas properties, net operating loss carryforwards, and the impact of statutory depletion. If netthe capitalized costs of proved and unproved oil and gas properties, net of accumulated depletion and prior impairments, and the related deferred income taxes exceed thisthe ceiling limit, the excess is charged to expense and reflected as additional accumulated depreciation, depletion and amortization. The calculation of future net cash flows assumes continuation of current economic conditions.expense. Once impairment expense is recognized, it cannot be reversed in future periods, even if increasing prices raise the ceiling amount. No provision for impairment was required forDuring the twelveyear ended December 31, 2017, the Company did not recognize any ceiling test impairments. During the year ended December 31, 2016, the four months ended December 31, 2015, and the year ended August 31, 2014 or 2013.2015, the Company recognized ceiling test impairments of $215.2 million, $125.2 million, and $16.0 million, respectively.
The oil and natural gas prices used to calculate the full cost ceiling limitation are based upon a 12 month12-month rolling average, calculated as the unweighted arithmetic average of the first day of the month price for each month within the 12 month period prior to the end of the reportingpreceding 12-month period unless prices are defined by contractual arrangements. Prices are adjusted for basis or location differentials.differentials and are held constant for the productive life of each well.
Oil and Natural Gas Reserves: Oil and natural gas reserves represent theoretical, estimated quantities of crude oil and natural gas which, using geological and engineering data, estimateare estimated with reasonable certainty to be recoverable in future years from known reservoirs under existing economic and operating conditions. There are numerous uncertainties inherent in estimating oil and natural gas reserves and their values including many factors beyond the Company’s control. Accordingly, reserve estimates are different from the future quantities of oil and natural gas that are ultimately recovered and the corresponding lifting costs associated with the recovery of these reserves.
The determination of depletion and amortization expenses,expense, as well as the ceiling test calculation related to the recorded value of the Company’s oil and natural gas properties, is highly dependent on estimates of proved oil and natural gas reserves.
Capitalized Interest:The Company capitalizes interest on expenditures made in connection with acquisitionacquisitions of mineral interests that are currently not subject to depletion and exploration and development projects that are not subject to current amortization.in progress. Interest is capitalized during the period that activities are in progress to bring the projects to their intended use. See Note 910 for additional information.
Capitalized Overhead: A portion of the Company’s overhead expenses are directly attributable to acquisition, exploration, and development activities. Under the full cost method of accounting, these expenses in the amounts shown in the table below wereare capitalized in the full cost pool (in thousands).
| | | For the Years Ended August 31, | |
| | | 2014 | | | 2013 | | | 2012 | |
| Capitalized overhead | | $ | 1,230 | | | $ | 637 | | | $ | 345 | |
Well Costs Payable: The cost of wells in progress are recorded as incurred, generally based upon invoiced amounts or joint interest billings (“JIB”). For those instances in which an invoice or JIB is not received on a timely basis, estimated costs are accrued to oil and gas properties, generally based on the Authorization for Expenditure (“AFE”).
Other Property and Equipment:Support equipment (including such items as vehicles, well servicingcomputer equipment, and software), office leasehold improvements, office furniture and equipment, and buildings are stated at historical cost. Expenditures
for support equipment relating to new assets or improvements are capitalized, provided the expenditure extends the useful life of an asset or extends the asset’s functionality. Support equipment, office leasehold improvements, and office furniture and equipment) is stated at the lower of cost or market. Depreciation of support equipment is computed using primarilyare depreciated under the straight-line method over periodsusing estimated useful lives ranging from three to five to seven years. The Class II disposal well isBuildings are also depreciated based on a units of productionunder the straight-line method using barrelsestimated useful lives of water disposed.thirty-nine years. No depreciation is taken on assets classified as construction in progress until the asset is placed into service. Gains and losses are recorded upon retirement, sale, or disposal of assets. Maintenance and repair costs are recognized as period costs when incurred. The Company evaluates its other property and equipment for impairment when events or changes in circumstances indicate that the related carrying amount may not be recoverable.
Accounts Payable and Accrued Expenses: Accounts payable and accrued expenses consist of the following (in thousands):
|
| | | | | | | |
| | As of December 31, |
| | 2017 | | 2016 |
| Trade accounts payable | $ | 624 |
| | $ | 786 |
|
| Accrued well costs | 56,348 |
| | 42,779 |
|
| Accrued G&A | 6,017 |
| | 4,292 |
|
| Accrued LOE | 5,249 |
| | 3,140 |
|
| Accrued interest | 3,125 |
| | 320 |
|
| Accrued other | 3,309 |
| | 1,136 |
|
| | 74,672 |
| | 52,453 |
|
Revenue Payable: Revenue payable represents amounts collected from purchasers for oil and natural gas sales which are revenues due to other working or royalty interest owners. Generally, the Company is required to remit amounts due under these liabilities within 30 days of the end of the month in which the related proceeds from the production are received.
Asset Retirement Obligations: The Company’s activities are subject to various laws and regulations, including legal and contractual obligations to reclaim, remediate, or otherwise restore properties at the time the asset is permanently removed from service. Calculation of an asset retirement obligation ("ARO") requires estimates about several future events, including the life of the asset, the costs to remove the asset from service, and inflation factors. The ARO is initially estimated based upon discounted cash flows over the life of the asset and is accreted to full value over time using the Company’s credit adjusted risk free interestcredit-adjusted risk-free rate. Estimates are periodically reviewed and adjusted to reflect changes.
The present value of a liability for the ARO is initially recorded when it is incurred if a reasonable estimate of fair value can be made. This is typically when a well is completed or an asset is placed in service. When the ARO is initially recorded, the Company capitalizes the cost (asset retirement cost or “ARC”) by increasing the carrying value of the related asset. ARCsAsset retirement costs ("ARCs") related to wells are capitalized to the full cost pool and subject to depletion. Over time, the liability increases for the change in its present value, (accretion of ARO), while the net capitalized cost decreases over the useful life of the asset as depletion expense is recognized. In addition, ARCs are included in the ceiling test calculation for valuingwhen assessing the full cost pool.pool for impairment.
Business Combinations: The Company accounts for its acquisitions that qualify as businesses using the acquisition method under FASB Accounting Standards Codification ("ASC") 805, Business Combinations. Under the acquisition method, assets acquired and liabilities assumed are recognized and measured at their fair values. The use of fair value accounting requires the use of significant judgment since some transaction components do not have fair values that are readily determinable. The excess, if any, of the purchase price over the net fair value amounts assigned to assets acquired and liabilities assumed is recognized as goodwill. Conversely, if the fair value of assets acquired exceeds the purchase price, including liabilities assumed, the excess is immediately recognized in earnings as a bargain purchase gain.
Goodwill: The Company’s goodwill represents the excess of the purchase price over the fair value of net identifiable assets acquired in a business combination. Goodwill is not amortized and is tested for impairment annually or whenever other circumstances or events indicate that the carrying amount of goodwill may not be recoverable. We have historically performed the annual impairment assessment as of August 31st. During 2016, we changed the date of our annual goodwill impairment assessment to October 1st. With respect to its annual goodwill testing date, management believes that this voluntary change in accounting method is preferable as it better aligns the annual impairment testing date with the Company’s new fiscal year end, which was also changed in 2016. This change in assessment date was applied prospectively and did not delay, accelerate, or avoid a potential impairment charge.
When evaluating goodwill for impairment, the Company may first perform an assessment of qualitative factors to determine if the fair value of the reporting unit is more-likely-than-not greater than its carrying amount. If, based on the review of the qualitative factors, the Company determines it is not more-likely-than-not that the fair value of a reporting unit is less than its carrying value, the required impairment test can be bypassed. If the Company does not perform a qualitative assessment or if the fair value of the reporting unit is not more-likely-than-not greater than its carrying value, the Company must calculate the estimated fair value of the reporting unit. If the carrying value of the reporting unit exceeds the estimated fair value, the Company should recognize an impairment charge. The amount of impairment for goodwill is measured as the amount by which the carrying amount of the reporting unit exceeds the reporting unit's fair value; however, the loss recognized should not exceed the total amount of goodwill. For purposes of assessing goodwill, the Company only has one reporting unit.
We performed our annual goodwill impairment test as of October 1, 2017. This test did not result in an impairment. The Company utilized a market approach in estimating the fair value of the reporting unit. The primary assumptions used in the Company's impairment evaluations are based on the best available market information at the time. Changes in these assumptions or future economic conditions could impact the Company's conclusion regarding an impairment of goodwill and potentially result in a non-cash impairment loss in a future period.
Oil, Natural Gas, and Gas Sales:NGL Revenues: The Company derives revenue primarily from the sale of crude oil, and natural gas, and NGLs produced on its properties. Revenues from production on properties in which the Company shares an economic interest with other owners are recognized on the basis of the Company's pro-rata interest. Revenues are reported on a grossnet revenue interest basis, for the amounts received before taking into account production taxes and lease operating costs, which excludes revenues that are reported as separate expenses.attributable to other parties' working or royalty interests. Revenue is recorded and receivables are accrued using the sales method, which occurs in the month production is delivered to the purchaser, at which time ownership of the oilproduct is transferred to the purchaser. Payment is generally received between thirty and ninety days after the date of production. Provided that reasonable estimates can be made, revenue and receivables are accrued to recognize delivery of product to the purchaser. Differences between estimates and actual volumes and prices, if any, are adjusted upon final settlement.
Major Customers and Operating Region: Customers:The Company operates exclusively within the United States of America. Except for cash and short-term investments, all of the Company’s assets are employed in and all of its revenues are derived from the oil and gas industry. The table below presents the percentages of oil and gas revenue resulting from purchases by major customers.
| | | For the Years Ended August 31, |
| | | 2014 | | 2013 | | 2012 |
| Company A | | 54% | | 50% | | 68% |
| Company B | | 13% | | 15% | | 11% |
The Company sells production to a small number of customers as is customary in the industry. Customers representing 10% or more of its oil, natural gas, and NGL revenue (“major customers”) for each of the periods presented are shown in the following table:
|
| | | | | | | |
| | Year Ended December 31, | | Four Months Ended December 31, 2015 | | Year Ended August 31, 2015 |
| | 2017 | | 2016 | | |
| Company A | 33% | | * | | * | | * |
| Company B | 24% | | 20% | | 15% | | 11% |
| Company C | 17% | | 20% | | * | | * |
| Company D | * | | 16% | | * | | * |
| Company E | * | | 13% | | * | | * |
| Company F | * | | * | | 57% | | 65% |
| Company G | * | | * | | 12% | | * |
* less than 10%
Based on the current demand for oil and natural gas, the availability of other buyers, the multiple contracts for sales of our products, and the Company having the option to sell to other buyers if conditions so warrant, the Company believes that itsthe loss of our existing customers or individual contract would not have a material adverse effect on us. Our oil and natural gas production canis a commodity with a readily available market, and we sell our products under many distinct contracts. In addition, there are several oil and natural gas purchasers and processors within our area of operations to whom our production could be sold in the market in the event that it is not sold to the Company’s existing customers. However, in some circumstances, a change in customers may entail significant transition costs and/or shutting in or curtailing production for weeks or even months during the transition to a new customer.sold.
Accounts receivable consist primarily of trade receivables from oil, natural gas, and gasNGL sales and amounts due from other working interest owners whom have been billedwho are liable for their proportionate share of well costs. The Company typically has the right to withhold future revenue disbursements to recover outstanding joint interest billings on outstanding receivables from joint interest owners.
Customers with balances greater than 10% of total receivable balances as of each of the fiscal year endsperiods presented are shown in the following table:table (these companies do not necessarily correspond to those presented above):
|
| | | |
| | As of December 31, |
| | 2017 | | 2016 |
| Company A | 26% | | 23% |
| Company B | 23% | | * |
| Company C | 16% | | * |
| Company D | 11% | | 43% |
| Company E | * | | 10% |
* less than 10%
| | | As of August 31, |
| | | 2014 | | 2013 | | 2012 |
| Company A | | 37% | | 24% | | 35% |
| Company B | | * | | 23% | | 30% |
| Company C | | * | | 12% | | * |
| | | | | | | |
| * less than 10% | | | | | | |
Lease Operating Expenses: Costs incurred to operate and maintain wells and related equipment and facilities are expensed as incurred. Lease operating expenses (also referred to as production or lifting costs) include the costs of labor to operate the wells and related equipment and facilities, repairs and maintenance, materials, supplies, and fuel consumed, and supplies utilized in operating the wells and related equipment and facilities, property taxes, and insurance applicable to proved properties and wells and related equipment and facilities.
Stock-Based Compensation: The Company recognizes all equity-based compensation as stock-based compensation expense based on the fair value of the compensation measured at the grant date,date. For stock options, fair value is calculated using the Black-Scholes-Merton option pricing model. For stock bonus awards and restricted stock units, fair value is the closing stock price for the Company's common stock on the grant date. For performance-vested stock units, fair value is calculated using a Monte Carlo simulation. The expensecompensation is recognized over the vesting period of the grant. See Note 11 below13 for additional information.
Income Tax: Income taxes are computed using the asset and liability method. Accordingly, deferred tax assets and liabilities are recognized for the future tax consequences attributable to differences between the financial statement carrying amounts of existing assets and liabilities and their respective tax bases as well as the effect of net operating losses, tax credits, and tax credit carry-forwards.carryforwards. Deferred tax assets and liabilities are measured using enacted tax rates expected to apply to taxable income in the year in which the differences are expected to be recovered or settled. The effect on deferred tax assets and liabilities of a change in income tax rates is recognized in the results of operations in the period that includes the enactment date.
No significant uncertain tax positions were identified as of any date on or before AugustDecember 31, 2014.2017. The Company’s policy is to recognize interest and penalties related to uncertain tax benefits in income tax expense. As of AugustDecember 31, 2014,2017, the Company has not recognized any interest or penalties related to uncertain tax benefits. See Note 1215 for further information.
Financial Instruments: The Company considers cash in banks, deposits in transit, and highly liquid debt instruments purchased with original maturities of less than three months to be cash and cash equivalents. A substantial portion of the Company’s financial instruments consist of cash and cash equivalents, short-term investments, accounts receivable, trade accounts payable, accrued expenses, and obligations under the revolving line of credit facility, all of which are considered to be representative of their fair value due to the short-term and highly liquid nature of these instruments.
Financial instruments, whether measured on a recurring or non-recurring basis, are recorded at fair value. A fair value hierarchy, established by the Financial Accounting Standards Board (“FASB”), prioritizes the inputs used to measure fair value. The hierarchy gives the highest priority to unadjusted quoted prices in active markets for identical assets or liabilities (Level 1 measurements) and the lowest priority to unobservable inputs (Level 3 measurements).
As discussed in Note 5, the Company incurred asset retirement obligations during the periods presented, the value of which was determined using unobservable pricing inputs (or Level 3 inputs). The Company uses the income valuation technique to estimate the fair value of the obligation using several assumptions and judgments about the ultimate settlement amounts, inflation factors, credit adjusted discount rates, and timing of settlement.
Commodity Derivative Instruments: The Company has entered into commodity derivative instruments, primarily utilizing swaps, puts, or “no premium” collars, to reduce the effect of price changes on a portion of ourits future oil and natural gas production. The Company’s commodity derivative instruments are measured at fair value and are included in the accompanying consolidated balance sheets as commodity derivative assets and liabilities. Unrealized gains and losses are recorded based on the changes in the fair values of the derivative instruments. Both the unrealized and realizedRealized gains and losses resulting from the contract settlement of derivatives are recorded in the commodity derivative gain (loss) line on the consolidated statement of operations. We value ourThe Company values its derivative instruments by obtaining independent market quotes as well as using industry standard models that consider various assumptions, including quoted forward prices for commodities, risk freerisk-free interest rates, and estimated volatility factors as well as other relevant economic measures. We compare the valuations calculated by us to valuations provided by the counterparties to assess the reasonableness of each valuation. The discount rate used in the fair values of these instruments includes a measure of nonperformance risk by the counterparty or us,the Company, as appropriate. For additional discussion, please refer to Note 7 – Commodity Derivative Instruments.
Earnings Per Share Amounts:Transportation Commitment Charge: Basic earnings per share includes no dilution and is computed by dividing net income The Company has entered into several agreements that require us to deliver minimum amounts of oil to a third party marketer and/or loss byother counterparties that transport oil via pipelines. See Note 16 for
additional information. Pursuant to these agreements, we must deliver specific amounts, either from our own production or from oil that we acquire. If we are unable to fulfill all of our contractual delivery obligations from our own production, we may be required to pay penalties or damages pursuant to these agreements, or we may have to purchase oil from third parties to fulfill our delivery obligations. When we incur penalties of this type, we recognize the weighted-average number of shares outstanding during the period. Diluted earnings per share reflect the potential dilution of securities that could shareexpense as a transportation commitment charge in the earningsconsolidated statement of the Company. The number of potential shares outstanding relating to stock options and warrants is computed using the treasury stock method. Potentially dilutive securities outstanding are not included in the calculation when such securities would have an anti-dilutive effect on earnings per share.
The following table sets forth the share calculation of diluted earnings per share.
| | | For the Years Ended August 31, | |
| | | 2014 | | | 2013 | | | 2012 | |
| Weighted-average shares outstanding - basic | | | 76,214,737 | | | | 57,089,362 | | | | 46,587,558 | |
| Potentially dilutive common shares from: | | | | | | | | | |
| Stock options | | | 479,222 | | | | 1,881,682 | | | | 1,380,861 | |
| Warrants | | | 1,114,095 | | | | 117,717 | | | | 391,486 | |
| Weighted-average shares outstanding - diluted | | | 77,808,054 | | | | 59,088,761 | | | | 48,359,905 | |
The following potentially dilutive securities outstanding for the fiscal years presented were not included in the respective earnings per share calculation above, as such securities had an anti-dilutive effect on earnings per share:
| | | For the Years Ended August 31, | |
| | | 2014 | | | 2013 | | | 2012 | |
| Potentially dilutive common shares from: | | | | | | | |
| Stock options | | | 533,000 | | | | 670,000 | | | | 2,495,000 | |
| Warrants | | | - | | | | 8,500,000 | | | | 14,098,000 | |
| Total | | | 533,000 | | | | 9,170,000 | | | | 16,593,000 | |
RecentIn November 2016, the FASB issued Accounting Pronouncements:Standards Update ("ASU") 2016-18, "Restricted Cash" ("ASU 2016-18"), which amends ASC 230 to add or clarify guidance on the classification and presentation of restricted cash in the statement of cash flows. Key requirements of ASU 2016-18 are as follows: 1) An entity should include in its cash and cash equivalent balances in the statement of cash flows those amounts that are deemed to be restricted cash and restricted cash equivalents. ASU 2016-18 does not define the terms “restricted cash” and “restricted cash equivalents” but states that an entity should continue to provide appropriate disclosures about its accounting policies pertaining to restricted cash in accordance with other GAAP. ASU 2016-18 also states that any change in accounting policy will need to be assessed under ASC 250; 2) A reconciliation between the statement of financial position and the statement of cash flows must be disclosed when the statement of financial position includes more than one line item for cash, cash equivalents, restricted cash, and restricted cash equivalents; 3) Changes in restricted cash and restricted cash equivalents that result from transfers between cash, cash equivalents, and restricted cash and restricted cash equivalents should not be presented as cash flow activities in the statement of cash flows; and 4) An entity with a material balance of amounts generally described as restricted cash and restricted cash equivalents must disclose information about the nature of the restrictions. We adopted this pronouncement effective October 1, 2017 and have applied it retrospectively. Upon adoption, we removed cash held in escrow of $18.2 million from the statement of cash flows for the year ended December 31, 2016. This change resulted in a decrease to net cash used in investing activities of $18.2 million. Additionally, we removed cash held in escrow of $18.2 million from the statement of cash flows for the year ended December 31, 2017. This change resulted in an increase to net cash used in investing activities of $18.2 million. The adoption of this standard did not impact cash flows for the 4-months ended December 31, 2015 nor the year ended August 31, 2015. We have included a tabular reconciliation of cash, cash equivalents, and restricted cash in the discussion of "Cash Held in Escrow" above.
In March 2016, the FASB issued ASU 2016-09, “Improvements to Employee Share-Based Payment Accounting” (“ASU 2016-09”), which intends to improve the accounting for share-based payment transactions. ASU 2016-09 changes several aspects of the accounting for share-based payment award transactions, including: (1) Accounting and Cash Flow Classification for Excess Tax Benefits and Deficiencies, (2) Forfeitures, and (3) Tax Withholding Requirements and Cash Flow Classification. ASU 2016-09 is effective for public businesses for fiscal years, and interim periods within those fiscal years, beginning after December 15, 2016, with early adoption permitted. We adopted this pronouncement effective January 1, 2017. Upon adoption of this standard, we no longer estimate the total number of awards for which the requisite service period will not be rendered, and effective January 1, 2017, we began accounting for forfeitures when they occur. We applied this accounting change on a modified retrospective basis with a cumulative-effect adjustment of $0.1 million to retained earnings as of the date of adoption. The adoption of the other provisions did not materially impact the consolidated financial statements.
In January 2017, the FASB issued ASU 2017-04, "Simplifying the Test for Goodwill Impairment" ("ASU 2017-04"), which removes the requirement to compare the implied fair value of goodwill with its carrying amount as part of step 2 of the goodwill impairment test. We adopted ASU 2017-04 on January 1, 2017, and it will be applied for any interim or annual goodwill impairment tests subsequent to that date. The adoption of this guidance did not impact the consolidated financial statements.
Recently Issued Accounting Pronouncements: We evaluate the pronouncements of various authoritative accounting organizations to determine the impact of new accounting pronouncements on US GAAP and the impact on us.
In May 2014,February 2016, the Financial Accounting Standards Board (“FASB”)FASB issued Accounting Standards Update 2014-09 (“ASU 2014-09”2016-02, "Leases (Topic 842)" ("ASU 2016-02"), which establishes a comprehensive new revenue recognitionlease standard designed to depictincrease transparency and comparability among organizations by recognizing lease assets and lease liabilities on the transferbalance sheet and disclosing key information about leasing arrangements. In transition, lessees and lessors are required to recognize and measure leases at the beginning of goods or services tothe earliest period presented using a customer in an amount that reflects the consideration the entity expects to receive in exchange for those goods or services. In doing so, companies may need to use more judgment and make more estimates than under current revenue recognition guidance. The ASU allows for the use of either the full or modified retrospective transition method, andapproach. The modified retrospective approach includes a number of optional practical expedients that entities may elect to apply. An entity that elects to apply the standardpractical expedients will, bein effect, continue to account for leases that commence before the effective date in accordance with previous US GAAP. ASU 2016-02 is effective for us in the first quarter of ourpublic businesses for fiscal year 2018;years, and interim periods within those fiscal years, beginning after December 15, 2018, with early adoption is not permitted. The Company isWe are currently evaluating which transition approach to use and the impact of the adoption of this standard on itsour consolidated financial statements.
In December 2011,May 2014, the FASB issued Accounting Standards Update 2011-11, “Disclosures about Offsetting AssetsASU 2014-09, Revenue from Contracts with Customers. The objective of this update is to clarify the principles for recognizing revenue and Liabilities” (“to develop a common revenue standard for U.S. GAAP and International
Financial Reporting Standards. The FASB subsequently issued various ASUs, which deferred the effective date of ASU 2011-11”),2014-09 and issued Accounting Standards Update 2013-01, “Clarifying the Scope of Disclosures about Offsetting Assetsprovided additional implementation guidance. ASU 2014-09 and Liabilities” (“ASU 2013-01”) in January 2013. These updates require disclosures about the nature of an entity’s rights of offset and related arrangements associated with its recognized derivative contracts. The new disclosure requirements, whichamendments are effective for interim and annual reporting periods beginning on or after December 15, 2017, and interim periods within those annual periods. The Company will adopt these ASUs with an effective date of January 1, 2013, were implemented by2018, using the modified retrospective method. While we have not yet completed all aspects of the adoption of the standard, based on our current assessment of contracts with customers, we do not believe there will be any impact to the timing of our revenue recognition or our operating income (loss), net income (loss), and cash flows. The Company on September 1, 2013. Theis in the process of evaluating changes, if any, to accounting policies and internal control procedures along with continuing to assess additional disclosures which may be required upon implementation of ASU 2011-11 and ASU 2013-01 had no impact on the Company’s financial position or results of operations. See Note 7 for the Company’s derivative disclosures.these ASUs.
There were various updates recently issued by the Financial Accounting Standards Board,FASB, most of which represented technical corrections to the accounting literature or application to specific industries and are not expected to a have a material impact on the Company's consolidatedour reported financial position, results of operations, or cash flows.
The capitalized costs related to the Company’s oil and gas producing activities were as follows (in thousands):
| | | As of August 31, | |
| | | 2014 | | | 2013 | |
| Oil and gas properties, full cost method: | | | | | | |
| Unevaluated costs, not subject to amortization: | | | | |
| Lease acquisition and other costs | | $ | 41,531 | | | $ | 38,826 | |
| Wells in progress | | | 53,747 | | | | 25,889 | |
| Subtotal, unevaluated costs | | | 95,278 | | | | 64,715 | |
| | | | | | | | | |
| Evaluated costs: | | | | | | | | |
| Producing and non-producing | | | 329,926 | | | | 155,755 | |
| Total capitalized costs | | | 425,204 | | | | 220,470 | |
| Less, accumulated depletion | | | (54,908 | ) | | | (22,776 | ) |
| Oil and gas properties, net | | | 370,296 | | | | 197,694 | |
| | | | | | | | | |
| Land | | | 3,898 | | | | 44 | |
| Other property and equipment | | | 5,961 | | | | 500 | |
| Less, accumulated depreciation | | | (755 | ) | | | (273 | ) |
| Other property and equipment, net | | | 9,104 | | | | 271 | |
| | | | | | | | | |
| Total property and equipment, net | | $ | 379,400 | | | $ | 197,965 | |
|
| | | | | | | |
| | As of December 31, |
| | 2017 | | 2016 |
| Oil and gas properties, full cost method: | | | |
| Costs of proved properties: | | | |
| Producing and non-producing | $ | 1,629,789 |
| | $ | 969,239 |
|
| Less, accumulated depletion and full cost ceiling impairments | (659,205 | ) | | (545,157 | ) |
| Subtotal, proved properties, net | 970,584 |
| | 424,082 |
|
| | | | |
| Costs of wells in progress | 106,269 |
| | 81,780 |
|
| | | | |
| Costs of unproved properties and land, not subject to depletion: | | | |
| Lease acquisition and other costs | 786,469 |
| | 392,561 |
|
| Land | 7,200 |
| | 5,986 |
|
| Subtotal, unproved properties and land | 793,669 |
| | 398,547 |
|
| | | | |
| Costs of other property and equipment: | | | |
| Other property and equipment | 8,134 |
| | 5,063 |
|
| Less, accumulated depreciation | (2,080 | ) | | (736 | ) |
| Subtotal, other property and equipment, net | 6,054 |
| | 4,327 |
|
| | | | |
| Total property and equipment, net | $ | 1,876,576 |
| | $ | 908,736 |
|
Periodically, theThe Company periodically reviews its unevaluatedoil and gas properties to determine if the carrying value of such assets exceeds estimated fair value. The reviews as ofFor proved producing and non-producing properties, the Company performs a ceiling test each quarter to determine whether there has been an impairment to its capitalized costs. At December 31, 2017, the calculated value of the fiscalceiling limitation exceeded the carrying value of our oil and gas properties subject to the test, and no impairment was necessary. During the year ends presented,ended December 31, 2016, the four months ended December 31, 2015, and the year ended August 31, 2015, the Company's ceiling tests resulted in total impairments of $215.2 million, $125.2 million, and $16.0 million, respectively. No impairments were recognized for the comparable 2017 period.
The costs of unproved properties are withheld from the depletion base until such time as the properties are either developed or abandoned. Unproved properties are reviewed on an annual basis, or more frequently if necessary, for impairment and, if impaired, are reclassified to proved properties and included in the depletion base. During the year ended December 31, 2017, these reviews indicated that the estimated fair valuesvalue of such assets exceeded the carrying values, thus revealingvalues. Therefore, no impairment. Theimpairment was necessary as December 31, 2017. However, during the years ended December 31, 2016 and August 31, 2015, the Company recorded impairments of $18.9 million and $15.4 million, respectively, related to the fair value of its unproved properties. No such impairments were recognized during the four months ended December 31, 2015.
Capitalized Overhead: A portion of the Company’s overhead expenses are directly attributable to acquisition, exploration, and development activities. Under the full cost ceiling test, explainedmethod of accounting, these expenditures, in Note 1, and, as performed as of each of the fiscal year ends presented, similarly revealed no impairment of oil and gas assets.amounts shown in the table below, were capitalized in the full cost pool (in thousands):
|
| | | | | | | | | | | | | | | |
| | Year Ended December 31, | | Four Months Ended December 31, 2015 | | Year Ended August 31, 2015 |
| | 2017 | | 2016 | | |
| Capitalized overhead | $ | 10,293 |
| | $ | 7,074 |
| | $ | 1,091 |
| | $ | 2,049 |
|
Costs Incurred: Costs incurred in oil and gas property acquisition, exploration, and development activities for the fiscal yearsperiods presented were (in thousands):
| | | For the Years Ended August 31, | |
| | | 2014 | | | 2013 | | | 2012 | |
| Acquisition of property: | | | | | | | | | |
| Unproved | | $ | 15,002 | | | $ | 12,295 | | | $ | 9,145 | |
| Proved | | | 33,795 | | | | 43,143 | | | | 459 | |
| Exploration costs | | | 43,089 | | | | - | | | | - | |
| Development costs | | | 111,238 | | | | 61,128 | | | | 39,739 | |
| Other property and equipment | | | 9,315 | | | | - | | | | - | |
| Asset retirement obligation | | | 1,610 | | | | 1,578 | | | | 300 | |
| Total costs incurred | | $ | 214,049 | | | $ | 118,144 | | | $ | 49,643 | |
|
| | | | | | | | | | | | | | | |
| | Year Ended December 31, |
| Four Months Ended December 31, 2015 | | Year Ended August 31, 2015 |
| | 2017 | | 2016 |
| |
| Acquisition of property: | | | |
| | | |
| Unproved | $ | 538,489 |
| | $ | 365,548 |
|
| $ | 38,779 |
| | $ | 32,701 |
|
| Proved | 139,154 |
| | 152,363 |
|
| 51,085 |
| | 51,400 |
|
| Exploration costs | — |
| | 43,154 |
|
| 23,697 |
| | 146,892 |
|
| Development costs | 460,875 |
| | 87,782 |
|
| 17,742 |
| | 4,957 |
|
| Other property and equipment, and land | 4,397 |
| | 7,506 |
|
| 395 |
| | 741 |
|
| Capitalized interest, capitalized G&A, and other | 26,677 |
| | 18,744 |
|
| 4,415 |
| | 7,051 |
|
| Total costs incurred | $ | 1,169,592 |
| | $ | 675,097 |
|
| $ | 136,113 |
| | $ | 243,742 |
|
Capitalized Costs Excluded from Amortization:Depletion: The following table summarizes costs related to unevaluatedunproved properties that have been excluded from amounts subject to depletion depreciation, and amortization at AugustDecember 31, 20142017 (in thousands). :
|
| | | | | | | | | | | | | | | | | | | | | | | |
| | Period Incurred | | |
| | Year Ended December 31, | | Four Months Ended December 31, 2015 | | Year Ended August 31, | | Total as of December 31, 2017 |
| | 2017 | | 2016 | | | 2015 | | 2014 and Prior | |
| Unproved leasehold acquisition costs | $ | 537,470 |
| | $ | 223,907 |
| | $ | 23,068 |
| | $ | 456 |
| | $ | 1,568 |
| | $ | 786,469 |
|
| Unproved development costs | 26,056 |
| | — |
| | — |
| | — |
| | — |
| | 26,056 |
|
| Total unevaluated costs | $ | 563,526 |
| | $ | 223,907 |
| | $ | 23,068 |
| | $ | 456 |
| | $ | 1,568 |
| | $ | 812,525 |
|
There were no individually significant properties or significant development projects included in the Company’s unevaluatedunproved property balance. The Company regularly evaluates these costs to determine whether impairment has occurred.occurred or proved reserves have been established. The majority of these costs are expected to be evaluated and included in the amortizationdepletion base within three years.
| | | Period Incurred | | | Total as of | |
| | | | | | | | | | | | 2011 | | | August 31, | |
| | | 2014 | | | 2013 | | | 2012 | | | and prior | | | 2014 | |
| Unproved leasehold acquisition costs | | $ | 15,002 | | | $ | 11,021 | | | $ | 6,159 | | | $ | 9,349 | | | $ | 41,531 | |
| Unevaluated development costs | | | 53,747 | | | | - | | | | - | | | | - | | | $ | 53,747 | |
| Total unevaluated costs | | $ | 68,749 | | | $ | 11,021 | | | $ | 6,159 | | | $ | 9,349 | | | $ | 95,278 | |
| |
| 3. | Acquisitions and Divestitures |
The Company seeks to acquire developed and undeveloped oil and gas properties in the core Wattenberg Field to provide additional mineral acres upon which the Company can drill wells and produce hydrocarbons.
December 2017 Acquisition
On September 16, 2013,
In November 2017, the Company entered into an agreement ("GCII Agreement") to purchase a definitivetotal of approximately 30,200 net acres located in an area known as the Greeley-Crescent development area in Weld County Colorado, primarily south of the city of Greeley, for $568 million ("GCII Acquisition"). Estimated net daily production from the acquired non-operated properties was approximately 2,500 BOE at the time we entered into the agreement. On December 15, 2017, the Company closed on the portion of the assets comprised of the undeveloped lands and non-operated production. The effective date of this part of the transaction was November 1, 2017, and the purchase price was $569.5 million, comprised of $568.1 million in cash and the assumption of certain liabilities. The purchase price has preliminarily been allocated as $59.9 million to proved oil and gas
properties and $509.6 million to unproved oil and gas properties, pending the final closing. The second closing will cover the operated producing properties and is expected to be completed in 2018. For the second closing, the effective date will be the first day of the calendar month in which the closing for such properties occurs. The second closing is subject to certain closing conditions including the receipt of regulatory approval. Accordingly, the second closing of the transaction may not close in the expected time frame or at all.
The first closing was accounted for as an asset acquisition under ASC 805, Business Combinations, which requires the acquired assets and liabilities to be recorded at cost on the acquisition date of December 15, 2017.
September 2017 Acquisition
In September 2017, we completed the second closing of the GC Acquisition (as defined in "-June 2016 Acquisition" below). At the second closing, we acquired 335 operated vertical wells and 7 operated horizontal wells. The effective date of the second closing was April 1, 2016 for the horizontal wells acquired and September 1, 2017 for the vertical wells acquired. At the second closing, the escrow balance of $18.2 million was released and $11.4 million of that amount was returned to the Company. The total purchase price for the second closing was $30.3 million, composed of cash of $6.3 million and assumed liabilities of $24.0 million. The assumed liabilities included $20.9 million for asset retirement obligations. The entire purchase price has been allocated to proved oil and gas properties.
August 2017 Acquisition and Swap
In August 2017, we also entered into an agreement with another party to trade approximately 3,200 net acres of the Company's non-contiguous acreage for approximately 3,200 net acres within the Company's core operating area. This transaction closed in the fourth quarter of 2017. We also acquired approximately 1,000 net acres of developed and undeveloped leasehold and mineral interests, along with the associated production, for a total purchase price of $22.6 million, composed of cash and assumed liabilities. The purchase price for the acquisition has preliminarily been allocated as $6.7 million to proved oil and gas properties and $15.9 million to unproved oil and gas properties, pending the final closing.
March 2017 Acquisition
In March 2017, we closed an acquisition comprised primarily of developed and undeveloped oil and gas leasehold interests for a total purchase price of $25.1 million, composed of cash and assumed liabilities. The purchase price has been allocated as $15.3 million to proved oil and gas properties, $9.4 million to unproved oil and gas properties, and $0.4 million to other assets and land.
Acquisitions in the Second Half of 2016
In August and October 2016, the Company completed four acquisitions of certain assets for a total purchase price of $13.5 million composed of cash, forgiven receivables, and assumed liabilities. The acquired properties were comprised primarily of undeveloped oil and gas leasehold interests and additional interests in developed properties operated by the Company.
June 2016 Acquisition
In May 2016, we entered into a purchase and sale agreement with Trilogy Resources, LLC (“Trilogy”),pursuant to which we agreed to acquire a total of approximately 72,000 gross (33,100 net) acres in an area referred to as the Greeley-Crescent project in the Wattenberg Field for its interests in 21 producing$505 million (the "GC Acquisition").
In June 2016, the Company closed on the portion of the assets comprised of undeveloped oil and gas wellsleasehold interests and approximately 800 net mineral acres (the “Trilogy Assets”). On November 12, 2013, the Company closednon-operated production. The effective date of this part of the transaction for a combinationwas April 1, 2016. As discussed above in "- September 2017 Acquisition" above,we closed on the second part of cash and stock. Trilogy received 301,339 shares ofthis transaction covering the Company’s common stock valued at $2.9 million and cash consideration of approximately $16.0 million. No material transaction costs were incurredoperated producing properties in connection with this acquisition.September 2017.
The acquisitionfirst closing on June 14, 2016 was for a total purchase price of $486.4 million, net of customary closing adjustments. The purchase price was composed of $485.1 million in cash plus the assumption of certain liabilities. The first closing encompassed approximately 33,100 net acres of oil and gas leasehold interests and related assets and net production of approximately 800 BOED at the time of entering into the GC Agreement.
The first closing was accounted for using the acquisition method under ASC 805, Business Combinations, which requires the acquired assets and liabilities to be recorded at fair values as of the acquisition date of November 12, 2013.June 14, 2016. Transaction costs of
$0.5 million related to the acquisition were expensed as incurred. The following table summarizes the preliminary purchase price and the preliminary estimatedfinal fair values of assets acquired and liabilities assumed (in thousands):
|
| | | |
| Purchase Price | June 14, 2016 |
| Consideration given: | |
| Cash | $ | 485,141 |
|
| Net liabilities assumed, including asset retirement obligations | 1,273 |
|
| Total consideration given | $ | 486,414 |
|
| | |
Allocation of Purchase Price (1) | |
| Proved oil and gas properties | $ | 132,903 |
|
| Unproved oil and gas properties | 353,511 |
|
| Total fair value of assets acquired | $ | 486,414 |
|
(1) Oil and is subject to revision as the Company continues to evaluate thegas properties were measured primarily using an income approach. The fair value of the acquisition (in thousands):
| Preliminary Purchase Price | | November 12, 2013 | |
| Consideration Given | | | |
| Cash | | $ | 16,008 | |
| Synergy Resources Corp. Common Stock * | | | 2,896 | |
| | | | | |
| Total consideration given | | $ | 18,904 | |
| | | | | |
| Preliminary Allocation of Purchase Price | | | | |
| Proved oil and gas properties | | $ | 19,374 | |
| Total fair value of oil and gas properties acquired | | | 19,374 | |
| | | | | |
| Working capital | | $ | (119 | ) |
| Asset retirement obligation | | | (351 | ) |
| | | | | |
| Fair value of net assets acquired | | $ | 18,904 | |
| | | | | |
| Working capital acquired was estimated as follows: | | | | |
| Accounts receivable | | | 500 | |
| Accrued liabilities and expenses | | | (619 | ) |
| | | | | |
| Total working capital | | $ | (119 | ) |
| | | | | |
* The fair value of the consideration attributed to the Common Stock under ASC 805 was based on the Company's closing stock price on the measurement date of November 12, 2013. (301,339 shares at $9.61 per share). | |
On August 27, 2013, the Company entered into a definitive purchase and sale agreement (the “Agreement”), with Apollo Operating, LLC (“Apollo”), for its interests in 38 producing oil and gas wells, partial interest (25%) in one water disposal well (the “Disposal Well”), and approximately 3,639 gross (1,000 net) mineral acres (the “Apollo Operating Assets”). On November 13, 2013, the Company closed the transaction for a combination of cash and stock. Apollo received cash consideration of approximately $11.0 million and 550,518 shares of the Company’s common stock valued at $5.2 million. Following its acquisition of the Apollo Operating Assets, the Company acquired all other remaining interests in the Disposal Well (the “Related Interests”) through several transactions with the individual owners of such interests. The Company acquired the Related Interests for approximately $3.7 million in cash consideration and 20,626 shares of the Company’s common stock, valued at $0.2 million. No material transaction costs were incurred in connection with this acquisition.
The acquisition was accounted for using the acquisition method under ASC 805, Business Combinations, which requires the acquired assets and liabilities to be recorded at fair values as of the acquisition date of November 13, 2013. The following table summarizes the preliminary purchase price and the preliminary estimated values of assets acquired and liabilities assumed and is subject to revision as the Company continues to evaluate the fair value of the acquisition (in thousands):
| Preliminary Purchase Price | | November 13, 2013 | |
| Consideration Given | | | |
| Cash | | $ | 14,679 | |
| Synergy Resources Corp. Common Stock * | | | 5,432 | |
| | | | | |
| Total consideration given | | $ | 20,111 | |
| | | | | |
| Preliminary Allocation of Purchase Price | | | | |
| Proved oil and gas properties | | $ | 16,009 | |
| Disposal Well | | $ | 5,220 | |
| Total fair value of oil and gas properties acquired | | | 21,229 | |
| | | | | |
| Working capital | | $ | (883 | ) |
| Asset retirement obligation | | | (235 | ) |
| | | | | |
| Fair value of net assets acquired | | $ | 20,111 | |
| | | | | |
| Working capital acquired was estimated as follows: | | | | |
| Accounts receivable | | | 380 | |
| Accrued liabilities and expenses | | | (1,263 | ) |
| | | | | |
| Total working capital | | $ | (883 | ) |
| | | | | |
| * The fair value of the consideration attributed to the Common Stock under ASC 805 was based on the Company's closing stock prices on the measurement dates (including 550,518 shares at $9.49 per share on November 13, 2013 plus 20,626 shares at various measurement dates at an average per share price of $10.08). | |
| | | | | |
.
The Company believes both acquisitions will be accretive to cash flow and earnings per share. The acquisitions qualify as a business combination, and as such, the Company estimated the fair value of each property as of the acquisition date (the date on which the Company obtained control of the properties). Fair value measurements utilize assumptions of market participants. To determine the fair value of the oil and gas assets were based, in part, on significant inputs not observable in the Company used an income approachmarket and thus represent a Level 3 measurement. The significant inputs included assumed future production profiles, commodity prices (mainly based on observable market inputs), a discounted cash flow model and made marketdiscount rate of 11.5%, and assumptions as to future commodity prices, projections of estimated quantities of oil and natural gas reserves, expectations forregarding the timing and amount of future development and operating costs, projectionscosts.
For the year ended December 31, 2017, the results of future rates of production, expected recovery rates and risk adjusted discount rates. The Company determined the appropriate discount rates used for the discounted cash flow analyses by using a weighted average cost of capital from a market participant perspective plus property-specific risk premiums for the assets acquired. The Company estimated property-specific risk premiums taking into consideration that the related reserves are primarily natural gas, among other items. Given the unobservable natureoperations of the significant inputs, they are deemed to be Level 3acquired assets, representing approximately $5.4 million of revenue and $4.7 million of operating income, have been included in the fair value hierarchy. The working capital assets acquired were determined to be at fair value due to their short-term nature.
Pro Forma Financial InformationCompany's consolidated statements of operations.
As stated above, on November 12 and 13, 2013,The following table presents the Company completed acquisitions of oil and gas properties from Trilogy Resources, LLC and Apollo Operating, LLC. Below are theunaudited pro forma combined results of operations for the twelve monthsyear ended AugustDecember 31, 2014 and 20132016 as if the acquisitionsfirst closing had occurred on September 1, 2012 (in thousands).
2014. The unaudited pro forma results reflect significant pro forma adjustments related to funding the acquisition through the issuance of common stock,cash, additional depreciation expense, costs directly attributable to the acquisitionsacquisition, and operating costs incurred as a result of the Trilogy and Apollo acquisitions.assets acquired. The pro forma results do not include any cost savings or other synergies that may result from the acquisition or any estimated costs that have been or will be incurred by the Company to integrate the properties acquired. The pro forma results are not necessarily indicative of what actually would have occurred if the acquisition had been completed as of the beginning of the period, nor are they necessarily indicative of future results.
| | | For the years ended August 31, | |
| | | (Unaudited) | |
| | | 2014 | | | 2013 | |
| | | | | | | |
| Oil and Gas Revenues | | $ | 106,584 | | | $ | 55,633 | |
| | | | | | | | | |
| Net income | | $ | 29,681 | | | $ | 13,191 | |
| | | | | | | | | |
| Earnings per common share | | | | | | | | |
| Basic | | $ | 0.39 | | | $ | 0.23 | |
| Diluted | | $ | 0.38 | | | $ | 0.22 | |
On October 23, 2012, |
| | | |
| (in thousands) | Year Ended December 31, 2016 |
| Oil, natural gas, and NGL revenues | $ | 110,635 |
|
| Net loss | $ | (218,578 | ) |
| | |
| Net loss per common share | |
| Basic | $ | (1.10 | ) |
| Diluted | $ | (1.10 | ) |
February 2016 Acquisition
In February 2016, the Company entered into a definitive purchase and sale agreement (“completed the Agreement”), with Orr Energy, LLC (“Orr”), for its interests in 36 producingacquisition of undeveloped oil and gas wells and approximately 3,933 gross (3,196 net) mineral acres (the “Orr Assets”). On December 5, 2012, the Company closed the transactionleasehold interests for a combinationtotal purchase price of cash and stock. Orr received 3,128,422 shares of the Company’s common stock valued at $13.5$10.0 million. The purchase price has been allocated as $8.6 million and cash consideration of approximately $29.0 million. Transaction costs related to the acquisition were approximately $109,000, all of which were recorded in the statement of operations within the general and administrative expenses line item for the twelve months ended August 31, 2013. No material costs were incurred for the issuance of the shares of common stock.
Pro Forma Financial Information
As stated above, on December 5, 2012, the Company completed an acquisition ofproved oil and gas properties from Orr Energy. Below areand $1.4 million to unproved oil and gas properties. See Note 9 for further details as to the combined resultspreparation of operations for the twelve months ended August 31, 2013 and 2012 as if the acquisition had occurred on September 1, 2011 (in thousands, except per share data).these significant estimates.
The unaudited pro forma results reflect significant pro forma adjustments related to fundingDivestitures
During the acquisition through the issuanceyear ended December 31, 2017, we completed divestitures of common stock, additional depreciation expense, costs directly attributable to the acquisition and costs incurred as a resultapproximately 16,000 net undeveloped acres, along with associated production, outside of the Orr Energy acquisition. The pro forma results do not include any cost savings or other synergies that may result fromCompany's core development area for approximately $91.6 million in cash and the acquisition or any estimated costs that have been or will be incurredassumption by the buyers of $5.2 million in asset retirement obligations and $22.2 million in other liabilities.
During the year ended December 31, 2016, the Company to integratecompleted divestitures of approximately 3,700 net undeveloped acres and 107 vertical wells primarily in Adams County, Colorado for total consideration of approximately $24.7 million in cash and the properties acquired.assumption by the buyers of $0.5 million in liabilities. The pro forma results are not necessarily indicativedivested assets had associated production of what actually would have occurred if the acquisition had been completed as of the beginning of the period, nor are they necessarily indicative of future results.approximately 200 BOED.
In accordance with full cost accounting guidelines, the net proceeds from these divestitures were credited to the full cost pool.
| |
| 4. | Depletion, depreciation, and amortization (“DDA”accretion ("DD&A") |
Depletion, depreciation and amortizationDD&A consisted of the following (in thousands):
| | | For the Years Ended August 31, | |
| | | 2014 | | | 2013 | | | 2012 | |
| Depletion | | $ | 32,132 | | | $ | 13,046 | | | $ | 5,838 | |
| Depreciation and amortization | | | 826 | | | | 290 | | | | 172 | |
| Total DDA Expense | | $ | 32,958 | | | $ | 13,336 | | | $ | 6,010 | |
|
| | | | | | | | | | | | | | | |
| | Year Ended December 31, | | Four Months Ended December 31, 2015 | | Year Ended August 31, 2015 |
| | 2017 | | 2016 | | |
| Depletion of oil and gas properties | $ | 109,287 |
| | $ | 45,193 |
| | $ | 18,371 |
| | $ | 65,158 |
|
| Depreciation and accretion | 3,022 |
| | 1,485 |
| | 405 |
| | 711 |
|
| Total DD&A Expense | $ | 112,309 |
| | $ | 46,678 |
| | $ | 18,776 |
| | $ | 65,869 |
|
Capitalized costs of evaluatedproved oil and gas properties are depleted quarterly using the units-of-production method based on a depletion rate, which is calculated by comparing production volumes for the quarter to estimated total reserves at the beginning of the quarter. For the year ended December 31, 2017, production of 12,481 MBOE represented 5.2% of estimated total proved reverses. For the year ended December 31, 2016, production of 4,271 MBOE represented 4.4% of estimated total proved reserves. For the four months ended December 31, 2015, production of 1,320 MBOE represented 2.0% of estimated total proved reserves.
For the year ended August 31, 2015, production of 3,194 MBOE represented 5.3% of estimated total proved reserves. DD&A expense was $9.00 per BOE and $10.93 per BOE for the years ended December 31, 2017 and 2016, respectively. DD&A expense was $14.22 per BOE and $20.62 per BOE for the four months ended December 31, 2015 and the year ended August 31, 2015, respectively.
| |
| 5. | Asset Retirement Obligations |
Upon completion or acquisition of a well, the Company recognizes obligations for its oil and natural gas operations for anticipated costs to remove and dispose of surface equipment, plug and abandon the wells, and restore the drilling sitessite to its original use. The estimated present value of such obligations is determined using several assumptions and judgments about the ultimate settlement amounts, inflation factors, credit adjustedcredit-adjusted discount rates, timing of settlement, and changes in regulations. Changes in estimates are reflected in the obligations as they occur. If the fair value of a recorded asset retirement obligation changes, a revision is recorded to both the asset retirement obligation and the capitalized asset retirement capitalized cost. For the purpose of determining the fair value of ARO incurred during the fiscal years presented, the Company used the following assumptions:
| | | | For the Years Ended August 31, |
| | | | 2014 | | 2013 |
| Inflation rate | | 3.90% | | 3.9 - 4.0% |
| Estimated asset life | | 25.0 - 39.0 years | | 24.0 - 40.0 years |
| Credit adjusted risk free interest rate | 8% | | 8.0 - 11.2% |
The following table summarizes the changes in asset retirement obligations associated with the Company's oil and gas properties (in thousands). The revisions recognized during 2013 were:
|
| | | | | | | |
| | Year Ended December 31, |
| | 2017 | | 2016 |
| | | | |
| Beginning asset retirement obligation | $ | 16,458 |
| | $ | 13,400 |
|
| Obligations incurred with development activities | 3,398 |
| | 773 |
|
| Obligations assumed with acquisitions | 24,696 |
| | 2,230 |
|
| Accretion expense | 1,554 |
| | 1,046 |
|
| Obligations discharged with asset retirements and divestitures | (14,332 | ) | | (4,739 | ) |
| Revisions in previous estimates | (152 | ) | | 3,748 |
|
| Ending asset retirement obligation | $ | 31,622 |
| | $ | 16,458 |
|
| Less, current portion | (3,246 | ) | | (2,683 | ) |
| Non-current portion | $ | 28,376 |
| | $ | 13,775 |
|
During the year ended December 31, 2017, the Company decreased its asset retirement obligation by $0.2 million due to a revision to the expected timing of the future cash flows. During the year ended December 31, 2016, the Company increased its asset retirement obligation by $3.7 million due primarily from increases into a revision to its assumption of the undiscounted abandonmentaverage cost estimates.to plug and abandon each well.
| | | As of August 31, | |
| | | 2014 | | | 2013 | |
| Beginning asset retirement obligation | | $ | 2,777 | | | $ | 1,027 | |
| Liabilities incurred | | | 1,024 | | | | 376 | |
| Liabilities assumed | | | 586 | | | | 240 | |
| Accretion expense | | | 343 | | | | 172 | |
| Revisions in previous estimates | | | - | | | | 962 | |
| | | $ | 4,730 | | | $ | 2,777 | |
| |
| 6. | Revolving Credit Facility |
The Company maintains a revolving credit facility (“LOC”(sometimes referred to as the "Revolver") with a bank syndicate.syndicate with a maturity date of December 15, 2019. The LOCRevolver is available for working capital requirements, capital expenditures, acquisitions, general corporate purposes, and to support letters of credit. As most recently amended on June 4, 2014,of December 31, 2017, the terms of the Revolver provide for $300up to $500 million in the maximum amount of borrowings, available to the Company, subject to a borrowing base limitation. Community Bankslimitation of Colorado acts as $400 million. As of December 31, 2017 and 2016, there was no outstanding principal balance. The Company has an outstanding letter of credit of approximately $0.5 million.
In September 2017, the administrative agentlenders under the Revolver completed their regular semi-annual redetermination of our borrowing base.The borrowing base was increased from $225 million to $400 million. The next semi-annual redetermination is scheduled for the bank syndicate with respect to the LOC. The credit facility expires on May 29, 2019.April 2018.
Interest under the LOC is payableRevolver accrues monthly and accrues at a variable rate, subject to a minimum rate of 2.5%.rate. For each borrowing, the Company designates its choice of reference rates, which can be either the Prime Rate plus a margin of 0.5% to 1.5%, or the London Interbank Offered Rate (LIBOR)LIBOR plus a margin of 1.75% to 2.75%.margin. The interest rate margin, as well as other bank fees, varies with utilization of the LOC.Revolver. The average annual interest rate for borrowings during the twelve monthsyears ended AugustDecember 31, 2014,2017 and 2016, was 2.7%. As of August 31, 2014, the interest rate on the outstanding balance was 2.5%3.4%, representing the minimum rate.and 2.6%, respectively.
Certain of the Company’s assets, including substantially all of the producing wells and developed properties,oil and gas leases, have been designated as collateral under the arrangement.Revolver. The borrowing commitment is subject to adjustment based upon a borrowing base calculation that includes the value of oil and gas reserves. The borrowing base limitation is subject to scheduled redeterminations on a semi-annual basis. InIf certain events and at the discretion ofoccur, or if the bank syndicate or the Company so elects, an unscheduled redetermination could be prepared. The most recent redetermination in June 2014 increased the borrowing base to $110 million from $90 million. As of August 31, 2014, based upon a borrowing base of $110 million and an outstanding principal balance of $37 million, the unused borrowing base available for future borrowing totaled approximately $73 million. The next scheduled redetermination will occur in November 2014 and will reflect the value of oil and gas reserves computed as of August 31, 2014.undertaken.
The arrangementRevolver contains covenants that, among other things, restrict the payment of dividends. In addition, the LOC generally requires andividends and limit our overall hedgecommodity derivative position that covers a rolling 24 months of estimated future production with a minimum position of no less than 45% andto a maximum position that varies over 5 years as a percentage of no more than 85% of hydrocarbon production.estimated proved developed producing or total proved reserves as projected in the semi-annual reserve report.
As amended on June 4, 2014,Furthermore, the arrangement revisedRevolver requires the Company to maintain compliance with certain financial and liquidity ratio compliance covenants. Under the amended requirements, on a quarterly basis,In particular, the Company must (a) not at any time,(a) permit its ratio of total funded debt as of such time to EBITDAX, as defined in the agreement, to be greater than or equal to 4.0 to 1.0; and1.0 as of the end of any fiscal quarter; or (b) not, as of the last day of theof any fiscal quarter permit its adjusted current ratio, as defined in the agreement, to be less than 1.0 to 1.0. As of AugustDecember 31, 2014 and during the year ended,2017, the most recent compliance date, the CompanyCompany was in compliance with allthese loan covenants.
covenants and expects to remain in compliance throughout the next 12-month period.
2025 Senior Notes
In November 2017, the Company issued $550 million aggregate principal amount of 6.25% Senior Notes (the "2025 Senior Notes") in a private placement to qualified institutional buyers. The maturity for the payment of principal is December 1, 2025. Interest on the 2025 Senior Notes accrues at 6.25% and began accruing on November 29, 2017. Interest is payable on June 1 and December 1 of each year, beginning on June 1, 2018. The 2025 Senior Notes were issued pursuant to an indenture dated as of November 29, 2017 and are guaranteed on a senior unsecured basis by the Company’s existing and future subsidiaries that incur or guarantee certain indebtedness, including indebtedness under the Revolver. The net proceeds from the sale of the 2025 Senior Notes were $538.1 million after deductions of $11.9 million for expenses and underwriting discounts and commissions. The associated expenses and underwriting discounts and commissions are amortized using the interest method at an effective interest rate of 6.6%. The net proceeds were used to fund the GCII Acquisition as discussed further in Note3, repay the 2021 Senior Notes, and pay off the outstanding Revolver balance.
At any time prior to December 1, 2020, the Company may redeem all or a part of the 2025 Senior Notes at a redemption price equal to 100% of the principal amount plus an Applicable Premium (as defined in the Indenture) plus accrued and unpaid interest. On and after December 1, 2020, the Company may redeem all or a part of the 2025 Senior Notes at a redemption price equal to a specified percentage of the principal amount of the redeemed notes (104.688% for 2020, 103.125% for 2021, 101.563% for 2022, and 100% for 2023 and thereafter, during the twelve-month period beginning on December 1 of each applicable year), plus accrued and unpaid interest. Additionally, prior to December 1, 2020, the Company can, on one or more occasions, redeem up to 35% of the principal amount of the 2025 Senior Notes with all or a portion of the net cash proceeds of one or more Equity Offerings (as defined in the Indenture) at a redemption price equal to 106.25% of the principal amount of the redeemed notes, plus accrued and unpaid interest, subject to certain conditions.
The Indenture contains covenants that restrict the Company’s ability and the ability of certain of its subsidiaries to, among other restrictions and limitations: (i) incur additional indebtedness; (ii) incur liens; (iii) pay dividends; (iv) consolidate, merge, or transfer all or substantially all of its or their assets; (v) engage in transactions with affiliates; or (vi) engage in certain restricted business activities. These covenants are subject to a number of exceptions and qualifications.
As of December 31, 2017, the most recent compliance date, the Company was in compliance with these loan covenants and expects to remain in compliance throughout the next 12-month period.
2021 Senior Notes
In June 2016, the Company issued $80 million aggregate principal amount of 9% Senior Notes due 2021 (the "2021 Senior Notes") in a private placement to qualified institutional buyers. The maturity for the payment of principal was June 13, 2021. Interest on the 2021 Senior Notes accrued at 9% and began accruing on June 14, 2016. Interest was payable on June 15 and December 15 of each year, beginning on December 15, 2016. The 2021 Senior Notes were issued pursuant to an indenture dated as of June 14, 2016 and are guaranteed on a senior unsecured basis by the Company’s existing and future subsidiaries that incur or guarantee certain indebtedness, including indebtedness under the revolving credit facility. The net proceeds from the sale of the 2021 Senior Notes were $75.2 million after deductions of $4.8 million for expenses and underwriting discounts and commissions.
In December 2017, the Company repurchased all $80 million aggregate principal amount of the 2021 Senior Notes. At the time of repurchase, the Company made a required make whole payment of $8.2 million and wrote-off deferred issuance costs of $3.6 million.
| |
| 8. | Commodity Derivative Instruments |
The Company has entered into commodity derivative instruments, as described below. The Company has utilized swaps or “no premium”Our commodity derivative instruments may include but are not limited to "collars," "swaps," and "put" positions. Our derivative strategy, including the volumes and commodities covered and the relevant strike prices, is based in part on our view of expected future market conditions and our analysis of well-level economic return potential. In addition, our use of derivative contracts is subject to stipulations set forth in the Revolver.
A "put" option gives the owner the right, but not the obligation, to sell the underlying commodity at a specified price (strike price) within a specific time period. Depending on market conditions, strike prices, and the value of the contracts, we may at times purchase put options, which require us to pay premiums at the time we purchase the contracts. These premiums represent the fair value of the purchased put as of the date of purchase.
A "call" option gives the owner the right, but not the obligation, to purchase the underlying commodity at a specified price (strike price) within a specific time period. Depending on market conditions, strike prices, and the value of the contracts, we may, at times, sell call options in conjunction with the purchase of put options to create "collars." We regularly utilize "no premium" (a.k.a. zero cost) collars to reducewhere the effectcost of the put is offset by the proceeds of the call. At settlement, we receive the difference between the published index price changes onand a portion of its future oil and gas production. A swap requires a payment to the counterpartyfloor price if the settlementindex price exceedsis below the strikefloor. We pay the difference between the ceiling price and the same counterparty is required to make a paymentindex price if the settlement price is less than the strike price. A collar requires a payment to the counterparty if the settlementindex price is above the contracted ceiling price and requires the counterparty to make a paymentprice. No amounts are paid or received if the settlementindex price is belowbetween the floor price. The objective ofand the Company’s use ofceiling price.
Additionally, at times, we may enter into swaps. Swaps are derivative financial instruments iscontracts which obligate two counterparties to achieve more predictable cash flows in an environment of volatile oil and gas prices and to manage its exposure toeffectively trade the underlying commodity at a set price risk. While the use of these derivative instruments limits the downside risk of adverse price movements, such use may also limit the Company’s ability to benefit from favorable price movements. over a specified term.
The Company may, from time to time, add incremental derivatives to hedgecover additional production, restructure existing derivative contracts, or enter into new transactions to modify the terms of current contracts in order to realize the current value of the Company’s existing positions. The Company does not enter into derivative contracts for speculative purposes.
The use of derivatives involves the risk that the counterparties to such instruments will be unable to meet the financial terms of such contracts. The Company’s derivative contracts are currently with three counterparties. Onefive counterparties and an exchange. Three of the counterparties is a participating lenderare lenders in the Company’s credit facility.Revolver. The Company has netting arrangements with the counterparties that provide for the offset of payables against receivables from separate derivative arrangements with the counterparty in the event of contract termination. The derivative contracts may be terminated by a non-defaulting party in the event of default by one of the parties to the agreement.
The Company’s commodity derivative instruments are measured at fair value and are included in the accompanying consolidated balance sheets as commodity derivative assets andor liabilities. Unrealized gains and losses are recorded based on the changes in the fair values of the derivative instruments. Both the unrealized and realized gains and losses resulting from contract settlement of derivatives are recorded in the commodity derivative line on theconsolidated statements of operations. The Company’s cash flow is only impacted when the actual settlements under commodity derivative contracts result in it making or receiving a payment to or from the Counterparty.counterparty. Actual cash settlements can occur at either the scheduled maturity date of the contract or at an earlier date if the contract is liquidated prior to its scheduled maturity. These settlements under the commodity derivative contracts are reflected as operating activities in the Company’s consolidated statements of cash flows.
The Company’s commodity derivative contracts as of AugustDecember 31, 20142017 are summarized below:
| Settlement Period | Derivative Instrument | | Average Volumes (BBls/MMBtu per month) | | | Average Fixed Price | | | Floor Price | | | Celling Price | |
| Crude Oil - NYMEX WTI | | | | | | | | | | | | | |
| Sep 1, 2014 - Dec 31, 2014 | Collar | | | 1,840 | | | | - | | | $ | 85.00 | | | $ | 98.50 | |
| Sep 1, 2014 - Dec 31, 2014 | Collar | | | 20,000 | | | | - | | | $ | 87.00 | | | $ | 96.25 | |
| Sep 1, 2014 - Dec 31, 2014 | Swap | | | 18,340 | | | $ | 94.50 | | | | - | | | | - | |
| | | | | | | | | | | | | | | | | | |
| Jan 1, 2015 - Jun 30, 2015 | Collar | | | 7,000 | | | | - | | | $ | 80.00 | | | $ | 92.50 | |
| Jan 1, 2015 - Jun 30, 2015 | Collar | | | 2,500 | | | | - | | | $ | 80.00 | | | $ | 95.75 | |
| Jul 1, 2015 - Dec 31, 2015 | Collar | | | 9,000 | | | | - | | | $ | 80.00 | | | $ | 92.25 | |
| Jan 1, 2015 - Dec 31, 2015 | Collar | | | 4,500 | | | | - | | | $ | 80.00 | | | $ | 99.40 | |
| Jan 1, 2015 - Dec 31, 2015 | Collar | | | 6,000 | | | | - | | | $ | 85.00 | | | $ | 101.30 | |
| | | | | | | | | | | | | | | | | | |
| Jan 1, 2016 - May 31, 2016 | Collar | | | 10,000 | | | | - | | | $ | 75.00 | | | $ | 96.00 | |
| Jan 1, 2016 - May 31, 2016 | Collar | | | 5,000 | | | | - | | | $ | 80.00 | | | $ | 100.75 | |
| Jun 1, 2016 - Aug 31, 2016 | Collar | | | 15,000 | | | | - | | | $ | 80.00 | | | $ | 100.05 | |
| | | | | | | | | | | | | | | | | | |
| Natural Gas - NYMEX Henry Hub | | | | | | | | | | | | | | | | |
| Sep 1, 2014 - Dec 31, 2014 | Swap | | | 80,000 | | | $ | 4.58 | | | $ | - | | | $ | - | |
| Sep 1, 2014 - Dec 31, 2014 | Collar | | | 30,000 | | | | - | | | $ | 4.07 | | | $ | 4.18 | |
| Jan 1, 2015 - Dec 31, 2015 | Collar | | | 72,000 | | | | - | | | $ | 4.15 | | | $ | 4.49 | |
| Jan 1, 2016 - May 31, 2016 | Collar | | | 60,000 | | | | - | | | $ | 4.05 | | | $ | 4.54 | |
| Jun 1, 2016 - Aug 31, 2016 | Collar | | | 60,000 | | | | | | | $ | 3.90 | | | $ | 4.14 | |
|
| | | | | | | | | | | | | |
| Settlement Period | | Derivative Instrument | | Average Volumes (Bbls per day) | | Floor Price | | Ceiling Price |
| Crude Oil - NYMEX WTI | | | | | | | | |
| Jan 1, 2018 - Dec 31, 2018 | | Collar | | 1,000 |
| | $ | 40.00 |
| | $ | 57.50 |
|
| Jan 1, 2018 - Dec 31, 2018 | | Collar | | 1,000 |
| | $ | 40.00 |
| | $ | 57.75 |
|
| Jan 1, 2018 - Dec 31, 2018 | | Collar | | 500 |
| | $ | 40.00 |
| | $ | 57.50 |
|
| Jan 1, 2018 - Dec 31, 2018 | | Collar | | 2,500 |
| | $ | 45.00 |
| | $ | 58.00 |
|
| Jan 1, 2018 - Dec 31, 2018 | | Collar | | 2,500 |
| | $ | 45.00 |
| | $ | 64.55 |
|
| Jan 1, 2018 - Dec 31, 2018 | | Collar | | 1,000 |
| | $ | 44.50 |
| | $ | 65.00 |
|
| Jan 1, 2018 - Dec 31, 2018 | | Collar | | 1,500 |
| | $ | 44.50 |
| | $ | 65.00 |
|
| | | | | | | | | |
| Settlement Period | | Derivative
Instrument | | Average Volumes
(MMBtu
per day) | | Floor
Price | | Ceiling
Price |
| Natural Gas - CIG Rocky Mountain | | | | | | | | |
| Jan 1, 2018 - Dec 31, 2018 | | Collar | | 10,000 |
| | $ | 2.25 |
| | $ | 2.82 |
|
| Jan 1, 2018 - Dec 31, 2018 | | Collar | | 5,000 |
| | $ | 2.25 |
| | $ | 2.81 |
|
Subsequent to AugustDecember 31, 2014,2017, the Company entered intoadded the following commodity derivative contracts:positions:
| | | | | | | | | |
| Settlement Period | | Derivative Instrument | | Average Volumes (BBls/MMBtu per month) | | | Average Fixed Price | |
| Crude Oil - NYMEX WTI | | | | | | |
| Oct 1, 2014 - Dec 31, 2014 | | Swap | | | 15,000 | | | $ | 90.85 | |
| Nov 1, 2014 - Dec 31, 2014 | | Swap | | | 25,000 | | | $ | 80.04 | |
| | | | | | | | | | | |
| Jan 1, 2015 - Jun 30, 2015 | | Swap | | | 20,000 | | | $ | 90.10 | |
| Jul 1, 2015 - Dec 31, 2015 | | Swap | | | 15,500 | | | $ | 89.52 | |
| Jan 1, 2015 - Oct 31 2015 | | Swap | | | 14,600 | | | $ | 78.65 | |
| | | | | | | | | | | |
| Jan 1, 2016 - Aug 31, 2016 | | Swap | | | 5,000 | | | $ | 88.55 | |
| Sept 1. 2016 - Dec 2016 | | Swap | | | 20,000 | | | $ | 88.10 | |
| Jan 1, 2016 - Oct 2016 | | Swap | | | 6,400 | | | $ | 78.96 | |
|
| | | | | | | | | |
| Settlement Period | | Derivative Instrument | | Average Volumes
(Bbls
per day) | | Average Fixed Price |
| Propane - Mont Belvieu | | | | | | |
| Feb 1, 2018 - Dec 31, 2018 | | Swap | | 1,000 |
| | $ | 0.80 |
|
Offsetting of Derivative Assets and Liabilities
As of AugustDecember 31, 20142017 and 2013,2016, all derivative instruments held by the Company were subject to enforceable master netting arrangements held by various financial institutions. In general, the terms of the Company’s agreements provide for offsetting of amounts payable or receivable between itthe Company and the counterparty, at the election of both parties,either party, for transactions that occur on the same date and in the same currency. TheyThe Company’s agreements also provide that, in the event of an early termination, the counterparties haveeach party has the right to offset amounts owed or owing under that and any other agreement with the same counterparty. The Company’s accounting policy is to offset these positions in its accompanyingconsolidated balance sheets.
The following table provides a reconciliation between the net assets and liabilities reflected on the accompanying consolidated balance sheets and the potential effect of master netting arrangements on the fair value of the Company’s derivative contractcontracts (in thousands):
| | | | | As of August 31, 2014 | |
| Underlying Commodity | | Balance Sheet Location | | Gross Amounts of Recognized Assets and Liabilities | | | Gross Amounts Offset in the Balance Sheet | | | Net Amounts of Assets and Liabilities Presented in the Balance Sheet | |
| Derivative contracts | | Current assets | | $ | 903 | | | $ | (538 | ) | | $ | 365 | |
| Derivative contracts | | Noncurrent assets | | $ | 718 | | | $ | (664 | ) | | $ | 54 | |
| Derivative contracts | | Current liabilities | | $ | 840 | | | $ | (538 | ) | | $ | 302 | |
| Derivative contracts | | Noncurrent liabilities | | $ | 971 | | | $ | (664 | ) | | $ | 307 | |
|
| | | | | | | | | | | | | | |
| | | | | As of December 31, 2017 |
| Underlying Commodity | | Balance Sheet
Location | | Gross Amounts of Recognized Assets and Liabilities | | Gross Amounts Offset in the
Balance Sheet | | Net Amounts of Assets and Liabilities Presented in the
Balance Sheet |
| Commodity derivative contracts | | Current assets | | $ | 1,960 |
| | $ | (1,960 | ) | | $ | — |
|
| Commodity derivative contracts | | Non-current assets | | $ | — |
| | $ | — |
| | $ | — |
|
| Commodity derivative contracts | | Current liabilities | | $ | 9,825 |
| | $ | (1,960 | ) | | $ | 7,865 |
|
| Commodity derivative contracts | | Non-current liabilities | | $ | — |
| | $ | — |
| | $ | — |
|
| | | | | As of August 31, 2013 | |
| Underlying Commodity | | Balance Sheet Location | | Gross Amounts of Recognized Assets and Liabilities | | | Gross Amounts Offset in the Balance Sheet | | | Net Amounts of Assets and Liabilities Presented in the Balance Sheet | |
| Derivative contracts | | Current assets | | $ | 28 | | | $ | (28 | ) | | $ | - | |
| Derivative contracts | | Noncurrent assets | | $ | 182 | | | $ | (182 | ) | | $ | - | |
| Derivative contracts | | Current liabilities | | $ | 2,343 | | | $ | (28 | ) | | $ | 2,315 | |
| Derivative contracts | | Noncurrent liabilities | | $ | 516 | | | $ | (182 | ) | | $ | 334 | |
|
| | | | | | | | | | | | | | |
| | | | | As of December 31, 2016 |
| Underlying Commodity | | Balance Sheet
Location | | Gross Amounts of Recognized Assets and Liabilities | | Gross Amounts Offset in the
Balance Sheet | | Net Amounts of Assets and Liabilities Presented in the
Balance Sheet |
| Commodity derivative contracts | | Current assets | | $ | 2,045 |
| | $ | (1,748 | ) | | $ | 297 |
|
| Commodity derivative contracts | | Non-current assets | | $ | — |
| | $ | — |
| | $ | — |
|
| Commodity derivative contracts | | Current liabilities | | $ | 4,622 |
| | $ | (1,748 | ) | | $ | 2,874 |
|
| Commodity derivative contracts | | Non-current liabilities | | $ | — |
| | $ | — |
| | $ | — |
|
The amount of lossgain (loss) recognized in the consolidated statements of operations related to derivative financial instruments was as follows (in thousands):
|
| | | | | | | | | | | | | | | |
| | Year Ended December 31, | | Four Months Ended December 31, 2015 | | Year Ended August 31, 2015 |
| | 2017 | | 2016 | | |
| Realized gain (loss) on commodity derivatives | $ | 39 |
| | $ | 2,355 |
| | $ | 1,577 |
| | $ | 30,466 |
|
| Unrealized gain (loss) on commodity derivatives | (4,265 | ) | | (10,105 | ) | | 4,905 |
| | 1,790 |
|
| Total gain (loss) | $ | (4,226 | ) | | $ | (7,750 | ) | | $ | 6,482 |
| | $ | 32,256 |
|
| | | For the Years Ended August 31, | |
| | | 2014 | | | 2013 | | | 2012 | |
| Realized (loss) on commodity derivatives | | $ | (2,138 | ) | | $ | (395 | ) | | | - | |
| Unrealized gain (loss) on commodity derivatives | | | 2,459 | | | | (2,649 | ) | | | - | |
| Total gain (loss) | | $ | 321 | | | $ | (3,044 | ) | | $ | - | |
Realized gains and losses include cash received from the monthly settlement of derivative contracts at their scheduled maturity date net of the previously incurred premiums attributable to settled commodity contracts. During the year ended August 31, 2015, the Company liquidated oil derivatives with an average price of $82.79 and covering 372,500 barrels and received cash settlements of approximately $20.5 million. The following table summarizes derivative realized gains and losses during the periods presented (in thousands):
|
| | | | | | | | | | | | | | | |
| | Year Ended December 31, | | Four Months Ended December 31, 2015 | | Year Ended August 31, 2015 |
| | 2017 | | 2016 | | |
| Monthly settlement | $ | 1,062 |
| | $ | 4,396 |
| | $ | 2,331 |
| | $ | 11,212 |
|
| Previously incurred premiums attributable to settled commodity contracts | (1,023 | ) | | (2,041 | ) | | (754 | ) | | (1,255 | ) |
| Early liquidation | — |
| | — |
| | — |
| | 20,509 |
|
| Total realized gain (loss) | $ | 39 |
| | $ | 2,355 |
| | $ | 1,577 |
| | $ | 30,466 |
|
Credit Related Contingent Features
As of AugustDecember 31, 2014, one2017, three of the threesix counterparties was a memberto the Company's derivative instruments were members of the Company’s credit facility syndicate. The Company’s obligations under itsthe credit facility and its derivative contracts are secured by liens on substantially all of the Company’s producing oil and gas properties. The agreement with onethe fourth counterparty, which
is not a member oflender under the credit facility, is based on an unsecured basis and does not require the posting of collateral. The agreement with onethe fifth counterparty, which is not a lender under the credit facility, may require the posting of collateral if in a liability position. The agreement with the sixth counterparty is subject to an inter-creditor agreement between the counterparty and the Company’s lenders under the credit facility.
8. | |
| 9. | Fair Value Measurements |
ASC Topic 820, Fair Value Measurements and Disclosure, establishes a hierarchy for inputs used in measuring fair value for financial assets and liabilities that maximizes the use of observable inputs and minimizes the use of unobservable inputs by requiring that the most observable inputs be used when available. Observable inputs are inputs that market participants would use in pricing the asset or liability based on market data obtained from sources independent of the Company. Unobservable inputs are inputs that reflect the Company’s assumptions of what market participants would use in pricing the asset or liability based on the best information available in the circumstances. The hierarchy is broken down into three levels based on the reliability of the inputs as follows:
· | Level 1: Quoted prices are available in active markets for identical assets or liabilities; |
· | Level 2: Quoted prices in active markets for similar assets and liabilities that are observable for the asset or liability; and liabilities that are observable for the asset or liability; |
· | Level 3: Unobservable pricing inputs that are generally less observable from objective sources, such as discounted cash or valuation models. |
The financial assets and liabilities are classified based on the lowest level of input that is significant to the fair value measurement. The Company’s assessment of the significance of a particular input to the fair value measurement requires judgment and may affect the valuation of the fair value of assets and liabilities and their placement within the fair value hierarchy levels.
The Company’s non-recurring fair value measurements include unproved properties, asset retirement obligations, please refer to Note 5—Asset Retirement Obligations, and for the purchase price allocations for the fair value of assets and liabilities acquired through business combinations pleaseand certain asset acquisitions. Please refer to Notes 2, 3, and 5 for further discussion of unproved properties, business combinations and asset acquisitions, and asset retirement obligations, respectively.
The Company determines the estimated fair value of its unproved properties using market comparables which are deemed to be a Level 3 input. See Note 3—Acquisitions.2 for additional information.
The acquisition of a group of assets in a business combination transaction and certain asset acquisitions requires fair value estimates for assets acquired and liabilities assumed. The fair value of assets and liabilities acquired is calculated using a net discounted cash flow approach for the proved producing, proved undeveloped, probable, and possible properties. The discounted cash flows are developed using the income approach and are based on management’s expectations for the future. Unobservable inputs include estimates of future oil and natural gas production from the Company’s reserve reports, commodity prices based on the NYMEX forward price curves as of the date of the estimate (adjusted for basis differentials), estimated operating and development costs, and a risk-adjusted discount rate (all of which are designated as Level 3 inputs within the fair value hierarchy). For unproved properties, the fair value is determined using market comparables.
The Company determines the estimated fair value of its asset retirement obligations by calculating the present value of estimated cash flows related to plugging and abandonment liabilities using levelLevel 3 inputs. The significant inputs used to calculate such liabilities include estimates of costs to be incurred;incurred, the Company’s credit adjusted discount rates,credit-adjusted risk-free rate, inflation ratesrate, and estimated dates of abandonment. The asset retirement liability is accreted to its present value each period, and the capitalized asset retirement cost is depleted as a component of the full cost pool using the units-of-production method.
The acquisition of a group of assets in a business combination transaction requires fair value estimates See Notes 3 and 5 for assets acquired and liabilities assumed. The fair value of assets and liabilities acquired through business combinations is calculated using a discounted-cash flow approach using primarily unobservable inputs. Inputs are reviewed by management on an annual basis. Cash flow estimates require forecasts and assumptions for many years into the future for a variety of factors, including risk-adjusted oil and gas reserves, commodity prices and operating costs.additional information.
The following table presents the Company’s financial assets and liabilities that were accounted for at fair value on a recurring basis as of August 31, 2014 and 2013 by level within the fair value hierarchy (in thousands):
| | | Fair Value Measurements at August 31, 2014 | | |
| | | Level 1 | | | Level 2 | | | Level 3 | | | Total | | |
| Financial assets and liabilities: | | | | | | | | | | | | | |
| Commodity derivative asset | | $ | - | | | $ | 419 | | | $ | - | | | $ | 419 | | |
| Commodity derivative liability | | $ | - | | | $ | 609 | | | $ | - | | | $ | 609 | | |
| | | | | | | | | | | | | | | | | | | | | | | | | | |
| | | Fair Value Measurements at August 31, 2013 | | Fair Value Measurements at December 31, 2017 |
| | | Level 1 | | | Level 2 | | | Level 3 | | | Total | | Level 1 | | Level 2 | | Level 3 | | Total |
| Financial assets and liabilities: | | | | | | | | | | | | | | | | | | | | | | | |
| Commodity derivative asset | | $ | - | | | $ | - | | | $ | - | | | $ | - | | $ | — |
| | $ | — |
| | $ | — |
| | $ | — |
|
| Commodity derivative liability | | $ | - | | | $ | 2,649 | | | $ | - | | | $ | 2,649 | | $ | — |
| | $ | 7,865 |
| | $ | — |
| | $ | 7,865 |
|
|
| | | | | | | | | | | | | | | |
| | Fair Value Measurements at December 31, 2016 |
| | Level 1 | | Level 2 | | Level 3 | | Total |
| Financial assets and liabilities: | | | | | | | |
| Commodity derivative asset | $ | — |
| | $ | 297 |
| | $ | — |
| | $ | 297 |
|
| Commodity derivative liability | $ | — |
| | $ | 2,874 |
| | $ | — |
| | $ | 2,874 |
|
Commodity Derivative Instruments
The Company determines its estimate of the fair value of commodity derivative instruments using a market approach based on several factors, including quoted market prices in active markets, quotes from third parties, the credit rating of each counterparty, and the Company’s own credit standing. In consideration of counterparty credit risk, the Company assessed the possibility of whether the counterpartycounterparties to theits derivative contracts would default by failing to make any contractually required payments. Additionally, theThe Company considers that it isthe counterparties to be of substantial credit quality and hasbelieves that they have the financial resources and willingness to meet itstheir potential repayment obligations associated with the derivative transactions. At AugustDecember 31, 2014,2017, derivative instruments utilized by the Company consist of both “no premium” collars and swaps.collars. The crude oil and natural gas derivative markets are highly active. Although the Company’s derivative instruments are based on several factors including public indices, the instruments themselves are traded with third-party counterparties and are not openly traded on an exchange.counterparties. As such, the Company has classified these instruments as levelLevel 2.
Fair Value of Financial Instruments
The Company’s financial instruments consist primarily of cash and cash equivalents, cash held in escrow, accounts receivable, accounts payable, commodity derivative instruments (discussed above), notes payable, and credit facility borrowings. The carrying values of cash and cash equivalents, andcash held in escrow, accounts receivable, and accounts payable are representative of their fair values due to their short-term maturities. Due to the variable interest rate paid on the credit facility borrowings, the carrying value is representative of its fair value.
The carrying amountfair value of the Company’s credit facility approximatednotes payable is estimated to be $564.1 million at December 31, 2017. The Company determined the fair value of its notes payable at December 31, 2017 by using observable market based information for debt instruments of similar amounts and duration. The Company has classified the notes payable as it bears interest at variable rates over the term of the loan.Level 2.
The components of interest expense are (in thousands):
| | | For the Years Ended August 31, | |
| | | 2014 | | | 2013 | | | 2012 | |
| | | | | | | | | | |
| Revolving bank credit facility | | $ | 986 | | | $ | 1,067 | | | $ | 108 | |
| Amortization of debt issuance costs | | | 448 | | | | 160 | | | | 32 | |
| Other | | | - | | | | - | | | | 68 | |
| Less, interest capitalized | | | (1,434 | ) | | | (1,130 | ) | | | (208 | ) |
| Interest expense, net | | $ | - | | | $ | 97 | | | $ | - | |
|
| | | | | | | | | | | | | | | |
| | Year Ended December 31, | | Four Months Ended December 31, 2015 | | Year Ended August 31, 2015 |
| | 2017 | | 2016 | | |
| Revolving credit facility | $ | 2,004 |
| | $ | 154 |
| | $ | 661 |
| | $ | 2,776 |
|
| Notes payable | 10,036 |
| | 3,940 |
| | — |
| | — |
|
| Amortization of debt issuance costs | 3,084 |
| | 1,638 |
| | 431 |
| | 853 |
|
| Debt extinguishment costs | 11,842 |
| | — |
| | — |
| | — |
|
| Less: interest capitalized | (15,124 | ) | | (5,732 | ) | | (1,092 | ) | | (3,384 | ) |
| Interest expense, net | $ | 11,842 |
| | $ | — |
| | $ | — |
| | $ | 245 |
|
10. | |
| 11. | Shareholders’ Equity |
The Company's classes of stock are summarized as follows:
| | | For the Years Ended August 31, | |
| | | 2014 | | | 2013 | | | 2012 | |
| Preferred stock, shares authorized | | | 10,000,000 | | | | 10,000,000 | | | | 10,000,000 | |
| Preferred stock, par value | | $ | 0.01 | | | $ | 0.01 | | | $ | 0.01 | |
| Preferred stock, shares issued and outstanding | | nil | | | nil | | | nil | |
| Common stock, shares authorized | | | 200,000,000 | | | | 100,000,000 | | | | 100,000,000 | |
| Common stock, par value | | $ | 0.001 | | | $ | 0.001 | | | $ | 0.001 | |
| Common stock, shares issued and outstanding | | | 77,999,082 | | | | 70,587,723 | | | | 51,409,340 | |
F-21
|
| | | | | | | |
| | As of December 31, |
| | 2017 | | 2016 |
| Preferred stock, shares authorized | 10,000,000 |
| | 10,000,000 |
|
| Preferred stock, par value | $ | 0.01 |
| | $ | 0.01 |
|
| Preferred stock, shares issued and outstanding | nil |
| | nil |
|
| Common stock, shares authorized | 300,000,000 |
| | 300,000,000 |
|
| Common stock, par value | $ | 0.001 |
| | $ | 0.001 |
|
| Common stock, shares issued and outstanding | 241,365,522 |
| | 200,647,572 |
|
Preferred Stock may be issued in series with such rights and preferences as may be determined by the Board of Directors. Since inception, the Company has not issued any preferred shares.
The following sharesShares of the Company’s common stock were issued during the fiscal years presented:ended December 31, 2017 and 2016, the four months ended December 31, 2015, and the year ended August 31, 2015, as described further below.
Sales of common stock
In June 2013,A summary of the Company completed the sale of common stock in an underwritten public offering led by Johnson Rice LLC.
In fiscal year 2012, the Company completed the sale of common stock in an underwritten public offering led by Northland Capital Markets.
Certain details of each transaction aretransactions is shown in the following table. Net proceeds represent amounts received by the Company after deductions for underwriting discounts, commissions, and expenses of the offering.offering.
|
| | | | | | | | | | | | | | | |
| | Year Ended December 31, | | Four Months Ended December 31, 2015 | | Year Ended August 31, 2015 |
| | 2017 | | 2016 | | |
| Number of common shares sold | 40,250,000 |
| | 90,275,000 |
| �� | — |
| | 18,613,952 |
|
| Offering price per common share | $ | 7.76 |
| | $ | 6.02 |
| | $ | — |
| | $ | 10.75 |
|
| Net proceeds (in thousands) | $ | 312,170 |
| | $ | 543,400 |
| | $ | — |
| | $ | 190,845 |
|
| | | For the Years Ended August 31, | | | | |
| | | 2014 | | | 2013 | | | 2012 | |
| Number of common shares sold | | | - | | | | 13,225,000 | | | | 14,363,363 | |
| Offering price per common share | | $ | - | | | $ | 6.25 | | | $ | 2.75 | |
| Net proceeds (in thousands) | | $ | - | | | $ | 78,243 | | | $ | 37,422 | |
Common stock issued for acquisition of mineral property interests
During the fiscal yearsperiods presented, the Company issued shares of common stock in exchange for mineral property interests. The value of each transaction was determined using the market price of the Company’s common stock on the date of each transaction.
| | | For the Years Ended August 31, | |
| | | 2014 | | | 2013 | | | 2012 | |
| Number of common shares issued for mineral property leases | | | 357,901 | | | | 687,122 | | | | 669,765 | |
| Number of common shares issued for acquisitions | | | 872,483 | | | | 3,128,422 | | | | - | |
| Total common shares issued | | | 1,230,384 | | | | 3,815,544 | | | | 669,765 | |
| | | | | | | | | | | | | |
| Average price per common share | | $ | 9.09 | | | $ | 4.37 | | | $ | 3.12 | |
| Aggregate value of shares issues (in thousands) | | $ | 11,184 | | | $ | 16,684 | | | $ | 2,090 | |
|
| | | | | | | | | | | | | | | |
| | Year Ended December 31, | | Four Months Ended December 31, 2015 | | Year Ended August 31, 2015 |
| | 2017 | | 2016 | | |
| Number of common shares issued for mineral property leases | — |
| | — |
| | 37,051 |
| | 995,672 |
|
| Number of common shares issued for acquisitions | — |
| | — |
| | 4,418,413 |
| | 4,648,136 |
|
| Total common shares issued | — |
| | — |
| | 4,455,464 |
| | 5,643,808 |
|
| | | | | | | | |
| Average price per common share | $ | — |
| | $ | — |
| | $ | 11.28 |
| | $ | 10.67 |
|
| Aggregate value of shares issues (in thousands) | $ | — |
| | $ | — |
| | $ | 50,265 |
| | $ | 60,221 |
|
Common stock warrants12. Weighted-Average Shares Outstanding
The Company has issued warrants to purchase common stock. The relevant terms offollowing table sets forth the warrants are described in the following paragraphs.Company's outstanding equity grants which have a dilutive effect on earnings per share:
Series A – During the year ended August 31, 2009, the Company issued 4,098,000 Series A warrants, each of which was immediately exercisable. Each Series A warrant entitled the holder to purchase one share of common stock for $6.00 per share. All of the Series A warrants expired on December 31, 2012.
Series B – During the year ended August 31, 2009, the Company issued 1,000,000 Series B warrants, each of which was immediately exercisable. Each Series B warrant entitled the holder to purchase one share of common stock for $10.00 per share. All of the Series B warrants expired on December 31, 2012.
Series C – During the year ended August 31, 2010, the Company issued 9,000,000 Series C warrants in connection with a unit offering. Each unit included one convertible promissory note with a face value of $100,000 and 50,000 Series C warrants. Each Series C warrant entitles the holder to purchase one share of common stock for $6.00 per share. The Series C warrants will expire, if not previously exercised, on December 31, 2014. During each of the three years ended August 31, 2014, the following warrants were exercised: 5,938,585, during fiscal 2014, 500,000 during fiscal 2013, and nil during fiscal 2012.
Series D – During the year ended August 31, 2010, the Company issued 1,125,000 Series D warrants to the placement agent for the Series C unit offering. Each Series D warrant entitles the holder to purchase one share of common stock for $1.60 per share, and contains a net settlement provision that provides for exercise of the warrants on a cashless basis. The Series D warrants will expire, if not previously exercised, on December 31, 2014. During each of the three years ended August 31, 2014, the following warrants were exercised: 140,744 during fiscal 2014, 627,799 during fiscal 2013, and nil during fiscal 2012.
Sales Agent Warrants – During the year ended August 31, 2009, the Company issued 31,733 warrants to the sales agent for an equity offering. Each Sales Agent Warrant entitled the holder to purchase two shares of common for $1.80 per share. The Sales Agent Warrants had an expiration date of December 31, 2012, and all of the warrants were exercised during the year ended August 31, 2013.
Investor Relations Warrants – During the year ended August 31, 2012, the Company issued 100,000 warrants to a firm providing investor relations services. Each Investor Relations Warrant entitles the holder to purchase one share of common stock for $2.69 per share, and contains a net settlement provision that provides for exercise of the warrants on a cashless basis. The warrants were to become exercisable in equal quarterly installments over a one year period. During the year ended August 31, 2013, warrants to purchase 50,000 shares became exercisable and warrants to purchase 50,000 shares were forfeited due to early termination of the agreement with the firm. During each of the three years ended August 31, 2014, the following warrants were exercised: 25,000 during fiscal 2014, 25,000 during fiscal 2013, and nil during fiscal 2012. |
| | | | | | | | | | | |
| | Year Ended December 31, | | Four Months Ended December 31, 2015 | | Year Ended August 31,2015 |
| | 2017 | | 2016 | | |
| Weighted-average shares outstanding - basic | 206,167,506 |
| | 173,774,035 |
| | 107,789,554 |
| | 94,628,665 |
|
| Potentially dilutive common shares from: | | | | | | | |
| Stock options | 417,809 |
| | — |
| | — |
| | 672,493 |
|
| Restricted stock units and stock bonus shares | 158,236 |
| | — |
| | — |
| | 18,111 |
|
| Weighted-average shares outstanding - diluted | 206,743,551 |
| | 173,774,035 |
| | 107,789,554 |
| | 95,319,269 |
|
The following table summarizes activitypotentially dilutive securities outstanding for the periods presented were not included in the respective weighted-average shares outstanding-diluted calculation above as such securities had an anti-dilutive effect on earnings per share:
|
| | | | | | | | | | | |
| | Year Ended December 31, | | Four Months Ended December 31, 2015 | | Year Ended August 31, 2015 |
| | 2017 | | 2016 | | |
| Potentially dilutive common shares from: | | | | | | | |
| Stock options | 4,657,834 |
| | 6,001,500 |
| | 5,056,000 |
| | 2,785,500 |
|
Performance-vested stock units1 | 951,884 |
| | 478,510 |
| | — |
| | — |
|
| Restricted stock units and stock bonus shares | 285,448 |
| | 890,336 |
| | 915,867 |
| | 145,000 |
|
| Total | 5,895,166 |
| | 7,370,346 |
| | 5,971,867 |
| | 2,930,500 |
|
1 The number of awards assumes that the associated vesting condition is met at the target amount. The final number of shares of the Company’s common stock warrants forissued may vary depending on the fiscal years presented:
| | | Number of Shares Issuable Upon Warrant Exercise | | | Weighted Average Exercise Price Per Share | |
| Outstanding, August 31, 2011 | | | 14,931,067 | | | $ | 6.02 | |
| Granted | | | 100,000 | | | $ | 2.69 | |
| Exercised | | | - | | | $ | - | |
| Outstanding, August 31, 2012 | | | 15,031,067 | | | $ | 6.02 | |
| Exercised | | | 1,216,265 | | | $ | 3.44 | |
| Forfeited / Expired | | | 5,148,000 | | | $ | 6.74 | |
| Outstanding, August 31, 2013 | | | 8,666,802 | | | $ | 5.92 | |
| Exercised | | | 6,104,329 | | | $ | 5.88 | |
| Forfeited / Expired | | | - | | | $ | - | |
| Outstanding, August 31, 2014 | | | 2,562,473 | | | $ | 6.00 | |
The following table summarizes information about the Company’s issued and outstanding common stock warrants as of August 31, 2014:
Number of Shares | | | Exercise Price | | | Remaining Contractual Life (in years) | | | Exercise Price times number of shares | |
| | 2,561,415 | | | $ | 6.00 | | | | 0.33 | | | $ | 15,368,490 | |
| | 1,058 | | | $ | 1.60 | | | | 0.33 | | | $ | 1,693 | |
| | 2,562,473 | | | | | | | | | | | $ | 15,370,183 | |
11. | |
| 13. | Stock-Based Compensation |
In addition to cash compensation, the Company may compensate certain service providers, including employees and directors consultants, and other advisors, with equity basedequity-based compensation in the form of stock options, performance-vested stock units, restricted stock grants,units, stock bonus shares, and warrants.other equity awards. The Company records an expense related toits equity compensation by pro-rating the estimated grant-date fair value of each grant over the period of time that the recipient is required to provide services to the Company (the “vesting phase”"vesting period"). The calculation of fair value is based, either directly or indirectly, on the quoted market value of the Company’s common stock. Indirect valuations are calculated using the Black-Scholes-Merton option pricing model.model or a Monte Carlo Model. For the periods presented, all stock basedstock-based compensation expense was either classified as a component within Generalgeneral and Administrativeadministrative expense onin the StatementCompany's consolidated statements of Operations.operations or, for that portion which is directly attributable to individuals performing acquisition, exploration, and development activities, was capitalized to the full cost pool. As of December 31, 2017, there were 4,500,000 common shares authorized for
grant under the 2015 Equity Incentive Plan, of which 110,158 shares were available for future grants. The shares available for future grant exclude 951,884 shares which have been reserved for future vesting of performance-vested stock units in the event that these awards met the criterion to vest at their maximum multiplier.
The amount of stock basedstock-based compensation expense iswas as follows (in thousands):
| | | For the Years Ended August 31, | |
| | | 2014 | | | 2013 | | | 2012 | |
| Stock options | | $ | 1,767 | | | $ | 1,039 | | | $ | 443 | |
| Restricted stock grants | | | 1,201 | | | | 277 | | | | 17 | |
| Investor relations warrants | | | - | | | | 46 | | | | 13 | |
| | | $ | 2,968 | | | $ | 1,362 | | | $ | 473 | |
|
| | | | | | | | | | | | | | | |
| | Year Ended December 31, | | Four Months Ended December 31, 2015 | | Year Ended August 31, 2015 |
| | 2017 | | 2016 | | |
| Stock options | $ | 5,076 |
| | $ | 5,417 |
| | $ | 2,161 |
| | $ | 4,741 |
|
| Performance-vested stock units | 2,938 |
| | 1,047 |
| | — |
| | — |
|
| Restricted stock units and stock bonus shares | 4,977 |
| | 4,232 |
| | 7,162 |
| | 2,950 |
|
| Total stock-based compensation | 12,991 |
| | 10,696 |
| | 9,323 |
| | 7,691 |
|
| Less: stock-based compensation capitalized | (1,766 | ) | | (1,205 | ) | | (892 | ) | | (778 | ) |
| Total stock-based compensation expense | $ | 11,225 |
| | $ | 9,491 |
| | $ | 8,431 |
| | $ | 6,913 |
|
General Description of Stock Option and Other Stock Award Plans
The Company has three stock award plans: (i) a 2011 non-qualified stock option plan, (ii) a 2011 incentive stock option plan, and (iii) a 2011 stock bonus plan. The plans adopted during 2011 replaced a non-qualified stock option plan and a stock bonus plan originally adopted during 2005 (the “2005 Plans”). No additional options or shares will be issued under the 2005 Plans.
Each plan authorizes the issuance of shares of the Company's common stock to persons that exercise options granted pursuant to the Plan. Employees, directors, officers, consultants and advisors are eligible to receive such awards, provided that bona fide services be rendered by such consultants or advisors and such services must not be in connection with promoting our stock or the sale of securities in a capital-raising transaction. The option exercise price is determined by the Board of Directors, though is generally the closing market price of Company stock on the date of grant.
As of August 31, 2014, there were 5,000,000 shares authorized for issuance under the non-qualified plan and 2,000,000 shares authorized for each of the incentive stock option and stock bonus plans.
No stock options were granted during the year ended December 31, 2017. During the respective fiscal years,periods presented, the Company granted the following non-qualified stock options:
| | | | | For the Years Ended August 31, | | Year Ended December 31, 2016 | | Four Months Ended December 31, 2015 | | Year Ended August 31, 2015 |
| | | 2014 | | | 2013 | | | 2012 | | |
| Number of options to purchase common shares | | | 433,000 | | | | 1,025,000 | | | | 275,000 | | 1,067,500 |
| | 1,142,500 |
| | 2,377,500 |
|
| Weighted average exercise price | | $ | 10.37 | | | $ | 6.05 | | | $ | 2.96 | | |
| Weighted-average exercise price | | $ | 7.19 |
| | $ | 10.84 |
| | $ | 11.55 |
|
| Term (in years) | | 10 years | | | 10 years | | | 10 years | | 10 years |
| | 10 years |
| | 10 years |
|
| Vesting Period (in years) | | 5 years | | | 3-5 years | | | 4-5 years | | 3 - 5 years |
| | 3.7-5 years |
| | 3-5 years |
|
| Fair Value (in thousands) | | $ | 3,009 | | | $ | 4,179 | | | $ | 519 | | $ | 3,860 |
| | $ | 6,591 |
| | $ | 13,266 |
|
The assumptions used in valuing stock options granted during each of the fiscal yearsperiods presented were as follows:
| | | | | For the Years Ended August 31, | | Year Ended December 31, 2016 | | Four Months Ended December 31, 2015 | | Year Ended August 31, 2015 |
| | | 2014 | | | 2013 | | | 2012 | | |
| Expected term | | 6.7 years | | | 6.2 years | | | 6.5 years | | 6.4 years |
| | 6.5 years |
| | 6.5 years |
|
| Expected volatility | | | 73 | % | | | 77 | % | | | 56.7 - 69.4 | % | 55 | % | | 53 | % | | 47 | % |
| Risk free rate | | | 1.8 - 2.3 | % | | | 0.9 - 2.1 | % | | | 1.0-1.4 | % | |
| Risk-free rate | | 1.25 - 2.00% |
| | 1.8 - 2.0% |
| | 1.4 - 2.0% |
|
| Expected dividend yield | | | 0.0 | % | | | 0.0 | % | | | 0.0 | % | — | % | | — | % | | — | % |
| Forfeiture rate | | | 0.0 | % | | | 0.0 | % | | | 0.0 - 0.7 | % | |
The following table summarizes activity for stock options for the fiscal yearsperiods presented:
| | | Number of Shares | | | Weighted Average Exercise Price | |
| Outstanding, August 31, 2011 | | | 4,645,000 | | | $ | 5.21 | |
| Granted | | | 275,000 | | | $ | 2.96 | |
| Exercised | | | - | | | $ | - | |
| Forfeited | | | (5,000 | ) | | $ | 3.40 | |
| Outstanding, August 31, 2012 | | | 4,915,000 | | | $ | 5.09 | |
| Granted | | | 1,025,000 | | | $ | 6.05 | |
| Exercised | | | (2,120,000 | ) | | $ | 1.10 | |
| Expired | | | (2,000,000 | ) | | $ | 10.00 | |
| Outstanding, August 31, 2013 | | | 1,820,000 | | | $ | 4.88 | |
| Granted | | | 433,000 | | | $ | 10.37 | |
| Exercised | | | (61,000 | ) | | $ | 3.71 | |
| Forfeited | | | (25,000 | ) | | $ | 10.32 | |
| Outstanding, August 31, 2014 | | | 2,167,000 | | | $ | 5.94 | |
|
| | | | | | | | | | | | |
| | Number of
Shares | | Weighted-Average
Exercise Price | | Weighted-Average
Remaining Contractual Life | | Aggregate Intrinsic Value
(thousands) |
| Outstanding, August 31, 2014 | 2,167,000 |
| | $ | 5.94 |
| | 8.0 years | | $ | 16,287 |
|
| Granted | 2,377,500 |
| | 11.55 |
| | | | |
| Exercised | (258,000 | ) | | 3.81 |
| | | | 2,103 |
|
| Forfeited | (110,000 | ) | | 4.97 |
| | | | |
| Outstanding, August 31, 2015 | 4,176,500 |
| | 9.29 |
| | 8.6 years | | 8,187 |
|
| Granted | 1,142,500 |
| | 10.84 |
| | | | |
| Exercised | (188,000 | ) | | 6.56 |
| | | | 981 |
|
| Expired | (60,000 | ) | | 11.74 |
| | | | |
| Forfeited | (15,000 | ) | | 11.68 |
| |
| |
|
|
| Outstanding, December 31, 2015 | 5,056,000 |
| | 9.71 |
| | 8.7 years | | 4,351 |
|
| Granted | 1,067,500 |
| | 7.19 |
| | | |
|
| Exercised | (20,000 | ) | | 3.19 |
| | | | 117 |
|
| Expired | — |
| | — |
| | | | |
| Forfeited | (102,000 | ) | | 10.40 |
| |
| |
|
|
| Outstanding, December 31, 2016 | 6,001,500 |
| | 9.27 |
| | 8.0 years | | 6,515 |
|
| Granted | — |
| | — |
| | | | |
| Exercised | (187,666 | ) | | 3.95 |
| | | | 976 |
|
| Expired | (41,000 | ) | | 11.98 |
| | | | |
| Forfeited | (136,000 | ) | | 10.97 |
| | | | |
| Outstanding, December 31, 2017 | 5,636,834 |
| | $ | 9.38 |
| | 7.0 years | | $ | 4,806 |
|
| Outstanding, Exercisable at December 31, 2017 | 3,203,045 |
| | $ | 9.08 |
| | 6.5 years | | $ | 3,587 |
|
The following table summarizes information about issued and outstanding stock options as of AugustDecember 31, 2014:2017:
|
| | | | | | | | | | | | | | | | | | |
| | | Outstanding Options | | Exercisable Options |
| Range of Exercise Prices | | Options | | Weighted-Average Exercise Price per Share | | Weighted-Average Remaining Contractual Life | | Options | | Weighted-Average Exercise Price per Share | | Weighted-Average Remaining Contractual Life |
| Under $5.00 | | 454,000 |
| | $ | 3.45 |
| | 3.5 years | | 454,000 |
| | $ | 3.45 |
| | 3.5 years |
| $5.00 - $6.99 | | 1,012,000 |
| | 6.38 |
| | 6.9 years | | 558,400 |
| | 6.45 |
| | 5.8 years |
| $7.00 - $10.99 | | 1,548,834 |
| | 9.36 |
| | 7.4 years | | 708,245 |
| | 9.53 |
| | 7.0 years |
| $11.00 - $13.46 | | 2,622,000 |
| | 11.58 |
| | 7.4 years | | 1,482,400 |
| | 11.59 |
| | 7.4 years |
| Total | | 5,636,834 |
| | $ | 9.38 |
| | 7.0 years | | 3,203,045 |
| | $ | 9.08 |
| | 6.5 years |
| | | As of August 31, 2014 | |
| | | | | | | |
| | | Outstanding Options | | | Vested Options | |
| Number of shares | | | 2,167,000 | | | | 797,500 | |
| Weighted average remaining contractual life | | 8 years | | | 7.2 years | |
| Weighted average exercise price | | $ | 5.94 | | | $ | 4.55 | |
| Aggregate intrinsic value (in thousands) | | $ | 16,287 | | | $ | 7,103 | |
The estimated unrecognized compensation cost from unvested stock options not vested as of AugustDecember 31, 2014,2017, which will be recognized ratably over the remaining vesting phase,period, is as follows:
| | | Unvested Options at August 31, 2014 | |
| Unrecognized compensation expense (in thousands) | | $ | 5,410,960 | |
| Remaining vesting phase | | 3.4 years | |
|
| | | |
| Unrecognized compensation (in thousands) | $ | 9,697 |
|
| Remaining vesting period | 2.3 years |
|
Restricted stock units and stock bonus awards
The Company grants restricted stock units and stock bonus awards to directors, eligible employees, and officers as a part of its equity incentive plan. Restrictions and vesting periods for the awards are determined by the Compensation Committee of the Board of Directors and are set forth in the award agreements. Each restricted stock unit or stock bonus award represents one share of the Company’s common stock to be released from restrictions upon completion of the vesting period. The awards typically vest in equal increments over three to five years. Restricted stock units and stock bonus awards are valued at the closing price of the Company’s common stock on the grant date and are recognized over the vesting period of the award.
The following table summarizes activity for restricted stock units and stock bonus awards for the periods presented:
|
| | | | | | |
| | Number of
Shares | | Weighted-Average
Grant-Date Fair Value |
| Not vested, August 31, 2014 | 293,333 |
| | $ | 10.60 |
|
| Granted | 547,699 |
| | 11.17 |
|
| Vested | (208,532 | ) | | 11.09 |
|
| Forfeited | — |
| | — |
|
| Not vested, August 31, 2015 | 632,500 |
| | 10.93 |
|
| Granted | 919,604 |
| | 10.08 |
|
| Vested | (636,237 | ) | | 10.13 |
|
| Forfeited | — |
| | — |
|
| Not vested, December 31, 2015 | 915,867 |
| | 10.63 |
|
| Granted | 464,533 |
| | 7.66 |
|
| Vested | (424,483 | ) | | 9.92 |
|
| Forfeited | (65,581 | ) | | 8.99 |
|
| Not vested, December 31, 2016 | 890,336 |
| | 9.55 |
|
| Granted | 681,568 |
| | 8.29 |
|
| Vested | (455,772 | ) | | 9.21 |
|
| Forfeited | (28,746 | ) | | 9.74 |
|
| Not vested, December 31, 2017 | 1,087,386 |
| | $ | 8.89 |
|
The estimated unrecognized compensation cost from restricted stock units and stock bonus awards not vested as of December 31, 2017, which will be recognized ratably over the remaining vesting period, is as follows:
|
| | | |
| Unrecognized compensation (in thousands) | $ | 7,113 |
|
| Remaining vesting period | 2.2 years |
|
Performance-vested stock units
The Company grants performance-vested stock units ("PSUs") to certain executives under its long-term incentive plan. The number of shares of the Company’s common stock that may be issued to settle PSUs ranges from zero to two times the number of PSUs awarded. The shares issued for PSUs are determined based on the Company’s performance over a three-year measurement period and vest in their entirety at the end of the measurement period. The PSUs will be settled in shares of the Company’s common stock following the end of the three-year performance cycle. Any PSUs that have not vested at the end of the applicable measurement period are forfeited. The vesting criterion for the PSUs is based on a comparison of the Company’s total shareholder return ("TSR") for the measurement period compared with the TSRs of a group of peer companies for the same measurement period. As the vesting criterion is linked to the Company's share price, it is considered a market condition for purposes of calculating the grant-date fair value of the awards.
The fair value of the PSUs was measured at the grant date with a stochastic process method using a Monte Carlo simulation. A stochastic process is a mathematically defined equation that can create a series of outcomes over time. These outcomes are not deterministic in nature, which means that by iterating the equations multiple times, different results will be obtained for those iterations. In the case of the Company’s PSUs, the Company cannot predict with certainty the path its stock price or the stock
prices of its peers will take over the performance period. By using a stochastic simulation, the Company can create multiple prospective stock pathways, statistically analyze these simulations, and ultimately make inferences regarding the most likely path the stock price will take. As such, because future stock prices are stochastic, or probabilistic with some direction in nature, the stochastic method, specifically the Monte Carlo Model, is deemed an appropriate method by which to determine the fair value of the PSUs. Significant assumptions used in this simulation include the Company’s expected volatility, risk-free interest rate based on U.S. Treasury yield curve rates with maturities consistent with the measurement period, and the volatilities for each of the Company’s peers.
The assumptions used in valuing the PSUs granted were as follows:
|
| | | | | |
| | Year Ended December 31, |
| | 2017 | | 2016 |
| Weighted-average expected term | 2.9 years |
| | 2.7 years |
|
| Weighted-average expected volatility | 59 | % | | 58 | % |
| Weighted-average risk-free rate | 1.34 | % | | 0.87 | % |
The fair value of the PSUs granted during the years ended December 31, 2017 and 2016 was $5.1 million and $4.0 million, respectively. As of December 31, 2017, unrecognized compensation for PSUs was $5.0 million and will be amortized through 2019. A summary of the status and activity of PSUs is presented in the following table:
|
| | | | | | |
| | Number of Units1 | | Weighted-Average Grant-Date Fair Value |
| Not vested, December 31, 2015 | — |
| | $ | — |
|
| Granted | 490,713 |
| | 8.10 |
|
| Vested | — |
| | — |
|
| Forfeited | (12,203 | ) | | 8.22 |
|
| Not vested, December 31, 2016 | 478,510 |
| | 8.09 |
|
| Granted | 473,374 |
| | 10.79 |
|
| Vested | — |
| | — |
|
| Forfeited | — |
| | — |
|
| Not vested, December 31, 2017 | 951,884 |
| | $ | 9.44 |
|
1 The number of awards assumes that the associated vesting condition is met at the target amount. The final number of shares of the Company’s common stock issued may vary depending on the performance multiplier, which ranges from zero to two, depending on the level of satisfaction of the vesting condition.
12. | |
| 14. | Defined Contribution Plan |
The Company sponsors a 401(k) defined contribution plan (the "plan") for eligible employees. Effective January 1, 2017, the Company modified the plan to include a discretionary matching contribution equal to 100% of compensation deferrals not to exceed 6% of eligible compensation. The Company contributed approximately $0.7 million for year ended December 31, 2017, $0.4 million for the year ended December 31, 2016, $0.1 million for the four months ended December 31, 2015, and $0.1 million during the year ended August 31, 2015 to the plan.
The income tax provision (benefit) is comprised of the following (in thousands):
| | | As of August 31, | |
| | | 2014 | | | 2013 | | | 2012 | |
| Current: | | | | | | | | | |
| Federal | | $ | 4 | | | $ | - | | | $ | - | |
| State | | | 111 | | | | - | | | | - | |
| Total current income tax | | $ | 115 | | | $ | - | | | $ | - | |
| | | | | | | | | | | | | |
| Deferred: | | | | | | | | | | | | |
| Federal | | $ | 13,748 | | | $ | 6,367 | | | $ | 4,219 | |
| State | | | 1,151 | | | | 503 | | | | 360 | |
| Total deferred income tax | | $ | 14,899 | | | $ | 6,870 | | | $ | 4,579 | |
| | | | | | | | | | | | | |
| Valuation allowance | | | - | | | | - | | | | (4,911 | ) |
| Income tax provision (benefit) | | $ | 15,014 | | | $ | 6,870 | | | $ | (332 | ) |
F-26
|
| | | | | | | | | | | | | | | |
| | Year Ended December 31, | | Four Months Ended December 31, 2015 | | Year Ended August 31, 2015 |
| | 2017 | | 2016 | | |
| Current: | | | | | | | |
| Federal | $ | (99 | ) | | $ | 106 |
| | $ | — |
| | $ | (4 | ) |
| State | — |
| | — |
| | — |
| | (111 | ) |
| Total current income tax expense (benefit) | (99 | ) | | 106 |
| | — |
| | (115 | ) |
| | | | | | | | |
| Deferred: | | | | | | | |
| Federal | 48,631 |
| | (74,099 | ) | | (45,332 | ) | | 10,820 |
|
| State | 4,371 |
| | (6,651 | ) | | (4,074 | ) | | 972 |
|
| Total deferred income tax (benefit) expense | 53,002 |
| | (80,750 | ) | | (49,406 | ) | | 11,792 |
|
| | | | | | | | |
| Valuation allowance | (53,002 | ) | | 80,750 |
| | 39,399 |
| | — |
|
| Income tax expense (benefit) | $ | (99 | ) | | $ | 106 |
| | $ | (10,007 | ) | | $ | 11,677 |
|
A reconciliation of expected federal income taxes on income from continuing operations at statutory rates with the expense (benefit) for income taxes is presented in the following table (in thousands):
| | | | | Year Ended December 31, | | Four Months Ended December 31, 2015 | | Year Ended August 31, 2015 |
| | | As of August 31, | | 2017 | | 2016 | |
| | | 2014 | | | 2013 | | | 2012 | | | | | | | | |
| Federal income tax at statutory rate | | $ | 14,915 | | | $ | 5,594 | | | $ | 4,009 | | $ | 48,410 |
| | $ | (74,489 | ) | | $ | (45,200 | ) | | $ | 10,105 |
|
| State income taxes, net of federal tax | | | 1,341 | | | | 503 | | | | 360 | | 4,371 |
| | (6,685 | ) | | (4,062 | ) | | 908 |
|
| Statutory depletion | | | (1,266 | ) | | | (929 | ) | | | - | | (159 | ) | | (287 | ) | | (150 | ) | | (451 | ) |
| Stock based compensation | | | - | | | | 1,911 | | | | - | | |
| Stock-based compensation | | 50 |
| | 383 |
| | — |
| | 92 |
|
| Non-deductible compensation | | — |
| | — |
| | — |
| | 850 |
|
| Impact of tax reform, net of valuation allowance | | (99 | ) | | | | | | |
| Valuation allowance | | (53,002 | ) | | 80,750 |
| | 39,399 |
| | — |
|
| Other | | | 24 | | | | (209 | ) | | | 210 | | 330 |
| | 434 |
| | 6 |
| | 173 |
|
| Change in valuation allowance | | | - | | | | - | | | | (4,911 | ) | |
| Income tax provision (benefit) | | $ | 15,014 | | | $ | 6,870 | | | $ | (332 | ) | |
| Income tax expense (benefit) | | $ | (99 | ) | | $ | 106 |
| | $ | (10,007 | ) | | $ | 11,677 |
|
| Effective rate expressed as a percentage | | | 34 | % | | | 42 | % | | | 3 | % | — | % | | — | % | | 8 | % | | 39 | % |
On December 22, 2017, Congress signed Public Law No. 115-97, commonly referred to as the Tax Cut and Jobs Act of 2017 (“TCJA”). The Company reportedpassage of this legislation resulted in the change in the U.S. statutory rate from 35% to 21% beginning in January of 2018, the elimination of the corporate alternative minimum tax (“AMT”), the acceleration of depreciation for US tax purposes, limitations on deductibility of interest expense, the elimination of net operating loss carrybacks, and limitations on the use of future losses. In accordance with ASC 740, Income Taxes, the impact of a change in tax law is recorded in the period of enactment. Consequently, the Company has recorded a decrease to its net deferred tax assets of $24.0 million with a corresponding net adjustment to the valuation allowance of $4,911,000 for the year ended AugustDecember 31, 2012. 2017. The Company also eliminated the $0.1 million deferred tax asset for its AMT credits and recorded a non-current tax receivable with a corresponding benefit to current income taxes. Based on the Company's current interpretation and subject to the release of the related regulations and any future interpretive guidance, the Company believes the effects of the change in tax law incorporated herein are substantially complete. As a result of other changes introduced by the TCJA, starting with compensation paid in 2018, Section 162(m) may limit us from deducting compensation, including performance-based compensation, in excess of $1 million paid to anyone who, starting in 2018, serves as the Chief Executive Officer or Chief Financial Officer, or who is among the three most highly compensated executive officers for any fiscal year. The only exception to this rule is for compensation that is paid pursuant to a binding contract in effect on November 2, 2017 that would have otherwise been deductible under the prior Section 162(m) rules. Accordingly, any compensation
paid in the future pursuant to new compensation arrangements entered into after November 2, 2017, even if performance-based, will count towards the $1 million fiscal year deduction limit if paid to a covered executive. Additional information that may affect our income tax accounts and disclosures would include further clarification and guidance on how the Internal Revenue Service will implement tax reform, including guidance with respect to 100% bonus depreciation on self-constructed assets and Section 162(m), further clarification and guidance on how state taxing authorities will implement tax reform and the related effect on our state income tax returns, completion of our 2017 tax return filings, and the potential for additional guidance from the SEC or the FASB related to tax reform.
In assessing the realizability of deferred tax assets, the Company considers whether it is more likely than not that some portion or all of the deferred tax assets will not be realized. Management considers all available evidence (both positive and negative) in determining whether a valuation allowance is required. Such evidence includes the scheduled reversal of deferred tax liabilities, available taxes in carryback periods, projected future taxable income, and tax planning strategies in making this assessment, and judgmentassessment. Judgment is required in considering the relative weight of negative and positive evidence. The Company continues to monitor facts and circumstances in the reassessment of the likelihood that operating loss carry-forwards,carryforwards, credits, and other deferred tax assets will be utilized prior to their expiration. As a result, it may be determined that a deferred tax asset valuation allowance should be established or released. Any increases or decreases in a deferred tax asset valuation allowance would impact net income through offsetting changes in income tax expense. In 2012, the Company determined that the weight of the evidence indicated that it would more likely than not be able to realize its deferred tax asset, and the entire valuation allowance was released.
The tax effects of temporary differences that give rise to significant components of the deferred tax assets and deferred tax liabilities at each of the fiscal yearperiod ends is presented in the following table (in thousands):
|
| | | | | | | |
| | As of December 31, |
| | 2017 | | 2016 |
| Deferred tax assets (liabilities): | | | |
| Net operating loss carryforward | $ | 43,283 |
| | $ | 47,462 |
|
| Stock-based compensation | 5,237 |
| | 5,576 |
|
| Basis of oil and gas properties | (5,011 | ) | | 62,707 |
|
| Statutory depletion | 2,795 |
| | 4,028 |
|
| Unrealized loss on commodity derivative | 1,939 |
| | 1,334 |
|
| Other | (615 | ) | | (958 | ) |
| | 47,628 |
| | 120,149 |
|
| Valuation allowance on tax assets | (47,628 | ) | | (120,149 | ) |
| Deferred tax asset (liability), net | $ | — |
| | $ | — |
|
| | | As of August 31, | |
| | | 2014 | | | 2013 | |
| Deferred tax assets: | | | | | | |
| Net operating loss carry-forward | | $ | 8,589 | | | $ | 11,485 | |
| Stock-based compensation | | | 1,115 | | | | 515 | |
| Statutory depletion | | | 2,194 | | | | 929 | |
| Unrealized loss on commodity derivative | | | 70 | | | | 982 | |
| Other | | | 4 | | | | 3 | |
| Gross deferred tax assets | | $ | 11,972 | | | $ | 13,914 | |
| | | | | | | | | |
| Deferred tax liabilities: | | | | | | | | |
| Basis of oil and gas properties | | | 33,409 | | | | 20,452 | |
| Gross deferred tax liabilities | | | 33,409 | | | | 20,452 | |
| Deferred tax liability (asset), net | | $ | 21,437 | | | $ | 6,538 | |
In connection with ASU 2016-09, deferred tax assets were increased by $4.5 million related to excess benefit net operating loss carryforwards along with a $4.5 million offsetting increase in the Company's valuation allowance. The impact of the adjustments netted to zero within retained earnings.
At AugustDecember 31, 20142017, the Company has aU.S. Federal and state net operating loss carry-forward for federal tax purposescarryforward of approximately $33.2 million and state tax purposes of approximately $41.1$175.5 million that could be utilized to offset taxable income of future years. For financialThese net operating loss carryforwards will expire in various years beginning in 2025 with substantially all of the carryforwards expiring beginning in 2031.
At each reporting purposesperiod, management considers the scheduled reversal of deferred tax liabilities, available taxes in carryback periods, projected future taxable income, and tax planning strategies in making an assessment as to the future utilization of deferred tax assets. During the year ended December 31, 2017, the Company recognized a full valuation allowance on its net deferred tax assets. This decision was based on the fact that for the preceding three-year period, the Company has reported cumulative net operating losses of approximately $22.5 million and $30.4 million for federal and state, respectively. The difference of $10.7 million relates to tax deductions for compensation expense for financial reporting purposes for which the benefit will not be recognized until the related deductions reduce taxes payable. The net operating loss carryovers may be carried back two years and forward twenty years from the year the net operating loss was generated. Substantially all of the carry-forward will commence expiring in 2031, 2032, and 2033.losses.
The realization of the deferred tax assets related to the NOL carry-forwards is dependent on the Company’s ability to generate sufficient future taxable income within the applicable carryforward periods. As of August 31, 2014, the Company believes it will be able to generate sufficient future taxable income within the carryforward periods, and accordingly believes that it is more likely than not that its net deferred income tax assets will be fully realized.
The ability of the Company to utilize its NOL carry-forwardscarryforwards to reduce future taxable income is subject to various limitations under the Internal Revenue Code of 1986, as amended (the “Code”). The utilization of such carry-forwardscarryforwards may be limited upon the occurrence of certain ownership changes, including the purchase or sale of stock by 5% shareholders and the offering of stock by the Company during any three-year period resulting in an aggregate change of more than 50% in the beneficial ownership of the Company. In the event of an ownership change, Section 382 of the Code imposes an annual limitation on the amount of a Company’s taxable income that can be offset by these carry-forwards. carryforwards.
The Company completed a studyunderwent an ownership change as defined in Section 382 of the impactInternal Revenue Code on December 31, 2016, as a result of the Codeour issuance of common stock. The amount of our taxable income for tax years ending after our ownership change, which may be offset by NOL carryovers from pre-change years, will be subject to an annual limitation, known as a Section 382 limitation. The Section 382 limitation is based on future payments and determined that the statutory provisions were unlikelyvalue of our stock immediately before the ownership change multiplied by the long-term tax exempt rate in effect at the time of the ownership change, increased by built in gains recognized during the 5-year period beginning on the ownership change date. The identified change of ownership is not anticipated to limitrestrict the Company's ability to realize future tax benefits.utilize its NOLs.
As of AugustDecember 31, 2014,2017, the Company had no unrecognized tax benefits. The Company believes that there are no new items, nor changes in facts or judgments that should impact the Company’s tax position. Given the substantial NOL carry-forwardscarryforwards at both the federal and state levels, it is anticipated that any changes resulting from a tax examination would simply adjust the carry-forwards,carryforwards, and would not result in significant interest expense or penalties. Substantially of theThe Company's federal and state tax returns filed since inception are stillAugust 31, 2014 and August 31, 2013, respectively, remain subject to examination by tax authorities.
13. | Related Party Transactions |
Whenever the Company engages in transactions with its officers, directors, or other related parties, the terms of the transaction are reviewed by the disinterested directors. All transactions must be on terms no less favorable to the Company than similar transactions with unrelated parties.
Lease Agreement: The Company leases its headquarters, a field office, and an equipment storage yard under a twelve month lease agreement with HS Land & Cattle, LLC (“HSLC”). HSLC is controlled by Ed Holloway and William Scaff, Jr., the Company’s Co-Chief Executive Officers. The current lease terminates on June 30, 2015. Historically, the lease has been renewed annually. Under this agreement, the Company incurred the following expenses to HSLC for the fiscal years presented (in thousands):
| | | For the Years Ended August 31, | |
| | | 2014 | | | 2013 | | | 2012 | |
| Rent expense | | $ | 180 | | | $ | 130 | | | $ | 120 | |
Mineral Leasing Program: During 2010, the Company initiated a program to acquire mineral interests in several Colorado and Nebraska counties that are considered the eastern portion of the D-J Basin. George Seward, a member of the Company’s board of directors, agreed to lead that program. The Company agreed to compensate the persons, including Mr. Seward, to assist the Company with the acquisitions at a specific rate per qualifying net mineral acre. The compensation is paid in the form of restricted shares of the Company’s common stock, as follows:
| | | For the Years Ended August 31, | |
| | | 2014 | | | 2013 | | | 2012 | |
| Shares of restricted common stock | | | 15,883 | | | | 31,454 | | | | 188,137 | |
| Value of common stock (in thousands) | | $ | 106 | | | $ | 105 | | | $ | 491 | |
Mineral Leases Acquired from Director: Mr. Seward owns mineral interests in several Colorado and Nebraska counties. He agreed to lease his interests to the Company in exchange for restricted shares of common stock. The following table discloses the acquisition of mineral leases from Mr. Seward during each of the fiscal years presented:
| | | For the Years Ended August 31, | |
| | | 2014 | | | 2013 | | | 2012 | |
| Mineral acres leased | | | 4,844 | | | | 2,263 | | | | - | |
| Shares of restricted common stock | | | 40,435 | | | | 22,202 | | | | - | |
| Value of common stock (in thousands) | | $ | 313,000 | | | $ | 91,000 | | | $ | - | |
Revenue Distribution Processing: Effective January 1, 2012, the Company commenced processing revenue distribution payments to all persons that own a mineral interest in wells that it operates. Payments to mineral interest owners included payments to entities controlled by three of the Company’s directors, Ed Holloway, William Scaff Jr, and George Seward. The following table summarizes the royalty payments made to directors or their affiliates for the fiscal years presented (in thousands):
| | | For the Years Ended August 31, | |
| | | 2014 | | | 2013 | | | 2012 | |
| Total Royalty Payments | | $ | 292 | | | $ | 304 | | | $ | 196 | |
14.16. | Other Commitments and Contingencies |
Volume Commitments
The Company entered into firm sales agreements for its oil production with three counterparties during 2014 and entered into an additional firm sales agreement for its oil production in the third quarter 2017. Deliveries under two of the sales agreements commenced during 2015. Deliveries under the third agreement commenced in 2016. Deliveries under the fourth agreement are expected to commence in the fourth quarter of 2018. Pursuant to these agreements, we must deliver specific amounts of oil either from our own production or from oil that we acquire from third parties. If we are unable to fulfill all of our contractual obligations, we may be required to pay penalties or damages pursuant to these agreements. Our commitments over the next five years, excluding the contingent commitment described below, are as follows:
|
| | | |
| Year ending December 31, | | Oil (MBbls) |
| 2018 | | 4,485 |
|
| 2019 | | 5,167 |
|
| 2020 | | 4,003 |
|
| 2021 | | 1,672 |
|
| 2022 | | — |
|
| Thereafter | | — |
|
| Total | | 15,327 |
|
During the years ended December 31, 2017 and 2016, and four months ended December 31, 2015, the Company incurred transportation deficiency charges of $0.7 million, $0.6 million, and $2.8 million, respectively, as we were unable to meet all of the obligations during the period. No such charges were incurred during the year ended August 31, 2014,2015.
In collaboration with several other producers and DCP Midstream, LP ("DCP Midstream"), we have agreed to participate in the Company was using three rigs under contracts with Ensign United States Drilling, Inc.expansion of natural gas gathering and processing capacity in the D-J Basin. The Company estimates that its minimum future obligationfirst agreement includes a new 200 MMcf per day processing plant as well as the expansion of a related gathering system. Both are currently expected to Ensign underbe completed during the termsthird quarter of 2018, although the start-up date is undetermined at this time. Our share of the existing contractscommitment will aggregate $24 million, based upon its current drilling schedule and time requiredrequire 46.4 MMcf per day to drill each well. Allbe delivered after the plant in-service date for a period of 7 years. The second agreement also includes a new 200 MMcf per day processing plant as well as the expansion of a related gathering system. Both are currently expected to be completed in mid-2019, although the start-up date is undetermined at this time. Our share of the contracts are based upon turn-key pricing and have termination dates duringcommitment will require 43.8 MMcf per day to be delivered after the first halfplant in-service date for a period of fiscal year 2015. At the option of the Company, the drilling commitments7 years. These contractual obligations can be extended into future months, although pricing terms may be modified. Actual payments duereduced by the collective volumes delivered to Ensignthe plants by other producers in the D-J Basin that are in excess of such producers' total commitment. We expect that our development plan will depend upon a numbersupport the utilization of variables, including the surface location, the target formation, measured depth of well and other technical details.this capacity.
Litigation
From time to time, the Company receives notice fromis a party to various commercial and regulatory claims, pending or threatened legal action, and other operators of their intent to drill and operate a well in which the Company will own a working interest (a “non-operated well”). The Company has the option to participateproceedings that arise in the well and assume the obligation for its pro-rata shareordinary course of the costs. As of August 31, 2014, the Company was participating in 43 gross (6 net) new horizontal wells, with aggregate costs to its interest estimated at $26.9 million.business. It is the opinion of management that none of the current proceedings are reasonably likely to have a material adverse impact on its business, financial position, results of operations, or cash flows.
Office Leases
In September 2016, the Company entered into a new 65-month lease for the Company’s policy to accrue costs onprincipal office space located in Denver, which commenced in the first quarter of 2017. Rent under the new lease is approximately $62,000 per month. In July 2016, the Company entered into a non-operated well when it receives notice that active drilling operations have commenced. Accordingly,field office lease in Greeley which requires monthly payments of $7,500 through October 2021.
Rent expense for office leases was $1.1 million for the year ended December 31, 2017, $1.0 million for year ended December 31, 2016, $0.3 million for the four months ended December 31, 2015, and $0.3 million for the year ended August 31, 2014 financial statements include costs2015.
Vehicle Leases
In December 2017, the Company entered into a leasing arrangement for its vehicles used in our normal operations. These leases expire after four years and are classified as capital leases. The assets associated with these capital leases are recorded within "Other property and equipment, net."
A schedule of $26.9 million for these wells. the minimum lease payments under non-cancelable capital and operating leases as of December 31, 2017 follows (in thousands):
|
| | | | | | | | |
| Year ending December 31: | | Vehicles Leases | | Office Leases |
| 2018 | | $ | 76 |
| | $ | 840 |
|
| 2019 | | 37 |
| | 859 |
|
| 2020 | | 37 |
| | 878 |
|
| 2021 | | 63 |
| | 875 |
|
| 2022 | | — |
| | 477 |
|
| Thereafter | | — |
| | — |
|
| Total minimum lease payments | | $ | 213 |
| | $ | 3,929 |
|
| Less: Amount representing estimated executory cost | | (16 | ) | | |
| Net minimum lease payments | | 197 |
| | |
| Less: Amount representing interest | | (24 | ) | | |
Present value of net minimum lease payments * | | $ | 173 |
| | |
* Reflected in the balance sheet as current and non-current obligations of $63 thousand and $110 thousand, respectively, within "Accounts payable and accrued expenses" and "Other liabilities," respectively.
15. | |
| 17. | Supplemental Schedule of Information to the Consolidated Statements of Cash Flows |
The following table supplements the cash flow information presented in the consolidated financial statements for the fiscal yearsperiods presented (in thousands):
| | | | | For the Years Ended August 31, | | Year Ended December 31, | | Four Months Ended December 31, 2015 | | Year Ended August 31, 2015 |
| Supplemental cash flow information: | | 2014 | | | 2013 | | | 2012 | | 2017 | | 2016 | |
| Interest paid | | $ | 989 | | | $ | 995 | | | $ | 74 | | $ | 9,235 |
| | $ | 3,779 |
| | $ | 683 |
| | $ | 2,817 |
|
| Income taxes paid | | | - | | | | - | | | | - | | $ | — |
| | $ | 106 |
| | $ | (150 | ) | | $ | 202 |
|
| | | | | | | | | | | | | | | | | | | | |
| Non-cash investing and financing activities: | | | | | | | | | | | | | | | | | | | |
| Accrued well costs | | $ | 71,849 | | | $ | 25,491 | | | $ | 5,733 | | |
| Accrued well costs as of period end | | $ | 56,348 |
| | $ | 42,779 |
| | $ | 31,414 |
| | $ | 33,071 |
|
| Assets acquired in exchange for common stock | | | 11,184 | | | | 16,684 | | | | 1,985 | | — |
| | — |
| | 50,265 |
| | 60,221 |
|
| Asset retirement costs and obligations | | | 1,610 | | | | 1,578 | | | | 300 | | |
| Asset retirement obligations incurred with development activities | | 3,398 |
| | 773 |
| | 1,819 |
| | 7,051 |
|
| Asset retirement obligations assumed with acquisitions | | 24,696 |
| | 2,230 |
| | — |
| | — |
|
| Obligations discharged with asset retirements and divestitures | | $ | (14,332 | ) | | $ | (4,739 | ) | | $ | — |
| | $ | — |
|
| | | | | | | | | |
| Net changes in operating assets and liabilities: | | | | | | | | |
| Accounts receivable | | $ | (72,518 | ) | | $ | (13,063 | ) | | $ | 5,696 |
| | $ | 3,446 |
|
| Accounts payable and accrued expenses | | 5,823 |
| | 2,283 |
| | 3,954 |
| | (2,307 | ) |
| Revenue payable | | 47,345 |
| | 2,254 |
| | (5,441 | ) | | 4,557 |
|
| Production taxes payable | | 33,311 |
| | (7,095 | ) | | 3,631 |
| | 5,121 |
|
| Other | | (1,131 | ) | | (790 | ) | | (1,037 | ) | | (359 | ) |
| Changes in operating assets and liabilities | | $ | 12,830 |
| | $ | (16,411 | ) | | $ | 6,803 |
| | $ | 10,458 |
|
16. | |
| 18. | Unaudited Oil and Natural Gas Reserves Information |
Oil and Natural Gas Reserve Information: Proved reserves are the estimated quantities of crude oil, natural gas, and natural gas liquids which geological and engineering data demonstrate with reasonable certainty to be recoverable in future years from known reservoirs under existing economic and operating conditions (prices and costs held constant as of the date the estimate is made). Proved developed reserves are reserves that can be expected to be recovered through existing wells with existing equipment and operating methods. Proved undeveloped reserves are reserves that are expected to be recovered from new wells on undrilled acreage or from existing wells where a relatively major expenditure is required for recompletion.
Proved oil and natural gas reserve information as of the fiscal yearperiod ends presented and the related discounted future net cash flows before income taxes are based on estimates prepared by Ryder Scott Company LP.Scott. Reserve information for the properties was prepared in accordance with guidelines established by the SEC.
The reserve estimates prepared as of each of the fiscal yearperiod ends presented were prepared in accordance with “Modernization of Oil and Gas Reporting” published by the SEC. The recent guidance included updated definitions of proved developed and proved undeveloped oil and gas reserves, oil and gas producing activities and other terms.applicable SEC rules. Proved oil and natural gas reserves wereare calculated based on the prices for oil and natural gas during the 12 monthtwelve-month period before the respective reportingdetermination date, determined as the unweighted arithmetic average of the first day of the month price for each month within such period, rather than the year-end spot prices, which had been used in prior years.period. This average price is also used in calculating the aggregate amount and changes in future cash inflows related to the standardized measure of discounted future cash flows. Undrilled locations can generally be classified as having proved undeveloped reserves only if a development plan has been adopted indicating that they are scheduled to be drilled within five years. The recent guidance broadened the typesyears of technologies that may be used to establish reserve estimates.initial booking.
The following table sets forth information regarding the Company’s net ownership interests in estimated quantities of proved developed and undeveloped oil and natural gas reserve quantities and changes therein for each of the fiscal yearsperiods presented:
| | | Oil (Bbl) | | | Gas (McF) | | | Boe | |
| Balance, August 31, 2011 | | | 2,069,705 | | | | 14,261,158 | | | | 4,446,564 | |
| Revision of previous estimates | | | 429,783 | | | | 3,298,906 | | | | 979,601 | |
| Purchase of reserves in place | | | 33,328 | | | | 706,842 | | | | 151,135 | |
| Extensions, discoveries, and other additions | | | 2,788,686 | | | | 16,288,125 | | | | 5,503,374 | |
| Sale of reserves in place | | | - | | | | - | | | | - | |
| Production | | | (235,691 | ) | | | (1,109,057 | ) | | | (420,534 | ) |
| Balance, August 31, 2012 | | | 5,085,811 | | | | 33,445,974 | | | | 10,660,140 | |
| Revision of previous estimates | | | (194,236 | ) | | | (2,923,919 | ) | | | (681,556 | ) |
| Purchase of reserves in place | | | 1,000,664 | | | | 7,360,752 | | | | 2,227,456 | |
| Extensions, discoveries, and other additions | | | 1,576,301 | | | | 4,914,627 | | | | 2,395,406 | |
| Sale of reserves in place | | | - | | | | - | | | | - | |
| Production | | | (421,265 | ) | | | (2,107,603 | ) | | | (772,532 | ) |
| Balance, August 31, 2013 | | | 7,047,275 | | | | 40,689,831 | | | | 13,828,914 | |
| Revision of previous estimates | | | 83,592 | | | | 3,046,893 | | | | 591,408 | |
| Purchase of reserves in place | | | 1,028,200 | | | | 5,956,437 | | | | 2,020,939 | |
| Extensions, discoveries, and other additions | | | 9,141,836 | | | | 49,288,543 | | | | 17,356,592 | |
| Sale of reserves in place | | | (34,732 | ) | | | (56,282 | ) | | | (44,113 | ) |
| Production | | | (941,218 | ) | | | (3,747,074 | ) | | | (1,565,729 | ) |
| Balance, August 31, 2014 | | | 16,324,953 | | | | 95,178,348 | | | | 32,188,011 | |
| | | | | | | | | | | | | |
| | | | | | | | | | | | | |
| Proved developed and undeveloped reserves: | | | | | | | | | | | | |
| Developed at August 31, 2012 | | | 2,823,604 | | | | 17,380,806 | | | | 5,720,405 | |
| Undeveloped at August 31, 2012 | | | 2,262,207 | | | | 16,065,168 | | | | 4,939,735 | |
| Balance, August 31, 2012 | | | 5,085,811 | | | | 33,445,974 | | | | 10,660,140 | |
| | | | | | | | | | | | | |
| Developed at August 31, 2013 | | | 4,659,405 | | | | 25,866,008 | | | | 8,970,406 | |
| Undeveloped at August 31, 2013 | | | 2,387,870 | | | | 14,823,823 | | | | 4,858,507 | |
| Balance, August 31, 2013 | | | 7,047,275 | | | | 40,689,831 | | | | 13,828,913 | |
| | | | | | | | | | | | | |
| Developed at August 31, 2014 | | | 6,616,482 | | | | 38,161,602 | | | | 12,976,749 | |
| Undeveloped at August 31, 2014 | | | 9,708,471 | | | | 57,016,746 | | | | 19,211,262 | |
| Balance, August 31, 2014 | | | 16,324,953 | | | | 95,178,348 | | | | 32,188,011 | |
|
| | | | | | | | | | | |
| | Oil (MBbl) | | Natural Gas (MMcf) | | NGL (MBbl) | | MBOE |
| Balance, August 31, 2014 | 16,324 |
| | 95,179 |
| | — |
| | 32,188 |
|
| Revision of previous estimates | (1,699 | ) | | (4,889 | ) | | — |
| | (2,513 | ) |
| Purchase of reserves in place | 4,201 |
| | 21,957 |
| | — |
| | 7,860 |
|
| Extensions, discoveries, and other additions | 11,465 |
| | 73,392 |
| | — |
| | 23,696 |
|
| Sale of reserves in place | (629 | ) | | (4,337 | ) | | — |
| | (1,352 | ) |
| Production | (1,970 | ) | | (7,344 | ) | | — |
| | (3,194 | ) |
| Balance, August 31, 2015 | 27,692 |
| | 173,958 |
| | — |
| | 56,685 |
|
| Revision of previous estimates | (10,917 | ) | | (38,931 | ) | | — |
| | (17,407 | ) |
| Purchase of reserves in place | 4,380 |
| | 58,959 |
| | — |
| | 14,207 |
|
| Extensions, discoveries, and other additions | 8,263 |
| | 62,301 |
| | — |
| | 18,647 |
|
| Sale of reserves in place | (2,297 | ) | | (14,149 | ) | | — |
| | (4,655 | ) |
| Production | (742 | ) | | (3,468 | ) | | — |
| | (1,320 | ) |
| Balance, December 31, 2015 | 26,379 |
| | 238,670 |
| | — |
| | 66,157 |
|
| Revision of previous estimates | (7,788 | ) | | (80,549 | ) | | — |
| | (21,213 | ) |
| Purchase of reserves in place | 23,141 |
| | 197,103 |
| | — |
| | 55,991 |
|
| Extensions, discoveries, and other additions | 1,457 |
| | 13,018 |
| | — |
| | 3,627 |
|
| Sale of reserves in place | (2,900 | ) | | (24,235 | ) | | — |
| | (6,939 | ) |
| Production | (2,257 | ) | | (12,086 | ) | | — |
| | (4,271 | ) |
| Balance, December 31, 2016 | 38,032 |
| | 331,921 |
| | — |
| | 93,352 |
|
| Revision of previous estimates | (3,038 | ) | | (66,413 | ) | | 28,689 |
| | 14,581 |
|
| Purchase of reserves in place | 12,150 |
| | 117,167 |
| | 13,424 |
| | 45,103 |
|
| Extensions, discoveries, and other additions | 28,736 |
| | 206,644 |
| | 24,358 |
| | 87,535 |
|
| Sale of reserves in place | (660 | ) | | (4,592 | ) | | — |
| | (1,425 | ) |
| Production | (5,824 | ) | | (24,834 | ) | | (2,518 | ) | | (12,481 | ) |
| Balance, December 31, 2017 | 69,396 |
| | 559,893 |
| | 63,953 |
| | 226,665 |
|
| | | | | | | | |
| Proved developed and undeveloped reserves: | | | | | | | |
| Developed at August 31, 2015 | 7,393 |
| | 46,026 |
| | — |
| | 15,064 |
|
| Undeveloped at August 31, 2015 | 20,299 |
| | 127,932 |
| | — |
| | 41,621 |
|
| Balance, August 31, 2015 | 27,692 |
| | 173,958 |
| | — |
| | 56,685 |
|
| | | | | | | | |
| Developed at December 31, 2015 | 8,410 |
| | 56,751 |
| | — |
| | 17,868 |
|
| Undeveloped at December 31, 2015 | 17,969 |
| | 181,919 |
| | — |
| | 48,289 |
|
| Balance, December 31, 2015 | 26,379 |
| | 238,670 |
| | — |
| | 66,157 |
|
| | | | | | | | |
| Developed at December 31, 2016 | 7,435 |
| | 62,570 |
| | — |
| | 17,863 |
|
| Undeveloped at December 31, 2016 | 30,597 |
| | 269,351 |
| | — |
| | 75,489 |
|
| Balance, December 31, 2016 | 38,032 |
| | 331,921 |
| | — |
| | 93,352 |
|
| | | | | | | | |
| Developed at December 31, 2017 | 26,552 |
| | 219,279 |
| | 24,251 |
| | 87,350 |
|
| Undeveloped at December 31, 2017 | 42,844 |
| | 340,614 |
| | 39,702 |
| | 139,315 |
|
| Balance, December 31, 2017 | 69,396 |
| | 559,893 |
| | 63,953 |
| | 226,665 |
|
Notable changes in proved reserves for the year ended AugustDecember 31, 20142017 included:
· | Purchases of reserves in place. In 2014, purchases of minerals in place of 2.0 million Boe were attributable to the acquisition of producing oil and gas wells and undeveloped acreage from Trilogy Resources, LLC and Apollo Operating, LLC. Please see the Acquisitions footnotePurchases of reserves in place. For the year ended December 31, 2017, purchases of reserves in place of 45,103 MBOE were primarily attributable to the acquisition of proved reserves in the GCII Acquisition. Please see Note 3 for further information. Revision of previous estimates. For the year ended December 31, 2017, revisions to previous estimates increased proved developed and undeveloped reserves by a net amount of 14,581 MBOE primarily as a result of updated pricing as well as shifting from reporting reserves on a 2-stream to a 3-stream basis. Extensions and discoveries. For the year ended December 31, 2017, total extensions and discoveries of 87,535 MBOE were primarily attributable to extending our development plan by a year due to the passage of time, the addition of a third rig for the second and third years of our development plan, and the drilling and completion of wells not previously proved. |
· | Revision of previous estimates. In 2014, revisions to previous estimates increased proved developed and undeveloped reserves by a net amount of 591,408 Boe. The prices for the 2014 oil and gas reserves are based on the 12 month arithmetic average for the first of month price September 1, 2013 through August 31, 2014. The 2014 crude oil price of $89.48 per barrel (West Texas Intermediate Cushing) was $3.08 higher than the 2013 crude oil price of $86.40 per barrel. The 2014 natural gas price of $5.03 per mcf (Henry Hub) was $0.63 higher than the 2013 price of $4.40 per mcf.
|
· | Extensions and discoveries. In 2014, total extensions and discoveries of 17.4 million Boe were primarily attributable to successful drilling in the Wattenberg Field. The new producing wells in this area and their adjacent proved undeveloped locations added during the year increased the Company’s proved reserves.
|
Notable changes in proved reserves for the year ended AugustDecember 31, 20132016 included:
· | Purchases of reserves in place. In 2013, purchases of minerals in place of 2.2 million Boe were attributable to the acquisition of 36 producing oil and gas wells and undeveloped acreage from Orr Energy, LLC. Please see the Acquisitions footnote for further information.
|
· | Purchases of reserves in place. For the year ended December 31, 2016, purchases of reserves in place of 55,991 MBOE were primarily attributable to the acquisition of proved reserves in the GC Acquisition. Please see Note 3 for further information. Revision of previous estimates. For the year ended December 31, 2016, revisions to previous estimates decreased proved developed and undeveloped reserves by a net amount of 21,213 MBOE primarily as a result of the GC Acquisition and related changes to our development plan that resulted in the removal of certain legacy PUD locations from the three-year drilling plan. Extensions and discoveries. For the year ended December 31, 2016, total extensions and discoveries of 3,627 MBOE were primarily attributable to successful drilling in the Wattenberg Field. In addition, successful drilling by other operators in adjacent acreage allowed us to increase our proved undeveloped locations.In 2013, revisions to previous estimates decreased proved developed and undeveloped reserves by a net amount of 681,556 Boe as the Company’s drilling schedule was adjusted to reflect the elimination of previously planned vertical drilling locations as the development focus shifted from vertical to horizontal drilling. |
· | Extensions and discoveries. In 2013, total extensions and discoveriesNotable changes in proved reserves for the four months ended December 31, 2015 included:
Purchases of reserves in place. For the four months ended December 31, 2015, purchases of reserves in place of 14,207 MBOE were attributable to the acquisition of 2.4 million Boe were primarily attributable to successful drilling in the Wattenberg Field. The new producing wells in this area and their adjacent proved undeveloped locations added during the year increased the Company’s proved reserves. Please see Note 3 for further information. Revision of previous estimates. For the four months ended December 31, 2015, revisions to previous estimates decreased proved developed and undeveloped reserves by a net amount of 17,407 MBOE. As the Company continued to revise its drilling plans, the development plan was changed to remove undeveloped reserves that were not projected to be drilled in the subsequent three years and reflected the lower development costs anticipated from transitioning to a monobore wellbore design and longer horizontal wells; in addition, we high-graded our inventory of wells to be drilled. Extensions and discoveries. For the four months ended December 31, 2015, total extensions and discoveries of 18,647 MBOE were primarily attributable to successful drilling in the Wattenberg Field. In addition, successful drilling by other operators in adjacent acreage allowed us to increase our proved undeveloped locations. |
Notable changes in proved reserves for the year ended August 31, 20122015 included:
· | Purchases of reserves in place. In 2012, purchases of minerals in place of 151,135 Boe were attributable to the acquisition of additional working interests in existing wells that the Company already operates.
|
· | Revision of previous estimates. In 2012, revisions to previous estimates increased proved developed and undeveloped reserves by a net amount of 979,601 Boe. Included in these revisions were 451,000 Boe of upward adjustments caused by higher crude oil and natural gas prices, and 528,601 Boe of net upward adjustments attributable to reservoir analysis and well performance.
|
· | Extensions and discoveries. In 2012, total extensions and discoveries of 5.5 million Boe were primarily attributable to successful drilling in the Wattenberg Field. The new producing wells in this area and their adjacent proved undeveloped locations added during the year increased the Company’s proved reserves.
|
F-31Purchases of reserves in place. For the year ended August 31, 2015, purchases of reserves in place of 7,860 MBOE were attributable to the acquisition of proved reserves.
Revision of previous estimates. For the year ended August 31, 2015, revisions to previous estimates decreased proved developed and undeveloped reserves by a net amount of 2,513 MBOE. As the Company continued to revise its drilling plans toward horizontal drilling, the vertical proved undeveloped and vertical developed non-producing locations were removed from its development plan.
Extensions and discoveries. For the year ended August 31, 2015, total extensions and discoveries of 23,696 MBOE were primarily attributable to successful drilling in the Wattenberg Field. The Company drilled 67 vertical exploratory wells. In addition, successful drilling by other operators in adjacent acreage allowed us to increase our proved undeveloped locations.
Standardized Measure of Discounted Future Net Cash Flows: The following analysis is adiscussion relates to the standardized measure of future net cash flows from our proved reserves and changes therein related to estimated proved reserves. Future oil and natural gas sales have been computed by applying average prices of oil and natural gas during each of the fiscal years presented.as discussed below. Future production and development costs were computed by estimating the expenditures to be incurred in developing and producing the proved oil and natural gas reserves at the end of the year,period based on year-endperiod-end costs. The calculation assumes the continuation of existing economic conditions, including the use of constant prices and costs. Future income tax expenses were calculated by applying year-endperiod-end statutory tax rates, with consideration of future tax rates already legislated, to future pretax cash flows relating to proved oil and natural gas reserves, less the tax basis of properties involved and tax credits and loss carry-forwardscarryforwards relating to oil and
natural gas producing activities. All cash flow amounts are discounted at 10% annually to derive the standardized measure of discounted future cash flows. Actual future cash inflows may vary considerably, and the standardized measure does not necessarily represent the fair value of the Company’s oil and natural gas reserves. Actual future net cash flows from oil and gas properties will also be affected by factors such as actual prices the Company receives for oil and natural gas, the amount and timing of actual production, supply of and demand for oil and natural gas, and changes in governmental regulations or taxation.
The following table sets forth the Company’s future net cash flows relating to proved oil and natural gas reserves based on the standardized measure prescribed inby the ASCSEC (in thousands):
| | | For the Years Ended August 31, | |
| | | 2014 | | | 2013 | | | 2012 | |
| Future cash inflow | | $ | 1,839,987 | | | $ | 749,030 | | | $ | 537,462 | |
| Future production costs | | | (395,019 | ) | | | (146,352 | ) | | | (85,612 | ) |
| Future development costs | | | (412,517 | ) | | | (108,290 | ) | | | (100,821 | ) |
| Future income tax expense | | | (252,925 | ) | | | (113,545 | ) | | | (109,349 | ) |
| Future net cash flows | | | 779,526 | | | | 380,843 | | | | 241,680 | |
| 10% annual discount for estimated timing of cash flows | | | (376,827 | ) | | | (199,111 | ) | | | (139,175 | ) |
| Standardized measure of discounted future net cash flows | | $ | 402,699 | | | $ | 181,732 | | | $ | 102,505 | |
|
| | | | | | | | | | | | | | | |
| | As of December 31, | | As of August 31, 2015 |
| | 2017 | | 2016 | | 2015 | |
| Future cash inflow | $ | 5,493,507 |
| | $ | 2,180,673 |
| | $ | 1,710,610 |
| | $ | 2,046,615 |
|
| Future production costs | (1,291,369 | ) | | (644,093 | ) | | (462,097 | ) | | (653,009 | ) |
| Future development costs | (1,048,856 | ) | | (584,537 | ) | | (340,449 | ) | | (510,720 | ) |
| Future income tax expense | (285,349 | ) | | (90,195 | ) | | (108,172 | ) | | (144,399 | ) |
| Future net cash flows | 2,867,933 |
| | 861,848 |
| | 799,892 |
| | 738,487 |
|
| 10% annual discount for estimated timing of cash flows | (1,267,258 | ) | | (427,587 | ) | | (408,939 | ) | | (372,658 | ) |
| Standardized measure of discounted future net cash flows | $ | 1,600,675 |
| | $ | 434,261 |
| | $ | 390,953 |
| | $ | 365,829 |
|
There have been significant fluctuations in the posted prices of oil and natural gas during the last three years. Prices actually received from purchasers of the Company’s oil and natural gas are adjusted from posted prices for location differentials, quality differentials, and BTUBtu content. Estimates of the Company’s reserves are based on realized prices.
The following table presents the prices used to prepare the reserve estimates based upon the unweighted arithmetic average of the first day of the month price for each month within the 12 monthtwelve-month period prior to the end of the respective reporting period presented:
presented as adjusted for our differentials:
| | | Oil (Bbl) | | | Gas (Mcf) | |
| August 31, 2012 (Average) | | $ | 86.68 | | | $ | 3.76 | |
| August 31, 2013 (Average) | | $ | 86.40 | | | $ | 4.40 | |
| August 31, 2014 (Average) | | $ | 89.48 | | | $ | 4.20 | |
|
| | | | | | | | | | | |
| | Oil (Bbl) | | Natural Gas (Mcf) | | NGL (Bbl) |
| December 31, 2017 (Average) | $ | 46.57 |
| | $ | 2.21 |
| | $ | 16.06 |
|
| December 31, 2016 (Average) | $ | 36.07 |
| | $ | 2.44 |
| | $ | — |
|
| December 31, 2015 (Average) | $ | 41.33 |
| | $ | 2.60 |
| | $ | — |
|
| August 31, 2015 (Average) | $ | 53.27 |
| | $ | 3.28 |
| | $ | — |
|
F-32
The prices for the December 31, 2017 oil and natural gas reserves are based on the twelve-month arithmetic average for the first of month prices as adjusted for our differentials from January 1, 2017 through December 31, 2017. The December 31, 2017 oil price of $46.57 per barrel (West Texas Intermediate Cushing) was $10.50 higher than the December 31, 2016 oil price of $36.07 per barrel. The December 31, 2017 natural gas price of $2.21 per Mcf (Henry Hub) was $0.23 lower than the December 31, 2016 price of $2.44 per Mcf.
Changes in the Standardized Measure of Discounted Future Net Cash Flows: The principle sources of change in the standardized measure of discounted future net cash flows are (in thousands):
| | | For the Years Ended August 31, | |
| | | 2014 | | | 2013 | | | 2012 | |
| Standardized measure, beginning of year | | $ | 181,732 | | | $ | 102,505 | | | $ | 57,550 | |
| Sale and transfers, net of production costs | | | (86,808 | ) | | | (38,569 | ) | | | (21,321 | ) |
| Net changes in prices and production costs | | | 15,828 | | | | (4,550 | ) | | | (6,023 | ) |
| Extensions, discoveries, and improved recovery | | | 300,087 | | | | 70,191 | | | | 69,073 | |
| Changes in estimated future development costs | | | (20,817 | ) | | | (6,006 | ) | | | (42,578 | ) |
| Development costs incurred during the period | | | 15,000 | | | | 5,106 | | | | 39,739 | |
| Revision of quantity estimates | | | 4,589 | | | | (14,214 | ) | | | 21,058 | |
| Accretion of discount | | | 23,612 | | | | 35,103 | | | | 15,379 | |
| Net change in income taxes | | | (76,616 | ) | | | (7,850 | ) | | | (30,832 | ) |
| Divestitures of reserves | | | (925 | ) | | | - | | | | - | |
| Purchase of reserves in place | | | 47,017 | | | | 40,016 | | | | 460 | |
| Standardized measure, end of year | | $ | 402,699 | | | $ | 181,732 | | | $ | 102,505 | |
|
| | | | | | | | | | | | | | | |
| | Year Ended December 31, | | Four Months Ended December 31, 2015 | | Year Ended August 31, 2015 |
| | 2017 | | 2016 | | |
| Standardized measure, beginning of period | $ | 434,261 |
| | $ | 390,953 |
| | $ | 365,829 |
| | $ | 402,699 |
|
| Sale and transfers, net of production costs | (306,754 | ) | | (81,468 | ) | | (25,222 | ) | | (98,486 | ) |
| Net changes in prices and production costs | 135,525 |
| | (64,387 | ) | | (81,968 | ) | | (233,051 | ) |
| Extensions, discoveries, and improved recovery | 811,564 |
| | 18,795 |
| | 116,343 |
| | 173,918 |
|
| Changes in estimated future development costs | (25,969 | ) | | (6,016 | ) | | (7,195 | ) | | 10,002 |
|
| Previously estimated development costs incurred during the period | 170,296 |
| | 62,502 |
| | 5,923 |
| | 4,957 |
|
| Revision of quantity estimates | 165,267 |
| | (110,306 | ) | | (36,820 | ) | | (38,340 | ) |
| Accretion of discount | 47,635 |
| | 44,703 |
| | 14,610 |
| | 57,629 |
|
| Net change in income taxes | (113,523 | ) | | 5,104 |
| | 25,263 |
| | 58,547 |
|
| Divestitures of reserves | (7,157 | ) | | (26,839 | ) | | (43,754 | ) | | (19,234 | ) |
| Purchase of reserves in place | 260,999 |
| | 228,855 |
| | 77,024 |
| | 56,795 |
|
| Changes in timing and other | 28,531 |
| | (27,635 | ) | | (19,080 | ) | | (9,607 | ) |
| Standardized measure, end of period | $ | 1,600,675 |
| | $ | 434,261 |
| | $ | 390,953 |
| | $ | 365,829 |
|
17. | |
| 19. | Unaudited Quarterly Financial Data |
The Company’s unaudited quarterly financial information for the years ended August 31, 2014 and 2013 is as follows (in thousands, except share data):
| | | | | For the Year Ended August 31, 2014 | | Year Ended December 31, 2017 |
| | | First Quarter | | | Second Quarter | | | Third Quarter | | | Fourth Quarter | | First Quarter | | Second Quarter | | Third Quarter | | Fourth Quarter |
| Revenues | | $ | 19,266 | | | $ | 23,028 | | | $ | 25,672 | | | $ | 36,253 | | $ | 43,790 |
| | $ | 75,036 |
| | $ | 103,593 |
| | $ | 140,097 |
|
| Expenses | | | 12,048 | | | | 13,550 | | | | 14,413 | | | | 20,744 | | 27,536 |
| | 48,514 |
| | 57,461 |
| | 71,420 |
|
| Operating income | | | 7,218 | | | | 9,478 | | | | 11,259 | | | | 15,509 | | 16,254 |
| | 26,522 |
| | 46,132 |
| | 68,677 |
|
| Other income (expense) | | | 2,269 | | | | (1,979 | ) | | | (983 | ) | | | 1,096 | | 3,626 |
| | 1,414 |
| | (2,284 | ) | | (17,958 | ) |
| Income before income taxes | | | 9,487 | | | | 7,499 | | | | 10,276 | | | | 16,605 | | 19,880 |
| | 27,936 |
| | 43,848 |
| | 50,719 |
|
| Income tax provision | | | 3,387 | | | | 2,338 | | | | 3,116 | | | | 6,173 | | |
| Income tax benefit | | — |
| | — |
| | — |
| | (99 | ) |
| Net income | | $ | 6,100 | | | $ | 5,161 | | | $ | 7,160 | | | $ | 10,432 | | $ | 19,880 |
| | $ | 27,936 |
| | $ | 43,848 |
| | $ | 50,818 |
|
Net income per common share:(1) | | | | | | | | | | | | | | | | | | | | | | | |
| Basic | | $ | 0.08 | | | $ | 0.07 | | | $ | 0.09 | | | $ | 0.13 | | $ | 0.10 |
| | $ | 0.14 |
| | $ | 0.22 |
| | $ | 0.23 |
|
| Diluted | | $ | 0.08 | | | $ | 0.07 | | | $ | 0.09 | | | $ | 0.13 | | |
| Weighted average shares outstanding: | | | | | | | | | | | | | | | | | |
Diluted (2) | | $ | 0.10 |
| | $ | 0.14 |
| | $ | 0.22 |
| | $ | 0.23 |
|
| Weighted-average shares outstanding: | | | | | | | | |
| Basic | | | 73,674,865 | | | | 76,203,938 | | | | 77,176,420 | | | | 77,771,916 | | 200,707,891 |
| | 200,831,063 |
| | 200,881,447 |
| | 222,072,930 |
|
| Diluted | | | 76,044,605 | | | | 77,990,416 | | | | 79,008,619 | | | | 79,698,720 | | 201,309,251 |
| | 201,224,172 |
| | 201,460,915 |
| | 222,917,611 |
|
| | | | | For the Year Ended August 31, 2013 | | Year Ended December 31, 2016 |
| | | First Quarter | | | Second Quarter | | | Third Quarter | | | Fourth Quarter | | First Quarter | | Second Quarter | | Third Quarter | | Fourth Quarter |
| Revenues | | $ | 8,314 | | | $ | 10,921 | | | $ | 12,314 | | | $ | 14,674 | | $ | 18,273 |
| | $ | 23,947 |
| | $ | 26,234 |
| | $ | 38,695 |
|
| Expenses | | | 4,768 | | | | 6,439 | | | | 7,449 | | | | 8,022 | | 71,356 |
| | 172,157 |
| | 45,887 |
| | 29,324 |
|
| Operating income | | | 3,546 | | | | 4,482 | | | | 4,865 | | | | 6,652 | | |
| Operating income (loss) | | (53,083 | ) | | (148,210 | ) | | (19,653 | ) | | 9,371 |
|
| Other income (expense) | | | 7 | | | | (146 | ) | | | 451 | | | | (3,406 | ) | 1,682 |
| | (5,537 | ) | | 417 |
| | (4,070 | ) |
| Income before income taxes | | | 3,553 | | | | 4,336 | | | | 5,316 | | | | 3,246 | | |
Income tax provision(2) | | | 1,315 | | | | 1,604 | | | | 1,701 | | | | 2,250 | | |
| Net income | | $ | 2,238 | | | $ | 2,732 | | | $ | 3,615 | | | $ | 996 | | |
Net income per common share:(1) | | | | | | | | | | | | | | | | | |
| Income (loss) before income taxes | | (51,401 | ) | | (153,747 | ) | | (19,236 | ) | | 5,301 |
|
| Income tax expense | | — |
| | 101 |
| | 5 |
| | — |
|
| Net income (loss) | | $ | (51,401 | ) | | $ | (153,848 | ) | | $ | (19,241 | ) | | $ | 5,301 |
|
Net income (loss) per common share: (1) | | | | | | | | |
| Basic | | $ | (0.42 | ) | | $ | (0.89 | ) | | $ | (0.10 | ) | | $ | 0.03 |
|
Diluted (2) | | $ | (0.42 | ) | | $ | (0.89 | ) | | $ | (0.10 | ) | | $ | 0.03 |
|
| Weighted-average shares outstanding: | | | | | | | | |
| Basic | | $ | 0.04 | | | $ | 0.05 | | | $ | 0.07 | | | $ | 0.02 | | 121,392,736 |
| | 172,013,551 |
| | 200,515,555 |
| | 200,585,800 |
|
| Diluted | | $ | 0.04 | | | $ | 0.05 | | | $ | 0.06 | | | $ | 0.01 | | 121,392,736 |
| | 172,013,551 |
| | 200,515,555 |
| | 201,254,678 |
|
| Weighted average shares outstanding: | | | | | | | | | | | | | | | | | |
| Basic | | | 51,661,704 | | | | 54,900,326 | | | | 55,238,098 | | | | 66,283,325 | | |
| Diluted | | | 53,616,182 | | | | 56,481,752 | | | | 58,918,586 | | | | 70,176,105 | | |
| |
1 | The sum of net income (loss) per common share for the four quarters may not agree with the annual amount reported because the number used as the denominator for each quarterly computation is based on the weighted-average number of shares outstanding during that quarter whereas the annual computation is based upon an average for the entire year. |
| |
2 | Common share equivalents were excluded from the calculation of net income (loss) per share as the inclusion of the common share equivalents was anti-dilutive. |
2
| For the three months ended August 31, 2013, income taxes were provided at a higher than expected rate due to a downward adjustment in the deferred tax asset related to the expiration of underlying stock options. |
Exercise of Series C Warrants
Subsequent to August 31, 2014, the Company issued approximately 1.3 million shares pursuant to the exercise of Series C warrants and received proceeds of approximately $7.9 million.
SIGNATURES
Pursuant to the requirements of Section 13 or 15(a) of the Securities Exchange Act of 1934, the Registrant has duly caused this Report to be signed on its behalf by the undersigned, thereunto duly authorized on the 22nd21st day of June, 2015 .February 2018.
|
| SYNERGY RESOURCES CORPORATION | |
| | SRC Energy Inc. |
| | |
| | /s/ Ed Holloway | Lynn A. Peterson |
| | Ed Holloway, Co-ChiefLynn A. Peterson, Principal Executive Officer
(Principal Executive Officer)
| |
| | |
| | |
| | /s/ William E Scaff, Jr | James P. Henderson |
| | William E Scaff, Jr, Co- Chief ExecutiveJames P. Henderson, Principal Financial Officer
(Principal Executive Officer)
| |
| | |
| | | /s/ Jared C. Grenzenbach |
| | /s/ Frank L. Jennings | |
| Frank L. Jennings, Chief Financial Officer
(Principal Financial andJared C. Grenzenbach, Principal Accounting Officer)
| |
| | |
| | Officer |
Pursuant to the requirements of the Securities Exchange Act of l934, this Report has been signed below by the following persons on behalf of the Registrant and in the capacities and on the dates indicated.
|
| | | | |
| Signature | | Title | | Date |
| | | | | |
/s/ Ed HollowayLynn A. Peterson | | Co-ChiefPresident, Chief Executive Officer, and Director | | June 22, 2015February 21, 2018 |
Ed HollowayLynn A. Peterson | | (Principal Executive Officer) | | |
| | | | | |
/s/ William E. Scaff, Jr.Jack N. Aydin | | Co-Chief Executive Officer, Treasurer and Director | | June 22, 2015February 21, 2018 |
William E. Scaff, Jr.Jack N. Aydin | | (Principal Execuive Officer) | | |
| | | | | |
/s/ Frank L. JenningsDaniel E. Kelly | | Chief Financial Officer Director | | June 22, 2015February 21, 2018 |
Frank L. JenningsDaniel E. Kelly | | (Principal Financial and Principal Accounting Officer) | | |
| | | | | |
/s/ Rick WilberPaul Korus | | Director | | June 22, 2015February 21, 2018 |
Rick WilberPaul Korus | | | | |
| | | | | |
| /s/ Raymond E. McElhaney | | Director | | June 22, 2015February 21, 2018 |
| Raymond E. McElhaney | | | | |
| | | | | |
/s/ Bill M. ConradJennifer S. Zucker | | Director | | June 22, 2015February 21, 2018 |
Bill M. Conrad | | | | |
| | | | |
/s/ R. W. Noffsinger, III | | Director | | June 22, 2015 |
R. W. Noffsinger, III | | | | |
| | | | |
/s/ George Seward | | Director | | June 22, 2015 |
George Seward | | | | |
| | | | |
/s/ Jack Aydin | | Director | | June 22, 2015 |
Jack Aydin | | | | |
| Jennifer S. Zucker | | | | |
GLOSSARY OF UNITS OF MEASUREMENT AND INDUSTRY TERMS
Units of Measurement
The following presents a list of units of measurement used throughout the document:
Bbl - One stock tank barrel of oil or 42 U.S. gallons liquid volume of NGLs.
Bcf - One billion cubic feet of natural gas volume.
BOE - One barrel of oil equivalent, which combines Bbls of oil, Mcf of natural gas by converting each six Mcf of natural gas to one Bbl of oil, and Bbls of NGLs.
BOED - BOE per day.
Btu - British thermal unit.
MBOE - One thousand BOE.
MMBbls - One million barrels of oil.
Mcf - One thousand cubic feet of natural gas volume.
MMBtu - One million British thermal units.
MMcf - One million cubic feet of natural gas volume.
MMcf/d - MMcf per day.
Glossary of Industry Terms
The following are abbreviations and definitions of terms commonly used in the oil and gas industry and this report:
Completion - Refers to the work performed and the installation of permanent equipment for the production of oil and natural gas from a recently drilled well.
Developed acreage - Acreage assignable to productive wells.
Development well - A well drilled within the proved area of an oil or gas reservoir to the depth of a stratigraphic horizon known to be productive.
Differentials - The difference between the oil and natural gas index spot price and the corresponding cash spot price in a specified location.
Dry gas - Natural gas is considered dry when its composition is over 90% pure methane.
Dry well or dry hole- A well found to be incapable of producing hydrocarbons in sufficient quantities to justify completion as an oil or natural gas well.
EURs - Estimated ultimate recovery.
Exploratory well- A well drilled to find a new field or to find a new reservoir in a field previously found to be productive of oil or natural gas in another reservoir.
Extensions and discoveries - As to any period, the increases to proved reserves from all sources other than the acquisition of proved properties or revisions of previous estimates.
Farm-out - Transfer of all or part of the operating rights from a working interest owner to an assignee, who assumes all or some of the burden of development in return for an interest in the property. The assignor usually retains an overriding royalty interest but may retain any type of interest.
Gross acres or wells - Refers to the total acres or wells in which we have a working interest.
Henry Hub - Henry Hub index. Natural gas distribution point where prices are set for natural gas futures contracts traded on the NYMEX.
Horizontal drilling- A drilling technique that permits the operator to drill a horizontal wellbore from the bottom of a vertical section of a well and thereby to contact and intersect a larger portion of the producing horizon than conventional vertical drilling
techniques allow and may, depending on the horizon, result in increased production rates and greater ultimate recoveries of hydrocarbons.
Horizontal well- A well that has been drilled using the horizontal drilling technique. The term "horizontal wells" include wells where the productive length of the wellbore is drilled more or less horizontal to the earth's surface, to intersect the target formation on a parallel basis.
Hydraulically fracture or Hydraulic fracturing - a procedure to stimulate production by forcing a mixture of fluid and proppant into the formation under high pressure. Fracturing creates artificial fractures in the reservoir rock to increase permeability, thereby allowing the release of trapped hydrocarbons.
Joint interest billing - Process of billing/invoicing the costs related to well drilling, completions, and production operations among working interest partners.
Natural gas liquid(s) or NGL(s) - Hydrocarbons which can be extracted from "wet" natural gas and become liquid under various combinations of increasing pressure and lower temperature. NGLs include ethane, propane, butane, and other condensates.
Net acres or wells - Refers to gross acres or wells we own multiplied, in each case, by our percentage working interest.
Net revenue interest - Refers to all working interests less all royalties.
Net production- Oil and natural gas production that we own less royalties and production due to others.
Non-operated - A project in which another entity has responsibility over the daily operation of the project.
NYMEX- New York Mercantile Exchange.
OPEC - the Organization of Petroleum Exporting Countries.
Operator - The individual or company responsible for the exploration, development, and/or production of an oil or natural gas well or lease.
Overriding royalty - An interest which is created out of the operating or working interest. Its term is coextensive with that of the operating interest.
Possible reserves - This term is defined in SEC Regulation S-X Section 4-10(a) and refers to those reserves that are less certain to be recovered than probable reserves. When deterministic methods are used, the total quantities ultimately recovered from a project have a low probability to exceed the sum of proved, probable and possible reserves. When probabilistic methods are used, there must be at least a 10 percent probability that the actual quantities recovered will equal or exceed the sum of proved, probable and possible estimates.
Present value of future net revenues or PV-10 - PV-10 is a Non-GAAP financial measure calculated before the imposition of corporate income taxes. It is derived from the standardized measure of discounted future net cash flows relating to proved oil and natural gas reserves prepared in accordance with the provisions of Accounting Standards Codification Topic 932, Extractive Activities - Oil and Gas. The standardized measure of discounted future net cash flows is determined by using estimated quantities of proved reserves and the periods in which they are expected to be developed and produced based on specified economic conditions. The estimated future production is based upon benchmark prices that reflect the unweighted arithmetic average of the first-day-of-the-month price for oil and natural gas during the relevant period. The resulting estimated future cash inflows are then reduced by estimated future costs to develop and produce reserves based on current cost levels. No deduction is made for the depletion of historical costs or for indirect costs, such as general corporate overhead. Present values are computed by discounting future net revenues by 10% per year.
Probable reserves - This term is defined in SEC Regulation S-X Section 4-10(a) and refers to those reserves that are less certain to be recovered than proved reserves but which, together with proved reserves, are as likely as not to be recovered. When deterministic methods are used, it is as likely as not that actual remaining quantities recovered will exceed the sum of estimated proved plus probable reserves. Similarly, when probabilistic methods are used, there must be at least a 50 percent probability that the actual quantities recovered will equal or exceed the proved plus probable reserves estimates.
Productive well - A well that is not a dry well or dry hole, as defined above, and includes wells that are mechanically capable of production.
Proved developed non-producing reservesor PDNPs - Reserves that consist of (i) proved reserves from wells which have been completed and tested but are not producing due to lack of market or minor completion problems which are expected to be corrected and/or (ii) proved reserves currently behind the pipe in existing wells and which are expected to be productive due to both the well log characteristics and analogous production in the immediate vicinity of the wells.
Proved developed producing reserves or PDPs- Proved reserves that can be expected to be recovered from currently producing zones under the continuation of present operating methods.
Proved developed reserves - The combination of proved developed producing and proved developed non-producing reserves.
Proved reserves - This term means "proved oil and natural gas reserves" as defined in SEC Regulation S-X Section 4-10(a) and refers to those quantities of oil and condensate, natural gas, and NGLs, which, by analysis of geoscience and engineering data, can be estimated with reasonable certainty to be economically producible - from a given date forward, from known reservoirs, and under existing conditions, operating methods, and government regulations - prior to the time at which contracts providing the right to operate expire, unless evidence indicates that renewal is reasonably certain, regardless of whether deterministic or probabilistic methods are used for the estimation.
Proved undeveloped reserves or PUDs- Proved reserves that are expected to be recovered from new wells on undrilled acreage, or from existing wells where a relatively major expenditure is required for recompletion.
Recomplete or Recompletion - The modification of an existing well for the purpose of producing oil and natural gas from a different producing formation.
Reserves - Estimated remaining quantities of oil, natural gas, and NGLs or related substances anticipated to be economically producible, as of a given date, by application of development projects to known accumulations. In addition, there must exist, or there must be a reasonable expectation that there will exist, the legal right to produce or a revenue interest in the production, installed means of delivering oil, natural gas, and NGLs or related substances to market, and all permits and financing required to implement the project.
Royalty - An interest in an oil and natural gas lease or mineral interest that gives the owner of the royalty the right to receive a portion of the production from the leased acreage or mineral interest (or of the proceeds of the sale thereof), but generally does not require the owner to pay any portion of the costs of drilling or operating the wells on the leased acreage. Royalties may be either landowner’s royalties, which are reserved by the owner of the leased acreage at the time the lease is granted, or overriding royalties, which are usually reserved by an owner of the leasehold in connection with a transfer to a subsequent owner.
Section - A square tract of land one mile by one mile, containing 640 acres.
Spud - To begin drilling; the act of beginning a hole.
Standardized measure of discounted future net cash flows or standardized measure- Future net cash flows discounted at a rate of 10%. Future net cash flows represent the estimated future revenues to be generated from the production of proved reserves determined in accordance with SEC guidelines, net of estimated production and future development costs, using prices and costs as of the date of estimation without future escalation, giving effect to (i) estimated future abandonment costs, net of the estimated salvage value of related equipment and (ii) future income tax expense.
Undeveloped acreage - Leased acreage on which wells have not been drilled or completed to a point that would permit the production of commercial quantities of oil and natural gas, regardless of whether such acreage contains proved reserves.
Vertical well - Directional wells that are drilled at an angle toward a target area where the productive length of the wellbore intersects the target formation on a perpendicular basis.
Wet gas or wet natural gas - Natural gas that contains a larger quantity of hydrocarbon liquids than dry natural gas, such as NGLs, condensate, and oil.
Working interest - An interest in an oil and gas lease that gives the owner of the interest the right to drill and produce oil and natural gas on the leased acreage. It requires the owner to pay its share of the costs of drilling and production operations.
Workover - Major remedial operations on a producing well to restore, maintain, or improve the well's production.
WTI - West Texas Intermediate. A specific grade of oil used as a benchmark in oil pricing. It is the underlying commodity of NYMEX's oil futures contracts.
58