�� | Page | |
| PART I | ||
| Item 1. | 3 | |
| Item 1A. | 11 | |
| Item 1B. | 22 | |
| Item 2. | 22 | |
| Item 3. | 22 | |
| Item 4. | 22 | |
| PART II | ||
| Item 5. | 23 | |
| Item 6. | 25 | |
| Item 7. | 27 | |
| Item 7A. | 38 | |
| Item 8. | 39 | |
| Item 9. | 70 | |
| Item 9A. | 70 | |
| Item 9B. | 72 | |
| PART III | ||
| Item 10. | ||
| Item 11. | ||
| Item 12. | ||
| Item 13. | ||
| Item 14. | ||
| PART IV | ||
| Item 15. |
PART IIII
We encourage you to read the risks described under “Risk Factors” carefully. We caution you not to place undue reliance on the forward-looking statements contained in this report. These statements, like all statements in this report, speak only as Chief Scientific Officer, Medical Directorof the date of this report (unless an earlier date is indicated) and Director in October 2002. In December 2000, Dr. Hedrick co-foundedwe undertake no obligation to update or revise the statements except as required by law. Such forward-looking statements are not guarantees of future performance and served as Presidentactual results will likely differ, perhaps materially, from those suggested by such forward-looking statements.
General
Cytori (NASDAQ: CYTX) develops cell therapies uniquely optimized and Chief Executive Officerformulated for specific therapeutic applications, with a core focus on cardiovascular disease, thermal burns and Director of StemSource, Inc., a company specializing in stem cell research and development, which was acquired by the Company in 2002. Heother soft tissue injuries. Cytori Cell Therapy is a plastic surgeon and istreatment utilizing a former Associate Professormixed population of Surgery and Pediatrics at the University of California, Los Angeles (UCLA). From 1998 until 2005, he directed the Laboratory of Regenerative Bioengineering and Repair for the Department of Surgery at UCLA. Dr. Hedrick earned his M.D. degree from University of Texas Southwestern Medical School, Dallas and an M.B.A. from UCLA Anderson School of Management. Dr. Hedrick’s qualifications to sit on our Board of Directors include his experience as a general, vascular and plastic surgeon; his academic appointments and achievements in the life sciences; his executive and managerial experience inadult stem cell research and scientific product development, and his foundational knowledge, experience and contributions to the specific technology and operations of our company. In addition, Dr. Hedrick has extensive global experience and familiarity with the cell therapy and regenerative medical industry.cells from fat tissue (ADRC’s) that are extracted using our innovative and proprietary Celution® System technology. Our Celution® System technology automates the complex process of digesting fat tissue, releasing the ADRCs, and concentrating them into an optimized and proprietary formulation in a sterile environment. The system is comprised of a central device and single-use, per-procedure consumable cartridges. The business model is based on the sale of the device and generating recurring revenue from the cartridges that are utilized in each procedure.
In addition to our targeted therapeutic development, we have continued to commercialize the Celution® System under select medical device clearances to research customers developing new therapeutic applications for Cytori Cell Therapy in Europe, Japan, and other regions. The early sales of systems, consumables and ancillary products contributes margins that partially offset our operating expenses and play an important strategic role in fostering familiarity within the medical community with our technology. These sales have also facilitated the discovery of new applications for Cytori Cell Therapy by customers conducting investigator-initiated and funded research.
Cardiovascular Disease
Cardiovascular disease is the most advanced therapeutic application of Cytori Cell Therapy in clinical development. In 2013, we further refined our therapeutic focus to concentrate efforts on our U.S. ATHENA trial for patients with heart failure due to ischemic heart disease.
ATHENA is a FDA approved, multi-center, randomized, double blind, placebo controlled, safety and feasibility trial utilizing Cytori Cell Therapy in ischemic heart failure patients. The trial is expected to enroll up to 45 patients at eight sites in the United States. Enrollment in the ATHENA trial is ongoing and we expect to report initial results from January 2001the study approximately 8 months after the last patient is treated. In 2013, we received approval from the FDA for ATHENA II to January 2005,study a higher dose in the same population of patients. ATHENA II will enroll an additional 45 patients at ten trial sites. Enrollment at two new trial centers will start in the first half of 2014; enrollment will begin at the eight ATHENA trial centers immediately following completion of ATHENA enrollment. We anticipate full data from both ATHENA and was GovernorATHENA II in 2015.
ADVANCE is our European clinical trial for acute myocardial infarction (heart attack). As part of Wisconsina comprehensive evaluation of our global cardiovascular strategy, resource utilization and development priorities, we determined to discontinue the ADVANCE trial as of September 30, 2013. All evidence to date supports the current, known safety profile for Cytori’s Cell Therapy and the patients enrolled in the trial will continue to be followed according to the protocol. The outcomes will be fully analyzed in conjunction with the existing safety and feasibility data from January 1987the APOLLO acute myocardial infarction trial. We will focus our internal and financial resources on the highest clinical development priority, which is the expanded U.S. ATHENA trial.
Previously, the Company established clinical proof-of-concept for the treatment of damaged heart muscle using Cytori’s Cell Therapy based on the outcomes from two European pilot studies. In the PRECISE trial, in patients with ischemic heart failure, primary six-month outcomes and longer-term 18-month data demonstrated safety and sustained improvement in cardiac functional capacity as measured by VO2 Max. In the APOLLO trial, in patients suffering from acute heart attacks, 18-month data demonstrated safety and sustained improvement in infarct size and perfusion.
In addition to January 2001. Mr. Thompson was the ChairmanCompany-sponsored clinical work on the ATHENA trial, Cytori Cell Therapy is available on a limited commercial basis for vascular conditions in the EU. On February 25, 2013 we received CE Mark approval in Europe for Intravase®, a reagent designed to be used with Cytori’s Celution® System for preparing safe and optimized adipose-derived stem and regenerative cells (ADRCs) for intravascular delivery into the same patient. Intravase® is a sterile, GMP-grade secondary reagent and is currently being used in both our U.S. ATHENA trials in patients with heart failure due to ischemic heart disease patients.
While this approval is for a general use claim and not indicated for any specific therapy, the approval enables physicians to utilize Cytori’s Cell Therapy for a wide range of applications which could include acute heart attack, refractory heart disease including chronic myocardial ischemia, peripheral vascular disease, stroke, liver and kidney applications among others to the extent such applications may require cells to be delivered into the bloodstream. In 2013, we began the process of initiating a European registry program to track heart disease patients treated with Cytori Cell Therapy. In the future we intend to pursue specific vascular disease therapeutic indications such as heart failure to ischemic heart disease, no option chronic myocardial ischemia, and acute heart attack, among other indications.
Soft Tissue Injuries
In addition to our cardiovascular disease therapeutic pipeline, Cytori is also developing its cell therapy platform for the treatment of thermal burns combined with radiation injury. In the third quarter of 2012, we were awarded a contract to develop a new countermeasure for thermal burns valued at up to $106 million with the U.S. Department of Health and Human Service’s Biomedical Advanced Research and Development Authority (BARDA). The initial base period includes $4.7 million over two years and covers preclinical research and continued development of Cytori’s Celution® System to improve cell processing. The additional contract options, if fully executed, could cover our clinical development through FDA approval under a device-based PMA regulatory pathway.
The cost-plus-fixed-fee contract is valued at up to $106 million, with a guaranteed two-year base period of approximately $4.7 million which includes preclinical research and the acceleration of Cytori’s ongoing development of the BoardCelution® System. Cytori submitted reports to BARDA in late 2013 detailing what we believe to be the completion of Logistics Health, Inc., havingthe three objectives in the initial contract. Cytori will undergo an In-Process Review Meeting in the first half of 2014 to confirm completion of the proof of concept phase.
Upon satisfactory proof of concept, BARDA may elect to exercise contract options which would extend the contract term to up to five years if all options are exercised. The options cover: (i) research and development, regulatory, clinical, and other tasks required for completion of a pilot clinical trial of the Celution® System; (ii) research and development, regulatory, and clinical activities necessary to achieve regulatory clearances to optimize a treatment for combined injury involving thermal burn and radiation exposure and (iii) a pivotal clinical trial for FDA approval of the use of the Celution® System for thermal burn injury. The total award is intended to support all clinical, preclinical, regulatory, and technology development activities needed to complete the FDA approval process for use in thermal burn injury under a device-based PMA regulatory pathway.
While BARDA is our primary soft tissue focus, in early 2014 we announced that we had received Investigational Device Exemption (IDE) approval from the FDA to begin a new U.S. clinical trial for hamstring injury. RECOVER is a prospective, safety and feasibility trial that will initially enroll ten patients. Once the safety and feasibility of administering Cytori Cell Therapy has been Presidentconfirmed in the first ten patients, RECOVER is approved to be expanded to a 60-patient, multi-center, double-blind, placebo-controlled trial. We are also in the process of initiating European registry programs for a range of soft tissue injuries, including hamstring injury and Sclerodactyly due to Scleroderma.
Sales & Marketing
Japan
A significant contributor to Cytori’s product revenue historically and throughout 2013 has been sales in Japan. In September 2012, we obtained a full commercial operational license for Cytori Therapeutics, K.K. (our wholly owned subsidiary in Japan) and a Class I Medical Device Clearance for our Celution® and Puregraft® based technologies in Japan. These achievements are expected to facilitate our sales growth in Japan on a forward looking basis. We have established partnerships with a number of medical distributors which should expand our reach and penetration into this critical medical market.
In addition to the new clearances and distribution partnerships in Japan, we expect to continue to have demand from February 2005researchers at academic hospitals seeking to January 2011. Mr. Thompsonperform investigator-initiated and funded studies using Cytori Cell Therapy. These studies continue to drive strategic value for Cytori through the investigator relationships that are built, clinical data that is compiled and the global visibility generated. Our academic research customers are investigating a broad array of applications including stress urinary incontinence, wound healing, fistula repair, burn, facial wasting, liver insufficiency, radiation injury, bone regeneration, kidney disease, spinal disc injury, periodontal disease, vocal cord paralysis and peripheral vascular disease. Collectively, they contribute to maintaining Cytori’s position as one of the world’s leaders in cell therapy.
Other Sales
Cytori offers its Celution® System in Europe for multiple indications. In Europe, the Celution® 800 System has servedCE Mark approval for certain soft tissue procedures, such as breast reconstruction, tissue ischemia, deficiency or injury of skin, fat, muscle and fascia, and soft tissue wounds or fistulae associated with trauma, diabetes, ischemia or radiation injury. With the addition of the Intravase® reagent, customers may now use the Cytori’s Celution® System for preparing safe and optimized adipose derived regenerative cells (“ADRC”) for intravascular delivery into the same patient. Our European customers include hospitals and clinics as well as researchers performing investigator-initiated and funded studies.
We currently market our StemSource® Cell & Tissue Banking line to hospitals, clinics, tissue banks, and stem cell banking companies worldwide. The line encompasses three product configurations that are available on a regionally specific basis: ADRC banking, ADRC and adipose tissue banking, or tissue banking alone. We market StemSource® Banks worldwide through a combination of distributors and direct sales. We remain responsible for manufacturing and sourcing all necessary equipment, including but not limited to cryopreservation chambers, cooling and thawing devices, cell banking protocols and the proprietary software and database application.
In July 2013, Cytori divested its Puregraft® line of products in a $15 million agreement, including a $5 million up-front cash payment and up to an additional $10 million in commercial milestone payments. In addition, Bimini Technologies was granted a license for exclusive worldwide rights to develop and sell the Celution® System for Alopecia (hair loss) in exchange for a perpetual royalty on sales.
Refer to Note 2 for a discussion of geographical concentration of sales.
Manufacturing and Raw Materials
With the exception of some of our Puregraft® System products and ancillary supplies, our products are currently manufactured at the Company’s headquarters in San Diego, CA. Our manufacturing capabilities are expected to enable us to meet anticipated demand in 2014. We are, and the manufacturer of any future therapeutic products would be, subject to periodic inspection by regulatory authorities and distribution partners. The manufacturer of devices and products for human use is subject to regulation and inspection from time to time by the FDA for compliance with the FDA’s Quality System Regulation, or QSR, requirements, as well as equivalent requirements and inspections by state and non-U.S. regulatory authorities.
Most of the raw materials required to manufacture the Celution® System family of products are commonly available from multiple sources, and we have identified and executed supply agreements with our preferred vendors. Some specialty components are custom made for us, and we are dependent on the ability of these suppliers to deliver functioning parts or materials in a timely manner to meet the ongoing demand for our products. There can be no assurance that we will be able to obtain adequate quantities of the necessary raw materials supplies within a reasonable time or at commercially reasonable prices. Interruptions in supplies due to price, timing, or availability or other issues with our suppliers could have a negative impact on our ability to manufacture products.
Competition
The field of regenerative medicine is expanding rapidly, in large part through the development of cell-based therapies and/or devices designed to isolate cells from human tissues. As the field grows, we face, and will continue to face, increased competition from pharmaceutical, biopharmaceutical, medical device and biotechnology companies, as well as academic and research institutions and governmental agencies in the United States and abroad. Most regenerative medicine efforts involve sourcing adult stem and regenerative cells from tissues such as bone marrow, placental tissue, umbilical cord and peripheral blood, and skeletal muscle. However, a growing number of companies are using adipose tissue as a Directorcell source. We exclusively use adipose tissue as a source of C.R. Bard since August 2005;adult stem and regenerative cells.
With the growing number of companies working in the cell therapy field, we are forced to compete across several areas, including equity and capital, clinical trial sites, enrollment of patients in clinical trials, corporate partnerships, skilled and experience personnel and commercial market share. Some of our competitors and potential competitors have substantially greater financial, technological, research and development, marketing, and personnel resources than we do. We cannot with any accuracy forecast when or if these companies are likely to bring cell therapies to market for indications such as refractory heart failure, acute myocardial infarction, and thermal burns which we are also pursuing.
Companies researching and developing cell-based therapies for our lead indication, cardiovascular disease, include, among others Aastrom Biosciences, Arteriocyte, Athersys, Baxter, Capricor, Cardio3, Cytomedix, Juventas, Medistem, Mesoblast, NeoStem, Tissue Genesis and Tigenix NV. These companies are in various stages of clinical development in the U.S. and Europe, investigating their respective cell therapies for acute myocardial infarction (heart attack), chronic myocardial ischemia or other forms of coronary artery disease, as well as certain vascular conditions. In addition, we are aware of several surgeons who are performing autologous fat transfers using manual methods, some of whom enrich the fat with autologous adipose-derived cells.
We expect to compete based on, among other things, the efficacy of our products, our intellectual property, and our continued ability to attract and retain skilled and experienced scientific, clinical development and executive personnel that can bring adipose derived stem and regenerative based cell therapies to market.
Research and Development
Research and development expenses were $17,065,000, $13,628,000 and $10,904,000 for the years ended December 31, 2013, 2012 and 2011, respectively. These expenses have supported the basic research, product development and clinical activities necessary to bring our products to market.
Our research and development efforts in 2013 focused predominantly on the following areas:
| · | Supported enrollment in the ATHENA and ATHENA II trials; |
| · | Supported regulatory application for CE Mark for the Intravase® reagent for vascular delivery; |
| · | Supported ongoing work towards BARDA base contract milestones; |
| · | Continued patient follow-up and data analysis from the APOLLO heart attack and PRECISE no-option chronic myocardial ischemia trials; |
| · | Supported FDA submission and approval, and site initiation, for the RECOVER trial; |
| · | Prepared and submitted multiple regulatory filings in the United States, Europe, Japan, and other regions related to various cell and tissue processing systems under development; |
| · | As part of our contractual obligations with Bimini, completed development and released small-volume product line extension for the Puregraft® family of products for autologous fat transfer; |
| · | Developed new configurations and expanded functionality of our Celution® platform to address the Japan Class I and other markets; |
| · | Conducted ADRC viability and transport studies in support of clinical trial requirements; |
| · | Conducted, presented, and published research efforts related to ADRC characterization and potency to further establish scientific leadership in the field; and |
| · | Continued to optimize and develop the Celution® System family of products and next-generation devices, single-use consumables and related instrumentation. |
Customers
In Japan, we are establishing a Directornetwork of CareView Communications, Inc. since July 2005;distributors to leverage our new clearances in that country. Our current customers in Japan consist primarily of researchers at academic hospitals and clinics. We also have a Directornetwork of Centene Corporation since April 2005distributors who offer our Celution® Systems, instrumentation and consumables to surgeons and hospitals throughout Europe. These distributors purchase the products from Cytori at a Director of United Therapeutics Corporation since February 2011. Hecontractually agreed-upon transfer price. We also servedmarket our Celution® System directly to customers in select countries within Europe. In addition, we offer the StemSource® 900/MB as Chairmanresearch laboratory equipment or as part of the BoardStemSource® Cell Bank (a comprehensive suite of AGA Medical Corporation from July 2005products to November 2011. He isallow hospitals or tissue banks to cryopreserve adipose-derived stem and regenerative cells) directly to customers. In parts of Asia and India, we sell the Celution® System directly to customers, many of whom are academic hospitals, who are sponsoring and funding their own independent, investigator-led clinical studies using the product. Through our new partnership with Lorem Vascular, we intend to substantially increase our commercialization and sales efforts for Celution® and StemSource® products in China, Hong Kong, Malaysia, Singapore and Australia. The StemSource® adipose-only tissue banks are sold directly to customers in the United States.
Intellectual Property
Our success depends in large part on our ability to protect our proprietary technology, including the Celution® System product platform, and to operate without infringing on the proprietary rights of third parties. We rely on a recipientcombination of patent, trade secret, copyright and trademark laws, as well as confidentiality agreements, licensing agreements and other agreements, to establish and protect our proprietary rights. Our success also depends, in part, on our ability to avoid infringing patents issued to others. If we were judicially determined to be infringing on any third party patent, we could be required to pay damages, alter our products or processes, obtain licenses or cease certain activities.
To protect our proprietary medical technologies, including the Celution® System platform and other scientific discoveries, Cytori has 65 issued patents worldwide. We have 18 issued U.S. patents and 47 issued international patents. Of the 18 issued U.S. patents, 5 were issued in 2012 and 1 was issued in 2013. Of the 47 issued international patents, 10 were issued in 2012 and 8 in 2013. In addition, we have over 85 patent applications pending worldwide related to our technology. We are seeking additional patents on methods and systems for processing adipose-derived stem and regenerative cells, on the use of adipose-derived stem and regenerative cells for a variety of therapeutic indications, including their mechanisms of actions, on compositions of matter that include adipose-derived stem and regenerative cells, and on other scientific discoveries. We are also the exclusive, worldwide licensee of the prestigious Horatio Alger Award and has served as chairmanRegents of the National Governors’ Association, the Education Commission of the States, and the Midwestern Governors’ Conference. Mr. Thompson received both his B.S. and his J.D. from the University of Wisconsin-MadisonCalifornia’s rights to a portfolio related to isolated adipose derived stem cells, which includes one US patent and also served in the Wisconsin National Guard and the Army Reserve. Mr. Thompson’s qualifications to sit on our Board of Directors include his significant experience in the healthcare industry both as a public official and in the private sector; his advocacy of innovative solutions to health care challenges, and his service on other public company boards and committees.twelve foreign patents.
There is a risk that any patent applications that we file and therapiesany patents that we hold or later obtain could be challenged by third parties and declared invalid or infringing of third party claims. A patent interference proceeding may be instituted with the U.S. Patent and Trademark Office (the “USPTO”) when more than one person files a patent application covering the same technology, or if someone wishes to challenge the validity of an issued patent. At the completion of the interference proceeding, the USPTO will determine which competing applicant is entitled to the patent, or whether an issued patent is valid. Patent interference proceedings are complex, highly contested legal proceedings, and the marketingUSPTO’s decision is subject to appeal. This means that if an interference proceeding arises with respect to any of our patent applications, we may experience significant expenses and sales capabilities requireddelay in obtaining a patent, and if the outcome of the proceeding is unfavorable to achieve significant revenue growthus, the patent could be issued to a competitor rather than to us. In addition to interference proceedings, the USPTO can reexamine issued patents at the request of a third party seeking to have the patent invalidated. All patents are subject to requests for reexamination by third parties. This means that patents owned or licensed by us may be subject to reexamination and may be lost, or some or all claims may require amendment or cancellation, if the outcome of the reexamination is unfavorable to us. Patent reexamination proceedings are long and complex proceedings and could result in global markets.a reduction or loss of patent rights.
In addition to patent protection, we rely on unpatented trade secrets and proprietary technological expertise. We cannot assure you that others will not independently develop or otherwise acquire substantially equivalent techniques, somehow gain access to our trade secrets and proprietary technological expertise or disclose such trade secrets, or that we can ultimately protect our rights to such unpatented trade secrets and proprietary technological expertise. We rely, in part, on confidentiality agreements with our marketing partners, employees, advisors, vendors and consultants to protect our trade secrets and proprietary technological expertise. We cannot assure you that these agreements will not be breached, that we will have adequate remedies for any breach or that our unpatented trade secrets and proprietary technological expertise will not otherwise become known or be independently discovered by competitors.
Government Regulation
As medical devices that yield cells with therapeutic potential, our products must receive regulatory clearances or approvals from the European Union, the FDA and, from other applicable governments prior to their sale. Our current and future Celution® Systems are or will be subject to stringent government regulation in the United States by the FDA under the Federal Food, Drug and Cosmetic Act. The BoardFDA regulates the design/development process, clinical testing, manufacture, safety, labeling, sale, distribution, and promotion of Directors held seven meetings during 2012. The Audit Committee met seven times; the Compensation Committee met two timesmedical devices and took action via unanimous written consent four times; the Governancedrugs. Included among these regulations are pre-market clearance and Nominating Committee met three times;pre-market approval requirements, design control requirements, and the Executive Committee met five timesQuality System Regulations/Good Manufacturing Practices. Other statutory and took action via unanimous written consent once.regulatory requirements govern, among other things, registration and inspection, medical device listing, prohibitions against misbranding and adulteration, labeling and post-market reporting.
8
The Celution® System family of products must also comply with the government regulations of each individual country in which the products are to be distributed and sold. These regulations vary in complexity and can be as stringent, and on occasion even more stringent, than FDA regulations in the United States. International government regulations vary from country to country and region to region. For example, regulations in some parts of the world only require product registration while other regions/countries require a complex product approval process. Due to the fact that there are new and emerging cell therapy and cell banking regulations that have recently been drafted and/or implemented in various countries around the world, the application and subsequent implementation of these new and emerging regulations have little to no precedence. Therefore, the level of complexity and stringency is not always precisely understood today for each country, creating greater uncertainty for the international regulatory process. Furthermore, government regulations can change with little to no notice and may result in up-regulation of our product(s), thereby, creating a greater regulatory burden for our cell processing and cell banking technology products.
Worldwide, the regulatory process can be lengthy, expensive, and uncertain with no guarantee of approval. Before any new medical device may be introduced to the U.S. market, the manufacturer generally must obtain FDA clearance or approval through either the 510(k) pre-market notification process or the lengthier pre-market approval application (PMA) process, which requires clinical trials to generate clinical data supportive of safety and efficacy. Approval of a PMA could take four or more years from the time the process is initiated. Our core Celution® System processing device products under development are generally subject to the lengthier PMA process for many specific applications. Failure to comply with applicable requirements can result in application integrity proceedings, fines, recalls or seizures of products, injunctions, civil penalties, total or partial suspensions of production, withdrawals of existing product approvals or clearances, refusals to approve or clear new applications or notifications, and criminal prosecution.
Specifically, regulation of the Celution® System in Europe and the U.S. for use in cardiovascular disease requires that we conduct clinical trials to collect safety and efficacy data to support marketing approvals. We have completed a pilot study in Europe for acute myocardial infarction. We completed a pilot study for chronic myocardial ischemia in Europe and based on the data are seeking a limited approval in Europe. In the U.S., we are currently enrolling our ATHENA trial for refractory heart failure under the device regulations via the PMA pathway. The ATHENA trial will enroll up to 45 patients at eight U.S. trial sites.
Summary of Celution®System Family Regulatory Status
| Region | Clinical Applications | Regulatory Status |
| Japan | Cell Banking | Approved |
| Celution® Centrifuge, Celbrush, Puregraft Bag and select components. | Class I Notification | |
Europe | Celution® 800 and Celution One: Cell Processing for re-implantation or re-infusion into same patient (General Processing) | CE Mark |
| Celution® 800 and Celution One: Breast reconstruction, healing of Crohn’s wounds and other cosmetic procedures | CE Mark | |
| Celution® 800: Cryptoglandular fistula, tissue ischemia and other soft tissue procedures | CE Mark | |
| Intravase® for use with Celution® 800 | CE Mark (obtained February 2013) | |
| Cell Concentration | CE Mark | |
| Celution® One cosmetic and reconstructive surgery claims | CE Mark | |
| U.S. | Refractory Heart Failure | ATHENA and ATHENA II IDE trial underway |
| Hamstring Injury | RECOVER IDE trial | |
| Australia | Celution 800 Cell Processing for re-implantation or re-infusion into same patient (general/plastic reconstruction), Puregraft, Instrument Sets | ARTG Certificate |
| Croatia | Celution 800 Cell Processing for re-implantation or re-infusion into same patient (general/plastic reconstruction), Puregraft | Approval Certificated from the Croatia Agency for Medicinal Products and Medical Devices |
| New Zealand | Celution 800, Puregraft, Instrument Sets | WAND Registered |
| Russia | Celution 800 Cell Processing for re-implantation or re-infusion into same patient (general/plastic reconstruction), Puregraft | Roszdravnadzor Certificate (Federal Service for Control of Healthcare and Social Development) |
| Serbia | Celution 800 Cell Processing for re-implantation or re-infusion into same patient (general/plastic reconstruction), Puregraft | ALIMS (Medicines and Medical Devices Agency of Serbia) |
| Singapore | Celution 800 Cell Processing for re-implantation or re-infusion into same patient (general/plastic reconstruction), Puregraft, | HSA approved, SMDR Registered |
Medical devices are also subject to post-market reporting requirements for deaths or serious injuries when the device may have caused or contributed to the death or serious injury, and for certain device malfunctions that would be likely to cause or contribute to a death or serious injury if the malfunction were to recur. If safety or effectiveness problems occur after the product reaches the market, the FDA may take steps to prevent or limit further marketing of the product. Additionally, the FDA actively enforces regulations prohibiting marketing and promotion of devices for indications or uses that have not been cleared or approved by the FDA. In addition, modifications or enhancements of products that could affect the safety or effectiveness or effect a major change in the intended use of a device that was either cleared through the 510(k) process or approved through the PMA process may require further FDA review through new 510(k) or PMA submissions.
Employees
As of Directors has determined that Messrs. Hawkins, Hawran, Rickey, Dean, Thompson,December 31, 2013, we had 115 employees, including part-time and Dr. Holmesfull-time employees. These employees are “independent” under the rulescomprised of the NASDAQ Stock Market. Under applicable14 employees in manufacturing, 42 employees in research and development, 23 employees in sales and marketing and 36 employees in management, finance and administration. From time to time, we also employ independent contractors to support our operations. Our employees are not represented by any collective bargaining agreements and we have never experienced an organized work stoppage.
Corporate Information and Web Site Access to SEC and the NASDAQ rules, the existence of certain “related person” transactions above certain thresholds between a director and the Company are required to be disclosed and preclude a finding by the Board that the director is independent. The Board of Directors is not able to consider Mr. Calhoun, our Chief Executive Officer, or Dr. Hedrick, our President, independent,Filings
We were initially formed as a resultCalifornia general partnership in July 1996, and incorporated in the State of their respective employment with us during the past three years.
In analyzing our company, you should consider carefully the following risk factors together with all of the other information included in this Annual Report on Form 10-K, including our unaudited Consolidated Financial Statements and the related notes and “Management’s Discussion and Analysis of Financial Conditions and Results of Operations”. If any of the risks described below occur, our business, operating results, and financial condition could be adversely affected and the value of our common stock could decline.
Risks Related to Our Business
We will need to raise more cash in the future
We have almost always had negative cash flows from operations. Our business will continue to result in a substantial requirement for research and development expenses for several years, during which we may not be able to bring in sufficient cash and/or revenues to offset these expenses. During 2012 and 2013, we expanded our commercialization activities while simultaneously pursuing available financing sources to support operations and growth. We have had, and we will continue to have, an ongoing need to raise additional cash from outside sources to continue funding our operations to profitability. We do not currently believe that our cash balance and the revenues from our operations will be sufficient to fund the development and marketing efforts required to reach profitability without raising additional capital from accessible sources of financing in the future.
In addition, our Loan and Security Agreement with Oxford Finance LLC and Silicon Valley Bank requires us to maintain certain minimum cash requirements, including at least three months of cash on hand, to avoid an event of default thereunder, and if our cash reserves fall below those minimum requirements, then we could be in default under the loan agreement and subject to potential adverse remedies by the lenders, which would have a substantial and material adverse effect on our business, financial condition, results of operations, the value of our common stock and warrants and our ability to raise capital. We believe our plans to raise additional cash from outside sources and if necessary, our cost containment efforts are sufficient to allow us to continue operations for the next twelve months. This includes minimum liquidity renuirements of the Loan and Security Agreement that require us to make principal and interest payments of $868,000 per month beginning in August 2014 and maintain at least three months of cash on hand to avoid an event of default under the loan agreement. Our plans include pursuing additional cash through strategic corporate partnerships and possibly engaging in future sales of equity, as well as our gross profits. While we have an established history of raising capital through these platforms, and we are currently involved in negotiations with multiple parties, there is no guarantee that adequate funds will be available when needed from additional debt or equity financing, development and commercialization partnerships, increased results of operations, or from other sources, or on terms acceptable to us. If our efforts to obtain sufficient additional funds are not successful. we would be required to delay, scale back, or eliminate some or all of our research or product development, manufacturing operations, administrative operations. including our employee base, and clinical or regulatory activities which could negatively affect our ability to achieve certain corporate goals.
Continued turmoil in the economy could harm our business
Negative trends in the general economy, including trends resulting from an actual or perceived recession, tightening credit markets, increased cost of commodities, including oil, actual or threatened military action by the United States and threats of terrorist attacks in the United States and abroad, could cause a reduction of investment in and available funding for companies in certain industries, including ours and our customers. Our ability to raise capital has been and may in the future be adversely affected by downturns in current credit conditions, financial markets and the global economy.
We have never been profitable on an operational basis and expect significant operating losses for the next few years
We have incurred net operating losses in each year since we started business. As our focus on the Celution® System platform and development of therapeutic applications for its cellular output has increased, losses have resulted primarily from expenses associated with research and development activities and general and administrative expenses. While we work continuously to implement cost reduction measures where possible, we nonetheless expect to continue operating in a loss position on a consolidated basis and that recurring operating expenses will be at high levels for the next several years, in order to perform clinical trials, additional pre-clinical research, product development, and marketing. As a result of our historic losses, we have been, and are likely to continue to be, reliant on raising outside capital to fund our operations.
Our business strategy is high-risk
We are focusing our resources and efforts primarily on development of the Celution® System family of products and the therapeutic applications of its cellular output, which requires extensive cash needs for research, development, and commercialization activities. This is a high-risk strategy because there is no assurance that our future products will ever become commercially viable (commercial risk), that we will prevent other companies from depriving us of market share and profit margins by selling products based on our inventions and developments (legal risk), that we will successfully manage a company in a new area of business (regenerative medicine) and on a different scale than we have operated in the past (operational risk), that we will be able to achieve the desired therapeutic results using stem and regenerative cells (scientific risk), or that our cash resources will be adequate to develop our products until we become profitable, if ever (financial risk). We are using our cash in one of the riskiest industries in the economy (strategic risk). This may make our stock an unsuitable investment for many investors.
The development and manufacture of current and future generation Celution ® System devices is important to us
We must continue to develop and manufacture both the current and future generation Celution® System devices. If we are not successful in further development of the current and future generation Celution® System devices, we may not be able to compete successfully in the marketplace (technology risk), and if we experience disruptions and/or delays in our production of these devices as required by the marketplace, our operations and commercialization efforts (clinical, regulatory and/or commercial sales) we would be harmed (manufacturing risk).
Although we have significant experience in manufacturing the current Celution® System platform and its consumables at a commercial level, there can be no guarantee that we will be able to successfully develop and manufacture future generation Celution® Systems in a manner that is cost-effective or commercially viable, or that development and manufacturing capabilities might not take much longer than currently anticipated to be ready for the market.
Although we have been manufacturing the Celution® 800 System and the StemSource® 900-based Cell Bank since 2008, we cannot assure that we will be able to manufacture sufficient numbers of such products to meet future demand, or that we will be able to overcome unforeseen manufacturing difficulties for this sophisticated equipment.
We have a limited operating history; operating results and stock price can be volatile like many life science companies
Our prospects must be evaluated in light of the risks and difficulties frequently encountered by emerging companies and particularly by such companies in rapidly evolving and technologically advanced biotech and medical device fields. From time to time, we have tried to update our investors’ expectations as to our operating results by periodically announcing financial guidance. However, we have in the past been forced to revise or withdraw such guidance due to lack of visibility and predictability of product demand. Our stock price has a history of significant volatility, which may harm our ability to raise additional capital and may cause an investment in Cytori to be unsuitable for some investors.
We may not be able to correctly estimate or control our future operating expenses, which could lead to cash shortfalls
Our budgeted expense levels are based in part on our expectations concerning future revenues from sales as well our assessment of the future investments needed to expand our commercial organization and support research and development activities. We may be unable to reduce our expenditures in a timely manner to compensate for any unexpected events or a shortfall in revenue. Accordingly, a shortfall in demand for our products or other unexpected events could have an immediate and material impact on our business and financial condition.
We are vulnerable to competition and technological change, and also to physicians’ inertia
We compete with many domestic and foreign companies in developing our technology and products, including biotechnology, medical device, and pharmaceutical companies. Many current and potential competitors have substantially greater financial, technological, research and development, marketing, and personnel resources. There is no assurance that our competitors will not succeed in developing alternative products that are more effective, easier to use, or more economical than those which we have developed or are in the process of developing, or that would render our products obsolete and non-competitive. In general, we may not be able to prevent others from developing and marketing competitive products similar to ours or which perform similar functions.
Competitors may have greater experience in developing therapies or devices, conducting clinical trials, obtaining regulatory clearances or approvals, manufacturing and commercialization. It is possible that competitors may obtain patent protection, approval, or clearance from the FDA or achieve commercialization earlier than we can, any of which could have a substantial negative effect on our business.
We compete against cell-based therapies derived from alternate sources, such as bone marrow, umbilical cord blood and potentially embryos. Doctors historically are slow to adopt new technologies like ours, regardless of the perceived merits, when older technologies continue to be supported by established providers. Overcoming such inertia often requires very significant marketing expenditures or definitive product performance and/or pricing superiority.
We expect physicians’ inertia and skepticism to also be a significant barrier as we attempt to gain market penetration with our future products. We believe we will continue to need to finance lengthy time-consuming clinical studies to provide evidence of the medical benefit of our products and resulting therapies in order to overcome this inertia and skepticism particularly in reconstructive surgery, cell preservation, the cardiovascular area and many other indications.
Many potential applications of our technology are pre-commercialization, which subjects us to development and marketing risks
We are in a relatively early stage of the path to commercialization with many of our products. We believe that our long-term viability and growth will depend in large part on our ability to develop commercial quality cell processing devices and useful procedure-specific consumables, and to establish the safety and efficacy of our therapies through clinical trials and studies. With our Celution® System platform, we are pursuing new approaches for therapies for cardiovascular disease, burns, soft tissue defects, reconstructive surgery, preservation of stem and regenerative cells for potential future use, and other conditions. There is no assurance that our development programs will be successfully completed or that required regulatory clearances or approvals will be obtained on a timely basis, if at all.
There is no proven path for commercializing the Celution® System platform in a way to earn a durable profit commensurate with the medical benefit. Although we began to commercialize our reconstructive surgery products in Europe and certain Asian markets, and our cell banking products in Japan, Europe, and certain Asian markets in 2008, additional market opportunities for many of our products and/or services may not materialize for a number of years.
Successful development and market acceptance of our products is subject to developmental risks, including failure of inventive imagination, ineffectiveness, lack of safety, unreliability, failure to receive necessary regulatory clearances or approvals, high commercial cost, preclusion or obsolescence resulting from third parties’ proprietary rights or superior or equivalent products, competition from copycat products, and general economic conditions affecting purchasing patterns. There is no assurance that we or our partners will successfully develop and commercialize our products, or that our competitors will not develop competing technologies that are less expensive or superior. Failure to successfully develop and market our products would have a substantial negative effect on our results of operations and financial condition.
If any party to a key collaboration partnership fails to perform material obligations under our agreements, or any other collaboration agreement, or if such agreements are terminated for any reason, our business could significantly suffer
We have entered into collaboration agreements under which we may receive future payments in the form of milestone payments, maintenance fees and royalties. We are dependent on our collaborators to commercialize our products in certain countries in order for us to realize any financial benefits from these collaborations. Our collaborators may not devote the attention and resources to such efforts to be successful. In addition, in the event that a party fails to perform under a key collaboration agreement, or if a key collaboration agreement is terminated, the reduction in anticipated revenues could delay or suspend our product commercialization in certain countries. Specifically, the termination of a key collaboration agreement by one of our collaborators could materially impact our ability to enter into additional collaboration agreements with new collaborators on favorable terms.
If we or our collaborators fail to comply with regulatory requirements applicable to promotion, sale and manufacturing of approved products, regulatory agencies may take action against us or them, which could significantly harm our business
Any approved products, along with the manufacturing processes, post-approval clinical data, labeling, advertising and promotional activities for these products, are subject to continual requirements and review by the FDA, state and foreign regulatory bodies. Regulatory authorities subject a marketed product, its manufacturer and the manufacturing facilities to continual review and periodic inspections. We, our collaborators and our respective contractors, suppliers and vendors, will be subject to ongoing regulatory requirements, including complying with regulations and laws regarding advertising, promotion and sales of products, required submissions of safety and other post-market information and reports, registration requirements, cGMP regulations (including requirements relating to quality control and quality assurance, as well as the corresponding maintenance of records and documentation), and the requirements regarding the distribution of samples to physicians and recordkeeping requirements. Regulatory agencies may change existing requirements or adopt new requirements or policies. We, our collaborators and our respective contractors, suppliers and vendors, may be slow to adapt or may not be able to adapt to these changes or new requirements.
Failure to comply with regulatory requirements may result in any of the following:
restrictions on our products or manufacturing processes;
warning letters;
withdrawal of the products from the market;
voluntary or mandatory recall;
fines;
suspension or withdrawal of regulatory approvals;
suspension or termination of any of our ongoing clinical trials;
refusal to permit the import or export of our products;
refusal to approve pending applications or supplements to approved applications that we submit;
product seizure;
injunctions; or
imposition of civil or criminal penalties.
We must rely on the performance of Lorem Vascular for the commercialization of our products in China, Hong Kong, Singapore, Malaysia and Australia.
Lorem Vascular is the exclusive licensee for our products in China, Hong Kong, Singapore, Malaysia and Australia, and while we will be strongly supportive to their efforts, they are responsible for obtaining regulatory approvals, market development and sales in these countries. Lorem Vascular is also a new company and as such will be required to develop the expertise, personnel and relationships in each of these countries required to successfully market and sell our products. We cannot guarantee that Lorem Vascular will make the investments required to be successful in these countries. We cannot guarantee that the necessary regulatory approvals can be obtained, and we cannot guarantee that our products will be successful in these markets even if advantageous market regulatory approvals are obtained.
Market acceptance of new technology such as ours can be difficult to obtain
New and emerging cell therapy and cell banking technologies, such as those provided by the Celution® System family of products, may have difficulty or encounter significant delays in obtaining market acceptance in some or all countries around the world due to the novelty of our cell therapy and cell banking technologies. Therefore, the market adoption of our cell therapy and cell banking technologies may be slow and lengthy with no assurances that significant market adoption will be successful. The lack of market adoption or reduced or minimal market adoption of our cell therapy and cell banking technologies may have a significant impact on our ability to successfully sell our product(s) into a country or region.
Future clinical trial results may differ significantly from our expectations
While we have proceeded incrementally with our clinical trials in an effort to gauge the risks of proceeding with larger and more expensive trials, such as in our PRECISE chronic ischemic trial in Europe, and our ATHENA I and ATHENA II feasibility trial in heart failure due to ischemic heart disease, we cannot guarantee that we will not experience negative results in larger and much more expensive clinical trials than we have conducted to date. Poor results in our clinical trials could result in substantial delays in commercialization, substantial negative effects on the perception of our products, and substantial additional costs. These risks are increased by our reliance on third parties in the performance of many of the clinical trial functions, including the clinical investigators, hospitals, and other third party service providers.
Our product candidates may not receive regulatory approvals or their development may be delayed for a variety of reasons, including unsuccessful clinical trials, regulatory requirements or safety concerns
Clinical testing of our products is a long, expensive and uncertain process, and the failure or delay of a clinical trial can occur at any stage. Even if initial results of preclinical and nonclinical studies or clinical trial results are promising, we may obtain different results in subsequent trials or studies that fail to show the desired levels of safety and efficacy, or we may not obtain applicable regulatory approval for a variety of other reasons. Clinical trials for any of our products could be unsuccessful, which would delay or prohibit regulatory approval and commercialization of the product. In the United States and other jurisdictions, regulatory approval can be delayed, limited or not granted for many reasons, including, among others:
clinical results may not meet prescribed endpoints for the studies or otherwise provide sufficient data to support the efficacy of our products;
clinical and nonclinical test results may reveal side effects, adverse events or unexpected safety issues associated with the use of our products;
regulatory review may not find a product safe or effective enough to merit either continued testing or final approval;
regulatory review may not find that the data from preclinical testing and clinical trials justifies approval;
regulatory authorities may require that we change our studies or conduct additional studies which may significantly delay or make continued pursuit of approval commercially unattractive;
a regulatory agency may reject our trial data or disagree with our interpretations of either clinical trial data or applicable regulations;
the cost of clinical trials required for product approval may be greater than what we originally anticipate, and we may decide to not pursue regulatory approval for such a product;
a regulatory agency may identify problems or other deficiencies in our existing manufacturing processes or facilities, or the existing processes or facilities of our collaborators, our contract manufacturers or our raw material suppliers;
a regulatory agency may change its formal or informal approval requirements and policies, act contrary to previous guidance, adopt new regulations or raise new issues or concerns late in the approval process; or
a product candidate may be approved only for indications that are narrow or under conditions that place the product at a competitive disadvantage, which may limit the sales and marketing activities for such products or otherwise adversely impact the commercial potential of a product.
If a product is not approved in a timely fashion on commercially viable terms, or if development of any product is terminated due to difficulties or delays encountered in the regulatory approval process, it could have a material adverse impact on our business, and we will become more dependent on the development of other proprietary products and/or our ability to successfully acquire other products and technologies. There can be no assurances that any product will receive regulatory approval in a timely manner, or at all.
Certain products will be marketed, and perhaps manufactured, in foreign countries. The process of obtaining regulatory approvals in foreign countries is subject to delay and failure for the reasons set forth above, as well as for reasons that vary from jurisdiction to jurisdiction. The approval process varies among countries and jurisdictions and can involve additional testing. The time required to obtain approval may differ from that required to obtain FDA approval. Foreign regulatory agencies may not provide approvals on a timely basis, if at all. Approval by the FDA does not ensure approval by regulatory authorities in other countries or jurisdictions, and approval by one foreign regulatory authority does not ensure approval by regulatory authorities in other foreign countries or jurisdictions or by the FDA.
We may not be able to protect our proprietary rights
Our success depends in part on whether we can maintain our existing patents, obtain additional patents, maintain trade secret protection, and operate without infringing on the proprietary rights of third parties.
There can be no assurance that any of our pending patent applications will be approved or that we will develop additional proprietary products that are patentable. There is also no assurance that any patents issued to us will not become the subject of a re-examination, will provide us with competitive advantages, will not be challenged by any third parties, or that the patents of others will not prevent the commercialization of products incorporating our technology. Furthermore, there can be no guarantee that others will not independently develop similar products, duplicate any of our products, or design around our patents.
Our commercial success will also depend, in part, on our ability to avoid infringing on patents issued by others. If we were judicially determined to be infringing on any third-party patent, we could be required to pay damages, alter our products or processes, obtain licenses, or cease certain activities. If we are required in the future to obtain any licenses from third parties for some of our products, there can be no guarantee that we would be able to do so on commercially favorable terms, if at all. U.S. patent applications are not immediately made public, so we might be surprised by the grant to someone else of a patent on a technology we are actively using.
Litigation, which would result in substantial costs to us and diversion of effort on our part, may be necessary to enforce or confirm the ownership of any patents issued or licensed to us, or to determine the scope and validity of third-party proprietary rights. If our competitors claim technology also claimed by us and prepare and file patent applications in the United States, we may have to participate in interference proceedings declared by the U.S. Patent and Trademark Office or a foreign patent office to determine priority of invention, which could result in substantial costs to and diversion of effort, even if the eventual outcome is favorable to us. Any such litigation or interference proceeding, regardless of outcome, could be expensive and time-consuming.
Successful challenges to our patents through oppositions, reexamination proceedings or interference proceedings could result in a loss of patent rights in the relevant jurisdiction. If we are unsuccessful in actions we bring against the patents of other parties and it is determined that we infringe the patents of third-parties, we may be subject to litigation, or otherwise prevented from commercializing potential products in the relevant jurisdiction, or may be required to obtain licenses to those patents or develop or obtain alternative technologies, any of which could harm our business. Furthermore, if such challenges to our patent rights are not resolved in our favor, we could be delayed or prevented from entering into new collaborations or from commercializing certain products, which could adversely affect our business and results of operations.
On September 16, 2011, President Obama signed into law major patent law reform known as the Leahy-Smith America Invents Act (AIA). Among other things the AIA implements a first inventor to file standard for patent approval, changes the legal standards for patentability under section 102 of the statute, and creates a post grant review system. As a result of the added uncertainty of interpretation of the AIA and the uncertainty of patent law in general, we cannot predict with certainty how much protection, if any, will be given to our patents if we attempt to enforce them and they are challenged in court. Changes to the patent law under the AIA also may provoke third parties to assert claims against us or result in our intellectual property being narrowed in scope or declared to be invalid or unenforceable.
Competitors or third parties may infringe our patents. We may be required to file patent infringement claims, which can be expensive and time-consuming. In addition, in an infringement proceeding, a court may decide that a patent of ours is not valid or is unenforceable, or that the third party’s technology does not in fact infringe upon our patents. An adverse determination of any litigation or defense proceedings could put one or more of our patents at risk of being invalidated or interpreted narrowly and could put our related pending patent applications at risk of not issuing. Litigation may fail and, even if successful, may result in substantial costs and be a distraction to our management. We may not be able to prevent misappropriation of our proprietary rights, particularly in countries outside the U.S. where patent rights may be more difficult to enforce. Furthermore, because of the substantial amount of discovery required in connection with intellectual property litigation, there is a risk that some of our confidential or sensitive information could be compromised by disclosure in the event of litigation. In addition, during the course of litigation there could be public announcements of the results of hearings, motions or other interim proceedings or developments. If securities analysts or investors perceive these results to be negative, it could have a substantial adverse effect on the price of our common stock.
In addition to patents, which alone may not be able to protect the fundamentals of our business, we also rely on unpatented trade secrets and proprietary technological expertise. Some of our intended future cell-related therapeutic products may fit into this category. We rely, in part, on confidentiality agreements with our partners, employees, advisors, vendors, and consultants to protect our trade secrets and proprietary technological expertise. There can be no guarantee that these agreements will not be breached, or that we will have adequate remedies for any breach, or that our unpatented trade secrets and proprietary technological expertise will not otherwise become known or be independently discovered by competitors.
Failure to obtain or maintain patent protection, or protect trade secrets, for any reason (or third-party claims against our patents, trade secrets, or proprietary rights, or our involvement in disputes over our patents, trade secrets, or proprietary rights, including involvement in litigation), could have a substantial negative effect on our results of operations and financial condition.
We may not be able to protect our intellectual property in countries outside the United States
Intellectual property law outside the United States is uncertain and in many countries is currently undergoing review and revisions. The laws of some countries do not protect our patent and other intellectual property rights to the same extent as United States laws. This is particularly relevant to us as most of our current commercial product sales and clinical trials are outside of the United States. Third parties may attempt to oppose the issuance of patents to us in foreign countries by initiating opposition proceedings. Opposition proceedings against any of our patent filings in a foreign country could have an adverse effect on our corresponding patents that are issued or pending in the United States. It may be necessary or useful for us to participate in proceedings to determine the validity of our patents or our competitors’ patents that have been issued in countries other than the U.S. This could result in substantial costs, divert our efforts and attention from other aspects of our business, and could have a material adverse effect on our results of operations and financial condition. We currently have pending patent applications in Europe, Australia, Japan, Canada, China, Korea, and Singapore, among others.
We and our medical devices are subject to FDA regulation
As medical devices, the Celution® System family of products, and components of the Stemsource® cell banks, must receive regulatory clearances or approvals from the FDA and, in many instances, from non-U.S. and state governments prior to their sale. The Celution® System family of products is subject to stringent government regulation in the United States by the FDA under the Federal Food, Drug and Cosmetic Act. The FDA regulates the design/development process, clinical testing, manufacture, safety, labeling, sale, distribution, and promotion of medical devices and drugs. Included among these regulations are pre-market clearance and pre-market approval requirements, design control requirements, and the Quality System Regulations/Good Manufacturing Practices. Other statutory and regulatory requirements govern, among other things, establishment registration and inspection, medical device listing, prohibitions against misbranding and adulteration, labeling and post-market reporting.
The regulatory process can be lengthy, expensive, and uncertain. Before any new medical device may be introduced to the U.S. market, the manufacturer generally must obtain FDA clearance or approval through either the 510(k) pre-market notification process or the lengthier pre-market approval application, or PMA, process. It generally takes from three to 12 months from submission to obtain 510(k) pre-market clearance, although it may take longer. Approval of a PMA could take four or more years from the time the process is initiated. The 510(k) and PMA processes can be expensive, uncertain, and lengthy, and there is no guarantee of ultimate clearance or approval. Our Celution® products under development today and in the foreseeable future will be subject to the lengthier PMA process. Securing FDA clearances and approvals may require the submission of extensive clinical data and supporting information to the FDA, and there can be no guarantee of ultimate clearance or approval. Failure to comply with applicable requirements can result in application integrity proceedings, fines, recalls or seizures of products, injunctions, civil penalties, total or partial suspensions of production, withdrawals of existing product approvals or clearances, refusals to approve or clear new applications or notifications, and criminal prosecution.
Medical devices are also subject to post-market reporting requirements for deaths or serious injuries when the device may have caused or contributed to the death or serious injury, and for certain device malfunctions that would be likely to cause or contribute to a death or serious injury if the malfunction were to recur. If safety or effectiveness problems occur after the product reaches the market, the FDA may take steps to prevent or limit further marketing of the product. Additionally, the FDA actively enforces regulations prohibiting marketing and promotion of devices for indications or uses that have not been cleared or approved by the FDA.
There can be no guarantee that we will be able to obtain the necessary 510(k) clearances or PMA approvals to market and manufacture our other products in the United States for their intended use on a timely basis, if at all. Delays in receipt of or failure to receive such clearances or approvals, the loss of previously received clearances or approvals, or failure to comply with existing or future regulatory requirements could have a substantial negative effect on our results of operations and financial condition.
To sell in international markets, we will be subject to regulation in foreign countries
In cooperation with our distribution partners, we intend to market our current and future products both domestically and in many foreign markets. A number of risks are inherent in international transactions. In order for us to market our products in Europe, Canada, Japan and certain other non-U.S. jurisdictions, we need to obtain and maintain required regulatory approvals or clearances and must comply with extensive regulations regarding safety, manufacturing processes and quality. These regulations, including the requirements for approvals or clearances to market, may differ from the FDA regulatory scheme. International sales also may be limited or disrupted by political instability, price controls, trade restrictions and changes in tariffs. Additionally, fluctuations in currency exchange rates may adversely affect demand for our products by increasing the price of our products in the currency of the countries in which the products are sold.
There can be no assurance that we will obtain regulatory approvals or clearances in all of the countries where we intend to market our products, or that we will not incur significant costs in obtaining or maintaining foreign regulatory approvals or clearances, or that we will be able to successfully commercialize current or future products in various foreign markets. Delays in receipt of approvals or clearances to market our products in foreign countries, failure to receive such approvals or clearances or the future loss of previously received approvals or clearances could have a substantial negative effect on our results of operations and financial condition.
Changing, new and/or emerging government regulations may adversely affect us
Government regulations can change without notice. Given the fact that Cytori operates in various international markets, our access to such markets could change with little to no warning due to a change in government regulations that suddenly up-regulate our product(s) and create greater regulatory burden for our cell therapy and cell banking technology products.
Due to the fact that there are new and emerging cell therapy and cell banking regulations that have recently been drafted and/or implemented in various countries around the world, the application and subsequent implementation of these new and emerging regulations have little to no precedence. Therefore, the level of complexity and stringency is not known and may vary from country to country, creating greater uncertainty for the international regulatory process.
Anticipated or unanticipated changes in the way or manner in which the FDA regulates products or classes/groups of products can delay, further burden, or alleviate regulatory pathways that were once available to other products. There are no guarantees that such changes in FDA’s approach to the regulatory process will not deleteriously affect some or all of our products or product applications.
We may have difficulty obtaining health insurance reimbursement for our products
New and emerging cell therapy and cell banking technologies, such as those provided by the Celution® System family of products, may have difficulty or encounter significant delays in obtaining health care reimbursement in some or all countries around the world due to the novelty of our cell therapy and cell banking technology and subsequent lack of existing reimbursement schemes/pathways. Therefore, the creation of new reimbursement pathways may be complex and lengthy with no assurances that such reimbursements will be successful. The lack of health insurance reimbursement or reduced or minimal reimbursement pricing may have a significant impact on our ability to successfully sell our cell therapy and cell banking technology product(s) into a county or region, which would negatively impact our operating results.
Our concentration of sales in Japan may have negative effects on our business in the event of any crisis in that region
We have operations in a number of regions around the world, including the United States, Japan, and Europe. Our global operations may be subject to risks that may limit our ability to operate our business. We sell our products globally, which exposes us to a number of risks that can arise from international trade transactions, local business practices and cultural considerations, including:
political unrest, terrorism and economic or financial instability;
unexpected changes and uncertainty in regulatory requirements and systems related;
nationalization programs that may be implemented by foreign governments;
import-export regulations;
difficulties in enforcing agreements and collecting receivables;
difficulties in ensuring compliance with the laws and regulations of multiple jurisdictions;
changes in labor practices, including wage inflation, labor unrest and unionization policies;
longer payment cycles by international customers;
currency exchange fluctuations;
disruptions of service from utilities or telecommunications providers, including electricity shortages;
difficulties in staffing foreign branches and subsidiaries and in managing an expatriate workforce, and differing employment practices and labor issues;
potentially adverse tax consequences;
We also face risks associated with currency exchange and convertibility, inflation and repatriation of earnings as a result of our foreign operations. We are also vulnerable to appreciation or depreciation of foreign currencies against the U.S. dollar. Although we have significant operations in Asia, a substantial portion of transactions are denominated in U.S. dollars. As appreciation against the U.S. dollar increases, it will result in an increase in the cost of our business expenses abroad. Conversely, downward fluctuations in the value of foreign currencies relative to the U.S. dollar may make our products less price competitive than local solutions. From time to time, we may engage in currency hedging activities, but such activities may not be able to limit the risks of currency fluctuations.
Our revenue, results of operations, and cash flows may suffer upon the loss of a significant customer or a significant reduction in the amount of product ordered by any such customer.
Our largest customer accounted for 26% of our revenue during the year ended December 31, 2013. Loss of this significant customer or a significant reduction in the amount of product ordered by this customer could adversely affect our revenue, results of operations, and cash flows.
We must maintain quality assurance certification and manufacturing approvals
The manufacture of our products is, and the manufacture of any future cell-related therapeutic products would be, subject to periodic inspection by regulatory authorities and distribution partners. The manufacture of devices and products for human use is subject to regulation and inspection from time to time by the FDA for compliance with the FDA’s Quality System Regulation, or QSR, requirements, as well as equivalent requirements and inspections by state and non-U.S. regulatory authorities. There can be no guarantee that the FDA or other authorities will not, during the course of an inspection of existing or new facilities, identify what they consider to be deficiencies in our compliance with QSRs or other requirements and request, or seek remedial action.
Failure to comply with such regulations or a potential delay in attaining compliance may adversely affect our manufacturing activities and could result in, among other things, injunctions, civil penalties, FDA refusal to grant pre-market approvals or clearances of future or pending product submissions, fines, recalls or seizures of products, total or partial suspensions of production, and criminal prosecution. There can be no assurance after such occurrences that we will be able to obtain additional necessary regulatory approvals or clearances on a timely basis, if at all. Delays in receipt of or failure to receive such approvals or clearances, or the loss of previously received approvals or clearances could have a substantial negative effect on our results of operations and financial condition.
The termination or suspension of the BARDA contract could delay and/or adversely affect our business and our ability to further develop our Celution® System
Cytori was awarded the contract with BARDA in September 2012 with the aim to develop a new countermeasure for a combined injury involving thermal burn and radiation exposure which would be useful following a mass-casualty event. The cost-plus-fixed-fee contract is valued at up to $106 million, with a guaranteed base period of approximately $4.7 million which includes preclinical research and the acceleration of Cytori’s ongoing development of Cytori’s ongoing development of the Celution® cell processing System (the Celution® System). Upon satisfactory proof of concept, BARDA may elect to exercise up to three contract options which will extend the contract term to up to five years if all options are exercised. BARDA may suspend or terminate this contract should we fail to achieve key objectives or milestones, or fail to comply with the operating procedures and processes approved by BARDA and its audit agency, the Defense Contract Audit Agency. There can be no assurance that we will be able to achieve these milestones or continue to comply with these procedures and protocols, or whether we will be able to successfully develop our Celution® System under the contract. If the BARDA contract were terminated or suspended, our business could be adversely affected.
The BARDA contract has certain contracting requirements that allow the U.S. Government to unilaterally control its contracts. If the U.S. Government suspends, cancels, or otherwise terminates our contract with them, we could experience significant revenue shortfalls, and our financial condition and business may be adversely affected
Contracts with U.S. Government agencies typically contain termination provisions unfavorable to the other party, and are subject to audit and modification by the U.S. government at its sole discretion, which will subject us to additional risks. These risks include the ability of the U.S. Government to unilaterally:
| · | audit or object to our contract-related costs and fees, and require us to reimburse all such costs and fees; |
| · | suspend or prevent us for a set period of time from receiving new contracts or extending our existing contracts based on violations or suspected violations of laws or regulations; |
| · | cancel, terminate or suspend our contracts based on violations or suspected violations of laws or regulations; |
| · | terminate our contracts if in the Government’s best interest, including if funds become unavailable to the applicable governmental agency; |
| · | reduce the scope and value of our contracts; and |
| · | change certain terms and conditions in our contracts. |
BARDA is able to terminate its contracts with us, either for its best interests or if we default by failing to perform in accordance with or to achieve the milestones set forth in the contract schedules and terms. Termination-for-convenience provisions generally enable us to recover only our costs incurred or committed and settlement expenses on the work completed prior to termination. Changes to, or an unexpected termination of this contract could result in significant revenue shortfalls. If revenue shortfalls occur and are not offset by corresponding reductions in expenses, our business could be adversely affected. We cannot anticipate if, when or to what extent BARDA might revise, alter or terminate its contract with us in the future.
Under our contract with BARDA, our operations, and those of our contractors, are subject to audit by the U.S. Government, a negative outcome to which could adversely affect our financial conditions and business operations
U.S. government agencies, such as the Department of Health and Human Services, or DHHS, and the Defense Contract Audit Agency, or the DCAA, routinely audit and investigate government contractors and recipients of federal grants. These agencies evaluate a contractor’s performance under its contracts, cost structure and compliance with applicable laws, regulations and standards.
The DHHS and the DCAA also review the adequacy of, and a contractor’s compliance with, its internal control systems and policies, including the contractor’s purchasing, property, estimating, compensation and management information systems. Any costs found to be improperly allocated to a contract will not be reimbursed, while such costs already reimbursed must generally be repaid. If an audit identifies improper or illegal activities, we may be subject to civil and criminal penalties and administrative sanctions, including, but not limited to:
| · | termination of contracts; |
| · | forfeiture of profits; |
| · | suspension of payments; |
| · | fines; and |
| · | suspension or prohibition from conducting business with the United States government. |
We depend on a few key officers
Our performance is substantially dependent on the performance of our executive officers and other key scientific and sales staff, including Christopher J. Calhoun, our Chief Executive Officer, and Marc Hedrick, MD, our President. We rely upon them for strategic business decisions and guidance. We believe that our future success in developing marketable products and achieving a competitive position will depend in large part upon whether we can attract and retain additional qualified management and scientific personnel. Competition for such personnel is intense, and there can be no assurance that we will be able to continue to attract and retain such personnel. The loss of the services of one or more of our executive officers or key scientific staff, or the inability to attract and retain additional personnel and develop expertise as needed could have a substantial negative effect on our results of operations and financial condition.
We may not have enough product liability insurance
The testing, manufacturing, marketing, and sale of our regenerative cell products involve an inherent risk that product liability claims will be asserted against us, our distribution partners, or licensees. There can be no guarantee that our clinical trial and commercial product liability insurance is adequate or will continue to be available in sufficient amounts or at an acceptable cost, if at all. A product liability claim, product recall, or other claim, as well as any claims for uninsured liabilities or in excess of insured liabilities, could have a substantial negative effect on our results of operations and financial condition. Also, well-publicized claims could cause our stock to fall sharply, even before the merits of the claims are decided by a court.
Risks Related to Ownership of our Common Stock
The market price of our common stock may be volatile and fluctuate significantly, which could result in substantial losses for stockholders and subject us to litigation.
The market price of our common stock may be subject to significant fluctuations. Among the factors that may cause the market price of our common stock to fluctuate are the risks described in this “Risk Factors” section and other factors, including:
fluctuations in our operating results or the operating results of our competitors;
changes in estimates of our financial results or recommendations by securities analysts;
variance in our financial performance from the expectations of securities analysts;
changes in the estimates of the future size and growth rate of our markets;
changes in accounting principles or changes in interpretations of existing principles, which could affect our financial results;
conditions and trends in the markets we serve;
changes in general economic, industry and market conditions;
success of competitive products and services;
changes in market valuations or earnings of our competitors;
announcements of significant new products, contracts, acquisitions or strategic alliances by us or our competitors;
the timing and outcome of regulatory reviews and approvals of our products;
the commencement or outcome of litigation involving our company, our general industry or both;
changes in our capital structure, such as future issuances of securities or the incurrence of additional debt;
actual or expected sales of our common stock by the holders of our common stock; and
the trading volume of our common stock.
In addition, the stock market in general, the NASDAQ Global Market and the market for cell therapy development companies in particular may experience a loss of investor confidence. A loss of investor confidence may result in extreme price and volume fluctuations in our common stock that are unrelated or disproportionate to the operating performance of our business, our financial condition or results of operations. These broad market and industry factors may materially harm the market price of our common stock and expose us to securities class-action litigation. Class-action litigation, even if unsuccessful, could be costly to defend and divert management’s attention and resources, which could further materially harm our financial condition and results of operations.
Future sales of our common stock may depress our share price.
As of December 31, 2013, we had 71,305,375 shares of our common stock outstanding. Sales of a number of shares of common stock in the public market, or the expectation of such sales, could cause the market price of our common stock to decline. In addition, our 2004 Equity Incentive Plan provides for annual increases in the number of shares available for issuance under the plan, which may, among other things, result in dilution of the price of our common stock. We may also sell additional common stock in subsequent public offerings, which may adversely affect the market price of our common stock.
We have granted demand registration rights for the resale of certain shares of our common stock to each of Olympus Corporation, Astellas Pharma Inc. and Green Hospital Supply, Inc. pursuant to common stock purchase agreements previously entered into with each of these stockholders. An aggregate of 5,528,571 shares of our common stock are subject to these demand registration rights. If we receive a written request from any of these stockholders to file a registration statement under the Securities Act covering its shares of unregistered common stock, we are required to use reasonable efforts to prepare and file with the SEC within 30 business days of such request a registration statement covering the resale of the shares for an offering to be made on a continuous basis pursuant to Rule 415 under the Securities Act.
Our charter documents contain anti-takeover provisions
Certain provisions of our amended and restated certificate of incorporation and amended and restated bylaws could discourage, delay or prevent a merger, acquisition or other change of control that stockholders may consider favorable. These provisions could also prevent or frustrate attempts by our stockholders to replace or remove members of our Board of Directors. Stockholders who wish to participate in these transactions may not have the opportunity to do so. These provisions:
authorize our Board of Directors to issue without stockholder approval up to 5,000,000 shares of preferred stock, the rights of which will be determined at the discretion of the Board of Directors;
require that stockholder actions must be effected at a duly called stockholder meeting and cannot be taken by written consent;
establish advance notice requirements for stockholder nominations to our Board of Directors or for stockholder proposals that can be acted on at stockholder meetings; and
limit who may call stockholder meetings.
21
We are governed by the provisions of Section 203 of the Delaware General Corporation Law, which may, unless certain criteria are met, prohibit large stockholders, in particular those owning 15% or more of the voting rights on our common stock, from merging or combining with us for a prescribed period of time.
We pay no dividends.
We have never paid cash dividends in the past, and currently do not intend to pay any cash dividends in the foreseeable future. Furthermore, our June 28, 2013 Loan and Security Agreement with Oxford Finance LLC and Silicon Valley Bank currently prohibits our issuance of cash dividends. This could make an “outside director”investment in our company inappropriate for some investors, and may serve to narrow our potential sources of additional capital.
If securities and/or industry analysts fail to continue publishing research about our business, if they change their recommendations adversely or if our results of operations do not meet their expectations, our stock price and trading volume could decline.
The trading market for our common stock will be influenced by the research and reports that industry or securities analysts publish about us or our business. If one or more of these analysts cease coverage of our company or fail to publish reports on us regularly, we could lose visibility in the financial markets, which in turn could cause our stock price or trading volume to decline. In addition, it is likely that in some future period our operating results will be below the expectations of securities analysts or investors. If one or more of the analysts who cover us downgrade our stock, or if our results of operations do not meet their expectations, our stock price could decline.
Not applicable.
We lease 77,585 square feet at 3020 and 3030 Callan Road, San Diego, California that we use for our corporate headquarters and manufacturing facilities. The related lease agreement, as amended, bears monthly rent at a rate of $1.80 per square foot, with annual increase of $0.05 per square foot. The lease term is 88 months, commencing on July 1, 2010 and expiring on October 31, 2017. We are eligible to receive a 50% rent abatement for an additional 17,467 square feet through March of 2014 along with a tenant improvement allowance. Additionally, we’ve entered into several lease agreements for international office locations and corporate housing for our employees on international assignments. For these properties, we pay an aggregate of approximately $180,000 in rent per month.
From time to time, we have been involved in routine litigation incidental to the conduct of our business. As of December 31, 2013, we were not a party to any material legal proceeding.
Not applicable.
PART II
Item 5. Market for Registrant’s Common Equity, Related Stockholder Matters and Issuer Purchases of Equity Securities
Market Prices
From August 2000 (our initial public offering in Germany) through September 2007 our common stock was quoted on the Frankfurt Stock Exchange under the symbol “XMPA” (formerly XMP). In September 2007 our stock closed trading on the Frankfurt Stock Exchange. Effective December 19, 2005, our common stock began trading on the NASDAQ Capital Market under the symbol “CYTX,” and has since transferred to the NASDAQ Global Market effective February 14, 2006. Warrants, issued as part of a financing agreement in March 2009, began trading on the NASDAQ Global Market under the symbol “CYTXW” effective June 22, 2009. The following tables show the high and low sales prices for our common stock and warrants for the periods indicated, as reported by the NASDAQ Stock Market. These prices do not include retail markups, markdowns or commissions.
Common Stock
| High | Low | |||||||
| 2012 | ||||||||
| Quarter ended March 31, 2012 | $ | 4.50 | $ | 2.20 | ||||
| Quarter ended June 30, 2012 | $ | 2.86 | $ | 2.01 | ||||
| Quarter ended September 30, 2012 | $ | 4.93 | $ | 2.35 | ||||
| Quarter ended December 31, 2012 | $ | 4.55 | $ | 2.46 | ||||
| 2013 | ||||||||
| Quarter ended March 31, 2013 | $ | 3.16 | $ | 2.31 | ||||
| Quarter ended June 30, 2013 | $ | 2.89 | $ | 2.20 | ||||
| Quarter ended September 30, 2013 | $ | 2.87 | $ | 2.09 | ||||
| Quarter ended December 31, 2013 | $ | 3.93 | $ | 2.00 | ||||
All of our outstanding shares have been deposited with the Depository Trust & Clearing Corporation (DTCC) since December 9, 2005.
Warrants
| High | Low | |||||||
| 2012 | ||||||||
| Quarter ended March 31, 2012 | $ | 2.45 | $ | 1.02 | ||||
| Quarter ended June 30, 2012 | $ | 1.40 | $ | 0.86 | ||||
| Quarter ended September 30, 2012 | $ | 2.73 | $ | 0.90 | ||||
| Quarter ended December 31, 2012 | $ | 2.40 | $ | 1.11 | ||||
| 2013 | ||||||||
| Quarter ended March 31, 2013 | $ | 1.66 | $ | 0.90 | ||||
| Quarter ended June 30, 2013 | $ | 1.08 | $ | 0.67 | ||||
| Quarter ended September 30, 2013 | $ | 1.01 | $ | 0.65 | ||||
| Quarter ended December 31, 2013 | $ | 1.40 | $ | 0.49 | ||||
As of February 28, 2014, we had approximately 22 record holders of our common stock and 1 record holder of our warrants. Because many of our shares and warrants are held by brokers and other institutions on behalf of stockholders and warrant holders, we are unable to estimate the total number of individual stockholders and warrant holders represented by these record holders.
Dividends
We have never declared or paid any dividends on our common stock and do not anticipate paying any in the foreseeable future. Furthermore, our June 28, 2013 Loan and Security Agreement with Oxford Finance LLC and Silicon Valley Bank currently prohibits our issuance of cash dividends.
Equity Compensation Plan Information
| Plan Category | Number of securities to be issued upon exercise of outstanding options, warrants and rights | Weighted-average exercise price of outstanding options, warrants and rights | Number of securities remaining available for future issuance under equity compensation plans (excluding securities reflected in column(a)) | |||||||||
| (a) | (b) | (c) | ||||||||||
| Equity compensation plans approved by security holders (1) | 840,087 | $ | 4.60 | — | ||||||||
| Equity compensation plans not approved by security holders (2) | 7,740,094 | $ | 4.39 | 700,647 | ||||||||
| Total | 8,580,181 | $ | 4.41 | 700,647 | ||||||||
| (1) | The 1997 Stock Option and Stock Purchase Plan expired on October 22, 2007. |
| (2) | See Notes to our Consolidated Financial Statements included elsewhere herein for a description of our 2004 Equity Incentive Plan. The maximum number of shares shall be cumulatively increased on the first January 1 after the Effective Date, August 24, 2004, and each January 1 thereafter for 9 more years, by a number of shares equal to the lesser of (a) 2% of the number of shares issued and outstanding on the immediately preceding December 31, and (b) a number of shares set by the Board. |
Comparative Stock Performance Graph
The following graph shows how an initial investment of $100 in our common stock would have compared to an equal investment in the NASDAQ Composite Index and the NASDAQ Biotechnology Index during the period from December 31, 2008 through December 31, 2013. The performance shown is not necessarily indicative of future price performance.
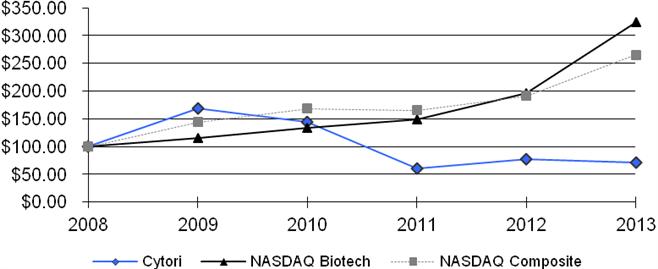
The selected data presented below under the captions “Statements of Operations Data,” “Statements of Cash Flows Data” and “Balance Sheet Data” for, and as of the end of, each of the years in the five-year period ended December 31, 2013, are derived from, and should be read in conjunction with, our audited consolidated financial statements. The consolidated balance sheets as of December 31, 2013 and 2012, and the related consolidated statements of operations and comprehensive loss, stockholders’ equity, and cash flows for each of the years in the three-year period ended December 31, 2013, which have been audited by KPMG LLP, an independent registered public accounting firm, and their report thereon, are included elsewhere in this annual report. The consolidated balance sheets as of December 31, 2011, 2010 and 2009, and the related consolidated statements of operations and comprehensive loss, stockholders’ equity, and cash flows for the years ended December 31, 2010 and 2009, which were also audited by KPMG LLP, are included with our annual reports previously filed.
The information contained in this table should also be read in conjunction with “Management’s Discussion and Analysis of Financial Condition and Results of Operations” and the financial statements and related notes thereto included elsewhere in this report (in thousands except share and per share data):
| 2013 | 2012 | 2011 | 2010 | 2009 | ||||||||||||||||
| Statements of Operations Data: | ||||||||||||||||||||
| Product revenues: | ||||||||||||||||||||
| Sales to related party | $ | 1,845 | $ | — | $ | — | $ | 590 | $ | 591 | ||||||||||
| Sales to third parties | 5,277 | 8,709 | 7,983 | 7,664 | 5,246 | |||||||||||||||
| 7,122 | 8,709 | 7,983 | 8,254 | 5,837 | ||||||||||||||||
| Cost of product revenues | 3,421 | 4,000 | 3,837 | 3,908 | 3,394 | |||||||||||||||
| Gross profit | 3,701 | 4,709 | 4,146 | 4,346 | 2,443 | |||||||||||||||
| Development revenues: | ||||||||||||||||||||
| Development, related party | 638 | 2,882 | 1,992 | 2,122 | 8,840 | |||||||||||||||
| Development | 1,179 | 2,529 | — | — | — | |||||||||||||||
| Government contracts and other | 3,257 | 381 | 21 | 251 | 53 | |||||||||||||||
| 5,074 | 5,792 | 2,013 | 2,373 | 8,893 | ||||||||||||||||
| Operating expenses: | ||||||||||||||||||||
| Research and development | 17,065 | 13,628 | 10,904 | 9,687 | 12,231 | |||||||||||||||
| Sales and marketing | 9,026 | 9,488 | 13,560 | 11,040 | 6,583 | |||||||||||||||
| General and administrative | 16,031 | 15,672 | 14,727 | 12,570 | 10,415 | |||||||||||||||
| Change in fair value of warrants | (418 | ) | (209 | ) | (4,360 | ) | (1,285 | ) | 4,574 | |||||||||||
| Change in fair value of option liabilities | (2,250 | ) | 340 | 740 | 30 | (920 | ) | |||||||||||||
| Total operating expenses | 39,454 | 38,919 | 35,571 | 32,042 | 32,883 | |||||||||||||||
| Total operating loss | (30,679 | ) | (28,418 | ) | (29,412 | ) | (25,323 | ) | (21,547 | ) | ||||||||||
| Other income (expense): | ||||||||||||||||||||
| Loss on asset disposal | (257 | ) | — | — | — | — | ||||||||||||||
| Loss on debt extinguishment | (708 | ) | — | — | — | — | ||||||||||||||
| Interest income | 4 | 4 | 9 | 9 | 20 | |||||||||||||||
| Interest expense | (3,396 | ) | (3,386 | ) | (2,784 | ) | (2,052 | ) | (1,427 | ) | ||||||||||
| Other income (expense), net | (438 | ) | (314 | ) | (55 | ) | 23 | (218 | ) | |||||||||||
| Gain on Puregraft divestiture | 4,453 | — | — | — | — | |||||||||||||||
| Gain on previously held equity interest in JV | 4,892 | — | — | — | — | |||||||||||||||
| Equity loss in investments | (48 | ) | (165 | ) | (209 | ) | (151 | ) | (44 | ) | ||||||||||
| Net loss | $ | (26,177 | ) | $ | (32,279 | ) | $ | (32,451 | ) | $ | (27,494 | ) | $ | (23,216 | ) | |||||
| Basic and diluted net loss per share | $ | (0.39 | ) | $ | (0.55 | ) | $ | (0.61 | ) | $ | (0.60 | ) | $ | (0.65 | ) | |||||
| Basic and diluted weighted average common shares | 67,781,364 | 58,679,687 | 53,504,030 | 45,947,966 | 35,939,260 | |||||||||||||||
| Statements of Cash Flows Data: | ||||||||||||||||||||
| Net cash used in operating activities | $ | (34,563 | ) | $ | (32,193 | ) | $ | (35,323 | ) | $ | (23,574 | ) | $ | (23,807 | ) | |||||
| Net cash provided by(used in) investing activities | 3,686 | (1,204 | ) | (560 | ) | (1,290 | ) | (221 | ) | |||||||||||
| Net cash provided by financing activities | 20,772 | 22,192 | 20,137 | 64,678 | 24,271 | |||||||||||||||
| Effect of exchange rate changes on cash and cash equivalents | (106 | ) | — | — | — | — | ||||||||||||||
| Net (decrease) increase in cash | (10,211 | ) | (11,205 | ) | (15,746 | ) | 39,814 | 243 | ||||||||||||
| Cash and cash equivalents at beginning of year | 25,717 | 36,922 | 52,668 | 12,854 | 12,611 | |||||||||||||||
| Cash and cash equivalents at end of year | $ | 15,506 | $ | 25,717 | $ | 36,922 | $ | 52,668 | $ | 12,854 | ||||||||||
| Balance Sheet Data: | ||||||||||||||||||||
| Cash, cash equivalents and short-term investments | $ | 15,506 | $ | 25,717 | $ | 36,922 | $ | 52,668 | $ | 12,854 | ||||||||||
| Working capital | 9,671 | 16,366 | 35,516 | 45,730 | 9,915 | |||||||||||||||
| Total assets | 42,060 | 43,250 | 51,534 | 66,347 | 24,749 | |||||||||||||||
| Deferred revenues, related party | — | 638 | 3,520 | 5,512 | 7,634 | |||||||||||||||
| Deferred revenues | 212 | 2,635 | 5,244 | 4,929 | 2,388 | |||||||||||||||
| Warrant liabilities, long-term | — | — | 627 | 4,987 | 6,272 | |||||||||||||||
| Option liabilities | — | 2,250 | 1,910 | 1,170 | 1,140 | |||||||||||||||
| Long-term deferred rent | 710 | 756 | 504 | 398 | — | |||||||||||||||
| Long-term obligations, less current portion | 23,100 | 12,903 | 21,962 | 13,255 | 2,790 | |||||||||||||||
| Total stockholders’ equity (deficit) | $ | 3,132 | $ | 6,455 | $ | 9,946 | $ | 22,873 | $ | (3,658 | ) | |||||||||
We are a cell therapy company dedicated to the development of novel treatments primarily for cardiovascular disease as well as for a range of soft tissue injuries. In the U.S. our goal is to bring Cytori Cell Therapy to market for treatment of heart failure due to ischemic heart disease through Cytori-sponsored clinical development efforts and to develop a treatment for thermal burns combined with radiation injury under a contract from BARDA, a division of the U.S. Department of Health and Human Services.
Cytori Cell Therapy is a proprietary formulation of stem and regenerative cells derived from a patient’s own adipose (fat) tissue (ADRCs). Adipose tissue is a rich and accessible source of stem and other regenerative cells. To access these cells from a patient at the time of a surgical procedure, we have designed and developed a sophisticated tissue processing system, the Celution® System, which automates the complex process of digesting fat tissue, releasing the ADRCs, and concentrating them into an optimized and proprietary formulation in a sterile environment. The system is comprised of a central device and single-use, per-procedure consumable cartridges. The business model is based on the sale of the device and generating recurring revenue from the cartridges that are utilized in each procedure.
In addition to our targeted therapeutic development, we have continued to commercialize the Celution® System under select medical device clearances to research customers developing new therapeutic applications for Cytori Cell Therapy in Europe, Japan, and other regions. The early sales of systems, consumables and ancillary products contributes margins that partially offset our operating expenses and play an important strategic role in fostering familiarity within the medical community with our technology. These sales have also facilitated the discovery of new applications for Cytori Cell Therapy by customers conducting investigator-initiated and funded research.
Development Pipeline
The primary therapeutic areas currently within our development pipeline are cardiovascular disease, specifically heart failure due to ischemic heart disease, the treatment of thermal burns, and orthopedics and sports medicine indications.
In the U.S., we are conducting our ATHENA trial, a prospective, double blind, placebo-controlled, multi-center trial in up to 45 patients with ischemic heart disease. The trial will measure several endpoints, including peak oxygen consumption (VO2 max). Additional endpoints include perfusion defect, left ventricle end-systolic and diastolic volume and ejection fraction at six and 12 months, NYHA functional class and health-related quality of life. In the third quarter, the FDA approved expanding the ATHENA trial from six trial centers to a total of eight centers. In addition, we also received approval from the FDA to expand the ATHENA program to include a higher cell dose. This trial, ATHENA II, will enroll 45 patients at up to 10 centers, including most of the centers in ATHENA I and will begin enrolling in the first quarter of 2014.
ADVANCE is our European clinical trial for acute myocardial infarction (heart attack). As part of a comprehensive evaluation of our global cardiovascular strategy, resource utilization and development priorities, we have discontinued enrollment in the ADVANCE trial as of September 30, 2013. All evidence to date supports the current, known safety profile for Cytori’s Cell Therapy and the patients enrolled in the trial will continue to be followed according to the protocol. The outcomes will be fully analyzed in conjunction with the existing safety and feasibility data from the APOLLO acute myocardial infarction trial. We will focus our internal and financial resources on the highest clinical development priority, which is the expanded U.S. ATHENA trial.
We have completed two European pilot trials investigating Cytori’s Cell Therapy for cardiovascular disease. We have reported long term, 18-month data from the PRECISE trial for chronic myocardial ischemia, which showed that Cytori’s Cell Therapy demonstrated safety and sustained improvement in cardiac functional capacity as measured by VO2 max. Results from the APOLLO trial for acute heart attack demonstrated safety and sustained improvement in infarct size.
In addition to our cardiovascular disease therapeutic pipeline, Cytori is also developing its cell therapy platform for the treatment of thermal burns combined with radiation injury, sports medicine and orthopedics. In the third quarter of 2012, we were awarded a contract to develop a new countermeasure for thermal burns valued at up to $106 million with the U.S. Department of Health and Human Service’s Biomedical Advanced Research and Development Authority (BARDA). The initial base period includes $4.7 million over two years and covers preclinical research and continued development of Cytori’s Celution® System to improve cell processing. The additional contract options, if fully executed, could cover our clinical development through FDA approval under a device-based PMA regulatory pathway. We are making progress in fulfilling the required milestones of the base contract with the goal of completing the base period in early 2014. We have also received FDA approval in late 2013 to conduct a safety and feasibility clinical trial in patients with acute hamstring tears in order to evaluate the effect of Cytori Cell Therapy on healing in muscle injury.
Results of Operations
Product revenues
Product revenues consisted of revenues primarily from our Celution® and StemSource® Cell Banks.
The following table summarizes the components for the years ended December 31, 2013, 2012 and 2011:
| Years ended | ||||||||||||
| 2013 | 2012 | 2011 | ||||||||||
| Related party | $ | 1,845,000 | $ | — | $ | — | ||||||
| Third party | 5,277,000 | 8,709,000 | 7,983,000 | |||||||||
| Total product revenues | $ | 7,122,000 | $ | 8,709,000 | $ | 7,983,000 | ||||||
A significant contributor to Cytori’s product revenue historically and throughout 2013 has been sales in Japan. In September 2012 we obtained Class I Device Clearance for Celution® and a number of our other products in Japan. This clearance is expected to facilitate sales growth in Japan and it is anticipated that demand will come mostly from researchers at academic hospitals seeking to perform investigator-initiated and funded studies using Cytori’s Cell Therapy.
We experienced a decrease in product revenue during year ended December 31, 2013 as compared to the same periods in 2012 and 2011, due principally to the product mix comprising revenue for each period and anticipated timing associated with larger system related sales. An additional $3.6 million in orders shipped to customers in 2013 was excluded from product revenues as the relevant revenue recognition criteria were not met, and is expected to be recognized in 2014.
The future: We expect to continue to generate product revenues from a mix of Celution® and StemSource® System and consumables sales. We will sell the products to a diverse group of distributors and partners in Europe, Asia and the U.S., who may apply the products towards reconstructive surgery, soft tissue repair, research, aesthetics, and cell and tissue banking as approved in each country. Additionally, as a result of Class I Device Clearance for Celution® and a number of our other products in Japan, we anticipate to sell these products to researchers at academic hospitals seeking to perform investigator-initiated and funded studies using Cytori’s Cell Therapy. As a result of sale of our Puregraft® product line discussed in note 5 of the Consolidated Financial Statements, we do not expect significant revenues from that product line in the foreseeable future.
Cost of product revenues
Cost of product revenues relate primarily to Celution® System products and StemSource® Cell Banks and includes material, manufacturing labor, and overhead costs. The following table summarizes the components of our cost of revenues for the years ended December 31, 2013, 2012 and 2011:
| Years ended | ||||||||||||
| 2013 | 2012 | 2011 | ||||||||||
| Cost of product revenues | $ | 3,338,000 | $ | 3,923,000 | $ | 3,772,000 | ||||||
| Share-based compensation | 83,000 | 77,000 | 65,000 | |||||||||
| Total cost of product revenues | $ | 3,421,000 | $ | 4,000,000 | $ | 3,837,000 | ||||||
| Total cost of product revenues as % of product revenues | 48.0 | % | 45.9 | % | 48.1 | % | ||||||
Cost of product revenues as a percentage of product revenues was 48.0%, 45.9% and 48.1% for the years ended December 31, 2013, 2012 and 2011, respectively. Fluctuation in this percentage is to be expected due to the product mix, distributor and direct sales mix, and allocation of overhead.
The future. We expect to continue to see variation in our gross profit margin as the product mix comprising revenues fluctuates.
Development revenues
The following table summarizes the components of our development revenues for the years ended December 31, 2013, 2012 and 2011:
| Years ended | ||||||||||||
| 2013 | 2012 | 2011 | ||||||||||
| Milestone revenue (Olympus) | $ | 638,000 | $ | 2,882,000 | $ | 1,992,000 | ||||||
| Development revenue (Astellas) | — | 2,529,000 | — | |||||||||
| Development revenue (Senko) | 1,179,000 | — | — | |||||||||
| Government contract (BARDA) and Other | 3,257,000 | 379,000 | 17,000 | |||||||||
| Regenerative cell storage services | — | 2,000 | 4,000 | |||||||||
| Total development revenues | $ | 5,074,000 | $ | 5,792,000 | $ | 2,013,000 | ||||||
We recognize deferred revenues, related party, as development revenue when certain performance obligations are met (i.e., using a proportional performance approach). During the year ended December 31, 2013, we recognized $638,000 of revenue associated with our arrangements with Olympus as a result of the United States Court of Appeals upholding the FDA’s previous determination that our cell processing devices were not substantially equivalent to the cited predicate devices. The recognition of revenue associated with this event reflects the completion of our efforts expended to use commercially reasonable efforts to obtain device regulatory approvals in the United States as it pertains to the 510(k) pathway. During the year ended December 31, 2012 we recognized $2,882,000 of revenue associated with our arrangements with Olympus as a result of two remaining milestones for the APOLLO and PRECISE clinical trials that were reached upon the completion of all patient follow up procedures and recognition of a regulatory milestone triggered upon us obtaining Class I Device Clearance for Celution® and a number of our other products in Japan. During the year ended December 31, 2011, we recognized $1,992,000 of revenue associated with our arrangements with Olympus as a result of achieving a product development milestone related to additional preproduction development of the Celution® One System and a regulatory milestone related to our obtaining CE Mark claims for the Celution® One System in Europe.
In February 2013, we entered into a mutual termination and release agreement with Senko, whereby the Distribution Agreement and all Senko rights, licenses and privileges granted under the Distribution Agreement terminated and reverted to the Company. As a result of this Termination Agreement, we are obligated to pay Senko $1,200,000 in six quarterly installment payments of $200,000 each through May 2014. At the time of the Termination Agreement, we had a balance of $2,379,000 in deferred revenues on our balance sheet relating to the payments received from Senko in the past pursuant to the Distribution Agreement. At the time of the Termination Agreement, we accrued $1,200,000 of the termination fee, and recognized the remaining $1,179,000 in development revenues which reflects the Company’s efforts towards commercialization under the agreement.
In the third quarter of 2012, we were awarded a contract to develop a new countermeasure for thermal burns valued at up to $106 million with U.S. Department of Health and Human Service’s Biomedical Advanced Research and Development Authority (BARDA). The initial base period includes $4.7 million over two years and covers preclinical research and continued development of Cytori’s Celution® system to improve cell processing. The additional contract options, if fully executed, could cover clinical development through FDA approval under a device-based PMA regulatory pathway. This is a cost reimbursement contract and related government contract revenue was recorded at the gross amount of reimbursement starting in the fourth quarter of 2012. To receive funds under this arrangement, we are required to (i) demonstrate that we incurred “qualifying expenses,” as defined in the contract agreement between BARDA and us, (ii) maintain a system of controls, whereby we can accurately track and report all expenditures related solely to develop a new countermeasure for thermal burns, and (iii) file appropriate forms and follow appropriate protocols established by Section 162(m)BARDA. During the year ended December 31, 2013, we incurred $3,053,000 in qualified expenditures. We recognized a total of $3,282,000 in revenues for the year ended December 31, 2013, which included allowable fees as well as cost reimbursements. During the year ended December 31, 2012, we incurred $331,000 in qualified expenditures. We recognized a total of $355,000 in revenues for the year ended December 31, 2012, which included allowable fees as well as cost reimbursements. There were no comparable revenues and expenditures for the year ended December 31, 2011.
The future: We expect to continue recognizing government contract revenue relating to our contract with BARDA as we continue our development work relating to this contract.
Research and development expenses
Research and development expenses include costs associated with the design, development, testing and enhancement of our products, regulatory fees, the purchase of laboratory supplies, pre-clinical studies and clinical studies. The following table summarizes the components of our research and development expenses for the years ended December 31, 2013, 2012 and 2011:
| Years ended | ||||||||||||
| 2013 | 2012 | 2011 | ||||||||||
| Research and development | $ | 16,444,000 | $ | 12,784,000 | $ | 10,021,000 | ||||||
| Development milestone (Joint Venture) | 16,000 | 219,000 | 396,000 | |||||||||
| Stock-based compensation | 605,000 | 625,000 | 487,000 | |||||||||
| Total research and development expenses | $ | 17,065,000 | $ | 13,628,000 | $ | 10,904,000 | ||||||
Research and development expenses relate to the development of a technology platform that involves using adipose tissue as a source of autologous regenerative cells for therapeutic applications. These expenses, in conjunction with continued development efforts related to our Celution® System, result primarily from the broad expansion of our research and development efforts.
Research and development expenses for the year ended December 31, 2013 as compared to the same period in 2012 increased primarily due to the increase in salary and related benefits expense (excluding share-based compensation) of $590,000, an increase in professional services expenses of $1,025,000 and increase in research supplies expense of $987,000 due to increase in our clinical and research activities including our efforts related to BARDA.
Research and development expenses for the year ended December 31, 2012 as compared to the same period in 2011 increased primarily due to the increase in salary and related benefits expense (excluding share-based compensation) of $949,000, an increase in professional services expenses of $393,000, increase in research supplies expense of $360,000, and increase in clinical study expense of $370,000 due to increase in our clinical and regulatory activities.
Expenditures related to the Joint Venture with Olympus, which are included in the variation analysis above, included costs that were necessary to support the commercialization of future generation devices, including the next generation Celution® System. These development activities, which began in November 2005, concluded during the first quarter of 2013, and we did not incur any Joint Venture development costs subsequent to our acquisition, in May 2013, of Olympus’ 50% interest in the Joint Venture.
The future: We expect research and development expenditures to increase in 2014 as we continue enrollment in our US trial ATHENA and ATHENA II, RECOVER, continue development work under our BARDA contract, and as we seek additional regulatory clearances and potentially seek to initiate additional trials or patient registries during 2014.
Sales and marketing expenses
Sales and marketing expenses include costs of sales and marketing personnel, tradeshows, physician training, and promotional activities and materials. The following table summarizes the components of our sales and marketing expenses for the years ended December 31, 2013, 2012 and 2011:
| Years ended | ||||||||||||
| 2013 | 2012 | 2011 | ||||||||||
| Sales and marketing | $ | 8,329,000 | $ | 8,764,000 | $ | 12,674,000 | ||||||
| Stock-based compensation | 697,000 | 724,000 | 886,000 | |||||||||
| Total sales and marketing | $ | 9,026,000 | $ | 9,488,000 | $ | 13,560,000 | ||||||
The decrease in sales and marketing expense during the year ended December 31, 2013 as compared to the same period in 2012 was mainly attributed to the decrease in salary and related benefits expense (excluding share-based compensation) of $662,000 due to a decrease in headcount, and a decrease in travel & entertainment of $168,000, which was also offset by an increase in professional services of $337,000.
The decrease in sales and marketing expense during the year ended December 31, 2012 as compared to the same period in 2011 was mainly attributed to the decrease in salary and related benefits expense (excluding share-based compensation) of $2,122,000 due to a decrease in headcount, and a decrease in professional services expenses of $610,000, as a result of targeted reductions in staff and external costs made prior to year end in 2011 as well as subsequent reductions made in early 2012.
The future. We expect sales and marketing expenditures to remain relatively stable in 2014.
General and administrative expenses
General and administrative expenses include costs for administrative personnel, legal and other professional expenses, and general corporate expenses. The following table summarizes the general and administrative expenses for the years ended December 31, 2013, 2012 and 2011:
| Years ended | ||||||||||||
| 2013 | 2012 | 2011 | ||||||||||
| General and administrative | $ | 13,808,000 | $ | 13,194,000 | $ | 12,849,000 | ||||||
| Stock-based compensation | 2,223,000 | 2,478,000 | 1,878,000 | |||||||||
| Total general and administrative expenses | $ | 16,031,000 | $ | 15,672,000 | $ | 14,727,000 | ||||||
For the year ended December 31, 2013 as compared to the same period in 2012, the general and administrative expenses, (excluding share-based compensation), increased due to non-cash accounts receivable charges of $1,141,000, an increase in professional services of $301,000 and were offset by reduced labor costs.
For the year ended December 31, 2012 as compared to the same period in 2011, the general and administrative expenses (excluding share-based compensation) remained relatively consistent.
The future. We expect general and administrative expenses to remain relatively stable in 2014.
Stock-based compensation expenses
Stock-based compensation expenses include charges related to options and restricted stock awards issued to employees, directors and non-employees along with charges related to the employee stock purchases under the Employee Stock Purchase Plan (ESPP). We measure stock-based compensation expense based on the grant-date fair value of any awards granted to our employees. Such expense is recognized over the period of time that employees provide service to us and earn all rights to the awards.
The following table summarizes the components of our stock-based compensation for the years ended December 31, 2013, 2012 and 2011:
| Years ended | ||||||||||||
| 2013 | 2012 | 2011 | ||||||||||
| Cost of product revenues | $ | 83,000 | $ | 77,000 | $ | 65,000 | ||||||
| Research and development related | 605,000 | 625,000 | 487,000 | |||||||||
| Sales and marketing related | 697,000 | 724,000 | 886,000 | |||||||||
| General and administrative related | 2,223,000 | 2,478,000 | 1,878,000 | |||||||||
| Total stock-based compensation | $ | 3,608,000 | $ | 3,904,000 | $ | 3,316,000 | ||||||
Most of the share-based compensation expenses for the years ended December 31, 2013, 2012 and 2011 related to the vesting of stock option and restricted stock awards to employees.
The decrease in share-based compensation for the year ended December 31, 2013 as compared to the same period in 2012 is primarily due to restricted stock awards granted to our executive team during 2012. See Note 16 to the Consolidated Financial Statements included elsewhere herein for disclosure and discussion of share based compensation.
The increase in share-based compensation for the year ended December 31, 2012 as compared to the same period in 2011 is primarily due to the grant of restricted stock awards and performance based stock awards. See Note 16 to the Consolidated Financial Statements included elsewhere herein for disclosure and discussion of share based compensation.
The future. We expect to continue to grant options and stock awards (which will result in an expense) to our employees, directors, and, as appropriate, to non-employee service providers. In addition, previously-granted options will continue to vest in accordance with their original terms. As of December 31, 2013, the total compensation cost related to non-vested stock options and stock awards not yet recognized for all our plans is approximately $4,810,000. Of this amount, $4,725,000 is expected to be recognized as a result of vesting under service conditions over a weighted average period of 1.81 years.
Change in fair value of warrant liability
The following is a table summarizing the change in fair value of warrant liability for the years ended December 31, 2013, 2012 and 2011:
| Years ended December 31, | ||||||||||||
| 2013 | 2012 | 2011 | ||||||||||
| Change in fair value of warrant liability | $ | (418,000 | ) | $ | (209,000 | ) | $ | (4,360,000 | ) | |||
Changes in fair value of our warrant liability are primarily due to fluctuations in the valuation inputs, such as stock price, volatility, remaining life and others. See Note 2 to the Consolidated Financial Statements included elsewhere herein for disclosure and discussion of our warrant liability.
The future: No future changes in the fair value of the warrant liability will be recognized as the warrants expired in August 2013.
Change in fair value of option liability
The following is a table summarizing the change in fair value of option liability for the years ended December 31, 2013, 2012 and 2011:
| Years ended | ||||||||||||
| 2013 | 2012 | 2011 | ||||||||||
| Change in fair value of option liability | $ | (2,250,000 | ) | $ | 340,000 | $ | 740,000 | |||||
Changes in fair value of our put option liability are due to changes in assumptions used in estimating the value of the Put, such as bankruptcy threshold for Cytori, fair value of the Olympus-Cytori, Inc. Joint Venture, volatility and others. See Note 4 to the Consolidated Financial Statements included elsewhere herein for disclosure and discussion of our put option liability.
The future: The Put was cancelled as a result of the Joint Venture termination as such we will not be recognizing any changes in fair value of put option liability in the future.
Financing items
The following table summarizes interest income, interest expense, and other income and expenses for the years ended December 31, 2013, 2012 and 2011:
| Years ended | ||||||||||||
| 2013 | 2012 | 2011 | ||||||||||
| Loss on asset disposal | $ | (257,000 | ) | $ | — | $ | — | |||||
| Loss on debt extinguishment | $ | (708,000 | ) | $ | — | $ | — | |||||
| Interest income | 4,000 | 4,000 | 9,000 | |||||||||
| Interest expense | (3,396,000 | ) | (3,386,000 | ) | (2,784,000 | ) | ||||||
| Other income (expense), net | (438,000 | ) | (314,000 | ) | (55,000 | ) | ||||||
| Gain on Puregraft divestiture | 4,453,000 | — | — | |||||||||
| Gain on previously held equity interest in joint venture | 4,892,000 | — | — | |||||||||
| Total | $ | 4,550,000 | $ | (3,696,000 | ) | $ | (2,830,000 | ) | ||||
| · | In connection with the June 28, 2013 Loan and Security Agreement (Loan Agreement), a loss on debt extinguishment was recorded that relates to the payoff of the prior loan obligation. See Note 11 to Consolidated Financial Statements for further information. |
| · | Interest expense increased for the year ended December 31, 2013 as compared to prior year ended December 31, 2012 due to cash interest and non-cash amortization of debt issuance costs and debt discount for our $27.0 million term loan. |
| · | Interest expense increased for the year ended December 31, 2012 and December 31, 2011 is due to cash interest and non-cash amortization of debt issuance costs and debt discount for our $25.0 million term loan. In September 2011, we entered into a second amendment to the Amended and Restated Loan and Security Agreement, pursuant to which the lenders funded an additional principal, increasing the total principal balance to $25.0 million. |
| · | The changes in other income (expense) in 2013, 2012 and 2011 resulted primarily from changes in foreign currency exchange rates. |
| · | Refer to Note 5 for discussion on gain on Puregraft divestiture. |
| · | Refer to Note 4 for discussion on gain on previously held equity interest in joint venture. |
The future: Interest income earned in 2014 will be dependent on our levels of funds available for investment as well as general economic conditions. Subject to our future financing activities, we expect interest expense in 2014 to increase slightly as we continue to pay interest on the $27.0 million term loan that was amended in June 2013.
Equity loss from investment in Joint Venture
The following table summarizes equity loss from investment in joint venture for the years ended December 31, 2013, 2012 and 2011.
| Years ended | ||||||||||||
| 2013 | 2012 | 2011 | ||||||||||
| Equity loss from investment in joint venture | $ | (48,000 | ) | $ | (165,000 | ) | $ | (209,000 | ) | |||
The losses relate entirely to our 50% equity interest in the Joint Venture, which we account for using the equity method of accounting.
The future: Pursuant to the May 2013 acquisition of the remaining interest in the Olympus-Cytori Joint Venture we will not recognize any additional losses from the activities of the Joint Venture.
Liquidity and Capital Resources
Short-term and long-term liquidity
The following is a summary of our key liquidity measures at December 31, 2013 and 2012:
| As of December 31, | ||||||||
| 2013 | 2012 | |||||||
| Cash and cash equivalents | $ | 15,506,000 | $ | 25,717,000 | ||||
| Current assets | $ | 24,577,000 | $ | 33,979,000 | ||||
| Current liabilities | 14,906,000 | 17,613,000 | ||||||
| Working capital | $ | 9,671,000 | $ | 16,366,000 | ||||
We incurred net losses of $26,177,000, $32,279,000 and $32,451,000 for the years ended December 31, 2013, 2012 and 2011, respectively. We have an accumulated deficit of $300,905,000 as of December 31, 2013. Additionally, we have used net cash of $34,563,000, $32,193,000 and $35,323,000 to fund our operating activities for years ended December 31, 2013, 2012 and 2011, respectively. To date, these operating losses have been funded primarily from outside sources of invested capital and gross profits. During 2013 and 2012, we expanded our commercialization activities while simultaneously pursuing available financing sources to support operations and growth.
We have had, and we will likely continue to have, an ongoing need to raise additional cash from outside sources to fund our future operations.
We believe our plans to raise additional cash from outside sources and, if necessary, our cost containment efforts are sufficient to allow us to continue operations for the next twelve months. This includes minimum liquidity requirements of the Loan and Security Agreement that require us to make principal and interest payments of $868,000 per month beginning in August 2014 and maintain at least three months of cash on hand to avoid an event of default under the loan agreement. Our plans include pursuing additional cash through strategic corporate partnerships and possibly engaging in future sales of equity, as well as our gross profits. While we have an established history of raising capital through these platforms, and we are currently involved in negotiations with multiple parties, there is no guarantee that adequate funds will be available when needed from additional debt or equity financing, development and commercialization partnerships, increased results of operations, or from other sources, or on terms acceptable to us. If our efforts to obtain sufficient additional funds are not successful, we would be required to delay, scale back, or eliminate some or all of our research or product development, manufacturing operations, administrative operations, including our employee base, and clinical or regulatory activities, which could negatively affect our ability to achieve certain corporate goals.
The Company continues to seek additional capital through product revenues, strategic transactions, including extension opportunities under the awarded BARDA contract, and from other financing alternatives.
From January 1, 2010 to December 31, 2013, we have financed our operations primarily by:
| · | In June 2010, we entered into an Amended and Restated Loan and Security Agreement with the GECC, SVB, and Oxford Finance Corporation (Lenders), pursuant to which the Lenders funded a term loan in the amount of $20,000,000 on June 14, 2010, which refinanced the remaining balance of the term loan entered into with GECC and SVB on October 14, 2008. |
| · | In October 2010, we entered into an underwriting agreement with Jefferies, relating to the issuance and sale of 4,600,000 shares of our common stock. This price to the public in this offering was $4.50 per share and Jefferies agreed to purchase the shares from us at a price of $4.23 per share. The transaction was completed on October 13, 2010 raising approximately $20,700,000 in gross proceeds before deducting underwriting discounts and commissions and other offering expenses payable by us. |
| · | In December 2010, we raised $10,000,000 in gross proceeds from a sale of 1,428,571 shares of unregistered common stock to Astellas Pharma Inc. for $7.00 per share in a private stock placement. |
| · | In July 2011, we entered into a common stock purchase agreement with Seaside 88, LP relating to the offering and sale of a total of up to 6,326,262 shares of our common stock. The agreement required us to issue and Seaside to buy 1,326,262 shares of our common stock at an initial closing and 250,000 shares of our common stock once every two weeks, commencing 30 days after the initial closing, for up to an additional 20 closings, subject to the satisfaction of customary closing conditions. At the initial closing, the offering price was $4.52, which equaled to 88% of our common stock’s volume-weighted average trading prices, or VWAP, during the ten-day trading period immediately prior to the initial closing date, raising approximately $6,000,000 in gross proceeds. At subsequent closings, the offering price was 90.25% of our common stock’s volume-weighted average trading prices during the ten-day trading period immediately prior to each subsequent closing date. We raised approximately $18,233,000 in gross proceeds from the sale of 5,826,262 shares in our scheduled closings through April 9, 2012. Effective, April 30, 2012, we terminated the agreement with Seaside 88, LP and we will not sell the remaining and final 500,000 shares that would otherwise have been sold under this agreement. |
| · | In September 2011, we entered into an Second Amendment to the Amended and Restated Loan and Security Agreement with the GECC, SVB, and Oxford Finance Corporation (Lenders), pursuant to which the Lenders increased the prior term loan made to the Company to a principal amount of $25.0 million. |
| · | In December 2012, we entered into an underwriting agreement with Lazard Capital Markets, LLC (underwriter), relating to the issuance and sale of 7,020,000 shares of our common stock. This price to the public in this offering was $2.85 per share and the underwriter purchased the shares from us at a price of $2.69 per share. The transaction was completed on December 19, 2012 raising approximately $20,007,000 in gross proceeds before deducting underwriting discounts and commissions and other offering expenses payable by us. |
| · | In January 2013, Lazard Capital Markets, LLC (underwriter) exercised the option and as a result we sold an additional 1,053,000 shares raising approximately $3,000,000 in gross proceeds before deducting underwriting discounts and commissions and other offering expenses payable by us. |
| · | On June 28, 2013 we entered into a Loan and Security Agreement (Loan Agreement) with Oxford Finance LLC and Silicon Valley Bank (together, the “Lenders”), pursuant to which the Lenders funded an aggregate principal amount of $27.0 million (Term Loans), subject to the terms and conditions set forth in the loan agreement. The Term Loan accrues interest at a fixed rate of 9.75% per annum. In connection with the Term Loans, on June 28, 2013, we issued to the Lenders warrants to purchase up to an aggregate of 596,553 shares of our common stock at an exercise price of $2.26 per share. These warrants are immediately exercisable and will expire on June 28, 2020. In connection with the Loan Agreement, we prepaid all outstanding amounts under the prior loan agreement, at which time the Company’s obligations under the prior loan agreement immediately terminated. The net proceeds of the Term Loans, after payment of lender fees and expenses and prepaying all the outstanding amounts relating to the prior loan agreement, were approximately $7.8 million. |
| · | On July 30, 2013, we entered into a Sale and Exclusive License/Supply Agreement with Bimini Technologies LLC (“Bimini”), pursuant to which we sold to Bimini substantially all of the assets (other than certain retained rights and licenses) of our Puregraft® product line, a series of standalone fat transplantation products that were developed to improve the predictability of outcomes for autologous fat grafting and aesthetic body contouring. The aggregate value of the consideration paid by Bimini at the execution of the agreement was $5.0 million. |
| · | On October 29, 2013, we entered into a partnership with Lorem Vascular, to commercialize Cytori Cell Therapy for the cardiovascular, renal and diabetes markets, in China, Hong Kong, Malaysia, Singapore and Australia (License/Supply Agreement), and a Common Stock Purchase Agreement. On January 30, 2014 we entered into the Amended and Restated License/Supply Agreement with Lorem Vascular (the “Restated Agreement”) expanding the licensed field to all uses excepting alopecia (hair loss). Under the Restated Agreement, Lorem Vascular committed to pay up to $500 million in license fees in the form of revenue milestones. In addition, Lorem is required to pay us 30% of their gross profits in China, Hong Kong and Malaysia for the term of the agreement. Cytori Cell Therapy is derived from the Company’s Celution® System, which enables access to a patient’s own adipose-derived regenerative cells (ADRCs) at the point-of-care. . In addition, Lorem Vascular agrees to purchase the Cytori Celution® System and consumables under the Restated Agreement. Pursuant to the related Common Stock Purchase Agreement, Cytori has received $24 million in exchange for 8 million shares of Cytori common stock at $3.00 per share. The Equity purchased was closed in two installments, the first in November 2013, and the second in January 2014. |
The following summarizes our contractual obligations and other commitments at December 31, 2013, and the effect such obligations could have on our liquidity and cash flow in future periods:
| Payments due by period | ||||||||||||||||||||
| Contractual Obligations | Total | Less than 1 year | 1 – 3 years | 3 – 5 years | More than 5 years | |||||||||||||||
| Long-term obligations | $ | 28,670,000 | $ | 3,318,000 | $ | 17,848,000 | $ | 7,504,000 | $ | — | ||||||||||
| Interest commitment on long-term obligations | 5,791,000 | 2,583,000 | 3,015,000 | 193,000 | — | |||||||||||||||
| Operating lease obligations | 7,417,000 | 2,071,000 | 3,737,000 | 1,609,000 | — | |||||||||||||||
| Minimum purchase requirements | 850,000 | 850,000 | — | — | — | |||||||||||||||
| Pre-clinical research study obligations | 23,000 | 23,000 | — | — | — | |||||||||||||||
| Clinical research study obligations | 4,705,000 | 3,530,000 | 1,175,000 | — | — | |||||||||||||||
| Total | $ | 47,456,000 | $ | 12,375,000 | $ | 25,775,000 | $ | 9,306,000 | $ | — | ||||||||||
Net cash used in or provided by operating, investing and financing activities for the years ended December 31, 2013, 2012 and 2011 is summarized as follows:
| Years Ended | ||||||||||||
| 2013 | 2012 | 2011 | ||||||||||
| Net cash used in operating activities | $ | (34,563,000 | ) | $ | (32,193,000 | ) | $ | (35,323,000 | ) | |||
| Net cash provided by (used in) investing activities | 3,686,000 | (1,204,000 | ) | (560,000 | ) | |||||||
| Net cash provided by financing activities | 20,772,000 | 22,192,000 | 20,137,000 | |||||||||
Operating activities
Operational activities, inclusive of research and development, sales and marketing, and general and administrative efforts, offset in part by product sales, generated a $26,177,000 net loss for the year ended December 31, 2013. The operating cash impact of this loss was $34,563,000, after adjusting for the recognition of non-cash development revenues of $1,817,000, the consideration of non-cash share-based compensation, other adjustments for material non-cash activities, such as depreciation, amortization, change in fair value of option liabilities and warrants, gain on sale of assets and acquisition of joint venture, and changes in working capital due to timing of product shipments (accounts receivable) and payment of liabilities. Overall, our operational cash use increased as compared to same period in 2012, due primarily to increased spending in research activities.
Operational activities, inclusive of research and development, sales and marketing, and general and administrative efforts, offset in part by product sales, generated a $32,279,000 net loss for the year ended December 31, 2012. The operating cash impact of this loss was $32,193,000, after adjusting for the recognition of non-cash development revenues of $5,411,000, the consideration of non-cash share-based compensation, other adjustments for material non-cash activities, such as depreciation, amortization, change in fair value of option liabilities and warrants, and changes in working capital due to timing of product shipments (accounts receivable) and payment of liabilities.
Operational activities, inclusive of research and development, sales and marketing, and general and administrative efforts, offset in part by product sales, generated a $32,451,000 net loss for the year ended December 31, 2011. The operating cash impact of this loss was $35,323,000, after adjusting for the recognition of non-cash development revenue of $1,992,000, the consideration of non-cash share-based compensation, other adjustments for material non-cash activities, such as depreciation, amortization, change in fair value of option liabilities and warrants, and changes in working capital due to timing of product shipments (accounts receivable) and payment of liabilities.
Investing activities
Net cash provided in investing activities for the year ended December 31, 2013 resulted from cash outflows for payment of a license termination fee of $800,000 and for purchases of property and equipment and cash inflows of $5,000,000 from the sale of Puregraft product line.
Net cash used by investing activities for the year ended December 31, 2012 and 2011 resulted primarily from purchases of property and equipment, primarily for use in clinical trials and research.
Financing Activities
The net cash provided by financing activities for the year ended December 31, 2013 related primarily to a sale to Lorem Vascular of 4,000,000 shares for $12,000,000 in gross proceeds, as well as an additional $3,000,000 in gross proceeds (received in 2013) which related to the second closing of an additional 4,000,000 shares in January 2014. The balance of $9,000,000 in gross proceeds for the second closing was received in 2014. In addition, there was a sale of 1,053,000 shares for approximately $3,000,000 in gross proceeds in connection with the underwriter exercising the option to purchase additional shares relating to our December 2012 public offering offset by principal payments of $22,304,000 primarily relating to our $25.0 million loan. Additionally, in June 2013, we entered into a Loan and Security Agreement with Lenders pursuant to which the Lenders funded aggregate principal amount of $27,000,000 offset by $1,744,000 debt issuance costs and loan fees. Also, during the year ended December 31, 2013, we paid $221,000 payment towards our Joint Venture purchase obligation.
The net cash provided by financing activities for the year ended December 31, 2012 related primarily to a sale of 1,750,000 shares for approximately $4,881,000 in net proceeds in connection with our common stock purchase agreement with Seaside entered into on July 11, 2011, the sale of 7,020,000 shares of common stock and for approximately $18,590,000 in net proceeds in the December 2012 public offering and proceeds from exercise of warrants and employee stock options and employee stock purchase plan of $1,413,000.
The net cash provided by financing activities for the year ended December 31, 2011 related primarily to a sale of 4,076,262 shares for approximately $13,286,000 in gross proceeds in connection with common stock purchase agreement with Seaside entered into on July 11, 2011 and proceeds from exercise of warrants and employee stock options of $2,849,000. Additionally, in September 2011, we entered into a Second Amendment to the Amended and Restated Loan and Security Agreement with Lenders pursuant to which the Lenders increased the prior term loan made to the Company to a principal amount of $25,000,000 with proceeds of $9,444,000 in additional principal, before debt issuance costs and loan fees.
Critical Accounting Policies and Significant Estimates
The preparation of financial statements in conformity with accounting principles generally accepted in the United States requires us to make estimates and assumptions that affect the reported amounts of our assets, liabilities, revenues and expenses, and that affect our recognition and disclosure of contingent assets and liabilities.
While our estimates are based on assumptions we consider reasonable at the time they were made, our actual results may differ from our estimates, perhaps significantly. If results differ materially from our estimates, we will make adjustments to our financial statements prospectively as we become aware of the necessity for an adjustment.
We believe it is important for you to understand our most critical accounting policies. These are our policies that require us to make our most significant judgments and, as a result, could have the greatest impact on our future financial results.
Warrant and Put Option Liability
See Notes to Consolidated Financial Statements included elsewhere herein for disclosure and discussion of our warrant liability and our put option liability.
Revenue Recognition
See Notes to Consolidated Financial Statements included elsewhere herein for disclosure and discussion of revenue recognition.
Stock-based compensation
See Notes to Consolidated Financial Statements included elsewhere herein for disclosure and discussion of stock-based compensation.
Recent Accounting Pronouncements
See Notes to Consolidated Financial Statements included elsewhere herein for disclosure and discussion of new accounting standards.
We are exposed to market risk related to fluctuations in interest rates and in foreign currency exchange rates.
Interest Rate Exposure
We are not subject to market risk due to fluctuations in interest rates on our long-term obligations as they bear a fixed rate of interest. Our exposure relates primarily to short-term investments, including funds classified as cash equivalents. As of December 31, 2013, all excess funds were invested in money market funds and other highly liquid investments, therefore our interest rate exposure is not considered to be material.
Foreign Currency Exchange Rate Exposure
Our exposure to market risk due to fluctuations in foreign currency exchange rates relates primarily to our activities in Europe and Japan. Transaction gains or losses resulting from cash balances and revenues have not been significant in the past and we are not currently engaged in any hedging activity in the Euro, the Yen or other currencies. Based on our cash balances and revenues derived from markets other than the United States for the year ended December 31, 2013, a hypothetical 10% adverse change in the Euro or Yen against the U.S. dollar would not result in a material foreign currency exchange loss. Consequently, we do not expect that reductions in the value of such sales denominated in foreign currencies resulting from even a sudden or significant fluctuation in foreign exchange rates would have a direct material impact on our financial position, results of operations or cash flows.
Notwithstanding the foregoing, the indirect effect of fluctuations in interest rates and foreign currency exchange rates could have a material adverse effect on our business, financial condition and results of operations. For example, foreign currency exchange rate fluctuations may affect international demand for our products. In addition, interest rate fluctuations may affect our customers’ buying patterns. Furthermore, interest rate and currency exchange rate fluctuations may broadly influence the United States and foreign economies resulting in a material adverse effect on our business, financial condition and results of operations.
| Page | |
| Reports of Independent Registered Public Accounting Firm | 40 |
| Consolidated Balance Sheets as of December 31, 2013 and 2012 | 42 |
| Consolidated Statements of Operations and Comprehensive Loss for the years ended December 31, 2013, 2012 and 2011 | 43 |
| Consolidated Statements of Stockholders’ Equity (Deficit) for the years ended December 31, 2013, 2012 and 2011 | 44 |
| Consolidated Statements of Cash Flows for the years ended December 31, 2013, 2012 and 2011 | 45 |
| Notes to Consolidated Financial Statements | 47 |
PART I. FINANCIAL INFORMATION
Item 1. Financial Statements
Report of Independent Registered Public Accounting Firm
The Board of Directors and Stockholders
Cytori Therapeutics, Inc.:
We have audited the accompanying consolidated balance sheets of Cytori Therapeutics, Inc. and subsidiaries (the Company) as of December 31, 2013 and 2012, and the related consolidated statements of operations and comprehensive loss, stockholders’ equity, and cash flows for each of the years in the three‑year period ended December 31, 2013. In connection with our audits of the consolidated financial statements, we have also audited the accompanying schedule of valuation and qualifying accounts. These consolidated financial statements are the responsibility of the Company’s management. Our responsibility is to express an opinion on these consolidated financial statements based on our audits.
We conducted our audits in accordance with the standards of the Public Company Accounting Oversight Board (United States). Those standards require that we plan and perform the audit to obtain reasonable assurance about whether the financial statements are free of material misstatement. An audit includes examining, on a test basis, evidence supporting the amounts and disclosures in the financial statements. An audit also includes assessing the accounting principles used and significant estimates made by management, as well as evaluating the overall financial statement presentation. We believe that our audits provide a reasonable basis for our opinion.
In our opinion, the consolidated financial statements referred to above present fairly, in all material respects, the financial position of Cytori Therapeutics, Inc. and subsidiaries as of December 31, 2013 and 2012, and the results of their operations and their cash flows for each of the years in the three‑year period ended December 31, 2013, in conformity with U.S. generally accepted accounting principles. Also, in our opinion, the related financial statement schedule, when considered in relation to the basic consolidated financial statements taken as a whole, presents fairly, in all material respects, the information set forth therein.
We also have audited, in accordance with the standards of the Public Company Accounting Oversight Board (United States), Cytori Therapeutics, Inc.’s internal control over financial reporting as of December 31, 2013, based on criteria established in Internal Control – Integrated Framework (1992) issued by the Committee of Sponsoring Organizations of the Treadway Commission (COSO), and our report dated March 14, 2014 expressed an adverse opinion on the effectiveness of the Company’s internal control over financial reporting.
| /s/ KPMG LLP | |
| San Diego, California | |
| March 14, 2014 |
Report of Independent Registered Public Accounting Firm
The Board of Directors and Stockholders
Cytori Therapeutics, Inc:
We have audited Cytori Therapeutics, Inc. and subsidiaries (the Company) internal control over financial reporting as of December 31, 2013, based on criteria established in Internal Control ‑ Integrated Framework (1992) issued by the Committee of Sponsoring Organizations of the Treadway Commission (COSO) . The Company’s management is responsible for maintaining effective internal control over financial reporting and for its assessment of the effectiveness of internal control over financial reporting, included in the accompanying Management’s Report on Internal Control over Financial Reporting (Item 9A(b)). Our responsibility is to express an opinion on the Company's internal control over financial reporting based on our audit.
We conducted our audit in accordance with the standards of the Public Company Accounting Oversight Board (United States). Those standards require that we plan and perform the audit to obtain reasonable assurance about whether effective internal control over financial reporting was maintained in all material respects. Our audit included obtaining an understanding of internal control over financial reporting, assessing the risk that a material weakness exists, and testing and evaluating the design and operating effectiveness of internal control based on the assessed risk. Our audit also included performing such other procedures as we considered necessary in the circumstances. We believe that our audit provides a reasonable basis for our opinion.
A company's internal control over financial reporting is a process designed to provide reasonable assurance regarding the reliability of financial reporting and the preparation of financial statements for external purposes in accordance with generally accepted accounting principles. A company’s internal control over financial reporting includes those policies and procedures that (1) pertain to the maintenance of records that, in reasonable detail, accurately and fairly reflect the transactions and dispositions of the assets of the company; (2) provide reasonable assurance that transactions are recorded as necessary to permit preparation of financial statements in accordance with generally accepted accounting principles, and that receipts and expenditures of the company are being made only in accordance with authorizations of management and directors of the company; and (3) provide reasonable assurance regarding prevention or timely detection of unauthorized acquisition, use, or disposition of the company’s assets that could have a material effect on the financial statements.
Because of its inherent limitations, internal control over financial reporting may not prevent or detect misstatements. Also, projections of any evaluation of effectiveness to future periods are subject to the risk that controls may become inadequate because of changes in conditions, or that the degree of compliance with the policies or procedures may deteriorate.
A material weakness is a deficiency, or a combination of deficiencies, in internal control over financial reporting, such that there is a reasonable possibility that a material misstatement of the company’s annual or interim financial statements will not be prevented or detected on a timely basis. A material weakness related to the recognition and measurement of revenue has been identified and included in Management’s assessment. We also have audited, in accordance with the standards of the Public Company Accounting Oversight Board (United States), the consolidated financial statements of the Company as December 31, 2013 and December 31, 2012. This material weakness was considered in determining the nature, timing, and extent of audit tests applied in our audit of the consolidated financial statements as of and for the year ended December 31, 2013, and this report does not affect our report dated March 14, 2014, which expressed an unqualified opinion on those consolidated financial statements.
In our opinion, because of the effect of the aforementioned material weakness on the achievement of the objectives of the control criteria, the Company has not maintained effective internal control over financial reporting as of December 31, 2013, based on established in Internal Control—Integrated Framework (1992) issued by COSO.
/s/ KPMG LLP
San Diego, California
March 14, 2014
CYTORI THERAPEUTICS, INC.
| As of December 31, | ||||||||
| 2013 | 2012 | |||||||
| Assets | ||||||||
| Current assets: | ||||||||
| Cash and cash equivalents | $ | 15,506,000 | $ | 25,717,000 | ||||
| Accounts receivable, net of reserves of $1,445,000 and of $278,000 in 2013 and 2012, respectively | 4,152,000 | 3,926,000 | ||||||
| Inventories, net | 3,694,000 | 3,175,000 | ||||||
| Other current assets | 1,225,000 | 1,161,000 | ||||||
| Total current assets | 24,577,000 | 33,979,000 | ||||||
| Property and equipment, net | 1,054,000 | 2,174,000 | ||||||
| Restricted cash and cash equivalents | 350,000 | 350,000 | ||||||
| Investment in joint venture | — | 85,000 | ||||||
| Other assets | 2,812,000 | 2,740,000 | ||||||
| Intangibles, net | 9,345,000 | — | ||||||
| Goodwill | 3,922,000 | 3,922,000 | ||||||
| Total assets | $ | 42,060,000 | $ | 43,250,000 | ||||
| Liabilities and Stockholders’ Equity | ||||||||
| Current liabilities: | ||||||||
| Accounts payable and accrued expenses | $ | 6,077,000 | $ | 7,411,000 | ||||
| Current portion of long-term obligations, net of discount | 3,191,000 | 9,784,000 | ||||||
| Termination fee obligation | 400,000 | — | ||||||
| Puregraft divestiture obligation | 547,000 | — | ||||||
| Joint Venture purchase obligation | 4,691,000 | — | ||||||
| Warrant liability, current | — | 418,000 | ||||||
| Total current liabilities | 14,906,000 | 17,613,000 | ||||||
| Deferred revenues, related party | — | 638,000 | ||||||
| Deferred revenues | 212,000 | 2,635,000 | ||||||
| Option liability | — | 2,250,000 | ||||||
| Long-term deferred rent | 710,000 | 756,000 | ||||||
| Long-term obligations, net of discount, less current portion | 23,100,000 | 12,903,000 | ||||||
| Total liabilities | 38,928,000 | 36,795,000 | ||||||
| Commitments and contingencies | ||||||||
| Stockholders’ equity: | ||||||||
| Preferred stock, $0.001 par value; 5,000,000 shares authorized; -0- shares issued and outstanding in 2013 and 2012 | — | — | ||||||
| Common stock, $0.001 par value; 145,000,000 shares authorized; 71,305,375 and 65,914,050 shares issued and outstanding in 2013 and 2012, respectively | 71,000 | 66,000 | ||||||
| Additional paid-in capital | 303,710,000 | 281,117,000 | ||||||
| Accumulated other comprehensive income | 256,000 | — | ||||||
| Accumulated deficit | (300,905,000 | ) | (274,728,000 | ) | ||||
| Total stockholders’ equity | 3,132,000 | 6,455,000 | ||||||
| Total liabilities and stockholders’ equity | $ | 42,060,000 | $ | 43,250,000 | ||||
THE ACCOMPANYING NOTES ARE AN INTEGRAL PART OF THESE CONSOLIDATED FINANCIAL STATEMENTS
CYTORI THERAPEUTICS, INC.
| For the Years Ended December 31, | ||||||||||||
| 2013 | 2012 | 2011 | ||||||||||
| Product revenues: | ||||||||||||
| Related party | $ | 1,845,000 | $ | — | $ | — | ||||||
| Third party | 5,277,000 | 8,709,000 | 7,983,000 | |||||||||
| 7,122,000 | 8,709,000 | 7,983,000 | ||||||||||
| �� | ||||||||||||
| Cost of product revenues | 3,421,000 | 4,000,000 | 3,837,000 | |||||||||
| Gross profit | 3,701,000 | 4,709,000 | 4,146,000 | |||||||||
| Development revenues: | ||||||||||||
| Development, related party | 638,000 | 2,882,000 | 1,992,000 | |||||||||
| Development | 1,179,000 | 2,529,000 | — | |||||||||
| Government contracts and other | 3,257,000 | 381,000 | 21,000 | |||||||||
| 5,074,000 | 5,792,000 | 2,013,000 | ||||||||||
| Operating expenses: | ||||||||||||
| Research and development | 17,065,000 | 13,628,000 | 10,904,000 | |||||||||
| Sales and marketing | 9,026,000 | 9,488,000 | 13,560,000 | |||||||||
| General and administrative | 16,031,000 | 15,672,000 | 14,727,000 | |||||||||
| Change in fair value of warrants | (418,000 | ) | (209,000 | ) | (4,360,000 | ) | ||||||
| Change in fair value of option liability | (2,250,000 | ) | 340,000 | 740,000 | ||||||||
| Total operating expenses | 39,454,000 | 38,919,000 | 35,571,000 | |||||||||
| Operating loss | (30,679,000 | ) | (28,418,000 | ) | (29,412,000 | ) | ||||||
| Other income (expense): | ||||||||||||
| Loss on asset disposal | (257,000 | ) | — | — | ||||||||
| Loss on debt extinguishment | (708,000 | ) | — | — | ||||||||
| Interest income | 4,000 | 4,000 | 9,000 | |||||||||
| Interest expense | (3,396,000 | ) | (3,386,000 | ) | (2,784,000 | ) | ||||||
| Other income (expense), net | (438,000 | ) | (314,000 | ) | (55,000 | ) | ||||||
| Gain on Puregraft divestiture | 4,453,000 | — | — | |||||||||
| Gain on previously held equity interest in joint venture | 4,892,000 | — | — | |||||||||
| Equity loss from investment in joint venture | (48,000 | ) | (165,000 | ) | (209,000 | ) | ||||||
| Total other income (expense) | 4,502,000 | (3,861,000 | ) | (3,039,000 | ) | |||||||
| Net loss | (26,177,000 | ) | (32,279,000 | ) | (32,451,000 | ) | ||||||
| Other comprehensive income – foreign currency translation adjustments | 256,000 | — | — | |||||||||
| Comprehensive loss | (25,921,000 | ) | (32,279,000 | ) | (32,451,000 | ) | ||||||
| Basic and diluted net loss per common share | $ | (0.39 | ) | $ | (0.55 | ) | $ | (0.61 | ) | |||
| Basic and diluted weighted average common shares | 67,781,364 | 58,679,687 | 53,504,030 | |||||||||
THE ACCOMPANYING NOTES ARE AN INTEGRAL PART OF THESE CONSOLIDATED FINANCIAL STATEMENTS
CYTORI THERAPEUTICS, INC.
FOR THE YEARS ENDED DECEMBER 31, 2013, 2012 AND 2011
Additional Paid-in | Accumulated Deficit | Accumulated Other Comprehensive Income (Loss) | Total | |||||||||||||||||||||
| Common Stock | ||||||||||||||||||||||||
| Shares | Amount | |||||||||||||||||||||||
Balance at December 31, 2010 | 51,955,265 | $ | 52,000 | $ | 232,819,000 | $ | (209,998,000 | ) | $ | — | $ | 22,873,000 | ||||||||||||
Stock-based compensation expense | — | — | 3,316,000 | — | — | 3,316,000 | ||||||||||||||||||
| Issuance of common stock under stock option plan | 222,283 | — | 767,000 | — | — | 767,000 | ||||||||||||||||||
| Issuance of common stock under stock warrant agreement | 340,873 | 1,000 | 2,081,000 | — | — | 2,082,000 | ||||||||||||||||||
| Sale of common stock, net | 4,076,262 | 4,000 | 13,088,000 | — | — | 13,092,000 | ||||||||||||||||||
| Allocation of fair value for debt-related warrants | — | — | 267,000 | — | — | 267,000 | ||||||||||||||||||
Net loss for the year ended December 31, 2011 | — | — | — | (32,451,000 | ) | — | (32,451,000 | ) | ||||||||||||||||
Balance at December 31, 2011 | 56,594,683 | $ | 57,000 | $ | 252,338,000 | $ | (242,449,000 | ) | $ | — | $ | 9,946,000 | ||||||||||||
Stock-based compensation expense | — | — | 3,904,000 | — | — | 3,904,000 | ||||||||||||||||||
| Issuance of common stock under stock option plan and employee stock purchase plan | 450,512 | — | 1,157,000 | — | — | 1,157,000 | ||||||||||||||||||
| Issuance of common stock under stock warrant agreement | 98,855 | — | 256,000 | — | — | 256,000 | ||||||||||||||||||
| Sale of common stock, net | 8,770,000 | 9,000 | 23,462,000 | — | — | 23,471,000 | ||||||||||||||||||
| Net loss for the year ended December 31, 2012 | — | — | — | (32,279,000 | ) | — | (32,279,000 | ) | ||||||||||||||||
Balance at December 31, 2012 | 65,914,050 | $ | 66,000 | $ | 281,117,000 | $ | (274,728,000 | ) | $ | — | $ | 6,455,000 | ||||||||||||
Stock-based compensation expense | — | — | 3,608,000 | — | — | 3,608,000 | ||||||||||||||||||
| Issuance of common stock under stock option plan and employee stock purchase plan | 338,325 | — | 225,000 | — | — | 225,000 | ||||||||||||||||||
Sale of common stock, net | 5,053,000 | 5,000 | 17,811,000 | — | — | 17,816,000 | ||||||||||||||||||
| Allocation of fair value for debt-related warrants | — | — | 949,000 | — | — | 949,000 | ||||||||||||||||||
| Accumulated other comprehensive income (loss) | — | — | — | — | 256,000 | 256,000 | ||||||||||||||||||
Net loss for the year ended December 31, 2013 | — | — | — | (26,177,000 | ) | — | (26,177,000 | ) | ||||||||||||||||
Balance at December 31, 2013 | 71,305,375 | $ | 71,000 | $ | 303,710,000 | $ | (300,905,000 | ) | $ | 256,000 | $ | 3,132,000 | ||||||||||||
ACCOMPANYING NOTES ARE AN INTEGRAL PART OF THESE CONSOLIDATED FINANCIAL STATEMENTS
CYTORI THERAPEUTICS, INC.
| For the Years Ended December 31, | ||||||||||||
| 2013 | 2012 | 2011 | ||||||||||
| Cash flows from operating activities: | ||||||||||||
| Net loss | $ | (26,177,000 | ) | $ | (32,279,000 | ) | $ | (32,451,000 | ) | |||
| Adjustments to reconcile net loss to net cash used in operating activities: | ||||||||||||
| Depreciation and amortization | 1,630,000 | 933,000 | 855,000 | |||||||||
| Amortization of deferred financing costs and debt discount | 893,000 | 930,000 | 711,000 | |||||||||
| Joint Venture acquisition obligation accretion | 204,000 | — | — | |||||||||
| Provision for doubtful accounts | 1,141,000 | 144,000 | 483,000 | |||||||||
| Change in fair value of warrants | (418,000 | ) | (209,000 | ) | (4,360,000 | ) | ||||||
| Change in fair value of option liability | (2,250,000 | ) | 340,000 | 740,000 | ||||||||
| Stock-based compensation | 3,608,000 | 3,904,000 | 3,316,000 | |||||||||
| Equity loss from investment in joint venture | 48,000 | 165,000 | 209,000 | |||||||||
| Loss on asset disposal | 257,000 | — | — | |||||||||
| Gain on previously held equity interest in Joint Venture | (4,892,000 | ) | — | — | ||||||||
| Gain on sale of assets | (4,453,000 | ) | — | — | ||||||||
| Loss on debt extinguishment | 708,000 | — | — | |||||||||
| Increases (decreases) in cash caused by changes in operating assets and liabilities: | ||||||||||||
| Accounts receivable | (1,209,000 | ) | (1,810,000 | ) | (670,000 | ) | ||||||
| Inventories | (459,000 | ) | 143,000 | 60,000 | ||||||||
| Other current assets | (24,000 | ) | (324,000 | ) | (3,000 | ) | ||||||
| Other assets | (854,000 | ) | (74,000 | ) | (1,206,000 | ) | ||||||
| Accounts payable and accrued expenses | (409,000 | ) | 1,183,000 | (1,436,000 | ) | |||||||
| Deferred revenues, related party | (638,000 | ) | (2,882,000 | ) | (1,992,000 | ) | ||||||
| Deferred revenues | (1,223,000 | ) | (2,609,000 | ) | 315,000 | |||||||
| Long-term deferred rent | (46,000 | ) | 252,000 | 106,000 | ||||||||
| Net cash used in operating activities | (34,563,000 | ) | (32,193,000 | ) | (35,323,000 | ) | ||||||
| Cash flows from investing activities: | ||||||||||||
| Purchases of property and equipment | (519,000 | ) | (1,204,000 | ) | (560,000 | ) | ||||||
| Proceeds from Puregraft divestiture | 5,000,000 | — | — | |||||||||
| License agreement termination fee | (800,000 | ) | — | — | ||||||||
| Cash acquired in purchase of Joint Venture | 5,000 | — | — | |||||||||
| Net cash provided by (used in) investing activities | 3,686,000 | (1,204,000 | ) | (560,000 | ) | |||||||
| Cash flows from financing activities: | ||||||||||||
| Principal payments on long-term obligations | (22,304,000 | ) | (2,692,000 | ) | (4,529,000 | ) | ||||||
| Proceeds from long-term obligations | 27,000,000 | — | 9,444,000 | |||||||||
| Debt issuance costs and loan fees | (1,744,000 | ) | — | (719,000 | ) | |||||||
| Payments toward purchase of Joint Venture | (221,000 | ) | — | — | ||||||||
| Proceeds from exercise of employee stock options and warrants and stock purchase plan | 225,000 | 1,413,000 | 2,849,000 | |||||||||
| Proceeds from sale of common stock | 18,000,000 | 24,953,000 | 13,286,000 | |||||||||
| Costs from sale of common stock | (184,000 | ) | (1,482,000 | ) | (194,000 | ) | ||||||
| Net cash provided by financing activities | 20,772,000 | 22,192,000 | 20,137,000 | |||||||||
| Effect of exchange rate changes on cash and cash equivalents | (106,000 | ) | — | — | ||||||||
| Net decrease in cash and cash equivalents | (10,211,000 | ) | (11,205,000 | ) | (15,746,000 | ) | ||||||
| Cash and cash equivalents at beginning of year | 25,717,000 | 36,922,000 | 52,668,000 | |||||||||
| Cash and cash equivalents at end of year | $ | 15,506,000 | $ | 25,717,000 | $ | 36,922,000 | ||||||
| For the Years Ended December 31, | ||||||||||||
| 2013 | 2012 | 2011 | ||||||||||
| Supplemental disclosure of cash flows information: | ||||||||||||
| Cash paid during period for: | ||||||||||||
| Interest | $ | 2,252,000 | $ | 2,497,000 | $ | 2,031,000 | ||||||
| Final payment fee on long-term debt | 1,078,000 | — | 419,000 | |||||||||
| Supplemental schedule of non-cash investing and financing activities: | ||||||||||||
| Fair value of warrants allocated to additional paid-in capital | $ | 949,000 | $ | — | $ | 267,000 | ||||||
| Capital equipment lease | — | — | 79,000 | |||||||||
| Fair value of intangible assets acquired | 9,394,000 | — | — | |||||||||
| Fair value of tangible assets acquired | 260,000 | — | — | |||||||||
| Joint Venture purchase obligation | 4,709,000 | — | — | |||||||||
| Fair value of previously held equity interest at acquisition date | 4,928,000 | — | — | |||||||||
THE ACCOMPANYING NOTES ARE AN INTEGRAL PART OF THESE CONSOLIDATED FINANCIAL STATEMENTS
CYTORI THERAPEUTICS, INC.
NOTES TO CONSOLIDATED FINANCIAL STATEMENTS
DECEMBER 31, 2013
| 1. | Organization and Operations |
The Company
Cytori (NASDAQ: CYTX) is developing cell therapies for cardiovascular disease and for the repair of soft tissue injuries and burns. Cytori’s Cell Therapy utilizes a patient’s own adipose derived stem and regenerative cells, uniquely optimized and formulated for specific therapeutic applications.
Principles of Consolidation
The accompanying consolidated financial statements include our accounts and those of our subsidiaries. All significant intercompany transactions and balances have been eliminated. Management evaluates its investments on an individual basis for purposes of determining whether or not consolidation is appropriate. In instances where we do not demonstrate control through decision-making ability and/or a greater than 50% ownership interest, we account for the related investments under the cost or equity method, depending upon management’s evaluation of our ability to exercise and retain significant influence over the investee. Our investment in the Olympus-Cytori, Inc. joint venture has been accounted for under the equity method of accounting (see note 4 for further details).
We have four subsidiaries located in Japan, Switzerland, India and Spain that have been established primarily to support our sales and marketing activities in these regions.
Certain Risks and Uncertainties
Our prospects are subject to the risks and uncertainties frequently encountered by companies in the early stages of development and commercialization, especially those companies in rapidly evolving and technologically advanced industries such as the biotech/medical device field. Our future viability largely depends on our ability to complete development of new products and receive regulatory approvals for those products. No assurance can be given that our new products will be successfully developed, regulatory approvals will be granted, or acceptance of these products will be achieved. The development of medical devices for specific therapeutic applications is subject to a number of risks, including research, regulatory and marketing risks. There can be no assurance that our development stage products will overcome these hurdles and become commercially viable and/or gain commercial acceptance.
Capital Availability
We incurred net losses of $26,177,000, $32,279,000 and $32,451,000 for the years ended December 31, 2013, 2012 and 2011, respectively. We have an accumulated deficit of $300,905,000 as of December 31, 2013. Additionally, we have used net cash of $34,563,000, $32,193,000 and $35,323,000 to fund our operating activities for years ended December 31, 2013, 2012 and 2011, respectively. To date, these operating losses have been funded primarily from outside sources of invested capital and gross profits. During 2013 and 2012, we expanded our commercialization activities while simultaneously pursuing available financing sources to support operations and growth.
We have had, and we will likely continue to have, an ongoing need to raise additional cash from outside sources to fund our future operations.
We believe our plans to raise additional cash from outside sources and, if necessary, our cost containment efforts are sufficient to allow us to continue operations for the next twelve months. This includes minimum liquidity requirements of the Loan and Security Agreement that require us to make principal and interest payments of $868,000 per month beginning in August 2014 and maintain at least three months of cash on hand to avoid an event of default under the loan agreement. Our plans include pursuing additional cash through strategic corporate partnerships and possibly engaging in future sales of equity, as well as our gross profits. While we have an established history of raising capital through these platforms, and we are currently involved in negotiations with multiple parties, there is no guarantee that adequate funds will be available when needed from additional debt or equity financing, development and commercialization partnerships, increased results of operations, or from other sources, or on terms acceptable to us. If our efforts to obtain sufficient additional funds are not successful, we would be required to delay, scale back, or eliminate some or all of our research or product development, manufacturing operations, administrative operations, including our employee base, and clinical or regulatory activities, which could negatively affect our ability to achieve certain corporate goals.
The Company continues to seek additional capital through product revenues, strategic transactions, including extension opportunities under the awarded BARDA contract, and from other financing alternatives.
Use of Estimates
The preparation of Consolidated Financial Statements in conformity with U.S. generally accepted accounting principles requires management to make estimates and assumptions affecting the reported amounts of assets and liabilities and disclosure of contingent assets and liabilities at the date of the financial statements, and the reported amounts of revenue and expenses during the reporting period. Our most significant estimates and critical accounting policies involve recognizing revenue, valuing the acquisition of the Olympus-Cytori Joint Venture, valuing warrants, determining the assumptions used in measuring share-based compensation expense and valuing allowances for doubtful accounts and inventories.
Actual results could differ from these estimates. Management’s estimates and assumptions are reviewed regularly, and the effects of revisions are reflected in the Consolidated Financial Statements in the periods they are determined to be necessary.
Cash and Cash Equivalents
We consider all highly liquid investments with maturities of three months or less at the time of purchase to be cash equivalents. Investments with original maturities of three months or less that were included with and classified as cash and cash equivalents totaled $4,644,000 and $6,145,000 as of December 31, 2013 and 2012, respectively. We maintain our cash at insured financial institutions. The combined account balances at each institution periodically exceed FDIC insurance coverage, and as a result, there is a concentration of credit risk related to amounts in excess of FDIC limits.
Short-term Investments
We invest excess cash in money market funds, highly liquid debt instruments of financial institutions and corporations with strong credit ratings, and in United States government obligations. We have established guidelines relative to diversification and maturities to maintain safety and liquidity. These guidelines are periodically reviewed and modified to take advantage of trends in yields and interest rates. After considering current market conditions, and in order to minimize our risk, management has elected to invest all excess funds in money market funds and other highly liquid investments that are appropriately classified as cash equivalents as of December 31, 2013 and December 31, 2012.
Restricted Cash and Cash Equivalents
Restricted cash consists of cash and cash equivalents held in a letter of credit account pursuant to a lease agreement entered into on April 2, 2010 (amended November 4, 2011) for leasing of property at 3020 and 3030 Callan Road, San Diego, California. The lease agreement required us to execute a letter of credit for $350,000 naming the landlord as a beneficiary. The letter of credit was issued in July 2010 and required us to maintain $350,000 as restricted cash for the duration of the lease, which expires October 31, 2017.
Accounts Receivable
Accounts receivable are recorded at the invoiced amount and do not bear interest. Amounts collected on accounts receivable are included in net cash provided by operating activities in the consolidated statements of cash flows. The Company maintains an allowance for doubtful accounts for estimated losses inherent in its accounts receivable portfolio. In establishing the required allowance, management considers historical losses adjusted to take into account current market conditions and our customers’ financial condition, the amount of receivables in dispute, and the current receivables aging and current payment patterns. Account balances are charged off against the allowance after all means of collection have been exhausted and the potential for recovery is considered remote.
Inventories
Inventories include the cost of material, labor, and overhead, and are stated at the lower of cost, determined on the first-in, first-out (FIFO) method, or market. We periodically evaluate our on-hand stock and make appropriate provisions for any stock deemed excess or obsolete. Manufacturing costs resulting from lower than “normal” production levels are expensed as incurred.
Property and Equipment
Property and equipment are stated at cost, net of accumulated depreciation. Depreciation expense, which includes the amortization of capitalized leasehold improvements, is provided for on a straight-line basis over the estimated useful lives of the assets, or the life of the lease, whichever is shorter, and range from three to five years. When assets are sold or otherwise disposed of, the cost and related accumulated depreciation are removed from the accounts and the resulting gain or loss is included in operations. Maintenance and repairs are charged to operations as incurred.
Impairment
We assess certain of our long-lived assets, such as property and equipment and intangible assets other than goodwill, for potential impairment when there is a change in circumstances that indicates carrying values of assets may not be recoverable. Such long-lived assets are deemed to be impaired when the undiscounted cash flows expected to be generated by the asset (or asset group) are less than the asset’s carrying amount. Any required impairment loss would be measured as the amount by which the asset’s carrying value exceeds its fair value, and would be recorded as a reduction in the carrying value of the related asset and a charge to operating expense. We recognized no impairment losses during any of the periods presented in these financial statements.
Goodwill and Intangibles
Goodwill is reviewed for impairment annually or more frequently when events or changes in circumstances indicate that fair value of the reporting unit has been reduced to less than its carrying value. We perform our impairment test annually during the fourth quarter. In September 2011, the FASB issued revised guidance to simplify how entities test goodwill for impairment. Under the revised guidance, entities have the option to first assess qualitative factors to determine whether it is more likely than not that the fair value of a reporting unit is less than its carrying amount as a basis for determining whether it is necessary to perform the two-step goodwill impairment test described in Accounting Standards Codification Topic 350. If, after assessing qualitative factors, an entity determines it is not more likely than not that the fair value of a reporting unit is less than its carrying amount, then performing the two-step impairment test is unnecessary. If deemed necessary, a two-step test is used to identify the potential impairment and to measure the amount of goodwill impairment, if any. The first step is to compare the fair value of the reporting unit with its carrying amount, including goodwill. If the fair value of the reporting unit exceeds its carrying amount, goodwill is considered not impaired; otherwise, there is an indication that goodwill may be impaired and the amount of the loss, if any, is measured by performing step two. Under step two, the impairment loss, if any, is measured by comparing the implied fair value of the reporting unit goodwill with the carrying amount of goodwill. We completed this assessment as of November 30, 2013, and concluded that no impairment existed.
Separable intangible assets that have finite useful lives continue to be amortized over their respective useful lives. Intangibles, consisting of patents and core technology purchased in the acquisition of StemSource, Inc. in 2002, were amortized on a straight-line basis over their expected useful lives of ten years, and are fully amortized as of December 31, 2012.
As part of the May 2013 acquisition of the Joint Venture, we acquired intangible assets which consisted primarily of contractual license rights that had previously enabled the Joint Venture to conduct development and manufacturing activities pertaining to certain aspects of Cytori’s Celution ® technology. The useful life of the identifiable intangible assets was estimated based on the assumed future economic benefit expected to be received from the assets. The technology valued at $9,394,000 will be amortized over its useful life of seven years, based on the quarterly revenue forecasted for those years. As of December 31, 2013, we have amortized $49,000. The estimated aggregate amortization expense will be $67,000 for 2014, $352,000 for 2015, $673,000 for 2016, $1,557,000 for 2017, $3,348,000 for 2018 and $3,348,000 thereafter.
The changes in the carrying amounts of other indefinite and finite-life intangible assets and goodwill for the years ended December 31, 2013 and 2012 are as follows:
| December 31, 2013 | ||||
| Other intangibles, net: | ||||
| Beginning balance | $ | — | ||
| Acquisition of JV Intangible | 9,394,000 | |||
| Amortization | (49,000 | ) | ||
| Ending balance | 9,345,000 | |||
| Goodwill, net: | ||||
| Beginning balance | 3,922,000 | |||
| Increase (decrease) | — | |||
| Ending balance | 3,922,000 | |||
| Total goodwill and other intangibles, net | $ | 13,267,000 | ||
| December 31, 2012 | ||||
| Other intangibles, net: | ||||
| Beginning balance | $ | 192,000 | ||
| Amortization | (192,000 | ) | ||
| Ending balance | — | |||
| Goodwill, net: | ||||
| Beginning balance | 3,922,000 | |||
| Increase (decrease) | — | |||
| Ending balance | 3,922,000 | |||
| Total goodwill and other intangibles, net | $ | 3,922,000 | ||
Warrant Liability
Warrants with exercise price reset features (down-round protection) were accounted for liabilities, with changes in the fair value included in net loss for the respective periods. The fair value of the liability associated with the warrants with this reset feature was $0 as of December 31, 2013, $418,000, $209,000 and $4,360,000 in gains from the change in fair value of warrants was recorded for the years ended December 31, 2013, 2012 and 2011.
Changes in the fair value of the warrants were recognized in earnings until such time as the warrants were exercised or they expired. These warrants expired as of August 2013. The warrants were not traded in an active securities market, and as such, we estimated the fair value of these warrants using an option pricing model with the following assumptions:
As of December 31, 2012 | ||||
| Expected term | 0.61 years | |||
| Common stock market price | $ | 2.80 | ||
| Risk-free interest rate | 0.11 | % | ||
| Expected volatility | 73.88 | % | ||
| Resulting fair value (per warrant) | $ | 0.20 | ||
Expected volatility was based primarily on historical volatility. Historical volatility was computed using daily pricing observations for recent periods that corresponded to the expected term of the warrants. We believe this method produced an estimate that was representative of our expectations of future volatility over the expected term of these warrants. The expected life was based on the remaining contractual term of the warrants. The risk-free interest rate was the interest rate for treasury constant maturity instruments published by the Federal Reserve Board that was closest to the expected term of the warrants. The fair value of these warrants also incorporated our assumptions about future equity issuances and their impact to the down-round protection feature.
Fluctuations in the fair value of the warrants were impacted by unobservable inputs, most significantly the assumption with regards to future equity issuances and its impact to the down-round protection feature. Significant increases (decreases) in this input in isolation would have resulted in a significantly higher (lower) fair value measurement.
Revenue Recognition
Product Sales
We recognize revenue from product sales when the following fundamental criteria are met: (i) persuasive evidence of an arrangement exists, (ii) delivery has occurred, (iii) the price to the customer is fixed or determinable and (iv) collection of the resulting accounts receivable is reasonably assured.
For all sales, we use a binding purchase order or a signed agreement as evidence of an arrangement. If the other revenue recognition criteria are met, revenue for these product sales is recognized upon delivery to the customer, as all risks and rewards of ownership have been substantively transferred to the customer at that point. For sales to customers who arrange for and manage the shipping process, we recognize revenue upon shipment from our facilities. Shipping and handling costs that are billed to our customers are classified as revenue. The customer’s obligation to pay and the payment terms are set at the time of delivery and are not dependent on the subsequent use or resale of our products. For sales where all revenue recognition criteria are not met, revenue is deferred and related inventory remains on our books.
For sales that include multiple deliverables, such as sales of our StemSource® Cell Bank (cell bank), we account for products or services (deliverables) separately rather than as a combined unit. Stem cell banks typically consist of a complex array of equipment, proprietary knowledge, license rights, and services, including one or more StemSource® devices, a cryogenic freezer, measuring and monitoring equipment, and a database patient tracking system. In addition, we typically provide consulting, installation, and training services. Web hosting, technical support and maintenance services are generally provided for a period of up to one year subsequent to the date of sale. FASB authoritative guidance requires an evaluation of these deliverables to determine the appropriate “units of accounting” for purposes of revenue recognition. Each cell bank is customized to provide the best solution for the customer. Depending on customers’ needs, all or combination of the following units of accounting will apply to cell bank transactions:
| · | initial consulting services; |
| · | license rights and standard operating procedures; |
| · | equipment and supplies; |
| · | installation services; |
| · | training services; |
| · | database hosting services; |
| · | technical support services; and |
| · | maintenance services. |
FASB authoritative guidance establishes a selling price hierarchy for determining the selling price of a deliverable, which is based on: (a) vendor-specific objective evidence (“VSOE”); (b) third-party evidence (“TPE”); or (c) management estimates. This guidance requires arrangement consideration to be allocated at the inception of the arrangement to all deliverables using the relative selling price method. For our cell bank sales, we establish relative selling prices for all deliverables based on vendor-specific quotes for comparable services when available. In the absence of VSOE, we use competitors’ products or services considered largely interchangeable with our own or management’s best estimate. Revenue allocated to each unit of accounting is calculated and recognized based on the relative selling price of each deliverable. Future services such as web hosting and ongoing maintenance are deferred and recognized into income as the services are provided, generally over one year following the installation of the equipment.
Concentration of Significant Customers & Geographical Sales
For the year ended December 31, 2013, our sales were concentrated with respect to one distributor, which comprised 26% of our product revenue recognized. Two distributors and one direct customer accounted for 55% of total outstanding accounts receivable as of December 31, 2013.
For the year ended December 31, 2012, our sales were concentrated with respect to one direct customer, which comprised 12% of our product revenue recognized. Two direct customers and one distributor accounted for 39% of total outstanding accounts receivable as of December 31, 2012.
For the year ended December 31, 2011, our sales were concentrated with respect to one direct customer, which comprised 14% of our product revenue recognized. Two direct customers accounted for 27% of total outstanding accounts receivable as of December 31, 2011.
Product revenues, classified by geographic location, are as follows:
| Years ended | ||||||||||||||||||||||||
| 2013 | 2012 | 2011 | ||||||||||||||||||||||
Product Revenues | % of Total | Product Revenues | % of Total | Product Revenues | % of Total | |||||||||||||||||||
| North America | $ | 1,079,000 | 15 | % | $ | 1,143,000 | 13 | % | $ | 1,347,000 | 17 | % | ||||||||||||
| Japan | 2,109,000 | 30 | % | 4,352,000 | 50 | % | 3,202,000 | 40 | % | |||||||||||||||
| Europe | 1,240,000 | 17 | % | 2,004,000 | 23 | % | 1,973,000 | 25 | % | |||||||||||||||
| Other countries | 2,694,000 | 38 | % | 1,210,000 | 14 | % | 1,461,000 | 18 | % | |||||||||||||||
| Total product revenues | $ | 7,122,000 | 100 | % | $ | 8,709,000 | 100 | % | $ | 7,983,000 | 100 | % | ||||||||||||
Research and Development
We earn revenue for performing tasks under research and development agreements with both commercial enterprises, such as Olympus and Senko, and governmental agencies like the U.S. Department of Health and Human Service’s Biomedical Advanced Research and Development Authority (BARDA). Revenue earned under development agreements with commercial enterprises is classified as development revenues. Revenues derived from reimbursement of direct out-of-pocket expenses for research costs associated with government contracts are recorded as government contract and other within development revenues. Government contract revenue is recorded at the gross amount of the reimbursement. The costs associated with these reimbursements are reflected as a component of research and development expense in our statements of operations.
In the third quarter of 2012, we were awarded a contract to develop a new countermeasure for thermal burns valued at up to $106 million with BARDA. The initial base period includes $4.7 million over two years and covers preclinical research and continued development of Cytori’s Celution® system to improve cell processing. The additional contract options, if fully executed, cover clinical development through FDA approval under a device-based PMA regulatory pathway. This is a cost reimbursement contract and related government contract revenue was recorded at the gross amount of reimbursement starting in the fourth quarter of 2012.
We received funds from Olympus and Olympus-Cytori, Inc. during 2005 and 2006. We recorded upfront fees totaling $28,311,000 as deferred revenues, related party. In exchange for these proceeds, we agreed to (a) provide Olympus-Cytori, Inc. an exclusive and perpetual license to our Celution® System device technology and certain related intellectual property, and (b) provide future development contributions related to commercializing the Celution® System platform. The license and development services were not separable and as a result the recognition of this deferred amount as revenue required achievement of service related milestones, under a proportional performance methodology. Revenue was recognized as the above mentioned R&D milestones were completed. Of the amounts received and deferred, we recognized the last remaining development revenue of $638,000 during the three months ended March 31, 2013 as a result of the United States Court of Appeals upholding the FDA’s previous determination that our cell processing devices were not substantially equivalent to the cited predicate devices. The recognition of revenue associated with this event reflects the completion of our efforts expended to use commercially reasonable efforts to obtain device regulatory approvals in the United States as it pertains to the 510(k) pathway. During the year ended December 31, 2012, we recognized $2,882,000 of revenue associated with our arrangement with Olympus as a result of two milestones for the APOLLO and PRECISE clinical trials. As of December 31, 2013, there are no deferred amounts under this contract.
Refer to Note 8 for discussion about our arrangement with Senko.
Warranty
Beginning in March 2008, we began sales and shipments of our Celution® 800/CRS System to the European and Asia-Pacific reconstructive surgery market. In September 2008, we completed installation of our first StemSource® Cell Bank. We are selling medical device equipment for use with humans, which is subjected to exhaustive and highly controlled specification compliance and fitness testing and validation procedures before it can be approved for sale to help ensure that the products will be free of defects. We believe that the rigorous nature of the testing and compliance efforts serves to minimize the likelihood of defects in material or workmanship such that recognition of a warranty obligation is not justified at this time. Accordingly, we have not recorded a warranty reserve for our Celution® 800/CRS System and StemSource® Cell Bank product line during the years ended December 31, 2013, 2012 and 2011.
Research and Development
Research and development expenditures, which are charged to operations in the period incurred, include costs associated with the design, development, testing and enhancement of our products, regulatory fees, the purchase of laboratory supplies, and pre-clinical and clinical studies as well as salaries and benefits for our research and development employees.
Also included in research and development expenditures are costs incurred to support government contract reimbursement and costs incurred in connection with our development arrangements with Olympus and Senko.
Expenditures related to the Joint Venture with Olympus included costs that were necessary to support the commercialization of future generation devices, including the next generation Celution® System. These development activities, which began in November 2005, concluded during the first quarter of 2013, and we did not incur any Joint Venture development costs subsequent to our acquisition, in May 2013, of Olympus’ 50% interest in the Joint Venture.
Our government contract with BARDA to develop a new countermeasure for thermal burns entitles us to qualifying expenditures of up to $4.7 million during the initial base period. We incurred $3,053,000 in qualified expenses for the year ended December 31, 2013 and $331,000 for the year ended December 31, 2012. There were no comparable expenditures in 2011.
Deferred Financing Costs and Other Debt-Related Costs
Deferred financing costs are capitalized and amortized to interest expense over the term of the associated debt instrument. We evaluate the terms of the debt instruments to determine if any embedded or freestanding derivatives or conversion features exist. We allocate the aggregate proceeds of the debt between the warrants and the debt based on their relative fair values. The fair value of the warrant issued to the Lenders was calculated utilizing the Black-Scholes option pricing model. We are accreting the resultant discount over the term of the debt through maturity date using the effective interest method. If the maturity of the debt is accelerated because of default or early debt repayment, then the amortization or accretion would be accelerated.
Income Taxes
Income taxes are accounted for under the asset and liability method. Deferred tax assets and liabilities are recognized for the future tax consequences attributable to differences between the financial statement carrying amounts of existing assets and liabilities and their respective tax bases and operating loss and tax credit carry forwards. Deferred tax assets and liabilities are measured using enacted tax rates expected to apply to taxable income (loss) in the years in which those temporary differences are expected to be recovered or settled. Due to our history of loss, a full valuation allowance was recognized against our deferred tax assets.
Stock Based Compensation
We recognize the fair value method of all share-based payment awards in our statements of operations over the requisite vesting period of each award. We estimate the fair value of these options using the Black-Scholes option pricing model using assumptions for expected volatility, expected term, and risk-free interest rate. Expected volatility is based primarily on historical volatility and is computed using daily pricing observations for recent periods that correspond to the expected term of the options. The expected life is based on the expected term of the options. The risk-free interest rate is the interest rate for treasury instruments with maturities that approximate the expected term.
Segment Information
For the years ended December 31, 2013, 2012 and 2011, all of our financial results relate to regenerative cell technology, therefore we report our results as a single segment.
Loss Per Share
Basic per share data is computed by dividing net income or loss applicable to common stockholders by the weighted average number of common shares outstanding during the period. Diluted per share data is computed by dividing net income or loss applicable to common stockholders by the weighted average number of common shares outstanding during the period increased to include, if dilutive, the number of additional common shares that would have been outstanding as calculated using the treasury stock method. Potential common shares were related entirely to outstanding but unexercised options and warrants for all periods presented.
We have excluded all potentially dilutive securities, including unvested performance-based restricted stock, from the calculation of diluted loss per share attributable to common stockholders for the years ended December 31, 2013, 2012, and 2011, as their inclusion would be antidilutive. Potentially dilutive common shares excluded from the calculations of diluted loss per share were 17,173,374, 17,426,976 and 19,476,425 for the years ended December 31, 2013, 2012 and 2011, respectively.
| 3. | Partnership Agreement with Lorem Vascular |
On October 29, 2013, we entered into a partnership with Lorem Vascular, to commercialize Cytori Cell Therapy for the cardiovascular, renal and diabetes markets, in China, Hong Kong, Malaysia, Singapore and Australia (License/Supply Agreement), and a Common Stock Purchase Agreement. On January 30, 2014 we entered into the Amended and Restated License/Supply Agreement with Lorem Vascular (the “Restated Agreement”) which restated the License/Supply Agreement in its entirety and expanded the licensed field to all uses excepting alopecia (hair loss). Under the Restated Agreement, Lorem Vascular committed to pay up to $500 million in license fees in the form of revenue milestones. In addition, Lorem is required to pay us 30% of their gross profits in China, Hong Kong and Malaysia for the term of the agreement. In addition, Lorem Vascular has agreed to purchase the Cytori Celution® System and consumables under the Restated Agreement. Pursuant to the related Common Stock Purchase Agreement, Cytori sold Lorem Vascular 8 million shares of Cytori common stock at $3.00 per share for a total of $24 million. The Equity purchased was closed in two installments, the first half in November 2013, and the second half in January 2014.
In addition, Lorem Vascular initially committed to purchase approximately $7 million in Celution® devices and consumables, with an approximately $2 million order already placed, and an approximately $5 million order to be placed following regulatory approval in China. Lorem and Cytori have implemented a regulatory plan for China and anticipate approval in 2014. In connection with the Common Stock Purchase Agreement, the right to appoint one member of our Board of directors was granted to Mr. K.T. Lim, Chairman of Lorem Vascular. We expect Mr. Lim to appoint a member to serve on our Board of Directors in the second half of 2014.
| 4. | Transactions with Olympus Corporation |
Acquisition of Olympus’ Interest in the Joint Venture
In 2005, we entered into a joint venture and other related agreements (the “Joint Venture Agreements”) with Olympus. The Joint Venture was owned equally by Olympus and us. We had previously accounted for our interests in the Joint Venture using the equity method of accounting, since we could not exert significant influence over the Joint Venture’s operations.
On May 8, 2013, Cytori and Olympus agreed to terminate the Olympus-Cytori Joint Venture (Termination Agreement), and Cytori acquired the remaining 50% equity interest in the Joint Venture from Olympus. The termination of the relationship and purchase of Olympus’ equity shares of the Joint Venture allows Cytori to regain full control of the manufacturing rights for the Celution ® system. The purpose of the acquisition is to gain more flexibility on the manufacturing process and associated costs, enable higher margins, and speed the transition to the critical next-generation systems. In connection with the Termination Agreement, the assets acquired, liabilities assumed, and the Company’s previously held equity interest were recorded at fair value. For valuation purposes Cytori determined the acquisition date (the date on which Cytori effectively gained full control of the equity interest previously held by Olympus) to be May 27, 2013. The remeasurement of the previously held equity interest at the acquisition date resulted in a net gain of $4,892,000 that was recorded in the accompanying Consolidated Statements of Operations.
As consideration for the Termination Agreement, Cytori can choose from alternative payment options as defined in the Termination Agreement. The payment options call for a minimum of $4,500,000 up to a maximum of $16,000,000 to be paid by Cytori to Olympus in installments over periods ranging from one year to six years depending on the option selected by the Company. Installment payments will be calculated quarterly based on 5% of Cytori’s gross sales receipts for all products sold. If Cytori receives an aggregate $35,000,000 in cash through strategic or financing arrangements during the first year of the Termination Agreement, Cytori would be required to pay $4,500,000 (minus installment payments previously made) upon request of Olympus as full and complete consideration under the Agreement.
The fair value of the Joint Venture, including the identified intangible assets acquired, consideration transferred, and Cytori’s previously held equity interest, was estimated from a market participant perspective, using valuation techniques based on the income approach for measuring fair value. Specifically, an excess earnings methodology was employed using primarily Level 3 fair value inputs. The intangible assets acquired consisted primarily of contractual license rights that had previously enabled the Joint Venture to conduct development and manufacturing activities pertaining to certain aspects of Cytori’s Celution ® technology. The useful life of the identifiable intangible assets was estimated based on the assumed future economic benefit expected to be received from the assets. Inputs used in the valuation included various market participant assumptions in order to project potential future cash flows, discounted at a rate commensurate with the risk involved.
Useful Life (in years) | Estimated Fair Value | |||||||
| Intangible assets: | ||||||||
| Developed technology | 7 | $ | 9,394,000 | |||||
The Company calculated the fair value of the purchase consideration on the acquisition date to be $4,928,000. This was determined using a weighted probability assessment of the payment options available to Cytori. Present value risk-adjusted discount rates applied to the purchase consideration ranged from 9.75% to 12.75%. The fair value calculation of the purchase consideration resulted in a discount of $1,072,000, which was being amortized to interest expense over a weighted average expected term of 1.8 years. On a quarterly basis, the Company reassesses the probabilities of the various payment options and expected term. Changes in the expected term and the remaining discount amount as a result of the reassessment will be recognized prospectively as an adjustment to interest expense. Upon final settlement of the purchase obligation, any difference between the amount paid and the carrying amount of the purchase obligation will be recorded as a gain or loss on extinguishment of the liability. As a result of this reassessment as of December 31, 2013 the Company believes it will settle the obligation for a total of $4.5 million (less any installment payments already made), which will result in a gain of $0.6 million upon settlement.
There was no revenue or earnings from the Joint Venture included in our consolidated results subsequent to the date of acquisition. Had the acquisition occurred on January 1, 2013, consolidated revenue would not have been affected, but our consolidated net loss would have been reduced by $48,000, the amount of our year to date equity loss from investment in Joint Venture.
The following table summarizes the fair value of the assets acquired and liabilities assumed at the date of acquisition (in thousands):
Estimated Fair Value | ||||
| Current assets | $ | 236 | ||
| Property and equipment | 260 | |||
| Intangible assets | 9,394 | |||
| Total assets acquired | 9,890 | |||
| Accrued and other current liabilities | (33 | ) | ||
| Total fair value of the Joint Venture | $ | 9,857 | ||
Acquisition-related transaction costs are not included as components of consideration transferred but have been accounted for as expenses in the period in which the costs are incurred.
Put/Calls and Guarantees
Prior to the termination of the Joint Venture the Shareholders’ Agreement between Cytori and Olympus provided that in certain specified circumstances of our insolvency or if we experienced a change in control, Olympus would have the rights to (i) repurchase our interests in the Joint Venture at the fair value of such interests or (ii) sell its own interests in the Joint Venture to Cytori (the “Put”) at the higher of (a) $22,000,000 or (b) the Put’s fair value.
At December 31, 2012 and 2011, the fair value of the Put was $2,250,000 and $1,910,000, respectively. The Put, as a previously existing contractual relationship between Olympus and Cytori, was cancelled as a result of the Joint Venture termination in May 2013 and therefore its related fair value decreased to zero as a result of the termination. Fluctuations in the Put value are recorded in the Consolidated Statements of Operations as change in fair value of option liabilities.
| 5. | Sale and Exclusive License/Supply Agreement with Bimini Technologies LLC |
On July 30, 2013, we entered into a Sale and Exclusive License/Supply Agreement with Bimini Technologies LLC (“Bimini”), pursuant to which we sold to Bimini substantially all of the assets (other than certain retained rights and licenses) of our Puregraft® product line, a series of standalone fat transplantation products that were developed to improve the predictability of outcomes for autologous fat grafting and aesthetic body contouring. The aggregate value of the consideration paid by Bimini at the execution of the agreement was $5.0 million.
In connection with the sale, Bimini granted to the Company an exclusive, perpetual, royalty bearing license to market and sell the Puregraft products for use in combination with adipose derived regenerative cells, and non-exclusive rights for use in connection with the Company’s licensed cell and tissue banks (in addition to certain Company retained ownership rights in the technology). The Company will supply Puregraft products to Bimini on an interim basis until the Company transfers the manufacturing of the Puregraft products to Bimini. After the transfer, Bimini will supply the Puregraft products to the Company.
Pursuant to the sale agreement, the Company has also granted to Bimini the global, exclusive, perpetual, irrevocable royalty bearing license to purchase from Cytori, use and sell the Celution® System products for Alopecia (hair loss). Cytori will supply Celution devices and consumable sets to Bimini, and Bimini will be responsible for all costs associated with commercial development in the Alopecia market.
The agreement includes certain obligations to be performed by the Company on the behalf of Bimini, which includes transferring the manufacturing of Puregraft products to an agreed upon third party on or before December 31, 2014 and training. The Company recorded a gain on the Puregraft divestiture of $4.5 million in the accompanying Consolidated Statements of Operations, which is net of $547,000 in estimated future transfer and training obligations. Bimini is obligated to make certain additional milestone payments to the Company (in an aggregate amount of up to $10.0 million), contingent upon the achievement of certain milestones relating to Bimini’s gross profits from sales of the Puregraft products.
| 6. | Fair Value Measurements |
Fair value measurements are market-based measurements, not entity-specific measurements. Therefore, fair value measurements are determined based on the assumptions that market participants would use in pricing the asset or liability. We follow a three-level hierarchy to prioritize the inputs used in the valuation techniques to derive fair values. The basis for fair value measurements for each level within the hierarchy is described below:
·Level 1: Quoted prices in active markets for identical assets or liabilities.
·Level 2: Quoted prices for similar assets or liabilities in active markets; quoted prices for identical or similar instruments in markets that are not active; and model-derived valuations in which all significant inputs are observable in active markets.
·Level 3: Valuations derived from valuation techniques in which one or more significant inputs are unobservable in active markets.
The following table provides a summary of the recognized assets and liabilities that we measure at fair value on a recurring basis:
| Balance as of | Basis of Fair Value Measurements | |||||||||||||||
| December 31, 2013 | Level 1 | Level 2 | Level 3 | |||||||||||||
| Assets: | ||||||||||||||||
| Cash equivalents | $ | 4,644,000 | $ | 4,644,000 | $ | — | $ | — | ||||||||
| Balance as of | Basis of Fair Value Measurements | |||||||||||||||
| December 31, 2012 | Level 1 | Level 2 | Level 3 | |||||||||||||
| Assets: | ||||||||||||||||
| Cash equivalents | $ | 6,145,000 | $ | 6,145,000 | $ | — | $ | — | ||||||||
| Liabilities: | ||||||||||||||||
| Put option liability | $ | (2,250,000 | ) | $ | — | $ | — | $ | (2,250,000 | ) | ||||||
| Warrant liability | $ | (418,000 | ) | $ | — | $ | — | $ | (418,000 | ) | ||||||
We use quoted market prices to determine the fair value of our cash equivalents, which consist of money market funds and therefore are classified in Level 1 of the fair value hierarchy.
We value our put liability using an option pricing theory based simulation analysis (i.e., a Monte Carlo simulation).
The following table summarizes the change in our Level 3 put option liability value:
| Year ended | Year ended | |||||||
| Put option liability | December 31, 2013 | December 31, 2012 | ||||||
| Beginning balance | $ | (2,250,000 | ) | $ | (1,910,000 | ) | ||
| Decrease (increase) in fair value recognized in operating expenses | 2,250,000 | (340,000 | ) | |||||
| Ending balance | $ | — | $ | (2,250,000 | ) | |||
Common stock purchase warrants issued in connection with our August 2008 private equity placement do not trade in an active securities market, and as such, we estimate the fair value of these warrants using the option pricing model. Some of the significant inputs are observable in active markets, such as common stock market price, volatility, and risk free rate. The fair value of these warrants also incorporate our assumptions about future equity issuances and their impact to the down-round protection feature. Because some of the inputs to our valuation model are either not observable quoted prices or are not derived principally from or corroborated by observable market data by correlation or other means, the warrant liability is classified as Level 3 in the fair value hierarchy.
The following table summarizes the change in our Level 3 warrant liability value:
| Year ended | Year ended | |||||||
| Warrant liability | December 31, 2013 | December 31, 2012 | ||||||
| Beginning balance | $ | (418,000 | ) | $ | (627,000 | ) | ||
| Decrease (increase) in fair value recognized in operating expenses | 418,000 | 209,000 | ||||||
| Ending balance | $ | — | $ | (418,000 | ) | |||
No other assets or liabilities are measured at fair value on a recurring basis, or have been measured at fair value on a non-recurring basis subsequent to initial recognition, on the accompanying consolidated balance sheet as of December 31, 2013.
| 7. | Fair Value |
Financial Instruments
We disclose fair value information about all financial instruments, whether or not recognized in the balance sheet, for which it is practicable to estimate fair value. The disclosures of estimated fair value of financial instruments at December 31, 2013 and 2012 were determined using available market information and appropriate valuation methods. Considerable judgment is necessary to interpret market data and develop estimated fair value. The use of different market assumptions or estimation methods may have a material effect on the estimated fair value amounts.
The carrying amounts for cash and cash equivalents, accounts receivable, inventories, other current assets, accounts payable, accrued expenses and other liabilities approximate fair value due to the short-term nature of these instruments.
We utilize quoted market prices to estimate the fair value of our fixed rate debt, when available. If quoted market prices are not available, we calculate the fair value of our fixed rate debt based on a currently available market rate assuming the loans are outstanding through maturity and considering the collateral. In determining the current market rate for fixed rate debt, a market spread is added to the quoted yields on federal government treasury securities with similar terms to the debt.
At December 31, 2013 and 2012, the aggregate fair value and the carrying value of the Company’s fixed rate long-term debt were as follows:
| December 31, 2013 | December 31, 2012 | |||||||||||||||
| Fair Value | Carrying Value | Fair Value | Carrying Value | |||||||||||||
| Fixed rate long-term debt | $ | 26,207,000 | $ | 26,241,000 | $ | 22,425,000 | $ | 22,608,000 | ||||||||
The fair value of debt is classified as Level 3 in the fair value hierarchy as some of the inputs to our valuation model are either not observable quoted prices or are not derived principally from or corroborated by observable market data by correlation or other means.
Carrying value is net of debt discount of $2,379,000 and $917,000 as of December 31, 2013 and 2012, respectively.
Nonfinancial Assets and Liabilities
We apply fair value techniques on a non-recurring basis associated with: (1) valuing potential impairment losses related to goodwill which are accounted for pursuant to the authoritative guidance for intangibles—goodwill and other; and (2) valuing potential impairment losses related to long-lived assets which are accounted for pursuant to the authoritative guidance for property, plant and equipment.
All of our goodwill is associated with regenerative cell technology, and we determine the fair value based on a combination of inputs including the market capitalization of the company, as well as Level 3 inputs such as discounted cash flows which are not observable from the market, directly or indirectly. We conduct our goodwill impairment analysis annually as of November 30 each year, or upon the occurrence of certain triggering events. No such triggering events occurred during the year ended December 31, 2013. Historically, the fair value has significantly exceeded its carrying value.
We test for the impairment of our long-lived assets when triggering events occur and such impairment, if any, is measured at fair value. The inputs for fair value of our long lived assets would be based on Level 3 inputs as data used for such fair value calculations would be based on discounted cash flows using one or more significant unobservable inputs. No triggering events occurred during the year ended December 31, 2013.
As part of the May 2013 acquisition of the Joint Venture, we acquired intangible assets which consisted primarily of contractual license rights that had previously enabled the Joint Venture to conduct development and manufacturing activities pertaining to certain aspects of Cytori’s Celution ® technology. The useful life of the identifiable intangible assets was estimated based on the assumed future economic benefit expected to be received from the assets. The technology valued at $9,394,000 will be amortized over its useful life of seven years, based on the quarterly revenue forecasted for those years.
| 8. | Thin Film Japan Distribution Agreement |
In 2004, the Company entered into a Distribution Agreement with Senko. Under this agreement, we granted to Senko an exclusive license to sell and distribute certain Thin Film products in Japan and are responsible for the completion of the initial regulatory application to the Ministry of Health, Labor and Welfare (MHLW) and commercialization of the Thin Film product line in Japan. The Distribution Agreement with Senko was to commence upon “commercialization.” Essentially, commercialization occurs when one or more Thin Film product registrations are completed with the MHLW. At the inception of this arrangement, we received a $1,500,000 license fee which was recorded as deferred revenues in 2004. Half of the license fee was refundable if the parties agree commercialization is not achievable and a proportional amount was refundable if we terminate the arrangement, other than for material breach by Senko, before three years post-commercialization. We have also received $1,250,000 in milestone payments from Senko.
In February 2013, we entered into a mutual termination and release agreement with Senko, whereby the Distribution Agreement and all Senko rights, licenses and privileges granted under the Distribution Agreement terminated and reverted to the Company. As a result of this Termination Agreement, we are obligated to pay Senko $1,200,000 in six quarterly installment payments of $200,000 each through May 2014. At the time of the Termination Agreement, we had a balance of $2,379,000 in deferred revenues on our balance sheet relating to the payments received from Senko in the past pursuant to the Distribution Agreement. At the time of the Termination Agreement we accrued $1,200,000 of the termination fee, and recognized the remaining $1,179,000 in development revenues which reflects the Company’s efforts towards commercialization under the agreement.
During the year ended December 31, 2013, our aggregate installment payments paid were $800,000. As of December 31, 2013, we have a remaining termination fee obligation of $400,000.
9. | Composition of Certain Financial Statement Captions |
Inventories, net
As of December 31, 2013 and 2012, inventories, net, were comprised of the following:
| December 31, | ||||||||
| 2013 | 2012 | |||||||
| Raw materials | $ | 1,315,000 | $ | 1,384,000 | ||||
| Work in process | 232,000 | 404,000 | ||||||
| Finished goods | 2,147,000 | 1,387,000 | ||||||
| $ | 3,694,000 | $ | 3,175,000 | |||||
Other Current Assets
As of December 31, 2013 and 2012, other current assets were comprised of the following:
| December 31, | ||||||||
| 2013 | 2012 | |||||||
| Prepaid insurance | $ | 264,000 | $ | 291,000 | ||||
| Prepaid other | 850,000 | 759,000 | ||||||
| Other receivables | 111,000 | 111,000 | ||||||
| $ | 1,225,000 | $ | 1,161,000 | |||||
Property and Equipment, net
As of December 31, 2013 and 2012, property and equipment, net, were comprised of the following:
| December 31, | ||||||||
| 2013 | 2012 | |||||||
| Manufacturing and development equipment | $ | 5,059,000 | $ | 5,250,000 | ||||
| Office and computer equipment | 2,274,000 | 2,266,000 | ||||||
| Leasehold improvements | 3,271,000 | 3,267,000 | ||||||
| 10,604,000 | 10,783,000 | |||||||
| Less accumulated depreciation and amortization | (9,550,000 | ) | (8,609,000 | ) | ||||
| $ | 1,054,000 | $ | 2,174,000 | |||||
Depreciation expense totaled $1,581,000, $741,000 and $618,000 for the years ended December 31, 2013, 2012, and 2011, respectively.
Other Assets
As of December 31, 2013 and 2012, other assets were comprised of the following:
| December 31, | ||||||||
| 2013 | 2012 | |||||||
| Deposits | $ | 479,000 | $ | 401,000 | ||||
| Prepaid supplies, long-term | 2,333,000 | 2,339,000 | ||||||
| $ | 2,812,000 | $ | 2,740,000 | |||||
Accounts Payable and Accrued Expenses
As of December 31, 2013 and 2012, accounts payable and accrued expenses were comprised of the following:
| December 31, | ||||||||
| 2013 | 2012 | |||||||
| Accrued legal fees | $ | 564,000 | $ | 826,000 | ||||
| Accrued R&D studies | 376,000 | 896,000 | ||||||
| Accounts payable | 965,000 | 1,579,000 | ||||||
| Accrued vacation | 918,000 | 873,000 | ||||||
| Accrued bonus | 759,000 | 846,000 | ||||||
| Accrued expenses | 2,167,000 | 2,071,000 | ||||||
| Deferred rent | 138,000 | 35,000 | ||||||
| Accrued accounting fees | 140,000 | 190,000 | ||||||
| Accrued payroll | 50,000 | 95,000 | ||||||
| $ | 6,077,000 | $ | 7,411,000 | |||||
| 10. | Commitments and Contingencies |
We have contractual obligations to make payments on leases of office, manufacturing, and corporate housing space as follows:
| Years Ending December 31, | Operating Leases | |||
| 2014 | 2,071,000 | |||
| 2015 | 1,845,000 | |||
| 2016 | 1,892,000 | |||
| 2017 | 1,609,000 | |||
| Total | $ | 7,417,000 | ||
Rent expense, which includes common area maintenance, for the years ended December 31, 2013, 2012 and 2011 was $3,458,000, $2,980,000 and $2,524,000, respectively.
We have entered into agreements with various research organizations for pre-clinical and clinical development studies, which have provisions for cancellation. Under the terms of these agreements, the vendors provide a variety of services including conducting research, enrolling patients, recruiting patients, monitoring studies and data analysis. Payments under these agreements typically include fees for services and reimbursement of expenses. The timing of payments due under these agreements was estimated based on current schedules of pre-clinical and clinical studies in progress. As of December 31, 2013, we have pre-clinical research study obligations of $23,000 (all of which are expected to be complete within a year) and clinical research study obligations of $4,705,000 ($3,530,000 of which are expected to be complete within a year). Should the timing of the pre-clinical and clinical trials change, the timing of the payment of these obligations would also change.
During 2008, we entered into a supply agreement with a minimum purchase requirements clause. As of December 31, 2013, we have minimum purchase obligations of $850,000 (all of which is expected to be paid within a year).
We are subject to various claims and contingencies related to legal proceedings. Due to their nature, such legal proceedings involve inherent uncertainties including, but not limited to, court rulings, negotiations between affected parties and governmental actions. Management assesses the probability of loss for such contingencies and accrues a liability and/or discloses the relevant circumstances, as appropriate. Management believes that any liability to us that may arise as a result of currently pending legal proceedings will not have a material adverse effect on our financial condition, liquidity, or results of operations as a whole.
Refer to note 8 for a discussion of our commitments and contingencies related to our arrangements with Senko.
Refer to note 11 for a discussion of our commitments and contingencies related to our long-term obligations.
| 11. | Long-term Obligations |
On June 28, 2013 we entered into a Loan and Security Agreement (Loan Agreement) with Oxford Finance LLC and Silicon Valley Bank (together, the “Lenders”), pursuant to which the Lenders funded an aggregate principal amount of $27.0 million (Term Loan), subject to the terms and conditions set forth in the loan agreement. The Term Loan accrues interest at a fixed rate of 9.75% per annum. Pursuant to the Loan Agreement, we are required to make interest only payments through July 1, 2014 and thereafter we are required to make payments of principal and accrued interest in equal monthly installments sufficient to amortize the Term Loan through July 1, 2017, the maturity date. However, if we achieve a specified revenue threshold for the period of 12 months from the date of the loan agreement through June 30, 2014, the interest only period will be extended to February 1, 2015. All unpaid principal and interest with respect to the Term Loan is due and payable in full on July 1, 2017. At maturity of the Term Loan, or the earlier repayment in full following a voluntary prepayment or upon acceleration, the Company is required to make a final payment fee in an aggregate amount equal to $1,620,000. In connection with the Term Loan, on June 28, 2013, we issued to the Lenders warrants to purchase up to an aggregate of 596,553 shares of our common stock at an exercise price of $2.26 per share. These warrants are immediately exercisable and will expire on June 28, 2020.
In connection with the funding of the Loan Agreement, we prepaid all outstanding amounts under the prior loan agreement, at which time the Company’s obligations under the prior loan agreement immediately terminated. The Company paid to the prior agent and the prior lenders approximately $18,866,000, consisting of the then outstanding principal balance due of approximately $17,325,000, accrued but unpaid interest of approximately $119,000, a final payment fee (net of fees waived or refunded by the Lenders under the new loan agreement) of approximately $1,078,000, a prepayment fee (net of fees waived or refunded by the Lenders under the new loan agreement) of approximately $312,000 and other customary lender fees and expenses.
The net proceeds of the Term Loan, after payment of lender fees and expenses and prepaying all the outstanding amounts relating to the prior loan agreement, were approximately $7.8 million.
For the continuing Lenders, we accounted for this amendment as a debt modification. Accordingly, related fees of $1,942,000 were recorded as debt discount, and along with the unamortized debt discount will be amortized as an adjustment of interest expense using the effective interest method. For one existing lender that did not participate in the Term Loan, the payoff of their loan was accounted for as debt extinguishment. Accordingly, a loss on debt extinguishment of $708,000 was recorded, which includes that lender’s portion of unamortized fees and discounts along with prepayment and final payment fees.
We allocated the aggregate proceeds of the Term Loan between the warrants and the debt obligations based on their relative fair values. The fair value of the warrants issued to the Lenders was calculated utilizing the Black-Scholes option pricing model. We are amortizing the resulting additional discount of $949,000 to interest expense over the term of the loan using the effective interest method. The overall effective interest rate for the Term Loan is 13.92%. The Term Loan are collateralized by the tangible assets of the company, including a security interest in substantially all of its existing and after-acquired assets.
Additional details relating to the above term loan that is outstanding as of December 31, 2013, are presented in the following table:
| Origination Date | Original Loan Amount | Interest Rate | Current Monthly Payment* | Term | Remaining Principal (Face Value) | ||||||||||||
| June 2013 | $ | 27,000,000 | 9.75 | % | $ | 219,375 | 48 Months | $ | 27,000,000 | ||||||||
*Current monthly payment is inclusive of interest only
As of December 31, 2013, the future contractual principal and final fee payments on all of our debt and lease obligations are as follows:
| Years Ending December 31, | ||||
| 2014 | $ | 3,318,000 | ||
| 2015 | 8,502,000 | |||
| 2016 | 9,346,000 | |||
| 2017 | 7,504,000 | |||
| Total | $ | 28,670,000 | ||
| Reconciliation of Face Value to Book Value as of December 31, 2013 | ||||
| Total debt and lease obligations, including final payment fee (Face Value) | $ | 28,670,000 | ||
| Less: Debt discount | (2,379,000 | ) | ||
| Total: | 26,291,000 | |||
| Less: Current portion | (3,191,000 | ) | ||
| Long-term obligation | $ | 23,100,000 | ||
Our interest expense for the years ended December 31, 2013, 2012 and 2011 (most of which related to the loan entered into June 2013, September 2011 and June 2010) was $3,396,000, $3,386,000 and $2,784,000, respectively. Interest expense is calculated using the effective interest method, therefore it is inclusive of non-cash amortization in the amount of $893,000, $930,000 and $711,000, respectively, related to the amortization of the debt discount and capitalized loan fees.
| 12. | Income Taxes |
Due to our net losses for the years ended December 31, 2013, 2012 and 2011, and since we have recorded a full valuation allowance against deferred tax assets, there was no provision or benefit for income taxes recorded. There were no components of current or deferred federal or state income tax provisions for the years ended December 31, 2013, 2012 and 2011.
A reconciliation of the total income tax provision tax rate to the statutory federal income tax rate of 34% for the years ended December 31, 2013, 2012 and 2011 is as follows:
| 2013 | 2012 | 2011 | ||||||||||
| Income tax expense (benefit) at federal statutory rate | (34.00 | )% | (34.00 | )% | (34.00 | )% | ||||||
| Income tax expense (benefit) at state statutory rate | (3.54 | )% | (2.79 | )% | (3.36 | )% | ||||||
| Gain on previously held equity interest in joint venture | (7.02 | ) % | 0.00 | % | 0.00 | % | ||||||
| Mark to market permanent adjustment | (2.15 | )% | (0.24 | )% | (5.02 | )% | ||||||
| Change in federal valuation allowance | 80.13 | % | 35.86 | % | 45.72 | % | ||||||
| Change in state rate | (1.01 | )% | (8.36 | )% | (3.29 | )% | ||||||
| Deferred revenue | 0.00 | % | 000 | % | (2.09 | )% | ||||||
| Acquired NOL’s/Intangibles from joint venture | (33.40 | ) % | 0.00 | % | 0.00 | % | ||||||
| Foreign rate differential | 2.48 | % | (0.04 | )% | 0.00 | % | ||||||
| Other, net | (1.49 | )% | 9.57 | % | 2.04 | % | ||||||
| 0.00 | % | 0.00 | % | 0.00 | % | |||||||
The tax effects of temporary differences that give rise to significant portions of our deferred tax assets and deferred tax liabilities as of December 31, 2013 and 2012 are as follows:
| 2013 | 2012 | |||||||
| Deferred tax assets: | ||||||||
| Allowances and reserves | $ | 639,000 | $ | 169,000 | ||||
| Accrued expenses | 718,000 | 1,053,000 | ||||||
| Deferred revenue and gain-on-sale | 79,000 | 1,138,000 | ||||||
| Stock based compensation | 6,962,000 | 5,635,000 | ||||||
| Net operating loss carryforwards | 107,846,000 | 87,045,000 | ||||||
| Income tax credit carryforwards | 6,710,000 | 5,729,000 | ||||||
| Property and equipment, principally due to differences in depreciation | 804,000 | 422,000 | ||||||
| Other,net | 296,000 | 295,000 | ||||||
| 124,054,000 | 101,486,000 | |||||||
| Valuation allowance | (122,450,000 | ) | (101,476,000 | ) | ||||
| Total deferred tax assets, net of allowance | 1,604,000 | 10,000 | ||||||
| Deferred tax liabilities: | ||||||||
| Intangibles | (1,604,000 | ) | (10,000 | ) | ||||
| Total deferred tax liability | (1,604,000 | ) | (10,000 | ) | ||||
| Net deferred tax assets (liability) | $ | — | $ | — | ||||
We have established a valuation allowance against our net deferred tax assets due to the uncertainty surrounding the realization of such assets. We periodically evaluate the recoverability of the deferred tax assets. At such time as it is determined that it is more likely than not that deferred assets are realizable, the valuation allowance will be reduced. We have recorded a full valuation allowance of $122,450,000 as of December 31, 2013 as we do not believe it is more likely than not our net deferred tax assets will be realized. We increased our valuation allowance by approximately $20,974,000 during the year ended December 31, 2013. The valuation allowance includes approximately $579,000 related to stock option deductions, the benefit of which, if realized, will eventually be credited to equity and not to income.
At December 31, 2013, we had federal, California, and Massachusetts tax loss carry forwards of approximately $288,010,655, $180,510,359, and $576,000, respectively, prior to reduction for windfall tax benefits. The federal and state net operating loss carry forwards begin to expire in 2019 and 2013 respectively, if unused. At December 31, 2013, we had federal and state tax credit carry forwards of approximately $4,059,910 and $4,015,837, respectively, after reduction for uncertain tax positions. The federal credits will begin to expire in 2018, if unused, and the state credits carry forward indefinitely. In addition, we had a foreign tax loss carry forward of $987,000 in Japan, $1,234,000 in Switzerland, and $98,000 in India. Our Italian subsidiary was dissolved during 2012 and we no longer maintain Italian tax loss carry forwards associated with such entity.
Pursuant to the Internal Revenue Code (“IRC”) of 1986, as amended. The Committee Chairmanamended, specifically IRC §382 and IRC §383, our ability to use net operating loss and R&D tax credit carry forwards (“tax attribute carry forwards”) to offset future taxable income is responsiblelimited if we experience a cumulative change in ownership of more than 50% within a three-year testing period. We have not completed an ownership change analysis pursuant to IRC Section 382 for setting the Committee’s calendar and meeting agenda. Effectivetaxable years ended after December 31, 2007. If ownership changes within the meaning of IRC Section 382 are identified as having occurred subsequent to 2007, the amount of remaining tax attribute carry forwards available to offset future taxable income and income tax expense in future years may be significantly restricted or eliminated. Further, our deferred tax assets associated with such tax attributes could be significantly reduced upon realization of an ownership change within the meaning of IRC §382.
We recognize tax benefits associated with the exercise of stock options directly to stockholders’ equity only when realized. Accordingly, deferred tax assets are not recognized for net operating loss carry forwards resulting from windfall tax benefits. At December 31, 2013, deferred tax assets do not include $1,261,000 of excess tax benefits from stock-based compensation.
We changed our accounting method of accounting for uncertain tax positions on January 1, 2007. We had no unrecognized tax benefits as of the date of adoption.
Following is a tabular reconciliation of the unrecognized tax benefits activity during the years ended December 31, 2013, 2012 Mr. Henriksen retiredand 2011:
| 2013 | 2012 | 2011 | ||||||||||
| Unrecognized Tax Benefits – Beginning | $ | 1,394,000 | $ | 1,304,000 | $ | 1,166,000 | ||||||
| Gross increases – tax positions in prior period | 69,000 | — | — | |||||||||
| Gross decreases – tax positions in prior period | — | — | — | |||||||||
| Gross increase – current-period tax positions | 260,000 | 90,000 | 138,000 | |||||||||
| Settlements | — | — | — | |||||||||
| Lapse of statute of limitations | — | — | — | |||||||||
| Unrecognized Tax Benefits – Ending | $ | 1,723,000 | $ | 1,394,000 | $ | 1,304,000 | ||||||
The unrecognized tax benefit amounts are reflected in the determination of the Company’s deferred tax assets. If recognized, none of these amounts would affect the Company’s effective tax rate, since it would be offset by an equal reduction in the deferred tax asset valuation allowance. The Company does not foresee material changes to its liability for uncertain tax benefits within the next twelve months.
The Company did not recognize interest related to unrecognized tax benefits in interest expense and penalties in operating expenses as of December 31, 2013.
The Company’s material tax jurisdictions are United States and California. To our knowledge, the Company is currently not under examination by the Internal Revenue Service or any other taxing authority.
The Company’s tax years for 1999 and forward can be subject to examination by the United States and California tax authorities due to the carry forward of net operating losses and research development credits.
| 13. | Employee Benefit Plan |
We implemented a 401(k) retirement savings and profit sharing plan (the “Plan”) effective January 1, 1999. We may make discretionary annual contributions to the Plan, which is allocated to the profit sharing accounts based on the number of years of employee service and compensation. At the sole discretion of the Board of Directors, we may also match the participants’ contributions to the Plan. We made no discretionary or matching contributions to the Plan in 2013, 2012 and 2011.
| 14. | Stockholders’ Equity |
Preferred Stock
We have authorized 5,000,000 shares of $.001 par value preferred stock, with no shares outstanding as of December 31, 2013 and 2012. Our Board of Directors is authorized to designate the terms and conditions of any preferred stock we issue without further action by the common stockholders.
Common Stock
In October 2010, we entered into an underwriting agreement with Jefferies & Company, relating to the issuance and sale of 4,600,000 shares of our common stock. This price to the public in this offering was $4.50 per share and the underwriter has agreed to purchase the shares from us at a price of $4.23 per share. The transaction was completed on October 13, 2010 raising approximately $20,700,000 in gross proceeds before deducting underwriting discounts and commissions and other offering expenses payable by us.
On December 13, 2010 we raised $10,000,000 in gross proceeds from a sale of 1,428,571 shares of unregistered common stock to Astellas Pharma Inc. for $7.00 per share in a private stock placement. Pursuant to the terms of the purchase agreement, we granted Astellas Pharma Inc. a two year right of first refusal to enter into a development and commercialization collaboration with us regarding the use of our technology, on a worldwide basis, for the treatment of liver conditions. In addition, we have agreed to use reasonable efforts to file a registration statement with the Securities and Exchange Commission to register the shares of common stock for resale upon the request of Astellas Pharma Inc. We also granted Astellas Pharma Inc. a non-voting observer seat on our Board of Directors and the right to designate a representative member to our Scientific Advisory Board. The $10,000,000 in total proceeds we received exceeded the market value of our stock at the completion of the purchase agreement. The $2,526,000 difference between the proceeds received and the fair market values of our common stock was recorded as a component of deferred revenues in the accompanying balance sheet. This difference was recorded as deferred revenue since, conceptually, the excess proceeds represent a value paid by Astellas Pharma Inc. attributable to the scientific advisory board seat, the non-voting observer seat on our Board of Directors, and the two year right of first refusal to enter into a development and commercialization collaboration with us regarding the use of our technology, on a worldwide basis, for the treatment of liver conditions, rather than an additional equity investment in Cytori. We recognized this deferred amount as development revenue upon the expiration of the two year right of refusal period in December 2012. We are still actively involved in discussions with Astellas Pharma, Inc. about a potential future development and commercialization collaboration with us.
On July 11, 2011, we entered into a common stock purchase agreement with Seaside 88, LP relating to the offering and sale of a total of up to 6,326,262 shares of our common stock. The agreement required us to issue and Seaside to buy 1,326,262 shares of our common stock at an initial closing and 250,000 shares of our common stock once every two weeks, commencing 30 days after the initial closing, for up to an additional 20 closings, subject to the satisfaction of customary closing conditions. At the initial closing, the offering price was $4.52, which equaled 88% of our common stock’s volume-weighted average trading prices, or VWAP, during the ten-day trading period immediately prior to the initial closing date, raising approximately $6,000,000 in gross proceeds. At subsequent closings, the offering price was 90.25% of our common stock’s volume-weighted average trading prices during the ten-day trading period immediately prior to each subsequent closing date. We raised approximately $18,233,000 in gross proceeds from the Compensation Committee.sale of 5,826,262 shares in our scheduled closings through April 9, 2012. Effective, April 30, 2012, we terminated the agreement with Seaside 88, LP and we did not sell the remaining and final 500,000 shares that would otherwise have been sold under this agreement.
In December 2012, we entered into an underwriting agreement with Lazard Capital Markets, LLC (underwriter), relating to the issuance and sale of 7,020,000 shares of our common stock. The price to the public in this offering was $2.85 per share and the underwriter purchased the shares from us at a price of $2.69 per share. The transaction was completed on December 19, 2012 raising approximately $20,007,000 in gross proceeds before deducting underwriting discounts and commissions and other offering expenses payable by us. Under the terms of the underwriting agreement, we granted the underwriter an option, exercisable for 30 days, to purchase up to an additional 1,053,000 shares.
In January 1, 2013, the Compensation Committee consists of David M. Rickey (Chairman), Paul W. Hawranunderwriter exercised this option and Richard J. Hawkins.
In October 2013, we entered into a Common Stock Purchase Agreement with Lorem Vascular for the purchase of 8,000,000 shares at $3.00 per share. The transaction occurred in two separate closings of 4,000,000 shares each. The first closing occurred in November 2013, and the second closing occurred in January 2014. As of December 31, 2013, we received $15,000,000 of the gross proceeds, $12,000,000 for the first closing and $3,000,000 towards the second closing. The balance of $9,000,000 in gross proceeds required to complete the second closing were received in January 2014. In connection with the Common Stock Purchase Agreement, the right to appoint one member of our Board of directors was granted to Mr. K.T. Lim, Chairman of Lorem Vascular. We expect Mr. Lim to appoint a member to serve on our Board of Directors in the second half of 2014.
| 15. | Stockholders Rights Plan |
On May 28, 2003, the Board of Directors declared a dividend distribution of one preferred share purchase right (a “Right”) for each outstanding share of our common stock. The dividend is payable to the discretionstockholders of record on June 10, 2003, and with respect to shares of common stock issued thereafter until the Distribution Date (as defined below) and, in certain circumstances, with respect to shares of common stock issued after the Distribution Date. Except as set forth below, each Right, when it becomes exercisable, entitles the registered holder to purchase from us one one-thousandth (1/1000th) of a share of our Series RP Preferred Stock, $0.001 par value per share (the “Preferred Stock”), at a price of $25.00 per one one-thousandth (1/1000th) of a share of Preferred Stock, subject to adjustment. Each share of the full Board. More specifically,Preferred Stock would entitle the holder to our Compensation Committee establishes base salary ratescommon stock with a value of twice that paid for eachthe Preferred Stock. The description and terms of the Rights are set forth in a Rights Agreement (the “Rights Agreement”) between us and Computershare Trust Company, Inc., as Rights Agent, dated as of May 29, 2003, and as amended on May 12, 2005 and August 28, 2007.
The Rights attach to all certificates representing shares of our common stock outstanding, and are evidenced by a legend on each share certificate, incorporating the Rights Agreement by reference. The Rights trade with and only with the associated shares of our common stock and have no impact on the way in which holders can trade our shares. Unless the Rights Agreement was to be triggered, it would have no effect on the Company’s officers,consolidated balance sheet or income statement and administersshould have no tax effect on the Company or its stockholders. The Rights Agreement is triggered upon the earlier to occur of (i) a person or group of affiliated or associated persons having acquired, without the prior approval of the Board, beneficial ownership of 15% or more (20% or more for certain shareholders) of the outstanding shares of our Amendedcommon stock or (ii) 10 days, or such later date as the Board may determine, following the commencement of or announcement of an intention to make, a tender offer or exchange offer the consummation of which would result in a person or group of affiliated or associated persons becoming an Acquiring Person (as defined in the Rights Agreement) except in certain circumstances (the “Distribution Date”).
The Rights were not exercisable until the Distribution Date and Restatedexpired at the close of business on May 29, 2013.
During 1997, we adopted the 1997 Stock Option and Stock Purchase Plan (the “1997 Plan”), which provides for the direct award or sale of shares and for the grant of incentive stock options (“ISOs”) and non-statutory options to employees, directors or consultants. The 1997 Plan, as amended, provides for the issuance of up to 7,000,000 shares of our common stock. The exercise price of ISOs cannot be less than the fair market value of the underlying shares on the date of grant. ISOs can be granted only to employees. The 1997 Plan expired on October 22, 2007.
During 2004, we adopted the 2004 Equity Incentive Plan (the “2004 Plan”), which provides our Executive Management Incentive Compensationemployees, directors and consultants the opportunity to purchase our common stock through non-qualified stock options, stock appreciation rights, restricted stock units, or restricted stock and cash awards. The 2004 Plan initially provides for issuance of 3,000,000 shares of our common stock, which number may be cumulatively increased (subject to Board discretion) on an annual basis beginning January 1, 2005, which annual increase shall not exceed 2% of our then outstanding stock. As of December 31, 2013, there are 700,647 securities remaining and ouravailable for future issuances under 2004 Plan, which is exclusive of securities to be issued upon an exercise of outstanding options, warrants, and rights.
In August 2011, stockholders approved the 2011 Employee Stock Purchase Plan. This Committee establishes the compensation and benefits for our Chief Executive Officer and other executive officers, and annually reviews the relationship between our performance and our compensation policies as well as assessing any risks associatedPlan (ESPP), with our compensation policies. In addition, this Committee reviews and advises the Board concerning regional and industry-wide compensation practices and trends in order to assess the adequacy of our executive compensation programs. The charter of the Compensation Committee has been established and approved by the Board of Directors, and a copy of the charter has been posted on our website at www.cytori.com under Investor Relations – Corporate Governance.
| 2011/2012 Base Salary | 2012/2013 Base Salary | Target Bonus % | ||||||||||
| Mr. Calhoun | $ | 467,900 | $ | 467,900 | 50 | % | ||||||
| Dr. Hedrick | $ | 406,628 | $ | 406,628 | 40 | % | ||||||
| Mr. Saad | $ | 389,917 | $ | 389,917 | 35 | % | ||||||
Mr. Shirahama (1) | $ | 455,157 | $ | 457, 972 | 25 | % | ||||||
| Mr. Shores | $ | 329,469 | $ | 329,469 | 30 | % | ||||||
| Officer and Position | Target Bonus as a % of Salary | % of Target Bonus Awarded | Bonus Awarded as a % of Salary | Amount of 2012 Bonus Paid in 2013 | ||||||||||||
| Christopher J. Calhoun, | 50 | % | 47 | % | 23.5 | % | $ | 109,956 | ||||||||
| Chief Executive Officer | ||||||||||||||||
| Marc H. Hedrick, | 40 | % | 47 | % | 18.8 | % | $ | 76,446 | ||||||||
| President | ||||||||||||||||
| Mark Saad, | 35 | % | 47 | % | 16.5 | % | $ | 64,141 | ||||||||
| Chief Financial Officer | ||||||||||||||||
| Seijiro N. Shirahama, | 25 | % | 78.5 | % | 19.6 | % | $ | 89,877 | (1) | |||||||
| President – Asia Pacific | ||||||||||||||||
| Clyde Shores, | 30 | % | 65 | % | 19.5 | % | $ | 65,276 | ||||||||
| Executive Vice President Marketing & Sales | ||||||||||||||||
| (a) | (b) | (c) | (d) | (e) | (f) | (g) | (h) | ||||||||||||||||||
| Name and Principal Position | Year | Salary | Stock Awards(1) | Option Awards(2) | Non-Equity Incentive Plan Comp. (3) | All Other Comp-ensation | Total | ||||||||||||||||||
| Christopher J. Calhoun, | 2012 | $ | 467,900 | $ | 293,260 | (10) | $ | 483,996 | $ | 109,956 | — | (5) | $ | 1,355,112 | (8) | ||||||||||
| Chief Executive Officer (PEO) | 2011 | $ | 456,543 | $ | 292,455 | (9) | $ | 252,855 | $ | 140,370 | $ | 10,230 | (4) | $ | 1,152,453 | (8) | |||||||||
| 2010 | $ | 439,713 | $ | 610,980 | $ | 172,623 | — | (5) | $ | 1,223,316 | |||||||||||||||
| Marc H. Hedrick, President | 2012 | $ | 406,627 | $ | 212,764 | (10) | $ | 241,998 | $ | 76,446 | — | (5) | $ | 937,835 | (8) | ||||||||||
| 2011 | $ | 396,758 | $ | 214,467 | (9) | $ | 185,427 | $ | 97,591 | — | (5) | $ | 894,243 | (8) | |||||||||||
| 2010 | $ | 382,131 | — | $ | 448,052 | $ | 115,277 | — | (5) | $ | 945,460 | ||||||||||||||
| Mark E. Saad, | 2012 | $ | 389,917 | $ | 184,040 | (10) | $ | 84,173 | $ | 64,141 | — | (5) | $ | 722,271 | (8) | ||||||||||
| Chief Financial Officer (PFO) | 2011 | $ | 380,453 | $ | 194,970 | (9) | $ | 168,570 | $ | 81,883 | — | (5) | $ | 825,876 | (8) | ||||||||||
| 2010 | $ | 366,428 | — | $ | 407,320 | $ | 109,972 | — | (5) | $ | 883,720 | ||||||||||||||
| Seijiro N. Shirahama, | 2012 | $ | 454,432 | (7) | $ | 178,278 | (10) | $ | 84,173 | $ | 82,843 | — | (5) | $ | 799,726 | (8) | |||||||||
| President – Asia Pacific | 2011 | $ | 441,900 | (7) | $ | 185,221 | (9) | $ | 160,142 | $ | 69,308 | — | (5) | $ | 856,571 | (8) | |||||||||
| 2010 | $ | 381,931 | (7) | — | $ | 386,954 | $ | 87,892 | — | (5) | $ | 856,777 | |||||||||||||
| Clyde W. Shores, | 2012 | $ | 329,469 | $ | 178,278 | (10) | $ | 84,173 | $ | 65,276 | $ | 44,400 | (6) | $ | 701,596 | ||||||||||
| Executive Vice President Marketing & Sales | 2011 | $ | 203,870 | —— | $ | 269,222 | $ | 37,370 | $ | 152,136 | (6) | $ | 662,598 | ||||||||||||
| 2010 | — | — | — | — | — | ||||||||||||||||||||
| (a) | (b) | (c-e | ) | (f) | (g) | (h) | (i) | (j) | |||||||||||||||||||||||||
| Maximum Potential Payouts Under Non-Equity Incentive Plan Awards | All Other Stock Awards: Number of Shares of Stock or Units | All Other Option Awards: Number of Securities Underlying Options | Exercise or Base Price of Option Awards | Market Price on Date of Grant | Full Grant Date Fair Value of Stock and Option Awards | ||||||||||||||||||||||||||||
| Named Officers | Grant | Thre-shold | Target | Maxi- mum | |||||||||||||||||||||||||||||
| Date | ($) | ($) | ($) | (# | )(3) | (# | ) | ($/Sh) | ($/Sh) | ($)(1) | |||||||||||||||||||||||
| Christopher J. Calhoun, | 1/26/2012 | – | $ | 233,950 | – | 85,250 | 230,000 | $ | 3.44 | $ | 3.44 | $ | 777,256 | ||||||||||||||||||||
| Chief Executive Officer | |||||||||||||||||||||||||||||||||
| Marc H. Hedrick, | 1/26/2012 | $ | 162,651 | – | 61,850 | 115,000 | $ | 3.44 | $ | 3.44 | $ | 454,762 | |||||||||||||||||||||
| President | |||||||||||||||||||||||||||||||||
| Mark E. Saad, | 1/26/2012 | – | $ | 136,471 | – | 53,500 | 40,000 | $ | 3.44 | $ | 3.44 | $ | 268,213 | ||||||||||||||||||||
| Chief Financial Officer | |||||||||||||||||||||||||||||||||
| Seijiro N. Shirahama, | 1/26/2012 | – | $ | 113,789 | (2) | – | 51,825 | 40,000 | $ | 3.44 | $ | 3.44 | $ | 262,451 | |||||||||||||||||||
| President – Asia Pacific | |||||||||||||||||||||||||||||||||
| Clyde W. Shores, | 1/26/2012 | – | $ | 98,841 | – | 51,825 | 40,000 | $ | 3.44 | $ | 3.44 | $ | 262,451 | ||||||||||||||||||||
| Executive Vice President Marketing & Sales | |||||||||||||||||||||||||||||||||
Stock Options
Generally, options issued under the 2004 Plan or the 1997 Plan are subject to four-year vesting, and have a contractual term of ten years and vest in equal monthly installments over a period10 years. Most options contain one of four years, subject to the NEO’s continued service to the Company.following two vesting provisions:
| (a) | (b) | (c) | (d) | (e) | (f) | (g) | (h) | |||||||||||||||
| Option Awards | Stock Awards | |||||||||||||||||||||
| Name | Option Grant Date (1) | Number of Securities Underlying Unexercised Options (#) Exercisable | Number of Securities Underlying Unexercised Options (#) Un-Exercisable (2) | Option Exercise Price ($) | Option Ex-piration Date | Number of Shares or Units of Stock That Have Not Vested (#)(3) | Market Value of Shares or Units of Stock That Have Not Vested ($) | |||||||||||||||
| Christopher J. | 1/28/2003 | 200,000 | — | $ | 4.40 | 1/28/2013 | — | — | ||||||||||||||
| Calhoun, | 6/2/2004 | 75,000 | — | $ | 4.16 | 6/2/2014 | — | — | ||||||||||||||
| Chief Executive | 2/2/2005 | 100,000 | — | $ | 3.12 | 2/2/2015 | — | — | ||||||||||||||
| Officer | 1/24/2006 | 100,000 | — | $ | 7.04 | 1/24/2016 | — | — | ||||||||||||||
| 2/26/2007 | 70,000 | — | $ | 5.44 | 2/26/2017 | — | — | |||||||||||||||
| 1/31/2008 | 85,000 | — | $ | 5.14 | 1/31/2018 | — | — | |||||||||||||||
| 1/29/2009 | 97,915 | 2,085 | $ | 4.80 | 1/29/2019 | — | — | |||||||||||||||
| 2/5/2010 | 106,248 | 43,752 | $ | 6.71 | 2/5/2020 | — | — | |||||||||||||||
| 1/27/2011 | 35,937 | 39,063 | $ | 5.57 | 1/27/2021 | — | — | |||||||||||||||
| 1/26/2012 | 52,708 | 177,292 | $ | 3.44 | 1/26/2022 | 85,250 | $ | 293,260 | ||||||||||||||
| Marc H. Hedrick, | 1/28/2003 | 25,000 | — | $ | 4.40 | 1/28/2013 | — | — | ||||||||||||||
| President | 6/2/2004 | 50,000 | — | $ | 4.16 | 6/2/2014 | — | — | ||||||||||||||
| 2/2/2005 | 70,000 | — | $ | 3.12 | 2/2/2015 | — | — | |||||||||||||||
| 1/24/2006 | 70,000 | — | $ | 7.04 | 1/24/2016 | — | — | |||||||||||||||
| 2/26/2007 | 50,000 | — | $ | 5.44 | 2/26/2017 | — | — | |||||||||||||||
| 1/31/2008 | 60,000 | — | $ | 5.14 | 1/31/2018 | — | — | |||||||||||||||
| 1/29/2009 | 73,436 | 1,564 | $ | 4.80 | 1/29/2019 | — | — | |||||||||||||||
| 2/5/2010 | 77,915 | 32,085 | $ | 6.71 | 2/5/2020 | — | — | |||||||||||||||
| 1/27/2011 | 26,354 | 28,646 | $ | 5.57 | 1/27/2021 | — | — | |||||||||||||||
| 1/26/2012 | 26,354 | 88,646 | $ | 3.44 | 1/26/2022 | 61,850 | $ | 212,764 | ||||||||||||||
| Mark E. Saad, | 6/21/2004 | 190,000 | — | $ | 4.12 | 6/21/2014 | — | — | ||||||||||||||
| Chief Financial | 2/2/2005 | 70,000 | — | $ | 3.12 | 2/2/2015 | — | — | ||||||||||||||
| Officer | 1/24/2006 | 70,000 | — | $ | 7.04 | 1/24/2016 | — | — | ||||||||||||||
| 2/26/2007 | 50,000 | — | $ | 5.44 | 2/26/2017 | — | — | |||||||||||||||
| 1/31/2008 | 55,000 | — | $ | 5.14 | 1/31/2018 | — | — | |||||||||||||||
| 1/29/2009 | 68,541 | 1,459 | $ | 4.80 | 1/29/2019 | — | — | |||||||||||||||
| 2/5/2010 | 70,832 | 29,168 | $ | 6.71 | 2/5/2020 | — | — | |||||||||||||||
| 1/27/2011 | 23,958 | 26,042 | $ | 5.57 | 1/27/2021 | — | — | |||||||||||||||
| 1/26/2012 | 9,167 | 30,883 | $ | 3.44 | 1/26/2022 | 53,500 | $ | 184,040 | ||||||||||||||
| Seijiro N. | 6/2/2004 | 25,000 | — | $ | 4.16 | 6/2/2014 | — | — | ||||||||||||||
| Shirahama, | 2/2/2005 | 35,000 | — | $ | 3.12 | 2/2/2015 | — | — | ||||||||||||||
| President – Asia | 12/8/2005 | 50,000 | — | $ | 6.86 | 12/8/2015 | — | — | ||||||||||||||
| Pacific | 1/24/2006 | 35,000 | — | $ | 7.04 | 1/24/2016 | — | — | ||||||||||||||
| 2/26/2007 | 30,000 | — | $ | 5.44 | 2/26/2017 | — | — | |||||||||||||||
| 11/15/2007 | 25,000 | — | $ | 5.35 | 11/15/2017 | — | — | |||||||||||||||
| 1/31/2008 | 55,000 | — | $ | 5.14 | 1/31/2018 | — | — | |||||||||||||||
| 1/29/2009 | 63,645 | 1,355 | $ | 4.80 | 1/29/2019 | — | — | |||||||||||||||
| 2/5/2010 | 67,291 | 27,709 | $ | 6.71 | 2/5/2020 | — | — | |||||||||||||||
| 1/27/2011 | 22,760 | 24,740 | $ | 5.57 | 1/27/2021 | — | — | |||||||||||||||
| 1/26/2012 | 9,167 | 30,883 | $ | 3.44 | 1/26/2022 | 51,825 | $ | 178,278 | ||||||||||||||
| Clyde W. Shores, | 5/19/2011 | 32,656 | 49,844 | $ | 5.37 | 5/19/2021 | — | — | ||||||||||||||
| Executive Vice | 1/26/2012 | — | 40,000 | $ | 3.44 | 1/26/2022 | 51,825 | $ | 178,278 | |||||||||||||
| President | ||||||||||||||||||||||
| Marketing & Sales | ||||||||||||||||||||||
| 1/48 of the award |
| Options | Weighted Average Exercise Price | |||||||
| Balance as of January 1, 2013 | 6,744,986 | $ | 5.02 | |||||
| Granted | 2,548,950 | $ | 3.23 | |||||
| Exercised | (17,500 | ) | $ | 2.14 | ||||
| Expired | (499,586 | ) | $ | 4.28 | ||||
| Cancelled/forfeited | (454,561 | ) | $ | 4.55 | ||||
| Balance as of December 31, 2013 | 8,322,289 | $ | 4.55 | |||||
| Options | Weighted Average Exercise Price | Weighted Average Remaining Contractual Term (years) | Aggregate Intrinsic Value | |||||||||||||
| Balance as of December 31, 2013 | 8,322,289 | $ | 4.55 | 6.10 | $ | 148,817 | ||||||||||
| Vested and expected to vest at December 31, 2013 | 8,277,773 | $ | 4.56 | 6.09 | $ | 147,931 | ||||||||||
| Exercisable at December 31, 2013 | 5,718,096 | $ | 5.05 | 4.88 | $ | 111,654 | ||||||||||
The following table sets forth information regardingtotal intrinsic value of stock options exercised was $3,500, $311,000 and $541,000 for the years ended December 31, 2013, 2012 and 2011, respectively.
The fair value of each option awarded during the year ended December 31, 2013, 2012 and 2011 was estimated on the date of grant using the Black-Scholes-Merton option valuation model based on the following weighted-average assumptions:
| Years ended December 31, | ||||||||||||
| 2013 | 2012 | 2011 | ||||||||||
| Expected term | 6.0 years | 5.20 years | 5.5 years | |||||||||
| Risk-free interest rate | 1.12 | % | 0.83 | % | 1.95 | % | ||||||
| Volatility | 75.27 | % | 75.63 | % | 72.36 | % | ||||||
| Dividends | — | — | — | |||||||||
| Resulting weighted average grant date fair value | $ | 1.72 | $ | 1.96 | $ | 3.24 | ||||||
We calculated the expected term of our stock options based on our historical data. The expected term is calculated for and applied to all employee awards as a single group as we do not expect (nor does historical data suggest) substantially different exercise or post-vesting termination behavior amongst our employee population.
We estimate volatility based on the historical volatility of our daily stock price over the period preceding grant date commensurate with the expected term of the option.
The weighted average risk-free interest rate represents the interest rate for treasury constant maturity instruments published by the Federal Reserve Board. If the term of available treasury constant maturity instruments is not equal to the expected term of an employee option, we use the weighted average of the two Federal Reserve securities closest to the expected term of the employee option.
The dividend yield has been assumed to be zero as we (a) have never declared or paid any dividends and (b) do not currently anticipate paying any cash dividends on our outstanding shares of common stock acquired uponin the foreseeable future.
Restricted Stock Awards
Generally, restricted stock awards issued under the 2004 Plan are subject to a vesting by our Named Executive Officers during the fiscal ended December 31, 2012:
| (a) | (b) | (c) | (d) | (e) | ||||||||||||
| Option Awards | Stock Awards | |||||||||||||||
| Name | Number of Shares Acquired on Exercise (#) | Value Realized on Exercise ($) | Number of Shares Acquired on Vesting (#) | Value Realized on Vesting ($) | ||||||||||||
| Christopher J. Calhoun, | 205,000 | (1) | $ | 187,477 | (2) | — | — | |||||||||
| Chief Executive Officer | ||||||||||||||||
| Marc H. Hedrick, | — | — | — | — | ||||||||||||
| President | ||||||||||||||||
| Mark E. Saad, | — | — | — | — | ||||||||||||
| Chief Financial Officer | ||||||||||||||||
| Seijiro N. Shirahama, | — | — | — | — | ||||||||||||
| President – Asia Pacific | ||||||||||||||||
| Clyde W. Shores, | — | — | — | — | ||||||||||||
| Executive Vice President Marketing & Sales | ||||||||||||||||
Change in Control(2) | Termination Following Change in Control(3) | |||||||
PAYMENTS DUE UPON ACQUISITION / TERMINATION(1): | ||||||||
| Cash Severance | ||||||||
Base Salary(4) | $ | — | $ | 701,850 | ||||
| Benefits | ||||||||
| COBRA Premiums | — | $ | 31,700 | |||||
| Long-Term Incentives | ||||||||
Value of Accelerated Stock Options(5) | $ | — | $ | |||||
| TOTAL VALUE | $ | — | $ | 733,550 | ||||
Change in Control (2) | Termination Following Change in Control (3) | |||||||
PAYMENTS DUE UPON ACQUISITION / TERMINATION(1): | ||||||||
| Cash Severance | ||||||||
Base Salary(4) | $ | — | $ | 406,628 | ||||
| Benefits | ||||||||
| COBRA Premiums | — | $ | 21,200 | |||||
| Long-Term Incentives | ||||||||
Value of Accelerated Stock Options(5) | $ | — | $ | — | ||||
| TOTAL VALUE | $ | — | $ | 427,828 | ||||
Change in Control (2) | Termination Following Change in Control (3) | |||||||
PAYMENTS DUE UPON ACQUISITION / TERMINATION(1): | ||||||||
| Cash Severance | ||||||||
Base Salary(4) | $ | — | $ | 389,917 | ||||
| Benefits | ||||||||
| COBRA Premiums | — | $ | 21,200 | |||||
| Long-Term Incentives | ||||||||
Value of Accelerated Stock Options(5) | $ | — | $ | — | ||||
| TOTAL VALUE | $ | — | $ | 411,117 | ||||
Change in Control (2) | Termination Following Change in Control (3) | |||||||
PAYMENTS DUE UPON ACQUISITION / TERMINATION(1): | ||||||||
| Cash Severance | ||||||||
Base Salary(4) | $ | — | $ | 454,432 | ||||
| Benefits | ||||||||
| COBRA Premiums | — | $ | 21,200 | |||||
| Long-Term Incentives | ||||||||
Value of Accelerated Stock Options(5) | $ | — | $ | — | ||||
| TOTAL VALUE | $ | — | $ | 475,632 | ||||
Change in Control (2) | Termination Following Change in Control (3) | |||||||
PAYMENTS DUE UPON ACQUISITION / TERMINATION(1): | ||||||||
| Cash Severance | ||||||||
Base Salary(4) | $ | — | $ | 329,469 | ||||
| Benefits | ||||||||
| COBRA Premiums | — | $ | 21,200 | |||||
| Long-Term Incentives | ||||||||
Value of Accelerated Stock Options(5) | $ | — | $ | — | ||||
| TOTAL VALUE | $ | — | $ | 350,669 | ||||
| (a) | (b) | (c) | (d) | (e) | ||||||||||||
Director Name(1) | Fees Earned or Paid in Cash(2) ($) | Stock Awards(3) ($) | Option Awards(4)(5) ($) | Total ($) | ||||||||||||
| Lloyd H. Dean, | $ | 69,000 | $ | 22,000 | $ | 20,233 | $ | 111,233 | ||||||||
| Chairman | ||||||||||||||||
| Richard J. Hawkins | $ | 59,500 | $ | 22,000 | $ | 20,233 | $ | 101,733 | ||||||||
| Paul W. Hawran | $ | 72,000 | $ | 22,000 | $ | 20,233 | $ | 114,233 | ||||||||
Ronald D. Henriksen(6) | $ | 56,000 | $ | 22,000 | $ | 20,233 | $ | 98,233 | ||||||||
| E. Carmack Holmes, MD | $ | 41,000 | $ | 22,000 | $ | 20,233 | $ | 83,233 | ||||||||
| David M. Rickey | $ | 65,000 | $ | 22,000 | $ | 20,233 | $ | 107,233 | ||||||||
| Tommy Thompson | $ | 40,000 | $ | 22,000 | $ | 20,233 | $ | 82,233 | ||||||||
| Equity Compensation Paid to Directors for Fiscal Year 2012 | |||||||||||||||||||||
| (a) | (b) | (c) | (d) | (e) | (f) | (g) | |||||||||||||||
Director Name | Grant Date | Option Awards (#) | Grant Date Fair Value of Option Awards ($) | Stock Awards (#) | Grant Date Fair Value of Stock Awards ($) | Total Value of Equity Awards for 2012 ($) | |||||||||||||||
| Lloyd H. Dean, | 1/1/2012 | 15,000 | $ | 20,233 | (1) | 10,000 | $ | 22,000 | (2) | $ | 42,233 | ||||||||||
| Chairman | |||||||||||||||||||||
| Richard J. Hawkins | 1/1/2012 | 15,000 | $ | 20,233 | (1) | 10,000 | $ | 22,000 | (2) | $ | 42,233 | ||||||||||
| Paul W. Hawran | 1/1/2012 | 15,000 | $ | 20,233 | (1) | 10,000 | $ | 22,000 | (2) | $ | 42,233 | ||||||||||
| Ronald D. Henriksen | 1/1/2011 | 15,000 | $ | 20,233 | (1) | 10,000 | $ | 22,000 | (2) | $ | 42,233 | ||||||||||
| E. Carmack Holmes, MD | 1/1/2012 | 15,000 | $ | 20,233 | (1) | 10,000 | $ | 22,000 | (2) | $ | 42,233 | ||||||||||
| David M. Rickey | 1/1/2011 | 15,000 | $ | 20,233 | (1) | 10,000 | $ | 22,000 | (2) | $ | 42,233 | ||||||||||
| Tommy Thompson | 1/1/2012 | 15,000 | $ | 20,233 | (1) | 10,000 | $ | 22,000 | (2) | $ | 42,233 | ||||||||||
Restricted Stock Awards | Weighted Average Grant Date Fair Value | |||||||
| Balance as of January 1, 2013 | 294,741 | $ | 3.55 | |||||
| Granted | 57,600 | $ | 2.60 | |||||
| Exercised/Released | (236,000 | ) | $ | 3.29 | ||||
| Cancelled/forfeited | (10,000 | ) | $ | 3.44 | ||||
| Balance as of December 31, 2013 | 106,341 | $ | 3.62 | |||||
Restricted Stock Awards | Weighted Average Grant Date Fair Value | Weighted Average Remaining Contractual Term (years) | ||||||||||
| Balance as of December 31, 2013 | 106,341 | $ | 3.62 | 8.45 | ||||||||
| Vested and expected to vest at December 31, 2013 | 106,341 | $ | 3.62 | 8.45 | ||||||||
| Exercisable at December 31, 2013 | 85,341 | $ | 3.95 | 8.13 | ||||||||
We granted 246,225 performance-based restricted stock awards under the 2004 Equity Incentive Plan in February 2011. The awards provide certain employees until January 1, 2012 to achieve certain performance goals established by the Compensation Committee. Effective January 2012, the outstanding awards were terminated in their entirety based upon the decision by the Compensation Committee that performance criteria had not been met as of January 1, 2012. No compensation expense was recognized related to these awards.
In January 2012, we granted 276,375 performance-based restricted stock awards under the 2004 Equity Incentive Plan. The awards provide certain employees until December 31, 2012 to achieve certain performance goals established by the Compensation Committee. Once earned, the awards remain unvested until January 10, 2014. Termination of employment prior to vesting will result in the forfeiture of the awards.
In January 2013, the Compensation Committee modified the awards to allow a portion of the awards to continue vesting based on partial achievement of certain performance goals. As a result of this modification, 86,229 shares with fair value of $2.74 per share will continue vesting under the modified terms of the grant that would have been cancelled under the original terms. Additional compensation expense $236,000 resulting from this modification will be recognized from the modification date through the vesting date of January 2014.
We recognized $344,000 and $107,000 of compensation expense related to performance-based awards during the years ended December 31, 2013 and 2012, respectively.
The following table sets forth information regarding ownershipsummarizes activity with respect to the performance based restricted stock awards during the year ended December 31, 2013:
Restricted Stock Awards | Weighted Average Grant- Date Fair Value | |||||||
| Outstanding at January 1, 2013 | 261,300 | $ | 3.44 | |||||
| Granted | — | — | ||||||
| Vested | — | — | ||||||
| Cancelled/forfeited | (109,749 | ) | $ | 3.44 | ||||
| Outstanding at December 31, 2013 | 151,551 | $ | 3.44 | |||||
| Vested at December 31, 2013 | — | — | ||||||
The following summarizes the total compensation cost recognized for the stock options and restricted stock awards in the accompanying financial statements:
| Years ended December 31, | ||||||||||||
| 2013 | 2012 | 2011 | ||||||||||
| Total compensation cost for share-based payment arrangements recognized in the statement of operations (net of tax of $0) | $ | 3,608,000 | $ | 3,904,000 | $ | 3,316,000 | ||||||
As of our Common Stock as of MarchDecember 31, 2013, (or earlier datethe total compensation cost related to non-vested stock options and stock awards not yet recognized for information based on filings with the SEC) by (a) each person knownall our plans is approximately $4,810,000. Of this amount, $4,725,000 is expected to us to own more than 5% of the outstanding shares of our Common Stock, (b) each director and nominee for director, (c) our Chief Executive Officer, President, Chief Financial Officer and each other executive officer named in the compensation tables appearing in Item 11 and (d) all directors and executive officersbe recognized as a group. The informationresult of vesting under service conditions over a weighted average period of 1.81 years.
As of December 31, 2012, the total compensation cost related to non-vested stock options and stock awards not yet recognized for all our plans is approximately $4,593,000. Of this amount, $3,918,000 is expected to be recognized as a result of vesting under service conditions over a weighted average period of 1.56 years.
Cash received from stock option and warrant exercises and employee stock purchase for the years ended December 31, 2013, 2012 and 2011 was approximately $225,000, $1,413,000 and $2,849,000, respectively. No income tax benefits have been recorded related to the stock option exercises as the benefits have not been realized in this table is based solely on statements in filings with the SEC or other reliable information. A total of 67,173,050our income tax returns.
To settle stock options and restricted stock awards, we will issue new shares of our common stock were issuedstock. At December 31, 2013, we have an aggregate of 64,739,929 shares authorized and outstanding as of March 31, 2013.
Name and Address of Beneficial Owner (1) | Number of Shares of Common Stock Owned (2) | Number of Shares of Common Stock Subject to Options/Warrants Exercisable Within 60 Days (3) | Total Number of Shares of Common Stock Beneficially Owned (4) | Percent Ownership | ||||||||||||
| Olympus Corporation | 4,013,043 | 787,037 | 4,800,080 | 7.1 | % | |||||||||||
| Shinjuku Monolith, 3-1 Nishi- | ||||||||||||||||
| Shinjuku 2-Chome, Shinjuku-ku, | ||||||||||||||||
| Tokyo 163-0914, Japan | ||||||||||||||||
BlackRock, Inc.(5) | 3,801,494 | 3,801,494 | 5.7 | % | ||||||||||||
40 East 52nd Street | ||||||||||||||||
| New York, NY 10022 | ||||||||||||||||
| Christopher J. Calhoun | 154,975 | 795,727 | 950,702 | 1.4 | % | |||||||||||
| Marc H. Hedrick, MD | 500,338 | 586,977 | 1,087,315 | 1.6 | % | |||||||||||
| Mark E. Saad | 119,000 | 642,811 | 761,811 | 1.1 | % | |||||||||||
| Seijiro N. Shirahama | 30,200 | 446,039 | 476,239 | * | ||||||||||||
| Clyde W. Shores | 20,000 | 63,958 | 83,958 | * | ||||||||||||
| David M. Rickey | 311,569 | 141,017 | 452,586 | * | ||||||||||||
| Ronald D. Henriksen | 70,092 | 38,500 | 108,592 | * | ||||||||||||
| E. Carmack Holmes, MD | 37,401 | 241,017 | 278,418 | * | ||||||||||||
| Paul W. Hawran | 81,610 | 191,017 | 272,627 | * | ||||||||||||
| Richard J. Hawkins | 20,085 | 116,017 | 136,102 | * | ||||||||||||
| Lloyd H. Dean | 71,000 | 37,017 | 108,017 | * | ||||||||||||
| Tommy Thompson | 3,050 | 63,017 | 66,067 | * | ||||||||||||
| All executive officers and directors as a group (12) | 1,419,320 | 3,363,114 | 4,782,434 | 6.8 | % | |||||||||||
During the year ended December 31, 2013, 2012 there has not been any transaction or series of similar transactions to which we were or are a party in which the amount involved exceeded or exceeds $120,000 and in which any of our directors or executive officers, any holder of more than 5% of any class of our voting securities or any member of the immediate family of any of the foregoing persons had or will have a direct or indirect material interest, other than the compensation arrangements described herein and as otherwise set forth below.
As of Directors, the Audit Committee, or some other committee consistingDecember 31, 2013, Lorem Vascular Pty. Ltd. (Lorem) was a beneficial owner of all independent directors, as the case may be. In general, transactions with holdersmore than five percent of our securities covered by Item 403(a)outstanding shares of Regulation S-K will be reviewedcommon stock. During the year ended December 31, 2013 Lorem purchased Celution® Systems and approved by our full Boardconsumable sets from us for a total of Directors, so long as none of our directors or executive officers or their family members have a material interest in such transaction. Related parties include any of our directors or executive officers, certain of our stockholders and their immediate family members. This obligation is set forth in writing in our Governance and Nominating Committee Charter. A copy of the Governance and Nominating Committee Charter is available at www.cytori.com under Investor Relations – Corporate Governance.
| Subsequent Events |
| 2012 | 2011 | |||||||
Audit fees (1) | $ | 547,568 | $ | 530,734 | ||||
Audit related fees (2) | $ | 88,800 | 40,000 | |||||
Tax Fees (3) | 71,524 | 191,204 | ||||||
All other fees (4) | — | — | ||||||
| Total | $ | 707,892 | $ | 761,938 | ||||
The following unaudited quarterly financial information includes, in management’s opinion, all the normal and recurring adjustments necessary to fairly state the results of operations and related information for the periods presented.
| For the three months ended | ||||||||||||||||
March 31, 2013 | June 30, 2013 | September 30, 2013 | December 31, 2013 | |||||||||||||
| Product revenues | $ | 1,392,000 | $ | 1,408,000 | $ | 1,616,000 | $ | 2,706,000 | ||||||||
| Gross profit | 636,000 | 800,000 | 685,000 | 1,580,000 | ||||||||||||
| Development revenues | 2,366,000 | 859,000 | 1,095,000 | 754,000 | ||||||||||||
| Operating expenses | 9,739,000 | 8,022,000 | 10,241,000 | 11,452,000 | ||||||||||||
| Other income (expense) | (930,000 | ) | 3,152,000 | 3,203,000 | (923,000 | ) | ||||||||||
| Net loss | $ | (7,667,000 | ) | $ | (3,211,000 | ) | $ | (5,258,000 | ) | $ | (10,041,000 | ) | ||||
| Basic and diluted net loss per share | $ | (0.11 | ) | $ | (0.05 | ) | $ | (0.08 | ) | $ | (0.14 | ) | ||||
| For the three months ended | ||||||||||||||||
March 31, 2012 | June 30, 2012 | September 30, 2012 | December 31, 2012 | |||||||||||||
| Product revenues | $ | 1,481,000 | $ | 1,947,000 | $ | 1,314,000 | $ | 3,967,000 | ||||||||
| Gross profit | 628,000 | 915,000 | 611,000 | 2,555,000 | ||||||||||||
| Development revenues | 3,000 | 2,429,000 | 2,000 | 3,358,000 | ||||||||||||
| Operating expenses | 8,996,000 | 10,304,000 | 10,945,000 | 8,674,000 | ||||||||||||
| Other income (expense) | (960,000 | ) | (923,000 | ) | (916,000 | ) | (1,062,000 | ) | ||||||||
| Net loss | $ | (9,325,000 | ) | $ | (7,883,000 | ) | $ | (11,248,000 | ) | $ | (3,823,000 | ) | ||||
| Basic and diluted net loss per share | $ | (0.16 | ) | $ | (0.13 | ) | $ | (0.19 | ) | $ | (0.06 | ) | ||||
Not applicable.
| (a) | Evaluation of |
We maintain disclosure controls and procedures that are designed to ensure that information required to be disclosed in our reports filed or furnished pursuant to the Exchange Act is recorded, processed, summarized and reported within the time periods specified in the Securities and Exchange Commission’s rules and forms, and that such information is accumulated and communicated to our management, including our Chief Executive Officer and Chief Financial Officer, as appropriate, to allow for timely decisions regarding required disclosure. In designing and evaluating the disclosure controls and procedures, management recognizes that any controls and procedures, no matter how well designed and operated, can provide only reasonable assurance of achieving the desired control objectives, and management necessarily is required to apply its judgment in evaluating the cost-benefit relationship of possible controls and procedures.
As required by Rule 13a-15(b) under the Exchange Act, we carried out an evaluation, under the supervision and with the participation of our management, including our Chief Executive Officer and Chief Financial Officer, of the effectiveness of our disclosure controls and procedures, as such term is defined under Rule 13a-15(e) promulgated under the Securities Exchange Act of 1934, as amended, as of the end of the period covered by this Annual Report on Form 10-K. Based on the foregoing, our Chief Executive Officer and Chief Financial Officer concluded that our disclosure controls and procedures as of the end of the period covered by this Annual Report were not effective due to the material weakness described below in Management’s Report on Internal Control Over Financial Reporting.
| (b) | Management’s Report on Internal Control Over Financial Reporting |
Our management is responsible for establishing and maintaining adequate internal control over financial reporting. Internal control over financial reporting is defined in Rule 13a-15(f) or 15d-15(f) under the Securities Exchange Act of 1934 as a process designed by, or under the supervision of, the Company’s principal executive and principal financial officers and effected by the Company’s Board of Directors, management and other personnel, to provide reasonable assurance regarding the reliability of financial reporting and the preparation of financial statements for external purposes in accordance with generally accepted accounting principles and includes those policies and procedures that:
| · | Pertain to the |
| Provide reasonable assurance that transactions are recorded as necessary to permit preparation of |
| · | Provide reasonable assurance regarding prevention or |
Based on our evaluation, management concluded that our internal control over financial reporting was not effective as of December 31, 2013 because a material weakness existed in our internal controls related to the recognition and measurement of revenue in accordance with U.S. generally accepted accounting principles. Specifically, our controls did not operate effectively to aggregate and communicate information necessary to (i) verify that the collection of accounts receivable was reasonably assured and (ii) evaluate whether contractual provisions were satisfied in order to recognize revenue. The audit committeeCompany's management has adopteddetermined that these control deficiencies, in the aggregate, constitute a policy and procedures formaterial weakness that resulted in material errors in product revenues in our 2013 annual consolidated financial statements, which were corrected prior to issuance of the pre-approval of audit and non-audit services rendered by ourCompany’s consolidated financial statements.
Our independent registered public accounting firm, KPMG LLP. TheLLP, has issued an adverse audit committee generally pre-approves specified servicesreport on the effectiveness of our internal control over financial reporting as of December 31, 2013, which is included herein.
| (c) | Changes in Internal Control over Financial Reporting |
There have been no changes in our internal control over financial reporting during the defined categories of audit services, audit-related services, tax services and all other fees upquarter ended December 31, 2013 that have materially affected, or are reasonably likely to specified amounts. Pre-approval may also be given as part of the audit committee’s approval of the scope of the engagement of the independent registered public accounting firm or on an individual explicit case-by-case basis before the independent registered public accounting firm is engaged to provide each service. All of the independent audit fees were pre-approved by the audit committee and no services were performedmaterially affect, our internal control over financial reporting other than by KPMG LLP. The chairman of the audit committee has been delegatedmaterial weakness described above.
| (d) | Remediation of Material Weakness |
We are currently taking steps to enhance our revenue recognition policies and procedures and remediate the authority to grant pre-approval under the pre-approval policy. Any approval by the chairman under this authority is reported to the audit committee at its next regular meeting.material weakness in our internal control over financial reporting, including in particular:
| 1. | Reevaluating our processes for the recognition of revenue at our Japan subsidiary. |
| 2. | Relocating to our Japan subsidiary a qualified individual with appropriate experience to assist with our review of revenue arrangements in accordance with U.S. generally accepted accounting principles and to help facilitate better communication with our Japan subsidiary. |
| 3. | Enhancing our assessment of collectability over our customers to ensure that adequate evidence of collectability is obtained prior to the recognition of revenue. |
material weakness described above.
None.
PART III
The information called for by Item 10 is incorporated herein by reference to the material under the captions “Election of Directors” and “Directors, Executive Officers and Corporate Governance” in our Definitive Proxy Statement for our 2014 Annual Meeting of Stockholders, to be filed with SEC on or before April 30, 2014 (the “2014 Proxy Statement”).
The information called for by Item 11 is incorporated herein by reference to the material under the caption “Executive Compensation” in our 2014 Proxy Statement.
Item 12. Security Ownership of Certain Beneficial Owners and Management and Related Stockholder Matters
The information called for by Item 12 is incorporated herein by reference to the material under the caption “Security Ownership of Certain Beneficial Owners and Management” in our 2014 Proxy Statement.
The information called for by Item 13 is incorporated herein by reference to the material under the caption “Information Concerning Directors and Executive Officers- Certain Relationships and Related Transactions” in our 2014 Proxy Statement.
The information called for by Item 14 is incorporated herein by reference to the material under the caption “Principal Accountant Fees and Services” in our 2014 Proxy Statement.
PART IV
| (a) (1) |
| Page | |||
| Reports of KPMG LLP, Independent Registered Public Accounting Firm | 40 | ||
| Consolidated Balance Sheets as of December 31, | 42 | ||
| Consolidated Statements of Operations and Comprehensive Loss for the | 43 | |||
| Consolidated Statements of Stockholders’ Equity | 44 | |||
| Consolidated Statements of Cash Flows for the | 45 | |||
| Notes to Consolidated Financial Statements | 47 | |||
(a) (2) |
Balance at beginning of year | Additions (A) | Deductions (B) | Other (C) | Balance at end of year | ||||||||||||||||
Allowance for doubtful accounts | ||||||||||||||||||||
| Year ended December 31, 2013 | $ | 278 | $ | 1,141 | $ | (16 | ) | $ | 42 | $ | 1,445 | |||||||||
| Year ended December 31, 2012 | $ | 474 | $ | 144 | $ | ( 313 | ) | $ | (27 | ) | $ | 278 | ||||||||
| Year ended December 31, 2011 | $ | 306 | $ | 483 | $ | (256 | ) | $ | (59 | ) | $ | 474 | ||||||||
| (A) | ||
| (B) | Includes deductions for uncollectible accounts receivable, net of any equipment recovered |
| (C) | Miscellaneous activity for product sales recognized on a cash basis |
Table of Contents
| (a)(3) | Exhibits |
| CYTORI THERAPEUTICS, INC. | |||||
| EXHIBIT INDEX | |||||
Exhibit Number | Exhibit Title | Filed with this Form 10-K | Incorporated by Reference | ||
| Form | File No. | Date Filed | |||
| 3.1 | 333-192409 Exhibit 4.1 | ||||
| 3.2 | Amended and Restated Bylaws of Cytori Therapeutics, Inc. | 10-Q | 000-32501 Exhibit 3.2 | 08/14/2003 | |
| 4.2 | Form of Warrant. | 8-K | 000-32501 Exhibit 4.2 | 03/10/2009 | |
| 4.3 | Form of Warrant to be dated February 28, 2007. | 8-K | 000-32501 Exhibit 10.4 | 02/26/2007 | |
| 4.4 | Form of Warrant to Purchase Common Stock issued on August 11, 2008 pursuant to | ||||
| the Securities Purchase Agreement, dated August 7, 2008, by and among the Company and the Purchasers identified on the signature pages thereto. | 8-K | 000-32501 Exhibit 10.34 | 08/08/2008 | ||
| 4.5 | Registration Rights Agreement, dated August 7, 2008, by and among the Company | ||||
| and the Purchasers identified on the signature pages thereto. | 8-K | 000-32501 Exhibit 10.35 | 08/08/2008 | ||
| 4.6 | Warrant to Purchase Common Stock issued by the Company on October 14, 2008 in | ||||
| favor of GE Capital Equity Investments, Inc., pursuant to the Loan and Security Agreement dated October 14, 2008. | 10-K | 000-32501 Exhibit 10.61 | 03/06/2009 | ||
| 4.7 | Warrant to Purchase Common Stock issued by the Company on October 14, 2008 in | ||||
| favor of Silicon Valley Bank, pursuant to the Loan and Security Agreement dated October 14, 2008. | 10-K | 000-32501 Exhibit 10.62 | 03/06/2009 | ||
| 4.8 | Form of Warrant to Purchase Common Stock to be issued on or about May 11, 2009. | 8-K | 000-32501 Exhibit 10.64 | 05/08/2009 | |
| 4.9 | Registration Rights Agreement, dated May 7, 2009, by and among Cytori | ||||
| Therapeutics, Inc. and the Purchasers identified on the signature pages thereto. | 8-K | 000-32501 Exhibit 10.65 | 05/08/2009 | ||
| 4.10 | Warrant to Purchase Common Stock issued by the Company on June 11, 2010 in favor of GE Capital Equity Investments, Inc., pursuant to the Amended and Restated Loan and Security Agreement dated June 11, 2010. | 8-K | 001-34375 Exhibit 10.73 | 06/17/2010 | |
| 4.11 | Warrant to Purchase Common Stock issued by the Company on June 11, 2010 in favor of Silicon Valley Bank, pursuant to the Amended and Restated Loan and Security Agreement dated June 11, 2010. | 8-K | 001-34375 Exhibit 10.74 | 06/17/2010 | |
| 4.12 | Warrant to Purchase Common Stock issued by the Company on June 11, 2010 in favor of Oxford Financial Corporation, pursuant to the Amended and Restated Loan and Security Agreement dated June 11, 2010. | 8-K | 001-34375 Exhibit 10.75 | 06/17/2010 | |
| 4.13 | Warrant to Purchase Common Stock issued by the Company on September 9, 2011 in favor of GE Capital Equity Investments, Inc., pursuant to the Amended and Restated Loan and Security Agreement dated September 9, 2011. | 8-K | 001-34375 Exhibit 10.84 | 09/15/2011 | |
| 4.14 | Warrant to Purchase Common Stock issued by the Company on September 9, 2011 in favor of Silicon Valley Bank, pursuant to the Amended and Restated Loan and Security Agreement dated September 9, 2011. | 8-K | 001-34375 Exhibit 10.85 | 09/15/2011 | |
| 4.15 | Warrant to Purchase Common Stock issued by the Company on September 9, 2011 in favor of Oxford Financial Corporation, pursuant to the Amended and Restated Loan and Security Agreement dated September 9, 2011. | 8-K | 001-34375 Exhibit 10.86 | 09/15/2011 | |
| 4.16 | Warrant to Purchase Common Stock issued by the Company on September 9, 2011 in favor of Oxford Financial Corporation, pursuant to the Amended and Restated Loan and Security Agreement dated September 9, 2011. | 8-K | 001-34375 Exhibit 10.87 | 09/15/2011 |
| 4.17 | Warrant to Purchase Common Stock issued by the Company on June 28, 2013 in favor of Oxford Finance LLC pursuant to the Loan and Security Agreement dated June 28, 2013. | 10-Q | 001-34375 Exhibit 4.17 | 08/09/2013 | |
| 4.18 | Warrant to Purchase Common Stock issued by the Company on June 28, 2013 in favor of Oxford Finance LLC pursuant to the Loan and Security Agreement dated June 28, 2013. | 10-Q | 001-34375 Exhibit 4.18 | 08/09/2013 | |
| 4.19 | Warrant to Purchase Common Stock issued by the Company on June 28, 2013 in favor of Oxford Finance LLC pursuant to the Loan and Security Agreement dated June 28, 2013. | 10-Q | 001-34375 Exhibit 4.19 | 08/09/2013 | |
| 4.20 | Warrant to Purchase Common Stock issued by the Company on June 28, 2013 in favor of Oxford Finance LLC pursuant to the Loan and Security Agreement dated June 28, 2013. | 10-Q | 001-34375 Exhibit 4.20 | 08/09/2013 | |
| 4.21 | Warrant to Purchase Common Stock issued by the Company on June 28, 2013 in favor of Silicon Valley Bank pursuant to the Loan and Security Agreement dated June 28, 2013. | 10-Q | 001-34375 Exhibit 4.21 | 08/09/2013 | |
| 4.22 | Stock Purchase Agreement, effective October 29, 2013, by and between the Company and Lorem Vascular, Pty. Ltd. | S-3 | 333-192409 | 11-19-2013 | |
| 10.1# | Amended and Restated 1997 Stock Option and Stock Purchase Plan. | 10 | 000-32501 Exhibit 10.1 | 03/30/2001 | |
| 10.1.1# | Board of Directors resolution adopted November 9, 2006 regarding determination of fair market value for stock option grant purposes (incorporated by reference to Exhibit 10.10.1 filed as Exhibit 10.10.1 to our Form 10-K Annual Report, as filed on March 30, 2007 and incorporated by reference herein) | 10-K | 000-32501 Exhibit 10.10.1 | 03/30/2007 | |
| 10.10# | 2004 Equity Incentive Plan of Cytori Therapeutics, Inc | 8-K | 000-32501 Exhibit 10.1 | 08/27/2004 | |
| 10.10.1# | Board of Directors resolution adopted November 9, 2006 regarding determination of fair market value for stock option grant purposes. | 10-K | 000-32501 Exhibit 10.10.1 | 03/30/2007 | |
| 10.12# | Notice and Agreement for Stock Options Grant Pursuant to Cytori Therapeutics, Inc. 1997 Stock Option and Stock Purchase Plan; (Nonstatutory). | 10-Q | 000-32501 Exhibit 10.19 | 11/15/2004 | |
| 10.13# | Notice and Agreement for Stock Options Grant Pursuant to Cytori Therapeutics, Inc. 1997 Stock Option and Stock Purchase Plan; (Nonstatutory) with Cliff. | 10-Q | 000-32501 Exhibit 10.20 | 11/15/2004 | |
| 10.14# | Notice and Agreement for Stock Options Grant Pursuant to Cytori Therapeutics, Inc. 1997 Stock Option and Stock Purchase Plan; (Incentive). | 10-Q | 000-32501 Exhibit 10.21 | 11/15/2004 | |
| 10.15# | Notice and Agreement for Stock Options Grant Pursuant to Cytori Therapeutics, Inc. 1997 Stock Option and Stock Purchase Plan; (Incentive) with Cliff. | 10-Q | 000-32501 Exhibit 10.22 | 11/15/2004 | |
| 10.16# | Form of Options Exercise and Stock Purchase Agreement Relating to the 2004 Equity Incentive Plan. | 10-Q | 000-32501 Exhibit 10.23 | 11/15/2004 | |
| 10.17# | Form of Notice of Stock Options Grant Relating to the 2004 Equity Incentive Plan. | 10-Q | 000-32501 Exhibit 10.24 | 11/15/2004 | |
| 10.22 | Common Stock Purchase Agreement dated April 28, 2005, between Olympus Corporation and the Company. | 10-Q | 000-32501 Exhibit 10.21 | 08/15/2005 | |
| 10.23 | Sublease Agreement dated May 24, 2005, between Biogen Idec, Inc. and the Company. | 10-Q | 000-32501 Exhibit 10.21 | 08/15/2005 | |
| 10.27+ | Joint Venture Agreement dated November 4, 2005, between Olympus Corporation and the Company. | 10-K | 000-32501 Exhibit 10.27 | 03/30/2006 | |
| 10.28+ | License/ Commercial Agreement dated November 4, 2005, between Olympus-Cytori, Inc. and the Company | 10-K | 000-32501 Exhibit 10.28 | 03/30/2006 | |
| 10.28.1 | Amendment One to License/ Commercial Agreement dated November 14, 2007, between Olympus-Cytori, Inc. and the Company. | 10-K | 000-32501 Exhibit 10.28.1 | 03/14/2008 |
75
| 10.29+ | License/ Joint Development Agreement dated November 4, 2005, between Olympus Corporation, Olympus-Cytori, Inc. and the Company. | 10-K | 000-32501 Exhibit 10.29 | 03/30/2006 | |
| 10.29.1 | Amendment No. 1 to License/ Joint Development Agreement dated May 20, 2008, between Olympus Corporation, Olympus-Cytori, Inc. and the Company. | 10-Q | 000-32501 Exhibit 10.29.1 | 08/11/2008 | |
| 10.30+ | Shareholders Agreement dated November 4, 2005, between Olympus Corporation and the Company. | 10-K | 000-32501 Exhibit 10.30 | 03/30/2006 | |
| 10.32 | Common Stock Purchase Agreement, dated August 9, 2006, by and between Cytori Therapeutics, Inc. and Olympus Corporation. | 8-K | 000-32501 Exhibit 10.32 | 08/15/2006 | |
| 10.33 | Form of Common Stock Subscription Agreement, dated August 9, 2006 (Agreements on this form were signed by Cytori and each of respective investors in the Institutional Offering). | 8-K | 000-32501 Exhibit 10.33 | 08/15/2006 | |
| 10.43 | Financial services advisory engagement letter agreement, dated February 16, 2007, between Cytori Therapeutics, Inc. and WBB Securities, LLC. | 8-K | 000-32501 Exhibit 10.2 | 02/26/2007 | |
| 10.46 | Common Stock Purchase Agreement, dated March 28, 2007, by and between Cytori Therapeutics, Inc. and Green Hospital Supply, Inc. | 10-Q | 000-32501 Exhibit 10.46 | 05/11/2007 | |
| 10.47 | Consulting Agreement, dated May 3, 2007, by and between Cytori Therapeutics, Inc. and Marshall G. Cox. | 10-Q | 000-32501 Exhibit 10.47 | 08/14/2007 | |
| 10.48+ | Master Cell Banking and Cryopreservation Agreement, effective August 13, 2007, by and between Green Hospital Supply, Inc. and Cytori Therapeutics, Inc. | 10-Q | 000-32501 Exhibit 10.48 | 11/13/2007 | |
| 10.48.1 | Amendment No. 1 to Master Cell Banking and Cryopreservation Agreement, effective June 4, 2008, by and between Green Hospital Supply, Inc. and the Company. | 8-K | 000-32501 Exhibit 10.48.1 | 06/10/2008 | |
| 10.49+ | License & Royalty Agreement, effective August 23, 2007, by and between Olympus-Cytori, Inc. and Cytori Therapeutics, Inc. | 10-Q | 000-32501 Exhibit 10.49 | 11/13/2007 | |
| 10.51 | Common Stock Purchase Agreement, dated February 8, 2008, by and between Green Hospital Supply, Inc. and Cytori Therapeutics, Inc. | 8-K | 000-32501 Exhibit 10.51 | 02/19/2008 | |
| 10.51.1 | Amendment No. 1 to Common Stock Purchase Agreement, dated February 29, 2008, by and between Green Hospital Supply, Inc. and Cytori Therapeutics, Inc. | 8-K | 000-32501 Exhibit 10.51.1 | 02/29/2008 | |
| 10.52# | Agreement for Acceleration and/or Severance, dated January 31, 2008, by and between Christopher J. Calhoun and Cytori Therapeutics, Inc. | 10-K | 000-32501 Exhibit 10.52 | 03/14/2008 | |
| 10.53# | Agreement for Acceleration and/or Severance, dated January 31, 2008, by and between Marc H. Hedrick and Cytori Therapeutics, Inc. | 10-K | 000-32501 Exhibit 10.53 | 03/14/2008 | |
| 10.54# | Agreement for Acceleration and/or Severance, dated January 31, 2008, by and between Mark E. Saad and Cytori Therapeutics, Inc. | 10-K | 000-32501 Exhibit 10.54 | 03/14/2008 | |
| 10.55 | Common Stock Purchase Agreement, dated August 7, 2008, by and between the Company and Olympus Corporation. | 8-K | 000-32501 Exhibit 10.32 | 08/08/2008 | |
| 10.55.1 | Amendment No. 1 to Common Stock Purchase Agreement, dated August 8, 2008, by and between the Company and Olympus Corporation. | 8-K | 000-32501 Exhibit 10.32.1 | 08/14/2008 | |
| 10.56 | Securities Purchase Agreement, dated August 7, 2008, by and among the Company and the Purchasers identified on the signature pages thereto. | 8-K | 000-32501 Exhibit 10.33 | 08/08/2008 | |
| 10.59 | Loan and Security Agreement, dated October 14, 2008, by and among the Company, General Electric Capital Corporation, and the other lenders signatory thereto. | 10-K | 000-32501 Exhibit 10.59 | 03/06/2009 | |
| 10.60 | Promissory Note issued by the Company in favor of General Electric Capital Corporation or any subsequent holder thereof, pursuant to the Loan and Security Agreement dated October 14, 2008. | 10-K | 000-32501 Exhibit 10.60 | 03/06/2009 | |
| 10.63 | Form of Subscription Agreement by and between Cytori Therapeutics, Inc. and the Purchaser (as defined therein), dated as of March 9, 2009. | 8-K | 000-32501 Exhibit 10.63 | 03/10/2009 | |
| 10.64 | Placement Agency Agreement, dated March 9, 2009, between Cytori Therapeutics, Inc. and Piper Jaffray & Co. | 8-K | 000-32501 Exhibit 10.64 | 03/10/2009 |
| 10.65 | Securities Purchase Agreement, dated May 7, 2009, by and among Cytori Therapeutics, Inc. and the Purchasers identified on the signature pages thereto. | 8-K | 000-32501 Exhibit 10.63 | 05/08/2009 | ||
| 10.68 | Form of Common Stock Purchase Agreement by and between Cytori Therapeutics, Inc. and Seaside 88, LP, dated as of June 19, 2009. | 8-K | 001-34375 Exhibit 10.68 | 06/22/2009 | ||
| 10.69 | Lease Agreement entered into on April 2, 2010, between HCP Callan Rd, LLC. and Cytori Therapeutics, Inc.. | 10-Q | 001-34375 Exhibit 10.69 | 05/06/2010 | ||
| 10.70 | Amended and Restated Loan and Security Agreement, dated June 11, 2010, by and among the Company, General Electric Capital Corporation, and the other lenders signatory thereto. | 8-K | 001-34375 Exhibit 10.70 | 06/17/2010 | ||
| 10.71 | Promissory Note issued by the Company in favor of General Electric Capital Corporation or any subsequent holder thereof, pursuant to the Loan and Security Agreement dated June 11, 2010. | 8-K | 001-34375 Exhibit 10.71 | 06/17/2010 | ||
| 10.72 | Promissory Note issued by the Company in favor of Oxford Financial Corporation or any subsequent holder thereof, pursuant to the Loan and Security Agreement dated June 11, 2010. | 8-K | 001-34375 Exhibit 10.72 | 06/17/2010 | ||
| 10.76 | Common Stock Purchase Agreement, dated December 6, 2010, by and among Cytori Therapeutics, Inc. and Astellas Pharma Inc. | 8-K | 001-34375 Exhibit 10.76 | 12/09/2010 | ||
| 10.77 | Form of Notice and Restricted Stock Award Agreement for grants of performance-based restricted stock awards under the 2004 Equity Incentive Plan. | 8-K | 001-34375 Exhibit 10.1 | 03/04/2011 | ||
| 10.78 | Form of Common Stock Purchase Agreement by and between Cytori Therapeutics, Inc. and Seaside 88, LP, dated July 11, 2011 | 8-K | 001-34375 Exhibit 10.78 | 07/12/2011 | ||
| 10.79 | First Amendment to Amended and Restated Loan and Security Agreement, dated June 23, 2011, by and among the Company, Oxford Finance LLC, the other lenders party hereto and General Electric Capital Corporation. | 10-Q | 001-34375 Exhibit 10.79 | 08/09/2011 | ||
| 10.80 | Second Amendment to the Amended and Restated Loan and Security Agreement, dated September 9, 2011, by and among the Company, General Electric Capital Corporation, and the other lenders signatory thereto. | 8-K | 001-34375 Exhibit 10.80 | 09/15/2011 | ||
| 10.81 | Promissory Note issued by the Company in favor of General Electric Capital Corporation or any subsequent holder thereof, pursuant to the Loan and Security Agreement dated September 9, 2011. | 8-K | 001-34375 Exhibit 10.81 | 09/15/2011 | ||
| 10.82 | Promissory Note issued by the Company in favor of Silicon Valley Bank or any subsequent holder thereof, pursuant to the Loan and Security Agreement dated September 9, 2011. | 8-K | 001-34375 Exhibit 10.82 | 09/15/2011 | ||
| 10.83 | Promissory Note issued by the Company in favor of Oxford Financial Corporation or any subsequent holder thereof, pursuant to the Loan and Security Agreement dated September 9, 2011. | 8-K | 001-34375 Exhibit 10.83 | 09/15/2011 | ||
| 10.88 | First Amendment to Lease Agreement entered into on November 4, 2011, between HCP Callan Rd, LLC. and the Company. | 10-Q | 001-34375 Exhibit 10.88 | 11/08/2011 | ||
| 10.89# | 2011 Employee Stock Purchase Plan | DEF 14A | 001-34375 Appendix A | 05/02/2011 | ||
| 10.90+ | Contract HHSO100201200008C dated September 27, 2012, by and between the Company and the U.S. Department of Health and Human Services Biomedical Advanced Research and Development Authority (portions of the exhibit have been omitted pursuant to a request for confidential treatment). | 8-K | 001-34375 Exhibit 10.90 | 10/03/2012 | ||
| 10.91 | Joint Venture Termination Agreement dated May 8, 2013 by and between the Company and Olympus Corporation. | 10-Q | 001-34375 Exhibit 10.91 | 05/10/2013 | ||
| 10.92 | Loan and Security Agreement, dated June 28, 2013, by and among the Company, Oxford Finance LLC and Silicon Valley Bank. | 10-Q | 001-34375 Exhibit 10.92 | 08/09/2013 |
| 10.93+ | Puregraft Sale-License-Supply Agreement, dated July 30, 2013, by and among the Company and Bimini Technologies LLC. | 10-Q/A | 001-34375 Exhibit 10.93 | 11/12/2013 | |
| 10.94+ | Amended and Restated License and Supply Agreement dated January 30, 2014, by and between the Company and Lorem Vascular Pty. Ltd. | 8-K | 001-34375 | 02/04/2014 | |
| 14.1 | Code of Ethics. | 10-K | 000-32501 Exhibit 14.1 | 03/30/2004 | |
| Consent of KPMG LLP, Independent Registered Public Accounting Firm | |||||
| Certification of Principal Executive Officer Pursuant to Securities Exchange Act Rule 13a-14(a), as adopted pursuant to Section 302 of the Sarbanes-Oxley Act of 2002 | X |
| Certification of Principal Financial Officer Pursuant to Securities Exchange Act Rule 13a-14(a), as adopted pursuant to Section 302 of the Sarbanes-Oxley Act of 2002 | X | |||||
| Certifications Pursuant to 18 U.S.C. Section 1350/ Securities Exchange Act Rule 13a-14(b), as adopted pursuant to Section 906 of the Sarbanes - Oxley Act of 2002 | ||||||
| XBRL Instance Document | ||||||
| 101.SCH | XBRL Schema Document | X | ||||
| 101.CAL | XBRL Calculation Linkbase Document | X | ||||
| 101.DEF | XBRL Definition Linkbase Document | X | ||||
| 101.LAB | XBRL Label Linkbase Document | X | ||||
| * | XBRL Presentation Linkbase Document | X |
| + | Confidential treatment has been granted with respect to certain portions of this exhibit. |
| # | Indicates management contract or compensatory plan or arrangement. |
78
SIGNATURES
| CYTORI THERAPEUTICS, INC. | ||
| By: | /s/ Christopher J. Calhoun | |
| Christopher J. Calhoun | ||
| Chief Executive Officer | ||
| March 14, 2014 | ||
Pursuant to the requirements of the Securities Exchange Act of 1934, this annual report has been signed below by the following persons on Form 10-K forbehalf of the fiscal year ended December 31, 2012, originally filed withregistrant and in the SECcapacities and on March 15, 2013, which is being amended hereby.the dates indicated.
| SIGNATURE | TITLE | DATE | ||
| /s/ David M. Rickey | Chairman of the Board of Directors | March 14, 2014 | ||
| David M. Rickey | ||||
| /s/ Christopher J. Calhoun | Chief Executive Officer, Vice-Chairman, Director (Principal Executive Officer) | March 14, 2014 | ||
| Christopher J. Calhoun | ||||
| /s/ Marc H. Hedrick, MD | President, Director | March 14, 2014 | ||
| Marc H. Hedrick, MD | ||||
| /s/ Mark E. Saad | Chief Financial Officer (Principal Financial Officer) | March 14, 2014 | ||
| Mark E. Saad | ||||
| /s/ John W. Townsend | Chief Accounting Officer | March 14, 2014 | ||
| John W. Townsend | ||||
| /s/ Lloyd H. Dean | Director | March 14, 2014 | ||
| Lloyd H. Dean | ||||
| /s/ Paul W. Hawran | Director | March 14, 2014 | ||
| Paul W. Hawran | ||||
| /s/ E. Carmack Holmes, MD | Director | March 14, 2014 | ||
| E. Carmack Holmes, MD | ||||
| /s/ Richard J. Hawkins | Director | March 14, 2014 | ||
| Richard J. Hawkins | ||||
| /s/ Tommy G. Thompson | Director | March 14, 2014 | ||
| Tommy G. Thompson |
| /s/ Gary A. Lyons | Director | March 14, 2014 | ||
| Gary A. Lyons |
79