_____________________
(Mark One) x ANNUAL REPORT PURSUANT TO SECTION 13 OR 15(d) OF THE SECURITIES EXCHANGE ACT OF 1934 or Delaware 77-0019522 (State or other jurisdiction of (I.R.S. Employer incorporation or organization) Identification No.) Title of Each Class Name of Each Exchange on Which Registered Common Stock, $0.0001 par value per share (Do not check if a smaller reporting company) Smaller reporting company o 3 operating systems. distinctive constituents across multiple screens, including PCs, mobile devices, and Internet-connected living room electronics such as televisions (“TVs”). We also believe those who manage Websites will want to utilize Web analytic data and other Web usage metrics to optimize their Websites and content to improve the overall experience of their sites. non-PC based devices. Despite maintaining strong market share for our professional Photoshop products during the year, revenue decreased significantly on a year-over-year basis due to the macro-economic environment. economy. desktop products. We will also utilize hardware improvements such as 64-bit computing support and graphics processor unit acceleration to significantly improve the performance of our products. deliver improved Web-based content, applications and experiences for both PC screens and non-PC screens such as mobile device and TV screens. In illustration, we will continue to innovate and develop new capabilities which we believe will preserve our Illustrator product as a leading graphics creation solution. individual Photoshop products. Web and to mobile devices. We will also work to integrate analytics and optimization capabilities into our video solutions, leveraging our OSMF effort and the capabilities of our Omniture offerings. number of hobbyists desiring easy-to-use video editing solutions grows, we intend to enhance the video editing and DVD creation capabilities of our Adobe Premiere Elements product for the sharing of digital video memories. Bridge, a tool used to produce innovative and compelling content for a broad range of mobile phones and consumer electronics devices called Adobe Device Central, and Adobe Acrobat Connect Web conferencing software that enables users to instantly communicate and collaborate through easy-to-use, easy-to-access online personal meeting rooms. devices that run Adobe Flash Player. video production. create more efficient video production workflows while reducing production costs, Adobe Story automatically turns content in scripts into relevant metadata that can be used throughout the Adobe digital video workflow. implement marketing campaigns and sell products online. two distinct businesses within our Business Productivity Solutions: Knowledge Worker and Enterprise. Both businesses utilize industry standards and leverage our client platforms that include Adobe Reader, Adobe Flash Player and Adobe AIR. interactive document. and technical publishing, we believe there are tens of millions of users who desktop solution. H.264 video for direct playback in Adobe Acrobat software; Acrobat Pro Extended also: allows users to easily add audio, video and quizzes to PowerPoint slides to create rich, interactive presentations with Adobe Presenter; enables conversion of a variety of video formats to FLV for playback in PDF; and enables the creation of PDF maps through the importing geospatial files that can retain metadata and coordinates. Acrobat 9 Pro Extended includes Adobe LiveCycle Designer ES, Adobe Presenter, Adobe 3D Reviewer and Adobe 3D Capture Utility for UNIX. extend Adobe LiveCycle environment. author intended and previewing them before deployment; it also simplifies adding intelligence to documents, such as business and routing logic, and binding form fields to arbitrary XML schemes for seamless integration with enterprise applications. Adobe Reader—software for reliable reviewing and printing of Adobe PDF Adobe AIR. and Print and Publishing categories. Market Opportunity and Strategy corporate training markets. Adobe Flash, Microsoft markets its Silverlight product and technology which provides capabilities for the creation of media experiences and interactive applications for the Web that incorporate video, animation, interactivity and user interfaces. illustration functionalities, the technical capabilities of the product and our ability to leverage core technologies from our other established products. service bureaus, and through the development of Sony – as well as video editing capabilities found in operating systems and other video editing solutions bundled by video camcorder manufacturers with their hardware offerings. document process management solutions from workflow solution vendors such as services. JavaFX. Our publishers and the widespread proliferation of the Shockwave Player. the United Kingdom. significant customers are distributors who sell products across our various segments. Japan. Centers are charged with providing timely, high quality technical expertise on Enterprise and Knowledge Worker products under a SaaS or on-demand model, where software is provided on demand to customers, generally through a Web browser. The use of these products is generally governed by terms of use associated with these products. Name Age Positions President and Chief Executive Officer Senior Vice President, General Counsel and Corporate Secretary Senior Vice President, Senior Vice President, Worldwide Field Operations Vice President, Principal Accounting Officer Officer. Mr. Narayen joined Adobe in January 1998 as Vice President and General Manager of Adobe’s engineering technology group. In January 1999, he was promoted to Senior Vice President, Worldwide Products and in March 2001 he was promoted to Executive Vice President, Worldwide Product Marketing and Development. In January 2005, Mr. Narayen was promoted to President and Chief Operating Officer and in December 2007, he was appointed Chief Executive Officer of Mr. Narayen is also a director of Dell Inc. from December 2002 to September 2005 and from 1999 to December 2002, Mr. Rowley served as Vice President, Corporate Controller and Principal Accounting Officer. From 1994 to 1999, Mr. Rowley served in several finance-related positions at Synopsys. Mr. Rowley is a certified public accountant. report. and marketing resources. In the mobile and device markets, our intent is to If any of our assumptions about revenue from our new businesses prove incorrect, our actual results may vary materially from those anticipated, estimated or projected. disclosure. weakens and we were unable to timely secure replacement distributors. the revised standards for business combinations will result in the recognition of certain types of expenses in our results of operations that we currently capitalize pursuant to existing accounting standards. may not be recoverable include a decline in stock price and market capitalization, future cash flows, and slower growth rates in our industry. We may be required to record a significant charge to earnings in our financial statements during the period in which any impairment of our goodwill or amortizable intangible assets is determined, resulting in an impact on our results of operations. For example, our Mobile and Device Solutions business, which is reported Effective succession planning is also a key factor for our long-term success. Our failure to enable the effective transfer of knowledge and facilitate smooth transitions with regards to our key employees could adversely affect our long-term strategic planning and execution. Location Use North America: 378,000 Research, product development, sales and marketing, 321,000 Research, product development, sales and marketing 267,000 Research, product development, Product development, sales, technical support and administration Research, product development, sales, marketing and administration Product development The total square footage is 61,000, of which we occupy 21,000 financial position, cash flows or results of operations could be negatively affected by November 27, 2009. Price Range Cash High Low Per Share Fiscal 2006: First Quarter $ 40.51 $ 34.52 — Second Quarter 39.45 28.35 — Third Quarter 34.07 26.47 — Fourth Quarter 42.55 31.50 — Fiscal Year 42.55 26.47 — Fiscal 2005: First Quarter $ 32.56 $ 27.40 $ 0.00625 Second Quarter 34.48 26.57 — Third Quarter 32.92 25.80 — Fourth Quarter 35.68 26.67 — Fiscal Year 35.68 25.80 0.00625 Plan/Period Shares Average Maximum Stock Repurchase Program I Beginning shares available to be repurchased as of September 1, 2006 147,609,017 September 2 - 29, 2006 From employees(2) 1,388 $ 36.92 Structured repurchases 471,879 33.33 September 30 - October 27, 2006 From employees(2) 1,443 38.59 Structured repurchases 593,946 36.89 October 28 - December 1, 2006 From employees(2) 1,346 41.47 Structured repurchases 1,160,105 38.06 Total shares repurchased 2,230,107 (2,230,107 ) Adjustments to repurchase authority for net dilution 10,471,889 (3) Ending shares available to be repurchased as of December 1, 2006 155,850,799 (4) Fiscal Years 2006 2005 2004 2003 2002 Operations: Revenue $ 2,575,300 $ 1,966,321 $ 1,666,581 $ 1,294,749 $ 1,164,788 Gross profit 2,282,843 1,853,743 1,562,203 1,201,727 1,060,500 Income before income taxes 679,727 765,776 608,645 380,492 284,689 Net income(*) 505,809 602,839 450,398 266,344 191,399 Net income per share(*) Basic 0.85 1.23 0.94 0.57 0.41 Diluted 0.83 1.19 0.91 0.55 0.40 Cash dividends declared per common share — 0.00625 0.025 0.025 0.025 Financial position: Cash, cash equivalents and short-term investments 2,280,879 1,700,834 1,313,221 1,096,533 617,737 Working capital 2,207,122 1,528,183 1,107,142 892,498 436,883 Total assets 5,962,548 2,440,315 1,958,632 1,555,045 1,051,610 Stockholders’ equity 5,151,876 1,864,326 1,423,477 1,100,800 674,321 Additional data: Worldwide employees 6,068 4,285 3,848 3,515 3,319 estimates involved in the accounting for revenue recognition, stock-based compensation, business combinations, goodwill impairment and income taxes have the greatest potential impact on our consolidated financial statements. These areas are key components of our results of operations and are based on complex rules which require us to make judgments and estimates, so we consider these to be our critical accounting policies. operations. volatility of our common stock by using implied volatility in market traded options. Our decision to use implied volatility was based upon the availability of actively traded options on our common stock and our assessment that implied volatility is more representative of future stock price trends than historical volatility. We base the risk-free interest rate such assumptions, estimates or actual results. value of the asset carried on our balance sheet to its estimated fair value. Assumptions, judgments and estimates about future values are complex and often subjective. They can be affected by a variety of factors, including external factors such as industry and economic trends, and internal factors such as changes in our business strategy reporting units. results. existing customers. Fiscal % Change Fiscal % Change Fiscal Product $ 2,484.7 29 % $ 1,923.3 18 % $ 1,634.0 Percentage of total revenues 96 % 98 % 98 % Services and support 90.6 111 % 43.0 32 % 32.6 Percentage of total revenues 4 % 2 % 2 % Total revenues $ 2,575.3 31 % $ 1,966.3 18 % $ 1,666.6 Knowledge Worker segment to our Enterprise segment. Fiscal % Change Fiscal % Change Fiscal Creative Solutions $ 1,424.9 26 % $ 1,128.3 14 % $ 987.8 Percentage of total revenues 55 % 57 % 59 % Knowledge Worker Solutions 671.0 13 % 593.5 35 % 439.4 Percentage of total revenues 26 % 30 % 27 % Enterprise and Developer Solutions 189.2 67 % 113.0 10 % 102.5 Percentage of total revenues 7 % 6 % 6 % Mobile and Device Solutions 37.7 * % — * % — Percentage of total revenues 2 % — — Other* 252.5 92 % $ 131.5 (4 )% 136.9 Percentage of total revenues 10 % 7 % 8 % Total Revenues $ 2,575.3 $ 1,966.3 $ 1,666.6 fiscal 2007. Fiscal % Change Fiscal % Change Fiscal Americas $ 1,266.7 35 % $ 939.7 22 % $ 770.6 Percentage of total revenues 49 % 48 % 46 % EMEA 770.1 26 % 612.7 13 % 541.5 Percentage of total revenues 30 % 31 % 33 % Asia 538.5 30 % 413.9 17 % 354.5 Percentage of total revenues 21 % 21 % 21 % Total revenues $ 2,575.3 31 % $ 1,966.3 18 % $ 1,666.6 many of our major products. 2008. During fiscal 2009, our currency hedging program related to the Yen resulted in hedging gains of $1.2 million. the Yen against the U.S. dollar. 2008. Fiscal % Change Fiscal % Change Fiscal Product $ 226.5 152 % $ 90.0 4 % $ 86.6 Percentage of total revenues 9 % 5 % 5 % Services and support 66.0 192 % 22.6 27 % 17.8 Percentage of total revenues 3 % 1 % 1 % Total cost of revenues $ 292.5 160 % $ 112.6 8 % $ 104.4 % Change % Change Increased (decreased) amortization of purchased technology 151 % (8 )% Increased cost of sales due to shrink-wrap revenue 3 5 Decreased localization costs related to our product launches (3 ) — Increased royalties for licensed technologies 1 2 (Decreased) increased excess and obsolete inventory (2 ) 1 Increased localization costs related to our product launches — 3 Various individually insignificant items 2 1 Total change 152 % 4 % services. Fiscal % Change Fiscal % Change Fiscal Expenses $ 539.9 48 % $ 365.3 17 % $ 311.3 Percentage of total revenues 21 % 19 % 19 % % Change % Change Increased compensation and related benefits associated with headcount growth related to the Macromedia acquisition, higher incentive compensation, amortization of deferred stock compensation related to the acquisition of Macromedia and stock-based compensation costs as a result of adopting SFAS 123R at the beginning of fiscal 2006 37 % — Compensation and related benefits associated with headcount growth and higher incentive compensation — 10 % Increased facility costs related to acquisition of Macromedia 5 — Increased use of contractors 1 1 Increased repairs and maintenance 1 — Increased purchases of equipment and software licenses 1 2 Various individually insignificant items 3 4 Total change 48 % 17 % Fiscal % Change Fiscal % Change Fiscal Expenses $ 867.1 46 % $ 593.3 14 % $ 521.1 Percentage of total revenues 34 % 30 % 31 % % Change % Change Increased compensation and related benefits associated with headcount growth related to the Macromedia acquisition, higher incentive compensation, amortization of deferred stock compensation related to the acquisition of Macromedia and stock-based compensation costs as a result of adopting SFAS 123R at the beginning of fiscal 2006 33 % — Compensation and related benefits associated with headcount growth and higher incentive compensation — 7 % Increased contractor costs 3 — Increased professional fees 3 — Increased facility costs related to acquisition of Macromedia 3 — Increased marketing spending related to product launches and overall marketing efforts to further increase revenues 4 4 Various individually insignificant items — 3 Total change 46 % 14 % Fiscal % Change Fiscal % Change Fiscal Expenses $ 235.1 41 % $ 166.7 21 % $ 138.0 Percentage of total revenues 9 % 8 % 8 % % Change % Change Increased compensation and related benefits associated with headcount growth related to the Macromedia acquisition, higher incentive compensation, amortization of deferred stock compensation related to the acquisition of Macromedia and stock-based compensation costs as a result of adopting SFAS 123R at the beginning of fiscal 2006 21 % — Compensation and related benefits associated with headcount growth and higher incentive compensation — 9 % Increased (decreased) legal fees 6 (2 ) Increased professional fees — 6 Increased depreciation and amortization 5 3 Increased repairs and maintenance 4 2 Increased contractor fees 4 — Increased provision for bad debt 1 — Various individually insignificant items — 3 Total change 41 % 21 % Fiscal % Change Fiscal % Change Fiscal Expenses $ 19.7 *% $ — — % $ — Percentage of total revenues 1 % — — 2013, respectively. We expect to pay the restructuring liabilities associated with the Omniture and Macromedia acquisitions through fiscal 2013 and fiscal 2012, respectively. Fiscal % Change Fiscal % Change Fiscal Expenses $ 69.9 — % $ — * % $ — Percentage of total revenues 3 % — — Fiscal % Change Fiscal % Change Fiscal Investment gain (loss) $ 61.2 * % $ (1.3 ) * % $ 2.5 Percentage of total revenues 2 % * % * % Interest and other income 67.2 74 % 38.6 * % 14.3 Percentage of total revenues 3 % 2 % 1 % Total non-operating income $ 128.4 244 % $ 37.3 * % $ 16.8 paid upon expiration of the London interbank offered rate (“LIBOR”) contract or at a minimum, quarterly. The decline in interest expense was primarily due to lower interest rates. Gains (Losses), Net 2006 2005 2004 Net losses related to our investments in Adobe Ventures and cost method investments $(6.5 ) $(1.0 ) $(0.1 ) Write-downs due to other-than-temporary declines in value of our marketable equity securities — (0.6 ) — Gains from sale of short-term investments — 0.1 2.5 Gains from sale of equity investments 67.9 — — Gains (losses) on stock warrants (0.2 ) 0.2 0.1 Total investment gain (loss) $61.2 $(1.3 ) $2.5 Fiscal % Change Fiscal % Change Fiscal Provision $ 173.9 7 % $ 162.9 3 % $ 158.2 Percentage of total revenues 7 % 8 % 10 % Effective tax rate 26 % 21 % 26 % 2007. Fiscal % Change Fiscal % Change Fiscal Cash, cash equivalents and short-term investments $ 2,280.9 34 % $ 1,700.8 30 % $ 1,313.2 Working capital 2,207.1 44 % 1,528.2 38 % 1,107.1 Stockholders’ equity $ 5,151.9 176 % $ 1,864.3 31 % $ 1,423.5 2009. Capital Resources Considerations U.S. Treasury securities. third-parties. During fiscal 2009, we repurchased approximately 15.2 million shares at an average price per share of $27.89 through structured repurchase agreements entered into during fiscal 2008 and fiscal 2009. During fiscal 2008, we repurchased 22.4 million shares at an average price of $36.26 through structured repurchase agreements which included prepayments from fiscal 2007. During fiscal 2007, we repurchased 22.0 million shares at an average price of $40.04 through structured repurchase agreements which included prepayments from fiscal 2006. $39.79 in open market transactions. Board Approval Repurchases 2006 2005 2004 Date Under the Plan Shares Average Shares Average Shares Average December 1997 From employees(1) 134 $ 37.10 7 $ 29.16 10 $ 25.65 Open market 1,650 36.04 — — 12,414 20.82 Structured repurchases(2) 36,792 34.00 18,708 30.61 9,532 23.33 Total shares 38,576 34.10 18,715 $ 30.61 21,956 $ 21.91 Total cost $ 1,315,317 $ 572,930 $ 481,075 Total Less than 1-3 years 3-5 years Over Total non-cancelable operating leases, net of sublease income* $ 201.4 $ 47.2 $ 73.9 $ 26.4 $ 53.9 Statements for information regarding our hedging activities. $12.9 million. Statements for information regarding our hedging activities. Securities during fiscal 2009. 50% 35% 15% Marketable equity securities $ (5.9 ) $ (4.2 ) $ (1.8 ) Due within one year $ 1,505.0 Due within two years 409.7 Due within three years 175.3 Due after three years 130.0 Total $ 2,220.0 0.5% 1.0% 1.5% 6 month horizon $ (5.5 ) $ (11.1 ) $ (16.6 ) 12 month horizon $ (2.9 ) $ (5.9 ) $ (8.8 ) 2006 Quarter Ended Year Ended March 3 June 2 September 1 December 1 December 1 Revenue $ 655,478 $ 635,456 $ 602,191 $ 682,175 $ 2,575,300 Gross profit 577,732 569,849 532,712 602,550 2,282,843 Income before income taxes 144,257 164,497 123,012 247,961 679,727 Net income* 105,072 123,097 94,396 183,244 505,809 Basic net income per share* 0.18 0.21 0.16 0.31 0.85 Shares used in computing basic net income per share 598,451 595,284 586,433 584,798 593,750 Diluted net income per share 0.17 0.20 0.16 0.30 0.83 Shares used in computing diluted net income per share 621,839 613,804 600,882 602,175 612,222 2005 Quarter Ended Year Ended March 4 June 3 September 2 December 2 December 2 Revenue $ 472,882 $ 496,029 $ 487,039 $ 510,371 $ 1,966,321 Gross profit 445,913 468,595 459,559 479,676 1,853,743 Income before income taxes 176,785 187,808 193,964 207,219 765,776 Net income 151,894 149,778 144,916 156,251 602,839 Basic net income per share 0.31 0.31 0.29 0.32 1.23 Shares used in computing basic net income per share 486,260 488,765 491,710 492,517 489,921 Diluted net income per share 0.30 0.29 0.29 0.31 1.19 Shares used in computing diluted net income per share 506,182 508,156 507,821 508,562 508,070 Page 1. Financial statements · Report of Independent Registered Public Accounting Firm 74 · Consolidated Balance Sheets December 1, 2006 and December 2, 2005 75 · Consolidated Statements of Income Years Ended December 1, 2006, December 2, 2005 and December 3, 2004 76 · Consolidated Statements of Stockholders’ Equity Years Ended December 1, 2006, December 2, 2005 and December 3, 2004 77 · Consolidated Statements of Cash Flows Years Ended December 1, 2006, December 2, 2005 and December 3, 2004 78 · Notes to Consolidated Financial Statements 79 2. Exhibits 121 December 1, December 2, 2006 2005 ASSETS Current assets: Cash and cash equivalents $ 772,500 $ 420,818 Short-term investments 1,508,379 1,280,016 Trade receivables, net of allowances for doubtful accounts of $6,798 and $5,376, respectively 356,815 173,245 Other receivables 51,851 31,504 Deferred income taxes 155,613 58,710 Prepaid expenses and other assets 39,311 44,285 Total current assets 2,884,469 2,008,578 Property and equipment, net 227,197 103,549 Goodwill 2,149,494 118,683 Purchased and other intangibles, net 506,405 16,477 Investment in lease receivable 126,800 126,800 Other assets 68,183 66,228 $ 5,962,548 $ 2,440,315 LIABILITIES AND STOCKHOLDERS’ EQUITY Current liabilities: Trade and other payables $ 55,031 $ 41,042 Accrued expenses 303,550 226,915 Accrued restructuring 10,088 70 Income taxes payable 178,368 154,529 Deferred revenue 130,310 57,839 Total current liabilities 677,347 480,395 Long-term liabilities: Deferred revenue 32,644 9,731 Deferred income taxes 70,715 78,800 Accrued restructuring 21,984 — Other liabilities 7,982 7,063 Total liabilities 810,672 575,989 Commitments and contingencies Stockholders’ equity: Preferred stock, $0.0001 par value; 2,000 shares authorized; none issued — — Common stock, $0.0001 par value; 900,000 shares authorized; 600,834 and 591,528 shares issued and outstanding, respectively 61 60 Additional paid-in-capital 2,451,610 1,350,692 Retained earnings 3,317,785 2,838,560 Accumulated other comprehensive income (loss) 6,344 (914 ) Treasury stock, at cost (13,608 and 102,799 shares, respectively), net of re-issuances (623,924 ) (2,324,072 ) Total stockholders’ equity 5,151,876 1,864,326 $ 5,962,548 $ 2,440,315 Years Ended December 1, December 2, December 3, Revenue: Products $ 2,484,710 $ 1,923,278 $ 1,633,959 Services and support 90,590 43,043 32,622 Total revenue 2,575,300 1,966,321 1,666,581 Costs of revenue: Products 226,506 89,942 86,572 Services and support 65,951 22,636 17,806 Total cost of revenue 292,457 112,578 104,378 Gross profit 2,282,843 1,853,743 1,562,203 Operating expenses: Research and development 539,684 365,328 311,296 Sales and marketing 867,145 593,323 521,143 General and administrative 235,115 166,658 137,970 Restructuring and other charges 19,733 — — Amortization of purchased intangibles 69,873 — — Total operating expenses 1,731,550 1,125,309 970,409 Operating income 551,293 728,434 591,794 Non-operating income: Investment gain (loss), net 61,249 (1,301 ) 2,506 Interest and other income, net 67,185 38,643 14,345 Total non-operating income 128,434 37,342 16,851 Income before income taxes 679,727 765,776 608,645 Provision for income taxes 173,918 162,937 158,247 Net income $ 505,809 $ 602,839 $ 450,398 Basic net income per share $ 0.85 $ 1.23 $ 0.94 Shares used in computing basic income per share 593,750 489,921 477,658 Diluted net income per share $ 0.83 $ 1.19 $ 0.91 Shares used in computing diluted income per share 612,222 508,070 495,626 Cash dividends declared per share — $ 0.00625 $ 0.025 Common Stock Additional Retained Accumulated Treasury Stock Shares Amount Capital Earnings (Loss) Shares Amount Total Balances at November 28, 2003 591,528 $ 30 $ 903,672 $ 1,800,398 $ (999 ) (114,928 ) $ (1,602,301 ) $ 1,100,800 Comprehensive income: Net income — — — 450,398 — — — 450,398 Other comprehensive loss, net of taxes — — — — (1,290 ) — — (1,290 ) Total comprehensive income, net of taxes 449,108 Tax benefit from employee stock option plans — — 97,794 — — — — 97,794 Issuance of compensatory stock — — 225 — — 20 115 340 Dividends declared — — — (11,989 ) — — — (11,989 ) Purchase of treasury stock — — — — — (21,956 ) (608,681 ) (608,681 ) Re-issuance of treasury stock under employee stock purchase and stock option plans — — 192,498 — — 29,710 203,607 396,105 Balances at December 3, 2004 591,528 $ 30 $ 1,194,189 $ 2,238,807 $ (2,289 ) (107,154 ) $ (2,007,260 ) $ 1,423,477 Comprehensive income: Net income — — — 602,839 — — — 602,839 Other comprehensive income, net of taxes — — — — 1,375 — — 1,375 Total comprehensive income, net of taxes 604,214 Tax benefit from employee stock option plans — — 82,852 — — — — 82,852 Issuance of compensatory stock — — 189 — — 16 202 391 Dividends declared — — — (3,056 ) — — — (3,056 ) Purchase of treasury stock — — — — — (18,715 ) (600,099 ) (600,099 ) Re-issuance of treasury stock under employee stock purchase and stock option plans — — 73,462 — — 23,054 283,085 356,547 Stock dividend — 30 — (30 ) — — — — Balances at December 2, 2005 591,528 $ 60 $ 1,350,692 $ 2,838,560 $ (914 ) (102,799 ) $ (2,324,072 ) $ 1,864,326 Cumulative effect of adjustments from the adoption of SAB No. 108, net of taxes — — 27,422 (26,584 ) — — — 838 Adjusted balances as of December 2, 2005 591,528 $ 60 $ 1,378,114 $ 2,811,976 $ (914 ) (102,799 ) (2,324,072 ) 1,865,164 Comprehensive income: Net income — — — 505,809 — — — 505,809 Other comprehensive income, net of taxes — — — — 7,258 — — 7,258 Total comprehensive income, net of taxes — — — — — — — 513,067 Issuance of common stock and re-issuance of treasury stock under stock compensation plans 3,058 — (385,618 ) — — 24,972 895,430 509,812 Tax benefit from employee stock option plans — — 143,118 — — — — 143,118 Purchase of treasury stock — — — — — (38,576 ) (1,364,412 ) (1,364,412 ) Stock-based compensation 170,534 — — — — 170,534 Issuance of common stock, re-issuance of treasury stock and stock options assumed for acquisition 6,248 1 1,145,462 — — 102,795 2,169,130 3,314,593 Balances at December 1, 2006 600,834 $ 61 $ 2,451,610 $ 3,317,785 $ 6,344 (13,608 ) $ (623,924 ) $ 5,151,876 Years Ended December 1, December 2, December 3, Cash flows from operating activities: Net income $ 505,809 $ 602,839 $ 450,398 Adjustments to reconcile net income to net cash provided by operating activities: Depreciation and amortization 307,822 82,775 81,867 Stock-based compensation expense 170,534 391 340 Deferred income taxes (4,264 ) (7,068 ) 46,270 Provision for (recovery of) losses on receivables 1,107 394 (443 ) Tax benefit from employee stock option plans 143,118 82,852 97,794 Excess tax benefits from stock-based compensation (80,230 ) — — Retirements of property and equipment 767 1,093 804 Net (gains) losses on sales and impairments of investments (63,593 ) 1,322 (2,506 ) Changes in operating assets and liabilities, net of acquired assets and assumed liabilities: Trade and other receivables (112,844 ) (36,091 ) 9,221 Prepaid expenses and other current assets 12,430 (10,585 ) 4,908 Trade and other payables 11,794 (2,456 ) 5,755 Accrued expenses (31,057 ) 26,278 44,896 Accrued restructuring (41,091 ) — (871 ) Income taxes payable 27,247 8,616 (47,571 ) Deferred revenue 79,690 8,029 13,941 Net cash provided by operating activities 927,239 758,389 704,803 Cash flows from investing activities: Purchases of short-term investments (1,596,442 ) (1,849,862 ) (1,866,740 ) Maturities of short-term investments 357,775 309,202 94,756 Sales of short-term investments 1,010,284 1,291,131 1,655,596 Purchases of long-term investments and other assets (23,094 ) (32,196 ) (35,286 ) Acquisitions of property and equipment (83,250 ) (48,875 ) (63,226 ) Net cash received from (paid for) acquisitions 439,120 (19,137 ) (15,545 ) Investment in lease receivable — — (126,800 ) Proceeds from sale of equity securities and other assets 90,793 1,338 5,933 Net cash provided by (used for) investing activities 195,186 (348,399 ) (351,312 ) Cash flows from financing activities: Purchase of treasury stock (1,364,412 ) (600,099 ) (608,681 ) Proceeds from re-issuance of treasury stock 509,506 356,547 396,105 Excess tax benefits from stock-based compensation 80,230 — — Payment of dividends. — (3,044 ) (11,942 ) Net cash used for financing activities (774,676 ) (246,596 ) (224,518 ) Effect of exchange rates on cash and cash equivalents 3,933 (1,637 ) 3,566 Net increase in cash and cash equivalents 351,682 161,757 132,539 Cash and cash equivalents at beginning of year 420,818 259,061 126,522 Cash and cash equivalents at end of year $ 772,500 $ 420,818 $ 259,061 Supplemental disclosures: Cash paid for income taxes, net of refunds $ 36,632 $ 78,633 $ 61,423 Non-cash investing and financing activities: Cash dividends declared but not paid $ — $ — $ 3,027 Unrealized losses on available-for-sale securities, net of taxes $ (5,480 ) $ (2,306 ) $ (7,345 ) Common and treasury stock issued and stock options assumed for acquisition of Macromedia $ 3,436,725 $ — $ — thereafter as of November 27, 2009 (in thousands): Beginning Due to Charged/ Deductions(*) Ending Allowance for doubtful accounts: Year Ended: December 1, 2006 $ 5,376 $ 2,105 $ 1,107 $ (1,790 ) $ 6,798 December 2, 2005 6,191 — 394 (1,209 ) 5,376 December 3, 2004 7,903 — (443 ) (1,269 ) 6,191 Ventures, for certain events or occurrences while Granite Ventures is, or was serving, at our request in such capacity provided that Granite Ventures acts in good faith on behalf of the partnership. We are unable to develop an estimate of the maximum potential amount of future payments that could potentially result from any hypothetical future claim, but believe the risk of having to make any payments under this general indemnification to be remote. Retained Earnings $ (26,584 ) Deferred Income Taxes 838 Additional Paid in Capital 27,422 Retained Earnings 1998-2001 2002 2003 2004 2005 Total Stock compensation expense $ (10,324 ) $ (11,476 ) $ (10,420 ) $ (2,959 ) $ (230 ) $ (35,409 ) Tax effect 2,628 2,856 2,558 726 57 8,825 Total, net of tax $ (7,696 ) $ (8,620 ) $ (7,862 ) $ (2,233 ) $ (173 ) $ (26,584 ) Income before taxes $ 1,292,791 $ 284,689 $ 380,492 $ 608,645 $ 765,776 Percent of income before taxes. (1% ) (4% ) (3% ) 0% 0% Value of Adobe stock issued $ 3,209,121 Fair value of stock options assumed 227,604 Direct transaction costs 29,060 Restructuring costs 72,728 Total estimated purchase price $ 3,538,513 Amount Estimated Net tangible assets $ 713,164 N/A Identifiable intangible assets: Acquired product rights 365,500 4 years Customer contracts and relationships 183,800 6 years Non-competition agreements 500 2 years Trademarks 130,700 5 years Goodwill 2,022,715 N/A Deferred stock-based compensation 122,134 2.18 years† Total preliminary estimated purchase price $ 3,538,513 Fiscal 2005 Amortization of intangible assets $ 204,678 Amortization of deferred stock-based compensation 63,686 Restructuring costs 19,733 Business combination accounting effect on historical support revenue 39,504 Fiscal 2005 Net revenues $ 2,353,168 Net income 400,853 Basic net income per share 0.68 Shares used in computing basic net income per share 592,110 Diluted net income per share 0.65 Shares used in computing diluted net income per share 619,270 Carrying Unrealized Unrealized Estimated Classified as current assets: Cash $ 48,869 $ — $ — $ 48,869 Cash equivalents: Money market mutual funds 642,942 — — 642,942 Bank time deposits 33,972 — — 33,972 State and municipal bonds and notes 2,004 — — 2,004 Corporate bonds 44,713 — — 44,713 Total cash equivalents 723,631 — — 723,631 Total cash and cash equivalents 772,500 — — 772,500 Short-term investments: State and municipal bonds 1,231,327 1,079 (3,100 ) 1,229,306 United States Treasury notes 163,110 274 (87 ) 163,297 Corporate bonds 51,601 67 — 51,668 Obligations of foreign sovereigns 23,896 27 (6 ) 23,917 Bonds of multi-lateral government agencies 28,124 40 — 28,164 Marketable equity securities 6,734 5,293 — 12,027 Total short-term investments 1,504,792 6,780 (3,193 ) 1,508,379 Total cash, cash equivalents, and short-term investments $ 2,277,292 $ 6,780 $ (3,193 ) $ 2,280,879 Carrying Unrealized Unrealized Estimated Classified as current assets: Cash $ 41,682 $ — $ — $ 41,682 Cash equivalents: Money market mutual funds 334,933 — — 334,933 Bank time deposits 24,339 — — 24,339 Corporate bonds 19,864 — — 19,864 Total cash equivalents 379,136 — — 379,136 Total cash and cash equivalents 420,818 — — 420,818 Short-term investments: State and municipal bonds 1,091,538 22 (8,168 ) 1,083,392 United States Treasury notes 112,093 — (614 ) 111,479 Corporate bonds 74,449 101 (240 ) 74,310 Obligations of foreign sovereigns 9,004 — (25 ) 8,979 Marketable equity securities* 131 1,725 — 1,856 Total short-term investments 1,287,215 1,848 (9,047 ) 1,280,016 Total cash, cash equivalents, and short-term investments $ 1,708,034 $ 1,848 $ (9,047 ) $ 1,700,834 Less Than 12 Months 12 Months or More Total Fair Value Gross Fair Value Gross Fair Value Gross State and municipal bonds $ 311,847 $ (399 ) $ 402,032 $ (2,701 ) $ 713,879 $ (3,100 ) United States Treasury notes 69,563 (53 ) 1,977 (34 ) 71,540 (87 ) Corporate bonds 30,698 — — — 30,698 — Obligations of foreign sovereigns 9,997 (6 ) — — 9,997 (6 ) Total $ 422,105 $ (458 ) $ 404,009 $ (2,735 ) $ 826,114 $ (3,193 ) Cost Estimated Due within one year $ 1,506,167 $ 1,505,007 Due within two years 410,184 409,656 Due within three years 175,658 175,281 Due after three years 129,680 130,038 Total $ 2,221,689 $ 2,219,982 2006 2005 Computers and equipment. $ 237,480 $ 196,912 Furniture and fixtures. 50,008 37,604 Capital projects in-progress. 2,363 565 Leasehold improvements. 93,910 68,100 Land 35,350 — Buildings 62,461 9,611 481,572 312,792 Less accumulated depreciation and amortization. (254,375 ) (209,243 ) Property and equipment, net. $ 227,197 $ 103,549 2006 2005 Creative Solutions $ 782,717 $ 18,763 Knowledge Worker Solutions 429,036 8,395 Enterprise and Developer Solutions 382,911 91,525 Mobile and Device Solutions 321,323 — Other* 233,507 — Total goodwill $ 2,149,494 $ 118,683 Cost Accumulated Net Purchased technology $ 397,098 $ (147,376 ) $ 249,722 Localization $ 9,060 $ (2,261 ) $ 6,799 Trademarks 130,925 $ (26,857 ) 104,068 Other intangibles 189,001 $ (43,185 ) 145,816 Total other intangible assets $ 328,986 $ (72,303 ) $ 256,683 Total purchased and other intangible assets $ 726,084 $ (219,679 ) $ 506,405 Accumulated Purchased technology $ 18,785 $ (11,153 ) $ 7,632 Localization $ 20,512 $ (11,901 ) $ 8,611 Trademarks 225 (82 ) 143 Other intangibles 301 $ (210 ) 91 Total other intangible assets $ 21,038 $ (12,193 ) $ 8,845 Total purchased and other intangible assets $ 39,823 $ (23,346 ) $ 16,477 Fiscal Year Purchased Other Intangible 2007 $ 114,180 $ 74,985 2008 81,592 66,512 2009 50,310 57,652 2010 649 47,015 2011 536 10,481 Thereafter 2,455 38 Total expected amortization expense $ 249,722 $ 256,683 2006 2005 Investments $ 46,273 $ 51,707 Security deposits and other 13,304 7,419 Prepaid land lease 3,263 3,301 Prepaid rent 2,943 3,801 Unbilled receivables 2,400 — Total other assets $ 68,183 $ 66,228 2006 2005 2004 Net losses related to our investments in Adobe Ventures and cost method investments $ (6,487 ) $ (1,021 ) $ (81 ) Write-downs due to other-than-temporary declines in value of our marketable equity securities — (558 ) — Gains from sale of short-term investments — 104 2,493 Gains (losses) on stock warrants (226 ) 153 94 Other investment gains 67,962 21 — Total investment gain (loss) $ 61,249 $ (1,301 ) $ 2,506 2006 2005 Trade payables $ 37,915 $ 27,467 Other 17,116 13,575 Total trade and other payables $ 55,031 $ 41,042 2006 2005 Accrued compensation and benefits $ 148,000 $ 112,362 Sales and marketing allowances 20,361 16,306 Other 135,189 98,247 Total accrued expenses $ 303,550 $ 226,915 2006 2005 2004 Current: United States federal $ 12,419 $ 63,932 $ 1,769 Foreign 34,762 18,550 11,728 State and local 3,623 4,671 1,638 Total current 50,804 87,153 15,135 Deferred: United States federal (19,843 ) (7,653 ) 56,641 Foreign 2,198 93 (970 ) State and local (5,383 ) 492 (10,353 ) Total deferred (23,028 ) (7,068 ) 45,318 Charge in lieu of taxes attributable to employee stock plans 146,142 82,852 97,794 $ 173,918 $ 162,937 $ 158,247 2006 2005 2004 Computed “expected” tax expense $ 237,905 $ 268,022 $ 213,026 State tax expense, net of federal benefit 8,768 9,878 6,826 Tax-exempt income (12,637 ) (7,196 ) (4,284 ) Tax credits (1,204 ) (8,977 ) (9,500 ) Differences between statutory rate and foreign effective tax rate (61,067 ) (62,561 ) (47,622 ) Change in deferred tax asset valuation allowance (7,539 ) (5,836 ) (1,238 ) FAS 123R Stock Compensation (net of tax deduction) 3,320 — — Tax benefit for repatriation of certain foreign earnings under theAJCA — (29,271 ) — Other, net 6,372 (1,122 ) 1,039 $ 173,918 $ 162,937 $ 158,247 2006 2005 Deferred tax assets: Acquired technology. $ 6,715 $ 9,048 Reserves. 55,662 29,716 Deferred revenue. 24,533 11,409 Unrealized losses on investments. 19,072 8,238 FAS 123R stock compensation 28,716 — Net operating loss of acquired companies 134,440 — Credits. 47,360 24,899 Other 9,216 — Total gross deferred tax assets 325,714 83,310 Deferred tax asset valuation allowance (1,243 ) (8,238 ) Total deferred tax assets 324,471 75,072 Deferred tax liabilities: Depreciation and amortization (1,420 ) (22,650 ) Undistributed earnings of foreign subsidiaries. (112,084 ) (71,373 ) Acquired intangible assets (126,069 ) — Other. — (1,139 ) Total deferred tax liabilities. (239,573 ) (95,162 ) Net deferred tax assets (liabilities) $ 84,898 $ (20,090 ) 2006 2005 Beginning balance. $ 154,529 $ 145,913 Current year liability. 50,804 87,153 Macromedia acquisition. 22,972 — Payments and reclassifications. (49,937 ) (78,537 ) Ending balance. $ 178,368 $ 154,529 Initial Cash Payments Adjustments Balance at Termination Benefits $ 26,608 $ (26,459 ) $ 853 $ 1,002 Cost of closing redundant facilities 32,083 (10,547 ) 7,398 28,934 Cost of contract termination 3,969 (3,224 ) (699 ) 46 Other 2,500 (1,072 ) 16 1,444 Total $ 65,160 $ (41,302 ) $ 7,568 $ 31,426 Initial Cash Payments Adjustments Balance at Termination Benefits $ 18,879 $ (18,597 ) $ (103 ) $ 179 Cost of closing redundant facilities — (479 ) 946 467 Cost of contract termination 105 (11 ) (94 ) — Total $ 18,984 $ (19,087 ) $ 749 $ 646 Outstanding Options Options Number of Weighted November 28, 2003 25,907 84,939 $ 16.40 Granted (20,760 ) 20,760 21.07 Exercised — (26,587 ) 13.55 Canceled 2,578 (2,578 ) 20.46 Expired (19 ) — — Increased authorization 9,000 — — December 3, 2004 16,706 76,534 18.52 Granted (11,418 ) 11,418 31.88 Exercised — (20,495 ) 15.32 Canceled 2,206 (2,206 ) 21.52 Increased authorization 16,800 — — December 2, 2005 24,294 65,251 $ 21.76 Granted (12,221 ) 12,017 28.71 Exercised — (25,873 ) 17.73 Canceled 4,807 (4,807 ) 25.33 Forfeited (1,600 ) — 15.32 Due to acquisition 1,324 15,143 — December 1, 2006 16,604 61,731 $ 24.19 2006 2005 2004 Weighted average fair value $ 10.79 $ 9.08 $ 5.63 Range of Exercise Prices Number Weighted Weighted Number Weighted $0.81 - 13.24 6,402 3.83 years $ 11.57 6,153 $ 11.57 $13.38 - 14.33 6,229 2.96 years 13.74 5,992 13.73 $14.38 - 19.55 9,491 2.60 years 18.38 8,981 18.36 $19.64 - 21.78 8,261 4.63 years 21.42 5,863 21.33 $21.97 - 28.01 6,224 4.33 years 26.16 4,292 26.50 $28.03 - 30.60 2,126 6.28 years 29.03 699 29.00 $30.79 - 30.79 6,752 6.56 years 30.79 625 30.79 $30.80 - 32.30 4,890 3.62 years 31.90 3,591 31.96 $32.42 - 32.42 6,287 5.48 years 32.42 2,246 32.42 $32.67 - 68.43 5,069 6.19 years 37.51 502 34.67 61,731 4.44 years $ 24.19 38,944 $ 20.58 2006 2005 2004 Options granted to existing directors 200 400 350 Exercise price $ 35.95 $ 29.74 $ 20.83 Options granted to new directors 50 50 100 Exercise price $ 35.25 $ 26.83 $ 21.05 2006 2005 2004 Weighted average fair value $ 8.09 $ 9.08 $ 6.27 Restricted Stock Non-vested Weighted November 28, 2003 443 $ 6.30 Awarded 14 21.44 Released (42 ) 18.85 Forfeited (1 ) 14.80 December 3, 2004 414 5.51 Awarded 26 30.86 Released (12 ) 18.39 December 2, 2005 428 6.68 Awarded 9 39.47 Released (302 ) 22.03 Forfeited (48 ) 25.53 Due to acquisition 414 22.35 December 1, 2006 501 $ 9.17 Performance Shares Shares Maximum December 2, 2005 — — Awarded 360 540 Forfeited (24 ) (36 ) December 1, 2006 336 504 Fiscal Years 2006 2005 2004 Expected life (in years) 3.7 3.0—3.9 2.5 Volatility 30.29—36.95 % 30—37 % 34—40 % Risk free interest rate 4.30—5.15 % 3.38—4.49 % 2.18—3.11 % Dividend yield — — 0.093—0.125 % Fiscal Years 2006 2005 2004 Expected life (in years) 1.25 1.25 1.25 Volatility 30.30—35.02 % 32—37 % 34—40 % Risk free interest rate 4.32—5.26 % 3.03—3.58 % 1.24—1.76 % Dividend yield — — 0.093—0.125 % Income Statement Classifications Option Grants Restricted Macromedi Cost of revenue—services and support $ 2,499 $ — $ 5,681 Research and development 45,635 1,678 18,315 Sales and marketing 34,309 1,500 32,483 General and administrative 19,913 1,313 7,208 Total $ 102,356 $ 4,491 $ 63,687 2005 2004 Net income: As reported $ 602,839 $ 450,398 Add: Stock-based compensation expense for employees included in reported net income, net of related tax effects 255 221 Less: Total stock-based compensation expense for employees determined under the fair value based method, net of related tax effects (88,603 ) (105,883 ) Pro forma $ 514,491 $ 344,736 Basic net income per share: As reported $ 1.23 $ 0.94 Pro forma $ 1.05 $ 0.72 Diluted net income per share: As reported $ 1.19 $ 0.91 Pro forma $ 1.01 $ 0.70 Unrealized Gain Available Derivative Foreign Balance at November 28, 2003 $ 2,451 $ (2,489 ) $ (961 ) $ (999 ) Unrealized gain (loss) (6,696 ) 3,097 — (3,599 ) Reclassification adjustment for (gains) losses recognized during the period (3,283 ) 405 — (2,878 ) Tax effect of above 2,634 (1,013 ) — 1,621 Translation adjustments — — 3,566 3,566 Other comprehensive income (loss) (7,345 ) 2,489 3,566 (1,290 ) Balance at December 3, 2004 (4,894 ) — 2,605 (2,289 ) Unrealized gain (loss), net of tax (4,529 ) 12,771 — 8,242 Reclassification adjustment for (gains) losses recognized during the period, net of tax 2,223 (7,453 ) — (5,230 ) Translation adjustments — — (1,637 ) (1,637 ) Other comprehensive income (loss) (2,306 ) 5,318 (1,637 ) 1,375 Balance at December 2, 2005 (7,200 ) 5,318 968 (914 ) Unrealized gain, net of tax 7,210 285 — 7,495 Reclassification adjustment for (gains) losses recognized during the period, net of tax 865 (5,035 ) — (4,170 ) Translation adjustments — — 3,933 3,933 Other comprehensive income (loss) 8,075 (4,750 ) 3,933 7,258 Balance at December 1, 2006 $ 875 $ 568 $ 4,901 $ 6,344 2006 2005 2004 Net income $505,809 $ 602,839 $ 450,398 Shares used to compute basic net income per share 593,750 489,921 477,658 Dilutive potential common shares: Unvested restricted stock 85 35 22 Stock options 18,387 18,114 17,946 Shares used to compute diluted net income per share 612,222 508,070 495,626 Basic net income per share $ 0.85 $ 1.23 $ 0.94 Diluted net income per share $ 0.83 $ 1.19 $ 0.91 2006 2005 2004 Rent expense $ 74,629 $ 58,215 $ 55,333 Sublease income 3,556 4,995 5,681 Net rent expense $ 71,073 $ 53,220 $ 49,652 Fiscal Year Future Future Sublease 2007 $ 57,013 $ 9,781 2008 50,001 9,191 2009 42,377 9,304 2010 23,553 6,025 2011 10,034 1,116 Thereafter 53,916 80 Total $ 236,894 $ 35,497 Balance Sheet Accumulated December 1, December 2, 2006 2005 Recognized but Unrealized—Open Transactions: Net unrealized gain remaining in other accumulated comprehensive income, net of tax $ 566.8 $ 5,317.1 Income Statement Years Ended December 1, 2006 December 2, 2005 December 3, 2004 Revenue Other Revenue Other Revenue Other Gain (loss) on completed hedge transactions: Net realized gain (loss) reclassified from other accumulated comprehensive income to revenue $ 5,035 $ — $ 7,453 $ — $ (405 ) $ — Net realized loss from the cost of purchased options — (8,873 ) — (6,624 ) — (6,829 ) Gain (loss) on open hedge transactions: Net unrealized gain (loss) from time value degradation on open cash flow hedge transactions — (3,913 ) — 2,648 — (2,602 ) $ 5,035 $ (12,786 ) $ 7,453 $ (3,976 ) $ (405 ) $ (9,431 ) 2006 2005 2004 Gain (loss) on foreign currency assets and liabilities: Net realized gain (loss) recognized in other income (loss) $ 11,046 $ (9,604 ) $ 4,586 Net unrealized gain (loss) recognized in other income (loss) 4,721 (4,088 ) 3,949 15,767 (13,692 ) 8,535 Gain (loss) on hedges of foreign currency assets and liabilities: Net realized gain (loss) recognized in other income (loss) (4,179 ) 9,893 (11,123 ) Net unrealized gain (loss) recognized in other income (loss) (6,879 ) 5,747 3,150 (11,058 ) 15,640 (7,973 ) Net gain recognized in other income $ 4,709 $ 1,948 $ 562 2004 Gain on foreign currency assets and liabilities: Net realized gain recognized in other income $ 2,234 Net unrealized loss recognized in other income (1,935 ) 299 Loss on hedges of foreign currency assets and liabilities: Net realized gain recognized in other income 3,026 Net unrealized loss recognized in other income (3,482 ) (456 ) Net loss recognized in other income $ (157 ) Creative Knowledge Enterprise Mobile and Fiscal 2006 Revenue $ 1,424,851 $ 670,945 $ 189,272 $ 37,771 $ 252,461 $ 2,575,300 Cost of revenue 135,149 36,997 68,088 22,268 29,955 292,457 Gross profit $ 1,289,702 $ 633,948 $ 121,184 $ 15,503 $ 222,506 $ 2,282,843 Gross profit as a percentage of revenues 91 % 94 % 64 % 41 % 88 % 89 % Fiscal 2005 Revenue $ 1,128,339 $ 593,520 $ 113,002 $ — $ 131,460 $ 1,966,321 Cost of revenue 55,321 22,192 24,161 — 10,904 112,578 Gross profit $ 1,073,018 $ 571,328 $ 88,841 $ — $ 120,556 $ 1,853,743 Gross profit as a percentage of revenues 95 % 96 % 79 % — 92 % 94 % Fiscal 2004 Revenue $ 987,781 $ 439,404 $ 102,495 $ — $ 136,901 $ 1,666,581 Cost of revenue 56,690 19,664 18,658 — 9,366 104,378 Gross profit $ 931,091 $ 419,740 $ 83,837 $ — $ 127,535 $ 1,562,203 Gross profit as a percentage of revenues 94 % 96 % 82 % — 93 % 94 % 2006 2005 2004 Total gross profit from operating units above $ 2,282,843 $ 1,853,743 $ 1,562,203 Total operating expenses * 1,731,550 1,125,309 970,409 Total operating income 551,293 728,434 591,494 Non-operating income 128,434 37,342 16,851 Income before income taxes $ 679,727 $ 765,776 $ 608,645 Revenue 2006 2005 2004 Americas: United States $ 1,157,708 $ 864,274 $ 706,064 Other 109,068 75,443 64,500 Total Americas 1,266,776 939,717 770,564 EMEA 770,060 612,721 541,528 Asia: Japan 354,029 284,528 262,685 Other 184,435 129,355 91,804 Total Asia 538,464 413,883 354,489 Total revenue $ 2,575,300 $ 1,966,321 $ 1,666,581 Property and Equipment 2006 2005 2004 Americas: United States $ 178,893 $ 65,351 $ 72,857 Other 11,900 4,060 4,771 Total Americas 190,793 69,411 77,628 EMEA 17,896 19,891 10,543 Asia: India 13,534 13,060 10,306 Other 4,974 1,187 1,198 Total Asia 18,508 14,247 11,504 Total property and equipment $ 227,197 $ 103,549 $ 99,675 2006 2005 2004 Ingram Micro 24 % 26 % 23 % Tech Data 10 % 11 % 13 % 2006 2005 Ingram Micro 25 % 26 % Tech Data 11 % 10 % ADOBE SYSTEMS INCORPORATED Signature Title Director 10-K: Exhibit Incorporated by Reference** Filed Number Exhibit Description Form Date Number Herewith 3.1 Amended and Restated Bylaws 8-K 9/23/05 3.1 3.2 Restated Certificate of Incorporation, as filed with the Secretary of State of the State of Delaware on 5/22/01 10-Q 7/16/01 3.6 3.2.1 Certificate of Correction of Restated Certificate of Incorporation as filed with the Secretary of State of the State of Delaware 10-Q 4/11/03 3.6.1 3.3 Certificate of Designation of Series A Preferred Stock of Adobe Systems Incorporated 10-Q 7/8/03 3.3 4.1 Fourth Amended and Restated Rights Agreement between the Company and Computershare Investor Services, LLC 8-K 7/3/00 1 4.1.1 Amendment No. 1 to Fourth Amended and Restated Rights Agreement between the Company and Computershare Investor Services, LLC 8-A/2G/A 5/23/03 7 10.1 1984 Stock Option Plan, as amended* 10-Q 7/02/93 10.1.6 10.2 Amended 1994 Performance and Restricted Stock Plan* X 10.3 Form of Restricted Stock Agreement used in connection with the Amended 1994 Performance and Restricted Stock Plan* 10-Q 10/7/04 10.7 10.4 1994 Stock Option Plan, as amended* S-8 5/30/97 10.40 10.5 1997 Employee Stock Purchase Plan, as amended* 10-K 12/1/00 10.70 10.6 1996 Outside Directors Stock Option Plan, as amended* 10-Q 4/12/06 10.6 10.7 Forms of Stock Option Agreements used in connection with the 1996 Outside Directors Stock Option Plan* S-8 6/16/00 4.8 10.8 1999 Nonstatutory Stock Option Plan, as amended* S-8 10/29/01 4.6 10.9 1999 Equity Incentive Plan, as amended* 10-K 2/26/03 10.37 10.10 2003 Equity Incentive Plan, as amended* DEF 14A 3/14/05 Appendix A Exhibit Incorporated by Reference** Filed Number Exhibit Description Form Date Number Herewith 10.11 Forms of Stock Option and Restricted Stock Agreement used in connection with the 2003 Equity Incentive Plan* 10-Q 10/7/04 10.11 10.12 Form of Indemnity Agreement* 10-Q 5/30/97 10.25.1 10.13 Forms of Retention Agreement* 10-K 11/28/97 10.44 10.14 Second Amended and Restated Master Lease of Land and Improvements by and between SMBC Leasing and Finance, Inc. and Adobe Systems Incorporated 10-Q 10/7/04 10.14 10.15 Lease agreement between Adobe Systems and Selco Service Corporation 10-K 2/21/02 10.77 10.16 Participation agreement among Adobe Systems, Selco Service Corporation, et al. 10-K 2/21/02 10.78 10.17 Amendment No.1 to Lease Agreement between Adobe and Selco Services Corporation 10-K 2/26/03 10.81 10.18 Lease Agreement by and between Allaire Corporation and EOP Riverside Project LLC dated November 23, 1999 10-K 3/30/00 10.23 10.19 First Amendment to Lease Agreement by and between Allaire Corporation and EOP Riverside Project LLC dated May 31, 2000 10-Q 8/14/00 10.3 10.20 Form of Restricted Stock Unit Agreement used in connection with the Amended 1994 Performance and Restricted Stock Plan* X 10.21 Form of Restricted Stock Unit Agreement used in connection with the 2003 Equity Incentive Plan* X 10.22 Adobe Systems Incorporated 2004 Annual Executive Incentive Plan* 8-K 1/13/05 10.1 10.23 Adobe Systems Incorporated 2005 Annual Executive Incentive Plan* 8-K 1/13/05 10.2 10.24 Description of 2005 Director Compensation* 10-K 2/2/05 10.21 10.25 Description of 2006 Director Compensation* 8-K 9/23/05 10.1 10.26 Adobe Systems Incorporated 2006 Management Team Annual Incentive Plan * 8-K 1/13/06 10.1 10.27 2005 Equity Incentive Assumption Plan* 8-K 12/07/05 10.2 Exhibit Incorporated by Reference** Filed Number Exhibit Description Form Date Number Herewith 10.28 Form of Stock Option Agreement used in connection with the 2005 Equity Incentive Assumption Plan* 8-K 12/07/05 10.3 10.29 Allaire Corporation 1997 Stock Incentive Plan* S-8 03/27/01 4.06 10.30 Allaire Corporation 1998 Stock Incentive Plan* S-8 03/27/01 4.07 10.31 Allaire Corporation 2000 Stock Incentive Plan* S-8 03/27/01 4.08 10.32 Andromedia, Inc. 1996 Stock Option Plan* S-8 12/07/99 4.07 10.33 Andromedia, Inc. 1997 Stock Option Plan* S-8 12/07/99 4.08 10.34 Andromedia, Inc. 1999 Stock Plan* S-8 12/07/99 4.09 10.35 ESI Software, Inc. 1996 Equity Incentive Plan* S-8 10/18/99 4.08 10.36 eHelp Corporation 1999 Equity Incentive Plan* S-8 12/29/03 4.08 10.37 Blue Sky Software Corporation 1996 Stock Option Plan* S-8 12/29/03 4.07 10.38 Bright Tiger Technologies, Inc. 1996 Stock Option Plan* S-8 03/27/01 4.11 10.39 Live Software, Inc. 1999 Stock Option/Stock Issuance Plan* S-8 03/27/01 4.10 10.40 Macromedia, Inc. 1999 Stock Option Plan* S-8 08/17/00 4.07 10.41 Macromedia, Inc. 1993 Directors Stock Option Plan* 10-Q 08/03/01 10.02 10.42 Macromedia, Inc. 1992 Equity Incentive Plan* 10-Q 08/03/01 10.01 10.43 Macromedia, Inc. 2002 Equity Incentive Plan* S-8 08/10/05 4.08 10.44 Form of Macromedia, Inc. Stock Option Agreement* S-8 08/10/05 4.09 10.45 Middlesoft, Inc. 1999 Stock Option Plan* S-8 08/17/00 4.09 10.46 Form of Macromedia, Inc. Revised Non-Plan Stock Option Agreement* S-8 11/23/04 4.10 10.47 Form of Macromedia, Inc. Restricted Stock Purchase Agreement* 10-Q 2/8/05 10.01 Exhibit Incorporated by Reference** Filed Number Exhibit Description Form Date Number Herewith 10.48 Restricted Stock Purchase Agreement between Macromedia, Inc. and Stephen Elop, dated January 24, 2005* 10-Q 2/8/05 10.02 10.49 Restricted Stock Purchase Agreement between Macromedia, Inc. and Robert Burgess, dated January 24, 2005* 10-Q 2/8/05 10.03 10.50 Amended and Restated Employment Agreement by and between Robert K. Burgess, dated January 21, 2005* 8-K 1/21/05 10.01 10.51 Amendment to Employment Agreement by and between Adobe Systems Incorporated, Adobe Macromedia Software LLC and Robert K. Burgess, dated December 7, 2005* 8-K 12/12/05 10.2 10.52 Amended and Restated Employment Agreement between Adobe Systems Incorporated and Stephen Elop, dated May 23, 2005* S-4 6/28/05 10.1 10.54 Adobe Systems Incorporated 2006 Performance Share Program pursuant to the 2003 Equity Incentive Plan* 8-K 2/3/06 10.1 10.55 Adobe Systems Incorporated 2006 Performance Share Program pursuant to the Amended 1994 Performance and Restricted Stock Plan* 8-K 2/3/06 10.2 10.56 Form of Maximum Award Grant Notice used in connection with grants under the Adobe Systems Incorporated 2006 Performance Share Program pursuant to the 2003 Equity Incentive Plan* 8-K 2/3/06 10.3 10.57 Form of Performance Share Maximum Award Agreement used in connection with grants under the Adobe Systems Incorporated 2006 Performance Share Program pursuant to the 2003 Equity Incentive Plan* 8-K 2/3/06 10.4 10.57 Form of Performance Share Maximum Award Agreement used in connection with grants under the Adobe Systems Incorporated 2006 Performance Share Program pursuant to the 2003 Equity Incentive Plan* 8-K 2/3/06 10.4 Exhibit Incorporated by Reference** Filed Number Exhibit Description Form Date Number Herewith 10.58 Form of Maximum Award Grant Notice used in connection with grants under the Adobe Systems Incorporated 2006 Performance Share Program pursuant to the Amended 1994 Performance and Restricted Stock Plan* 8-K 2/3/06 10.5 10.59 Form of Performance Share Maximum Award Agreement used in connection with grants under the Adobe Systems Incorporated 2006 Performance Share Program pursuant to the Amended 1994 Performance and Restricted Stock Plan* 8-K 2/3/06 10.6 10.60 Adobe Systems Incorporated Executive Cash Bonus Plan DEF 14A 2/24/06 Appendix B 10.61 Employment Transition Agreement between Adobe Systems Incorporated and Murray J. Demo, dated March 21, 2006* 8-K 3/22/06 10.1 10.62 Employment offer letter between Adobe Systems Incorporated and Randy Furr, dated May 16, 2006* 8-K 5/22/06 10.1 10.63 Adobe Systems Incorporated Deferred Compensation Plan* 8-K 9/26/06 10.1 10.64 Adobe Systems Incorporated Executive Severance Plan in the Event of a Change of Control* 8-K 11/16/06 10.2 10.65 Employment offer letter between Adobe Systems Incorporated and Richard Rowley, dated October 30, 2006* 8-K 11/16/06 10.1 10.66 Confidential Resignation Agreement and General Release of Claims between Adobe Systems Incorporated and Peg Wynn, dated January 22, 2007* X 21 Subsidiaries of the Registrant X 23.1 Consent of Independent Registered Public Accounting Firm, KPMG LLP X 31.1 Certification of Chief Executive Officer, as required by Rule 13a-14(a) of the Securities Exchange Act of 1934 X 31.2 Certification of Chief Financial Officer, as required by Rule 13a-14(a) of the Securities Exchange Act of 1934 X Exhibit Incorporated by Reference** Filed Number Exhibit Description Form Date Number Herewith 10-K/A(Amendment No. 1)For the fiscal year ended December 1, 2006November 27, 2009ORoo TRANSITION REPORT PURSUANT TO SECTION 13 OR 15(d) OF THE SECURITIES EXCHANGE ACT OF 1934
___________________________, and (2) has been subject to such filing requirements for the past 90 days. YesxNo oo¨non-accelerated filer.smaller reporting company. See definitionthe definitions of “large accelerated filer, “accelerated filerfiler” and large accelerated filer”“smaller reporting company” in Rule 12b-2 of the Exchange Act.June 2, 2006,May 29, 2009, the last business day of the registrant’s most recently completed second fiscal quarter, was $14,829,198,488$12,843,687,113 (based on the closing sales price of the registrant’s common stock on that date). Shares of the registrant’s common stock held by each officer and director and each person who owns 5% or more of the outstanding common stock of the registrant have been excluded in that such persons may be deemed to be affiliates. This determination of affiliate status is not necessarily a conclusive determination for other purposes. As of December 29, 2006, 588,456,485January 15, 2010, 524,119,635 shares of the registrant’s common stock, $0.0001 par value per share, were issued and outstanding.20072010 Annual Meeting of Stockholders (the “Proxy Statement”), to be filed within 120 days of the end of the fiscal year ended December 1, 2006,November 27, 2009, are incorporated by reference in Part III hereof. Except with respect to information specifically incorporated by reference in this Form 10-K/A,10-K, the Proxy Statement is not deemed to be filed as part hereof.Adobe Systems Incorporated is filing this Amendment No.1 to Form 10-K to amend and restate its original Form 10-K that was filed on February 5, 2007 in order to replace the original Form 10-K, which was an incorrect version of the Form 10-K that was filed due to an error by a third-party Edgar filing service provider.Page No. 3542424344444647646868697072727272727311812012110-K/A10-K contains forward-looking statements, including statements regarding product plans, future growth and market opportunities which involve risks and uncertainties that could cause actual results to differ materially. materially from these forward-looking statements. Factors that might cause or contribute to such differences include, but are not limited to, those discussed in this section under “RiskItem 1A, Risk Factors.” You should carefully review the risks described herein and in other documents we file from time to time with the Securities and Exchange Commission (“SEC”), including the Quarterly Reports on Form 10-Q to be filed in 2007.2010. When used in this report, the words “expects,” “could,” “would”,“would,” “may,” “anticipates,” “intends,” “plans,” “believes,” “seeks,” “targets,” “estimates,” “looks for,” “looks to,”to” and similar expressions, as well as statements regarding our focus for the future, are generally intended to identify forward-looking statements. You should not place undue reliance on these forward-looking statements which speak only as of the date of this Annual Report on Form 10-K/A.10-K. We undertake no obligation to publicly release any revisions to the forward-looking statements or reflect events or circumstances after the date of this document.designers, knowledge workers, high-end consumers, original equipment manufacturers (“OEM”OEMs”), developers and enterprises for creating, managing, delivering, optimizing and engaging with compelling content and experiences across multiple operating systems, devices and media. We distribute our products through a network of distributors, and dealers, value-added resellers (“VARs”), systems integrators, independent software vendors (“ISVs”) and OEMs, direct to end users and through our own Web siteWebsite at www.adobe.com. We also license our technology to hardware manufacturers, software developers and service providers, and we offer integrated software solutions to businesses of all sizes. We have operations in the Americas;Americas, Europe, Middle East and Africa (“EMEA”); and Asia. Our software runs on personal computers with Microsoft Windows, Apple Mac OS, Linux, UNIX and various non-personal computingnon-PC platforms, depending on the product.Web siteWebsite at www.adobe.com. Investors can obtain copies of our SEC filings from this site free of charge, as well as from the SEC Web siteWebsite at www.sec.gov.videodynamic media production, and by delivering a ubiquitous technology platform, we help people express, share, manage, optimize and collaborate on their ideas in imaginative and meaningful new ways.information. Our customers also includeinformation; enterprise users—IT managers, Web analysts, marketing executives, line of business managers and executives; high-end consumers—digital imaging and digital video hobbyists and enthusiasts. OEM partners such as enthusiasts; application developers and OEMs—mobile device manufacturers, printer manufacturers, Internet service providers and developers.technology platform, which utilizesubiquitous client technologies including our universal Adobe Reader, and our Adobe Flash Platform which enables the development of products and solutions that dramatically improves how businesses and governments engage with their customers, employees and constituents. Our Adobe Flash Platform includes our broadly deployed Adobe Flash Player, software. Our technology platform allowsand our Adobe AIR software which enables developers to build and deploy rich media and Internet applications to client devices. Together, these client technologies allow users of our products and technologies to ensure reliable, secure and rich application experiences across devices, browsers desktops and devices.2006, coinciding with the completion of our acquisition of Macromedia, Inc. (“Macromedia”),2009, we categorized our products and services into the following businesses: Creative Solutions, Business Productivity Solutions, Platform and Print and Publishing. We further broke our Business Productivity Solutions business into two reported segments: Knowledge Worker and Enterprise. With our acquisition of Omniture, Inc. (“Omniture”) in the fourth quarter of fiscal 2009, we created and added a new segment called Omniture for the purpose of reporting Omniture results.Solutions, Enterprise, Omniture, Platform, and Developer Solutions, MobilePrint and Device Solutions, and Other.Publishing. This overview, organized by these segments, combines an explanation of our various market opportunities with a summary of our fiscal 20062009 results and a discussion of our strategies to address our market opportunities in fiscal 20072010 and beyond.professionals whoprofessionals. They use and rely on Adobe’s solutions for professional publishing, Web design and development, professional photography, video production, animation and motion graphic production and printing visually rich information.Web sites,Websites, Rich Internet Applications (“RIAs”), catalogs, advertisements, brochures, product documentation, books, memos, reports and banners. Our tools are also used to create and enhance visually rich content, including video, animation and mobile content, that is created by multimedia, film, television, audio and video producers who work in advertising, Web design, music, entertainment, corporate and marketing communications, product design, user interface design, sales training, printing, architecture and fine arts. Knowledge workers, educators, hobbyists and high end consumers are also attracted to our creative products to create and deliver content that is of creative professional quality.everconstantly changing ways in which people choose to receive information, creative professionals look to their software tools as a means to make their information impactful and to repurpose content across a variety of media, applications and applications.systems. They desire greater efficiency from the software they use to streamline their publishing and content creation workflows and to effectively manage their assets. They also look for new and innovative ways to deliver their content and information to hand-held devices such as mobile handsets and consumer electronic devices.Adobe’s brand and customer loyalty in this market continues to be strong. upgradeupgrades and new unitsversions of our Creative Solutions products due to the high degree of innovative new features and significant productivity gained through their use. They also frequently purchase license upgradeupgrades and new unitsversions of these products when they buy new computers, or migrate to new or updated operating systems.at workin enterprises, educators and students in schools and universities, and hobbyists at home license our Creative Solutions products. Knowledge workers desire professional-quality products to accomplish tasks such ascommunication,online communications and photo albums, community newsletters, Web blogs, animations, videos and web sitesWebsites for family, friends or community organizations.The businesses of creative professionals are sensitive to the economy as they derive their revenue mainly from corporate marketing, product marketing and ad spending in corporations. In difficult economic times, corporations tend to reduce marketing spending and the businesses of creative professionals often may decline. Conversely, in an environment where the economy is stable or improving, corporations tend to increase their marketing spending, which leads to stable or improved business conditions for creative professionals. Thus, depending on economic conditions and the status of their businesses, these users adjust their spending on items such as hardware and software, and the staffing levels within their company. Due to this correlation, our Creative Solutions opportunity is closely linked to the performance of the economy in each of the countries in which we do business.Web site and mobile deviceWebsite content created by our customers to deliver impactful and compelling Web-based experiences for their constituents.adoption makesspeeds have made the Web a viable platform for the delivery of rich media, especially digital video. In turn, the growth in the use of high definition TVs (“HD”HD TVs”) televisions and video is driving the need for HD-enhanced video tools to produce HD content for movies and cablecommercial television, as well as the need to deliver or repurpose this content to be viewed on the Web across PC and commercial television.Web sites that leverage the adoption of broadband.Websites. We believe professional videographers are upgrading their systems to support HD video content creation, enhancement and delivery. We also believe hobbyists will use, with more frequency, digital imaging and digital video software and online hosted software services as they purchase more affordable digital SLR cameras and digital video cameras.2006,2009, our creative business was adversely affected by the global economic recession and the weak general macro-economic environment. This caused revenue for our Creative Suite 4 (“CS4”) family of products to be more than 20 percent weaker than revenue achieved with the prior version for a comparable period of time since release. Despite this economy-driven weakness, we maintained our focus on driving adoption of our creative products during the year—particularly ourwith large media companies and enterprise customers. Our CS4 family of products, which first shipped in fiscal 2008, incorporate Adobe Creative Suite products, our Macromedia Studio product, and software bundles containing variations of both. Available in two options (Standard and Premium), the Adobe Creative Suite incorporates several of our technologies used by creative professionals into one product and is a complete design solution that provides efficiency through improved product integration and integrated workflow capabilities.After achieving combined record revenue for our Adobesix Creative Suite editions and Macromedia Studiothirteen individual creative products, providing offerings for the various creative disciplines our customers desire. These disciplines include end-user markets such as interactive design for print and Web, as well as rich media and digital video creation. After significant weakness in the first quarter of fiscal 2006, we began to experience a decline in revenue with these products starting in our second quartertwo months of the fiscal year. We attributed this decline to awareness by ouryear, licensing of CS4 products remained stable through the remainder of the year despite the uncertain global economic conditions in end-user creative professional customers of new versions of the products that are expected to ship in fiscal 2007. We also attributed customer deferral of purchase of Creative Suite products to our customers’ desire to have new support in Adobe applications for the Apple hardware platform which includes Intel-based processors—something we publicly stated would not be available until the next release of the Creative Suite family of products.In fiscal 2006, we also continued to focus on driving adoption of our dynamic media and digital video-based technologies. In the first quarter of fiscal 2006, we released new versions of our digital video products, including Adobe Premiere Pro version 2.0 software for video editing, Adobe After Effects version 7.0 software for adding special effects to video, Adobe Audition version 2.0 software for audio editing and Adobe Encore version 2.0 software for DVD creation. Along with these individual digital video products, we also delivered a new suite containing these technologies called Adobe Production Studio.In addition to various new features and ease-of-use improvements found in each of the new releases, we added enhanced support for Flash Video output to our family of digital video products to leverage the broad, increased adoption of Flash Video on the Web as a means to deliver compelling video content. These new features combined with the enhanced Flash Video support helped drive record revenue and more than 45 percent year-over-year growth for our digital video business in fiscal 2006. Adobe also won a prestigious Technical and Engineering Emmy Award from the National Academy of Television Arts and Sciences for its Flash Video technology, in recognition of the software’s pivotal role in bringing television content to the Internet.In addition to licensing our technologies as bundles or as suites during fiscal 2006, we also continued to focus on adoption of our standalone products such as Adobe After Effects Professional, Adobe InDesign, Adobe Illustrator, Adobe Photoshop, Adobe Premiere Pro, Macromedia Dreamweaver, and Macromedia Flash.In the professional page layout market, we continued to drive market share gains duringwith our Adobe InDesign product. In addition to success with the standalone desktop version, we also saw the InDesign ecosystem grow in fiscal 2006—our software and systems integrator partners successfully deployed new innovative workflow solutions based on InDesign and InDesign Server within enterprise-class newspaper, magazine and book publishing systems. Our success in these areas contributed to a second consecutive year of record revenue in this product category.We also maintained our focus during the year on meeting the digital imaging and video software needs of professional photographers, professional videographers, business users and hobbyists. Adobe Photoshop is an essential tool in these customers’ workflows and they rely on Adobe’s digital imaging and video editing solutions to create and enhance many of the pictures and video we see everyday in print, on television, in movies and on the Web.first quarterdynamic media market, which includes users who require new and advanced digital video and animation technologies, we continued to focus on driving adoption of fiscal 2006, weour new digital video-based technologies. We released a new beta version of Adobe Photoshop Lightroom. Photoshop Lightroom is an all-new digital imaging solution targeted at professional photographers that delivers an efficient, powerful way to import, select, develop and showcase large volumes of digital images.In addition, duringFlash Media Server 3.5 (“FMS”) in the fourth quarter of fiscal 2006,2009 which provides improved dynamic streaming and HTTP delivery capabilities, performance improvements and enhanced digital rights management capabilities for H.264 video and digital video recorder functionality. The launch of FMS, which is licensed either directly by our customers or licensed through our Flash Video Streaming Service via Content Delivery Network (“CDN”) partners such as Akamai and Limelight, helped to maintain the broad adoption of Flash Video (“FLV”), the video file format compatible with Adobe Flash Player as5.08 of our Adobe Photoshop Elements software which is our digital imaging application targeted for amateur photographers and digital imaging hobbyists. In the same quarter, we released version 3.08 of Adobe Premiere Elements software which is our video editing software that can be used by hobbyists to enhance and share their digital video memories on DVDs. We also released a software bundle that includes the new versions of Adobe Photoshop Elements and Adobe Premiere Elements to target hobbyists who desire both applications in one affordable package. TheseDespite success with these new hobbyist product releases, helped to generate recordoverall revenue in this productthe hobbyist category duringdeclined year-over-year due to the year, and contributed year-over-year revenue growth to our overall creative business.2007,2010, our Creative Solutions strategy will continue to focus on driving revenue growth and increasing market share of our products through the delivery of comprehensive software platformssolutions that meet the evolving needs of our customers. To help drive this strategy, we plan towill deliver CreativeSuite version 3, which will contain improved integrationnew versions of our Creative SolutionsSuite family of products to enhance product functionality and to enableduring the year with a focus on improved integration between our products, more efficient collaboration and workflows.In addition, theworkflow capabilities, and enhanced functionality – particularly in areas related to interactivity and rich media use related to Adobe Flash content creation, mobile and alternative device content creation, and enhancement of digital video and motion graphics by creative professionals, and opportunities to improve user workflow andhosted cloud-based services which will augment the delivery of this content to the Web and to mobile and other non-PC related devices, represent an emerging opportunity we intend to address as partcapabilities of our Creative Solution offerings. or will make the switch to our Creative Suite productseditions from individual applications over time,creative products, there continuesstill remains a large opportunity to exist an opportunity of upgrading existingmigrate customers from individual application users to newer versions of these individual applications. In addition, we will market the benefits of newer versions of the Creative Suite to existing Creative Suite and Macromedia Studio users to drive Creative Suiteproducts to Creative Suite editions – particularly in emerging markets and Studio toother large geographic markets outside the United States where our Creative Suite upgrades.penetration is lower. We also believe many customers who did not migrate to newer CS4 releases during 2009 due to economic factors could upgrade to new versions of our products in 2010, due to new and enhanced features, improved productivity gains, support for the latest Microsoft and Apple operating systems that are being adopted by our customers, new hardware purchases by our customers which could cause them to update old versions of creative software, and the addition of features in some of our creative products which will provide better integration with our Omniture Web analytics and business optimization products.new users of creative applications—those who aspireprovide innovative ways to be creative professionals, or those at home or at work who wish to use the professional-level capabilities of our solutions, but are not trained creative professionals.and Web layout and illustration software markets. In page layout, we intend towill continue to add new features to our InDesign product with a focus on cross-media publishing workflows, as well as continue to enhance its integration with other products print professionals utilize in their workflows. In Web layout, we strive to continue to redefine the Web experience by offering the most feature-rich, market-leading solutions for Website design and development with our Dreamweaver and Flash offerings.enhancework on enhancements for our Photoshop family of product offerings to meet the evolving needs of professional photographers, and creative professional customers including(including graphic designers, Web designers and video producersproducers) and imaging enthusiasts to drive upgrades and new user adoption. We also plan to release version 1.0 ofadd new capabilities to Adobe Photoshop Lightroom, which will improve integratedour digital photography workflowsworkflow tool for professional photographers.photographers and hobbyists. In addition, as we have seen during the past three fiscal years, wecontinue to believe many customers will continue to license the Photoshop product capabilities via our Creative Suite productseditions as opposed to licensing the standalone version.strongest, market-leading, end-to-end digital video, motion graphic and animation authoring platform for our customers. To grow this business, we will continue to market the advanced features, the cross-platform and cross-device capabilities, and the workflow benefits of this platform to creative professionals and videographers in the film, broadcast, corporate and event videography market segments,segments. We are also enhancing our FMS solution to deliver the highest quality video streaming capability and we are working with partners to deliver integrated video systems.systems and video delivery services. With broad adoption of Adobe Flash Player and its high-quality video playback features, we will continue to work to provide aon advancing our seamless video authoring-to-playback workflow capability for those wishing to provide a rich video experience on the Web.number of imaging and video hobbyists desiring easy-to-use video editing solutions grows, we intend to enhance the video editing and DVD creation capabilities of our Adobe Premiere Elements product for the sharing of digital video memories. We also plan to continue to target the imaging and video hobbyist markets with an integrated offering of our Photoshop Elements and Premiere Elements products.With our set of professional digital video and motion graphic products, we strive to provide the strongest, market-leading digital video, motion graphic and animation authoring platform for our customers. To grow this business, we will continue to market the benefits of this platform to creative professionals and videographers in the film, broadcast, corporate and event videography market segments, and we are working with partners to deliver integrated video systems. With broad adoption of Adobe Flash Player and its high-quality video playback features, we will work to provide a seamless video authoring-to-playback capability for those wishing to provide a rich video experience on the Web. In addition, as theEffects—professional Effects Professional—software used to create sophisticated animation, motion graphics and visual effects found in television broadcast, film, DVD authoring and the Web; available in two versions: After Effects Standard provides basic 2D and 3D compositing, animation and visual effects tools; After Effects Professional addstools, as well as advanced features such as motion tracking and stabilization, advanced keying and warping tools, more than 30 additional visual effects and additional audio effects.Premium Edition—Design Premium—an integrated software solution that creative professionals can use as a platform to modify and enhance digital images, create graphics, produce professional-quality printed publications, create and maintain dynamic Web sites, author visually rich content for wireless Web devices, and share content reliably for print, Web and screen display. The suitemobile content publishing; combines Adobe Acrobat Professional,Pro, Adobe GoLive,Dreamweaver, Adobe Flash Professional, Adobe Illustrator, Adobe InDesign and Adobe Photoshop Extended technologies with file management and integration technology called Version Cue, and a navigationalfile management and control center called Adobe Bridge.Standard Edition—Design Standard—an integrated software solution that creative professionals can use as a platform to modifyutilize for professional design and enhance digital images, create graphics,print production, page layout, image editing, illustration and produce professional-quality printed publications. The suiteAdobe PDF workflows; combines Adobe Acrobat Pro, Adobe Illustrator, Adobe InDesign and Adobe Photoshop technologies, with file management and integration technology called Version Cue, Adobe Bridge, Adobe Device Central and a navigational control center called Adobe Bridge.8DVD—Adobe Fireworks, Adobe Flash Professional, Adobe Illustrator, Adobe InDesign, Adobe Photoshop Extended, Adobe Premiere Pro and Adobe Soundbooth technologies, Version Cue, Adobe Bridge, Adobe Device Central, Adobe Acrobat Connect and Adobe Dynamic Link which enables intermediate rendering for a smoother workflow between video production tools.GoLive—Fireworks—a professional graphics design tool that allows users to rapidly prototype and design Websites and Web designapplication interfaces while giving professional designers and publishing softwaredevelopers tools for creating images that can be deployed to Web browsers, Adobe Flash Player and Adobe AIR; integrates with Adobe Dreamweaver, Adobe Flash and Adobe Photoshop, and supports Adobe AIR application development.innovative toolsa flexible development environment for creating and delivering interactive media applications; utilized by many industries, including media and entertainment, telecommunications, advertising, government and education.Web authors use to design, layout, produce and maintain content for Web sites and wireless Web devices without the need for complex multimedia programming.Adobe Graphics Server—imaging server softwarecan be used to createdeliver live streaming and maintain digitalvideo-on-demand streaming; configured for lower volume streaming of content that is suitable for small- and medium- size streaming needs.images on frequently updated data-driven content, such asadditional video functionality; solutions built with Adobe Flash Professional are deployed via the Web sitesto browsers and printed catalogs, by automating the creation and the reuse of images; integrates with content management and e-commerce systems to automate workflows, and eliminates the tedious manual tasks of refining and reformatting images for specific purposes.the Web.itthat enables Adobe and its industry partners to deliver powerful publishing solutions for magazine, newspaper and other publishing applications.Adobe Photoshop Album—offers easy-to-use interface to find, organize, share and edit digital photographs; designed for consumers to manage their collections of digital photographs, easily share photos via e-mail and the Web, create digital slide shows and photo albums, and get their photographs printed via on-line photo finishing services.Adobe Photoshop Album Starter Edition—a limited-feature version of Photoshop Album available for free; lets consumers find photos fast, fix common flaws and easily share images with others.a new productsoftware designed for professional photographers and photo hobbyists, it addresses their unique photography workflow needs by providing more efficient and powerful ways to import, select, develop and showcase large volumes of digital images.Adobe Production Studio Premium Edition—a suite of integrated application products that provides a complete digital video post-production environment and allows users to produce professional-quality video, film and DVDs; includes Adobe After Effects Professional Edition, Adobe Audition, Adobe Encore DVD, Adobe Illustrator, Adobe Photoshop and Adobe Premiere Pro, along with Creative Suite 2 features for timesaving workflow features such as Adobe Dynamic Link and Adobe Bridge.Adobe Production Studio Standard Edition—a suite of integrated application products that provides a digital video post-production environment and allows users to produce professional-quality video; includes Adobe After Effects Standard Edition, Adobe Photoshop and Adobe Premiere Pro, along with Creative Suite 2 features for timesaving workflow features such as Adobe Dynamic Link and Adobe Bridge.a newan application that provides video editors, designers and others who do not specialize in audio with the tools that they need to accomplish audio-based tasks in their everyday work, such as removing noise from recordings, polishing voiceovers and customizing music to fit a video or animation production.Stock Photos—Story—new online collaborative script development tool currently in beta release and made available as a service that allows usershosted service; can be used to begin the planning and preproduction phase of video workflows and will be integrated with other Adobe products, including future versions of the Adobe Creative Suite productsproduct family; developed to purchase stock photography from leading stock photography agencies directly from within their applications.email, CD/,e-mail, CD, DVD, PowerPoint or live over the Internet.DV Rack HD—direct-to-disk recordingmonitoring software which helps generate superior quality video from an SD or HD camera connectedrun a Website to a laptop computer.either through direct sales, or together with leading content delivery network (CDN) providers,via CDN partners, Adobe offers hosted services for streaming on-demand video for the Adobe Flash Player runtime across high-performance networks; built with Adobe Flash Media Server, Flash Video Streaming Service provides an effective way to deliver Flash VideoFLV to large audiences without the overhead of setting up and maintaining streaming server hardware and network.Macromedia Dreamweaver—a professional software application used by designers and developers to create a broad range of Web solutions for publishing online commerce, customer service and online educational content; includes capabilities for visually designing HTML pages, coding HTML and application logic and working with application server technologies.Macromedia Fireworks—a professional graphics design tool for building interactive Web graphics; gives professional designers and developers tools for creating images that can be deployedused to Web browserscreate and the Adobedeliver custom online media players for content owners; enables developers using Flash Player; integrates with Adobe Flashtechnologies to quickly and Macromedia Dreamweaver.Macromedia Flash Basic—a software development application for creating interneteasily add rich functionality such as advertising, user measurement and rich interactive applications which integrate animations, motion graphics, sound, texttracking, and social network integration into new custom video functionality; solutions built with Macromedia Flash are deployed via the Web to browsers and to devices that run the Adobe Flash Player.Macromedia Flash Media Server—offers streaming media capabilities to deliver video on demand, video blogging and messaging, Web conferencing, and live video capabilitiesplayers that can be viewed via the Flash Player; provides a flexible development environmentbranded for creating and delivering interactive media applications; utilized by many industries, including media and entertainment, telecommunications, advertising, government, and education.Macromedia Flash Professional—provides an advanced development environment for creating internet applications which integrate animations, motion graphics, sound, text and additional videofunctionality; solutions built with Macromedia Flash Professional are deployed via the Web to browsers and to devices that run Adobe Flash Player.Macromedia Studio—an advanced suite of integrated application tools for developers and experienced designers who develop internet and mobile solutions, and require additional video capabilities when developing Flash content; includes Macromedia Dreamweaver, Macromedia Flash Professional, Macromedia Fireworks, Macromedia Contribute and Adobe Flash Player.Ultra—softwaretransform digital videoautomate the production and HD keyingavailability of rich media experiences, including zoom, dynamic sizing, personalization and interactive dynamic product catalogs.· · · a practical daily production tool for all types of video professionals users.Vlog It!—software which allows users to easily create dynamic video blogs containing photos, audio, video clips and narration.Solutions SegmentSolutions Market OpportunityOur Knowledge WorkerSegment focuses onfocus, we address the needs of the knowledge worker customer whowhom we define as someone working in document intensive industries, focused on creating and disseminating high-value information as part of their job on a regular basis. Knowledge workers include a wide variety of job functions—such as accountants, administrative assistants, executives,attorneys, architects, educators, engineers, graphic designers, insurance underwriters software developers and stock analysts—just to name a few.analysts. These jobs typically require the sharing of information either in an information dissemination (one-way) format,as a static, published document or inas a collaborative, (multi-way) format. and ubiquitous format that ensures coworkers and constituents can reliably and securely access the information. When appropriate, this information often needs to be protected or securely managed.Collaborationmanaged and controlled.thatwho participate in collaborations with their colleagues may be located in offices next door to each other, or in different parts of the world. These team members may change with every project and either be part of an organization’s employee base, or be an external consultant or third partythird-party partner.to beis a significant opportunity to provide solutions which enable knowledge workers to communicate and collaborate across technical, geographical and social boundaries, both inside and outside of their companies. We believe that with such solutions, users can collaborate and efficiently manage feedback from their colleagues in both real time and on-demand, and control how, when and by whom information is accessed.For more than ten years,requireneed capabilities such as those provided by Acrobat who have not yet licensed an AcrobatAcrobat- based solution.sharing and collaborating on documents reliably across disparate platforms withcomplementing our Acrobat we believe there isdesktop solutions, Acrobat.com also serves as an adjacent market opportunity wherebyintroductory service for knowledge workers will increasinglywho wish to utilize Web conferencing solutions to more effectively collaboratePDF-creation capabilities and consult with their colleagues, partners, and customers. We also believe businesses will increasingly utilize Web conferencing to improve how they train, market, sell, and support their products and solutions to their customers.We have recently announced and released a new product called Adobe Acrobat Connect, which was formerly known as Macromedia Breeze. Acrobat Connect provides capabilities via the Adobe Flash Player for live Web conferencing, as well as delivering on-demand rich presentations. By integrating accessibility to the functionality ofReader, but have not yet licensed an Acrobat Connect from Acrobat and the free Adobe Reader, we believe we can extend adoption of Web conferencing to a broader potential market and grow the use of such technology with an easy-to-adopt business model.Solutions Business SummaryOur Knowledge Worker business achieved solid year-over-year growth and record revenue in2006. The largest component of2009, our Knowledge Worker business was adversely affected by the recession and the weak general macro-economic environment. This caused revenue generated byfor our Knowledge Worker products to be approximately 23% weaker than revenue achieved in fiscal 2008. Despite this economy-driven weakness, we maintained our focus on driving adoption of our Acrobat products during the year—particularly with enterprise and government customers.products. In fiscal 2006, successproducts, which first shipped in this business was driven by continued adoptionAugust of Adobe Acrobat version 7.0 throughout the year, as well as the launch of Adobe Acrobat version 8 which began shipping in the later part of our fourth quarter and helped to achieve record quarterly revenue in the fourth quarter for this business.The updated version 8 product family2008, offers enhanced features that allow workgroups to manage a range of essential business activities such as assembling documents from multiple sources, controlling security and access to sensitive information, enabling the creation and filling out of intelligent electronic forms and more effectively collaborating on documents and projects. In addition, the new Acrobat 89 family of products providesallows users to unify a new user interfacewide range of content into a PDF Portfolio. Users can assemble documents, drawings, e-mail, spreadsheets and additional functionalityrich media—including audio, video, 3D and maps — in a single, compressed PDF Portfolio. Other version 9 features and enhancements included the ability to: create interactive, on-demand presentations using Adobe Presenter software; easily share video in PDF using FLV; improved security to address specific customer workflow issueshelp protect and control access to PDF documents; permanently remove sensitive information through the use of redaction tools to black out sensitive text, illustrations, or other information; easily create and manage electronic forms; and enable anyone using the free Adobe Reader to digitally sign documents, participate in vertical markets such as architecture, engineering, construction, manufacturing, education, governmentshared document reviews and financial services.save forms locally. These enhanced capabilities helped to continue the increase of our penetration of Acrobat desktop licenses in enterprises, thereby helpingenterprises.businessCreative Suite products has also contributed to grow.To supplement our vertical market focus withbroader adoption of Acrobat we also shippedin the creative professional market. Acrobat Pro is included in four of the six Creative Suite editions and utilization of Acrobat prepress, printing and collaboration functionality is a new product called Adobecritical component of creative customer workflows. As such, adoption of Acrobat 3Dthrough the Creative Suite family of products has resulted in a material amount of Acrobat revenue being reported in our Creative Solutions Segment during the year.2006. Acrobat 3D extends document-based three dimensional (“3D”) design collaboration2009, we enhanced its capabilities to virtually anyone inwith easier file sharing, improved remote access including mobile device access, and the design supply chain—from engineers to manufacturers. Acrobat 3D utilizes Adobe PDF as a cross-platform standard to share complex 2Daddition of new spreadsheet and 3D content withoutpresentation authoring capabilities. We believe this compelling subscription-based service will enhance the need for using proprietary viewing technology for recipients receiving such content.Overgrowth capabilities of the course of fiscal 2006, we also focused on the Web conferencing market opportunity with our Macromedia Breeze product line, which is licensed by customers as server-based software, or licensed as a hosted service that we provide. This business model focuses on charging meeting organizers for the ability to host meetings, and allows for participants to join meetings for free utilizing the ubiquitous Adobe Flash player. With the release of Acrobat version 8, we re-launched Macromedia Breeze as Adobe Acrobat Connect and integrated the ability to start an online Web conference from within the new Acrobat family of products as well as throughin the new version (free) of Adobe Reader.Finally, as a supplement to our knowledge worker desktop products, we introduced a new hosted service that provides the ability to protect and secure PDF documents for a monthly fee.Solutions Business Strategy2007,2010, we plan to continue to market the benefits of our Knowledge Workerknowledge worker solutions to small and medium-sized businesses, large enterprises and government institutions around the world. With our Acrobat family of products, we intend to continue to increase our seat penetration in these markets through the utilization of our corporate and volume licensing programs. We also intend to increase our focus on marketing and licensing Acrobat in targeted vertical markets such as education, financial services, telecommunications and government, manufacturing,as well as expanding into emerging markets.architecture, engineering, and construction markets.With our Acrobat Connect product,macro-economic downturn. In addition, we intend to increase awarenessupdate the capabilities of our solution in targeted horizontal markets such as traininghosted service, Acrobat.com, to increase the value of the service to existing and marketing,new users. As the use of Acrobat.com grows, we intend to target users of the free aspects of the service with paid-for functionality that will enhance their use of the overall solution.targeted vertical marketssimple PDF creation, an online word processor called Buzzword, an online spreadsheet authoring tool called Tables, an online presentation creation tool called Presentations, and personal Web conferencing services with Adobe ConnectNow.manufacturing, financial servicesMicrosoft Office software, graphics applications and telecommunications. We also intendmore; supports automated collaborative workflows with a rich set of commenting tools and review tracking features; includes everything needed to market the benefits of how our Acrobatcreate and Acrobat Connect solutionsdistribute rich electronic documents that can be used together to meetviewed easily within leading Web browsers or on computer desktops via the synchronous and asynchronous collaboration needs in the marketplace. With the broad distribution and reach of our free Adobe Reader, we also intendReader.exposeall the capabilities of Acrobat ConnectStandard, Acrobat Pro delivers specialized capabilities for creative professional and engineering users, such as pre-flighting, color separation and measuring tools; also allows users to potentially new users with a simple-to-adopt business model based on monthlyinsert FLV or annual subscription fees.Knowledge Worker Solutions Products3D—and Adobe Reader, create dynamic XML forms with Adobe LiveCycle Designer ES and create PDF documents that enable Adobe Reader users to digitally sign PDF documents.software.(formerly Macromedia Breeze)—Pro product line as part of our CIS offerings. Connect Pro provides capabilities via Adobe Flash Player for live Web conferencing, as well as delivering on-demand rich presentations through an on-premise server or as a hosted service. By also offering Web conferencing services as part of our LiveCycle family of products, we believe we can extend adoption of Web conferencing to a broader potential market and grow the use of such technology with an easy-to-adopt business model.Adobe Acrobat Elements—desktop software that enables enterprises to extend the value of their Microsoft Office investment by standardizing on Adobe PDF for reliable document distribution; provides for the easy conversion of Microsoft Office documents to Adobe PDF, preserving document integrity for reliable viewing and printing on other operating systems and hardware platforms inside and outside the enterprise’s IT firewall.Adobe Acrobat Messenger—software that works with a scanner or digital copier and is designed for workgroups and departments to transform paper documents into electronic Adobe PDF files and deliver them via e-mail, Web or fax; allows users to preview their documents on-screen, crop or rotate pages, and add electronic annotations.Adobe Acrobat Standard—creates secure, reliable and compact Adobe PDF files from desktop authoring applications such as Microsoft Office software, graphics applications and more. Supports automated collaborative workflows with a rich set of commenting tools and review tracking features; includes everything needed to create and distribute rich electronic documents that can be viewed easily within leading Web browsers or on computer desktops via the free Adobe Reader.13Adobe Acrobat Professional—in addition to all the capabilities of Acrobat Standard, Acrobat Professional delivers specialized capabilities for creative professional and engineering users, such as pre-flighting, color separation and measuring tools.Adobe Document Center—a hosted service that enables businesses to secure and mange Adobe PDF files and other common business document files such as those in Microsoft Office formats.Create Adobe PDF Online—a Web-based subscription service that provides for the easy conversion of Microsoft Office documents and other application files to Adobe PDF for the secure and reliable sharing of rich electronic documents that can be viewed easily within leading Web browsers or on computer desktops via the free Adobe Reader.Enterprise and Developer Solutions SegmentEnterprise and Developer Solutions Market OpportunityEnterprises are under increasing pressure to save money, offer improved customer service, adhere to regulatory requirements and leverage existing investments in core systems. As a means to address these issues, a critical component of an organization’s business processes is the need to interact with data stored in enterprise applications. As this need expands beyond the core users of those applications, adapting systems to accommodate a diverse group of users has become an expensive and time-consuming endeavor. The outcome is a proliferation of manual workarounds that result in process inefficiencies, delays and poor quality of information.In addition, enterprises have built Web applications which enjoy the reach of the Web but often fail to deliver a user interface with the ease of use and richness that users expect. This impedes utilization of these applications and increases training costs, reducing the overall return on investment (“ROI”) that enterprises expect. Organizations are now looking to Rich Internet Applications (“RIA”) to boost their ROI for these Web applications by combining a rich graphical application interface with the universal reach of the Web.We believe significant opportunities exist to help enterprises address these issues by making their business processes more efficient and their Web applications more engaging. To address these opportunities, we offer Adobe Enterprise and Developer Solutions to securely extend the reach of information, processes and services to engage with customers and constituents. Our solutions leverage our technology platform, which helps businesses and government agencies inspire commitment in their customers and constituents by engaging them—anywhere, any time, and in any medium through our universal clients and application solutions.Our technology platform utilizes our universal Adobe Reader and Adobe Flash Player software, which ensure reliable, secure and rich application experiences across browsers, desktops and devices. The technology platform provides developers with an RIA programming model to integrate and optimize workflows, and a server software framework to simplify integration and leverage existing enterprise infrastructures. We also offer services and other software components to accelerate the creation of compelling, relevant and actionable applications, either through RIAs or through intelligent electronic documents.We believe our technology platform revolutionizes how enterprises and government agencies present, deliver, consume and interact with information and content. By providing an integrated client-server framework and toolset for developers, designers and IT organizations, we believe our Enterprise and Developer Solutions allow our customers to:· Engage their constituents with compelling experiences and intelligent documents—providing them with the ability to act upon information or tasks presented to them for improved and effective collaboration;· Streamline and accelerate document-based processes so more work gets done;· Simplify the creation and deployment of compelling, relevant and actionable applications;· Augment existing enterprise infrastructures to deliver the next level of engagement with their stakeholders;· Scale these solutions needs regardless of the size of their constituent populations; and· Leverage the ubiquitous Adobe Reader and Adobe Flash Player clients to reach people inside and outside of their organizations, and across all desktops and devices.Although our Enterprise and Developer Solutions address the needs of a diverse set of enterprise customers, we focus primarily on key vertical industries such as financial services, telecommunications, media and publishing, education, manufacturing, government and life sciences. For these customers, we offer comprehensive, scalable, secure and reliable server products and tools to develop applications tailored to their specific information and business process requirements.Our Enterprise and Developer Solutions currently offer several families of products that we market to these customers:· Adobe LiveCycle—provides process management services to automate paper-based processes, leveraging the ubiquitous Adobe Reader for viewing, printing and interaction with information provided in Adobe PDF-based documents;· ColdFusion MX—provides a server-scripting environment and a set of features used by organizations for building database-driven applications that are accessible through Web browsers and the Adobe Flash Player; and· Adobe Flex—provides a standards-based programming framework for building and deploying enterprise-class RIAs; an Eclipse-based Integrated Development Environment (IDE); and a powerful set of server-side services for connecting with Enterprise infrastructure.These solution sets are built on a common server architecture based on J2EE and XML, allowing for easy integration into enterprise infrastructures.Our Adobe Flex solutions utilize the Flash file format and leverage our widely-used Flash Player technology. With Flex, developers are able to combine the rich user interface of desktop software with the reach and ease of deployment of the Web, and the processing power of desktop computers and mobile devices. This combination enables the delivery of more complex interactions than are currently supported by the Web browser model. Flex applications extend the server-based object model to client systems, improving interactivity by eliminating the constant page refreshes and context switches that users frequently experience. As a result, Flex applications enable organizations to provide users with a dramatically improved experience that supports the manipulation of data and information in ways that are impractical in a traditional browser-based environment.Sample uses of Adobe Flex applications to build RIAs include the following:· Guided selling—Adobe Flex can aid the design and development of product-oriented applications, such as configurators, selectors, comparison engines and shopping carts. Such applications can provide customers with an integrated experience from initial inquiry to final purchase. By reducing customer search time and leading customers directly to the items they want, guided selling can increase conversion rates, drive larger sales and reduce shopping cart abandonment;·Data dashboards—Adobe Flex can provide charting, graphing and drill-down capabilities that make it easy to consolidate data from disparate systems without slow page refreshes. Businesses can benefit from faster decision cycles and improved access to information; and· Process and data integration—With Flex, businesses can consolidate data and information, and align processes to meet the unique needs of internal and external users. Automated process and data integration can increase accuracy, improve efficiency and enhance customer service through faster response times.To build and deliver enterprise-class RIAs, the following components are required:· Adobe Flex Data Services—Our Flex Data Services is an application that acts as the application and services intermediary between Flex applications and the existing enterprise environment. Flex Data Services easily integrates with existing enterprise application servers, and leverages existing resources and policies for functions such as deployment, session management and security;· Industry-standard IDE—Flex applications can be built and tested using Adobe Flex Builder or a third-party IDE such as Borland JBuilder, Microsoft Visual Studio and others; and· Adobe Flash Player client—The ubiquitous Adobe Flash Player client runtime application provides the user interface to Flex applications.Our Capturesolutions utilize Adobe PDF documents which interact with core business applications and integrate information contained in those documents into business processes. In addition to being reliable electronic replicas, Adobe PDF documents are “intelligent” - they retain the best characteristics of paper documents, such as a familiar look, but add powerful business logic capabilities such as data validation and automated routing instructions. In addition, arbitrary data (including XML-based data) can be embedded inside of intelligent PDF documents for use or access later on in a business process. These features allow for more efficient interaction with enterprise applications while still providing the ability for people to manually access and interact with the data when necessary.Our LiveCycle products leverage our Adobe Reader software—with more than 500 million distributed copies of Adobe Reader, we have created a ubiquitous platform for accessing and interacting with intelligent electronic documents. Adobe Reader is available on the most common operating system platforms free of charge, including Microsoft Windows, Apple Macintosh, Linux, various Unix-based platforms, and portable device systems such as Palm OS, Pocket PC and the Symbian operating system for cellular phones. As a universal client, Adobe Reader enables users inside and outside the firewall to interact with intelligent PDF documents on most platforms, including desktops, laptops, PDAs, mobile phones and kiosks, regardless of the application used to author the document.To address the specific needs of our customers, we offer “process management services.” These are services are sets of technologies that create, integrate and manage intelligent documents, and leverage the use of our Adobe Reader software for our customers’ constituents to interact with data within the document. Process management services that we currently provide include:· Process Automation—products and solutions which allow organizations to automate form-based workflows deploying intelligent data capture systems and rules-based process management to automate business transactions;· Information Assurance—products and solutions to control document access and usage, enable the use of digital signatures as a replacement for paper and pen-based signatures and certify document authenticity; and· Document Generation—products and solution which enables users to generate high-quality documents in real time and via batch processes. This can be done from desktop applications or dynamically from core systems. These products and solutions dynamically generate personalized, customer-facing documents from enterprise applications for enhanced customer communications.Our ColdFusion products provide fast and easy ways to build and deploy powerful Internet applications. Developers can extend or integrate ColdFusion with Java or .NET applications, connect to enterprise data and applications, create and interact via Web services, or interface with SMS on mobile devices or Instant messaging clients. ColdFusion can also be used for business reporting, rich-forms generation, printable document generation, full-text search, and graphing and charting—enabling customers to more fully engage their constituents with better Web experiences.Enterprise and Developer Solutions Business SummaryThrough the combination of Adobe and Macromedia technologies and execution against our go-to-market strategy in fiscal year 2006, we achieved strong year-over-year growth in our Enterprise and Developer business during the year. Our LiveCycle family of server products and technologies achieved record revenue in fiscal 2006, driven by strong adoption in targeted markets such as government and financial services. Our integration with other software vendors’ platforms, such as those from SAP AG, helped to further drive adoption during the year—as did adoption of Adobe PDF and Adobe server technologies in markets like insurance.With our Adobe Flex solutions, we also achieved strong revenue growth and adoption in key targeted markets during fiscal 2006. Our Macromedia ColdFusion business also continued to perform well due to revenue generated from its existing customer base that benefits from a large and active developer community. This business was also enhanced based on the delivery of an updated ColdFusion release during fiscal 2006 which added strong integration capabilities with Adobe Flex.Enterprise and Developer Solutions StrategyIn fiscal 2007, we intend to focus on offering more complete enterprise server-based solutions targeting the document and rich internet application needs of governments and enterprises. We wish to help these customers develop and deliver self-service and assisted-service Web-based applications that blend rich user interfaces, documents and collaboration capabilities that are easy to use. We strive to provide solutions which are customer-centric and help the constituents of our customers work together on complex processes and bridge the digital and paper-based environments, and do so by providing capabilities that are accessible by anyone, anywhere, and on any Web-connected device. We intend to provide such solutions directly through our consulting services organization, as well as together with software partners such as SAP AG, and through global systems integrators we partner with that deliver comprehensive solutions to their customers.We will focus our go-to-market efforts on markets such as financial services, government, manufacturing, and life sciences.Enterprise and Developer Solutions ProductsAdobe Acrobat Capture—enables conversion of legacy paper-based documents into indexed, searchable, platform-independent electronic PDF files for archiving and distribution purposes.Adobe Central Pro Output Server—a server-based software application for document generation that allows organizations to create personalized, customer-facing documents from any data source—including legacy, line-of-business, ERP, or CRM applications; merges data with an electronic document template using a powerful processing engine to dynamically generate electronic documents such as purchase orders,invoices, statements and checks for delivery via Adobe PDF, the Web, e-mail, fax, or print; works with Adobe Output Designer, which is a companion tool used to create sophisticated document templates.Adobe Flex SDK—The developer tools for developing RIAs with Flex. Developers use the SDK to compile and debug MXML and ActionScript files into the SWF format that executes in the Flash Player. The Flex SDK is licensed at no charge, providing a commercial grade RIA development which competes with free open source alternatives.Adobe Flex Builder—an integrated development environment tool that can be used by designers and enterprise developers for visually architecting and developing RIAs. Tightly integrated with the Flex SDK, Flex Builder provides features for quickly prototyping, coding, debugging and deploying Flash based RIAs. Flex Builder is a commercial product based on the open source Eclipse toolkit, the emerging industry standard for enterprise development tools.Adobe Flex Data Services—provides enterprise connectivity and data management capabilities for advanced Flex RIAs. Flex Data Services runs on J2EE application servers and provides messaging, high performance data connectivity, and advanced data management that integrate Flex based RIAs into enterprise infrastructure including Web services, remote Java objects and real-time data and messaging systems.Adobe LiveCycle Assembler—a server-based software application for the creation, manipulation and assembly of customized Adobe PDF documents; XML-based data can be inserted into templates to create complex, content-rich documents for more targeted and effective customer communications; integrates with leading enterprise applications as well as custom systems.Adobe LiveCycle Designer—a desktop software application which simplifies the creation and maintenance of intelligent XML form templates for deployment as Adobe PDF forms or HTML applications; provides an intuitive, graphical design tool for creating XML templates that look exactly as the author intended, and previewing them before deployment. It also simplifies adding intelligence to documents, such as calculations and validations, and binding form fields to arbitrary XML schemes for seamless integration with enterprise applications.Adobe LiveCycle Form Manager—a Barcoded Forms ES2—server-based software application which simplifies form management and increases user satisfaction by centralizing the management of all forms, regardless of file type, into a single point of access via a Web-based portal; allows administrators to manage form publication, version control and user access, as well as establish ebXML relationships with business partners and customers inside and outside the enterprise.Adobe LiveCycle Forms—offers a range of solutions for deploying intelligent forms that can be completed online or offline, across diverse platforms and devices; identifies a user’s environment to deliver the richest form-filling capabilities supported and integrates with enterprise applications to pre-populate form fields, save captured data, and initiate data-driven workflows.Adobe LiveCycle Barcoded Forms—enables organizations to accurately capture user-supplied information from fill-and-print paper forms by usingthat uses proven and dynamic 2D barcodes;barcode technology online and offline to automate the extraction of data from paper forms and deliver it to core systems for processing; dramatically reduces costs, errors and time compared to manual data entry and solutions based on optical character recognition; barcodes are initially set up through creation of the form with Adobe’s Designer application; after the form is printed, signed and returned by users of the form, the barcode on the form is scanned and decoded, and form data obtained from the barcode is routed to the appropriate enterprise application through Adobe’s LiveCycle server products.Document Security—Data Services ES2—high-performance, scalable and flexible framework that streamlines the development of RIAs using Adobe Flex and Adobe AIR; abstracts the complexity required to create server push–based applications and supports a rich set of features to create real-time solutions; utilizes powerful data services and simplifies data management problems such as tracking changes, synchronization, paging and conflict resolution; deployed as a standard J2EE Web application, which enables customers to leverage their existing infrastructure.files,documents, validate digital signatures and encrypt/decrypt Adobe PDF documents; safeguards information when it leaves a company’s network and integrates with existing public key infrastructures.Policy Server—a Rights Management ES2—server-based software application that helps organizations manage information access securely with dynamic, persistent document control; allows for theaccess control and monitoringauditing of Adobe PDF, Microsoft Word, Microsoft Excel, Microsoft PowerPoint, PTC Pro/ENGINEER, Dassault CATIA and CATIALattice XVL CAD document usage inside or outside the firewall, online or offline and across multiple document platforms; lets organizations know when a document has been viewed, printed or altered and restricts access so that only intended recipients can open, use and forward a document; allows for previously granted document permissions and access to be revoked; leverages Adobe Acrobat and Adobe Reader and other client plug-in software to author and view protected documents.Reader Extensions—a Output ES2—server-based solution which supports on-demand document processes including the generation of documents such as correspondence, confirmations, bids, or shipping labels; provides capabilities to merge XML data from back-end systems with Adobe LiveCycle Designer ES templates to generate documents in PDF, PDF/A, PostScript, PCL, or Zebra label formats; customers can customize electronic document packages by combining newly generated PDF documents with existing files from document repositories; customers can also convert PDF documents to print or image file formats and then route them automatically to support direct server-based printing or archiving operations.application which lets enterprises easily createautomates the creation, assembly, distribution and share interactivearchival of PDF documents in combination with critical business processes; converts a wide range of native and standard file formats, and can combine newly created PDF documents with existing files with external parties who must interact with these documents—without requiring recipients of theor pages to assemble customized PDF packages; supports direct server-based PDF printing or can convert PDF documents to acquire Acrobata wide variety of formats, including image formats and PDF/A.that normally would be necessary to interactwhich extends Adobe LiveCycle PDF Generator ES with support for the PDF files they receive. On an individualconversion and integration of complex 2D and 3D CAD design and engineering product data into a single PDF document it unlocks features so that when such a file is opened in the free Adobe Reader, users have access to functionality that normally would not be available in Adobe Reader. Examples of document collaboration features that can be enabled inshared using the Adobe Reader software without requiring a CAD application or viewer.this server product includecollecting multiple jobs over time and then grouping them to minimize mailing costs.usemonitoring of digital signatures to electronically sign PDF documents,all LiveCycle processes with 16 out-of-the-box dashboards and, Adobe LiveCycle BAM ES Extended, which adds the ability to ability to fill in, submit, and save electronic documents locally, and the ability to fill-in form information.PDF Generator—BAM ES to other enterprise business systems so that users can monitor business processes inside and outside the next-generation replacement for Acrobat Distiller Server and Acrobat Elements Server that offers server-based conversion of native PostScript, text, image formats, standard office formats, and technical drawing formats into PDF files. LiveCycle PDF Generator integrates with other LiveCycle products that apply digital rights management, document assembly, and process management to converted documents in an automated fashion. The product can generate PDF files that comply with the new PDF/A specification for long term document archives.Workflow Server—a Process Management ES2—server-based process management application that allows for the design, deploymentorganizations to orchestrate people, systems, content and business rules into streamlined, end-to-end processes that are accessible to process participants through engaging user interfaces, online or offline; provides out-of-box dashboards to help users gain insights into business operations in real time and management tools to fix day-to-day operational problems and make long-term process improvements.forms-basedservices that can be used with other LiveCycle solution components to create content-rich engagement applications whereby end users can share and collaborate on content development in content spaces as part of a company’s business processesprocesses; supports check-in/check-out capabilities, keeps a complete audit history of all document actions and provides a fully integrated set of content services ranging from an enterprise content repository to improve organizational agilitysocial collaboration tools such as enterprise forums; also includes team collaboration capabilities such as forums and productivity; uses discussions, and provides Microsoft Office plug-ins that enable users to interact with the process engine and content repository using Microsoft Word and Microsoft Excel.rules-and roles-basedserver-based software application for document generation that allows organizations to create personalized, customer-facing documents from any data source—including legacy, line-of-business, ERP or CRM applications; merges data with an electronic document template using a powerful processing engine to dynamically generate electronic documents such as purchase orders, invoices, statements and checks for delivery via Adobe PDF, the Web, e-mail, fax or print; works with Adobe Output Designer which is a companion tool used to create sophisticated document templates.defines business rules a process must follow, as welllook exactly as the roles of each individual involved in the process.ana SAP-certified server-based software application for document generation that enables organizations to optimize their investment in their SAP solution by creating personalized, professional-looking, customer-facing documents; provides an easy, fast and cost-effective way to create and maintain documents for the SAP environment; integrates directly with an SAP system to extract information which is merged with a document template that defines the layout and formatting of the document; output can be in a variety of formats, including Adobe PDF, print, fax, e-mail and the Web.Adobe Web Output Pak—a server-based software application for document generation; creates documents in PDF and HTML for presentation on the Web, and in Wireless Markup Language (“WML”) for presentation to a wireless device; allows users to personalize and control the look of documents based on the data the documents contain.Macromedia ColdFusion—provides a server-scripting environment and a set of features used by organizations for building database-driven scalable applications that are accessible through Web browsers and the Adobe Flash Player; built on an open Java technology architecture and can be deployed on third-party Java application servers that support the J2EE specification.19Mobile and Device Solutions SegmentMobile and Device Solutions Market OpportunityAs hundreds of millions of people around the world adopt internet-connected hand-held phones and devices as a means to communicate, collaborate and entertain, as well as consumer electronic devices such as digital cameras, game consoles, music players, and electronic educational toys, we believe a significant opportunity exists to offer solutions for these devices which provide for the creation and delivery of rich content, user interfaces, and data services which allow users to engage with information more easily and effectively.Our strategy in addressing the Mobile and Device Solutions market is to license Adobe mobile solutions, including Adobe Flash Player, Adobe Reader LE, and Macromedia FlashCast, to device manufacturers and telecommunications carriers that embed our technology on their platforms, enabling them to provide multimedia content, documents and services to their customers. As Flash Player and Adobe Reader technology penetrates digital devices and platforms, millions of developers will be able to use our content creation products to create engaging consumer content and rich mobile business applications.To support the delivery of content and services in these millions of devices, we offer client-server solutions which leverage the broad deployment of our Flash Player and Adobe Reader technologies. FlashCast, the first of these service delivery solutions, consists of client software built upon Macromedia Flash Lite runtime technology, as well as server technology that manages the content being delivered to the mobile phone. Just as other Adobe solutions such as Acrobat Connect are built upon our technology platform, we see market opportunities to bring similar solutions to the mobile and device ecosystems.Mobile and Device Solutions Business SummaryIn fiscal 2006, despite the loss of deferred revenue due to purchase accounting adjustments made with the integration of Macromedia at the beginning of the year, we achieved solid revenue results and strong unit adoption of our client software on mobile and consumer electronic devices. As of September 30, 2006, our Flash Lite client has been installed on more than 150 million devices worldwide – on over 150 different mobile handset models and over 250 different device models. This success has been driven by key hardware OEM relationships with companies such as Nokia, Sony/Ericsson, LG Electronics, BenQ Mobile, Motorola, and Samsung.In addition to the key OEM relationships we have established, we achieved a milestone in the United States market with the launch of Flash Lite for Qualcomm BREW on the Verizon network. This relationship signals the start of the creation of a Flash Lite ecosystem in the United States, driven initially by the ability for Verizon subscribers to view Flash-based content on their BREW enabled handsets.We also achieved strong unit adoption of our Flash Lite client on consumer electronics devices during the fiscal year. Key customers such as Sony have licensed our Flash Lite for distribution on devices such as the Sony PlayStation Portable and the Sony PlayStation 3.In addition to client-based revenue, we have increased traction with our server-based solution FlashCast, which provides data-based services that major wireless carriers such as NTT DoCoMo offer their subscribers. In Japan, more than 7 million DoCoMo subscribers have signed up for an Adobe FlashCast based service in its first year of availability. We also announced a relationship with Verizon to deliver Flash based services with Verizon to their millions of subscribers in North America.Mobile and Device Solutions StrategyIn fiscal 2007, we intend to continue our focus on client-based OEM revenue from our mobile and device hardware customers to drive revenue growth in our business. We also intend to work closely with carriers in key ecosystems to enable our authoring and content delivery solutions, and to leverage and extend our current offerings to them. Geographically, we look to expand our presence in markets such as Europe, Japan, China, and the United States. Our expansion will be driven by our own efforts, as well as those of key systems integration, distribution, and content partners that we have already signed agreements with, or those who we intend to partner with.Mobile and Device Solutions ProductsAdobe Reader LE—a version of the Adobe Reader specifically developed for mobile phones that renders PDF documents on small-sized devices.Macromedia Flash Lite—a version of the Adobe Flash Player specifically developed for many devices ranging from smart phones to feature phones, and for other consumer electronic devices; designed to require fewer device resources and can therefore operate on many devices from feature phones to TVs and digital video recorders on many devices from smart phones and feature phones.Macromedia Flash SDK—a software development kit specifically developed for bringing Flash based content to consumer electronic devices; designed to require fewer device resources and can therefore operate on many devices from game devices to TVs and digital video recorders.Macromedia FlashCast—an end-to-end, client-server solution that is designed to effectively create, deliver and use rich data services which are viewed as “channels” of information on mobile handsets; consists of the FlashCast client software which is embedded on mobile devices such as mobile phones and is built based on the Flash Lite runtime engine, and FlashCast server software which manages subscriber accounts, aggregates and delivers FlashCast channel updates to subscribers, and generates billing transactions for fulfillment.Our Other Business segment contains several of our products and services which address market opportunities ranging from the diverse publishing needs of technical and business publishing, to our legacy type and OEM printing businesses, to new strategic opportunities such as OEM revenue generated from our technology platform – which includes the ubiquitous Adobe Reader and Adobe Flash Player clients. These opportunities, and the products we offer to address them, are reviewed below in the following categories: Platform, OEM PostScript, and Print and Classic Publishing.Platform OpportunitiesAs previously discussed, central to our long term strategy is our technology platform which enables the development of products and solutions that dramatically improves how businesses engage with their customers. While our technology platform encompasses products and technologies created across all of Adobe’s segments, the Platform Business Unit focuses on the development and delivery of our technology platform client technologies, including Adobe Reader and Adobe Flash Player software. These solutions ensure reliable, secure and rich application experiences across the broadest range of browsers, operating systems and devices.Based on how these solutions allow consumers, enterprises and government agencies to present, deliver, consume and interact with information and content, there exists an opportunity to monetize the use of our Reader and Flash Player software. While typically provided for free, the widely used nature ofboth Flash Player and Reader has created new opportunities with partners whereby we can generate revenue based on the deployment of partner technology as part of our technology platform products.In fiscal 2007, we will continue to explore monetization opportunities for our technology platform solutions, as well as focus on the long-term strategic goal of developing a new cross-platform client (code named “Apollo”) based on the Flash, PDF and HTML client technologies that will enable the creation of Web-enabled desktop applications.Platform Productsfilesdocuments on a variety of hardware and operating system platforms; when used with certain Adobe PDF filesdocuments created with Adobe LiveCycle Reader Extensions Server, Adobe Acrobat Professional,Pro or Adobe Acrobat 3D,Pro Extended, Adobe Reader also can be used to enable collaborative workflows through the addition of collaboration features built into the Adobe PDF file; these features include review and markup tools that normally are not present in the standard Adobe Reader product.· · · theAdobe Flash Player provides a runtime environment for text, graphics, animations, sound, video, application forms and two-way communications.Shockwave Player—Flash Platform Services—new developer services that enable advertisers and content publishers to promote, measure and monetize applications across social networks, desktops and mobile devices.rich media player usedfree, open source framework, compiler and debugger for deploying multimedia content fordeveloping RIAs targeting the Adobe Flash Platform; developers use Flex to compile and debug MXML and ActionScript files into the SWF format that executes in internet solutions including education, training, gamesAdobe Flash Player and commerce.Opportunitieshardware manufacturers in this industry. We generate revenuesrevenue by licensing our technology to OEMs that manufacture workflow software, printers and other output devices.files;documents; allows PDF filesdocuments to be rendered natively throughout a workflow, providing performance benefits such aswhich include eliminating the need to flatten transparent artwork.Classic Publishing OpportunitiesClassic Publishing Business Unit focuses on these solutions which address the diverse customer needs in markets such as:as technical document publishing and communication, business document publishing, CD-ROM publishing, e-learningeLearning solutions, on-line help systems technical document publishing and typography.Classic Publishing Productsinteractive demonstrationsprofessional and engaging eLearning content – including software simulationssimulation, quizzes, animation and multi-media—and deliver the content in Adobe Flash and other formats; the Flash file format; records users’ actions incontent can be created without any applicationprogramming or multi-media skills and instantly creates Flash simulations with visiblecan be published to CD/DVDs and audible mouse movements; the small file size and high resolution make Adobe Captivate simulations and demonstrations easy to publish online or burn onto a CD for useLearning Management Systems used in training, sales, marketing or user support;and customer support applications; often used in combination with Acrobat Connect, Adobe Captivate provides a robust technology solution to bring understanding and retention to the end users of rapid training and e-learningeLearning solutions.easy wayeasy-to-use tool to update add and publish Web content;content, designed for non-technical business users canwho need to make minor changes to intranet and internetInternet Websites while automatically maintaining site standards forthat conform to the structure, style, layout and code; assite standards setup by a server application, Adobe ContributeWebsite administrator; streamlines the Web content maintenance process and provides Website administrators with a Web publishing system which enables IT professionalsset of simple content management functionality to manage and administer Websites; also provides bloggers with a simple tool to create and update their blogs.permissions as partanimations for use in various markets, including education, games and commerce; also enables the creation of fixed-media content for CD titles and DVD titles in the Web publishing process; also content providersentertainment, education and Web professionals to save time and streamline the Web-content maintenance process.XML,HTML, PDF import/export, content management, distributed workforces, team authoring capabilities, as well as JavaHelp.Collectioncollection packages of Adobe’s best-selling typefaces; makes it easy to create beautiful text for print, Web and video projects.Macromedia Authorware—a rich media authoring tool used to develop caption based e-learning on Windows and Macintosh based platforms; use of the product ranges from creating Web-based tutorials to simulations incorporating audio and video; applications developed with Macromedia Authorware can be delivered on the Web, over corporate networks or on CD-ROM.Macromedia Director—a tool for creating professional multimedia content that combines images, text, audio and video into presentations and interactive experiences; for Websites, it provides users with the ability to deliver multimedia content that supports three dimensional images and animations for use in various markets, including education, games and commerce; also enables the creation of fixed-media content for CD titles and DVD titles in the entertainment, education and corporate training markets.Macromedia the Adobe Flash Player.Macromedia JRun—an application server based on the J2EE specification; integratesdevelopment tool offerings and is usedbusiness” in Item 1A of this report for a discussion of risks related to deploy applications for functions such as online banking and customer service.24rapiddisruptive software and hardware technology developments, and frequent new product introductions.introductions, short product life cycles, price cutting with resulting downward pressure on gross margins and price sensitivity on the part of consumers. Our future success will depend on our ability to enhance our existing products, introduce new products on a timely and cost-effective basis, meet changing customer needs, extend our core technology into new applications and anticipate and respond to emerging standards, business models, software delivery methods and other technological changes.two versions,multiple editions which consist of combinations of several of our technologies. The AdobeIn addition to offering the technologies within the Creative Suite Standard Edition combines the capabilities of Adobe InDesign, Adobe Illustrator and Adobe Photoshop, as well as file management and integration technology called Version Cue, and Adobe Bridge which provides a simple interface to easily organize, browse and locate files. The Adobe Creative Suite Premium Edition adds to this the capabilities of Adobe Acrobat Professional and Adobe GoLive. Similarly,editions, we offer Macromedia Studio, which is a product that combines the capabilities of Macromedia Dreamweaver, Macromedia Flash Professional, Macromedia Fireworks, Macromedia Contribute and Macromedia FlashPaper. We also offer various bundles for customers who desire some of these applications in one affordable package.Our Creative Solutionsthem as individual software applications. These products compete with those from many companies, including Apple, Corel, Avid, Corel, Google,Quark, Microsoft and Quark, as they increase their presence in the creative software and solutions markets,others, as well as from various open source initiatives.it announced a new suite of products, calledtheir Expression Studio which will competecompetes with our Adobe Creative Suite and Macromedia Studiofamily of products andas well as individual Creative Solutions segment products. Expected to ship in the second quarter of 2007, Expression Studio includes Microsoft Expression Design (formerly Microsoft Expression Graphic Designer) which will competecompetes with our Adobe Illustrator, Adobe Photoshop, Adobe Photoshop Lightroom and MacromediaAdobe Fireworks products; Microsoft Expression Blend (formerly Microsoft Expression Interactive Designer), which will competecompetes with our MacromediaAdobe Flash product line;Professional product; Microsoft Expression Web (formerly Microsoft Expression Web Designer), which will competecompetes with our MacromediaAdobe Dreamweaver and Adobe GoLive products;product; and Microsoft Expression Media which provides digital asset management, basic image editing and video encoding/compression capabilities and will potentially competecompetes with some aspects of our creativevideo and hobbyist-focused products. Microsoft’s new operating system, Windows Vista, also includes new features in its Presentation Foundation thatTo compete with Macromedia Flash.and our Macromedia Studio product competecompetes favorably on the basis of features and functionality, ease of use, product reliability, price and performance characteristics. The individual technologies within the Creative Suite and Studio productseditions also work well together, providing broader functionality and shortened product training time for the individual who uses multiple applications to complete a project.In addition to Adobe Creative Suite and Macromedia Studio products, we offer the technologies within them as individual software applications. The competitive nature for these individual Creative Solutions products iscompete favorably against those offered by our competitors, as discussed below.and Macromedia FreeHand products faceproduct faces competition from companies such as ACDsee, Autodesk, Corel, Deneba, Mediascape, Xara and the open source product called Karbon14. We believe our products compete favorably due to high customer awareness of their rich features, especially the drawing andGoLive, Macromedia Dreamweaver and MacromediaAdobe Flash Professional face direct and indirect competition from desktop software companies such as Bare Bones Software and various proprietary and open source Web authoring tools. We also face competition from AJAXAjax and Microsoft Visual Studio products, and other integrated development environments that enable developers to create Web applications from companies such as BEA Systems (a subsidiary of Oracle), Borland and IBM. We believe our products compare favorably to these applications; however, our market share may be constrained by Microsoft’s ability to target its Web software to users in markets they dominate, includingit dominates. These target customers include users of Microsoft Office, Microsoft Windows operating system, the Microsoft Internet Explorer Web browser and Microsoft Visual Studio. DVD, Adobe Premiere Elements and Adobe Premiere Pro, face competition from companies offering similar products. We also continue to face competition from new emerging products, including online based services and thosewhich compete directly with our Photoshop.com offering, as well as any new competitive products coming from the open source movement.mid-range consumerother digital imaging and video editing offerings, including Adobe Photoshop Elements and Adobe Premiere Elements, are subject to intense competition, including customer price sensitivity, competitor brand awareness and competitor strength in OEM bundling and retail distribution. We face direct and indirect competition from a number of companies that market software which competes with ours, including ACD Systems, AI Soft (Japan), Apple, ArcSoft, Corel, i4 (Japan), Google, Kodak, Nova Development, Magix, Microsoft, Paessler GmbH (Germany), Pegasus Imaging Company, Phase One, Photodex Corporation, Sonic, Pinnacle, Sony and Ulead Systems.Yahoo. In addition, we face competition from device, hardware and camera manufacturers such as Apple, Canon, Dell, Hewlett-Packard, Nikon, Sony and others as they try to differentiate their offerings by bundling, for free, their own digital imaging software, or those of our competitors. Similarly, we face potential competition from operating system manufacturers such as Apple and Microsoft as they integrate hobbyist-level digital imaging and image management features into their operating systems. Finally, we face potential competition from open source products, including Gimp for Linux. mid-range digital imaging, digital video and consumer-focused image management software applications with our Adobe Photoshop Elements and Adobe Premiere Elements and Adobe Photoshop Album products due to strong consumer awareness of our brand in digital imaging and digital video, our relationships with significant OEMs, positive recommendations for our products by market influencers, our increased focus on the retail software channel and strong feature sets.Apple and Corel. Our Adobe Photoshop product competesproducts compete favorably due to high customer awareness of the Photoshop brand in digital imaging, the positive recommendations for our Photoshop product by market influencers, the features and technical capabilities of the product and our ability to leverage core features from our other established products.third partythird-party plug-in products. Barriers to the adoption of Adobe InDesign by Quark XPress customers include this infrastructure, as well as the cost of conversion, training and software/hardware procurement required to switch to InDesign. We have seen an increase in the adoption of InDesign software and we believe we will continue to see market share gains going forward due to a product offering that contains new innovative features, improved integration with our other products, our strong brand among users, positive reviews by industry experts, adoption of InDesign by major accounts which are influencers in their industries and improved infrastructure support by the industry for our overall solution.DVDAdobe Premiere Pro and Adobe Premiere ProSoundbooth software products, as well as the Discreet, Sonic and Sony. Our Adobe Premiere Elements software product which is targeted for use by hobbyists, faces competition from companies such as Aist, Apple, ArcSoft, Avid, Broderbund, Corel, Cyberlink, Magix, Microsoft, Muvee and Muvee.on the Microsoft Windows platform with Adobe Premiere Pro and compete favorably due to our strong feature set, our OEM relationships and the integration with our other products to create a broad digital video publishing platform for our customers.Knowledge Workerare seeing an increase incontinue to face competition from Microsoft. Microsoft has announced its new, next generationTheir Windows operating system called Windows Vista, which started shipping in late 2006. Windows Vista includes a proprietary digital rights management technology and a new document format, called XML Paper Specification (“XPS”), which competes with Adobe PDF. In addition, Microsoft recently released the next version of itsMicrosoft’s widely used Office product which offers a feature to save Microsoft Office documents as PDF files through a freely distributed plug-in.documents. This new PDF feature in Office competes with Adobe Acrobat. Given Microsoft’s market dominance, XPS, the PDF feature in Office and any other competitive Microsoft product or technology that is bundled as part of its Office product or operating system or made freely available, could harm our overall Knowledge Worker SolutionsAdobe Acrobat market opportunity. Ansyr Technology, Apple, Global Graphics, Nuance, Software995, Sourcenext and others. In addition, other PDF creation solutions can be found at a low cost, or for free, on the Web. Standard and Adobe Acrobat Professional as part of document collaboration and document process management solutions, where electronic document delivery, exchange, collaboration, security and archival needs exist, our Acrobat product family faces competition from entrenched office applications such as Microsoft Office.Office and its integration with their SharePoint product. In the higher end of the electronic document market, Acrobat Professional providesPro and Acrobat Pro Extended provide features which compete with other creative professional PDF tool providers, such as Enfocus, Dalim TeamPDF and Zinio. In addition, we are targeting the architecture, engineering and construction electronic document collaboration market with our Acrobat Professional product market. The capabilities of our product in this market compete with some aspects of Autodesk’s solution.Pro Extended product.(formerly Macromedia Breeze)Pro, faces competition from many Web conferencing vendors, including Cisco WebEx, and Microsoft Office Live Meeting.Meeting, IBM Lotus Sametime and Citrix GoToMeeting. Cisco WebEx is a market share leader and Microsoft has steadily increased its marketing of Microsoft Office Live Meeting. To address the threats from Microsoftthese and othersother smaller competitors in the Web conferencing space, we focus on providing a differentiated and enhanced user experience through our ubiquitous Adobe Flash Player.Mobile and Device solutions are influenced by evolving industry standards, rapid software and hardware technology developments, and frequent new product and technology introductions by companies or open-source initiatives targeting similar opportunities. Technologies and products which could compete with Macromedia Flash Lite include Java, Brew, SVG, WAP and Microsoft Windows Mobile, as well as solutions from the open source movement and vendors supplying clone versions of these products and technologies.We believe our Macromedia Flash Lite solution competes favorably against these technologies and solutions due to the ubiquitous distribution of Adobe Flash Player technology on a broad set of platforms, including PCs, cellular phones, and consumer electronic devices. We also believe our robust programming model and developer tools used to create Flash content, and the large Flash developer community and ecosystem which utilize our tools, are key assets in our ability to effectively compete in this market. Further, the rich expressiveness of Flash, which provides the capability to deliver audio, video, motion graphics, vector graphics and visual effects, and results in rich user experiences and interfaces on mobile devices, is a key differentiation when compared to the capabilities of alternate solutions.Enterprise and Developer SolutionsThe markets we address with our Macromedia ColdFusion, Adobe LiveCycle and Adobe Flex productsEnterprise Suite are influenced by evolving industry standards, rapid software and hardware technology developments, and new product introductions from competitors such as Microsoft and IBM.In the Professional versionMicrosoft continues to offer its eForms solution called InfoPath in certain versions of Microsoft Office 2003, it introduced a new information gathering program calledand has added Office Forms Services which extends their forms to users as MS Outlook e-mail messages or to Web browsers rather than the InfoPath 2003.client. They also introducedcontinue to offer their Windows Rights Management Services in their Windows Server 2003 product which is designed to allow corporate networks to manage and enforce restrictions built into documents.has recently started shipping its next generation operating system, calledmarkets Windows Vista. Windows Vista includesand Office which include a new document format called XPS which competes with Adobe PDF. Certain Windows Vistaoperating systems also contains a proprietary digital rights management technology which competes with Adobe LiveCycle Policy Server.Rights Management ES. In addition, Microsoft’s newmost recent version of Office includes an updated version of its SharePoint product which competes with certain aspects of our Adobe LiveCycle products. Microsoft has also recently delivered technology called Windows Presentation Foundation as part of the Windows Vista release in late 2006. Windows Presentation Foundationand Silverlight which offers an alternative to building RIA applications within the Microsoft .NET framework.acquisition of an eForms solution company called PureEdge and their acquisition of FileNET’s electronic form solutions.recently rebranded as Lotus Workplace Forms. Similarly, we face competition forMetaStorm,PegaSystems, Lombardi, Nuance and Ultimus.ubiquitous universal multi-platform solution that is more compelling than our competitors’ offerings.Asbroaden the scope of productscompete primarily with Web analytics and solutions offeredbusiness optimization vendors whose software is provided on demand to customers, generally through a Web browser. We also compete to a limited extent with vendors whose software is installed by customers directly on their servers. In addition, we compete at times with our Enterprisecustomers’ or potential customers’ internally developed applications.Developer SolutionsWebTrends that offer on-demand services. We also compete with software vendors, such as Infor (which owns Epiphany), Nielsen/NetRatings, a part of the Nielsen Online Unit of the Nielsen Company, Unica Corporation (which acquired Sane Solutions) and SAS Institute. In addition, we also compete with online marketing service providers, such as Microsoft Advertising (formerly aQuantive when acquired by Microsoft), DoubleClick (owned by Google) and 24/7 Real Media (acquired by WPP).face increased competition from entrenched office applications, emerging products/technologiescompete favorably with our competitors on the basis of these factors. However, if we are not able to compete successfully against our current and potentially, enterprise collaboration system providers. Additionally, current office applicationsfuture competitors, it will be difficult to acquire and content creation/management tools that use HTML, Microsoft Word, Tagged Information File Format (“TIFF”) and various XML-based formats for electronic document distribution provide alternate solutions toretain customers, and indirectly compete withwe may experience revenue declines, reduced operating margins, loss of market share and diminished value in our enterprise server products and the use of Adobe PDF.Flex server product provides a solution for developers and IT departments wanting to deploy enterprise class, Rich Internet Applications and leveragesFlash Platform technologies, including Adobe Flash Player technology. Beyond the competitiveand Adobe AIR, face competition from Microsoft threats previously discussed, vendors such as Tibco, JackBe, Backbase, and NexaWeb offer competitive solutions in the RIA market that we target with Flex. In addition, new open source technologies including AJAX techniques provide alternative methods for creating RIAs. Numerous open source groups,Silverlight, as well as a number of commercial software vendors are workingalternative approaches to build toolsbuilding RIAs – including Google Gears and frameworks that make AJAX competitive with Flex.MacromediaAdobe ColdFusion product family and our Adobe Flash Builder developer tool products face competition from major vendors including Microsoft, IBM, BEA (a subsidiary of Oracle) and Sun. In addition,Our ColdFusion competesproducts also compete with several technologies available today at no cost including the PHP and PERL programming environments that are available for the Apache Web server. (via their acquisition of Arbortext), as well as lower-end desktop publishing products such as Microsoft Word. Competition is based on the quality and features of products, the level of customization and integration with other publishing system components, the number of hardware platforms supported, service and price. We believe we can successfully compete based upon the quality and features of the Adobe FrameMaker product and our extensive application programming interface.Xionics.Zoran. In addition, as previously discussed, Microsoft has recently shipped its nextgeneration operating system called Windows Vista. It includes a newMicrosoft’s XPS document format called XPS, which competes with Adobe PDF. Certain aspects of XPS also compete withPDF and our Adobe PostScript technologies and solutions.e-learning contentthe rapid eLearning authoring our Authorware product faces competition from vertically focused e-learning content authoring solutions. Competition is based on the quality and features of products, ease-of-use and price. We believe we have a strong product and can successfully compete based upon the quality and features of the Macromedia Authorware product and its strong brand among users, and its widespread adoption among e-learning content publishers.In interactive simulations/e-learning,market, our Adobe Captivate product faces competition from general content development tools such as Microsoft PowerPoint, screen recording tools such as Techsmith’s Camtasia and more advanced e-learningeLearning and software simulation solutions such as Firefly, or OnDemand.Lectora and Articulate. Competition in this market is based on speed of development and completeness of the features of products, ease-of-use and price. We believe we have a strongour product and can successfully compete based upon the quality andstrength of its broad range of features, of the Adobe Captivate product, its strong brand among users and its widespread adoption among training developers.“Wikis”,“Wikis,” as well as basic content publishing products such as Microsoft Word, Microsoft FrontPage, Microsoft Notepad, basic HTML editors like ezHTMLArea and ekTron, content management tools like Microsoft SharePoint and, large-scale Web content management systems from companies such as Interwoven, Vignette, IBM and Oracle. Competition in this market is based on the usability, quality and features of products, the level of customization and integration with other Web content management components, the integration with Web design tools, the number of hardware platforms supported, service and price. We believe we can successfully compete based upon the usability and price of the Adobe Contribute, product,its strong brand among users and integration with other Web content management components.MacromediaAdobe Director product, its strong brand among users, and its widespread adoption among content developers and publishers.the number of hardware platforms supported, service and price. We believe we can successfully compete based upon the quality and features of the Adobe RoboHelp product.Our Macromedia JRun product competes with large Java application server vendors as well as products available at no cost including the Tomcat Java Servlet Engine provided by the Apache Foundation.30Web siteWebsite at www.adobe.com.England,Dubai, Finland, France, Germany, India, Ireland, Italy, Japan, Korea, Mexico, Moldova, the Netherlands, Norway, Poland, Portugal, Romania, Russia, Scotland, Singapore, South Africa, Spain, Sweden, Switzerland, Taiwan, Turkey and Taiwan.For information regarding market and business segment revenue, geographic areas and significant customers, please refer to Note 17as a percentage of net revenue for fiscal 2009, 2008 and 2007. As listed, our Notes to Consolidated Financial Statements. 2009 2008 2007 Ingram Micro 15 % 18 % 21 % Tech Data 8 % 9 % 10 % 2009 2008 Ingram Micro 16 % 18 % 6 % 8 % Global Supply Chain Management operations.Operations organization. We outsource our orderproduction, inventory and fulfillment activities to third parties in the United States, Europe, Asia and Asia.components, although an interruption in production by a supplier could result in a delay in shipmentcomponents.products.global inventory policy. The backlog of orders from customers, as of January 19, 200715, 2010 and January 20, 2006, was16, 2009, were approximately $15.1$5.4 million and $30.9$6.4 million, respectively.Adobe ConsultingProfessional Services team dedicated to developing and implementing solutions for enterprise customers in key vertical markets and to transfer technical expertise to our solution partners. The Adobe ConsultingProfessional Services team uses a comprehensive, customer-focused methodology to develop high quality solutions, which in turn deliver a competitive advantage to our enterprise customers. A portfolio of technical training courses is also available for desktop and server-based products to meet the needs of our enterprise customers and solution partners.Solutions products and solutions to meet the growing needs of our customers.Solution Network DeveloperPartner Connection Program focuses on providing developers with high-quality tools, software development kits, information and services.complimentary person-to-personGetting Started support on certain matters. Support for some products and in some countries may vary.Web siteWebsite (www.adobe.com) and through a growing series of how to books published by Adobe Press pursuant to a joint publishing agreement with Peachpit Press. In addition, we develop tests to certify independent trainers who teach Adobe software classes. We sponsor workshops, work with professional associations and user groups, and conduct regular beta testing programs.interestsinterest in three venture capital limited partnerships, Adobe Ventures L.P., Adobe Ventures III, L.P. and Adobe Ventures IV L.P. (collectively “Adobe(“Adobe Ventures”), that havehas invested in early stage companies with innovative technologies. We also make direct investments in privately heldprivately-held companies. We enter into these investments with the intent of securing financial returns as well as for strategic purposes as they often increase our knowledge of emerging markets and technologies, as well as expand our opportunities to provide Adobe products and services. The partnerships areAdobe Ventures is managed by Granite Ventures, an independent venture capital firm and sole general partner of Adobe Ventures.We intend to continue direct investments in new technologies and plan to invest approximately $100 million in venture capital overnext three to five years in companies leveraging our platform technologies.Since the personal computer and enterprise software industries areindustry is characterized by rapid technological change, a continuous high level of investment is required for the enhancement of existing products and services and the development of new products.products and services. We primarily develop our software internally. We occasionallyinternally as well as acquire products or technology developed by others by purchasing the stock or assets of the business entity that held ownership rights to the technology. In other instances, we have licensed or purchased the intellectual property ownership rights of programs developed by others with license or technology transfer agreements that may obligate us to pay a flat license fee or royalties, typically based on a dollar amount per unit shipped or a percentage of the revenuesrevenue generated by those programs.December 1, 2006, December 2, 2005,November 27, 2009, November 28, 2008 and December 3, 2004,November 30, 2007, our research and development expenses including costs related to contract development, were $539.7$565.1 million, $365.3$662.1 million and $311.3$613.2 million, respectively.During fiscal 2006, we acquired Macromedia, Inc., a provider of software technologies that enable the development of a wide range of internet and mobile application solutions. For further information regarding this acquisition, see Note 2 of our Notes to Consolidated Financial Statements.During fiscal 2005, we acquired OKYZ S.A., a privately held company, which provided three dimensional technology and expertise to our Intelligent Document platform.During fiscal 2004, we acquired Q-Link Technologies, Inc, a privately-held company, which provided Java-based workflow technology that was integrated with our enterprise server products to enable customers to integrate document process management with core applications.have obtainedalso offer many patents and have registered numerous copyrights, trademarks, domain names and logos in the United States and foreign countries.anti piracyanti-piracy programs directly and through certain external software associations. Although our products generally do not contain copy protection or network copy detection features,In addition, we have recently included activation technology in certain products to guard against illegal use and will continue to do so in certain future products.January 19, 2007,November 27, 2009, we employed 6,0828,660 people. We have not experienced work stoppages and believe our employee relations are good. Competition in recruiting personnel in the software industry, especially highly skilled engineers, is intense. We believe our future success will depend in part on our continued ability to recruit and retain highly skilled technical, management and sales and marketing personnel.Web siteWebsite at www.adobe.com as soon as reasonably practicable after we electronically file such material with, or furnish it to, the SEC. The information posted on our Web siteWebsite is not incorporated into this Annual Report on Form 10-K/A. report.19, 200715, 2010 are as follows:AgeBruce R. Chizen51 and acting52 Executive Vice President, Chief Financial Officer 57Shantanu Narayen43and Chief Operating Officer48 Senior Vice President, Creative Solutions Business Unit 43 Senior Vice President, Chief Technology Officer 41 Senior Vice President, Business Productivity Business Unit 4851Chizen joined Adobe upon the closing of the acquisition of Aldus in August 1994Narayen currently serves as ViceAdobe’s President and General Manager, Consumer Products Division. In December 1997, he was promoted to Senior Vice President and General Manager, Graphic Products Division and in August 1998, Mr. Chizen was promoted to Executive Vice President, Products and Marketing. In April 2000, Mr. Chizen was promoted to President of Adobe and in December 2000, he also became Adobe’s Chief Executive Officer and joined the Adobe Board of Directors in December 2000. In January 2005, Mr. Chizen relinquished the title of President, but remains as Adobe’s Chief Executive Officer and a member of Adobe’s Board of Directors. Mr. Chizen was also appointed as Adobe’s acting Chief Financial Officer in November 2006. Mr. Chizen is a member of the Board of Directors of Synopsys, Inc. Ms. Cottle joined Adobe in February 2002 as Senior Vice President, General Counsel and Secretary. Prior to joining Adobe, Ms. Cottle served as General Counsel for Vitria Technology, Inc., a service-oriented business application software company from February 2000 to February 2002. From 1996 to 1999, Ms. Cottle served as Vice President, General Counsel and Secretary of Raychem Corporation.Adobe.Adobe and joined the Adobe Board of Directors. Prior to joining Adobe, Mr. Narayen co-founded Pictra Inc., a digital photo sharing software company, in 1996. He was Director of Desktop and Collaboration products at Silicon Graphics Inc. and held various senior manager positions at Apple Inc. before founding Pictra.electronicselectronic design technologies. While at Cadence, from January 1998 to June 2000, Mr. Thompson served as Senior Vice President, Worldwide Sales and Field Operations and from April 1994 to January 1998 as Vice President, Worldwide Professional Services.forward lookingforward-looking statements. Factors that might cause or contribute to such differences include, but are not limited to, those discussed below. These and many other factors described in this report could adversely affect our operations, performance and financial condition.Delaysdevelopmentthe financial markets and other adverse changes in general economic or shipmentpolitical conditions in any of the major countries in which we do business could adversely affect our operating results.versions ofproducts and services or upgrades or enhancements to existing products and services that meet customer requirements, our operating results could cause a decline in our revenue.Any delays or failures insuffer.and marketing our products, including upgrades of currentnew high technology products and the integration of Macromediaservices and enhancing existing products intoand services is complex, costly and uncertain, and any failure by us to anticipate customers’ changing needs and emerging technological trends accurately could significantly harm our product line, may have a harmful impact on ourmarket share and results of operations. We may have particular difficultymust make long-term investments, develop or obtain appropriate intellectual property and delays developing products that integrate Adobe and Macromedia products, sincecommit significant resources before knowing whether our predictions will accurately reflect customer demand for our products are highly complex, have been designed independently and were designed without regard to such integration.services. Our inability to extend our core technologies into new applications and new platforms, including the mobile and embedded devices market, and to anticipate or respond to technological changes could affect continued market acceptance of our products and services and our ability to develop new products. Delaysproducts and services. Additionally, any delay in the development, production, marketing or distribution of a new product or service or upgrade introductionsor enhancement to an existing product or service could cause a decline in our revenue, earnings or stock price.price and could harm our competitive position. We cannot determinemaintain strategic relationships with third parties with respect to the ultimate effectdistribution of certain of our technologies. If we are unsuccessful in establishing or maintaining our strategic relationships with these delaysthird parties, our ability to compete in the marketplace or to grow our revenues would be impaired and our operating results would suffer.introductionLinux platform as well as the Windows and UNIX platforms. To the extent that there is a slowdown of customer purchases of personal computers on either the Windows or Macintosh platform or in general, or to the extent that significant demand arises for our products or competitive products on other platforms before we choose and are able to offer our products on these platforms our business could be harmed. Additionally, to the extent that we have difficulty transitioning product or version releases to new Windows and Macintosh operating systems, or to the extent new releases of operating systems or other third-party products make it more difficult for our products to perform, our business could be harmed.or upgrades will have on our revenue or results of operations.Introduction of new productsservices and business models by existing and new competitors could harm our competitive position and results of operations. end markets for our products and services are characterized by intense competition, evolving industry standards and business models, disruptive software and hardware technology developments, frequent new product and service introductions, short product and service life cycles, price cutting, with resulting downward pressure on gross margins, and price sensitivity on the part of consumers. Our future success will depend on our ability to enhance our existing products are intensely and increasingly competitive,services, introduce new products and are significantly affected by product introductionsservices on a timely and market activitiescost-effective basis, meet changing customer needs, extend our core technology into new applications, and anticipate and respond to emerging standards, business models, software deliveryindustry competitors, including Microsoft’s announced introduction of its new VistaMicrosoft Windows operating system which containssystems contain a new fixed document format, XPS, which will competecompetes with Adobe PDF, and its introductionPDF. Additionally, certain versions of Microsoft Office 12 which offersoffer a feature to save Microsoft Office documents as PDF files, through a freely distributed plug-in, which competes with Adobe PDF creation. Microsoft Expression Studio competes with our Adobe Creative Suite family of products and Microsoft Silverlight and Visual Studio, Web development tools for RIAs, compete with Adobe Flash, Adobe Flex and Adobe AIR. Google Gears and Sun’s JavaFX, alternative approaches to deploying RIAs, compete with Adobe Flash and Adobe AIR. Additionally, HTML5 specifies scripting application programming interfaces which if broadly implemented in browsers could compete with Adobe Flash. Companies, such as Google, Sun, Apple and Microsoft, may introduce competing software offerings for free or open source vendors may introduce competitive products. In addition, recent advances in computing and communications technologies have made the SaaS, or on-demand, business model viable. SaaS allows companies to provide applications, data and related services over the Internet. Providers use primarily advertising or subscription-based revenue models. We are developing and deploying our own SaaS strategies through various business units, including our Omniture business unit, but there are significant competitors in this area as well. For instance, our Omniture Online Marketing Suite competes with Google Analytics, which Google offers free of charge, and other competitive SaaS offerings from companies such as Coremetrics, Yahoo! and WebTrends. If theseany competing products or services in these areas achieve widespread acceptance, our operating results could suffer. In addition, consolidation has occurred among some of the competitors in our markets. Any further consolidations among our competitors may result in stronger competitors and may therefore harm our results of operations. For additional information regarding our competition and the risks arising out of the competitive environment in which we operate, see the section entitled “Competition” contained in Item 1 of this Annual Report.and government markets and the mobile and device markets. In the enterprise and government markets, we intend to increase our focus on vertical markets such as education, financial services, manufacturing, and the architecture, engineering and construction markets. With our Adobe Acrobat Connect product line, we intend to increase awareness in targetedmarkets and horizontal markets such as training and marketing and vertical markets such as manufacturing, financial services and telecommunications.marketing. These new offerings and markets require a considerable investment of technical, financial and sales resources, and a scaleablescalable organization. Many of our competitors may have advantages over us due to their larger presence, larger developer network, deeper experience in the enterprise, and government markets and the mobile and device markets, and greater saleslicense our technology topartner with device makers, manufacturers and telecommunications carriers thatto embed our technology on their platforms, and in the enterprise and government market our intent is to form strategic alliances with leading enterprise and government solutions and service providers to provide additional resources to further enable penetration of such markets. If we are unable to successfully enter into strategic alliances with device makers, manufacturers, telecommunication carriers and leading enterprise and government solutions and service providers, or if they are not as productive as we anticipate, our market penetration may not proceed as rapidly as we anticipate and our results of operations could be negatively impacted. Another development is the software-as-a-service business model, by which companies provide applications, data and related services over the Internet. Providers use primarily advertising or subscription-based revenue models. Recent advances in computing and communications technologies have made this model viable and could enable the rapid growth of some of our competitors. We are exploring the development of our own software-as-a-service strategies. It is uncertain whether these strategies will prove successful. Additionally, customer requirements for “open standards” or “open source” products could impact adoption or use with respect to some of our products.Adverse changes in general economic or political conditions in any of the major countries in which we do business could adversely affect our operating results.If the economy worsens in any geographic areas where we do business, it would likely cause our future results to vary materially from our targets. A slower economy also may adversely affect our ability to grow. Political instability in any of the major countries in which we do business also may adversely affect our business.Revenuesrevenues.revenue and revenue may decline quicker than anticipated. Additionally, we intend to expand the use of our Mobile and Device Solutions by licensing our products for use in mobile phones, set-top boxes, game devices, personal digital assistants, hand-held computers and other consumer electronic devices; however, we have a limited history of licensing products and offering services in thesecertain markets such as the government and enterprise market and may experience a number of factors that will make our revenue less predictable, including longer than expected sales and implementation cycles, decision to open source certain of our technology initiatives, potential deferral of revenue due to multiple-element revenue arrangements and alternate licensing arrangements.failutilize in our Omniture business unit typically involves selling services on a subscription basis pursuant to anticipateservice agreements that are generally one to three years in length. Although many of our service agreements contain automatic renewal terms, our customers have no obligation to renew their subscriptions for our services after the expiration of their initial subscription period upon providing timely notice of non-renewal and develop new productswe cannot provide assurance that these subscriptions will be renewed at the same or higher level of service, if at all. Moreover, under some circumstances, some of our customers have the right to cancel their service agreements prior to the expiration of the terms of their agreements. We cannot be assured that we will be able to accurately predict future customer renewal rates. Our customers’ renewal rates may decline or fluctuate as a result of a number of factors, including their satisfaction or dissatisfaction with our services, the prices of our services, the prices of services offered by our competitors, mergers and acquisitions affecting our customer base, reductions in responseour customers’ spending levels, or declines in consumer Internet activity as a result of economic downturns or uncertainty in financial markets. If our customers do not renew their subscriptions for our services or if they renew on less favorable terms to changes in demand for application software, computers, printers,us, our revenues may decline.other non PC-devicesfuture acquisitions, and integration of these acquisitions may disrupt our business could be harmed.Any failure to anticipate changing customer requirements and developmanagement.deploy newmay in the future acquire additional companies, products in response to changing market conditions may have a material impact on our results of operations. As previously discussed,or technologies. Most recently, we plan to release numerous new product offerings and upgrade versions of our current products in connection with our transition to new business models andcompleted the acquisition of Macromedia. Market acceptanceOmniture in October 2009. We may not realize the anticipated benefits of our newan acquisition and each acquisition has numerous risks. These risks include:· difficulty in assimilating the operations and personnel of the acquired company; · difficulty in effectively integrating the acquired technologies, products or services with our current technologies, products or services; · difficulty in maintaining controls, procedures and policies during the transition and integration; · entry into markets in which we have no or limited direct prior experience and where competitors in such markets have stronger market positions; · disruption of our ongoing business and distraction of our management and employees from other opportunities and challenges; · difficulty integrating the acquired company’s accounting, management information, human resources and other administrative systems; · inability to retain key technical and managerial personnel of the acquired business; · inability to retain key customers, distributors, vendors and other business partners of the acquired business; · inability to achieve the financial and strategic goals for the acquired and combined businesses; · inability to take advantage of anticipated tax benefits as a result of unforeseen difficulties in our integration activities; · incurring acquisition-related costs or amortization costs for acquired intangible assets that could impact our operating results; · potential additional exposure to fluctuations in currency exchange rates; · potential impairment of our relationships with employees, customers, partners, distributors or third-party providers of our technologies, products or services; · potential failure of the due diligence processes to identify significant problems, liabilities or other shortcomings or challenges of an acquired company or technology, including but not limited to, issues with the acquired company’s intellectual property, product quality or product architecture, data back-up and security, revenue recognition or other accounting practices, employee, customer or partner issues or legal and financial contingencies; · exposure to litigation or other claims in connection with, or inheritance of claims or litigation risk as a result of, an acquisition, including but not limited to, claims from terminated employees, customers, former stockholders or other third-parties; · incurring significant exit charges if products or services acquired in business combinations are unsuccessful; · potential inability to assert that internal controls over financial reporting are effective; · potential inability to obtain, or obtain in a timely manner, approvals from governmental authorities, which could delay or prevent such acquisitions; · potential delay in customer and distributor purchasing decisions due to uncertainty about the direction of our product and service offerings; and · potential incompatibility of business cultures. version releases will be dependent on our ability to include functionalityintegrate an acquired business successfully and usability in such releases that addressa timely manner, we may not realize the requirementsbenefits of customer demographics with which we have limited prior experience. To the extent we incorrectly estimate customer requirements for such products and version releases or if there is a delay in market acceptance of such products and version releases, our business could be harmed.We offer our Creative Solutions and Knowledge Worker Solutions application-based products primarily on Windows and Macintosh platforms and on some UNIX platforms. We generally offer our server-based products, but not desktop application products, on the Linux platform as well as the Windows and UNIX platforms. To the extent that there is a slowdown of customer purchases of personal computers on either the Windows or Macintosh platform or in general, oracquisition to the extent that significant demand arisesfor our products or competitive products on the Linux desktop platform before we choose and are able to offer our products on this platform, our business could be harmed. Additionally, to the extent that we have difficulty transitioning product or version releases to new Windows and Macintosh operating systems, e.g., porting our applications to the “Mactel” platform, or to the extent new releases of operating systems or other third party products make it more difficult for our products to perform, our business could be harmed.We may incur significant costs in acquiring the necessary third party intellectual property rights for use in our products. Third partyThird-party intellectual property disputes could subject us to significant liabilities, require us to enter into royalty and licensing arrangements on less favorableunfavorable terms, prevent us from manufacturing or licensing certain of our products or offering certain of our services, subject us to injunctions restricting our sale of products or services, cause severe disruptions to our operations or the markets in which we compete, or require us to satisfy indemnification commitments with our customers including contractualany oneand service agreements. In addition, we may incur significant costs in acquiring the necessary third-party intellectual property rights for use in our products. Any of whichthese could seriously harm our business.disclosure or malicious attack.code (the detailed program commands for our software programs).code. If unauthorized disclosure of our source code occurs, we could potentially lose future trade secret protection for that source code. The loss of future trade secret protection could make it easier for third partiesthird-parties to compete with our products by copying functionality, which could adversely affect our revenue and operating margins. We also seek to protect our confidential information and trade secrets through the use of non-disclosure agreements with our customers, contractors, vendors, and partners. However there is a risk that our confidential information and trade secrets may be disclosed or published without our authorization, and in these situations it may be difficult and and/or costly for us to enforce our rights.We also devote significant resourcesmaintainingreduced revenues or to liability claims. products from malicious hackers whocustomers. Hackers develop and deploy viruses, worms, and other malicious software programs that attack our products and systems. Although this is an industry-wide problem that affects computers and products across all platforms, it affects our products in particular because hackers tend to focus their efforts on the most popular operating systems and programs and we expect them to continue to do so. Critical vulnerabilities have been identified in certain of our products. Nevertheless,These vulnerabilities could cause the application to crash and could potentially allow an attacker to take control of the affected system.couldand systems may lead to claims against us and harm our reputation, and could lead some customers to seek to return products, to stop using certain services, to reduce or delay future purchases of products or services, or to use competitivecompeting products or to make claims against us. Also, with the introduction of hosted services with some of our product offerings, our customersservices. Customers may use such services to share confidential and sensitive information. If a breach of security occursalso increase their expenditures on these hostedprotecting their existing computer systems we could be held liable to our customers. Additionally, such breaches could lead to interruptions, delays and data loss and protection concerns as well as harm to our reputation.37We may not realize the anticipated benefits of past or future acquisitions, and integration of these acquisitions may disrupt our business and management.We have in the past and may in the future acquire additional companies, products or technologies. We may not realize the anticipated benefits of an acquisition and each acquisition has numerous risks. These risks include:· difficulty in assimilating the operations and personnel of the acquired company;· difficulty in effectively integrating the acquired technologies or products with our current products and technologies;· difficulty in maintaining controls, procedures and policies during the transition and integration;· disruption of our ongoing business and distraction of our management and employees from other opportunities and challenges due to integration issues;· difficulty integrating the acquired company's accounting, management information, human resources and other administrative systems;· inability to retain key technical and managerial personnel of the acquired business;· inability to retain key customers, distributors, vendors and other business partners of the acquired business;· inability to achieve the financial and strategic goals for the acquired and combined businesses;· incurring acquisition-related costs or amortization costs for acquired intangible assets that could impact our operating results;· potential impairment of our relationships with employees, customers, partners, distributors or third-party providers of technology or products;· potential failure of the due diligence processes to identify significant issues with product quality, architecture and development, or legal and financial contingencies, among other things;· incurring significant exit charges if products acquired in business combinations are unsuccessful;· potential inability to assert that internal controls over financial reporting are effective;· potential inability to obtain, or obtain in a timely manner, approvals from governmental authorities,attack, which could delay or prevent such acquisitions; and· potential delay in customer and distributor purchasing decisions due to uncertainty about the directionadoption of our product offeringsMergers and acquisitionsnew technologies. Any of high technology companies are inherently risky, and ultimately, if we do not complete the integration of acquired businesses successfully and in a timely manner, we may not realize the anticipated benefits of the acquisitions to the extent anticipated, whichthese actions by customers could adversely affect our business, financial condition or resultsrevenue.operations.Weour businesses rely on distributorsus or third-party service providers to sell our productshost and deliver services, and any adverse changeinterruptions or delays in our relationshipservice or service from these third parties, security or privacy breaches, or failures in data collection could expose us to liability and harm our business and reputation.distributorsservices, as applicable. We do not formally audit such customers to confirm compliance with these representations. If these representations are false or if such customers do not otherwise comply with applicable privacy laws, we could face potentially adverse publicity and possible legal or other regulatory action.We distribute our application products primarily through distributors, resellers, retailers and increasingly systems integrators, ISVs and VARs (collectively referred to as “distributors”). Corporation.Corporation, which represented 15% and 8% of our net revenue for fiscal 2009, respectively. We have multiple non-exclusive, independently negotiated distribution agreements with Ingram Micro and Tech Data and their subsidiaries covering our arrangements in specified countries and regions. Each of these contracts has an independent duration, is independent of any other agreement (such as a master distribution agreement) and any termination of one agreement does not affect the status of any of the other agreements. In addition,fiscal 2009, no single agreement with these distributors was responsible for over 10% of our total net revenue. If any one of our agreements with these distributors were terminated, we believe we could make arrangements with new or existing distributors to distribute our products without a substantial disruption to our business; however, any prolonged delay in securing a replacement distributor could have a negative short-term impact on our results of operations.program focusespartners, we face potential legal risk from the activities of these third parties including, but not limited to, export control violations, corruption and anti-competitive behavior. Although we have undertaken efforts to reduce these third-party risks, they remain present. We cannot be certain that our efforts on larger distributors, which has resulted indistribution channel will continue to market or sell our dependence on a relatively small number of distributors licensing a large amount of ourproducts effectively. If we are not successful, we may lose sales opportunities, customers and revenues.products. theseour distributors and our continuing relationships with them are important to our success. Some of these distributors may be unable to withstand adverse changes in business conditions.current economic conditions, which could result in insolvency of certain of our distributors and/or the inability of our distributors to obtain credit to finance purchases of our products. In addition, weakness in the end-user market could further negatively affect the cash flow of our distributors who could, in turn, delay paying their obligations to us, which would increase our credit risk exposure. Our business could be seriously harmed if the financial condition of some of these distributors substantially weakens.cyber-attack,cyber attack, war, terrorist attack, or other catastrophic event could cause system interruptions, reputational harm, loss of intellectual property, delays in our product development, lengthy interruptions in our services, breaches of data security and loss of critical data and could prevent us from fulfilling our customers’ orders. Our corporate headquarters, a significant portion of our research and development activities, certain of our data centers, and certain other critical business operations are located in San Jose, California, which is near major earthquake faults. We believe we have developed sufficientcertain disaster recovery plans and certain backup systems to reduce the potentially adverse effect of such events, but a catastrophic event that results in the destruction or disruption of any of our data centers or our critical business or information technology systems could severely affect our ability to conduct normal business operations and, as a result, our future operating results could be adversely affected.We rely on turnkey assemblers and any adverse change in our relationship with our turnkey assemblers could result in a lossrevenue and harm our business.We currently rely on six turnkey assemblers of our products, with at least two turnkeys located in each major region we serve. If any significant turnkey assembler terminates its relationship with us, or if our supply from any significant turnkey assembler is interrupted or terminated for any other reason, wethe market generally may not have enough time or be able to replace the supply of products replicatedby that turnkey assembler to avoid serious harm to our business.Our future operating results are difficult to predict and are likely to fluctuate substantially from quarter to quarter and as a resultcause the market price of our stock to decline.volatile and our stock price could decline.As a result of a variety of factors discussed herein, our quarterly revenues and operating results for a particular period are difficult to predict. Our revenues may grow at a slower rate than experienced in previous periods and, in particular periods, may decline. Additionally, we periodically provide operating model targets. These targets reflectaffected by a number of assumptions,factors, including assumptions about product pricing and demand, economic and seasonal trends, competitive factors, manufacturing costs and volumes, the mix of shrink-wrap and licensingshortfalls in our net revenue, full and upgrade products, distribution channels and geographic markets. If one or more of these assumptions prove incorrect, our actual results may vary materially from those anticipated, estimated or projected.Due to the factors noted above, our future earnings and stock price may be subject to volatility, particularly on a quarterly basis. Shortfalls in revenue ormargins, earnings or delays in the release of products or upgrades compared to analysts’ or investors’ expectations have caused and could cause in the future an immediate and significant decline in the trading price of our common stock. Additionally, we may not learn of such shortfalls or delays until late in the fiscal quarter, which could result in an even more immediate and greater decline in the trading price of our common stock. Finally, we participate in a highly dynamic industry. In addition to factors specific to us,key performance metrics, changes in analysts’ earnings estimates foror recommendations by securities analysts; the announcement of new products, product enhancements or service introductions by us or our industry, and factors affecting the corporate environment, our industry, or the securities markets in general, have resulted, and may competitors, seasonal variationsfuture result,demand for our products and services and the implementation cycles for our new customers, the loss of a large customer or our inability to increase sales to existing customers and attract new customers, quarterly variations in volatilityour or our competitors’ results of operations, developments in our common stock price.industry; unusual events such as significant acquisitions, divestitures and litigation, general socio-economic, regulatory, political or market conditions and other factors, including factors unrelated to our operating performance.internationalglobal operations which may harm our business.typically generateare a global business that generates over 50% of our total revenue from sales to customers outside of the Americas. Sales to these customers subjectThis subjects us to a number of risks, including (i) foreign currency fluctuations, (ii) changes in government preferences for software procurement, (iii) international economic and political conditions, (iv) unexpected changes in, or impositions of, international legislative or regulatory requirements, (v) inadequate local infrastructure, (vi) delays resulting from difficulty in obtaining export licenses for certain technology, tariffs, quotas and other trade barriers and restrictions, (vii) transportation delays, (viii) the burdens of complying with a variety of foreign laws, including more stringent consumer and data protection laws, and other factors beyond our control, including terrorism, war, natural disasters and diseases. including:· foreign currency fluctuations; · changes in government preferences for software procurement; · international economic, political and labor conditions; · tax laws (including U.S. taxes on foreign subsidiaries); · increased financial accounting and reporting burdens and complexities; · unexpected changes in, or impositions of, legislative or regulatory requirements; · failure of laws to protect our intellectual property rights adequately; · inadequate local infrastructure and difficulties in managing and staffing international operations; · delays resulting from difficulty in obtaining export licenses for certain technology, tariffs, quotas and other trade barriers and restrictions; · transportation delays; · operating in locations with a higher incidence of corruption and fraudulent business practices; and · other factors beyond our control, including terrorism, war, natural disasters and diseases. yenYen and the euro.Euro. We regularly review our hedging program and will make adjustments as necessary based on the judgment factors discussed above. Our hedging activities may not offset more than a portion of the adverse financial impact resulting from unfavorable movement in foreign currency exchange rates, which could adversely affect our financial condition or results of operations.conformityaccordance with U.S.accounting principles generally accepted accounting principles.in the United States of America (“GAAP”). These principles are subject to interpretation by the SEC and various bodies formed to interpret and create appropriate accounting principles. A change in these principles can have a significant effect on our reported results and may even retroactively affect previously reported transactions. Our accounting principles that recently have been or may be affected by changes in the accounting principles are as follows:· software revenue recognition;·· software and subscription revenue recognition; · accounting for stock-based compensation; · accounting for income taxes; and · accounting for business combinations and related goodwill. stock-based compensation;· accounting for income taxes; and·business combinations, which changes the accounting for business combinations including timing of the measurement of acquirer shares issued in consideration for a business combination, the timing of recognition and amount of contingent consideration, the accounting for pre-acquisition gain and loss contingencies, the recognition of capitalized in-process research and development, the accounting for acquisition related goodwillIn particular,restructuring liabilities, the treatment of acquisition related transaction costs and the recognition of changes in the acquirer’s income tax valuation allowance. The revised standards for business combinations is effective for financial statements issued for fiscal years beginning after December 15, 2008. The revised standards for business combinations are effective for us beginning the first quarter of fiscal 2006, we adopted SFAS 123R which requires the measurement of all stock-based compensation to employees, including grants of employee stock options, using a fair-value-based method and the recording of such expense in our consolidated statements of income. The adoption of SFAS 123R had a significant adverse effect on our reported financial results. It will continue to significantly adversely affect our reported financial results and may impact the way in which we conduct our business. Please refer to Notes 1 and 11 of our Notes to Consolidated Financial Statements for further information regarding2010. We currently believe that the adoption of SFAS 123R.generally accepted accounting principles,GAAP, we review our goodwill and amortizable intangible assets for impairment when events or changes in circumstances indicate the carrying value may not be recoverable. Goodwill is required to be tested for impairment at least annually. Factors that may be considered a change in circumstances indicating that the carrying value of our goodwill or amortizable intangible assetstax laws or the interpretation of, tax laws,rules and regulations in the jurisdictions in which we do business, by unanticipated decreases in the amount of revenue or earnings in countries with low statutory tax rates, by lapses of the availability of the U.S. research and development tax credit, or by changes in the valuation of our deferred tax assets and liabilities.Internal Revenue ServiceIRS and other domestic and foreign tax authorities, including a current examination by the Internal Revenue Service forIRS of our fiscal 2001, 20022005, 2006 and 20032007 tax returns, primarily relatedreturns. These examinations are expected to focus on our intercompany transfer pricing.pricing practices as well as other matters. We regularly assess the likelihood of outcomes resulting from these examinations to determine the adequacy of our provision for income taxes and have reserved for potential adjustments that may result from the current examination. We believe such estimates to be reasonable; however, there can be no assurance that the final determination of any of these examinations will not have an adverse effect on our operating results and financial position.management, including our Chief Executive Officer and other members of our executive team.management. These individuals have acquired specialized knowledge and skills with respect to Adobe. The loss of any of these individuals could harm our business. Our business is also dependent on our ability to retain, hire and motivate talented, highly skilled personnel. Experienced personnel in the information technology industry are in high demand and competition for their talents is intense, especially in the Silicon Valley,Bay Area, where the majoritymany of our employees are located. We have relied on our ability to grant equity compensation as one mechanism for recruiting and retaining such highly skilled personnel. Recently enacted accountingAccounting regulations requiring the expensing of equity compensation may impair our ability to provide these incentives without incurring significant compensation costs. Additionally, the recent significant adverse volatility in our stock price has resulted in many employees’ stock option exercise prices exceeding the underlying stock’s market value as well as deterioration in the value of employees’ restricted stock units granted, thus lessening the effectiveness of retaining employees through stock-based awards. If we are unable to continue to successfully attract and retain key personnel, our business may be harmed. hold equity investments in public companies that have experienced significant declines in market value. We also have investments and plan to continue to make future investments in privately held companies, many of which are considered in the start-up or development stages. These investments are inherently risky, as the market for the technologies or products these companies have under development is typically in the early stages and may never materialize. Our investment activities can impact our net income. Future price fluctuations in these securities and any significant long-term declines in value of any of our investments could reduce our net income in future periods.412006.2009. We lease or sublease all of these properties with the exception of our property in India, where we own the building and lease the land, and San Francisco on Townsend and Waltham where we own the building and land. All properties are leased under operating leases. Such leases expire at various times through 2025,2028, with the exception of the land lease that expires in 2091. The annual base rent expense (including operating expenses, property taxes and assessments, as applicable) for all facilities is currently approximately $69.1$84.8 million and is subject to annual adjustments as well as changes in interest rates. and administration Administration, productProduct development, sales and salesadministration
Street263,000* administration, sales, marketing and marketingadministration 255,0001-3 Riverside Center275 Grove StreetNewton, MA 02466, USA81,000*Sales, marketing, research, product development333 Preston StreetOttawa, Ontario K1S 1N4122,000India:61,000 ** Product development, sales and marketing 108,000 63,000 *** Research, product development, sales and marketing 35,000 Product development, sales and marketing 29,000 Product development, sales and marketing 122,000 Research, product development, sales, marketing and administration India: 201301200,00065,000 Product development 56002956,000ProductLocation Use Japan: Japan:Ohsaki,Osaki, Shinagawa-ku 141-003257,000Sales,Product development, sales and marketingChina: 77,000 Research and product development Germany: 36,000 Research and product development Romania: 44,000 Research and product development UK: 22,000 Product development, sales, marketing and product developmentadministration* Germany:Grobe Elbstrable 27Hamburg 2276727,000Product developmentThe total square footage is 346,000, of which we occupy 272,000 square feet, or approximately 79% of this facility; 74,000 square feet is unoccupied basement space. UK:3 Roundwood AvenueStockley Park, Uxbridge, UB11 1AYSales, marketing, product development, and administration square feet, or approximately 34% of this facility. The remaining square footage is subleased. * The total square footage is 348,000, of which we occupy 81,000 square feet, or approximately 23% of this facility.*** The total square footage is 63,000, of which we occupy 49,000 square feet, or approximately 78% of this facility. The remaining square footage is subleased. In addition to the facilities listed above, we also lease other office space in the United States and various other countries under operating leases. We have one leased set of offices in San Jose, California that was vacated in connection with the restructuring program implemented in fiscal 1998. We have subleased the offices but still have a commitment under the lease agreement until mid 2007.6, 2002, Plaintiff Fred B. Dufresne23, 2009, Richard Miner on behalf of himself and all similarly situated stockholders of Omniture, Inc. filed suita class action lawsuit captioned Miner v. Omniture, Inc., et. al., Case No. 090403559 (the “Miner Lawsuit”) against Adobe, Microsoft Corporation, Macromedia, Inc.Omniture, the members of Omniture’s board of directors (collectively, the “Omniture Defendants”) and Trellix CorporationAdobe in the U.S.United States Fourth Judicial District Court for Utah County, Provo Department, State of Utah seeking to enjoin the proposed acquisition between Omniture and Adobe. In the event the acquisition is consummated, the plaintiff seeks to recover an unspecified amount of damages. The plaintiff alleges that the members of Omniture’s board of directors breached their fiduciary duties to Omniture’s stockholders by failing to seek the highest possible price for Omniture and that Adobe induced or aided and abetted in the alleged breach of such fiduciary duties. Also on September 23, 2009, Christopher R. Barrell filed a substantially similar lawsuit to the Miner Lawsuit in the United States Fourth Judicial District Court for Utah County, Provo Department, State of Massachusetts, alleging infringement of U.S. PatentUtah, captioned Barrell v. Omniture, Inc. et. al., Case No. 5,835,712, entitled “Client-Server System Using Embedded Hypertext Tags090403560 (the “Barrell Lawsuit”). The Barrell Lawsuit names the same defendants as the Miner Lawsuit, and also names Snowbird Acquisition Corporation as an additional defendant. Subsequently, on September 24, 2009, the plaintiff in the Barrell Lawsuit filed an amended complaint, which added allegations that the Schedule 14D-9 Solicitation/Recommendation Statement filed by Omniture on September 24, 2009 contained inadequate disclosures and was materially misleading. On September 25, 2009, the Omniture Defendants filed a motion requesting that the court consolidate the Barrell Lawsuit, Miner Lawsuit and a substantially similarApplication and Database Development.”an order consolidating all three lawsuits. The Plaintiff’s complaint asserts that “defendants have infringed, and continue to infringe, one or more claimsplaintiffs in the three lawsuits filed a joint motion seeking preliminary injunction barring the consummation of the ‘712 patentproposed acquisition and requiring additional disclosures by making, using, selling and/or offeringOmniture in its Schedule 14D-9. At a hearing on October 20, 2009, the court granted Omniture’s motion to consolidate the three cases and denied the plaintiffs’ motion for sale, inter alia, products supporting Microsoft Active Server Pages technology.” Plaintiff seeks unspecified compensatory damages,a preliminary and permanent injunctive relief, trebling of damages for “willful infringement,” and fees and costs. We believeinjunction. On December 30, 2009, the action has no merit and are vigorously defending against it.On October 13, 2006, a purported shareholder derivative action entitled Steven Staehr v. Bruce R. Chizen, et al was filed in the Superior Court of California for the County of Santa Clara against certain of the Company’s current and former officers and directors, and against Adobe as a nominal defendant. The complaint asserts that stock option grants to executives were priced retroactively by Adobe and were improperly accounted for, and alleges various causes of action based on that assertion. The complaint seeks payment byplaintiffs served the defendants with a consolidated amended complaint. Adobe intends to Adobe of damages allegedly suffered by it and disgorgement of profits, as well as injunctive relief.defend the lawsuits vigorously. law and have recently increased in frequency, especially in Latin American countries.laws. We believe we have valid defenses with respect to such counter-claims; however, it is possible that our consolidated financial position, cash flows or results of operations could be affected in any particular period by the resolution of one or more of these counter-claims. in addition to those identified above, Adobe is subject to legal proceedings, claims investigations and proceedingsinvestigations in the ordinary course of business, including claims of alleged infringement of third-party patents and other intellectual property rights, commercial, employment and other matters. In accordance with U.S. generally accepted accounting principles,GAAP, Adobe makes a provision for a liability when it is both probable that a liability has been incurred and the amount of the loss can be reasonably estimated. These provisions are reviewed at least quarterly and adjusted to reflect the impacts of negotiations, settlements, rulings, advice of legal counsel and other information and events pertaining to a particular case. Litigation is inherently unpredictable. However, we believe that we have valid defenses with respect to the legal matters pending against Adobe. It is possible, nevertheless, that our consolidatedthean unfavorable resolution of one or more of such contingencies.December 1, 2006.(a) On January 19, 2007,According to the records of our transfer agent, there were 1,8271,709 holders of record of our common stock.stock on January 15, 2010. Because many of such shares are held by brokers and other institutions on behalf of stockholders, we are unable to estimate the total number of stockholders represented by these record holders.and the cash dividends paid per share, for the periods indicated. All per share amounts in the following table have been adjusted to reflect the two-for-one stock split in the form Price Range High Low Fiscal 2009: First Quarter $ 24.29 $ 16.70 Second Quarter $ 28.18 $ 15.98 Third Quarter $ 33.43 $ 26.34 Fourth Quarter $ 36.90 $ 31.00 Fiscal Year $ 36.90 $ 15.98 Fiscal 2008: First Quarter $ 44.62 $ 32.62 Second Quarter $ 44.06 $ 30.79 Third Quarter $ 45.89 $ 38.23 Fourth Quarter $ 43.14 $ 20.75 Fiscal Year $ 45.89 $ 20.75 a stock dividend effected May 23, 2005.Equity Securities
DividendUnder the terms of our lease agreements for our San Jose headquarters, we are not prohibited from paying cash dividends unless an event of default occurs. We discontinued our quarterly cash dividend after the payment of the dividend for the first quarter of fiscal 2005. We intend to use the cash previously used to pay the quarterly dividend for our ongoing stock repurchase programs.For information on our equity compensation plans, refer to Note 11 in our Notes to Consolidated Financial Statements.(c) December 1, 2006 (in thousands, except average price per share). November 27, 2009. See Note 1214 of our Notes to Consolidated Financial Statements for information regarding our stock repurchase programs. Stock Repurchase Program I Beginning shares available to be repurchased as of August 28, 2009 131,855,184 (3) August 29—September 25, 2009 1,842,160 $ 31.62 September 26—October 23, 2009 1,770,314 $ 32.73 October 24—November 27, 2009 10 $ 34.78 1,705,926 $ 33.88 — 5,840,221 (5) 5,318,410 (5,318,410 ) Ending shares available to be repurchased under Program I as of November 27, 2009 132,376,995 (6)
Repurchased(1)
Price Per
Share
Number of Shares
that May Yet be
PurchasedIn December 1997, our Board of Directors authorized Stock Repurchase Program I which is not subject to expiration. However, this repurchase program is limited to covering net dilution from stock issuances and is subject to business conditions and cash flow requirements as determined by our Board of Directors from time to time. (2) All shares were purchased as part of publicly announced plans. (3) Additional 109.0 million shares were issued for the acquisition of Macromedia which accounted for the majority of the repurchase authorization. (4) The repurchases from employees represent shares cancelled when surrendered in lieu of cash payments for withholding taxes due. (5) Adjustment of authority to reflect changes in the dilution from outstanding shares and options. (6) The remaining authorization for the ongoing stock repurchase program is determined by combining all stock issuances, net of any cancelled, surrendered or exchanged shares less all stock repurchases under the ongoing plan, beginning in the first quarter of fiscal 1998. publicly announced plans.(2) The repurchases from employees represent shares canceled when surrendered in lieu of cash payments for withholding taxes due.(3) Adjustment of authority to reflect changes in the dilution from outstanding sharesStandard & Poor’s 500 Index (“S&P 500”) and options.(4) The remaining authorizationthe S&P 500 Software & Services Index for the ongoingfive fiscal year periods ending November 27, 2009. The stock repurchase programprice information shown on the graph below is determined by combining allnot necessarily indicative of future price performance.issuances, netthe S&P 500 Index and the S&P 500 Software & Services Index, with reinvestment of any canceled, surrendered or exchanged shares less all stock repurchases underdividends. For each reported year, our reported dates are the ongoing plan, beginning inlast trading dates of our fiscal year which ends on the first quarter of fiscal 1998.Friday closest to November 30. 2004 2005 2006 2007 2008 2009 $ 100.00 $ 111.13 $ 125.05 $ 133.91 $ 73.60 $ 112.43 $ 100.00 $ 108.16 $ 121.69 $ 131.45 $ 81.83 $ 101.64 S&P 500 Software & Services Index $ 100.00 $ 102.94 $ 107.51 $ 122.76 $ 70.42 $ 106.79 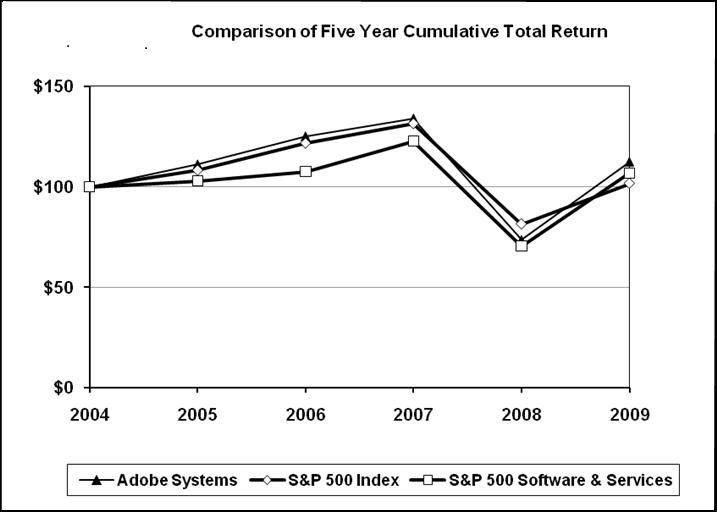
45(*) The material in this report is not deemed “filed” with the SEC and is not to be incorporated by reference into any of our filings under the Securities Act of 1933 or the Securities Exchange Act of 1934, whether made before or after the date hereof and irrespective of any general incorporation language in any such filings. areis derived from our consolidated financial statements. This data should be read in conjunction with the consolidated financial statements and notes thereto, and with Item 7, Management’s Discussion and Analysis of Financial Condition and Results of Operations. All per share amounts referred to in the table below have been adjusted to reflect the two-for-one stock split in the form of stock dividends effected May 23, 2005.�� Fiscal Years 2009 2008 2007 2006 2005 Operations: $ 2,945,853 $ 3,579,889 $ 3,157,881 $ 2,575,300 $ 1,966,321 $ 2,649,121 $ 3,217,259 $ 2,803,187 $ 2,282,843 $ 1,853,743 $ 701,520 $ 1,078,508 $ 947,190 $ 679,727 $ 765,776 $ 386,508 $ 871,814 $ 723,807 $ 505,809 $ 602,839 $ 0.74 $ 1.62 $ 1.24 $ 0.85 $ 1.23 $ 0.73 $ 1.59 $ 1.21 $ 0.83 $ 1.19 Cash dividends declared per common share $ — $ — $ — $ — $ 0.00625 Cash, cash equivalents and short-term investments $ 1,904,473 $ 2,019,202 $ 1,993,854 $ 2,280,879 $ 1,700,834 $ 1,629,071 $ 1,972,504 $ 1,720,441 $ 2,208,688 $ 1,528,915 $ 7,282,237 $ 5,821,598 $ 5,713,679 $ 5,962,548 $ 2,440,315 $ 1,000,000 $ 350,000 $ — $ — $ — $ 4,890,568 $ 4,410,354 $ 4,649,982 $ 5,151,876 $ 1,865,164 Additional data: 8,660 7,544 6,794 6,068 4,285 (1) (2) On March 16, 2005, our Board of Directors approved a two-for-one stock split, in the form of a stock dividend, of our common stock payable on May 23, 2005 to stockholders of record as of May 2, 2005. Per share data, for all periods presented, have been adjusted to give effect to this stock split. (3) Information associated with our financial position is as of the Friday closest to November 30 for the five fiscal periods through 2009. *TABLE OF CONTENTS In fiscal 2006, net income and net income per share includes the impact of SFAS 123R stock-based compensation charges as well as the integration of Macromedia into our operations, neither of which were present in prior years. Refer to Notes 2 and 11 of our Notes to Consolidated Financial Statements. (presented in millions) should be read in conjunction with our consolidated financial statements and notes thereto. The share and per share data below have been adjusted to give effect to our stock split as of May 23, 2005.10-K/A10-K contains forward-looking statements, including statements regarding product plans, future growth and market opportunities which involve risks and uncertainties that could cause actual results to differ materially. materially from these forward-looking statements. Factors that might cause or contribute to such differences include, but are not limited to, those discussed in the section titled “Business - Risk Factors.”“Risk Factors” in Part 1, Item 1A of this report. You should carefully review the risks described herein and in other documents we file from time to time with the SEC, including the Quarterly Reports on Form 10-Q to be filed in 2007.fiscal 2010. When used in this report, the words “expects,” “could,” “would”,“would,” “may,” “anticipates,” “intends,” “plans,” “believes,” “seeks,” “targets,” “estimates,” “looks for,” “looks to,”to” and similar expressions, as well as statements regarding our focus for the future, are generally intended to identify forward-looking statements. You should not place undue reliance on these forward-looking statements, which speak only as of the date of this Annual Report on Form 10-K/A.10-K. We undertake no obligation to publicly release any revisions to the forward-looking statements or reflect events or circumstances after the date of this document.On December 3, 2005, we completed the acquisition of Macromedia for approximately $3.5 billion. We expect our revenues, cost of revenues and operating expenses to increase in the future, but we also anticipate cost saving synergies. We incurred restructuring charges of $19.7 million during fiscal 2006. Coinciding with the integration of Macromedia and the start of our 2006 fiscal year, we changed the reporting of our segments to be aligned with our market opportunities and how we manage our various businesses. The discussions in this section of the Annual Report on Form 10-K/A, as well as the financial statements contained herein, reflect the impact of the acquisition. See Note 2 for further information regarding this acquisition.high-end consumers, creative professionals, designers, knowledge workers, OEM partners,consumers, OEMs, developers and enterprises for creating, managing, delivering, optimizing and engaging with compelling content and experiences across multiple operating systems, devices and media. We distribute our products through a network of distributors, and dealers, VARs, systems integrators, ISVs and OEMs;OEMs, direct to end users;users and through our own Web siteWebsite at www.adobe.com. We also license our technology to major hardware manufacturers, software developers and service providers, and we offer integrated software solutions to businesses of all sizes. We have operations in the Americas, Europe, EMEA and Asia. Our software runs on personal computers with Microsoft Windows, Apple OS, Linux, UNIX and various non-personal computernon-PC platforms, depending on the product.can have a significant impact onaffect the reported amounts reported in our consolidated financial statements.of assets, liabilities, revenue and expenses, and related disclosures of contingent assets and liabilities. We base our assumptions, judgments and estimates on historical experience and various other factors that we believe to be reasonable under the circumstances. Actual results could differ materially from these estimates under different assumptions or conditions. On a regular basis, we evaluate our assumptions, judgments and estimates and make changes accordingly.estimates. We also discuss our critical accounting policies and estimates with the Audit Committee of the Board of Directors.We discuss below the critical accounting estimates associated with these policies. Historically, our assumptions, judgments and estimates relative to our critical accounting policies have not differed materially from actual results. For further information on our critical accounting policies, see Note 1 of our Notes to Consolidated Financial Statements.in accordance with current U.S. generally accepted accounting principles thatwhen all four revenue recognition criteria have been prescribedmet: persuasive evidence of an arrangement exists, we have delivered the product or performed the service, the fee is fixed or determinable and collection is probable. Determining whether and when some of these criteria have been satisfied often involves assumptions and judgments that can have a significant impact on the timing and amount of revenue we report. For example, for multiple element arrangements, we must: (1) determine whether and when each element has been delivered; (2) determine whether undelivered products or services are essential to the functionality of the delivered products and services; (3) determine whether vendor-specific objective evidence (“VSOE”) of fair value exists for each undelivered element; and (4) allocate the total price among the various elements we must deliver. Changes in assumptions or judgments or changes to the elements in a software industry. Revenue recognition requirementsarrangement could cause a material increase or decrease in the software industry are very complex and are subject to change. In applying ouramount of revenue recognition policythat we must determine which portions of our revenue are recognized currently and which portions, if any, must be deferred. In order to determine current and deferred revenue, we make judgments and estimates with regard to future deliverable products and services and the appropriate pricing for those products and services. report in a particular period.OurWhile we believe we can make reliable estimates regarding these matters, these estimates are inherently subjective. Accordingly, our assumptions and judgments regarding future products and services as well as our estimates of royalty revenuesrevenue could differ from actual events, thus materially impacting our financial position and results of operations.have to estimate provisionsreduce the revenue recognized for estimated future returns, which are recorded against our revenues.price protection and rebates at the time the related revenue is recorded. In determining our estimate for returns and in accordance with our internal policy regarding global channel inventory which is used to determine the level of product held by our distributors on which we have recognized revenue, we rely upon historical data, the estimated amount of product inventory in our distribution channel, the rate at which our product sells through to the end user, product plans and other factors. Our estimated provisions for returns can vary from what actually occurs. MoreProduct returns may be more or less product may be returned fromthan what was estimated. The amount of inventory in the channel could be different than what is estimated. Our estimate of the rate of sell through for product in the channel could be different than what actually occurs. There could be a delay in the release of our products. These factors and unanticipated changes in the economic and industry environment could make our return estimates differ from actual returns, thus materially impacting our financial position and results of operations.adoptedoffer price protection to our distributors that allows for the provisionsright to a credit if we permanently reduce the price of a software product. When evaluating the adequacy of the price protection allowance, we analyze historical returns, current sell-through of distributor and accountretailer inventory of our products, changes in customer demand and acceptance of our products and other related factors. In addition, we monitor the volume of sales to our channel partners and their inventories. Changes to these assumptions or in the economic environment could result in higher returns or higher price protection costs in subsequent periods.stock-based compensationhosting services that are based on a committed number of transactions, including implementation and set-up fees, ratably beginning on the date the customer commences use of our services and continuing through the end of the customer term. Over-usage fees, and fees billed based on the actual number of transactions from which we capture data, are billed in accordance with Statementcontract terms as these fees are incurred. We record amounts that have been invoiced in accounts receivable and in deferred revenue or revenue, depending on whether the revenue recognition criteria have been met.Financial Accounting Standard (“SFAS”) 123R during the first quarterconsulting revenue could differ from actual events and may materially impact our financial position and results of fiscal 2006. We elected the modified-prospective method, under which prior periods are not revised for comparative purposes. Under the fair value recognition provisions of this statement, stock-basedoperations.payment awards on the date of grant using an option-pricingoption pricing model is affected by our stock price as well as assumptions regarding a number of complex and subjective variables. These variables include our expected stock price volatility over the expected term of the awards, actual and projected employee stock option exercise behaviors, the risk-free interest rate, estimated forfeitures and expected dividends.As permitted by Staff Accounting Bulletin (“SAB”) 107, weWe estimate the that we use in the option pricing model on zero-coupon yields implied from U.S. Treasury issues with remaining terms similar to the expected term on the options. We do not anticipate paying any cash dividends in the foreseeable future and therefore use an expected dividend yield of zero in the option pricing model. We are required to estimate forfeitures at the time of grant and revise those estimates in subsequent periods if actual forfeitures differ from those estimates. We use historical data to estimate pre-vesting option forfeitures and record stock-based compensation expense only for those awards that are expected to vest. All share based payment awards are amortized on a straight-line basis over the requisite service periods of the awards, which are generally the vesting periods.factors change and we employuse different assumptions for estimating stock-based compensation expense in future periods or if we decide to use a different valuation model,actual forfeitures differ materially from our estimated forfeitures, the future periods may differ significantly from what we have recordedchange in the current period andour stock-based compensation expense could materially affect our operating income, net income and net income per share.Black-Scholes option-pricing model waspurchase price allocation process requires management to make significant estimates and assumptions, especially at acquisition date with respect to intangible assets and deferred revenue obligations assumed.· future expected cash flows from software license sales, subscriptions, support agreements, consulting contracts and acquired developed technologies and patents; · expected costs to develop the in-process research and development into commercially viable products and estimated cash flows from the projects when completed; · the acquired company’s trade name and trademarks as well as assumptions about the period of time the acquired trade name and trademarks will continue to be used in the combined company’s product portfolio; and · discount rates. use in estimatingour acquisitions, we estimate the fair value of traded options that have no vesting restrictions and are fully transferable, characteristics not present in our option grants and employee stock purchase plan shares. Existing valuation models, including the Black-Scholes and lattice binomial models, may not provide reliable measuresdeferred revenue obligations assumed. The estimated fair value of the support obligations is determined utilizing a cost build-up approach. The cost build-up approach determines fair values of our stock-based compensation. Consequently, there isvalue by estimating the costs related to fulfilling the obligations plus a risk that our estimates ofnormal profit margin. The estimated costs to fulfill the fair values of our stock-based compensation awardsobligations are based on the grant dateshistorical costs related to fulfilling the obligations.bear little resemblance to the actual values realized upon the exercise, expiration, early termination or forfeiture of those stock-based payments in the future. Certain stock-based payments, such as employee stock options,occur which may expire worthless or otherwise result in zero intrinsic value as compared to the fair values originally estimated on the grant date and reported in our financial statements. Alternatively, value may be realized from these instruments that are significantly higher than the fair values originally estimated on the grant date and reported in our financial statements. There currently is no market-based mechanism or other practical application to verify the reliability and accuracy of the estimates stemming from these valuation models, nor is there a means to compare and adjust the estimates to actual values.The guidance in SFAS 123R and SAB 107 is relatively new. The application of these principles may be subject to further interpretation and refinement over time. There are significant differences among valuation models, and there is a possibility that we will adopt different valuation models in the future. This may result in a lack of consistency in future periods and materially affect the fair value estimateaccuracy or validity of stock-based payments. It may also result in a lack of comparability with other companies that use different models, methods and assumptions.See Note 11 of our Consolidated Financial Statements for further information regarding the SFAS 123R disclosures.performcomplete our goodwill impairment teststest on an annual basis, during the second quarter of our fiscal year, or more frequently, if changes in facts and circumstances warrant a review. We make judgments about goodwill whenever events or changes in circumstances indicate that an impairment in the value of goodwill recorded on our balance sheet may exist. The timing of an impairment test may result in charges to our statements of income in our current reporting period that could not have been reasonably foreseen in prior periods. In order to estimate the fair value of goodwill, we typically make various assumptions about theestimate future prospects the asset relates to,revenue, consider market factorsandor our internal forecasts. Although we believe the assumptions, judgments and estimates we have made in the past have been reasonable and appropriate, different assumptions, judgments and estimates could materially affect our reported financial results. More conservative assumptionsthe anticipatedfiscal 2009 and determined there was no impairment. We currently believe that there is no significant risk of future benefits could resultmaterial goodwill impairment in impairment charges, which would decrease net income and result in lower asset values onany of our balance sheet. Conversely, less conservative assumptions could result in smaller or no impairment charges, higher net income and higher asset values. assumptions and estimates relative to the current provision for income taxtaxes take into account current tax laws, our interpretation of current tax laws and possible outcomes of current and future audits conducted by foreign and domestic tax authorities. We have established reserves for income taxes to address potential exposures involving tax positions that could be challenged by tax authorities. WeIn addition, we are currently undersubject to the continual examination of our income tax returns by the IRS and other domestic and foreign tax authorities, including a current examination by the Internal Revenue ServiceIRS for our fiscal 2001, 20022005, 2006 and 20032007 tax returns, primarily relatedreturns. These examinations are expected to focus on our intercompany transfer pricing.pricing practices as well as other matters. Although we believe our assumptions, judgments assumptions and estimates are reasonable, changes in tax laws or our interpretation of tax laws and the resolution of the current and any future tax audits could significantly impact the amounts provided for income taxes in our consolidated financial statements.2006, we continued to focus on delivering market-leading technologies2009, our business was broadly impacted by the global economic recession and software that are redefining business, entertainment, and personal communications. Our solutions, which utilize industry standards for producing and delivering content that allow people to engage with information virtually anywhere at anytime, drove stronggenerally weak macro-economic environment. This resulted in a significant year-over-year decline in our revenue and earnings growth in the year.SolutionSolutions segment, we generated strong year-over-year growth based on the addition of Macromedia productsrevenue decreased by 18% during fiscal 2009 as compared to our product portfolio and the performancefiscal 2008. We attribute this decline to reduced adoption of our Creative SuiteCS4 family of products family. In addition, to capitalize onduring the broad adoption of digital video onyear, as the Web, we introduced Production Studio 1.0 - a suite of video products - including Adobe Premiere Pro 2.0, Adobe After Effects 7.0, Adobe Audition 2.0, and Adobe Encore 2.0. This new release drove strong year-over-year growthglobal financial crisis significantly affected demand in the digital video categorycreative professional end user market. All major creative product categories declined on a year-over-year basis.our creative business.50In the fourth quarter, we introduced new versions of our Adobe Photoshop Elements and Adobe Premiere Elements hobbyist products, which target consumers who desire professional-like capabilities with an easy-to-use interface for enhancing and sharing their memoriesrevenue in the form of images and video. These products contributed strong year-over-year growth in this category of our Creative Solutions segment.In our Knowledge Worker segment we introduced Adobe Acrobat 3D 7.0– was the primary factor for this decline. In our Enterprise business, our LiveCycle revenue declined 7% when compared to revenue achieved in fiscal 2008. We attribute this smaller percentage decline in comparison to our other segments to focused execution by our sales teams and the first quarterlarge market opportunities these product solutions address.address the needsimpact of the engineeringOSP. The removal of license fees associated with our Flash technologies on mobile devices commenced in fiscal 2009, and manufacturing markets, where complex documents are createdas such, OEM revenue from device manufacturers began to decline from rates of revenue we achieved in fiscal 2008. We continue to expect this decline to be offset over time by an increased demand for tooling products, server technologies, services and shared across diverse user basesapplications in many of our other business segments.platforms. In addition, we deliveredPublishing segment, revenue was also impacted by the Acrobat 8 family of productsglobal macroeconomic environment, resulting in a 16% year-over-year decline.of fiscal 2006. Acrobat 8 has numerous new features to help drive increased adoption by users in enterprises, governments and specialized vertical markets such as architecture, engineering and construction. In combination with the delivery of Acrobat 8, we introduced Acrobat Connect, a rebranded and new version of the former Macromedia Breeze product, which provides real-time collaboration via the Web. Together, these product introductions and our execution against the opportunities we forecastimprovement in the knowledge worker business helped us to achieve strong year-over-year growth in this business.Our Enterprise and Developer segment also achieved solid results in 2006, generating record revenue and gaining broad market acceptancegeneral economy, as indicated by an increase in the categoriestransaction volume on our network. In addition, customer retention rates began stabilizing and we experienced an increase in the number of Document Services and Rich Internet Applications withsubscription services provided to our LiveCycle and Flex technologies. $ 2,759.4 (19 )% $ 3,396.5 12 % $ 3,019.5 94 % 95 % 96 % 186.5 2 % 183.4 33 % 138.4 6 % 5 % 4 % $ 2,945.9 (18 )% $ 3,579.9 13 % $ 3,157.9 Other segments, we achieved solid growth through the monetization of our platform technologies, as well as new releases of existing products such as Adobe Captivate 2 and Adobe Contribute 4 (which were former Macromedia products). Our Postscript printing technology, a key part of our Other segments revenue, also generated year-over-year growth.
2006
2006 to 2005
2005
2005 to 2004
2004Coinciding with the integration of Macromedia and the start of fiscal 2006, we changed the reporting of our segments to be aligned with our market opportunities and how we manage our combined businesses. For comparability, the prior fiscal period’s results have been reclassified to reflect the realignment of the segments.We haveinto the following segments: Creative Solutions, Knowledge Worker, Solutions, Enterprise, Platform, Print and Developer Solutions, MobilePublishing and Device Solutions, and Other. Omniture products.This segment combines most of the products of our prior Creative Professional and Digital Imaging and Video segments, along with the creative professional-focused products and solutions that we obtained through our acquisition of Macromedia. TheOur Knowledge Worker Solutions segment focuses on the needs of knowledge worker customers, providing essential applications and services to help them reliably share information and collaborate effectively. This segment contains revenue generated by the Adobe Acrobat family of products. Our Enterprise segment provides server-based enterprise interaction solutions that automate people-centric processes. The segmentprocesses and contains revenue generated by our LiveCycle ColdFusion and Flex linesline of products. The MobilePlatform segment provides developer solutions and DeviceSolutions segment providestechnologies, including Adobe Flash Player, Adobe AIR and Flash Builder which are used to build rich application experiences in addition to solutions that create compelling experiences through rich content, user interfaces and data services on mobile and non-PC devices such as cellular phones, consumer devices and internetInternet connected hand-held devices. Finally, Other contains several of our productsThe Print and services which addressPublishing segment addresses market opportunities ranging from the diverse publishing needs of technical and business publishing, to our legacy type and OEM printing businesses,businesses. Finally, our Omniture segment provides Web analytics and online business optimization products and services.strategic opportunities such as OEM revenue generatedfiscal year. Specifically, we are moving responsibility for our Adobe Connect Pro product line from our free software downloads, which include Adobe Reader and Adobe Flash Player applications.Enterpriseenterprise, developer and Developer Solutionsplatform products. Our support revenue also includes technical support and developer support to partners and developer organizations related to our desktop products. Our consulting revenue is recognized using the proportionate performance method and is measured monthly based on input measures, such as on hours incurred to date compared to total estimated hours to complete, with consideration given to output measures, such as contract milestones, when applicable. Our maintenance and support offerings which entitle customers to receive product upgrades and enhancements or technical support, depending on the offering, isare recognized ratably over the term of the arrangement.Segment Information
2006
2006 to 2005
2005
2005 to 2004
2004*TABLE OF CONTENTS Other segment revenue includes platform revenue of $37.2 million and $0.4 million for fiscal 2006 and 2005, respectively, or 1% and 0% of total revenues, respectively. We did not have platform revenuefiscal 2004.millions) Creative Solutions $ 1,702.1 (18 )% $ 2,072.8 9 % $ 1,899.0 Percentage of total revenue 58 % 58 % 60 % Knowledge Worker 623.0 (23 )% 810.9 11 % 728.5 Percentage of total revenue 21 % 23 % 23 % Enterprise 235.5 (7 )% 253.0 32 % 191.3 Percentage of total revenue 8 % 7 % 6 % Platform 181.0 (22 )% 231.6 74 % 133.4 Percentage of total revenue 6 % 6 % 4 % Print and Publishing 178.0 (16 )% 211.6 3 % 205.7 Percentage of total revenue 6 % 6 % 7 % Omniture 26.3 * % — — % — Percentage of total revenue 1 % — % — % Total revenue $ 2,945.9 (18 )% $ 3,579.9 13 % $ 3,157.9 * Percentage is not meaningful. 20062009 Revenue Compared to Fiscal 20052008 Revenue20062008 as compared to fiscal 20052007 primarily due to ongoing adoption of our CS3 family of products, as well as the addition ofnewlaunch of our CS4 family of products in the fourth quarter of fiscal 2008. We also achieved solid growth in our Scene7 business and with our hobbyist products. The increase was also driven by a 7% increase in Creative Suites related revenue and an increase of 5% in Photoshop point product revenue. Also contributing to the acquisition of Macromedia. We had an approximately 45% increase in revenue fromfiscal 2008 as compared to fiscal 2007 was an increase in certain unit average selling prices. Units sold remained relatively stable.Digital Video software productsKnowledge Worker segment increased $82.4 million during fiscal 2008 as compared to fiscal 2007 primarily due to an increase in the release of the Adobe Production Studio and the new versionslicensing of our videoAcrobat 8 and new Acrobat 9 family of products. RevenueAn increase in the number of units sold as well as a slight increase in certain unit average selling prices also increased 9% in our creative products duecontributed to continued growth inhigher revenue from our Adobe Creative Suite product and the introduction of new software bundles. These increases were partially offset by a decrease in revenues of 2% from our Digital Imaging software products dueas compared to product lifecycle timing and the success of our suites and bundles.Knowledge Worker SolutionsEnterprise segment increased $61.7 million during fiscal 20062008 as compared to fiscal 20052007 primarily due to an increased adoption of our LiveCycle family of products and a larger number of enterprise solution transactions at a higher average transaction size.our Acrobat family of productsFlash Lite by mobile and non-PC device manufacturers, as well as increased revenue related to Flash Player and the launch ofAcrobat 8 during the fourth quarter of fiscal 2006, as well as the addition of new products related to the acquisition of Macromedia. There were no notable decreases for fiscal 2006.Revenue Adobe AIR which resulted in increased revenue from our Enterprisedeveloper tools.Developer Solutions segmentPublishing business increased by $5.9 million during fiscal 20062008 as compared to fiscal 2005 primarily due to the addition of new products related to the acquisition of Macromedia. Revenue from this segment also grew due to increases in revenue from our LiveCycle products of 23% as a result of increased licensing and server support revenue, as we continue to successfully focus on both the government sector and financial services. There were no notable decreases for fiscal 2006.Revenue from our Mobile and Device Solutions segment increased during fiscal 2006 as compared fiscal 2005, wholly due to the addition of new products related to the acquisition of Macromedia.Revenue from our Other segments increased during fiscal 2006 as compared to fiscal 2005, primarily due to increased revenue from PostScript licensing and to the addition of new products related to the acquisition of Macromedia. There were no notable decreases for fiscal 2006.Fiscal 2005 Revenue Compared to Fiscal 2004 RevenueRevenue from our Creative Solutions segment grew during fiscal 2005 as compared to fiscal 2004. The growth in the segment was due to a 32% increase in revenues from the new versions2007, driven by ongoing adoption of our Adobe Creative Suite products which were released during the second quarter of fiscal 2005. Additionally, there was a 3% increase in revenues from our digital imaging software products as a result of new releases of our Adobe Photoshop Elements producteLearning solutions as well as the new software bundle that combinessome of our Adobe Photoshop Elementslegacy print and Adobe Premiere Elementspublishing products. There were no notable decreases for fiscal 2005.Revenue from our Knowledge Worker segment increased during fiscal 2005 as compared to fiscal 2004 primarily due to a 36% increase in revenues from our Acrobat desktop products. The increase in revenues from our Acrobat desktop products is due to continued adoption of Acrobat desktop products by enterprises and technical professionals, as well as the release of Acrobat 7 during the first quarter of fiscal 2005.Revenue from our Enterprise Solutions segment increased during fiscal 2005 as compared to fiscal 2004 primarily due to our LiveCycle products. There was approximately a 10% increase in revenue during fiscal 2005 due to increased licensing and server support revenue, as we continued our focus on both the government sector and financial services. Additionally, revenue from our Enterprise Solutions segment increased during fiscal 2005 due to an increase in consulting revenues. There were no notable decreases for fiscal 2005.Revenue from our Other segments decreased slightly during fiscal 2005 as compared to fiscal 2004 primarily due to a decrease in revenues from our Classic Publishing software products.
2006
2006 to 2005
2005
2005 to 2004
2004 Americas $ 1,382.6 (15 )% $ 1,632.8 8 % $ 1,508.9 Percentage of total revenue 46 % 46 % 48 % EMEA 928.9 (24 )% 1,229.2 20 % 1,026.4 Percentage of total revenue 32 % 34 % 32 % Asia 634.4 (12 )% 717.9 15 % 622.6 22 % 20 % 20 % Total revenue $ 2,945.9 (18 )% $ 3,579.9 13 % $ 3,157.9 20062009 Revenue by Geography Compared to Fiscal 20052008 Revenue by Geographyrevenuesrevenue in each of the geographic segments for fiscal 2006 increased comparatively2009 decreased compared to fiscal 20052008 primarily due to the acquisitionglobal economic recession, which resulted in reduced adoption of Macromedia.the Americas and EMEA increased during fiscal 2006 as compared to fiscal 2005measured in U.S. dollars decreased approximately $47.1 million, due to the strength of our Creative Solutions, Enterprise Solutions, Knowledge Worker Solutions and Other segments.Revenue in Asia increased during fiscal 2006the U.S. dollar against the Euro, as compared to fiscal 20052008. Our currency hedging program is used to mitigate a portion of the foreign currency impact to revenue. During fiscal 2009, our currency hedging program related to the Euro resulted in hedging gains of $25.8 million. Revenue in Asia measured in U.S. dollars was favorably impacted by approximately $32.8 million due to the strength of our Creative Solutions, Enterprise Solutions, Mobile and Device Solutions, and Other segments.Additionally, due to the weakening ofYen against the euro and the yen, revenues in EMEA and Asia measured in U.S. dollars were lower by approximately $13.8 million and $21.2 million, respectively in fiscal 2006dollar as compared to fiscal 2005.20052008 Revenue by Geography Compared to Fiscal 20042007 Revenue by Geographythe Americas increasedEMEA measured in U.S. dollars was favorably impacted by approximately $69.3 million during fiscal 20052008 as compared to fiscal 2004 due to the strength of our Creative Solutions and Enterprise Solutions segments.Revenue in EMEA and Asia increased during fiscal 2005 as compared to fiscal 2004 due to the strength of our Creative Solutions, Knowledge Worker Solutions and Enterprise Solutions segments.Additionally,2007 primarily due to the strength of the euro andEuro against the yen, revenuesU.S. dollar. Additionally, during fiscal 2008 we had a hedging gain of $13.2 million. Revenue in EMEA and Asia measured in U.S. dollars were higherwas favorably impacted by approximately $15.0$39.6 million and $3.0 million, respectively, induring fiscal 20052008 as compared to fiscal 2004.Inventory InformationAt2007 primarily due to the endstrength of fiscal 2006 our overall channel inventory position was within our global inventory policy which allows up to an estimated 4.5 weeks of anticipated total product supply at our distributors. our experience is that the actual amount of backlog at any particular time may not be a meaningful indicator of future business prospects. For example, prior to the finalization and release of new products, we may have significant levels of orders for new product releases. Our backlogBacklog is comprised of unfulfilled orders, at the end of fiscal 2006, other thanexcluding those associated with new product releases, those pending credit review and those not shipped due to the application of our global distributor inventory policy,policy. Our backlog for the fourth quarter of fiscal 2009 was approximately 2%9% of fourth quarter fiscal 20062009 revenue compared with approximately 2% of third quarter fiscal 2009 revenue. The comparableWe had minimal backlog at the end of thirdthe fourth quarter of fiscal 2006 was an insignificant percentage of third quarter fiscal 2006 revenue.
2006
2006 to 2005
2005
2005 to 2004
2004 Product $ 228.9 (14 )% $ 266.4 (2 )% $ 270.8 Percentage of total revenue 8 % 7 % 9 % Services and support 67.8 (30 )% 96.2 15 % 83.9 2 % 3 % 3 % Total cost of revenue $ 296.7 (18 )% $ 362.6 2 % $ 354.7 technologiesrights to use technology and the costs associated with the manufacturing of our products.fluctuateddecreased due to the following: Amortization of acquired rights to use technology (8 )% 6 % Amortization of purchased intangibles (10 ) (10 ) Royalty cost (1 ) 3 Hosted services 9 3 Various individually insignificant items (4 ) (4 ) Total change (14 )% (2 )% acquisitionfact that we entered into certain technology licensing arrangements totaling $100.4 million and $60.0 million during fiscal 2008 and fiscal 2007, respectively. Of this cost, an estimated $56.4 million and $44.8 million during fiscal 2008 and fiscal 2007, respectively, was related to future licensing rights and has been capitalized and will be amortized on a straight-line basis over the estimated useful lives up to fifteen years. Of the remaining costs, we estimated that approximately $27.2 million and $15.2 million was related to historical use of Macromedialicensing rights which was expensed as cost of sales and the residual of $16.8 million for fiscal 2008 was expensed as general and administrative costs. In connection with these licensing arrangements, we have the ability to acquire additional rights to use technology in the following areas:future.
2006 to 2005
2005 to 2004composed primarily comprised of employee-related costs and relatedassociated costs incurred to provide consulting services, training and product support.20062008 as compared to fiscal 2005, due to compensation and related benefits and travel expenses as a result of higher headcount related to increases in services and support activities. Included in compensation costs for fiscal 2006 are compensation and related benefits, including amortization of deferred compensation, for former Macromedia employees and stock-based compensation costs as a result of adopting SFAS 123R at the beginning of fiscal 2006. See Note 11 of our Consolidated Financial Statements for further information regarding the impact of SFAS 123R. Cost of services and support revenue also increased due to costs associated with our Expert Support program.Cost of services and support revenue increased during fiscal 2005 as compared to fiscal 2004 2007, primarily due to increases in headcount related expenses, including higher compensation and related benefits as well as outsourceddriven by increases in headcount related to product support and utilization by customers of our consulting fees.
2006
2006 to 2005
2005
2005 to 2004
2004 $ 565.1 (15 )% $ 662.1 8 % $ 613.2 19 % 18 % 19 % 55fluctuateddecreased due to the following:
2006 to 2005
2005 to 2004 Compensation and related benefits associated with headcount growth 1 % 7 % Compensation associated with incentive compensation and stock-based compensation (13 ) — Various individually insignificant items (3 ) 1 Total change (15 )% 8 % remainremaining competitive in the marketplace and are directly related to continued timely development of new and enhanced products. We will continue to focus on long-term opportunities available in our end markets and make significant investments in the development of our desktop application and server-based software products.
2006
2006 to 2005
2005
2005 to 2004
2004 Expenses $ 981.9 (10 )% $ 1,089.3 11 % $ 984.4 Percentage of total revenue 33 % 30 % 31 % includeof salary and benefit expenses, sales commissions, travel expenses and related facilities costs for our sales, marketing, order management and global supply chain management personnel. Sales and marketing expenses also include the costs of programs aimed at increasing revenue, such as advertising, trade shows, public relations and other market development programs.fluctuateddecreased due to the following:
2006 to 2005
2005 to 2004 Compensation and related benefits associated with headcount growth 2 % 5 % Compensation associated with incentive compensation and stock-based compensation (8 ) 1 Marketing spending related to product launches and overall marketing efforts to further increase revenue (1 ) 4 (3 ) 1 (10 )% 11 %
2006
2006 to 2005
2005
2005 to 2004
2004 Expenses $ 298.7 (11 )% $ 337.3 23 % $ 275.0 Percentage of total revenue 10 % 9 % 9 % General and administrative expenses decreased due to the following: Allocation of costs associated with acquired rights to use technology (5 )% 6 % Compensation and related benefits associated with headcount growth 2 4 Compensation associated with incentive compensation and stock-based compensation (8 ) 2 Charitable contributions (3 ) 4 Professional and consulting fees 1 2 — 2 Depreciation and amortization 1 1 Various individually insignificant items 1 2 Total change (11 )% 23 % General and administrative expenses fluctuatedfollowing:fact that we entered into certain technology licensing arrangements totaling $100.4 million and $60.0 million during fiscal 2008 and fiscal 2007, respectively. Of this cost, an estimated $56.4 million and $44.8 million during fiscal 2008 and fiscal 2007, respectively, was related to future licensing rights and has been capitalized and will be amortized on a straight-line basis over the estimated useful lives up to fifteen years. Of the remaining costs, we estimated that approximately $27.2 million and $15.2 million during fiscal 2008 and fiscal 2007, respectively, was related to historical use of licensing rights which was expensed as cost of sales and the residual of $16.8 million for fiscal 2008 was expensed as general and administrative costs. In connection with these licensing arrangements, we have the ability to acquire additional rights to use technology in the future. Expenses $ 41.3 29 % $ 32.1 * % $ 0.6 Percentage of total revenue 1 % 1 % * %
2006 to 2005
2005 to 2004* Percentage is not meaningful. and Other Charges
2006
2006 to 2005
2005
2005 to 2004
2004not meaningful.Inexpected to be paid during fiscal 2010. The restructuring activities related to this program affect only those employees and facilities that were associated with Adobe prior to the acquisition of Omniture on October 23, 2009.2006, pursuant2010, we expect to Boardrecord additional restructuring charges of Directors’ approval,approximately $15 million to $18 million primarily related to the consolidation of leased facilities and up to approximately $26 million related to employee severance arrangements for the elimination of the remaining full-time positions worldwide. We expect to accrue the facility related liabilities beginning in the first quarter of fiscal 2010 and pay these liabilities through fiscal 2021 based on current lease terms. Substantially all of these charges will result in cash expenditures.implementedinitiated a plan to restructure the pre-merger operations of Omniture to eliminate certain duplicative activities, focus our resources on future growth opportunities and reduce our cost structure. In connection with this restructuring plan, to eliminate 313 positions, held by Adobe employees worldwide and which impacted all functional areas. The reductionwe accrued a total of approximately $10.6 million in force was completed in fiscal 2006. The restructuring plan, which is estimated to be completed in fiscal 2007, also includes costs related to termination benefits for the world-wide consolidationelimination of facilities,approximately 100 regular positions and for the closure of duplicative facilities. We also accrued approximately $0.2 million in costs related to the cancellation of certain contracts and the write-off of fixed assets located at facilities that will be vacated. During fiscal 2006, the total restructuring charges of $19.7 million included severance and related charges associated with the reductionwind-down of subsidiaries and other service contracts held by Omniture. These costs were recorded as a part of the purchase price allocation, as discussed in forceNote 2 of our Notes to Consolidated Financial Statements, and have been accrued for as of November 27, 2009. We expect to pay the termination benefits and facility related liabilities through fiscal 2010 and fiscal 2013, respectively.closure of duplicative facilities and the cancellation of certain contracts.We did not incur any restructuringcontracts associated with the wind-down of subsidiaries and other service contracts held by Macromedia. Costs for termination benefits and contract cancellations were completed during fiscal 2007. Total costs incurred were $27.0 million and $3.2 million, respectively.inrelated to the 2009 restructuring program, 2008 restructuring program, Omniture acquisition, and Macromedia acquisition totaled approximately $23.0 million, $4.4 million, $12.3 million, and $5.0 million respectively. We expect to pay the liabilities associated with the 2009 and 2008 restructuring programs through fiscal 20052021 and 2004.
2006
2006 to 2005
2005
2005 to 2004
2004 Expenses $ 71.6 5 % $ 68.2 (6 )% $ 72.4 Percentage of total revenue 2 % 2 % 2 % acquiring Macromedia,our acquisition of Omniture in fiscal 2009, we acquired purchased intangibles which will beare amortized over their estimated useful lives of one to twelve years. In addition, as a result of our acquisition of Macromedia in fiscal 2006, we acquired purchased intangibles which are amortized over their estimated useful lives of two to four years. See Note 2During fiscal 2009, we completed one business combination, in addition to Omniture. During fiscal 2008 we completed one business combination and during fiscal 2007, we completed two business combinations and one asset acquisition. We acquired purchased intangibles through these acquisitions which are amortized over their estimated useful lives.NotesOmniture.Consolidated Financial Statementsfiscal 2007, due to a decrease in amortization expense associated with intangible assets purchased through the Macromedia acquisition. Interest and other income, net $ 31.4 (28 )% $ 43.8 (47 )% $ 82.7 Percentage of total revenue 1 % 1 % 3 % Interest expense (3.4 ) 66 % (10.0 ) * (0.2 ) Percentage of total revenue * * * Investment gains (losses), net (17.0 ) (204 )% 16.4 131 % 7.1 Percentage of total revenue (1 )% * % * Total non-operating income (expense), net $ 11.0 (78 )% $ 50.2 (44 )% $ 89.6 * Percentage is not meaningful. further information regarding these purchased intangibles.our share repurchase programs, lower interest rates and increased hedging costs. Additionally, during fiscal 2008, interest and other income, net included losses on fixed income investments associated with a write-down for an other-than-temporary impairment totaling approximately $1.3 million during the second quarter of fiscal 2008.
2006
2006 to 2005
2005
2005 to 2004
2004*Percentagenot meaningful.Gain (Loss)gain (loss)gains (losses), net, consists principally of realized gains or losses from the sale of marketable equity investments, other-than-temporary declines in the value of marketable and non-marketable equity securities, unrealized holding gains and losses associated with our deferred compensation plan assets (classified as trading securities), and gains and losses of Adobe Ventures. 2009 2008 2007 Net gains (losses) related to our investments in Adobe Ventures and cost method investments $ (16.7 ) $ 15.9 $ 6.9 Gains from sale of equity investments — 5.4 0.2 Write-downs due to other-than-temporary declines in value of our marketable equity securities (0.3 ) (4.9 ) — Total investment gains (losses), net $ (17.0 ) $ 16.4 $ 7.1 other direct investments.The increase in ourgain from fiscal 2005gains (losses), net increased as compared to fiscal 2006 is2007 due primarily dueto investment gains from our direct and Adobe Ventures investments. Additionally, during fiscal 2008, we received cash and recognized a gain resulting from the expiration of the escrow period related to the sale of our investment in Atom Entertainment, Inc. that occurred during the fourth quarter of fiscal 2006. We are uncertain of future investment gains or losses as they are primarily dependent upon market conditions and the operations of the underlying investee companies.Interest and Other IncomeThe largest component of interest and other income is interest earned on cash, cash equivalents and short-term fixed income investments, but also includes gains and losses on the sale of fixed income investments, foreign exchange transactions including hedging gains and losses, and interest expense.Interest and other income increased during fiscal 2006 compared to fiscal 2005 due to higher levels of cash and short term investments and higher rates of return during fiscal 2006. These gains were partially offset by increased costs of our foreign currency hedging program.Interest and other income increased in fiscal 2005 compared to fiscal 2004 primarily due to higher interest income as a result of higher levels of cash and higher interest rates during fiscal 2005, as well as higher gains on our foreign currency hedging program.
2006
2006 to 2005
2005
2005 to 2004
2004 Provision $ 315.0 52 % $ 206.7 (7 )% $ 223.4 Percentage of total revenue 11 % 6 % 7 % Effective tax rate 45 % 19 % 24 % 20062008 as compared to fiscal 2005.2007. The netdecrease was primarily related to the completion in the third quarter of fiscal 2008 of a U.S. income tax examination covering our fiscal years 2001 through 2004, a refund of foreign taxes from our fiscal years 2000 through 2002 following a foreign tax court judgment and stronger international profits for fiscal 2008 offset in part by an increase is primarily due to the expirationtax benefit for the reinstatement of the federal research and development tax credit on December 31, 2005 and because the 2005 effective tax rate included a tax benefit recognized in connection with the repatriation of certain foreign earnings. In December 2006, after the end of Adobe’s fiscal year, the federal research and development tax credit was retroactively extended from January 1, 2006 until December 31, 2007 which includes an 11 month period in Adobe’s 2006 fiscal year. The impact of this new tax law will be reflected in our fiscal 2007 results including an approximately $12 million discrete item in our first quarter fiscal 2007 results for the credit relating to fiscal 2006.Our effective tax rate decreased four percentage points during2006 in the first quarter of fiscal 2005 as compared to fiscal 2004 primarily due to a tax benefit recognized as a result of the release of certain deferred tax liabilities in connection with the repatriation of certain foreign earnings. In addition, our effective tax rate decreased one percentage point due to a variety of factors, including higher profits earned by our international trading company which are taxed at a lower statutory rate and a reduction of a valuation allowance against certain deferred tax assets.(in millions) $ 1,904.5 $ 2,019.2 $ 1,629.1 $ 1,972.5 $ 4,890.6 $ 4,410.4
2006
2006 to 2005
2005
2005 to 2004
2004 $ 1,117.7 $ 1,280.7 $ 1,441.1 (1,497.1 ) (304.7 ) 81.5 477.7 (1,021.6 ) (1,350.4 ) Effect of foreign currency exchange rates on cash and cash equivalents 14.7 (14.4 ) 1.7 $ 113.0 $ (60.0 ) $ 173.9 (salaries, bonuses, and benefits),related expenses; general operating expenses (marketing,including marketing, travel and office rent)rent; and cost of product revenue. Another source of cash is proceeds from the exercise of employee options and anotherparticipation in the employee stock purchase plan (“ESPP”). Another use of cash is our stock repurchase program, which is detaileddescribed below.2006, of $927.2 million,2009, was primarily comprised of net income plus the net effect of non-cash related expenses. The primary working capital sourcesources of cash was a decreasewere net income coupled with decreases in trade receivables, prepaid expenses and other current assets and increases in income taxes payablepayable. Trade receivables decreased primarily from CS4 revenue that was shipped in the latter half of the fourth quarter of fiscal 2008 and deferred revenue. Income taxes payable increased primarily duecollected during the first quarter of fiscal 2009, in addition to higher current tax liabilities related tolower overall increased taxable income. Deferredgross revenue increased primarily due to increased maintenance and support obligations. Workingimproved collections.included an increase in trade receivables andwere decreases in accrued expenses, deferred revenue, trade payables and accrued restructuring. Our trade receivables increased due to an increase in revenue. As compared to the same period last year, our days sales outstanding in trade receivables (“DSO”) increased from 31 days to 48 days. The increase in DSO was due to an increase in revenue in the latter part of the year due to timing of product shipments and an increase in certain receivables from the Macromedia acquisition which have longer payment terms. Accrued expenses decreased becauseprimarily due to payments for employee bonuses and commissions related to fiscal 2008. Decreases in deferred revenue related primarily to deferred revenue that was recognized in the first quarter of compensation related costsfiscal 2009 associated with our free of charge upgrades for CS4 and other expenses.Adobe Photoshop Lightroom products, as well as declines in maintenance and support orders. Accrued restructuring decreased becauseprimarily due to payments related to the 2008 restructuring program that was initiated in the fourth quarter of payments made during fiscal 2006; please refer2008, offset in part by new charges related to Note 9our 2009 restructuring program and acquisition of the Notes to Consolidated Financial Statements for more information.Omniture.Cash2005, of $758.4 million,2008, was primarily comprised of net income plus the net effect of non-cash related expenses. WorkingThe primary working capital sources of cash were increases in net income, deferred revenue, accrued expenses, income taxes payablerestructuring and trade payables. Increases in deferred revenue. Accrued expenses increased primarily due to compensation related costs and marketing expenses. Income taxes payable increased as a result of higher current tax liabilitiesrevenue related to repatriation of certain foreign earnings and overall increased taxable income. Deferred revenue increased primarily due to increased maintenance and support obligations. Workingand free of charge upgrade plan purchases which offset in part, decreases in deferred revenue related to royalties. Accrued restructuring costs increased due to the restructuring program initiated in the fourth quarter of fiscal 2008 offset in part by payments of facility costs during fiscal 2008 associated with the Macromedia acquisition. See Note 11 of our Notes to Consolidated Financial Statements for information regarding our restructuring charges.includedwere increases in trade receivables and prepaid expenses and other current assets. Our accounts receivableassets coupled with decreases in income taxes payable and accrued expenses. Trade receivables increased primarily as a result of high sales of our CS4 family of products at the end of fiscal 2008. Income taxes payable decreased primarily due to higher revenue duringpayments made as the period. As comparedresult of the completion of a U.S. income tax examination covering our fiscal years 2001 through 2004. Accrued expenses decreased primarily due to fiscal 2004, our DSO was 31 days, one day higher than fiscal 2004.Cashpayments for employee bonuses and profit sharing offset in part by increases in royalty accruals and charitable contributions.2004, of $704.8, million2007, was primarily comprised of net income, net of non-cash related expenses. Workingaccounts receivable. Accrued expenses increasedaccrued restructuring costs which was primarily due to compensation related costs. Deferred revenue increased primarily due to increased maintenancepayments for facility and support obligations. Our accounts receivable decreased due to increased levels of cash collections. Working capital uses of cash included a decrease in income taxes payable due to tax payments madeseverance costs for both agreed and disputed tax assessments.Net cash provided byfiscal 2007. in fiscal 2006 of $195.2 million increased from net cash used in fiscal 2005 of $348.4 million due to the net cash acquired with Macromedia and due to the sale of our minority equity investment in Atom Entertainment, Inc. These proceeds were partially offset by purchases of long term investments and acquisitions of property, plant, and equipment as well as net purchases of short-term investments in fiscal 2006.inof $1.5 billion for fiscal 20052009, was primarily due to the acquisition of $348.4 million decreased from net cash used in fiscal 2004 of $351.3 million because there was not an investment in a lease receivable (related to our corporate headquarter office buildings) as there was in 2004. This was partially offset by higher netOmniture, purchases of short-term investments and paymentsproperty and equipment, offset in part by maturities and sales of short-term investments. Purchases of long-term investments and other assets during fiscal 2009 were less than fiscal 2008 primarily due to $56.0 million paid in the third quarter of fiscal 2008 for acquisition costsfuture licensing rights acquired through certain technology licensing arrangements which did not recur in fiscal 2005.2006 of $774.7 million increased from net cash used in2008 as compared to fiscal 2005 of $246.6 million2007, primarily due to thenet borrowings under our credit agreement of $350.0 million. Additionally, we had lower purchases of treasury stock. Cash used during fiscal 2006 was partially stock when compared to the prior year (See sections entitled “Stock Repurchase Program I” and “Stock Repurchase Program II” discussed below), offset in part by thelower proceeds related to the issuance of the treasury stock from exercises of employee stock options. Cash used for stock repurchases during fiscal 2006 increased from the prior year due to a higher average cost per share, a higher number of shares being repurchased, and remaining prepayments related to stock repurchase agreements (see section titled “Stock Repurchase Program—On-Going Dilution).Net cash used for financing activities in fiscal 2005 of $246.6 million increased from cash used in fiscal 2004 of $224.5 million primarily due to a decrease in proceeds received from the re-issuance of treasury stock as a result of a lower number of options being exercised.We discontinued our quarterly cash dividend after the payment of the dividend for the first quarter of fiscal 2005. We intend to use the cash previously used to pay the quarterly dividend for our ongoing stock repurchase programs. Under the terms of our lease agreements for our San Jose headquarters, we are not prohibited from paying cash dividends unless an event of default occurs.In fiscal 2006, we entered into various agreements with San Jose Water Corporation and certain of its affiliates to acquire land and a building in downtown San Jose for $36.5 million. The building and certain parking areas were used by the San Jose Water Company and will be leased back to San Jose Water Corporation until mid 2008. Additionally, the Board of Directors has approved a facilities expansion plan for our operations in India, which may include the purchase of land and buildings. We are also in the process of extending our lease for the Almaden Tower for a five year term with an additional five years at our option. We have received Board approval to purchase a portion of the lease receivable of the lessor aswe have done with the East and West Towers. We expect a cash outlay of approximately $90 million when the transaction closes sometime during the first quarter of fiscal 2007. investments in short-term and long-term investments, venture capital, facilities expansion and purchases of computer systems for research and development, sales and marketing, product support and administrative staff. Furthermore, cash reserves may be used to repurchase stock under our stock repurchase programs and strategically acquire software companies, products or technologies that are complementary to our business. In addition,The Board of Directors has approved a facilities expansion for our operations in India, which may include the purchase of land and buildings.investappropriately align our costs in connection with our fiscal 2010 operating plan impacting up to approximately $100630 full-time positions worldwide. In connection with this restructuring plan, in the fourth quarter of fiscal 2009, we recorded restructuring charges of approximately $25.5 million related to ongoing termination benefits for the elimination of approximately 340 of these full-time positions worldwide. As of November 27, 2009, approximately $2.5 million was paid. The remaining accrual associated with these ongoing termination benefits is expected to be paid during fiscal 2010. The restructuring activities related to this program are only to those employees and facilities that were associated with Adobe prior to the acquisition of Omniture on October 23, 2009.venture capital overcosts related to termination benefits for the next threeelimination of approximately 100 regular positions and for the closure of duplicative facilities. We also accrued approximately $0.2 million in costs related to five yearsthe cancellation of certain contracts associated with the wind-down of subsidiaries and other service contracts held by Omniture. These costs were recorded as a part of the purchase price allocation, as discussed in Companies leveraging our platform technologies.Adobe uses professional investment management firms to manage mostNote 2 of our invested cash. External investment firms managed,Notes to Consolidated Financial Statements, and have been accrued for as of November 27, 2009. We expect to pay the termination benefits and facility related liabilities through fiscal 2010 and fiscal 2013, respectively.average, 77%October 23, 2009.Adobe’s invested balances during fiscal 2006. Within2008, we initiated a restructuring program, consisting of reductions in workforce of approximately 560 full-time positions globally and the consolidation of facilities, in order to reduce our operating costs and focus our resources on key strategic priorities. In connection with this restructuring program, we recorded restructuring charges in the fourth quarter of fiscal 2008 totaling $29.2 million related to termination benefits for the elimination of approximately 460 of the 560 full-time positions globally.fixed income portfolio is primarily invested in municipal bonds. OutsideUnited Kingdom and Canada. We accrued $8.5 million for the fair value of our future contractual obligations under these operating leases using our credit-adjusted risk-free interest rate, estimated at approximately 6% as of the U.S., our fixed income portfoliodate we ceased to use the leased properties. This amount is primarily invested in U.S. Treasury notes and highly rated corporate notes. The balancenet of the fixedfair value of future estimated sublease income portfolio is managed internally and invested primarily in money market and enhanced money market fundsof approximately $4.4 million. We also recorded charges of $6.7 million for working capital purposes. Asongoing termination benefits for the elimination of December 1, 2006, $182.3 millionsubstantially all of the securities now classified asremaining 100 full-time positions expected to be terminated. We have paid substantially all of the accrued termination benefits during fiscal 2009 with and expect to pay the remaining amounts in fiscal 2010. We expect to pay facilities-related liabilities through fiscal 2013.have structural features that allow usand cash generated from operations will be sufficient to sellmeet the securities at par within 90 dayscash outlays for the restructuring changes described above.thus retain similar liquidity characteristics as cash equivalents. All investments are made according to policies approved by the Board of Directors.20072010 in the event of a further weakening of the economy or changes in our planned cash outlay.outlay, including changes in incremental costs such as direct and integration costs related to the acquisition. Cash from operations could also be affected by various risks and uncertainties, including, but not limited to the risks detailed in Part I, Item 1A titled “Risk Factors.” However, based on our current business plan and revenue prospects, we believe that our existing balances together withand our anticipated cash flows from operations will be sufficient to meet our working capital and operating resource expenditure requirements for the next twelve months. In addition,At November 27, 2009, our existing credit facility is $1.0 billion and we have received Board approvalborrowed against the entire amount. See Note 18 of our Notes to executeConsolidated Financial Statements for further information regarding our credit agreement.$500 million credit facility which is expected to be finalized inlarge portion of our invested cash. External investment firms managed, on average, 50% of our consolidated invested balances during the firstfourth quarter of fiscal 2007. This credit facility will provide backup liquidity2009. Within the U.S., the portfolio is invested primarily in money market funds for general corporate purposes for a periodworking capital purposes. Outside of up to 5 years. Cash from operations could be affected by various risks and uncertainties, including, but not limited to the risks detailedU.S., our fixed income portfolio is primarily invested in Item 1A, “Risk Factors.”from time to timealso enter into structured stock repurchase agreementsrepurchases with third parties. Refer to Part II, Item 5(c) in this Annual Report for share repurchases during the quarter ended December 1, 2006.As part of this program, on April 17, 2005, the Board of Directors approved the use of an additional $1.0 billion for stock repurchase commencing upon the close of the Macromedia acquisition. This additional $1.0 billion in stock repurchases was completed by the third quarter of fiscal 2006.20062009, 2008 and 2005,2007 we entered into several structured repurchase agreements with large financial institutions, whereupon we provided the financial institutions with prepayments of $1.3$350.0 million, $525.0 million and $1.1 billion, and $600 million, respectively. We entered into these agreements in order to take advantage of repurchasing shares at a guaranteed discount to the volume weighted average priceVolume Weighted Average Price (“VWAP”) of our common stock.stock over a specified period of time. We only enter into such transactions when the discount that we receive is higher than the foregone return on our cash prepayments to the financial institutions. There were no explicit commissions or fees on these structured repurchases. Under the terms of the agreements, there is no requirement for the financial institutions to return any portion of the prepayment to us.622006,2009, 2008 and 2007, the $1.3 billion prepayment wasprepayments were classified as treasury stock on our balance sheetConsolidated Balance Sheets at the payment date, though only shares physically delivered to us by December 1, 2006 areNovember 27, 2009, November 28, 2008 and November 30, 2007 were excluded from the denominator in the computation of earnings per share. All outstandingAs of November 27, 2009 and November 28, 2008, approximately $59.9 million and $134.7 million, respectively, of up-front payments remained under the agreements.asto large financial institutions. During the third quarter of December 1, 2006 will expire on or before July 19, 2007. Asfiscal 2008, the remaining authorized number of December 1, 2006shares were repurchased.$204.0$133.7 million of up-front payments remained under the agreements.At the beginningthese agreements as of November 30, 2007.2007,2008, we entered intoalso repurchased 0.5 million shares at an additional structured repurchase agreement with a large financial institution, whereupon we provided the financial institution with a prepaymentaverage price of $300.0 million which will be classified as treasury stock on our balance sheet.Board Approval Repurchases 2009 2008 2007 Date Under the Plan Shares Average Shares Average Shares Average December 1997 1 $ 24.00 5 $ 34.89 39 $ 39.24 Open market — $ — 3,554 $ 36.41 — $ — 15,231 $ 27.89 22,418 $ 36.26 22,012 $ 40.04 April 2007 — $ — 31,859 $ 37.15 17,684 $ 40.50 Open market — $ — 456 $ 39.79 — $ — Total shares 15,232 $ 27.89 58,292 $ 36.79 39,735 $ 40.25 Total cost $ 424,851 $ 2,144,400 $ 1,599,214 (1) The repurchases from employees represent shares canceled when surrendered in lieu of cash payments for the option exercise price or withholding taxes due.(2) Stock repurchase agreements executed with large financial institutions. See “Stock Repurchase Program I—On-going Dilution Coverage” above.(1) The repurchases from employees represent shares cancelled when surrendered in lieu of cash payments for the option exercise price or withholding taxes due. (2) Stock repurchase agreements executed with large financial institutions. See “Stock Repurchase Program I” and “Stock Repurchase Program II” above. December 1, 2006,November 27, 2009, consist of obligations under operating leases, royalty agreements and various service agreements. We expect to fulfill all of the following commitments from our working capital.Lease CommitmentsThe two lease agreements discussed inSee Note 1517 of our Notes to Consolidated Financial Statements for additional information regarding our contractual commitments Payment Due by Period Total 1-3 years 3-5 years Operating leases $ 249.3 $ 53.2 $ 74.7 $ 44.8 $ 76.6 Purchase obligations 210.5 165.5 26.0 6.0 13.0 Debt 1,000.0 — — 1,000.0 — Total $ 1,459.8 $ 218.7 $ 100.7 $ 1,050.8 $ 89.6 covenants.ratios as defined in the lease agreements that are reported to the lessors quarterly. As of December 1, 2006November 27, 2009, we were in compliance with all of our financial covenants. We expect to remain within compliance in the next 12 months. We are comfortable withbelieve these limitations and believe theycovenants will not impact our credit or cash in the coming fiscal year or restrict our ability to execute our business plan.151 of our Notes to Consolidated Financial StatementsStatements. Under the revised accounting guidance for further information regarding our lease commitments.The following table summarizes our contractual commitments as of December 1, 2006:
1 year
5 years* These amounts are net of sublease income. See Note 15 of Notes to Consolidated Statements for further detail regarding our future commitments under these non-cancelable operating leases.
RoyaltiesUnder FIN 45, theThe fair value of a residual value guarantee in lease agreements entered into after December 31, 2002, must be recognized as a liability on our consolidated balance sheet.Consolidated Balance Sheets. As such, we recognized a $5.2 million liabilityand $3.0 million in liabilities, related to the extended East and West towers lease that was extended in August 2004. This liability isTowers and Almaden Tower leases, respectively. These liabilities are recorded in other long-term liabilities with the offsetting entry recorded as prepaid rent in other assets. The balance will be amortized to the income statementour Consolidated Statements of Income over the life of the lease.leases. As of December 1, 2006,November 27, 2009, the unamortized portion of the fair value of the residual value guaranteeguarantees remaining in other long-term liabilities and prepaid rent was $2.8$1.3 million.third partiesthird-parties arising from the use of our products. Historically, costs related to these indemnification provisions have not been significant and we are unable to estimate the maximum potential impact of these indemnification provisions on our future results of operations.officersdirectors and directorsofficers for certain events or occurrences while the officerdirector or directorofficer is, or was serving, at our request in such capacity. The indemnification period covers all pertinent events and occurrences during the officer’sdirector’s or director’sofficer’s lifetime. The maximum potential amount of future payments we could be required to make under these indemnification agreements is unlimited; however, we have director and officer insurance coverage that reduceslimits our exposure and enables us to recover a portion of any future amounts paid. We believe the estimated fair value of these indemnification agreements in excess of applicable insurance coverage is minimal.partnerships.partnership. We are unable to develop an estimate of the maximum potential amount of future payments that could potentially result from any hypothetical future claim, but believe the risk of having to make any payments under this general indemnification to be remote.We in foreign countries, in U.S. dollars and in various foreignother currencies. In Europe and Japan, transactions that are denominated in euro or yenEuro and Yen, respectively, are subject us to exposure from movements in exchange rates. We hedge our net recognized foreign currency assets and liabilities with foreign exchange forward contracts to reduce the risk that our earnings and cash flows will be adversely affected by changes in exchange rates. This exposure is primarily related to yen-denominated product and support revenue in Japan and euro-denominated product and support revenue in certain European countries.We may use foreign exchange option or forward contracts for Euro- or Yen-denominated revenue.2006, 20052009, 2008 and 2004,2007, our revenue exposures were 32.8 billion yen, 26.4 billion yen,504.3 million Euros, 628.2 million Euros and 24.1 billion yen,595.5 million Euros, respectively. In fiscal 2006, 20052009, 2008 and 2004,2007, our revenue exposures were 504.7 million euros, 411.4 million euros,30.3 billion Yen, 36.8 billion Yen and 375.4 million euros,35.5 billion Yen, respectively. Japanese operating expenses are in yen and our European operating expenses are primarily in euro,Euro and our Japanese operating expenses are in Yen, which mitigates a portion of the exposure related to yenEuro and euroYen denominated product revenue. In addition, we hedge firmly committed transactions using forward contracts. These contracts do subject us to risk of accounting gains and losses; however, the gains and losses on these contracts largely offset gains and losses on the assets, liabilities and transactions being hedged. We also hedge a percentage of forecasted international revenue with forwardpurchased option contracts and purchased optionforward contracts. Our revenue hedging policy is intended to neutralizehelp mitigate the impact on our forecasted revenue due to foreign currency exchange rate movements. At December 1, 2006,As of November 27, 2009, total outstanding contracts were $646.8$510.4 million which included the notional equivalent of $434.7$283.9 million in euro, $176.1Euro, 182.1 million in yen,Yen and $36.0$44.4 million in other foreign currencies. These hedges are foreign currency forward exchange contracts which hedged our balance sheet exposures. In addition, we had the notional equivalent of $419.0 million inexposures and purchased put option contracts which hedged our forecasted revenue. As of December 1, 2006,November 27, 2009, all contracts were set to expire at various times through July 2007.2010. The bank counterparties in these contracts expose us to credit-related losses in the event of their nonperformance. However, to mitigate that risk, we only contract with counterparties with specificwho meet our minimum rating requirements.requirements under our counterparty risk assessment process. In addition, our hedging policy establishes maximum limits for each counterparty.long termlong-term investment exposures consisting of the capitalization and retained earnings in our non-USD functional currency foreign subsidiaries. For the fiscal years ending December 1, 2006As of November 27, 2009 and December 2, 2005November 28, 2008, this long termlong-term investment exposure totaled a notional equivalent of $85.9$228.8 million and $56.7$149.1 million, respectively. At this time, we do not hedge these long termlong-term investment exposures. option contracts, carried at fair value, may have maturities between one and twelve months. Such cash flow exposures result from portions of our forecasted revenuesrevenue denominated in currencies other than the U.S. dollar, primarily the Japanese yenEuro and the euro.Japanese Yen. We enter into these foreign exchange option contracts to hedge forecasted product licensing revenue in the normal course of business and accordingly, they are not speculative in nature. (loss), until the forecasted transaction occurs. When the forecasted transaction occurs, we reclassify the related gain or loss on the cash flow hedge to revenue. In the event the underlying forecasted transaction does not occur, or it becomes probable that it will not occur, we reclassify the gain or loss on the related cash flow hedge from accumulated other comprehensive income (loss) to interest and other income, (loss)net on the consolidated statementour Consolidated Statements of incomeIncome at that time. For the fiscal year ended December 1, 2006,November 27, 2009, there were no such net gains or losses recognized in other income relating to hedges of forecasted transactions that did not occur.also Note 16 in5 of our Notes to Consolidated Financial Statements.(loss).net. These derivative instruments do not subject us to material balance sheet risk due to exchange rate movements because gains and losses on these derivatives are intended to offset gains and losses on the assets and liabilities being hedged. At December 1, 2006,November 27, 2009, the outstanding balance sheet hedging derivatives had maturities of 15090 days or less.December 1, 2006.November 27, 2009. This sensitivity analysis was based on a modeling technique that measures the hypothetical market value resulting from a 10% and 15% shift in the value of exchange rates relative to the U.S. dollar. For option contracts, the Black-Scholes equation model was used. For forward contracts, duration modeling was used where hypothetical changes are made to the spot rates of the currency. A 10% and 15% increase in the value of the U.S. dollar (and a corresponding decrease in the value of the hedged foreign currency asset) would lead to an increase in the fair value of our financial hedging instruments by $39.9 million and $66.6 million, respectively.$22.2 million. Conversely, a 10% and 15% decrease in the value of the U.S. dollar would result in a decrease in the fair value of these financial instruments by $18.8 million and $27.4 million, respectively.at any time to change our hedging program.also Note 16 in5 of our Notes to Consolidated Financial Statements.Due within one year $ 387.6 Due within two years 249.9 Due within three years 218.6 Due after three years 43.9 Total $ 900.0 -150 BPS -100 BPS -50 BPS Fair Value 11/27/2009 +50 BPS +100 BPS +150 BPS 910.8 909.2 905.4 900.0 893.9 888.0 882.2 -150 BPS -100 BPS -50 BPS Fair Value 11/28/2008 +50 BPS +100 BPS +150 BPS 1,145.8 1,142.3 1,136.4 1,129.7 1,123.0 1,116.4 1,109.9 InvestmentsDecember 1, 2006,November 27, 2009, our total equity holdings in publicly traded companies were valued at $11.9$5.0 million compared to $1.8$3.0 million at December 2, 2005.November 28, 2008. The increase was primarily due to distributions from Adobe Ventures ofthe change in the fair value of two previously private companies that went public during fiscal 2006. The investments were reclassified from long-term to short-term. We believe that it is reasonably possible that the fair values of these securities could adversely change in the near term. We have a policy in place to review our equity holdings on a regular basis to evaluate whether or not each security has experienced an other-than-temporary decline in fair value. Our policy includes, but is not limited to, reviewing each company’s cash position, earnings/revenue outlook, stock price performance over the past six months, liquidity and management/ownership. If we believe that an other-than-temporary decline in value exists in one of our marketable equity securities, it is our policy to write down these equity investments to the market value and record the related write-down in our consolidated statements of income.Fixed Income InvestmentsAt December 1, 2006, we had an investment portfolio of fixed income securities, including those classified as cash equivalents, of $2,220.0 million compared to $1,657.3 million at December 2, 2005, an increase of 34%. Changes in interest rates could adversely affect the market value of our fixed income investments. The table below separates the remaining maturities of our fixed income securities into segments, based on stated maturities, to show the approximate exposure to interest rates. A significantproportion of securities classified as “due after three years,” based on the stated maturity, have structural features that allow us to sell the securities, at par, in less than three years.A sensitivity analysis was performed on our investment portfolio as of December 1, 2006. This sensitivity analysis was based on a modeling technique that measures the hypothetical market value changes that would result from a parallel shift in the yield curve of plus 50, 100, or 150 basis points over six-month and twelve-month time horizons. The following table represents the potential decrease to the value of our fixed income securities given a negative shift in the yield curve used in our sensitivity analysis.We limit our exposure to interest rate and credit risk by establishing and monitoring clear policies and guidelines for our fixed income portfolios. Our investment policy limits the maximum weighted average duration of all invested funds to 2.5 years. The guidelines also establish credit quality standards, limits on exposure to any one security issue, limits on exposure to any one issuer and limits on exposure to the type of instrument.Privately Held InvestmentsWe have direct investments, as well as indirect investments through Adobe Ventures, in several privately held companies, many of which can still be considered in the start-up or development stages. These investments are inherently risky, as the technologies or products these companies have under development are typically in the early stages and may never materialize, and we could lose a substantial part of our initial investment in these companies.It is our policy to review privately-held investments on a regular basis to evaluate the carrying amount and economic viability of these companies. This policy includes, but is not limited to, reviewing each of the companies’ cash position, financing needs, earnings/revenue outlook, operational performance, management/ownership changes and competition. The evaluation process is based on information that we request from these privately-held companies. This information is not subject to the same disclosure regulations as U.S. publicly traded companies, and as such, the basis for these evaluations is subject to the timing and the accuracy of the data received from these companies.See also Note 1 in our Notes to Consolidated Financial Statements.67(in millions) 50% 35% 15% $ (2.5 ) $ (1.7 ) $ (0.8 ) Page 76 77 78 79 80 122 statementsstatement schedules have been omitted, since the required by this item are submitted as a separate sectioninformation is not applicable or is not present in amounts sufficient to require submission of this Form 10-K/A. See Item 15 (a)(1) for a listing of financial statements providedthe schedule, or because the information required is included in the section titled “FinancialConsolidated Financial Statements and Notes thereto. November 27, November 28, 2009 2008 ASSETS Current assets: Cash and cash equivalents $ 999,487 $ 886,450 Short-term investments 904,986 1,132,752 Trade receivables, net of allowances for doubtful accounts of $15,225 and $4,128, respectively 410,879 467,234 Deferred income taxes 77,417 110,713 Prepaid expenses and other current assets 80,855 137,954 Total current assets 2,473,624 2,735,103 Property and equipment, net 388,132 313,037 Goodwill 3,494,589 2,134,730 Purchased and other intangibles, net 527,388 214,960 Investment in lease receivable 207,239 207,239 Other assets 191,265 216,529 Total assets $ 7,282,237 $ 5,821,598 LIABILITIES AND STOCKHOLDERS’ EQUITY Current liabilities: Trade payables $ 58,904 $ 55,840 Accrued expenses 419,646 399,969 Accrued restructuring 37,793 35,690 Income taxes payable 46,634 27,136 Deferred revenue 281,576 243,964 Total current liabilities 844,553 762,599 Long-term liabilities: Debt 1,000,000 350,000 Deferred revenue 36,717 31,356 Accrued restructuring 6,921 6,214 Income taxes payable 223,528 123,182 Deferred income taxes 252,486 117,328 Other liabilities 27,464 20,565 Total liabilities 2,391,669 1,411,244 Commitments and contingencies Stockholders’ equity: Preferred stock, $0.0001 par value; 2,000 shares authorized; none issued — — Common stock, $0.0001 par value; 900,000 shares authorized; 600,834 shares issued; 522,657 and 526,111shares outstanding, respectively 61 61 Additional paid-in-capital 2,390,061 2,396,819 Retained earnings 5,299,914 4,913,406 Accumulated other comprehensive income 24,446 57,222 Treasury stock, at cost (78,177 and 74,723 shares, respectively), net of re-issuances (2,823,914 ) (2,957,154 ) Total stockholders’ equity 4,890,568 4,410,354 Total liabilities and stockholders’ equity $ 7,282,237 $ 5,821,598 ”The following tables (presented inADOBE SYSTEMS INCORPORATEDamounts) set forth supplementary data for each of the quarters (unaudited) in the two-year period ended December 1, 2006. The share and per share data below have been adjusted to give effect to our stock split as of May 23, 2005.* In fiscal 2006, net income and net income per share includes the impact of SFAS 123R stock-based compensation charges as well as the integration of Macromedia into our operations, neither of which were present during fiscal 2005. Refer to Notes 2 and 11 of our Years Ended Revenue: $ 2,759,391 $ 3,396,542 $ 3,019,524 Services and support 186,462 183,347 138,357 2,945,853 3,579,889 3,157,881 Cost of revenue: 228,897 266,389 270,818 67,835 96,241 83,876 296,732 362,630 354,694 2,649,121 3,217,259 2,803,187 Operating expenses: 565,141 662,057 613,242 981,903 1,089,341 984,388 298,749 337,291 274,982 41,260 32,053 555 Amortization of purchased intangibles and incomplete technology 71,555 68,246 72,435 1,958,608 2,188,988 1,945,602 690,513 1,028,271 857,585 Non-operating income (expense): 31,380 43,847 82,724 (3,407 ) (10,019 ) (253 ) (16,966 ) 16,409 7,134 11,007 50,237 89,605 701,520 1,078,508 947,190 315,012 206,694 223,383 $ 386,508 $ 871,814 $ 723,807 Basic net income per share $ 0.74 $ 1.62 $ 1.24 524,470 539,373 584,203 $ 0.73 $ 1.59 $ 1.21 530,610 548,553 598,775 DISAGREEMENTS WITH ACCOUNTANTS ONCOMPREHENSIVE INCOME Common Stock Retained Treasury Stock Shares Amount Capital Earnings Income Shares Amount Total Balances at December 1, 2006 600,834 $ 61 $ 2,451,610 $ 3,317,785 $ 6,344 (13,608 ) $ (623,924 ) $ 5,151,876 Comprehensive income: — — — 723,807 — — — 723,807 — — — — 21,604 — — 21,604 — — — — — — — 745,411 Re-issuance of treasury stock under stock compensation plans — — (298,776 ) — — 23,918 814,863 516,087 Tax benefit from employee stock option plans — — 66,966 — — — — 66,966 Purchase of treasury stock — — — — — (39,735 ) (1,951,527 ) (1,951,527 ) Stock-based compensation — — 149,987 — — — — 149,987 Adjustment to the valuation of Macromedia assumed options — — (28,818 ) — — — — (28,818 ) Balances at November 30, 2007 600,834 $ 61 $ 2,340,969 $ 4,041,592 $ 27,948 (29,425 ) $ (1,760,588 ) $ 4,649,982 Comprehensive income: — — — 871,814 — — — 871,814 — — — — 29,274 — — 29,274 — — — — — — — 901,088 Re-issuance of treasury stock under stock compensation plans — — (206,984 ) — — 12,994 526,149 319,165 Tax benefit from employee stock option plans — — 90,360 — — — — 90,360 Purchase of treasury stock — — — — — (58,292 ) (1,722,715 ) (1,722,715 ) Stock-based compensation — — 172,474 — — — — 172,474 Balances at November 28, 2008 600,834 $ 61 $ 2,396,819 $ 4,913,406 $ 57,222 (74,723 ) $ (2,957,154 ) $ 4,410,354 Comprehensive income: — — — 386,508 — — — 386,508 — — — — (32,776) — — (32,776) Total comprehensive income, net of taxes — — — — — — — 353,732 Re-issuance of treasury stock under stock compensation plans — — (303,688 ) — — 11,777 483,254 179,566 Tax benefit from employee stock option plans — — 44,381 — — — — 44,381 Purchase of treasury stock — — — — — (15,231 ) (350,014 ) (350,014 ) Equity awards assumed for acquisition — — 84,968 — — — — 84,968 Stock-based compensation — — 167,581 — — — — 167,581 Balances at November 27, 2009 600,834 $ 61 $ 2,390,061 $ 5,299,914 $ 24,446 (78,177 ) $ (2,823,914 ) $ 4,890,568 Years Ended November 27, 2009 November 28, 2008 November 30, 2007 Cash flows from operating activities: Net income $ 386,508 $ 871,814 $ 723,807 Adjustments to reconcile net income to net cash provided by operating activities: Depreciation, amortization and accretion 282,423 270,269 315,464 Stock-based compensation 167,581 172,474 149,987 Deferred income taxes 49,590 46,584 58,385 Unrealized losses (gains) on investments 11,623 (17,377 ) (6,776 ) Tax benefit from employee stock option plans 44,381 90,360 55,074 Other non-cash items 4,434 4,784 (176 ) Excess tax benefits from stock-based compensation (11,980 ) (31,983 ) (85,050 ) Changes in operating assets and liabilities, net of acquired assets and assumed liabilities: Trade receivables, net 172,287 (153,386 ) 46,332 Prepaid expenses and other current assets 21,814 (5,584 ) 6,418 Trade payables (13,601 ) 14,078 3,518 Accrued expenses (53,320 ) (13,904 ) 83,281 Accrued restructuring (8,446 ) 24,330 (13,796 ) Income taxes payable 109,620 (57,656 ) 61,448 Deferred revenue (45,142 ) 65,879 43,137 Net cash provided by operating activities 1,117,772 1,280,682 1,441,053 Cash flows from investing activities: Purchases of short-term investments (1,307,366 ) (2,381,533 ) (2,503,147 ) Maturities of short-term investments 464,031 1,568,874 516,839 Proceeds from sales of short-term investments 1,057,176 717,076 2,457,347 Purchases of property and equipment (119,592 ) (111,792 ) (132,075 ) Acquisitions, net of cash acquired (1,582,669 ) (3,584 ) (75,528 ) Purchases of long-term investments and other assets (29,143 ) (124,469 ) (111,939 ) Investment in lease receivable — — (80,439 ) Issuance costs for credit facility — — (856 ) Proceeds from sale of long-term investments 17,696 30,747 11,342 Other 2,771 — — Net cash (used for) provided by investing activities (1,497,096 ) (304,681 ) 81,544 Cash flows from financing activities: Purchases of treasury stock (350,013 ) (1,722,715 ) (1,951,527 ) Proceeds from issuance of treasury stock 179,566 319,165 516,087 Excess tax benefits from stock-based compensation 11,980 31,983 85,050 Proceeds from borrowings on credit facility 650,000 800,000 — Repayments of borrowings on credit facility — (450,000 ) — Repayments of acquired debt (13,875 ) — — Net cash provided by (used for) financing activities 477,658 (1,021,567 ) (1,350,390 ) Effect of foreign currency exchange rates on cash and cash equivalents 14,703 (14,406 ) 1,715 Net increase (decrease) in cash and cash equivalents 113,037 (59,972 ) 173,922 Cash and cash equivalents at beginning of year 886,450 946,422 772,500 Cash and cash equivalents at end of year $ 999,487 $ 886,450 $ 946,422 Supplemental disclosures: Cash paid for income taxes, net of refunds $ 105,158 $ 126,299 $ 55,236 Cash paid for interest $ 2,088 $ 9,604 $ — Non-cash investing activities: Issuance of common stock and stock awards assumed in business acquisitions $ 84,968 $ — $ — Use of Estimates Fiscal Year (in thousands) 2009 2008 2007 Beginning balance $ 4,128 $ 4,398 $ 6,798 9,421 — — 2,841 4,414 (1,367 ) Preference claim, credited to operating expense (1,000 ) (2,000 ) — (165 ) (2,684 ) (1,033 ) Ending balance $ 15,225 $ 4,128 $ 4,398 _________________________________________ (*) Deductions related to the allowance for doubtful accounts represent amounts written off against the allowance, less recoveries. Purchased technology 7 Localization 1 Trademarks 7 Customer contracts and relationships 10 Other intangibles 2 · Distributors are allowed limited rights of return of products purchased during the previous quarter. In addition, distributors are allowed to return products that have reached the end of their lives and products that are being replaced by new versions. · We offer rebates to our distributors, resellers and/or end user customers. The amount of revenue that is reduced for distributor and reseller rebates is based on actual performance against objectives set forth by us for a particular reporting period (volume, timely reporting, etc.). If mail-in or other promotional rebates are offered, the amount of revenue reduced is based on the dollar amount of the rebate, taking into consideration an estimated redemption rate calculated using historical trends. · From time to time, we may offer price protection to our distributors that allow for the right to a credit if we permanently reduce the price of a software product. The amount of revenue that is reduced for price protection is calculated as the difference between the old and new price of a software product on inventory held by the distributor prior to the effective date of the decrease. 2009 2008 2007 Beginning balance $ 50,943 $ 43,532 $ 55,526 Increase due to acquisition 6,566 — — Amount charged to revenue 113,009 153,129 156,761 Actual returns (136,117 ) (145,718 ) (168,755 ) Ending balance $ 34,401 $ 50,943 $ 43,532 Foreign Currency and Other Hedging Instruments Acquisition of approximately 79 million shares of outstanding common stock of Omniture at $21.50 per share in cash $ 1,698,926 Estimated fair value of earned stock options and restricted stock units assumed and converted 84,968 13,964 $ 1,797,858 (in thousands) Amount Net tangible assets $ 31,138 N/A Identifiable intangible assets: Existing technology 176,100 6 Customer contracts and relationships 167,900 11 Contract backlog 52,100 2 Non-competition agreements 900 2 Trademarks 41,000 8 In-process research and development 4,600 N/A Goodwill 1,334,980 N/A Restructuring liability (10,860 ) N/A Total estimated purchase price allocation $ 1,797,858 2009 2008 $ 3,168,731 $ 3,835,799 $ 308,904 $ 742,749 $ 0.59 $ 1.38 Shares used in computing basic net income per share 524,470 539,373 Diluted net income per share $ 0.58 $ 1.35 Shares used in computing diluted net income per share 531,293 549,883 ITEM 9A. CONTROLSProceduresBasedshort-term investments as “available-for-sale.” These investments are free of trading restrictions. We carry these investments at fair value, based on his evaluationquoted market prices or other readily available market information. Unrealized gains and losses, net of taxes, are included in accumulated other comprehensive income, which is reflected as a separate component of stockholders’ equity in our Consolidated Balance Sheets. Gains are recognized when realized in our Consolidated Statements of Income. Losses are recognized as realized. When we have determined that an other-than-temporary decline in fair value has occurred the amount of the decline that is related to a credit loss is recognized in earnings. Gains and losses are determined using the specific identification method.DecemberNovember 27, 2009 (in thousands): Current assets: Cash $ 75,110 $ — $ — $ 75,110 Cash equivalents: Money market mutual funds 884,240 — — 884,240 Bank deposits 40,137 — — 40,137 Total cash equivalents 924,377 — — 924,377 Total cash and cash equivalents 999,487 — — 999,487 Short-term investments: United States treasury notes 373,180 3,199 (1 ) 376,378 United States government agency bonds 59,447 273 — 59,720 Government guaranteed bonds 221,730 3,409 (1 ) 225,138 Corporate bonds 185,735 4,702 — 190,437 Obligations of foreign governments 23,022 397 — 23,419 Bonds of multi-lateral government agencies 24,598 269 — 24,867 Subtotal 887,712 12,249 (2 ) 899,959 Other marketable equity securities 2,527 2,500 — 5,027 Total short-term investments 890,239 14,749 (2 ) 904,986 Total cash, cash equivalents and short-term investments $ 1,889,726 $ 14,749 $ (2 ) $ 1,904,473 Current assets: Cash $ 117,681 $ — $ — $ 117,681 Cash equivalents: Money market mutual funds 682,148 — — 682,148 Bank deposits 40,594 — — 40,594 United States treasury notes 35,992 7 — 35,999 Corporate bonds 10,028 — — 10,028 Total cash equivalents 768,762 7 — 768,769 Total cash and cash equivalents 886,443 7 — 886,450 Short-term investments: United States treasury notes 863,772 14,384 (1 ) 878,155 Corporate bonds 109,415 219 (997 ) 108,637 Obligations of foreign governments 115,316 811 (33 ) 116,094 Bonds of multi-lateral government agencies 26,559 260 — 26,819 Subtotal 1,115,062 15,674 (1,031 ) 1,129,705 Other marketable equity securities 2,773 274 — 3,047 Total short-term investments 1,117,835 15,948 (1,031 ) 1,132,752 Total cash, cash equivalents and short-term investments $ 2,004,278 $ 15,955 $ (1,031 ) $ 2,019,202 Less Than 12 Months Total Fair Value Fair Value United States treasury notes and agency bonds $ 11,179 $ (1 ) $ 11,179 $ (1 ) Government guaranteed bonds 5,041 (1 ) 5,041 (1 ) Total $ 16,220 $ (2 ) $ 16,220 $ (2 ) Less Than 12 Months Total Fair Value Fair Value United States treasury notes $ 37,400 $ (1 ) $ 37,400 $ (1 ) Corporate bonds 67,606 (997 ) 67,606 (997 ) Obligations of foreign governments 28,033 (33 ) 28,033 (33 ) Total $ 133,039 $ (1,031 ) $ 133,039 $ (1,031 ) $ 385,828 $ 387,572 246,169 249,882 214,108 218,621 41,607 43,884 $ 887,712 $ 899,959 Fair Value Measurements at Reporting Date Using Total (Level 1) (Level 2) (Level 3) Current assets: $ 924,378 $ 924,378 $ — $ — 899,960 — 899,960 — 5,026 5,026 — — Total current assets 1,829,364 929,404 899,960 — Non-current assets: 37,121 — — 37,121 4,307 — 4,307 — 717 717 — — Equity and fixed income mutual funds 8,328 — 8,328 — Subtotal for deferred compensation plan assets 9,045 717 8,328 — Total non-current assets 50,473 717 12,635 37,121 $ 1,879,837 $ 930,121 $ 912,595 $ 37,121 Liabilities: $ 1,589 $ — $ 1,589 $ — $ 1,589 $ — $ 1,589 $ — Fair Value Measurements at Reporting Date Using Total (Level 1) (Level 2) (Level 3) Current assets: $ 722,742 $ 722,742 $ — $ — 1,175,732 — 1,175,732 — 3,047 3,047 — — Total current assets 1,901,521 725,789 1,175,732 — Non-current assets: 39,004 251 — 38,753 49,848 — 49,848 — 704 704 — — Equity and fixed income mutual funds 6,856 — 6,856 — Subtotal for deferred compensation plan assets 7,560 704 6,856 — Total non-current assets 96,412 955 56,704 38,753 $ 1,997,933 $ 726,744 $ 1,232,436 $ 38,753 Liabilities: $ 1,739 $ — $ 1,739 $ — $ 1,739 $ — $ 1,739 $ — (1) Included in cash and cash equivalents on our Consolidated Balance Sheets. (2) Included in either cash and cash equivalents or short-term investments on our Consolidated Balance Sheets. (3) Included in short-term investments on our Consolidated Balance Sheets. (4) Included in other assets on our Consolidated Balance Sheets. (5) Included in prepaid expenses and other current assets on our Consolidated Balance Sheets. (6) Included in accrued expenses on our Consolidated Balance Sheets. 2006,inputs) or inputs other than quoted prices that are observable either directly or indirectly (Level 2 inputs) in determining fair value. However, we classify all of our Chief Executive Officer and Chief Financial Officer, has concluded that our disclosurefixed income available-for-sale securities as having Level 2 inputs. Our procedures include controls and procedures (as defined in Rules 13a-15(e) and 15d-15(e) under the Securities Exchange Act of 1934, as amended) were sufficiently effective to ensure that appropriate fair values are recorded such as comparing prices obtained from multiple independent sources.information required to be disclosed by usLevel 3 investments consist of investments in this Annual Report on Form 10-K/A was recorded, processed, summarized and reported within the time periods specifiedprivately-held companies. These investments are remeasured at fair value each period with any gains or losses recognized in the SEC’s rules and instructions for Form 10-K/A.Our management, includinginvestment gains (losses), net in our Chief Executive Officer and Chief Financial Officer, does not expect that our disclosure controls and procedures or our internal controls will prevent all error and all fraud. A control system, no matter how well conceived and operated, can provide only reasonable, not absolute, assurance that the objectivesConsolidated Statements of Income. We estimated fair value of the control system are met. Further, the designLevel 3 investments by considering available information such as pricing in recent rounds of a control system must reflect the fact that there are resource constraintsfinancing, current cash positions, earnings and the benefits of controls must be considered relative to their costs. Becausecash flow forecasts, recent operational performance and any other readily available market data.inherent limitationsbeginning and ending balances for investments of limited partnership using significant unobservable inputs (Level 3) as of November 27, 2009 and November 28, 2008 was as follows (in thousands): $ 30,647 363 7,743 38,753 1,921 (3,553 ) $ 37,121 all control systems, no evaluation of controls can provide absolute assurance that all control issues and instances of fraud, if any, within Adobe have been detected.(b) Management’s Report on Internal Control over Financial ReportingOur management is responsibleprivately-held companies accounted for establishing and maintaining adequate internal control over financial reporting (as defined in Rule 13a-15(f) under the Securities Exchange Act of 1934, as amended). Our managementcost method, which are periodically assessed for other-than-temporary impairment. If we determine that an other-than-temporary impairment has occurred, we write-down the effectivenessinvestment to its fair value. We estimated fair value of our internal control over financial reportingcost method investments considering available information such as pricing in recent rounds of December 1, 2006. In making this assessment,financing, current cash positions, earnings and cash flow forecasts, recent operational performance and any other readily available market data. During fiscal 2009, we determined that certain of our management usedcost method investments were other-than-temporarily impaired which resulted in a charge of $13.9 million, included in investment gains (losses), net in our Consolidated Statements of Income. The fair value of cost method investments that were impaired was estimated using Level 3 inputs.criteria set forth by the Committee of Sponsoring Organizationsuse of the Treadway Commission (“COSO”)derivative and whether it is designated and qualifies for hedge accounting.Internal Control-Integrated Framework. Our management has concludedU.S. dollars and in various other currencies. In Europe and Japan, transactions that as of December 1, 2006, our internal control over financial reporting is effective based on these criteria. Our independent registered public accounting firm, KPMG LLP, have issued an audit report on our assessment of our internal control over financial reporting, which is included herein.(c) Changesare denominated in Internal Control over Financial ReportingThere were no changes in our internal controls over financial reporting during the quarter ended December 1, 2006 that have materially affected, or are reasonably likely to materially affect our internal controls over financial reporting.(d) Report of Independent Registered Public AccountingThe Board of DirectorsEuro and StockholdersAdobe Systems Incorporated:We have audited management’s assessment, included in the accompanying Management’s Report on Internal Control over Financial Reporting appearing under Item 9A(b), that Adobe Systems Incorporated maintained effective internal control over financial reporting as of December 1, 2006, based on the criteria established in Internal Control—Integrated Framework issued by the Committee of Sponsoring Organizations of the Treadway Commission (COSO). Management of Adobe Systems Incorporated is responsible for maintaining effective internal control over financial reporting and for its assessment of the effectiveness of internal control over financial reporting. Our responsibility is to express an opinion on management’s assessment and an opinion on the effectiveness of the internal control over financial reporting of Adobe Systems Incorporated based on our audit.We conducted our audit in accordance with the standards of the Public Company Accounting Oversight Board (United States). Those standards require that we plan and perform the audit to obtain reasonable assurance about whether effective internal control over financial reporting was maintained in all material respects. Our audit included obtaining an understanding of internal control over financial reporting, evaluating management’s assessment, testing and evaluating the design and operating effectiveness of internal control, and performing such other procedures as we considered necessary in the circumstances. We believe that our audit provides a reasonable basis for our opinion.A company’s internal control over financial reporting is a process designed to provide reasonable assurance regarding the reliability of financial reporting and the preparation of financial statements for external purposes in accordance with generally accepted accounting principles. A company’s internal control over financial reporting includes those policies and procedures that (1) pertain to the maintenance of records that, in reasonable detail, accurately and fairly reflect the transactions and dispositions of the assets of the company; (2) provide reasonable assurance that transactions are recorded as necessary to permit preparation of financial statements in accordance with generally accepted accounting principles, and that receipts and expenditures of the company are being made only in accordance with authorizations of management and directors of the company; and (3) provide reasonable assurance regarding prevention or timely detection of unauthorized acquisition, use, or disposition of the company’s assets that could have a material effect on the financial statements.Because of its inherent limitations, internal control over financial reporting may not prevent or detect misstatements. Also, projections of any evaluation of effectiveness to future periodsYen are subject to the risk that controlsexposure from movements in exchange rates. We may become inadequate because ofuse foreign exchange option contracts or forward contracts to hedge certain operational (“cash flow”) exposures resulting from changes in conditions, or thatforeign currency exchange rates. These foreign exchange contracts, carried at fair value, may have maturities between one and twelve months. The maximum original duration of any contract is twelve months. We enter into these foreign exchange contracts to hedge a portion of our forecasted foreign currency denominated revenue in the degreenormal course of compliance withbusiness and accordingly, they are not speculative in nature.policies or procedures may deteriorate.In our opinion, management’s assessment that Adobe Systems Incorporated maintained effective internal control over financial reporting as of December 1, 2006, is fairly stated, in all material respects, based on criteria established in Internal Control—Integrated Framework issued by COSO. Also, in our opinion, Adobe Systems Incorporated maintained, in all material respects, effective internal control over financial reporting as of December 1, 2006, based on the criteria established in Internal Control—Integrated Framework issued by COSO.We also have audited, in accordance with the standardsinception of the Public Company Accounting Oversight Board (United States), the consolidated balance sheets of Adobe Systems Incorporated and subsidiaries as of December 1, 2006 and December 2, 2005,hedge, and the related consolidated statements of income, stockholders’ equity, andhedges must be highly effective in offsetting changes to future cash flows for each of the yearson hedged transactions. We record changes in the three-year period ended December 1, 2006, andintrinsic value of these cash flow hedges in accumulated other comprehensive income in our report dated February 5, 2007, expressed an unqualified opinion on those consolidated financial statements./s/ KPMG LLPMountain View, CaliforniaFebruary 5, 2007Attached as Exhibit 100 to this Annual Report on Form 10-K/A are the following materials, formatted in Extensible Business Reporting Language (“XBRL”): (i) the information contained in Item 7 of Part II, (ii) the Consolidated Balance Sheets, until the forecasted transaction occurs. When the forecasted transaction occurs, we reclassify the related gain or loss on the cash flow hedge to revenue. In the event the underlying forecasted transaction does not occur, or it becomes probableDecember 1, 2006that time. For fiscal 2009, 2008 and December 2, 2005, (iii)2007 there were no such gains or losses recognized in interest and other income, net relating to hedges of forecasted transactions that did not occur. 2009 Derivatives in cash flow hedging relationships: $ (14,618 ) $ — $ 27,138 $ — $ (18,027 ) $ — Derivatives not designated as hedging relationships: $ — $ (14,407 ) (1) Net change in the fair value of the effective portion classified in other comprehensive income (“OCI”). (2) Effective portion classified as revenue. (3) Ineffective portion and amount excluded from effectiveness testing classified in interest and other income, net. (4) Classified in interest and other income, net. years ended December 1, 2006, December 2, 2005,risk that our earnings and December 3, 2004cash flows will be adversely affected by changes in exchange rates. These derivative instruments hedge assets and (iv)liabilities that are denominated in foreign currencies and are carried at fair value with changes in the fair value recorded to interest and other income, net in our Consolidated Statements of Stockholders’ Equity for the years ended December 1, 2006, December 2, 2005,Income. These derivative instruments do not subject us to material balance sheet risk due to exchange rate movements because gains and December 3, 2004losses on these derivatives are intended to offset gains and (v) the Consolidated Statements of Cash Flows for the yearsended December 1, 2006, December 2, 2005, and December 3, 2004. The financial information contained in the XBRL documents is unaudited and these are not the official publicly filed financial statements of the Registrant. The purpose of submitting these XBRL documents is to test the related format and technology and, as a result, investors should continue to relylosses on the official filed versionassets and liabilities being hedged. As of the furnished documents and not rely on this information in making investment decisions.The information in Exhibit 100 attached hereto shall not be deemed “filed” for purposesNovember 27, 2009, total notional amounts of Section 18 of the Securities Exchange Act of 1934 (the “Exchange Act”) or otherwise subject to the liabilities of that section, nor shall it be deemed incorporated by reference in any filing under the Securities Act of 1933 or the Exchange Act, regardless of any general incorporation language in such filing.Subsequent to the filing of our Form 8K on December 14, 2006,outstanding contracts were $154.9 million which included the notional equivalent of $87.6 million in Euro, $22.9 million in Yen and $44.4 million in other foreign currencies. At November 27, 2009, the outstanding balance sheet hedging derivatives had maturities of 90 days or less.press release containingConsolidated Balance Sheets as of November 27, 2009 were as follows (in thousands): Fair Values of Derivative Instruments Asset Derivatives Liability Derivatives Derivatives designated as hedging instruments: $ 4,175 $ — Derivatives not designated as hedging instruments: 132 1,589 $ 4,307 $ 1,589 2009 2008 2007 Gain (loss) on foreign currency assets and liabilities: Net realized gain (loss) recognized in other income $ 25,384 $ (7,738 ) $ 13,388 Net unrealized (loss) gain recognized in other income related to instruments outstanding (6,390 ) 5,223 (4,035 ) 18,994 (2,515 ) 9,353 (Loss) gain on hedges of foreign currency assets and liabilities: Net realized loss recognized in other income (11,872 ) (3,255 ) (8,394 ) (2,535 ) 3,920 1,887 (14,407 ) 665 (6,507 ) Net gain (loss) recognized in other income $ 4,587 $ (1,850 ) $ 2,846 December 1, 2006 unaudited financial statements,investment policy. Our policy limits the amount of credit exposure to any one security issue or issuer and we have made immaterial adjustments to our fiscal 2006 financial statements which had the effectbelieve no significant concentration of increasing net income by approximately $1.4 million. These adjustments are not material to either the annual or fourth quarter financial statements for the period ended December 1, 2006.We received a letter dated January 31, 2007 from the Staff of the Division of Corporate Finance of the Securities and Exchange Commissioncredit risk exists with respect to our Quarterly Report on Form 10-Q filed for the quarterly period ended September 1, 2006. The Staff noted our disclosurethese investments.stock-based compensation errors foundforeign currency hedges through a policy that establishes counterparty limits. The bank counterparties in these contracts expose us to credit-related losses in the event of their nonperformance. However, to mitigate that risk, we only contract with counterparties who meet our minimum requirements under our counterparty risk assessment process. In addition, our hedging policy establishes maximum limits for each counterparty. We monitor ratings, credit spreads and potential downgrades on at least a quarterly basis. Based on our on-going assessment of counterparty risk, we will adjust our exposure to various counterparties.reviewnew distributors, dealers and OEMs. We also perform ongoing credit evaluations of employee option grant practicesour customers’ financial condition and require letters of credit or other guarantees, whenever deemed necessary. The credit limit given to the applicationcustomer is based on our risk assessment of Staff Accounting Bulletin (SAB) No. 108 thereto. The Staff requestedtheir ability to pay, country risk and other factors and is not contingent on the resale of the product or on the collection of payments from their customers. We also purchase credit insurance to mitigate credit risk in some foreign markets where we believe it is warranted. If we license our software to a response regardingcustomer where we have a reason to believe the required materiality analysis under SAB 108 with respectcustomer’s ability to these errors, including both qualitative and quantitative factors.pay is not probable, due to country risk or credit risk, we will not recognize the revenue. We will be respondingrevert to recognizing the Staff's comments, but as disclosed inrevenue on a cash basis, assuming all other criteria for revenue recognition has been met. See Note 120 for information regarding our significant customers.NotesOEM PostScript and Other licensing revenue from a small number of OEMs. Our OEMs on occasion seek to Consolidated Financial Statements, we concluded that the impact of the stock-based compensation errors was immaterial for all fiscal periods ending prior to the fiscal year ended December 1, 2006 but was materialrenegotiate their royalty arrangements. We evaluate these requests on a cumulative basiscase-by-case basis. If an agreement is not reached, a customer may decide to our fiscal 2006 financial statements, and therefore we recorded an adjustment to our opening retained earnings balancepursue other options, which could result in the amount of $26.6 million as provided under the provisions of SAB 108.lower licensing revenue for us.ITEM 10. DIRECTORS, EXECUTIVE OFFICERSCORPORATE GOVERNANCEEQUIPMENT 2009 2008 Computers and equipment $ 409,595 $ 331,235 Furniture and fixtures 62,786 56,253 Capital projects in-progress 19,931 7,273 Leasehold improvements 152,200 133,571 Land 86,493 74,835 Buildings 99,845 62,464 Total 830,850 665,631 Less accumulated depreciation and amortization. (442,718 ) (352,594 ) Property and equipment, net. $ 388,132 $ 313,037 2008 Acquisitions 2009 $ 956,011 $ 253,463 $ 1,126 $ 1,210,600 408,318 — 2,255 410,573 298,039 — (4,310 ) 293,729 265,518 — (398 ) 265,120 206,844 — (311 ) 206,533 — 1,108,034 — 1,108,034 $ 2,134,730 $ 1,361,497 $ (1,638 ) $ 3,494,589 (*) Includes net reductions in goodwill of $5.2 million for tax related obligations associated with our acquisitions of Macromedia and Accelio in addition to a facility lease obligation adjustment of $1.7 million related to Macromedia, offset in part by foreign currency translation adjustments and other individually insignificant tax items. Directors, Codeacquisitions.EthicsNovember 27, 2009 and compliance with Section 16(a)November 28, 2008 were as follows (in thousands): 2009 2008 Creative Solutions $ 124,178 $ 107,526 Knowledge Worker 23,041 48,851 Enterprise 6,588 13,146 Platform 9,159 26,248 Print and Publishing 6,218 19,189 Omniture 358,204 — Purchased and other intangible assets, net $ 527,388 $ 214,960 Cost Net $ 586,952 $ (387,731 ) $ 199,221 $ 20,284 $ (15,222 ) $ 5,062 172,030 (104,953 ) 67,077 363,922 (159,450 ) 204,472 54,535 (2,979 ) 51,556 $ 610,771 $ (282,604 ) $ 328,167 $ 1,197,723 $ (670,335 ) $ 527,388 Cost Net $ 411,408 $ (338,608 ) $ 72,800 $ 23,751 $ (6,156 ) $ 17,595 130,925 (78,181 ) 52,744 198,891 (127,520 ) 71,371 800 (350 ) 450 $ 354,367 $ (212,207 ) $ 142,160 $ 765,775 $ (550,815 ) $ 214,960 Fiscal Year 2010 $ 35,830 $ 100,403 2011 32,446 58,494 2012 30,840 22,068 2013 26,867 21,447 2014 25,110 21,046 Thereafter 48,128 104,709 Total expected amortization expense $ 199,221 $ 328,167 Securities Exchange Actfollowing (in thousands): 2009 2008 $ 84,313 $ 90,643 63,526 76,589 11,692 16,087 12,059 9,026 9,045 7,560 4,650 7,361 3,209 3,185 1,377 2,658 1,394 3,420 $ 191,265 $ 216,529 1934,licensing rights which was expensed as cost of sales and the residual of $16.8 million for fiscal 2008 was expensed as general and administrative costs. In connection with these licensing arrangements, we have the ability to acquire additional rights to use technology in the future. See Note 17 for further information regarding our contractual commitments.youinvestments, on a regular basis. This evaluation includes, but is not limited to, reviewing each company’s cash position, financing needs, earnings and revenue outlook, operational performance, management and ownership changes and competition. In the case of privately-held companies, this evaluation is based on information that we request from these companies. This information is not subject to the sections entitled “Proposal 1—Electionsame disclosure regulations as U.S. publicly traded companies and as such, the basis for these evaluations is subject to the timing and the accuracy of Directors,” “Corporate Governance—the data received from these companies. See Note 4 for further information regarding Adobe Ventures. 2009 2008 Accrued compensation and benefits $ 164,352 $ 177,760 Taxes payable 11,879 21,760 Sales and marketing allowances 32,774 28,127 Other 210,641 172,322 Accrued expenses $ 419,646 $ 399,969 2009 2008 2007(*) Current: $ 152,840 $ 24,179 $ 36,614 36,794 27,680 55,536 25,427 6,972 4,100 215,061 58,831 96,250 Deferred: 50,376 41,678 50,640 559 (9,693 ) (13,480 ) 4,635 25,518 23,007 55,570 57,503 60,167 44,381 90,360 66,966 $ 315,012 $ 206,694 $ 223,383 (*) 2009 2008 2007 Computed “expected” tax expense $ 245,532 $ 377,478 $ 331,516 State tax expense, net of federal benefit 7,799 12,700 8,938 Tax-exempt income — (342 ) (11,123 ) Tax credits (14,127 ) (12,873 ) (23,341 ) Differences between statutory rate and foreign effective tax rate (91,262 ) (132,470 ) (84,740 ) Change in deferred tax asset valuation allowance 2,759 (1,105 ) 1,694 Stock-based compensation (net of tax deduction) 6,085 5,457 2,587 Resolution of U.S. income tax exam for fiscal 2001 - 2004 years — (20,712 ) — Foreign tax refund for fiscal 2000 - 2002 — (16,351 ) — Domestic manufacturing deduction benefit (7,525 ) (6,300 ) (4,419 ) Tax charge for licensing Omniture’s technology to foreign subsidiaries 161,701 — — Other, net 4,050 1,212 2,271 Provision for income taxes $ 315,012 $ 206,694 $ 223,383 2009 2008 Deferred tax assets: $ 937 $ 4,497 68,472 71,174 17,441 46,200 15,263 10,350 56,541 50,329 56,138 7,621 12,205 19,130 5,701 5,688 11,603 3,538 244,301 218,527 (4,283 ) (1,524 ) 240,018 217,003 Deferred tax liabilities: (11,975 ) (3,113 ) (210,619 ) (167,760 ) (192,493 ) (52,745 ) (415,087 ) (223,618 ) $ (175,069 ) $ (6,615 ) Ethics,” “Executive Compensation—Section 16(a) Beneficial Ownership Reporting Compliance,” and “Certain Relationships and Related Transactions” respectively,$82.8 million which have not been recorded in the Proxy Statementfinancial statements pursuant to accounting standards related to stock-based compensation. These amounts are no longer included in our gross or net deferred tax assets. Pursuant to these standards, the benefit of these deferred tax assets will be recorded to equity when they reduce taxes payable. 2009 2008 $ 139,549 $ 201,808 43,173 14,009 42,422 11,350 (429 ) (81,213 ) (12,585 ) (3,512 ) 5,910 (2,893 ) $ 218,040 $ 139,549 delivernot have an adverse effect on our operating results and financial position.stockholdersadoption of new accounting standards related to business combinations in fiscal 2010 (see Note 1). Under the new guidance related to business combinations, adjustments to acquired income tax liabilities (including adjustments for acquisitions completed prior to the effective date) that are recorded subsequent to the acquisition date will be recognized in income from continuing operations, with certain exceptions, if such changes occur after the measurement period.Annual Meetingfiscal 2010 operating plan impacting up to approximately 630 full-time positions worldwide. In connection with this restructuring plan, in the fourth quarter of Stockholdersfiscal 2009, we recorded restructuring charges of approximately $25.5 million related to ongoing termination benefits for the elimination of approximately 340 of these full-time positions worldwide. As of November 27, 2009, approximately $2.5 million was paid. The remaining accrual associated with these ongoing termination benefits is expected to be paid during fiscal 2010. The restructuring activities related to this program affect only those employees that were associated with Adobe prior to the acquisition of Omniture, Inc. on October 23, 2009. $ — $ 25,521 $ (2,537 ) $ — $ 22,984 $ — $ 6,704 $ — $ 8 $ 6,712 Cost of closing redundant facilities — 3,914 — 19 3,933 — 242 — — 242 $ — $ 10,860 $ — $ 27 $ 10,887 April 5, 2007. Information regardingOctober 23, 2009 for which subsequent payments of $0.1 million were made during the fourth quarter of fiscal 2009. Restructuring costs related to these facilities were approximately $1.4 million at November 27, 2009 with $1.2 million recorded in accrued restructuring, current and $0.2 million related to long-term facilities obligations recorded in accrued restructuring, non-current in our Executive Officers is containedConsolidated Balance Sheets. We expect to pay these facilities-related liabilities through fiscal 2013.reportrestructuring program, we recorded restructuring charges in Part I, Item 1 titled “Business.”the fourth quarter of fiscal 2008 totaling $29.2 million related to ongoing termination benefits for the elimination of approximately 460 of the 560 full-time positions globally. As of November 28, 2008, $0.4 million was paid.are incorporatingvacated approximately 89,000 square feet of research and development and sales facilities in the information contained in those sectionsU.S., the United Kingdom and Canada. We accrued $8.5 million for the fair value of our Proxy Statement here by reference.ITEM 11. EXECUTIVE COMPENSATIONFor information regardingfuture contractual obligations under these operating leases using our Executive Compensation, Compensation Committee Interlockscredit-adjusted risk-free interest rate, estimated at approximately 6% as of the date we ceased to use the leased properties. This amount is net of the fair value of future estimated sublease income of approximately $4.4 million. We also recorded additional charges of $6.7 million for termination benefits for the elimination of substantially all of the remaining 100 full-time positions expected to be terminated. $ 28,759 $ 6,722 $ (34,191 ) $ (233 ) $ 1,057 Cost of closing redundant facilities — 8,514 (5,380 ) 248 3,382 $ 28,759 $ 15,236 $ (39,571 ) $ 15 $ 4,439 Insider Participation,$2.5 million related to long-term facilities obligations recorded in accrued restructuring, non-current in our Consolidated Balance Sheets. Total costs incurred to date and expected to be incurred for closing redundant facilities are $44.5 million and $44.7 million, respectively. We have substantially paid all of the accrued termination benefits during fiscal 2009. We expect to pay facilities-related liabilities through fiscal 2013.Compensation Committee Report,acquisition of Macromedia on December 3, 2005. In connection with this acquisition, we direct youinitiated plans to restructure both the pre-merger operations of Adobe and Macromedia to eliminate certain duplicative activities, focus our resources on future growth opportunities and reduce our cost structure. In connection with the worldwide restructuring plan, we recognized costs related to termination benefits for employee positions that were eliminated and for the closure of duplicative facilities. We also recognized costs related to the section entitled “Executive Compensation,” “Compensation Committee Interlockscancellation of certain contracts associated with the wind-down of subsidiaries and Insider Participation,”other service contracts held by Macromedia. Costs for termination benefits and “Reportcontract terminations were completed during fiscal 2007. Total costs incurred were $27.0 million and $3.2 million, respectively. Cost of closing redundant facilities $ 12,168 $ (6,675 ) $ (487 ) $ 5,006 Other 977 (889 ) (80 ) 8 Total $ 13,145 $ (7,564 ) $ (567 ) $ 5,014 Cost of closing redundant facilities $ 16,283 $ (7,187 ) $ 3,072 $ 12,168 Other 1,435 (147 ) (311 ) 977 Total $ 17,718 $ (7,334 ) $ 2,761 $ 13,145 ExecutiveMacromedia acquisition as well as the net effect of foreign currency changes.Committee”PlanProxy Statement weform of a lump sum or annual installments over five, ten or fifteen years. Upon termination of a participant’s employment with Adobe, such participant will deliverreceive a distribution in the form of a lump sum payment. All distributions will be made in cash, except for deferred performance-based and time-based restricted stock units which will be settled in stock. As of November 27, 2009 and November 28, 2008, the invested amounts under the Deferred Compensation Plan total $9.0 million and $7.6 million, respectively and were recorded as other assets on our Consolidated Balance Sheets. As of November 27, 2009 and November 28, 2008, $9.0 million and $7.6 million, respectively, was recorded as long-term liabilities to our stockholders in connection with our Annual Meeting of Stockholdersrecognize undistributed deferred compensation due to be held on April 5, 2007. We are incorporating the information contained in that section of our Proxy Statement here by reference.employees.ITEM 12. We have the following stock-based compensation plans and programs: SECURITY OWNERSHIP OF CERTAIN BENEFICIAL OWNERS AND MANAGEMENT AND RELATED STOCKHOLDER MATTERSYou will find this informationsection captioned “Security Ownershipfollowing discussion as “the Plans.” Under the Plans, options can be granted to all employees, including executive officers, outside consultants and non-employee directors. The Plans will continue until the earlier of Certain Beneficial Owners(i) termination by the Board or (ii) the date on which all of the shares available for issuance under the plan have been issued and Management”restrictions on issued shares have lapsed. Option vesting periods are generally four years for all of the Plans. Options granted under the Plans generally expire seven years from the effective date of grant.“Equity4.0 million shares of common stock for issuance under our 2003 Plan and 2005 Assumption Plan, respectively. As of November 27, 2009, we had 42.7 million and 2.9 million shares available for grant under our 2003 Plan and 2005 Assumption Plan, respectively.Plan Information”Committee adopted the 2009 Performance Share Program (the “2009 Program”). The purpose of the 2009 Program is to align key management and senior leadership with stockholders’ interests and to retain key employees. The measurement period for the 2009 Program is our fiscal 2009 year. All members of our executive management and other key senior leaders are participating in the Proxy Statement2009 Program. Awards granted under the 2009 Program were granted in the form of performance shares pursuant to the terms of our 2003 Equity Incentive Plan. If pre-determined performance goals are met, shares of stock will be granted to the recipient, with 25% vesting on the later of the date of certification of achievement or the first anniversary date of the grant, and the remaining 75% vesting evenly on the following three annual anniversary dates of the grant, contingent upon the recipient’s continued service to Adobe. Participants in the 2009 Program have the ability to receive up to 115% of the target number of shares originally granted.deliverissue treasury stock. If treasury stock is not available, common stock will be issued. In order to minimize the impact of on-going dilution from exercises of stock options and vesting of restricted stock and performance shares, we instituted a stock repurchase program. See Note 14 for information regarding our stock repurchase programs. Fiscal Years 2009 2008 2007 Expected term (in years) 3.0 – 4.1 2.3 – 4.7 3.5 – 4.8 34 – 57 % 32 – 60 % 30 – 39 % Risk-free interest rate 1.16 – 2.24 % 1.70 – 3.50 % 3.60 – 5.10 % Fiscal Years 2009 2008 2007 Expected term (in years) 0.5 – 2.0 0.5 – 2.0 0.5 – 2.0 Volatility 40 – 57 % 30 – 36 % 30 – 33 % 0.27 – 1.05 % 2.12 – 3.29 % 4.79 – 5.11 % Outstanding Options December 1, 2006 61,731 $ 24.19 Granted 10,084 40.36 Exercised (21,368 ) 21.18 Cancelled (2,705 ) 33.18 November 30, 2007 47,742 $ 28.47 Granted 5,462 35.08 Exercised (9,983 ) 25.45 (2,517 ) 35.34 November 28, 2008 40,704 $ 29.67 Granted 5,758 22.90 Exercised (7,560 ) 17.15 Cancelled (3,160 ) 33.57 Increase due to acquisition 5,509 20.15 November 27, 2009 41,251 $ 29.45 As of November 27, 2009 Options outstanding 41,251 $ 29.45 4.33 $ 295.8 Options vested and expected to vest 39,322 $ 29.54 4.24 $ 279.1 Options exercisable 26,677 $ 29.85 3.54 $ 181.7 As of November 28, 2008 Options outstanding 40,704 $ 29.67 4.00 $ 76.1 Options vested and expected to vest 38,975 $ 29.36 3.87 $ 76.1 Options exercisable 28,034 $ 26.61 3.28 $ 76.1 As of November 30, 2007 Options outstanding 47,742 $ 28.47 4.36 $ 654.2 Options vested and expected to vest 43,067 $ 27.68 4.19 $ 623.8 Options exercisable 29,387 $ 23.77 3.38 $ 539.8 (*) The intrinsic value is calculated as the difference between the market value as of end of the fiscal year and the exercise price of the shares. As reported by the NASDAQ Global Select Market, the market values as of November 27, 2009, November 28, 2008 and November 30, 2007 were $35.38, $23.16 and $42.14, respectively. 2009 2008 2007 Beginning outstanding balance 4 $ 39.31 21 $ 36.41 501 $ 9.17 — — — — 5 40.03 (1 ) 38.22 (15 ) 34.94 (92 ) 29.32 — — (2 ) 39.95 (393 ) 4.77 Ending outstanding balance 3 $ 40.01 4 $ 39.31 21 $ 36.41 4,261 1,701 — 6,176 3,177 1,771 (1,162 ) (422 ) — (401 ) (195 ) (70 ) 1,559 — — 10,433 4,261 1,701 2009 Restricted stock units outstanding 10,433 1.82 $ 369.1 Restricted stock units vested and expected to vest 8,078 1.63 $ 285.7 2008 Restricted stock units outstanding 4,261 1.73 $ 98.7 Restricted stock units vested and expected to vest 3,351 1.52 $ 77.6 2007 Restricted stock units outstanding 1,701 1.88 $ 71.7 Restricted stock units vested and expected to vest 1,309 1.65 $ 55.2 (*) The intrinsic value is calculated as the market value as of end of the fiscal year. As reported by the NASDAQ Global Select Market, the market values as of November 27, 2009, November 28, 2008 and November 30, 2007 were $35.38, $23.16 and $42.14, respectively. — — 559 643 (7 ) (8 ) 552 635 2009 2008 Beginning outstanding balance 383 — Achieved 1,022 993 Released (382 ) (480 ) Forfeited (73 ) (130 ) Ending outstanding balance 950 383 2009 Performance shares outstanding 950 1.05 $ 33.6 Performance shares vested and expected to vest 818 0.97 $ 28.8 2008 383 1.20 $ 8.9 Performance shares vested and expected to vest 323 1.10 $ 7.4 (*) The intrinsic value is calculated as the market value as of end of the fiscal year. As reported by the NASDAQ Global Select Market, the market value as of November 27, 2009 and November 28, 2008 was $35.38 and $23.16, respectively. 2009 2008 2007 Options granted to existing directors 175 250 250 Exercise price $ 23.28 $ 37.09 $ 42.61 2009 Restricted stock units granted to existing directors 27 Restricted stock units granted to new directors 20 Income Statement Classifications Research and Development General and Administrative $ 1,906 $ 45,535 $ 38,790 $ 24,595 $ 110,826 $ 3,728 $ 55,653 $ 41,326 $ 24,521 $ 125,228 $ 5,152 $ 58,579 $ 41,801 $ 24,467 $ 129,999 $ 639 $ 27,931 $ 19,818 $ 9,274 $ 57,662 $ 570 $ 20,835 $ 17,928 $ 10,810 $ 50,143 $ 346 $ 9,518 $ 6,084 $ 4,040 $ 19,988 (*) During fiscal 2009 and 2008, we recorded $0.9 million and $2.9 million, respectively, associated with cash recoveries of fringe benefit tax from employees in India. in connection with our Annual Meeting of Stockholders to be held on April 5, 2007. We are incorporating the information contained in that section here by reference.ITEM 13. CERTAIN RELATIONSHIPS AND RELATED TRANSACTIONS, AND DIRECTOR INDEPENDENCEYou will find this informationand minimize dilution from stock issuances, we repurchase shares in the section captioned “Certain Relationshipsopen market and Related Transactions”also enter into structured repurchases with third-parties.“Proposal 1—Electionis subject to business conditions and cash flow requirements as determined by our Board of Directors—IndependenceDirectors from time to time.Directors”$350.0 million, $525.0 million and $1.1 billion, respectively. We entered into these agreements in order to take advantage of repurchasing shares at a guaranteed discount to the Volume Weighted Average Price (“VWAP”) of our common stock over a specified period of time. We only enter into such transactions when the discount that we receive is higher than the foregone return on our cash prepayments to the financial institutions. There were no explicit commissions or fees on these structured repurchases. Under the terms of the agreements, there is no requirement for the financial institutions to return any portion of the prepayment to us.Proxy Statementcontract, the number of trading days in the interval and the average VWAP of our stock during the interval less the agreed upon discount. During fiscal 2009, we will deliverrepurchased approximately 15.2 million shares at an average price per share of $27.89 through structured repurchase agreements entered into during fiscal 2008 and fiscal 2009. During fiscal 2008, we repurchased 22.4 million shares at an average price of $36.26 through structured repurchase agreements which included prepayments from fiscal 2007. During fiscal 2007, we repurchased 22.0 million shares at an average price of $40.04 through structured repurchase agreements which included prepayments from fiscal 2006.stockholderscommon stock. During the third quarter of fiscal 2008, the remaining authorized number of shares were repurchased. From the inception of the 50.0 million share authorization under this program, we provided prepayments of $1.9 billion under structured share repurchase agreements to large financial institutions. During the third quarter of fiscal 2008, the remaining authorized number of shares were repurchased.connection with our Annual Meeting of Stockholders to be held on April 5, 2007. We are incorporating the information contained in that section here by reference.open market transactions.ITEM 14. PRINCIPAL ACCOUNTING FEES AND SERVICESYou will find this information inThe following table sets forth the section captioned “Principal Accounting Fees and Services,” in the Proxy Statement we will deliver to our stockholders in connection with our Annual Meeting of Stockholders to be held on April 5, 2007. We are incorporating the information contained in that section here by reference.72ITEM 15. EXHIBITS, FINANCIAL STATEMENT SCHEDULES(a) Documents filed as part of this reportThe exhibits listed in the accompanying Index to Exhibits are filed or incorporated by reference as part of this report.73REPORT OF INDEPENDENT REGISTERED PUBLIC ACCOUNTING FIRMThe Board of Directors and StockholdersAdobe Systems Incorporated:We have audited the accompanying consolidated balance sheets of Adobe Systems Incorporated and subsidiaries as of December 1, 2006 and December 2, 2005, and the related consolidated statements of income, stockholders’ equity, and cash flowsactivity for each component of comprehensive income, net of related taxes, for fiscal 2009, 2008 and 2007 (in thousands): 2009 2008 2007 $ 386,508 $ 871,814 $ 723,807 Other comprehensive income (loss): Available-for-sale securities: Unrealized gains (losses) on available-for-sale securities, net of taxes 6,661 (3,102 ) 14,570 Reclassification adjustment for (gains) losses on available-for-sale securities recognized during the period (8,752 ) 1,559 2,000 Subtotal available-for-sale securities (2,091 ) (1,543 ) 16,570 Derivative instruments: Unrealized (losses) gains on derivative instruments (14,618 ) 54,967 4,974 (27,138 ) (13,248 ) (5,510 ) Subtotal derivative instruments (41,756 ) 41,719 (536 ) Foreign currency translation adjustments 11,071 (10,902 ) 5,570 Other comprehensive income (loss) (32,776 ) 29,274 21,604 Total comprehensive income, net of taxes $ 353,732 $ 901,088 $ 745,411 years in the three-year period ended December 1, 2006. These consolidated financial statements are the responsibility of the Company’s management. Our responsibility is to express an opinion on these consolidated financial statements based on our audits.We conducted our audits in accordance with the standards of the Public Company Accounting Oversight Board (United States). Those standards require that we plan and perform the audit to obtain reasonable assurance about whether the financial statements are free of material misstatement. An audit includes examining, on a test basis, evidence supporting the amounts and disclosures in the financial statements. An audit also includes assessing the accounting principles used and significant estimates made by management, as well as evaluating the overall financial statement presentation. We believe that our audits provide a reasonable basis for our opinion.In our opinion, the consolidated financial statements referred to above present fairly, in all material respects, the financial position of Adobe Systems Incorporated and subsidiaries as of December 1, 2006 and December 2, 2005, and the results of their operations and their cash flowstaxes related for each component of other comprehensive income for fiscal 2009, 2008 and 2007 (in thousands): 2009 2008 2007 Available-for-sale securities $ 931 $ (988 ) $ 2,382 Foreign currency translation adjustments $ 1,411 $ (4,860 ) $ 3,699 years incomponents of accumulated other comprehensive income, net of related taxes, for fiscal 2009 and 2008 (in thousands): 2009 2008 Net unrealized gains on available-for-sale securities: Unrealized gains on available-for-sale securities $ 13,818 $ 16,062 Unrealized losses on available-for-sale securities (2 ) (155 ) Total net unrealized gains on available-for-sale securities 13,816 15,907 Net unrealized gains on derivative instruments (5 ) 41,750 Cumulative foreign currency translation adjustments 10,635 (435 ) Total accumulated other comprehensive income, net of taxes $ 24,446 $ 57,222 three-yearcomponents of foreign currency translation adjustments for fiscal 2009, 2008 and 2007 (in thousands): 2009 2008 2007 Beginning balance $ (431 ) $ 10,471 $ 4,901 17,343 (19,461 ) 9,269 Income tax effect relating to translation adjustments for undistributed foreign earnings (6,272 ) 8,559 (3,699 ) $ 10,640 $ (431 ) $ 10,471 ended December 1, 2006, in conformity with U.S. generally accepted accounting principles.As discussed in Note 1 toexcluding unvested restricted stock. Diluted net income per share is based upon the Consolidated Financial Statements, effective December 3, 2005,weighted average common shares outstanding for the Company adoptedperiod plus dilutive potential common shares, including unvested restricted stock and stock options using the provisiontreasury stock method.Statement of Financial Accounting Standards No. 123 (revised 2004), Share-Based Payment,basic and Securitiesdiluted net income per share for fiscal 2009, 2008 and Exchange Commission Staff Accounting Bulletin No. 108, Considering the Effects of Prior Year Misstatements when Quantifying Misstatements in the Current Year Financial Statements.We also have audited, in accordance with the standards of the Public Company Accounting Oversight Board (United States), the effectiveness of Adobe Systems Incorporated’s internal control over financial reporting as of December 1, 2006, based on the criteria established in Internal Control—Integrated Framework issued by the Committee of Sponsoring Organizations of the Treadway Commission (COSO), and our report dated February 5, 2007 expressed an unqualified opinion on management’s assessment of, and the effective operation of, internal control over financial reporting./s/ KPMG LLPMountain View, CaliforniaFebruary 5, 200774ADOBE SYSTEMS INCORPORATEDCONSOLIDATED BALANCE SHEETS(In(in thousands, except per share data): 2009 2008 2007 $ 386,508 $ 871,814 $ 723,807 Shares used to compute basic net income per share 524,470 539,373 584,203 Dilutive potential common shares: Unvested restricted stock and performance share awards 2,130 1,107 13 Stock options 4,010 8,073 14,559 530,610 548,553 598,775 $ 0.74 $ 1.62 $ 1.24 $ 0.73 $ 1.59 $ 1.21 See accompanying Notes to Consolidated Financial Statements.75CONSOLIDATED STATEMENTS OF INCOME(In thousands, except per share data)
2006
2005
2004See accompanying Notes to Consolidated Financial Statements.76ADOBE SYSTEMS INCORPORATEDCONSOLIDATED STATEMENTS OF STOCKHOLDERS’ EQUITY (In thousands)
Paid-In
Other
ComprehensiveSee accompanying Notes to Consolidated Financial Statements.77ADOBE SYSTEMS INCORPORATEDCONSOLIDATED STATEMENTS OF CASH FLOWS(In thousands)
2006
2005
2004See accompanying Notes to Consolidated Financial Statements.78per share data)2007, options to purchase approximately 27.0 million, 16.5 million and 10.4 million shares, respectively, of common stock with exercise prices greater than the annual average fair market value of our stock of $27.30, $37.07 and $41.77, respectively, were not included in the calculation because the effect would have been anti-dilutive.Note 1. Significant Accounting PoliciesOperationsFounded in 1982, Adobe Systems Incorporated offers a linecreative, businessour facilities and mobile software and services used by high-end consumers, creative professionals, designers, knowledge workers, OEM partners, developers and enterprises for creating, managing, delivering and engaging with compelling content and experiences across multiplesome of our equipment under non-cancellable operating systems, devices and media. We distribute our productslease arrangements that expire at various dates through a network of distributors and dealers, VARs, systems integrators, ISVs and OEMs; direct to end users; and through our own Web site at www.adobe.com.2028. We also licensehave one land lease that expires in 2091. Rent expense includes base contractual rent and variable costs such as building expenses, utilities, taxes, insurance and equipment rental. Rent expense and sublease income for these leases for fiscal 2007 through fiscal 2009 were as follows (in thousands): 2009 2008 2007 Rent expense $ 93,921 $ 101,202 $ 90,553 Less: sublease income 5,563 11,421 9,406 Net rent expense $ 88,358 $ 89,781 $ 81,147 technologycorporate headquarters are located. We reference these office buildings as the Almaden Tower and the East and West Towers.major hardware manufacturers, software developers and service providers andextend for an additional five years solely at our election. In June 2009, we offer integrated software solutionssubmitted notice to businesses of all sizes. We have operationsthe lessor that we intended to exercise our option to renew this agreement for an additional five years effective August 2009. As stated in the Americas, EMEAoriginal lease agreement, in conjunction with the lease renewal, we were required to obtain a standby letter of credit for approximately $16.5 million which enabled us to secure a lower interest rate and Asia. Our software runs on Microsoft Windows, Apple Macintosh, Linux, UNIX and various non-personal computer platforms, depending onreduce the product.Basisnumber of PresentationThe accompanying consolidated financial statements include those of Adobe and our subsidiaries, after elimination of all intercompany accounts and transactions. Adobe has prepared the accompanying consolidated financial statements in conformity with accounting principles generally acceptedcovenants. As defined in the United Stateslease agreement, the standby letter of America.Usecredit primarily represents the lease investment balance equity which is callable in the event of Estimatesdefault. In March 2007, the Almaden Tower lease was extended for five years, with a renewal option for an additional five years solely at our election. As part of the lease extensions, we purchased the lease receivable from the lessor of the East and West Towers for $126.8 million and a portion of the lease receivable from the lessor of the Almaden Tower for $80.4 million, both of which are recorded as investments in lease receivables on our Consolidated Balance Sheets. This purchase may be credited against the residual value guarantee if we purchase the properties or will be repaid from the sale proceeds if the properties are sold to third parties. Under the agreement for the East and West Towers and the agreement for the Almaden Tower, we have the option to purchase the buildings at anytime during the lease term for approximately $143.2 million and $103.6 million, respectively. The residual value guarantees under the East and West Towers and the Almaden Tower obligations are $126.8 million and $89.4 million, respectively.preparationcase of financial statementsa default, the lessor may demand we purchase the buildings for an amount equal to the lease balance, or require that we remarket or relinquish the buildings. Both leases qualify for operating lease accounting treatment and, as such, the buildings and the related obligations are not included on our consolidated balance sheet. We utilized this type of financing in conformity with accounting principles generally accepted in the United States of America, we must make estimates and assumptions that affect the reported amounts of assets and liabilities and disclosure of contingent assets and liabilities,order to access bank-provided funding at the datemost favorable rates and to provide the lowest total cost of occupancy for the headquarter buildings. At the end of the lease term, we can extend the lease for an additional five year term, purchase the buildings for the lease balance, sheet,remarket or relinquish the buildings. If we choose to remarket or are required to do so upon relinquishing the buildings, we are bound to arrange the sale of the buildings to an unrelated party and reported amountswill be required to pay the lessor any shortfall between the net remarketing proceeds and the lease balance, up to the residual value guarantee amount.revenuesthe next five years and expenses during the reporting period. Actual results could differ from those estimates.Fiscal Year $ 53,244 $ 3,970 41,328 3,323 33,391 2,008 24,780 404 19,964 — 76,548 — $ 249,255 $ 9,705 Fiscal YearOur fiscal year is a 52/53-week year ending on the Friday closestThe table above includes commitments related to November 30.Stock DividendOn March 16, 2005, our Board of Directors approved a two-for-one stock split, in the formrestructured facilities. See Note 11 for information regarding our restructuring charges.stock dividend, ofresidual value guarantee in lease agreements entered into after December 31, 2002, must be recognized as a liability on our common stock payable on May 23, 2005 to stockholders of record as of May 2, 2005. ShareConsolidated Balance Sheets. As such, we recognized $5.2 million and per share data, for all periods presented, have been adjusted to give effect to this stock split.ReclassificationCertain amounts$3.0 million in fiscal 2005 and 2004 as reported in the Consolidated Statements of Cash Flows have been revised. Specifically in fiscal 2005, approximately $9.6 million of prepaid expensesliabilities, related to the Macromedia acquisitionextended East and $18.4 million of expense relatedWest Towers and Almaden Tower leases, respectively. These liabilities are recorded in other long-term liabilities with the offsetting entry recorded as prepaid rent in other assets. The balance will be amortized to the amortization of premium on available for sale securities have been reclassified from Net Cash Provided by Operating Activities to Net Cash Provided By (Used For) Investing Activities. In fiscal 2004, $21.0 million of expense related to the amortization of premium on available for sale securities has been reclassified from Net Cash Provided By Operating Activities to Net Cash Provided By (Used For) Investing Activities.Cash Equivalents and Short-term InvestmentsCash equivalents consist of instruments with remaining maturities of three months or less at the time of purchase.We classify all of our cash equivalents and short-term investments that are free of trading restrictions or become free of trading restrictions within one year as “available-for-sale.” We carry these investments at fair value, based on quoted market prices. Unrealized gains and losses, net of taxes, are included in accumulated other comprehensive income (loss), which is reflected as a separate component of stockholders’ equity. Gains are recognized when realized in our consolidated statements of income. Losses are recognized as realized or when we have determined that an other-than-temporary decline in fair value has occurred.It is our policy to review our marketable equity securities classified as short-term investments on a regular basis to evaluate whether or not any security has experienced an other-than-temporary decline in fair value. Our policy includes, but is not limited to, reviewing the cash position, earnings/revenue outlook, stock price performancestatement over the past six months, liquidity and management/ownership of each company we invest in. If we believe that an other-than-temporary decline exists in one of our marketable equity securities, it is our policy to write down these equity investments to the market value and record the related write-down as an investment loss on our consolidated statements of income.Allowance for doubtful accountsWe also maintain an allowance for doubtful accounts to reserve for potentially uncollectible trade receivables. We review our trade receivable by aging category to identify significant customers with known disputes or collection issues. For accounts not specifically identified, we provide reserves based on the agelife of the receivable. In determiningleases. As of November 27, 2009 and November 28, 2008, the reserve, we make judgments about the credit-worthinessunamortized portion of significant customers based on ongoing credit evaluations. We also consider our historical level of credit losses and current economic trends that might impact the level of future credit losses.
Balance
Acquisition
(Credited) to
Operating
Expenses
Balance(*) Deductions related to the allowance for doubtful accounts represent amounts written off against the allowance, less recoveries.Foreign Currency TranslationWe translate assets and liabilities of foreign subsidiaries, whose functional currency is the local currency, at exchange rates in effect at the balance sheet date. We translate revenues and expenses at the monthly average rates of exchange prevailing during the year. We include the adjustment resulting from translating the financial statements of such foreign subsidiaries in accumulated other comprehensive income (loss), which is reflected as a separate component of stockholders’ equity.Property and EquipmentWe record property and equipment at cost. Depreciation and amortization are calculated using the straight-line method over the shorter of the estimated useful lives (thirty-five years for buildings; two to seven years for furniture and equipment) or shorter of lease terms or estimated useful lives (five to ten years for leasehold improvements) of the respective assets. Additionally, it is our policy to capitalize certain costs for internal-use software incurred during the application development stage, in accordance with Statement of Position 98-1, “Accounting for the Costs of Computer Software Developed or Obtained for Internal Use.” Amortization begins once the software is ready for its intended use.Goodwill and Purchased and Other IntangiblesIn accordance with Statement of Financial Accounting Standards No. 142 (“SFAS 142”), “Goodwill and Other Intangible Assets,” we review our goodwill for impairment annually, or more frequently, if facts and circumstances warrant a review. The provisions of SFAS 142 require that a two-step test be performed to assess goodwill for impairment. First, the fair value of the reportingresidual value guarantees, for both leases, remaining in other long-term liabilities and prepaid rent was $1.3 million and $2.6 million, respectively.comparedor was serving, at our request in such capacity. The indemnification period covers all pertinent events and occurrences during the officer’s or director’s lifetime. The maximum potential amount of future payments we could be required to its carrying value. Ifmake under these indemnification agreements is unlimited; however, we have director and officer insurance coverage that reduces our exposure and enables us to recover a portion of any future amounts paid. We believe the fair value exceeds the carrying value, goodwill is not impaired and no further testing is performed. The second step is performed if the carrying value exceeds the fair value. The impliedestimated fair value of the reporting unit’s goodwill must be determined and compared to the carrying value of the goodwill. If the carrying value of a reporting unit’s goodwill exceeds its implied fair value, an impairment loss equal to the difference will be recorded. In determining the fair value of our reporting units, we relied upon the Income Approach and the Market Approach. Under the Income Approach, the fair value of a business is based on the cash flows it can be expected to generate over its remaining life. The estimated cash flows are converted to their present value equivalent using an appropriate rate of return. The Market Approach utilizes a market comparable method whereby similar publicly traded companies are valued using Market Value of Invested Capital (“MVIC”) multiples (i.e., MVIC to revenue, MVIC to earnings before interest and taxes, MVIC to cash flow, etc.) and then these MVIC multiples are applied to a company’s operating results to arrive at an estimate of value.We completed our annual goodwill impairment test during the second quarter of fiscal 2006 and determined that the carrying amount of goodwill was not impaired.SFAS 142 also requires that intangible assets with definite lives be amortized over their estimated useful life and reviewed for impairment whenever an impairment indicator exists. We continually monitor events and changesindemnification agreements in circumstances that could indicate carrying amounts of our intangible assets may not be recoverable. When such events or changes in circumstances occur, we assess the recoverability of intangible assets by determining whether the carrying value of such assets will be recovered through the undiscounted expected future cash flows. If the future undiscounted cash flows are less than the carrying amount of the intangible assets, we recognize an impairment loss based on the excess of the carrying amount over the fair value of the assets. We did not recognize intangible asset impairment charges in fiscal 2006, 2005 or 2004.We are currently amortizing acquired intangible assets with definite lives. Purchased technologyapplicable insurance coverage is amortized over its useful life, which is generally three years and other intangibles assets are amortized over estimated useful lives ranging from 1 to 13 years. Generally, amortization is based on the pattern in which the economic benefits of the intangible asset will be consumed. The amortization expense is related to acquired technology and contracts is classified as cost of product revenue in our consolidated statements of income. Amortization expense related to all other intangible assets is classified in operating expense.Software Development CostsCapitalization of software development costs for software to be sold, leased, or otherwise marketed begins upon the establishment of technological feasibility, which is generally the completion of a workingprototype that has been certified as having no critical bugs and is a release candidate or when alternative future use exists. To date, software development costs incurred between completion of a working prototype and general availability of the related product have not been material and have not been capitalized.Other AssetsOther assets include long-term investments, security deposits and a land deposit. Other assets also include the fair value, at inception, of the residual value guarantee associated with our lease on two buildings we occupy as headquarters, in accordance with FASB Interpretation No. 45 (“FIN 45”), “Guarantor’s Accounting and Disclosure Requirements for Guarantees, Including Indirect Guarantees of Indebtedness of Others.” Our long-term investments include investments in privately held companies that we make either directly or indirectly through venture capital limited partnerships. We own limited partnership interests in three venture capital limited partnerships—Adobe Ventures, L.P., Adobe Ventures III, L.P. and Adobe Ventures IV, L.P. (collectively “Adobe Ventures”)—that invest in early stage companies with innovative technologies. The partnerships are managed bywe have provided a general indemnification to Granite Ventures, an independent venture capital firm and sole general partner of Adobe Ventures.investmentsplaintiff alleges that the members of Omniture’s board of directors breached their fiduciary duties to Omniture’s stockholders by failing to seek the highest possible price for Omniture and that Adobe induced or aided and abetted in the alleged breach of such fiduciary duties. Also on September 23, 2009, Christopher R. Barrell filed a substantially similar lawsuit to the Miner Lawsuit in the United States Fourth Judicial District Court for Utah County, Provo Department, State of Utah, captioned Barrell v. Omniture, Inc. et. al., Case No. 090403560 (the “Barrell Lawsuit”). The Barrell Lawsuit names the same defendants as the Miner Lawsuit, and also names Snowbird Acquisition Corporation as an additional defendant. Subsequently, on September 24, 2009, the plaintiff in the Barrell Lawsuit filed an amended complaint, which added allegations that the Schedule 14D-9 Solicitation/Recommendation Statement filed by Omniture on September 24, 2009 contained inadequate disclosures and was materially misleading. On September 25, 2009, the Omniture Defendants filed a motion requesting that the court consolidate the Barrell Lawsuit, Miner Lawsuit and a substantially similar lawsuit captioned Lodhia v. Omniture, Inc. et al., Case No. 090403499 (the “Lodhia Lawsuit”) in which the Omniture Defendants, but not Adobe, Ventureswere named. Additionally, on September 30, 2009, the plaintiff in the Lodhia Lawsuit filed a response to defendants’ motion to consolidate, agreeing consolidation is appropriate, and also filed a motion seeking appointment as lead plaintiff in the consolidated action. Omniture moved for an order consolidating all three lawsuits. The plaintiffs in the three lawsuits filed a joint motion seeking preliminary injunction barring the consummation of the proposed acquisition and requiring additional disclosures by Omniture in its Schedule 14D-9. At a hearing on October 20, 2009, the court granted Omniture’s motion to consolidate the three cases and denied the plaintiffs’ motion for a preliminary injunction. On December 30, 2009, the plaintiffs served the defendants with a consolidated amended complaint. Adobe intends to defend the lawsuits vigorously. As of November 27, 2009, no amounts have been accrued as a loss is not probable.in accordance with FASB Interpretation No. 46R (“FIN 46R”) a revisionfinancial position, cash flows or results of operations could be negatively affected by an unfavorable resolution of one or more of such proceedings, claims or investigations.FASB Interpretation No. 46 (“FIN 46”our Credit Agreement dated February 2007 (the “Amendment”), “Consolidationwhich increased the total senior unsecured revolving facility from $500.0 million to $1.0 billion. The Amendment also permits us to request one-year extensions effective on each anniversary of Variable Interest Entities.” Adobe Ventures carry their investmentsthe closing date of the original agreement, subject to the majority consent of the lenders. We also retain an option to request an additional $500.0 million in equity securitiescommitments, for a maximum aggregate facility of $1.5 billion.estimated fair market valuethis date if no additional extensions have been requested and unrealized gainsgranted. All other terms and lossesconditions remain the same.investment gain (loss)long-term liabilities on our consolidated statements of income.Consolidated Balance Sheets. The stock of a number of technology investments held by Adobe Ventures at December 1, 2006 and December 2, 2005 is not publicly traded and, therefore, there is no established market for these securities. In order to determine the fair market value of these investments, we use the most recent round of financing involving new non-strategic investors or estimates of current market value made by Granite Ventures. It is our policy to review the fair value of these investments held by Adobe Ventures, as well as our direct investments, on a regular basis to evaluate the carrying value of the investmentsoutstanding liability approximates fair value. As of November 27, 2009, we were in these companies. This evaluation includes, but is not limited to, reviewing each company’s cash position, financing needs, earnings/revenue outlook, operational performance, management/ownership changes and competition. In the case of privately held companies, this evaluation is based on information that we request from these companies. This information is not subject to the same disclosure regulations as U.S. publicly traded companies and as such, the basis for these evaluations is subject to the timing and the accuracycompliance with all of the data received from these companies. Ifcovenants. 2009 2008 2007 Interest and other income, net: $ 34,978 $ 57,588 $ 92,794 (13,420 ) (17,494 ) (9,264 ) 8,753 3,161 934 (1 ) (1,501 ) (3,510 ) 1,070 2,093 1,770 $ 31,380 $ 43,847 $ 82,724 $ (3,407 ) $ (10,019 ) $ (253 ) Investment gains (losses), net: $ 52 $ 18,398 $ 9,308 7,950 7,803 5,265 (9,019 ) (1,417 ) (2,236 ) (15,949 ) (8,375 ) (5,203 ) $ (16,966 ) $ 16,409 $ 7,134 $ 11,007 $ 50,237 $ 89,605 (*) During fiscal 2009, we recorded $3.0 million in unrealized holding gains and losses associated with our deferred compensation plan assets (classified as trading securities). believehad the carrying valuefollowing reportable segments: Creative Solutions, Knowledge Worker, Enterprise, Platform and Print and Publishing. Coinciding with the integration of a company is in excess of fair value, it is our policy to write-down the investments to reduce its carrying value to fair value.Revenue RecognitionOur revenue is derived from the licensing of software products, consulting, and maintenance and support. We recognize revenue when persuasive evidence of an arrangement exists, we have delivered the product or performed the service, the fee is fixed or determinable and collection is probable.Product revenueWe recognize our product revenue upon shipment, provided collection is determined to be probable and no significant obligations remain. Our desktop application products revenue from distributors is subject to agreements allowing limited rights of return, rebates and price protection. Our direct sales and OEM sales are also subject to limited rights of return. Accordingly we reduce revenue recognized for estimated future returns, price protection and rebates at the time the related revenue is recorded. The estimates for returns are adjusted periodically based upon historical rates of returns, inventory levelsOmniture in the distribution channel and other related factors.We record the estimated costs of providing free technical phone support to customers for our software products.We record OEM licensing revenue, primarily royalties, when OEM partners ship products incorporating Adobe software, provided collection of such revenue is deemed probable. For certain OEM customers, we must estimate royalty revenue due to the timing of securing customer information.Our product-related deferred revenue includes maintenance upgrade revenue and customer advances under OEM license agreements. Our maintenance upgrade revenue for our desktop application products is included in our product revenue line item as the maintenance primarily entitles customers to receive product upgrades. In cases where we provide a specified free upgrade to an existing product, we defer the fair value for the specified upgrade right until the future obligation is fulfilled or when the right to the specified free upgrade expires.Services and support revenueOur services and support revenue is composed of consulting, training, and maintenance and support, primarily related to the licensing of our Enterprise and Developer Solutions and Mobile and Device Solutions products. Our support revenue also includes technical support and developer support to partners and developer organizations related to our desktop products.Our consulting revenue is recognized using the proportionate performance method and is measured monthly based on input measures, such as on hours incurred to date compared to total estimated hours to complete, with consideration given to output measures, such as contract milestones when applicable. Our maintenance and support offerings, which entitle customers to receive product upgrades and enhancements or technical support, depending on the offering, are recognized ratably over the term of the arrangement.Multiple element arrangementsWe enter into revenue arrangements in which a customer may purchase a combination of software, upgrades, maintenance and support, and consulting (multiple-element arrangements). When vendor-specific objective evidence (“VSOE”) of fair value exists for all elements, we allocate revenue to each element based on the relative fair value of each of the elements. VSOE of fair value is established by the price charged when that element is sold separately. For maintenance and support, VSOE of fair value is established by renewal rates. For arrangements where VSOE of fair value exists only for the undelivered elements, we defer the full fair value of the undelivered elements and recognize the difference between the total arrangement fee and the amount deferred for the undelivered items as revenue, assuming all other criteria for revenue recognition have been met.Advertising ExpensesWe expense all advertising costs as incurred and classify these costs under sales and marketing expense. Advertising expenses for fiscal 2006, 2005 and 2004 were $27.8 million, $39.0 million, and $31.9 million, respectively.Stock-based CompensationDuring the firstfourth quarter of fiscal 2006,2009, we adopted the provisionscreated a new reportable segment for financial reporting purposes. Our Creative Solutions segment focuses on delivering a complete professional line of integrated tools for a full range of creative and account for stock-based compensation in accordance with, the Financial Accounting Standards Board’s (“FASB”) Statementdeveloper tasks to an extended set of Financial Accounting Standards No. 123—revised 2004 (“SFAS 123R”), “Share-Based Payment” which replaced Statement of Financial Accounting Standards No. 123 (“SFAS 123”), “Accounting for Stock-Based Compensation” and supersedes APB Opinion No. 25 (“APB 25”), “Accounting for Stock Issued toEmployees.” Under the fair value recognition provisions of this statement, stock-based compensation cost is measured at the grant date basedcustomers. The Knowledge Worker segment focuses on the fair valueneeds of the awardknowledge worker customers, providing essential applications and is recognizedservices to help them share information and collaborate. This segment contains revenue generated by Acrobat Connect and our Acrobat family of products. Our Enterprise segment provides server-based enterprise interaction solutions that automate people-centric processes and contains revenue generated by our LiveCycle line of products. The Platform segment includes client and developer technologies, such as expense on a straight-line basis over the requisite service period, which is the vesting period. We elected the modified-prospective method, under which prior periods are not revised for comparative purposes.Adobe Flash Player, Adobe Flash Lite, Adobe AIR, Adobe Flex and Adobe Flash Builder, and also encompasses products and technologies created and managed in other Adobe segments. The valuation provisions of SFAS 123R apply to new grantsPrint and to grants that were outstanding prior to the effective date and are subsequently modified. Estimated compensation for grants that were outstanding as of the effective date will be recognized over the remaining service period using the compensation cost estimated for the SFAS 123 pro forma disclosures.The adoption of SFAS 123R had and will have a material impact on our consolidated financial position and results of operations. See Note 11 for further information regarding our stock-based compensation assumptions and expenses, including pro forma disclosures for prior periods as if we had recorded stock-based compensation expense.Upon exercise of stock options or vesting of restricted stock and performance shares, we will issue treasury stock. If treasury stock is not available, common stock will be issued. In order to minimize the impact of on-going dilution from exercises of stock options and vesting of restricted stock and performance shares, we instituted a stock repurchase program. See Note 12 for information regarding our stock repurchase program.Foreign Currency and Other Hedging InstrumentsWe transact business in foreign countries, in U.S. dollars and in various foreign currencies. In Europe and Japan, transactions that are denominated in euro and yen subject us to exposure from movements in foreign currency exchange rates. We hedge our net recognized foreign currency assets and liabilities with foreign exchange forward contracts to reduce the risk that our earnings and cash flows will be adversely affected by changes in foreign currency exchange rates. We use foreign exchange option and forward contracts to reduce our exposure to foreign currency rate changes on non-functional currency denominated forecasted product licensing revenue, primarily yen-denominated and euro-denominated revenue.Adobe accounts for its derivative instruments as either assets or liabilities on the balance sheet and measures them at fair value. Derivatives that are not defined as hedges in Statement of Financial Accounting Standards No. 133 (“SFAS 133”), “Accounting for Derivative Instruments and Hedging Activities,” must be adjusted to fair value through earnings. As described in Note 16, gains and losses resulting from changes in fair value are accounted for depending on the use of the derivative and whether it is designated and qualifies for hedge accounting.Gains and lossesPublishing segment addresses market opportunities ranging from the foreign exchange forward contracts hedging certain balance sheet positions, primarily non-functional currency denominated assets, such as trade receivables,diverse publishing needs of technical and liabilities, such as accounts payable, are recorded each period in other income (expense) in the consolidated statements of operations. Foreign exchange forward contracts hedging forecasted non-functional currency denominated forecasted product licensing revenue, are designated as cash flow hedges under SFAS 133, with gainsbusiness publishing, to our legacy type and losses recorded net of tax, as a component of other comprehensive income in stockholders’ equityOEM printing businesses. Finally, our Omniture segment provides web analytics and reclassified into revenue at the time the forecasted transactions occur.Income TaxesWe use the assetonline business optimization products and liability method of accounting for income taxes. Under this method, income tax expense is recognized for the amount of taxes payable or refundable for the current year. In addition, deferred tax assetsservices to manage and liabilities are recognized for expected future tax consequences of temporary differences between the financial reportingenhance online, offline and tax bases of assets and liabilities, and for operating losses and tax credit carryforwards. We record a valuation allowance to reduce deferred tax assets to an amount for which realization is more likely than not.84Recent Accounting PronouncementsIn September 2006, the FASB issued Statement of Financial Accounting Standards No. 157 (“SFAS 157”), “Fair Value Measurements,” which defines fair value, establishes guidelines for measuring fair value and expands disclosures regarding fair value measurements. SFAS 157 does not require any new fair value measurements but rather eliminates inconsistencies in guidance found in various prior accounting pronouncements. SFAS 157 is effective for fiscal years beginning after November 15, 2007. Earlier adoption is permitted, provided the company has not yet issued financial statements, including for interim periods, for that fiscal year. We are currently evaluating the impact of SFAS 157, but do not expect the adoption of SFAS 157 to have a material impact on our consolidated financial position, results of operations or cash flows.In September 2006, the FASB issued SFAS No. 158, “Employers’ Accounting for Defined Benefit Pension and Other Postretirement Plans—An Amendment of FASB No. 87, 88, 106 and 132(R)” (“SFAS 158”). SFAS 158 requires that the funded status of defined benefit postretirement plans be recognized on the company’s balance sheet, and changes in the funded status be reflected in comprehensive income, effective fiscal years ending after December 15, 2006. The standard also requires companies to measure the funded status of the plan as of the date of its fiscal year-end, effective for fiscal years ending after December 15, 2008. We do not expect the adoption of SFAS 158 to have a material impact on our consolidated financial position, results of operations or cash flows.In July 2006, the FASB issued Financial Interpretation No. 48, “Accounting for Uncertainty in Income Taxes—an interpretation of FASB Statement No. 109” (“FIN 48”), which is a change in accounting for income taxes. FIN 48 specifies how tax benefits for uncertain tax positions are to be recognized, measured, and derecognized in financial statements; requires certain disclosures of uncertain tax matters; specifies how reserves for uncertain tax positions should be classified on the balance sheet; and provides transition and interim period guidance, among other provisions. FIN 48 is effective for fiscal years beginning after December 15, 2006 and as a result, is effective for AdobeEffective in the first quarter of fiscal 2008. We are currently evaluating the impact of FIN 48 on2009, our consolidated financial position, results of operations,former Mobile and cash flows.In February 2006, the FASB issued Statement of Financial Accounting Standards No. 155 (“SFAS 155”), “Accounting for Certain Hybrid Financial Instruments” which amends Statement of Financial Accounting Standards No. 133 (“SFAS 133”), “Accounting for Derivative InstrumentsDevices Solutions segment, was integrated into our Platform business unit to better align our engineering and Hedging Activities”marketing efforts and Statement of Financial Accounting Standards No. 140 (“SFAS 140”), “Accounting for Transfers and Servicing of Financial Assets and Extinguishments of Liabilities.” SFAS 155 simplifies the accounting for certain derivatives embedded in other financial instruments by allowing them to be accounted foris now reported as a whole if the holder elects to account for the whole instrument on a fair value basis. SFAS 155 also clarifies and amends certain other provisions of SFAS 133 and SFAS 140. SFAS 155 is effective for all financial instruments acquired, issued or subject to a re-measurement event occurring in fiscal years beginning after September 15, 2006. Earlier adoption is permitted, provided the company has not yet issued financial statements, including for interim periods, for that fiscal year. We will adopt SFAS 155 in the first quarter of fiscal 2007. We do not expect the adoption of SFAS 155 to have a material impact on our consolidated financial position, results of operations or cash flows.In September 2006, the SEC (“SEC”) issued SAB No. 108 “Considering the Effects of Prior Year Misstatements When Quantifying Misstatements in Current Year Financial Statements”, which provides interpretive guidance on how registrants should quantify financial statement misstatements. Under SAB 108 registrants are required to consider both a “rollover” method which focuses primarily on the income statement impact of misstatements and the “iron curtain” method which focuses primarily on the balance sheet impact of misstatements. The transition provisions of SAB 108 permit a registrant to adjust retainedearnings for the cumulative effect of immaterial errors relating to prior years. We were required to adopt SAB 108 in our current fiscal year.In the second quarter of fiscal 2006, the Company concluded a voluntary review of its executive officer grants from 1997 to 2006 and uncovered no improper grants to executive officers. In the fourth quarter of fiscal 2006, we concluded a second voluntary review, focused principally on grants to non-executive employees from 1997 to 2006. Preliminary results of this internal review suggested that certain annual grants may have had improper grant dates. The Board of Directors formed a Special Committee of outside Directors to undertake a broader review of these annual non-executive employee option grants. The Special Committee enlisted the assistance of independent legal counsel and an independent accounting firm. The Special Committee uncovered no fraud or intentional wrongdoing. The Special Committee did find certain instances relating to grants made to employees where the list of employees and/or shares allocated to them was not sufficiently definitive for the grant to be deemed final aspart of the reported grant date. In other instances, the Special Committee found that adjustments were made to some employee grants after the grant date without a corresponding change to the measurement date. These errors resulted in an understatement of stock-based compensation in 1998 through 2005.Historically, we have evaluated uncorrected differences utilizing the rollover approach. We believe the impact of these stock-based compensation errors were immaterial to prior fiscal years under the rollover method. However, under SAB 108, which we were required to adopt for thePlatform segment. Prior year ended December 1, 2006, we must assess materiality using both the rollover method and the iron-curtain method. Under the iron-curtain method, the cumulative stock option errors are material to our fiscal 2006 financial statements and, therefore, we have recorded an adjustment to our opening fiscal 2006 retained earnings balance in the amount of $26.6 million in accordance with the implementation guidance in SAB 108. The total cumulative impact is as follows:The impact on retained earnings is comprised of the following amounts:Note 2. AcquisitionsOn December 3, 2005, we completed the acquisition of Macromedia, a provider of software technologies that enable the development of a wide range of internet and mobile application solutions, for approximately $3.5 billion. Acquiring Macromedia accelerates our strategy of delivering an industry-defining technology platform that provides more powerful solutions for engaging people with digital information. The transaction was accounted for using the purchase method of accounting in accordance with Statement of Financial Accounting Standards No. 141 (“SFAS 141”), “Business Combinations.” The results of operations of Macromedia have been included in the Consolidated Statements of Income beginning on December 3, 2005.Assets acquired and liabilities assumed were recorded at their fair values as of December 3, 2005. The total $3.5 billion purchase price is comprised of the following:As a result of the acquisition, we issued approximately 109.0 million shares of Adobe common stock based on an exchange ratio of 1.38 shares of Adobe common stock for each outstanding share of Macromedia common stock as of December 3, 2005. This fixed exchange ratio gives effect to the two-for-one stock split in the form of a stock dividend paid on May 23, 2005 to the stockholders of Adobe. The average market price per share of Adobe common stock of $29.43 used to determine the fair value the stock issued was based on the average of the closing prices for a range of trading days (April 14, 2005 through April 20, 2005) around the announcement date (April 18, 2005) of the proposed transaction.Under the terms of the merger agreement, each Macromedia stock option that was outstanding and unexercised was converted into an option to purchase Adobe common stock and we assumed that stock option in accordance with the terms of the applicable Macromedia stock option plan and terms of the stock option agreement relating to that Macromedia stock option. Based on Macromedia’s stock options outstanding at December 3, 2005, we converted options to purchase approximately 11.0 million shares of Macromedia common stock into options to purchase approximately 15.1 million shares of Adobe common stock. The fair value of options assumed of $227.6 million was determined using the Black Scholes valuation model. The stock price used in the valuation was $29.43, which was the average of closing prices for a range of trading days (April 14, 2005 through April 20, 2005) around the announcement date (April 18, 2005) of the proposed transaction. The risk-free interest rate used in the valuation was the zero-coupon yield implied from U.S. Treasury securities with equivalent remaining terms. We do not anticipate paying any cash dividends in the foreseeable future and therefore an expected dividend yield of zero was used in the valuation. For fully vested options, the expected term used was one year. We estimated the expected term of unvested options by taking the average of the vesting term remaining and the contractual term of the option, as illustrated in the Securities and Exchange Commission’s Staff Accounting Bulletin No. 107 (“SAB 107”). The implied volatility of Adobe traded stock options was used for volatility.Direct transaction costs of $29.1 million include investment banking, legal and accounting fees, and other external costs directly related to the acquisition. As of December 1, 2006, substantially all costs for accounting, legal, and other professional services have been paid.Restructuring costs of $72.7 million relate primarily to costs for severance, associated benefits, outplacement services, and excess facilities. See Note 9 for further details of the amounts accrued and payments made during 2006.Purchase Price AllocationIn accordance with SFAS No. 141the total preliminary purchase price was allocated to Macromedia’s net tangible and intangible assets based upon their estimated fair values as of December 3, 2005. The excess purchase price over the value of the net tangible and identifiable intangible assets was recorded as goodwill. The fair values assigned to tangible and intangible assets acquired and liabilities assumed are based on estimates and assumptions of management. During the fourth quarter of fiscal 2006, we revised our estimate of certain costs associated with our acquisition of Macromedia, resulting in a decrease to goodwill of approximately $0.2 million. The adjustment primarily reflected costs related to closing redundant facilities.The following represents the allocation of the purchase price to the acquired net assets of Macromedia and the associated estimated useful lives:
Useful Life† Estimated weighted-average remaining vesting period.Net tangible assets—Macromedia’s tangible assets and liabilities as of December 3, 2005 were reviewed and adjusted to their fair value as necessary, including an increase to market value of $18.4 million related to owned land and a building, $11.5 million related to an investment, and $21.5 million for receivables related to future payments from existing customers. We also assumed $488.4 million in cash and cash equivalents, $109.8 million in property, plant, and equipment, $103.2 million in accrued expenses, and $186.9 million in deferred tax liabilities.Deferred revenues—Macromedia’s deferred revenue was derived from licenses, maintenance and support, hosting, and consulting contracts. We estimated our obligation related to the deferred revenue using the cost build-up approach. The cost build-up approach determines fair value by estimating the costs relating to fulfilling the obligation plus a normal profit margin. The sum of the costs and operating profit approximates, in theory, the amount that we would be required to pay a third party to assume the support obligation. The estimated costs to fulfill the support obligation were based on the historical direct costs related to providing the support. As a result, we recorded an adjustment to reduce Macromedia’s carrying value of deferred revenue by $49.1 million to $14.9 million, which represents our estimate of the fair value of the contractual obligations assumed.Identifiable intangible assets—Acquired product rights include developed and core technology and patents. Developed technology relates to Macromedia products across all of their product lines that have reached technological feasibility. Core technology and patents represent a combination of Macromedia’s processes, patents and trade secrets developed through years of experience in design and development of its products. We will amortize the fair value of the acquired product rights based on the pattern in which the economic benefits of the intangible asset will be consumed.Customer contracts and relationships represent existing contracts and the underlying customer relationships. We will amortize the fair value of these assets based on the pattern in which the economic benefits of the intangible asset will be consumed.Trademarks primarily relate to the Flash trade name and other product names, which will be amortized based on the pattern in which the economic benefits of the intangible asset will be consumed.In-process research and development—As of the acquisition date, no amounts were allocated to in-process research and development. In-process research and development is dependent on the status of new projects on the date the acquisition is consummated. Prior to the acquisition date, Macromedia had released new versions of its software products. Accordingly, there were no substantive research and development projects in process on the date the acquisition was consummated.88Goodwill—Approximately $2.0 billion has been allocated to goodwill. Goodwill represents the excess of the purchase price over the fair value of the underlying acquired net tangible and intangible assets. In accordance with SFAS 142, goodwill will not be amortized but instead will be tested for impairment at least annually (more frequently if certain indicators are present). The factors that contributed to the recognition of goodwill included securing buyer-specific synergies that increase revenue and profits and are not otherwise available to a marketplace participant, acquiring a talented workforce, and significant cost savings opportunities.Taxes—As part of our accounting for the Macromedia acquisition, a portion of the overall purchase price was allocated to goodwill and acquired intangible assets. Amortization expense associated with acquired intangible assets is not deductible for tax purposes. Thus, approximately $186.9 million was established as a deferred tax liability for the future amortization of the intangible assets. In accordance with Statement of Financial Accounting Standards No. 109, “Accounting for Income Taxes,” the valuation allowance on Macromedia’s financial statements as of December 3, 2005 was reduced by $237.8 million to $16.1 million, to the extent the deferred tax assets are more likely than not realizable.Any impairment charges made in the future associated with goodwill will not be tax deductible and will result in an increased effective income tax rate in the quarter the impairment is recorded.Deferred stock-based compensation—Deferred stock-based compensation represents the estimated fair value, measured as of December 3, 2005, of unvested Macromedia stock options and restricted stock assumed. The fair value of unvested options assumed was $117.3 million using the Black Scholes valuation model. The stock price used in the valuation is $34.97, which was the closing price of Adobe shares on December 2, 2005, the last trading day before the close of the acquisition. The risk-free interest rate was the zero coupon yield on December 2, 2005 implied from U.S. Treasury securities with equivalent remaining terms. We do not anticipate paying any cash dividends in the foreseeable future and therefore used an expected dividend yield of zero. We estimate the expected term by taking the average of the vesting term remaining and the contractual term of the option, as illustrated in SAB 107. The implied volatility of Adobe traded stock options as of December 2, 2005 was used for volatility. The fair value of the unvested restricted stock of $4.8 million was based on the fair value of the underlying shares on the acquisition date.The assumptions used to value unvested Macromedia stock options are as follows:2006Expected term (in years)0.17—6.67Volatility32.9—35.2%Risk free interest rate3.97—4.48%Total deferred stock-based compensation, of $122.1 million, is being amortized to expenses over the remaining vesting periods of the underlying options or restricted stock. See Note 11 for the amortization of deferred stock-based compensation during fiscal 2006.Pro Forma ResultsThe unaudited financial information in the table below summarizeshas been reclassified to reflect the combined resultsintegration of operations of Adobethese business units.Macromedia, on a pro forma basis, as thoughgo-to-market strategies, in fiscal 2010 we plan to move responsibility for the companies had been combined as ofConnect Solutions product line from our Knowledge Worker segment to our Enterprise segment. We will adjust our reportable segments at the beginning of fiscal 2010 to reflect changes for how we manage our business as we enter the period presented.new fiscal year.pro forma financialmanagement approach designates the internal reporting used by management for making decisions and assessing performance as the source of our reportable segments. Enterprise Total Fiscal 2009 $ 1,702,110 $ 622,970 $ 235,498 $ 181,033 $ 177,970 $ 26,272 $ 2,945,853 152,909 40,155 47,991 21,174 18,674 15,829 296,732 $ 1,549,201 $ 582,815 $ 187,507 $ 159,859 $ 159,296 $ 10,443 $ 2,649,121 Gross profit as a percentage of revenue 91 % 94 % 80 % 88 % 90 % 40 % 90 % Fiscal 2008 $ 2,072,835 $ 810,883 $ 252,976 $ 231,558 $ 211,637 $ — $ 3,579,889 160,560 53,282 75,539 44,344 28,905 — 362,630 $ 1,912,275 $ 757,601 $ 177,437 $ 187,214 $ 182,732 $ — $ 3,217,259 Gross profit as a percentage of revenue 92 % 93 % 70 % 81 % 86 % — 90 % Fiscal 2007 $ 1,898,924 $ 728,528 $ 191,317 $ 133,380 $ 205,732 $ — $ 3,157,881 147,161 57,683 68,932 44,087 36,831 — 354,694 $ 1,751,763 $ 670,845 $ 122,385 $ 89,293 $ 168,901 $ — $ 2,803,187 Gross profit as a percentage of revenue 92 % 92 % 64 % 67 % 82 % — 89 % (1) Platform revenue includes revenue related to our Mobile client products of $51.3 million, $113.1 million and $52.5 million for fiscal 2009, 2008 and 2007, respectively, or 28%, 49% and 39% of Platform revenues, respectively. (2) Fiscal 2009 includes the integration of Omniture as a new reportable segment in the fourth quarter. Fiscal 2008 and 2007 do not include the impact of our acquisition of Omniture. Revenue 2009 2008 2007 Americas: United States $ 1,244,631 $ 1,473,319 $ 1,379,028 Other 137,940 159,507 129,776 Total Americas 1,382,571 1,632,826 1,508,804 EMEA 928,857 1,229,161 1,026,455 Asia: Japan 410,055 450,799 407,344 Other 224,370 267,103 215,278 Total Asia 634,425 717,902 622,622 Revenue $ 2,945,853 $ 3,579,889 $ 3,157,881 Property and Equipment 2009 2008 Americas: United States $ 336,303 $ 252,434 Other 5,806 9,154 Total Americas 342,109 261,588 EMEA 23,729 29,887 Asia: India 14,625 15,242 Other 7,669 6,320 Total Asia 22,294 21,562 Property and equipment, net $ 388,132 $ 313,037 2009 2008 2007 15 % 18 % 21 % 8 % 9 % 10 % 2009 2008 16 % 18 % Tech Data 6 % 8 % 2009 (in thousands, except per share data) Quarter Ended February 27 May 29 August 28 November 27 Revenue $ 786,390 $ 704,673 $ 697,507 $ 757,283 Gross profit $ 709,037 $ 632,665 $ 632,460 $ 674,959 Income before income taxes $ 203,162 $ 163,730 $ 174,416 $ 160,212 Net income (loss) $ 156,435 $ 126,071 $ 136,045 $ (32,043 ) Basic net income (loss) per share $ 0.30 $ 0.24 $ 0.26 $ (0.06 ) Diluted net income (loss) per share $ 0.30 $ 0.24 $ 0.26 $ (0.06 ) 2008 (in thousands, except per share data) Quarter Ended February 29 May 30 August 29 November 28 Revenue $ 890,445 $ 886,886 $ 887,257 $ 915,301 Gross profit $ 807,970 $ 804,020 $ 776,406 $ 828,863 Income before income taxes $ 295,644 $ 278,006 $ 228,514 $ 276,344 Net income $ 219,379 $ 214,910 $ 191,608 $ 245,917 Basic net income per share $ 0.39 $ 0.40 $ 0.36 $ 0.47 Diluted net income per share $ 0.38 $ 0.40 $ 0.35 $ 0.46 presented for informational purposes only and is not indicativea 52- or 53-week year. Each of the resultsfiscal quarters presented were comprised of operations that would13 weeks.been achieved ifaudited the acquisition had taken place on December 4, 2004 oraccompanying consolidated balance sheets of results that may occurAdobe Systems Incorporated and subsidiaries as of November 27, 2009 and November 28, 2008, and the related consolidated statements of income, stockholders’ equity and comprehensive income, and cash flows for each of the years in the future. The pro formathree-year period ended November 27, 2009. We have also audited Adobe Systems Incorporated’s internal control over financial informationreporting as of November 27, 2009, based on criteria established in Internal Control – Integrated Framework, issued by the Committee of Sponsoring Organizations of the Treadway Commission (COSO). Adobe System Incorporated’s management is responsible for these consolidated financial statements, for maintaining effective internal control over financial reporting, and for its assessment of the effectiveness of internal control over financial reporting, included in the accompanying Management’s Annual Report on Internal Control over Financial Reporting appearing under Item 9A. Our responsibility is to express an opinion on these consolidated financial statements and an opinion on Adobe Systems Incorporated’s internal control over financial reporting based on our audits.2005 includes2009, and management excluded from its assessment of the following items:The unaudited pro formaeffectiveness of Adobe Systems Incorporated’s internal control over financial information for fiscal 2005 combinesreporting as of November 27, 2009, Omniture, Inc.’s internal control over financial reporting associated with total assets of $195.5 million and total revenues of $26.3 million included in the historical results forconsolidated financial statements of Adobe Systems Incorporated and subsidiaries as of and for the year ended December 2, 2005November 27, 2009. Our audit of internal control over financial reporting of Adobe Systems Incorporated also excluded an evaluation of the internal control over financial reporting of Omniture, Inc.historical results of their operations and their cash flows for Macromedia foreach of the yearyears in the three-year period ended September 30, 2005.November 27, 2009, in conformity with U.S. generally accepted accounting principles. Also in our opinion, Adobe Systems Incorporated maintained, in all material respects, effective internal control over financial reporting as of November 27, 2009, based on criteria established in Internal Control – Integrated Framework, issued by COSO.In additionacquisitionconsolidated financial statements, Adobe Systems Incorporated changed its method of Macromedia, Adobe acquired other companies duringaccounting for uncertainty in income taxes in fiscal 2006 for a total aggregated purchase price of $46.9 million. The impact of these acquisitions are considered immaterial to our financial statements. Refer to Note 5 of the Notes to Consolidated Financial Statements for any impact to Goodwill and Purchased and Other Intangibles due to these acquisitions.During fiscal 2005, we acquired OKYZ S.A., a privately held company, which provided three dimensional technology and expertise to our Intelligent Document platform.During fiscal 2004, we acquired Q-Link Technologies, Inc, a privately-held company, which provided Java-based workflow technology that was integrated with our enterprise server products to enable customers to integrate document process management with core applications.Note 3. Cash, cash equivalents and short-term investmentsCash, cash equivalents and short-term investments consisted of the following as of December 1, 2006:
Value
Gains
Losses
Fair ValueCash, cash equivalents and short-term investments consisted of the following as of December 2, 2005:
Value
Gains
Losses
Fair Value* The carrying value of marketable equity securities has been reduced by other-than-temporary declines in the fair value of these securities.Interest income for fiscal 2006, 2005, and 2004 was $74.9 million, $42.1 million, and $22.3 million, respectively.In accordance with FASB Staff Position (“FSP”) FAS115-1, “The Meaning of Other-Than-Temporary Impairment and Its Application to Certain Investments,”the following table summarizes the fair value and gross unrealized losses related to available-for-sale securities, aggregated by investment category and length of time that individual securities have been in a continuous unrealized loss position, at December 1, 2006:
Unrealized
Losses
Unrealized
Losses
Unrealized
LossesMarket values were determined for each individual security in the investment portfolio. There were 278 securities in total which had market values less than amortized cost. These securities were comprised primarily of state or municipal bonds.In determining whether the decline in the value of these securities was temporary we considered the following factors:· The length of time and the extent to which the market value has been less than cost;· The financial condition and near-term prospects of the issuer;· Adobe’s intent and ability to retain its investment in the issuer for a period of time sufficient to allow for any anticipated recovery in market value.Our analysis led to the following conclusions:· The magnitude of the unrealized losses is such that they could be reversed with a modest change in interest rates.· The probability that any of the issuers of these securities would be unable to meet its obligations to meet principal or interest payments is negligible.· Based on both the length of time and the extent to which the market value has been less than cost and the financial condition and near-term prospects of the issuer, we concluded that none of the unrealized losses at December 1, 2006 constituted other-than-temporary impairment.See Note 1 for our policy on recording other-than-temporary declines in our marketable equity securities. We recognize realized gains and losses upon sale of investments using the specific identification method. See Note 6 for net realized gains2008 resulting from the saleadoption of our short-term investments and losses related to other-than-temporary declines in the fair value of our marketable equity securities.92The following table summarizes the cost and estimated fair value of current debt securities and money market mutual funds, classified by the stated maturity of the security. A significant proportion of securities classified as “due after three years,” based on the stated maturity, have structural features that allow us to sell the securities, at par, in less than three years.
Fair ValueNote 4. PropertyITEM 9. CHANGES IN AND DISAGREEMENTS WITH ACCOUNTANTS ON ACCOUNTING AND FINANCIAL DISCLOSUREequipment consistedwith the participation of our Chief Executive Officer and Chief Financial Officer, the effectiveness of our disclosure controls and procedures as of November 27, 2009. Based on their evaluation as of November 27, 2009, our Chief Executive Officer and Chief Financial Officer have concluded that our disclosure controls and procedures (as defined in Rules 13a-15(e) and 15d-15(e) under the Securities Exchange Act of 1934, as amended) were effective at the reasonable assurance level to ensure that the information required to be disclosed by us in this Annual Report on Form 10-K was (i) recorded, processed, summarized and reported within the time periods specified in the SEC’s rules and regulations and (ii) accumulated and communicated to our management, including our Chief Executive Officer and Chief Financial Officer, to allow timely decisions regarding required disclosure.followingcontrol system are met. Further, the design of a control system must reflect the fact that there are resource constraints and the benefits of controls must be considered relative to their costs. Because of the inherent limitations in all control systems, no evaluation of controls can provide absolute assurance that all control issues and instances of fraud, if any, within Adobe have been detected.December 1, 2006 and December 2, 2005:The increaseNovember 27, 2009. In making this assessment, our management used the criteria set forth by the Committee of Sponsoring Organizations of the Treadway Commission (“COSO”) in property and equipmentInternal Control-Integrated Framework. Our management has concluded that, as of November 27, 2009, our internal control over financial reporting is effective based on these criteria.fiscal 2006 to fiscal 2005 is primarily due to our acquisition of Macromedia.Depreciation expense for fiscal 2006, 2005 and 2004 was $67.7 million, $43.9which we acquired certain assets on October 23, 2009. At November 27, 2009, Omniture had $ 195.5 million and $39.8$40.4 million respectively.Note 5. Goodwillof total assets and Purchased and Other IntangiblesAsnet assets, respectively. For the year ended November 27, 2009, our Consolidated Statement of December 1, 2006,Income included total revenue associated with Omniture of $26.3 million. In accordance with guidance issued by the goodwill balance relatesSEC, companies are allowed to ourexclude acquisitions from their assessment of Macromedia, Accelio, Q-Link, Syntrillium, OKYZ, GoLive Systems, Inc and GoLive Systems GmbH and Co. KG (together “GoLive”), Serious Magic, Interakt, and Inscriber Technology Corporation.Below is our goodwill reported by business segment, as of December 1, 2006:*All goodwill in our Other segments relates to our platform business..During fiscal 2006, our goodwill increased by $2.2 billion. Of this amount, $2.0 billion is related to our acquisition of Macromedia. Refer to Note 2 for further information. This goodwill was reduced by $26.9 million primarily forinternal controls over financial reporting during the realization of tax benefits for deductions resulting from the exercise of stock options and disqualifying dispositions of vested options assumed and for adjustments made to deferred and current tax balances upon filing the final Macromedia U.S. income tax returns in August 2006. In addition, goodwill also increased by $35.0 million duefirst year subsequent to the acquisition of TTFwhile integrating the acquired operations.the second quarter of fiscal 2006 and Serious Magic and Interaktthis Annual Report on Form 10-K, has issued an attestation report on our internal control over financial reporting, which is included herein.the fourth quarter of fiscal 2006.Purchased and other intangible assets, subject to amortization,Internal Control over Financial Reportingas follows as of December 1, 2006:
AmortizationPurchased and other intangible assets, subject to amortization, were as follows as of December 2, 2005:
Cost
Amortization
NetAmortization expense related to identifiable intangible assets was $221.6 million, $20.4 million, and $21.1 million for fiscal 2006, 2005 and 2004, respectively. Of the total amortization expense for fiscal 2006, $137.5 million was charged to cost of sales. There was no amortization charge to cost of sales for fiscal 2005 and 2004. The increase in amortization expense from fiscal 2005 to fiscal 2006 is primarily due to our acquisition of Macromedia. Amortization expense, as of December 1, 2006, is expected to be as follows:
Technology
AssetsOther assets consisted of the following as of December 1, 2006 and December 2, 2005: Included in investments are our limited partnership interests in Adobe Ventures which are consolidated in accordance with FASB Interpretation No. 46R a revision to FASB Interpretation No. 46, “Consolidation of Variable Interest Entities.” The partnerships are controlled by Granite Ventures, an independent venture capital firm and sole general partner of Adobe Ventures. Investments also include our direct investments which are accounted for under the cost method.The following table summarizes the net realized gains and losses from our investments for fiscal 2006, 2005, and 2004.The increasechanges in our investment gain from fiscal 2005 to fiscal 2006 is due to our sale of our investment in Atom Entertainment, Inc.internal control over financial reporting during the fourth quarter of fiscal 2006. As a result of the sale, we received $82.3 million in cash. Our carrying value was $13.2 million at the date of sale.During fiscal 2004, we restructured the lease for two ofended November 27, 2009 that have materially affected, or are reasonably likely to materially affect our headquarter office buildings. See Note 15 for additional information. The lease agreement provides for a residual value guarantee. In accordance with FIN 45, we recognized the fair value of the residual value guarantee of $5.2 million as a long-term liability on our balance sheet with the offsetting entry to prepaid rent in other assets. The balance will be amortized to the income statementinternal control over five years, the life of the lease. As of December 1, 2006, the unamortized portion of the fair value of the residual value guarantee remaining in prepaid rent was $2.8 million.Note 7. Trade Payables and Accrued ExpensesTrade and other payables consisted of the following as of December 1, 2006 and December 2, 2005:95Accrued expenses consisted of the following as of December 1, 2006 and December 2, 2005:Income before income taxes includes income from foreign operations of approximately $293.7 million, $348.7 million and $298.0 million for fiscal 2006, 2005 and 2004, respectively.The provision for income taxes consisted of the following for fiscal 2006, 2005, and 2004: Certain employee stock plan benefits in 2006 associated with the acquisition of Macromedia reduced goodwill. See Note 5 for further information.Total income tax expense differs from the expected tax expense (computed by multiplying the United States federal statutory rate of 35% by income before income taxes) as a result of the following:During fiscal 2005, the American Jobs Creation Act (“AJCA”) introduced a limited time 85% dividends received deduction on the repatriation of certain foreign earnings to a U.S. taxpayer, providedcertain criteria are met. We made a determination for a planned repatriation of $558.3 million of certain foreign earnings, of which $500.0 million qualifies for the 85% dividends received deduction. We completed the repatriation of $558.3 million of certain foreign earnings during fiscal 2005.The total income tax provision of $162.9 million, for fiscal 2005, includes a tax provision of $43.5 million for the repatriation of certain foreign earnings. Additionally, it includes a reversal of $72.8 million for income taxes on certain foreign earnings for which a deferred tax liability had been previously accrued. As a result, a net income tax benefit of $29.3 million was recognized for the difference between income taxes previously provided on certain foreign earnings at the federal statutory tax rate and income taxes at the lower rate under the repatriation provisions of the AJCA.The tax effects of the temporary differences that give rise to significant portions of the deferred tax assets and liabilities as of December 1, 2006 and December 2, 2005 are presented below:The deferred tax assets and liabilities for fiscal 2006 include amounts related to the acquisition of Macromedia. We provide United States income taxes on the earnings of foreign subsidiaries unless the subsidiaries’ earnings are considered permanently reinvested outside the United States. To the extent that the foreign earnings previously treated as permanently reinvested are repatriated, the related United States tax liability may be reduced by any foreign income taxes paid on these earnings. As of December 1, 2006, the cumulative amount of earnings upon which U.S. income taxes have not been provided is approximately $400.7 million. The unrecognized deferred tax liability for these earnings is approximately $134.5 million. As of December 1, 2006, we have net operating loss carryforwards attributable to various acquired companies of approximately $134 million, which, if not used, will expire between fiscal 2013 and 2019. These net operating loss carryforwards are subject to an annual limitation under Internal Revenue Code Section 382, but are expected to be fully realized.For financial reporting purposes, a valuation allowance has been established for certain deferred tax assets related to the write-down of investments. At the end of fiscal 2006, our valuation allowance was $1.2 million.We are currently under examination by the Internal Revenue Service for our fiscal 2001, 2002, and 2003 tax returns. Although we believe our judgments, assumptions and estimates are reasonable, changes in tax laws or our interpretation of tax laws and the resolution of the current and any future tax audits could significantly impact the amounts provided for income taxes in our consolidated financial statements. Although the ultimate outcome is unknown, we have reserved for potential adjustments that may result from the current examination and we believe that the final outcome will not have a material effect on our results of operations.At the end of fiscal 2006, we had federal and state tax credit carry-forwards of approximately $2 million and $45 million, respectively. The state tax credit carry-forwards can be carried forward indefinitely.Below is a summary of our income tax payable activity for fiscal 2006 and 2005:In the first quarter of fiscal 2006, pursuant to Board of Directors’ approval, we initiated plans to restructure both the pre-merger operations of Adobe and Macromedia to eliminate certain duplicative activities, focus our resources on future growth opportunities and reduce our cost structure. In connection with the worldwide restructuring plan, we recognized costs related to termination benefits for employee positions that were eliminated and for the closure of duplicative facilities. We also recognized costs related to the cancellation of certain contracts associated with the wind-down of subsidiaries and other service contracts held by Macromedia.Macromedia Merger Restructuring ChargesA summary of preliminary restructuring activities follows:
Restructuring
Charges
December 1,
2006We completed our acquisition of Macromedia on December 3, 2005. Pursuant to Emerging Issues Task Force Issue No. 95-3, “Recognition of Liabilities in Connection with a Purchase Business Combination,” all restructuring charges related to the Macromedia acquisition are recognized as a part of the purchase price allocation, as discussed in Note 2 and have been accrued for as of December 1, 2006.Accrued restructuring charges of $31.4 million at December 1, 2006 includes $9.8 million recorded in accrued restructuring, current and $21.6 million, related to long-term facilities obligations, recorded in accrued restructuring, non-current in the accompanying Condensed Consolidated Balance Sheets. We expect to pay these liabilities through the third quarter of fiscal 2007.Adobe Restructuring ChargesIn connection with the worldwide restructuring plan, we recognized costs related to termination benefits for former Adobe employees whose positions were eliminated and for the closure of Adobe facilities. We also recognized costs related to the cancellation of certain contracts held by Adobe. In addition, costs related to the write-off of fixed assets located at facilities that will no longer be used will be recognized in the periods that the respective offices are vacated. We expect to pay these liabilities through the first quarter of fiscal 2007.A summary of exit costs follows:
Restructuring
Charges
December 1,
2006Pursuant to FASB’s Statement of Financial Accounting Standards No. 146, “Accounting for Costs Associated with Exit or Disposal Activities,” all facility related charges related to the pre-merger operations are expensed and accrued for based upon the cease use date. As of December 1, 2006, accrued restructuring charges of $0.6 million at December 1, 2006 includes $0.3 million recorded in accrued restructuring, current and $0.3 million, related to long-term facilities obligations, recorded in accrued restructuring, non-current in the accompanying Condensed Consolidated Balance Sheets.Pretax Savings PlanIn 1987, we adopted an Employee Investment Plan, qualified under Section 401(k) of the Internal Revenue Code, which is a pretax savings plan covering substantially all of our United States employees. Under the plan, eligible employees may contribute up to 65% of their pretax salary, subject to the Internal Revenue Service annual contribution limits. In fiscal 2006, we matched 50% of the first 6% of the employee’s contribution. We contributed approximately $11.2 million, $8.9 million and $6.5 million in fiscal 2006, 2005 and 2004, respectively. We can terminate matching contributions at our discretion.Profit Sharing PlanWe have a profit sharing plan that provides for profit sharing payments to all eligible employees following each quarter in which we achieve at least 80% of our budgeted earnings for the quarter. The plan, as well as the annual operating budget on which the plan is based, is approved by our Board of Directors. We contributed approximately $51.9 million, $45.7 million and $42.6 million to the plan in fiscal 2006, 2005 and 2004, respectively.Stock OptionsITEM 10. DIRECTORS, EXECUTIVE OFFICERS AND CORPORATE GOVERNANCEOur stock option programa long-term retention program that is intended to attract, retain and provide incentives for talented employees, officers and directors, and to align stockholder and employee interests. We considerincorporated herein by reference from the information contained in the section entitled “Proposal 1 – Election of Directors” in our option programs criticaldefinitive Proxy Statement we will deliver to our operation and productivity. Currently, we grant options from the 1) 2003 Equity Incentive Plan (“2003 Plan”), under which options couldstockholders in connection with our Annual Meeting of Stockholders to be grantedheld on April 16, 2010. For information with respect to all employees, includingour executive officers, and outside consultants and 2) the 1996 Outside Directors Stock Option Plan (“Directors Plan”), as amended, under which options are granted automatically under a pre-determined formula to non-employee directors. In addition, our stock option program includes the 2005 Equity Incentive Assumption Plan (“2005 Assumption Plan”), from which we currently do not grant options, but may do so in the future. The plans listed above are collectively referred to in the following discussion as “the Plans.” Option vesting periods are generally three to four years for all of the Plans.As of December 1, 2006, we had reserved 53.9 million, 5.2 million and 1.3 million shares of common stock for issuance under our 2003 Plan, Directors Plan and 2005 Assumption Plan, respectively. As of December 1, 2006, we had 14.2 million, 1.0 million and 1.3 million shares available for grant under our 2003 Plan, Directors Plan and 2005 Assumption Plan, respectively.The following table sets forth the summary of option activity under our stock option program for fiscal years 2006, 2005 and 2004:
Available for
Grant
Shares
Average
Exercise
PriceThe weighted average fair values of options granted during fiscal 2006, 2005 and 2004 are as follows:The difference in shares granted under options available for grant and number of options outstanding is due to performance share grants. See below for information regarding the performance shares.The total intrinsic value of options exercised during fiscal 2006 was $440.0 million. The intrinsic value is calculated as the difference between the market value on the date of exercise and the exercise price of the shares.100Information regarding the stock options outstanding at December 1, 2006 is summarized below:
Outstanding
Average
Remaining
Contractual
Life
Average
Exercise
Price
Exercisable
Average
Exercise
PriceThe aggregate intrinsic value of options outstanding and options exercisable as of December 1, 2006 was $936.8 million and $731.0 million, respectively. The intrinsic value is calculated as the difference between the market value as of December 1, 2006 and the exercise price of the shares. The market value as of December 1, 2006 was $39.35 as reported by the NASDAQ Global Select Market.All stock option grants to current executive officers are made after a review by and with the approval of the Executive Compensation Committee of the Board of Directors. All members of the Executive Compensation Committee are independent directors, as defined in the rules applicable to issuers traded on the Nasdaq Global Select Market.The Directors Plan provides for the granting of nonqualified stock options to non-employee directors. Option grants are limited to 25,000 shares per person in each fiscal year, except for a new non-employee director to whom 50,000 shares are granted upon election as a director. Options granted prior to March 28, 2006 have a ten-year term and are exercisable and vest over three years: 25% on the day preceding each of Adobe’s next two annual meetings of stockholders and 50% on the day preceding Adobe’s third annual meeting of stockholders after the grant of the option. However, options granted on or after March 28, 2006 have a seven-year term and vest over four years: 25% on the day preceding each of Adobe’s next four annual meetings. The exercise price of the options that are issued is equal to the fair market value of our common stock on the date of grant.Options granted to directors for fiscal 2006, 2005 and 2004 are as follows:As of December 1, 2006, approximately 2.0 million shares were reserved for issuance upon exercise of outstanding options under the Directors Plan. The Directors Plan will continue until the earlier of (i) termination by the Board or (ii) the date on which all of the shares available for issuance under the plan have been issued and restrictions on issued shares have lapsed.Employee Stock Purchase PlanOur 1997 Employee Stock Purchase Plan (the “ESPP”) allows eligible employee participants to purchase shares of our common stock at a discount through payroll deductions. The ESPP consists of twenty-four-month offering periods with four six-month purchase periods in each offering period. Employees purchase shares in each purchase period at 85% of the market value of our common stock at either the beginning of the offering period or the end of the purchase period, whichever price is lower.As of December 1, 2006, we had reserved 76.0 million shares of our common stock for issuance under the ESPP and approximately 20.6 million shares remain available for future issuance.The weighted average fair values of employee stock purchase rights granted during fiscal 2006, 2005 and 2004 are as follows:The ESPP will continue until the earlier of (i) termination by the Board or (ii) the date on which all of the shares available for issuance under the plan have been issued.Restricted StockWe grant restricted shares and performance awards to employees under our Amended 1994 Performance and Restricted Stock Plan (“Restricted Stock Plan”) and our 2003 Equity Incentive Plan. These plans provide for the granting of restricted stock and/or performance awards to officers and key employees. Restricted stock issued under these plans generally vest annually over two to three years but are considered outstanding at the time of grant, as the stockholders are entitled to dividends and voting rights. As of December 1, 2006, we had reserved 16.0 million shares of our common stock for issuance under the Restricted Stock Plan and approximately 5.2 shares were available for grant.Restricted stock activity for fiscal 2006, 2005 and 2004 are as follows:
Shares
Average
Grant Date
Fair ValuePerformance SharesEffective February 2, 2006, the Executive Compensation Committee adopted the 2006 Performance Share Program (the “Program”). The Executive Compensation Committee established the Program toalign the new leadership team to achieve key integration milestones and create stockholder value and to retain key executives. All members of Adobe’s executive management team and other key members of senior management are participating in the Program which runs through the end of our fiscal 2007. Awards under the Program were granted in the form of performance shares pursuant to the terms of our 2003 Plan or Restricted Stock Plan. Performance shares granted entitle the recipient to receive fully-vested shares of Adobe common stock upon completion of the performance period subject to attaining identified performance goals, some of which contain discretionary metrics.During fiscal 2006, we granted performance shares under the Program as shown in the table below. Upon achievement of performance goals, the recipients may be eligible to receive up to 504,000 shares. These shares will be issued out of our 2003 Plan and our Restricted Stock Plan.
Granted
Shares
Eligible to
ReceiveStock-Based CompensationBeginning with our first quarter of fiscal 2006, we adopted SFAS 123R. See Note 1 for a description of our adoption of SFAS 123R. We currently use the Black-Scholes option pricing model to determine the fair value of stock options and employee stock purchase plan shares. The determination of the fair value of stock-based payment awards on the date of grant using an option-pricing model is affected by our stock price as well as assumptions regarding a number of complex and subjective variables. These variables include our expected stock price volatility over the term of the awards, actual and projected employee stock option exercise behaviors, risk-free interest rate and expected dividends.We estimate the expected term of options granted by calculating the average term from our historical stock option exercise experience. As permitted by SAB 107, we estimate the volatility of our common stock by using implied volatility in market traded options. Our decision to use implied volatility was based upon the availability of actively traded options on our common stock and our assessment that implied volatility is more representative of future stock price trends than historical volatility. We base the risk-free interest rate that we use in the option valuation model on U.S. Treasury zero-coupon issues with remaining terms similar to the expected term on the options. We do not anticipate paying any cash dividends in the foreseeable future and therefore use an expected dividend yield of zero in the option valuation model. We are required to estimate forfeitures at the time of grant and revise those estimates in subsequent periods if actual forfeitures differ from those estimates. We use historical data to estimate pre-vesting option forfeitures and record stock-based compensation expense only for those awards that are expected to vest. All stock-based payment awards are amortized on a straight-line basis over the requisite service periods of the awards, which are generally the vesting periods.The expected term of employee stock purchase plan shares is the average of the remaining purchase periods under each offering period.Prior to the adoption of SFAS 123R, we recognized the estimated compensation cost of restricted stock over the vesting term. The estimated compensation cost is based on the fair value of Adobe’s common stock on the date of grant. We will continue to recognize the compensation cost, net of estimated forfeitures, over the vesting term.In accordance with SFAS 123R, we will recognize the estimated compensation cost of performance shares, net of estimated forfeitures. The awards are earned upon attainment of identified performance goals, some of which contain discretionary metrics, and are accounted for based upon the fair value of the award at each reporting date. As such, these awards are re-valued based on Adobe’s traded stock pricesee “Executive Officers” at the end of each reporting period. IfPart I, Item 1 of this report.discretion is removed, then the treatment stops and the award will be classified as a fixed equity award. The fair value of the awards will be based on the measurement date, which is the date the award becomes fixed. The awards will be subsequently amortized over the remaining performance period.In addition to estimating expense for grants to Adobe employees, we also estimated deferred stock-based compensation related to unvested options assumedinformation contained in the acquisition of Macromedia (see Note 2 for further information). In accordance with SFAS 123R, deferred compensation expense is classified by functional area onsection entitled “Section 16(a) Beneficial Ownership Reporting Compliance” in our consolidated statement of income.The assumptions used to value the option grants are as follows:The assumptions used to value employee stock purchase rights are as follows:See Note 2 for the assumptions used to value Macromedia deferred compensation. As of December 1, 2006, there was $57.4 million of unamortized deferred compensation, related to the acquisition of Macromedia, whichdefinitive Proxy Statement we will be recognized over a weighted average period of 1.22 years.Total stock-based compensation recognized on our consolidated statement of income for fiscal 2006 is as follows:
and Stock
Purchase Rights
Stock and
Performance
Shares
Deferred
Stock-Base
Compensation104The following table sets forth the pro forma amounts of net income and net income per share, for fiscal 2005 and 2004, that would have resulted if we had accounted for our employee stock plans under the fair value recognition provisions of SFAS 123:Prior to the adoption of SFAS 123R, we presented all tax benefits for deductions resulting from the exercise of stock options and disqualifying dispositions as operating cash flows on our consolidated statement of cash flows. SFAS 123R requires the benefits of tax deductions in excess of recognized compensation expense to be reported as a financing cash flow, rather than as an operating cash flow. This requirement will reduce net operating cash flows and increase net financing cash flows in periods after adoption. Total cash flow will remain unchanged from what would have been reported under prior accounting rules.Pursuant to the income tax provisions included in SFAS 123R, we have elected the “long method” of computing our hypothetical APIC pool. As of December 1, 2006, there was $134.2 million of unrecognized compensation cost, adjusted for estimated forfeitures, related to non-vested stock-based payments granted to Adobe employees. Total unrecognized compensation cost will be adjusted for future changes in estimated forfeitures.Stockholder Rights PlanOur Stockholder Rights Plan is intended to protect stockholders from unfair or coercive takeover practices. In accordance with this plan, the Board of Directors declared a dividend distribution of one common stock purchase right on each outstanding share of our common stock held as of July 24, 1990 and on each share of common stock issued by Adobe thereafter. In July 2000, the Stockholder Rights Plan was amended to extend it for ten years so that each right entitles the holder to purchase one unit of Series A Preferred Stock, which is equal to 1/1000 share of Series A Preferred Stock, par value $0.0001 per share, at a price of $700 per unit. As adjusted for our 2000 and 2005 stock splits each in the form of a dividend, each share of common stock now entitles the holder to one-quarter of such a purchase right. Each whole right still entitles the registered holder to purchase from Adobe a unit of preferred stock at $700. The rights become exercisable in certain circumstances, including upon an entity’s acquiring or announcing the intention to acquire beneficial ownership of 15% or more of our common stock without the approval of theBoard of Directors or upon our being acquired by any person in a merger or business combination transaction. The rights are redeemable by Adobe prior to exercise at $0.01 per right and expire on July 23, 2010.Stock Repurchase Program—On-going Dilution CoverageTo facilitate our stock repurchase program, designed to return valuedeliver to our stockholders and minimize dilutionin connection with our Annual Meeting of Stockholders to be held on April 16, 2010.stock issuances, we repurchase sharesthe information contained in the open market and from timesection entitled “Code of Ethics” in our definitive Proxy Statement we will deliver to time enter into structured repurchase agreementsour stockholders in connection with third parties.Authorizationour Annual Meeting of Stockholders to repurchase shares to cover on-going dilution is not subject to expiration. However, this repurchase program is limited to covering net dilution from stock issuances and is subject to business conditions and cash flow requirements as determined by our Board of Directors from time to time.As part of this program,be held on April 17, 2005,16, 2010.Boardinformation contained in the sections entitled “Proposal 1- Election of Directors approved the use of an additional $1.0 billion for stock repurchase commencing upon the closeDirectors” and report of the Macromedia acquisition. This additional $1.0 billion“Audit Committee” in stock repurchases was completed by the third quarterour definitive Proxy Statement we will deliver to our stockholders in connection with our Annual Meeting of fiscal 2006.During fiscal 2006 and 2005, we entered into several structured repurchase agreements with large financial institutions, whereupon we provided the financial institutions with prepayments of $1.3 billion and $600 million, respectively. We entered into these agreements in orderStockholders to take advantage of repurchasing shares at a guaranteed discount to the Volume Weighted Average Price (“VWAP”) of our stock. We only enter into such transactions when the discount that we receive is higher than the foregone returnbe held on our cash prepayments to the financial institutions. There were no explicit commissions or fees on these structured repurchases. Under the terms of the agreements, there is no requirement for the financial institutions to return any portion of the prepayment to us.The financial institutions agree to deliver shares to us at monthly intervals during the contract term. The parameters used to calculate the number of shares deliverable are: the total notional amount of the contract, the number of trading days in the contract, the number of trading days in the interval, and the average VWAP of our stock during the interval less the agreed upon discount. During the fiscal 2006, we repurchased 1.7 million shares at an average price of $36.04 through open market repurchases and 36.8 million shares at an average price of $34.00 through structured repurchase agreements which included prepayments from fiscal 2005. During fiscal 2005, we repurchased 18.7 million shares at an average price of $30.61 through structured repurchase agreements which included prepayments remaining from fiscal 2004.For fiscal 2006, the $1.3 billion in prepayments was classified as treasury stock on our balance sheet at the payment date, though only shares physically delivered to us by December 1, 2006 are excluded from the denominator in the computation of earnings per share. All outstanding structured repurchase agreements as of December 1, 2006 will expire on or before July 19, 2007. As of December 1, 2006 and December 2, 2005, approximately $204.0 million and $154.9 million respectively, of up-front payments remained under the agreements.Note 13. Comprehensive IncomeITEM 11. EXECUTIVE COMPENSATIONStatement of Financial Accounting Standards No. 130 (“SFAS 130”), “Reporting Comprehensive Income,” establishes standards for the reporting and display of comprehensive income and its componentsfinancial statements. Itemssections captioned “Compensation Discussion and Analysis,” “Executive Compensation Committee Report,” “Executive Compensation,” “Director Compensation” and “Compensation Committee Interlocks and Insider Participation” in the Proxy Statement we will deliver to our stockholders in connection with our Annual Meeting of comprehensive incomeStockholders to be held on April 16, 2010. We are incorporating the information contained in that we currently report are unrealized gains and losses on marketable securities categorized as available-for-sale and foreign currency translation adjustments. We also report unrealized gains and losses on derivative instruments qualifying as cash flow hedges.The following table sets forth the components of other comprehensive income for fiscal 2006, 2005, and 2004:
(Loss) on
-for-Sale
Securities
Instruments
Currency
Translation
TotalBasic net income per share is computed using the weighted average number of common shares outstanding for the period, excluding unvested restricted stock. Diluted net income per share is based upon the weighted average common shares outstanding for the period plus dilutive potential common shares, including unvested restricted common stock and stock options using the treasury stock method.The following table sets forth the computation of basic and diluted net income per share for fiscal 2006, 2005 and 2004.For the fiscal 2006, 2005 and 2004, options to purchase approximately 17.7 million, 11.6 million, and 14.0 million shares, respectively, of common stock with exercise prices greater than the annual average fair market valuesection of our stock of $35.32, $30.33, and $22.23, respectively, were not includedProxy Statement here by reference.calculation becausesections captioned “Security Ownership of Certain Beneficial Owners and Management” and “Equity Compensation Plan Information” in the effect would have been anti-dilutive.Proxy Statement we will deliver to our stockholders in connection with our Annual Meeting of Stockholders to be held on April 16, 2010. We are incorporating the information contained in that section here by reference.Note 15. Commitments and ContingenciesITEM 13. CERTAIN RELATIONSHIPS AND RELATED TRANSACTIONS, AND DIRECTOR INDEPENDENCELease CommitmentsWe lease certain of our facilities and some of our equipment under noncancelable operating lease arrangements that expire at various dates through 2025. We also have one land lease that expires in 2091. Rent expense and sublease income for these leases for fiscal 2004 through fiscal 2006 were as follows:We occupy three office buildings in San Jose, California where our corporate headquarters are located. We reference these office buildings as the “Almaden tower” and the “East and West towers.”In December 2003, upon completion of construction, we began a five year lease agreement for the Almaden tower. Under the agreement, we have the option to purchase the building at any time during the lease term for the lease balance, which is approximately $103.0 million. The maximum recourse amount (“residual value guarantee”) underobligation is $90.8 million.we have put in place for the East and West Towers.In August 2004, we extended the lease agreement for our East and West towers for an additional five years with an option to extend for an additional five years solely at Adobe’s election. As part of the lease extension, we purchased a portion of the lease receivable of the lessor for $126.8 million, which is recorded as an investment in lease receivable on our consolidated balance sheet. This purchase may be credited against the residual value guarantee if we purchase the properties or repaid from the sale proceeds if the properties are sold to third parties. Under the agreement for the East and West towers, we have the option to purchase the buildings at any time during the lease term for the lease balance, which is approximately $143.2 million. The maximum recourse amount (“residual value guarantee”) under this obligation is $126.8 million.108These two leases are both subject to standard covenants including liquidity, leverage and profitability ratios that are reported to the lessors quarterly. As of December 1, 2006, we were in compliance with all covenants. In the case of a default, the lessor may demand we purchase the buildings for an amount equal to the lease balance, or require that we remarket or relinquish the buildings. Both leases qualify for operating lease accounting treatment under Statement of Financial Accounting Standards No. 13, “Accounting for Leases,” and, as such, the buildings and the related obligations are not included on our consolidated balance sheet. We utilized this type of financing in order to access bank-provided funding at the most favorable rates and to provide the lowest total cost of occupancy for the headquarter buildings. At the end of the lease term, we can extend the lease for an additional five year term (for the East and West towers lease only), purchase the buildings for the lease balance, remarket or relinquish the buildings. If we choose to remarket or are required to do so upon relinquishing the buildings, we are bound to arrange the sale of the buildings to an unrelated party and will be required to pay the lessor any shortfall between the net remarketing proceeds and the lease balance, up to the maximum recourse amount.As of December 1, 2006, future minimum lease payments undernon-cancelable operating leases and future minimum sublease income under non-cancelable subleases followinformation in the table below. The table includes commitments relatedsections captioned “Transactions with Related Persons” and “Proposal 1—Election of Directors—Independence of Directors” in the Proxy Statement we will deliver to our restructured facilities. Refer to Note 9 for more information regarding our restructurings.
Minimum
Lease
Payments
Minimum
IncomeGuaranteesThe lease agreements for our corporate headquarters provide for residual value guarantees. Under FIN 45, the fair value of a residual value guaranteestockholders in lease agreements entered into after December 31, 2002, must be recognized as a liability on our consolidated balance sheet. As such, we recognized a $5.2 million liability related to the East and West tower lease that was extended in August 2004. This liability is recorded in other long-term liabilities with the offsetting entry recorded as prepaid rent in other assets. The balance will be amortized to the income statement over the life of the lease. As of December 1, 2006, the unamortized portion of the fair value of the residual value guarantee remaining in other long-term liabilities and prepaid rent was $2.8 million.RoyaltiesWe have certain royalty commitments associated with the shipment and licensing of certain products. Royalty expense is generally based on a dollar amount per unit shipped or a percentage of the underlying revenue. Royalty expense, which was recorded under our cost of products revenue on our consolidated statements of income, was approximately $19.1 million, $17.8 million, and $15.9 million in fiscal 2006, 2005, and 2004, respectively.IndemnificationsIn the normal course of business, we provide indemnifications of varying scope to customers against claims of intellectual property infringement made by third parties arising from the use of our products.Historically, costs related to these indemnification provisions have not been significant and we are unable to estimate the maximum potential impact of these indemnification provisions on our future results of operations.To the extent permitted under Delaware law, we have agreements whereby we indemnify our officers and directors for certain events or occurrences while the officer or director is, or was serving, at our request in such capacity. The indemnification period covers all pertinent events and occurrences during the officer’s or director’s lifetime. The maximum potential amount of future payments we could be required to make under these indemnification agreements is unlimited; however, we have director and officer insurance coverage that reduces our exposure and enables us to recover a portion of any future amounts paid. We believe the estimated fair value of these indemnification agreements in excess of applicable insurance coverage is minimal.As part of our limited partnership interests in Adobe Ventures, we have provided a general indemnification to Granite Ventures, an independent venture capital firm and sole general partner of Adobe Ventures, for certain events or occurrences while Granite Ventures is, or was serving, at our request in such capacity provided that Granite Ventures acts in good faith on behalf of the partnerships. We are unable to develop an estimate of the maximum potential amount of future payments that could potentially result from any hypothetical future claim, but believe the risk of having to make any payments under this general indemnification to be remote.Legal ProceedingsOn September 6, 2002, Plaintiff Fred B. Dufresne filed suit against Adobe, Microsoft Corporation, Macromedia, Inc. and Trellix Corporation in the U.S. District Court, District of Massachusetts, alleging infringement of U.S. Patent No. 5,835,712, entitled “Client-Server System Using Embedded Hypertext Tags for Application and Database Development.” The Plaintiff’s complaint asserts that “defendants have infringed, and continue to infringe, one or more claims of the ‘712 patent by making, using, selling and/or offering for sale, inter alia, products supporting Microsoft Active Server Pages technology.” Plaintiff seeks unspecified compensatory damages, preliminary and permanent injunctive relief, trebling of damages for “willful infringement,” and fees and costs. We believe the action has no merit and are vigorously defending against it. As of December 1, 2006, we do not believe that a loss is probable or estimable.On October 13, 2006, a purported shareholder derivative action entitled Steven Staehr v. Bruce R. Chizen, et al was filed in the Superior Court of California for the County of Santa Clara against certain of the Company’s current and former officers and directors, and against Adobe as a nominal defendant. The complaint asserts that stock option grants to executives were priced retroactively by Adobe and were improperly accounted for, and alleges various causes of action based on that assertion. The complaint seeks payment by the defendants to Adobe of damages allegedly suffered by it and disgorgement of profits, as well as injunctive relief. As of December 1, 2006, we do not believe that a loss is probable or estimable.In connection with our anti-piracy efforts, conducted both internally and throughAnnual Meeting of Stockholders to be held on April 16, 2010. We are incorporating the Business Software Alliance, from time to time we undertake litigation against alleged copyright infringers. Such lawsuits may lead to counter-claims alleging improper use of litigation or violation of other local law and have recently increasedinformation contained in frequency, especially in Latin American countries. We believe we have valid defenses with respect to such counter-claims; however, it is possible that our consolidated financial position, cash flows or results of operations could be affected in any particular periodsection here by the resolution of one or more of these counter-claims.From time to time, in addition to those identified above, Adobe is subject to legal proceedings, claims, investigations and proceedingsreference.ordinary coursesections captioned “Principal Accounting Fees and Services” and “Audit Committee Pre-Approval of business, including claims of alleged infringement of third-party patents and other intellectual property rights, commercial, employment and other matters. In accordance with U.S. generally accepted accounting principles, Adobe makes a provision for a liabilitywhen it is both probable that a liability has been incurred and the amount of the loss can be reasonably estimated. These provisions are reviewed at least quarterly and adjusted to reflect the impacts of negotiations, settlements, rulings, advice of legal counsel, and other information and events pertaining to a particular case. Litigation is inherently unpredictable. However, we believe that we have valid defenses with respect to the legal matters pending against Adobe. It is possible, nevertheless, that our consolidated financial position, cash flows or results of operations could be affectedServices Performed by the resolution of one or more of such contingencies.Note 16. Financial InstrumentsIn accordance with Statement of Financial Accounting Standards No. 133 (“SFAS 133”), “Accounting for Derivative Instruments and Hedging Activities” we recognize derivative instruments and hedging activities as either assets or liabilities on the balance sheet and measure them at fair value. Gains and losses resulting from changes in fair value are accounted for depending on the use of the derivative and whether it is designated and qualifies for hedge accounting.Economic Hedging—Hedges of Forecasted TransactionsWe use foreign exchange option contracts to hedge certain operational (“cash flow”) exposures resulting from changes in foreign currency exchange rates. Such cash flow exposures result from portions of our forecasted revenues denominated in currencies other than the U.S. dollar, primarily the Japanese yen and the Euro. These foreign exchange contracts, carried at fair value, may have maturities between one and twelve months. The maximum original duration of any option contract is twelve months. We enter into these foreign exchange contracts to hedge forecasted product licensing revenueOur Independent Registered Public Accountants” in the normal course of business, and accordingly, they are not speculative in nature.To receive hedge accounting treatment, all hedging relationships are formally documented at the inception of the hedge, and the hedges must be highly effective in offsetting changes to future cash flows on hedged transactions. We record changes in the intrinsic value of these cash flow hedges in accumulated other comprehensive income (loss) until the forecasted transaction occurs.The following is a summary of the existing gains that are currently included in accumulated other comprehensive income. These amounts represent the fair value of our cash flow hedge contracts that were still open as of the periods below.Gain (Loss) on Hedges of Forecasted Transactions:
Other Comprehensive
Income (Loss)When the forecasted transaction occurs, we reclassify the related gain or loss on the cash flow hedge to revenue. In the event the underlying forecasted transaction does not occur, or it becomes probable that it will not occur, the related hedge gains and losses on the cash flow hedge are reclassified from accumulated other comprehensive income (loss) to interest and other income (loss) on the consolidated statement of income at that time. For fiscal 2006 and 2005, there were no such gains or losses recognized in other income relating to hedges of forecasted transactions that did not occur.Pursuant to SFAS 133, we evaluate hedge effectiveness at the inception of the hedge prospectively as well as retrospectively and record any ineffective portion of the hedging instruments in other income (loss) on the consolidated income statement. The net gain (loss) recognized in other income for cash flow hedges due to hedge ineffectiveness was insignificant for fiscal 2006 and 2005. The time value of purchased derivative instruments is recorded in other income (loss).A summary of the amounts included on the consolidated income statement due to occurrence of the hedged transaction and or time value degradation on open hedge transactions is as follows:
Income
(Loss)
Income
(Loss)
Income
(Loss)Balance Sheet Hedging - Hedging of Foreign Currency Assets and LiabilitiesWe hedge our net recognized foreign currency assets and liabilities with forward foreign exchange contracts to reduce the risk that our earnings and cash flows will be adversely affected by changes in foreign currency exchange rates. These derivative instruments hedge assets and liabilities that are denominated in foreign currencies and are carried at fair value with changes in the fair value recorded as other income (loss). These derivative instruments do not subject us to material balance sheet risk due to exchange rate movements because gains and losses on these derivatives are intended to offset gains and losses on the assets and liabilities being hedged. At December 1, 2006, the outstanding balance sheet hedging derivatives had maturities of 150 days or less.Net gains (losses) recognized in other income (loss) relating to balance sheet hedging for fiscal 2006, 2005, 2004 were as follows:Fair Value Hedges—Hedging of Foreign Currency Denominated Available for Sale SecuritiesDuring fiscal 2004, a portion of our investment portfolio was invested in euro denominated securities. In order to mitigate the currency risk of those euro denominated securities, we entered into forward currency contracts designated as fair value hedges. During fiscal 2005 we did not invest in euro denominated securities.Net gains recognized in other income relating to fair value hedges for fiscal 2004 were as follows:Concentration of RiskFinancial instruments that potentially subject us to concentrations of credit risk are short-term investments, primarily fixed-income securities, derivatives, hedging foreign currency and interest rate risk, and accounts receivable.Our investment portfolio consists of investment-grade securities diversified among security types, industries, and issuers. Our cash and investments are held and managed by recognized financial institutions that follow Adobe’s investment policy. Our policy limits the amount of credit exposure to any one security issue or issuer, and we believe no significant concentration of credit risk exists with respect to these investments.113We mitigate concentration of risk related to foreign currency hedges as well as interest rate hedges through a policy that establishes counterparty limits. We also have minimum rating requirements for all bank counterparties.Credit risk in receivables is limited to OEM partners, dealers and distributors of hardware and software products to the retail market, and to customers whereby we license software directly. Management believes that any risk of loss is reduced due to the diversity of our customers and geographic sales areas. A credit review is completed for our new distributors, dealers, and OEM partners. We also perform ongoing credit evaluations of our customers’ financial condition and require letters of credit or other guarantees, whenever deemed necessary. The credit limit given to the customer is based on our risk assessment of their ability to pay, country risk, and other factors and is not contingent on the resale of the product or on the collection of payments from their customers. We also purchase credit insurance to mitigate credit risk in some foreign markets where we believe it is warranted. If we license our software to a customer where we have a reason to believe the customer’s ability to pay is not probable, due to country risk or credit risk,Proxy Statement we will not recognizedeliver to our stockholders in connection with our Annual Meeting of Stockholders to be held on April 16, 2010. We are incorporating the revenue. We will revert to recognizing the revenue on a cash basis, assuming all other criteria for revenue recognition has been met. For discussion of significant customers as of December 1, 2006, see Note 17.We derive a significant portion of our OEM PostScript and Other licensing revenue from a small number of OEM partners. Our OEM partners on occasion seek to renegotiate their royalty arrangements. We evaluate these requests on a case-by-case basis. If an agreement is not reached, a customer may decide to pursue other options, which could resultinformation contained in lower licensing revenue for us.Note 17. Industry Segment, Geographic Information, and Significant CustomersITEM 15. EXHIBITS, FINANCIAL STATEMENT SCHEDULESCoinciding with the integration of Macromedia and the start of fiscal 2006, we changed the reporting of our segments to be aligned with our market opportunities and how we manage our combined businesses. For comparability, the prior fiscal period’s results have been reclassified to reflect the realignment of the segments and do not include the impact of our acquisition of Macromedia.We have the following segments: Creative Solutions, Knowledge Worker Solutions, Enterprise and Developer Solutions, Mobile and Device Solutions, and Other, which includes the Print and Classic Publishing and Platform segments. Our Creative Solutions segment focuses on delivering a complete professional line of integrated tools for a full range of creative and developer tasks to an extended set of customers. This segment combines most of the products of our prior Creative Professional and Digital Imaging and Video business segments, along with the creative professional-focused products and solutions that we obtained through our acquisition of Macromedia. The Knowledge Worker Solutions segment focuses on the needs of knowledge worker customers, providing essential applications and services to help them share information and collaborate. This segment contains revenue generated by Adobe Acrobat Connect and our Acrobat family of products. Our Enterprise segment provides server-based enterprise interaction solutions that automate people-centric processes. The segment contains revenue generated by our LiveCycle, ColdFusion and Flex lines of products. The Mobile and Device Solutions segment provides solutions that create compelling experiences through rich content, user interfaces, and data services on mobile and non-PC devices such as cellular phones, consumer devices and internet connected hand-held devices. Finally, Other contains several of our products and services which address market opportunities ranging from the diverse publishing needs of technical and business publishing, to our legacy type and OEM printing businesses, to new strategic opportunities such as OEM revenue generated from our desktop technology platform—which includes Adobe Reader and Adobe Flash Player applications.The accounting policies of the operating segments are the same as those described in the summary of significant accounting policies. With the exception of goodwill, we do not identify or allocate our assets by the operating segments.Our results for fiscal years 2006, 2005, and 2004 are reported by operating units below:
Solutions
Worker
Solutions
and
Developer
Solutions
Device
Solutions
Other*
Total1. Financial Statements. See “Index to Consolidated Financial Statements” in Part II, Item 8 of this Form 10-K. 2. Exhibits. The exhibits listed in the accompanying “Index to Exhibits” are filed or incorporated by reference as part of this Form 10-K. * Other segments revenue includes platform revenue of $37.2 million and $0.4 million for fiscal 2006 and 2005, respectively. We did not have platform revenue in fiscal 2004. Costs of revenue related to our platform segment are insignificant for each period. Gross margins for our platform segment are $37.2 million and $0.4 million for fiscal 2006 and 2005, or 1% and 0% of total revenues, respectively.A reconciliation of the totals reported for the operating units to the applicable line items in the consolidated financial statements for fiscal 2006, 2005, and 2004 is as follows:* Total operating expenses include research and development, sales and marketing and general and administrative. For fiscal 2006, operating expenses also included restructuring and other charges and the amortization of purchased intangibles and incomplete technology.For fiscal 2006, 2005, and 2004, our revenues and property and equipment, net of accumulated depreciation, are presented below by geographic area. With the exception of property and equipment, we do not identify or allocate our assets by operating unit.Significant CustomersThe table below lists our significant customers for fiscal 2004 through 2006. As listed, our significant customers are distributors and thus impact each of our reporting segments. The amounts listed below are a percentage of our net revenues.The amounts listed below are receivables, from our significant customers, as a percentage of our gross trade receivables for fiscal 2006 and 2005.Note 18. Subsequent EventsTABLE OF CONTENTSPurchase of Land in San JoseIn fiscal 2006, we entered into various agreements with San Jose Water Corporation and certain of its affiliates to acquire land and a building in downtown San Jose for $36.5 million. The building and certain parking areas were used by the San Jose Water Company and will be leased back to San Jose Water Corporation until mid 2008.Execution of Credit FacilityWe have received Board approval to execute a $500 million credit facility which is expected to be finalized in the first quarter of fiscal 2007. This credit facility will provide backup liquidity for general corporate purposes for a period of up to 5 years.Structured Stock Repurchase AgreementsIn December 2006, we entered into additional structured stock repurchase agreements with large financial institutions whereupon we provided the financial institutions with pre-payments of $300.0 million. The $300.0 million will be classified as treasury stock on our balance sheet. See Note 12 for further information regarding our structured stock repurchase agreements.117February 5, 2007.January 22, 2010.By:/s/ BRUCE R. CHIZENBy: Bruce R. Chizen,Chief OfficerVice President and (Principal Executive Officer and indicatedand on the 5th day of February, 2007.dates indicated.Date /s/ JOHN E. WARNOCKJanuary 22, 2010 John E. Warnock Chairman of the Board of Directors /s/ CHARLES M. GESCHKEJanuary 22, 2010 Charles M. Geschke Chairman of the Board of Directors /s/ BRUCE R. CHIZENBruce R. ChizenJanuary 22, 2010 Shantanu Narayen January 22, 2010 Executive Vice President and Chief Financial Officer (Principal Executive Officer (Principal Financial Officer)January 22, 2010 Richard T. Rowley Vice President and Principal Financial Officer) Accounting Officer/s/ EDWARD W. BARNHOLTDirectorJanuary 22, 2010 /s/ ROBERT K. BURGESSDirector DirectorJanuary 22, 2010 /s/ MICHAEL R. CANNONDirector Signature Title Date DirectorJanuary 22, 2010 /s/ JAMES E. DALEYDirector DirectorJanuary 22, 2010 /s/ CAROL MILLSDirector Carol MillsDirectors/ COLLEEN M. POULIOTs/ Carol MillsJanuary 22, 2010 Co lleen M. PouliotJanuary 22, 2010 Daniel L. Rosensweig Director January 22, 2010 Robert Sedgewick Director SignatureTitle/s/ ROBERT SEDGEWICKRobert SedgewickDirector/s/ DELBERT W. YOCAMDelbert W. YocamDirector/s/ RICHARD T. ROWLEYRichard T. RowleyVice President an d Principal Accounting Officer11910-K/A:Acrobat CaptureAcrobat MessengerAction ScriptAdobe EncoreAdobe LiveCycleBreezeDistillerDV RackFlashCastFlashPaperFlex BuilderGoLiveUltraVlog It!120As required under Item 15, Exhibits and Financial Statement Schedules, the exhibits filed as part of this report are provided in this separate section. The exhibits includped in this section are as follows:Exhibit Incorporated by Reference** Filed Number Exhibit Description Form Date Number Herewith 3.1 Amended and Restated Bylaws 8-K 1/13/09 3.1 3.2 Restated Certificate of Incorporation of Adobe Systems Incorporated 10-Q 7/16/01 3.6 3.2.1 Certificate of Correction of Restated Certificate of Incorporation of Adobe Systems Incorporated 10-Q 4/11/03 3.6.1 3.3 Certificate of Designation of Series A Preferred Stock of Adobe Systems Incorporated 10-Q 7/08/03 3.3 4.1 Fourth Amended and Restated Rights Agreement between Adobe Systems Incorporated and Computershare Investor Services, LLC 8-K 7/03/00 1 4.1.1 Amendment No. 1 to Fourth Amended and Restated Rights Agreement between Adobe Systems Incorporated and Computershare Investor Services, LLC 8-A/2G/A 5/23/03 7 4.2 Specimen Common Stock Certificate S-3 1/15/2010 4.3 10.1 Amended 1994 Performance and Restricted Stock Plan* 10-Q 4/4/08 10.2 10.2 Form of Restricted Stock Agreement used in connection with the Amended 1994 Performance and Restricted Stock Plan* 10-K 1/23/09 10.3 10.3 1997 Employee Stock Purchase Plan, as amended* 10-K 1/24/08 10.5 10.4 1996 Outside Directors Stock Option Plan, as amended* 10-Q 4/12/06 10.6 10.5 Forms of Stock Option Agreements used in connection with the 1996 Outside Directors Stock Option Plan* S-8 6/16/00 4.8 10.6 1999 Nonstatutory Stock Option Plan, as amended* S-8 10/29/01 4.6 10.7 1999 Equity Incentive Plan, as amended* 10-K 2/26/03 10.37 10.8 2003 Equity Incentive Plan, as amended and restated* DEF 14A 2/20/09 Appendix A 10.9 Form of Stock Option Agreement used in connection with the 2003 Equity Incentive Plan* 10-Q 4/4/08 10.11 10.10 Form of Indemnity Agreement* 10-Q 6/26/09 10.12 10.11 Forms of Retention Agreement* 10-K 11/28/97 10.44 10.12 Second Amended and Restated Master Lease of Land and Improvements by and between SMBC Leasing and Finance, Inc. and Adobe Systems Incorporated 10-Q 10/07/04 10.14 10.13 Lease between Adobe Systems Incorporated and Selco Service Corporation, dated March 26, 2007 8-K 3/28/07 10.1 10.14 Participation Agreement among Adobe Systems Incorporated, Selco Service Corporation, et al. dated March 26, 2007 8-K 3/28/07 10.2 10.15 Form of Restricted Stock Unit Agreement used in connection with the Amended 1994 Performance and Restricted Stock Plan* 10-K 1/23/09 10.19 Exhibit Incorporated by Reference** Filed 32.1CertificationExhibit DescriptionForm Date Number Herewith 10.16 Form of Restricted Stock Unit Agreement used in connection with the 2003 Equity Incentive Plan* 10-K 1/23/09 10.20 10.17 Form of Restricted Stock Agreement used in connection with the 2003 Equity Incentive Plan* 10-Q 10/07/04 10.11 10.18 2008 Executive Officer Annual Incentive Plan* 8-K 1/30/08 10.4 10.19 2005 Equity Incentive Assumption Plan, as amended and restated* X 10.20 Form of Stock Option Agreement used in connection with the 2005 Equity Incentive Assumption Plan* 10-Q 4/4/08 10.24 10.21 Allaire Corporation 1997 Stock Incentive Plan* S-8 03/27/01 4.06 10.22 Allaire Corporation 1998 Stock Incentive Plan* S-8 03/27/01 4.07 10.23 Allaire Corporation 2000 Stock Incentive Plan* S-8 03/27/01 4.08 10.24 Andromedia, Inc. 1999 Stock Plan* S-8 12/07/99 4.09 10.25 Blue Sky Software Corporation 1996 Stock Option Plan* S-8 12/29/03 4.07 10.26 Macromedia, Inc. 1999 Stock Option Plan* S-8 08/17/00 4.07 10.27 Macromedia, Inc. 1992 Equity Incentive Plan* 10-Q 08/03/01 10.01 10.28 Macromedia, Inc. 2002 Equity Incentive Plan* S-8 08/10/05 4.08 10.29 Form of Macromedia, Inc. Stock Option Agreement* S-8 08/10/05 4.09 10.30 Middlesoft, Inc. 1999 Stock Option Plan* S-8 08/17/00 4.09 Exhibit Incorporated by Reference** Filed Number Exhibit Description Form Date Number Herewith 10.31 Form of Macromedia, Inc. Revised Non-Plan Stock Option Agreement* S-8 11/23/04 4.10 10.32 Form of Macromedia, Inc. Restricted Stock Purchase Agreement* 10-Q 2/08/05 10.01 10.33 Adobe Systems Incorporated Form of Performance Share Program pursuant to the 2003 Equity Incentive Plan* 8-K 1/30/08 10.1 10.34 Form of Award Grant Notice and Performance Share Award Agreement used in connection with grants under the Adobe Systems Incorporated 2008 Performance Share Program pursuant to the 2003 Equity Incentive Plan* 8-K 1/30/08 10.2 10.35 2008 Award Calculation Methodology Exhibit A to the 2008 Performance Share Program pursuant to the 2003 Equity Incentive Plan* 8-K 1/30/08 10.3 10.36 Adobe Systems Incorporated Deferred Compensation Plan* 10-K 1/24/08 10.52 10.37 Adobe Systems Incorporated 2007 Performance Share Program pursuant to the 2003 Equity Incentive Plan* 8-K 1/30/07 10.1 10.38 Form of Award Grant Notice and Performance Share Award Agreement used in connection with grants under the Adobe Systems Incorporated 2007 Performance Share Program pursuant to the 2003 Equity Incentive Plan* 8-K 1/30/07 10.2 Exhibit Incorporated by Reference** Filed Number Exhibit Description Form Date Number Herewith 10.39 Adobe Systems Incorporated 2007 Performance Share Program pursuant to the Amended 1994 Performance and Restricted Stock Plan* 8-K 1/30/07 10.3 10.40 Form of Award Grant Notice and Performance Share Award Agreement used in connection with grants under the Adobe Systems Incorporated 2007 Performance Share Program pursuant to the Amended 1994 Performance and Restricted Stock Plan* 8-K 1/30/07 10.4 10.41 Adobe Systems Incorporated Executive Cash Bonus Plan* DEF 14A 2/24/06 Appendix B 10.42 First Amendment to Retention Agreement between Adobe Systems Incorporated and Shantanu Narayen, effective as of February 11, 2008* 8-K 2/13/08 10.1 10.43 Adobe Systems Incorporated Executive Severance Plan in the Event of a Change of Control* 8-K 2/13/08 10.2 10.44 Employment offer letter between Adobe Systems Incorporated and Richard Rowley, dated October 30, 2006* 8-K 11/16/06 10.1 10.45 Employment offer letter between Adobe Systems Incorporated and Mark Garrett dated January 5, 2007* 8-K 1/26/07 10.1 Exhibit Incorporated by Reference** Filed Number Exhibit Description Form Date Number Herewith 10.46 Credit Agreement, dated as of February 16, 2007, among Adobe Systems Incorporated and Certain Subsidiaries as Borrowers; BNP Paribas, Keybank National Association, and UBS Loan Finance LLC as Co-Documentation Agents; JPMorgan Chase Bank, N.A. as Syndication Agent; Bank of America, N.A. as Administrative Agent and Swing Line Lender; the Other Lenders Party Thereto; and Banc of America Securities LLC and J.P. Morgan Securities Inc. as Joint Lead Arrangers and Joint Book Managers 8-K 8/16/07 10.1 10.47 Amendment to Credit Agreement, dated as of August 13, 2007, among Adobe Systems Incorporated, as Borrower; each Lender from time to time party to the Credit Agreement; and Bank of America, N.A. as Administrative Agent 8-K 8/16/07 10.2 10.48 Second Amendment to Credit Agreement, dated as of February 26, 2008, among Adobe Systems Incorporated, as Borrower; each Lender from time to time party to the Credit Agreement; and Bank of America, N.A. as Administrative Agent 8-K 2/29/08 10.1 10.49 Purchase and Sale Agreement, by and between NP Normandy Overlook, LLC, as Seller and Adobe Systems Incorporated as Buyer, effective as of May 12, 2008 8-K 5/15/08 10.1 Exhibit Incorporated by Reference** Filed Number Exhibit Description Form Date Number Herewith 10.50 Form of Director Annual Grant Stock Option Agreement used in connection with the 2003 Equity Incentive Plan* 10-K 1/23/09 10.60 10.51 Form of Director Initial Grant Restricted Stock Unit Agreement in connection with the 2003 Equity Incentive Plan* 10-K 1/23/09 10.61 10.52 Form of Director Annual Grant Restricted Stock Unit Agreement in connection with the 2003 Equity Incentive Plan* 10-K 1/23/09 10.62 10.53 Description of 2009 Director Compensation* 10-K 1/23/09 10.63 10.54 2009 Performance Share Program Award Calculation Methodology* 8-K 1/29/09 10.3 10.55 2009 Executive Annual Incentive Plan* 8-K 1/29/09 10.4 10.56 Omniture, Inc. 1999 Equity Incentive Plan, as amended (the “Omniture 1999 Plan”)* S-1 4/4/06 10.2A 10.57 Forms of Stock Option Agreement under the Omniture 1999 Plan* S-1 4/4/06 10.2B 10.58 Form of Stock Option Agreement under the Omniture 1999 Plan used for Named Executive Officers and Non-Employee Directors* S-1 6/9/06 10.2C 10.59 Omniture, Inc. 2006 Equity Incentive Plan and related forms* 10-Q 08/06/09 10.3 10.60 Omniture, Inc. 2007 Equity Incentive Plan and related forms* 10-K 2/27/09 10.9 Exhibit Incorporated by Reference** Filed Number Exhibit Description Form Date Number Herewith 10.61 Omniture, Inc. 2008 Equity Incentive Plan and related forms* 10-K 2/27/09 10.10 10.62 Visual Sciences, Inc. (formerly, WebSideStory, Inc.) Amended and Restated 2000 Equity Incentive Plan* 10-K 2/29/08 10.5 10.63 Visual Sciences, Inc. (formerly, WebSideStory, Inc.) 2004 Equity Incentive Award Plan (the “VS 2004 Plan”) and Form of Option Grant Agreement* 10-K 2/29/08 10.6 10.64 Form of Restricted Stock Award Grant Notice and Restricted Stock Award Agreement under the VS 2004 Plan* 10-K 2/29/08 10.6A 10.65 Visual Sciences, Inc. (formerly, WebSideStory, Inc.) 2006 Employment Commencement Equity Incentive Award Plan and Form of Option Grant Agreement* 10-K 2/29/08 10.8 10.66 Avivo Corporation 1999 Equity Incentive Plan and Form of Option Grant Agreement* 10-K 2/29/08 10.7 10.67 The Touch Clarity Limited Enterprise Management Incentives Share Option Plan 2002* S-8 3/16/07 99.5 10.68 Forms of Agreements under The Touch Clarity Limited Enterprise Management Incentives Share Option Plan 2002* S-8 3/16/07 99.6 10.69 Touch Clarity Limited 2006 U.S. Stock Plan* S-8 3/16/07 99.7 Exhibit Incorporated by Reference** Filed Number Exhibit Description Form Date Number Herewith 10.70 Form of Stock Option Agreement under Touch Clarity Limited 2006 U.S. Stock Plan* S-8 3/16/07 99.8 10.71 Description of 2010 Director Compensation* X 21 Subsidiaries of the Registrant X 23.1 Consent of Independent Registered Public Accounting Firm, KPMG LLP X 24.1 Power of Attorney (set forth on the signature page to this Annual Report on Form 10-K) X 31.1 Certification of Chief Executive Officer, as required by Rule 13a-14(a) of the Securities Exchange Act of 1934 X 31.2 Certification of Chief Financial Officer, as required by Rule 13a-14(a) of the Securities Exchange Act of 1934 X 32.1 Certification of Chief Executive Officer, as required by Rule 13a-14(b) of the Securities Exchange Act of 1934† X 32.2 Certification of Chief Financial Officer, as required by Rule 13a-14(b) of the Securities Exchange Act of 1934† X 101.INS XBRL Instance†† X 101.SCH XBRL Taxonomy Extension Schema†† X 101.CAL XBRL Taxonomy Extension Calculation†† X Exhibit Incorporated by Reference** Filed Number Exhibit Description Form Date Number Herewith 101.LAB XBRL Taxonomy Extension Labels†† X 101.PRE XBRL Taxonomy Extension Presentation†† X 101.DEF XBRL Taxonomy Extension Definition†† X * Compensatory plan or arrangement. ** References to Exhibits 10.21 through 10.32 are to filings made by Macromedia, Inc. *** References to Exhibits 10.56 through 10.70 are to filings made by Omniture, Inc. † Chief Executive Officer,Adobe Systems Incorporated under the Securities Act of 1933, as required by Rule 13a-14(b) ofamended, or the Securities Exchange Act of 1934†X32.2Certification1934, as amended, whether made before or after the date of Chief Financial Officer, as required by Rule 13a-14(b)this Form 10-K, irrespective of the Securities Exchange Act of 1934†X100.INSXBRL Instance††X100.SCHXBRL Taxonomy Extension Schema††X100.CALXBRL Taxonomy Extension††X100.LABXBRL Taxonomy Extension Labels††X100.PREXBRL Taxonomy Extension††X†† Furnished, not filed. * Compensatory plan or arrangement** References to Exhibits 10.18 and 10.19 are to filings made by the Allaire Corporation. References to Exhibits 10.29 through 10.50 are to filings made by Macromedia, Inc.† The certifications attached as Exhibits 32.1 and 32.2 that accompany this Annual Report on Form 10-K/A, are not deemed filed with the Securities and Exchange Commission and are not to be incorporated by reference into any filing of Adobe Systems Incorporated under the Securities Act of 1933, as amended, or the Securities Exchange Act of 1934, as amended, whether made before or after the date of this Form 10-K/A, irrespective of any general incorporation language contained in such filing.†† Furnished not filed as stated in Part II, Item 9B.126