PART IIIAs of September 30, 2008, we had 165 employees, 52 were in engineering, research and development, 78 in manufacturing and assembly operations, 9 in quality and 26 in selling and general administrative positions.
Our future success depends on our ability to attract, train and retain highly qualified personnel. We plan to hire additional personnel, including, in particular, sales and marketing personnel, during the next twelve months. Competition for such qualified personnel is intense and we may not be able to attract, train and retain highly qualified personnel in the future. Our employees are not represented by a labor union.
Item 10.Executive Officers of the Registrant Directors and
The following is a list of our executive officers, of the registrant.
The current members of the Board of Directors, together with certain information about them, are set forth below:their ages and their positions:
|
|
| Director |
| Term |
|
| |||
Name |
|
|
| Age |
| Since |
| Expires |
| Positions with the Company |
Class I Directors |
|
|
|
|
|
|
|
| ||
Ivan M. Marks |
| 65 |
| 1996 |
| 2007 |
| Director | ||
Robert H. Rau |
| 70 |
| 2001 |
| 2007 |
| Director | ||
Class II Directors |
|
|
|
|
|
|
|
| ||
Glen R. Bressner |
| 46 |
| 1999 |
| 2008 |
| Director | ||
Robert E. Mittelstaedt, Jr. |
| 63 |
| 1989 |
| 2008 |
| Director | ||
Raymound J. Wilson |
| 61 |
| 2007 |
| 2008 |
| Director | ||
Class III Directors |
|
|
|
|
|
|
|
| ||
Geoffrey S. M. Hedrick |
| 65 |
| 1988 |
| 2009 |
| Director, Chairman of the Board | ||
|
|
|
|
|
|
| and Chief Executive Officer | |||
Winston J. Churchill |
| 66 |
| 1990 |
| 2009 |
| Director | ||
Name | Age | Position | ||
|---|---|---|---|---|
| Geoffrey S.M. Hedrick | 66 | Chairman of the Board and Chief Executive Officer | ||
| Roman G. Ptakowski | 60 | President | ||
| John C. Long | 43 | Chief Financial Officer |
Ivan M. Marks. Mr. Marks retired January 31, 2005 as Vice President-Controller of Parker Aerospace Group, which is the aerospace segment of Parker Hannifin Corporation, a position he held since 1979. Mr. Marks holds a Bachelor of Science degree in Business Administration from Drake University and is a Certified Public Accountant.
Robert H. Rau. Mr. Rau retired December 31, 1998 as President of the Aerostructures Group of The Goodrich Company. Prior to its merger with Goodrich, Mr. Rau was President and Chief Executive Officer of Rohr, Inc. from 1993 to 1997. Before joining Rohr, he was an Executive Vice President of Parker Hannifin Corporation and President of its Aerospace Sector. In addition, Mr. Rau is a past member of the Board of Governors of the Aerospace Industries Association, a past Chairman of the General Aviation Manufacturers Association, and Chairman of the International Advisory Panel of Singapore Aerospace. Mr. Rau received a Bachelor of Arts degree in Business Administration from Whittier College in 1962.
Glen R. Bressner. Mr. Bressner has been a partner of Mid-Atlantic Venture Funds, a venture capital firm, since 1997. Mr. Bressner is also a partner of NEPA Venture Fund, L.P., a venture capital firm, a position he has held since 1985. From 1996 to 1997, Mr. Bressner served as the Chairman of the Board of Directors of the Greater Philadelphia Venture Group. Mr. Bressner holds a Bachelor of Science degree in Business Administration from Boston University and a Masters of Business Administration degree from Babson College.
Robert E. Mittelstaedt, Jr. Mr. Mittelstaedt served as our Non-Executive Chairman of the Board of Directors from 1989 to 1997. Since July 1, 2004 Mr. Mittelstaedt has been Dean of the W.P. Carey School of Business at Arizona State University. Prior to that, Mr. Mittelstaedt was Vice Dean of The Wharton School of the University of Pennsylvania since 1989. Mr. Mittelstaedt also serves on the Board of Directors of Laboratory Corporation of America Holdings, Inc. Mr. Mittelstaedt holds a Bachelor of Science degree in Mechanical Engineering from Tulane University and a Masters of Business Administration degree from The Wharton School of the University of Pennsylvania.
Geoffrey S. M. Hedrick.Hedrick Mr. Hedrick has been our Chief Executive Officer since he founded the CompanyIS&S in February 1988 through June 4, 2007 and ourwas reappointed September 8, 2008. He has also been Chairman of the Board since 1997. Prior to founding the Company,IS&S, Mr. Hedrick served as President and Chief Executive Officer of Smiths Industries North American Aerospace Companies. He also founded Harowe Systems, Inc. in 1971, which was subsequently acquired
by Smiths Industries. Mr. Hedrick has over 35 years of experience in the avionics industry, and he holds a number of patents in the electronics, optoelectric, electromagnetic, aerospace and contamination-control fields.
Winston J. Churchill.Roman G. Ptakowski Mr. Churchill has been managing general partner of SCP Private Equity PartnersPresident since he founded it in 1996, and has over twenty-five years experience in private equity investing. Previously, he had formed Churchill Investment Partners, Inc. in 1989 and CIP Capital, L.P., another venture capital fund, in 1990.March 2003. Prior to that, Mr. Ptakowski served as a Group Vice President and General Manager and, before that, as a Vice President of Sales and Marketing at B/E Aerospace, Inc. Previously, Mr. Ptakowski held a number of positions with increasing responsibility within ASEA Brown Boveri Power T&D Company, Inc. There, he was General Manager of the Protective Relay Division before leaving to join B/E Aerospace, Inc. Mr. Ptakowski received a managing partnerB.S. in Electrical Engineering from New York University and a MBA from Duke University.
John C. Long has been Chief Financial Officer since January 2008. Prior to joining the Company, Mr. Long served in a variety of positions with Arrow International, Inc., including as Vice President from January, 2003 to January, 2008 as Treasurer from January, 2003 to October, 2007, as Secretary
from April, 2004 to October, 2007 and as Assistant Treasurer from 1995 to January 2003. Prior to joining Arrow International, Mr. Long served as Controller for the Jaindl Companies, a private investmentgroup of privately held companies involved in agribusiness and real estate development, from 1989 to 1995. From 1986 to 1989, Mr. Long was employed in the Allentown, Pennsylvania office of the accounting firm, that specializedConcannon, Gallagher, Miller & Co. Mr. Long also serves as a director and Audit Committee Chairman of D&E Communications, Inc., an integrated communications provider. Mr. Long received a B.S. in leveraged buyouts on behalf of Bessemer Securities Corporation. From 1967 to 1983, he practiced lawAccounting from Wilkes University and a MBA from Columbia University.
Other
The public may read and copy any materials filed by us with the SEC at the Philadelphia firm of Saul, Ewing, Remick and Saul and served as Chairman of its Banking and Financial Institutions Department, ChairmanSEC's public reference room located at 100 F Street, N.E., Washington, D.C. 20549. The public may obtain information about the operation of the Finance CommitteeSEC's public reference rooms by calling the SEC at 1-800-SEC-0330. The SEC also maintains a website athttp://www.sec.gov that contains reports, proxy and a memberinformation statements and other information about issuers such as that file electronically with the SEC.
Our primary website ishttp://www.innovative-ss.com. We make available, free of its Executive Committee. Hecharge, at our corporate website our annual report on Form 10-K, quarterly reports on Form 10-Q, current reports on Form 8-K and amendments to those as reasonably practicable after we electronically file such material with, or furnish it to, the SEC. The information on our web site is a Directornot incorporated as part of Amkor Technology, Inc.this annual report.
You should carefully consider the risks, uncertainties and Griffin Landother factors described below, in addition to the other information set forth in this report, because they could materially and Nurseries, Inc.,adversely affect our business, operating results, financial condition, cash flows and prospects as well as adversely affect the value of an investment in our common stock.
Risks Related to Our Business
Our sales principally relate to flat panel display systems and air data products, and we cannot be certain that the market will continue to accept these or other products.
During fiscal 2008, 2007, and 2006 we derived 77%, 53% and 38% of our revenues from the sale of flat panel display systems, respectively. We expect that revenues from our air data products will continue to decline as a percent of total sales as peak demand associated with the FAA's RVSM mandate has been accommodated. Our revenues and profitability will decrease if new products such as our Flat Panel Display Systems do not receive market acceptance or if our existing customers do not continue to incorporate our products in their retrofitting or manufacturing of aircraft. In seeking new customers, it may be difficult for our products to displace competing products. Accordingly, we cannot assure you that potential customers will accept our products or that existing customers will not abandon them.
A global recession and continued credit tightening could adversely affect us.
Concerns about a potential global recession and continued credit tightening, including failures of financial institutions has initiated unprecedented government intervention in the U.S., Europe and other regions of the world. If these concerns continue or worsen, risks to us include:
- •
- Declines in revenues and profitability from reduced orders, payment delays or other factors caused by the economic problems of customers;
- •
- reprioritization of government spending away from defense programs in which we participate;
- •
- adverse impacts on our access to credit sources; and
- •
- supply problems associated with any financial constraints faced by our vendors.
A portion of our sales have been, and we expect will continue to be, to defense contractors or government agencies in connection with government aircraft retrofit or original manufacturing contracts. Sales to government contractors and government agencies could decline as a result of DoD spending cuts and general budgetary constraints which may become more frequent as tax revenues decline due to the continued weakening of general economic conditions.
The loss of a key customer or a significant deterioration in the financial condition of a key customer could have a material adverse effect on our results of operations.
Our revenue is concentrated with a limited number of private companies. From 1989 to 1993, he served as Chairmancustomers. During fiscal year 2008 we derived 68% of the Finance Committeerevenues from four customers, American Airlines, DoD, Eclipse, and Federal Express. We derived 47% of the Pennsylvania Public School Employees’ Retirement System. He is currently a trustee of Fordham University, Georgetown University, Immaculata University, American Friends of New College Oxford, England, The Gesu Schoolrevenue during fiscal year 2007 from three customers, DoD, Eclipse and Young Scholars Charter School. He was awarded a BS in Physics, summa cum laude, from Fordham University followed by a M.A. in Economics from Oxford University where he studied as a Rhodes Scholar, and a J.D. degree from Yale Law School.
Raymond J. Wilson C.B.E.Since June, 2004, Mr. Wilson is employed as an independent Aerospace Manufacturing Consultant, Wilson in the period from January 2001 to January 2004, served on the five-person Executive Committee for Airbus S.a.s., where he was an integral member of the management group responsible for the overall performance of the $30 billion international aircraft manufacturing firm. At that time, he also served as Executive Vice President for Procurement with the Toulouse, France-based Company. Prior to that, from September 1997 to January 2001, Mr. Wilson was Managing Director for Airbus U.K. as well as a member of the Airbus Executive Board in the three years prior to the formation of Airbus as a company. Mr. Wilson is currently a non executive member of the Board of Directors of the Gardner Group LTD. in Nuneaton U.K.
As part of New Year’s Honours 2004, Wilson was honored by Her Majesty Queen Elizabeth II as a Commander of the British Empire (C.B.E.) for his services to the Aircraft Industry. Wilson is a graduate of Napier University in Edinburgh, Scotland and resides in Clevedon U.K.
The current executive officers of the Company, their ages, positions, terms of office with the Company, and brief summaries of their business experience are set forth in Part I of the Form 10-K beginning on page 12.
AuditCommittee and Audit Committee Expert
The Audit Committee makes recommendations to the Board with respect to various auditing and accounting matters, including the selection and compensationWestern Aircraft. We derived 47% of our independent registered public accounting firm, the scope of our annual audits, fees to be paid to the independent registered public accounting firm, the performance and independence of our independent registered public accounting firm and our accounting practices. The Audit Committee approves all services provided to the Company by the independent registered public accounting firm. The Audit Committee has established procedures for the receipt, retention and treatment, on a confidential basis, of complaints received by the Company, regarding accounting, internal accounting controls or auditing matters, and the confidential, anonymous submissions by employees of concerns regarding questionable accounting or auditing matters. In addition, the Audit Committee has responsibility for, among other things, the planning and review of our annual and periodic reports and accounts and the involvement of our independent registered public accounting firm in that process. Messrs. Rau (Chairman), Bressner and Marks are currently members of the Audit Committee.
The Audit Committee is comprised solely of independent members, as independence for audit committee members is defined in the listing standards of the Nasdaq National Market. In addition, the Board has determined in its business judgment that each member of the Audit Committee is financially literate and that at least one of the Audit Committee members, Mr. Marks, is an audit committee financial expert, as defined by SEC rules and regulations.
Section 16(A) Beneficial Ownership Reporting Compliance
Section 16(a) of the Securities Exchange Act of 1934, as amended, requires our officers (as defined under Section 16(a) of the Securities Exchange Act), directors and persons who own greater than 10% of a registered class of our equity securities to file reports of ownership and changes in ownership with the Securities and Exchange Commission. Based solely on a review of the forms we have received and on written representations from certain reporting persons that no such forms were required for them, we believe thatrevenues during fiscal year 2006 allfrom five customers, ABX Air, Boeing, DoD, Department of National Defense-Canada, and Star Aviation. We expect a relatively small number of customers to account for a majority of our revenues for the foreseeable future. As a result of our concentrated customer base, a loss of one or more of these customers could have a material adverse effect on our revenue and results of operations. In addition, we continually monitor and evaluate the credit status of our customers and attempt to adjust sales terms as appropriate. Despite these efforts, a significant deterioration in the financial condition or bankruptcy filing of a key customer could have a material adverse effect on our business, results of operations and financial condition.
On November 25, 2008, Eclipse Aviation filed a voluntary petition for relief under Chapter 11 of the Section 16(a) filingU.S. Bankruptcy Code. Given the early stages if the bankruptcy proceedings, it is unclear at this time what the precise impact the Eclipse's bankruptcy will have. The Company may not receive any payment on its pre-petition claims. In addition, Eclipse may choose to reject its contract with the Company, which could result in a larger pre-petition claim.
Growth of our customer base could be limited by delays or difficulties in completing development and introduction of our planned products or product enhancements. If we fail to enhance existing products or to develop and achieve market acceptance for flat panel displays and other new products that meet customer requirements, applicableour business will be adversely affected.
Although historically a substantial majority of our revenues has come from sales of air data systems and related products, we currently spend a large portion of our research and development efforts in developing and marketing our flat panel display systems and complementary products. Our ability to grow and diversify our officers, directorsoperations through introduction and 10% beneficial owners were complied with bysale of new products is dependent upon our success in continuing product development and engineering activities as well as our sales and marketing efforts and our ability to obtain requisite approvals to sell such persons, exceptproducts. Our sales growth will also depend in part on market acceptance of and demand for our CIP and future products. We cannot be certain we will be able to develop, introduce or market our CIP or other new products or product enhancements in a timely or cost-effective manner or that State Teachers Retirement System of Ohio filed a Form 3 on June 12, 2006 for a transaction that occurred on May 30, 2006 and a Form 4 on June 12, 2006 for transactions that occurred on June 5, 2006 and June 6, 2006.
Code of Ethicsany new products will receive market acceptance or necessary regulatory approval.
We adoptedrely on third party suppliers for components of our products, and any interruption in supply of these components could hinder our ability to deliver our products.
Our manufacturing process consists primarily of assembling components purchased from our supply chain. These suppliers may not continue to be available to us. If we are unable to maintain relationships with key third party suppliers, the development and distribution of our products could be delayed until equivalent components can be obtained and integrated into our products. In addition, substitution of certain components from other manufacturers may require FAA or other approval, which could delay our ability to ship products.
Government contracts can be terminated by the government at any time and therefore may not result in sales.
Our government retrofit projects are generally pursuant to either a Codedirect contract with a government agency or a subcontract with a general contractor to a government agency. Each contract includes various federal regulations that impose certain requirements on us, including the ability of Ethics (the “Codethe government agency or general contractor to alter the price, quantity or delivery schedule of Ethics”) applicable to our Directors, our principal executive officer and principal financial and accounting officer and persons performing similar functions.products. In addition, the Codegovernment agency or general contractor retains the right to terminate the contract at any time at its convenience. Upon alteration or termination of Ethics appliesthese contracts, we would be entitled to an equitable adjustment to the contract price so we may receive the purchase price for items we have delivered and reimbursement for allowable costs we have incurred. Accordingly, because these contracts can be terminated, we cannot assure you that our government retrofit backlog will result in sales.
We depend on key personnel to manage our business effectively, and if we are unable to retain our key employees, our ability to compete could be harmed.
Our success depends on the efforts, abilities and expertise of our senior management and other key personnel. There can be no assurance we will be able to retain such employees, the loss of some of whom could hurt our ability to execute our business strategy. We intend to continue hiring key management and sales and marketing personnel. Competition for such personnel is intense, and we may not be able to attract or retain additional qualified personnel.
Our future success will depend in part on our ability to implement and improve our operational, administrative and financial systems and controls and to manage, train and expand our employee base. We cannot assure you that after giving effect to our employees, officers, agentsrecent cost containment initiatives that our current and representatives.planned personnel levels, systems, procedures and controls will be adequate to support our future operations. If inadequate, we may not be able to exploit existing and potential market opportunities. Any delays or difficulties we encounter could impair our ability to attract new customers or enhance our relationships with existing customers.
Our revenue and operating results may vary significantly from quarter to quarter, which may cause our stock price to decline.
Our revenue and operating results may vary significantly from quarter to quarter due to a number of factors, including:
- •
- demand for our products and or schedule delivery changes by our customers;
- •
- capital expenditure budgets of aircraft owners and operators and appropriation cycles of the U.S. government;
- •
- changes in the use of our products, including air data systems and flat panel displays;
- •
- delays in introducing or obtaining government approval for new products;
- •
- new product introductions by competitors;
- •
- changes in our pricing policies or pricing policies of our competitors, and
- •
- costs related to possible acquisition of technologies or businesses.
We plan to expand our sales and marketing operations and fund greater levels of product development. As a result, a delay in generating revenues could cause significant variations in our operating results from quarter to quarter.
Our competition includes other manufacturers of air data systems and flight information displays against whom we may not be able to compete successfully.
The Codemarkets for our products are intensely competitive and subject to rapid technological change. Our competitors include Kollsman, Inc., Honeywell International Inc., Rockwell Collins Inc., GE Aviation and L-3 Communications. Substantially all of Ethicsour competitors have significantly greater financial, technical and human resources than we do. In addition, our competitors have much greater experience in and resources for marketing their products. As a result, our competitors may be able to respond more quickly to new or emerging technologies and customer preferences or devote greater resources to development, promotion and sale of their products than we can. Our competitors may also have greater name recognition and more extensive customer bases that they can use to their benefit. This competition could result in price reductions, fewer customer orders, reduced gross margins and loss of market share.
We may not be able to identify or complete acquisitions or we may consummate an acquisition that adversely affects our operating results.
One of our strategies is postedto acquire businesses or technologies that complement our existing operations. We have limited experience in acquiring businesses or technologies. There can be no assurance we will be able to acquire or profitably manage acquisitions or successfully integrate them into our operations. Furthermore, certain risks are inherent in pursuing acquisitions, such as the diversion of management's time and attention and combining disparate company cultures and facilities. Acquisitions may have an adverse effect on our operating results, particularly in quarters immediately following the consummation of such transactions, as we integrate operations of acquired businesses into our operations. Once integrated, acquisitions may not perform as expected.
Our success depends on our ability to protect our proprietary rights, and there is a risk of infringement. If we are unable to protect and enforce our intellectual property rights, we may be unable to compete effectively.
Our success and ability to compete will depend in part on our ability to obtain and maintain patent or other protection for our technology and products, both in the United States and abroad. In addition, we must operate without infringing the proprietary rights of others.
We currently hold 19 U.S. patents and have 6 U.S. patent applications pending. In addition, we hold 16 international patents and have 30 international patent applications pending. We cannot be certain that patents will be issued on any of our present or future applications. In addition, our existing patents or any future patents may not adequately protect our technology if they are not broad enough, are successfully challenged or other entities are able to develop competing methods without violating our patents. If we are not successful in protecting our intellectual property, competitors could begin to offer products that incorporate our technology. Patent protection involves complex legal and factual questions and, therefore, is highly uncertain, and litigation relating to intellectual property is often very time consuming and expensive. If a successful claim of patent infringement were made against us or we are unable to develop non-infringing technology or license the infringed or similar technology on a timely and cost-effective basis, we might not be able to make some of our products. In addition, we have in the past and may continue in the future to incur significant legal and other costs in defense of our intellectual property.
Potential lenders may have suffered losses related to the weakening economy and may not be able to provide us with needed financing.
Potential lenders may have suffered losses related to their lending and other financial relationships, especially because of the general weakening of the national economy and increased financial instability
of many borrowers. As a result, lenders may become insolvent or tighten their lending standards, which could make it more difficult for us to borrow or to obtain new financing on favorable terms or at all. Our financial condition and results of operations would be adversely affected if we were unable to obtain cost-effective financing in the future.
Risks Related to Our Industry
If we are unable to respond to rapid technological change, our products could become obsolete and our reputation could suffer.
Future generations of air data systems, engine and fuel displays, and flat panel displays embodying new technologies or new industry standards could render our products obsolete. The market for aviation products is subject to rapid technological change, new product introductions, changes in customer preferences and evolving industry standards. Our future success will depend on our ability to:
- •
- adapt to rapidly changing technologies;
- •
- adapt our products to evolving industry standards; and
- •
- develop and introduce a variety of new products and product enhancements to address the increasingly sophisticated needs of our customers.
Our future success will also depend on our developing high quality, cost-effective products and enhancements to our products that satisfy needs of customers and on our introducing these new technologies to the marketplace in a timely manner. If we fail to modify or improve our products in response to evolving industry standards, our products could rapidly become obsolete.
Our products are currently subject to direct regulation by the FAA, its European counterpart, the European Aviation Safety Administration (EASA), and other comparable organizations. Our products, as they relate to aircraft applications, must be approved by the FAA, EASA or other comparable organizations before they can be used in an aircraft. To be certified, we must demonstrate that our products are accurate and able to maintain certain levels of repeatability over time. Although certification requirements of the FAA and the EASA are substantially similar, there is no formal reciprocity between the two systems. Accordingly, even though some of our products are FAA-approved, we may need to obtain approval from the EASA or other appropriate organizations to have them certified for installation outside the United States.
Significant delay in receiving certification for newly developed products or enhancements to our products or losing certification for our existing products could result in lost sales or delays in sales. Furthermore, adoption of additional regulations or product standards, as well as changes to existing product standards, could require us to change our products and underlying technology. We cannot assure you that we will receive regulatory approval on a timely basis or at all.
Because our products utilize sophisticated technology and are deployed in complex aircraft cockpit environments, problems with these products may arise that could seriously harm our reputation for quality assurance and our business.
Our products use complex system designs and components that may contain errors, omissions or defects, particularly when we incorporate new technologies into our products or we release new versions or enhancements of our products. Despite our quality assurance process, errors, omissions or defects could occur in our current products, in new products or in new versions or enhancements of existing products after commercial shipment has begun. We may be required to redesign or recall those products or pay damages. Such an event could result in the following:
- •
- delay or loss of revenues;
- •
- cancellation of customer contracts;
- •
- diversion of development resources;
- •
- damage to our reputation;
- •
- increased service and warranty costs; or
- •
- litigation costs.
Although we currently carry product liability insurance, this insurance may not be adequate to cover our losses in the event of a product liability claim. Moreover, we may not be able to maintain such insurance in the future.
We have limited experience in marketing and distributing our products internationally.
We expect to derive an increasing amount of our revenues from sales outside the United States, particularly in Europe. There are certain risks inherent in doing business on an international basis, such as:
- •
- differing regulatory requirements for products being installed in aircraft;
- •
- legal uncertainty regarding liability;
- •
- tariffs, trade barriers, and other regulatory barriers;
- •
- political and economic instability;
- •
- changes in diplomatic and trade relationships;
- •
- potentially adverse tax consequences;
- •
- the impact of recessions in economies outside the United States; and
- •
- variance and unexpected changes in local laws and regulations.
Currently, all of our international sales are denominated in U.S. dollars. An increase in the dollar's value of the compared to other currencies could make our products less competitive in foreign markets. In the future, we may be required to conduct sales in local currencies, exposing us to changes in exchange rates that could adversely affect our operating results.
Item 1B. Unresolved Staff Comments.
None
In fiscal 2001 we purchased 7.5 acres of land in the Eagleview Corporate Park in Exton, Pennsylvania. There we constructed a 44,800 square foot design, manufacturing and office facility. Land development approval allows for expansion of up to 20,400 additional square feet. This would provide for a 65,200 square foot facility. The construction was principally funded with a Chester County, Pennsylvania, Industrial Revenue Bond. The building serves as security for the Industrial Revenue Bond.
In the ordinary course of business, we are at times subject to various legal proceedings. Except with respect to the fees incurred in connection with the matters described below, we do not believe any current legal proceedings will have a material adverse effect on our results of operations or financial position.
On September 13, 2005 the Company filed a lawsuit in the United States District Court for the Western District of Tennessee against J2, Inc., a company founded and jointly owned by Joseph Cesar, a former employee of the Company, and James Zachary, a former sales consultant for the Company. The complaint alleged that the J2/Kollsman/Air Data Computer then being marketed by J2 and manufactured by Kollsman, Inc. infringed a patent assigned to IS&S.
On November 7, 2007 the Company received a favorable jury verdict in its trade secret misappropriation case against Kollsman, Inc. (a subsidiary of Elbit Systems Ltd.), J2 Inc., Joseph Caesar, James Zachary and Zachary Technologies, Inc. in the United States District Court for the Western District of Tennessee. The jury unanimously found that each of the defendants had misappropriated IS&S's air data computer technology. The jury found that IS&S had suffered damages of just over $4.4 million in lost profits and $1.6 million in defendants' net profits, for a total of over $6 million. The jury also found in favor of IS&S's claims for breach of duty and contract, and unfair competition against J2 Inc., Joseph Caesar, James Zachary and Zachary Technologies, Inc.
On December 18, 2007, the court entered a temporary injunction aimed at preventing further use of the Company's trade secret and proprietary information. On March 14, 2008, the judge presiding over the case heard the Company's claims for a permanent injunction as well as punitive and exemplary damages and attorneys' fees against Kollsman and the other defendants.
On July 7, 2008, the court issued several rulings in the case. In the rulings, the court awarded damages, interest and fees in addition to the more than $6 million in compensatory damages awarded by the jury when it rendered its verdict in the case in November 2007. The additional awards bring the damages assessed against Kollsman, Inc. to a total or more than $23 million. The court also entered an order granting the Company's request for permanent injunctive relief.
On August 27, 2008, the Company entered into a Settlement Agreement (the Settlement Agreement) with Kollsman, Inc. On August 29, 2008, the settlement became effective with respect to all claims filed by the Company and Kollsman against each other in the United States District Court for the Western District of Tennessee and a Consent Order was entered. Under the Settlement Agreement, all claims between the Company and Kollsman have been dismissed with prejudice, a final agreed injunction has been entered and the matter has been fully and finally mutually settled without any admission of guilt by either party. In addition, an agreed settlement payment of $17 million has been made by Kollsman to the Company.
On October 9, 2008, Zachary and ZTI consented to the entry of judgment against and to a permanent injunction, which resulted in the conclusion of all claims with respect to those parties. On November 17, 2008, the court granted the Company's motion to dismiss its patent infringement claims against Caesar and J2, and dismissed Caesar and J2's counterclaims for noninfringement, invalidity and unenforceability because there was no longer a justifiable claim or controversy with respect to those counterclaims.
On January 17, 2007 the Company filed suit in Pennsylvania state court against Strathman Associates, a former software consultant for IS&S, alleging that Strathman had improperly used IS&S trade secret and proprietary information in assisting J2 and Kollsman in developing the J2/Kollsman Air Data Computer. The case is ongoing.
Through September 30, 2008 and 2007 the Company has incurred approximately $13.6 million and $8.0 million, respectively, in legal fees in connection with the two matters discussed above.
Item 4. Submission of Matters to a Vote of Security Holders.
No matters were submitted to a vote of our shareholders during the three months ended September 30, 2008.
Item 5. Market for the Registrant's Common Equity, Related Stockholder Matters and Issuer Repurchases of Equity Securities.
Our common stock has been traded on the Company’s website, www.innovative-ss.com,Nasdaq Stock Market, LLC under the heading Investor Relations.symbol "ISSC" since our initial public offering on August 4, 2000. The following table lists the high and low per share sale prices for our common stock for the periods indicated:
| | Fiscal 2008 | Fiscal 2007 | |||||||||||
|---|---|---|---|---|---|---|---|---|---|---|---|---|---|
Period | High | Low | High | Low | |||||||||
First Quarter | $ | 22.20 | $ | 9.00 | $ | 18.19 | $ | 14.14 | |||||
Second Quarter | 12.61 | 7.73 | 27.21 | 16.01 | |||||||||
Third Quarter | 12.00 | 6.39 | 29.42 | 21.74 | |||||||||
Fourth Quarter | 9.18 | 4.52 | 23.99 | 14.26 | |||||||||
On December 5, 2008, there were 20 holders of record of the shares of outstanding common stock. This does not reflect beneficial shareholders who hold their stock in nominee or "street" name through brokerage firms.
Item 11. Executive compensation. We paid a special cash dividend of $1.00 per share on September 29, 2008 on our common stock. The amounts necessary to pay the special dividend were funded in cash from the proceeds received in connection with the Company's settlement with Kollsman, Inc. We do not expect to declare or pay cash dividends on our common stock in the near future. We intend to retain any earnings to finance the growth of our business.
On February 21, 2008 the Company's Board of Directors approved a common stock repurchase program to acquire up to 1,000,000 shares of our outstanding common stock. Purchases of the stock were to be made from time to time, subject to market conditions and at prevailing market prices. The program will remain in effect until February 21, 2009, unless extended by the Board of Directors. During fiscal year 2008 we purchased 173,000 shares of common stock under the program at a cost of $1.0 million, or an average market price of $6.06 per share. We financed these purchases through our available cash. We did not make any common stock repurchases during the fiscal year ended September 30, 2007. The following table sets forth the cash compensationpurchases made each month of the three months ended September 30, 2008:
Period | Total Number of Shares Purchased | Average Price Paid per Share | Total Number of Shares Purchased as Part of Publicly Announced Plans or Programs | Maximum Number of Shares that May Yet Be Purchased Under the Program | |||||||||
|---|---|---|---|---|---|---|---|---|---|---|---|---|---|
July 2008 | — | — | — | 993,000 | |||||||||
August 2008 | — | — | — | 993,000 | |||||||||
September 2008 | 166,000 | $ | 5.97 | 166,000 | 827,000 | ||||||||
Total | 166,000 | 166,000 | |||||||||||
COMPARISON OF 5 YEAR CUMULATIVE TOTAL RETURN*
Among Innovative Solutions and Support, Inc., The NASDAQ Composite Index
And The Russell 2000 Index
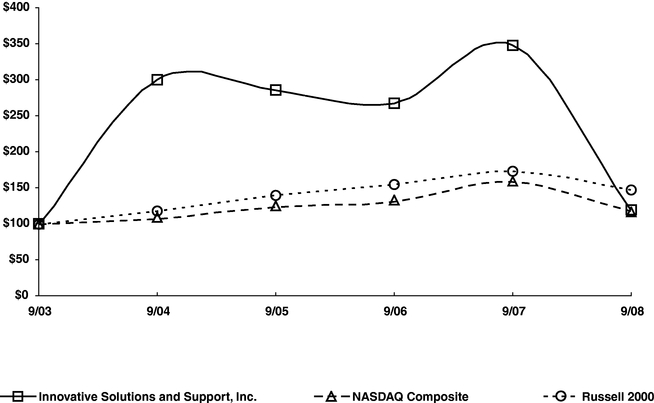
| | 9/03 | 9/04 | 9/05 | 9/06 | 9/07 | 9/08 | |||||||||||||
|---|---|---|---|---|---|---|---|---|---|---|---|---|---|---|---|---|---|---|---|
Innovative Solutions and Support, Inc. | 100.00 | 300.61 | 285.48 | 267.10 | 348.71 | 120.42 | |||||||||||||
NASDAQ Composite | 100.00 | 107.78 | 122.80 | 131.27 | 158.39 | 118.78 | |||||||||||||
Russell 2000 | 100.00 | 118.77 | 140.09 | 154.00 | 173.00 | 147.94 | |||||||||||||
- *
- $100 invested on 9/30/03 in stock or index—including reinvestment of dividends.
Fiscal year ending September 30.
The graph above shows the cumulative shareholder return on $100 invested at the market close on September 30, 2003 through and including September 30, 2008, the last trading day before the end of our most recently completed fiscal year, with the cumulative total return over the same time period of the same amount invested in the Nasdaq Composite Index and the Russell 2000 Index.
Item 6. Selected Consolidated Financial Data.
The following tables present portions of our consolidated financial statements. You should read the following selected consolidated financial data set forth below together with "Management's Discussion and Analysis of Financial Condition and Results of Operations" and our consolidated financial statements and related notes to our financial statements appearing elsewhere herein. The selected statement of operations data for the fiscal years ended September 30, 2008, 2007 and 2006 and the balance sheet data as wellof September 30, 2008 and 2007 are derived from our audited consolidated financial statements included elsewhere in this Annual Report on Form 10-K. The selected statements
of operations data for the fiscal years ended September 30, 2005 and 2004 and the balance sheet data as certain other compensation paid or accrued during fiscal yearsof September 30, 2006, 2005 and 2004 toare derived from our chief executive officer and each other executive officer who earned more than $100,000 during fiscal year 2006 (collectively, the “Named Executive Officers”) for services renderedaudited consolidated financial statements that are not included in such years:this Annual Report on Form 10-K.
|
|
|
|
|
|
| Long-Term |
|
|
| ||||||||||
|
|
|
|
|
|
|
| Compensation |
|
|
| |||||||||
|
|
|
|
|
|
|
| Awards |
|
|
| |||||||||
|
|
|
|
|
|
|
| Securities |
|
|
| |||||||||
|
| Annual Compensation |
| Underlying |
| All Other |
| |||||||||||||
Name and Principal Position |
|
|
| Year |
| Salary |
| Bonus |
| Options |
| Compensation |
| |||||||
Geoffrey S. M. Hedrick |
| 2006 |
| $ | 400,000 |
| $ | 1,945 |
|
| — |
|
|
| $ | 3,270 | (2) |
| ||
Chief Executive Officer |
| 2005 |
| $ | 432,692 | (1) | $ | 4,225 |
|
| — |
|
|
| $ | 4,900 | (3) |
| ||
| 2004 |
| $ | 350,000 |
| — |
|
| — |
|
|
| $ | 5,936 | (3) |
| ||||
Roman G. Ptakowski |
| 2006 |
| $ | 250,000 |
| $ | 1,703 |
|
| — |
|
|
| — |
|
| |||
President |
| 2005 |
| $ | 250,000 |
| $ | 30,000 |
|
| — |
|
|
|
|
|
| |||
|
| 2004 |
| $ | 250,000 |
|
|
|
|
|
|
|
| $ | 57,903 | (4) |
| |||
James J. Reilly |
| 2006 |
| $ | 200,000 |
| $ | 1,768 |
|
| — |
|
|
|
|
|
| |||
Chief Financial Officer |
| 2005 |
| $ | 192,308 |
| $ | 4,225 |
|
| 15,000 |
|
|
|
|
|
| |||
| 2004 |
| $ | 180,000 |
| — |
|
| — |
|
|
| — |
|
| |||||
| | Fiscal year ended September 30, | ||||||||||||||||
|---|---|---|---|---|---|---|---|---|---|---|---|---|---|---|---|---|---|
| | 2008 | 2007 | 2006 | 2005 | 2004 | ||||||||||||
Statement of Operations Data: | |||||||||||||||||
Net sales | $ | 30,533,311 | $ | 18,348,128 | $ | 16,721,967 | $ | 63,264,359 | $ | 46,099,777 | |||||||
Cost of sales | 20,551,857 | 14,154,425 | 8,631,761 | 20,888,729 | 15,663,108 | ||||||||||||
Gross profit | 9,981,454 | 4,193,703 | 8,090,206 | 42,375,630 | 30,436,669 | ||||||||||||
Research and development | 10,304,279 | 5,180,360 | 6,749,426 | 6,057,889 | 4,811,156 | ||||||||||||
Selling, general and administrative | 22,306,016 | 15,840,255 | 9,863,758 | 8,898,622 | 7,567,959 | ||||||||||||
Asset impairment | 2,475,000 | — | — | — | — | ||||||||||||
Total operating expenses | 35,085,295 | 21,020,615 | 16,613,184 | 14,956,511 | 12,379,115 | ||||||||||||
Operating income (loss) | (25,103,841 | ) | (16,826,912 | ) | (8,522,978 | ) | 27,419,119 | 18,057,554 | |||||||||
Interest income, net | 1,415,732 | 2,886,602 | 3,091,986 | 1,764,246 | 404,727 | ||||||||||||
Other income | 17,300,000 | — | — | — | — | ||||||||||||
Income (loss) before income taxes | (6,388,109 | ) | (13,940,310 | ) | (5,430,992 | ) | 29,183,365 | 18,462,281 | |||||||||
Income tax expense (benefit), net | 1,509,139 | (5,095,022 | ) | (2,548,600 | ) | 10,598,563 | 6,530,084 | ||||||||||
Net income (loss) | $ | (7,897,248 | ) | $ | (8,845,288 | ) | $ | (2,882,392 | ) | $ | 18,584,802 | $ | 11,932,197 | ||||
Net income (loss) per common share: | |||||||||||||||||
Basic | $ | (0.47 | ) | $ | (0.52 | ) | $ | (0.17 | ) | $ | 1.04 | $ | 0.69 | ||||
Diluted | $ | (0.47 | ) | $ | (0.52 | ) | $ | (0.17 | ) | $ | 1.02 | $ | 0.67 | ||||
Weighted average shares outstanding | |||||||||||||||||
Basic | 16,887,049 | 16,865,028 | 17,388,524 | 17,873,780 | 17,400,380 | ||||||||||||
Diluted | 16,887,049 | 16,865,028 | 17,388,524 | 18,259,856 | 17,928,180 | ||||||||||||
(1) Includes $32,692 of retroactive pay from fiscal 2004.
(2) Automobile Allowance.
| | As of September 30, | |||||||||||||||
|---|---|---|---|---|---|---|---|---|---|---|---|---|---|---|---|---|
| | 2008 | 2007 | 2006 | 2005 | 2004 | |||||||||||
Balance Sheet Data: | ||||||||||||||||
Cash and cash equivalents | $ | 35,031,932 | $ | 49,151,078 | $ | 62,984,829 | $ | 83,172,582 | $ | 65,867,167 | ||||||
Working capital | 42,491,253 | 62,453,234 | 73,751,866 | 93,455,475 | 70,627,114 | |||||||||||
Total Assets | 59,896,714 | 84,585,785 | 87,232,880 | 107,034,878 | 87,468,627 | |||||||||||
Debt and capital lease obligations, less current portion | 4,362,725 | 4,382,542 | 4,339,587 | 4,248,113 | 4,255,681 | |||||||||||
Total shareholders' equity | 59,896,714 | 70,733,779 | 78,201,353 | 97,866,098 | 75,454,987 | |||||||||||
(3) Automobile & Airplane allowance.
(4)Table of Contents This
Item 7. Management's Discussion and Analysis of Financial Condition and Results of Operations.
The following discussion and analysis should be read in conjunction with "Selected Consolidated Financial Data" and our financial statements and the related notes included in this report.
Overview
Innovative Solutions and Support was founded in 1988. The Company designs, develops, manufactures and sells flight information computers, large flat-panel displays and advanced monitoring systems that measure and display critical flight information, including data relative to aircraft separation, airspeed, altitude as well as engine and fuel data measurements.
Our sales are derived from the sale of our products to the retrofit market and, to a lesser extent, original equipment manufacturers. Our customers include the DoD and their commercial contractors, aircraft operators, aircraft modification centers and various OEMs. Although we occasionally sell our products directly to the DoD, we primarily have sold our products to commercial customers for end use in DoD programs. Sales to defense contractors are on commercial terms, although some of the termination and other provisions of government contracts are applicable to these contracts.
Our cost-of-sales related to product sales is comprised of material components purchased through our supplier base and direct in-house assembly labor and overhead costs. Many of the components we use in assembling our products are standard, although certain parts are manufactured to meet our specifications. The overhead portion of cost of sales is primarily comprised of salaries and benefits, building occupancy, supplies, and outside service costs related to our production, purchasing, material control and quality departments, and warranty costs.
Our cost of sales related to Engineering—modification and development (EMD) is comprised of engineering labor, consulting services, and other cost associated with specific design and development projects.
We intend to continue investing in the development of new products that complement our current product offerings and will expense associated research and development costs as they are incurred.
Our selling, general and administrative expenses consist of sales, marketing, business development, professional services, and salaries and benefits for executive and administrative personnel as well as facility costs, recruiting, legal, accounting, and other general corporate expenses.
We sell our products to agencies of the United States and foreign governments, aircraft operators, aircraft modification centers and original equipment manufacturers. Our customers have been and may continue to be affected by the ongoing adverse economic conditions that currently exist both in the United States and abroad. Such conditions may cause our customers to curtail or delay their spending on both new and existing aircraft. Factors that can impact general economic conditions and the level of spending by our customers include but are not limited to general levels of consumer spending, increases in fuel and energy costs, conditions in the real estate and mortgage markets, labor and healthcare costs, access to credit, consumer confidence and other macroeconomic factors affecting spending behavior. In addition, spending by government agencies may in the future be further reduced due to declining tax revenues associated with this economic downturn. If our customers curtail or delay their spending or are forced to declare bankruptcy or liquidate their operations due to continuing adverse economic conditions, our revenues and results of operations will be adversely affected. However, we believe that in a declining economic environment customers that may have otherwise elected to purchase newly manufactured aircraft will instead be interested in retrofitting existing aircraft as a cost effective alternative, which will create a market opportunity for our products.
On November 25, 2008, Eclipse Aviation filed a voluntary petition for relief under Chapter 11 of the U.S. Bankruptcy Code. Given the early stages if the bankruptcy proceedings, it is unclear at this
time what the precise impact the Eclipse's bankruptcy will have. During the fiscal year ended September 30, 2008, Eclipse accounted for approximately 42% of the Company's overall revenues.
During the fourth quarter of fiscal 2008, the Company took steps to limit its overall exposure to Eclipse, including by increasing the allowance for doubtful accounts and inventory obsolescence specifically for Eclipse by $4.1 million and $1.9 million, respectively. In response to the lost future revenues from Eclipse and the overall downward turn in the economy, the Company reduced its overall headcount by 52 people. The reductions affect most of the departments in the Company with the majority of the reductions coming from the engineering department. The Company expects to see a significant reduction in its overall headcount costs in fiscal 2009 as a result of these actions.
Results of Operations
Fiscal Year Ended September 30, 2008 Compared to Fiscal Year Ended September 30, 2007
Net sales. Net sales increased $12.2 million or 66% to $30.5 million for fiscal 2008 from $18.3 million for fiscal 2007. Flat panel display system sales for fiscal 2008 grew by $13.9 million or 142% from fiscal 2007 while air data sales for fiscal 2008 declined by $1.7 million or 20% from fiscal 2007. The increase in net sales was the result of a $1.3 million increase in EMD flat panel display system sales associated with the Eclipse 500, Pilatus PC-12 and C-130 airplanes. The increase in product sales of $10.9 million for fiscal 2008 was the result of increased shipments of flat panel display systems associated with the Eclipse 500, and the 757/767 product sold to American Airlines and Federal Express as these programs moved from development into production. The decline in air data product sales was a result of variability in customer demand that is not directly attributable to any particular customer or specific product.
Cost of sales. Cost of sales increased $6.4 million or 45% to $20.6 million, or 67% of net sales, for fiscal 2008 from $14.2 million, or 77% of net sales, for fiscal 2007. The increase in the dollar amount representswas mainly due to increased volume and the establishment of an inventory reserve associated with the suspension of activity related to the Eclipse program (Eclipse Aviation filed under Chapter 11 of the US Bankruptcy Code on November 25, 2008), offset by a relocation bonus.decrease in the direct costs associated with various EMD projects. The dollar amount of product cost of sales increased by $8.6 million or 96% in fiscal 2008 from fiscal 2007. On a percent to product sales basis the increase amounted to eight percentage points from the prior fiscal year.
Stock Option Grants Research and development. Research and development expenses increased $5.1 million, or 99% to $10.3 million, or 34% of net sales for fiscal 2008 from $5.2 million or 28% of net sales for fiscal 2007. The dollar increase was a result of a significant increase in staffing and other project costs in order to bring a variety of projects to completion in fiscal 2008. When you combine research and development expenses with EMD cost of sales, combined engineering research and development related expenses increased by $2.9 million or 29% to $13.3 million in fiscal 2008 from $10.4 million in fiscal 2007. The combined increase was due to increased salaries and associated benefits tied to employee additions, consultants and supplies.
Selling, general and administrative expenses. Selling, general and administrative expenses increased $6.5 million or 41% to $22.3 million, or 73% of net sales, for fiscal 2008 from $15.8 million, or 86% of net sales, for fiscal 2007. The increase in the dollar amount was principally due to the establishment of a bad debt reserve related to the Company's decision to suspend activity related to the Eclipse program (Eclipse Aviation filed under Chapter 11 of the US Bankruptcy Code on November 25, 2008) and expenses associated with the termination of the former CEO and the retirement of the former CFO.
Interest (income) expense, net. Net interest income decreased $1.5 million or 51% to $1.4 million for fiscal 2008 from $2.9 million for fiscal 2007. The net interest income decline in fiscal 2008 was due to lower average cash balances during the year.
There Other income. Other income was $17.3 million for fiscal 2008 primarily as a result of the receipt of $17.0 million in proceeds related to the settlement of the Company's trade secret litigation and $0.3 million related to short-swing profit disgorgement proceeds from a shareholder.
Income tax. The income tax expense for fiscal 2008 was $1.5 million and the income tax benefit for fiscal 2007 was $5.1 million. The effective tax rate for fiscal 2008 was an expense of 24% and for fiscal 2007 the effective tax rate was a benefit of 37%. For fiscal 2008 there was no tax benefit due to the inability of the Company, per the provisions of FAS 109, to recognize the tax benefits associated with the current year pretax loss and the need to establish a valuation allowance to eliminate the book value of all deferred tax assets based upon the negative evidence that exists. The effective tax rate for fiscal 2007 differs from the statutory rate due to state tax expense, partially offset by the utilization of research and development tax credits.
Net income (loss). As a result of the factors described above, our net loss for fiscal 2008 was $7.9 million. The net loss for fiscal 2007 was $8.8 million. On a fully diluted basis, the loss per share of $0.47 for fiscal 2008 compares to a loss per share of $0.52 for fiscal 2007.
Fiscal Year Ended September 30, 2007 Compared to Fiscal Year Ended September 30, 2006
Net sales. Net sales increased $1.6 million or 10% to $18.3 million for fiscal 2007 from $16.7 million for fiscal 2006. Flat panel display system sales for fiscal 2007 grew by $3.4 million or 53% while air data sales for fiscal year 2007 declined by $1.8 million or 17% from fiscal 2006. The increase in net sales was the result of a $2.5 million increase in EMD flat panel display system sales associated with the Eclipse 500 and Boeing KDC10 airplanes. The increase in EMD sales more than offset a $0.9 million or 5% year over year decline in product sales that resulted because of a decline in demand for air data products as well as certification delays on hardware transitioning from development to production.
Cost of sales. Cost of sales increased $5.6 million or 64% to $14.1 million, or 77% of net sales, for fiscal 2007 from $8.6 million, or 51% of net sales, for fiscal 2006. The increase in the dollar amount and percent to sales was mainly due to higher EMD sales in fiscal 2007 as well as incurring higher cost on the Eclipse program, over and above the amount Eclipse paid the Company for system development. The dollar amount of product cost of sales increased by $1.0 million or 12% in fiscal 2007 from fiscal 2006. On a percent to product sales basis the increase amounted to nine percentage points from the prior fiscal year.
Research and development. Research and development expenses decreased $1.5 million, or 24% to $5.2 million, or 28% of net sales for fiscal 2007 from $6.7 million or 40% of net sales for fiscal 2006. The dollar decrease was principally due to allocating $5.2 million of research and development expense to EMD cost of sales. The allocation was necessary to match non recurring engineering cost with corresponding non recurring engineering sales in the year. When you combine research and development expenses with EMD cost of sales, combined engineering research and development related expenses have increased by $3.1 million or 44% to $10.4 million in fiscal 2007 from $7.3 million in fiscal 2006. The combined increase was due to increased salaries and associated benefits tied to employee additions, consultants and supplies.
Selling, general and administrative expenses. Selling, general and administrative expenses increased $5.9 million or 60% to $15.8 million, or 86% of net sales, for fiscal 2007 from $9.9 million, or 59% of net sales, for fiscal 2006. The increase in both the dollar amount and percent to sales was principally due to legal and other fees relating to defense of our intellectual property.
Interest (income) expense, net. Net interest income decreased $0.2 million or 7% to $2.9 million for fiscal 2007 from $3.1 million for fiscal 2006. The net interest income decline in fiscal 2007 was due to lower average cash balances in the year.
Income tax. The income tax benefit for fiscal 2007 was $5.1 million. The income tax benefit for fiscal 2006 was $2.5 million. The increase in the amount of tax benefit in fiscal 2007 was the result of a higher loss before income tax in fiscal 2007.
The effective tax rate for fiscal 2007 was a benefit of 37% and for fiscal 2006 the effective tax rate was a benefit of 47%. For fiscal 2007 the effective tax rate differs from the statutory rate due to state tax expense, partially offset by the utilization of research and development tax credits. For fiscal 2006 the effective tax rate differs from the statutory rate due to the benefit for state income taxes and an adjustment to the tax payable accounts, partially offset by the loss of benefit from the deduction for domestic production activities and the exclusion for extraterritorial income due to the taxable loss for the year.
Net income (loss). As a result of the factors described above, our net loss for fiscal 2007 was $8.8 million. The net loss for fiscal 2006 was $2.9 million. On a fully diluted basis, the loss per share of $0.52 for fiscal 2007 compares to a loss per share of $0.17 for fiscal 2006.
Related-Party Transactions:
The Company incurred legal fees of $129,000, $146,000 and $357,000 with a law firm that is a shareholder of the Company for the years ended September 30, 2008, 2007 and 2006, respectively. The fees paid and services rendered were nocomparable with the fees paid and services rendered prior to the law firm's investment in the Company.
For the years ended September 30, 2008, 2007 and 2006, respectively, we incurred service fees of $67,000, $18,000 and $25,000 with a commercial graphics firm controlled by an individual who is married to a shareholder and daughter of the Company's Chairman and Chief Executive Officer.
Liquidity and Capital Resources
Our primary source of liquidity was cash flow generated in prior fiscal years. We require cash principally to finance inventory, payroll and accounts payable.
Cash flow provided by operating activities was $4.2 million in fiscal 2008 as compared to $10.6 million used in operating activities in fiscal 2007. The $14.8 million difference was attributable to a $17.0 million legal settlement, a decrease in accounts receivable of $0.9 million (principally the Eclipse reserve) and a decrease of $6.9 million in the change in prepaid expenses and other assets partially offset by a $5.4 million decrease in the change in accounts payable. The Company had negative operating cash flow of $1.6 million in fiscal 2006 primarily as a result of the net operating loss realized.
Cash used in investing activities was $0.6 million, $3.9 million and $0.7 million for fiscal year 2008, 2007, and 2006 and consisted of spending for licensing fees, production equipment and laboratory test equipment.
Cash used in financing activities was $17.7 million for fiscal year 2008 and consisted primarily of the special dividend of $16.7 million paid along with share repurchases of $1.0 million. Cash provided by financing activities was $0.6 million for fiscal year 2007 and consisted primarily of proceeds from stock option grantsexercises. Cash used in financing activities was $17.9 million for fiscal 2006. The primary use of cash for financing activities in fiscal year 2006 was attributable to share repurchases of $18.1 million.
To accommodate future growth, in 2001 we purchased 7.5 acres of land in the Eagleview Corporate Park, Exton, Pennsylvania, where we built a 44,800 square foot facility that is expandable to 65,200 square feet. Both the land and building cost approximate $6.5 million, $4.3 million of which was funded through an Industrial Development Bond (IDB) and the remainder from cash from operations.
The IDB previously required the Company to maintain certain financial covenants including a ratio of liabilities to earnings before interest, taxes and depreciation and amortization (EBITDA), fixed charge ratio and a minimum tangible net worth. As of June 30, 2006, the Company was in violation of certain of these financial covenants. The defaults were subsequently waived and an amendment to the agreement was entered into with the lender whereby the defaulted covenants were modified. Effective November 30, 2007 prior loan agreement covenants were changed to only require the Company to maintain at all times unencumbered cash and marketable securities having a market value of at least $20.0 million and a minimum Tangible Net Worth of $65.0 million. The lender, however, agreed on January 10, 2008 to discontinue the Tangible Net Worth covenant so that the only remaining requirement is that the Company maintain at all times unencumbered cash and marketable securities having a value of at least $20.0 million. As of September 30, 2008, the Company was in compliance with this requirement.
Our future capital requirements depend on numerous factors, including market acceptance of our products (in particular flat panel display systems), the timing and rate of expansion of our business, acquisitions, joint ventures and other factors. We have experienced increases in our expenditures since our inception consistent with growth in our operations, personnel, and product line and we anticipate that our operations and expenditures will continue to increase in the foreseeable future. We believe that our cash and cash equivalents will provide sufficient capital to fund our operations for at least the next twelve months. However, we may need to raise additional funds through public or private financing or other arrangements in order to support more rapid expansion of our business than we currently anticipate. Potential lenders may have suffered losses related to their lending and other financial relationships, especially because of the general weakening of the national economy and increased financial instability of many borrowers. As a result, lenders may become insolvent or tighten their lending standards, which could make it more difficult for us to borrow or to obtain new financing on favorable terms or at all. Our financial condition and results of operations would be adversely affected if we were unable to obtain cost-effective financing in the future. Further, we may develop and introduce new or enhanced products, respond to competitive pressures, invest in or acquire businesses or technologies or respond to unanticipated requirements or developments.
Our contractual obligations of as of September 30, 2008 mature as follows:
| | Payments Due by Period | |||||||||||||||
|---|---|---|---|---|---|---|---|---|---|---|---|---|---|---|---|---|
Contractual Obligations | Total | Less than 1 Year | 1-3 Years | 4-5 Years | After 5 Years | |||||||||||
Interest on loan from Chester County Industrial Dev. Auth.(1) | $ | 1,207,731 | $ | 172,533 | $ | 345,066 | $ | 345,066 | $ | 345,066 | ||||||
Principal on Chester County Industrial Loan | 4,335,000 | — | — | — | 4,335,000 | |||||||||||
Operating Lease | 39,065 | 39,065 | — | — | — | |||||||||||
Capital Leases, including interest | 55,152 | 13,788 | 27,576 | 13,788 | — | |||||||||||
Puchase Obligations(2) | 3,215,641 | 2,673,858 | 109,447 | 432,336 | — | |||||||||||
| $ | 8,852,589 | $ | 2,899,244 | $ | 482,089 | $ | 791,190 | $ | 4,680,066 | |||||||
- (1)
- The interest on the Industrial Development Bond assumes the current rate of 3.98%. The interest rate set by the remarketing agent is consistent with 30-day tax-exempt commercial paper.
- (2)
- A "purchase obligation" is defined as an agreement to purchase goods or services that is enforceable and legally binding on the company and that specifies all significant terms, including: fixed or minimum quantities to be purchased; fixed, minimum or variable price provisions; and the approximate timing of the transaction. These amounts are primarily comprised of open purchase order commitments entered in the ordinary course of business vendors and subcontractors pertaining to fulfillment of our current order backlog.
Off-Balance Sheet Arrangements
The Company has no off-balance sheet arrangements.
Inflation
We do not believe inflation had a material effect on our financial position or results of operations during the past three years, however, we cannot predict future effects of inflation.
Critical Accounting Policies
The preparation of financial statements in conformity with accounting principles generally accepted in the United States of America requires management to make estimates and assumptions that affect the reported amounts of assets and liabilities, disclosure of contingent assets and liabilities at the date of the financial statements and the reported amount of revenues and expenses during the reporting period. The Company's most critical accounting policies are revenue recognition, income taxes, inventory valuation, share-based compensation, and warranty reserves.
Revenue recognition
The Company recognizes revenue under the provisions of Staff Accounting Bulletin No. 104, "Revenue Recognition" (SAB 104).
The Company enters into certain sales arrangements that include multiple deliverables as defined in Emerging Issues Task Force (EITF) Issue No. 00-21, "Revenue Arrangements with Multiple Deliverables." The Company identifies all goods and/or services that are to be delivered separately under a sales arrangement and allocates revenue to each deliverable based on fair value. In general, revenues are separated between product sales and EMD sales. The allocated revenue for each deliverable is then recognized using appropriate revenue recognition methods.
The Company accounts for transactions with software that is more than incidental to the products under Statement of Position (SOP) 97-2. "Software Revenue Recognition" and EITF Issue 03-5, "Applicability of AICPA Statement of Position 97-2, Software Revenue Recognition, to Non-Software Deliverables in an Arrangement Containing More-Than-Incidental Software." For Software arrangements that include multiple elements, revenue is allocated to the various elements, including post contract customer support (PCS), if applicable, based on vendor-specific objective evidence of fair value. Revenue for each element other than PCS is recognized when all of the following criteria are met: 1) there is persuasive evidence that an arrangement exists; 2) delivery has occurred or services have been rendered; 3) the seller's price to the buyer is fixed or determinable; and 4) collectability is reasonably assured. The portion of revenue allocated to PCS should be recognized as revenue ratably over the term of the PCS arrangement because PCS services are assumed to be provided ratably.
Sales related to certain long-term contracts requiring development and delivery of products over several accounting periods are accounted for under the American Institute of Certified Public Accountants (AICPA) SOP 81-1, "Accounting for Performance of Construction-Type and Certain Production-Type Contracts." We consider the nature of these contracts as well as the types of products and services provided when determining appropriate accounting treatment for a particular contract. We recognize our construction-type contracts using either the percentage-of-completion method or completed contract method of accounting. We record sales relating to these contracts using the percentage-of-completion method when we determine that progress toward completion is reasonable and reliably estimable and the contract is long-term in nature; we use the competed contract method for all others.
The Company offers its customers extended warranties for additional fees. These warranty sales are recorded as deferred revenue and recognized as sales on a straight-line basis over the warranty period.
Income taxes
Income taxes are recorded in accordance with Statement of Financial Accounting Standards (SFAS) No. 109, "Accounting for Income Taxes" (SFAS 109). Provisions for federal and state income taxes are calculated on reported financial statement pre-tax income based on current tax law. The Company recognizes deferred tax assets and liabilities for temporary differences between the financial reporting basis and the tax basis of the Company's assets and liabilities and expected benefits of utilizing net operating loss carryforwards. The impact on deferred taxes of changes in tax rates and laws, if any, applied to the years during which temporary differences are expected to be settled, are reflected in the consolidated financial statements in the period of enactment.
As required by SFAS 109, we record a valuation allowance to reduce our deferred tax assets to the amount that is more likely than not to be realized. In evaluating our ability to recover our deferred tax assets we consider all available positive and negative evidence, including our operating results, ongoing tax planning, and forecasts of future taxable income on a jurisdiction by jurisdiction basis. In the event we were to determine that we would be able to realize our deferred tax assets in the future in excess of their net recorded amount, we would make an adjustment to the valuation allowance which would reduce the provision for income taxes.
Effective October 1, 2007 (the first day of fiscal 2008), we adopted Financial Accounting Standards Board (FASB) Interpretation No. 48, "Accounting for Uncertainty in Income Taxes" (FIN 48). FIN 48 prescribes a comprehensive model for how a company should recognize, measure, present and disclose in its financial statements uncertain tax positions that the company has taken or expects to take on a tax return. FIN 48 states that a tax benefit from an uncertain tax position may be recognized only if it is "more likely than not" that the position is sustainable based on its technical merits. The tax benefit of a qualifying position is the largest amount of tax benefit that is greater than 50% likely of being realized upon settlement with a taxing authority having full knowledge of all relevant information. A tax benefit from an uncertain position was previously recognized if it was probable of being sustained. Under FIN 48, the liability for unrecognized tax benefits is classified as noncurrent unless the liability is expected to be settled in cash within 12 months of the reporting date. We have elected to record any interest or penalties from the uncertain tax position as income tax expense (see Note 9).
We prepare and file tax returns based on our interpretation of tax laws and regulations, and we record estimates based on these judgments and interpretations. In the normal course of business, our tax returns are subject to examination by various taxing authorities. Such examinations may result in future tax and interest assessments by these taxing authorities and we record a liability when we believe that it is probable that we will be assessed. We adjust our estimates periodically because of ongoing examinations by and settlements with the various taxing authorities, as well as changes in tax laws, regulations and precedent. The consolidated tax provision of any given year includes adjustments to prior year income tax accruals that are considered appropriate and any related estimated interest. We believe adequate accruals have been made for income taxes. Differences between estimated and actual amounts determined upon ultimate resolution, individually or in the aggregate, are not expected to have a material adverse effect on our consolidated financial position but could possibly be material to our consolidated results of operations or cash flow of any one period.
Inventories
We value our inventory at the lower of cost (first-in, first-out) or market through the establishment of inventory reserves. Inventories are written down for estimated obsolescence equal to the difference
between inventory cost and estimated net realizable value based upon assumptions about future market conditions. Our reserve contains uncertainties because the calculation requires management to make assumptions and to apply judgment regarding inventory aging, forecasted future demand, market conditions and technological obsolescence. If actual future demand or market conditions are less favorable than those projected by management, additional inventory write-downs may be required.
Share-based compensation
Effective October 1, 2005 the Company adopted the provisions of SFAS No. 123R, "Share-Based Payment" (SFAS 123R), using the modified prospective approach and now accounts for share-based compensation applying the fair value method for expensing stock options. Accordingly, adoption of SFAS 123R's fair value method results in recording compensation costs under the Company's 1998 Stock Option Plan. We determine the fair value of our stock option awards at the date of grant using the Black-Scholes option pricing model. Option-pricing models and generally accepted valuation techniques require management to make assumptions and to apply judgment to determine the fair value of our awards. These assumptions and judgments include estimating future volatility of our stock price, expected dividend yield, future employee turnover rates and future employee stock option exercise behaviors. Changes in these assumptions can materially affect fair value estimates. We do not believe there is a reasonable likelihood that there will be a material change in the future estimates or assumptions we use to determine stock-based compensation expense. However, if actual results are not consistent with our estimates or assumptions, we may be exposed to changes in stock-based compensation expense that could be material.
Warranty reserves
We offer warranties on some products of various lengths. At the time of shipment, we establish a reserve for estimated costs of warranties based on our best estimate of the amounts necessary to settle future and existing claims using historical data on products sold as of the balance sheet date. The length of the warranty period, the product's failure rates and the customer's usage affects warranty cost. If actual costs of warranties differs from our estimated amounts, future results of operations could be adversely affected.
New Accounting Pronouncements
In December 2007, the FASB issued SFAS No. 141R, "Business Combinations" (SFAS 141R), which replaces SFAS No. 141, "Business Combinations." SFAS 141R, among other things, establishes principles and requirements for how an acquirer entity recognizes and measures in its financial statements the identifiable assets acquired, the liabilities assumed and any controlling interests in the acquired entity; recognizes and measures the goodwill acquired in the business combination or a gain from a bargain purchase; and determines what information to disclose to enable users of the financial statements to evaluate the nature and financial effects of the business combination. Costs of the acquisition will be recognized separately from the business combination. SFAS 141R applies prospectively, except for taxes, to business combinations for which the acquisition date is on or after the beginning of the first annual reporting period on or after December 15, 2008.
In September 2006, the FASB issued SFAS No. 157,Fair Value Measurements ("SFAS 157"). SFAS 157 defines fair value, establishes a framework for measuring fair value in generally accepted accounting principles, and expands disclosures about fair value measurements. This statement does not require any new fair value measurements; however, application of this Statement may change current practice for some entities. SFAS 157 is effective for fiscal years beginning after November 15, 2007. The Company is currently evaluating the impact of this pronouncement.
Business Segments
The Company operates in one principal business segment which designs, manufactures and sells flight information computers, large flat-panel displays and advanced monitoring systems to the DoD, government agencies, defense contractors, commercial air transport carriers and corporate/general aviation markets. The Company currently derives virtually all of its revenues from the sale of this equipment. Almost all of the Company's sales, operating results and identifiable assets are in the United States. Net sales, operating results, and identifiable assets outside the U.S. are not significant.
In fiscal year 2008, 2007, and 2006 net sales outside the United States amounted to $1.7 million, $1.1 million and $2.8 million respectively.
Item 7A. Quantitative and qualitative disclosures about market risk.
The Company's operations are exposed to market risks primarily as a result of changes in interest rates. The Company does not use derivative financial instruments for speculative or trading purposes. The Company's exposure to market risk for changes in interest rates relates to its cash equivalents and an industrial revenue bond. The Company's cash equivalents consist of funds invested in money market accounts, which bear interest at a variable rate, while the industrial revenue bond carries an interest rate that is consistent with 30-day tax-exempt commercial paper. As the interest rates are variable, a change in interest rates earned on the cash equivalents or paid on the industrial revenue bond would impact interest income and expense along with cash flows, but would not impact the fair market value of the related underlying instruments.
Item 8. Financial statements and supplementary data.
The financial statements of Innovative Solutions and Support, Inc. listed in the index appearing under Item 8 herein are filed as part of this Report.
Innovative Solutions and Support, Inc.
INDEX TO CONSOLIDATED FINANCIAL STATEMENTS
| Page | ||
|---|---|---|
Report of Independent Registered Public Accounting Firm | 32 | |
Consolidated Balance Sheets | 33 | |
Consolidated Statements of Operations | 34 | |
Consolidated Statements of Shareholders' Equity | 35 | |
Consolidated Statements of Cash Flows | 36 | |
Notes to Consolidated Financial Statements | 37-51 |
REPORT OF INDEPENDENT REGISTERED PUBLIC ACCOUNTING FIRM
To the Board of Directors and Shareholders of
Innovative Solutions and Support, Inc.
Exton, Pennsylvania
We have audited the accompanying consolidated balance sheets of Innovative Solutions and Support, Inc. and subsidiaries (the "Company") as of September 30, 2008 and 2007, and the related consolidated statements of operations, cash flows, and shareholders' equity for each of the three years in the period ended September 30, 2008. These consolidated financial statements are the responsibility of the Company's management. Our responsibility is to express an opinion on the financial statements based on our audits.
We conducted our audits in accordance with the standards of the Public Company Accounting Oversight Board (United States). Those standards require that we plan and perform the audit to obtain reasonable assurance about whether the financial statements are free of material misstatement. An audit includes examining, on a test basis, evidence supporting the amounts and disclosures in the financial statements. An audit also includes assessing the accounting principles used and significant estimates made by management, as well as evaluating the overall financial statement presentation. We believe that our audits provide a reasonable basis for our opinion.
In our opinion, such consolidated financial statements present fairly, in all material respects, the financial position of the Company as of September 30, 2008 and 2007, and the results of its operations and its cash flows for each of the three years in the period ended September 30, 2008, in conformity with accounting principles generally accepted in the United States of America.
As discussed in Note 9 to the consolidated financial statements, the Company adopted Financial Accounting Standards Board Interpretation No. 48,Accounting for Uncertainty in Income Taxes, effective October 1, 2007.
We have also audited, in accordance with the standards of the Public Company Accounting Oversight Board (United States), the Company's internal control over financial reporting as of September 30, 2008, based on the criteria established inInternal Control—Integrated Framework issued by the Committee of Sponsoring Organizations of the Treadway Commission and our report dated December 9, 2008 expressed an unqualified opinion on the Company's internal control over financial reporting.
DELOITTE & TOUCHE LLP
Philadelphia, Pennsylvania
December 9, 2008
INNOVATIVE SOLUTIONS AND SUPPORT, INC.
CONSOLIDATED BALANCE SHEETS
| | As of September 30, 2008 | As of September 30, 2007 | |||||||||
|---|---|---|---|---|---|---|---|---|---|---|---|
ASSETS | |||||||||||
Current Assets: | |||||||||||
Cash and cash equivalents | $ | 35,031,932 | $ | 49,151,078 | |||||||
Accounts receivable, net | 4,218,443 | 6,248,606 | |||||||||
Inventories | 9,361,257 | 9,363,795 | |||||||||
Deferred income taxes | 414,636 | 899,895 | |||||||||
Prepaid expenses and other current assets | 1,406,260 | 6,208,804 | |||||||||
Total current assets | 50,432,528 | 71,872,178 | |||||||||
Property and Equipment: | |||||||||||
Computers and test equipment | 5,879,362 | 5,444,737 | |||||||||
Corporate airplane | 3,076,400 | 3,058,627 | |||||||||
Furniture and office equipment | 1,074,029 | 1,016,954 | |||||||||
Manufacturing facility | 5,576,536 | 5,557,048 | |||||||||
Land | 1,021,245 | 1,021,245 | |||||||||
| 16,627,572 | 16,098,611 | ||||||||||
Less-Accumulated depreciation and amortization | (7,669,226 | ) | (6,721,274 | ) | |||||||
Net property and equipment | 8,958,346 | 9,377,337 | |||||||||
Deferred income taxes | — | 328,060 | |||||||||
Other assets | 505,840 | 3,008,210 | |||||||||
Total assets | $ | 59,896,714 | $ | 84,585,785 | |||||||
LIABILITIES AND SHAREHOLDERS' EQUITY | |||||||||||
Current Liabilities | |||||||||||
Current portion of capitalized lease obligations | $ | 9,908 | $ | 9,908 | |||||||
Accounts payable | 2,349,981 | 4,077,789 | |||||||||
Accrued expenses | 5,130,463 | 4,670,832 | |||||||||
Deferred revenue | 450,923 | 660,415 | |||||||||
Total current liabilities | 7,941,275 | 9,418,944 | |||||||||
Note payable | 4,335,000 | 4,335,000 | |||||||||
Long-term portion of capitalized lease obligations | 37,633 | 47,542 | |||||||||
Deferred revenue | 114,075 | 50,520 | |||||||||
Deferred income taxes | 414,636 | — | |||||||||
Other liabilities | 249,969 | ||||||||||
Commitments and contingencies | — | — | |||||||||
Shareholders' Equity: | |||||||||||
Preferred stock, 10,000,000 shares authorized, $.001 par value, of which 200,000 shares are authorized as Class A Convertible stock. No shares issued and outstanding at September 30, 2008 and 2007 | — | — | |||||||||
Common stock, $.001 par value: 75,000,000 shares authorized, 18,177,024 and 18,161,172 shares issued at September 30, 2008 and 2007 | 18,177 | 18,161 | |||||||||
Additional paid-in capital | 45,767,960 | 44,607,993 | |||||||||
Retained earnings | 20,152,615 | 44,194,053 | |||||||||
Treasury stock, at cost, 1,445,510 and 1,272,510, shares at September 30, 2008 and 2007 | (19,134,626 | ) | (18,086,428 | ) | |||||||
Total shareholders' equity | 46,804,126 | 70,733,779 | |||||||||
Total liabilities and shareholders' equity | $ | 59,896,714 | $ | 84,585,785 | |||||||
The accompanying notes are an integral part of these statements.
INNOVATIVE SOLUTIONS & SUPPORT, INC.
CONSOLIDATED STATEMENTS OF OPERATIONS
| | For the Fiscal Year Ended September 30, | |||||||||||
|---|---|---|---|---|---|---|---|---|---|---|---|---|
| | 2008 | 2007 | 2006 | |||||||||
Net sales: | ||||||||||||
Product | $ | 25,946,917 | $ | 15,083,465 | $ | 15,940,721 | ||||||
Engineering—modification and development | 4,586,394 | 3,264,663 | 781,246 | |||||||||
Total net sales | 30,533,311 | 18,348,128 | 16,721,967 | |||||||||
Cost of sales | ||||||||||||
Product | 17,584,314 | 8,968,939 | 8,006,406 | |||||||||
Engineering—modification and development | 2,967,543 | 5,185,486 | 625,355 | |||||||||
Total cost of sales | 20,551,857 | 14,154,425 | 8,631,761 | |||||||||
Gross profit | 9,981,454 | 4,193,703 | 8,090,206 | |||||||||
Operating expenses: | ||||||||||||
Research and development | 10,304,279 | 5,180,360 | 6,749,426 | |||||||||
Selling, general and administrative | 22,306,016 | 15,840,255 | 9,863,758 | |||||||||
Asset impairment | 2,475,000 | — | — | |||||||||
Total operating expenses | 35,085,295 | 21,020,615 | 16,613,184 | |||||||||
Operating loss | (25,103,841 | ) | (16,826,912 | ) | (8,522,978 | ) | ||||||
Interest income | 1,576,599 | 3,090,919 | 3,280,179 | |||||||||
Interest expense | (160,867 | ) | (204,317 | ) | (188,193 | ) | ||||||
Other income | 17,300,000 | — | — | |||||||||
Loss before income taxes | (6,388,109 | ) | (13,940,310 | ) | (5,430,992 | ) | ||||||
Income taxes expense (benefit) | 1,509,139 | (5,095,022 | ) | (2,548,600 | ) | |||||||
Net loss | $ | (7,897,248 | ) | $ | (8,845,288 | ) | $ | (2,882,392 | ) | |||
Net loss per common share: | ||||||||||||
Basic | $ | (0.47 | ) | $ | (0.52 | ) | $ | (0.17 | ) | |||
Diluted | $ | (0.47 | ) | $ | (0.52 | ) | $ | (0.17 | ) | |||
Weighted average shares outstanding: | ||||||||||||
Basic | 16,887,049 | 16,865,028 | 17,388,524 | |||||||||
Diluted | 16,887,049 | 16,865,028 | 17,388,524 | |||||||||
The accompanying notes are an integral part of these statements.
INNOVATIVE SOLUTIONS AND SUPPORT, INC.
CONSOLIDATED STATEMENTS OF SHAREHOLDERS' EQUITY
| | Common Stock | Additional Paid-in Capital | Retained Earnings | Treasury Stock | Total | |||||||||||
|---|---|---|---|---|---|---|---|---|---|---|---|---|---|---|---|---|
Balance, September 30, 2005 | $ | 18,047 | $ | 41,926,318 | $ | 55,921,733 | $ | — | $ | 97,866,098 | ||||||
Exercise of options to purchase common stock | 25 | 408,779 | — | — | 408,804 | |||||||||||
Share-based compensation | — | 655,351 | — | 655,351 | ||||||||||||
Issuance of stock to directors | 16 | 239,904 | — | — | 239,920 | |||||||||||
Purchase of treasury stock | — | — | — | (18,086,428 | ) | (18,086,428 | ) | |||||||||
Net loss | — | — | (2,882,392 | ) | — | (2,882,392 | ) | |||||||||
Balance, September 30, 2006 | 18,088 | 43,230,352 | 53,039,341 | (18,086,428 | ) | 78,201,353 | ||||||||||
Exercise of options to purchase common stock | 58 | 652,060 | — | — | 652,118 | |||||||||||
Share-based compensation | — | 505,652 | — | — | 505,652 | |||||||||||
Issuance of stock to directors | 15 | 219,929 | 219,944 | |||||||||||||
Net loss | — | — | (8,845,288 | ) | — | (8,845,288 | ) | |||||||||
Balance, September 30, 2007 | 18,161 | 44,607,993 | 44,194,053 | (18,086,428 | ) | 70,733,779 | ||||||||||
Exercise of options to purchase common stock | 5 | 22,055 | — | — | 22,060 | |||||||||||
Share-based compensation | 938,013 | — | — | 938,013 | ||||||||||||
Issuance of stock to directors | 11 | 199,899 | — | — | 199,910 | |||||||||||
Purchase of treasury stock | — | — | — | (1,048,198 | ) | (1,048,198 | ) | |||||||||
Cumulative effect of adoption of FIN 48 | — | — | 587,324 | — | 587,324 | |||||||||||
Dividends | (16,731,514 | ) | (16,731,514 | ) | ||||||||||||
Net loss | — | — | (7,897,248 | ) | — | (7,897,248 | ) | |||||||||
Balance, September 30, 2008 | $ | 18,177 | $ | 45,767,960 | $ | 20,152,615 | $ | (19,134,626 | ) | $ | 46,804,126 | |||||
The accompanying notes are an integral part of these statements.
INNOVATIVE SOLUTIONS AND SUPPORT, INC.
CONSOLIDATED STATEMENTS OF CASH FLOWS
| | For the Fiscal Year Ended September 30, | |||||||||||||
|---|---|---|---|---|---|---|---|---|---|---|---|---|---|---|
| | 2008 | 2007 | 2006 | |||||||||||
CASH FLOWS FROM OPERATING ACTIVITIES: | ||||||||||||||
Net loss | $ | 1,509,139 | $ | (8,845,288 | ) | $ | (2,882,392 | ) | ||||||
Adjustments to reconcile net income (loss) to net cash provided by (used in) operating activities: | ||||||||||||||
Depreciation and amortization | 1,048,267 | 946,215 | 858,641 | |||||||||||
Share-based compensation expense: | ||||||||||||||
Stock options | 938,013 | 505,652 | 655,351 | |||||||||||
Nonvested stock awards | 199,910 | 219,944 | 239,920 | |||||||||||
Tax benefit (expense) from share-based arrangements: | ||||||||||||||
Stock options | 10,497 | 162,985 | 227,965 | |||||||||||
Nonvested stock awards | (21,655 | ) | (3,588 | ) | (8,456 | ) | ||||||||
Provision for losses on accounts receivable | 4,077,319 | — | — | |||||||||||
Excess tax benefits from share-based payments arrangements | (11,424 | ) | (154,873 | ) | (44,504 | ) | ||||||||
Loss on disposal of fixed assets | 9,531 | 7,278 | 22,066 | |||||||||||
Excess and obsolete inventory expense | 1,856,827 | 100,000 | 38,861 | |||||||||||
Asset impairment | 2,475,000 | — | — | |||||||||||
Deferred income taxes | 1,227,955 | (635,096 | ) | (272,756 | ) | |||||||||
(Increase) decrease in: | ||||||||||||||
Accounts receivable | (2,047,156 | ) | (2,915,475 | ) | 2,146,805 | |||||||||
Inventories | (1,854,289 | ) | (2,997,639 | ) | (2,593,391 | ) | ||||||||
Prepaid expenses and other current assets | 4,802,544 | (2,143,108 | ) | (35,348 | ) | |||||||||
Other non current assets | (41,080 | ) | (88,446 | ) | — | |||||||||
Increase (decrease) in: | ||||||||||||||
Accounts payable | (1,727,808 | ) | 3,718,971 | 53,302 | ||||||||||
Accrued expenses | 1,046,955 | 1,548,291 | (381,272 | ) | ||||||||||
Deferred revenue | (145,937 | ) | (1,682 | ) | 344,504 | |||||||||
Other non current liabilities | 249,969 | — | — | |||||||||||
Net cash provided by (used in) operating activities | 13,602,577 | (10,575,859 | ) | (1,630,704 | ) | |||||||||
CASH FLOWS FROM INVESTING ACTIVITIES: | ||||||||||||||
Purchases of property and equipment | (573,357 | ) | (1,276,508 | ) | (456,528 | ) | ||||||||
Purchases of other assets | (2,616,500 | ) | (240,000 | ) | ||||||||||
Proceeds on sale of fixed assets | 3,000 | |||||||||||||
Net cash used in investing activities | (570,357 | ) | (3,893,008 | ) | (696,528 | ) | ||||||||
CASH FLOWS FROM FINANCING ACTIVITIES: | ||||||||||||||
Proceeds from exercise of stock options | 33,218 | 492,721 | 189,295 | |||||||||||
Purchase of treasury stock | (1,048,198 | ) | — | (18,086,428 | ) | |||||||||
Dividend paid | (16,731,514 | ) | — | — | ||||||||||
Repayment of capitalized lease obligations | (9,909 | ) | (12,478 | ) | (7,892 | ) | ||||||||
Excess tax benefits from share-based payments arrangements | 11,424 | 154,873 | 44,504 | |||||||||||
Net cash (used in) provided by financing activities | (17,744,979 | ) | 635,116 | (17,860,521 | ) | |||||||||
Net decrease in cash and cash equivalents | (4,712,759 | ) | (13,833,751 | ) | (20,187,753 | ) | ||||||||
Cash and cash equivalents, beginning of year | 49,151,078 | 62,984,829 | 83,172,582 | |||||||||||
Cash and cash equivalents, end of year | $ | 44,438,319 | $ | 49,151,078 | $ | 62,984,829 | ||||||||
SUPPLEMENTAL DISCLOSURE OF CASH FLOW INFORMATION | ||||||||||||||
Cash paid for interest | $ | 120,650 | $ | 164,091 | $ | 147,332 | ||||||||
Cash paid for income taxes | $ | 9,073 | $ | — | $ | 457,672 | ||||||||
Cash received from income tax refund | $ | (5,107,269 | ) | $ | (2,424,704 | ) | $ | (3,278,844 | ) | |||||
The accompanying notes are an integral part of these statements.
1. Background:
Innovative Solutions and Support, Inc., (the "Company"), was incorporated in Pennsylvania on February 12, 1988. The Company's primary business is the design, manufacture and sale of flight information computers, large flat panel displays and advanced monitoring systems to the Department of Defense (DoD), defense contractors, commercial air transport and corporate/general aviation markets.
2. Concentrations:
Major Customers and Products
In fiscal 2008, 2007, and 2006 the Company derived 72%, 58%, and 47% of net sales from five customers, although not all the same customers in each year. Accounts receivable related to those top five customers was $2.3 million, $4.7 million, and $1.8 million for fiscal 2008, 2007, and 2006, respectively.
The Company recorded sales with two customers that individually accounted for 42% and 10% of total sales for fiscal year 2008, three customers that individually accounted for 20%, 16% and 11% of net sales for fiscal year 2007 and one customer that accounted for 17% of net sales for fiscal year 2006.
Sales of air data systems and components were 23%, 47%, and 62% of total sales for the years ended September 30, 2008, 2007, and 2006 respectively. Flat Panel sales were 77%, 53%, and 38% of net sales in the years ended September 30, 2008, 2007. and 2006 respectively. Sales to government contractors and agencies accounted for approximately 23%, 36%, and 51% of total sales during fiscal years 2008, 2007, and 2006, respectively.
Major Suppliers
The Company currently buys several of its components from sole source suppliers. Although there are a limited number of manufacturers of particular components, management believes other suppliers could provide similar components on comparable terms.
Concentration of Credit Risk
Financial instruments that potentially subject the Company to concentration of credit risk consist principally of cash balances and accounts receivable. The Company invests its excess cash where preservation of principal is the major consideration. The Company's customer base principally consists of companies within the aviation industry. The Company routinely requests advance payments and/or letters of credit from new customers.
The Company has maintained a reserve for doubtful accounts in the amount of $4.1 million, $0 and $0.1 million for fiscal year 2008, 2007 and 2006, respectively. The large increase in the reserve for doubtful accounts in fiscal year 2008 was directly related to accounts receivable from Eclipse Aviation, a customer that filed for bankruptcy under Chapter 11 subsequent to the Company's year end. There were no accounts receivable write-offs in fiscal 2008, 2007, and 2006, respectively.
3. Summary Of Significant Accounting Policies:
Principles of Consolidation
The consolidated financial statements include the accounts of the Company and its subsidiaries. All material inter-company balances and transactions have been eliminated in consolidation.
3. Summary Of Significant Accounting Policies: (Continued)
Use of Estimates
Preparation of consolidated financial statements in conformity with accounting principles generally accepted in the United States of America requires management to make estimates and assumptions that affect reported amounts of assets and liabilities, and disclosure of contingent assets and liabilities, as of the date of the financial statements and the reported amounts of revenues and expenses during the reporting period. Actual results could differ materially from those estimates.
Cash and Cash Equivalents
Highly liquid investments purchased with an original maturity of three months or less are classified as cash equivalents. Cash equivalents at September 30, 2008 and 2007 consist of funds invested in money market accounts with financial institutions.
Inventories
Inventories are stated at the lower of cost (first-in, first-out) or market and consist of the following:
| | September 30, | ||||||
|---|---|---|---|---|---|---|---|
| | 2008 | 2007 | |||||
Raw materials | $ | 4,705,134 | $ | 6,420,184 | |||
Work-in-process | 3,046,451 | 2,216,111 | |||||
Finished goods | 1,609,672 | 727,500 | |||||
| $ | 9,361,257 | $ | 9,363,795 | ||||
The growth in Finished goods is a result of contractual requirements to hold inventory prior to scheduled delivery.
Property and Equipment
Property and equipment is stated at cost. Depreciation is provided using an accelerated method over estimated useful lives of the assets (the lesser of three to seven years or over the lease term), except for the airplane and manufacturing facility, which are depreciated over a straight-line method. Major additions and improvements are capitalized, while maintenance and repairs that do not improve or extend the life of assets are charged to expense as incurred. Depreciation expense was $1.0 million, $0.9 million and $0.8 million for the fiscal years ended September 30, 2008, 2007, and 2006.
Long-Lived Assets
The Company assesses the impairment of long-lived assets in accordance with SFAS No. 144, "Accounting for the Impairment or Disposal of Long-Lived Assets". This statement requires that long-lived assets be reviewed for impairment whenever events or changes in circumstances indicate the carrying amount of an asset may not be recoverable. Also, in general, long-lived assets to be disposed of should be reported at the lower of the carrying amount or fair value less cost to sell. The Company considers historical performance and future estimated results in its evaluation of potential impairment and then compares the carrying amount of the asset to estimated future cash flows expected to result from use of the asset. If the carrying amount of the asset exceeds the estimated expected undiscounted future cash flows, the Company measures the amount of the impairment by comparing the carrying amount of the asset to its fair value. The estimation of fair value is generally measured by discounting
3. Summary Of Significant Accounting Policies: (Continued)
expected future cash flows. The Company recorded an asset impairment of $2.5 million, the full carrying value of previously acquired engineering software which is no longer part of the Company's product offering and will generate no future cash flows. No impairment charges were recorded in fiscal years 2007 and 2006.
Revenue Recognition
The Company recognizes revenue under the provisions of Staff Accounting Bulletin (SAB) No. 104, "Revenue Recognition" (SAB 104).
The Company enters into certain sales arrangements that include multiple deliverables as defined in EITF Issue No. 00-21, "Revenue Arrangements with Multiple Deliverables." The Company identifies all goods and/or services that are to be delivered separately under a sales arrangement and allocates revenue to each deliverable based on fair value. In general, revenues are separated between product sales and EMD sales. The allocated revenue for each deliverable is then recognized using appropriate revenue recognition methods.
The Company accounts for transactions with software that is more than incidental to products under SOP 97-2 "Software Revenue Recognition" and EITF Issue 03-5, "Applicability of AICPA Statement of Position 97-2, Software Revenue Recognition, to Non-Software Deliverables in an Arrangement Containing More-Than-Incidental Software." For Software arrangements that include multiple elements revenue is allocated to the various elements, including the post contract customer support (PCS), if applicable, based on vendor-specific objective evidence of fair value. Revenue for each element other than PCS is recognized when all of the following criteria are met: 1) there is persuasive evidence that an arrangement exists; 2) delivery has occurred or services have been rendered; 3) the seller's price to the buyer is fixed or determinable; and 4) collectability is reasonably assured. The portion of the revenue allocated to PCS should be recognized as revenue ratably over the term of the PCS arrangement, because the PCS services are assumed to be provided ratably.
Sales related to certain long-term contracts requiring development and delivery of products over several accounting periods are accounted for under the American Institute of Certified Public Accountants (AICPA) Statement of Position (SOP) 81-1, "Accounting for Performance of Construction-Type and Certain Production-Type Contracts." The Company considers the nature of these contracts as well as the types of products and services provided when determining the appropriate accounting treatment for a particular contract. The Company recognizes its construction-type contracts using either the percentage-of-completion method or completed contract method of accounting. The Company records sales relating to these contracts using the percentage-of-completion method when the Company determines that progress toward completion is reasonable and reliably estimable and the contract is long-term in nature; the Company uses the competed contract method for all others. Sales related to these types of contracts were $1.4 million, $3.3 million and $.8 million for fiscal years ended September 30, 2008, 2007, and 2006 respectively.
The Company offers its customers extended warranties for additional fees. These warranty sales are recorded as deferred revenue and recognized as sales on a straight-line basis over the warranty period.
Warranty
Estimated cost to repair or replace products under warranty is provided when sales of product are recorded.
3. Summary Of Significant Accounting Policies: (Continued)
Income Taxes
Income taxes are recorded in accordance with Statement of Financial Accounting Standards (SFAS) No. 109, "Accounting for Income Taxes" (SFAS 109), which principally utilizes a balance sheet approach to provide for income taxes. Under this method, the Company recognizes deferred tax assets and liabilities for temporary differences between the financial reporting basis and the tax basis of the Company's assets and liabilities and expected benefits of utilizing net operating loss carryforwards. The impact on deferred taxes of changes in tax rates and laws, if any, applied to the years during which temporary differences are expected to be settled, are reflected in the consolidated financial statements in the period of enactment. The Company files a consolidated United States federal income tax return (see Note 9).
Effective October 1, 2007 (the first day of fiscal 2008), the Company adopted Financial Accounting Standards Board (FASB) Interpretation No. 48, "Accounting for Uncertainty in Income Taxes" (FIN 48). FIN 48 prescribes a comprehensive model for how a company should recognize, measure, present and disclose in its financial statements uncertain tax positions that the company has taken or expects to take on a tax return. The Company has elected to record any interest or penalties from the uncertain tax position as income tax expense (see Note 9).
Research and Development
Research and development charges incurred for product enhancements and future product development are recorded as expense as incurred.
Comprehensive Income
Pursuant to SFAS No. 130, "Reporting Comprehensive Income," the Company would be required to classify items of other comprehensive income by their nature in a financial statement and display the accumulated balance of other comprehensive income separately from retained earnings and additional paid-in capital in the equity section of a statement of financial position. Comprehensive income consists of net income and there were no items of other comprehensive income for any of the Namedperiods presented.
Fair Value of Financial Instruments
The estimated fair value amounts presented in these consolidated financial statements were determined by the Company using available market information and appropriate methodologies. The Company's financial instruments consist primarily of cash and cash equivalents, accounts receivable, accounts payable, accrued liabilities and debt instruments. The carrying values of these assets and liabilities are considered to be representative of respective fair values based on pertinent information available to management as of September 30, 2008 and 2007.
Stock-Based Compensation
We account for stock-based compensation under SFAS No. 123 (revised 2004),Share-Based Payment (SFAS 123(R)). SFAS 123(R) requires us to measure the cost of employee services received in exchange for an award of equity instruments based on the grant-date fair value of the award using an option pricing model. That cost is recognized over the period during which an employee is required to provide service in exchange for the award.
3. Summary Of Significant Accounting Policies: (Continued)
New Accounting Pronouncements
In December 2007, the FASB issued SFAS No. 141R, "Business Combinations" (SFAS 141R), which replaces SFAS No. 141, "Business Combinations." SFAS 141R, among other things, establishes principles and requirements for how an acquirer entity recognizes and measures in its financial statements the identifiable assets acquired, the liabilities assumed and any controlling interests in the acquired entity; recognizes and measures the goodwill acquired in the business combination or a gain from a bargain purchase; and determines what information to disclose to enable users of the financial statements to evaluate the nature and financial effects of the business combination. Costs of the acquisition will be recognized separately from the business combination. SFAS 141R applies prospectively, except for taxes, to business combinations for which the acquisition date is on or after the beginning of the first annual reporting period on or after December 15, 2008.
In September 2006, the FASB issued SFAS No. 157, "Fair Value Measurements" ("SFAS 157"). SFAS 157 defines fair value, establishes a framework for measuring fair value in generally accepted accounting principles, and expands disclosures about fair value measurements. This statement does not require any new fair value measurements; however, the application of this Statement may change current practice for some entities. SFAS 157 is effective for fiscal years beginning after November 15, 2007. The Company is currently evaluating the impact of this pronouncement.
4. Net Income (Loss) Per Share:
Net income (loss) per share is calculated pursuant to SFAS No. 128, "Earnings per Share" (SFAS 128). Basic earnings per share EPS excludes potentially dilutive securities and is computed by dividing net income by the weighted-average number of Common shares outstanding for the period. Diluted EPS is computed assuming the conversion or exercise of all dilutive securities such as preferred stock, options and warrants.
There is no difference between basic weighted average shares outstanding and diluted weighted-average shares outstanding used to compute diluted EPS for fiscal years 2008, 2007 and 2006 because the Company is in a net loss position.
The number of incremental shares from the assumed exercise of stock options is calculated by using the treasury stock method. For the fiscal years ended September 30, 2008, 2007 and 2006, there were 750,608, 572,959 and 701,854 options to purchase common stock outstanding, respectively, that were excluded from the computation of diluted earnings per share as the effect would be anti-dilutive.
5. Prepaid Expenses and Other Current Assets:
Prepaid expenses consist of the following:
| | September 30, | ||||||
|---|---|---|---|---|---|---|---|
| | 2008 | 2007 | |||||
Prepaid income taxes | $ | — | $ | 5,017,794 | |||
Other | 1,406,260 | 1,191,010 | |||||
| $ | 1,406,260 | $ | 6,208,804 | ||||
6. Other Assets:
Other assets consist of the following:
| | September 30, | ||||||
|---|---|---|---|---|---|---|---|
| | 2008 | 2007 | |||||
Intangible assets, net of accumulated amortization of $89,950 and $36,000 at September 30, 2008 and 2007 | $ | 289,050 | $ | 2,820,500 | |||
Other | 216,790 | 187,710 | |||||
| $ | 505,840 | $ | 3,008,210 | ||||
Intangible assets consist of licensing and certification rights which are amortized over a defined number of units. During the fiscal year ended September 30, 2008, the Company recorded an asset impairment of $2.5 million, the full carrying value of previously acquired engineering software which is no longer part of the Company's product offering and will generate no future cash flows. No impairment charge was recorded in fiscal year 2007. Total amortization expense was $68,450 and $14,400 for the fiscal years ended September 30, 2008 and 2007, respectively. Because the intangible assets are being amortized over a defined number of units, the future amortization expense over the next five years cannot be determined at this time.
7. Accrued Expenses:
Accrued expenses consist of the following:
| | September 30, | ||||||
|---|---|---|---|---|---|---|---|
| | 2008 | 2007 | |||||
Salary, benefits and payroll taxes | $ | 904,904 | $ | 603,565 | |||
Warranty | 736,815 | 592,524 | |||||
Income taxes payable | 798,801 | 959,227 | |||||
Professional fees | 474,730 | 1,515,630 | |||||
Reduction in workforce / Severance | 904,163 | — | |||||
Materials on order | 467,759 | 137,245 | |||||
Other | 843,291 | 862,641 | |||||
| $ | 5,130,463 | $ | 4,670,832 | ||||
During the fiscal year ended September 30, 2008, the Company incurred $904,163 in severance and other costs associated with the reduction in workforce and the September termination of its Chief Executive Officers.Officer.
8. Warranty:
The Company provides for estimated cost of product warranties at the time revenue is recognized. Warranty cost is recorded as cost of sales in the financial statements. While the Company engages in extensive product quality programs and processes, the Company's warranty obligation is affected by product failure rates and the related material, labor and delivery costs incurred in correcting a product failure. Should actual product failure rates, material or labor costs differ from Company estimates, revisions to estimated warranty liability would be required.
8. Warranty: (Continued)
Warranty cost and accrual information for the fiscal years ended September 30, 2008 and 2007:
| | 2008 | 2007 | |||||
|---|---|---|---|---|---|---|---|
Warranty accrual at October 1, | $ | 592,524 | $ | 617,116 | |||
Accrued expense for the fiscal year ended September 30 | 317,968 | 210,555 | |||||
Warranty costs for the fiscal year ended September 30 | (173,677 | ) | (235,147 | ) | |||
Warranty accrual at September 30 | $ | 736,815 | $ | 592,524 | |||
9. Income Taxes:
The Company accounts for income taxes under SFAS No. 109, which generally provides that deferred tax assets and liabilities be recognized for temporary differences between financial reporting and tax basis of the Company's assets and liabilities and expected benefits of utilizing net operating loss (NOL) carry forwards. The impact on deferred taxes of changes in tax rates and laws, if any, applied to the years during which temporary differences are expected to be settled are reflected in the financial statements in the period of enactment.
Components of income taxes are as follows:
| | For the Fiscal Year Ended September 30, | ||||||||||
|---|---|---|---|---|---|---|---|---|---|---|---|
| | 2008 | 2007 | 2006 | ||||||||
Current provision (benefit): | |||||||||||
Federal | $ | 236,170 | $ | (4,463,302 | ) | $ | (1,943,991 | ) | |||
State | (30,708 | ) | 3,377 | — | |||||||
| 205,462 | (4,459,925 | ) | (1,943,991 | ) | |||||||
Deferred provision (benefit): | |||||||||||
Federal | 883,439 | (639,263 | ) | (158,789 | ) | ||||||
State | 420,238 | 4,166 | (445,820 | ) | |||||||
| 1,303,677 | (635,097 | ) | (604,609 | ) | |||||||
| $ | 1,509,139 | $ | (5,095,022 | ) | $ | (2,548,600 | ) | ||||
Following is a reconciliation of the statutory federal rate to the Company's effective income tax rate:
| | For the Fiscal Year Ended September 30, | |||||||||
|---|---|---|---|---|---|---|---|---|---|---|
| | 2008 | 2007 | 2006 | |||||||
Federal statutory tax rate | 34.0 | % | 34.0 | % | 35.0 | % | ||||
State income taxes, net of federal benefit | 7.3 | % | 0.0 | % | 5.3 | % | ||||
Research and development tax credits | 1.8 | % | 5.1 | % | 0.5 | % | ||||
Increase in valuation allowance | (74.5 | )% | — | — | ||||||
Additional benefit from federal amended and carryback | 6.3 | % | — | — | ||||||
Other | 1.5 | % | (2.6 | )% | 6.1 | % | ||||
| (23.6 | )% | 36.5 | % | 46.9 | % | |||||
In October of 2008, an extension of the Research and Experimentation ("R&E") tax credit was enacted into law. This retroactive extension is for amounts paid or incurred after December 31, 2007.
9. Income Taxes: (Continued)
The entire impact of this retroactive extension will be recognized in the first quarter of the fiscal year ending September 30, 2009 as required by SFAS 109.
The deferred tax effect of temporary differences giving rise to the Company's deferred tax assets and liabilities consists of the components below.
| | September 30, | |||||||||||||
|---|---|---|---|---|---|---|---|---|---|---|---|---|---|---|
| | 2008 | 2007 | ||||||||||||
| | Current | Non Current | Current | Non Current | ||||||||||
Deferred tax assets: | ||||||||||||||
Deferred revenue | $ | 77,920 | $ | — | $ | 45,504 | $ | — | ||||||
Reserves and accruals | 3,172,061 | 237,460 | 657,250 | 198,456 | ||||||||||
Research and development credit | 184,837 | 462,267 | ||||||||||||
Software | 596,469 | — | — | |||||||||||
NOL carryforwards—state | — | 1,050,052 | — | 824,573 | ||||||||||
Stock options | — | 687,353 | — | 362,894 | ||||||||||
Other | — | 55,131 | — | — | ||||||||||
| 3,434,818 | 2,626,465 | 1,165,021 | 1,385,923 | |||||||||||
Less: Valuation allowance | (3,002,107 | ) | (2,295,589 | ) | (246,325 | ) | (293,032 | ) | ||||||
Deferred tax asset | 432,711 | 330,876 | 918,696 | 1,092,891 | ||||||||||
Deferred tax liabilities: | ||||||||||||||
Depreciation | — | (745,512 | ) | — | (764,831 | ) | ||||||||
Other | (18,075 | ) | — | (18,801 | ) | — | ||||||||
Deferred tax liability | (18,075 | ) | (745,512 | ) | (18,801 | ) | (764,831 | ) | ||||||
Net deferred tax asset (liability) | $ | 414,636 | $ | (414,636 | ) | $ | 899,895 | $ | 328,060 | |||||
During the fiscal year ended September 30, 2007 the Company generated a federal net operating loss (NOL) of approximately $14.2 million. The NOL was carried-back to previous tax years and the Company received a refund of previously paid federal income tax of approximately $5.1 million during the quarter ended March 31, 2008. As of September 30, 2008, the Company had state net operating losses of $17.8 million which expire in varying amounts beginning in 2026. In addition, the Company has research and development tax credit carryforwards of approximately $214,049, which expire in varying amounts beginning 2027.
The Company's financial statements contain certain deferred tax assets which have arisen primarily as a result of tax benefits associated with the loss before income tax incurred during the twelve months ended September 30, 2008, as well as deferred income tax assets resulting from temporary differences in prior tax years. SFAS 109 requires the consideration of a valuation allowance to reflect the likelihood of realization of deferred tax assets. Significant management judgment is required in determining any valuation allowance recorded against net deferred tax assets. The Company considered all available positive and negative evidence, including significant operating losses incurred in 2006 and 2007, continued operating losses in 2008, uncertainty as to the extent and timing of profitability in future periods, and ongoing tax planning strategies. Based on the weight of available evidence, the Company recorded a full valuation allowance against net deferred tax assets during the quarter ended March 31, 2008. There were no significant changes in management's judgment during the quarter ended September 30, 2008 and the Company continues to carry a full valuation allowance against its net deferred tax assets.
9. Income Taxes: (Continued)
If realization of deferred tax assets in the future is considered more likely than not, a reduction to the valuation allowance related to deferred tax assets would increase net income in the period such determination is made. The amount of deferred tax assets considered realizable is based on significant estimates, and it is possible that changes in these estimates could materially affect the financial condition and results of operations. The Company's effective tax rate may vary from period to period based on changes in estimated taxable income or loss; changes to the valuation allowance; changes to federal or state tax laws; and as a result of acquisitions.
The Company adopted provisions of FASB Interpretation 48,"Accounting for Uncertainty in Income Taxes" (FIN 48), on October 1, 2007. Previously, the Company accounted for tax contingencies in accordance with SFAS No. 5,"Accounting for Contingencies". At the adoption date of October 1, 2007, the Company applied FIN 48 to all tax positions for which the statute of limitations remained open. As a result of implementation of FIN 48, the Company recognized a decrease of approximately $587,000 in the liability for unrecognized tax benefits, which was accounted for as an increase to the October 1, 2007 balance of retained earnings.
The amount of unrecognized tax benefits as of October 1, 2007 was approximately $435,000, all of which, if ultimately recognized, would reduce the Company's annual effective tax rate.
The Company is subject to income taxes in the U.S. federal and various state jurisdictions. Tax regulations within each jurisdiction are subject to the interpretation of related tax laws and regulations and require significant judgment to apply. During the fiscal year ended September 30, 2008, the Internal Revenue Service concluded an examination for tax years through September 30, 2006. The Company also files income tax returns in various state jurisdictions, as appropriate, with varying statutes of limitation. There are no state income tax examinations in process at this time.
The Company's policy is to recognize interest accrued and, if applicable, penalties related to unrecognized tax benefits in income tax expense for all periods presented. The Company has accrued approximately $21,000 for the payment of interest, net of tax benefits, at September 30, 2008 ($27,000 at October 1, 2007). There is no accrual recorded for penalties.
For the fiscal year ended September 30, 2008, the Company recognized a benefit of $6,000 of interest (net of federal impact) within income tax expense.
Following is a reconciliation of beginning and ending balances of total amounts of gross unrecognized tax benefits:
Balance at October 1, 2007 | $ | 435,000 | ||
Unrecognized tax benefits related to prior years | (125,000 | ) | ||
Unrecognized tax benefits related to the current year | 72,000 | |||
Settlements | — | |||
Decrease in unrecognized tax benefits due to the lapse of applicable statute of limitations | (58,000 | ) | ||
Balance at September 30, 2008 | $ | 324,000 | ||
It is not anticipated that unrecognized tax benefits taken regarding previously filed returns will change significantly over the next twelve months.
10. Notes Payable:
The Company entered into a $4,335,000 loan agreement dated August 1, 2000 with the Chester County, Pennsylvania Industrial Development Authority. The purpose of the loan was to fund the construction of the Company's new office and manufacturing facility. The loan matures in 2015 and
10. Notes Payable: (Continued)
carries an interest rate set by the remarketing agent that is consistent with 30-day tax-exempt commercial paper. The loan agreement includes an optional redemption schedule allowing the Company the option of forgoing any principal pay-down until such time the bonds expire in 2015. The Company has exercised its option not to pay-down the outstanding balance and accordingly, the balance of the notes payable will be due in 2015.
The loan agreement previously required the Company to maintain certain financial covenants including a ratio of liabilities to earnings before interest, taxes and depreciation and amortization (EBITDA), fixed charge ratio and a minimum tangible net worth. As of June 30, 2006, the Company was in violation of certain of these financial covenants. The defaults were subsequently waived and an amendment to the agreement was entered into with the lender whereby the defaulted covenants were modified. Effective November 30, 2007 prior loan agreement covenants were changed to only require the Company to maintain at all times unencumbered cash and marketable securities having a market value of at least $20.0 million and a minimum Tangible Net Worth of $65.0 million. The lender, however, agreed on January 10, 2008 to discontinue the Tangible Net Worth covenant so that the only remaining requirement is that the Company maintain at all times unencumbered cash and marketable securities having a value of at least $20.0 million.
The interest cost related to this debt for fiscal years 2008 and 2007 was $117,000 and $164,000 respectively. The interest rate on this debt was 3.98% at September 30, 2008. The Company is also required to maintain a letter of credit in the amount of $5,000,000 covering the debt.
11. Savings Plan:
The Company sponsors a voluntary defined contribution savings plan covering all employees. The Company made contributions of $172,000, $0 and $0 for the fiscal years ended September 30, 2008, 2007 and 2006, respectively.
12. Share-Based Compensation:
Effective October 1, 2005 the Company adopted the provisions of Statement of Financial Accounting Standards (SFAS) 123R using the modified prospective approach and now accounts for share-based compensation applying the fair value method for expensing stock options and non-vested stock awards.
Total share-based compensation expense was $1,138,000, $726,000 and $895,000 for the fiscal years ended September 30, 2008, 2007, and 2006, respectively. The total income tax (expense) benefit recognized in the statement of operations for share-based compensation arrangements was ($11,000), $265,000 and $420,000 for the fiscal years ended September 30, 2008, 2007, and 2006, respectively. Compensation expense related to share-based awards is recorded as a component of general and administrative expense.
The Company maintains the 1998 Stock Option ExercisesPlan (the "Plan") and Holdingsthe 2003 Restricted Stock Plan (the "Restricted Plan"). These plans were approved by the Company's shareholders. The Plan expired on November 13, 2008.
Stock Options
The Plan allows granting of incentive and nonqualified stock options to employees, officers, directors and independent contractors and consultants. Through September 30, 2008 no stock options have been granted to independent contractors or consultants under this Plan. Total compensation expense was $938,000, $506,000, and $655,000 for fiscal years ended September 30, 2008, 2007, and 2006 respectively. Incentive stock options granted under the Plan have exercise prices that must be at
12. Share-Based Compensation: (Continued)
least equal to fair value of the common stock on grant date. Nonqualified stock options granted under the Plan have exercise prices that may be less than, equal to or greater than the fair value of the common stock on the date of grant. The following table sets forthCompany has reserved 3,389,000 shares of Common Stock for awards under the plan. At September 30, 2008 there were 1,502,173 shares remaining and available for grant under the Plan, however the Plan expired on November 13, 2008 and no additional shares may be granted under the Plan after that date.
Following is a summary of option activity under the Plan for fiscal years ended September 30, 2008, 2007, and 2006 and changes during the periods then ended:
| | Options | Weighted Average Exercise Price | Aggregate Intrinsic Value | ||||||||
|---|---|---|---|---|---|---|---|---|---|---|---|
Outstanding at September 30, 2005 | 594,253 | $ | 8.76 | ||||||||
Granted | 204,000 | 14.36 | |||||||||
Exercised | (25,300 | ) | 7.48 | ||||||||
Cancelled | (71,099 | ) | 13.70 | ||||||||
Outstanding at September 30, 2006 | 701,854 | $ | 8.76 | ||||||||
Granted | 49,000 | 24.42 | |||||||||
Exercised | (57,995 | ) | 8.50 | ||||||||
Cancelled | (119,900 | ) | 14.79 | ||||||||
Outstanding at September 30, 2007 | 572,959 | $ | 10.30 | ||||||||
Granted | 409,000 | 10.16 | |||||||||
Exercised | (4,497 | ) | 7.31 | ||||||||
Cancelled | (226,854 | ) | 11.88 | ||||||||
Outstanding at September 30, 2008 | 750,608 | $ | 9.76 | $ | 250,455 | ||||||
Vested and expected to vest | 735,848 | $ | 8.04 | $ | 250,455 | ||||||
Options exercisable at September 30, 2008 | 455,408 | $ | 8.04 | $ | 250,289 | ||||||
The weighted-average grant date fair value of individual options granted during the fiscal years ended September 30, 2008, 2007 and 2006 was $5.05, $14.38 and $7.53, respectively. The total intrinsic value of options held by each ofexercised during the Named Executive Officersfiscal years ended September 30, 2008, 2007 and 2006 were $33,000, $620,000 and $187,000, respectively.
Following table summarizes information about stock options under the Plan at September 30, 2006.2008:
| Options Outstanding | Options Exercisable | |||||||||||||||
|---|---|---|---|---|---|---|---|---|---|---|---|---|---|---|---|---|
Range of Exercise Prices | Outstanding As of September 30, 2008 | Weighted- Average Remaining Contractual Life | Weighted- Average Exercise Price | As of September 30, 2008 | Weighted- Average Exercise Price | |||||||||||
$— -$5.00 | 201,909 | 3.3 | $ | 4.22 | 201,909 | $ | 4.22 | |||||||||
$5.01-$10.00 | 209,099 | 5.6 | $ | 7.82 | 121,599 | $ | 7.69 | |||||||||
$10.01-$15.00 | 251,200 | 8.0 | $ | 11.70 | 88,000 | $ | 11.73 | |||||||||
$15.01-$20.00 | 40,600 | 6.1 | $ | 16.84 | 30,500 | $ | 16.84 | |||||||||
$20.01-$26.97 | 47,800 | 6.1 | $ | 25.53 | 13,400 | $ | 24.52 | |||||||||
| 750,608 | 6.3 | $ | 9.76 | 455,408 | $ | 8.04 | ||||||||||
Aggregated Option Exercises in 2006 and Option Values at September 30, 200612. Share-Based Compensation: (Continued)
|
|
|
|
|
| Number of Securities |
|
|
|
|
| ||||||||||||||||
|
| Shares |
|
|
| Underlying Unexercised |
| Value of Unexercised |
| ||||||||||||||||||
|
| Acquired |
|
|
| Options at |
| In-The-Money Options at |
| ||||||||||||||||||
|
| On |
| Value |
| September 30, 2006 |
| September 30, 2006(1) |
| ||||||||||||||||||
Name |
|
|
| Exercise (#) |
| Realized ($) |
| Exercisable |
| Unexercisable |
| Exercisable |
| Unexercisable |
| ||||||||||||
Geoffrey S. M. Hedrick |
|
| — |
|
|
| — |
|
|
| 1,500 |
|
|
|
|
|
| $ | 10,796 |
|
| $ | 0 |
|
| ||
Roman G. Ptakowski |
|
|
|
|
|
|
|
|
|
| 180,000 |
|
|
|
|
|
| $ | 1,858,140 |
|
| $ | 0 |
|
| ||
James J. Reilly |
|
|
|
|
|
|
|
|
|
| 46,049 |
|
|
| 12,000 |
|
| $ | 286,016 |
|
| $ | 0 |
|
| ||
(1) The Fair value of unexercised in-the-moneyeach option grant is estimated on the date of grant using the Black-Scholes option pricing model. Options are exercisable over a maximum term of ten years from date of grant and typically vest over periods of five years from the grant date. The expected term of options represents the period of time that options granted are expected to be outstanding and is based on the difference between the last sale price of a share of our common stock as reportedhistorical experience. Expected volatility is based on the Nasdaq National Market on September 29, 2006 ($14.53) and the exercise pricehistorical volatility of the options, multiplied by the number of options.
Employment Contracts, Termination of Employment and Change in Control Arrangements
In March 2003, we entered into an agreement with Roman G. Ptakowski to serve as President at an annual salary of $250,000 and an annual performance incentive bonus of up to 30% of base salaryCompany's stock. The risk free interest rate is based on performance of the business. The initial term of the agreement was for two yearsU.S. Treasuries with yearly one-year renewal periods unless either party provides the other party with written notice of termination of the agreement not later than ninety-days (90) prior to the end of the then current term of the agreement. In the event that Mr. Ptakowski is involuntarily terminated without cause. Mr. Ptakowski would be entitled to continue to receive compensation and benefits at the rateconstant maturities in effect at the time of termination untilgrant. Compensation expense for employee stock options also includes an estimate for forfeitures and is recognized ratably over the endvesting term. Below are fair value assumptions used to record compensation expense for the period identified:
| | Fiscal Year Ended September 30, | |||||||||
|---|---|---|---|---|---|---|---|---|---|---|
| | 2008 | 2007 | 2006 | |||||||
Expected dividend rate | — | — | — | |||||||
Expected volatility | 61.9 | % | 64.4 | % | 63.7 | % | ||||
Weighted average risk-free interest rate | 2.1 | % | 2.3 | % | 2.4 | % | ||||
Expected lives (years) | 8.00 | 8.62 | 8.41 | |||||||
At September 30, 2008, there was approximately $1.6 million of the then current termunrecognized compensation cost, net of the agreement, provided however, that such amount shall notforfeitures, related to non-vested stock options, which is expected to be less than six monthsrecognized over a period of current salary and benefits. Amounts payable following such a termination shall be reduced by any compensation received for services rendered by Mr. Ptakowski to a subsequent employer. In addition, Mr. Ptakowski was granted options to purchase 270,000 shares of common stock at $4.21 per share. One-third of these options vest each year on the anniversary of the initial grant date.
In the event that Mr. Ptakowski is involuntarily terminated without cause or resigns as a result of a material change in duties or a reduction in compensation or benefits following certain changes of control of Innovative Solutions and Support, Mr. Ptakowski would be entitled to receive a one time payment equal to Mr. Ptakowski’s annual salary as then in effect within thirty (30) days of the date of such termination in addition to continued compensation and benefits at the rate in effect at the time of termination until the end of the then current term of the agreement.
On December 27, 2004 both parties concurred that the current agreement will be allowed to expire and will be replaced with one that continues with the same terms and conditions, provided that employment may be terminated by either party at any time on ninety-days prior notice.
Compensation of Directorsapproximately 5 years.
Non-vested Stock
The 2003 Restricted Stock Plan for non-employee directors was approved by shareholders at the Company’sCompany's February 26, 2004 Annual Meeting of Shareholders. The Plan calledIt calls for an annual award of restrictednon-vested stock having a fair market value of $25,000 as of the$40,000 at close of business on October 1 of the current fiscal year for all eligible non-employee directors. The stock vestsis awarded in four quarterly installments during the fiscal year provided the director wasis still serving on the Boardboard on the vestingquarterly issue date. Total expense was $200,000, $220,000 and $220,000 for the fiscal years ended September 30, 2008, 2007, and 2006, respectively. The following outlines restricted stock awards for fiscal years ended September 30, 2008, 2007, and 2006:
| | Non-vested Stock Awards | Weighted Average Share Price | ||||||
|---|---|---|---|---|---|---|---|---|
Balance at September 30, 2005 | 3,588 | $ | 16.68 | |||||
Granted | 15,738 | 15.25 | ||||||
Issued | (15,396 | ) | 15.58 | |||||
Cancelled | (655 | ) | 15.25 | |||||
Balance at September 30, 2006 | 3,275 | $ | 15.25 | |||||
Granted | 15,939 | 14.43 | ||||||
Issued | (15,056 | ) | 14.61 | |||||
Cancelled | (693 | ) | 14.43 | |||||
Balance at September 30, 2007 | 3,465 | $ | 14.43 | |||||
Granted | 10,525 | 19.00 | ||||||
Issued | (11,355 | ) | 17.61 | |||||
Cancelled | — | — | ||||||
Balance at September 30, 2008 | 2,635 | $ | 19.00 | |||||
13. Commitments and Contingencies:
Capital Lease
The Company leases certain equipment under capital leases with terms of five years and implicit interest rate of 7.2%. The capitalized cost of $57,450 and related accumulated amortization of $22,816 and $8,207 have been included in property and equipment at September 30, 2008 and 2007 respectively. The balance due on these leases was $47,542 and $57,450 as of September 30, 2008 and 2007 respectively. Future payments, including interest relating to these leases are $13,788 annually for the next four years.
Operating Leases
Rent expense under operating leases totaled $196,000, $109,000 and $11,000 for the years ended September 30, 2008, 2007 and 2006, respectively. As of September 30, 2008, future minimum payments related to all non-cancelable operating leases is $11,000 in fiscal 2009.
Product Liability
The Company has product liability insurance of $50,000,000, which management believes is adequate to cover potential liabilities that may arise.
Legal Proceedings
In the ordinary course of business, we are at times subject to various legal proceedings. Except with respect to the fees incurred in connection with the matters described below, we do not believe that any of the current legal proceedings will have a material adverse effect on our results of operations or financial position. On September 13, 2005 the Company filed a lawsuit in the United States District Court for the Western District of Tennessee against J2, Inc., a company founded and jointly owned by Joseph Cesar, a former employee of the Company, and James Zachary, a former sales consultant for the Company. The complaint alleged that the J2/Kollsman/Air Data Computer then being marketed by J2 and manufactured by Kollsman, Inc. infringed a patent assigned to IS&S.
On November 7, 2007 the Company received a favorable jury verdict in its trade secret misappropriation case against Kollsman, Inc. (a subsidiary of Elbit Systems Ltd.), J2 Inc., Joseph Caesar, James Zachary and Zachary Technologies, Inc. in the United States District Court for the Western District of Tennessee. The jury unanimously found that each of the defendants had misappropriated IS&S's air data computer technology. The jury found that IS&S had suffered damages of just over $4.4 million in lost profits and $1.6 million in defendants' net profits, for a total of over $6 million. The jury also found in favor of IS&S's claims for breach of duty and contract, and unfair competition against J2 Inc., Joseph Caesar, James Zachary and Zachary Technologies, Inc.
On December 18, 2007, the court entered a temporary injunction aimed at preventing further use of the Company's trade secret and proprietary information. On March 14, 2008, the judge presiding over the case heard the Company's claims for a permanent injunction as well as punitive and exemplary damages and attorneys' fees against Kollsman and the other defendants.
On July 7, 2008, the court issued several rulings in the case. In the rulings, the court awarded damages, interest and fees in addition to the more than $6 million in compensatory damages awarded by the jury when it rendered its verdict in the case in November 2007. The additional awards bring the damages assessed against Kollsman, Inc. to a total or more than $23 million. The court also entered an order granting the Company's request for permanent injunctive relief.
13. Commitments and Contingencies: (Continued)
On August 27, 2008, the Company entered into a Settlement Agreement (the Settlement Agreement) with Kollsman, Inc. On August 29, 2008, the settlement became effective with respect to all claims filed by the Company and Kollsman against each other in the United States District Court for the Western District of Tennessee and a Consent Order was entered. Under the Settlement Agreement, all claims between the Company and Kollsman have been dismissed with prejudice, a final agreed injunction has been entered and the matter has been fully and finally mutually settled without any admission of guilt by either party. In addition, an agreed settlement payment of $17 million has been made by Kollsman to the Company.
On October 9, 2008, Zachary and ZTI consented to the entry of judgment against and to a permanent injunction, which resulted in the conclusion of all claims with respect to those parties. On November 17, 2008, the court granted the Company's motion to dismiss its patent infringement claims against Caesar and J2, and dismissed Caesar and J2's counterclaims for noninfringement, invalidity and unenforceability because there was no longer a justifiable claim or controversy with respect to those counterclaims.
On January 17, 2007 the Company filed suit in Pennsylvania state court against Strathman Associates, a former software consultant for the Company, alleging that Strathman had improperly used IS&S trade secret and proprietary information in assisting J2 and Kollsman in developing the J2/Kollsman Air Data Computer. The case is ongoing.
Through September 30, 2008 and 2007 the Company has incurred approximately $13.6 million and $8.0 million, respectively, in legal fees in connection with the two matters discussed above.
14. Related-Party Transactions:
The Company incurred legal fees of $129,000, $146,000 and $357,000 with a law firm which is a shareholder of the Company for the years ended September 30, 2008, 2007 and 2006, respectively. The fees paid and services rendered were comparable with the fees paid and services rendered prior to the law firm's investment in the Company.
For the years ended September 30, 2008, 2007 and 2006, respectively, the Company incurred service fees of $67,000, $18,000 and $25,000 with a commercial graphics firm controlled by an individual who is married to a shareholder and daughter of the Company's Chairman and Chief Executive Officer.
15. Quarterly Financial Data (unaudited):
Summarized quarterly results of operations of the Company for the years ended September 30, 2008 and September 30, 2007 are presented below:
| | Year Ended September 30, 2008 | |||||||||||||
|---|---|---|---|---|---|---|---|---|---|---|---|---|---|---|
| | First Quarter | Second Quarter | Third Quarter | Fourth Quarter | ||||||||||
Net sales | $ | 4,725,647 | $ | 6,824,360 | $ | 8,751,309 | $ | 10,221,995 | ||||||
Cost of sales | 3,659,059 | 3,790,661 | 4,568,303 | 8,533,834 | ||||||||||
Gross profit | 1,066,588 | 3,033,699 | 4,183,006 | 1,688,161 | ||||||||||
Operating loss | (6,599,986 | ) | (4,477,323 | ) | (4,795,875 | ) | (9,230,657 | ) | ||||||
Net (Loss) Income | (4,121,941 | ) | (7,060,157 | ) | (4,288,871 | ) | 7,573,721 | |||||||
Net loss per common share | ||||||||||||||
Basic | $ | (0.24 | ) | $ | (0.42 | ) | $ | (0.25 | ) | $ | 0.45 | |||
Diluted | $ | (0.24 | ) | $ | (0.42 | ) | $ | (0.25 | ) | $ | 0.45 | |||
15. Quarterly Financial Data (unaudited): (Continued)
| | Year Ended September 30, 2007 | |||||||||||||
|---|---|---|---|---|---|---|---|---|---|---|---|---|---|---|
| | First Quarter | Second Quarter | Third Quarter | Fourth Quarter | ||||||||||
Net sales | $ | 3,428,648 | $ | 3,955,298 | $ | 5,844,405 | $ | 5,119,777 | ||||||
Cost of sales | 2,033,945 | 3,018,028 | 3,639,235 | 5,463,217 | ||||||||||
Gross profit | 1,394,703 | 937,270 | 2,205,170 | (343,440 | ) | |||||||||
Operating loss | (2,988,666 | ) | (4,417,238 | ) | (3,094,228 | ) | (6,326,780 | ) | ||||||
Net loss | (1,098,444 | ) | (2,359,146 | ) | (1,350,857 | ) | (4,036,841 | ) | ||||||
Net loss per common share | ||||||||||||||
Basic | $ | (0.07 | ) | $ | (0.14 | ) | $ | (0.08 | ) | $ | (0.24 | ) | ||
Diluted | $ | (0.07 | ) | $ | (0.14 | ) | $ | (0.08 | ) | $ | (0.24 | ) | ||
Quarterly and total year earnings per share are calculated independently based on the weighted average number of shares outstanding during each period.
16. Business Segments
The Company operates in one principal business segment which designs, manufactures and sells flight information computers, flat panel displays and advanced monitoring systems to the DoD, government agencies, commercial air transport carriers and corporate/general aviation markets. The Company currently derives virtually all of its revenues from the sale of this equipment. Almost all of the Company's sales, operating results and identifiable assets are in the United States. Net sales, operating results and identifiable assets outside the U.S. are not material. During fiscal 2008, 2007 and 2006 we derived 77%, 53% and 38%, respectively, of our revenues from the sale of Flat Panel Display Systems. During fiscal 2008, 2007, and 2006 we derived 23%, 47% and 62% respectively, of revenues from the sale of air data systems related products.
Geographic Data
Almost all of the Company's sales, operating results and identifiable assets are in the United States. Net sales, operating results and identifiable assets outside the U.S. are not material. In fiscal year 20052008, 2007 and 2006 net sales outside the annual award was increasedUnited States amounted to $40,000 effective in$1.7 million, $1.1 million, and $2.8 million, respectively.
Product Data
Our current product line includes flat panel display systems and air data systems and components, During fiscal 2008, 2007 and 2006, the fourth quarterCompany derived 77%, 53% and 38%, respectively, of its revenue from sales of flat panel display systems. The remaining revenue for each of the fiscal year. Additionally, each non-employee director receives $1,000 for each board meeting attended. All directors are reimbursed for reasonable travelyears was from sales of air data systems and lodging expenses associatedcomponents.
Item 9. Changes in and disagreements with attendance at meetings.accountants on accounting and financial disclosure.
None
Compensation Committee Interlocks and Insider Participation Item 9A. Controls and procedures
No member
- (a)
- An evaluation was performed under supervision and with participation of the
Compensation Committee is a formerCompany's management, including its Chief Executive Officer, orcurrent executive officerCEO, and Chief Financial Officer, oremployeeCFO, of theCompany. There are no compensation committee interlocks between us and any other entity involving us or such entity’s executive officers or board members.The following graph shows the total return on our common stock during the period from September 30, 2001 until September 30, 2006, against the cumulative total return on the NASDAQ Composite Index and the Russell 2000 index during such period. The comparison assumes that $100 was invested at the beginning of such period in our common stock and in eacheffectiveness of theforegoing indicesCompany's disclosure controls andassumes the reinvestment of any dividends.COMPARISON OF 5-YEAR CUMULATIVE TOTAL RETURN*AMONG INNOVATIVE SOLUTIONS AND SUPPORT, INC.,THE NASDAQ COMPOSITE INDEXAND THE RDG TECHNOLOGY COMPOSITE INDEX
*$100 invested on 9/30/01 in stock or index-including reinvestment of dividends. Fiscal year ending September 30.Cumulative Total Return
9/01
9/02
9/03
9/04
9/05
9/06
Innovative Solutions and Support, Inc.
100.00
105.78
112.24
337.41
320.43
299.79
NASDAQ Composite
100.00
80.97
120.85
131.16
150.08
159.80
Russell 2000
100.00
90.70
123.80
147.04
173.44
190.65
The following report of the Compensation Committee and the performance graph on the previous page will not be deemed incorporated by reference by any general statement incorporating by reference this Annual Report into any filingprocedures, as such term is defined underthe Securities Act of 1933, as amended, orRule 13a-15(e) promulgated under the Securities Exchange Act of 1934, as amendedexcept(the "Exchange Act") as of September 30, 2007. Based on that evaluation, the Company's management, including the CEO and CFO, concluded the Company's disclosure controls and procedures are effective to provide reasonable assurance that information required to be disclosed by theextentCompany in reports thatwe specifically incorporateit files or submits under the Exchange Act, is recorded, processed, summarized and reported as specified in Securities and Exchange Commission rules and forms and that such information is accumulated and communicated by the Company's management, including the CEO and CFO, or persons performing similar functions, as appropriate to allow timely decisions regarding required disclosure. - (b)
- Management's annual report on internal control over financial reporting and the attestation report of our independent registered public accounting firm are set forth below on this
informationAnnual Report on Form 10-K. - (c)
- There were no changes in the Company's internal control over financial reporting identified in connection with the evaluation of such controls that occurred during the Company's most recent fiscal quarter that has materially affected, or is reasonably likely to materially affect, the Company's internal control over financial reporting.
Management's Report on Internal Control over financial reporting
Management of Innovative Solutions & Support, Inc. and its subsidiaries (the Company) is responsible for establishing and maintaining adequate internal control over financial reporting. The Company's internal control over financial reporting is a process designed under the supervision of the Company's principal executive officer and principal financial officer to provide reasonable assurance regarding the reliability of financial reporting and preparation of the Company's financial statements for external purposes in accordance with accounting principles generally accepted in the United States of America.
The Company's internal control over financial reporting includes policies and procedures that (1) pertain to maintenance of records that, in reasonable detail, accurately and fairly reflect transactions and dispositions of the assets of the Company; (2) provide reasonable assurance that transactions are recorded as necessary to permit preparation of financial statements in accordance with generally accepted accounting principles, and that receipts and expenditures of the Company are being made only in accordance with authorizations of management and directors of the Company; and (3) provide reasonable assurance regarding prevention or timely detection of unauthorized acquisition, use, or disposition of Company assets that could have a material effect on financial statements.
Due to its inherent limitations, internal control over financial reporting may not prevent or detect misstatements and, even when determined to be effective, can only provide reasonable, not absolute, assurance with respect to financial statement preparation and presentation. Projections of any evaluation of effectiveness to future periods are subject to risk that controls may become inadequate as a result of changes in conditions or deterioration in the degree of compliance.
As of September 30, 2008, management assessed the effectiveness of the Company's internal control over financial reporting based on criteria established in Internal Control—Integrated Framework issued by reference. The followingthe Committee of Sponsoring Organizations of the Treadway Commission (COSO). Based on this assessment, management has determined that the Company's internal control over financial reporting as of September 30, 2008 is effective.
Our internal control over financial reporting has been audited by Deloitte & Touche LLP, an independent registered public accounting firm, as stated in their report shall not otherwise be deemed filed under such Acts.which is included herein.
REPORT OF THE COMPENSATION COMMITTEEINDEPENDENT REGISTERED PUBLIC ACCOUNTING FIRM
The Compensation Committee ofTo the Board of Directors is composedand Shareholders of two directors, each
Innovative Solutions and Support, Inc.
Exton, Pennsylvania
We have audited the internal control over financial reporting of whom,Innovative Solutions and Support, Inc. and subsidiaries (the "Company") as of September 30, 2008, based on criteria established inInternal Control—Integrated Framework issued by the judgmentCommittee of Sponsoring Organizations of the Board of Directors, was found to be “independent” as defined by the applicable NASDAQ listing standards.Treadway Commission. The Compensation CommitteeCompany's management is responsible for settingmaintaining effective internal control over financial reporting and administeringfor its assessment of the effectiveness of internal control over financial reporting, included in the accompanying Management's Report on Internal Control over Financial Reporting. Our responsibility is to express an opinion on the Company's internal control over financial reporting based on our audit.
We conducted our audit in accordance with the standards of the Public Company Accounting Oversight Board (United States). Those standards require that we plan and perform the audit to obtain reasonable assurance about whether effective internal control over financial reporting was maintained in all material respects. Our audit included obtaining an understanding of internal control over financial reporting, assessing the risk that a material weakness exists, testing and evaluating the design and operating effectiveness of internal control based on the assessed risk, and performing such other procedures as we considered necessary in the circumstances. We believe that our audit provides a reasonable basis for our opinion.
A company's internal control over financial reporting is a process designed by, or under the supervision of, the company's principal executive and principal financial officers, or persons performing similar functions, and effected by the company's board of directors, management, and other personnel to provide reasonable assurance regarding the reliability of financial reporting and the preparation of financial statements for external purposes in accordance with generally accepted accounting principles. A company's internal control over financial reporting includes those policies and procedures that (1) pertain to the maintenance of records that, in reasonable detail, accurately and fairly reflect the transactions and dispositions of the assets of the company; (2) provide reasonable assurance that transactions are recorded as necessary to permit preparation of financial statements in accordance with generally accepted accounting principles, and that receipts and expenditures of the company are being made only in accordance with authorizations of management and directors of the company; and (3) provide reasonable assurance regarding prevention or timely detection of unauthorized acquisition, use, or disposition of the company's assets that could have a material effect on the financial statements.
Because of the inherent limitations of internal control over financial reporting, including the possibility of collusion or improper management override of controls, material misstatements due to error or fraud may not be prevented or detected on a timely basis. Also, projections of any evaluation of the effectiveness of the internal control over financial reporting to future periods are subject to the risk that the controls may become inadequate because of changes in conditions, or that the degree of compliance with the policies that govern annual executive salaries, bonuses and stock ownership programs. The Compensationor procedures may deteriorate.
In our opinion, the Company maintained, in all material respects, effective internal control over financial reporting as of September 30, 2008, based on the criteria established inInternal Control—Integrated Framework issued by the Committee annually evaluates the performance, and determines or recommends to the full Board the compensation,of Sponsoring Organizations of the Chief Executive OfficerTreadway Commission.
We have also audited, in accordance with the standards of the Public Company Accounting Oversight Board (United States), the consolidated financial statements as of and other executive officers.
The Compensation Committee’s objectives include (i) attracting and retaining exceptional individuals as executive officers, and (ii) providing key executives with motivation to perform tofor the full extent of their abilities to maximize the performanceyear ended September 30, 2008 of the Company and deliver enhanced valueour report dated December 9, 2008 expressed an unqualified opinion on those consolidated financial statements and included an explanatory paragraph relating to the Company’s shareholders. The Compensation Committee attemptsCompany's adoption of Financial Accounting Standards Board Interpretation No. 48,Accounting for Uncertainty in Income Taxes, effective October 1, 2007.
DELOITTE & TOUCHE LLP
Philadelphia, Pennsylvania
December 9, 2008
Item 10. Directors, executive officers and corporate governance.
This information (other than information relating to achieve these objectivesexecutive officers included in Part I Item 1.) will be included in our Proxy Statement relating to our Annual Meeting of Shareholders, which will be filed within 120 days after the close of our fiscal year covered by annually reviewingthis Report, and approving corporate goalsis hereby incorporated by reference to such Proxy Statement. We have adopted a written code of business conduct and objectives relevantethics, known as our code of conduct, which applies to the compensationall of our directors, officers, and employees, including our chief executive officer, our president and our chief financial officer. Our code of conduct is available on our Internet website,www.innovative-ss.com. Our code of conduct may also be obtained by contacting investor relations at (610) 646-9800. Any amendments to our code of conduct or waivers from provisions of the Chiefcode for our directors and our officers will be disclosed on our Internet website promptly following the date of such amendment or waiver.
Item 11. Executive Officer and other key executive officerscompensation.
This information will be included in our Proxy Statement relating to our Annual Meeting of the Company, evaluating the performanceShareholders, which will be filed within 120 days after close of the Chief Executive Officer and other key executive officers in light of those goals and objectives, and determining and approving the compensation level of the Chief Executive Officer and other key executive officers based on this evaluation.
Components of Executive Compensation
An executive officer’s annual salary is established initially on the basis of subjective factors, including experience, individual achievements, level of responsibility assumed at the Company and market compensation practices. The Compensation Committee annually reviews each executive officer’s annual salary based on such executive officer’s past performance, expected future contributions, the scope and nature of the responsibilities of the executive officer, including any changes in such responsibilities, and compensation practices among competitive peers.
Chief Executive Officer Compensation
Geoffrey S.M. Hedrick has served as the Company’s Chief Executive Officer since 1988. For fiscal 2006, Mr. Hedrick was paid an annual salary of $400,000. Mr. Hedrick’s salary was adjusted inour fiscal year 2004 from $350,000covered by this Report, and is hereby incorporated by reference to $400,000 and has remained unchanged during fiscal year 2005 and 2006.such Proxy Statement.
Section 162(m) of the Internal Revenue Code of 1986, as amended, generally denies a federal income tax deduction for certain compensation exceeding $1,000,000 paid to the Chief Executive Officer or any of the other named executive officers, excluding, among other things, certain performance-based compensation. Through September 30, 2006, this provision has not affected our tax deductions, and the Compensation Committee believes that, at the present time, it is unlikely that the compensation paid to any of our employees in a taxable year will exceed $1,000,000. The Compensation Committee intends to continue to evaluate the effects of the statute and any applicable regulations and to comply with Internal Revenue Code Section 162(m) in the future to the extent consistent with our best interests.
Submitted by the Compensation Committee:
Winston J. Churchill (Chairman)
Robert E. Mittelstaedt, Jr.
Item 12. Security ownership of certain beneficial owners and management.management and related stockholder matters.
This information will be included in our Proxy Statement relating to our Annual Meeting of Shareholders, which will be filed within 120 days after close of our fiscal year covered by this Report, and is hereby incorporated by reference to such Proxy Statement.
The following table gives information about our common stock that may be issued upon the exercise of options and rights under all of our existing equity compensation plans and arrangements as of September 30, 2006,2008, including the 1998 Stock Option Plan and thePlan.
Plan Category | Number of Securities to be issued upon exercise of outstanding options and rights | Weighted-average exercise price of outstanding options and rights | Number of Securities remaining available for future issuance under equity compensation plans (excluding securities reflected in second column) | |||||||
|---|---|---|---|---|---|---|---|---|---|---|
Equity compensation plans approved by security holders | 753,243 | $ | 9.79 | 1,570,982 | ||||||
Equity compensation plans not approved by security holders | — | $ | — | — | ||||||
| 753,243 | $ | 9.79 | 1,570,982 | |||||||
The 2003 Restricted Stock Plan.Plan for non-employee directors was approved by shareholders at the Company's February 26, 2004 Annual Meeting of Shareholders. The Plan called for an annual award of restricted stock having a fair market value of $25,000 as of the close of business on October 1 of the current fiscal year for all eligible non-employee directors. The stock is awarded in four installments quarterly during the fiscal year provided the director is still serving on the board on the quarterly issue date. In fiscal year 2005 the annual award was increased to $40,000 effective the fourth quarter of the fiscal year.
Plan Category |
|
|
| Number of Securities |
| Weighted-average |
| Number of Securities |
| |||||||
Equity compensation plans approved by security holders |
|
| 705,129 |
|
|
| $ | 9.95 |
|
|
| 1,698,065 | (1) |
| ||
Equity compensation plans not approved by security holders |
|
| 0 |
|
|
| $ | 0.00 |
|
|
| 0 |
|
| ||
Total |
|
| 705,129 |
|
|
| $ | 9.95 |
|
|
| 1,698,065 | (1) |
| ||
(1)Table of Contents Includes 1,613,419 stock options from the 1998 Stock Option Plan and 84.646 shares from the 2003 Restricted Stock Plan.
In the fiscal years ended September 30, 2006, 20052008, 2007 and 20042006, awards to our non-employee directors under the 2003 Restricted stock Plan were 15,396, 15,82811,355, 15,056 and 30,85515,396 shares respectively.
Security Ownership of Principal Shareholders
The following table sets forth certain information with respect to the beneficial ownership, as of January 25, 2007, of each person who we knew to be the beneficial owner of more than 5% of our common stock. To the knowledge of the Company, each of the shareholders named below has sole voting and investment power with respect to such shares, unless otherwise indicated. The information provided in the table is based on our records, information filed with the Securities and Exchange Commission and information provided to the Company.
|
| Common Stock |
| ||||
|
| Number of |
| Percent of |
| ||
Name of Beneficial Owner |
|
|
| Shares |
| Class(1) |
|
Geoffrey S. M. Hedrick(2) |
| 4,001,676 |
| 23.7 | % | ||
Federated Investors, Inc.(3) |
| 2,600,400 |
| 15.4 | % | ||
State Teachers Retirement System of Ohio(4) |
| 2,276,550 |
| 13.5 | % | ||
Putnam Investment Management(5) |
| 974,074 |
| 5.8 | % | ||
(1) As used in this table, beneficial ownership means the sole or shared power to vote or direct the voting of a security, or the sole or shared investment power with respect to a security (i.e., the power to dispose, or direct the disposition, of a security). A person is deemed as of any date to have beneficial ownership of any security that such person has the right to acquire within 60 days after such date. Percentage ownership is based upon 16,856,193 shares of common stock outstanding as of January 25, 2007.
(2) Mr. Hedrick’s address is c/o Innovative Solutions and Support, Inc., 720 Pennsylvania Drive, Exton, PA 19341. The amount includes options to purchase 1,500 shares, which were exercisable as of January 25, 2007, or within 60 days from such date.
(3) As filed on Amendment No.1 to Schedule 13G with the SEC on March 10, 2006. Federated Investors, Inc.’s address is Federated Investors Tower, Pittsburgh PA. 15222
(4) As filed on Form 4 with the SEC on January 12, 2007. State Teachers Retirement System of Ohio’s address is 275 East Broad Street, Columbus OH. 43215
(5) As filed on Amendment to Schedule 13G with the SEC on February 11, 2005. Putnam Investment Management’s address is One Post Office Square, Boston, MA. 02109
Security Ownership of Management
The following table sets forth certain information with respect to the beneficial ownership as of January 25, 2007 of (i) each director, (ii) the Named Executive Officers and (iii) all the directors and executive officers as a group. Each of the shareholders named below has sole voting and investment power with respect to such shares, unless otherwise indicated. The information provided in the table is based on our records, information filed with the Securities and Exchange Commission and information provided to the Company.
Name of Beneficial Owner |
|
|
| Number of Shares |
| Percent of Class(1) |
| ||||
Geoffrey S. M. Hedrick |
|
| 4,001,676 | (2) |
|
| 23.7 | % |
| ||
Robert E. Mittelstaedt, Jr. |
|
| 124,424 | * |
|
|
|
|
| ||
Roman G. Ptakowski |
|
| 180,000 | (3) |
|
| 1.1 | % |
| ||
Winston J. Churchill |
|
| 60,922 | * |
|
|
|
|
| ||
James J. Reilly |
|
| 53,549 | (4) | * |
|
|
|
| ||
Robert H. Rau |
|
| 28,040 | * |
|
|
|
|
| ||
Glen R. Bressner |
|
| 25,383 | * |
|
|
|
|
| ||
Ivan M. Marks |
|
| 13,009 | * |
|
|
|
|
| ||
Raymond J. Wilson |
|
| — |
|
|
|
|
|
| ||
All executive officers and directors as a group (9 persons) |
|
| 4,487,003 | (5) |
|
| 26.6 | % |
| ||
* Less than 1%.
(1) As used in this table, beneficial ownership means the sole or shared power to vote or direct the voting of a security, or the sole or shared investment power with respect to a security (i.e., the power to dispose, or direct the disposition, of a security). A person is deemed as of any date to have beneficial ownership of any security that such person has the right to acquire within 60 days after such date. Percentage ownership is based upon 16,856,193 shares of common stock outstanding as of January 25, 2007.
(2) Includes options to purchase 1,500 shares, which were exercisable as of January 25, 2007, or within 60 days from such date.
(3) Represents the total number of outstanding options to purchase shares, which were exercisable as of January 25, 2007, or within 60 days from such date.
(4) Includes options to purchase 49,049 shares, which were exercisable as of January 25, 2007, or within 60 days from such date.
(5) Includes options to purchase 230,549 shares, which were exercisable as of January 25, 2007, or within 60 days from such date
Item 13. Certain relationships and related transactions.transactions and Director independence.
This information will be included in our Proxy Statement relating to our Annual Meeting of Shareholders, which will be filed within 120 days after close of our fiscal year covered by this Report, and is hereby incorporated by reference to such Proxy Statement.
The Company incurred legal fees of $357,000, $137,000 and $116,000 with a law firm which is a shareholder of the Company for the years ended September 30, 2006, 2005 and 2004, respectively. The fees paid and services rendered were comparable with the fees paid and services rendered prior to the law firm’s investment in the Company.
For the years ended September 30, 2006, 2005 and 2004, respectively, the Company incurred service fees of $25,000, $33,000 and $125,000 with a commercial graphics firm controlled by an individual who is married to a shareholder and the daughter of the Company’s Chairman and Chief Executive Officer.
Item 14. Principal accounting fees and services
Principal Accountant Fees and Services
The audit committee retained Deloitte & Touche, LLP This information will be included in our Proxy Statement relating to provide audit services for the fiscal years ended September 30, 2006 and 2007. Services provided by Deloitte & Touche, LLP included an auditour Annual Meeting of the annual consolidated financial statementsShareholders, which will be filed within 120 days after close of the company, an audit of the effectiveness of internal controls over financial reporting as required by the Sarbanes-Oxley Act of 2002 and other services related to filings made with the SEC. The aggregate fees billed by Deloitte & Touche, LLP in connection with services rendered duringour fiscal year ended September 30, 2006covered by this Report, and 2005 were:
|
| FY 2006 |
| FY 2005 |
| ||
Audit Fees |
| $ | 407,180 |
| $ | 462,975 |
|
Audit Related Fees |
| $ | 17,150 |
| $ | 16,000 |
|
Tax Fees |
| $ | 3,900 |
| $ |
|
|
Total |
| $ | 428,230 |
| $ | 478,975 |
|
is hereby incorporated by reference to such Proxy Statement.
Audit fees for fiscal 2006 and 2005 were for professional services rendered for the audit of our annual consolidated financial statements, auditing the effectiveness of our internal controls over financial reporting, review of the interim consolidated financial statements included in quarterly reports and services that are normally provided by Deloitte & Touche, LLP in connection with statutory and regulatory filings or engagements.
Audit related fees for fiscal 2006 and 2005 were for audits of our 401(k) Plan.
Tax-related fees for fiscal year 2006 were related to assistance with an IRS examination for the fiscal year 2002.
Pre-Approved Policies and Procedures
The Audit Committee’s policy is to pre-approve the engagement of accountants to render all audit and tax-related services for the Company, as well as any changes to the terms of the engagement. The Audit Committee will also pre-approve all proposed non-audit related services to be provided by the Company’s independent registered public accounting firm. The Audit Committee reviews the terms of the engagement, a description of the engagement, and a budget for the engagement. The request for services must be specific as to the particular services to be provided. Requests are aggregated and submitted to the Audit Committee in one of the following ways: requesting approval of services at a meeting of the Audit Committee, through a written consent or by a designated member of the Audit Committee. The Audit Committee approved all 2006 and 2005 fees paid to the independent registered public accounting firm.
Pursuant to the adoption of the revised Audit Committee Charter, the Board of Directors has adopted a policy which prohibits the Company from entering into non-audit related consulting agreements for financial information systems design and implementation, for certain other services considered to have an impact on independence, and for all other services prohibited by the Sarbanes-Oxley Act of 2002 and new Securities and Exchange Commission regulations. The policy also contains procedures requiring Audit Committee pre-approval of all audit and permitted non-audit services provided by the Company’s independent registered public accounting firm.
10