Table of Contents
·
•intellectual property or litigation developments;·
•changes in our management team;·
•economic factors unrelated to our performance; and·
•our issuance of additional shares of stock or other securities. In addition, the securities markets have experienced significant price and trading volume fluctuations. These broad market fluctuations may adversely affect the trading price of our securities. In the past, following periods of volatility in the market price of a public company’scompany's securities, securities class action litigation has often been instituted against that company. Such litigation could result in substantial cost and a diversion of management’smanagement's attention and resources.
Our quarterly operating results are volatile and may adversely affect the market price of our securities.
Our future revenues and operating results are likely to vary significantly from quarter to quarter due to a number of factors, many of which are outside our control, and any of which could harm our business. As a result, we believe that quarterly comparisons of our operating results are not necessarily meaningful and that you should not rely on the results of one quarter as an indication of our future performance. In addition to the other risk factors described in this report, additional factors that have caused and/or could cause our quarterly operating results to fluctuate and in turn affect the market price of our securities include:
·
- •
- increases in the cost of advertising;
·
- •
- our inability to retain existing customers or encourage repeat purchases;
·
- •
- the extent to which our existing and future marketing agreements are successful;
·
- •
- price competition that results in lower profit margins or losses;
·
- •
- the amount and timing of operating costs and capital expenditures relating to the expansion of our business operations and infrastructure;
·
- •
- the amount and timing of our purchases of inventory;
·
- •
- our inability to manage distribution operations or provide adequate levels of customer service;
·
- •
- our ability to successfully integrate operations and technologies from acquisitions or other business combinations;
·
- •
entering intooffering new lines of products;·
- •
- our ability to attract users to our
new auctions, and car listing and real estate sites; and·
- •
- our inability to replace the loss of significant customers.
Our operating results may fluctuate depending on the season, and such fluctuations may affect the market price of our securities.
We have experienced and expect to continue to experience fluctuations in our operating results because of seasonal fluctuations in traditional retail patterns. Sales in the retail and wholesale industry tend to be significantly higher in the fourth calendar quarter of each year than in the preceding three quarters due primarily to increased shopping activity during the holiday season. However, there can be no assurance that our sales in the fourth quarter will exceed those of the preceding quarters or, if the fourth quarter sales do exceed those of the preceding quarters, that we will be able to manage the
Table of Contents
increased sales effectively. Further, we generally increase our inventories substantially in anticipation of holiday season shopping activity, which has a negative effect on our cash flow. Securities analysts and investors may inaccurately estimate the effects of seasonality on our results of operations in one or more future quarters and, consequently, our operating results may fall below expectations, causing the market price of our securities to decline.
We do not intend to pay dividends on our common stock and you may lose the entire amount of your investment in our common stock.
We have never declared or paid any cash dividends on our common stock and do not intend to pay dividends on our common stock for the foreseeable future. We intend to invest our future earnings, if any, to fund our growth. Therefore, you will not receive any funds without selling your shares. We cannot assure that you will receive a positive return on your investment when you sell your shares or that you will not lose the entire amount of your investment.
Our Amended and Restated Certificate of Incorporation, Amended and Restated Bylaws and the Delaware General Corporation Law contain anti-takeover provisions which could discourage or prevent a takeover, even if an acquisition would be beneficial to our stockholders.
Several provisions of our Amended and Restated Certificate of Incorporation and Amended and Restated Bylaws could discourage potential acquisition proposals and could delay or prevent a change in control of our company even if that change in control would be beneficial to our stockholders. For example, only one-third of our board of directors will be elected at each of our annual meetings of stockholders, which will make it more difficult for a potential acquirer to change the management of our company, even after acquiring a majority of the shares of our common stock. These provisions, which cannot be amended without the approval of two-thirds of our stockholders, could diminish the opportunities for a stockholder to participate in tender offers, including tender offers at a price above the then current market value of our common stock. In addition, our board of directors, without further stockholder approval, may issue preferred stock, with such terms as the board of directors may determine, that could have the effect of delaying or preventing a change in control of our company. The issuance of preferred stock could also adversely affect the voting powers of the holders of common stock, including the loss of voting control to others. We are also afforded the protections of Section 203 of the
21
Table of Contents
Delaware General Corporation Law, which could delay or prevent a change in control of our company or could impede a merger, consolidation, takeover or other business combination involving our company or discourage a potential acquirer from making a tender offer or otherwise attempting to obtain control of our company.
The price of our stock may be vulnerable to manipulation.
We have filed an unfair business practice lawsuit against, Gradient Analytics, Rocker Partners, L.P. and others, alleging that the defendants have conspired to denigrate Overstock’sOverstock's business for personal profit, as well as an amended complaint alleging additional causes of action and articulating in greater detail the allegations against the defendants. We have also filed an unfair business practice lawsuit against Morgan Stanley & Co. Incorporated, Goldman Sachs & Co., Bear Stearns Companies, Inc., Bank of America Securities LLC, Bank of New York, Citigroup Inc., Credit Suisse (USA) Inc., Deutsche Bank Securities, Inc., Merrill Lynch, Pierce, Fenner & Smith, Inc., and UBS Financial Services, Inc. In September 2007, we filed an amended complaint adding Lehman Brothers Holdings Inc. as an additional defendant and articulating in greater detail the allegations against the defendants. We believe that the defendants in both of these lawsuits have engaged in unlawful actions and have caused substantial harm to Overstock, and that certain of the defendants have made efforts to drive the market price of Overstock’sOverstock's common stock down. To the extent that the defendants or other persons engage in any such actions or take any other actions to interfere with or destroy or harm Overstock’s Overstock's
Table of Contents
existing and/or prospective business relationships with its suppliers, bankers, customers, lenders, investors, prospective investors or others, our business, prospects, financial condition and results of operation may suffer, and the price of our common stock may be more volatile than it might otherwise be and/or may trade at prices below those that might prevail in the absence of any such efforts.
Our stock has consistently been on the Regulation SHO threshold list.
Regulation SHO requires the stock exchanges to publish daily a list of companies whose stock has failures-to-deliver above a certain threshold. It also requires mandatory close-outs for open fail-to-deliver positions in threshold securities persisting for over 13 days, with the aim that no security would appear on the threshold for any extended period. Despite that aim, we have consistently appeared on the Regulation SHO threshold list and, while we do not currently appear on the Regulation SHO threshold list, we have been on the list for more trading days than any other company.
Any investment in our securities involves a high degree of risk. Investors should consider carefully the risks and uncertainties described above, and all other information in this Form 10-K/A and in any reports we file with the SEC after we file this Form 10-K/A, before deciding whether to purchase or hold our securities. Additional risks and uncertainties not currently known to us or that we currently deem immaterial may also become important factors that may harm our business. The occurrence of any of the risks described in this Form 10-K/A could harm our business. The trading price of our securities could decline due to any of these risks and uncertainties, and investors may lose part or all of their investment.
Available Information
Our Internet website address is http://www.overstock.com. Our Annual Report on Form 10-K, Quarterly Reports on Form 10-Q, Current Reports on Form 8-K and amendments to those reports filed or furnished pursuant to Section 13(a) or 15(d) of the Securities Exchange Act of 1934 are available free of charge through our Internet website as soon as reasonably practicable after we electronically file such material with, or furnish it to, the SEC. Our Internet website and the information contained therein or connected thereto are not a part of or incorporated into this Annual Report on Form 10-K/A.
ITEM 1B. UNRESOLVED STAFF COMMENTS
None.
ITEM 2. PROPERTIES
Corporate office space
ThroughIn July 2005, we leased 43,000 square feet of office space at Old Mill Corporate Center I for our principal executive offices under an operating lease which was originally scheduled to expire in January 2007. Beginning July 2005, this lease was terminated and replaced with a lease for approximately 154,000 rentable square feet in the Old Mill Corporate Center III in Salt Lake City, Utah for a term of ten years.
We entered into a Tenant Improvement Agreement (the “OMIII Agreement”) with Old Mill Corporate Center III, LLC (the “Lessor”) relating to the office building in February 2005. The OMIII Agreement sets forth the terms on which we paid the costs of certain improvements to the leased office space. The amount of the costs was approximately $2.0 million. The OMIII Agreement also required us to provide a letter of credit in the amount of $500,000 to the Lessor to provide funds for the removal of certain improvements upon the termination of the lease.
In 2006, we commenced implementation of a facilities consolidation and restructuring program. Under the program, we recorded $638,000 of accelerated depreciation of leasehold improvements related to our current office facilities that we are attempting to sublease, and $450,000 of costs incurred to return our office facilities to their original condition as required by the lease agreement.
During fiscal year 2007, we recorded an additional $6.2 million of restructuring costs related to our marketing for sub-lease office and data center space in our current corporate office facilities. We also recorded an additional $2.2 million of restructuring charges related to accelerated depreciation of leasehold improvements located in the abandoned office and co-location data center space and $200,000 of other miscellaneous restructuring charges (see Item 15 of Part IV, “Financial Statements (Restated)”—Note 4—“Restructuring Expense”).
Logistics and warehouse space
In July 2004, we entered into a logistics service agreement (the “Logistics Agreement”) wherein the handling, storage and distribution of some of our prepackaged products were performed by a third party. The Logistics Agreement and subsequent amendment set forth terms on which we paid various fixed fees based onWe currently lease 795,000 square feet of storage and various variable costs based on product handling costs for a term of five years.
In December 2005, we entered into a warehouse facilities lease agreement (the “License Agreement”) to license approximately 400,000 square feet of warehouse space in Indiana. The License Agreement was subsequently amended, reducing the amount of lease space to approximately 300,000 and extending the term to 2011.
In the first quarter of 2007, we terminated the Logistics Agreement and gave notice of intent to sublease the Indiana warehouse facilities under the License Agreement. During the second quarter of 2007, we reached an agreement to terminate the Indiana warehouse facilities lease effective August 15, 2007. As a result of the termination of the License agreement and warehouse lease, we incurred $3.7 million of related restructuring charges in 2007 (see Item 15 of Part IV, “Financial Statements (Restated)”—Note 4—“Restructuring Expense”).
We lease 561,000 square feet for our warehouse facilities in Utah under operating leases which expire in August 2012. We also temporarily2012 and August 2015.
On April, 8, 2008, we entered into a lease agreement with Natomas Meadows, LLC (the "Natomas Lease"). The Natomas Lease is for a 686,865 square foot warehouse facility in Salt Lake City, Utah (the "New Warehouse"). The Natomas Lease provides that we will lease the New Warehouse in stages: on October 15, 2008, we leased an additional 251,000the initial 232,900 square feet of warehouse space in Utah under operating leasesthe New Warehouse; on February 1, 2009, we leased a total of 435,400 square feet; and, on September 1, 2009, we will lease the remainder, for a total of 686,865 square feet. The Natomas Lease term is seven years, and specifies rent, exclusive of common area maintenance fees, at a variable rate over the course of the staged lease term, ranging from $0.3300 per square foot for the seasonal increasefirst stage, to $0.3950 per square foot for the last year of the Natomas Lease term. Including the space now leased in inventory during the fourth quarterNew Warehouse, we currently have warehouse operations in two facilities in Salt Lake City. The Natomas Lease anticipates that we may construct a corporate office facility within the New Warehouse. We constructed a 40,000 square foot customer service facility in the New Warehouse and commenced use of 2007.
22the facility on November 3, 2008.
Table of Contents
Co-location data center
In July 2005, we entered into a Co-location Center Agreement (the “Co-location Agreement”) to build out and lease 11,289 square feet of space at Old Mill Corporate Center II for an IT co-location data center. The Co-location Agreement set forth the terms on which the Lessor would incur the costs to build out the IT co-location data center and we would commence to lease the space upon its completion for a term of ten years. In November 2006 however, we made the determination to consolidate our facilities and to not occupy the IT co-location data center, and the Co-location Agreement was terminated effective December 29, 2006, for which we incurred a $4.6 million restructuring charge (see Item 15 of Part IV, “Financial Statements (Restated)”—Note 4—“Restructuring Expense”).
In December 2006, we entered into a Data Center Agreement (the “OM"OM I Agreement”Agreement") to lease 3,999 square feet of space at Old Mill Corporate Center I for an IT data center to allow us to consolidate other IT data center facilities at the Old Mill Corporate Center II and at our current corporate offices facilities.
We believe that theseall the above listed facilities will be sufficient for our needs for at least the next twelve months, subject to seasonal requirements for additional warehouse space during the fourth quarter. Also, we are still considering further consolidation of office space, possibly through a complete relocation of our corporate office facilities.
ITEM 3. LEGAL PROCEEDINGS
The information set forth under Item 15 of Part IV, “Financial Statements (Restated)”"Financial Statements"—Note 13—“14—"Commitments and Contingencies”,Contingencies," subheading “Legal Proceedings”,"Legal Proceedings," contained in the “Notes"Notes to Consolidated Financial Statements”Statements" of this Annual Report on Form 10-K/A is incorporated by reference in answer to this Item.
ITEM 4. SUBMISSION OF MATTERS TO A VOTE OF SECURITY HOLDERS
No matters were submitted to a vote of security holders during the fourth quarter of 2007.2008.
EXECUTIVE OFFICERS OF THE REGISTRANT
The following persons were executive officers of Overstock.com as of March 1, 2008:
Executive Officers
|
| Age
|
| Position
|
Patrick M. Byrne
| | 45
| | Chairman, Chief Executive Officer
|
Stephen P. Tryon
| | 46
| | Senior Vice President, Logistics
|
Jonathan E. Johnson III
| | 42
| | Senior Vice President, Corporate Affairs and Legal
|
David K. Chidester
| | 36
| | Senior Vice President, Finance
|
Stormy Simon
| | 39
| | Senior Vice President, Customer Care, PR and Branding
|
Sam Peterson
| | 32
| | Senior Vice President, Technology
|
Jacob Hawkins
| | 32
| | Senior Vice President, Change Management
|
Dr. Patrick M. Byrne has served as our Chief Executive Officer (principal executive officer) and as a Director since October 1999, as Chairman of the Board from February 2001 through October 2005, and since July 2006. From September 1997 to May 1999, Dr. Byrne served as President and Chief Executive Officer of Fechheimer Brothers, Inc., a manufacturer and distributor of uniforms. From 1995 until its sale in September 1999, Dr. Byrne was Chairman, President and Chief Executive Officer of Centricut, LLC, a manufacturer and distributor of industrial torch parts. From 1994 to the present, Dr. Byrne has served as a Manager of the Haverford Group, an investment company and an affiliate of Overstock. Dr. Byrne has a Bachelor of Arts degree in Chinese studies from Dartmouth College, a Master’s degree from Cambridge University as a Marshall Scholar, and a Ph.D. in philosophy from Stanford University.
Mr. Stephen P. Tryon joined Overstock.com in August 2004, and serves as Senior Vice President, Logistics, with primary responsibility for logistics and supervision of the Company’s warehouse operations, and most recently, managing the Company’s human resources. Prior to joining Overstock.com, Mr. Tryon was the Legislative Assistant to the Chief of Staff of the United States Army. During his 21 years with the Army, his assignments included director of plans for the 10th Mountain Division, Congressional Fellow for United States Senator Max Cleland, Assistant Professor of Philosophy at the United States Military Academy, and commander of a company of paratroopers. Mr.Tryon received a B.S. in Applied Sciences from the U.S. Military Academy in 1983 and a M.A. in Philosophy from Stanford University in 1992.
Mr. Jonathan E. Johnson III joined Overstock.com in September 2002. He has served as our General Counsel and as our Vice President, Strategic Projects, and currently serves as our Senior Vice President, Corporate Affairs and Legal and as our Secretary. From May 1999 to September 2002, Mr. Johnson held various positions with TenFold Corporation, including positions as General Counsel, Executive Vice President and Chief Financial Officer. From October 1997 to April 1999, Mr. Johnson practiced law in the Los Angeles offices of Milbank, Tweed, Hadley & McCloy and from September 1994 to September 1997, he practiced law in the Los Angeles offices of Graham & James. From February 1994 to August 1994, Mr. Johnson served as a judicial clerk at the Utah Supreme Court for Justice Leonard H. Russon, and prior to that, from August 1993 to January 1994, Mr. Johnson served as a judicial clerk at the Utah Court of Appeals for Justice Russon. Mr. Johnson holds a Bachelor’s Degree in Japanese from Brigham Young University, studied for a year at Osaka University of Foreign Studies in Japan, and received his law degree from the J. Reuben Clark, Jr. Law School at Brigham Young University.
Mr. David K. Chidester currently serves as our Senior Vice President, Finance (our principal financial and accounting officer). Mr. Chidester served as our Controller from August 1999 to August 2003 and as our Acting Chief Financial Officer from August 2003 to January 2004. Prior to joining Overstock.com, Mr. Chidester was with PricewaterhouseCoopers LLP from December 1995 to August 1999. Mr. Chidester holds a Bachelor of Science Degree in Accounting and a Master’s Degree in Business Administration, both from the University of Utah.
Ms. Stormy Simon currently serves as our Senior Vice President, Customer Care and Strategic Marketing. Ms. Simon previously served as our Vice President, BMMG, Travel and Off-Line Advertising, Chief of Staff and as our Director of B2B. Prior to joining Overstock.com in 2001, Ms. Simon worked in the media and travel industries.
Mr. Sam Peterson currently serves as our Senior Vice President, Technology. Mr. Peterson previously served as the Vice President, Software Development from early 2005, and was appointed as Director, Network and Systems Engineering in 2003. Prior to joining Overstock in 1999, Mr. Peterson was involved in creating several start-up internet ventures, including Fitnesoft, Inc.
Mr. Jacob Hawkins currently serves as Senior Vice President, Change Management. Mr. Hawkins has performed various roles across the organization, including business development, marketing, merchandising, technology, and project management. Prior to joining Overstock.com, Mr. Hawkins worked for Professional Marketing International. Mr. Hawkins holds a Bachelor’s degree in Business Management from Brigham Young University and a Masters of Business Administration with an emphasis in information systems from the University of Utah.
There are no family relationships among any of the current officers and directors of the Company.
23
Table of Contents
PART II
ITEM 5. MARKET FOR THE REGISTRANT’SREGISTRANT'S COMMON EQUITY, RELATED STOCKHOLDER MATTERS AND ISSUER PURCHASES OF EQUITY SECURITIES
Market Information
Our common stock is traded on the NASDAQ Global Market under the symbol “OSTK”."OSTK." Prior to May 30, 2002, there was no public market for our common stock. The following table sets forth, for the periods indicated, the high and low sales prices per share for our common stock as reported by NASDAQ.
| | | | | | | | |
| | Common
Stock Price | |
|---|
| | High | | Low | |
|---|
Year Ended December 31, 2007 | | | | | | | |
| | First Quarter | | | 19.72 | | | 14.05 | |
| | Second Quarter | | | 19.98 | | | 15.80 | |
| | Third Quarter | | | 28.99 | | | 17.22 | |
| | Fourth Quarter | | | 39.39 | | | 14.75 | |
Year Ended December 31, 2008 | | | | | | | |
| | First Quarter | | | 15.68 | | | 8.61 | |
| | Second Quarter | | | 28.50 | | | 11.50 | |
| | Third Quarter | | | 29.59 | | | 13.64 | |
| | Fourth Quarter | | | 20.13 | | | 6.34 | |
Table of Contents
STOCK PERFORMANCE GRAPH
The following graph shows a comparison of cumulative total stockholder return, calculated on a dividend reinvested basis, from the market closing price on December 31, 2003 through December 31, 2008 for Overstock.com, Inc., Hemscott's (formerly Media General's) Nasdaq U.S. Index and Hemscott's Internet Software and Services Index. The graph assumes that $100 was invested in Overstock's common stock and the above indices at the closing prices on December 31. Historic stock price performance is not necessarily indicative of future stock price performance.
| | Common
Stock Price | |
| | High | | Low | |
Year Ended December 31, 2006 | | | | | |
First Quarter | | 35.02 | | 21.60 | |
Second Quarter | | 30.63 | | 19.00 | |
Third Quarter | | 22.93 | | 16.03 | |
Fourth Quarter | | 19.09 | | 13.40 | |
Year Ended December 31, 2007 | | | | | |
First Quarter | | 19.72 | | 14.05 | |
Second Quarter | | 15.80 | | 19.98 | |
Third Quarter | | 28.99 | | 17.22 | |
Fourth Quarter | | 39.39 | | 14.75 | |
COMPARISON OF CUMULATIVE TOTAL RETURN
AMONG OVERSTOCK.COM, INC.,
NASDAQ MARKET INDEX-U.S. AND HEMSCOTT GROUP INDEX
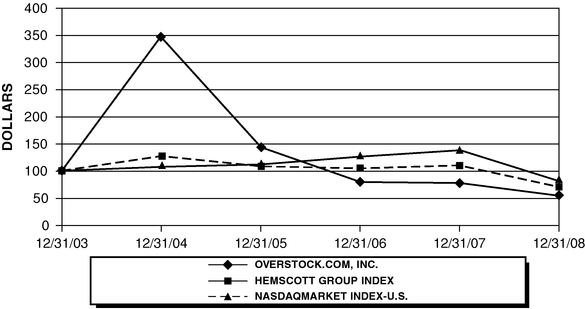
ASSUMES $100 INVESTED ON DEC. 31, 2003
ASSUMES DIVIDEND REINVESTED
FISCAL YEAR ENDING DEC. 31, 2008
Holders
As of March 14, 2008,February 23, 2009, there were 194183 holders of record of our common stock. Because many of our shares of common stock are held by brokers and other institutions on behalf of shareholders, we are unable to estimate the total number of shareholders represented by these record holders.
Dividends
We have never declared or paid any cash dividends on our common stock. We currently intend to retain any earnings for future growth and do not anticipate paying any cash dividends in the foreseeable future. Any future determination to pay dividends will be at the discretion of our board of directors and will depend on our results of operations, financial conditions, contractual and legal restrictions and other factors the board deems relevant. Our Loan and Security Agreement with Wells Fargo Retail Finance, LLC dated December 12, 2005as amended and restated on January 6, 2009, prohibits us from paying dividends without the consent of the lender.
Table of Contents
Recent Sales of Unregistered Securities
During January 2005, the BoardNone.
Issuer Purchases of Directors authorized a stock repurchase program under which we were authorized to repurchase up to $50.0 million of our common stock through December 31, 2007. On April 26, 2005, the Board of Directors increased the amount of the share repurchase program to $100.0 million. Additionally, on June 14, 2005, the Board of Directors authorized an amendment of the stock repurchase program to include the repurchase of its Convertible Senior Notes.
During 2005, we entered into several purchased call options, pursuant to which we could have been required to purchase up to 1.3 million shares of our common stock at certain settlement dates during the quarter ended June 30, 2005. In connection with these repurchase transactions; we paid approximately $47.5 million, which was recorded in shareholders’ equity in the consolidated balance sheet.
At our option, the purchased call options were settled in cash or stock, based on the market price of our common stock on the date of the settlement. Upon settlement, we either had our capital investment returned with a premium or received shares of our common stock, depending, respectively, on whether the market price of our common stock was above or below a pre-determined price agreed in connection with each such transaction.
Under the share repurchase program, we repurchased approximately 665,000 shares of our common stock in open market transactions for $24.1 million during the year ended December 31, 2005. In addition, approximately 1.0 million shares of common stock were acquired as a result of the settlement of $41.1 million of structured stock repurchase transactions during the twelve months ended December 31, 2005. The purchased call options that did not settle in stock settled in cash totaling $7.9 million, which we received in July 2005.
Equity Securities
In January 2008, the Board of Directors an additionalapproved a repurchase program under which we arewere authorized to repurchase up to $20.0 million of our common stock and/or Convertible Senior Notes due 2011 through December 31, 2009. Under this repurchase program, we repurchased approximately 1.11.2 million shares of our common stock in open market transactions for $12.0$13.4 million through March 14, 2008. None of the purchases were made during the fourth quarteryear ended December 31, 2008. The Company had fully utilized the authorized this $20.0 million repurchase program as of 2007.
December 31, 2008.
We have a 401(k) defined contribution plan which permits participating employees to defer up to a maximum of 25% of their compensation, subject to limitations established by the Internal Revenue Code. Employees who have completed a half-year of service and are 21 years of age or older are qualified to participate in the plan. We match 50% of the first 6% of each participant’sparticipant's contributions to the plan. Participant contributions are immediately vested. Company contributions vest based on the participant’sparticipant's years of service at 20% per year over five years. Our matching contribution totaled $261,000, $389,000, $494,000 and $494,000$570,000 during 2005,the years ended December 31, 2006, 2007 and 2007,2008, respectively. Beginning in 2006 and through January of 2008, our matching contribution was paid using common stock issued from treasury. In addition, for the 2005, 2006 and 2007, years, the board of directors approved a discretionary contributioncontributions of 2% of salary to all employees eligible to participate in the plan totaling $342,000, $409,000 and $408,000, respectively. The contributions in 2006 and 2007 were settled with shares of our common stock in the following year. No discretionary contributions were approved or paid for 2008.
Stock based Compensation
Stock Options
Our board of directors adopted the Amended and Restated 1999 Stock Option Plan, the 2002 Stock Option Plan and the 2005 Equity Incentive Plan (collectively, the “Plans”"Plans"), in May 1999, April 2002 and April 2005, respectively. Under these Plans, the Board of Directors may issue incentive stock options to our employees and directors and non-qualified stock options to our consultants, as well as other types of awards under the 2005 Equity Incentive Plan. Options granted under these Plans generally expire at the end of either five or ten years and vest in accordance with a vesting schedule determined by our Board of Directors, usually over four years from the grant date. As of the initial public offering, the Amended and Restated 1999 Stock Option Plan was terminated. FutureSubsequent awards will be made under the 2005 Equity Incentive Plan. As of December 31, 2007, 608,0002008, 1.2 million shares of stock based awards were available for future grants under these Plans.
24
Table of Contents
the 2005 Equity Incentive Plan.
The following is a summary of stock option activity (amounts in thousands, except per share data):
| | | | | | | | | | | | | | | | | | | | |
| | 2006 | | 2007 | | 2008 | |
|---|
| | Shares | | Weighted
Average
Exercise
Price | | Shares | | Weighted
Average
Exercise
Price | | Shares | | Weighted
Average
Exercise
Price | |
|---|
Outstanding—beginning of year | | | 1,299 | | $ | 18.09 | | | 1,011 | | $ | 18.97 | | | 1,161 | | $ | 20.48 | |
| | Granted at fair value | | | 183 | | | 22.47 | | | 762 | | | 18.14 | | | 11 | | | 14.14 | |
| | Exercised | | | (276 | ) | | 9.19 | | | (354 | ) | | 8.81 | | | (112 | ) | | 12.96 | |
| | Canceled/forfeited | | | (195 | ) | | 30.17 | | | (258 | ) | | 23.65 | | | (86 | ) | | 20.45 | |
| | | | | | | | | | | | | | | | | |
Outstanding—end of year | | | 1,011 | | | 18.97 | | | 1,161 | | | 20.48 | | | 974 | | | 21.27 | |
| | | | | | | | | | | | | | | | | |
Options exercisable at year-end | | | 679 | | $ | 15.74 | | | 408 | | $ | 22.36 | | | 609 | | $ | 23.18 | |
Table of Contents
| | 2005 | | 2006 | | 2007 | |
| | Shares | | Weighted
Average
Exercise
Price | | Shares | | Weighted
Average
Exercise
Price | | Shares | | Weighted
Average
Exercise
Price | |
Outstanding—beginning of year | | 1,512 | | $ | 12.90 | | 1,299 | | $ | 18.09 | | 1,011 | | $ | 18.97 | |
Granted at fair value | | 220 | | 44.44 | | 183 | | 22.47 | | 762 | | 18.14 | |
Exercised | | (298 | ) | 8.56 | | (276 | ) | 9.19 | | (354 | ) | 8.81 | |
Canceled/forfeited | | (135 | ) | 24.08 | | (195 | ) | 30.17 | | (258 | ) | 23.65 | |
| | | | | | | | | | | | | |
Outstanding—end of year | | 1,299 | | 18.09 | | 1,011 | | 18.97 | | 1,161 | | 20.48 | |
| | | | | | | | | | | | | |
Options exercisable at year-end | | 739 | | $ | 11.33 | | 679 | | $ | 15.74 | | 408 | | $ | 22.36 | |
Restricted Stock Units Activity
InDuring the first quarter ofyear ended December 31, 2008, the Compensation Committee of the Board of Directors approved grants of approximately 460,000491,000 restricted stock units towere granted. The cost of restricted stock units is determined using the fair value of our officerscommon stock on the date of the grant and employees whichcompensation expense is recognized in accordance with the vesting schedule. The weighted average grant date fair value of restricted stock units granted during the year ended December 31, 2008 was $12.64.
The following is a summary of restricted stock unit activity (amounts in thousands, except per share data):
| | | | | | | | |
| | 2008 | |
|---|
| | Units | | Grant Date
Fair Value | |
|---|
Outstanding—beginning of year | | | — | | $ | — | |
| | Granted at fair value | | | 491 | | | 12.64 | |
| | Vested | | | — | | | — | |
| | Canceled/forfeited | | | (42 | ) | | 12.13 | |
| | | | | | | |
Outstanding—end of year | | | 449 | | | 12.69 | |
| | | | | | | |
Restricted stock units vested at year-end | | | — | | | — | |
Restricted stock units vest over three years at 25% at the end of the first year, an additional 25% at the end of the second year and 50% at the end of the third year. During 2007, except as previously reported in a Quarterly Report on Form 10-Q/A, or current Report on Form 8-K, we did not sell any equity securities that were not registered under the Securities Act.
STOCK PERFORMANCE GRAPH
The following graph shows a comparison of cumulative total stockholder return, calculated on a dividend reinvested basis, from the market closing price onyears ended December 31, 2002 through2006, 2007 and 2008, the Company recorded stock based compensation related to restricted stock units of $0, $0 and $896,000.
At December 31, 2007 for Overstock.com, Inc., Hemscott’s (formerly Media General’s) Nasdaq U.S. Index and Hemscott’s Internet Software and Services Index. The graph assumes that $100 was invested in Overstock’s common2008, 449,000 restricted stock and the above indices at the closing prices onunits were outstanding. No restricted stock units had been vested as of December 31, 2002. Historic2008. On January 13, 2009, 337,000 restricted stock price performance is not necessarily indicativeunits were granted.
Table of future stock price performance.Contents
COMPARISON OF CUMULATIVE TOTAL RETURN ITEM 6. SELECTED FINANCIAL DATA
AMONG OVERSTOCK.COM, INC.,
NASDAQ MARKET INDEX-U.S. AND HEMSCOTT GROUP INDEX

ASSUMES $100 INVESTED ON DEC. 31, 2002
ASSUMES DIVIDEND REINVESTED
FISCAL YEAR ENDING DEC. 31, 2007
25
| | | | | | | | | | | | | | | | | | |
| | Year ended December 31, | |
|---|
| | 2004 | | 2005 | | 2006(1) | | 2007 | | 2008 | |
|---|
| | (in thousands, except per share data)
| |
|---|
Consolidated Statement of Operations Data: | | | | | | | | | | | | | | | | |
Revenue | | | | | | | | | | | | | | | | |
| | Direct revenue | | $ | 212,264 | | $ | 323,136 | | $ | 301,509 | | $ | 197,088 | | $ | 174,203 | |
| | Fulfillment partner revenue | | | 278,357 | | | 471,839 | | | 478,628 | | | 568,814 | | | 660,164 | |
| | | | | | | | | | | | |
| | | Total revenue | | | 490,621 | | | 794,975 | | | 780,137 | | | 765,902 | | | 834,367 | |
| | | | | | | | | | | | |
Cost of goods sold | | | | | | | | | | | | | | | | |
| | Direct | | | 183,653 | | | 280,647 | | | 284,774 | | | 168,008 | | | 154,501 | |
| | Fulfillment partner | | | 240,530 | | | 397,855 | | | 405,559 | | | 473,344 | | | 536,957 | |
| | | | | | | | | | | | |
| | | Total cost of goods sold | | | 424,183 | | | 678,502 | | | 690,333 | | | 641,352 | | | 691,458 | |
| | | | | | | | | | | | |
Gross profit | | | 66,438 | | | 116,473 | | | 89,804 | | | 124,550 | | | 142,909 | |
| | | | | | | | | | | | |
Operating expenses: | | | | | | | | | | | | | | | | |
| | Sales and marketing | | | 40,559 | | | 77,155 | | | 70,897 | | | 55,458 | | | 57,634 | |
| | Technology | | | 8,509 | | | 27,901 | | | 65,158 | | | 59,453 | | | 57,815 | |
| | General and administrative | | | 22,024 | | | 33,043 | | | 46,837 | | | 41,976 | | | 38,373 | |
| | Restructuring(2) | | | — | | | — | | | 5,674 | | | 12,283 | | | — | |
| | | | | | | | | | | | |
| | | Total operating expenses | | | 71,092 | | | 138,099 | | | 188,566 | | | 169,170 | | | 153,822 | |
| | | | | | | | | | | | |
Operating loss | | | (4,654 | ) | | (21,626 | ) | | (98,762 | ) | | (44,620 | ) | | (10,913 | ) |
Interest income, net | | | 1,064 | | | (161 | ) | | 3,566 | | | 4,788 | | | 3,163 | |
Interest expense | | | (775 | ) | | (5,582 | ) | | (4,765 | ) | | (4,188 | ) | | (3,462 | ) |
Other income (expense), net | | | (49 | ) | | 4,728 | | | 81 | | | (92 | ) | | (1,446 | ) |
| | | | | | | | | | | | |
Loss from continuing operations | | | (4,414 | ) | | (22,641 | ) | | (99,880 | ) | | (44,112 | ) | | (12,658 | ) |
Loss from discontinued operations | | | — | | | (2,571 | ) | | (6,882 | ) | | (3,924 | ) | | — | |
| | | | | | | | | | | | |
Net loss | | | (4,414 | ) | | (25,212 | ) | | (106,762 | ) | | (48,036 | ) | | (12,658 | ) |
Deemed dividend related to redeemable common stock | | | (188 | ) | | (185 | ) | | (99 | ) | | — | | | — | |
| | | | | | | | | | | | |
Net loss attributable to common shares | | $ | (4,602 | ) | $ | (25,397 | ) | $ | (106,861 | ) | $ | (48,036 | ) | $ | (12,658 | ) |
| | | | | | | | | | | | |
Net loss per common share—basic and diluted | | | | | | | | | | | | | | | | |
| | Loss from continuing operations | | $ | (0.26 | ) | $ | (1.17 | ) | $ | (4.91 | ) | $ | (1.86 | ) | $ | (0.55 | ) |
| | Loss from discontinued operations | | $ | — | | $ | (0.13 | ) | $ | (0.34 | ) | $ | (0.17 | ) | $ | — | |
Net loss per common share—basic and diluted | | $ | (0.26 | ) | $ | (1.30 | ) | $ | (5.25 | ) | $ | (2.03 | ) | $ | (0.55 | ) |
Weighted average common shares outstanding—basic and diluted | | | 17,846 | | | 19,429 | | | 20,332 | | | 23,704 | | | 22,901 | |
Table of Contents
ITEM 6. SELECTED FINANCIAL DATA (RESTATED)
Restatement
As discussed in Item 15 of Part IV “Financial Statements (Restated)” – Note 3 – “Restatement of Financial Statements”, the Company is restating (1) its consolidated financial statements as of December 31, 2007 and 2006 and for the years ended December 31, 2007, 2006, 2005; (2) its selected financial data as of and for the years ended December 31, 2007, 2006, 2005, 2004 and 2003; and (3) its quarterly results of operations for all quarters in the years ended December 31, 2007 and 2006 in this Amendment to the Company’s Annual Report on Form 10-K for the year ended December 31, 2007 to correct errors related to the accounting for customer refunds and credits and the accounting for gift cards issued to customers. All amounts in Selected Financial Data (Restated) have been adjusted, as appropriate, for the effects of the restatement.
The following selected consolidated financial data as of December 31, 2006 and 2007 and for each of the three years in the period ended December 31, 2007, are derived from our audited consolidated financial statements included elsewhere in this Form 10-K/A. The consolidated financial data as of December 31, 2003, 2004 and 2005 and for the years ended December 31, 2003 and 2004 are derived from our restated unaudited consolidated financial statements not contained herein. The historical results do not necessarily indicate results expected for any future period. This information should be read in conjunction with “Management’s Discussion and Analysis of Financial Condition and Results of Operations (Restated)” and the Consolidated Financial Statements and the related notes thereto included elsewhere in this Form 10-K/A.
| | Year ended December 31, | |
| | 2003(4)
(Restated) | | 2004(4)
(Restated) | | 2005(4)
(Restated) | | 2006(1)(4)
(Restated) | | 2007(4)
(Restated) | |
| | (in thousands, except per share data) | |
| | | | | | | | | | | |
Consolidated Statement of Operations Data: | | | | | | | | | | | |
Revenue | | | | | | | | | | | |
Direct revenue | | $ | 136,317 | | $ | 212,264 | | $ | 323,136 | | $ | 301,509 | | $ | 197,088 | |
Fulfillment partner revenue | | 98,286 | | 278,357 | | 471,839 | | 478,628 | | 568,814 | |
| | | | | | | | | | | |
Total revenue | | 234,603 | | 490,621 | | 794,975 | | 780,137 | | 765,902 | |
| | | | | | | | | | | |
Cost of goods sold | | | | | | | | | | | |
Direct | | 122,418 | | 183,653 | | 280,647 | | 284,774 | | 168,008 | |
Fulfillment partner | | 86,902 | | 240,530 | | 397,855 | | 405,559 | | 473,344 | |
| | | | | | | | | | | |
Total cost of goods sold | | 209,320 | | 424,183 | | 678,502 | | 690,333 | | 641,352 | |
| | | | | | | | | | | |
Gross profit | | 25,283 | | 66,438 | | 116,473 | | 89,804 | | 124,550 | |
| | | | | | | | | | | |
Operating expenses: | | | | | | | | | | | |
Sales and marketing | | 20,228 | | 40,559 | | 77,155 | | 70,897 | | 55,458 | |
Technology | | 2,549 | | 8,509 | | 27,901 | | 65,158 | | 59,453 | |
General and administrative | | 14,987 | | 22,024 | | 33,043 | | 46,837 | | 41,976 | |
Restructuring(2) | | — | | — | | — | | 5,674 | | 12,283 | |
| | | | | | | | | | | |
Total operating expenses | | 37,764 | | 71,092 | | 138,099 | | 188,566 | | 169,170 | |
| | | | | | | | | | | |
Operating loss | | (12,481 | ) | (4,654 | ) | (21,626 | ) | (98,762 | ) | (44,620 | ) |
Interest income, net | | 461 | | 1,064 | | (161 | ) | 3,566 | | 4,788 | |
Interest expense | | (76 | ) | (775 | ) | (5,582 | ) | (4,765 | ) | (4,188 | ) |
Other (expense) income, net | | 115 | | (49 | ) | 4,728 | | 81 | | (92 | ) |
| | | | | | | | | | | |
Loss from continuing operations | | (11,981 | ) | (4,414 | ) | (22,641 | ) | (99,880 | ) | (44,112 | ) |
Discontinued operations(3): | | — | | — | | — | | — | | — | |
Loss from discontinued operations | | — | | — | | (2,571 | ) | (6,882 | ) | (3,924 | ) |
| | | | | | | | | | | |
Net loss | | (11,981 | ) | (4,414 | ) | (25,212 | ) | (106,762 | ) | (48,036 | ) |
Deemed dividend related to redeemable common stock | | (262 | ) | (188 | ) | (185 | ) | (99 | ) | — | |
| | | | | | | | | | | |
Net loss attributable to common shares | | $ | (12,243 | ) | $ | (4,602 | ) | $ | (25,397 | ) | $ | (106,861 | ) | $ | (48,036 | ) |
| | | | | | | | | | | |
Net loss per common share—basic and diluted | | | | | | | | | | | |
Loss from continuing operations | | $ | (0.76 | ) | $ | (0.26 | ) | $ | (1.17 | ) | $ | (4.91 | ) | $ | (1.86 | ) |
Loss from discontinued operations | | $ | — | | $ | — | | $ | (0.13 | ) | $ | (0.34 | ) | $ | (0.17 | ) |
Net loss per common share—basic and diluted | | $ | (0.76 | ) | $ | (0.26 | ) | $ | (1.30 | ) | $ | (5.25 | ) | $ | (2.03 | ) |
Weighted average common shares outstanding—basic and diluted | | 16,198 | | 17,846 | | 19,429 | | 20,332 | | 23,704 | |
26
| | | | | | | | | | | | | | | | |
| | As of December 31, | |
|---|
| | 2004 | | 2005 | | 2006(3) | | 2007(3) | | 2008 | |
|---|
| | (in thousands)
| |
|---|
Balance Sheet Data: | | | | | | | | | | | | | | | | |
Cash and cash equivalents | | $ | 198,678 | | $ | 55,875 | | $ | 126,965 | | $ | 101,394 | | $ | 100,577 | |
Marketable securities | | | 88,802 | | | 55,799 | | | — | | | 46,000 | | | 8,989 | |
Working capital | | | 267,640 | | | 79,561 | | | 59,475 | | | 62,621 | | | 39,679 | |
Total assets | | | 381,600 | | | 335,953 | | | 264,453 | | | 231,143 | | | 172,445 | |
Total indebtedness | | | 117,589 | | | 84,676 | | | 84,336 | | | 82,453 | | | 69,130 | |
Redeemable common stock | | | 3,166 | | | 3,205 | | | — | | | — | | | — | |
Stockholders' equity (deficit) | | | 169,504 | | | 89,148 | | | 56,367 | | | 18,212 | | | (2,985 | ) |
Table of Contents
| | As of December 31, | |
| | 2003 (4)
(Restated) | | 2004 (4)
(Restated) | | 2005 (4)
(Restated) | | 2006 (4)
(Restated) | | 2007 (4)
(Restated) | |
| | (in thousands) | |
| | | | | | | | | | | |
Balance Sheet Data: | | | | | | | | | | | |
Cash and cash equivalents | | $ | 28,846 | | $ | 198,678 | | $ | 55,875 | | $ | 126,965 | | $ | 101,394 | |
Marketable securities | | 11,500 | | 88,802 | | 55,799 | | — | | 46,000 | |
Working capital | | 45,668 | | 267,640 | | 79,561 | | 59,475 | | 62,621 | |
Total assets | | 100,170 | | 381,600 | | 335,953 | | 264,453 | | 231,143 | |
Total indebtedness | | 161 | | 117,589 | | 84,676 | | 84,336 | | 82,453 | |
Redeemable common stock | | 2,978 | | 3,166 | | 3,205 | | — | | — | |
Stockholders’ equity | | 55,298 | | 169,504 | | 89,148 | | 56,367 | | 18,212 | |
| | | | | | | | | | | | | | | | |
- (1)
Effective January 1, 2006, we adopted SFAS 123(R) and recognized stock-based compensation of $4.1 million, and $4.5 million, inand $3.3 million during the years ended December 31, 2006, 2007 and 2007,2008, respectively.
(2)During the fourth quarter of 2006, we commenced implementation of a facilities consolidation and restructuring program designed to reduce the overall expense structure in an effort to improve future operating performance (see Item 15 of Part IV, “Financial Statements (Restated)”"Financial Statements"—Note 4—“3—"Restructuring Expense”Expense").
(3)As part of the program to reduce our expense structure and sell non-core businesses, we decided during the fourth quarter of 2006 to sell our travel subsidiary (“OTravel”("OTravel"). As a result, OTravel’sOTravel's operations have been classified as a discontinued operation and therefore are not included in the results of continuing operations. The loss from discontinued operations for OTravel was $6.9 million for the year ended December 31, 2006 (including a goodwill impairment charge of $4.5 million) and $3.9 million for the year ended December 31, 2007 (including a goodwill impairment charge of $3.8 million—see Item 15 of Part IV, “Financial Statements (Restated)”"Financial Statements"—Note 5—“4—"Acquisition and Subsequent Discontinued Operations”Operations").
(4)As discussed in Item 15 of Part IV “Financial Statements (Restated)” — Note 3 — “Restatement of Financial Statements”, the Company is restating (1) its consolidated financial statements as of December 31, 2007 and 2006 and for the years ended December 31, 2007, 2006, 2005; (2) its selected financial data as of and for the years ended December 31, 2007, 2006, 2005, 2004 and 2003; and (3) its quarterly results of operations for all quarters in the years ended December 31, 2007 and 2006 in this Amendment No. 1 to the Company’s Annual Report on Form 10-K for the year ended December 31, 2007 to correct errors related to the accounting for customer refunds and credits and the accounting for gift cards issued to customers. The effect of the error adjustments on the Consolidated Results of Operations for the years ended December 31, 2003, 2005, 2006 and 2007 is to increase net loss by $433,000, $294,000, $5.0 million and $3.0 million, respectively and decrease net loss for the year ended December 31, 2004 by $126,000. The effect of the error adjustments on loss per common share from continuing operations for the years ended December 31, 2003, 2005, 2006 and 2007 is to increase loss per common share from continuing operations by $0.03, $0.01, $0.24 and $0.13, respectively. The error adjustments did not have an effect on loss per common share from continuing operations for the year ended December 31, 2004. All amounts in Management’s Discussion and Analysis of Financial Condition and Results of Operations (Restated) have been adjusted, as appropriate, for the effects of the restatement.
The consolidated financial data as of December 31, 2003, 2004 and 2005 and for the years ended December 31, 2003 and 2004 have been restated as follows:
| | Year ended December 31, 2003 | |
| | As Reported | | Adjustments | | As Restated | |
| | (in thousands, except per share data) | |
| | | | | | | |
Consolidated Statement of Operations Data: | | | | | | | |
Revenue | | | | | | | |
Direct revenue | | $ | 138,134 | | (1,817 | ) | $ | 136,317 | |
Fulfillment partner revenue | | 100,811 | | (2,525 | ) | 98,286 | |
| | | | | | | |
Total revenue | | 238,945 | | (4,342 | ) | 234,603 | |
| | | | | | | |
Cost of goods sold | | | | | | | |
Direct | | 124,039 | | (1,621 | ) | 122,418 | |
Fulfillment partner | | 89,190 | | (2,288 | ) | 86,902 | |
| | | | | | | |
Total cost of goods sold | | 213,229 | | (3,909 | ) | 209,320 | |
| | | | | | | |
Gross profit | | 25,716 | | (433 | ) | 25,283 | |
| | | | | | | |
Operating expenses: | | | | | | | |
Sales and marketing | | 20,228 | | — | | 20,228 | |
Technology | | 2,549 | | — | | 2,549 | |
General and administrative | | 14,987 | | — | | 14,987 | |
Restructuring | | — | | — | | — | |
| | | | | | | |
Total operating expenses | | 37,764 | | — | | 37,764 | |
| | | | | | | |
Operating loss | | (12,048 | ) | (433 | ) | (12,481 | ) |
Interest income, net | | 461 | | — | | 491 | |
Interest expense | | (76 | ) | — | | (76 | ) |
Other (expense) income, net | | 115 | | — | | 115 | |
| | | | | | | |
Loss from continuing operations | | (11,548 | ) | (433 | ) | (11,981 | ) |
Discontinued operations: | | — | | — | | — | |
Loss from discontinued operations | | — | | — | | | |
| | | | | | | |
Net loss | | (11,548 | ) | (433 | ) | (11,981 | ) |
Deemed dividend related to redeemable common stock | | (262 | ) | — | | (262 | ) |
| | | | | | | |
Net loss attributable to common shares | | $ | (11,810 | ) | (433 | ) | $ | (12,243 | ) |
| | | | | | | |
Net loss per common share—basic and diluted | | | | | | | |
Loss from continuing operations | | $ | (0.73 | ) | (0.03 | ) | $ | (0.76 | ) |
Loss from discontinued operations | | $ | — | | — | | $ | — | |
Net loss per common share—basic and diluted | | $ | (0.73 | ) | (0.03 | ) | $ | (0.76 | ) |
| | | | | | | | | |
Weighted average common shares outstanding—basic and diluted | | 16,198 | | | | 16,198 | |
27
Table of Contents
| | Year ended December 31, 2004 | |
| | As Reported | | Adjustments | | As Restated | |
| | (in thousands, except per share data) | |
| | | | | | | |
Consolidated Statement of Operations Data: | | | | | | | |
Revenue | | | | | | | |
Direct revenue | | $ | 213,210 | | (946 | ) | $ | 212,264 | |
Fulfillment partner revenue | | 281,425 | | (3,068 | ) | 278,357 | |
| | | | | | | |
Total revenue | | 494,635 | | (4,014 | ) | 490,621 | |
| | | | | | | |
Cost of goods sold | | | | | | | |
Direct | | 184,964 | | (1,311 | ) | 183,653 | |
Fulfillment partner | | 243,468 | | (2,938 | ) | 240,530 | |
| | | | | | | |
Total cost of goods sold | | 428,432 | | (4,249 | ) | 424,183 | |
| | | | | | | |
Gross profit | | 66,203 | | 235 | | 66,438 | |
| | | | | | | |
Sales and marketing | | 40,559 | | — | | 40,559 | |
Technology | | 8,509 | | — | | 8,509 | |
General and administrative | | 22,024 | | — | | 22,024 | |
Restructuring | | — | | | | –– | |
| | | | | | | |
Total operating expenses | | 71,092 | | — | | 71,092 | |
| | | | | | | |
Operating loss | | (4,889 | ) | 235 | | (4,654 | ) |
Interest income, net | | 1,173 | | (109 | ) | 1,064 | |
Interest expense | | (775 | ) | — | | (775 | ) |
Other (expense) income, net | | (49 | ) | — | | (49 | ) |
| | | | | | | |
Loss from continuing operations | | (4,540 | ) | 126 | | (4,414 | ) |
Discontinued operations(3): | | — | | — | | — | |
Loss from discontinued operations | | — | | — | | — | |
| | | | | | | |
Net loss | | (4,540 | ) | 126 | | (4,414 | ) |
Deemed dividend related to redeemable common stock | | (188 | ) | — | | (188 | ) |
| | | | | | | |
Net loss attributable to common shares | | $ | (4,728 | ) | 126 | | $ | (4,602 | ) |
| | | | | | | |
Net loss per common share—basic and diluted | | | | | | | |
Loss from continuing operations | | $ | (0.26 | ) | — | | $ | (0.26 | ) |
Loss from discontinued operations | | $ | — | | — | | $ | — | |
Net loss per common share—basic and diluted | | $ | (0.26 | ) | — | | $ | (0.26 | ) |
| | | | | | | |
Weighted average common shares outstanding—basic and diluted | | 17,846 | | | | 17,846 | |
28
Table of Contents
| | As of December 31, 2003 | |
| | As Reported | | Adjustments | | As Restated | |
| | (in thousands) | |
| | | | | | | |
Balance Sheet Data: | | | | | | | |
Cash and cash equivalents | | $ | 28,846 | | — | | $ | 28,846 | |
Marketable securities | | 11,500 | | — | | 11,500 | |
Working capital | | 46,101 | | (433 | ) | 45,668 | |
Total assets | | 98,549 | | 1,621 | | 100,170 | |
Total indebtedness | | 161 | | — | | 161 | |
Redeemable common stock | | 2,978 | | — | | 2,978 | |
Stockholders’ equity | | 55,731 | | (433 | ) | 55,298 | |
| | | | | | | | | |
| | As of December 31, 2004 | |
| | As Reported | | Adjustments | | As Restated | |
| | (in thousands) | |
| | | | | | | |
Balance Sheet Data: | | | | | | | |
Cash and cash equivalents | | $ | 198,678 | | — | | $ | 198,678 | |
Marketable securities | | 88,802 | | — | | 88,802 | |
Working capital | | 267,947 | | (307 | ) | 267,640 | |
Total assets | | 377,543 | | 4,057 | | 381,600 | |
Total indebtedness | | 117,589 | | — | | 117,589 | |
Redeemable common stock | | 3,166 | | — | | 3,166 | |
Stockholders’ equity | | 169,811 | | (307 | ) | 169,504 | |
| | | | | | | | | |
| | As of December 31, 2005 | |
| | As Reported | | Adjustments | | As Restated | |
| | (in thousands) | |
| | | | | | | |
Balance Sheet Data: | | | | | | | |
Cash and cash equivalents | | $ | 55,875 | | — | | $ | 55,875 | |
Marketable securities | | 55,799 | | — | | 55,799 | |
Working capital | | 80,162 | | (601 | ) | 79,561 | |
Total assets | | 325,913 | | 10,040 | | 335,953 | |
Total indebtedness | | 84,676 | | — | | 84,676 | |
Redeemable common stock | | 3,205 | | — | | 3,205 | |
Stockholders’ equity | | 89,749 | | (601 | ) | 89,148 | |
| | | | | | | | | |
29
Table of Contents
ITEM 7. MANAGEMENT’SMANAGEMENT'S DISCUSSION AND ANALYSIS OF FINANCIAL CONDITION AND RESULTS OF OPERATION (RESTATED)OPERATIONS
The following Management’s Discussion and Analysis of Financial Condition and Results of Operation should be read in conjunction with our Consolidated Financial Statements and the related Notes thereto. This discussion containsAnnual Report on Form 10-K/A includes forward-looking statements based uponwithin the meaning of the Private Securities Litigation Reform Act of 1995. All statements other than statements of historical fact, including statements regarding guidance, industry prospects or future results of operations or financial position, made in this Annual Report on Form 10-K/A are forward-looking. We use words such as anticipates, believes, expects, future, intends, and similar expressions to identify forward-looking statements. Forward-looking statements reflect management's current expectations and are inherently uncertain. Actual results could differ materially for a variety of reasons, including, among others, changes in global economic conditions and consumer spending, world events, the rate of growth of the Internet and online commerce, the amount that involve risks and uncertainties, such as our plans, objectives, expectations and intentions, as set forth under “Special Note Regarding Forward-Looking Statements.” Our actual resultsOverstock.com invests in new business opportunities and the timing of eventsthose investments, the mix of products sold to customers, the mix of net sales derived from products as compared with services, the extent to which we owe income taxes, competition, management of growth, potential fluctuations in operating results, international growth and expansion, fluctuations in foreign exchange rates, the outcomes of legal proceedings and claims, fulfillment center optimization, risks of inventory management, seasonality, the degree to which the Company enters into, maintains, and develops commercial agreements, acquisitions, and strategic transactions, payments risks, and risks of fulfillment throughput and productivity. In addition, the current global economic climate amplifies many of these risks. These risks and uncertainties, as well as other risks and uncertainties that could cause our actual results to differ materiallysignificantly from those anticipatedmanagement's expectations, are described in these forward-looking statements as a resultgreater detail in Item 1A of several factors, including those set forth in the following discussion and under “Risk Factors” and elsewhere in this Form 10-K/A.Part I, "Risk Factors."
Restatement
The Company is restating (1) its consolidated financial statements as of December 31, 2007 and 2006 and for the years ended December 31, 2007, 2006, 2005; (2) its selected financial data as of and for the years ended December 31, 2007, 2006, 2005, 2004 and 2003; and (3) its quarterly results of operations for all quarters in the years ended December 31, 2007 and 2006 in this Amendment to the Company’s Annual Report on Form 10-K for the year ended December 31, 2007 to correct errors related to the accounting for customer refunds and credits and the accounting for gift cards issued to customers.
There was no effect of the of the error corrections prior to 2003. The effect of the error adjustments on the Consolidated Results of Operation for the years ended December 31, 2003, 2005, 2006 and 2007 is to increase net loss by $433,000, $294,000, $5.0 million and $3.0 million, respectively and decrease net loss for the year ended December 31, 2004 by $126,000. All amounts in Management’s Discussion and Analysis of Financial Condition and Results of Operations (Restated) have been adjusted, as appropriate, for the effects of the restatement.
A more complete discussion of the restatement can be found in “Selected Financial Data (Restated)” contained in Part I Item 6 and Note 3 to the consolidated financial statements contained in Part IV, Item 15 of this Amendment and Item 4.02(a) of the Company’s Current Report on Form 8-K filed with the Commission on October 24, 2008.
Overview
We are an online “closeout”"closeout" retailer offering discount brand name merchandise, including bed-and-bath goods, home décor, kitchenware, watches, jewelry, electronics and computers, sporting goods, apparel, and designer accessories, among other products. We also sell books, magazines, CDs, DVDs videocassettes and video games (“BMMG”("BMMG"). We also operate as part of our Website an online auctions business—a marketplace for the buying and selling of goods and services—as well as an online sitesites for listing cars and real estate for sale.
Our Company,We are based in Salt Lake City, Utah, wasand were founded in 1997, and we1997. We launched our first Website through which customers could purchase products in March 1999. Our Website offers our customers an opportunity to shop for bargains conveniently, while offering our suppliers an alternative inventory liquidation distribution channel. We continually add new, limited inventory products to our Website in order to create an atmosphere that encourages customers to visit frequently and purchase products before our inventory sells out. We offer approximately 63,000201,000 products under multiple departments under the shopping tab on our Website, and offer almost 724,000approximately 450,000 media products in the Books etc. department on our Website.
Closeout merchandise is typically available in inconsistent quantities and often is only available to consumers after it has been purchased and resold by disparate liquidation wholesalers. We believe that the traditional liquidation market is therefore characterized by fragmented supply and fragmented demand. We utilize the Internet to aggregate both supply and demand and create a more efficient market for liquidation merchandise. Our objective is to provide a one-stop destination for discount shopping for products and services sold through the Internet.
In the fourth quarter 2008, we faced unusual competition from brick and mortar retailers seeking to liquidate inventory directly. The macroeconomic slowdown and discounting by brick and mortar retailers have mixed effects on us. The effects include increased price competition and cautious consumers, but also include opportunities for us to acquire inventory at unusually low prices.
Table of Contents
Our Business
We utilizeuse the Internet to create a more efficient market for liquidation, closeout and other discount merchandise. We provide consumers and businesses with quick and convenient access to high-quality, brand-name merchandise at discount prices. Our shopping business (sales of product offered through the Shopping section of our Website) includes both a “direct”"direct" business and a “fulfillment partner” business. Some products"fulfillment partner" business (see Item 15 of Part IV, "Financial Statements"—Note 23—"Business Segments"). Products from our direct segment and fulfillment partner segments (including products from various industry verticals, such as florist supplies, restaurant supplies, and office supplies) are also available in bulk to both consumers and businesses through the Wholesale departmentproduct category on our Website. During the years ended December 31, 2005, 2006, 2007, and 2007,2008, no single customer accounted for more than 1% of our total revenue.
Direct business
Our direct business includes sales made to individual consumers and businesses, which are fulfilled from our warehouses in Salt Lake City, Utah.Utah (see Item 2 of Part I, "Properties"). During the years ended December 31, 20062007 and 2007,2008, we fulfilled approximately 39%25% and 25%21%, respectively, of all orders through our warehouses. Our warehouses generally ship between 5,000 and 8,000 orders per day and up to approximately 34,00032,000 orders per day during peak periods, using overlapping daily shifts.
Fulfillment partner business
For our fulfillment partner business, we sell merchandise of other retailers, cataloguers or manufacturers (“("fulfillment partners”partners") through our Website. We are considered to be the primary obligor for the majority of these sales transactions and we record revenue from the majority of these sales transactions on a gross basis. Our use of the term “partner”"partner" or “fulfillment partner”"fulfillment partner" does not mean that we have formed any legal partnerships with any of our fulfillment partners. We currently have fulfillment partner relationships with approximately 7301,200 third parties which post approximately 57,000196,000 non-BMMG products, as well as most of the BMMG products, on our Website.
Our revenue from sales on our shopping site from both the direct and fulfillment partner businesses is recorded net of returns, coupons and other discounts. During the third quarter of 2007, we updated our returns policy. For products other than computers, electronics and mattresses the returns policy provides for a full refund of the cost of the merchandise and all shipping charges if the item shipped is returned unopened within 30 days of delivery. If the item is returned after 30 days of delivery, opened or shows signs of wear, the transaction may only be subject to partial refund. For items shipped from our Computers and Electronics department, returns must be initiated within 20 days of the purchase date and must be received in the original condition within 30 days of purchase. Computer and Electronics items returned opened or received at our warehouse after 30 days may only qualify for up to a 70 percent refund. Damaged or defective mattresses qualify for a full refund only if the items are refused at the time of delivery.
Unless otherwise indicated or required by the context, the discussion herein of our financial statements, accounting policies and related matters, pertains to our shopping site and not necessarily to our auctions or cars tabs sites.
Both direct and fulfillment partner revenues are seasonal, with revenues historically being the highest in the fourth quarter, reflecting higher consumer holiday spending. We anticipate this will continue in the foreseeable future.
Unless otherwise indicated or required by the context, the discussion herein of our financial statements, accounting policies and related matters, pertains to the Shopping section of our Website and not necessarily to the Auctions, Cars, Real Estate or Community sections of our Website.
Auctions business
We operate an online auction service as part of our Website. Our auction tab allows sellers to list items for sale, buyers to bid on items of interest, and users to
30
Table of Contents
browse through listed items online. We record only our listing fees and commissions for items sold as revenue. From time to time, we also sell items returned from our shopping site on our auction site, and for these sales, we record the revenue on a gross basis. Revenue from our auction business is included in the fulfillment partner segment, as it is not significant enough to segregate as its own segment.
Car listing business
We operate an online site for listing cars for sale as a part of our Website. The car listing service allows sellers to list vehicles for sale and allows buyers to review vehicle descriptions, post offers to
Table of Contents
purchase, and provides the means for purchasers to contact sellers for further information and negotiations on the purchase of an advertised vehicle. Revenue from our car listing business is included in the fulfillment partner segment, as it is not significant enough to separate outsegregate as its own segment.
Cost of goods soldReal Estate listing business
Cost of goods sold consists of the cost of the product,We operate an online site for listing real estate for sale as well as inbound and outbound freight, warehousing and fulfillment costs (including payroll and related expenses and stock-based compensation), credit card fees and customer service costs.
Operating expenses
Sales and marketing expenses consist primarily of advertising, public relations and promotional expenditures, as well as payroll and related expenses, including stock-based compensation, for personnel engaged in marketing and selling activities.
Advertising expense is the largest componenta part of our salesWebsite. The real estate listing service allows customers to search active listings across the country. Listing categories include foreclosures, live and marketing expenseson-line auctions, for sale by owner listings, broker/agent listings and numerous aggregated classified ad listings. Advertising revenue from the real estate business is primarily attributableincluded in the fulfillment partner segment, as it is not significant enough to expenditures related to online marketing activities and offline national radio and television advertising. Our advertising expenses totaled approximately $75.3 million, $68.1 million and $51.0 million for the years ended December 31, 2005, 2006 and 2007, respectively, representing 98%, 96% and 92% of sales and marketing expenses for those respective periods.segregate as its own segment.
Technology expenses consist of wages and benefits, including stock-based compensation, for technology personnel, rent, utilities, connectivity charges, as well as support and maintenance and depreciation and amortization related to software and computer equipment.
General and administrative expenses consist of wages and benefits, including stock-based compensation, for executive, legal, accounting, merchandising and administrative personnel, rent and utilities, travel and entertainment, depreciation and amortization of intangible assets and other general corporate expenses.
International business
We have recorded no provision or benefit for federal and state income taxes as we have incurred net operating losses since inception. We have provided a full valuation allowance on the net deferred tax assets, consisting primarily of net operating loss carry-forwards, because of uncertainty regarding their realizability.
Executive Commentary
This executive commentary is intended to provide investors with a view of our businessbegan selling products through the eyes of our management. As an executive commentary, it necessarily focuses on selected aspects of our business. This executive commentary is intended as a supplement to, but not a substitute for, the more detailed discussion of our business included elsewhere herein. Investors are cautioned to read our entire “Management’s Discussion and Analysis of Financial Condition and Results of Operations (Restated)”, as well as our interim and audited financial statements, and the discussion of our business and risk factors and other information included elsewhere in this report. This executive commentary includes forward-looking statements, and investors are cautioned to read the “Special Note Regarding Forward-Looking Statements” included elsewhere in this report.
Commentary—Revenue. Total revenue decreased 2% for the fiscal year 2007 to $765.9 million and increased 4% for Q4 2007 to $294.5 million. The fulfillment partner business, which accounted for 74% of total revenue, during 2007 and 77% during Q4, grew 19% for the full year, and 21% in Q4 2007, an improvement from the -2% and 5% growth during the same periods in 2006, respectively. Our direct business, on the other hand, shrunk 35% for the year and 29% in Q4, compared to shrinking 7% and 24% during the same periods in 2006.
Total revenues decreased at the same rate we experienced in 2006;-2%. However, we did show progress toward returning to positive revenue growth throughout the year (Q1: -10%, Q2: -7%, Q3:1%, and Q4: 4%). This was driven primarily through our efforts to become more efficient in our marketing activities, and by nearly doubling our product selection through adding new fulfillment partners, as well as increasing the number of items offered by existing fulfillment partners. This initiative increased the number of products listed on our website to 63,000 non-BMMG products at December 31, 2007 compared to 36,000 atcustomers outside the end of 2006.
We also announced during the fourth quarter that we are planning to begin selling productsUnited States in international markets in 2008, first inlate August 2008. The initial launch included Canada and then potentially into other markets. Our initial approach will be to leverage existing partners in each country or region rather than opening our own distribution facilities33 European countries, including the U.K. and Germany. We do not have operations outside of the United States.
Commentary—Gross ProfitStates, and Gross Margin. Gross profit dollars increased 39%are utilizing a U.S. based third party to $124.6 million in 2007. Gross margin expanded to 16.3%provide logistics and fulfillment for all international orders. Revenue generated from 11.5%, a 480 basis point improvement, and a historical best for the company. Gross profit improved 95% in the fourth quarter, while total revenue increased by 4%. Gross margins for each of the quarters and fiscal years during 2006 and 2007 were:
Q1 2006
(Restated) | | Q2 2006
(Restated) | | Q3 2006
(Restated) | | Q4 2006
(Restated) | | FY 2006
(Restated) | | Q1 2007
(Restated) | | Q2 2007
(Restated) | | Q3 2007
(Restated) | | Q4 2007
(Restated) | | FY 2007
(Restated) | |
12.8 | % | 13.5 | % | 13.6 | % | 8.4 | % | 11.5 | % | 15.2 | % | 17.6 | % | 17.1 | % | 15.7 | % | 16.3 | % |
The improvement in gross margin is primarily due to significant expansion in our direct margins, which were up 920 basis points to 14.8% in fiscal 2007 from 5.6% in 2006. We significantly reduced our inventory in 2006, and in 2007, we maintained lower levels of inventory by refining the selection of products that we purchase directly to those that turn faster and have higher profitability. We believe that we can continue to do so, while filling in product selection using fulfillment partners, rather than acquiring the inventory directly. As a result of these efforts, we have seen a substantial improvement in direct and overall gross margin in 2007. With reduced inventory levels, we have also successfully reduced our warehouse space and the related costs, which we expect will assist in our efforts to further improve our direct gross margin.
While direct gross margin showed sequential improvement in the fourth quarter, overall gross margins decreased from Q3 2007 levels. This was primarily due to heavy shipping promotions and discounts offered during the holiday shopping season. In addition, demand for lower margin products like BMMG was up 200 basis points sequentially to 8.6% of gross sales and computers and consumer electronics (C&E) increased during the fourth quarter relative to other categories. Although C&E products typically have lower gross margin, we have aggressively expanded our product offering in this area throughout the year to better meet consumer demand.
Commentary—Marketing. While revenues declined by 2% this year, we were able to substantially reduce the dollars spent on marketing (down 22% to $55.5 million during fiscal 2007 from $70.9 million in 2006), and those dollars were spent more efficiently (7% of total revenue during fiscal 2007 versus 9% in 2006). However, with fewer dollars spent on advertising, the amount of traffic that came to our website was lower compared to 2006, and we believe our revenue growth was impacted throughout the year as a result. During the fourth quarter we decided to invest more heavily in television, radio and print advertising to both strengthen our
31
Table of Contents
brand and enhance revenue growth. Marketing expenses in the period were $27.4 million, or 9% of total revenue compared to $29.0 million, or 10% in Q4 2006.
Commentary—Contribution and Contribution Margin. Contribution (gross profit dollars less sales and marketing expense) increased 265%, from $18.9 million in 2006 to $69.1 million during fiscal 2007. For the three months ended December 31, 2007, contribution was $19.0 million, a $24.3 million improvement from $(5.3) million during Q4 2006. This was due to the improvements we made in gross margin combined with a slight reduction in total sales and marketing dollars spent. The following table represents our calculation of contribution (in thousands):
| | Three months ended
December 31, | | Twelve months ended
December 31, | |
| | 2006
(Restated) | | 2007
(Restated) | | 2006
(Restated) | | 2007
(Restated) | |
Total revenue | | $ | 282,407 | | $ | 294,516 | | $ | 780,137 | | $ | 765,902 | |
Cost of goods sold | | 258,636 | | 248,134 | | 690,333 | | 641,352 | |
| | | | | | | | | |
Gross profit | | 23,771 | | 46,382 | | 89,804 | | 124,550 | |
Less: Sales and marketing expense | | 29,045 | | 27,377 | | 70,897 | | 55,458 | |
| | | | | | | | | |
Contribution | | $ | (5,274 | ) | $ | 19,005 | | $ | 18,907 | | $ | 69,092 | |
| | | | | | | | | |
Contribution margin | | (1.9 | )% | 6.5 | % | 2.4 | % | 9.0 | % |
Commentary—Technology and G&A costs. We terminated a long-term computer co-location facility lease in December 2006 and we have reduced corporate headcount during 2007. We have also reduced facilities costs and other expenses by reducing corporate office space. As a result, our combined technology and G&A costs were down 9% for fiscal 2007 and down 23% for Q4 2007 versus 2006.
Overall, our operating expenses, including sales and marketing and restructuring were down 10% for fiscal 2007 and down 22% for Q4 2007 compared to the previous year.
Commentary—Operating loss. Our operating loss for fiscal 2007 was $44.6 million, down 55% from $98.8 million in 2006. For the three months ended December 31, 2007, our operating loss was $6.8 million, an 85% improvement from $44.5 million during the same period last year.
The 2007 operating loss includes $12.3 million of restructuring costs ($6.1 million in Q1 and $6.2 million in Q2). During 2006, we incurred restructuring costs of $5.7 million during the fourth quarter.
Commentary—Adjusted EBITDA (non-GAAP). Adjusted EBITDA for fiscal 2007 was $(10.6) million, $50.8 million better than the $(61.4) million in 2006. For the fourth quarter of 2007, adjusted EBITDA was $(415,000), a $31.3 million improvement from $(31.7) million in Q4 2006. We believe that because our current capital expenditures are significantly lower than our depreciation levels, discussing adjusted EBITDA at this stage of ourinternational business is useful to us and investors. During 2005 and 2006, we made significant investmentsincluded in either direct or fulfillment partner revenue, depending on whether the product is shipped from our systems and overall infrastructure. In 2007, capital expenditures were $2.6 million while depreciation expense was $29.5 million, and therefore we believe that adjusted EBITDA waswarehouses or from a reasonable measure of actual cash used or cash generated by the continuing operations of the business in 2007.fulfillment partner.
Regulation G, Conditions for Use of Non-GAAP Financial Measures, and other SEC regulations regulate the disclosure of certain non-GAAP financial information. Our measure of adjusted EBITDA (non-GAAP) which we reconcile to “Net loss” in our statement of operations, is earnings before interest, taxes, depreciation, amortization, stock-based compensation and discontinued operations. Adjusted EBITDA is used in addition to and in conjunction with results presented in accordance with GAAP and should not be relied upon to the exclusion of GAAP financial measures. Adjusted EBITDA reflects an additional way of viewing our results that, when viewed with our GAAP results, provides a more complete understanding of factors and trends affecting our results. You should review our financial statements and publicly-filed reports in their entirety and not rely on any single financial measure. Our discussion above and below (i) explains why management believes that presentation of adjusted EBITDA provides useful information to investors regarding our financial condition and results of continuing operations, (ii) to the extent material, discloses the additional purposes, if any, for which management uses this non-GAAP measure, and (iii) provides a reconciliation of this measure to our net loss. For further details on adjusted EBITDA, see the reconciliation of this non-GAAP measure to our GAAP net loss below (in thousands):
| | Three months ended
December 31, | | Twelve months ended
December 31, | |
| | 2006
(Restated) | | 2007
(Restated) | | 2006
(Restated) | | 2007
(Restated) | |
Net loss | | $ | (49,216 | ) | $ | (6,470 | ) | $ | (106,762 | ) | $ | (48,036 | ) |
Add back amounts for computation of adjusted EBITDA: | | | | | | | | | |
Depreciation and amortization | | 11,525 | | 6,670 | | 32,327 | | 29,495 | |
Interest (income) expense, net | | 550 | | (326 | ) | 1,199 | | (600 | ) |
Stock-based compensation expense | | 1,032 | | 1,136 | | 4,120 | | 4,522 | |
Stock-based compensation to consultants for service | | (8 | ) | (91 | ) | 23 | | 189 | |
Stock-based compensation for performance share plan | | — | | (900 | ) | — | | (550 | ) |
Treasury stock issued to employees as compensation | | 108 | | (434 | ) | 787 | | 494 | |
Loss from discontinued operations | | 4,267 | | — | | 6,882 | | 3,924 | |
| | | | | | | | | |
Adjusted EBITDA | | $ | (31,742 | ) | $ | (415 | ) | $ | (61,424 | ) | $ | (10,562 | ) |
Commentary—Balance Sheet Items. We ended the year with $147.4 million in cash, cash equivalents and marketable securities, compared to $127.0 million at the end of 2006. Working capital increased to $62.6 million from $59.5 million.
We ended the year with $25.6 million of inventory (including inventory in-transit of $3.1 million), an increase from the $23.9 million of inventory (including inventory in-transit of $3.6 million) we had at the end of 2006, but we have been able to turn our inventory more efficiently (inventory turns on the direct business
32
Table of Contents
increased from 4.3 times to 6.1 times) due to better inventory management and maintaining a more attractive product selection.
Commentary—Cash Flows. For the year ended December 31, 2007, we generated $10.0 million in cash flows from operations compared to cash outflows of $26.3 million during 2006. “Free Cash Flow” (a non-GAAP measure) for the three months ended December 31, 2006 and 2007 totaled $48.2 million and $55.3 million, respectively. For the years ended December 31, 2006 and 2007, free cash flow was $(49.7) million and $7.3 million.
Regulation G,Conditions for Use of Non-GAAP Financial Measures, and other SEC regulations regulate the disclosure of certain non-GAAP financial information. Free cash flow reflects an additional way of viewing our cash flows and liquidity that, when viewed with our GAAP results, provides a more complete understanding of factors and trends affecting our cash flows. Free cash flow, which we reconcile to “Net cash provided by (used in) operating activities”, is cash flow from operations reduced by “Expenditures for property and equipment”. Although we believe that cash flow from operating activities is an important measure, we believe free cash flow is a useful measure to evaluate our business since purchases of fixed assets are a necessary component of ongoing operations. Therefore, we believe it is important to view free cash flow as a complement to our entire consolidated statements of cash flows.
| | Three months ended
December 31, | | Twelve months ended
December 31, | |
| | 2006 | | 2007 | | 2006 | | 2007 | |
Net cash provided by (used in) operating activities | | $ | 51,949 | | $ | 55,734 | | $ | (26,293 | ) | $ | 9,977 | |
Expenditures for property and equipment | | (3,766 | ) | (411 | ) | (23,441 | ) | (2,643 | ) |
| | | | | | | | | |
Free cash flow | | $ | 48,183 | | $ | 55,323 | | $ | (49,734 | ) | $ | 7,334 | |
The balance of our Management’s Discussion and Analysis of Financial Condition and Results of Operations (Restated) provides further information about the matters discussed above and other important matters affecting our business.
Critical Accounting Policies and Estimates
Our consolidatedThe preparation of financial statements have been prepared in accordanceconformity with generally accepted accounting principles generally accepted inof the United States of America. The preparation of these financial statements("GAAP") requires us to make estimates and judgmentsassumptions that affect the reported amounts of assets and liabilities, revenues and expenses. We base our estimates on historical experienceexpenses, and on various other assumptions that we believe to be reasonable under the circumstances, the resultsrelated disclosures of which form the basis for making judgments about the carrying values ofcontingent assets and liabilities in the consolidated financial statements and accompanying notes. The Securities and Exchange Commission ("SEC") has defined a company's critical accounting policies as the ones that are not readily apparent frommost important to the portrayal of the company's financial condition and results of operations, and which require the company to make its most difficult and subjective judgments, often as a result of the need to make estimates of matters that are inherently uncertain. Based on this definition, we have identified the critical accounting policies and judgments addressed below. We also have other sources.key accounting policies, which involve the use of estimates, judgments, and assumptions that are significant to understanding our results. For additional information, see Item 15 of Part IV, "Financial Statements"—Note 2—"Summary of Significant Accounting Policies." Although we believe that our estimates, assumptions, and judgments are reasonable, they are based upon information presently available. Actual results may differ significantly from these estimates under different assumptions, judgments, or conditions. Our critical accounting policies are as follows:
- •
·revenue recognition;·
- •
- estimating valuation allowances and accrued liabilities (specifically, the reserve for returns, the allowance for doubtful accounts and the reserve for obsolete and damaged inventory);
·
- •
- internal use
software;software and website development (acquired and developed internally);
·
- •
- accounting for income taxes;
·
- •
- valuation of long-lived and intangible assets and goodwill; and
·
stock based - •
- stock-based compensation and performance share plan.
Revenue recognition
Revenue recognition. We derive our revenue primarily from two sources: direct revenue and fulfillment partner revenue, including listing fees and commissions collected from products being listed and sold through the
Table of Contents
Auctions tab of our Website as well as advertisement revenue derived from our cars listing business. The Company has organized its operations into two principal segments based on the primary source of revenue: Direct revenue and Fulfillment partner revenue (see Item 15 of Part IV, “Financial Statements (Restated) “—"Financial Statements"—Note 24—“23—"Business Segments”Segments").
Revenue is recognized when the following revenue recognition criteria are met: (1) persuasive evidence of an arrangement exists; (2) delivery has occurred or the service has been provided; (3) the selling price or fee revenue earned is fixed or determinable; and (4) collection of the resulting receivable is reasonably assured.
Revenue related to merchandise sales is recognized upon delivery to our customers. As we ship high volumes of packages through multiple carriers, it is not practical for us to track the actual delivery date of each shipment. Therefore, we use estimates to determine which shipments are delivered and therefore recognized as revenue at the end of the period. Our delivery date estimates are based on average shipping transit times, which are calculated using the following factors: (i) the shipping carrier (as carriers differ in transit times); (ii) the fulfillment source (either our warehouses or those of our fulfillment partners); (iii) the delivery destination; and (iv) actual transit time experience, which shows that delivery date is typically one to eight business days from the date of shipment.
We review and update our estimates on a quarterly basis based on our actual transit time experience. However, actual shipping times may differ from our estimates. The following table shows the effect that hypothetical changes in the estimate of average shipping transit times would have had on the reported amount of revenue and net loss for the year ended December 31, 2007 ($ in2008 (in thousands):
33
| | | | | | | |
| | Year ended December 31, 2008 | |
|---|
Change in the
Estimate of Average
Transit Times (Days) | | Effect on
Revenue | | Effect on
Net Income | |
|---|
-2 | | | $ 7,633 | | | $ 1,264 | |
-1 | | | $ 3,949 | | | $ 652 | |
As reported | | | As reported | | | As reported | |
1 | | | $ (959 | ) | | $ (142 | ) |
2 | | | $(1,634 | ) | | $ (259 | ) |
Table of Contents
Change in the | | Year ended December 31, 2007 | |
Estimate of Average | | (Restated) | |
Transit Times (Days) | | Effect on Revenue | | Effect on Net Income | |
-2 | | $ | 5,892 | | $ | 913 | |
-1 | | $ | 2,710 | | $ | 420 | |
As reported | | As reported | | As reported | |
1 | | $ | (1,879 | ) | $ | (291 | ) |
2 | | $ | (4,019 | ) | $ | (623 | ) |
We evaluate the criteria outlined in EITF Issue No. 99-19,Reporting Revenue Gross as a Principal Versus Net as an Agent, in determining whether it is appropriate to record the gross amount of product sales and related costs or the net amount earned as commissions. When we are the primary obligor in a transaction, are subject to inventory risk, have latitude in establishing prices and selecting suppliers, or have several but not all of these indicators, revenue is recorded gross. If we are not the primary obligor in the transaction and amounts earned are determined using a fixed percentage, revenue is recorded on a net basis. Currently, the majority of both direct revenue and fulfillment partner revenue is recorded on a gross basis, as we are the primary obligor.
We periodically provide incentive offers to our customers to encourage purchases. Such offers include discount offers, such as percentage discounts off current purchases and other similar offers. Discount offers, which, when acceptedused by our customers, are treated as a reduction to the purchase price of the related transaction.
Direct revenue
Direct revenue consists of sales of merchandise sold through our Website to both individual consumers and businesses that are fulfilled directly from our leased warehouses.warehouses (see Item 2 of Part I, "Properties"). Direct sales occur primarily through our Website, but may also occur through other offline channels.
Table of Contents
Fulfillment partner revenue
Fulfillment partner revenue consists of merchandise sold through our Website and shipped by third parties directly to consumers and other businesses from warehouses maintained by our fulfillment partners.
During September 2004, we added an online auction service to our Website. The Auctions business allows sellers to list items for sale, buyers to bid on items of interest, and users to browse through listed items online. With limited exceptions, we are not considered the seller of the items sold on the auction site and hashave no control over the pricing of those items. Therefore, for these sales, only the listing fees for items listed and commissions for items sold are recorded as revenue during the period items are listed or items are sold. Our auction business revenues were insignificant in 2005, 2006 and 2007. Revenue from the auctions business has been included in the fulfillment partner segment, as it is not large enough to separate out as its own segment at this early stage of the business.
During December 2006, we addedWe operate an online site for listing cars for sale as a part of our Website. The cars listing service allows dealers to list vehicles for sale and allows buyers to review vehicle descriptions, post offers to purchase, and provides the means for purchasers to contact sellers for further information and negotiations on the purchase of an advertised vehicle. Revenue from the cars listing business is not large enough to separate as a segment, and therefore has been included inwithin the fulfillment partner segment,segment.
We operate an online site for listing real estate for sale as ita part of our Website. The real estate listing service allows customers to search active listings across the country. Listing categories include foreclosures, live and on-line auctions, for sale by owner listings, broker/agent listings and numerous aggregated classified ad listings. Revenue from the real estate listing business is not significantlarge enough to separate out as its owna segment, and therefore has been included within the fulfillment partner segment.
International business
We began selling products through our website to customers outside the United States in August 2008. The initial launch included Canada and 33 European countries, including the U.K. and Germany. We do not have operations outside the United States, and are utilizing a U.S. based third party to provide logistics and fulfillment for all international orders. Revenue generated from our international business is included in either direct or fulfillment partner revenue, depending on whether the product is shipped from our warehouses or from a fulfillment partner.
Cost of goods sold
Cost of goods sold consists of the cost of the product, as well as inbound and outbound freight, warehousing and fulfillment costs (including payroll and related expenses and stock-based compensation), credit card fees and customer service costs.
Operating expenses
Sales and marketing expenses consist primarily of advertising, public relations and promotional expenditures, as well as payroll and related expenses, including stock-based compensation, for personnel engaged in marketing and selling activities.
Advertising expense is the largest component of our sales and marketing expenses and is primarily attributable to expenditures related to online marketing activities and offline radio and television advertising. Our advertising expenses totaled approximately $68.1 million, $51.0 million and $52.8 million for the years ended December 31, 2006, 2007 and 2008, respectively, representing 96%, 92% and 92% of sales and marketing expenses for those respective periods.
Table of Contents
Technology expenses consist of wages and benefits, including stock-based compensation, for technology personnel, rent, utilities, connectivity charges, as well as support and maintenance and depreciation and amortization related to software and computer equipment.
General and administrative expenses consist of wages and benefits, including stock-based compensation, for executive, legal, accounting, merchandising and administrative personnel, rent and utilities, travel and entertainment, depreciation and amortization of intangible assets and other general corporate expenses.
Business Restructuring
During 2006, we began a facilities consolidation and restructuring program which continued through 2007 designed to reduce our overall expense structure in an effort to improve future operating performance. If we determine to move our corporate headquarters we expect to incur future restructuring expenses. (see Item 15 of Part IV, "Financial Statements"—Note 3—"Restructuring Expense").
Deferred revenue.revenue We
Payment is generally require paymentrequired by credit card at the point of sale. Amounts owed or received prior to delivery of products or services provided are recorded as deferred revenue. In addition, amountsAmounts received in advance for Club O membership fees are recorded as deferred revenue and recognized ratably over the membership period. WeIn addition, we sell gift cards and record related deferred revenue at the time of the sale. Revenue from a gift card is recognized when a customer redeems it. If a gift card is not redeemed, we recognize revenue when the likelihood of its redemption becomes remote.
Reserve for returns.returns
Total revenue is recorded net of estimated returns. For products other than computers, electronics and mattresses the returns policy provides for a full refund of the cost of the merchandise and all shipping charges if the item shipped is returned unopened within 30 days of delivery. If the item is returned after 30 days of delivery, opened or shows signs of wear, the transaction may only be eligible for a partial refund. For items shipped from our Computers and Electronics department, returns must be initiated within 20 days of the purchase date and must be received in the original condition within 30 days of purchase. Computer and Electronics items returned opened or received at our warehouse after 30 days may only qualify for up to a 70 percent refund. Damaged or defective mattresses qualify for a full refund only if the items are refused at the time of delivery.
We maintain a reserve for returns based on estimates of future product returns related to current period revenues and are estimated using historical returns experience. Management analyzes historical returns, current economic trends and changes in customer demand and acceptance of our products when evaluating the adequacy of the sales returns reserve and other allowances in any accounting period. The reserve for returns was $4.6$6.9 million and $6.9$5.1 million at December 31, 20062007 and 2007,2008, respectively.
Allowance for doubtful accounts.accounts
From time to time, we grant credit to certain of our business customers on normal credit terms (typically 30 days). We perform ongoing credit evaluations of our customers’customers' financial condition and maintain an allowance for doubtful accounts receivable based upon our historical collection experience and expected collectibilitycollectability of all accounts receivable. We maintained an allowance for doubtful accounts receivable of $2.1$2.5 million and $2.5$1.6 million as of December 31, 20062007 and 2007,2008, respectively.
Reserve for obsolete and damaged inventory.inventory
We write down our inventory for estimated obsolescence or damage equal to the difference between the cost of inventory and the estimated market value based upon assumptions about future demand and market conditions. If actual market conditions are less favorable than those projected by management, additional inventory write-downs may be required. Once established, the original cost of the inventory less the related inventory reserve represents the new cost basis of such products. Reversal of these reserves is recognized only when the related inventory has been sold or scrapped. At December 31, 2006, our inventory balance was $23.9 million (including $3.6 million of inventory in-transit related to sales shipped but not yet delivered), net of allowance for obsolescence or damaged inventory of $6.6 million. At December 31, 2007, our inventory balance was $25.6 million (including $3.1 million of inventory in-transit related to sales shipped but not yet delivered), net of allowance for obsolescence or damaged inventory of $1.8 million. At December 31, 2008, our inventory balance was $17.7 million (including
Table of Contents
$2.8 million of inventory in-transit related to sales shipped but not yet delivered), net of allowance for obsolescence or damaged inventory of $2.1 million.
Internal-Use Software and Website Development.Development
Included in fixed assets is the capitalized cost of internal-use software and website development, including software used to upgrade and enhance our Website and processes supporting our business. As required by Statement of Position 98-1,Accounting for the Costs of Computer Software Developed or Obtained for Internal Use, we capitalize costs incurred during the application development stage of internal-use software and amortize these costs over the estimated useful life of two to three years. Costs incurred related to design or maintenance of internal-use software are expensed as incurred.
During the years ended December 31, 20062007 and 2007,2008, we capitalized $21.7$2.0 million and $2.0$9.0 million, respectively, of costs associated with internal-use software and website development.development, both internally developed and acquired externally. Amortization of previously capitalized amounts totaled $14.4$13.5 million and $13.5$11.6 million for those respective periods.
34
Table of Contents
Accounting for income taxes.taxes
Significant management judgment is required in determining our provision for income taxes, our deferred tax assets and liabilities and any valuation allowance recorded against our net deferred tax assets. As of December 31, 20062007 and 2007,2008, we have recorded a full valuation allowance of $76.5$86.0 million and $86.0$86.9 million, respectively, against our net deferred tax asset balance due to uncertainties related to our deferred tax assets as a result of our history of operating losses. The valuation allowance is based on our estimates of taxable income by jurisdiction in which we operate and the period over which our deferred tax assets will be recoverable. In the event that actual results differ from these estimates or we adjust these estimates in future periods, we may need to change the valuation allowance, which could materially impact our financial position and results of operations.
In July 2006, the Financial Accounting Standards Board (“FASB”("FASB") issued FASB Interpretation No. 48,Accounting for Uncertainty in Income Taxes—an Interpretation of FASB Statement No. 109 (“ ("FIN 48”48"). FIN 48 prescribes a comprehensive model for how a company should recognize, measure, present, and disclose in its financial statements uncertain tax positions that it has taken or expects to take on a tax return.
We adopted the provisions of FIN 48 on January 1, 2007. As a result of a full valuation allowance we do not have any unrecognized tax benefits and there iswas no effect on our financial condition or results of operations as a result of implementing FIN 48. We are subject to audit by the IRS and various states for periods since inception. We do not believe there will be any material changes in our unrecognized tax positions for periods since inception. Our policy is that we recognize interest and penalties accrued on any unrecognized tax positions as a component of income tax expense. As of the date of adoption of FIN 48, we did not have any accrued interest or penalties associated with any unrecognized tax positions, nor was any interest expense recognized during the year ended December 31, 2007.2008.
We have recorded no provision or benefit for federal and state income taxes as we have incurred net operating losses since inception. We have provided a full valuation allowance on the net deferred tax assets, consisting primarily of net operating loss carry-forwards, because of uncertainty regarding their realizability.
Valuation of long-lived and intangible assets and goodwill.goodwill
Under Statement of Financial Accounting Standard (“SFAS”("SFAS") No. 142,Goodwill and Other Intangible Assets, (“("SFAS 142”142"), goodwill is not amortized, but must be tested for impairment at least annually. Other long-lived assets must also be evaluated for impairment when management believes that an asset has experienced a decline in value that is other than temporary. Future adverse changes in
Table of Contents
market conditions or poor operating results of underlying investments could result in losses or an inability to recover the carrying value of the asset that may not be reflected in an asset’sasset's current carrying value, thereby possibly requiring an impairment charge in the future. Goodwill totaled $2.8 million as of December 31, 20062007 and 2007.
2008.
In conjunction with the decision to sell OTravel, our travel subsidiary, we performed an evaluation of its goodwill, pursuant to SFAS 144,Accounting for the Impairment Long-Lived Assets, (“("SFAS 144”144") and SFAS 142 and determined that goodwill was subject to an impairment loss of approximately $4.5 million and $3.8 million during the years ended December 31, 2006 and 2007 (see Item 15 of Part IV, “Financial Statements (Restated) —Note 5—“"Financial Statements"—Note 4—"Acquisition and Subsequent Discontinued Operations”Operations"). These have been recorded as a component of the loss from discontinued operations. There were no impairments to goodwill recorded during the year ended December 31, 2008.
Stock-based compensation
Stock-based compensation. As of January 1, 2006, we adopted SFAS 123(R)Share Based Payment (“ ("SFAS 123(R)”"), which requires us to measure compensation cost for all outstanding unvested share-based awards at fair value and recognize compensation over the service period for awards expected to vest. The estimation of stock awards that will ultimately vest requires judgment, and to the extent actual results differ from our estimates, such amounts will be recorded as an adjustment in the period estimates are revised. We consider many factors when estimating expected forfeitures, including types of awards, employee class, and historical experience. Actual results may differ substantially from these estimates. We have utilized ause the Black-Scholes-Merton (“BSM”("BSM") valuation model to estimate the value of stock options granted to employees. Several of the primary estimates used in measuring stock-based compensation are as follows:
Expected Volatility: The fair value of stock options were valued using a volatility factor based on our historical stock prices.
Expected Term: For 2005 and 2006 option grants, the expected term represents the period that our stock options are expected to be outstanding and was determined based on historical experience of similar awards, giving consideration to the contractual terms and vesting provisions of the stock-based awards. For 2007 and 2008 option grants, we elected to use the “simplified method”"simplified method" as discussed in Staff Accounting Bulletin (“SAB”("SAB") No. 107,Share Based Payment (“ ("SAB 107”No. 107") to develop an estimate of expected term. In December 2007, the SEC issued SAB No. 110,Certain Assumptions Used in Valuation Methods—Expected Term ("SAB No. 110"). According to SAB No. 110, under certain circumstances the SEC staff will continue to accept the use of the simplified method as discussed in SAB No. 107, in developing an estimate of expected term of "plain vanilla" share options in accordance with SFAS No. 123(R), beyond December 31, 2007. We adopted SAB No. 110 effective January 1, 2008 and will continue to use the simplified method in developing the expected term used for our valuation of stock-based compensation.
Expected Dividend: We have not paid any dividends and do not anticipate paying dividends in the foreseeable future.
Risk-Free Interest Rate: We base the risk-free interest rate used on the implied yield currently available on U.S. Treasury zero-coupon issues with remaining term equivalent to the expected term of the options.
Estimated Pre-vesting Forfeitures: When estimating forfeitures, we consider voluntary and involuntary termination behavior.
Table of Contents
Performance Share Plan.Plan
In January 2006, the Board of Directors and Compensation Committee adopted the Overstock.com Performance Share Plan (the "Plan") and approved grants to executive officers and certain employees.employees of the Company. The Performance Share Plan providesprovided for a three-year period for the measurement of ourthe Company's attainment of certainthe performance goals.
goal described in the form of grant.
The performance goal iswas measured by growth in economic value, as defined in the plan.Plan. The amount of payments due to participants under the plan will bePlan was a function of the then current market price of a share of ourthe Company's common stock, multiplied by a percentage dependent on the extent to which the performance goal has beenwas attained, which will bewas between 0% and 200%. If the growth in economic value iswas 10% compounded annually or less, the percentage willwould be 0%. If the growth in economic value iswas 25% compounded annually, the percentage willwould be 100%. If the growth in economic value iswas 40% compounded annually or more, the percentage willwould be 200%. If the percentage growth iswas between these percentages, the payment percentage willwould be determined on the basis of straight line interpolation. Amounts payable under the planPlan were subject to Board discretion. Amounts payable under the Plan were originally payable in cash. During interim and annual periods prior to the third quarter of 2007, we recorded compensation expense based upon the period-end stock price and estimates regarding the ultimate growth in economic value that iswas expected to occur. These estimates included assumed future growth rates in revenues, gross marginsprofit percentages and other factors. If we were to use different assumptions, the estimated compensation charges could be significantly different.
An amendment to the Performance Share Plan to allow usthe Company to make payments in the form of common stock was approved by the shareholders on May 15, 2007. In the third quarter of 2007, we determined the fair value of the awards on the amendment date and determined on August 7, 2007 to make the payments in the form of common stock, rather than cash. Therefore, we reclassified awards under the performance share planPlan from their current status as liability awards to equity awards in accordance with SFAS No. 123(R).
As of December 31, 2006, we had accrued $900,000 in total compensation expense under the plan. During the first six months of 2007, we accrued an additional $650,000 related to performance shares granted prior to the determination to make the payments in the form of common stock. We reclassified the total liability of approximately $1.6 million related to performance share awards granted prior to the determination to additional-paid-in-capital in the third quarter of 2007. Over the remaining six months of 2007, we reduced the estimated compensation expense under the plan by approximately $550,000, based on changes in ourits estimate of growth in economic value over the remaining twelve months of the plan. As of December 31, 2007, we have recorded $1.0 million ofthe cumulative expense related to the Performance Share Plan.performance share awards was $1.0 million.
During the year ended December 31, 2008, we reversed the cumulative $1.0 million in total compensation expense under the Plan as the Board determined no payments would be made under the plan. The plan expired on December 31, 2008.
Restricted Stock Units.Units In
During the first quarter ofyear ended December 31, 2008, the Compensation Committee of the Board of Directors approved grants of approximately 460,000491,000 restricted stock units to our officers and employees whichwere granted. The restricted stock units vest over three years at 25% at the end of the first year, an additional 25% at the end of the second year and 50% at the end of the third year.year and are subject to the employee's continuing service to the Company. At December 31, 2008, there were 449,000 restricted stock units that remained outstanding.
Recent Accounting Pronouncements.
In September 2006,The cost of restricted stock units is determined using the FASB issued SFAS No. 157, Fair Value Measurements (“SFAS 157”). SFAS 157 defines fair value establishes a framework for measuringof the Company's shares of common stock on the date of the grant and compensation expense is recognized in accordance with the vesting schedule. The weighted average grant date fair value and expands disclosures about fair value measurements. The FASB recently decided to postponeof restricted stock units granted during the effective date of SFAS 157 for other non-financial assets and liabilities for one year. SFAS 157 is effective for us as of January 1,year ended December 31, 2008 for financial items and January 1, 2009 for other non-financial items. We
35was $12.64.
Table of Contents
anticipate that the adoption of SFAS 157 will not have a material impact on our consolidated financial statements.
Recent Accounting Pronouncements.
In February 2007, the FASB issued SFAS No. 159,The Fair Value Option for Financial Assets and Financial Liabilities—including an amendment of FASB StatementLiabilities ("SFAS No. 115 (“SFAS 159”159"). Under SFAS No. 159, permits entities to choosecompanies may elect to measure manycertain financial instruments and certain other items at fair value. UnrealizedThe standard requires that unrealized gains and losses on items for which the fair value option has been elected will be recognizedreported in earnings at each subsequent reporting date.earnings. SFAS No. 159 is effective for our fiscal yearyears beginning after November 15, 2007. We adopted SFAS No. 159 on January 1, 2008; however, we did not elect to apply the fair value option to any financial instruments or other items upon adoption of SFAS No. 159 during the year ended December 31, 2008. We anticipate thatTherefore, the adoption of SFAS No. 159 willdid not have a material impact on our consolidated financial statements.position, results of operations or cash flows.
In December 2007, the FASB issued SFAS No. 141 (R),Business Combinations (“ ("SFAS 141(R)”No. 141 (R)"), and SFAS No. 160,Noncontrolling Interests in Consolidated Financial Statements (“ ("SFAS 160”No. 160"). SFAS No. 141 (R) requires an acquirer to measure the identifiable assets acquired, the liabilities assumed and any noncontrolling interest in the acquireeacquired entity at their fair values on the acquisition date, with goodwill being the excess value over the net identifiable assets acquired. SFAS No. 160 clarifies that a noncontrolling interest in a subsidiary should be reported as equity in the consolidated financial statements. The calculation of earnings per share will continue to be based on income amounts attributable to the parent. SFAS No. 141 (R) and SFAS No. 160 are effective for financial statements issued for fiscal years beginning after December 15, 2008. Early adoption is prohibited. We do not expect the adoption of SFAS No. 141 (R) or SFAS No. 160 will have a material impact our financial position and results of operations or cash flows.
In March 2008, the FASB issued SFAS No. 161,Disclosures about Derivative Instruments and Hedging Activities—an amendment of FASB Statement No. 133 ("SFAS No. 161"). SFAS No. 161 requires enhanced disclosures about a company's derivative and hedging activities, in particular: 1) how and why derivative instruments are utilized; 2) how derivative instruments and related hedged items are accounted for under SFAS No. 133 and its related interpretations; and 3) how derivative instruments and related hedged items affect a company's financial position, financial performance and cash flows. SFAS No. 161 is effective for financial statements issued for fiscal years and interim periods beginning after November 15, 2008, with early adoption encouraged. We have no derivative instruments. Therefore, we do not yet determinedexpect the effectadoption of SFAS No. 161 to impact our financial position and results of operations or cash flows.
In April 2008, the FASB issued FSP No. 142-3,Determination of the Useful Life of Intangible Assets ("FSP No. 142-3"). FSP No. 142-3 amends the factors that should be considered in developing renewal or extension assumptions used to determine the useful life of a recognized intangible asset under FASB Statement No. 142,Goodwill and Other Intangible Assets. FSP No. 142-3 is effective for financial statements issued for fiscal years beginning after December 15, 2008. Early adoption is prohibited. We do not expect the adoption of FSP No. 142-3 will have a material impact on our consolidated financial statements, if any, uponstatements.
In May 2008, the FASB issued SFAS No. 162,The Hierarchy of Generally Accepted Accounting Principles ("SFAS No. 162"). The current GAAP hierarchy was established by the American Institute of Certified Public Accountants, and faced criticism because it was directed to auditors rather than entities. The issuance of this statement corrects this and makes some other hierarchy changes. This statement is effective 60 days following the Securities and Exchange Commission's approval of the Public Company Accounting Oversight Board amendments to AU Section 411,The Meaning of Present Fairly in Conformity with Generally Accepted Accounting Principles. The adoption of SFAS 141 (R) or SFAS 160.No. 162 did not result in a change to our consolidated financial statements.
In May 2008, the FASB issued FASB Staff Position ("FSP") APB 14-1,Accounting for Convertible Debt Instruments That May Be Settled in Cash upon Conversion (Including Partial Cash Settlement) ("FSP
Table of Contents
APB 14-1"), which clarifies the accounting for convertible debt instruments that may be settled in cash upon conversion, including partial cash settlement. FSP APB 14-1 specifies that an issuer of such instruments should separately account for the liability and equity components of the instruments in a manner that reflect the issuer's non-convertible debt borrowing rate when interest costs are recognized in subsequent periods. FSP APB 14-1 is effective for financial statements issued for fiscal years beginning after December 15, 2008 and interim periods within those fiscal years. We anticipate that the adoption of FSP APB 14-1 will not have a material impact on our consolidated financial statements.
We periodically review new accounting standards that are issued from time to time. Although some of these accounting standards may be applicable to us, we have not identified any other new standards that we believe merit further discussion and we expect that none would have a significant impact on our consolidated financial statements.
Executive Commentary
This executive commentary is intended to provide investors with a view of our business through the eyes of our management. As an executive commentary, it necessarily focuses on selected aspects of our business. This executive commentary is intended as a supplement to, but not a substitute for, the more detailed discussion of our business included elsewhere herein. Investors are cautioned to read our entire "Management's Discussion and Analysis of Financial Condition and Results of Operations", as well as our interim and audited financial statements, and the discussion of our business and risk factors and other information included elsewhere in this report. This executive commentary includes forward-looking statements, and investors are cautioned to read the "Special Note Regarding Forward-Looking Statements" included elsewhere in this report.
Commentary—Revenue. We experienced strong revenue growth in the first three quarters of 2008. As of September 30, 2008, year-to-date revenue growth was 23% compared to a decrease of 2% for the same prior year period. However, our business experienced a significant slowdown in Q4 as consumers pulled back on discretionary spending over worries of a weakening economy. As a result, total revenue increased 9% for the fiscal year 2008 to $834.4 million from $765.9 million for the fiscal year 2007 notwithstanding a decrease of 13% in Q4 2008 revenue to $255.9 million from $294.5 million in Q4 2007.
The fulfillment partner business continued to be the SEC issued SAB No. 110, Certain Assumptions Usedprimary driver of growth throughout 2008. We believe this is due to our initiative to considerably increase the number of non-media products we offer on our website. At the end of 2008, we had approximately 201,000 non-media SKUs on site compared to 63,000 at the end of last year, a 219% increase. The fulfillment partner business accounted for 79% of total revenue during 2008 and 81% during Q4, and it grew 16% for the full year, despite decreasing 9% in Valuation Methods—Expected Term (“SAB 110”). AccordingQ4 2008. Going forward, our plan is to SAB 110, under certain circumstances the SEC staff will continue to acceptadd products to existing and new categories from new and existing partners. We ended 2008 with 1,200 fulfillment partners, up from 730 a year ago.
Our direct business, unlike the usefulfillment partner business, continued to contract in 2008 and revenues were down 12% from last year. As part of our initiative to add partner products to our website, some suppliers have transitioned into fulfillment partners, eliminating the need for us to purchase their inventory, and as a result, we have experienced a shift from direct to fulfillment partner business.
Commentary—Gross Profit and Gross Profit Percentage. Higher revenues and better purchasing contributed to 15% growth in gross profit dollars in 2008. Gross profit rose to $142.9 million, while gross profit percentage expanded 80 basis points to 17.1%, a historical best for the Company. Gross profit contracted in the fourth quarter by 6% due to lower revenues, but gross profit percentage expanded to 17.0% from 15.7%. This was partly due to a decision we made to be less promotional around the holiday season.
Table of Contents
In addition, during Q4 2008, we reduced Cost of Goods Sold by $1.8 million for billing recoveries from partners who were underbilled earlier in the year for certain fees and charges that they were contractually obligated to pay. When the underbilling was originally discovered, we determined that the recovery of such amounts was not assured, and that consequently the potential recoveries constituted a gain contingency. Accordingly, we determined that the appropriate accounting treatment for the potential recoveries was to record their benefit only when such amounts became realizable (i.e., an agreement had been reached with the partner and the partner had the wherewithal to pay). We are currently reviewing our policies and procedures surrounding partner supplier cost updates and partner billing processes to ensure that the amounts contractually negotiated are billed in a complete and timely manner. We may have further billing recoveries from our partners in the future that we will seek to recover. We will recognize such recoveries in the manner described above. This accounted for 60 basis points of the simplified method130 basis point improvement from Q4 2007. Gross profit percentages for each of the quarters and fiscal years during 2007 and 2008 were:
| | | | | | | | | | | | | | | | | | | | | | | | | | | | | | | |
| | Q1 2007 | | Q2 2007 | | Q3 2007 | | Q4 2007 | | FY 2007 | | Q1 2008 | | Q2 2008 | | Q3 2008 | | Q4 2008 | | FY 2008 | |
|---|
Direct | | | 11.7 | % | | 16.5 | % | | 15.3 | % | | 15.4 | % | | 14.8 | % | | 13.4 | % | | 12.5 | % | | 10.4 | % | | 8.7 | % | | 11.3 | % |
Fulfillment Partner | | | 16.6 | % | | 18.0 | % | | 17.7 | % | | 15.8 | % | | 16.8 | % | | 17.9 | % | | 19.0 | % | | 18.7 | % | | 19.0 | % | | 18.7 | % |
Combined | | | 15.2 | % | | 17.6 | % | | 17.1 | % | | 15.7 | % | | 16.3 | % | | 16.7 | % | | 17.6 | % | | 17.2 | % | | 17.0 | % | | 17.1 | % |
Fulfillment partner gross profit benefited throughout the year from a mix shift of higher-margin sales away from the direct business and into the fulfillment partner business, and a continued shift away from our low margin BMMG business, which accounted for 5% of gross sales for 2008, down from 8% a year ago. Fulfillment partner gross profit expanded by 29% to $123.2 million or 18.7% of revenue, a 190 basis point improvement.
In addition to the sales mix shift away from the direct business and lower revenues, higher product and freight costs negatively impacted direct gross profit, which declined 32% compared to 2007. Direct gross profit percentage fell by approximately 350 basis points to 11.3% despite a 40 basis point reduction in fulfillment costs.
Commentary—Marketing. While revenues increased by 9% this year our sales and marketing expense increased only 4% to $57.6 million during fiscal 2008, and marketing efficiency (marketing as discusseda percentage of revenue) improved to 6.9% from 7.2% in SAB 107,2007. In Q4 2007, we invested heavily in developingtelevision, radio and print advertising to both strengthen our brand and enhance future revenue growth. We continued to invest in our brand throughout 2008, but with a more consistent, disciplined approach. Because our branding spend was minimal in the first three quarters of 2007, sales and marketing expenses rose sharply through the first three quarters of 2008 compared to 2007. In Q4 2008, we reduced the level of marketing to $16.4 million or 6.4% of total revenue compared to $27.4 million or 9.3% of total revenue in Q4 2007.
Commentary—Contribution and Contribution Percentage. With higher gross profit and more efficient marketing, contribution (gross profit dollars less sales and marketing expense) increased 23% to $85.3 million in 2008. Contribution as of a percentage of revenue was 9.0% and 10.2% in 2007 and 2008, respectively. Contribution increased by 43% in Q4 to $27.2 million, an estimate$8.2 million improvement
Table of expected termContents
due primarily to lower marketing costs. The following table represents our calculation of “plain vanilla” share optionscontribution (in thousands):
| | | | | | | | | | | | | |
| | Three months ended December 31, | | Twelve months ended December 31, | |
|---|
| | 2007 | | 2008 | | 2007 | | 2008 | |
|---|
Total revenue | | $ | 294,516 | | $ | 255,862 | | $ | 765,902 | | $ | 834,367 | |
Cost of goods sold | | | 248,134 | | | 212,252 | | | 641,352 | | | 691,458 | |
| | | | | | | | | | |
Gross profit | | | 46,382 | | | 43,610 | | | 124,550 | | | 142,909 | |
Less: Sales and marketing expense | | | 27,377 | | | 16,437 | | | 55,458 | | | 57,634 | |
| | | | | | | | | | |
Contribution | | $ | 19,005 | | $ | 27,173 | | $ | 69,092 | | $ | 85,275 | |
| | | | | | | | | | |
Contribution percentage | | | 6.5 | % | | 10.6 | % | | 9.0 | % | | 10.2 | % |
Commentary—Technology and G&A costs. Our combined technology and G&A costs were down 5% to $96.2 million for fiscal 2008. Technology costs fell 3% to $57.8 million from $59.5 million in accordance2007 as we offset falling depreciation expense with SFAS 123(R), beyondIT development and related staff in 2008.
G&A costs decreased 9.0% to $38.4 million for the year 2008 from $42.0 million or $3.6 million. The primary reduction in G&A expenses year over year is primarily due to a $4.1 million decrease in bonuses accrued in 2008 (including our decision to not pay senior executives and company-wide profit sharing bonuses). In addition, the performance goal described in the Performance Share Plan (the "Plan") was not attained as of the end of the year ended 2008 and $1.0 million in total compensation expense accrued under the Plan was reversed. This year over year decrease was offset in part by an increase of approximately $1.5 million related to consulting costs and professional fees. Technology/G&A costs have been falling over the last few years; we expect that trend will reverse in 2009 as we invest in development and corporate staff and projects.
Commentary—Operating loss. Overall, our operating expenses, including sales and marketing, technology/G&A and restructuring were down 9% for 2008 and down 29% for Q4 2008 compared to the previous year. Our resulting operating loss for 2008 was $10.9 million, a 76% improvement from $44.6 million in 2007. For the three months ended December 31, 2008, our operating profit was $5.7 million, $12.5 million better than the $6.8 million operating loss during the same period last year. The 2007 operating loss includes $12.3 million of restructuring costs ($6.1 million in Q1 2007 and $6.2 million in Q2 2007). We did not incur any restructuring costs in 2008.
Commentary—Other income (expense), net. For the year ended 2008, other expense was $1.4 million and included a $2.8 million gain on the retirement of $9.5 million of 3.75% Senior Notes, a $3.9 million loss on settlement of notes receivable and a $300,000 other-than-temporary impairment of marketable securities.
Commentary—Adjusted EBITDA (non-GAAP). Adjusted EBITDA (a non-GAAP financial measure) for fiscal 2008 was $15.1 million, $25.5 million better than the $(10.5) million in 2007. For the fourth quarter of 2008, Adjusted EBITDA was $9.9 million, a $10.4 million improvement from ($415,000) in Q4 2007. In 2008, capital expenditures were $18.7 million, while depreciation expense was $22.7 million. We believe that a discussion of Adjusted EBITDA at this stage of our business is useful to investors, as Adjusted EBITDA is a reasonable measure of actual cash used or cash generated by the continuing operations of our business. See "Non-GAAP Financial Measures" below for a reconciliation of Adjusted EBITDA to net income (loss).
Commentary—Balance Sheet Items. We ended the year with $109.6 million in cash, cash equivalents and marketable securities, compared to $147.4 million at the end of 2007. Working capital
Table of Contents
decreased to $39.7 million from $62.6 million. The difference is largely the result of $20 million of stock repurchases and debt retirement and $18.7 million of capital expenditures.
We ended the year with $17.7 million of inventory (including inventory in-transit of $2.8 million), a decrease from the $25.6 million of inventory (including inventory in-transit of $3.1 million) we had at the end of 2007. We will adopt SAB 110 effective January 1,were able to turn our inventory more frequently due to more efficient inventory management and maintaining a more attractive product selection.
Commentary—Cash Flows (non-GAAP). For the year ended December 31, 2008, we generated $2.0 million in cash inflows from operations compared to cash inflows of $10.0 million during 2007. "Free Cash Flow" (a non-GAAP financial measure) for the three months ended December 31, 2007 and will continue2008 totaled $55.3 million and $39.4 million, respectively. For the years ended December 31, 2007 and 2008, free cash flow was $7.3 million and $(16.7) million. See "Non-GAAP Financial Measures" below for a reconciliation of Free Cash Flow to usenet cash provided by operating activities.
Commentary—Debt Repurchase Program. At December 31, 2008, $67.5 million of our 3.75% Senior Convertible Notes due 2011 were outstanding. On February 17, 2009 our Board authorized us to spend up to $20.0 million to repurchase Senior Notes. To date we have spent $3.0 million under the simplified method in developing the expected term used for our valuation of stock-based compensation.new debt repurchase program.
The balance of our Management's Discussion and Analysis of Financial Condition and Results of Operations provides further information about the matters discussed above and other important matters affecting our business.
Table of Contents
Results of Operations
The following table sets forth our results of operations expressed as a percentage of total revenue for 2005,2006, 2007 and 2008:
| | | | | | | | | | | | |
| | Years ended December 31, | |
|---|
| | 2006 | | 2007 | | 2008 | |
|---|
| | (as a percentage of total revenue)
| |
|---|
Revenue | | | | | | | | | | |
| | Direct revenue | | | 38.6 | % | | 25.7 | % | | 20.9 | % |
| | Fulfillment partner revenue | | | 61.4 | | | 74.3 | | | 79.1 | |
| | | | | | | | |
| | | Total revenue | | | 100.0 | | | 100.0 | | | 100.0 | |
| | | | | | | | |
Cost of goods sold | | | | | | | | | | |
| | Direct | | | 36.5 | | | 21.9 | | | 18.5 | |
| | Fulfillment partner | | | 52.0 | | | 61.8 | | | 64.4 | |
| | | | | | | | |
| | | Total cost of goods sold | | | 88.5 | | | 83.7 | | | 82.9 | |
| | | | | | | | |
Gross profit | | | 11.5 | | | 16.3 | | | 17.1 | |
| | | | | | | | |
Operating expenses: | | | | | | | | | | |
| | Sales and marketing | | | 9.1 | | | 7.2 | | | 6.9 | |
| | Technology | | | 8.4 | | | 7.8 | | | 6.9 | |
| | General and administrative | | | 6.0 | | | 5.5 | | | 4.6 | |
| | Restructuring | | | 0.7 | | | 1.6 | | | 0.0 | |
| | | | | | | | |
| | | Total operating expenses | | | 24.2 | | | 22.1 | | | 18.4 | |
| | | | | | | | |
Operating loss | | | (12.7 | ) | | (5.8 | ) | | (1.3 | ) |
Interest income, net | | | 0.5 | | | 0.6 | | | 0.4 | |
Interest expense | | | (0.6 | ) | | (0.6 | ) | | (0.4 | ) |
Other (expense) income, net | | | 0.0 | | | (0.0 | ) | | (0.2 | ) |
| | | | | | | | |
Loss from continuing operations | | | (12.8 | )% | | (5.8 | )% | | (1.5 | )% |
| | | | | | | | |
Comparison of Years Ended December 31, 2007 and 2008
Total revenue increased 9% to $834.4 million for the year ended December 31, 2008, from $765.9 million in 2007. During the three months ended December 31, 2007 and 2008, total revenue was $294.5 million and $255.9 million, respectively, a 13% decrease. Direct revenue decreased 12% from $197.1 million in 2007 to $174.2 million in 2008. In the fourth quarters, direct revenue decreased 28%, from $67.2 million in 2007 to $48.4 million in 2008. Fulfillment partner revenue increased 16% during fiscal 2008, but decreased 9% during the fourth quarter. For the year ended December 31, 2008, fulfillment partner revenue was $660.2 million compared to $568.8 million in 2007. For the three months ended December 31, 2008, fulfillment partner revenue was $207.4 million compared to $227.3 million in 2007.
Generally, our overall gross profit percentages fluctuate based on several factors, including our product mix of sales; sales volumes mix within our direct business and fulfillment partners business; changes in vendor and / or customer pricing, including competitive pricing and inventory management decisions within the direct business; warehouse management costs; customer service costs; and our
Table of Contents
discounted shipping offers. Discounted shipping offers reduce shipping revenue, and therefore reduce our gross profit percentage on retail sales.
Gross profit percentage for the twelve months ended December 31, 2008 increased 80 basis points, from 16.3% in 2007 to 17.1% in 2008. Gross profit for the years ended December 31, 2007 and 2008 amounted to $124.6 million and $142.9 million, respectively, a 15% increase. For the three months ended December 31, 2008, gross profit percentage increased 130 basis points, from 15.7% in 2007 to 17.0% in 2008, and gross profit decreased 6% from $46.4 million in Q4 2007 to $43.6 million in Q4 2008. Gross profit percentages for the quarters and fiscal years during 2007 and 2008 were:
| | | | | | | | | | | | | | | | | | | | | | | | | | | | | |
Q1 2007 | | Q2 2007 | | Q3 2007 | | Q4 2007 | | FY 2007 | | Q1 2008 | | Q2 2008 | | Q3 2008 | | Q4 2008 | | FY 2008 | |
|---|
| | 15.2 | % | | 17.6 | % | | 17.1 | % | | 15.7 | % | | 16.3 | % | | 16.7 | % | | 17.6 | % | | 17.2 | % | | 17.0 | % | | 17.1 | % |
Cost of goods sold includes stock-based compensation related to the adoption of SFAS 123(R) of $460,000 and $181,000 for the years ended December 31, 2007 and 2008, respectively.
Direct Gross Profit and Gross Profit Percentage—Gross profit for our direct business declined 32% from $29.1 million during the year ended December 31, 2007 to $19.7 million for the same period in 2008. Gross profit for our direct business as a percentage of direct revenue decreased from 14.8% in 2007 to 11.3% in 2008. For the three-month periods ended December 31, 2007 and 2008, gross profit for our direct business totaled $10.4 million and $4.2 million, respectively, a 59% decrease. Gross profit percentage for our direct business for those three-month periods decreased from 15.4% in 2007 to 8.7% in 2008.
Gross profit percentage for our direct business decreased along with a decrease in direct revenue of 12% for fiscal 2008, decreasing 28% for the fourth quarter of 2008 compared to the respective periods in 2007. While fulfillment costs continue to improve, these benefits are more than offset by our fixed warehouse cost being amortized over a smaller direct revenue base.
Fulfillment Partner Gross Profit and Gross Profit Percentage—Our fulfillment partner business generated gross profit of $95.5 million and $123.2 million for the years ended December 31, 2007 and 2008, respectively, a 29% improvement. Gross profit percentage for the fulfillment partner business also increased from 16.8% in 2007 to 18.7% in 2008 for those respective periods. The increase in gross profit dollars for our fulfillment partner business is the result of the 16% increase in fulfillment partner revenue combined with increased gross profit percentage.
Fulfillment costs include all warehousing costs, including fixed overhead and variable handling costs (excluding packaging costs), as well as credit card fees and customer service costs, all of which we include as costs in calculating gross profit percentage. We believe that some companies in our industry, including some of our competitors, account for fulfillment costs within operating expenses, and therefore exclude fulfillment costs from gross profit percentage. As a result, our gross profit percentage may not be directly comparable to others in our industry.
Table of Contents
The following table has been included to provide investors additional information regarding our classification of fulfillment costs and gross profit percentage, thus enabling investors to better compare our gross profit percentage with others in our industry (in thousands):
| | | | | | | | | | | | | | |
| | Years ended December 31, | |
|---|
| | 2007 | | 2008 | |
|---|
Total revenue | | $ | 765,902 | | | 100 | % | $ | 834,367 | | | 100 | % |
| | | | | | | | | | | | |
Cost of goods sold | | | | | | | | | | | | | |
| | Product costs and other cost of goods sold | | | 594,276 | | | 78 | % | | 644,212 | | | 77 | % |
| | Fulfillment costs | | | 47,076 | | | 6 | % | | 47,246 | | | 6 | % |
| | | | | | | | | | |
| | Total cost of goods sold | | | 641,352 | | | 84 | % | | 691,458 | | | 83 | % |
| | | | | | | | | | |
Gross profit | | $ | 124,550 | | | 16 | % | $ | 142,909 | | | 17 | % |
| | | | | | | | | | |
As displayed in the above table, fulfillment costs during the years ended December 31, 2007 and 2008 were $47.1 million and $47.2 million, representing 6% of total revenue for those respective periods. Fulfillment costs as a percentage of sales may vary due to several factors, such as our ability to manage costs at our warehouses, significant changes in the number of units received and fulfilled, the extent to which we utilize third party fulfillment services and warehouses, and our ability to effectively manage customer service costs and credit card fees.
Sales and marketing. Sales and marketing expenses totaled $55.5 million and $57.6 million for the years ended December 31, 2007 and 2008, representing 7% of total revenue for those respective periods. Comparing 2007 and 2008, sales and marketing expenses increased 4% from 2007 to 2008. We direct customers to our Website primarily through a number of targeted online marketing channels, such as sponsored search, affiliate marketing, portal advertising, e-mail campaigns, and other initiatives. We also use nation-wide television, print and radio advertising campaigns to promote sales. Sales and marketing expenses also include stock-based compensation related to the adoption of SFAS 123(R) in 2006 of $336,000 and $313,000 for the years ended December 31, 2007 and 2008, respectively.
Costs associated with our discounted shipping promotions are not included in marketing expense. Rather they are accounted for as a reduction of revenue and therefore affect sales growth and gross profit percentage. We consider discounted shipping promotions as an effective marketing tool, and intend to continue to offer them as we deem appropriate as part of our overall marketing plan.
Technology expenses. We seek to efficiently invest in our technology, including web services, customer support, search, and expansion of new and existing product categories, as well as technology infrastructure to continue to enhance the customer experience, improve our process efficiency and support our web services infrastructure.
Technology expenses totaled $59.5 million and $57.8 million for the years ended December 31, 2007 and 2008, respectively (7.8% and 6.9% of revenue for 2007 and 2008). From 2007 to 2008, technology expenses decreased 3% primarily due to decreased depreciation expense. Technology expenses also included stock-based compensation related to the adoption of SFAS 123(R) in 2006 of $764,000 and $792,000 for the years ended December 31, 2007 and 2008, respectively.
General and administrative expenses. General and administrative ("G&A") expenses totaled $42.0 million and $38.4 million for the years ended December 31, 2007 and 2008, respectively, representing approximately 5.5% and 4.6% of total revenue, respectfully. G&A costs decreased 9.0% to $38.4 million for the year 2008 from $42.0 million or $3.6 million. The primary reduction in G&A expenses year over year is primarily due to a $4.1 million decrease in bonuses accrued in 2008
Table of Contents
(including our decision to not pay senior executives and company-wide profit sharing bonuses). In addition, the performance goal described in the Performance Share Plan (the "Plan") was not attained as of the end of the year ended 2008 and $1.0 million in total compensation expense accrued under the Plan was reversed. This year over year decrease was offset in part by an increase of approximately $1.5 million related to consulting costs and professional fees.
We incurred stock-based compensation related to the adoption of SFAS 123(R) in 2006 within general and administrative expenses of approximately $3.0 million and $2.0 million for the years ended December 31, 2007 and 2008, respectively.
A large portion of our technology and general and administrative expenses are non-cash expenses. These non-cash expenses (which include depreciation and amortization and stock-based compensation) for the year ended December 31, 2008 were $26.0 million, compared to similar non-cash expense of $34.2 million during 2007. We estimate that that these non-cash expenses for 2009 will be approximately $18-$20 million.
Overall, our total operating expenses decreased 9% during fiscal 2008 compared to the previous year, while total revenues increased 9% and gross profit increased 15%.
Restructuring expenses. During the fourth quarter of 2006, we commenced a facilities consolidation and restructuring program designed to reduce our overall expense structure in an effort to improve future operating performance. The facilities consolidation and restructuring program was substantially completed by the end of the second quarter of 2007. There were no restructuring expenses recorded during the third and fourth quarters of 2007 or for any period in 2008. If we determine to move our corporate headquarters we expect to incurr future restructuring expenses. (see Item 15 of Part IV, "Financial Statements"—Note 3—"Restructuring Expense").
During fiscal year 2006, we recorded $5.7 million of restructuring charges, of which $4.6 million related to costs to terminate a co-location data center lease. Other costs included in the restructuring charge related to $638,000 of accelerated amortization of leasehold improvements in our current office facilities that we are attempting to sublease, and $450,000 of costs to return these office facilities to their original condition as required by the lease agreement.
During fiscal year 2007, we recorded $12.3 million of restructuring charges, of which $9.9 million related to the termination of a logistics services agreement, termination and settlement of a lease related to vacated warehouse facilities in Indiana, and abandonment and marketing for sub-lease office and data center space in our current corporate office facilities. We also recorded an additional $2.2 million of restructuring charges related to accelerated depreciation of leasehold improvements located in the abandoned office and co-location data center space and $200,000 of other miscellaneous restructuring charges. We had no restructuring charges in 2008.
Interest income and interest expense. Interest income is primarily derived from the investment of our cash in short-term investments. Comparing 2007 and 2008, the decrease in interest income is due to a decrease in total cash and interest rates in 2008.
Interest expense is largely related to interest incurred on our convertible notes and our credit lines. Interest expense for the years ended December 31, 2007 and 2008 totaled $4.2 million and $3.5 million, respectively.
Other income (expense). Other income (expense) for the year ended December 31, 2007 was net expense of $(92,000). For the year ended December 31, 2008, other income (expense) was net expense of $(1.4) million. This included a $2.8 million gain, net of amortization of debt discount of $142,000 on the retirement of $9.5 million of the 3.75% Senior Notes (see Item 15 of Part IV, "Financial
Table of Contents
Statements"—Note 17—"Stock and Debt Repurchase Program"), a $3.9 million loss on the settlement of notes receivable (see Item 15 of Part IV, "Financial Statements"—Note 4—"Acquisition and Subsequent Discontinued Operations") and a $300,000 other-than-temporary impairment of marketable securities.
On January 14, 2008, the Company's Board of Directors authorized a repurchase program that allowed the Company to purchase up to $20.0 million of its common stock and / or its 3.75% Senior Convertible Notes due 2011 ("Senior Notes") through December 31, 2009. During the year ended 2008, we retired $9.5 million of the Senior Notes for $6.6 million in cash and recognized a gain of $2.8 million, net of amortization of debt discount of $142,000.
We determined during the fourth quarter of 2006 to sell our travel subsidiary ("OTravel"). As a result, OTravel's operations were classified as a discontinued operation and therefore are not included in the results of continuing operations. The loss from discontinued operations for OTravel was $6.9 million and $3.9 million for the years ended December 31, 2006 and 2007:2007, respectively.
In conjunction with the discontinuance of OTravel, we performed an evaluation of the goodwill associated with the reporting unit pursuant to SFAS 142 and SFAS 144 and determined that goodwill of approximately $4.5 million was impaired as of December 31, 2006 based on a non-binding letter of intent from a third party to purchase this business. On April 25, 2007, we completed the sale of OTravel for cash proceeds of $9.9 million, net of cash transferred, and $6.0 million of notes. Based on the estimated fair value of the discounted cash flows of the net proceeds from the sale, we recorded an additional goodwill impairment of $3.8 million in 2007. (see Item 15 of Part IV, "Financial Statements"—Note 4—"Acquisition and Subsequent Discontinued Operations").
| | Years ended December 31, | |
| | 2005
(Restated) | | 2006
(Restated) | | 2007
(Restated) | |
| | (as a percentage of total revenue) | |
| | | | | | | |
Revenue | | | | | | | |
Direct revenue | | 40.6 | % | 38.6 | % | 25.7 | % |
Fulfillment partner revenue | | 59.4 | | 61.4 | | 74.3 | |
| | | | | | | |
Total revenue | | 100.0 | | 100.0 | | 100.0 | |
| | | | | | | |
Cost of goods sold | | | | | | | |
Direct | | 35.3 | | 36.5 | | 21.9 | |
Fulfillment partner | | 50.0 | | 52.0 | | 61.8 | |
| | | | | | | |
Total cost of goods sold | | 85.3 | | 88.5 | | 83.7 | |
| | | | | | | |
Gross profit | | 14.7 | | 11.5 | | 16.3 | |
| | | | | | | |
Operating expenses: | | | | | | | |
Sales and marketing | | 9.7 | | 9.1 | | 7.2 | |
Technology | | 3.5 | | 8.4 | | 7.8 | |
General and administrative | | 4.2 | | 6.0 | | 5.5 | |
Restructuring | | — | | 0.7 | | 1.6 | |
| | | | | | | |
Total operating expenses | | 17.4 | | 24.2 | | 22.1 | |
| | | | | | | |
Operating loss | | (2.7 | ) | (12.7 | ) | (5.8 | ) |
Interest income, net | | 0.0 | | 0.5 | | 0.6 | |
Interest expense | | (0.7 | ) | (0.6 | ) | (0.6 | ) |
Other (expense) income, net | | 0.6 | | 0.0 | | (0.0 | ) |
| | | | | | | |
Loss from continuing operations | | (2.8 | )% | (12.8 | )% | (5.8 | )% |
On January 21, 2009, we entered into a Note Purchase Agreement to sell both the senior and junior promissory notes to Castles Travel, Inc for $1.3 million in cash and recognized a loss on the settlement of these notes and interest receivable of approximately $3.9 million which was recorded as of December 31, 2008 (see Item 15 of Part IV, "Financial Statements"—Note 4—"Acquisition and Subsequent Discontinued Operations").
For the year ended December 31, 2007 and 2008, we incurred net operating losses, and consequently paid insignificant amounts of federal, state and foreign income taxes. As of December 31, 2007 and 2008, we had net operating loss carry-forwards of approximately $164.2 million and $171.8 million, respectively, which may be used to offset future taxable income. An additional $21.9 million of net operating losses are limited under Internal Revenue Code Section 382 to $799,000 a year. These net operating loss carry-forwards will begin to expire in 2018.
Based upon our historical experience, revenue typically increases during the fourth quarter because of the holiday retail season. The actual quarterly results for each quarter could differ materially depending upon consumer preferences, availability of product and competition, among other risks and uncertainties. Accordingly, there can be no assurances that seasonal variations will not materially affect
Table of Contents
our results of operations in the future. The following table reflects our total revenues for each of the quarters since 2005 (in thousands):
| | | | | | | | | | | | | |
| | First Quarter | | Second Quarter | | Third Quarter | | Fourth Quarter | |
|---|
2008 | | $ | 202,814 | | $ | 188,836 | | $ | 186,855 | | $ | 255,862 | |
2007 | | | 162,156 | | | 149,171 | | | 160,059 | | | 294,516 | |
2006 | | | 179,783 | | | 159,717 | | | 158,230 | | | 282,407 | |
2005 | | | 165,028 | | | 153,519 | | | 166,396 | | | 310,033 | |
Comparison of Years Ended December 31, 2006 and 2007
�� Total revenue decreased 2% to $765.9 million for the year ended December 31, 2007, from $780.1 million in 2006. During the three months ended December 31, 2006 and 2007, total revenue was $282.4 million and $294.5 million, respectively, a 4% increase. Direct revenue decreased 35% from $301.5 million in 2006 to $197.1 million in 2007, and comparing the fourth quarters, direct revenue decreased 29%, from $94.4 million in 2006 to $67.2 million in 2007. On the other hand, fulfillment partner revenue experienced 19% growth during fiscal 2007 and 21% growth during the fourth quarter. For the year ended December 31, 2007, fulfillment partner revenue was $568.8 million compared to $478.6 million in 2006. For the three months ended December 31, 2007, fulfillment partner revenue was $227.3 million versus $188.0 million in 2006.
Table of Contents
Gross profit and gross marginProfit Percentage
Generally, our overall gross marginsprofit percentages fluctuate based on several factors, including our product mix of sales; sales volumes mix by our direct business and fulfillment partners businesses; changes in vendor and / or customer pricing, including competitive pricing and inventory management decisions within the direct business; warehouse management costs; customer service costs; and our discounted shipping offers. Discounted shipping offers reduce shipping revenue, and therefore reduce our gross marginprofit percentage on retail sales.
Gross marginprofit percentage for the twelve months ended December 31, 2007 increased 480 basis points, from 11.5% in 2006 to 16.3% in 2007. Gross profit for the years ended December 31, 2006 and 2007 amounted to $89.8 million and $124.6 million, respectively, a 39% increase. For the three-month period ended December 31, 2007, gross marginprofit percentage increased 730 basis points, from 8.4% in 2006 to 15.7% in 2007, and gross profit increased 95% from $23.8 million in 2006 to $46.4 million in 2007. Gross marginsprofit percentages for the quarters and fiscal years during 2006 and 2007 were:
Q1 2006
(Restated) | | Q2 2006
(Restated) | | Q3 2006
(Restated) | | Q4 2006
(Restated) | | FY 2006
(Restated) | | Q1 2007
(Restated) | | Q2 2007
(Restated) | | Q3 2007
(Restated) | | Q4 2007
(Restated) | | FY 2007
(Restated) | |
12.8 | % | 13.5 | % | 13.6 | % | 8.4 | % | 11.5 | % | 15.2 | % | 17.6 | % | 17.1 | % | 15.7 | % | 16.3 | % |
| | | | | | | | | | | | | | | | | | | | | | | | | | | | | |
Q1 2006 | | Q2 2006 | | Q3 2006 | | Q4 2006 | | FY 2006 | | Q1 2007 | | Q2 2007 | | Q3 2007 | | Q4 2007 | | FY 2007 | |
|---|
| | 12.8 | % | | 13.5 | % | | 13.6 | % | | 8.4 | % | | 11.5 | % | | 15.2 | % | | 17.6 | % | | 17.1 | % | | 15.7 | % | | 16.3 | % |
Cost of goods sold includes stock-based compensation related to the adoption of SFAS 123(R) of $412,000 and $460,000 for the years ended December 31, 2006 and 2007, respectively.
Direct Gross Profit and Gross Margin—Profit Percentage—Gross profit for our direct business grew 74% from $16.7 million during the year ended December 31, 2006 to $29.1 million for the same period in 2007. Gross profit for our direct business as a percentage of direct revenue increased from 5.6% in 2006 to 14.8% in 2007. For the three-month periods ended December 31, 2006 and 2007, gross profit for our direct business totaled $(4.3) million and $10.4 million, respectively, a 342% increase. Gross marginprofit percentage for our direct business for those three-month periods increased from -4.5% in 2006 to 15.4% in 2007. Gross marginprofit percentage for our direct business expanded despite direct revenue decreasing 35% for fiscal 2007 and decreasing 29% for the fourth quarter of 2007 compared to the respective periods in 2006. This was primarily due to a significant reduction in direct inventory.
Table of Contents
However, gross marginsprofit percentages have increased at the same time, since the remaining inventory in general turns faster and has higher profitability. Gross marginsprofit percentages have also improved from the reduction of fulfillment costs (defined as warehousing costs, credit card fees and customer service costs—see further discussion in the following section entitled “Fulfillment Costs”"Fulfillment Costs") to 6.1% of sales in 2007 compared to 7.8% in 2006, a 170 basis point improvement.
Fulfillment Partner Gross Profit and Gross Margin—Profit Percentage—Our fulfillment partner business generated gross profit of $73.1 million and $95.5 million for the years ended December 31, 2006 and 2007, respectively, a 31% improvement. Gross marginprofit percentage for the fulfillment partner business also increased from 15.3% in 2006 to 16.8% in 2007 for those respective periods. The increase in gross profit dollars for our fulfillment partner business is the result of the 19% increase in fulfillment partner revenue combined with increased gross margin.profit percentage. The increase in partner gross marginprofit percentage is the result of better product pricing and improvements in partner fulfillment costs, particularly the cost of customer service.
Fulfillment costs include all warehousing costs, including fixed overhead and variable handling costs (excluding packaging costs), as well as credit card fees and customer service costs, all of which we include as costs in calculating gross margin.profit percentage. We believe that some companies in our industry, including some of our competitors, account for fulfillment costs within operating expenses, and therefore exclude fulfillment costs from gross margin.profit percentage. As a result, our gross marginprofit percentage may not be directly comparable to others in our industry.
The following table has been included to provide investors additional information regarding our classification of fulfillment costs and gross margin,profit percentage, thus enabling investors to better compare our gross marginprofit percentage with others in our industry (in thousands):
| | Years ended December 31, | |
| | 2006
(Restated) | | 2007
(Restated) | |
Total revenue | | $ | 780,137 | | 100 | % | $ | 765,902 | | 100 | % |
| | | | | | | | | |
Cost of goods sold | | | | | | | | | |
Product costs and other cost of goods sold | | 629,477 | | 81 | % | 594,276 | | 78 | % |
Fulfillment costs | | 60,856 | | 7 | % | 46,728 | | 6 | % |
| | | | | | | | | |
Total cost of goods sold | | 690,333 | | 88 | % | 641,352 | | 84 | % |
| | | | | | | | | |
Gross profit | | $ | 89,804 | | 12 | % | $ | 124,550 | | 16 | % |
| | | | | | | | | | | | | | |
| | Years ended December 31, | |
|---|
| | 2006 | | 2007 | |
|---|
Total revenue | | $ | 780,137 | | | 100 | % | $ | 765,902 | | | 100 | % |
| | | | | | | | | | |
Cost of goods sold | | | | | | | | | | | | | |
| | Product costs and other cost of goods sold | | | 629,477 | | | 81 | % | | 594,276 | | | 78 | % |
| | Fulfillment costs | | | 60,856 | | | 7 | % | | 47,076 | | | 6 | % |
| | | | | | | | | | |
| | Total cost of goods sold | | | 690,333 | | | 88 | % | | 641,352 | | | 84 | % |
| | | | | | | | | | |
Gross profit | | $ | 89,804 | | | 12 | % | $ | 124,550 | | | 16 | % |
| | | | | | | | | | |
As displayed in the above table, fulfillment costs during the years ended December 31, 2006 and 2007 were $60.9 million and $46.7$47.1 million, representing 7% and 6% of total revenue for those respective periods. Fulfillment costs as a percentage of sales may vary due to several factors, such as our ability to manage costs at our warehouses, significant changes in the number of units received and fulfilled, the extent to which we utilize third party fulfillment services and warehouses, and our ability to effectively manage customer service costs and credit card fees.
The decrease in fulfillment costs in 2007 has been the result of improved efficiencies in both our warehousing costs (including the reduction of warehouse space), and in our customer service operations.
Operating expenses
Sales and marketing. Sales and marketing expenses totaled $70.9 million and $55.5 million for the years ended December 31, 2006 and 2007, representing 9% and 7% of total revenue for those respective periods. Comparing 2006 and 2007, sales and marketing expenses decreased 22% from 2006 to 2007. We direct customers to our Website primarily through a number of targeted online marketing channels, such as sponsored search, affiliate marketing, portal advertising, e-mail campaigns, and other initiatives. We also utilize channels such as nation-wide television, print and radio advertising campaigns. Sales and marketing expenses also include stock-based compensation related to the adoption of SFAS 123(R) in 2006 of $301,000 and $336,000 for the years ended December 31, 2006 and 2007, respectively.
Table of Contents
Costs associated with our discounted shipping promotions are not included in marketing expense. Rather they are accounted for as a reduction of revenue and therefore affect sales growth and gross profit. We consider discounted shipping promotions as an effective marketing tool, and intend to continue to offer them as we deem appropriate as part of our overall marketing plan.
37
Table of Contents
Technology expenses. Technology expenses totaled $65.2 million and $59.5 million for the years ended December 31, 2006 and 2007, respectively (8% of revenue in both years). From 2006 to 2007, technology expenses decreased 9% primarily due to decreased depreciation expense. Technology expenses also included stock-based compensation related to the adoption of SFAS 123(R) in 2006 of $684,000 and $764,000 for the years ended December 31, 2006 and 2007, respectively.
General and administrative expenses. General and administrative expenses. General and administrative (“("G&A”&A") expenses totaled $46.8 million and $42.0 million for the years ended December 31, 2006 and 2007, respectively, representing approximately 6% of total revenue for both years. Comparing fiscal years 2006 and 2007, general and administrative expenses decreased 10%. The decrease in G&A expenses relates to decreases in corporate facilities costs, payroll-related expenses, professional fees, merchandising, legal and finance costs as we have made reductions to our corporate office space and headcount.
We incurred stock-based compensation related to the adoption of SFAS 123(R) in 2006 within general and administrative expenses of approximately $2.7 million and $3.0 million for the years ended December 31, 2006 and 2007, respectively.
A large portion of our technology and general and administrative expenses are non-cash expenses. These non-cash expenses (which include depreciation and amortization and stock-based compensation and excludes non-cash restructuring costs) for the year ended December 31, 2007 were $34.2 million, compared to similar non-cash expense of $37.3 million during 2006. We estimate that that these non-cash expenses for 2008 will be approximately $28-$30 million.
Overall, our total operating expenses decreased 10% during fiscal 2007 compared to the previous year, while total revenues decreased 2% and gross profit increased 39%.
Restructuring expenses. During the fourth quarter of 2006, we commenced a facilities consolidation and restructuring program designed to reduce our overall expense structure in an effort to improve future operating performance. The facilities consolidation and restructuring program was substantially completed by the end of the second quarter of 2007. There were no restructuring expenses recorded during the third and fourth quarters of 2007 (see Item 15 of Part IV, “Financial Statements (Restated)”"Financial Statements"—Note 4—“3—"Restructuring Expense”Expense").
During fiscal year 2006, we recorded $5.7 million of restructuring charges, of which $4.6 million related to costs to terminate a co-location data center lease. Other costs included in the restructuring charge related to $638,000 of accelerated amortization of leasehold improvements in our current office facilities that we are attempting to sublease, and $450,000 of costs to return these office facilities to their original condition as required by the lease agreement.
During fiscal year 2007, we recorded $12.3 million of restructuring charges, of which $9.9 million related to the termination of a logistics services agreement, termination and settlement of a lease related to vacated warehouse facilities in Indiana, and abandonment and marketing for sub-lease office and data center space in our current corporate office facilities. We also recorded an additional $2.2 million of restructuring charges related to accelerated depreciation of leasehold improvements located in the abandoned office and co-location data center space and $200,000 of other miscellaneous restructuring charges.
Table of Contents
Interest income, interest expense and other income (expense). Interest income is derived from the investment of our cash in short-term investments. Over the last two years, interest income totaled $3.6 million and $4.8 million for the years ended December 31, 2006 and 2007, respectively. Comparing 2006 and 2007, the increase in interest income is due to an increase in total cash and interest rates in 2007, and from interest income earned from our notes receivable related to the sale of our OTravel business which occuredoccurred in the second quarter of 2007 (see Item 15 of Part IV, “Financial Statements (Restated)”"Financial Statements"—Note 5—“4—"Acquisition and Subsequent Discontinued Operations”Operations"). During Q2 of 2006, we recorded $1.9 million of interest income related to the sale of Foreign Notes (see Item 15 of Part IV, “Financial Statements (Restated)”"Financial Statements"—Note 6—“5—"Marketable Securities”Securities").
Interest expense is largely related to interest incurred on our convertible notes, capital leases and our credit lines. Interest expense for the years ended December 31, 2006 and 2007 totaled $4.8 million and $4.2 million, respectively. The decrease from 2006 to 2007 is due primarily to the fact that we had $20 million of borrowings outstanding on our inventory line of credit in the first quarter of 2006, and no borrowings outstanding during the same period in 2007.
Other income (expense) for the year ended December 31, 2006 was income of $81,000 and net expense of $92,000 in 2007.
We determined during the fourth quarter of 2006 to sell our travel subsidiary (“OTravel”("OTravel"). As a result, OTravel’sOTravel's operations were classified as a discontinued operation and therefore are not included in the results of continuing operations. The loss from discontinued operations for OTravel was $6.9 million and $3.9 million for the years ended December 31, 2006 and 2007, respectively.
In conjunction with the discontinuance of OTravel, we performed an evaluation of the goodwill associated with the reporting unit pursuant to SFAS 142 and SFAS 144 and determined that goodwill of approximately $4.5 million was impaired as of December 31, 2006 based on a non-binding letter of intent from a third party to purchase this business. On April 25, 2007, we completed the sale of OTravel for cash proceeds of $9.9 million, net of cash transferred, and $6.0 million of notes. Based on the estimated fair value of the discounted cash flows of the net proceeds from the sale, we recorded an additional goodwill impairment of $3.8 million. There was no additional impairment of goodwill during the year ended December 31, 2007 (see Item 15 of Part IV, “Financial Statements (Restated)”"Financial Statements"—Note 5—“4—"Acquisition and Subsequent Discontinued Operations”Operations").
On January 21, 2009, we entered into a Note Purchase Agreement to sale both the senior and junior promissory notes to Castles Travel, Inc for $1.3 million in cash and recognized a loss on the settlement of these notes and interest receivable of approximately $3.9 million (see Item 15 of Part IV, "Financial Statements"—Note 4—"Acquisition and Subsequent Discontinued Operations").
Income taxes. For the year ended December 31, 2006 and 2007, we incurred net operating losses, and consequently paid insignificant amounts of federal, state and foreign income taxes. As of December 31, 2006 and 2007, we had net operating loss carry-forwards of approximately $150.5$145.2 million and $172.5$164.2 million, respectively, which may be used to offset future taxable income. An additional $21.9 million of net operating losses are limited under Internal Revenue Code Section 382 to $799,000 a year. These net operating loss carry-forwards will begin to expire in 2018.
Seasonality
Based upon our historical experience, revenue typically increases during the fourth quarter because of the holiday retail season. The actual quarterly results for each quarter could differ materially depending upon consumer preferences, availability of product and competition, among other risks and uncertainties. Accordingly, there can be no assurances that seasonal variations will not materially affect our results of operations in the future. The following table reflects our total revenues for each of the quarters since 2004 (in thousands):
| | First Quarter
(Restated) | | Second Quarter
(Restated) | | Third Quarter
(Restated) | | Fourth Quarter
(Restated) | |
2007 | | $ | 162,156 | | $ | 149,171 | | $ | 160,059 | | $ | 294,516 | |
2006 | | 179,783 | | 159,717 | | 158,230 | | 282,407 | |
2005 | | 165,028 | | 153,519 | | 166,396 | | 310,033 | |
2004 | | 82,660 | | 86,140 | | 102,659 | | 219,162 | |
| | | | | | | | | | | | | |
38
Table of Contents
Comparison of Years Ended December 31, 2005 and 2006
Revenue
During the year ended December 31, 2005 and 2006, total revenue decreased 2%, from $795.0 million in 2005 to $780.1 million in 2006. During the same period, direct revenue decreased 7%, from $323.1 million in 2005 to $301.5 million in 2006, while fulfillment partner revenue experienced 1% growth, from $471.8 million in 2005 to $478.6 million in 2006.
Our fourth quarter revenue declined 9%, and total revenue was down 2% for the year. We believe that these decreases were primarily the result of our infrastructure upgrades in the last half of 2005, which resulted in an unsatisfactory shopping experience for many of our customers and affected both repeat and new customer sales in 2006. We believe that a key to future revenue growth is to increase our Website conversion rate—defined as the percentage of visitors to the website who make a purchase. The areas of our business that most directly affect conversion rate, including personalization of the website, customer retention, e-mail marketing, and site design and layout, are the responsibility of our internal marketing department. Within each of these areas, we have identified and made progress on initiatives that we believe can improve conversion, including outsourcing to third-party providers certain aspects of the functionality on the website, such as the engine that provides product recommendations to customers visiting product pages and the gift center that went live during the fourth quarter.
Gross Margin
Total Gross Margin—For the years ended December 31, 2005 and 2006, total cost of goods sold increased $11.8 million or 2%, from $678.5 million in 2005 to $690.3 in 2006, resulting in a decrease in gross profit of 23% (from $116.5 million in 2005 to $89.8 million in 2006) during the same periods. As a percent of total revenue, cost of goods sold increased from 85% to 89% for those respective periods, resulting in decreased gross margin of 14.7% and 11.5% for the years ended December 31, 2005 and 2006, respectively. Cost of goods sold also included stock-based compensation related to the adoption of SFAS 123(R) in 2006 of $412,000 during the year ended December 31, 2006 compared to $6,000 of stock-based compensation in 2005.
Generally, our overall gross margins fluctuate based on several factors, including our product mix of sales; sales volumes mix by our direct business and fulfillment partners; changes in vendor pricing; lowering prices for customers, including competitive pricing and inventory management decisions within the direct business; warehouse management costs; customer service costs; and our discounted shipping offers. Discounted shipping offers reduce shipping revenue, and therefore reduce our gross margins on retail sales.
Direct Gross Margin—For the years ended December 31, 2005 and 2006, gross profit for our direct business decreased 61% from $42.5 million in 2005 to $16.7 million in 2006. Gross margin for our direct business decreased from 13.1% to 5.6% for those respective periods. The lower gross margin experienced by the direct business were primarily the result of lowering prices to our customers in an effort to significantly reduce inventory levels, which decreased from $97.7 million at the end of 2005 to $23.9 million at the end of 2006.
Fulfillment Partner Gross Margin—For the years ended December 31, 2005 and 2006, our fulfillment partner business generated gross profit of $74.0 million and $73.1 million, respectively, an decrease of 1%, also resulting in decrease gross margin of 15.7% and 15.3% for those respective periods.
Fulfillment costs
Fulfillment costs include all warehousing costs, including fixed overhead and variable handling costs (excluding packaging costs), as well as credit card fees and customer service costs, all of which we include as costs in calculating gross margins. We believe that some companies in our industry, including some of our competitors, account for fulfillment costs within operating expenses, and therefore exclude fulfillment costs from gross margins. As a result, our gross margins may not be directly comparable to others in our industry.
The following table has been included to provide investors additional information regarding our classification of fulfillment costs and gross margins, thus enabling investors to better compare our gross margins with others in our industry (in thousands):
| | Years ended December 31, | |
| | 2005 (Restated) | | 2006 (Restated) | |
Total revenue | | $ | 794,975 | | 100 | % | $ | 780,137 | | 100 | % |
| | | | | | | | | |
Cost of goods sold | | | | | | | | | |
Product costs and other cost of goods sold | | 618,571 | | 78 | % | 629,477 | | 81 | % |
Fulfillment costs | | 59,931 | | 7 | % | 60,856 | | 8 | % |
| | | | | | | | | |
Total cost of goods sold | | 678,502 | | 85 | % | 690,333 | | 89 | % |
| | | | | | | | | |
Gross profit | | $ | 116,473 | | 15 | % | $ | 89,804 | | 11 | % |
As displayed in the above table, fulfillment costs during the years ended December 31, 2005 and 2006 were $59.9 million and $60.9 million, respectively, or 7.5% and 7.8% of total revenue for those respective periods. Fulfillment costs as a percentage of sales may vary due to several factors, such as our ability to manage costs at our warehouses, significant changes in the number of units received and fulfilled, the extent we utilize third party fulfillment services and warehouses, and our ability to effectively manage customer service costs and credit card fees.
Operating expenses
Sales and marketing. For the years ended December 31, 2005 and 2006, sales and marketing expenses totaled $77.2 million and $70.9 million (8% decrease), respectively. As a percentage of total revenue, sales and marketing expenses decreased slightly from 10% in 2005 to 9% in 2006. We direct customers to our Website primarily through a number of targeted online marketing channels, such as sponsored search, affiliate marketing, portal advertising, e-mail campaigns, and other initiatives. We also utilize channels such as nation-wide television, print and radio advertising campaigns. Our marketing expense is variable and is measured as a percentage of overall sales.
Our intent in 2006 was to keep marketing expense as a percent of sales at approximately 7%, and we had accomplished this over the first six months of the year.
39
Table of Contents
However, we entered the third quarter with our systems and processes running smoothly, and our customer satisfaction ratings back to where they had been prior to the system issues we experienced at the end of 2005. As a result, we increased both online and offline marketing expenditures in the last half of 2006 in an effort to create sales momentum in Q4 2006 and into 2007. However, we did not see a corresponding increase in sales, primarily as a result of visitor conversion rates, and marketing expense was 10% of sales in the fourth quarter, bringing it to 9% of sales for the year.
We believe that our marketing expenditures were less efficient due to overall increases in online marketing rates, as well as the expiration of marketing agreements that we had with several large portals, including MSN, Yahoo and AOL, which are either no longer available or were too expensive for us to justify. In an effort to offset this, we internally developed a search engine optimization tool that we believed would help us manage keyword purchases more efficiently and is intended to help improve conversion rates and our overall marketing efficiency.
While costs associated with our discounted shipping promotions are not included in marketing expense (they are accounted for as a reduction of revenue), we consider discounted shipping promotions as an effective marketing tool, and intend to continue to offer them as we deem appropriate.
Sales and marketing expenses also included stock-based compensation related to the adoption of SFAS 123(R) in 2006 of $301,000 during the year ended December 31, 2006 compared to $4,000 of stock-based compensation in 2005.
Technology expenses. Technology expenses increased 134%, from $27.9 million for the year ended December 31, 2005 to $65.2 million for the same period in 2006, representing 3% and 8% of total revenue for those respective periods. Technology expenses also included stock-based compensation related to the adoption of SFAS 123(R) in 2006 of $684,000 during the year ended December 31, 2006, compared to $11,000 of stock-based compensation in 2005.
We incurred a “stair-step” increase in technology costs over these two years, as we had made significant investments in all of our major systems, with approximately $60 million of capital expenditures in 2005 and an additional $26 million in 2006 (including increases to capital leases). The increases in expense are related primarily to increased depreciation expense, as well as increases in maintenance and support costs, and increased IT personnel, including consultants. These increased expenses resulted in a significant increase in technology expenses as a percent of sales for the full-year 2006.
General and administrative expenses. General and administrative (“G&A”) expenses increased 42%, from $33.0 million during the year ended December 31, 2005 to $46.8 million during the same period in 2006, representing 4% and 6% of total revenue for each of the respective periods. We incurred stock-based compensation within general and administrative expenses of approximately $2.7 million for the year ended December 31, 2006 compared to $51,000 in stock-based compensation in 2005.
The increase in G&A expenses in 2006 compared to 2005 related to increases in payroll-related expenses, professional fees, merchandising, legal and finance costs, and also due to increased costs related to our relocation of our corporate offices to larger facilities in the third quarter of 2005.
A large portion of our technology and general and administrative expenses are now non-cash expenses. Total depreciation and amortization (including amortization of stock- based compensation) in 2006 was $36 million. This compared to only $14 million of similar non-cash expenses in 2005.
Restructuring expenses. During the fourth quarter of 2006, in an effort to improve future operating performance, we commenced implementation of a facilities consolidation and restructuring program designed to reduce our overall expense structure (see Item 15 of Part IV, “Financial Statements (Restated)”—Note 4—“Restructuring Expense”). The planned actions included the termination of a co-location data center lease, marketing of the current office facilities for sub-lease, and marketing non-core businesses for sale. We recorded $5.7 million of restructuring charges in 2006, of which $4.6 million related to costs to terminate a co-location data center lease. Other costs included in the restructuring charge related to $638,000 of accelerated amortization of leasehold improvements in our current office facilities that we are attempting to sublease, and $450,000 of costs to return these office facilities to their original condition as required by the lease agreement.
Non-operating income (expense)
Interest income, interest expense and other income (expense). Interest income is derived from the investment of our excess cash in short-term investments and marketable securities. In 2005, we incurred a large expense related to the valuation of the conditional coupon of our foreign bonds. Consequentially, interest income increased from $161,000 negative interest income related to a decrease in the valuation of the conditional coupon of our foreign bonds in 2005, to a positive $3.6 million of interest income for the year ended December 31, 2006, including a $1.9 million gain recognized in 2006 as a result of selling the foreign bonds.
Interest expense is largely related to our convertible notes, capital leases and our credit lines. Interest expense decreased slightly from $5.6 million during the year ended December 31, 2005 to $4.8 million during the same period in 2006. The decrease in interest expense was related to the reduction of convertible notes outstanding related to the retirement of $43.0 million of Senior Notes in June and November of 2005 (see Item 15 of Part IV, “Financial Statements (Restated)”—Note 12—“3.75% Convertible Senior Notes”).
Under SFAS No. 133, Accounting for Derivative Instruments and Hedging Activities, the Foreign Notes were considered to be derivative financial instruments and were marked to market quarterly. Any unrealized gain or loss related to the changes in value of the conditional coupon was recorded in the income statement as a component of interest income or expense. Any unrealized gain or loss related to the changes in the value of the Notes was recorded as a component of other comprehensive income (loss). On April 26, 2006, we sold the Foreign Notes for $49.5 million, resulting in the gain on the bond instrument of $1.9 million (see Item 15 of Part IV, “Financial Statements (Restated)”—Note 6—“Marketable Securities”).
Other income for the year ended December 31, 2005 related primarily to the retirement of $43.0 million of Senior Notes for $35.7 million, which resulted in a recognized gain of $6.2 million.
Discontinued operations
As part of the program to reduce our expense structure and sell non-core businesses, we decided during the fourth quarter of 2006 to sell our travel subsidiary (“OTravel”). As a result, OTravel’s operations have been classified as a discontinued operation and therefore were not included in the results of continuing operations. The loss from discontinued operations for OTravel was $6.9 million for the year ended December 31, 2006, including a goodwill impairment charge of $4.5 million.
Income taxes
Income taxes. For the year ended December 31, 2005 and 2006, we incurred net operating losses, and consequently paid insignificant amounts of federal, state and foreign income taxes. As of December 31, 2005 and 2006, we had net operating loss carry-forwards of approximately $58.2 million and $150.5 million, respectively, which may be used to offset future taxable income. An additional $21.9 million of net operating losses are limited under Internal Revenue Code Section 382 to $799,000 a year. These net operating loss carry-forwards will begin to expire in 2018.
Supplemental Information about Stock-Based Compensation
Periods prior to the adoption of SFAS 123(R)
Prior to January 1, 2006, the Company accounted for stock-based awards under the intrinsic value method, which followed the recognition and measurement
40
Table of Contents
principles of APB Opinion No. 25, Accounting for Stock Issued to Employee, and related interpretations. The intrinsic value method of accounting resulted in compensation expense for stock options to the extent option exercise prices were set below market prices on the date of grant. Also, to the extent stock awards were forfeited prior to vesting, any previously recognized expense was reversed as an offset to operating expenses in the period of forfeiture.
The following table (in thousands, except per share data) illustrates the effects on net loss and net loss per share as if the Company had applied the fair value recognition provisions of SFAS 123, Accounting for Stock Based Compensation, as amended by SFAS No. 148, Accounting for Stock-Based Compensation—Transition and Disclosure to options granted under the Company’s stock-based compensation plans prior to the adoption. For purposes of this pro forma disclosure, the value of the options was estimated using the Black-Scholes-Merton (“BSM”) option-pricing formula and amortized on a straight-line basis over the respective vesting periods of the awards. Disclosure for the years ended December 31, 2006 and 2007 are not presented because stock-based payments were accounted for under SFAS 123 (R)’s fair value method during these periods.
| | Year ended December 31,
2005
(Restated) | |
Net loss, as reported | | $ | (25,212 | ) |
Add: Stock-based employee compensation, as reported | | 72 | |
Deduct: Total stock-based employee compensation expense determined under fair value based method for all awards | | (3,996 | ) |
| | | |
Pro forma net loss | | $ | (29,136 | ) |
| | | |
Net loss per common share | | | |
Basic and diluted—as reported | | $ | (1.30 | ) |
Basic and diluted—pro forma | | $ | (1.50 | ) |
Adoption of SFAS 123(R)
As of January 1, 2006, the Company adopted SFAS No. 123(R) using the modified prospective method, which requires measurement of compensation cost for all stock-based awards at fair value on date of grant and recognition of compensation over the service period for awards expected to vest. The fair value of stock options is determined using the BSM valuation model, which is consistent with our valuation techniques previously utilized for options in footnote disclosures required under SFAS No. 123. Such value is recognized as expense over the service period, net of estimated forfeitures, using the straight-line method under SFAS 123(R).
The adoption of SFAS 123(R) did not result in a cumulative benefit from accounting change, which reflects the net cumulative impact of estimating future forfeitures in the determination of period expense, rather than recording forfeitures when they occur as previously permitted, as we did not have unvested employee stock awards for which compensation expense was recognized prior to adoption of SFAS No. 123(R).
Prior to the adoption of SFAS 123(R), cash retained as a result of tax deductions relating to stock-based compensation was presented in operating cash flows, along with other tax cash flows, in accordance with the provisions of the Emerging Issues Task Force (“EITF”) Issue No. 00-15, Classification in the Statement of Cash Flows of the Income Tax Benefit Received by a Company upon Exercise of a Nonqualified Employee Stock Option (“EITF 00-15”). SFAS 123(R) supersedes EITF 00-15, amends SFAS 95, Statement of Cash Flows, and requires tax benefits relating to excess stock-based compensation deductions to be prospectively presented in the statement of cash flows as financing cash inflows. As of the adoption of SFAS 123(R), we had fully reserved against any tax benefits resulting from stock-based compensation deductions in excess of amounts reported for financial reporting purposes.
On March 29, 2005, the SEC published SAB 107, which provides the Staff’s views on a variety of matters relating to stock-based payments. SAB 107 requires stock-based compensation be classified in the same expense line items as cash compensation. The Company has reclassified stock-based compensation from prior periods to correspond to current period presentation within the same operating expense line items as cash compensation paid to employees.
The application of SFAS 123(R) had the following effect on the year ended December 31, 2006 reported amounts relative to amounts that would have been reported using the intrinsic value method under previous accounting (in thousands, except per share amounts):
SFAS 123(R) Adjustments | | Year ended
December 31, 2006 (Restated) | |
Operating loss | | $ | (4,120 | ) |
Net loss | | $ | (4,120 | ) |
Net loss per common share—basic and diluted | | $ | (0.20 | ) |
Quarterly Results of Operations
The following tables set forth our restated unaudited quarterly results of operations for the eight most recent quarters for the period ended December 31, 2007, as well as such data expressed as a percentage of our total revenue for the periods presented. These amounts have been restated for errors described in Note 3 of the financial statements (see Item 15 of Part IV, “Financial Statements (Restated)” – Note 3 – “Restatement of Financial Statements”). See Item 15 of Part IV, “Financial Statements (Restated)” - Note 27 - “Quarterly Results of Operations” for a reconciliation from the previously report amounts. The information in the table below should be read in conjunction with the Consolidated Financial Statements and the Notes thereto included elsewhere in this Form 10-K/A. We have prepared this information on the same basis as the Consolidated Financial Statements and the information includes all adjustments, consisting only of normal recurring adjustments, that we consider necessary for a fair statement of our financial position and operating results for the quarters presented. Our quarterly operating results have varied substantially in the past and may vary substantially in the future. You should not draw any conclusions about our future results from the results of operations for any particular quarter.
41
Table of Contents
| | Three Months Ended | |
| | Mar. 31,
2006 (6)
(Restated) | | June 30,
2006 (6)
(Restated) | | Sept. 30,
2006 (6)
(Restated) | | Dec. 31,
2006 (6)
(Restated) | | Mar. 31,
2007 (6)
(Restated) | | June 30,
2007 (6)
(Restated) | | Sept. 30,
2007 (6)
(Restated) | | Dec. 31,
2007 (6)
(Restated) | |
| | (in thousands, except per share data) | |
Consolidated Statement of Operations Data: | | | | | | | | | | | | | | | | | |
Revenue | | | | | | | | | | | | | | | | | |
Direct revenue | | $ | 80,143 | | $ | 69,363 | | $ | 57,563 | | $ | 94,440 | | $ | 46,990 | | $ | 43,658 | | $ | 39,270 | | $ | 67,170 | |
Fulfillment partner revenue | | 99,640 | | 90,354 | | 100,667 | | 187,967 | | 115,166 | | 105,513 | | 120,789 | | 227,346 | |
| | | | | | | | | | | | | | | | | |
Total revenue | | 179,783 | | 159,717 | | 158,230 | | 282,407 | | 162,156 | | 149,171 | | 160,059 | | 294,516 | |
| | | | | | | | | | | | | | | | | |
Cost of goods sold | | | | | | | | | | | | | | | | | |
Direct | | 71,831 | | 62,178 | | 52,073 | | 98,692 | | 41,469 | | 36,456 | | 33,268 | | 56,815 | |
Fulfillment partner | | 85,013 | | 76,037 | | 84,565 | | 159,944 | | 96,077 | | 86,523 | | 99,425 | | 191,319 | |
| | | | | | | | | | | | | | | | | |
Total cost of goods sold | | 156,844 | | 138,215 | | 136,638 | | 258,636 | | 137,546 | | 122,979 | | 132,693 | | 248,134 | |
| | | | | | | | | | | | | | | | | |
Gross profit | | 22,939 | | 21,502 | | 21,592 | | 23,771 | | 24,610 | | 26,192 | | 27,366 | | 46,382 | |
| | | | | | | | | | | | | | | | | |
Operating expenses: | | | | | | | | | | | | | | | | | |
Sales and marketing | | 12,659 | | 11,911 | | 17,282 | | 29,045 | | 11,284 | | 7,962 | | 8,835 | | 27,377 | |
Technology | | 13,424 | | 14,897 | | 16,157 | | 20,680 | | 14,973 | | 15,237 | | 14,576 | | 14,667 | |
General and administrative | | 11,850 | | 11,050 | | 11,078 | | 12,859 | | 10,689 | | 10,429 | | 9,724 | | 11,134 | |
Restructuring | | — | | — | | — | | 5,674 | | 6,089 | | 6,194 | | — | | — | |
| | | | | | | | | | | | | | | | | |
Total operating expenses | | 37,933 | | 37,858 | | 44,517 | | 68,258 | | 43,035 | | 39,822 | | 33,135 | | 53,178 | |
| | | | | | | | | | | | | | | | | |
Operating loss | | (14,994 | ) | (16,356 | ) | (22,925 | ) | (44,487 | ) | (18,425 | ) | (13,630 | ) | (5,769 | ) | (6,796 | ) |
Interest income, net | | 315 | | 2,215 | | 459 | | 577 | | 990 | | 1,078 | | 1,291 | | 1,429 | |
Interest expense | | (1,267 | ) | (1,275 | ) | (1,096 | ) | (1,127 | ) | (1,029 | ) | (1,027 | ) | (1,029 | ) | (1,103 | ) |
Other income (expense), net | | — | | (1 | ) | (6 | ) | 88 | | — | | — | | (92 | ) | — | |
| | | | | | | | | | | | | | | | | |
Loss from continuing operations | | (15,946 | ) | (15,417 | ) | (23,568 | ) | (44,949 | ) | (18,464 | ) | (13,579 | ) | (5,599 | ) | (6,470 | ) |
Discontinued operations: | | | | | | | | | | | | | | | | | |
Loss from discontinued operations | | (779 | ) | (1,128 | ) | (708 | ) | (4,267 | ) | (3,624 | ) | (300 | ) | — | | — | |
| | | | | | | | | | | | | | | | | |
Net loss | | (16,725 | ) | (16,545 | ) | (24,276 | ) | (49,216 | ) | (22,088 | ) | (13,879 | ) | (5,599 | ) | (6,470 | ) |
Deemed dividend related to redeemable common stock | | (33 | ) | (33 | ) | (33 | ) | — | | — | | — | | — | | — | |
| | | | | | | | | | | | | | | | | |
Net loss attributable to common shares | | $ | (16,758 | ) | $ | (16,578 | ) | $ | (24,309 | ) | $ | (49,216 | ) | $ | (22,088 | ) | $ | (13,879 | ) | $ | (5,599 | ) | $ | (6.470 | ) |
| | | | | | | | | | | | | | | | | |
Net loss per common share—basic and diluted | | | | | | | | | | | | | | | | | |
| | | | | | | | | | | | | | | | | |
Loss from continuing operations | | $ | (0.82 | ) | $ | (0.76 | ) | $ | (1.15 | ) | $ | (2.12 | ) | $ | (0.78 | ) | $ | (0.57 | ) | $ | (0.23 | ) | $ | (0.27 | ) |
| | | | | | | | | | | | | | | | | | | | | | | | | |
Loss from discontinued operations | | $ | (0.04 | ) | $ | (0.06 | ) | $ | (0.03 | ) | $ | (0.20 | ) | $ | (0.15 | ) | $ | (0.01 | ) | $ | — | | $ | — | |
| | | | | | | | | | | | | | | | | | | | | | | | | |
Net loss per share—basic and diluted | | $ | (0.86 | ) | $ | (0.82 | ) | $ | (1.18 | ) | $ | (2.32 | ) | $ | (0.93 | ) | $ | (0.58 | ) | $ | (0.23 | ) | $ | (0.27 | ) |
Weighted average common shares outstanding—basic and diluted | | 19,385 | | 20,159 | | 20,600 | | 21,163 | | 23,594 | | 23,689 | | 23,726 | | 23,807 | |
42
Table of Contents
| | Three Months Ended | |
| | Mar. 31, 2006 | | June 30, 2006 | | Sept. 30, 2006 | | Dec. 31, 2006 | | Mar. 31, 2007 | | June 30, 2007 | | Sept. 30, 2007 | | Dec. 31, 2007 | |
| | (Restated) | | (Restated) | | (Restated) | | (Restated) | | (Restated) | | (Restated) | | (Restated) | | (Restated) | |
Additional Operating Data(1): | | | | | | | | | | | | | | | | | |
Gross bookings (in thousands)(2) | | $ | 200,900 | | $ | 172,091 | | $ | 170,590 | | $ | 319,621 | | $ | 170,362 | | $ | 165,683 | | $ | 177,226 | | $ | 336,942 | |
Number of orders(3) | | 1,856,000 | | 1,568,000 | | 1,529,000 | | 3,061,000 | | 1,481,000 | | 1,288,000 | | 1,457,000 | | 2,973,000 | |
| | | | | | | | | | | | | | | | | |
Number of new B2C customers(4) | | 638,000 | | 520,000 | | 540,000 | | 1,157,000 | | 473,000 | | 394,000 | | 486,000 | | 1,104,000 | |
| | | | | | | | | | | | | | | | | |
Average customer acquisition cost(5) | | $ | 19.49 | | $ | 22.98 | | $ | 31.22 | | $ | 25.56 | | $ | 24.58 | | $ | 20.20 | | $ | 18.17 | | $ | 24.98 | |
(1)
| The additional operating data sets forth certain operating data relating to our business for the eight most recent quarters for the period ended December 31, 2007. While we believe that the information in the table above facilitates an understanding of our business and results of operations for the periods presented, such information is not in accordance with generally accepted accounting principles and should be read in conjunction with the quarterly results of operations data set forth above.
|
| |
(2)
| Gross bookings exclude bookings related to the auctions and cars businesses (shopping business only). We believe that gross bookings is a metric widely used in our industry and by making this metric available to investors, we believe investors are able to compare our performance against others in our industry.
|
| |
(3)
| Number of orders represents the number of individual orders for merchandise through our Website excluding B2B orders.
|
| |
(4)
| Number of new B2C customers represents the number of valid new customer accounts. To establish a valid customer account, a person must provide us with the following information and purchase merchandise on our B2C Website: a unique e-mail address; a unique password; and a verified credit card account number.
|
| |
(5)
| Average customer acquisition cost represents total shopping sales and marketing expense divided by the number of new shopping customers for the period presented (excluding both new customers and marketing costs for the auctions business). We believe that investors may use the average customer acquisition cost metric to determine how efficiently we are able to acquire new customers.
|
| |
(6)
| A more complete discussion of the restatement can be found in Note 3 to the consolidated financial statements contained in Part IV, Item 15 of this Amendment and Item 4.02(a) of the Company’s Current Report on Form 8-K filed with the Commission on October 24, 2008.
|
43
Table of Contents
| | Three Months Ended | |
| | Mar. 31,
2006
(Restated) | | June 30,
2006
(Restated) | | Sept. 30,
2006
(Restated) | | Dec. 31,
2006
(Restated) | | Mar. 31,
2007
(Restated) | | June 30,
2007
(Restated) | | Sept. 30,
2007
(Restated) | | Dec. 31,
2007
(Restated) | |
| | (as a percentage of total revenue) | |
Revenue | | | | | | | | | | | | | | | | | |
Direct revenue | | 44.6 | % | 43.4 | % | 36.4 | % | 33.4 | % | 29.0 | % | 29.3 | % | 24.5 | % | 22.8 | % |
Fulfillment partner revenue | | 55.4 | | 56.6 | | 63.6 | | 66.6 | | 71.0 | | 70.7 | | 75.5 | | 77.2 | |
| | | | | | | | | | | | | | | | | |
Total revenue | | 100.0 | | 100.0 | | 100.0 | | 100.00 | | 100.00 | | 100.0 | | 100.0 | | 100.0 | |
| | | | | | | | | | | | | | | | | |
Cost of goods sold | | | | | | | | | | | | | | | | | |
Direct | | 40.0 | | 38.9 | | 32.9 | | 34.9 | | 25.6 | | 24.4 | | 20.8 | | 19.3 | |
Fulfillment partner | | 47.3 | | 47.6 | | 53.4 | | 56.6 | | 59.2 | | 58.0 | | 62.1 | | 65.0 | |
| | | | | | | | | | | | | | | | | |
Total cost of goods sold | | 87.2 | | 86.5 | | 86.4 | | 91.6 | | 84.8 | | 82.4 | | 82.9 | | 84.3 | |
| | | | | | | | | | | | | | | | | |
Gross profit | | 12.8 | | 13.5 | | 13.6 | | 8.4 | | 15.2 | | 17.6 | | 17.1 | | 15.7 | |
| | | | | | | | | | | | | | | | | |
Operating expenses: | | | | | | | | | | | | | | | | | |
Sales and marketing | | 7.0 | | 7.5 | | 10.9 | | 10.3 | | 7.0 | | 5.3 | | 5.5 | | 9.3 | |
Technology | | 7.5 | | 9.3 | | 10.2 | | 7.3 | | 9.2 | | 10.2 | | 9.1 | | 5.0 | |
General and administrative | | 6.6 | | 6.9 | | 7.0 | | 4.6 | | 6.6 | | 7.0 | | 6.1 | | 3.8 | |
Restructuring | | — | | — | | — | | 2.0 | | 3.7 | | 4.2 | | — | | — | |
| | | | | | | | | | | | | | | | | |
Total operating expenses | | 21.1 | | 23.7 | | 28.1 | | 24.2 | | 26.5 | | 26.7 | | 20.7 | | 18.1 | |
| | | | | | | | | | | | | | | | | |
Operating loss | | (8.3 | ) | (10.2 | ) | (14.5 | ) | (15.8 | ) | (11.4 | ) | (9.1 | ) | (3.6 | ) | (2.3 | ) |
Interest income | | 0.2 | | 1.4 | | 0.3 | | 0.2 | | 0.6 | | 0.7 | | 0.8 | | 0.5 | |
Interest expense | | (0.7 | ) | (0.8 | ) | (0.7 | ) | (0.4 | ) | (0.6 | ) | (0.7 | ) | (0.6 | ) | (0.4 | ) |
Other income (expense), net | | — | | — | | — | | — | | — | | — | | (0.1 | ) | — | |
| | | | | | | | | | | | | | | | | |
Loss from continuing operations | | (8.9 | )% | (9.7 | )% | (14.9 | )% | (15.9 | )% | (11.4 | )% | (9.1 | )% | (3.5 | )% | (2.2 | )% |
Total operating expenses gradually increased as a percentage of total revenue each quarter during 2006 primarily as a result of increases in marketing costs and our investment in an improved technology infrastructure. During 2007, total operating expenses as a percentage of total revenue decreased each quarter primarily due to restructuring charges during the first two quarters of 2007, decreases in marketing costs during the first three quarters and the significant drop in technology costs in the fourth quarter.
Due to the foregoing factors, in one or more future quarters our operating results may fall below the expectations of securities analysts and investors. In such an event, the trading price of our common stock would likely be materially adversely affected.
Off-Balance Sheet Arrangements
We do not have any off-balance sheet arrangements that have or are reasonably likely to have a current or future effect on the Company’s financial condition, changes in financial condition, revenues or expenses, results of operations, liquidity, capital expenditures or capital resources that would be material to investors.
Liquidity and Capital Resources
Prior to the second quarter of 2002, we financed our activities primarily through a series of private sales of equity securities, warrants to purchase our common stock and promissory notes. During the second quarter of 2002, we completed our initial public offering pursuant to which we received approximately $26.1 million in cash, net of underwriting discounts, commissions, and other related expenses. Additionally, we completed follow-on offerings in February 2003, May 2004 and November 2004, pursuant to which we received approximately $24.0 million, $37.9 million and $75.2 million, respectively, in cash, net of underwriting discounts, commissions, and other related expenses. In November 2004, we also received $116.2 million in proceeds from the issuance of our convertible senior notes in a transaction event exempt from registration under the Securities Act. During 2006, we received $64.4 million from two stock offerings in May and December. At December 31, 2007, our cash and cash equivalents balance was $101.4 million and we had $46.0 million in marketable securities, for a total
Current sources of $147.4 million of cash, cash equivalents and marketable securities.
For the years ended December 31, 2006 and 2007, our operating activities resulted in net cash outflows of $26.3 million and net cash inflows of $10.0 million, respectively. We have payment terms with our fulfillment partners that extend beyond the amount of time necessary to collect proceeds from our customers. As a result, following our seasonally strong fourth quarter sales, at December 31 of each year, our cash, cash equivalents, marketable securities and accounts payable balances typically reach their highest level (other than as a result of cash flows provided by or used in investing and financing activities). However, our accounts payable balance normally declines during the first three months following year-end, which normally results in a decline in our cash, cash equivalents, and marketable securities balances from the year-end balance. The seasonality of our business causes payables and accruals to grow significantly in the fourth quarter, and then decrease in the first quarter when they are paid.
The primary operating use of cash and cash equivalents during the year ended December 31, 2007 was to fund our net losses of $48.0 million (which includes $50.4 million of loss from discontinued operations and other net non-cash activity), as well as changes in inventories, prepaid inventory, prepaid expenses, accrued liabilities, deferred revenue and other long-term liabilities of $1.8 million, $1.3 million, $99,000, $5.9 million, $255,000 and $193,000, respectively. This was offset by the cash provided from changes in accounts receivable, other long-term assets and accounts payable of $4.8 million, $471,000 and $11.8 million, respectively. For the year ended December 31, 2006, the primary use of cash and cash equivalents was to fund our operations, including net losses of $106.8 million (which includes $43.3 million of loss from discontinued operations and other net non-cash activity), as well as changes in accounts receivables, accounts payables and accrued liabilities
44
Table of Contentsliquidity
of $1.5 million, $35.4 million and $11.6 million, respectively. This was offset by the cash provided from changes in inventory, prepaid inventory, prepaid expenses, other long-term assets and deferred revenue of $67.9 million, $7.4 million, $1.0 million, $496,000 and $3.4 million, respectively.
Investing activities resulted in cash inflows of $33.4 million and cash outflows of $33.5 million for the years ended December 31, 2006 and 2007, respectively. The $33.5 million used in investing activities during fiscal 2007 resulted from the net cash outflows from purchases and sales of marketable securities of $46.0 million and expenditures of property and equipment of $2.6 million, offset by payments received from a note receivable of $5.2 million and the net proceeds from the sale of OTravel of $9.9 million. The cash inflows of $33.4 million from investing activities in 2006 resulted from the sale of marketable securities of $56.8 million, including the sale of our foreign notes of $49.5 million in April 2006, offset by expenditures for property and equipment of $23.4 million. During 2006 we planned to reduce capital expenditures to $10.0 million or less in 2007. We actually spent $2.6 million in capital expenditures. During 2008, we plan capital expenditures of $15.0 million.
Financing activities resulted in cash inflows of $64.0 million and cash outflows of $2.0 million for the years ended December 31, 2006 and 2007, respectively. The net cash used in financing activities in 2007 was primarily due to payments for capital leases of $5.3 million offset by $3.2 million received from the exercise of stock options. The cash inflows of $64.0 million in 2006 primarily are the result of $64.4 million received from the sale of our common stock and $2.5 million received from the exercise of employee stock options, offset by payments on capital lease obligations of $3.0 million.
While we believe that the cash and marketable securities currently on hand, amounts available under our credit facility and expected cash flows from future operations will be sufficient to continue operations for at least the next twelve months, we may require additional financing. However, there can be no assurance that if additional financing is necessary it will be available, or, if available, that such financing can be obtained on satisfactory terms. Failure to generate sufficient revenues, profits or to raise additional capital could have a material adverse effect on our ability to continue as a going concern and to achieve our intended business objectives. Any projections of future cash needs and cash flows are subject to substantial uncertainty.
Our principal sources of liquidity are cash flows generated from operations and our existing cash, cash equivalents, and sale or maturity of marketable securities. At December 31, 2008, our cash and cash equivalents balance was $100.6 million and we had $9.0 million in marketable securities, for a total of $109.6 million of cash, cash equivalents and marketable securities.
Cash flow information is as follows:
| | | | | | | | | | | |
| | Year Ended December 31, | |
|---|
| | 2006 | | 2007 | | 2008 | |
|---|
| | (in thousands)
| |
|---|
Cash provided by (used in): | | | | | | | | | | |
| | Operating activities | | $ | (26,293 | ) | $ | 9,977 | | $ | 1,960 | |
| | Investing activities | | | 33,367 | | | (33,514 | ) | | 19,550 | |
| | Financing activities | | | 63,983 | | | (2,031 | ) | | (22,327 | ) |
Free Cash Flow. "Free Cash Flow" (a non-GAAP measure) for the years ended December 31, 2007 and 2008, was $7.3 million and $(16.7) million. See "Non-GAAP Financial Measures" below for a reconciliation of Free Cash Flow to net cash provided by operating activities.
Cash provided by (used in) operating activities. For the years ended December 31, 2007 and 2008, our operating activities resulted in net cash inflows of $10.0 million and net cash inflows of $2.0 million, respectively.
Cash received from customers generally corresponds to our net sales as our customers primarily use credit cards to buy from us causing our receivables from these sales transactions to settle quickly. We have payment terms with our fulfillment partners that generally extend beyond the amount of time necessary to collect proceeds from our customers. As a result, following our seasonally strong fourth quarter sales, at December 31 of each year, our cash, cash equivalents, marketable securities and accounts payable balances typically reach their highest level (other than as a result of cash flows
Table of Contents
provided by or used in investing and financing activities). However, our accounts payable balance normally declines during the first three months following year-end, which normally results in a decline in our cash, cash equivalents, and marketable securities balances from the year-end balance. The seasonality of our business causes payables and accruals to grow significantly in the fourth quarter, and then decrease in the first quarter when they are paid.
The primary operating use of cash and cash equivalents during the year ended December 31, 2008 was to fund our net losses of $12.7 million (which includes $27.3 million of net non-cash activity, including $3.9 million related to the loss on settlement of notes receivable (see Item 15 of Part IV, "Financial Statements"—Note 4—"Acquisition and Subsequent Discontinued Operations") and $2.8 million related to the gain from early extinguishment of debt (see Item 15 of Part IV, "Financial Statements"—Note 17—"Stock and Debt Repurchase Program"), as well as changes in prepaid expenses, other long term assets, accounts payable, accrued liabilities, deferred revenue and other long-term liabilities of $2.1 million, $516,000, $8.2 million, $12.3 million, $3.9 million and $462,000, respectively. This was offset by the cash provided from changes in accounts receivable, inventories, net, and prepaid inventory of $4.8 million, $7.9 million and $2.2 million, respectively.
In late December 2008, our credit card processor began withholding approximately 1% of our daily credit card remittances as a reserve. They have indicated that they expect to continue such withholding until the reserve reaches a total of $3.5 million. The reserve was $125,000 at December 31, 2008 and is included in Accounts Receivable in the Consolidated Balance Sheets.
The primary operating use of cash and cash equivalents during the year ended December 31, 2007 was to fund our net losses of $48.0 million (which includes $50.4 million of loss from discontinued operations and other net non-cash activity), as well as changes in inventories, prepaid inventory, prepaid expenses, accrued liabilities, deferred revenue and other long-term liabilities of $1.8 million, $1.3 million, $99,000, $5.9 million, $255,000 and $193,000, respectively. This was offset by the cash provided from changes in accounts receivable, other long-term assets and accounts payable of $4.8 million, $471,000 and $11.8 million, respectively.
Cash provided by (used in) investing activities. Cash provided by (used in) investing activities corresponds with purchases, sales, and maturities of marketable securities, cash purchases of fixed assets, including internal-use software and website development costs. Investing activities resulted in cash outflows of $33.5 million and cash inflows of $19.6 million for the years ended December 31, 2007 and 2008, respectively. The $19.6 million provided by investing activities during fiscal 2008 resulted from the net cash outflows for expenditures of fixed assets of $18.7 million, offset by payments received from purchases, sales and maturities of marketable securities of $36.7 million and a note receivable of $1.5 million related to the sale of the Company's interest in a variable interest entity (see Item 15 of Part IV, "Financial Statements"—Note 25—"Deconsolidation of Variable Interest Entity.")
The $33.5 million used in investing activities during fiscal 2007 resulted from the net cash outflows from purchases, sales and maturities of marketable securities of $46.0 million and expenditures of fixed assets of $2.6 million, offset by payments received from a note receivable of $5.2 million and the net proceeds from the sale of OTravel of $9.9 million.
Cash provided by (used in) financing activities. Financing activities resulted in cash outflows of $2.0 million and cash outflows of $22.3 million for the years ended December 31, 2007 and 2008, respectively. The net cash used in financing activities in 2008 was primarily due to payments for capital leases, paydown of long term debt, and treasury stock purchases of $3.8 million, $6.6 million, and $13.4 million, respectively (see Item 15 of Part IV, "Financial Statements"—Note 17—"Stock and Debt Repurchase Program."), offset by $1.5 million received from the exercise of stock options. The net cash used in financing activities in 2007 was primarily due to payments for capital leases of $5.3 million offset by $3.2 million received from the exercise of stock options.
Table of Contents
On January 14, 2008, our Board of Directors authorized a repurchase program that allowed us to purchase up to $20.0 million of our common stock and / or our 3.75% Senior Convertible Notes due 2011 ("Senior Notes") through December 31, 2009. Under this repurchase program, we repurchased approximately 1.2 million shares of our common stock in open market purchases for $13.4 million during the year ended December 31, 2008.
In addition, during the third quarter of 2008, we retired $9.5 million of the Senior Notes for $6.6 million in cash. As a result of the Senior Notes retirements, we recognized a gain of $2.8 million, net of the associated unamortized discount of $142,000. As of December 31, 2008, $67.5 million of Senior Notes remain outstanding. We had fully utilized the authorized $20.0 million repurchase program as of December 31, 2008.
On February 17, 2009, our Board of Directors approved a debt repurchase program that authorizes us to utilize up to $20.0 million to repurchase a portion of our 3.75% Senior Notes. Under this repurchase program, we have retired $4.9 million of the Senior Notes for $3.0 million in cash. As a result of the Senior Notes retirements, we expect to recognize a gain of $1.9 million, net of the associated unamortized discount of $63,000 (see Item 15 of Part IV, "Financial Statements"—Note 17—"Stock and Debt Repurchase Program").
In April 2005, we filed a registration statement with the Securities and Exchange Commission using a "shelf" registration or continuous offering process. On May 1, 2006, we issued approximately 1,042,000 shares of common stock for net proceeds of approximately $25.0 million. Additionally, on December 12, 2006, we issued approximately 2,734,000 shares for net proceeds of approximately $39.4 million. We did not issue any shares of common stock under the shelf registration statement during fiscal years 2007 and 2008. During 2008 we filed a new shelf registration statement with the Securities and Exchange Commission, which was declared effective on December 5, 2008. The new shelf registration statement registers offerings of our securities in an aggregate amount of up to $500.0 million.
The following table summarizes our contractual obligations as of December 31, 20072008 and the effect such obligations and commitments are expected to have on our liquidity and cash flow in future periods (in thousands):
| | | | | | | | | | | | | | | | | | | | | | |
| | Payments Due by Period | |
|---|
Contractual Obligations | | 2009 | | 2010 | | 2011 | | 2012 | | 2013 | | Thereafter | | Total | |
|---|
Long-term debt arrangements | | $ | — | | $ | — | | $ | 67,500 | | $ | — | | $ | — | | $ | — | | $ | 67,500 | |
Interest on convertible senior notes | | | 2,530 | | | 2,530 | | | 2,319 | | | — | | | — | | | — | | | 7,379 | |
Operating leases | | | 8,060 | | | 8,652 | | | 8,989 | | | 8,868 | | | 8,325 | | | 15,036 | | | 57,930 | |
Purchase obligations | | | 6,506 | | | 700 | | | 508 | | | — | | | — | | | — | | | 7,714 | |
Total contractual cash obligations | | $ | 17,096 | | $ | 11,882 | | $ | 79,316 | | $ | 8,868 | | $ | 8,325 | | $ | 15,036 | | $ | 140,523 | |
| | | | | | | | | | | | | | | | |
| | Payments Due by Period | |
Contractual Obligations | | 2008 | | 2009 | | 2010 | | 2011 | | 2012 | | Thereafter | | Total | |
Long-term debt arrangements | | $ | — | | $ | — | | $ | — | | $ | 77,000 | | $ | — | | $ | — | | $ | 77,000 | |
Interest on convertible senior notes | | 2,888 | | 2,888 | | 2,888 | | 2,647 | | — | | — | | 11,311 | |
Capital lease obligations | | 4,086 | | — | | — | | — | | — | | — | | 4,086 | |
Operating leases | | 7,647 | | 6,238 | | 5,987 | | 5,803 | | 5,526 | | 11,196 | | 42,397 | |
Purchase obligations | | 12,699 | | — | | — | | — | | — | | — | | 12,699 | |
Line of credit | | — | | — | | — | | — | | — | | — | | — | |
| | | | | | | | | | | | | | | |
Total contractual cash obligations | | $ | 27,320 | | $ | 9,126 | | $ | 8,875 | | $ | 85,450 | | $ | 5,526 | | $ | 11,196 | | $ | 147,493 | |
| | | | | | | | | | | | | | | | | | | | | | |
| | Amounts of Commitment Expiration Per Period | |
|---|
Other Commercial Commitments | | 2008 | | 2009 | | 2010 | | 2011 | | 2012 | | Thereafter | | Total | |
|---|
Letters of credit | | $ | 2,200 | | $ | — | | $ | — | | $ | — | | $ | — | | $ | — | | $ | 2,200 | |
| | | | | | | | | | | | | | | | |
Total commercial commitments | | $ | 2,200 | | $ | — | | $ | — | | $ | — | | $ | — | | $ | — | | $ | 2,200 | |
| | | | | | | | | | | | | | | | |
| | Amounts of Commitment Expiration Per Period | |
Other Commercial Commitments | | 2008 | | 2009 | | 2010 | | 2011 | | 2012 | | Thereafter | | Total | |
Letters of credit | | $ | 2,805 | | $ | — | | $ | — | | $ | — | | $ | — | | $ | — | | $ | 2,805 | |
| | | | | | | | | | | | | | | |
Total commercial commitments | | $ | 2,805 | | $ | — | | $ | — | | $ | — | | $ | — | | $ | — | | $ | 2,805 | |
Table of Contents
Purchase Obligations.3.75% Convertible Senior Notes The amount of purchase obligations shown above is based on assumptions regarding the legal enforceability against us of purchase orders we had outstanding at December 31, 2008. Under different assumptions regarding our rights to cancel our purchase orders or different assumptions regarding the enforceability of the purchase orders under applicable law, the amount of purchase obligations shown in the table above would be less.
Long-Term Debt Arrangements and Interest. In November 2004, we completed an offering of $120.0 million of 3.75% Convertible Senior Notes (the “Senior Notes”"Senior Notes"). Proceeds to us were $116.2 million, net of $3.8 million of initial purchaser's discount and debt issuance costs. The discount and debt issuance costs are being amortized using the straight-line method which approximates the interest method. We recorded amortization of discount and debt issuance costs related to this offering totaling $620,000, $417,000 and $344,000 during the years ended December 31, 2006, 2007 and 2008, respectively. Interest on the Senior Notes is payable semi-annually on June 1 and December 1 of each year. The Senior Notes mature on December 1, 2011 and are unsecured and rank equally in right of payment with all existing and future unsecured, unsubordinated debt and senior in right of payment to any existing and future subordinated indebtedness.
The Senior Notes are convertible at any time prior to maturity into our common stock at the option of the note holders at a conversion price of $76.23 per share or, approximately 885,000 shares in aggregate (subject to adjustment in certain events, including stock splits, dividends and other distributions and certain repurchases of our stock, as well as certain fundamental changes in our ownership)the ownership of us).
Beginning December 1, 2009, we have the right to redeem the Senior Notes, in whole or in part, for cash at 100% of the principal amount plus accrued and unpaid interest. Upon the occurrence of a fundamental change (including the acquisition of a majority interest in us, certain changes in our board of directors or the termination of trading of our stock) meeting certain conditions, holders of the Senior Notes may require us to repurchase for cash all or part of their notes at 100% of the principal amount plus accrued and unpaid interest.
The indenture governing the Senior Notes requires us to comply with certain affirmative covenants, including making principal and interest payments when due, maintaining our corporate existence and properties, and paying taxes and other claims in a timely manner. We were in compliance with these covenants at December 31, 2007.
In 2005,Wilmington Trust Company currently serves as Trustee under the Share Repurchase Programindenture.
Under the repurchase program discussed below,above, we retired $43.0$9.5 million of the Senior Notes during the quarter ended September 30, 2008 for $35.7$6.6 million in cash. As a result of the note retirements, we recognizedcash, resulting in a gain of $6.2$2.8 million on early extinguishment of debt, net of the$142,000 of associated unamortized discount of $1.2 million for the year ended December 31, 2005.discount. As of December 31, 2007, $77.02008, $67.5 million of the Senior Notes and unamortized debt discount of $1.4 million remainremained outstanding.
Computer equipment operating leases.
In June 2005 and 2006, we entered into non-cancelable We have two operating leases for certain computer equipment expiringthat expire in April 2008the first and June 2008, respectively.fourth quarters of 2010. It is expected that such leases will be renewed by exercising purchase options or replaced by leases of other computer equipment. The lease obligations also include our obligations for corporate office space, logistics and warehouse space, co-location data center agreement and other operating leases.
Corporate office spacespace.
Through In July 2005, we leased 43,000 square feet of office space at Old Mill Corporate Center I for our principal executive offices under an operating lease which
45
Table of Contents
was originally scheduled to expire in January 2007. Beginning July 2005, this lease was terminated and replaced with a lease for approximately 154,000 rentable square feet in the Old Mill Corporate Center III in Salt Lake City, Utah for a term of ten years. The total lease obligation over the ten-yearremaining term of the newthis lease is $42.4$30.4 million, of which approximately $7.6$4.0 million is payable in the next twelve months.
We entered into a Tenant Improvement Agreement (the “OMIII Agreement”) with Old Mill Corporate Center III, LLC (the “Lessor”) relating to the office building in February 2005. The OMIII Agreement sets forth the terms on which we paid the costs of certain improvements to the leased office space. The amount $8.0 million of the costs was approximately $2.0 million. The OMIII Agreement also required ustotal lease obligation is offset by estimated sublease payments related to provide a letterrestructuring, of creditwhich $1.0 million is anticipated to be received in the amount of $500,000 to the Lessor to provide funds for the removal of certain improvements upon the termination of the lease.
In 2006, we commenced implementation of a facilities consolidation and restructuring program. Under the program, we recorded $638,000 of accelerated amortization of leasehold improvements related to our current office facilities that we are attempting to sublease, and $450,000 of costs incurred to return our office facilities to their original condition as required by the lease agreement.
During fiscal year 2007, we recorded an additional $6.2 million of restructuring costs related to our marketing for sub-lease office and data center space in our current corporate office facilities. We also recorded an additional $2.2 million of restructuring charges related to accelerated amortization of leasehold improvements located in the abandoned office and co-location data center space and $200,000 of other miscellaneous restructuring charges.next twelve months (see Item 15 of Part IV, “Financial Statements (Restated)”"Financial Statements"—Note 4—“3—"Restructuring Expense”Expense").
Logistics and warehouse spacespace.
In July 2004, we entered into a logistics service agreement (the “Logistics Agreement”) wherein the handling, storage and distribution of some of our prepackaged products were performed by a third party. The Logistics Agreement and subsequent amendment set forth terms on which we paid various fixed fees based on We currently lease 795,000 square feet of storage and various variable costs based on product handling costs for a term of five years.
In December 2005, we entered into a warehouse facilities lease agreement (the “License Agreement”) to license approximately 400,000 square feet of warehouse space in Indiana. The License Agreement was subsequently amended, reducing the amount of lease space to approximately 300,000 and extending the term to 2011.
In the first quarter of 2007, we terminated the Logistics Agreement and gave notice of intent to sublease the Indiana warehouse facilities under the License Agreement. During the second quarter of 2007, we reached an agreement to terminate the Indiana warehouse facilities lease effective August 15, 2007. As a result of the termination of the License agreement and warehouse lease, we incurred $3.7 million of related restructuring charges in 2007. (see Item 15 of Part IV, “Financial Statements (Restated)”—Note 4—“Restructuring Expense”).
We lease 561,000 square feet for our warehouse facilities in Utah under operating leases which expire in August 2012. We have also temporarily leased an additional 251,000 square feet2012 and August 2015.
Table of warehouse space in Utah under operating leases for the seasonal increase in inventory during the fourth quarter of 2007.Contents
Co-location data center
In July 2005,On April, 8, 2008, we entered into a Co-location Center Agreementlease agreement with Natomas Meadows, LLC (the “Co-location Agreement”"Natomas Lease") to build out and. The Natomas Lease is for a 686,865 square foot warehouse facility in Salt Lake City, Utah (the "New Warehouse"). The Natomas Lease provides that we will lease 11,289the New Warehouse in stages: on October 15, 2008, we leased the initial 232,900 square feet of the New Warehouse; on February 1, 2009, we leased a total of 435,400 square feet; and, on September 1, 2009, we will lease the remainder, for a total of 686,865 square feet. The Natomas Lease term is seven years, and specifies rent, exclusive of common area maintenance fees, at a variable rate over the course of the staged lease term, ranging from $0.3300 per square foot for the first stage, to $0.3950 per square foot for the last year of the Natomas Lease term. Including the space at Old Mill Corporate Center II for an IT co-locationnow leased in the New Warehouse, we currently have warehouse operations in two facilities in Salt Lake City. The Natomas Lease anticipates that we may construct a corporate office facility within the New Warehouse. We constructed a 40,000 square foot customer service facility in the New Warehouse and commenced use of the facility on November 3, 2008.
Co-location data center. The Co-location Agreement set forth the terms on which the Lessor would incur the costs to build out the IT co-location data center and we would commence to We lease the space upon its completion for a term of ten years. In November 2006 however, we made the determination to consolidate our facilities and to not occupy the IT co-location data center, and the Co-location Agreement was terminated effective December 29, 2006, for which we incurred a $4.6 million restructuring charge (see Item 15 of Part IV, “Financial Statements (Restated)”—Note 4—“Restructuring Expense”).
In December 2006, we entered into a Data Center Agreement (the “OM I Agreement”) to lease 3,999approximately 4,000 square feet of space at Old Mill Corporate Center I for an IT data center to allow us to consolidate other IT data center facilities at the Old Mill Corporate Center II and at our current corporate offices facilities.
We believe that these facilities will be sufficient for our needs for the next twelve months, subject to seasonal requirements for additional warehouse space during the fourth quarter. Also, we are still considering further consolidation of office space, possibly through a complete relocation of our corporate office facilities.
Purchase Obligations
center. The amount of purchase obligations shown is based on assumptions regarding the legal enforceability against us of purchase orders we had outstanding at December 31, 2007. Under different assumptions regarding our rights to cancel our purchase orders or different assumptions regarding the enforceability of the purchase orders under applicable law, the amount of purchase obligations shownlease expires in the table above would be less.May 1, 2017.
$30.0 million Wells Fargo Credit AgreementAgreement.
We have a credit agreement (as amended to date, the “Credit Agreement”"Credit Agreement") with Wells Fargo Bank, National Association (“("Wells Fargo”Fargo"). The Credit Agreement provides a revolving line of credit to us of up to $30.0 million which we use primarily to obtain letters of credit to support inventory purchases. Interest on borrowings is payable monthly and accrued at either (i) 1.0% above LIBOR in effect on the first day of an applicable fixed rate term, or (ii) at a fluctuating rate per annum determined by the bank to be one half a percent (0.50%) above daily LIBOR in effect on each business day a change in daily LIBOR is announced by the bank. The Credit Agreement expires on January 1, 2010, and requires us to comply with certain covenants, including restrictions on mergers, business combinations or transfer orof assets. We were in compliance with these covenants at December 31, 2007.
Borrowings and outstanding letters of credit under the Credit Agreement are required to be completely collateralized by cash balances held at Wells Fargo Bank, N.A, and therefore the facility does not provide additional liquidity to us.
At December 31, 2007,2008, no amounts were outstanding under the Credit Agreement, and letters of credit totaling $2.8$2.2 million were issued on our behalf.
Wells Fargo Retail Finance Agreement.$40.0 million WFRF Agreement
We are a party to a On January 6, 2009 we entered into an Amended and Restated Loan and Security Agreement (as amended to date, the “WFRF Agreement”dated January 6, 2009 (the "WFRF Agreement") with Wells Fargo Retail Finance, LLC ("WFRF"). The WFRF Agreement replaces our Loan and related security agreements and other agreements described in the WFRF Agreement.
Security Agreement dated December 12, 2005 with WFRF.
The WFRF Agreement provides for advances to us and for the issuance of letters of credit for our account of up to an aggregate maximum of $40.0$35.0 million. The amount actually available to us may be less and may vary from time to time, depending on, among other factors, the amount of ourits eligible inventory and receivables. Our obligations under the WFRF Agreement and all related agreements are collateralized by all or substantially all of our and our subsidiaries’subsidiaries' assets. Our obligations under the WFRF Agreement are cross-collateralized with our assets pledgedobligation under our $30.0 million credit facility with Wells Fargo Bank, N.A. The WFRF Agreement contains standard default provisions and expires on December 12, 2008.January 5, 2011. The conditions to our use of the facility include a 45-day advance notice requirement.
46
Table of Contents
Advances under the WFRF Agreement bear interest at either (a) the rate announced, from time to time, within Wells Fargo Bank, N.A. at its principal office in San Francisco as its “prime rate”"prime rate" or (b) a rate based on LIBOR plus a varying percentage between 1.25% and 1.75%; however, the annual
Table of Contents
interest rate on advances under the WFRF Agreement will be at least 3.50%. The WFRF Agreement includes affirmative covenants as well as negative covenants that prohibit a variety of actions without the lender’slender's approval, including covenants that limit our ability to (a) incur or guarantee debt, (b) create liens, (c) enter into any merger, recapitalization or similar transaction or purchase all or substantially all of the assets or stock of another person, (d) sell assets, (e) change our name or the name of any of our subsidiaries, (f) make certain changes to our business, (g) optionally prepay, acquire or refinance indebtedness, (h) consign inventory, (i) pay dividends on, or purchase, acquire or redeem shares of, our capital stock, (j) change our method of accounting, (k) make investments, (l) enter into transactions with affiliates, or (m) store any of our inventory or equipment with third parties. We were in compliance with these covenants as of December 31, 2007.
At December 31, 2007,2008, no amounts were outstanding under the WFRF Agreement or under our prior loan agreement with WFRF.
Wells Fargo Commercial Purchasing Card Agreement. As of We have a commercial purchasing card agreement (the "Purchasing Card") with Wells Fargo Bank, National Association ("Wells Fargo"). We use the Purchasing Card for business purpose purchasing and must pay it in full each month. Outstanding amounts under the Purchasing Card are collateralized by cash balances held at Wells Fargo Bank, N.A, and therefore the facility does not provide additional liquidity to us. At December 31, 2007, availability2008, $436,000 was outstanding and $564,000 was available under the WFRF Agreement was $9.0 million.Purchasing Card.
Off-Balance Sheet Arrangements
We do not have any off-balance sheet arrangements that have or are reasonably likely to have a current or future effect on our financial condition, changes in financial condition, revenues or expenses, results of operations, liquidity, capital expenditures or capital resources that would be material to investors.
Share Repurchase ProgramsNon-GAAP Financial Measures
Regulation G,Conditions for Use of Non-GAAP Financial Measures, and other SEC regulations regulate the disclosure of certain non-GAAP financial information.
During January 2005, Adjusted EBITDA. Our measure of Adjusted EBITDA (a non-GAAP financial measure) (which we reconcile to "Net income (loss)" in our Boardstatement of Directors authorizedoperations) consists of earnings before interest, taxes, depreciation, amortization, stock-based compensation, other income (expense) and discontinued operations. Adjusted EBITDA is used in addition to and in conjunction with results presented in accordance with GAAP and should not be relied upon to the exclusion of GAAP financial measures. Adjusted EBITDA reflects an additional way of viewing our results that, when viewed with our GAAP results, provides a share repurchase program undermore complete understanding of factors and trends affecting our results. You should review our financial statements and publicly-filed reports in their entirety and not rely on any single financial measure. Our discussion above and below (i) explains why management believes that presentation of Adjusted EBITDA provides useful information to investors regarding our financial condition and results of continuing operations, (ii) to the extent material, discloses the additional purposes, if any, for which management uses this non-GAAP measure, and (iii) provides a
Table of Contents
reconciliation of this measure to our net income (loss). For further details on Adjusted EBITDA, see the reconciliation of this non-GAAP measure to our GAAP net income (loss) below (in thousands):
| | | | | | | | | | | | | | |
| | Three months ended
December 31, | | Twelve months ended
December 31, | |
|---|
| | 2007 | | 2008 | | 2007 | | 2008 | |
|---|
Net income (loss) | | $ | (6,470 | ) | $ | 1,014 | | $ | (48,036 | ) | $ | (12,658 | ) |
Add back amounts for computation of Adjusted EBITDA: | | | | | | | | | | | | | |
| | Depreciation and amortization, including internal-use software and website development, and other amortization | | | 6,670 | | | 4,703 | | | 29,495 | | | 22,667 | |
| | Stock-based compensation expense to employees and directors | | | 1,136 | | | 780 | | | 4,522 | | | 4,022 | |
| | Stock-based compensation to consultants for services | | | (91 | ) | | 78 | | | 189 | | | 259 | |
| | Stock-based compensation related to performance share plan | | | (900 | ) | | (1,300 | ) | | (550 | ) | | (1,000 | ) |
| | Treasury stock issued from treasury for 401(k) matching contribution | | | (434 | ) | | — | | | 494 | | | 19 | |
| | Interest (income) expense, net | | | (326 | ) | | 371 | | | (600 | ) | | 299 | |
| | Other income (expense), net | | | — | | | 4,297 | | | 92 | | | 1,446 | |
| | Loss from discontinued operations | | | — | | | — | | | 3,924 | | | — | |
| | | | | | | | | | |
Adjusted EBITDA | | $ | (415 | ) | $ | 9,943 | | $ | (10,470 | ) | $ | 15,054 | |
| | | | | | | | | | |
We believe that discussing Adjusted EBITDA at this stage of our business is useful to us and investors, as Adjusted EBITDA is a reasonable measure of actual cash used or cash generated by the continuing operations of our business.
Free Cash Flow. Free cash flow (a non-GAAP financial measure) reflects an additional way of viewing our cash flows and liquidity that, when viewed with our GAAP results, provides a more complete understanding of factors and trends affecting our cash flows. Free cash flow, which we were authorizedreconcile to repurchase up"Net cash provided by (used in) operating activities", is cash flow from operations reduced by "Expenditures for fixed assets, including internal-use software and website development." Although we believe that cash flow from operating activities is an important measure, we believe free cash flow is a useful measure to $50.0 millionevaluate our business since purchases of fixed assets are a necessary component of ongoing operations. Therefore, we believe it is important to view free cash flow as a complement to our common stock through December 31, 2007. On April 26, 2005,entire consolidated statements of cash flows.
| | | | | | | | | | | | | |
| | Three months ended December 31, | | Twelve months ended December 31, | |
|---|
(in thousands) | | 2007 | | 2008 | | 2007 | | 2008 | |
|---|
Net cash provided by operating activities | | $ | 55,734 | | $ | 42,830 | | $ | 9,977 | | $ | 1,960 | |
Expenditures for fixed assets, including internal-use software and website development | | | (411 | ) | | (3,432 | ) | | (2,643 | ) | | (18,690 | ) |
| | | | | | | | | | |
Free cash flow | | $ | 55,323 | | $ | 39,398 | | $ | 7,334 | | $ | (16,730 | ) |
| | | | | | | | | | |
Table of Contents
Quarterly Results of Operations (unaudited)
The following tables set forth our unaudited quarterly results of operations for the Board of Directors increasedeight most recent quarters for the amount of the share repurchase program to $100.0 million. Additionally, on June 14, 2005, the Board of Directors authorized an amendment of our three-year share repurchase program to include the repurchase of our Convertible Senior Notes. Under the repurchase program, we repurchased approximately 665,000 shares of our common stock in open market transactions for $24.1 million during the yearperiod ended December 31, 2005. In addition, approximately 1.0 million shares of common stock were acquired2008, as well as such data expressed as a resultpercentage of our total revenue for the settlementperiods presented. The information in the table below should be read in conjunction with the Consolidated Financial Statements and the Notes thereto included elsewhere in this Form 10-K/A. We have prepared this information on the same basis as the Consolidated Financial Statements and the information includes all adjustments, consisting only of $41.1 millionnormal recurring adjustments, that we consider necessary for a fair statement of structured stock repurchase transactions duringour financial position and operating results for the yearquarters presented. Our quarterly operating results have varied substantially in the past and may vary substantially in the future. You should not draw any conclusions about our future results from the results of operations for any particular quarter.
| | | | | | | | | | | | | | | | | | | | | | | | | | | | |
| | Three Months Ended | |
|---|
| | Mar. 31,
2007 | | June 30,
2007 | | Sept. 30,
2007 | | Dec. 31,
2007 | | Mar. 31,
2008 | | June 30,
2008 | | Sept. 30,
2008 | | Dec. 31,
2008 | |
|---|
| | (in thousands, except per share data)
| |
|---|
Consolidated Statement of Operations Data: | | | | | | | | | | | | | | | | | | | | | | | | | |
Revenue | | | | | | | | | | | | | | | | | | | | | | | | | |
| | Direct revenue | | $ | 46,990 | | $ | 43,658 | | $ | 39,270 | | $ | 67,170 | | $ | 51,764 | | $ | 39,832 | | $ | 34,176 | | $ | 48,431 | |
| | Fulfillment partner revenue | | | 115,166 | | | 105,513 | | | 120,789 | | | 227,346 | | | 151,050 | | | 149,004 | | | 152,679 | | | 207,431 | |
| | | | | | | | | | | | | | | | | | |
| | | | Total revenue | | | 162,156 | | | 149,171 | | | 160,059 | | | 294,516 | | | 202,814 | | | 188,836 | | | 186,855 | | | 255,862 | |
| | | | | | | | | | | | | | | | | | |
Cost of goods sold | | | | | | | | | | | | | | | | | | | | | | | | | |
| | Direct | | | 41,469 | | | 36,456 | | | 33,268 | | | 56,815 | | | 44,803 | | | 34,871 | | | 30,633 | | | 44,194 | |
| | Fulfillment partner | | | 96,077 | | | 86,523 | | | 99,425 | | | 191,319 | | | 124,040 | | | 120,756 | | | 124,103 | | | 168,058 | |
| | | | | | | | | | | | | | | | | | |
| | | Total cost of goods sold | | | 137,546 | | | 122,979 | | | 132,693 | | | 248,134 | | | 168,843 | | | 155,627 | | | 154,736 | | | 212,252 | |
| | | | | | | | | | | | | | | | | | |
Gross profit | | | 24,610 | | | 26,192 | | | 27,366 | | | 46,382 | | | 33,971 | | | 33,209 | | | 32,119 | | | 43,610 | |
| | | | | | | | | | | | | | | | | | |
Operating expenses: | | | | | | | | | | | | | | | | | | | | | | | | | |
| | Sales and marketing | | | 11,284 | | | 7,962 | | | 8,835 | | | 27,377 | | | 15,019 | | | 14,244 | | | 11,934 | | | 16,437 | |
| | Technology | | | 14,973 | | | 15,237 | | | 14,576 | | | 14,667 | | | 14,516 | | | 15,311 | | | 14,119 | | | 13,869 | |
| | General and administrative | | | 10,689 | | | 10,429 | | | 9,724 | | | 11,134 | | | 9,563 | | | 10,867 | | | 10,321 | | | 7,622 | |
| | Restructuring | | | 6,089 | | | 6,194 | | | — | | | — | | | — | | | — | | | — | | | — | |
| | | | | | | | | | | | | | | | | | |
| | | | Total operating expenses | | | 43,035 | | | 39,822 | | | 33,135 | | | 53,178 | | | 39,098 | | | 40,422 | | | 36,374 | | | 37,928 | |
| | | | | | | | | | | | | | | | | | |
Operating income/(loss) | | | (18,425 | ) | | (13,630 | ) | | (5,769 | ) | | (6,796 | ) | | (5,127 | ) | | (7,213 | ) | | (4,255 | ) | | 5,682 | |
Interest income, net | | | 990 | | | 1,078 | | | 1,291 | | | 1,429 | | | 1,304 | | | 740 | | | 664 | | | 455 | |
Interest expense | | | (1,029 | ) | | (1,027 | ) | | (1,029 | ) | | (1,103 | ) | | (901 | ) | | (888 | ) | | (847 | ) | | (826 | ) |
Other income (expense), net | | | — | | | — | | | (92 | ) | | — | | | — | | | 2 | | | 2,849 | | | (4,297 | ) |
| | | | | | | | | | | | | | | | | | |
Income /(loss) from continuing operations | | | (18,464 | ) | | (13,579 | ) | | (5,599 | ) | | (6,470 | ) | | (4,724 | ) | | (7,359 | ) | | (1,589 | ) | | 1,014 | |
Discontinued operations: | | | | | | | | | | | | | | | | | | | | | | | | | |
Loss from discontinued operations | | | (3,624 | ) | | (300 | ) | | — | | | — | | | — | | | — | | | — | | | — | |
| | | | | | | | | | | | | | | | | | |
Net income/(loss) attributable to common shares | | $ | (22,088 | ) | $ | (13,879 | ) | $ | (5,599 | ) | $ | (6,470 | ) | $ | (4,724 | ) | $ | (7,359 | ) | $ | (1,589 | ) | $ | 1,014 | |
| | | | | | | | | | | | | | | | | | |
Table of Contents
| | | | | | | | | | | | | | | | | | | | | | | | | | | |
| | Three Months Ended | |
|---|
| | Mar. 31,
2007 | | June 30,
2007 | | Sept. 30,
2007 | | Dec. 31,
2007 | | Mar. 31,
2008 | | June 30,
2008 | | Sept. 30,
2008 | | Dec. 31,
2008 | |
|---|
| | (in thousands, except per share data)
| |
|---|
Net income/(loss) per common share—basic | | | | | | | | | | | | | | | | | | | | | | | | | |
| | | Income /(loss) from continuing operations | | $ | (0.78 | ) | $ | (0.57 | ) | $ | (0.23 | ) | $ | (0.27 | ) | $ | (0.20 | ) | $ | (0.32 | ) | $ | (0.07 | ) | $ | 0.04 | |
| | | Loss from discontinued operations | | $ | (0.16 | ) | $ | (0.01 | ) | $ | — | | $ | — | | $ | — | | $ | — | | $ | — | | $ | — | |
Net income /(loss) per share—basic | | $ | (0.94 | ) | $ | (0.58 | ) | $ | (0.23 | ) | $ | (0.27 | ) | $ | (0.20 | ) | $ | (0.32 | ) | $ | (0. 07 | ) | $ | 0.04 | |
Weighted average common shares outstanding—basic | | | 23,594 | | | 23,689 | | | 23,726 | | | 23,807 | | | 23,345 | | | 22,750 | | | 22,768 | | | 22,745 | |
Net income /(loss) per common share—diluted | | | | | | | | | | | | | | | | | | | | | | | | | |
| | | Income /(loss) from continuing operations | | $ | (0.78 | ) | $ | (0.57 | ) | $ | (0.23 | ) | $ | (0.27 | ) | $ | (0.20 | ) | $ | (0.32 | ) | $ | (0.07 | ) | $ | 0.04 | |
| | | Loss from discontinued operations | | $ | (0.16 | ) | $ | (0.01 | ) | $ | — | | $ | — | | $ | — | | $ | — | | $ | — | | $ | — | |
Net income /(loss) per share—diluted | | $ | (0.94 | ) | $ | (0.58 | ) | $ | (0.23 | ) | $ | (0.27 | ) | $ | (0.20 | ) | $ | (0.32 | ) | $ | (0. 07 | ) | $ | 0.04 | |
Weighted average common shares outstanding—diluted | | | 23,594 | | | 23,689 | | | 23,726 | | | 23,807 | | | 23,345 | | | 22,750 | | | 22,768 | | | 22,827 | |
| | | | | | | | | | | | | | | | | | | | | | | | | |
| | Three Months Ended | |
|---|
| | Mar. 31,
2007 | | June 30,
2007 | | Sept. 30,
2007 | | Dec. 31,
2007 | | Mar. 31,
2008 | | June 30,
2008 | | Sept. 30,
2008 | | Dec. 31,
2008 | |
|---|
Additional Operating Data(1): | | | | | | | | | | | | | | | | | | | | | | | | | |
Gross bookings (in thousands)(2) | | $ | 174,740 | | $ | 164,646 | | $ | 176,410 | | $ | 336,340 | | $ | 219,754 | | $ | 206,151 | | $ | 204,656 | | $ | 285,648 | |
Number of orders(3) | | | 1,481,000 | | | 1,288,000 | | | 1,457,000 | | | 2,973,000 | | | 1,773,000 | | | 1,574,000 | | | 1,570,000 | | | 2,509,000 | |
Number of new B2C customers(4) | | | 473,000 | | | 394,000 | | | 486,000 | | | 1,104,000 | | | 596,000 | | | 516,000 | | | 547,000 | | | 930,000 | |
Average customer acquisition cost(5) | | $ | 24.58 | | $ | 20.20 | | $ | 18.17 | | $ | 24.98 | | $ | 25.21 | | $ | 27.61 | | $ | 21.82 | | $ | 17.67 | |
- (1)
- The additional operating data sets forth certain operating data relating to our business for the eight most recent quarters for the period ended December 31,
2005. The purchased call options2008. While we believe that didthe information in the table above facilitates an understanding of our business and results of operations for the periods presented, such information is not settle in stock settledaccordance with generally accepted accounting principles and should be read in cash totaling $7.9 million, whichconjunction with the quarterly results of operations data set forth above.
- (2)
- Gross bookings exclude bookings related to the auctions, cars and real estate businesses (shopping business only). We believe that gross bookings is a metric widely used in our industry and by making this metric available to investors, we
receivedbelieve investors are able to compare our performance against others in July 2005. We also repurchased convertible senior notes having an aggregate principal amountour industry.
- (3)
- Number of
$43.0 million during 2005. Asorders represents the number of December 31, 2007, we had utilized allindividual orders for merchandise through our Website excluding Business to Business ("B2B") orders.
- (4)
- Number of new Business to Consumers ("B2C") customers represents the
$100.0 million authorizednumber of valid new customer accounts. To establish a valid customer account, a person must provide us with the following information and purchase merchandise on our B2C Website: a unique e-mail address; a unique password; and a verified credit card account number.
- (5)
- Average customer acquisition cost represents total shopping sales and marketing expense divided by the
boardnumber of directors undernew shopping customers for the share repurchase program.period presented (excluding both new customers and marketing costs for the
Table of Contents
auctions, real estate, and cars business). We believe that investors may use the average customer acquisition cost metric to determine how efficiently we are able to acquire new customers.
| | | | | | | | | | | | | | | | | | | | | | | | | | | |
| | Three Months Ended | |
|---|
| | Mar. 31,
2007 | | June 30,
2007 | | Sept. 30,
2007 | | Dec. 31,
2007 | | Mar. 31,
2008 | | June 30,
2008 | | Sept. 30,
2008 | | Dec. 31,
2008 | |
|---|
| | (as a percentage of total revenue)
| |
|---|
Revenue | | | | | | | | | | | | | | | | | | | | | | | | | |
| | Direct revenue | | | 29.0 | % | | 29.3 | % | | 24.5 | % | | 22.8 | % | | 25.5 | % | | 21.1 | % | | 18.3 | % | | 18.9 | % |
| | Fulfillment partner revenue | | | 71.0 | | | 70.7 | | | 75.5 | | | 77.2 | | | 74.5 | | | 78.9 | | | 81.7 | | | 81.1 | |
| | | | | | | | | | | | | | | | | | |
| | | Total revenue | | | 100.0 | | | 100.0 | | | 100.0 | | | 100.0 | | | 100.0 | | | 100.0 | | | 100.0 | | | 100.0 | |
| | | | | | | | | | | | | | | | | | |
Cost of goods sold | | | | | | | | | | | | | | | | | | | | | | | | | |
| | Direct | | | 25.6 | | | 24.4 | | | 20.8 | | | 19.3 | | | 22.1 | | | 18.5 | | | 16.4 | | | 17.3 | |
| | Fulfillment partner | | | 59.2 | | | 58.0 | | | 62.1 | | | 65.0 | | | 61.2 | | | 63.9 | | | 66.4 | | | 65.7 | |
| | | | | | | | | | | | | | | | | | |
| | | Total cost of goods sold | | | 84.8 | | | 82.4 | | | 82.9 | | | 84.3 | | | 83.3 | | | 82.4 | | | 82.8 | | | 83.0 | |
| | | | | | | | | | | | | | | | | | |
Gross profit | | | 15.2 | | | 17.6 | | | 17.1 | | | 15.7 | | | 16.7 | | | 17.6 | | | 17.2 | | | 17.0 | |
| | | | | | | | | | | | | | | | | | |
Operating expenses: | | | | | | | | | | | | | | | | | | | | | | | | | |
| | Sales and marketing | | | 7.0 | | | 5.3 | | | 5.5 | | | 9.3 | | | 7.4 | | | 7.5 | | | 6.4 | | | 6.4 | |
| | Technology | | | 9.2 | | | 10.2 | | | 9.1 | | | 5.0 | | | 7.2 | | | 8.1 | | | 7.6 | | | 5.4 | |
| | General and administrative | | | 6.6 | | | 7.0 | | | 6.1 | | | 3.8 | | | 4.7 | | | 5.8 | | | 5.5 | | | 3.0 | |
| | Restructuring | | | 3.7 | | | 4.2 | | | — | | | — | | | — | | | — | | | — | | | — | |
| | | | | | | | | | | | | | | | | | |
| | Total operating expenses | | | 26.5 | | | 26.7 | | | 20.7 | | | 18.1 | | | 19.3 | | | 21.4 | | | 19.5 | | | 14.8 | |
| | | | | | | | | | | | | | | | | | |
Operating income (loss) | | | (11.4 | ) | | (9.1 | ) | | (3.6 | ) | | (2.3 | ) | | (2.5 | ) | | (3.8 | ) | | (2.3 | ) | | 2.2 | |
Interest income, net | | | 0.6 | | | 0.7 | | | 0.8 | | | 0.5 | | | 0.6 | | | 0.4 | | | 0.4 | | | 0.2 | |
Interest expense | | | (0.6 | ) | | (0.7 | ) | | (0.6 | ) | | (0.4 | ) | | (0.4 | ) | | (0.5 | ) | | (0.5 | ) | | (0.3 | ) |
Other income (expense), net | | | — | | | — | | | (0.1 | ) | | — | | | — | | | 0.0 | | | 1.5 | | | (1.7 | ) |
| | | | | | | | | | | | | | | | | | |
Income (loss) from continuing operations | | | (11.4 | )% | | (9.1 | )% | | (3.5 | )% | | (2.2 | )% | | (2.3 | )% | | (3.9 | )% | | (0.9 | )% | | 0.4 | % |
| | | | | | | | | | | | | | | | | | |
Table of Contents
On January 14, 2008, our Board of Directors authorized an additional repurchase program that authorizes us to purchase up to $20.0 million of our common stock and/or our 3.75% Senior Convertible Notes due 2011 through December 31, 2009. Under this repurchase program, we have repurchased approximately 1.1 million shares of our common stock in open market transactions for $12.0 million through March 14, 2008. None of the purchases were made during the fourth quarter of 2007.
Shelf Registration
In April 2005, we filed a registration statement with the Securities and Exchange Commission using a “shelf” registration or continuous offering process. Under this shelf process, we may, from time to time, sell any or all of the securities described in the prospectus in one or more offerings up to a total dollar amount of $500.0 million. On May 1, 2006, we issued approximately 1,042,000 shares of common stock for net proceeds of approximately $25.0 million. Additionally, on December 12, 2006, we issued approximately 2,734,000 shares for net proceeds of approximately $39.4 million. We did not issue any shares of common stock under the shelf registration statement during fiscal 2007.
ITEM 7A. QUANTITATIVE AND QUALITATIVE DISCLOSURES ABOUT MARKET RISK
We do not use derivative financial instruments in our investment portfolio and have no foreign exchange contracts. Our financial instruments consist of cash and cash equivalents, marketable securities, trade accounts and contracts receivable, accounts payable and long-term obligations. We consider investments in highly-liquid instruments with a remaining maturity of 90 days or less at the date of purchase to be cash equivalents.
Our exposure to market risk for changes in interest rates relates primarily to our short-term investments and short-term obligations; thus, fluctuations in interest rates would not have a material impact on the fair value of these securities. However, the fair values of our investments may be subject to fluctuations due to volatility of the stock market in general, investment-specific circumstances, and changes in general economic conditions.
At December 31, 2007,2008, we had $101.4$100.6 million in cash and cash equivalents and $46.0$9.0 million in marketable securities. Hypothetically, an increase or decrease in interest rates of one hundred basis points would have an estimated impact of $1.5$1.1 million on our earnings or loss, or the fair market value or cash flows of these instruments. Our cash, cash equivalents and marketable securities consisted of U.S. agency securities, money market funds and top tier commercial paper, and AAA-rated asset-backed securities collateralized by automobile loans/leases and credit card receivables.
paper.
At December 31, 2007,2008, we had approximately $77.0$67.5 million of convertible senior notes outstanding which bear interest at a fixed rate of 3.75%. In addition, atAt December 31, 2007,2008, there were no borrowings outstanding under our lines of credit and letters of credit totaling $2.8$2.2 million were outstanding under our credit facilities.
The fair value of the convertible senior notes is sensitive to interest rate changes. Interest rate changes would result in increases or decreases in the fair value of the convertible senior notes, due to differences between market interest rates and rates in effect at the inception of the obligation. Unless we elect to repurchase our convertible senior notes in the open market, changes in the fair value of convertible senior notes have no impact on our cash flows or consolidated financial statements. The estimated fair value of our 3.75% Convertible Senior Notesconvertible senior notes as of December 31, 20072008 was $60.0$38.1 million. The fair value of the convertible senior notes was derived using a convertible pricing model with observable market inputs, which include stock price, dividend payments, borrowing costs, equity volatility, interest rates and interest spread.
ITEM 8. FINANCIAL STATEMENTS AND SUPPLEMENTARY DATA (RESTATED)
The financial statements and supplementary data required by this item are included in Part IV, Item 15 of this Form 10-K/A and are presented beginning on page F-1.
ITEM 9. CHANGES IN AND DISAGREEMENTS WITH ACCOUNTANTS ON ACCOUNTING AND FINANCIAL DISCLOSURE
None.
47
Table of Contents
ITEM 9A. CONTROLS AND PROCEDURES (RESTATED)
Restatement
As discussed elsewhere in this Form 10-K/A and in Note 3 to the consolidated financial statements contained in Part IV, Item 15 of this Amendment, management of the Company has amended its Annual Report on Form 10-K for the year ended December 31, 2007 to restate (1) its consolidated financial statements as of December 31, 2007 and 2006 and for the years ended December 31, 2007, 2006 and 2005; (2) its selected financial data as of and for the years ended December 31,2007, 2006, 2005, 2004 and 2003; and (3) its quarterly results of operations for all quarters in the years ended December 31, 2007 and 2006. The determination to restate this previously issued financial information was made on October 20, 2008 as a result of management’s identification of errors related to the accounting for customer refunds and credits. Management subsequently determined that a portion of the error previously believed to be related to the accounting for customer refunds and credits was actually related to the accounting for gift cards issued to customers.
Evaluation of Disclosure Controls and Procedures
We maintain disclosure controls and procedures that are designed to ensure that information required to be disclosed in the reports filed or submitted under the Securities Exchange Act of 1934, as amended (the "Exchange Act") is recorded, processed, summarized and reported within the time periods specified in the SEC's rules and forms and that such information is accumulated and communicated to management, including the CEO (principal executive officer) and Senior Vice
Table of Contents
President, Finance (principal financial officer), as appropriate, to allow timely decisions regarding required disclosure.
In our Annual Report on Form 10-K (“Original Filing”) for the year ended December 31, 2007, filed on March 17, 2008, management Management of the Company, includingunder the supervision and with the participation of our CEO (principal executive officer) and Senior Vice President, Finance (principal financial officer), has evaluated the effectiveness of our disclosure controls and procedures (as such term is defined in Rulethe Rules 13a-15(e) promulgatedand 15d-15(e) under the Exchange Act of 1934, as amended (the “Exchange Act”))Act) as of the end of the period covered by the Original Filing.December 31, 2008. Based on thatupon this evaluation, management initiallyour CEO and Senior Vice President, Finance concluded that our disclosure controls and procedures were effective in reaching a reasonable level of assurance that information required to be included in our reports filed or submitted under the Exchange Act as of such time was recorded, processed, summarized, and reported within the time period specified in the U.S. Securities and Exchange Commission’s (the “Commission”) rules and forms and such information was accumulated and communicated as appropriate to allow timely decisions regarding required disclosures.
In connection with the restatement discussed above, management of the Company, including our CEO (principal executive officer) and Senior Vice President, Finance (principal financial officer), reevaluated the effectiveness of our disclosure controls and procedures as of December 31, 2007 pursuant to SEC Rule 13a-15(b) under the Exchange Act. As a result of such reevaluation, management has determined that the control deficiency discussed above constituted a material weakness in our system of internal control over financial reporting as of such date, which has caused us to amend our Original Filing for the year ended December 31, 2007 in order to restate our Consolidated Financial Statements as described above.2008.
As a result of the material weakness in our internal control over financial reporting described above, management, including our CEO (principal executive officer) and Senior Vice President, Finance (principal financial officer), has now concluded that our disclosure controls and procedures were not effective as of December 31, 2007.
Disclosure controls and procedures include controls and procedures designed to ensure that information required to be disclosed in our reports filed or submitted under the Exchange Act are properly recorded, processed, summarized and reported within the time periods required by the Commission’s rules and forms. Management necessarily applied its judgment in assessing the costs and benefits of such controls and procedures that, by their nature, can provide only reasonable assurance regarding management’s control objectives. Management does not expect that its disclosure controls and procedures will prevent all errors and fraud. A control system, irrespective of how well it is designed and operated, can only provide reasonable assurance, and cannot guarantee that it will succeed in its stated objectives.
The Company’s management nevertheless has concluded, after completion of procedures to reconcile customer refunds and credits to third party statements to determine the completeness and accuracy of such amounts as components of returns expense, accounts receivable and deferred revenue, and after completion of procedures to reconcile all gift cards issued to customers with underlying supporting data in order to determine the completeness and accuracy of such amounts as a component of revenue and deferred revenue, that the consolidated financial statements included in this Annual Report on Form 10-K/A are fairly stated, in accordance with accounting principles generally accepted in the United States of America.
Management’sManagement's Report on Internal Control over Financial Reporting (Restated)
Management of the Company is responsible for establishing and maintaining adequate internal control over financial reporting as defined in RulesRule 13a-15(f) and 15d-15(f) under the Exchange Act. The Company’s internalInternal control over financial reporting is a process designed by, or under our the supervision of, our CEO (principal executive officer) and Senior Vice President, Finance (principal financial officer), to provide reasonable assurance regarding the reliability of financial reporting and the preparation of financial statements for external purposes in accordance with generally accepted accounting principles. Because of its inherent limitations, internal control over financial reporting may not prevent or detect misstatements. Also, projections of any evaluation of effectiveness of internal control over financial reporting to future periods are subject to the risk that controls may become inadequate because of changes in conditions, or that the degree of compliance with the policies or procedures may deteriorate.
Under the supervision and with the participation of the Company’sour CEO (principal executive officer) and Senior Vice President, Finance (principal financial officer), management haswe have assessed the effectiveness of the Company’sCompany's internal control over financial reporting as of December 31, 2007.2008. In making itsan assessment of the effectiveness of internal control over financial reporting, managementwe used the criteria set forth inInternal Control — Control—Integrated Framework, issued by the Committee of Sponsoring Organizations of the Treadway Commission (“COSO”(the "COSO"). Our management concluded that based on its assessment, our internal control over financial reporting was effective as of December 31, 2008.
The effectiveness of our internal control over financial reporting as of December 31, 2008 has been audited by PricewaterhouseCoopers LLP, an independent registered public accounting firm, as stated in their report, included herein.
Remediation Steps to Address Material Weakness
As previously disclosure in our form 10-Q for the quarter ended September 30, 2008, the Company determined that there were errors in its accounting for customer refunds and credits and the accounting for gift cards issued to customers. As a result of these errors, the Company determined that previously issued financial information was no longer reliable and amended its Annual Report on Form 10-K for the year ended December 31, 2007 to restate (1) its consolidated financial statements as of December 31, 2007 and 2006 and for the years ended December 31, 2007, 2006 and 2005; (2) its selected financial data as of and for the years ended December 31, 2007, 2006, 2005, 2004 and 2003 and (3) its quarterly results of operations for all quarters in the years ended December 31, 2007 and 2006 on November 11, 2008. Management concluded that controls were not designed or operating effectively to ensure all refunds and credits issued to customers and gift cards issued to customers were completely and accurately recorded in the consolidated financial statements. These control failures impacted accounts receivable and deferred revenue in the consolidated balance sheet as well as revenue and returns expense (a component of revenue), in the consolidated statements operations. Management concluded that these deficiencies in the Company's internal control over financial reporting constituted a material weakness.
Table of Contents
A material weakness is a control deficiency, or a combination of control deficiencies, in internal control over financial reporting, such that there is a reasonable possibility that a material misstatement of the registrant’s annual or interim financial statements will not be prevented or detected on a timely basis. As of December 31, 2007, the Company did not maintain effective controls over its accounting for customer refunds and credits and gift cards issued to customers. Specifically, the Company’s controls were not designed or operating effectively to ensure that customer refunds and credits and gift cards issued to customers were completely and accurately recorded as a component of revenue, returns expense, accounts receivable and deferred revenue in accordance with generally accepted accounting principles. This control deficiency resulted in the restatement of the Company’s annual consolidated financial statements as of December 31, 2007 and 2006 and for the years ended December 31, 2007, 2006 and 2005 and the quarterly consolidated financial statements therein, as well as the selected financial data as of December 31, 2007, 2006, 2005 and 2004 and for the years ended December 31, 2004, 2005, 2006 and 2007. This control deficiency could result in misstatements in the aforementioned accounts that would result in a material misstatement to the annual or interim consolidated financial statements that would not be prevented or detected. Accordingly, management has determined that this control deficiency constitutes a material weakness.
In the Company’s original filing of the 2007 Annual Report on Form 10-K, management concluded that the Company maintained effective internal control over financial reporting as of December 31, 2007. However in connection with the restatement discussed in Note 3 to the consolidated financial statements, management has subsequently determined that the material weakness described above existed as of December 31, 2007. As a result of this material weakness, management has concluded that the Company did not maintain effective internal control over financial reporting as of December 31, 2007 based on the criteria set forth in Internal Control — Integrated Framework issued by the COSO. Accordingly, management has restated its report on internal control over financial reporting.
The effectiveness of the Company’s internal control over financial reporting as of December 31, 2007 has been audited by PricewaterhouseCoopers LLP, an independent registered public accounting firm, as stated in their report which is included herein.
Remediation Steps to Address Material Weakness
Management of the Company is implementingimplemented several processes to remediate the material weakness in the Company’sCompany's internal control over financial reporting
48
Table of Contents
and the ineffectiveness of its disclosure controls and procedures including:
- •
·Employee training on effectively reconciling customer refunds and credits and customer gift cards to a sufficient level of precision.precision;·
- •
- Regular reconciliation of credits and accounts receivable balance to third party
statements.statements;
·
- •
- Review and approval of these reconciliations by a person knowledgeable with the way transactions in these accounts are
processed.processed;
·
- •
- Controls to ensure changes to peripheral systems are evaluated for effects on
how they will impact data transferred to the ERP system.system;
·
- •
- Regular reconciliation of gift cards issued to customers as reported in the ERP system to amounts reported in peripheral systems.
· Supplemental We operated and tested the above controls over changes made to our information systems.at each month end during the fourth quarter of 2008.
We have determined as of December 31, 2008 that the remediation controls discussed above were effectively designed and demonstrated effective operation for a sufficient period of time to enable us to conclude that the material weakness has been remediated.
The effectiveness of any controls and procedures is subject to certain limitations, and, as a result, there can be no assurance that our controls and procedures will detect all errors or fraud. A control, no matter how well conceived and operated, can provide only reasonable, not absolute, assurance that the objectives of the control system will be attained.
We will continue to develop new policies and procedures as well as educate and train our employees on our existing policies and procedures in a continual effort to improve our internal control over financial reporting.
Changes in Internal Control Overover Financial Reporting
ThereAs described above, there have been no changes in our internal control over financial reporting that occurred during the fourth quarter of 2007ended December 31, 2008 that have materially affected, or are reasonably likely to materially affect, materially, ourthe Company's internal control over financial reporting.
/s/Patrick M. Byrne
| | /s/ David K. Chidester
|
Patrick M. Byrne
| | David K. Chidester
|
CEO (principal executive officer)
| | Senior Vice President, Finance (principal financial officer)
|
November 7, 2008
| | November 7, 2008
|
ITEM 9B. OTHER INFORMATION
None.
49
Table of Contents
PART III
ITEM 10. DIRECTORS, EXECUTIVE OFFICERS AND CORPORATE GOVERNANCE
Except as set forth herein, the information required by this Item is incorporated by reference to the Company’sCompany's definitive proxy statement for the 20082009 annual meeting of stockholders.
The Company has adopted a Code of Business Conduct and Ethics, which is applicable to all employees of the Company, including the principal executive officer, principal financial officer, and principal accounting officer. The Code includes provisions that are specifically applicable to our senior financial officers. We intend to disclose any amendments to these provisions and any waivers from any of these provisions granted to our principal executive officer, principal financial officer or principal accounting officer on our Website,www.overstock.com. We will provide a copy of the relevant portion to any person without any charge upon request in writing addressed to Overstock.com Attn: Investor Relations, 6350 South 3000 East, Salt Lake City, UT 84121.
ITEM 11. EXECUTIVE COMPENSATION
The information required by this Item is incorporated by reference to the Company’sCompany's definitive proxy statement for the 20082009 annual meeting of stockholders.
ITEM 12. SECURITY OWNERSHIP OF CERTAIN BENEFICIAL OWNERS AND RELATED STOCKHOLDER MATTERS
The information required by this Item is incorporated by reference to the Company’sCompany's definitive proxy statement for the 20082009 annual meeting of stockholders.
ITEM 13. CERTAIN RELATIONSHIPS AND RELATED TRANSACTIONS, AND DIRECTOR INDEPENDENCE
The information required by this Item is incorporated by reference to the Company’sCompany's definitive proxy statement for the 20082009 annual meeting of stockholders.
ITEM 14. PRINCIPAL ACCOUNTING FEES AND SERVICES
The information required by this Item is incorporated by reference to the Company’sCompany's definitive proxy statement for the 20082009 annual meeting of stockholders.
50
Table of Contents
PART IV
ITEM 15. EXHIBITS, FINANCIAL STATEMENT SCHEDULES
(a) 1. Financial Statements
INDEX TO CONSOLIDATED FINANCIAL STATEMENTS
2. Financial Statement Schedules
Schedule II Valuation and Qualifying Accounts listed in (a)(1) above is included herein. Schedules other than those listed above have been omitted as they are either not required, not applicable, or the information has otherwise been shown in the consolidated financial statements or notes thereto.
3. Exhibits
The exhibits listed below are filed as part of, or incorporated by reference into, this Form 10-K/A.
51
Table of Contents
Exhibit Number
|
| | |
Exhibit
Number | | Description of Document |
|---|
|
3.1(a) |
|
3.1(a)
| | Amended and Restated Certificate of Incorporation. |
|
3.2(a) | |
3.2(a)
| |
Amended and Restated Bylaws.
Bylaws (incorporated by reference to Exhibit 3.1 to our Report on Form 8-K filed on February 5, 2009). |
|
4.1(b) | |
4.1(b)
| |
Form of specimen common stock certificate.
|
|
4.2(b) | |
4.2(b)
| |
Investor Rights Agreement, dated March 4, 2002.
|
|
10.1(b) | |
10.1(b)
| |
Form of Indemnification Agreement between Overstock.com, Inc. and each of its directors and officers.
|
|
10.2(b) | |
10.2(b)
| |
Amended and Restated 1999 Stock Option Plan and form of agreements thereunder.
|
|
10.3(b) | |
10.3(b)
| |
2001 Stock Purchase Plan and form of agreements thereunder.
|
|
10.4(b) | |
10.4(b)
| |
Gear.com, Inc. Restated 1998 Stock Option Plan and form of agreements thereunder.
|
|
10.5 | |
10.5
| |
Form of agreements under 2002 Stock Option Plan, as amended (incorporated by reference to Exhibit 10.5 to our Registration Statement on Form S-1 (File No. 333-83728), which became effective on May 29, 2002).
|
|
10.6(b) | |
10.6(b)
| |
Agreement and Plan of Merger dated November 3, 2000 by and between Overstock.com, Inc. and Gear.com, Inc.
|
|
10.7 | |
10.7
| |
Lease Agreement dated January 23, 2002 between Overstock.com, Inc. and Holladay Building East L.L.C. (incorporated by reference to Exhibit 10.8 to our Registration Statement on Form S-1 (File No. 333-83728), which became effective on May 29, 2002).
|
Table of Contents
| | | |
| | | Exhibit
Number | | Description of Document |
|---|
10.8
| 10.8 | | Lease Agreement dated November 27, 2001 between Overstock.com and Holladay Building East L.L.C. (incorporated by reference to Exhibit 10.9 to our Registration Statement on Form S-1 (File No. 333-83728), which became effective on May 29, 2002). |
|
10.9 | |
10.9
| |
First Lease Extension Agreement dated January 25, 2002 by and between Overstock.com, Inc. and Holladay Building East L.L.C (incorporated by reference to Exhibit 10.10 to our Registration Statement on Form S-1 (File No. 333-83728), which became effective on May 29, 2002).
|
|
10.10 | |
10.10
| |
Lease Agreement by and between Overstock.com, Inc. and Marvin L. Oates Trust dated March 15, 2000 (incorporated by reference to Exhibit 10.12 to our Registration Statement on Form S-1 (File No. 333-83728), which became effective on May 29, 2002).
|
|
10.11 | |
10.11
| |
Severance Package Agreement with Douglas Greene dated June 17, 1999 (incorporated by reference to Exhibit 10.13 to our Registration Statement on Form S-1 (File No. 333-83728), which became effective on May 29, 2002).
|
|
10.12 | |
10.12
| |
Intellectual Property Assignment Agreement with Douglas Greene dated February 28, 2002 (incorporated by reference to Exhibit 10.14 to our Registration Statement on Form S-1 (File No. 333-83728), which became effective on May 29, 2002).
|
|
10.13 | |
10.13
| |
Amendment No. 1, dated April 29, 2002 to Intellectual Property Assignment Agreement dated February 28, 2002 by and between Overstock.com, Inc. and Douglas Greene. (incorporated by reference to Exhibit 10.18 to our Registration Statement on Form S-1 (File No. 333-83728), which became effective on May 29, 2002).
|
|
10.14 | |
10.14
| |
Form of Warrant to purchase Overstock.com, Inc. common stock. (incorporated by reference to Exhibit 10.20 to our Registration Statement on Form S-1 (File No. 333-83728), which became effective on May 29, 2002).
|
|
10.15 | |
10.15
| |
Lease Amendment #1 by and between Overstock.com, Inc. and Marvin L. Oates Trust, dated August 28, 2000. (incorporated by reference to Exhibit 10.22 to our Registration Statement on Form S-1 (File No. 333-102763), which became effective on February 12, 2003).
|
|
10.16 | |
10.16
| |
Commencement of Lease Amendment #1 by and between Overstock.com, Inc. and Marvin L. Oates Trust, dated October 25, 2000 (incorporated by reference to Exhibit 10.23 to our Registration Statement on Form S-1 (File No. 333-102763), which became effective on February 12, 2003).
|
|
10.17 | |
10.17
| |
Lease Amendment #2 by and between Overstock.com, Inc. and Marvin L. Oates Trust, dated November 12, 2001.(incorporated by reference to Exhibit 10.24 to our Registration Statement on Form S-1 (File No. 333-102763), which became effective on February 12, 2003).
|
|
10.18 | |
10.18
| |
Lease Amendment #3 by and between Overstock.com, Inc. and Marvin L. Oates Trust, dated July 23, 2002.(incorporated by reference to Exhibit 10.25 to our Registration Statement on Form S-1 (File No. 333-102763), which became effective on February 12, 2003).
|
|
10.19 | |
10.19
| |
Lease Amendment #4 by and between Overstock.com, Inc. and Marvin L. Oates Trust, dated August 19, 2002.(incorporated by reference to Exhibit 10.26 to our Registration Statement on Form S-1 (File No. 333-102763), which became effective on February 12, 2003).
|
52
Table of Contents
10.20
| | | |
Exhibit
Number | | Description of Document |
|---|
| 10.20 | | Lease Amendment #5 by and between Overstock.com, Inc. and Marvin L. Oates Trust, dated October 11, 2002.(incorporated by reference to Exhibit 10.27 to our Registration Statement on Form S-1 (File No. 333-102763), which became effective on February 12, 2003). |
|
10.21 | |
10.21
| |
Lease Amendment #6 by and between Overstock.com, Inc. and Marvin L. Oates Trust, dated December 23, 2002.(incorporated by reference to Exhibit 10.28 to our Registration Statement on Form S-1 (File No. 333-102763), which became effective on February 12, 2003).
|
|
10.22 | |
10.22
| |
Old Mill Corporate Center First Amendment to the Lease Agreement by and between Overstock.com, Inc. and Holladay Building East L.L.C., dated September 1, 2002.(incorporated by reference to Exhibit 10.29 to our Registration Statement on Form S-1 (File No. 333-102763), which became effective on February 12, 2003).
|
|
10.23 | |
10.23
| |
Credit Agreement dated February 13, 2004 between Overstock.com, Inc. and Wells Fargo Bank National Association (incorporated by reference to Exhibit 10.31 to our Annual Report on Form 10-K for the year ended December 31, 2003 filed on February 24, 2004).
|
|
10.24 | |
10.24
| |
Amendment to Credit Agreement by and between Overstock.com, Inc., and Wells Fargo Bank, National Association dated December 22, 2004. (incorporated by reference to Exhibit 99.1 to our Report on Form 8-K filed on December 27, 2004).
|
|
10.25 | |
10.25
| | Term sheet executed February 18, 2005 with Lehman Brothers OTC Derivatives Inc.(incorporated by reference to Exhibit 99.1 to our Report on Form 8-K filed on February 24, 2005).
|
| | |
10.26
| |
Tenant Improvement Agreement by and between Overstock.com, Inc. and old Mill Corporate Center III, LLC entered on February 11, 2005 (incorporated by reference to Exhibit 99.1 to our Report on Form 8-K filed on February 11, 2005).
|
|
10.26 | |
10.27
| |
Sublease Agreement by and between Overstock.com, Inc., Old Mill Technology Center, LLC, and Old Mill Building LLC (incorporated by reference to Exhibit 99.1 to our Report on Form 8-K/A filed on December 7, 2004).
|
|
10.27 | |
10.28
| |
Sublease Agreement by and between Overstock.com, Inc., Document Controls Systems, Inc., and Old Mill Building LLC (incorporated by reference to Exhibit 99.2 to our Report on Form 8-K/A filed on December 7, 2004).
|
|
10.28 | |
10.29
| |
Sublease Agreement by and between Overstock.com, Inc., Information Technology International, Inc., and Old Mill Building LLC (incorporated by reference to Exhibit 99.3 to our Report on Form 8-K/A filed on December 7, 2004).
|
|
10.29 | |
10.30
| |
Old Mill Corporate Center Fourth Amendment to the Lease Agreement (incorporated by reference to Exhibit 99.4 to our Report on Form 8-K/A filed on December 7, 2004).
|
|
10.30 | |
10.31
| |
Co-location Center Agreement (incorporated by reference to Exhibit 99.5 to our Report on Form 8-K/A filed on December 7, 2004).
|
|
10.31 | |
10.32
| |
Indenture, dated November 23, 2004, between Overstock.com, Inc. and Wells Fargo Bank, N.A., as trustee (incorporated by reference to Exhibit 10.1 to our Report on Form 8-K filed on November 24, 2004).
|
|
10.32 | |
10.33
| |
Registration Rights Agreement, dated November 23, 2004 by and among Overstock.com, Inc., Lehman Brothers., Piper Jaffray & Co., Legg Mason Wood Walker Incorporated and WR Hambrecht+ Co, LLC (incorporated by reference to Exhibit 10.2 to our Report on Form 8-K filed on November 24, 2004).
|
Table of Contents
| | | |
| | | Exhibit
Number | | Description of Document |
|---|
10.34
| 10.33 | | Purchase Agreement dated November 17, 2004 with Lehman Brothers Inc. as Representative (incorporated by reference to Exhibit 10.34 to our report on Form 10-K for the year ended December 31, 2004 filed on March 16, 2005). |
|
10.34 | |
10.35
| |
Underwriting Agreement dated November 17, 2004 with Lehman Brothers Inc. as Representative (incorporated by reference to Exhibit 1.1 to our Report on Form 8-K filed on November 18, 2004)
|
|
10.35 | |
10.36
| |
Underwriting Agreement dated May 13, 2004 with WR Hambrecht & Co., LLC and JMP Securities LLC. as Representatives (incorporated by reference to Exhibit 1.1 to our Report on Form 8-K filed on May 14, 2004
|
|
10.36 | |
10.37
| |
2002 Stock Option Plan, as amended (incorporated by reference to Exhibit 99.6 to our Report on Form 8-K filed May 7, 2004)
|
|
*10.37(c) |
|
Summary of unwritten Compensation arrangements with Directors |
10.38(c)
|
10.38(c) |
|
Summary of unwritten Compensation Payable toarrangements with Named Executive Officers |
|
10.39 | |
10.39(c)
| | Summary of Compensation Payable to Directors (filed herewith in part and incorporated in part by reference to Item 5.02(d) of our Report on Form 8-K filed on January 15, 2008)
|
| | |
10.40
| |
2005 Equity Incentive Plan (incorporated by reference to Appendix BA to Overstock.com, Inc.’s's definitive proxy statement filed with the SEC on March 29, 2005.
28, 2008. |
|
10.40 | |
10.41
| | Term sheet executed March 14, 2005 with IXIS Derivatives Inc. (incorporated by reference to Exhibit 99.1 to our Report on Form 8-K filed on March 16, 2005)
|
| | |
10.42
| | Stock Purchase Agreement dated June 24, 2005 with Ski West, Inc. and its shareholders (incorporated by reference to Exhibit 99.1 to our Form 8-K filed on June 24, 2005)
|
53
Table of Contents
10.43
| | Letter of Intent dated June 20, 2005 with Ski West, Inc. and certain of its shareholders (incorporated by reference to Exhibit 99.2 to our Form 8-K filed on June 24, 2005)
|
| | |
10.44
| | Fifth Amendment dated June 21, 2005 to Credit Agreement with Wells Fargo Bank, National Association (incorporated by reference to Exhibit 99.1 to our Form 8-K filed on June 27, 2005) |
|
10.41 | |
10.45
| |
First Modification dated June 21, 2005 to Promissory Note payable to Wells Fargo Bank, National Association (incorporated by reference to Exhibit 99.2 to our Form 8-K filed on June 27, 2005)
|
|
10.43 | |
10.46
| | Colocation Center Agreement dated July 1, 2005 between OMTek, LLC and Overstock.com, Inc (incorporated by reference to Exhibit 99.1 to our Form 8-K filed on July 7, 2005)
|
| | |
10.47
| |
Sixth Amendment dated October 18, 2005 to Credit Agreement with Wells Fargo Bank, National Association (incorporated by reference to Exhibit 10.1 to our Form 8-K filed on October 21, 2005)
|
|
10.44 | |
10.48
| |
Second Modification dated October 18, 2005 to Promissory Note payable to Wells Fargo Bank, National Association (incorporated by reference to Exhibit 10.2 to our Form 8-K filed on October 21, 2005)
|
|
10.45 | |
10.48
| |
Seventh Amendment dated December 31, 2005 to Credit Agreement with Wells Fargo Bank, National Association (incorporated by reference to Exhibit 10.1 to our Form 8-K filed on January 6, 2006)
|
|
10.46 | |
10.49
| |
Revolving Line of Credit Note dated January 1, 2006 payable to Wells Fargo Bank, National Association (incorporated by reference to Exhibit 10.2 to our Form 8-K filed on January 1, 2006)
|
|
10.47 | |
10.50
| |
Amended and Restated Loan and Security Agreement dated as of December 12, 2005January 6, 2009 with Wells Fargo Retail Finance, LLC (incorporated by reference to Exhibit 10.1 to our Form 8-K filed on December 12, 2005)
January 7, 2009) |
|
10.49 | |
10.51
| | Revolving Credit Note dated as of December 12, 2005 relating to Loan and Security Agreement dated as of December 12, 2005 payable to Wells Fargo Retail Finance, LLC (incorporated by reference to Exhibit 10.2 to our Form 8-K filed on December 12, 2005)
|
| | |
10.52
| | Performance Share Plan adopted by the Compensation Committee and Board of Directors of Overstock.com, Inc. on January 23, 2006 (incorporated by reference to Exhibit 10.1 to our Form 8-K filed on January 23, 2006)
|
| | |
10.53
| | Form of Grant relating to Performance Share Plan adopted by the Compensation Committee and Board of Directors of Overstock.com, Inc. on January 23, 2006 (incorporated by reference to Exhibit 10.2 to our Form 8-K filed on January 23, 2006)
|
| | |
10.54
| | 2006 Bonus Plan adopted by the Compensation Committee of the Board of Directors of Overstock.com, Inc. on January 23, 2006 (incorporated by reference to Exhibit 10.3 to our Form 8-K/A filed on January 31, 2006)
|
| | |
10.55
| | Amendment No. 1 dated March 1, 2006 to Stock Purchase Agreement with Ski West, Inc. and its shareholders (incorporated by reference to Exhibit 10.1 to our Form 8-K filed on March 6, 2006)
|
| | |
10.56
| | Letter of Agreement dated June 30, 2006 to Stock Purchase Agreement with Ski West, Inc. and its shareholders (incorporated by reference to Exhibit 10.1 to our Form 8-K filed on July 5, 2006)
|
| | |
10.57
| | Colocation Center Termination Agreement executed February 1, 2007 and effective December 29, 2006 (incorporated by reference to Exhibit 10.1 to our Form 8-K filed on February 5, 2007)
|
| | |
10.58
| |
Stock Purchase Agreement by and among Overstock.com, Inc., OTravel.com, Inc. and Castles Travel, Inc. dated April 25, 2007 (incorporated by reference to Exhibit 10.1 to our Report on Form 8-K filed on April 25, 2007)
|
|
10.50 | |
10.59
| |
License Termination Agreement between Overstock.com, Inc. and Ozburn-Hessey Logistics, LLC dated July 31, 2007 (incorporated by reference to Exhibit 10.1 to our Report on Form 8-K filed on August 1, 2007)
|
Table of Contents
| | | |
| | | Exhibit
Number | | Description of Document |
|---|
10.60
| 10.51 | | Amendment dated January 1, 2008 to Credit Agreement with Wells Fargo Bank, National Association (incorporated by reference to Exhibit 10.1 to our Report on Form 8-K filed on January 3, 2008) |
|
10.52 | |
10.61
| |
Revolving Line of Credit Note dated January 1, 2008 entered into in connection with Amendment to Credit Agreement with Wells Fargo Bank, National Association (incorporated by reference to Exhibit 10.2 to our Report on Form 8-K filed on January 3, 2008)
|
|
10.53 | |
10.62
| | Second Amendment dated January 14, 2008 to Loan and Security Agreement with Wells Fargo Retail Finance, LLC (incorporated by reference to Exhibit 10.1 to our Report on Form 8-K filed on January 15, 2008)
|
| | |
10.63
| |
Form of Restricted Stock Unit Grant Notice and Restricted Stock Agreement under the 2005 Equity Incentive Plan (incorporated by reference to Exhibit 10.1 to our Report on Form 8-K filed on January 15, 2008)
|
|
10.54 |
|
Lease Agreement with Natomas Meadows, LLC dated April 8, 2008 (incorporated by reference to Exhibit 10.1 to our Report on Form 8-K filed on April 11, 2008). |
21
|
10.55 |
|
First Amendment to Lease amending the terms of the Lease Agreement with Natomas Meadows, LLC dated December 16, 2008 (incorporated by reference to Exhibit 10.1 to our Report on Form 8-K filed on December 17, 2008). |
|
10.56 |
|
Note Purchase Agreement, First Amendment to Stock Purchase Agreement and First Amendment to Sub-Lease Agreement, by and among the Company, Mountain Reservations, Inc. and Castles Travel, Inc. dated January 21, 2009 (incorporated by reference to Exhibit 10.1 to our Report on Form 8-K filed on January 26, 2008). |
|
21 |
|
Subsidiaries of the Registrant |
|
*23.1 | |
23.1
| |
Consent of Independent Registered Public Accounting Firm
|
|
24.1 | |
24.1
| | Power
Powers of Attorney (see signature page)
page to original filing) |
54
Table of Contents
31.1
|
*31.1 | Rule 13a-14(a)/15d-14(a)
|
Exhibit 31 Certification of Chief Executive Officer |
|
*31.2 | |
31.2
| | Rule 13a-14(a)/15d-14(a)
Exhibit 31 Certification of Chief Financial Officer
|
|
*32.1 | |
32.1
| |
Section 1350 Certification of Chief Executive Officer
|
|
*32.2 | |
32.2
| |
Section 1350 Certification of Chief Financial Officer
|
- (a)
- Incorporated by reference to exhibits of the same number filed with our Form 10-Q (File No. 000-49799), filed on August 13, 2002.
- (b)
- Incorporated by reference to exhibits of the same number filed with our Registration Statement on Form S-1 (File No. 333-83728), which became effective on May 29, 2002.
- (c)
- Management contract or compensatory plan or arrangement.
- *
- Filed herewith.
(a)
| Incorporated by reference to exhibits of the same number filed with our Form 10-Q (File No. 000-49799), filed on August 13, 2002.
|
| |
(b)
| Incorporated by reference to exhibits of the same number filed with our Registration Statement on Form S-1 (File No. 333-83728), which became effective on May 29, 2002.
|
| |
(c)
| Management contract or compensatory plan or arrangement.
|
55
Table of Contents
SIGNATURES
SIGNATURES
Pursuant to the requirements of Section 13 or 15(d) of the Securities Act of 1934, the registrant has duly caused this reportForm 10-K/A to be signed on its behalf by the undersigned, thereunto duly authorized, on November 7, 2008.March 5, 2009.
| OVERSTOCK.COM, INC.
| | |
| OVERSTOCK.COM, INC. |
| |
By: | By:
|
/s/ PATRICK M. BYRNE
|
| |
Patrick M. Byrne |
| |
Chief Executive Officer
|
56
Table of Contents
POWER OF ATTORNEY
KNOW ALL PERSONS BY THESE PRESENTS, that each person whose signature appears below constitutes and appoints each of Patrick M. Byrne, Jonathan E. Johnson III and David K. Chidester, his or her attorneys-in-fact, each with the power of substitution, for him or her in any and all capacities, to sign any amendments to this Annual Report on Form 10-K and to file the same, with exhibits thereto and other documents in connection therewith, with the Securities and Exchange Commission, hereby ratifying and conforming all that said attorney-in-fact, or his or their substitute or substitutes, may do or cause to be done by virtue hereof.
Pursuant to the requirements of the Securities Exchange Act of 1934, this report has been signed below by the following persons on behalf of the registrant and in the capacities and on the dates indicated.
| | | | |
| | | | Date |
|---|
|
|
|
|
|
|
|
|
|
|
/s/ PATRICK M. BYRNE
Patrick M. Byrne | | Chief Executive Officer (Principal Executive Officer), | | November 7, 2008
|
Patrick M. Byrne
| |
Chairman of the Board
| | March 5, 2009 |
| | | | |
/s/ David K. Chidester
STEPHEN J. CHESNUT
Stephen J. Chesnut |
|
Senior Vice President, Finance (Principal Financial Officer and
| | |
David K. Chidester
| | Principal Accounting Officer) |
| November 7, 2008
March 5, 2009 |
| | | | |
/s/ ALLISON H. ABRAHAM*
Allison H. Abraham |
|
Director
|
| November 7, 2008
March 5, 2009 |
Allison H. Abraham
| | | | |
| | | | |
/s/ BARCLAY F. CORBUS*
Barclay F. Corbus |
|
Director
|
| November 7, 2008
March 5, 2009 |
Barclay F. Corbus
| | | | |
| | | | |
/s/ JOSEPH J. TABACCO, JR.*
Joseph J. Tabacco, Jr. |
|
Director
|
| November 7, 2008
March 5, 2009 |
Joseph J. Tabacco, Jr.
| | | | |
| | | | |
/s/ JAMES V. JOYCE
James V. Joyce |
|
Director
|
| November 7, 2008
March 5, 2009
|
| | | | | | |
James V. Joyce
*By | | /s/ STEPHEN J. CHESNUT
Stephen J. Chesnut, pursuant to a power of attorney | | | | |
57
Table of Contents
Report of Independent Registered Public Accounting Firm
To the Board of Directors and Stockholders of Overstock.com, Inc.:
Inc:
In our opinion, the accompanying consolidated financial statements listed in the index appearing under Item 15(a)(1) present fairly, in all material respects, the financial position of Overstock.com, Inc. and its subsidiaries (the “Company”) at December 31, 20072008 and 2006,2007, and the results of their operations and their cash flows for each of the three years in the period ended December 31, 20072008 in conformity with accounting principles generally accepted in the United States of America. In addition, in our opinion, the financial statement schedule listed in the accompanying index appearing under Item 15(a)(1) presents fairly, in all material respects, the information set forth therein when read in conjunction with the related consolidated financial statements. Management and we previously concluded that the Company maintained effective internal control over financial reporting as of December 31, 2007. However, management has subsequently determined that a material weaknessAlso in internal control over financial reporting related to accounting for customer refunds and credits and gift cards issued to customers existed as of that date. Accordingly, management’s report has been restated and our present opinion on internal control over financial reporting, as presented herein, is different from that expressed in our previous report. In our opinion, the Company did not maintain,maintained, in all material respects, effective internal control over financial reporting as of December 31, 2007,2008, based on criteria established inInternal Control - Control—Integrated Framework issued by the Committee of Sponsoring Organizations of the Treadway Commission (COSO) because a material weakness in internal control over financial reporting related to accounting for customer refunds and credits and gift cards issued to customers existed as of that date. A material weakness is a deficiency, or a combination of deficiencies, in internal control over financial reporting, such that there is a reasonable possibility that a material misstatement of the annual or interim financial statements will not be prevented or detected on a timely basis.. The material weakness referred to above is described in Management’s Report on Internal Control over Financial Reporting appearing under Item 9A. We considered this material weakness in determining the nature, timing, and extent of audit tests applied in our audit of the 2007 consolidated financial statements, and our opinion regarding the effectiveness of the Company’s internal control over financial reporting does not affect our opinion on those consolidated financial statements. The Company’sCompany's management is responsible for these financial statements and financial statement schedule, for maintaining effective internal control over financial reporting and for its assessment of the effectiveness of internal control over financial reporting, included in management’s report referred to above.Management's Report on Internal Control over Financial Reporting appearing under Item 9A. Our responsibility is to express opinions on these financial statements, on the financial statement schedule, and on the Company’sCompany's internal control over financial reporting based on our integrated audits. We conducted our audits in accordance with the standards of the Public Company Accounting Oversight Board (United States). Those standards require that we plan and perform the audits to obtain reasonable assurance about whether the financial statements are free of material misstatement and whether effective internal control over financial reporting was maintained in all material respects. Our audits of the financial statements included examining, on a test basis, evidence supporting the amounts and disclosures in the financial statements, assessing the accounting principles used and significant estimates made by management, and evaluating the overall financial statement presentation. Our audit of internal control over financial reporting included obtaining an understanding of internal control over financial reporting, assessing the risk that a material weakness exists, and testing and evaluating the design and operating effectiveness of internal control based on the assessed risk. Our audits also included performing such other procedures as we considered necessary in the circumstances. We believe that our audits provide a reasonable basis for our opinions.
As discussed in Note 3 to the consolidated financial statements, the Company has restated its consolidated financial statements as of December 31, 2007 and 2006 and for the years ended December 31, 2007, 2006 and 2005. As discussed in Note 1 to its financial statement schedule, the Company has restated its schedule as of December 31, 2007, 2006 and 2005.
As discussed in Note 18 to the consolidated financial statements, the Company changed the manner in which it accounts for stock-based compensation in 2006.
A company’scompany's internal control over financial reporting is a process designed to provide reasonable assurance regarding the reliability of financial reporting and the preparation of financial statements for external purposes in accordance with generally accepted accounting principles. A company’scompany's internal control over financial reporting includes those policies and procedures that (i) pertain to the maintenance of records that, in reasonable detail, accurately and fairly reflect the transactions and dispositions of the assets of the company; (ii) provide reasonable assurance that transactions are recorded as necessary to permit preparation of financial statements in accordance with generally accepted accounting principles, and that receipts and expenditures of the company are being made only in accordance with authorizations of management and directors of the company; and (iii) provide reasonable assurance regarding prevention or timely detection of unauthorized acquisition, use, or disposition of the company’scompany's assets that could have a material effect on the financial statements.
Because of its inherent limitations, internal control over financial reporting may not prevent or detect misstatements. Also, projections of any evaluation of effectiveness to future periods are subject to the risk that controls may become inadequate because of changes in conditions, or that the degree of compliance with the policies or procedures may deteriorate.
/s/PricewaterhouseCoopers LLP
Salt Lake City, Utah
March 17, 2008, except for the effect of the restatement discussed in Note 3 to the consolidated financial statements, Note 1 to the financial statement schedule and the matter described in the penultimate paragraph of Management’s Report on Internal Control Over Financial Reporting, for which the date is November 7, 2008
F-2
February 23, 2009
Table of Contents
Overstock.com, Inc.
Consolidated Balance Sheets
(in thousands)
| | December 31, | |
| | 2006 | | 2007 | |
| | (Restated) | | (Restated) | |
Assets | | | | | |
Current assets: | | | | | |
Cash and cash equivalents | | $ | 126,965 | | $ | 101,394 | |
Marketable securities | | — | | 46,000 | |
| | | | | |
Cash, cash equivalents and marketable securities | | 126,965 | | 147,394 | |
Accounts receivable, net | | 16,330 | | 11,208 | |
Note receivable (Note 26) | | 6,702 | | 1,506 | |
Inventories, net | | 23,870 | | 25,643 | |
Prepaid inventory | | 2,241 | | 3,572 | |
Prepaid expense | | 7,473 | | 7,572 | |
Current assets of held for sale subsidiary | | 4,718 | | — | |
| | | | | |
Total current assets | | 188,299 | | 196,895 | |
Property and equipment, net | | 56,198 | | 27,197 | |
Goodwill | | 2,784 | | 2,784 | |
Other long-term assets, net | | 578 | | 86 | |
Notes receivable | | — | | 4,181 | |
Long-term assets of held for sale subsidiary | | 16,594 | | — | |
| | | | | |
Total assets | | $ | 264,453 | | $ | 231,143 | |
| | | | | |
Liabilities and Stockholders’ Equity | | | | | |
Current liabilities: | | | | | |
Accounts payable | | $ | 58,412 | | $ | 70,358 | |
Accrued liabilities | | 38,434 | | 37,155 | |
Deferred revenue | | 23,220 | | 22,965 | |
Capital lease obligations, current | | 5,074 | | 3,796 | |
Current liabilities of held for sale subsidiary | | 3,684 | | — | |
| | | | | |
Total current liabilities | | 128,824 | | 134,274 | |
Capital lease obligations, non-current | | 3,983 | | — | |
Other long-term liabilities | | — | | 3,034 | |
Convertible senior notes | | 75,279 | | 75,623 | |
| | | | | |
Total liabilities | | 208,086 | | 212,931 | |
| | | | | |
Commitments and contingencies (Notes 11, 12 and 13) | | | | | |
Stockholders’ equity: | | | | | |
Preferred stock, $0.0001 par value, 5,000 shares authorized, no shares issued and outstanding as of December 31, 2006 and 2007 | | — | | — | |
Common stock, $0.0001 par value, 100,000 shares authorized, 25,069 and 25,423 shares issued as of December 31, 2006 and 2007, respectively | | 2 | | 2 | |
Additional paid-in capital | | 325,771 | | 333,909 | |
Accumulated deficit | | (204,291 | ) | (252,327 | ) |
| | | | | |
Treasury stock, 1,654 and 1,605 shares at cost as of December 31, 2006 and 2007, respectively | | (64,983 | ) | (63,278 | ) |
Accumulated other loss | | (132 | ) | (94 | ) |
| | | | | |
Total stockholders’ equity | | 56,367 | | 18,212 | |
| | | | | |
Total liabilities and stockholders’ equity | | $ | 264,453 | | $ | 231,143 | |
| | | | | | | | | |
| | December 31, | |
|---|
| | 2007 | | 2008 | |
|---|
Assets | |
Current assets: | | | | | | | |
| | Cash and cash equivalents | | $ | 101,394 | | $ | 100,577 | |
| | Marketable securities | | | 46,000 | | | 8,989 | |
| | | | | | |
| | | Cash, cash equivalents and marketable securities | | | 147,394 | | | 109,566 | |
| | Accounts receivable, net | | | 11,208 | | | 6,985 | |
| | Notes receivable (Note 25 and Note 4) | | | 1,506 | | | 1,250 | |
| | Inventories, net | | | 25,643 | | | 17,723 | |
| | Prepaid inventory, net | | | 3,572 | | | 761 | |
| | Prepaid expense | | | 7,572 | | | 9,694 | |
| | | | | | |
| | | Total current assets | | | 196,895 | | | 145,979 | |
Fixed assets, net | | | 27,197 | | | 23,144 | |
Goodwill | | | 2,784 | | | 2,784 | |
Other long-term assets, net | | | 86 | | | 538 | |
Notes receivable (Note 4) | | | 4,181 | | | — | |
| | | | | | |
| | | Total assets | | $ | 231,143 | | $ | 172,445 | |
| | | | | | |
Liabilities and Stockholders' Equity (Deficit) | |
Current liabilities: | | | | | | | |
| | Accounts payable | | $ | 70,358 | | $ | 62,120 | |
| | Accrued liabilities | | | 37,155 | | | 25,154 | |
| | Deferred revenue | | | 22,965 | | | 19,026 | |
| | Capital lease obligations | | | 3,796 | | | — | |
| | | | | | |
| | | Total current liabilities | | | 134,274 | | | 106,300 | |
Other long-term liabilities | | | 3,034 | | | 2,572 | |
Convertible senior notes | | | 75,623 | | | 66,558 | |
| | | | | | |
| | | Total liabilities | | | 212,931 | | | 175,430 | |
| | | | | | |
Commitments and contingencies (Notes 13 and 14) | | | | | | | |
Stockholders' equity (deficit): | | | | | | | |
| | Preferred stock, $0.0001 par value, 5,000 shares authorized, no shares issued and outstanding as of December 31, 2007 and 2008 | | | — | | | — | |
| | Common stock, $0.0001 par value, 100,000 shares authorized, 25,423 and 25,536 shares issued as of December 31, 2007 and 2008, respectively, and 23,818 and 22,743 shares outstanding as of December 31, 2007 and 2008, respectively | | | 2 | | | 2 | |
| | Additional paid-in capital | | | 333,909 | | | 338,620 | |
| | Accumulated deficit | | | (252,327 | ) | | (264,985 | ) |
| | Treasury stock, 1,605 and 2,793 shares at cost as of December 31, 2007 and 2008, respectively | | | (63,278 | ) | | (76,670 | ) |
| | Accumulated other comprehensive income (loss) | | | (94 | ) | | 48 | |
| | | | | | |
| | | Total stockholders' equity (deficit) | | | 18,212 | | | (2,985 | ) |
| | | | | | |
| | | Total liabilities and stockholders' equity (deficit) | | $ | 231,143 | | $ | 172,445 | |
| | | | | | |
The accompanying notes are an integral part of these consolidated financial statements.
F-3
Table of Contents
Overstock.com, Inc.
Consolidated Statements of Operations
(in thousands, except per share data)
| | Year ended December 31, | |
| | 2005 | | 2006 | | 2007 | |
| | (Restated) | | (Restated) | | (Restated) | |
Revenue | | | | | | | |
Direct revenue | | $ | 323,136 | | $ | 301,509 | | $ | 197,088 | |
Fulfillment partner revenue | | 471,839 | | 478,628 | | 568,814 | |
| | | | | | | |
Total revenue | | 794,975 | | 780,137 | | 765,902 | |
| | | | | | | |
Cost of goods sold | | | | | | | |
Direct(1) | | 280,647 | | 284,774 | | 168,008 | |
Fulfillment partner | | 397,855 | | 405,559 | | 473,344 | |
| | | | | | | |
Total cost of goods sold | | 678,502 | | 690,333 | | 641,352 | |
| | | | | | | |
Gross profit | | 116,473 | | 89,804 | | 124,550 | |
| | | | | | | |
Operating expenses: | | | | | | | |
Sales and marketing(1) | | 77,155 | | 70,897 | | 55,458 | |
Technology(1) | | 27,901 | | 65,158 | | 59,453 | |
General and administrative(1) | | 33,043 | | 46,837 | | 41,976 | |
Restructuring | | — | | 5,674 | | 12,283 | |
| | | | | | | |
Total operating expenses | | 138,099 | | 188,566 | | 169,170 | |
| | | | | | | |
Operating loss | | (21,626 | ) | (98,762 | ) | (44,620 | ) |
Interest income (expense), net | | (161 | ) | 3,566 | | 4,788 | |
Interest expense | | (5,582 | ) | (4,765 | ) | (4,188 | ) |
Other income (expense), net | | 4,728 | | 81 | | (92 | ) |
| | | | | | | |
Loss from continuing operations | | (22,641 | ) | (99,880 | ) | (44,112 | ) |
Discontinued operations (Note 5): | | | | | | | |
Loss from discontinued operations | | (2,571 | ) | (6,882 | ) | (3,924 | ) |
| | | | | | | |
Net loss | | (25,212 | ) | (106,762 | ) | (48,036 | ) |
Deemed dividend related to redeemable common stock | | (185 | ) | (99 | ) | — | |
| | | | | | | |
Net loss attributable to common shares | | $ | (25,397 | ) | $ | (106,861 | ) | $ | (48,036 | ) |
| | | | | | | |
Net loss per common share—basic and diluted: | | | | | | | |
Loss from continuing operations | | $ | (1.17 | ) | $ | (4.91 | ) | $ | (1.86 | ) |
| | | | | | | |
Loss from discontinued operations | | $ | (0.13 | ) | $ | (0.34 | ) | $ | (0.17 | ) |
| | | | | | | |
Net loss per common share—basic and diluted | | $ | (1.30 | ) | $ | (5.25 | ) | $ | (2.03 | ) |
| | | | | | | |
Weighted average common shares outstanding—basic and diluted | | 19,429 | | 20,332 | | 23,704 | |
| | | | | | | | | | | | |
| | Year ended December 31, | |
|---|
| | 2006 | | 2007 | | 2008 | |
|---|
Revenue | | | | | | | | | | |
| | Direct revenue | | $ | 301,509 | | $ | 197,088 | | $ | 174,203 | |
| | Fulfillment partner revenue | | | 478,628 | | | 568,814 | | | 660,164 | |
| | | | | | | | |
| | | Total revenue | | | 780,137 | | | 765,902 | | | 834,367 | |
| | | | | | | | |
Cost of goods sold | | | | | | | | | | |
| | Direct(1) | | | 284,774 | | | 168,008 | | | 154,501 | |
| | Fulfillment partner | | | 405,559 | | | 473,344 | | | 536,957 | |
| | | | | | | | |
| | | Total cost of goods sold | | | 690,333 | | | 641,352 | | | 691,458 | |
| | | | | | | | |
| | Gross profit | | | 89,804 | | | 124,550 | | | 142,909 | |
| | | | | | | | |
Operating expenses: | | | | | | | | | | |
| | Sales and marketing(1) | | | 70,897 | | | 55,458 | | | 57,634 | |
| | Technology(1) | | | 65,158 | | | 59,453 | | | 57,815 | |
| | General and administrative(1) | | | 46,837 | | | 41,976 | | | 38,373 | |
| | Restructuring | | | 5,674 | | | 12,283 | | | — | |
| | | | | | | | |
| | | Total operating expenses | | | 188,566 | | | 169,170 | | | 153,822 | |
| | | | | | | | |
Operating loss | | | (98,762 | ) | | (44,620 | ) | | (10,913 | ) |
Interest income, net | | | 3,566 | | | 4,788 | | | 3,163 | |
Interest expense | | | (4,765 | ) | | (4,188 | ) | | (3,462 | ) |
Other income (expense), net | | | 81 | | | (92 | ) | | (1,446 | ) |
| | | | | | | | |
Loss from continuing operations | | | (99,880 | ) | | (44,112 | ) | | (12,658 | ) |
Loss from discontinued operations (Note 4) | | | (6,882 | ) | | (3,924 | ) | | — | |
| | | | | | | | |
Net loss | | | (106,762 | ) | | (48,036 | ) | | (12,658 | ) |
Deemed dividend related to redeemable common stock | | | (99 | ) | | — | | | — | |
| | | | | | | | |
Net loss attributable to common shares | | $ | (106,861 | ) | $ | (48,036 | ) | $ | (12,658 | ) |
| | | | | | | | |
Net loss per common share—basic and diluted: | | | | | | | | | | |
| | Loss from continuing operations | | $ | (4.91 | ) | $ | (1.86 | ) | $ | (0.55 | ) |
| | | | | | | | |
| | Loss from discontinued operations | | $ | (0.34 | ) | $ | (0.17 | ) | $ | — | |
| | | | | | | | |
Net loss per common share—basic and diluted | | $ | (5.25 | ) | $ | (2.03 | ) | $ | (0.55 | ) |
| | | | | | | | |
Weighted average common shares outstanding—basic and diluted | | | 20,332 | | | 23,704 | | | 22,901 | |
| | | | | | | | |
- (1)
Includes stock-based compensation from stock based awards as follows:
Cost of goods sold—direct | | $ | 6 | | $ | 412 | | $ | 460 | |
Sales and marketing | | 4 | | 301 | | 336 | |
Technology | | 11 | | 684 | | 764 | |
General and administrative | | 51 | | 2,723 | | 2,962 | |
| | | | | | | | | | |
Cost of goods sold—direct | | $ | 412 | | $ | 460 | | $ | 181 | |
Sales and marketing | | | 301 | | | 336 | | | 313 | |
Technology | | | 684 | | | 764 | | | 792 | |
General and administrative | | | 2,746 | | | 2,601 | | | 1,995 | |
The accompanying notes are an integral part of these consolidated financial statements.
F-4
Table of Contents
Overstock.com, Inc.
Consolidated Statements of Stockholders’Stockholders' Equity (Deficit)
and Comprehensive Loss
(in(in thousands)
| | Common stock | | Additional Paid- | | | | Treasury stock | | Accumulated Other
Comprehensive | | | |
| | Shares | | Amount | | in capital | | Accumulated Deficit | | Shares | | Amount | | Income (Loss) | | Total | |
Balance at December 31, 2004 (as Reported) | | 19,390 | | $ | 2 | | $ | 241,830 | | $ | (71,726 | ) | (35 | ) | $ | (100 | ) | $ | (195 | ) | $ | 169,811 | |
| | | | | | | | | | | | | | | | | |
Cumulative effect of restatement (1) | | — | | — | | — | | (307 | ) | — | | — | | — | | (307 | ) |
Balance at January 1, 2005 (Restated) | | 19,390 | | $ | 2 | | $ | 241,830 | | $ | (72,033 | ) | (35 | ) | $ | (100 | ) | $ | (195 | ) | $ | 169,504 | |
Exercise of stock options and warrants | | 1,167 | | — | | 7,315 | | — | | — | | — | | — | | 7,315 | |
Treasury stock issued to employees as compensation | | — | | — | | 414 | | — | | 10 | | 29 | | — | | 443 | |
Purchase of treasury stock | | — | | — | | — | | — | | (665 | ) | (24,133 | ) | — | | (24,133 | ) |
Purchased call options for purchase of treasury stock | | — | | — | | (47,507 | ) | — | | — | | — | | — | | (47,507 | ) |
Settlement of purchased call options in exchange for cash | | — | | — | | 7,937 | | — | | — | | — | | — | | 7,937 | |
Settlement of purchased call options in exchange for treasury stock | | — | | — | | 41,121 | | — | | (997 | ) | (41,121 | ) | — | | — | |
Amortization of stock-based compensation | | — | | — | | 72 | | — | | — | | — | | — | | 72 | |
Stock-based compensation to consultants in exchange for services | | — | | — | | (389 | ) | — | | — | | — | | — | | (389 | ) |
Deemed dividend related to redeemable common stock | | — | | — | | — | | (185 | ) | — | | — | | — | | (185 | ) |
Lapse of rescission rights on redeemable common stock | | 14 | | — | | 146 | | — | | — | | — | | — | | 146 | |
Comprehensive loss (Restated): | | | | | | | | | | | | | | | | | |
Net loss (Restated) | | — | | — | | — | | (25,212 | ) | — | | — | | — | | (25,212 | ) |
Net unrealized loss on marketable securities | | — | | — | | — | | — | | — | | — | | (54 | ) | (54 | ) |
Unrealized gain on foreign notes | | — | | — | | — | | — | | — | | — | | 1,125 | | 1,125 | |
Cumulative translation adjustment | | — | | — | | — | | — | | — | | — | | 86 | | 86 | |
| | | | | | | | | | | | | | | | | |
Total comprehensive loss (Restated) | | | | | | | | | | | | | | | | (24,055 | ) |
| | | | | | | | | | | | | | | | | |
Balance at December 31, 2005 (Restated) | | 20,571 | | 2 | | 250,939 | | (97,430 | ) | (1,687 | ) | (65,325 | ) | 962 | | 89,148 | |
Issuance of common stock in offerings | | 3,776 | | — | | 64,406 | | — | | — | | — | | — | | 64,406 | |
Exercise of stock options | | 276 | | — | | 2,534 | | — | | — | | — | | — | | 2,534 | |
Treasury stock issued to employees as compensation | | — | | — | | 445 | | — | | 33 | | 342 | | — | | 787 | |
| | | | | | | | | | | | | | | | | |
Stock-based compensation from employee options | | — | | — | | 4,120 | | — | | — | | — | | — | | 4,120 | |
Stock-based compensation to consultants in exchange for services | | — | | — | | 23 | | — | | — | | — | | — | | 23 | |
Deemed dividend related to redeemable common stock | | — | | — | | — | | (99 | ) | — | | — | | — | | (99 | ) |
Lapse of rescission rights on redeemable common stock | | 446 | | — | | 3,304 | | — | | — | | — | | — | | 3,304 | |
Comprehensive loss (Restated): | | | | | | | | | | | | | | | | | |
Net loss (Restated) | | — | | — | | — | | (106,762 | ) | — | | — | | — | | (106,762 | ) |
| | | | | | | | | | | | | | | | | |
Unrealized (loss) on marketable securities | | — | | — | | — | | — | | — | | — | | (1,128 | ) | (1,128 | ) |
Cumulative translation adjustment | | — | | — | | — | | — | | — | | — | | 34 | | 34 | |
| | | | | | | | | | | | | | | | | |
Total comprehensive loss (Restated) | | | | | | | | | | | | | | | | (107,856 | ) |
| | | | | | | | | | | | | | | | | |
Balance at December 31, 2006 (Restated) | | 25,069 | | 2 | | 325,771 | | (204,291 | ) | (1,654 | ) | (64,983 | ) | (132 | ) | 56,367 | |
Exercise of stock options | | 354 | | — | | 3,230 | | — | | — | | — | | — | | 3,230 | |
Treasury stock issued for 401(k) matching contribution | | — | | — | | (391 | ) | — | | 26 | | 885 | | — | | 494 | |
Treasury stock issued for prior-year 401(k) discretionary contribution | | — | | — | | (412 | ) | — | | 23 | | 820 | | — | | 408 | |
| | | | | | | | | | | | | | | | | |
Stock-based compensation from employee options | | — | | — | | 4,522 | | — | | — | | — | | — | | 4,522 | |
Stock-based compensation to consultants in exchange for services | | — | | — | | 189 | | — | | — | | — | | — | | 189 | |
Stock-based compensation related to performance shares | | — | | — | | 1,000 | | — | | — | | — | | — | | 1,000 | |
Comprehensive loss (Restated): | | | | | | | | | | | | | | | | | |
Net loss (Restated) | | — | | — | | — | | (48,036 | ) | — | | — | | — | | (48,036 | ) |
| | | | | | | | | | | | | | | | | |
Unrealized gain on marketable securities | | — | | — | | — | | — | | — | | — | | 41 | | 41 | |
Cumulative translation adjustment | | — | | — | | — | | — | | — | | — | | (3 | ) | (3 | ) |
| | | | | | | | | | | | | | | | | |
Total comprehensive loss (Restated) | | | | | | | | | | | | | | | | (47,998 | ) |
| | | | | | | | | | | | | | | | | |
Balance at December 31, 2007 (Restated) | | 25,423 | | $ | 2 | | $ | 333,909 | | $ | (252,327 | ) | (1,605 | ) | $ | (63,278 | ) | $ | (94 | ) | $ | 18,212 | |
| | | | | | | | | | | | | | | | | | | | | | | | | | |
| | Common stock | |
| |
| | Treasury stock | |
| |
| |
|---|
| | Additional
Paid-in
capital | | Accumulated
Deficit | | Accumulated Other
Comprehensive
Income (Loss) | |
| |
|---|
| | Shares | | Amount | | Shares | | Amount | | Total | |
|---|
Balance at December 31, 2005 | | | 20,571 | | $ | 2 | | $ | 250,939 | | $ | (97,430 | ) | | (1,687 | ) | $ | (65,325 | ) | $ | 962 | | $ | 89,148 | |
Issuance of common stock in offerings | | | 3,776 | | | — | | | 64,406 | | | — | | | — | | | — | | | — | | | 64,406 | |
Exercise of stock options | | | 276 | | | — | | | 2,534 | | | — | | | — | | | — | | | — | | | 2,534 | |
Treasury stock issued for 401(k) matching contribution | | | — | | | — | | | 445 | | | — | | | 33 | | | 342 | | | — | | | 787 | |
Stock-based compensation from employee options | | | — | | | — | | | 4,120 | | | — | | | — | | | — | | | — | | | 4,120 | |
Stock-based compensation to consultants in exchange for services | | | — | | | — | | | 23 | | | — | | | — | | | — | | | — | | | 23 | |
Deemed dividend related to redeemable common stock | | | — | | | — | | | — | | | (99 | ) | | — | | | — | | | — | | | (99 | ) |
Lapse of rescission rights on redeemable common stock | | | 446 | | | — | | | 3,304 | | | — | | | — | | | — | | | — | | | 3,304 | |
Comprehensive loss: | | | | | | | | | | | | | | | | | | | | | | | | | |
| | Net loss | | | — | | | — | | | — | | | (106,762 | ) | | — | | | — | | | — | | | (106,762 | ) |
| | Unrealized (loss) on marketable securities | | | — | | | — | | | — | | | — | | | — | | | — | | | (1,128 | ) | | (1,128 | ) |
| | Cumulative translation adjustment | | | — | | | — | | | — | | | — | | | — | | | — | | | 34 | | | 34 | |
| | | | | | | | | | | | | | | | | | | | | | | | | |
Total comprehensive loss | | | | | | | | | | | | | | | | | | | | | | | | (107,856 | ) |
| | | | | | | | | | | | | | | | | | |
Balance at December 31, 2006 | | | 25,069 | | | 2 | | | 325,771 | | | (204,291 | ) | | (1,654 | ) | | (64,983 | ) | | (132 | ) | | 56,367 | |
Exercise of stock options | | | 354 | | | — | | | 3,230 | | | — | | | — | | | — | | | — | | | 3,230 | |
Treasury stock issued for 401(k) matching contribution | | | — | | | — | | | (391 | ) | | — | | | 26 | | | 885 | | | — | | | 494 | |
Treasury stock issued for prior-year 401(k) discretionary contribution | | | — | | | — | | | (412 | ) | | — | | | 23 | | | 820 | | | — | | | 408 | |
Stock-based compensation from employee options | | | — | | | — | | | 4,522 | | | — | | | — | | | — | | | — | | | 4,522 | |
Stock-based compensation to consultants in exchange for services | | | — | | | — | | | 189 | | | — | | | — | | | — | | | — | | | 189 | |
Stock-based compensation related to performance shares | | | — | | | — | | | 1,000 | | | — | | | — | | | — | | | — | | | 1,000 | |
Comprehensive loss: | | | | | | | | | | | | | | | | | | | | | | | | | |
| | Net loss | | | — | | | — | | | — | | | (48,036 | ) | | — | | | — | | | — | | | (48,036 | ) |
| | Unrealized gain on marketable securities | | | — | | | — | | | — | | | — | | | — | | | — | | | 41 | | | 41 | |
| | Cumulative translation adjustment | | | — | | | — | | | — | | | — | | | — | | | — | | | (3 | ) | | (3 | ) |
| | | | | | | | | | | | | | | | | | | | | | | | | |
Total comprehensive loss | | | | | | | | | | | | | | | | | | | | | | | | (47,998 | ) |
| | | | | | | | | | | | | | | | | | |
Balance at December 31, 2007 | | | 25,423 | | $ | 2 | | $ | 333,909 | | $ | (252,327 | ) | | (1,605 | ) | $ | (63,278 | ) | $ | (94 | ) | $ | 18,212 | |
Exercise of stock options | | | 113 | | | — | | | 1,471 | | | — | | | — | | | — | | | — | | | 1,471 | |
Treasury stock issued for 401(k) matching contribution | | | — | | | — | | | (41 | ) | | — | | | 2 | | | 60 | | | — | | | 19 | |
Purchase of treasury stock | | | — | | | — | | | — | | | — | | | (1,190 | ) | | (13,452 | ) | | — | | | (13,452 | ) |
Stock-based compensation from employee options | | | — | | | — | | | 4,022 | | | — | | | — | | | — | | | — | | | 4,022 | |
Stock-based compensation to consultants in exchange for services | | | — | | | — | | | 259 | | | — | | | — | | | — | | | — | | | 259 | |
Stock-based compensation related to performance shares | | | — | | | — | | | (1,000 | ) | | — | | | — | | | — | | | — | | | (1,000 | ) |
Comprehensive loss: | | | | | | | | | | | | | | | | | | | | | | | | | |
| | Net loss | | | — | | | — | | | — | | | (12,658 | ) | | — | | | — | | | — | | | (12,658 | ) |
| | Unrealized gain on marketable securities | | | — | | | — | | | — | | | — | | | — | | | — | | | 48 | | | 48 | |
| | Cumulative translation adjustment | | | — | | | — | | | — | | | — | | | — | | | — | | | 94 | | | 94 | |
Total comprehensive loss | | | | | | | | | | | | | | | | | | | | | | | | (12,516 | ) |
| | | | | | | | | | | | | | | | | | |
Balance at December 31, 2008 | | | 25,536 | | $ | 2 | | $ | 338,620 | | $ | (264,985 | ) | | (2,793 | ) | $ | (76,670 | ) | $ | 48 | | $ | (2,985 | ) |
(1) See “Note 3 – Restatement of Financial Statements.”
The accompanying notes are an integral part of these consolidated financial statements.
F-5
Table of Contents
Overstock.com, Inc.
Consolidated Statements of Cash Flows
(in thousands)
| | Year ended December 31, | |
| | 2005
(Restated) | | 2006
(Restated) | | 2007
(Restated) | |
Cash flows from operating activities of continuing operations: | | | | | | | |
Net loss | | $ | (25,212 | ) | $ | (106,762 | ) | $ | (48,036 | ) |
| | | | | | | |
Adjustments to reconcile net loss to net cash provided by (used in) operating activities of continuing operations: | | | | | | | |
Loss from discontinued operations | | 2,571 | | 6,882 | | 3,924 | |
Depreciation and amortization | | 14,111 | | 32,327 | | 29,495 | |
Realized loss (gain) on marketable securities | | 3,351 | | (2,085 | ) | — | |
Loss on disposition of property and equipment | | 1,457 | | 599 | | 1 | |
Stock-based compensation | | 72 | | 4,120 | | 4,522 | |
Stock-based compensation to consultants for services | | (389 | ) | 23 | | 189 | |
Stock-based compensation—performance shares | | — | | — | | (550 | ) |
Issuance of common stock from treasury for 401(k) matching contribution | | 443 | | 787 | | 494 | |
Amortization of debt discount and deferred financing fees | | 620 | | 417 | | 344 | |
Gain from retirement of convertible senior notes | | (6,158 | ) | — | | — | |
Asset impairment and depreciation (restructuring) | | — | | 791 | | 2,169 | |
Restructuring charges | | — | | 4,883 | | 10,114 | |
Notes receivable accretion | | — | | — | | (272 | ) |
Changes in operating assets and liabilities, net of effect of acquisition and discontinued operations: | | | | | | | |
Accounts receivable, net | | (8,755 | ) | (1,470 | ) | 4,822 | |
Inventories, net | | (48,245 | ) | 67,879 | | (1,773 | ) |
Prepaid inventory | | 2,689 | | 7,388 | | (1,331 | ) |
Prepaid expenses | | (5,022 | ) | 1,004 | | (99 | ) |
Other long-term assets | | (2,151 | ) | 496 | | 471 | |
Accounts payable | | 33,009 | | (35,400 | ) | 11,849 | |
Accrued liabilities | | 22,364 | | (11,573 | ) | (5,908 | ) |
Deferred revenue | | 9,182 | | 3,401 | | (255 | ) |
Other long-term liabilities | | — | | — | | (193 | ) |
| | | | | | | |
Net cash provided by (used in) operating activities of continuing operations | | (6,063 | ) | (26,293 | ) | 9,977 | |
| | | | | | | |
Cash flows from investing activities of continuing operations: | | | | | | | |
Change in restricted cash | | 1,349 | | 253 | | — | |
Purchases of marketable securities | | (185,543 | ) | — | | (75,217 | ) |
Sales of marketable securities | | 216,265 | | 56,756 | | 29,258 | |
Expenditures for property and equipment | | (44,642 | ) | (23,441 | ) | (2,643 | ) |
Acquisition of Ski West | | (25,111 | ) | — | | — | |
Proceeds from the sale of OTravel, net of cash transferred | | — | | — | | 9,892 | |
Collection of note receivable | | — | | — | | 5,196 | |
Proceeds from the sale of property and equipment | | — | | 1 | | — | |
Other investments | | — | | (100 | ) | — | |
Decrease in cash resulting from de-consolidation of variable interest entity | | — | | (102 | ) | — | |
| | | | | | | |
Net cash provided by (used in) investing activities of continuing operations | | (37,682 | ) | 33,367 | | (33,514 | ) |
| | | | | | | |
Cash flows from financing activities of continuing operatons: | | | | | | | |
Payments on capital lease obligations | | (7,086 | ) | (2,957 | ) | (5,261 | ) |
Drawdown on line of credit | | 11,868 | | 86,681 | | 2,423 | |
Payments on line of credit | | (11,868 | ) | (86,681 | ) | (2,423 | ) |
Payments to retire convertible senior notes | | (35,670 | ) | — | | — | |
Issuance of common stock in offerings, net of issuance costs | | — | | 64,406 | | — | |
Purchase of treasury stock | | (24,133 | ) | — | | — | |
Purchased call options for purchase of treasury stock | | (47,507 | ) | — | | — | |
Settlement of call options for cash | | 7,937 | | — | | — | |
Exercise of stock options and warrants | | 7,315 | | 2,534 | | 3,230 | |
| | | | | | | |
Net cash provided by (used in) financing activities of continuing operations | | (99,144 | ) | 63,983 | | (2,031 | ) |
| | | | | | | |
Effect of exchange rate changes on cash | | 86 | | 34 | | (3 | ) |
Cash (used in) provided by operating activies of discontinued operations | | (45 | ) | 1,581 | | (204 | ) |
Cash (used in) provided by investing activities of discontinued operations | | (98 | ) | (566 | ) | (53 | ) |
| | | | | | | |
Net increase (decrease) in cash and cash equivalents | | (142,946 | ) | 72,106 | | (25,828 | ) |
Less change in cash and cash equivalents from discontinued operations | | 143 | | (1,016 | ) | 257 | |
Cash and cash equivalents, beginning of year | | 198,678 | | 55,875 | | 126,965 | |
| | | | | | | |
Cash and cash equivalents from continuing operations, end of year | | $ | 55,875 | | $ | 126,965 | | $ | 101,394 | |
F-6
| | | | | | | | | | | | | |
| | Year ended December 31, | |
|---|
| | 2006 | | 2007 | | 2008 | |
|---|
Cash flows from operating activities of continuing operations: | | | | | | | | | | |
Net loss | | $ | (106,762 | ) | $ | (48,036 | ) | $ | (12,658 | ) |
Adjustments to reconcile net loss to net cash provided by (used in) operating activities of continuing operations: | | | | | | | | | | |
| | Loss from discontinued operations | | | 6,882 | | | 3,924 | | | — | |
| | Depreciation and amortization, including internal-use software and website development | | | 32,327 | | | 29,495 | | | 22,667 | |
| | Realized loss (gain) on marketable securities | | | (2,085 | ) | | — | | | 334 | |
| | Loss on settlement of notes receivable (Note 4) | | | — | | | — | | | 3,929 | |
| | Loss on disposition of fixed assets | | | 599 | | | 1 | | | 140 | |
| | Stock-based compensation to employees and directors | | | 4,120 | | | 4,522 | | | 4,022 | |
| | Stock-based compensation to consultants for services | | | 23 | | | 189 | | | 259 | |
| | Stock-based compensation relating to performance share plan | | | — | | | (550 | ) | | (1,000 | ) |
| | Issuance of common stock from treasury for 401(k) matching contribution | | | 787 | | | 494 | | | 19 | |
| | Amortization of debt discount | | | 417 | | | 344 | | | 334 | |
| | Gain from early extinguishment of debt | | | — | | | — | | | (2,849 | ) |
| | Asset impairment and depreciation (other non-cash restructuring charges) | | | 791 | | | 2,169 | | | — | |
| | Restructuring charges | | | 4,883 | | | 10,114 | | | — | |
| | Notes receivable accretion | | | — | | | (272 | ) | | (545 | ) |
| | Changes in operating assets and liabilities, net of effect of acquisition and discontinued operations: | | | | | | | | | | |
| | | Accounts receivable, net | | | (1,470 | ) | | 4,822 | | | 4,769 | |
| | | Inventories, net | | | 67,879 | | | (1,773 | ) | | 7,920 | |
| | | Prepaid inventory, net | | | 7,388 | | | (1,331 | ) | | 2,177 | |
| | | Prepaid expenses | | | 1,004 | | | (99 | ) | | (2,122 | ) |
| | | Other long-term assets, net | | | 496 | | | 471 | | | (516 | ) |
| | | Accounts payable | | | (35,400 | ) | | 11,849 | | | (8,238 | ) |
| | | Accrued liabilities | | | (11,573 | ) | | (5,908 | ) | | (12,281 | ) |
| | | Deferred revenue | | | 3,401 | | | (255 | ) | | (3,939 | ) |
| | | Other long-term liabilities | | | — | | | (193 | ) | | (462 | ) |
| | | | | | | | |
| | | | Net cash provided by (used in) operating activities of continuing operations | | | (26,293 | ) | | 9,977 | | | 1,960 | |
| | | | | | | | |
Cash flows from investing activities of continuing operations: | | | | | | | | | | |
| | Change in restricted cash | | | 253 | | | — | | | — | |
| | Purchases of marketable securities | | | — | | | (75,217 | ) | | (35,548 | ) |
| | Maturities of marketable securities | | | 56,756 | | | 29,258 | | | 64,542 | |
| | Sales of marketable securities prior to maturity | | | — | | | — | | | 7,740 | |
| | Expenditures for fixed assets, including internal-use software and website development | | | (23,441 | ) | | (2,643 | ) | | (18,690 | ) |
Table of Contents
Overstock.com, Inc.
Consolidated Statements of Cash Flows (Continued)
(in thousands)
Supplemental disclosures of cash flow information: | | | | | | | |
Interest paid | | $ | 5,108 | | $ | 3,677 | | $ | 3,882 | |
Equipment and software acquired under capital leases | | 15,438 | | 2,273 | | — | |
Asset retirement obligation | | — | | 450 | | — | |
Deemed dividend on redeemable common stock | | 185 | | 99 | | — | |
Lapse of rescission rights on redeemable common stock | | 146 | | 3,304 | | — | |
Settlement of purchased call options for treasury stock | | 41,121 | | — | | — | |
| | | | | | | |
Promissory note received in exchange for deconsolidation of variable interest entity | | — | | 6,702 | | — | |
Prior year discretionary 401(k) contribution settled in treasury stock | | — | | — | | 408 | |
Supplemental disclosure on non-cash investing activities: | | | | | | | |
Fair value of assets acquired | | 26,447 | | — | | — | |
Fair value of liabilities assumed | | (1,336 | ) | — | | — | |
| | | | | | | |
Cash paid to purchase business | | $ | 25,111 | | $ | — | | $ | — | |
| | | | | | | | | | | | | |
| | Year ended December 31, | |
|---|
| | 2006 | | 2007 | | 2008 | |
|---|
| | Proceeds from the sale of discontinued operations, net of cash transferred | | | — | | | 9,892 | | | — | |
| | Collection of note receivable | | | — | | | 5,196 | | | 1,506 | |
| | Proceeds from the sale of fixed assets | | | 1 | | | — | | | — | |
| | Other investments | | | (100 | ) | | — | | | — | |
| | Decrease in cash resulting from de-consolidation of variable interest entity | | | (102 | ) | | — | | | — | |
| | | | | | | | |
| | | | Net cash provided by (used in) investing activities of continuing operations | | | 33,367 | | | (33,514 | ) | | 19,550 | |
| | | | | | | | |
Cash flows from financing activities of continuing operations: | | | | | | | | | | |
| | Payments on capital lease obligations | | | (2,957 | ) | | (5,261 | ) | | (3,796 | ) |
| | Drawdowns on line of credit | | | 86,681 | | | 2,423 | | | 12,963 | |
| | Paydowns on line of credit | | | (86,681 | ) | | (2,423 | ) | | (12,963 | ) |
| | Payments to retire convertible senior notes | | | — | | | — | | | (6,550 | ) |
| | Issuance of common stock in offerings, net of issuance costs | | | 64,406 | | | — | | | — | |
| | Purchase of treasury stock | | | — | | | — | | | (13,452 | ) |
| | Exercise of stock options | | | 2,534 | | | 3,230 | | | 1,471 | |
| | | | | | | | |
| | | | Net cash provided by (used in) financing activities of continuing operations | | | 63,983 | | | (2,031 | ) | | (22,327 | ) |
| | | | | | | | |
Effect of exchange rate changes on cash | | | 34 | | | (3 | ) | | — | |
| | Cash used in operating activities of discontinued operations | | | 1,581 | | | (204 | ) | | — | |
| | Cash used in investing activities of discontinued operations | | | (566 | ) | | (53 | ) | | — | |
| | | | | | | | |
Net increase (decrease) in cash and cash equivalents | | | 72,106 | | | (25,828 | ) | | (817 | ) |
Less change in cash and cash equivalents from discontinued operations | | | (1,016 | ) | | 257 | | | — | |
Cash and cash equivalents, beginning of year | | | 55,875 | | | 126,965 | | | 101,394 | |
| | | | | | | | |
Cash and cash equivalents from continuing operations, end of year | | $ | 126,965 | | $ | 101,394 | | $ | 100,577 | |
| | | | | | | | |
Supplemental disclosures of cash flow information: | | | | | | | | | | |
| | Interest paid | | $ | 3,677 | | $ | 3,882 | | $ | 3,390 | |
| | Equipment and software acquired under capital leases | | | 2,273 | | | — | | | — | |
| | Asset retirement obligation | | | 450 | | | — | | | — | |
| | Deemed dividend on redeemable common stock | | | 99 | | | — | | | — | |
| | Lapse of rescission rights on redeemable common stock | | | 3,304 | | | — | | | — | |
| | Promissory notes received for sale of discontinued operations | | | — | | | 6,000 | | | — | |
| | Promissory note received in exchange for deconsolidation of variable interest entity | | | 6,702 | | | — | | | — | |
| | Prior year discretionary 401(k) contribution settled in treasury stock | | | 409 | | | 408 | | | — | |
The accompanying notes are an integral part of these consolidated financial statements.
F-7
Table of Contents
Overstock.com, Inc.
Notes to Consolidated Financial Statements
1. BUSINESS AND ORGANIZATION
Overstock.com, Inc. (the “Company”"Company") is an online “closeout”"closeout" retailer offering discount, brand-name merchandise for sale primarily over the Internet. The Company’sCompany's merchandise offerings include bed-and-bath goods, home décor, kitchenware, watches, jewelry, electronics and computers, sporting goods, apparel, and designer accessories, among other products. The Company also sells books, magazines, CDs, DVDs videocassettes and video games (“BMMG”("BMMG"). As part of its Website, the Company also offers on its Website an online auction service,—which acts as an online marketplace for the buying and selling of goods and services, as well as an online site for listing cars and homes for sale.
The Company was formed on May 5, 1997 as D2—Discounts Direct, a limited liability company. On December 30, 1998, the Company was reorganized as a C Corporation in the State of Utah and reincorporated in Delaware in May 2002. On October 25, 1999, the Company changed its name to Overstock.com, Inc. On July 23, 2003, the Company formed Overstock Mexico, S. de R. L. de C.V., a wholly owned subsidiary, to distribute products in Mexico.
The Company ceased operations of its Mexico Operations on October 24, 2008.
The Company has organized its operations into two principleprincipal segments based on the primary source of revenue: Direct revenue and Fulfillment partner revenue (see “Note 24—"Note 23—Business Segments”Segments").
2. SUMMARY OF SIGNIFICANT ACCOUNTING POLICIES
Principles of consolidation
The accompanying consolidated financial statements include the accounts of the Company and its wholly-owned subsidiaries. The consolidated financial statements include the accounts of the Company’sCompany's OTravel subsidiary through April 25, 2007 (see “Note 5—"Note 4—Acquisition and Subsequent Discontinued Operations”Operations"). The consolidated financial statements also include the accounts of a variable interest entity for which the Company was the primary beneficiary through November 30, 2006. All significant intercompany account balances and transactions have been eliminated in consolidation.
Use of estimates
The preparation of financial statements in conformity with generally accepted accounting principles requires estimates and assumptions that affect the reported amounts of assets and liabilities, revenues and expenses, and related disclosures of contingent liabilities in the consolidated financial statements and accompanying notes. Estimates are used for, but not limited to, valuation of investments, receivables valuation, revenue recognition, sales returns, incentive discount offers, inventory valuation, depreciable lives of fixed assets, internally-developed software, valuation of acquired intangibles, income taxes, stock-based compensation, and contingencies. Actual results could differ materially from those estimates.
Cash and Cash Equivalents
The Company classifies all highly liquid instruments, including money market funds with a remaining maturity of three months or less at the time of purchase, as cash equivalents.
Table of Contents
Overstock.com, Inc.
Notes to Consolidated Financial Statements (Continued)
2. SUMMARY OF SIGNIFICANT ACCOUNTING POLICIES (Continued)
Marketable Securities
Marketable securities consist of funds deposited into capital management accounts at twoone financial institutions.institution. The Company generally invests excess cash in “A”"A" rated or higher short- to intermediate-term fixed income securities and money market mutual funds, including municipal, government and corporate bonds and money market securities which are classified as cash or cash equivalents, or available-for-sale marketable securities on the consolidated balance sheets and are reported at fair value using the specific identification method. Realized gains and losses are included in other income (expense), net in the Consolidated Statements of Operations. Unrealized gains and losses are excluded from earnings and reported as a component of other comprehensive income (loss), net of related estimated tax provisions or benefits.
The Company periodically evaluates whether declines in fair values of its investments are other-than-temporary. This evaluation consists of a review of qualitative and quantitative factors, including quoted market prices, if available, other publicly available information, or other conditions that bear on the value of ourits investments. At December 31, 20062007 and 2007,2008, gross unrealized gains on marketable securities were zero$41,000 and $41,000,$48,000, respectively, and were determined to be temporary based on the Company’sCompany's assessment of the qualitative and quantitative factors discussed above. The Company recorded an "other than temporary" impairment of marketable securities of $300,000 and realized losses of $34,000 during the year ended December 31, 2008.
Fair value of financial instruments
The Company’sCompany's financial instruments, including cash, cash equivalents, notes receivable, accounts receivable, accounts payable and accrued liabilities are carried at cost, which approximates their fair value because of the short-term maturity of these instruments.
In September 2006, the Financial Accounting Standards Board ("FASB") issued SFAS No. 157,Fair Value Measurements ("SFAS No. 157"), which defines fair value, establishes guidelines for measuring fair value and expands disclosures regarding fair value measurements. SFAS No. 157 does not require any new fair value measurements but rather eliminates inconsistencies in guidance found in various prior accounting pronouncements. SFAS No. 157 is effective for fiscal years beginning after November 15, 2007. In February 2008, the FASB issued FASB Staff Position, ("FSP"), FAS No. 157-2,Effective Date of FASB Statement No. 157 ("FSP FAS No. 157-2"), which delayed the effective date of SFAS No. 157 to fiscal years beginning after November 15, 2008 and interim periods within those fiscal years for all non-financial assets and non-financial liabilities, except those that are recognized or disclosed at fair value in the financial statements on a recurring basis (at least annually). The Company adopted SFAS No. 157 on January 1, 2008, except as it applies to those non-financial assets and non-financial liabilities as described in FSP FAS No. 157-2, and it did not have a material impact on its consolidated financial position, results of operations or cash flows.
On a quarterly basis, the Company measures at fair value certain financial assets, including cash equivalents and available-for-sale securities. SFAS No. 157 specifies a hierarchy of valuation techniques based on whether the inputs to those valuation techniques are observable or unobservable. Observable inputs reflect market data obtained from independent sources, while unobservable inputs reflect the
Table of Contents
Overstock.com, Inc.
Notes to Consolidated Financial Statements (Continued)
2. SUMMARY OF SIGNIFICANT ACCOUNTING POLICIES (Continued)
Company's market assumptions. These two types of inputs have created the following fair-value hierarchy:
- •
- Level 1—Quoted prices for identical instruments in active markets;
- •
- Level 2—Quoted prices for similar instruments in active markets, quoted prices for identical or similar instruments in markets that are not active, and model-derived valuations in which all significant inputs and significant value drivers are observable in active markets; and
- •
- Level 3—Valuations derived from valuation techniques in which one or more significant inputs or significant value drivers are unobservable.
This hierarchy requires the Company to minimize the use of unobservable inputs and to use observable market data, if available, when determining fair value. The fair value of these financial assets was determined using the following levels of inputs as of December 31, 2008 (in thousands):
| | | | | | | | | | | | | | |
| | Fair Value Measurements
as of December 31, 2008: | |
|---|
| | Total | | Level 1 | | Level 2 | | Level 3 | |
|---|
Assets: | | | | | | | | | | | | | |
Cash equivalents—Money market mutual funds | |
$ |
100,577 | |
$ |
100,577 | |
$ |
— | |
$ |
— | |
Available-for-sale securities | | | 8,989 | | | 8,989 | | | — | | | — | |
| | | | | | | | | | |
| | Total assets | | $ | 109,566 | | $ | 109,566 | | $ | — | | $ | — | |
| | | | | | | | | | |
The estimated fair value of the Company’sCompany's 3.75% Convertible Senior Notes at December 31, 20062007 and 20072008 was $56.3$60.0 million and $60.0$38.1 million, respectively. The fair value of the convertible senior notes was derived using a convertible pricing model with observable market inputs, which include stock price, dividend payments, borrow costs, equity volatility, interest rates and interest spread.
Accounts receivable
Accounts receivable consist of trade amounts due from customers and from uncleared credit card transactions at period end. Accounts receivable are recorded at invoiced amounts and do not bear interest.
Allowance for Doubtful Accounts
The Company evaluates its allowance for doubtful accounts monthly. Account balances are written-off against the allowance when it is probable that the receivable will not be recovered. From time to time, the Company grants credit to certain of its business customers on normal credit terms (typically 30 days). The Company recordedperforms ongoing credit evaluations of its customers' financial condition and maintains an allowance for doubtful accounts receivable based upon its historical collection experience and expected collectability of $2.1all accounts receivable. The Company maintained an allowance for doubtful accounts receivable of $2.5 million and $2.5$1.6 million atas of December 31, 20062007 and 2007,2008, respectively.
Table of Contents
Overstock.com, Inc.
Notes to Consolidated Financial Statements (Continued)
2. SUMMARY OF SIGNIFICANT ACCOUNTING POLICIES (Continued)
Concentration of credit risk
Cash equivalents include short-term, highly liquid instruments with original maturities of 90 days or less. At December 31, 20062007 and 2007,2008, two banks held the Company’sCompany's cash and cash equivalents. The Company does not believe that, as a result of this concentration, it is subject to any unusual financial risk beyond the normal risk associated with commercial banking relationships.
Financial instruments that potentially subject the Company to significant concentrations of credit risk consist primarily of cash equivalents, investment securities, and receivables. The Company invests its cash primarily in money market, government and corporate securities which are uninsured.
F-8
Table of Contents
The Company’sCompany's accounts receivable are derived primarily from revenue earned from customers located in the United States. The Company maintains an allowance for doubtful accounts based upon the expected collectibilitycollectability of accounts receivable.
Inventories
Inventories, consisting of merchandise purchased for resale, are accounted for using a standard costing system which approximates the first-in-first-out (“FIFO”("FIFO") method of accounting, and are valued at the lower of cost or market value. The Company establishes reserves for estimated obsolescence or damage equal to the difference between the cost of inventory and the estimated market value based upon assumptions about future demand and market conditions. Once established, the original cost of the inventory less the related reserve represents the new cost basis of such products. Reversal of these reserves is recognized only when the related inventory has been sold or scrapped.
Prepaid inventory
Prepaid inventory represents inventory paid for in advance of receipt. Prepaid inventory at December 31, 20062007 and 20072008 was $2.2$3.6 million and $3.6 million,$761,000, respectively.
Prepaid expenses
Prepaid expenses represent expenses paid prior to receipt of the related goods or services, including advertising, maintenance, packaging, insurance and other miscellaneous costs. Total prepaid expenses at December 31, 20062007 and 20072008 were $7.5$7.6 million and $7.6$9.7 million, respectively.
Property and equipmentFixed Assets
Property and equipment,Fixed assets, which includes capitalized leases,assets such as furniture and fixtures, technology infrastructure, internal-use software and website development, are recorded at cost and depreciated using the straight-line method over the estimated useful lives of the related assets or the term of the related capital lease, whichever is shorter, as follows:
| | | | |
| | Years | |
|---|
Computer software | | Years
| 2-3 | |
Computer softwarehardware | | 3
| 3 | |
Computer hardware
| | 3
| |
Furniture and equipment | | 3-5
| 3-5 | |
Table of Contents
Overstock.com, Inc.
Notes to Consolidated Financial Statements (Continued)
2. SUMMARY OF SIGNIFICANT ACCOUNTING POLICIES (Continued)
Leasehold improvements are amortized over the shorter of the term of the related leases or estimated service lives. Depreciation expense is classified within the corresponding operating expense categories on our consolidated statements of operations, and certain assets are amortized as "Cost of goods sold." Upon sale or retirement of assets, cost and related accumulated depreciation are removed from the balance sheet and the resulting gain or loss is reflected in the consolidated statement of operations.
Internal-Use Software and Website Development
The Company includes in fixed assets the capitalized cost of internal-use software and website development, including software used to upgrade and enhance its Website and processes supporting the Company’sCompany's business. As required by Statement of Position ("SOP") 98-1,Accounting for the Costs of Computer Software Developed or Obtained for Internal Use, the Company capitalizes costs incurred during the application development stage of internal-use software and amortizes these costs over the estimated useful life of two to three years. The Company expenses costs incurred related to design or maintenance of internal-use software as incurred.
During the years ended December 31, 20062007 and 2007,2008, the Company capitalized $21.7$2.0 million and $2.0$9.0 million, respectively, of costs associated with internal-use software and website development.development, both developed internally and acquired externally. Amortization of costs associated with internal-use software and website development was $14.4$13.5 million and $13.5$11.6 million for those respective periods.
Leases
The Company accounts for its lease agreements pursuant to Statement of Financial Accounting Standards (“SFAS”("SFAS") No. 13,Accounting for Leases, which categorizes leases at their inception as either operating or capital leases depending on certain defined criteria. On certain of its lease agreements, the Company may receive rent holidays and other incentives. The Company recognizes lease costs on a straight-line basis without regard to deferred payment terms, such as rent holidays that defer the commencement date of required payments. Additionally, incentives it receives are treated as a reduction of our costs over the term of the agreement. Leasehold improvements are capitalized at cost and amortized over the lesser of their expected useful life or the life of the lease, without assuming renewal features, if any, are exercised.
Treasury Stock
The Company accounts for treasury stock under the cost method and includes treasury stock as a component of stockholders' equity (deficit).
Asset Retirement Obligation
In accordance with the Financial Accounting Standards Board (“FASB”) SFAS No. 143,Accounting for Asset Retirement Obligations, the Company establishes assets and liabilities for the present value of estimated future costs to return certain of our leased facilities to their original condition. Such assets are depreciated over the lease period into operating expense, and the recorded liabilities are accreted to the future value of the estimated restoration costs.
Table of Contents
Overstock.com, Inc.
Notes to Consolidated Financial Statements (Continued)
2. SUMMARY OF SIGNIFICANT ACCOUNTING POLICIES (Continued)
Other long-term assets
Other long-term assets include deposits, long-term prepaids, intangibles deferred financing and issuance costs and the fees associated with the acquisition of Overstock.com and other related domain names. The cost of the domain names is being amortized using the straight-line method over 5five years.
Impairment of long-lived assets
The Company reviews property and equipment and other long-lived assets for impairment whenever events or changes in circumstances indicate that the carrying amount of an asset may not be recoverable. Recoverability is measured by comparison of the assets’assets' carrying amount to future undiscounted net cash flows the assets are expected to generate. Cash flow forecasts are based on trends of historical performance and management’smanagement's estimate of future performance, giving consideration to existing and anticipated competitive and economic conditions. If such assets are considered to be impaired, the impairment to be recognized is measured by the amount by which the carrying amount of the assets exceeds the projected discounted future cash flows arising from the assets or their fair values, whichever is more determinable. The Company did not record any impairment of long-lived assets during 2005, 2006, 2007 and 2007.2008.
Goodwill
Goodwill represents the excess of the purchase price paid over the fair value of the tangible net assets acquired in business combinations.
In accordance with SFAS No. 142,Goodwill and Other Intangible Assets (“ ("SFAS 142”No. 142"), goodwill is not amortized but tested for impairment at least annually. When evaluating whether goodwill is impaired, the Company compares the fair value of the reporting unit to which the goodwill is assigned to its carrying amount. If
F-9
Table of Contents
the carrying amount exceeds its fair value, then the amount of the impairment loss must be measured. The impairment loss is calculated by comparing the implied fair value of the goodwill to its carrying amount. In calculating the implied fair value of goodwill, the fair value of the reporting unit is allocated to all the other assets and liabilities within the reporting unit based on fair value. The excess of the fair value of a reporting unit over the amount allocated to its other assets and liabilities is the implied fair value of goodwill. An impairment loss is recognized when the carrying amount of goodwill exceeds its implied fair value. The Company evaluated its goodwill during 20072008 and determined that no impairment charge should be recorded.
In conjunction with the discontinuance of the Company’sCompany's travel subsidiary (“OTravel”("OTravel"), the Company performed an evaluation of the goodwill associated with the reporting unit pursuant to SFAS No. 142 and SFAS No. 144,Accounting for the Impairment of Long-Lived Assets (“ ("SFAS 144”No. 144"), and determined that goodwill of approximately $4.5 million and $3.8 million was impaired in 2006 and 2007, respectively (see “Note 5—"Note 4—Acquisition and Subsequent Discontinued Operations”Operations").
Revenue recognition
The Company derives revenue primarily from two sources: direct revenue and fulfillment partner revenue, including listing fees and commissions collected from products being listed and sold through the Auctions tab of its Website as well as advertisement revenue derived from its cars and real estate listing business.businesses. The Company has organized its operations into two principal segments based on the
Table of Contents
Overstock.com, Inc.
Notes to Consolidated Financial Statements (Continued)
2. SUMMARY OF SIGNIFICANT ACCOUNTING POLICIES (Continued)
primary source of revenue: Direct revenue and Fulfillment partner revenue (see “Note 24—"Note 23—Business Segments).
Revenue is recognized when the following revenue recognition criteria are met: (1) persuasive evidence of an arrangement exists; (2) delivery has occurred or the service has been provided; (3) the selling price or fee revenue earned is fixed or determinable; and (4) collection of the resulting receivable is reasonably assured. Revenue related to merchandise sales is recognized upon delivery to the Company’sCompany's customers. As the Company ships high volumes of packages through multiple carriers, it is not practical for the Company to track the actual delivery date of each shipment. Therefore, the Company uses estimates to determine which shipments are delivered and therefore recognized as revenue at the end of the period. The delivery date estimates are based on average shipping transit times, which are calculated using the following factors: (i) the shipping carrier (as carriers differ in transit times); (ii) the fulfillment source (either the Company’sCompany's warehouses or those of its fulfillment partners); (iii) the delivery destination; and (iv) actual transit time experience, which shows that delivery date is typically one to eight business days from the date of shipment.
The Company evaluates the criteria outlined in EITF Issue No. 99-19,Reporting Revenue Gross as a Principal Versus Net as an Agent, in determining whether it is appropriate to record the gross amount of product sales and related costs or the net amount earned as commissions. When the Company is the primary obligor in a transaction, is subject to inventory risk, has latitude in establishing prices and selecting suppliers, or has several but not all of these indicators, revenue is recorded gross. If the Company is not the primary obligor in the transaction and amounts earned are determined using a fixed percentage, revenue is recorded on a net basis. Currently, the majority of both direct revenue and fulfillment partner revenue is recorded on a gross basis, as the Company is the primary obligor.
The Company periodically provides incentive offers to its customers to encourage purchases. Such offers include current discount offers, such as percentage discounts off current purchases, and other similar offers. Current discount offers, when acceptedused by its customers, are treated as a reduction to the purchase price of the related transaction.
Direct revenue
Direct revenue consists of merchandise sold through the Company’sCompany's Website to individual consumers and businesses that areis fulfilled from its leased warehouses.
Fulfillment partner revenue
Fulfillment partner revenue consists of merchandise sold through the Company’sCompany's Website and shipped by third parties directly to consumers and other businesses from warehouses maintained by the fulfillment partners.
During September 2004, the Company added an online auction service to its Website. The Auctions tab allows sellers to list items for sale, buyers to bid on items of interest, and users to browse through listed items online. The Company is not considered the seller of the majority of the items sold on the auction site and has no control over the pricing of the majority of those items. Therefore, for these sales, only the listing fees for items listed and commissions for items sold are recorded as revenue during the period items are listed or items are sold. TheFrom time to time, the Company also sells items returned from our shopping business through our auction business revenues were insignificant in 2005, 2006service, and 2007.for these sales, the revenue is
Table of Contents
Overstock.com, Inc.
Notes to Consolidated Financial Statements (Continued)
2. SUMMARY OF SIGNIFICANT ACCOUNTING POLICIES (Continued)
recorded on a gross basis. Revenue from the auctions business has been included in the fulfillment partner segment, as it is not large enough to separate out as its own segment at this early stage of the business.
segment.
During December 2006, the Company added an online site for listing cars for sale as a part of its Website. The cars listing service allows dealers to list vehicles for sale and allows buyers to review vehicle descriptions, post offers to purchase, and provides the means for purchasers to contact sellers for further information and negotiations on the purchase of an advertised vehicle. Revenue from its cars listing business is included in the fulfillment partner segment, as it is not significant enough to separate out as its own segment.
During August 2008, the Company added an online site for listing real estate for sale as a part of its Website. The real estate listing service allows customers to search active listings across the country. Listing categories include foreclosures, live and on-line auctions, for sale by owner listings, broker/agent listings and numerous aggregated classified ad listings. Revenue from the real estate business is included in the fulfillment partner segment, as it is not significant enough to separate out as a segment.
Deferred revenue.revenue
Payment is generally required by credit card at the point of sale. Amounts received prior to delivery of products or services provided are recorded as deferred revenue. In addition, amounts received in advance for Club O membership fees are recorded as deferred revenue and recognized ratably over the membership period. The Company sells gift cards and records related deferred revenue at the time of the sale. Revenue from a gift card is recognized when a customer redeems it. If a gift card is not redeemed, the Company recognizes revenue when the likelihood of its redemption becomes remote.
Reserve for returns.returns
Total revenue is recorded net of estimated returns. For products other than computers, electronics and mattresses the returns policy provides for a full refund of the cost of the merchandise and all shipping charges if the item shipped is returned unopened within 30 days of delivery. If the item is returned after 30 days of delivery, is opened or shows signs of wear, the transaction may only be eligible for a partial refund. For items shipped from the Computers and Electronics department, returns must be initiated within 20 days of the purchase date and must be received in the original condition within 30 days of purchase. Computer and Electronics items returned opened or received at the Company’s warehouse after 30 days may only qualify for up to a 70 percent refund. Damaged or defective mattresses qualify for a full refund only if the items are refused at the time of delivery.
The Company maintains a reserve for returns based on estimates of future product returns related to current period revenues and are estimated using historical returns experience. The Company analyzes historical returns, current economic trends and changes in customer demand and acceptance of ourits products when evaluating the adequacy of the sales returns reserve and other allowances in any accounting period. The reserve for returns was $4.6$6.9 million and $6.9$5.1 million at December 31, 20062007 and 2007,2008, respectively.
�� Allowance for doubtful accounts. From time to time, the Company grants credit to certain of our business customers on normal credit terms (typically 30 days). The Company performs ongoing credit evaluations of its customers’ financial condition and maintains an allowance for doubtful accounts receivable based upon its historical collection experience and expected collectibility of all accounts receivable.
Reserve for obsolete and damaged inventory.inventory
The Company writes down its inventory for estimated obsolescence or damage equal to the difference between the cost of inventory and the estimated market value based upon assumptions about future demand and market conditions. If actual market conditions are less favorable than those projected by management, additional inventory write-downs may be required. Once established, the original cost of the inventory less the related inventory reserve represents the new cost basis of such products. Reversal of these reserves is recognized only when the related inventory has been sold or scrapped.
F-10 At December 31, 2007, the Company's inventory balance was $25.6 million (including $3.1 million of inventory in-transit related to sales shipped but not yet delivered), net of allowance for obsolescence or damaged inventory of $1.8 million. At December 31, 2008, the Company's inventory balance was $17.7 million (including $2.8 million of inventory in-transit related to sales shipped but not yet delivered), net of allowance for obsolescence or damaged inventory of $2.1 million.
Table of Contents
Overstock.com, Inc.
Notes to Consolidated Financial Statements (Continued)
2. SUMMARY OF SIGNIFICANT ACCOUNTING POLICIES (Continued)
Cost of goods sold
Cost of goods sold includes product costs, warehousing costs, inbound and outbound shipping costs, handling and fulfillment costs, customer service costs and credit card fees, and areis recorded in the same period in which related revenues have been recorded. Fulfillment costs include warehouse handling labor costs, fixed warehouse costs, credit card fees and customer service costs. For the years ended December 31, 2005, 2006, 2007 and 2007,2008, fulfillment costs totaled $59.9 million, $60.9 million, and $47.1 million and $47.2 million, respectively.
| | | | | | | | | | | | | | | | | | | | |
| | Years ended December 31, | |
|---|
| | 2006 | | 2007 | | 2008 | |
|---|
| | (in thousands)
| |
|---|
Total revenue | | $ | 780,137 | | | 100 | % | $ | 765,902 | | | 100 | % | $ | 834,367 | | | 100 | % |
| | | | | | | | | | | | | | |
Cost of goods sold | | | | | | | | | | | | | | | | | | | |
| | Product costs and other cost of goods sold | | | 629,477 | | | 81 | % | | 594,276 | | | 78 | % | | 644,212 | | | 77 | % |
| | Fulfillment costs | | | 60,856 | | | 7 | % | | 47,076 | | | 6 | % | | 47,246 | | | 6 | % |
| | | | | | | | | | | | | | |
| | Total cost of goods sold | | |
690,333 | | |
88 |
% | |
641,352 | | |
84 |
% | |
691,458 | | |
83 |
% |
| | | | | | | | | | | | | | |
Gross profit | |
$ |
89,804 | | |
12 |
% |
$ |
124,550 | | |
16 |
% |
$ |
142,909 | | |
17 |
% |
| | | | | | | | | | | | | | |
| | Years ended December 31, | |
| | (in thousands) | |
| | 2005 | | 2006 | | 2007 | |
| | (Restated) | | (Restated) | | (Restated) | |
Total revenue | | $ | 794,975 | | 100 | % | $ | 780,137 | | 100 | % | $ | 765,902 | | 100 | % |
| | | | | | | | | | | | | |
Cost of goods sold | | | | | | | | | | | | | |
Product costs and other cost of goods sold | | 618,571 | | 78 | % | 629,477 | | 81 | % | 594,276 | | 78 | % |
Fulfillment costs | | 59,931 | | 7 | % | 60,856 | | 7 | % | 47,076 | | 6 | % |
| | | | | | | | | | | | | |
Total cost of goods sold | | 678,502 | | 85 | % | 690,333 | | 88 | % | 641,352 | | 84 | % |
| | | | | | | | | | | | | |
Gross profit | | $ | 116,473 | | 15 | % | $ | 89,804 | | 12 | % | $ | 124,550 | | 16 | % |
Advertising expense
The Company recognizes advertising expenses in accordance with SOP 93-7,Reporting on Advertising Costs. As such, the Company expenses the costs of producing advertisements at the time production occurs or the first time the advertising takes place and expenses the cost of communicating advertising in the period during which the advertising space or airtime is used. Internet advertising expenses are recognized as incurred based on the terms of the individual agreements, which are generally: 1) a commission for traffic driven to the Website that generates a sale or 2) a referral fee based on the number of clicks on keywords or links to our Website generated during a given period. Advertising expense included in sales and marketing expenses totaled $75.3 million, $68.1$68.1million, $51.0 million and $51.0$52.8 million during the years ended December 31, 2005, 2006, 2007 and 2007,2008, respectively.
Stock-based Compensation
As of January 1, 2006, the Company adopted SFAS No. 123(R)Share-based Payment (“ ("SFAS No. 123(R)”"), which requires the Company to measure compensation expense for all outstanding unvested share-based awards at fair value and recognize compensation expense over the service period for awards expected to vest. The estimation of stock awards that will ultimately vest requires judgment, and to the extent actual results differ from estimates, such amounts will be recorded as an adjustment in the period estimates are revised. Management considers many factors when estimating expected forfeitures, including types of awards, employee class, and historical experience. Actual results may differ substantially from these estimates (see “Note"Note 18—Stock Based Awards” and “Note 19—Performance Share Plan”Awards").
Table of Contents
Restructuring
Overstock.com, Inc.
Notes to Consolidated Financial Statements (Continued)
2. SUMMARY OF SIGNIFICANT ACCOUNTING POLICIES (Continued)
Restructuring
Restructuring expenses arecomprise primarily comprised of lease termination costs and the costs incurred for returning leased facilities back to their original condition in anticipation of subleasing current office space. SFAS 146,Accounting for Costs Associated with Exit or Disposal Activities, requires that when an entity ceases using a property that is leased under an operating lease before the end of its term contract, the termination costs should be recognized and measured at fair value when the entity ceases using the facility. Key assumptions in determining the restructuring expenses include the terms that may be negotiated to exit certain contractual obligations (see “Note 4—"Note 3—Restructuring Expense”Expense").
Income taxes
Income taxes are accounted for under the asset and liability method. Deferred income tax assets and liabilities are recognized for the future tax consequences attributable to differences between the financial statement carrying amounts of existing assets and liabilities and their respective tax basis using enacted tax rates in effect for the year in which the differences are expected to affect taxable income. Income tax expense (benefit) is the tax payable (receivable) for the period and the change during the period in the deferred tax assets and liabilities.
SFAS No. 109,Accounting for Income Taxes, requires that deferred tax assets be evaluated for future realization and be reduced by a valuation allowance to the extent the deferred tax asset will not be realized. The Company considers many factors when assessing the likelihood of future realization of ourits deferred assets including expectations of future taxable income, the carry-forward periods available for tax reporting purposes, and other relevant factors. At December 31, 20062007 and 2007,2008, the Company has established a full valuation allowance against its deferred tax assets. Significant judgment is required in making this assessment, and it is very difficult to predict when, if ever, ourthe Company's assessment may conclude that the remaining portion of the deferred tax assets are realizable.
Foreign currency translation
For the Company’sCompany's subsidiary located in Mexico, the subsidiary’ssubsidiary's local currency iswas considered its functional currency. As a result, all of the subsidiary’ssubsidiary's assets and liabilities arewere translated into U.S. dollars at exchange rates existing at the balance sheet dates, revenue and expenses arewere translated at weighted average exchange rates, and stockholders’stockholders' equity iswas recorded at historical exchange rates. The resulting foreign currency translation adjustments arewere recorded as a separate component of stockholders’stockholders' equity (deficit) in the consolidated balance sheets as part of accumulated other comprehensive income (loss). Transaction gains and losses arewere included in other income (expense) in the consolidated financial statements and havewere not been significant for any periodsperiod presented. The Company's subsidiary was located in Mexico and ceased operations on October 24, 2008.
Derivative instruments
SFAS No. 133,Accounting for Derivative Instruments and Hedging Activities (“ ("SFAS 133”133") requires companies to recognize their derivative instruments, including certain derivative instruments embedded in other contracts, as either assets or liabilities in the balance sheet at fair value. The accounting for changes in the fair value of a derivative instrument depends on whether the instrument has been designated and qualifies as part of a hedging relationship and further, on the type of hedging relationship. For those derivative instruments that are designated and qualify as hedging instruments, a
Table of Contents
Overstock.com, Inc.
Notes to Consolidated Financial Statements (Continued)
2. SUMMARY OF SIGNIFICANT ACCOUNTING POLICIES (Continued)
company must designate the hedging instrument, based upon the exposure being hedged, as a fair value hedge, a cash flow hedge or a hedge of a net investment in an international operation. For derivatives designated as hedges, the changes in fair value are recorded in the balance sheet as an item in other comprehensive income. Changes in the fair value of derivatives not designated as cash flow hedges are recorded in the statement of operations. As of December 31, 20062007 and 2007,2008, the Company had not designated any derivative instruments as hedges.
Earnings (loss) per share
In accordance with SFAS 128,Earnings per share, basic earnings (loss) per share is computed by dividing net income (loss) attributable to common shares by the
F-11
Table of Contents
weighted average number of common shares outstanding during the period. Diluted earnings (loss) per share is computed by dividing net income (loss) attributable to common shares for the period by the weighted average number of common and potential common shares outstanding during the period. Potential common shares, composed ofcomprising incremental common shares issuable upon the exercise of stock options, warrants, convertible senior notes, restricted stock units and shares under the Performance Share Plan, are included in the calculation of diluted net lossearnings (loss) per share to the extent such shares are dilutive.
The following table sets forth the computation of basic and diluted earnings (loss) per share for the periods indicated (in thousands):
| | | | | | | | | | | | |
| | Years ended December 31, | |
|---|
| | 2006 | | 2007 | | 2008 | |
|---|
Loss from continuing operations | | $ | (99,880 | ) | $ | (44,112 | ) | $ | (12,658 | ) |
Deemed dividend related to redeemable common stock | | | (99 | ) | | — | | | — | |
Loss from continuing operations attributable to common shares | | |
(99,979 |
) | |
(44,112 |
) | |
(12,658 |
) |
Loss from discontinued operations | | | (6,882 | ) | | (3,924 | ) | | — | |
Net loss attributable to common shares | |
$ |
(106,861 |
) |
$ |
(48,036 |
) |
$ |
(12,658 |
) |
Weighted average common shares outstanding—basic | | |
20,332 | | |
23,704 | | |
22,901 | |
Effect of dilutive securities: | | | | | | | | | | |
| | | Stock options and restricted units | | | — | | | — | | | — | |
| | | Convertible senior notes | | | — | | | — | | | — | |
| | | Shares under the Performance Share Plan | | | — | | | — | | | — | |
| | Restricted stock units | | | — | | | — | | | — | |
Weighted average common shares outstanding—diluted | | | 20,332 | | | 23,704 | | | 22,901 | |
Net loss per common share—basic and diluted: | | | | | | | | | | |
| | | Loss from continuing operations | | $ | (4.91 | ) | $ | (1.86 | ) | $ | (0.55 | ) |
| | | Loss from discontinued operations | |
$ |
(0.34 |
) |
$ |
(0.17 |
) |
$ |
— | |
| | | | | | | | |
Net loss per common share—basic and diluted | |
$ |
(5.25 |
) |
$ |
(2.03 |
) |
$ |
(0.55 |
) |
| | | | | | | | |
Table of Contents
| | Years ended December 31, | |
| | 2005 | | 2006 | | 2007 | |
| | (Restated) | | (Restated) | | (Restated) | |
Loss from continuing operations | | $ | (22,641 | ) | $ | (99,880 | ) | $ | (44,112 | ) |
Deemed dividend related to redeemable common stock | | (185 | ) | (99 | ) | — | |
| | | | | | | |
Loss from continuing operations attributable to common shares | | (22,826 | ) | (99,979 | ) | (44,112 | ) |
Loss from discontinued operations | | (2,571 | ) | (6,882 | ) | (3,924 | ) |
| | | | | | | |
Net loss attributable to common shares | | $ | (25,397 | ) | $ | (106,861 | ) | $ | (48,036 | ) |
| | | | | | | |
Weighted average common shares outstanding—basic | | 19,429 | | 20,332 | | 23,704 | |
Effective of dilutive securities: | | | | | | | |
Stock options and warrants | | — | | — | | — | |
Convertible senior notes | | — | | — | | — | |
Shares under the Performance Share Plan | | — | | — | | — | |
| | | | | | | |
Weighted average common shares outstanding—diluted | | 19,429 | | 20,332 | | 23,704 | |
| | | | | | | |
Net loss per common share—basic and diluted: | | | | | | | |
Loss from continuing operations | | $ | (1.17 | ) | $ | (4.91 | ) | $ | (1.86 | ) |
| | | | | | | |
Loss from discontinued operations | | $ | (0.13 | ) | $ | (0.34 | ) | $ | (0.17 | ) |
| | | | | | | |
Net loss per common share—basic and diluted | | $ | (1.30 | ) | $ | (5.25 | ) | $ | (2.03 | ) |
Overstock.com, Inc.
Notes to Consolidated Financial Statements (Continued)
2. SUMMARY OF SIGNIFICANT ACCOUNTING POLICIES (Continued)
The shares issuable related to stock options, warrants,restricted stock units, convertible senior notes outstanding and shares under the Performance Share Plan were not included in the computation of diluted earnings per share because to do so would have been antidilutive. The number of shares ofissuable related to stock options outstanding at each year-end was 1.3 million shares, 1.0 million shares, and 1.2 million shares and 974,000 shares for 2005, 2006, 2007 and 2007,2008, respectively. As of December 31, 2007,2008, the Company had $77.0$67.5 million of convertible senior notes outstanding (see “Note 12 - "Note 13—"Borrowings"—"3.75% Convertible Senior Notes”Notes"), which could potentially convert into 1.0 million885,000 shares of common stock in the aggregate. As of December 31, 2007, up to 376,000 shares could potentially be issued in relation to the Performance Share Plan based on growth in economic value as defined in the plan (see “Note 19—Performance Share Plan”).
Recent accounting pronouncements
In September 2006, the FASB issued SFAS No. 157, Fair Value Measurements (“SFAS 157”). SFAS 157 defines fair value, establishes a framework for measuring fair value and expands disclosures about fair value measurements. The FASB recently decided to postpone the effective date of SFAS 157 for other non-financial assets and liabilities for one year. SFAS 157 is effective for the Company as of January 1, 2008 for financial items and January 1, 2009 for other non-financial items. The Company anticipates that the adoption of SFAS 157 will not have a material impact on its consolidated financial statements.
In February 2007, the FASB issued SFAS No. 159,The Fair Value Option for Financial Assets and Financial Liabilities—including an amendment of FASB StatementLiabilities ("SFAS No. 115 (“SFAS 159”159"). Under SFAS No. 159, permits entities to choosecompanies may elect to measure manycertain financial instruments and certain other items at fair value. UnrealizedThe standard requires that unrealized gains and losses on items for which the fair value option has been elected will be recognizedreported in earnings at each subsequent reporting date.earnings. SFAS No. 159 is effective for the Company’s fiscal yearyears beginning after November 15, 2007. The Company adopted SFAS No. 159 on January 1, 2008; however, it did not elect to apply the fair value option to any financial instruments or other items upon adoption of SFAS No. 159 during the year ended December 31, 2008. The Company anticipates thatTherefore, the adoption of SFAS No. 159 willdid not have a material impact on itsthe Company's consolidated financial statements.position, results of operations or cash flows.
In December 2007, the FASB issued SFAS No. 141 (R),Business Combinations (“ ("SFAS 141(R)”No. 141 (R)"), and SFAS No. 160,Noncontrolling Interests in Consolidated Financial Statements (“ ("SFAS 160”No. 160"). SFAS 141(R)No. 141 (R) requires an acquirer to measure the identifiable assets acquired, the liabilities assumed and any noncontrolling interest in the acquireeacquired entity at their fair values on the acquisition date, with goodwill being the excess value over the net identifiable assets acquired. SFAS No. 160 clarifies that a noncontrolling interest in a subsidiary should be reported as equity in the consolidated financial statements. The calculation of earnings per share will continue to be based on income amounts attributable to the parent. SFAS 141(R)No. 141 (R) and SFAS No. 160 are effective for financial statements issued for fiscal years beginning after December 15, 2008. Early adoption is prohibited. The Company hasdoes not yet determinedexpect the effect on its consolidated financial statements, if any, upon adoption of SFAS 141(R)No. 141 (R) or SFAS 160.No. 160 to impact its financial position and results of operations or cash flows.
In December 2007,March 2008, the SECFASB issued Staff Accounting Bulletin (“SAB”)SFAS No. 110, 161,Certain Assumptions UsedDisclosures about Derivative Instruments and Hedging Activities—an amendment of FASB Statement No. 133 ("SFAS No. 161"). SFAS No. 161 requires enhanced disclosures about a company's derivative and hedging activities, in Valuation Methods—Expected Term (“SAB 110”). Accordingparticular: 1) how and why derivative instruments are utilized; 2) how derivative instruments and related hedged items are accounted for under SFAS No. 133 and its related interpretations; and 3) how derivative instruments and related hedged items affect a company's financial position, financial performance and cash flows. SFAS No. 161 is effective for financial statements issued for fiscal years and interim periods beginning after November 15, 2008, with early adoption encouraged. The Company has no derivative instruments. Therefore, the Company does not expect the adoption of SFAS No. 161 to SAB 110, under certain circumstanceshave a material impact its financial position and results of operations or cash flows.
In April 2008, the SEC staff will continue to accept the useFASB issued FSP No. 142-3,Determination of the simplified method as discussed in SABUseful Life of Intangible Assets ("FSP No. 107, Share Based Payment,142-3"). FSP No. 142-3 amends the factors that should be considered in developing an estimaterenewal or extension assumptions used to determine the useful life of expected term of “plain vanilla” share options in accordance witha recognized intangible asset under SFAS 123(R), beyond December 31, 2007. The Company will adopt SAB 110No. 142. FSP No. 142-3 is effective January 1, 2008 and will continue to use the simplified method in developing the expected term used for our valuation of stock-based compensation.financial statements issued for fiscal years beginning after
Reclassifications
Certain prior period amounts have been reclassified to conform to the current period’s presentation. The effect of these reclassifications had no impact on net income, total assets, total liabilities, or stockholders’ equity.
F-12
Table of Contents
3. RESTATEMENT OF FINANCIAL STATEMENTS
Overstock.com, Inc. (the “Company”)
Notes to Consolidated Financial Statements (Continued)
2. SUMMARY OF SIGNIFICANT ACCOUNTING POLICIES (Continued)
December 15, 2008. Early adoption is restatingprohibited. The Company does not expect the adoption of FSP No. 142-3 will have a material impact on its consolidated financial statements asstatements.
In May 2008, the FASB issued SFAS No. 162,The Hierarchy of December 31, 2007Generally Accepted Accounting Principles ("SFAS No. 162"). The current GAAP hierarchy was established by the American Institute of Certified Public Accountants, and 2006faced criticism because it was directed to auditors rather than entities. The issuance of this statement corrects this and makes some other hierarchy changes. This statement is effective 60 days following the Securities and Exchange Commission's approval of the Public Company Accounting Oversight Board amendments to AU Section 411,The Meaning of Present Fairly in Conformity with Generally Accepted Accounting Principles. The adoption of SFAS No. 162 did not result in a change to the Company's consolidated financial statements.
In May 2008, the FASB issued FASB Staff Position ("FSP") APB 14-1,Accounting for the years ended December 31, 2007, 2006 and 2005 to correct errors related toConvertible Debt Instruments That May Be Settled in Cash Upon Conversion (Including Partial Cash Settlement) ("FSP APB 14-1"), which clarifies the accounting for customer refundsconvertible debt instruments that may be settled in cash upon conversion, including partial cash settlement. FSP APB 14-1 specifies that an issuer of such instruments should separately account for the liability and credits andequity components of the accountinginstruments in a manner that reflect the issuer's non-convertible debt borrowing rate when interest costs are recognized in subsequent periods. FSP ABP 14-1 is effective for gift cards issued to customers.
The Company’s decision to restate the aforementioned financial statements was made as a result of management’s identification of errors related to the accountingissued for customer refundsfiscal years beginning after December 15, 2008 and credits. On October 20, 2008, management, including the CEO (principal executive officer) and Senior Vice President, Finance (principal financial officer), concluded, and the Board of Directors agreed with management’s conclusions that certain refunds and credits issued to customers were not completely and accurately recorded in the consolidated financial statements.
Management subsequently determined, and the Board of Directors adopted management’s conclusion, that a portion of the error previously believed to be related to the accounting for customer refunds and credits was actually related to the accounting for gift cards issued to customers and that gift cards issued to customers were not completely and accurately recorded in the consolidated financial statements.
These errors impacted accounts receivable and deferred revenue in the consolidated balance sheet as well as revenue and returns expense (a component of revenue), in the consolidated statement of operations. As a result, revenue, net of returns expense, was misstated in the consolidated statement of operations for the years ended December 31, 2007, 2006 and 2005 and accounts receivable and deferred revenue were misstated in the consolidated balance sheet as of December 31, 2007 and 2006.interim periods within those fiscal years. The amounts of these errors were determined to be material to the consolidated financial statements.
The effect of these error corrections on the Consolidated Results of Operations for the years ended December 31, 2007 and 2006 is to increase the net loss by $4.4 million (including reducing $1.7 million of direct revenue and $5.1 million of fulfillment partner revenue and reducing $246,000 of direct cost of goods sold and $2.2 million of fulfillment partner cost of goods sold) and $5.8 million (including reducing $3.7 million of direct revenue and $5.7 million of fulfillment partner revenue and increasing $1.0 million of direct cost of goods sold and $2.6 million of fulfillment partner cost of goods sold), respectively and for the year ended December 31, 2005 is to decrease the net loss by $440,000 (including increasing $26,000 of direct revenue and $80,000 of fulfillment partner revenue and decreasing $225,000 of direct cost of goods sold and increasing $109,000 of interest income). The cumulative effect of these errors at December 31, 2004 has been recorded as a $1.1 million adjustment to increase the beginning balance of retained earnings as of January 1, 2005.
In addition, from the Company’s inception through the third quarter of 2007, the Company had recorded revenue based on product ship date. In the fourth quarter of 2007, the Company determined that it should not record revenue until product delivery date because risk of loss transfers to the customer upon delivery and acceptance. In the fourth quarter of 2007, the Company performed a detailed analysis of this error and determinedanticipates that the adoption of FSP APB 14-1 will not have a material impact of this error on any prior annual or interim period was not material and the impact of recording the cumulative effect of the error in the fourth quarter of 2007 was immaterial to the full year. Therefore, the Company recorded the cumulative effect of the error in the fourth quarter of 2007. As the Company is now restating its previously issued consolidated financial statements to correct accounting errors related to customer refunds and credits and gift cards issued to customers, it has reversed the cumulative effect of the correction of the error in the fourth quarter of 2007 and restated all prior periods to reflect revenue recognition based on the product’s estimated delivery date in its consolidated financial statements for the years ended December 31, 2007, 2006, and 2005. The Company also recorded other miscellaneous adjustments as part of this restatement that were previously identified but determined to be immaterial.
The effect of this error correction related to product delivery date on the Consolidated Results of Operations for the years ended December 31, 2007 and 2006 is to decrease the net loss by $1.4 million (including recognizing $3.2 million of direct revenue and $9.4 million of fulfillment partner revenue and recognizing a corresponding $3.9 million of direct cost of goods sold and $7.3 million of fulfillment partner cost of goods sold) and $764,000 (including recognizing $2.0 million of direct revenue and deferring $607,000 of fulfillment partner revenue and recognizing $847,000 of direct cost of goods sold and deferring $199,000 of fulfillment partner cost of goods sold), respectively and increase the net loss for the year ended December 31, 2005 by $734,000 (including deferring $1.8 million of direct revenue and $2.7 million of fulfillment partner revenue and deferring $1.5 million of direct cost of goods sold and $2.2 million of fulfillment partner cost of goods sold). The cumulative effect of this error at December 31, 2004 has been recorded as a $1.4 million adjustment to reduce the beginning balance of retained earnings as of January 1, 2005.
F-13
Table of Contentsstatements.
The restated consolidated statements of operations and balance sheets have been restated as follows:
Consolidated Statements of Operations
(in thousands, except per share data)
| | Year Ended December 31, 2007 | |
| | As Previously
Reported | | Adjustments | | As Restated | |
| | | | | | | |
Revenue | | | | | | | |
Direct | | $ | 195,622 | | 1,466 | | $ | 197,088 | |
Fulfillment partner | | 564,539 | | 4,275 | | 568,814 | |
| | | | | | | |
Total revenue | | 760,161 | | 5,741 | | 765,902 | |
| | | | | | | |
Cost of goods sold | | | | | | | |
Direct | | 164,368 | | 3,640 | | 168,008 | |
Fulfillment partner | | 468,222 | | 5,122 | | 473,344 | |
| | | | | | | |
Total cost of goods sold | | 632,590 | | 8,762 | | 641,352 | |
| | | | | | | |
Gross profit | | 127,571 | | (3,021 | ) | 124,550 | |
| | | | | | | |
Operating expenses: | | | | | | | |
Sales and marketing | | 55,458 | | — | | 55,458 | |
Technology | | 59,453 | | — | | 59,453 | |
General and administrative | | 41,976 | | — | | 41,976 | |
Restructuring | | 12,283 | | — | | 12,283 | |
| | | | | | | |
Total operating expenses | | 169,170 | | — | | 169,170 | |
| | | | | | | |
Operating loss | | (41,599 | ) | (3,021 | ) | (44,620 | ) |
| | | | | | | |
Interest income | | 4,788 | | — | | 4,788 | |
Interest expense | | (4,188 | ) | — | | (4,188 | ) |
Other income, net | | (92 | ) | — | | (92 | ) |
| | | | | | | |
Loss from continuing operations | | (41,091 | ) | (3,021 | ) | (44,112 | ) |
Loss from discontinued operations | | (3,924 | ) | — | | (3,924 | ) |
Net loss | | (45,015 | ) | (3,021 | ) | (48,036 | ) |
Deemed dividend related to redeemable common shares | | — | | — | | — | |
| | | | | | | |
Net loss attributable to common shares | | $ | (45,015 | ) | $ | (3,021 | ) | $ | (48,036 | ) |
| | | | | | | |
Net loss per common share — basic and diluted | | | | | | | |
Loss from continuing operations | | $ | (1.73 | ) | $ | (0.13 | ) | $ | (1.86 | ) |
Loss from discontinued operations | | $ | (0.17 | ) | $ | — | | $ | (0.17 | ) |
Net loss per common share – basic and diluted | | $ | (1.90 | ) | $ | (0.13 | ) | $ | (2.03 | ) |
| | | | | | | |
Weighted average common shares outstanding — basic and diluted | | 23,704 | | | | 23,704 | |
F-14
Table of Contents
| | Year Ended December 31, 2006 | |
| | As Previously
Reported | | Adjustments | | As Restated | |
| | | | | | | |
Revenue | | | | | | | |
Direct | | $ | 303,202 | | (1,693 | ) | $ | 301,509 | |
Fulfillment partner | | 484,948 | | (6,320 | ) | 478,628 | |
| | | | | | | |
Total revenue | | 788,150 | | (8,013 | ) | 780,137 | |
| | | | | | | |
Cost of goods sold | | | | | | | |
Direct | | 284,943 | | (169 | ) | 284,774 | |
Fulfillment partner | | 408,407 | | (2,848 | ) | 405,559 | |
| | | | | | | |
Total cost of goods sold | | 693,350 | | (3,017 | ) | 690,333 | |
| | | | | | | |
Gross profit | | 94,800 | | (4,996 | ) | 89,804 | |
| | | | | | | |
Operating expenses: | | | | | | | |
Sales and marketing | | 70,897 | | — | | 70,897 | |
Technology | | 65,158 | | — | | 65,158 | |
General and administrative | | 46,837 | | — | | 46,837 | |
Restructuring | | 5,674 | | — | | 5,674 | |
| | | | | | | |
Total operating expenses | | 188,566 | | — | | 188,566 | |
| | | | | | | |
Operating loss | | (93,766 | ) | (4,996 | ) | (98,762 | ) |
| | | | | | | |
Interest income | | 3,566 | | — | | 3,566 | |
Interest expense | | (4,765 | ) | — | | (4,765 | ) |
Other income, net | | 81 | | — | | 81 | |
| | | | | | | |
Loss from continuing operations | | (94,884 | ) | (4,996 | ) | (99,880 | ) |
Loss from discontinued operations | | (6,882 | ) | — | | (6,882 | ) |
Net loss | | (101,766 | ) | (4,996 | ) | (106,762 | ) |
Deemed dividend related to redeemable common shares | | (99 | ) | — | | (99 | ) |
| | | | | | | |
Net loss attributable to common shares | | $ | (101,865 | ) | $ | (4,996 | ) | $ | (106,861 | ) |
| | | | | | | |
Net loss per common share — basic and diluted | | | | | | | |
Loss from continuing operations | | $ | (4.67 | ) | $ | (0.25 | ) | $ | (4.92 | ) |
Loss from discontinued operations | | $ | (0.34 | ) | $ | — | | $ | (0.34 | ) |
Net loss per common share – basic and diluted | | $ | (5.01 | ) | $ | (0.25 | ) | $ | (5.26 | ) |
| | | | | | | |
Weighted average common shares outstanding — basic and diluted | | 20,332 | | | | 20,332 | |
F-15
Table of Contents
| | Year Ended December 31, 2005 | |
| | As Previously Reported | | Adjustments | | As Restated | |
| | | | | | | |
Revenue | | | | | | | |
Direct | | $ | 324,875 | | (1,739 | ) | $ | 323,136 | |
Fulfillment partner | | 474,441 | | (2,602 | ) | 471,839 | |
| | | | | | | |
Total revenue | | 799,316 | | (4,341 | ) | 794,975 | |
| | | | | | | |
Cost of goods sold | | | | | | | |
Direct | | 282,383 | | (1,736 | ) | 280,647 | |
Fulfillment partner | | 400,057 | | (2,202 | ) | 397,855 | |
| | | | | | | |
Total cost of goods sold | | 682,440 | | (3,938 | ) | 678,502 | |
| | | | | | | |
Gross profit | | 116,876 | | (403 | ) | 116,473 | |
| | | | | | | |
Operating expenses: | | | | | | | |
Sales and marketing | | 77,155 | | — | | 77,155 | |
Technology | | 27,901 | | — | | 27,901 | |
General and administrative | | 33,043 | | — | | 33,043 | |
Restructuring | | — | | — | | — | |
| | | | | | | |
Total operating expenses | | 138,099 | | — | | 138,099 | |
| | | | | | | |
Operating loss | | (21,223 | ) | (403 | ) | (21,626 | ) |
| | | | | | | |
Interest income | | (270 | ) | 109 | | (161 | ) |
Interest expense | | (5,582 | ) | — | | (5,582 | ) |
Other income, net | | 4,728 | | — | | 4,728 | |
| | | | | | | |
Loss from continuing operations | | (22,347 | ) | (294 | ) | (22,641 | ) |
Loss from discontinued operations | | (2,571 | ) | — | | (2,571 | ) |
Net loss | | (24,918 | ) | (294 | ) | (25,212 | ) |
Deemed dividend related to redeemable common shares | | (185 | ) | — | | (185 | ) |
| | | | | | | |
Net loss attributable to common shares | | $ | (25,103 | ) | $ | (294 | ) | $ | (25,397 | ) |
| | | | | | | |
Net loss per common share — basic and diluted | | | | | | | |
Loss from continuing operations | | $ | (1.16 | ) | $ | (0.01 | ) | $ | (1.17 | ) |
Loss from discontinued operations | | $ | (0.13 | ) | $ | — | | $ | (0.13 | ) |
Net loss per common share – basic and diluted | | $ | (1.29 | ) | $ | (0.01 | ) | $ | (1.30 | ) |
| | | | | | | |
Weighted average common shares outstanding — basic and diluted | | 19,429 | | | | 19,429 | |
F-16
Table of Contents
Consolidated Balance Sheets
(in thousands)
| | As of December 31, 2007 | |
| | As Previously
Reported | | Adjustments | | As Restated | |
Assets | | | | | | | |
Current assets: | | | | | | | |
Cash and cash equivalents | | $ | 101,394 | | $ | — | | $ | 101,394 | |
Marketable securities | | 46,000 | | — | | 46,000 | |
Cash, cash equivalents and marketable securities | | 147,394 | | — | | 147,394 | |
Accounts receivable, net | | 12,304 | | (1,096 | ) | 11,208 | |
Note receivable | | 1,506 | | — | | 1,506 | |
Inventories, net | | 25,933 | | (290 | ) | 25,643 | |
Prepaid inventory | | 3,572 | | — | | 3,572 | |
Prepaid expenses | | 7,572 | | — | | 7,572 | |
| | | | | | | |
Total current assets | | 198,281 | | (1,386 | ) | 196,895 | |
| | | | | | | |
Property and equipment, net | | 27,197 | | — | | 27,197 | |
Goodwill | | 2,784 | | — | | 2,784 | |
Other long-term assets, net | | 86 | | — | | 86 | |
Notes receivable | | 4,181 | | — | | 4,181 | |
| | | | | | | |
Total assets | | 232,529 | | $ | (1,386 | ) | $ | 231,143 | |
| | | | | | | |
Liabilities, Redeemable Securities and Stockholders’ Equity | | | | | | | |
Current liabilities: | | | | | | | |
Accounts payable | | $ | 70,648 | | $ | (290 | ) | $ | 70,358 | |
Accrued liabilities | | 35,241 | | 1,914 | | 37,155 | |
Deferred revenue | | 17,357 | | 5,608 | | 22,965 | |
Capital lease obligations, current | | 3,796 | | — | | 3,796 | |
| | | | | | | |
Total current liabilities | | 127,042 | | 7,232 | | 134,274 | |
Other long-term liabilities | | 3,034 | | — | | 3,034 | |
Convertible senior notes | | 75,623 | | — | | 75,623 | |
| | | | | | | |
Total liabilities | | 205,699 | | 7,232 | | 212,931 | |
| | | | | | | |
Stockholders’ equity: | | | | | | | |
Preferred stock, $0.0001 par value, 5,000 shares authorized, no shares issued and outstanding as of December 31, 2007 | | — | | — | | — | |
Common stock, $0.0001 par value, 100,000 shares authorized, 25,423 shares issued as of December 31, 2007 | | 2 | | — | | 2 | |
Additional paid-in capital | | 333,909 | | — | | 333,909 | |
Accumulated deficit | | (243,709 | ) | (8,618 | ) | (252,327 | ) |
Treasury stock, 1,605 shares at cost as of December 31, 2004 | | (63,278 | ) | — | | (63,278 | ) |
Accumulated other comprehensive loss | | (94 | ) | — | | (94 | ) |
| | | | | | | |
Total stockholders’ equity | | 26,830 | | (8,618 | ) | 18,212 | |
| | | | | | | |
Total liabilities, redeemable securities and stockholders’ equity | | $ | 232,529 | | $ | (1,386 | ) | $ | 231,143 | |
F-17
Table of Contents
| | As of December 31, 2006 | |
| | As Previously
Reported | | Adjustments | | As Restated | |
Assets | | | | | | | |
Current assets: | | | | | | | |
Cash and cash equivalents | | $ | 126,965 | | $ | — | | $ | 126,965 | |
Marketable securities | | — | | — | | — | |
Cash, cash equivalents and marketable securities | | 126,965 | | — | | 126,965 | |
Accounts receivable, net | | 11,638 | | 4,692 | | 16,330 | |
Note receivable | | 6,702 | | — | | 6,702 | |
Inventories, net | | 20,274 | | 3,596 | | 23,870 | |
Prepaid inventory | | 2,241 | | — | | 2,241 | |
Prepaid expenses | | 7,473 | | — | | 7,473 | |
Current asset of held for sale subsidiary | | 4,718 | | — | | 4,718 | |
| | | | | | | |
Total current assets | | 180,011 | | 8,288 | | 188,299 | |
| | | | | | | |
Property and equipment, net | | 56,198 | | — | | 56,198 | |
Goodwill | | 2,784 | | — | | 2,784 | |
Other long-term assets, net | | 578 | | — | | 578 | |
Long-term assets of held for sale subsidiary | | 16,594 | | — | | 16,594 | |
| | | | | | | |
Total assets | | | | $ | 8,288 | | $ | 264,453 | |
| | | | | | | |
Liabilities, Redeemable Securities and Stockholders’ Equity | | | | | | | |
Current liabilities: | | | | | | | |
Accounts payable | | $ | 66,039 | | (7,622 | ) | $ | 58,412 | |
Accrued liabilities | | 37,492 | | 942 | | 38,434 | |
Deferred revenue | | 2,650 | | 20,570 | | 23,220 | |
Capital lease obligations, current | | 5,074 | | — | | 5,074 | |
Current liabilities of held for sale subsidiary | | 3,684 | | — | | 3,684 | |
| | | | | | | |
Total current liabilities | | 114,939 | | 13,885 | | 128,824 | |
Capital lease obligations, non-current | | 3,983 | | — | | 3,983 | |
Convertible senior notes | | 75,279 | | — | | 75,279 | |
| | | | | | | |
Total liabilities | | 194,201 | | 13,885 | | 208,086 | |
| | | | | | | |
Stockholders’ equity: | | | | | | | |
Preferred stock, $0.0001 par value, 5,000 shares authorized, no shares issued and outstanding as of December 31, 2005 | | — | | — | | — | |
Common stock, $0.0001 par value, 100,000 shares authorized, 25,069 shares issued as of December 31, 2005 | | 2 | | — | | 2 | |
Additional paid-in capital | | 325,771 | | — | | 325,771 | |
Accumulated deficit | | (198,694 | ) | (5,597 | ) | (204,291 | ) |
Treasury stock, 1,654 shares at cost as of December 31, 2005 | | (64,983 | ) | — | | (64,983 | ) |
Accumulated other comprehensive loss | | (132 | ) | — | | (132 | ) |
| | | | | | | |
Total stockholders’ equity | | 61,964 | | (5,597 | ) | 56,367 | |
| | | | | | | |
Total liabilities, redeemable securities and stockholders’ equity | | $ | 256,165 | | $ | 8,288 | | $ | 264,453 | |
F-18
Table of Contents
Overstock.com, Inc.
Consolidated Statements of Cash Flows
(in thousands)
| | Year ended December 31, 2005 | |
| | As Previously
Reported | | Adjustments | | As Reported | |
Cash flows from operating activities of continuing operations: | | | | | | | |
Net loss | | $ | (24,918 | ) | $ | (294 | ) | $ | (25,212 | ) |
| | | | | | | |
Adjustments to reconcile net loss to net cash provided by (used in) operating activities of continuing operations: | | | | | | | |
Loss from discontinued operations | | 2,571 | | — | | 2,571 | |
Depreciation and amortization | | 14,111 | | — | | 14,111 | |
Realized loss (gain) on marketable securities | | 3,351 | | — | | 3,351 | |
Loss on disposition of property and equipment | | 1,457 | | — | | 1,457 | |
Stock-based compensation | | 72 | | — | | 72 | |
Stock-based compensation to consultants for services | | (389 | ) | — | | (389 | ) |
Stock-based compensation—performance shares | | — | | — | | — | |
Issuance of common stock from treasury for 401(k) matching contribution | | 443 | | — | | 443 | |
Amortization of debt discount and deferred financing fees | | 620 | | — | | 620 | |
Gain from retirement of convertible senior notes | | (6,158 | ) | — | | (6,158 | ) |
Asset impairment and depreciation (restructuring) | | — | | — | | — | |
Restructuring charges | | — | | — | | — | |
Notes receivable accretion | | — | | — | | — | |
Changes in operating assets and liabilities, net of effect of acquisition and discontinued operations: | | | | | | | |
Accounts receivable, net | | (4,306 | ) | (4,449 | ) | (8,755 | ) |
Inventories, net | | (46,711 | ) | (1,534 | ) | (48,245 | ) |
Prepaid inventory | | 2,689 | | — | | 2,689 | |
Prepaid expenses | | (5,022 | ) | — | | (5,022 | ) |
Other long-term assets | | (2,151 | ) | — | | (2,151 | ) |
Accounts payable | | 35,210 | | (2,201 | ) | 33,009 | |
Accrued liabilities | | 22,131 | | 233 | | 22,364 | |
Deferred revenue | | 937 | | 8,245 | | 9,182 | |
Other long-term liabilities | | — | | — | | — | |
| | | | | | | |
Net cash provided by (used in) operating activities of continuing operations | | (6,063 | ) | — | | (6,063 | ) |
| | | | | | | |
Cash flows from investing activities of continuing operations: | | | | | | | |
Change in restricted cash | | 1,349 | | — | | 1,349 | |
Purchases of marketable securities | | (185,543 | ) | — | | (185,543 | ) |
Sales of marketable securities | | 216,265 | | — | | 216,265 | |
Expenditures for property and equipment | | (44,642 | ) | — | | (44,642 | ) |
Acquisition of Ski West | | (25,111 | ) | — | | (25,111 | ) |
Proceeds from the sale of OTravel, net of cash transferred | | — | | — | | — | |
Collection of note receivable | | — | | — | | — | |
Proceeds from the sale of property and equipment | | — | | — | | — | |
Other investments | | — | | — | | — | |
Decrease in cash resulting from de-consolidation of variable interest entity | | — | | — | | — | |
| | | | | | | |
Net cash provided by (used in) investing activities of continuing operations | | (37,682 | ) | — | | (37,682 | ) |
| | | | | | | |
Cash flows from financing activities of continuing operations: | | | | | | | |
Payments on capital lease obligations | | (7,086 | ) | — | | (7,086 | ) |
Drawdown on line of credit | | 11,868 | | — | | 11,868 | |
Payments on line of credit | | (11,868 | ) | — | | (11,868 | ) |
Payments to retire convertible senior notes | | (35,670 | ) | — | | (35,670 | ) |
Issuance of common stock in offerings, net of issuance costs | | — | | — | | — | |
Purchase of treasury stock | | (24,133 | ) | — | | (24,133 | ) |
Purchased call options for purchase of treasury stock | | (47,507 | ) | — | | (47,507 | ) |
Settlement of call options for cash | | 7,937 | | — | | 7,937 | |
Exercise of stock options and warrants | | 7,315 | | — | | 7,315 | |
| | | | | | | |
Net cash provided by (used in) financing activities of continuing operations | | (99,144 | ) | — | | (99,144 | ) |
| | | | | | | |
Effect of exchange rate changes on cash | | 86 | | — | | 86 | |
Cash (used in) provided by operating activities of discontinued operations | | (45 | ) | — | | (45 | ) |
Cash (used in) provided by investing activities of discontinued operations | | (98 | ) | — | | (98 | ) |
| | | | | | | |
Net increase (decrease) in cash and cash equivalents | | (142,946 | ) | — | | (142,946 | ) |
Less change in cash and cash equivalents from discontinued operations | | 143 | | — | | 143 | |
Cash and cash equivalents, beginning of year | | 198,678 | | — | | 198,678 | |
| | | | | | | |
Cash and cash equivalents from continuing operations, end of year | | $ | 55,875 | | — | | $ | 55,875 | |
| | | | | | | | | | |
F-19
Table of Contents
Overstock.com, Inc.
Consolidated Statements of Cash Flows
(in thousands)
| | Year ended December 31, 2006 | |
| | As Previously
Reported | | Adjustments | | As Reported | |
Cash flows from operating activities of continuing operations: | | | | | | | |
Net loss | | $ | (101,766 | ) | $ | (4,996 | ) | $ | (106,762 | ) |
| | | | | | | |
Adjustments to reconcile net loss to net cash provided by (used in) operating activities of continuing operations: | | | | | | | |
Loss from discontinued operations | | 6,882 | | — | | 6,882 | |
Depreciation and amortization | | 32,327 | | — | | 32,327 | |
Realized loss (gain) on marketable securities | | (2,085 | ) | — | | (2,085 | ) |
Loss on disposition of property and equipment | | 599 | | — | | 599 | |
Stock-based compensation | | 4,120 | | — | | 4,120 | |
Stock-based compensation to consultants for services | | 23 | | — | | 23 | |
Stock-based compensation—performance shares | | — | | — | | — | |
Issuance of common stock from treasury for 401(k) matching contribution | | 787 | | — | | 787 | |
Amortization of debt discount and deferred financing fees | | 417 | | — | | 417 | |
Gain from retirement of convertible senior notes | | — | | — | | — | |
Asset impairment and depreciation (restructuring) | | 791 | | — | | 791 | |
Restructuring charges | | 4,883 | | — | | 4,883 | |
Notes receivable accretion | | — | | — | | — | |
Changes in operating assets and liabilities, net of effect of acquisition and discontinued operations: | | | | | | | |
Accounts receivable, net | | (2,052 | ) | 582 | | (1,470 | ) |
Inventories, net | | 67,009 | | 870 | | 67,879 | |
Prepaid inventory | | 7,388 | | — | | 7,388 | |
Prepaid expenses | | 1,004 | | — | | 1,004 | |
Other long-term assets | | 496 | | — | | 496 | |
Accounts payable | | (35,200 | ) | (200 | ) | (35,400 | ) |
Accrued liabilities | | (12,633 | ) | 1,060 | | (11,573 | ) |
Deferred revenue | | 717 | | 2,684 | | 3,401 | |
Other long-term liabilities | | — | | — | | — | |
| | | | | | | |
Net cash provided by (used in) operating activities of continuing operations | | (26,293 | ) | — | | (26,293 | ) |
| | | | | | | |
Cash flows from investing activities of continuing operations: | | | | | | | |
Change in restricted cash | | 253 | | — | | 253 | |
Purchases of marketable securities | | — | | — | | — | |
Sales of marketable securities | | 56,756 | | — | | 56,756 | |
Expenditures for property and equipment | | (23,441 | ) | — | | (23,441 | ) |
Acquisition of Ski West | | — | | — | | — | |
Proceeds from the sale of OTravel, net of cash transferred | | — | | — | | — | |
Collection of note receivable | | — | | — | | — | |
Proceeds from the sale of property and equipment | | 1 | | — | | 1 | |
Other investments | | (100 | ) | — | | (100 | ) |
Decrease in cash resulting from de-consolidation of variable interest entity | | (102 | ) | — | | (102 | ) |
| | | | | | | |
Net cash provided by (used in) investing activities of continuing operations | | 33,367 | | — | | 33,367 | |
| | | | | | | |
Cash flows from financing activities of continuing operations: | | | | | | | |
Payments on capital lease obligations | | (2,957 | ) | — | | (2,957 | ) |
Drawdown on line of credit | | 86,681 | | — | | 86,681 | |
Payments on line of credit | | (86,681 | ) | — | | (86,681 | ) |
Payments to retire convertible senior notes | | — | | — | | — | |
Issuance of common stock in offerings, net of issuance costs | | 64,406 | | — | | 64,406 | |
Purchase of treasury stock | | — | | — | | — | |
Purchased call options for purchase of treasury stock | | — | | — | | — | |
Settlement of call options for cash | | — | | — | | — | |
Exercise of stock options and warrants | | 2,534 | | — | | 2,534 | |
| | | | | | | |
Net cash provided by (used in) financing activities of continuing operations | | 63,982 | | — | | 63,982 | |
| | | | | | | |
Effect of exchange rate changes on cash | | 34 | | — | | 34 | |
Cash (used in) provided by operating activities of discontinued operations | | 1,582 | | — | | 1,582 | |
Cash (used in) provided by investing activities of discontinued operations | | (566 | ) | — | | (566 | ) |
| | | | | | | |
Net increase (decrease) in cash and cash equivalents | | 72,106 | | — | | 72,106 | |
Less change in cash and cash equivalents from discontinued operations | | (1,016 | ) | — | | (1,016 | ) |
Cash and cash equivalents, beginning of year | | 55,875 | | — | | 55,875 | |
| | | | | | | |
Cash and cash equivalents from continuing operations, end of year | | $ | 126,965 | | — | | $ | 126,965 | |
| | | | | | | | | | |
F-20
Table of Contents
Overstock.com, Inc.
Consolidated Statements of Cash Flows
(in thousands)
| | Year ended December 31, 2007 | |
| | As Previously
Reported | | Adjustments | | As Reported | |
Cash flows from operating activities of continuing operations: | | | | | | | |
Net loss | | $ | (45,015 | ) | $ | (3,021 | ) | $ | (48,036 | ) |
| | | | | | | |
Adjustments to reconcile net loss to net cash provided by (used in) operating activities of continuing operations: | | | | | | | |
Loss from discontinued operations | | 3,924 | | — | | 3,924 | |
Depreciation and amortization | | 29,495 | | — | | 29,495 | |
Realized loss (gain) on marketable securities | | — | | — | | — | |
Loss on disposition of property and equipment | | 1 | | — | | 1 | |
Stock-based compensation | | 4,522 | | — | | 4,522 | |
Stock-based compensation to consultants for services | | 189 | | — | | 189 | |
Stock-based compensation—performance shares | | (550 | ) | — | | (550 | ) |
Issuance of common stock from treasury for 401(k) matching contribution | | 494 | | — | | 494 | |
Amortization of debt discount and deferred financing fees | | 344 | | — | | 344 | |
Gain from retirement of convertible senior notes | | — | | — | | — | |
Asset impairment and depreciation (restructuring) | | 2,169 | | — | | 2,169 | |
Restructuring charges | | 10,114 | | — | | 10,114 | |
Notes receivable accretion | | (272 | ) | — | | (272 | ) |
Changes in operating assets and liabilities, net of effect of acquisition and discontinued operations: | | | | | | | |
Accounts receivable, net | | (966 | ) | 5,788 | | 4,822 | |
Inventories, net | | (5,659 | ) | 3,886 | | (1,773 | ) |
Prepaid inventory | | (1,331 | ) | — | | (1,331 | ) |
Prepaid expenses | | (99 | ) | — | | (99 | ) |
Other long-term assets | | 471 | | — | | 471 | |
Accounts payable | | 4,512 | | 7,337 | | 11,849 | |
Accrued liabilities | | (6,880 | ) | 972 | | (5,908 | ) |
Deferred revenue | | 14,707 | | (14,962 | ) | (255 | ) |
Other long-term liabilities | | (193 | ) | — | | (193 | ) |
| | | | | | | |
Net cash provided by (used in) operating activities of continuing operations | | 9,977 | | — | | 9,977 | |
| | | | | | | |
Cash flows from investing activities of continuing operations: | | | | | | | |
Change in restricted cash | | — | | — | | — | |
Purchases of marketable securities | | (75,217 | ) | — | | (75,217 | ) |
Sales of marketable securities | | 29,258 | | — | | 29,258 | |
Expenditures for property and equipment | | (2,643 | ) | — | | (2,643 | ) |
Acquisition of Ski West | | — | | — | | — | |
Proceeds from the sale of OTravel, net of cash transferred | | 9,892 | | — | | 9,892 | |
Collection of note receivable | | 5,196 | | — | | 5,196 | |
Proceeds from the sale of property and equipment | | — | | — | | — | |
Other investments | | — | | — | | — | |
Decrease in cash resulting from de-consolidation of variable interest entity | | — | | — | | — | |
| | | | | | | |
Net cash provided by (used in) investing activities of continuing operations | | (33,514 | ) | — | | (33,514 | ) |
| | | | | | | |
Cash flows from financing activities of continuing operations: | | | | | | | |
Payments on capital lease obligations | | (5,261 | ) | — | | (5,261 | ) |
Drawdown on line of credit | | 2,423 | | — | | 2,423 | |
Payments on line of credit | | (2,423 | ) | — | | (2,423 | ) |
Payments to retire convertible senior notes | | — | | — | | — | |
Issuance of common stock in offerings, net of issuance costs | | — | | — | | — | |
Purchase of treasury stock | | — | | — | | — | |
Purchased call options for purchase of treasury stock | | — | | — | | — | |
Settlement of call options for cash | | — | | | | — | |
Exercise of stock options and warrants | | 3,230 | | — | | 3,230 | |
| | | | | | | |
Net cash provided by (used in) financing activities of continuing operations | | (2,031 | ) | — | | (2,031 | ) |
| | | | | | | |
Effect of exchange rate changes on cash | | (3 | ) | — | | (3 | ) |
Cash (used in) provided by operating activities of discontinued operations | | (204 | ) | — | | (204 | ) |
Cash (used in) provided by investing activities of discontinued operations | | (53 | ) | — | | (53 | ) |
| | | | | | | |
Net increase (decrease) in cash and cash equivalents | | (25,828 | ) | — | | (25,828 | ) |
Less change in cash and cash equivalents from discontinued operations | | 257 | | — | | 257 | |
Cash and cash equivalents, beginning of year | | 126,965 | | — | | 126,965 | |
| | | | | | | |
Cash and cash equivalents from continuing operations, end of year | | $ | 101,394 | | — | | $ | 101,394 | |
| | | | | | | | | | |
F-21
Table of Contents
4.3. RESTRUCTURING EXPENSE
During the fourth quarter of 2006, the Company began a facilities consolidation and restructuring program designed to reduce the overall expense structure in an effort to improve future operating performance. The facilities consolidation and restructuring program was substantially completed by the end of the second quarter of 2007. The Company incurred no restructuring charges during the third or fourth quarters of 2007.
During fiscal year 2006, the Company recorded $5.7 million of restructuring charges, of which $4.6 million related to costs to terminate a co-location data center lease. Other costs included in the restructuring charge related to $638,000 of accelerated depreciation of leasehold improvements in the Company’sCompany's current office facilities that the Company is attempting to sublease,subleasing, and $450,000 of costs to return these office facilities to their original condition as required by the lease agreement.
During fiscal year 2007, the Company recorded $12.3 million of restructuring charges, of which $9.9 million related to the termination of a logistics services agreement, termination and settlement of a lease related to vacated warehouse facilities in Indiana, and abandonment and marketing for sub-lease office and data center space in the Company’sCompany's current corporate office facilities. The Company also recorded an additional $2.2 million of restructuring charges related to accelerated depreciation of leasehold improvements located in the abandoned office and co-location data center space and $200,000 of other miscellaneous restructuring charges.
Table of Contents
Overstock.com, Inc.
Notes to Consolidated Financial Statements (Continued)
3. RESTRUCTURING EXPENSE (Continued)
Restructuring liabilities along with charges to expense cash payments or accelerated depreciation of leasehold improvements associated with the facilities consolidation and restructuring program were as follows (in thousands):
| | Balance
12/31/2006 | | Charges to
Expense | | Cash
payment or
accelerated depreciation | | Balance
12/31/2007 | |
Lease and contract termination costs | | $ | 5,499 | | $ | 9,914 | | $ | (11,378 | ) | $ | 4,035 | |
Asset retirement obligation | | 450 | | — | | (450 | ) | — | |
Accelerated depreciation of leasehold improvements | | — | | 2,169 | | (2,169 | ) | — | |
Other restructuring expenses | | — | | 200 | | (200 | ) | — | |
| | | | | | | | | |
Total | | $ | 5,949 | | $ | 12,283 | | $ | (14,197 | ) | $ | 4,035 | |
| | | | | | | | | | | | | |
| | Balance
12/31/2007 | | Charges to
Expense | | Cash payment or
accelerated depreciation | | Balance
12/31/2008 | |
|---|
Lease and contract termination costs | | $ | 4,035 | | $ | — | | $ | 851 | | $ | 3,184 | |
| | | | | | | | | | |
Total | |
$ |
4,035 | |
$ |
— | |
$ |
851 | |
$ |
3,184 | |
| | | | | | | | | | |
Under the restructuring program, the Company has recorded $18.0 million in restructuring charges through the end of fiscal yearthe second quarter of 2007, including $5.7 million in fiscal year 2006 and $12.3 million in fiscal year 2007, respectively.2007. There were no restructuring charges during the year ended December 31, 2008. The costs incurred to date within each restructuring category approximate the costs that the Company had anticipated at the beginning of the program. The Company believes that, except for the additional lease and contract termination costs related to potentially abandoning and subleasing its current office facilities, the restructuring program is substantially complete. However, as part of the program, the Company is still considering a complete relocation of itsIf we determine to move our corporate office facilities, which would result in additionalheadquarters we expect to incurr future restructuring charges, primarily for lease and contract termination costs.expenses.
5.4. ACQUISITION AND SUBSEQUENT DISCONTINUED OPERATIONS
On July 1, 2005, the Company acquired all the outstanding capital stock of Ski West, Inc. (“("Ski West”West") for an aggregate of $25.1 million (including $111,000 of capitalized acquisition related expenses).
Ski West was an on-line travel company whose proprietary technology provided consumer access to a large, fragmented, hard-to-find inventory of lodging, vacation, cruise and transportation bargains. The travel offerings were primarily in popular ski areas in the U.S. and Canada. Effective upon the closing, Ski West became a wholly-owned subsidiary of the Company, integrated the Ski West travel offerings with the Company’sCompany's existing travel offerings and changed its name to OTravel.com, Inc (“OTravel”("OTravel").
During the fourth quarter of 2006, in conjunction with the facilities consolidation and restructuring program described in Note 3, management decided to sell OTravel. The Company evaluated its plan to sell OTravel in accordance with SFAS No. 144, Accounting for the Impairment of Long-lived Assets (“SFAS 144”), which requires that long-lived assets be classified as held for sale only when certain criteria are met. The Company classified the OTravel assets and liabilities as “held for sale” as it met these criteria as of December 31, 2006, which include: management’s commitment to a plan to sell the assets; availability of the assets for immediate sale in their present condition; an active program to locate buyers and other actions to sell the assets has been initiated; sale of the assets is probable and their transfer is expected to qualify for recognition as a completed sale within one year; assets are being marketed at reasonable prices in relation to their fair value; and unlikelihood that significant changes will be made to the plan to the sell the assets. Results of operations for the subsidiary were included in the fulfillment partner segment prior to being classified as discontinued operations.
sale.
The Company also determined that the OTravel subsidiary met the definition of a “component"component of an entity”entity" and has been accounted for as a discontinued operation under SFAS No. 144. The results of operations for this subsidiary have been classified as discontinued operations in all periods presented.until its sale on April 25, 2007. In conjunction with the discontinuance of OTravel, the Company performed an evaluation of the goodwill associated with the reporting unit pursuant to SFAS No. 142 and SFAS No. 144 and
F-22
Table of Contents
determined that goodwill of approximately $4.5 million was impaired as of December 31, 2006, based on a non-binding letter of intent from a third party to purchase this business. During the quarter ended March 31, 2007, the Company received a revised offer from this third party to purchase its OTravel business and, in April 2007, the Company completed the sale of OTravel under these revised terms. Accordingly, the Company evaluated its goodwill as of March 31, 2007 and, based on the estimated fair value of the discounted cash flows of the net proceeds from the sale, determined that an additional $3.8 million of goodwill was impaired.
Table of Contents
Overstock.com, Inc.
Notes to Consolidated Financial Statements (Continued)
4. ACQUISITION AND SUBSEQUENT DISCONTINUED OPERATIONS (Continued)
On April 25, 2007, the Company completed the sale of OTravel.com to Castles Travel, Inc., an affiliate of Kinderhook Industries, LLC, and Castles Media Company LLC, for $17.0 million. The Company received cash proceeds, net of cash transferred, of $9.9 million and two $3.0 million promissory notes. The $3.0 million senior note maturesmatured three years from the closing date and bearsbore interest, payable quarterly, of 4.0%, 10.0% and 14.0% per year in the first, second and third years, respectively. The $3.0 million junior note maturesmatured five years from the closing date and bearsbore interest of 8.0% per year, compounded annually, and iswas payable in full at maturity.
On January 21, 2009, the Company entered into a Note Purchase Agreement to sell both the senior and junior promissory notes to to Castles Travel, Inc. for approximately $1.3 million in cash and recognized a loss on the settlement of these notes and interest receivable of approximately $3.9 million as of December 31, 2008.
The following table is a summary of the Company’sCompany's discontinued operations for the years ended December 31 2005 and 2006, and the period ended April 25, 2007 (in thousands):
| | | | | | | | |
| | Year ended
December 31, 2006 | | Year-to-date period
ended April 25, 2007 | |
|---|
Sales | | $ | 8,217 | | $ | 2,226 | |
Cost of sales | | | (1,848 | ) | | (650 | ) |
| | | | | | |
Gross profit | | |
6,369 | | |
1,576 | |
Sales and marketing | | | (1,888 | ) | | (447 | ) |
Technology | | | (481 | ) | | (60 | ) |
General and administrative | | | (6,422 | ) | | (1,152 | ) |
Goodwill impairment | | | (4,460 | ) | | (3,841 | ) |
| | | | | | |
| | Loss from discontinued operations | |
$ |
(6,882 |
) |
$ |
(3,924 |
) |
| | | | | | |
| | Year ended
December 31, 2005 | | Year ended
December 31, 2006 | | Year-to-date period
ended April 25, 2007 | |
Sales | | $ | 4,506 | | $ | 8,217 | | $ | 2,226 | |
Cost of sales | | (832 | ) | (1,848 | ) | (650 | ) |
| | | | | | | |
Gross profit | | 3,674 | | 6,369 | | 1,576 | |
Sales and marketing | | (2,500 | ) | (1,888 | ) | (447 | ) |
Technology | | (242 | ) | (481 | ) | (60 | ) |
General and administrative | | (3,503 | ) | (6,422 | ) | (1,152 | ) |
Goodwill impairment | | — | | (4,460 | ) | (3,841 | ) |
| | | | | | | |
Loss from discontinued operations | | $ | (2,571 | ) | $ | (6,882 | ) | $ | (3,924 | ) |
5. MARKETABLE SECURITIES
The held for sale assets and liabilities consisted of the following (in thousands):
| | December 31, 2006 | |
Assets of held for sale subsidiary: | | | |
Cash | | $ | 1,365 | |
Accounts receivable, net | | 3,267 | |
Property and equipment, net | | 1,215 | |
Goodwill and intangible assets, net | | 15,379 | |
Other | | 86 | |
| | | |
Total assets of discontinued operations | | $ | 21,312 | |
| | | |
Liabilities of held for sale subsidiary: | | | |
Current liabilities: | | | |
Accounts payable | | $ | 2,947 | |
Accrued liabilities | | 737 | |
| | | |
Total liabilities of discontinued operations | | $ | 3,684 | |
6. MARKETABLE SECURITIES
The Company’sCompany's marketable securities are reported at fair value with the related unrealized gains and losses included in accumulated other comprehensive income (loss), a component of shareholders’shareholders' equity, net of any tax effect. Realized gains or losses on the sale of marketable securities are determined using the specific-identification method.
The Company evaluates its investments periodically for possible other-than-temporary impairment by reviewing factors such as the length of time and extent to which fair value has been below cost basis, the financial condition of the issuer and the Company’sCompany's ability and intent to hold the investment for a period of time which may be sufficient for anticipated recovery of market value. The Company records an impairment charge to the extent that the carrying value of our available for sale securities exceeds the estimated fair market value of the securities and the decline in value is determined to be other-than-temporary. The Company did not record anyrecorded $300,000 of impairment charges related to other-than temporaryother-than-temporary decline in value of its marketable securities for the years endingyear ended December 31, 2007 or 2006.
2008. No related impairment charges were recorded for the year ended December 31, 2007.
As of December 31, 2007,2008, the Company’sCompany's marketable securities consisted of U.S. agency securities and top tier commercial paper, and AAA-rated asset-backed securities collateralized by automobile loans/leases and credit card receivables.paper. All marketable securities are classified as available-for-sale securities.
Table of Contents
Overstock.com, Inc.
Notes to Consolidated Financial Statements (Continued)
5. MARKETABLE SECURITIES (Continued)
The following table summarizes the Company’sCompany's marketable security investments as of December 31, 2007 (in thousands):
| | | | | | | | | | | |
| | Cost | | Net Unrealized
Gains (Losses) | | Estimated Fair
Market Value | |
|---|
Marketable securities: | | | | | | | | | | |
U.S. Agency Securities | | $ | 29,793 | | $ | 23 | | $ | 29,816 | |
Commercial Paper | | | 12,671 | | | 6 | | | 12,677 | |
Asset-Backed Securities | | | 3,495 | | | 12 | | | 3,507 | |
| | | | | | | | |
| | Total available-for-sale investments | |
$ |
45,959 | |
$ |
41 | |
$ |
46,000 | |
The following table summarizes the Company's marketable security investments as of December 31, 2008 (in thousands):
| | Cost | | Net Unrealized
Gains (Losses) | | Estimated Fair
Market Value | |
Marketable securities: | | | | | | | |
U.S. Agency Securities | | $ | 29,793 | | $ | 23 | | $ | 29,816 | |
Commercial Paper | | 12,671 | | 6 | | 12,677 | |
Asset-Backed Securities | | 3,495 | | 12 | | 3,507 | |
| | | | | | | |
Total available-for-sale investments | | $ | 45,959 | | $ | 41 | | $ | 46,000 | |
| | | | | | | | | | | | | | |
| | Cost | | Realized
Loss | | Net Unrealized
Gains | | Estimated Fair
Market Value | |
|---|
Marketable securities: | | | | | | | | | | | | | |
U.S. Agency Securities | | $ | 8,941 | | $ | — | | $ | 48 | | $ | 8,989 | |
Asset-Backed Securities | | | 300 | | | 300 | | | — | | | — | |
| | | | | | | | | | |
| | Total available-for-sale investments | |
$ |
9,241 | |
$ |
300 | |
$ |
48 | |
$ |
8,989 | |
The components of realized gains and losses on sales and impairment of marketable securities for the years ended December 31, 2005, 2006, 2007 and 20072008 were (in thousands):
F-23
| | | | | | | | | | |
| | Years ended December 31, | |
|---|
| | 2006 | | 2007 | | 2008 | |
|---|
Gross gains | | $ | 2,141 | | $ | — | | $ | — | |
Gross losses | | | (56 | ) | | — | | | (334 | ) |
| | | | | | | | |
Net realized gain (loss) on sales of marketable securities | |
$ |
2,085 | |
$ |
— | |
$ |
(334 |
) |
| | | | | | | | |
Table of Contents
| | Years ended December 31, | |
| | 2005 | | 2006 | | 2007 | |
Gross gains | | $ | — | | $ | 2,141 | | $ | — | |
Gross losses | | (3,351 | ) | (56 | ) | — | |
| | | | | | | |
Net realized gain (loss) on sales of marketable securities | | $ | (3,351 | ) | $ | 2,085 | | $ | — | |
Derivative instruments
During the first quarter of 2005, the Company purchased $49.9 million of Foreign Corporate Securities (“("Foreign Notes”Notes") which were scheduled to mature for $50.0 million in cash in November 2006. The Foreign Notes did not have a stated interest rate, but were structured to return the entire principal amount and a conditional coupon if held to maturity. The conditional coupon would provide a rate of return dependent on the performance of a “basket”"basket" of eight Asian currencies against the U.S. dollar. If the Company redeemed the Foreign Notes prior to maturity, the Company would not realize the full amount of its initial investment.
The Company purchased the Foreign Notes to manage its foreign currency risks related to the strengthening of Asian currencies compared to the U.S. dollar, which would reduce the inventory purchasing power of the Company in Asia. However, the Company determined that the Foreign Notes did not qualify as hedging derivative instruments.
Table of Contents
Overstock.com, Inc.
Notes to Consolidated Financial Statements (Continued)
5. MARKETABLE SECURITIES (Continued)
Under SFAS No. 133, the Foreign Notes arewere considered to be derivative financial instruments and were marked to market quarterly. Any unrealized gain or loss related to the changes in value of the conditional coupon was recorded in the income statement as a component of interest income or expense. Any unrealized gain or loss related to the changes in the value of the Foreign Notes was recorded as a component of accumulated other comprehensive income (loss).
For the year ended December 31, 2005, the combined overall fair value of the Foreign Notes decreased $1.5 million. The decrease was attributable to changes in the fair value of the conditional coupon resulting in a loss of $2.6 million, which was recorded in net income, and changes in fair value of the bond instrument resulting in a gain of $1.1 million, which was recorded as a component of accumulated other comprehensive income (loss) in the Balance Sheet. At December 31, 2005, the Foreign Notes had a fair value of $48.5 million.
In March 2006, the Foreign Notes had a faircarrying value of $47.6 million when the Company sold them for $49.5 million resulting in a gain on the bond instrument of $1.9 million, which the Company recognized in the second quarter of 2006 as a component of interest income. The Company had previously recorded $2.4 million of accumulated unrealized losses as a component of interest income over the period the bonds had been held.
The Company had pledged its Foreign Notes as collateral for a $30.0 million revolving line of credit. Subsequent to the sale of the Foreign Notes, the borrowings under the Amended Credit Agreement (see “Note 11—Borrowings”"Note 13—Borrowings") are now collateralized by cash balances held at Wells Fargo Bank, National Association.
6. OTHER COMPREHENSIVE LOSS
The Company follows SFAS No. 130,Reporting Comprehensive Income. This Statement establishes requirements for reporting comprehensive income (loss) and its components. The Company's comprehensive loss is as follows (in thousands):
| | | | | | | | | | |
| | Years ended December 31, | |
|---|
| | 2006 | | 2007 | | 2008 | |
|---|
Net loss | | $ | (106,762 | ) | $ | (48,036 | ) | $ | (12,658 | ) |
Net unrealized gain (loss) on marketable securities | | | (1,128 | ) | | 41 | | | 48 | |
Foreign currency translation adjustment | | | 34 | | | (3 | ) | | 94 | |
| | | | | | | | |
Comprehensive loss | | $ | (107,856 | ) | $ | (47,998 | ) | $ | (12,516 | ) |
| | | | | | | | |
Table of Contents
Overstock.com, Inc.
Notes to Consolidated Financial Statements (Continued)
7. INVENTORIESACCOUNTS RECEIVABLE
Accounts receivable consist of the following (in thousands):
| | | | | | | |
| | December 31, | |
|---|
| | 2007 | | 2008 | |
|---|
Credit card receivable | | $ | 9,189 | | $ | 4,057 | |
Accounts receivable, other | | | 4,496 | | | 4,522 | |
| | | | | | |
| | | 13,685 | | | 8,579 | |
Less: reserve for doubtful accounts | | | (2,477 | ) | | (1,594 | ) |
| | | | | | |
Accounts receivable, net | | $ | 11,208 | | $ | 6,985 | |
| | | | | | |
8. INVENTORIES
Inventories consist of the following (in thousands):
| | | | | | | |
| | December 31, | |
|---|
| | 2007 | | 2008 | |
|---|
Product inventory | | $ | 24,293 | | $ | 17,074 | |
Inventory outbound in-transit | | | 3,112 | | | 2,787 | |
| | | | | | |
| | | 27,405 | | | 19,861 | |
Less: reserve for obsolescence | | | (1,762 | ) | | (2,138 | ) |
| | | | | | |
| | $ | 25,643 | | $ | 17,723 | |
| | | | | | |
| | December 31, | |
| | 2006
(Restated) | | 2007
(Restated) | |
Product inventory | | $ | 26,859 | | $ | 24,293 | |
Inventory in transit | | 3,596 | | 3,112 | |
| | | | | |
| | 30,455 | | 27,405 | |
Less: reserve for obsolescence | | (6,585 | ) | (1,762 | ) |
| | | | | |
| | $ | 23,870 | | $ | 25,643 | |
8. PROPERTY AND EQUIPMENT9. FIXED ASSETS
Property and equipment consistsFixed assets consist of the following (in thousands):
| | December 31, | |
| | 2006 | | 2007 | |
Computer hardware and software | | $ | 95,385 | | $ | 95,652 | |
Furniture and equipment | | 11,534 | | 11,351 | |
Leasehold improvements | | 2,169 | | — | |
| | | | | |
| | 109,088 | | 107,003 | |
Less: accumulated depreciation and amortization | | (52,890 | ) | (79,806 | ) |
| | | | | |
| | $ | 56,198 | | $ | 27,197 | |
| | | | | | | |
| | December 31, | |
|---|
| | 2007 | | 2008 | |
|---|
Computer hardware and software, including internal-use software and website development | | $ | 95,652 | | $ | 109,397 | |
Furniture and equipment | | | 11,351 | | | 12,288 | |
Leasehold improvements | | | — | | | 1,665 | |
| | | | | | |
| | | 107,003 | | | 123,350 | |
Less: accumulated depreciation and amortization | | | (79,806 | ) | | (100,206 | ) |
| | | | | | |
| | $ | 27,197 | | $ | 23,144 | |
| | | | | | |
Depreciation and amortization of property and equipment totaled $14.0 million, $32.2 million, $29.5 million, and $29.5$22.7 million for the years ended December 31, 2005,2006, 2007 and 2008, respectively. For the years ended December 31, 2006 and 2007, respectively. Thethe Company incurred additional depreciation and amortization expense related to decreases in useful lives of certain fixed assets and leasehold
F-24
Table of Contents
improvement in connection with the Company’sCompany's facilities consolidation. This additional depreciation expense was included in restructuring expense (see “Note 4—"Note 3—Restructuring Expense”Expense").
Table of Contents
Overstock.com, Inc.
Notes to Consolidated Financial Statements (Continued)
9. FIXED ASSETS (Continued)
Property and equipmentFixed assets included assets under capital leases of $19.8 million at December 31, 20062007 and 2007,2008, and accumulated amortization related to assets under capital leases of $12.4$15.4 million and $19.1$19.3 million at December 31, 20062007 and 2007,2008, respectively.
9.10. OTHER LONG-TERM ASSETS
Other long-term assets consist of the following (in thousands):
| | December 31, | |
| | 2006 | | 2007 | |
Domain names | | $ | 466 | | $ | 490 | |
Intangibles | | 26 | | 20 | |
Less: accumulated amortization | | (435 | ) | (456 | ) |
| | | | | |
| | 57 | | 54 | |
Deferred financing fees, net | | 173 | | — | |
Deposits and long-term prepaids | | 348 | | 32 | |
| | | | | |
| | $ | 578 | | $ | 86 | |
| | | | | | | |
| | December 31, | |
|---|
| | 2007 | | 2008 | |
|---|
Domain names | | $ | 490 | | $ | 477 | |
Intangibles | | | 20 | | | 20 | |
Less: accumulated amortization | | | (456 | ) | | (474 | ) |
| | | | | | |
| | | 54 | | | 23 | |
Deposits and long-term prepaid expenses | | | 32 | | | 515 | |
| | | | | | |
| | $ | 86 | | $ | 538 | |
| | | | | | |
Amortization of domain names and intangibles totaled $142,000, $110,000, $21,000 and $21,000$18,000 for the years ended December 31, 2005, 2006, 2007 and 2007,2008, respectively.
11. DEFERRED REVENUE
Deferred revenue consists of the following (in thousands):
| | | | | | | |
| | December 31, | |
|---|
| | 2007 | | 2008 | |
|---|
Payments owed or received prior to product delivery | | $ | 19,003 | | $ | 14,381 | |
Unredeemed gift cards | | | 2,952 | | | 3,522 | |
Club O membership fees and other | | | 1,010 | | | 1,123 | |
| | | | | | |
| | $ | 22,965 | | $ | 19,026 | |
| | | | | | |
Table of Contents
Overstock.com, Inc.
10.Notes to Consolidated Financial Statements (Continued)
12. ACCRUED LIABILITIES
Accrued liabilities consist of the following (in thousands):
| | | | | | | |
| | December 31, | |
|---|
| | 2007 | | 2008 | |
|---|
Inventory received but not invoiced | | $ | 2,165 | | $ | 1,662 | |
Allowance for returns | | | 6,941 | | | 5,099 | |
Accrued payroll and other related costs | | | 10,783 | | | 3,917 | |
Accrued marketing expenses | | | 6,997 | | | 3,948 | |
Credit card processing fee accrual | | | 669 | | | 445 | |
Accrued freight | | | 665 | | | 881 | |
Accrued professional expenses | | | 1,638 | | | 1,205 | |
Accrued taxes | | | 486 | | | 526 | |
Accrued lease termination costs | | | 1,001 | | | 611 | |
Other accrued expenses | | | 5,810 | | | 6,860 | |
| | | | | | |
| | $ | 37,155 | | $ | 25,154 | |
| | | | | | |
| | December 31, | |
| | 2006
(Restated) | | 2007
(Restated) | |
Inventory received but not invoiced | | $ | 243 | | $ | 2,165 | |
Allowance for returns | | 4,557 | | 6,941 | |
Accrued payroll and other related costs | | 7,952 | | 10,783 | |
Accrued marketing expenses | | 10,835 | | 6,997 | |
Credit card processing fee accrual | | 818 | | 669 | |
Accrued freight | | 554 | | 665 | |
Accrued professional expenses | | 1,410 | | 1,638 | |
Accrued taxes | | 2,075 | | 486 | |
Lease termination costs | | 5,949 | | 1,001 | |
Other accrued expenses | | 4,041 | | 5,810 | |
| | | | | |
| | $ | 38,434 | | $ | 37,155 | |
13. BORROWINGS
11. BORROWINGS
$30.0 millionWells Fargo Credit Agreement
The Company has a credit agreement (as amended to date, the “Credit Agreement”"Credit Agreement") with Wells Fargo Bank, National Association (“("Wells Fargo”Fargo"). The Credit Agreement provides a revolving line of credit to the Company of up to $30.0 million which the Company uses primarily to obtain letters of credit to support inventory purchases. Interest on borrowings is payable monthly and accrued at either (i) 1.0% above LIBOR in effect on the first day of an applicable fixed rate term, or (ii) at a fluctuating rate per annum determined by the bank to be one half a percent (0.50%) above daily LIBOR in effect on each business day a change in daily LIBOR is announced by the bank. The Credit Agreement expires on January 1, 2010, and requires the Company to comply with certain covenants, including restrictions on mergers, business combinations or transfer of assets.
Borrowings and outstanding letters of credit under the Credit Agreement are required to be completely collateralized by cash balances held at Wells Fargo Bank, N.A, and therefore the facility does not provide additional liquidity to the Company.
At December 31, 2007,2008, no amounts were outstanding under the Credit Agreement, and letters of credit totaling $2.8$2.2 million were issued on behalf of the Company.
$40.0 million WFRFWells Fargo Retail Finance Agreement
The Company is a party to aOn January 6, 2009, Overstock.com, Inc. (the "Company") entered into an Amended and Restated Loan and Security Agreement dated January 6, 2009 (the “WFRF Agreement”"Agreement") with Wells Fargo Retail Finance, LLC ("WFRF"). The Agreement replaces the Company's Loan and related security agreementsSecurity Agreement dated December 12, 2005 with WFRF, which had previously been amended and other agreements describedhad terminated in the WFRF Agreement.
accordance with its terms.
The Amended WFRF Agreement ("WFRF Agreement") provides for advances to the Company and for the issuance of letters of credit for its account of up to an aggregate maximum of $40.0$35.0 million.
Table of Contents
Overstock.com, Inc.
Notes to Consolidated Financial Statements (Continued)
13. BORROWINGS (Continued)
The amount actually available to the Company may be less and may vary from time to time, depending on, among other factors, the amount of its eligible inventory and receivables. The Company’sCompany's obligations under the WFRF Agreement and all related agreements are collateralized by all or substantially all of the Company’sCompany's and its subsidiaries’subsidiaries' assets. The Company’sCompany's obligations under the WFRF Agreement are cross-collateralized with its assets pledged under its $30.0 million credit facility with Wells Fargo Bank, N.A. The WFRF Agreement contains standard default provisions and expires on December 12, 2008.January 5, 2011. The conditions to the Company’sCompany's use of the facility include a 45-day advance notice requirement.
F-25
Table of Contents
Advances under the WFRF Agreement bear interest at either (a) the rate announced, from time to time, within Wells Fargo Bank, N.A. at its principal office in San Francisco as its “prime rate”"prime rate" or (b) a rate based on LIBOR plus a varying percentage between 1.25% and 1.75%; however, the annual interest rate on advances under the WFRF Agreement will be at least 3.50%. The WFRF Agreement includes affirmative covenants as well as negative covenants that prohibit a variety of actions without the lender’slender's approval, including covenants that limit the Company’sCompany's ability to (a) incur or guarantee debt, (b) create liens, (c) enter into any merger, recapitalization or similar transaction or purchase all or substantially all of the assets or stock of another person, (d) sell assets, (e) change its name or the name of any of its subsidiaries, (f) make certain changes to its business, (g) optionally prepay, acquire or refinance indebtedness, (h) consign inventory, (i) pay dividends on, or purchase, acquire or redeem shares of, its capital stock, (j) change its method of accounting, (k) make investments, (l) enter into transactions with affiliates, or (m) store any of its inventory or equipment with third parties. The Company was in compliance with these covenants as of December 31, 2007.
At December 31, 2007,2008, no amounts were outstanding and availability under the WFRF Agreement was $9.0 million.or under the Company's prior loan agreement with WFRF.
Wells Fargo Commercial Purchasing Card Agreement
The Company has a commercial purchasing card agreement (the "Purchasing Card") with Wells Fargo Bank, National Association ("Wells Fargo"). The Company uses the Purchasing Card for business purpose purchasing and must pay it in full each month. Outstanding amounts under the Purchasing Card are collateralized by cash balances held at Wells Fargo Bank, N.A, and therefore the facility does not provide additional liquidity to the Company. At December 31, 2008, $436,000 was outstanding and $564,000 was available under the Purchasing Card.
Capital leases
The Company leases certain software and computer equipment under three non-cancelable capital leases that expire at various dates through 2008.
Software and equipment relating to the capital leases totaled $19.8 million at December 31, 20062007 and 2007,2008, with accumulated amortization of $12.4$15.4 million and $19.1$19.3 million at those respective dates. Depreciation of assets recorded under capital leases was $7.2$5.5 million and $6.5$3.9 million at December 31, 20062007 and 2007,2008, respectively. As of December 31, 2008, the Company had no remaining capital leases.
Future minimum lease payments under capital leases are as follows (in thousands):
Twelve months ending December 31, | | | |
2008 | | $ | 4,086 | |
Less: amount representing interest | | (290 | ) |
| | | |
Present value of capital lease obligations | | 3,796 | |
Less: current portion | | (3,796 | ) |
| | | |
Capital lease obligations, non-current | | $ | — | |
12. 3.75% CONVERTIBLE SENIOR NOTESConvertible Senior Notes
In November 2004, the Company completed an offering of $120.0 million of 3.75% Convertible Senior Notes (the “Senior Notes”"Senior Notes"). Proceeds to the Company were $116.2 million, net of $3.8 million
Table of Contents
Overstock.com, Inc.
Notes to Consolidated Financial Statements (Continued)
13. BORROWINGS (Continued)
of initial purchaser’spurchaser's discount and debt issuance costs. The discount and debt issuance costs are being amortized using the straight-line method which approximates the interest method. The Company recorded amortization of discount and debt issuance costs related to this offering totaling $620,000, $417,000 and $344,000 during the years ended December 31, 2005, 2006, 2007 and 2007,2008, respectively. Interest on the Senior Notes is payable semi-annually on June 1 and December 1 of each year. The Senior Notes mature on December 1, 2011 and are unsecured and rank equally in right of payment with all existing and future unsecured, unsubordinated debt and senior in right of payment to any existing and future subordinated indebtedness.
The Senior Notes are convertible at any time prior to maturity into the Company’sCompany's common stock at the option of the note holders at a conversion price of $76.23 per share or, approximately 1,010,000885,478 shares in aggregate (subject to adjustment in certain events, including stock splits, dividends and other distributions and certain repurchases of the Company’sCompany's stock, as well as certain fundamental changes in the ownership of the Company). Beginning December 1, 2009, the Company has the right to redeem the Senior Notes, in whole or in part, for cash at 100% of the principal amount plus accrued and unpaid interest. Upon the occurrence of a fundamental change (including the acquisition of a majority interest in the Company, certain changes in the Company’sCompany's board of directors or the termination of trading of the Company’sCompany's stock) meeting certain conditions, holders of the Senior Notes may require the Company to repurchase for cash all or part of their notes at 100% of the principal amount plus accrued and unpaid interest.
The indenture governing the Senior Notes requires the Company to comply with certain affirmative covenants, including making principal and interest payments when due, maintaining the Company’sCompany's corporate existence and properties, and paying taxes and other claims in a timely manner.
In June and November 2005,Under the repurchase program, the Company retired $33.0$9.5 million and $10.0of the Senior Notes during the third quarter of 2008 for $6.6 million in cash, resulting in a gain of $2.8 million on early extinguishment of debt, net of $142,000 of associated unamortized discount. As of December 31, 2008, $67.5 million of the Senior Notes remained outstanding.
On February 17, 2009 the Board of Directors of Overstock.com, Inc. approved a debt repurchase program that authorizes the Company to utilize up to $20.0 million to repurchase a portion of its 3.75% Senior Notes. Under this repurchase program, the Company retired $4.9 million of the Senior Notes for $27.9 million and $7.8$3.0 million in cash for each respective retirement.cash. As a result of the noteSenior Notes retirements, in June and November, the Company recognizedexpects to recognize a future gain of $6.2$1.9 million, net of the associated unamortized discount of $1.2 million during the year ended December 31, 2005. As of December 31, 2007, $77.0 million of the Senior Notes remained outstanding.$63,000 for this transaction (see Note 17—"Stock and Debt Repurchase Program").
13.14. COMMITMENTS AND CONTINGENCIES
Commitments
Commitments
Corporate office space
ThroughIn July 2005, the Company leased 43,000 square feet of office space at Old Mill Corporate Center I for its principal executive offices under an operating lease which was originally scheduled to expire in January 2007. Beginning July 2005, this lease was terminated and replaced with a lease for approximately 154,000 rentable square feet in the Old Mill Corporate Center III in Salt Lake City, Utah for a term of ten10 years. The total lease obligation over the ten-yearremaining term of the newthis lease is $42.4$29.4 million, of which approximately $7.6$4.0 million is payable in the next twelve months.
The Company entered into a Tenant Improvement Agreement (the “OMIII Agreement”) with Old Mill Corporate Center III, LLC (the “Lessor”) relating to the office building in February 2005. The OMIII Agreement sets forth the terms on which the Company paid the costs of certain improvements to the leased office space. The amount $7.7 million of the costs was approximately $2.0 million. The OMIII Agreement also required the Companytotal lease obligation is offset by estimated sublease payments, of which $1.1 million is anticipated to provide a letter of creditbe received in the amountnext twelve months.
Table of $500,000Contents
Overstock.com, Inc.
Notes to the Lessor to provide funds for the removal of certain improvements upon the termination of the lease.Consolidated Financial Statements (Continued)
14. COMMITMENTS AND CONTINGENCIES (Continued)
In the fourth quarter of 2006, the Company commenced implementation of a facilities consolidation and restructuring program. Under the program, the Company recorded $638,000 of accelerated amortization of leasehold improvements related to its currentsubleased office facilities, that it is attempting to sublease, and $450,000 of costs incurred to return its office facilities to their original condition as required by the lease agreement.
During fiscal year 2007, the Company recorded an additional $6.2 million of restructuring costs related to its marketing for sub-lease office and data center space in its current corporate office facilities. The Company also recorded an additional $2.2 million of restructuring charges related to accelerated depreciation of leasehold improvements located in the abandoned office and co-location data center space and $200,000 of other miscellaneous restructuring charges (see “Note 4—Note 3—"Restructuring Expense”Expense"). The company did not record any restructuring costs during the year ended December 31, 2008.
F-26
Table of Contents
Logistics and warehouse space
In July 2004, the Company entered into a logistics service agreement (the “Logistics Agreement”"Logistics Agreement") wherein the handling, storage and distribution of some of its prepackaged products were performed by a third party. The Logistics Agreement and subsequent amendment set forth terms on which the Company paid various fixed fees based on square feet of storage and various variable costs based on product handling costs for a term of five years.
In December 2005, the Company entered into a warehouse facilities service and lease agreement (the “License Agreement”"License Agreement") to license approximately 400,000 square feet of warehouse space in Indiana.Indiana and purchase fulfillment services. The License Agreement was subsequently amended, reducing the amount of lease space to approximately 300,000 square feet and extending the term to 2011.
In the first quarter of 2007, the Company terminated the Logistics Agreement and gave notice of intent to sublease the Indiana warehouse facilities under the License Agreement. During the second quarter of 2007, the Company reached an agreement to terminate the Indiana warehouse facilities lease effective August 15, 2007. As a result of the termination of the License agreementAgreement and warehouse lease, the Company incurred $3.7 million of related restructuring charges in 2007 (see Note 4—“3—"Restructuring Expense”Expense").
The Company currently leases 561,000795,000 square feet for its warehouse facilities in Utah under operating leases which expire in August 2012.2012 and August 2015.
On April, 8, 2008, the Company entered into a lease agreement with Natomas Meadows, LLC (the "Natomas Lease"). The Natomas Lease is for a 686,865 square foot warehouse facility located in Salt Lake City, Utah (the "New warehouse"). The Natomas Lease provides that the Company has also temporarilywill lease the new warehouse in stages: on October 15, 2008, the Company leased an additional 251,000the initial 232,900 square feet of warehouse space in Utah under operating leasesthe New Warehouse; on February 1, 2009, the Company leased a total of 435,400 square feet; and, on September 1, 2009, the Company will lease the remainder, for a total of 686,865 square feet. The Natomas Lease term is seven years, and specifies rent, exclusive of common area maintenance fees, at a variable rate over the course of the staged lease term, ranging from $0.3300 per square foot for the seasonal increasefirst stage, to $0.3950 per square foot for the last year of the Natomas Lease term. Including the space now leased in inventory during the fourth quarternew warehouse, the Company currently has warehouse operations in two facilities in
Table of 2007.Contents
Overstock.com, Inc.
Notes to Consolidated Financial Statements (Continued)
14. COMMITMENTS AND CONTINGENCIES (Continued)
Salt Lake City, Utah. The Company constructed a 40,000 square foot customer service facility in the new warehouse and commenced use of the facility on November 3, 2008.
Co-location data center
In July 2005, the Company entered into a Co-location Center Agreement (the “Co-location Agreement”"Co-location Agreement") to build out and lease 11,289 square feet of space at Old Mill Corporate Center II for an IT co-location data center. The Co-location Agreement set forth the terms on which the Lessor would incur the costs to build out the IT co-location data center and the Company would commence to lease the space upon its completion for a term of ten years. In NovemberHowever, during the fourth quarter of 2006, however, the Company made the determination to consolidate its facilities and to not occupy the IT co-location data center, and the Co-location Agreement was terminated effective December 29, 2006, for which the Company incurred a $4.6 million restructuring charge (see Note 4—“3—"Restructuring Expense”Expense").
In December 2006, the Company entered into a Data Center Agreement (the “OM"OM I Agreement”Agreement") to lease 3,999 square feet of space at Old Mill Corporate Center I for an IT data center to allow the Company to consolidate other IT data center facilities at the Old Mill Corporate Center II and at its current corporate offices facilities.
OperatingComputer equipment operating leases
In June 2005 and 2006, theThe Company entered into non-cancelablehas two operating leases for certain computer equipment expiringthat expire in April 2008the first and June 2008, respectively.fourth quarters of 2010. It is expected that such leases will be renewed by exercising purchase options or replaced by leases of other computer equipment.
Summary of future minimum lease payments for all operating leases
Minimum future payments under all operating leases are as follows (in thousands):
Twelve months Ending December 31, | | | |
2008 | | $ | 7,647 | |
2009 | | 6,238 | |
2010 | | 5,987 | |
2011 | | 5,803 | |
2012 | | 5,526 | |
Thereafter | | 11,196 | |
| | | |
| | $ | 42,397 | |
| | | | |
Twelve months Ending December 31, | |
| |
|---|
2009 | | $ | 8,060 | |
2010 | | | 8,652 | |
2011 | | | 8,989 | |
2012 | | | 8,868 | |
2013 | | | 8,325 | |
Thereafter | | | 15,036 | |
| | | | |
| | $ | 57,930 | |
| | | | |
Rental expense for operating leases totaled $4.0 million, $11.5 million, $11.6 million and $11.6$9.5 million for the years ended December 31, 2005, 2006, 2007 and 2007,2008, respectively.
Legal Proceedings
From time to time, the Company receives claims of and becomebecomes subject to consumer protection, employment, intellectual property and other commercial litigation related to the conduct of the Company’sCompany's business. Such litigation could be costly and time consuming and could divert its management and key personnel from its business operations. The uncertainty of litigation increases these risks. In connection with such litigation, the Company may be subject to significant damages or
Table of Contents
Overstock.com, Inc.
Notes to Consolidated Financial Statements (Continued)
14. COMMITMENTS AND CONTINGENCIES (Continued)
equitable remedies relating to the operation of its business and the sale of products on the Company’sCompany's website. Any such litigation may materially harm its business, prospects, results of operations, financial condition or cash flows. However, the Company does not currently believe that any of its outstanding litigation will have a material adverse effect on its financial statements.
On August 11, 2005, along with a shareholder plaintiff, the Company filed a complaint against Gradient Analytics, Inc.; Rocker Partners, LP; Rocker Management, LLC; Rocker Offshore Management Company, Inc. and their respective principals in the Superior Court of California, County of Marin. On October 12, 2005, the Company filed an amended complaint against the same entities alleging libel, intentional interference with prospective economic advantage and violations of California’sCalifornia's unfair business practices act. On March 7, 2006, the court denied the defendants demurrers to and motions to strike the amended complaint. The defendants each filed a motion to appeal the court’scourt's decision, the Company responded and the California Attorney General submitted an amicus brief supporting the Company’sCompany's view; the court has ruled that this appeal stays discovery in the case. On May 30, 2007 the California Court of Appeals upheld the lower court’scourt's ruling in the Company’sCompany's favor. Defendants filed motions for rehearing, which the Court of Appeals summarily denied on June 27, 2007. Defendants filed Petitions for Review before the California Supreme Court which the California Supreme court denied on September 19, 2007. On October 1, 2007, the Court of Appeals remitted the case back to the Superior Court. On December 4, 2007, Matthew Kliber, a former principal of Gradient Analytics, filed a motion for judgment on the pleading which the court denied on February 8, 2008. Discovery in this caseOn October 10, 2008, the Company and Patrick Byrne reached a confidential settlement agreement with Gradient Analytics and its current and former principals and those defendants have been dismissed from the case. On October 22, 2008, the Company amended the complaint to name as additional Defendants Cathy Longinotti, Mark Montgomery, Phillip Renna and Terrence Warzecha because of their former or existing status as general partners of Copper River Partners, L.P. On December 15, 2008 all the newly named Defendants filed an Anti-SLAPP motion to strike the amended complaint; a demurrer to the second, fourth and fifth causes of action; and a motion to quash the summons for Defendants Longinotti, Renna and Warzecha for lack of jurisdiction. These motions are now pending . The Rocker parties moved to postpone the trial date and the court granted the motion. Trial is currently stayed.now set for February 11, 2010. The Company intends to continue to pursue this action vigorously. The court has set a trial datevigorously against all of September 9, 2008.
the Rocker entities and their principals.
On November 9, 2007, Copper River Partners, L.P. (formerly known as Rocker Partners, LP) filed a cross-complaint against the Company and certain of its current and former directors. The Copper River cross-complaint alleges cross-defendants have engaged in violations of California’sCalifornia's state securities laws, violations of California’sCalifornia's unfair business practices act, tortuous interference with contract and prospective business advantage, and deceit. In January 2008, each of the cross-defendants filed various motions in opposition of this cross-complaint. On January 30,April 23, 2008, Gradient Analytics, Inc. filedthe court dismissed Copper River's cross claims against former Company directors, John Byrne and Jason Lindsey, and current Company director Allison Abraham. In that same ruling, the court dismissed four of the six claims against former Company director John Fisher: securities fraud, unfair business practices, common law fraud and equitable indemnity. In a motion for leaveseparate ruling on the same day relating to file a cross-complaint against the Company and Patrick Byrne. TheByrne, the court has not ruled on this motion. The proposed Gradient Analytics cross-complaint allegesdismissed the common law fraud claims and equitable indemnity claims and eliminated the possibility of money damages under Copper River's claims that the CompanyOverstock and Dr. Byrne engaged in violationsunfair business practices. In other portions of California’sthe court's rulings, the court declined to dismiss Copper River's securities fraud claims and its request for an injunction for unfair business practices act, interference with prospective business advantage, and libel. These cases are inagainst the initial stages. The Company intends to defend these cross-complaints vigorously.
F-27
Table of Contents
Overstock.com, Inc.
On May 9, 2006Notes to Consolidated Financial Statements (Continued)
14. COMMITMENTS AND CONTINGENCIES (Continued)
Company and Patrick Byrne and the claims for tortuous interference with contract and prospective business advantage against the Company, received a notice of an investigation and subpoena from the Securities and Exchange Commission, Salt Lake City District Office. On May 17, 2006, Patrick Byrne also received a subpoena fromand John Fisher. On June 20, Copper River dismissed its complaints against Mr. Fisher. The parties are in the Securities and Exchange Commission, Salt Lake City District Office. These subpoenas requested a broad rangediscovery phase of documents, including, among other documents, all documents relating to the Company’s accounting policies, the Company’s targets, projections or estimates related to financial performance, the Company’s recent restatement of its financial statements, the filing of its complaint against Gradient Analytics, Inc., the development and implementation of certain new technology systems and disclosures of progress and problems with those systems, communications with and regarding investment analysts, communications regarding shareholders who did not receive the Company’s proxy statement in April 2006, communications with certain shareholders, and communications regarding short selling, naked short selling, purchases and sales of Company stock, obtaining paper certificates, and stock loan or borrow of Company shares.case. The Company and Dr. Byrne have respondedintends to these subpoenas and each continues to cooperate withdefend the Securities and Exchange Commission on this matter.
Copper River cross-complaint vigorously.
On February 2, 2007, along with five shareholder plaintiffs, the Company filed a lawsuit in the Superior Court of California, County of San Francisco against Morgan Stanley & Co. Incorporated, Goldman Sachs & Co., Bear Stearns Companies, Inc., Bank of America Securities LLC, Bank of New York, Citigroup Inc., Credit Suisse (USA) Inc., Deutsche Bank Securities, Inc., Merrill Lynch, Pierce, Fenner & Smith, Inc., and UBS Financial Services, Inc. In September 2007, the Company filed an amended complaint adding two plaintiff shareholders, naming Lehman Brothers Holdings Inc. as a defendant, eliminating the previous claim of intentional interference with prospective economic advantage and clarifying various points of other claims in the original complaint. The suit alleges that the defendants, who control over 80% of the prime brokerage market, participated in an illegal stock market manipulation scheme and that the defendants had no intention of covering short sell orders with borrowed stock, as they are required to do, causing what are referred to as “fails"fails to deliver”deliver" and that the defendants’defendants' actions caused and continue to cause dramatic distortions with inwithin the nature and amount of trading in the Company’sCompany's stock as well as dramatic declines in the share price of the Company’sCompany's stock. The suit asserts that a persistent large number of “fails"fails to deliver”deliver" creates significant downward pressure on the price of a company’scompany's stock and that the amount of “fails"fails to deliver”deliver" has exceeded the company’sCompany's entire supply of outstanding shares. The suit accuses the defendants of violations of California securities laws and common law, specifically, conversion, trespass to chattels, intentional interference with prospective economic advantage, and violations of California’sCalifornia's Unfair Business Practices Act. The Company is seeking damages of $3.48 billion. In April 2007 defendants filed a demurrer and motion to strike the Company’sCompany's complaint. The Company opposed the demurrer and motion to strike. In July 2007 the court substantially denied defendants’defendants' demurrer and motion to strike. In November 2007, the defendants filed additional motions to strike. In February 2007,2008, the court denied defendants’defendants' motion to strike the Company’sCompany's claims under California’sCalifornia's Securities Anti-Fraud statute and defendants’defendants' motion to strike the Company’sCompany's common law punitive damages claims, but granted in part the defendants’defendants' motion to strike Overstock’sOverstock's claims under California’sCalifornia's Unfair Business Practices Act, while allowing the Company’sCompany's claims for injunctive relief under California’sCalifornia's Unfair Business Practices Act. Lehman Brothers Holdings filed for bankruptcy on September 15, 2008 and Barclays Bank has purchased its investment banking and trading business. The parties have begun discoverybankruptcy may adversely affect our ability to collect a judgment against Lehman. Dislocations in the financial markets and economy could result in additional bankruptcies or consolidations that may impact the litigation or our ability to collect a judgment. On January 12, 2009, Goldman Sachs Group, Inc,., Goldman Sachs &Co.; Goldman Sachs Execution & Clearing L.P., Citi Group, Inc, Citi Group Global markets, Inc., Credit Suisse (USA) Inc., and Credit Suisse Securities (USA) LLC filed a motion to strike portions of the Second Amended Complaint regarding allegations of collective action among defendants and the request for punitive damages. Also, on January 12, 2009, Goldman Sachs Group, Inc,., Goldman Sachs &Co.; Goldman Sachs Execution & Clearing L.P., Citi Group, Inc, Citi Group Global markets, Inc., Credit Suisse (USA) Inc., and Credit Suisse Securities (USA) LLC filed a demurrer to the first and second causes of action of the Second Amended Complaint for conversion and trespass to chattels. These motions are now pending. Discovery in this case.case continues. No trial date has been set. The Company intends to vigorously prosecute this action.
Table of Contents
Overstock.com, Inc.
Notes to Consolidated Financial Statements (Continued)
14. COMMITMENTS AND CONTINGENCIES (Continued)
On March 29, 2007,April 15, 2008, the Company received a letter from the Office of the District Attorney of Marin County, California, stating that the District Attorneys of Marin and four other counties in Northern California have begun an investigation into the way the Company advertises products for sale, together with an administrative subpoena seeking related information and documents. The subpoena requests a range of documents, including documents relating to pricing methodologies, definitions of core and partner product, as well as other site-defined terms, and the methods of internal and external pricing of products, as well as documents related to the pricing of a list of product items identified in the subpoena. The Company has responded to the subpoena. The Company believes that it follows industry advertising practices and intends to cooperate with the investigation.
On May 30, 2008 the Company filed a complaint in New York state court against the New York State Department of Taxation and Finance, its Commissioner, the State of New York and its governor, alleging that a recently enacted New York state tax law is unconstitutional. The effect of the New York law is to require internet sellers to collect and remit New York sales taxes on their New York sales, even if the seller has no New York tax "nexus" other than with New York based independent contractors who are internet advertising affiliates. The complaint asks for the court to declare the law unconstitutional and enjoin its application to the Company. New York filed a motion to dismiss. The Company responded to the motion and filed a motion for summary judgment, and both motions were heard simultaneously. On January 12, 2009, the court granted New York's motion to dismiss and denied the Company's motion for summary judgment. On February 12, 2009, the Company filed notice to appeal the ruling.
On August 12, 2008, the Company along with seven other defendants, was sued in the United States District Court for the EasternNorthern District of Texas, Tyler Division,California, by Orion IP, LLC.Sean Lane, and seventeen other individuals, on their own behalf and for others similarly in a class action suit, alleging violations of the Electronic Communications Privacy Act, Computer Fraud and Abuse Act, Video Privacy Protection Act, and California's Consumer legal Remedies Act and Computer Crime Law. The compliant relates to the Company's use of a product known as Facebook Beacon, created and provided to the Company by Facebook, Inc. Facebook Beacon provided the means for Facebook users to share purchasing data among their Facebook friends. Plaintiffs and Defendants, including the Company, have stipulated to an extension in the time for answering the complaint, while the parties engage in a mediation of the dispute. The Company has not responded to the Complaint. The Company has notified Facebook, Inc. of its indemnification obligations under the contract by which the Company obtained and deployed Facebook Beacon. The Company intends to vigorously defend this action and pursue with Facebook its indemnification rights under the Facebook Beacon agreement.
On November 14, 2008, the Company filed suit in Ohio state court against the Ohio Tax Commissioner, the Ohio Attorney General and the Governor of Ohio, alleging the Ohio Commercial Activity Tax is unconstitutional. Enacted in 2005, Ohio's Commercial Activity Tax is based on activities in Ohio that contribute to production or gross income for a company whether or not the company has a physical presence in or nexus within the state. The Company asks in its complaint for a judgment declaring the tax unconstitutional and for an injunction preventing any enforcement of the tax. The defendants have not answered the complaint, but have moved to dismiss the case. These motions to dismiss are now pending. The suit alleges thatis in its early stages.
On December 22, 2008, the Company, and thealong with other thirty-seven other defendants infringe twowas sued in a patent infringement law suit filed by Guardian Media Technologies, LTD in the United States District
Table of Contents
Overstock.com, Inc.
Notes to Consolidated Financial Statements (Continued)
14. COMMITMENTS AND CONTINGENCIES (Continued)
Court, Central District of California. The Company is alleged to have sold products infringing patents owned by Orion that relatethe plaintiff involving certain processes designed to block content from being viewed on televisions and DVD players. The Company has not yet answered the makingcomplaint and using supply chain methods, sales methods, sales systems, marketing methods, marketing systems, and inventory systems. On April 30, 2007, the Company filed an answer denying Orion’s allegations and a counterclaim asserting that Orion’s patent is invalid. The casesuit is in its discovery stages. The court has set a trial date of May 2009. As it has consistently done with similar suits filed by patent trolls,early stages and the Company intends to vigorously defend this action.
On October 5, 2007January 22, 2009, the Company, along with seven other defendants was served as defendantsued in a case alleging violationspatent infringement law suit by SBJ IP Holdings 1, LLC, in the United States District Court, Eastern District of Texas. The Company is alleged to have infringed a patent owned by the plaintiff involving certain processes by which online retail companies make product purchase recommendations to their customers. The Company has not yet answered the complaint and the suit is in its early stages and the Company intends to vigorously defend this action.
15. STOCKHOLDERS' EQUITY
Reincorporation
In May 2002, the Company reincorporated in Delaware. As a result of the Fair and Accurate Credit Transactions Act (the “Act”). The plaintiff alleged that, becausereincorporation, the Company followed an industry practiceis authorized to issue 100.0 million shares of displaying$0.0001 par value common stock and 5.0 million shares of $0.0001 par value preferred stock. The Board of Directors may issue the undesignated preferred stock in one or more series and determine preferences, privileges and restrictions thereof.
Common Stock
Each share of common stock has the right to one vote. The holders of common stock are also entitled to receive dividends whenever funds are legally available and when declared by the customer on a confirmation page the expiration dateBoard of the customer’s credit card while the customer was online and logged into the customer’s own account, the Company has violated certain provisionsDirectors, subject to prior rights of the Act which prohibit a merchant from printing the credit card expiration date on a receipt. Filed in the U.S. District Court, Southern Districtholders of Illinois, the case was styledall classes of stock outstanding having priority rights as a class action lawsuit on behalf of the nominative plaintiff and all others similarly situated. On November 13, 2007, the Company moved to dismissdividends. No dividends have been declared or stay the case or transfer venue. On December 27, 2007, the court dismissed the complaint without prejudicepaid on the basis that the complaint should have been brought under the arbitration agreement between the plaintiff and the Company. Plaintiff has not appealed the dismissal, and the time for appeal has expired.Company's common stock through December 31, 2008.
14. REDEEMABLE COMMON STOCKRedeemable Common Stock
Redeemable common stock relates to warrants and securities that were subject to rescission. Sales of 858,000 shares of the common stock and the issuance of 185,000 warrants to certain individuals may not have fully complied with certain requirements under applicable State Blue Sky Laws. The offer and sale of these securities were not made pursuant to a registration statement and the Securities Act of 1933, nor were the offer and sale registered or qualified under any state securities laws. Although the Company believed at the time that such offers, sales and conversion were exempt from such registration or qualification, they may not have been exempt in several states. As a result, purchasers of the Company’sCompany's common stock in some states may have had the right under federal or state securities laws to rescind their purchases for an amount equal to the purchase price paid for the shares, plus interest from the date of purchase until the rescission offer expired, at the annual rate mandated by the state in which such shares were purchased. These interest rates ranged from 8% to 10% per annum. The rescission rights lapsed on various dates through September 2006.
At December 31, 2005, there were 446,000 shares of common stock and no warrants subject to rescission rights outstanding. The Company had classified $3.2 million at December 31, 2005 related to the rescission rights outside of shareholders’shareholders' equity, because the redemption features were deemed not within the control of the Company. Interest attributable to these securities was recorded as a deemed
Table of Contents
Overstock.com, Inc.
Notes to Consolidated Financial Statements (Continued)
15. STOCKHOLDERS' EQUITY (Continued)
dividend and reflected as a deduction from net loss to arrive at net loss attributable to common shares in the Statements of Operations.
No amount has been classified outside of shareholders’shareholders' equity as of December 31, 2006 and 2007 as these rescission rights, if any, fully expired prior to the end of 2006, leaving no outstanding redeemable common stock as of December 31, 20062007 and 2007.2008.
15. STOCKHOLDERS’ EQUITY
Reincorporation
In May 2002, the Company reincorporated in Delaware. As a result of the reincorporation, the Company is authorized to issue 100.0 million shares of $0.0001 par value common stock and 5.0 million shares of $0.0001 par value preferred stock. The Board of Directors may issue the undesignated preferred stock in one or more series and determine preferences, privileges and restrictions thereof.
Common Stock
Each share of common stock has the right to one vote. The holders of common stock are also entitled to receive dividends whenever funds are legally available and when declared by the Board of Directors, subject to prior rights of holders of all classes of stock outstanding having priority rights as to dividends. No dividends have been declared or paid on the Company’s common stock through December 31, 2007.
Warrants
In 2000, the Company issued warrants to certain shareholders in connection with the purchase of additional shares of common stock. At December 31, 2006 and 2007, there were no warrants outstanding to purchase common stock of the Company. During 2005, 2006 and 2007, the number of warrants exercised was 870,000 in 2005 and zero in 2006 and 2007.
F-28
Table of Contents
16. STOCK OFFERINGS
During 2006, the Company closed two offerings under an existing “shelf”"shelf" registration statement, pursuant to which it sold 1.0 million shares of common stock in May and 2.7 million shares of common stock in December, with proceeds to the Company of approximately $25.0 million and $39.4 million, respectively, net of $594,000 of issuance costs.
There were no stock offerings during the yearyears ended December 31, 2007.2007 and 2008.
17. STOCK AND DEBT REPURCHASE PROGRAM
During January 2005, the Company’s Board of Directors authorized a stock repurchase program under which the Company was authorized to repurchase up to $50.0 million of its common stock through December 31, 2007. On April 26, 2005, the Board of Directors increased the amount of the stock repurchase program to $100.0 million. Additionally, on June 14, 2005, the Board of Directors authorized an amendment of its three-year stock repurchase program to include the repurchase of its Convertible Senior Notes.
During 2005, the Company entered into several purchased call options, pursuant to which the Company could have been required to purchase up to 1.3 million shares of its common stock at certain settlement dates during the quarter ended June 30, 2005. In connection with these repurchase transactions; the Company paid approximately $47.5 million, which was recorded in shareholders’ equity in the consolidated balance sheet.
At the Company’s option, the purchased call options were settled in cash or stock, based on the market price of its common stock on the date of the settlement. Upon settlement, the Company either had its capital investment returned with a premium or received shares of its common stock, depending, respectively, on whether the market price of its common stock was above or below a pre-determined price agreed in connection with each such transaction.
Under the repurchase program, the Company repurchased approximately 665,000 shares of its common stock in open market transactions for $24.1 million during the year ended December 31, 2005. In addition, approximately 1.0 million shares of common stock were acquired as a result of the settlement of $41.1 million of structured stock repurchase transactions during the twelve months ended December 31, 2005. The purchased call options that did not settle in stock settled in cash totaling $7.9 million, which the Company received in July 2005.
On January 14, 2008, the Company’sCompany's Board of Directors authorized an additionala repurchase program that allowsallowed the Company to purchase up to $20.0 million of its common stock and / or its 3.75% Senior Convertible Senior Notes due 2011 ("Senior Notes") through December 31, 2009. Under this repurchase program, the Company has repurchased approximately 1.11.2 million shares of its common stock in open market purchases for $12.0$13.4 million through March 14,as of December 31, 2008.
In addition, during the year ended 2008, the Company retired $9.5 million of the Senior Notes for $6.6 million in cash. As a result of the Senior Notes retirements, the Company recognized a gain of $2.8 million, net of the associated unamortized discount of $142,000. As of December 31, 2008, $67.5 million of Senior Notes remain outstanding. The Company had fully utilized this authorized $20.0 million repurchase program as of December 31, 2008.
On February 17, 2009 the Board of Directors of Overstock.com, Inc. approved a debt repurchase program that authorizes the Company to utilize up to $20.0 million to repurchase a portion of its 3.75% Senior Notes. Under this repurchase program, the Company retired $4.9 million of the Senior Notes for $3.0 million in cash. As a result of the Senior Notes retirements, the Company expects to recognize a future gain of $1.9 million, net of the associated unamortized discount of $63,000 for this transaction.
18. STOCK BASED AWARDS
Periods prior to the adoption of SFAS 123(R)
Prior to January 1, 2006, the Company accounted for stock-based awards under the intrinsic value method, which followed the recognition and measurement principles of APB Opinion No. 25, Accounting for Stock Issued to Employee, and related interpretations. The intrinsic value method of accounting resulted in compensation expense for stock options to the extent option exercise prices were set below market prices on the date of grant. Also, to the extent stock awards were forfeited prior to vesting, any previously recognized expense was reversed as an offset to operating expenses in the period of forfeiture.
The following table (in thousands, except for per share data) illustrates the effects on net loss and net loss per share as if the Company had applied the fair value recognition provisions of SFAS 123, Accounting for Stock Based Compensation, as amended by SFAS No. 148, Accounting for Stock-Based Compensation—Transition and Disclosure to options granted under the Company’s stock-based compensation plans prior to the adoption. For purposes of this pro forma disclosure, the value of the options was estimated using the Black-Scholes-Merton (“BSM”) option-pricing formula and amortized on a straight-line basis over the respective vesting periods of the awards. Disclosures for the years ended December 31, 2006 and 2007 are not presented because stock-based payments were accounted for under SFAS 123 (R)’s fair value method during these periods.
| | Year ended
December 31, 2005
(Restated) | |
Net loss, as reported | | $ | (25,212 | ) |
Add: Stock-based employee compensation, as reported | | 72 | |
Deduct: Total stock-based employee compensation expense determined under fair value based method for all awards | | (3,996 | ) |
| | | |
Pro forma net loss—SFAS 123 fair value adjusted | | $ | (29,136 | ) |
| | | |
Net loss per common share | | | |
Basic and diluted—as reported | | $ | (1.30 | ) |
Basic and diluted—pro forma | | $ | (1.50 | ) |
Adoption of SFAS 123(R)
As of January 1, 2006, the Company adopted SFAS No. 123(R) using the modified prospective method, which requires measurement of compensation cost for all stock-based awards at fair value on date of grant and recognition of compensation over the service period for awards expected to vest. The fair value of stock options is determined using the BSMBlack-Scholes-Merton ("BSM") valuation model, which is consistent with our valuation techniques previously utilized for options in footnote disclosures required under SFAS No. 123. Such value is recognized as expense over the service period, net of estimated forfeitures, using the straight-line method under SFAS 123(R).
Table of Contents
Overstock.com, Inc.
Notes to Consolidated Financial Statements (Continued)
18. STOCK BASED AWARDS (Continued)
The adoption of SFAS No. 123(R) did not result in a cumulative benefit from accounting change, which reflects the net cumulative impact of estimating future forfeitures in the determination of period expense, rather than recording forfeitures when they occur as previously permitted, as we did not have unvested employee stock awards for which compensation expense was recognized prior to adoption of SFAS No. 123(R).
Prior to the adoption of SFAS No. 123(R), cash retained as a result of tax deductions relating to stock-based compensation was presented in operating cash flows, along with other tax cash flows, in accordance with the provisions of the Emerging Issues Task Force (“EITF”("EITF") Issue No. 00-15,Classification in the Statement of Cash Flows of the Income Tax Benefit Received by a Company upon Exercise of a Nonqualified Employee Stock Option. SFAS No. 123(R) supersedes EITF 00-15, amends SFAS No. 95,Statement of Cash Flows, and requires tax benefits relating to excess stock-based compensation deductions to be prospectively presented in the statement of cash flows
F-29
Table of Contents
as financing cash inflows. As of the adoption of SFAS No. 123(R), we had fully reserved against any tax benefits resulting from stock-based compensation deductions in excess of amounts reported for financial reporting purposes.
On March 29, 2005, the SEC published SAB No. 107, which provides the Staff’sStaff's views on a variety of matters relating to stock-based payments. SAB No. 107 requires stock-based compensation be classified in the same expense line items as cash compensation. The Company has reclassified stock-based compensation from prior periods to correspond to current period presentation within the same operating expense line items as cash compensation paid to employees.
The application of SFAS No. 123(R) had the following effect on the year ended December 31, 2006 reported amounts relative to amounts that would have been reported using the intrinsic value method under previous accounting (in thousands, except per share amounts):
| | | | |
| | Year ended December 31, 2006 | |
|---|
Operating loss | | $ | (4,120 | ) |
Net loss | | $ | (4,120 | ) |
Net loss per common share—basic and diluted | | $ | (0.20 | ) |
| | Year ended
December 31, 2006
(Restated) | |
Operating loss | | $ | (4,120 | ) |
Net loss | | $ | (4,120 | ) |
Net loss per common share—basic and diluted | | $ | (0.20 | ) |
Valuation Assumptions for Stock Options
During the twelve months ended December 31, 2006, 2007 and 2007,2008, total stock options granted to employees were 182,500183,000, 762,000 and 762,00011,000 respectively, with estimated total grant-date fair values of $2.4 million, and $8.1 million and $106,000, respectively. The Company estimates that the stock-based compensation for the awards not expected to vest during the years ended December 31, 2006, 2007 and 20072008 was $643,000, and $2.4 million and $32,000, respectively. During the years ended December 31, 2006, 2007 and 2007,2008, the Company recorded stock-based compensation related to stock options of $4.1 million, and $4.5 million and $3.3 million, respectively.
Table of Contents
Overstock.com, Inc.
Notes to Consolidated Financial Statements (Continued)
18. STOCK BASED AWARDS (Continued)
The fair value for each stock option granted during the twelve months ended December 31, 2005, 2006, 2007 and 20072008 was estimated at the date of grant using the BSM option-pricing model, assuming no dividends and the following assumptions.
| | | | | | | | | | |
| | Years ended December 31, | |
|---|
| | 2006 | | 2007 | | 2008 | |
|---|
Average risk-free interest rate | | | 4.77 | % | | 4.75 | % | | 2.91 | % |
Average expected life (in years) | | | 3.5 | | | 6.3 | | | 6.3 | |
Volatility | | | 65.1 | % | | 68.5 | % | | 70.6 | % |
| | Years ended December 31, | |
| | 2005 | | 2006 | | 2007 | |
Average risk-free interest rate | | 4.44 | % | 4.77 | % | 4.75 | % |
Average expected life (in years) | | 3.7 | | 3.5 | | 6.3 | |
Volatility | | 73.3 | % | 65.1 | % | 68.5 | % |
Expected Volatility: The fair value of stock based payments were valued using a volatility factor based on the Company’sCompany's historical stock prices.
Expected Term: For 2005 and 2006 option grants, the Company’sCompany's expected term represents the period that the Company’sCompany's stock-based awards are expected to be outstanding and was determined based on historical experience of similar awards, giving consideration to the contractual terms and vesting provisions of the stock-based awards. For 2007 and 2008 option grants, the Company elected to use the “simplified method”"simplified method" as discussed in SAB No. 107 to develop the estimate of the expected term. In December 2007, the SEC issued SAB No. 110,Certain Assumptions Used in Valuation Methods—Expected Term ("SAB No. 110"). According to SAB No. 110, under certain circumstances the SEC staff will continue to accept the use of the simplified method as discussed in SAB No. 107, in developing an estimate of expected term of "plain vanilla" share options in accordance with SFAS No. 123(R), beyond December 31, 2007. The Company adopted SAB No. 110 effective January 1, 2008 and will continue to use the simplified method in developing the expected term used for its valuation of stock-based compensation.
Expected Dividend: The Company has not paid any dividends and does not anticipate paying dividends in the foreseeable future.
Risk-Free Interest Rate: The Company bases the risk-free interest rate used on the implied yield currently available on U.S. Treasury zero-coupon issues with remaining term equivalent to the expected term of the options.
Estimated Pre-vesting Forfeitures: When estimating forfeitures, the Company considers voluntary and involuntary termination behavior.
Stock Option Activity
The Company’sCompany's board of directors adopted the Amended and Restated 1999 Stock Option Plan, the 2002 Stock Option Plan and the 2005 Equity Incentive Plan (collectively, the “Plans”"Plans"), in May 1999, April 2002, and April 2005 respectively. Under these Plans, the Board of Directors may issue incentive stock options to employees and directors of the Company and non-qualified stock options to consultants of the Company. Options granted under these Plans generally expire at the end of five or ten years and vest in accordance with a vesting schedule determined by the Company’sCompany's Board of Directors, usually over four years from the grant date. As of the initial public offering, the Amended and Restated 1999 Stock Option Plan was terminated, and as of April 2005 the 2002 Stock Option Plan
Table of Contents
Overstock.com, Inc.
Notes to Consolidated Financial Statements (Continued)
18. STOCK BASED AWARDS (Continued)
was terminated (except with regard to outstanding options). Future shares will be granted under the 2005 Equity Incentive Plan. As of December 31, 2007, 608,0002008, 1.2 million shares of stock based awards are available for future grants under the 2005 Equity Incentive Plan. The Company settles stock option exercises with newly issued common shares. The following is a summary of stock option activity (in thousands, except per share data):
| | 2005 | | 2006 | | 2007 | |
| | Shares | | Weighted Average
Exercise Price | | Shares | | Weighted Average
Exercise Price | | Shares | | Weighted Average
Exercise Price | |
Outstanding—beginning of year | | 1,512 | | $ | 12.90 | | 1,299 | | $ | 18.09 | | 1,011 | | $ | 18.97 | |
Granted at fair value | | 220 | | 44.44 | | 183 | | 22.47 | | 762 | | 18.14 | |
Exercised | | (298 | ) | 8.56 | | (276 | ) | 9.19 | | (354 | ) | 8.81 | |
Canceled/forfeited | | (135 | ) | 24.08 | | (195 | ) | 30.17 | | (258 | ) | 23.65 | |
| | | | | | | | | | | | | |
Outstanding—end of year | | 1,299 | | 18.09 | | 1,011 | | 18.97 | | 1,161 | | 20.48 | |
| | | | | | | | | | | | | |
Options exercisable at year-end | | 739 | | 11.33 | | 679 | | $ | 15.74 | | 408 | | $ | 22.36 | |
| | | | | | | | | | | | | | | | |
| | | | | | | | | | | | | | | | | | | |
| | 2006 | | 2007 | | 2008 | |
|---|
| | Shares | | Weighted
Average
Exercise
Price | | Shares | | Weighted
Average
Exercise
Price | | Shares | | Weighted
Average
Exercise
Price | |
|---|
Outstanding—beginning of year | | | 1,299 | | $ | 18.09 | | | 1,011 | | $ | 18.97 | | | 1,161 | | $ | 20.48 | |
Granted at fair value | | | 183 | | | 22.47 | | | 762 | | | 18.14 | | | 11 | | | 14.14 | |
Exercised | | | (276 | ) | | 9.19 | | | (354 | ) | | 8.81 | | | (112 | ) | | 12.96 | |
Canceled/forfeited | | | (195 | ) | | 30.17 | | | (258 | ) | | 23.65 | | | (86 | ) | | 20.45 | |
| | | | | | | | | | | | | | | | | |
Outstanding—end of year | | | 1,011 | | | 18.97 | | | 1,161 | | | 20.48 | | | 974 | | | 21.27 | |
| | | | | | | | | | | | | | | | | |
Options exercisable at year-end | | | 679 | | $ | 15.74 | | | 408 | | $ | 22.36 | | | 609 | | $ | 23.18 | |
The following table summarizes information about stock options as of December 31, 20072008 (in thousands, except per share data):
F-30
| | | | | | | | | | | | | | | | | | | | | | | | | |
| | Options Outstanding | | Options Exercisable | |
|---|
Range of Exercise Prices | | Shares | | Weighted
Average
Exercise
Price | | Weighted
Average
Remaining
Contract Life | | Aggregate
Intrinsic
Value | | Shares | | Weighted
Average
Exercise
Price | | Weighted
Average
Remaining
Contract Life | | Aggregate
Intrinsic
Value | |
|---|
$ 8.50 - $16.99 | | | 17 | | $ | 13.28 | | | 7.04 | | $ | 51 | | | 4 | | $ | 14.92 | | | 4.73 | | $ | 45 | |
$17.00 - $17.99 | | | 577 | | | 17.11 | | | 8.05 | | | — | | | 276 | | | 17.11 | | | 8.04 | | | — | |
$18.00 - $29.99 | | | 221 | | | 19.97 | | | 1.68 | | | — | | | 181 | | | 19.63 | | | 0.97 | | | — | |
$30.00 - $58.30 | | | 159 | | | 39.04 | | | 2.87 | | | — | | | 147 | | | 39.18 | | | 2.72 | | | — | |
| | | | | | | | | | | | | | | | | | | | | | |
. | | | 974 | | | 21.27 | | | 5.74 | | | 51 | | | 609 | | | 23.18 | | | 4.63 | | | 45 | |
Table of Contents
| | Options Outstanding | | Options Exercisable | |
Range of Exercise Prices | | Shares | | Weighted
Average Exercise
Price | | Weighted
Average
Remaining
Contract Life | | Aggregate Intrinsic
Value | | Shares | | Weighted
Average Exercise
Price | | Weighted
Average
Remaining
Contract Life | | Aggregate Intrinsic
Value | |
$8.50-$16.99 | | 145 | | $ | 12.74 | | 0.94 | | $ | 1,185 | | 135 | | $ | 12.53 | | 0.49 | | $ | 1,137 | |
$17.00-$17.99 | | 604 | | 17.11 | | 9.01 | | 2,317 | | 2 | | 17.44 | | 3.57 | | 7 | |
$18.00-$29.99 | | 234 | | 19.96 | | 2.59 | | 346 | | 165 | | 19.33 | | 1.45 | | 317 | |
$30.00-$58.30 | | 178 | | 38.81 | | 3.76 | | — | | 106 | | 39.72 | | 1.86 | | — | |
| | | | | | | | | | | | | | | | | |
| . | 1,161 | | 20.48 | | 5.09 | | 3,848 | | 408 | | 22.36 | | 1.28 | | 1,461 | |
| | | | | | | | | | | | | | | | | | | | | |
Total unrecognized compensation costs related to nonvested awards was approximately $6.2 million, $7.3 million and $7.3$4.2 million as of December 31, 2006, 2007 and 2007,2008, respectively. These nonvested awards are expected to be exercised over the weighted average period of 8.37.6 years.
The aggregate intrinsic value in the table above represents the total pretax intrinsic value, based on the Company’sCompany's average stock price of $20.95$16.02 during the year ended December 31, 2007,2008, which would have been received by the option holders had all option holders exercised their options as of that date. The total number ofThere were no in-the-money options exercisable as of December 31, 2007 was approximately 271,000.
2008.
The weighted average exercise price of options granted during the years ended December 31, 2006, 2007 and 20072008 were $22.47, $18.14 and $18.14$14.14 per share, respectively. The total fair values of the shares vested during the years ended December 31, 2006, 2007 and 20072008 were $3.1 million, $3.7 million and $3.7$5.2 million, respectively. The total intrinsic value of options exercised during the years ended December 31, 2006, 2007 and 20072008 was $3.3 million, $4.5 million and $4.5$364,000 million, respectively. The total cash received from employees as a result of employee stock option exercises during the years ended December 31, 2006, 2007 and 20072008 were approximately $2.5 million, $3.2 million and $3.2
Table of Contents
Overstock.com, Inc.
Notes to Consolidated Financial Statements (Continued)
18. STOCK BASED AWARDS (Continued)
$1.5 million, respectively. In connection with these exercises, there was no tax benefit realized by the Company due to the Company’sCompany's current loss position.
Restricted Stock Unit Activity
InFor the first quarter ofyear ended December 31, 2008, the Compensation Committee of the Board of Directors approved grants of approximately 460,000491,000 restricted stock units to officers and employeeswere granted. The cost of restricted stock units is determined using the fair value of our common stock on the date of the Company whichgrant and compensation expense is recognized in accordance with the vesting schedule. The weighted average grant date fair value of restricted stock units granted during the year ended December 31, 2008 was $12.64.
The following is a summary of restricted stock unit activity (amounts in thousands, except per share data):
| | | | | | | |
| | Units | | Grant Date
Fair Value | |
|---|
Outstanding—beginning of year | | | — | | $ | — | |
Granted at fair value | | | 491 | | | 12.64 | |
Vested | | | — | | | — | |
Canceled/forfeited | | | (42 | ) | | 12.13 | |
| | | | | | | |
Outstanding—end of year | | | 449 | | | 12.69 | |
| | | | | | | |
Restricted stock units vested at year-end | | | — | | | — | |
The restricted stock units vest over three years at 25% at the end of the first year, an additional 25% at the end of the second year and 50% at the end of the third year. During the years ended December 31, 2006, 2007 and 2008, the Company recorded stock based compensation related to restricted stock units of $0, $0 and $896,000.
At December 31, 2008, there were 449,000 restricted stock units that remained outstanding, no restricted stock units were vested as of December 31, 2008. On January 13, 2009, 337,000 additional restricted stock units were granted.
19. PERFORMANCE SHARE PLANPerformance Share Plan
In January 2006, the Board of Directors and Compensation Committee adopted the Overstock.com Performance Share Plan (the "Plan") and approved grants to executive officers and certain employees of the Company. The Performance Share Plan provides for a three-year period for the measurement of the Company’sCompany's attainment of the performance goal described in the form of a grant.
The performance goal iswas measured by growth in economic value, as defined in the plan.Plan. The amount of payments due to participants under the plan will bePlan was a function of the then current market price of a share of the Company’sCompany's common stock, multiplied by a percentage dependent on the extent to which the performance goal hashad been attained, which will bewas between 0% and 200%. If the growth in economic value iswas 10% compounded annually or less, the percentage will bewas 0%. If the growth in economic value iswas 25% compounded annually, the percentage will bewas 100%. If the growth in economic value iswas 40% compounded annually or more, the percentage will bewas 200%. If the percentage growth iswas between these percentages, the payment percentage willwould be determined on the basis of straight line interpolation. Amounts payable under the planPlan were subject to Board discretion. Amounts payable
Table of Contents
Overstock.com, Inc.
Notes to Consolidated Financial Statements (Continued)
18. STOCK BASED AWARDS (Continued)
under the Plan were originally payable in cash. During interim and annual periods prior to the third quarter of 2007, the Company recorded compensation expense based upon the period-end stock price and estimates regarding the ultimate growth in economic value that iswas expected to occur. These estimates included assumed future growth rates in revenues, gross marginsprofit percentages and other factors. If the Company were to use different assumptions, the estimated compensation charges could bewould have been significantly different.
An amendment to the Performance Share Plan to allow the Company to make payments in the form of common stock was approved by the shareholders on May 15, 2007. In the third quarter of 2007, the Company determined the fair value of the awards on the amendment date and determined on August 7, 2007 to make the payments in the form of common stock, rather than cash. Therefore, the Company reclassified awards under the performance share planPlan from their current status as liability awards to equity awards in accordance with FASSFAS No. 123(R).
As of December 31, 2006, the Company had accrued $900,000 in total compensation expense under the plan. During the first six months of 2007, the Company accrued an additional $650,000 related to performance shares prior to the determination to make the payments in the form of common stock. The Company reclassified the total liability of approximately $1.6 million related to performance share awards granted prior to the determination to additional-paid-in-capital on August 7, 2007.
Over the remaining six months of 2007, the Company reduced the estimated compensation expense under the plan by approximately $550,000, based on changes in its estimate of growth in economic value over the remaining twelve months of the plan. As of December 31, 2007, the cumulative expense related to the performance share awards was $1.0 million.
During the year ended December 31, 2008, the Company reversed the cumulative $1.0 million in total compensation expense under the Plan as the Board determined no payments would be made under the Plan. The Plan expired on December 31, 2008.
20.19. EMPLOYEE RETIREMENT PLAN
The Company has a 401(k) defined contribution plan which permits participating employees to defer up to a maximum of 25% of their compensation, subject to limitations established by the Internal Revenue Code. Employees who have completed a half-year of service and are 21 years of age or older are qualified to participate in the plan. The Company matches 50% of the first 6% of each participant’sparticipant's contributions to the plan. Beginning in 2006 through January 2008, the Company’sCompany's matching contribution is comprised of common stock issued from treasury to employees. For the remainder of 2008, the Company's matching contribution consisted cash matching payment. Participant contributions are immediately vested. Company contributions vest based on the participant’sparticipant's years of service at 20% per year over five years. The Company’sCompany's matching contribution totaled $261,000, $389,000, $494,000 and $494,000$570,000 during 2005, 2006, 2007 and 2007,2008, respectively. In addition, the Company made discretionary contributions of $342,000, $409,000, $408,000, $0 during 2006, 2007 and $408,000 during 2005, 2006 and 20072008 to eligible participants as of the end of each respective calendar year. The contributions in 2006 and 2007 were settled with Company stock in the following year.
21.20. OTHER INCOME (EXPENSE), NET
Other income (expense), net consisted of the following (in thousands):
| | | | | | | | | | |
| | Years ended December 31, | |
|---|
| | 2006 | | 2007 | | 2008 | |
|---|
Gain from early retirement of 3.75% convertible senior notes | | $ | — | | $ | — | | $ | 2,849 | |
Loss on settlement of notes receivable | | | — | | | — | | | (3,929 | ) |
Other | | | 81 | | | (92 | ) | | (366 | ) |
| | | | | | | | |
Other income (expense), net | | $ | 81 | | $ | (92 | ) | $ | (1,446 | ) |
| | | | | | | | |
| | Years ended December 31, | |
| | 2005 | | 2006 | | 2007 | |
Gain from early retirement of convertible senior notes | | $ | 6,158 | | $ | — | | $ | — | |
Loss on disposal of software | | (1,457 | ) | — | | — | |
Other | | 27 | | 81 | | (92 | ) |
| | | | | | | |
Other income (expense), net | | $ | 4,728 | | $ | 81 | | $ | (92 | ) |
F-31
Table of Contents
Overstock.com, Inc.
22.Notes to Consolidated Financial Statements (Continued)
21. INCOME TAXES
The components of the Company’sCompany's deferred tax assets and liabilities as of December 31, 20062007 and 20072008 are as follows (in thousands):
| | December 31, | |
| | 2006
(Restated) | | 2007
(Restated) | |
Deferred tax assets and liabilities: | | | | | |
Net operating loss carry-forwards | | $ | 64,232 | | $ | 72,695 | |
Temporary differences: | | | | | |
Accrued expenses | | 5,722 | | 6,498 | |
Reserves and other | | 4,788 | | 2,924 | |
Depreciation | | 1,689 | | 3,799 | |
| | | | | |
| | 76,431 | | 85,916 | |
Valuation allowance | | (76,431 | ) | (85,916 | ) |
| | | | | |
Net asset | | $ | — | | $ | — | |
| | | | | | | | | |
| | December 31, | |
|---|
| | 2007 | | 2008 | |
|---|
Deferred tax assets and liabilities: | | | | | | | |
| | Net operating loss carry-forwards | | $ | 72,695 | | $ | 72,459 | |
| | Temporary differences: | | | | | | | |
| | | Accrued expenses | | | 6,498 | | | 5,365 | |
| | | Reserves and other | | | 2,924 | | | 4,115 | |
| | | Depreciation | | | 3,799 | | | 5,055 | |
| | | | | | |
| | | 85,916 | | | 86,994 | |
Valuation allowance | | | (85,916 | ) | | (86,994 | ) |
| | | | | | |
Net asset | | $ | — | | $ | — | |
| | | | | | |
As a result of the Company’sCompany's history of losses, a valuation allowance has been provided for the full amount of the Company’sCompany's net deferred tax assets.
At December 31, 20062007 and 2007,2008, the Company had net operating loss carry-forwards of approximately $145.2$164.2 million and $164.2$171.8 million, respectively, which may be used to offset future taxable income. An additional $21.9 million of net operating losses are limited under Internal Revenue Code Section 382 to $799,000 a year. These carry-forwards begin to expire in 2018.
The income tax benefit differs from the amount computed by applying the U.S. federal income tax rate of 35% to loss before income taxes for the following reasons (in thousands):
| | Years ended December 31, | |
| | 2005
(Restated) | | 2006
(Restated) | | 2007
(Restated) | |
U.S. federal income tax benefit at statutory rate | | $ | 8,805 | | $ | 37,367 | | $ | 16,813 | |
State income tax benefit, net of federal expense | | 857 | | 3,623 | | 949 | |
Stock compensation expense | | (25 | ) | — | | (2,267 | ) |
Other | | (389 | ) | (1,144 | ) | (3,969 | ) |
Unrecognized benefit due to valuation allowance | | (9,248 | ) | (39,846 | ) | (11,526 | ) |
| | | | | | | |
Income tax benefit | | $ | — | | $ | — | | $ | — | |
| | | | | | | | | | |
| | Years ended December 31, | |
|---|
| | 2006 | | 2007 | | 2008 | |
|---|
U.S. federal income tax benefit at statutory rate | | $ | 37,367 | | $ | 16,813 | | $ | 4,431 | |
State income tax benefit, net of federal expense | | | 3,623 | | | 949 | | | 147 | |
Stock based compensation expense | | | — | | | (2,267 | ) | | (1,491 | ) |
Other | | | (1,144 | ) | | (3,969 | ) | | (2,009 | ) |
Unrecognized benefit due to valuation allowance | | | (39,846 | ) | | (11,526 | ) | | (1,078 | ) |
| | | | | | | | |
Income tax benefit | | $ | — | | $ | — | | $ | — | |
| | | | | | | | |
The Company adopted the provisions of FASB Interpretation No. 48,Accounting for Uncertainty in Income Taxes (“ ("FIN 48”48") on January 1, 2007. As a result of a full valuation allowance, the Company does not have any unrecognized tax benefits and there iswas no effect on its financial condition or results of operations as a result of implementing FIN 48. The Company is subject to audit by the IRS and various states for periods since inception. The Company does not believe there will be any material changes in its unrecognized tax positions over the next 12 months. The Company’sCompany's policy is that it recognizes interest and penalties accrued on any unrecognized tax positions as a component of income tax expense. As of the date of adoption of FIN 48, the Company did not have any accrued interest or penalties associated with any unrecognized tax positions, nor did the Company recognize any interest expense or penalties during the year ended December 31, 2007.2008.
Table of Contents
Overstock.com, Inc.
23.Notes to Consolidated Financial Statements (Continued)
22. RELATED PARTY TRANSACTIONS
On occasion, Haverford-Valley, L.C. (an entity owned by the Company’sCompany's Chairman and Chief Executive Officer) and certain affiliated entities make travel arrangements for Company executives and pay the travel related expenses incurred by ourits executives on Company business. In 2005, 2006, 2007, and 20072008 the Company reimbursed Haverford-Valley L.C. $274,000, $267,000, $93,000, and $93,000,$111,000, respectively, for these expenses.
24.23. BUSINESS SEGMENTS
Segment information has been prepared in accordance with SFAS No. 131,Disclosures about Segments of an Enterprise and Related Information. Segments were determined based on products and services provided by each segment. Accounting policies of the segments are the same as those described in “Note"Note 2—Summary of Significant Accounting Policies”.Policies." There were no inter-segment sales or transfers during 2005, 2006, 2007 or 2007.2008. The Company evaluates the performance of its segments and allocates resources to them based primarily on gross profit. The table below summarizes information about reportable segments (in thousands):
F-32
| | | | | | | | | | |
| | Direct | | Fulfillment
partner | | Consolidated | |
|---|
2006 | | | | | | | | | | |
Revenue | | $ | 301,509 | | $ | 478,628 | | $ | 780,137 | |
Cost of goods sold | | | 284,774 | | | 405,559 | | | 690,333 | |
| | | | | | | | |
Gross profit | | | 16,735 | | | 73,069 | | | 89,804 | |
Operating expenses | | | | | | | | | (188,566 | ) |
Other income (expense), net | | | | | | | | | (1,118 | ) |
| | | | | | | | | | |
Loss from continuing operations | | | | | | | | $ | (99,880 | ) |
| | | | | | | | | | |
2007 | | | | | | | | | | |
Revenue | | $ | 197,088 | | $ | 568,814 | | $ | 765,902 | |
Cost of goods sold | | | 168,008 | | | 473,344 | | | 641,352 | |
| | | | | | | | |
Gross profit | | | 29,080 | | | 95,470 | | | 124,550 | |
Operating expenses | | | | | | | | | (169,170 | ) |
Other income (expense), net | | | | | | | | | 508 | |
| | | | | | | | | | |
Loss from continuing operations | | | | | | | | $ | (44,112 | ) |
| | | | | | | | | | |
2008 | | | | | | | | | | |
Revenue | | $ | 174,203 | | $ | 660,164 | | $ | 834,367 | |
Cost of goods sold | | | 154,501 | | | 536,957 | | | 691,458 | |
| | | | | | | | |
Gross profit | | | 19,702 | | | 123,207 | | | 142,909 | |
Operating expenses | | | | | | | | | (153,822 | ) |
Other income (expense), net | | | | | | | | | (1,745 | ) |
| | | | | | | | | | |
Loss from continuing operations | | | | | | | | $ | (12,658 | ) |
| | | | | | | | | | |
Table of Contents
| | Direct | | Fulfillment partner | | Consolidated | |
2005 (Restated) | | | | | | | |
Revenue | | $ | 323,136 | | $ | 471,839 | | $ | 794,975 | |
Cost of goods sold | | 280,647 | | 397,855 | | 678,502 | |
| | | | | | | |
Gross profit | | 42,489 | | 73,984 | | 116,473 | |
Operating expenses | | | | | | (138,099 | ) |
Other income (expense), net | | | | | | (1,015 | ) |
| | | | | | | |
Loss from continuing operations | | | | | | $ | (22,641 | ) |
| | | | | | | |
2006 (Restated) | | | | | | | |
Revenue | | $ | 301,509 | | $ | 478,628 | | $ | 780,137 | |
Cost of goods sold | | 284,774 | | 405,559 | | 690,333 | |
| | | | | | | |
Gross profit | | 16,735 | | 73,069 | | 89,804 | |
Operating expenses | | | | | | (188,566 | ) |
Other income (expense), net | | | | | | (1,118 | ) |
| | | | | | | |
Loss from continuing operations | | | | | | $ | (99,880 | ) |
| | | | | | | |
2007 (Restated) | | | | | | | |
Revenue | | $ | 197,088 | | $ | 568,814 | | $ | 765,902 | |
Cost of goods sold | | 168,008 | | 473,344 | | 641,352 | |
| | | | | | | |
Gross profit | | 29,080 | | 95,470 | | 124,550 | |
Operating expenses | | | | | | (169,170 | ) |
Other income (expense), net | | | | | | 508 | |
| | | | | | | |
Loss from continuing operations | | | | | | $ | (44,112 | ) |
The direct segment includes revenues, direct costs, and allocations associated with sales fulfilled from our warehouse. Costs for this segment include product costs, inbound freight, warehousing, and fulfillment costs, credit card fees and customer service costs.
Table of Contents
Overstock.com, Inc.
Notes to Consolidated Financial Statements (Continued)
23. BUSINESS SEGMENTS (Continued)
The fulfillment partner segment includes revenues, direct costs and cost allocations associated with the Company’sCompany's third party fulfillment partner sales and are earned from selling the merchandise of third parties over the Company’sCompany's Website. This segment also includes revenues and costs associated with the auctions and cars and real estate listing businesses. The costs for this segment include product costs, warehousing and fulfillment costs, credit card fees and customer service costs.
Assets have not been allocated between the segments for management purposes, and as such, they are not presented here.
During the years 20052006 through 2007,2008, over 99% of sales were made to customers in the United States of America. At December 31, 20062007 and 2007,2008, all of the Company’sCompany's fixed assets were located in the United States of America.
25.24. INDEMNIFICATIONS AND GUARANTEES
During its normal course of business, the Company has made certain indemnities, commitments, and guarantees under which it may be required to make payments in relation to certain transactions. These indemnities include, but are not limited to, indemnities to various lessors in connection with facility leases for certain claims arising from such facility or lease, and indemnities to directors and officers of the Company to the maximum extent permitted under the laws of the State of Delaware. The duration of these indemnities, commitments, and guarantees varies, and in certain cases, is indefinite. In addition, the majority of these indemnities, commitments, and guarantees do not provide for any limitation of the maximum potential future payments the Company could be obligated to make. As such, the Company is unable to estimate with any reasonableness its potential exposure under these items. The Company has not recorded any liability for these indemnities, commitments, and guarantees in the accompanying consolidated balance sheets. The Company does, however, accrue for losses for any known contingent liability, including those that may arise from indemnification provisions, when future payment is both probable and reasonably estimable. The Company carries specific and general liability insurance policies that the Company believes would, in most circumstances, provide some, if not total recourse to any claims arising from these indemnifications.
26.25. DECONSOLIDATION OF VARIABLE INTEREST ENTITY
In April 2005, the Company entered into an agreement which allowed the Company to lend up to $10.0 million to an entity for the purpose of buying diamonds and other jewelry, primarily to supply a new category within the jewelry department which allowed customers purchasing diamond rings to select both a specific diamond and ring setting. Under the agreement, the Company was to receive fifty percent (50%) of any profits of the entity. In addition, the Company had a ten year option to purchase (“("Purchase Option”Option") 50% of the ownership and voting interest of the entity. The exercise price of the Purchase Option was the sum of (a) one thousand dollars, and (b) $3.0 million, which may have been paid, at the Company’sCompany's election, in cash or by the forgiveness of $3.0 million of the entity’sentity's indebtedness to the Company.
The entity was evaluated in accordance with FASB Interpretation No. 46Revised, Consolidation of Variable Interest Entities—an Interpretation of ARB No. 51 (“ ("FIN 46”46"), and it was determined to be a variable interest entity for which the Company was determined to be the primary beneficiary. As such, the financial statements of the entity were consolidated into the financial statements of the Company.
Table of Contents
Overstock.com, Inc.
Notes to Consolidated Financial Statements (Continued)
25. DECONSOLIDATION OF VARIABLE INTEREST ENTITY (Continued)
In November 2004, the Company loaned the entity $8.4 million. The promissory note bore interest at 3.75% per annum. Interest on the loan was due and payable quarterly on the fifteenth day of February, May, August and November, commencing on November 15, 2004 until the due date of November 30, 2006, on which all principal and interest accrued and unpaid thereon, was due and payable. The promissory note was collateralized by all of the assets of the entity.
In November 2006, an unrelated third party purchased the Company’sCompany's interests in the variable interest entity by executing a promissory note to the Company in exchange for termination of all agreements between the Company and the variable interest entity. The promissory note iswas equal to the net assets of the entity or $6.7 million and bearsbore no interest. The first payment on the note receivable was due and paid on February 1, 2007 in the amount of $3.7 million with remainder of balance due in twelve equal monthly payments of $251,000 beginning on March 1, 2007. In September 2007, the Company amended the note receivable deferring the final six monthly payments from February 1, 2008to2008 to July 1, 2008. As of December 31, 2007 and 2008, the Company had received payments on the note totaling $5.2 million.
F-33million and $1.5 million, respectively. The promissory note was completely satisfied as of December 31, 2008.
Table of Contents
Overstock.com, Inc.
As a result of the agreement, the Company deconsolidated certain assets relatedNotes to the variable interest entity effective November 30, 2006. The operating results through November 30, 2006 relating to variable interest entity are included in the consolidated statements of operations. As a result of the deconsolidation, the following assets were removed from the Company’s accounts (in thousands):Consolidated Financial Statements (Continued)
Cash | | $ | 102 | |
Accounts Receivable, net | | 435 | |
Inventory | | 5,986 | |
Prepaids | | 4 | |
Other Long-term assets | | 175 | |
| | | |
Total | | $ | 6,702 | |
27.26. QUARTERLY RESULTS OF OPERATIONS (unaudited)
The following tables set forth the Company’sCompany's unaudited quarterly results of operations data for the eight most recent quarters for the period ended December 31, 2007, as reported and as restated.2008. The Company has prepared this information on the same basis as the Consolidated Statements of Operations and the information includes all adjustments, consisting only of normal recurring adjustments, that it considers necessary for a fair statement of our financial position and operating results for the quarters presented.
| | | | | | | | | | | | | | | | | | | | | | | | | | | |
| | Three Months Ended | |
|---|
| | Mar. 31,
2007 | | June 30,
2007 | | Sept. 30,
2007 | | Dec. 31,
2007 | | Mar. 31,
2008 | | June 30,
2008 | | Sept. 30,
2008 | | Dec. 31,
2008 | |
|---|
| | (in thousands, except per share data)
| |
|---|
Consolidated Statement of Operations Data: | | | | | | | | | | | | | | | | | | | | | | | | | |
Revenue | | | | | | | | | | | | | | | | | | | | | | | | | |
| | Direct revenue | | $ | 46,990 | | $ | 43,658 | | $ | 39,270 | | $ | 67,170 | | $ | 51,764 | | $ | 39,832 | | $ | 34,176 | | $ | 48,431 | |
| | Fulfillment partner revenue | | | 115,166 | | | 105,513 | | | 120,789 | | | 227,346 | | | 151,050 | | | 149,004 | | | 152,679 | | | 207,431 | |
| | | | | | | | | | | | | | | | | | |
| | | Total revenue | | | 162,156 | | | 149,171 | | | 160,059 | | | 294,516 | | | 202,814 | | | 188,836 | | | 186,855 | | | 255,862 | |
| | | | | | | | | | | | | | | | | | |
Cost of goods sold | | | | | | | | | | | | | | | | | | | | | | | | | |
| | Direct | | | 41,469 | | | 36,456 | | | 33,268 | | | 56,815 | | | 44,803 | | | 34,871 | | | 30,633 | | | 44,194 | |
| | Fulfillment partner | | | 96,077 | | | 86,523 | | | 99,425 | | | 191,319 | | | 124,040 | | | 120,756 | | | 124,103 | | | 168,058 | |
| | | | | | | | | | | | | | | | | | |
| | | Total cost of goods sold | | | 137,546 | | | 122,979 | | | 132,693 | | | 248,134 | | | 168,843 | | | 155,627 | | | 154,736 | | | 212,252 | |
| | | | | | | | | | | | | | | | | | |
Gross profit | | | 24,610 | | | 26,192 | | | 27,366 | | | 46,382 | | | 33,971 | | | 33,209 | | | 32,119 | | | 43,610 | |
| | | | | | | | | | | | | | | | | | |
Operating expenses: | | | | | | | | | | | | | | | | | | | | | | | | | |
| | Sales and marketing | | | 11,284 | | | 7,962 | | | 8,835 | | | 27,377 | | | 15,019 | | | 14,244 | | | 11,934 | | | 16,437 | |
| | Technology | | | 14,973 | | | 15,237 | | | 14,576 | | | 14,667 | | | 14,516 | | | 15,311 | | | 14,119 | | | 13,869 | |
| | General and administrative | | | 10,689 | | | 10,429 | | | 9,724 | | | 11,134 | | | 9,563 | | | 10,867 | | | 10,321 | | | 7,622 | |
| | Restructuring | | | 6,089 | | | 6,194 | | | — | | | — | | | — | | | — | | | — | | | — | |
| | | | | | | | | | | | | | | | | | |
| | | Total operating expenses | | | 43,035 | | | 39,822 | | | 33,135 | | | 53,178 | | | 39,098 | | | 40,422 | | | 36,374 | | | 37,928 | |
| | | | | | | | | | | | | | | | | | |
Operating income (loss) | | | (18,425 | ) | | (13,630 | ) | | (5,769 | ) | | (6,796 | ) | | (5,127 | ) | | (7,213 | ) | | (4,255 | ) | | 5,682 | |
Interest income, net | | | 990 | | | 1,078 | | | 1,291 | | | 1,429 | | | 1,304 | | | 740 | | | 664 | | | 455 | |
Interest expense | | | (1,029 | ) | | (1,027 | ) | | (1,029 | ) | | (1,103 | ) | | (901 | ) | | (888 | ) | | (847 | ) | | (826 | ) |
Other income (expense), net | | | — | | | — | | | (92 | ) | | — | | | — | | | 2 | | | 2,849 | | | (4,297 | ) |
| | | | | | | | | | | | | | | | | | |
Income (loss)Loss from continuing operations | | | (18,464 | ) | | (13,579 | ) | | (5,599 | ) | | (6,470 | ) | | (4,724 | ) | | (7,359 | ) | | (1,589 | ) | | 1,014 | |
Discontinued operations: | | | | | | | | | | | | | | | | | | | | | | | | | |
Loss from discontinued operations | | | (3,624 | ) | | (300 | ) | | — | | | — | | | — | | | — | | | — | | | — | |
| | | | | | | | | | | | | | | | | | |
Net income (loss) | | $ | (22,088 | ) | $ | (13,879 | ) | $ | (5,599 | ) | $ | (6,470 | ) | $ | (4,724 | ) | $ | (7,359 | ) | $ | (1,589 | ) | $ | 1,014 | |
| | | | | | | | | | | | | | | | | | |
Net income (loss) per common share—basic | | | | | | | | | | | | | | | | | | | | | | | | | |
| | Income (loss) from continuing operations | | $ | (0.78 | ) | $ | (0.57 | ) | $ | (0.23 | ) | $ | (0.27 | ) | $ | (0.20 | ) | $ | (0.32 | ) | $ | (0.07 | ) | $ | 0.04 | |
| | Loss from discontinued operations | | $ | (0.16 | ) | $ | (0.01 | ) | $ | — | | $ | — | | $ | — | | $ | — | | $ | — | | $ | — | |
Net income (loss) per share—basic | | $ | (0.94 | ) | $ | (0.58 | ) | $ | (0.23 | ) | $ | (0.27 | ) | $ | (0.20 | ) | $ | (0.32 | ) | $ | (0.07 | ) | $ | 0.04 | |
Weighted average common shares outstanding—basic | | | 23,594 | | | 23,689 | | | 23,726 | | | 23,807 | | | 23,345 | | | 22,750 | | | 22,768 | | | 22,745 | |
Net income (loss) per common share—diluted | | | | | | | | | | | | | | | | | | | | | | | | | |
| | Income (loss) from continuing operations | | $ | (0.78 | ) | $ | (0.57 | ) | $ | (0.23 | ) | $ | (0.27 | ) | $ | (0.20 | ) | $ | (0.32 | ) | $ | (0.07 | ) | $ | 0.04 | |
| | Income (loss) from discontinued operations | | $ | (0.16 | ) | $ | (0.01 | ) | $ | — | | $ | — | | $ | — | | $ | — | | $ | — | | $ | — | |
Net income (loss) per share—diluted | | $ | (0.94 | ) | $ | (0.58 | ) | $ | (0.23 | ) | $ | (0.27 | ) | $ | (0.20 | ) | $ | (0.32 | ) | $ | (0.07 | ) | $ | 0.04 | |
Weighted average common shares outstanding—diluted | | | 23,594 | | | 23,689 | | | 23,726 | | | 23,807 | | | 23,345 | | | 22,750 | | | 22,768 | | | 22,827 | |
| | Three Months Ended | |
| | Mar. 31,
2006
(As
Reported) | | June 30,
2006
(As
Reported) | | Sept. 30,
2006
(As
Reported) | | Dec. 31,
2006
(As
Reported) | | Mar. 31,
2007
(As
Reported) | | June 30,
2007
(As
Reported) | | Sept. 30,
2007
(As
Reported) | | Dec. 31,
2007
(As
Reported) | |
| | (in thousands, except per share data) | |
Consolidated Statement of Operations Data: | | | | | | | | | | | | | | | | | |
Revenue | | | | | | | | | | | | | | | | | |
Direct revenue | | $ | 79,710 | | $ | 68,770 | | $ | 56,564 | | $ | 98,158 | | $ | 45,701 | | $ | 43,578 | | $ | 39,446 | | $ | 66,897 | |
Fulfillment partner revenue | | 98,334 | | 90,422 | | 100,321 | | 195,871 | | 112,229 | | 105,389 | | 122,484 | | 224,437 | |
Total revenue | | 178,044 | | 159,192 | | 156,885 | | 294,029 | | 157,930 | | 148,967 | | 161,930 | | 291,334 | |
Cost of goods sold | | | | | | | | | | | | | | | | | |
Direct | | 70,703 | | 61,473 | | 51,037 | | 101,730 | | 39,320 | | 36,321 | | 33,160 | | 55,567 | |
Fulfillment partner | | 83,587 | | 75,411 | | 84,483 | | 164,926 | | 93,295 | | 86,343 | | 100,509 | | 188,075 | �� |
Total cost of goods sold | | 154,290 | | 136,884 | | 135,520 | | 266,656 | | 132,615 | | 122,664 | | 133,669 | | 243,642 | |
Gross profit | | 23,754 | | 22,308 | | 21,365 | | 27,373 | | 25,315 | | 26,303 | | 28,261 | | 47,692 | |
Operating expenses: | | | | | | | | | | | | | | | | | |
Sales and marketing | | 12,659 | | 11,911 | | 17,282 | | 29,045 | | 11,284 | | 7,962 | | 8,835 | | 27,377 | |
Technology | | 13,424 | | 14,897 | | 16,157 | | 20,680 | | 14,973 | | 15,237 | | 14,576 | | 14,667 | |
General and administrative | | 11,850 | | 11,050 | | 11,078 | | 12,859 | | 10,689 | | 10,429 | | 9,724 | | 11,134 | |
Restructuring | | — | | — | | — | | 5,674 | | 6,089 | | 6,194 | | — | | — | |
Total operating expenses | | 37,933 | | 37,858 | | 44,517 | | 68,258 | | 43,035 | | 39,822 | | 33,135 | | 53,178 | |
Operating loss | | (14,179 | ) | (15,550 | ) | (23,152 | ) | (40,885 | ) | (17,720 | ) | (13, 519 | ) | (4,874 | ) | (5,486 | ) |
Interest income, net | | 315 | | 2,215 | | 459 | | 577 | | 990 | | 1,078 | | 1,291 | | 1,429 | |
Interest expense | | (1,267 | ) | (1,275 | ) | (1,096 | ) | (1,127 | ) | (1,029 | ) | (1,027 | ) | (1,029 | ) | (1,103 | ) |
Other income (expense), net | | — | | (1 | ) | (6 | ) | 88 | | — | | — | | (92 | ) | — | |
Loss from continuing operations | | (15,131 | ) | (14,611 | ) | (23,795 | ) | (41,347 | ) | (17,759 | ) | (13,468 | ) | (4,704 | ) | (5,160 | ) |
Discontinued operations: | | | | | | | | | | | | | | | | | |
Loss from discontinued operations | | (779 | ) | (1,128 | ) | (708 | ) | (4,267 | ) | (3,624 | ) | (300 | ) | — | | — | |
Net loss | | (15,910 | ) | (15,739 | ) | (24,503 | ) | (45,614 | ) | (21,383 | ) | (13,768 | ) | (4,704 | ) | (5,160 | ) |
Deemed dividend related to redeemable common stock | | (33 | ) | (33 | ) | (33 | ) | — | | — | | — | | — | | — | |
Net loss attributable to common shares | | $ | (15,943 | ) | $ | (15,772 | ) | $ | (24,536 | ) | $ | (45,614 | ) | $ | (21,383 | ) | $ | (13,768 | ) | $ | (4,704 | ) | $ | (5,160 | ) |
Net loss per common share —basic and diluted | | | | | | | | | | | | | | | | | |
Loss from continuing operations | | $ | (0.78 | ) | $ | (0.73 | ) | $ | (1.16 | ) | $ | (1.95 | ) | $ | (0.75 | ) | $ | (0.57 | ) | $ | (0.20 | ) | $ | (0.22 | ) |
Loss from discontinued operations | | $ | (0.04 | ) | $ | (0.05 | ) | $ | (0.03 | ) | $ | (0.20 | ) | $ | (0.16 | ) | $ | (0.01 | ) | $ | — | | $ | — | |
Net loss per share—basic and diluted | | $ | (0.82 | ) | $ | (0.78 | ) | $ | (1.19 | ) | $ | (2.15 | ) | $ | (0.91 | ) | $ | (0.58 | ) | $ | (0.20 | ) | $ | (0.22 | ) |
Weighted average common shares outstanding—basic and diluted | | 19,385 | | 20,159 | | 20,600 | | 21,163 | | 23,594 | | 23,689 | | 23,726 | | 23,807 | |
F-34
Table of Contents
| | Three Months Ended (1) | |
| | Mar. 31, 2006
(Restated) | | June 30, 2006
(Restated) | | Sept. 30, 2006
(Restated) | | Dec. 31, 2006
(Restated) | | Mar. 31, 2007
(Restated) | | June 30, 2007
(Restated) | | Sept. 30, 2007
(Restated) | | Dec. 31, 2007
(Restated) | |
| | (in thousands, except per share data) | |
Consolidated Statement of Operations Data: | | | | | | | | | | | | | | | | | |
Revenue | | | | | | | | | | | | | | | | | |
Direct revenue | | $ | 80,143 | | $ | 69,363 | | $ | 57,563 | | $ | 94,440 | | $ | 46,990 | | $ | 43,658 | | $ | 39,270 | | $ | 67,170 | |
Fulfillment partner revenue | | 99,640 | | 90,354 | | 100,667 | | 187,967 | | 115,166 | | 105,513 | | 120,789 | | 227,346 | |
| | | | | | | | | | | | | | | | | |
Total revenue | | 179,783 | | 159,717 | | 158,230 | | 282,407 | | 162,156 | | 149,171 | | 160,059 | | 294,516 | |
| | | | | | | | | | | | | | | | | |
Cost of goods sold | | | | | | | | | | | | | | | | | |
Direct | | 71,831 | | 62,178 | | 52,073 | | 98,692 | | 41,469 | | 36,456 | | 33,268 | | 56,815 | |
Fulfillment partner | | 85,013 | | 76,037 | | 84,565 | | 159,944 | | 96,077 | | 86,523 | | 99,425 | | 191,319 | |
| | | | | | | | | | | | | | | | | |
Total cost of goods sold | | 156,844 | | 138,215 | | 136,638 | | 258,636 | | 137,546 | | 122,979 | | 132,693 | | 248,134 | |
| | | | | | | | | | | | | | | | | |
Gross profit | | 22,939 | | 21,502 | | 21,592 | | 23,771 | | 24,610 | | 26,192 | | 27,366 | | 46,382 | |
| | | | | | | | | | | | | | | | | |
Operating expenses: | | | | | | | | | | | | | | | | | |
Sales and marketing | | 12,659 | | 11,911 | | 17,282 | | 29,045 | | 11,284 | | 7,962 | | 8,835 | | 27,377 | |
Technology | | 13,424 | | 14,897 | | 16,157 | | 20,680 | | 14,973 | | 15,237 | | 14,576 | | 14,667 | |
General and administrative | | 11,850 | | 10,050 | | 11,078 | | 12,859 | | 10,689 | | 10,429 | | 9,724 | | 11,134 | |
Restructuring | | — | | — | | — | | 5,674 | | 6,089 | | 6,194 | | — | | — | |
| | | | | | | | | | | | | | | | | |
Total operating expenses | | 37,933 | | 37,858 | | 44,517 | | 68,258 | | 43,035 | | 39,822 | | 33,135 | | 53,178 | |
| | | | | | | | | | | | | | | | | |
Operating loss | | (14,994 | ) | (16,356 | ) | (22,925 | ) | (44,487 | ) | (18,425 | ) | (13,630 | ) | (5,769 | ) | (6,796 | ) |
Interest income, net | | 315 | | 2,215 | | 459 | | 577 | | 990 | | 1,078 | | 1,291 | | 1,429 | |
Interest expense | | (1,267 | ) | (1,275 | ) | (1,096 | ) | (1,127 | ) | (1,029 | ) | (1,027 | ) | (1,029 | ) | (1,103 | ) |
Other income (expense), net | | — | | (1 | ) | (6 | ) | 88 | | — | | — | | (92 | ) | — | |
| | | | | | | | | | | | | | | | | |
Loss from continuing operations | | (15,946 | ) | (15,417 | ) | (23,568 | ) | (44,949 | ) | (18,464 | ) | (13,579 | ) | (5,599 | ) | (6,470 | ) |
Discontinued operations: | | | | | | | | | | | | | | | | | |
Loss from discontinued operations | | (779 | ) | (1,128 | ) | (708 | ) | (4,267 | ) | (3,624 | ) | (300 | ) | — | | — | |
| | | | | | | | | | | | | | | | | |
Net loss | | (16,725 | ) | (16,545 | ) | (24,276 | ) | (49,216 | ) | (22,088 | ) | (13,879 | ) | (5,599 | ) | (6,470 | ) |
Deemed dividend related to redeemable common stock | | (33 | ) | (33 | ) | (33 | ) | — | | — | | — | | — | | — | |
| | | | | | | | | | | | | | | | | |
Net loss attributable to common shares | | $ | (16,758 | ) | $ | (16,578 | ) | $ | (24,309 | ) | $ | (49,216 | ) | $ | (22,088 | ) | $ | (13,879 | ) | $ | (5,599 | ) | $ | (6,470 | ) |
| | | | | | | | | | | | | | | | | |
Net loss per common share—basic and diluted | | | | | | | | | | | | | | | | | |
Loss from continuing operations | | $ | (0.82 | ) | $ | (0.77 | ) | $ | (1.15 | ) | $ | (2.12 | ) | $ | (0.78 | ) | $ | (0.57 | ) | $ | (0.23 | ) | $ | (0.27 | ) |
Loss from discontinued operations | | $ | (0.04 | ) | $ | (0.05 | ) | $ | (0.03 | ) | $ | (0.20 | ) | $ | (0.16 | ) | $ | (0.01 | ) | $ | — | | $ | — | |
Net loss per share—basic and diluted | | $ | (0.86 | ) | $ | (0.82 | ) | $ | (1.18 | ) | $ | (2.32 | ) | $ | (0.94 | ) | $ | (0.58 | ) | $ | (0.23 | ) | $ | (0.27 | ) |
Weighted average common shares outstanding—basic and diluted | | 19,385 | | 20,159 | | 20,600 | | 21,163 | | 23,594 | | 23,689 | | 23,726 | | 23,807 | |
(1)As discussed in Note 3 to the consolidated financial statements as of December 31, 2007 and 2006 and for the years ended December 31, 2007, 2006 and 2005, the quarterly data for years ended December 31, 2007 and 2006 and the related notes thereto contained in this Amendment to the Company’s Annual Report on Form 10-K for the year ended December 31, 2007, have been restated in order to correct errors related to the accounting for customer refunds and credits and the accounting for gift cards issued to customers. The effect of the error adjustments for September 30, 2006 decreased net loss by $227,000. For the quarters ended March 31, June 30, September 30 and December 31, 2007, the effect of the error adjustments on the Consolidated Results of Operations is to increase net loss by $705,000, $111,000, $895,000 and $1.3 million.
F-35
Table of Contents
Schedule II
Valuation and Qualifying Accounts
(dollars in thousands)
| | Balance at
Beginning of Year | | Charged to
Expense | | Deductions | | Balance at End
of Year | |
Year ended December 31, 2005 | | | | | | | | | |
Deferred tax valuation allowance (As reported) | | $ | 27,450 | | $ | 9,135 | | $ | — | | $ | 36,585 | |
Deferred tax valuation allowance (Restated) | | 27,450 | | 9,248 | | — | | 36,698 | |
Allowance for sales returns (As reported) | | 2,835 | | 62,178 | | 59,437 | | 5,576 | |
Allowance for sales returns (Restated) | | 3,221 | | 62,178 | | 59,437 | | 5,962 | |
Reserve for inventory obsolescence | | 1,323 | | 4,706 | | 788 | | 5,241 | |
Allowance for doubtful accounts | | 750 | | 2,202 | | 1,141 | | 1,811 | |
Year ended December 31, 2006 | | | | | | | | | |
Deferred tax valuation allowance (As reported) | | $ | 36,585 | | $ | 37,805 | | $ | — | | $ | 74,390 | |
Deferred tax valuation allowance (Restated) | | 36,698 | | 39,846 | | 113 | | 76,431 | |
Allowance for sales returns (As reported) | | 5,576 | | 61,401 | | 63,362 | | 3,615 | |
Allowance for sales returns (Restated) | | 5,962 | | 61,401 | | 62,806 | | 4,557 | |
Reserve for inventory obsolescence | | 5,241 | | 4,471 | | 3,127 | | 6,585 | |
Allowance for doubtful accounts | | 1,811 | | 2,395 | | 2,071 | | 2,135 | |
Year ended December 31, 2007 | | | | | | | | | |
Deferred tax valuation allowance (As reported) | | $ | 74,390 | | $ | 8,320 | | $ | — | | $ | 82,710 | |
Deferred tax valuation allowance (Restated) | | 76,431 | | $ | 11,526 | | $ | 2,041 | | $ | 85,916 | |
Allowance for sales returns (As reported) | | 3,615 | | 55,553 | | 54,140 | | 5,028 | |
Allowance for sales returns (Restated) | | 4,557 | | 55,553 | | 53,169 | | 6,941 | |
Reserve for inventory obsolescence | | 6,585 | | 283 | | 5,106 | | 1,762 | |
Allowance for doubtful accounts | | 2,135 | | 1,197 | | 855 | | 2,477 | |
1. RESTATEMENT OF FINANCIAL STATEMENT SCHEDULE
Overstock.com, Inc. (the “Company”) is restating its financial statement schedule as of December 31, 2007, 2006 and 2005 to correct errors related to the accounting for customer refunds and credits and the accounting for gift cards issued to customers.
F-36
| | | | | | | | | | | | | | |
| | Balance at
Beginning of Year | | Charged to
Expense | | Deductions | | Balance at
End of Year | |
|---|
Year ended December 31, 2006 | | | | | | | | | | | | | |
| | Deferred tax valuation allowance | | $ | 36,698 | | $ | 39,846 | | $ | 113 | | $ | 76,431 | |
| | Allowance for sales returns | | | 5,962 | | | 61,401 | | | 62,806 | | | 4,557 | |
| | Reserve for inventory obsolescence | | | 5,241 | | | 4,471 | | | 3,127 | | | 6,585 | |
| | Allowance for doubtful accounts | | | 1,811 | | | 2,395 | | | 2,071 | | | 2,135 | |
Year ended December 31, 2007 | | | | | | | | | | | | | |
| | Deferred tax valuation allowance | | $ | 76,431 | | $ | 11,526 | | $ | 2,041 | | $ | 85,916 | |
| | Allowance for sales returns | | | 4,557 | | | 55,553 | | | 53,169 | | | 6,941 | |
| | Reserve for inventory obsolescence | | | 6,585 | | | 283 | | | 5,106 | | | 1,762 | |
| | Allowance for doubtful accounts | | | 2,135 | | | 1,197 | | | 855 | | | 2,477 | |
Year ended December 31, 2008 | | | | | | | | | | | | | |
| | Deferred tax valuation allowance | | $ | 85,916 | | $ | 1,078 | | $ | — | | $ | 86,994 | |
| | Allowance for sales returns | | | 6,941 | | | 2,278 | | | 4,121 | | | 5,098 | |
| | Reserve for inventory obsolescence | | | 1,762 | | | 2,370 | | | 1,994 | | | 2,138 | |
| | Allowance for doubtful accounts | | | 2,477 | | | 550 | | | 1,433 | | | 1,594 | |