Any such forward-looking statements are not guarantees of future performance and actual results, developments and business decisions may differ materially from those envisaged by such forward-looking statements. These forward-looking statements speak only as of the date the Originalthis Form 10-K wasis filed with the SEC. We do not assume any obligation and do not intend to update any forward-looking statement except as required by law. See Item IA. Risk Factors1A. “Risk Factors” in Part I of this Form 10-K/A10-K for a further discussion regarding some of the reasonsfactors that may cause actual results may beto differ materially different from those that we anticipate.
PART I
Item 1.Business
General
Colfax Corporation is a diversified global supplier of a broad range of fluid handlingindustrial manufacturing and engineering company that provides gas- and fluid-handling and fabrication technology products including pumps, fluid handling systems and controls,services to commercial and specialty valves. We believe that we are a leading manufacturer of rotary positive displacement pumps, which include screw pumps, gear pumps and progressive cavity pumps. We design and engineer our products to high quality and reliability standards for use in critical fluid handling applications where performance is paramount. We also offer customized fluid handling solutions to meet individual customer needs based on our in-depth technical knowledge ofgovernmental customers around the applications in which our products are used.
Colfax began with a series of acquisitions in the fluid-handling and mechanical power transmission sectors, most notably those of IMO and Allweiler in 1997 and 1998, respectively. In 2004 we divested our mechanical power transmission operations and focused on fluid handling. Over the subsequent seven years, we made six strategic acquisitions in this sector: Lubrication Systems Company (“LSC”), Fairmount Automation, Inc. (“Fairmount”), PD-Technik Ingenieurbüro GmbH (“PD-Technik”), Baric Group (“Baric”), Rosscor Holding, B.V. (“Rosscor”) and COT-Puritech, Inc. (“COT-Puritech”).
On January 13, 2012, we closed the acquisition of Charter by Colfax (the “Charter Acquisition”), which transformed Colfax from a fluid-handling business into a multi-platform enterprise with a strong global footprint. We expect that this acquisition will:
enable Colfax to benefit from strong secular growth drivers, with a balance of short- and long-cycle businesses; and
Following the Charter Acquisition, we announced three additional acquisitions that we expect will grow and strengthen our business:
We employ a comprehensive set of tools that we refer to as the Colfax Business System, or CBS. CBS, is a disciplined strategic planning and execution methodology designed to achieve excellence and world-class financial performance in all aspects of our business by focusing on the Voice of the Customer and continuously improving quality, delivery and cost. Modeledmodeled on the Danaher Business System, is our business management system. It is a repeatable, teachable process that we use to create superior value for our customers, shareholders and associates. Rooted in our core values, it is our culture. CBS focusesprovides the tools and techniques to ensure that we are continuously improving our ability to meet or exceed customer requirements on conducting root-cause analysis, developing process improvementsa consistent basis.
Each year, Colfax associates in every business are asked to develop aggressive strategic plans which are based on theVoice of the Customer. In these plans, we are very clear about our market realities, our threats, our risks, our opportunities and implementingmost importantly, our vision forward. Execution and measurement of our plans is important to the process. Our belief is that when we use the tools of CBS to drive the implementation of these plans, we are able to uniquely provide the customer with the world class quality, delivery, cost and growth they require. And that performance, we believe, is what ultimately helps our customers and Colfax grow and succeed on a sustainable systems. Our approach addressesbasis.
Reportable Segments
Upon the entire business, not just manufacturing operations.
Gas and Fluid Handling
Our gas- and fluid-handling segment is a global supplier of a broad range of products, including pumps, fluid-handling systems and controls, specialty valves, heavy-duty centrifugal and axial fans, rotary heat exchangers and gas compressors, which serves customers in the power generation, oil, gas and petrochemical, mining, marine (including defense) and general industrial and other end markets.
Our gas-handling products are principally marketed under the Howden brand name, and are globalmanufactured and engineered in scope.facilities located in Asia, Europe, North and South America, Australia and Africa. Our strategic markets include:
Our gas- and fluid-handling products and systems for our customers in Chinaservices are generally sold directly, though independent representatives and other Asian markets and to supply low cost components and parts for our existing operations.
Fans
Howden fans primarily consist of heavy-duty axial, centrifugal and industrial cooling fans. Axial fans include non-variable pitch, variable pitch, OEM and mixed flow axial fans. Centrifugal fans consist of custom engineered, pre-engineered and OEM centrifugal fans. Ranging in diameter from 200mm to over 5m, and with a competitorvariety of impeller designs, control systems and layout options, our fans form a comprehensive series of axial and centrifugal fans to satisfy virtually all industrial applications. Howden industrial cooling fans are designed for cooling towers, heat exchangers and steam condensers. They range in the estimated $19 billion centrifugal pump market and the estimated $68 billion valve market.
Compressors
Howden process compressors and lubrication applications, strong product brand names and a reputation for reliabilitycomplete compressor packages are used in the power generation industry. Within thispetroleum, petrochemical, refrigeration and other markets where performance and reliability are crucial. Our product line includes screw, piston (reciprocating) and diaphragm process gas compressors as well as highly efficient turbo blowers and compressors capable of the most demanding end market we intendconditions. Howden designed and supplied the first diaphragm compressor and was the first company to continue our growth ascommercialize screw compressor technology.
Rotary Heat Exchangers
Rotary regenerative heat exchangers provide a provider of turnkey systems by utilizing our expertisecompact, cost effective and reliable solution for heat recovery in power generationplant and flue gas desulphurization systems. With over 80 years experience, Howden supplies highly efficient and reliable air preheaters for power boiler applications, to develop innovative solutions. We also plan to continue to leverage our global presence to strengthen our relationships with large original equipment manufacturers of power generation equipment to establish us as a critical supplier.
Pumps
Rotary Positive Displacement Pumps
Specialty Centrifugal Pumps—
Fluid-Handling Systems
We manufacture complete fluid handlingfluid-handling systems used primarily in the oil and gas, power generation, commercial marine and global navydefense markets. We offer turnkey systems and support, including design, manufacture, installation, commission and service. Our systems include:
| Ÿ |
| Ÿ | custom designed packages used in crude oil pipeline applications; |
| Ÿ | lubrication and fuel forwarding systems used in power generation turbines; |
| Ÿ | complete packages for commercial marine engine rooms; and |
| Ÿ | fire suppression systems for navy applications. |
Specialty Valves
Our specialty valves are used primarily in naval applications. Our valve business has specialized machining, welding and fabrication capabilities that enable itus to serve as a supplier to the U.S. Navy. In addition to designing and manufacturing valves, we also offer repair and retrofit services for products manufactured by other valve suppliers through our aftermarket support centers located in Portland, MaineVirginia Beach, Virginia and San Diego,Chula Vista, California.
Total Lubrication Management
Our total lubrication management offering provides lubrication system equipment and services to customers in end markets where lubrication system performance is critical, including: petroleum, petrochemical, natural gas and power generation. Our products include LubriMist® oil mist generators, Mistlock™ bearing lubrication cartridges and ThermoJet® oil purifiers. Our services include high velocity oil flushing, leakage oil reclamation and condition monitoring.
Fabrication Technology
We formulate, develop, manufacture and assemblesupply consumable products and equipment for use in the cutting and joining of steels, aluminum and other metals and metal alloys. For the year ended December 31, 2012, welding consumables represented approximately 39% of our total Net sales. Our fabrication technology products at 14are principally marketed under the ESAB brand name, which we believe is a leading international welding company with roots dating back to the invention of the welding electrode. ESAB’s comprehensive range of welding consumables includes electrodes, cored and solid wires and fluxes. ESAB’s fabrication technology equipment ranges from portable units to large custom systems. Products are sold into a wide range of end markets, including wind power, shipbuilding, pipelines, mobile/off-highway equipment and mining.
Many of ESAB’s manufacturing facilities are located in low cost locations, in particular Central and Eastern Europe, NorthSouth America and Asia. This global manufacturing reach enables usOur fabrication technology products are sold both through independent distributors and direct salespeople, depending on geography and end market.
The following discussions ofIndustry and Competition,International Operations,Research and Development,Intellectual Property,Raw Materials andBacklog,Seasonality,Working Capital,Associates,Government Contracts andCompany Information and Access to serve our customers wherever they chooseSEC Reports include information that is common to do business. Eachboth of our manufacturing sites offers machining, fabricationreportable segments, unless indicated otherwise.
Industry and assembly capabilities that gives us the flexibility to source some of our products from multiple facilities. We believe that this flexibility enables us to minimize the impact of a manufacturing disruption if one of our facilities was to be damaged as a result of a natural disaster or otherwise. Our manufacturing facilities also benefit from the use of shared technology and collaboration across production lines, enabling us to increase operational efficiencies through the use of common suppliers and the duplication of production processes.
Our products and services are marketed on a worldwide basis. We believe that the principal elements of competition in our markets are:
Our customer base is broadly diversified across many different competitorssectors of the economy, and we believe customers place a premium on quality, reliability, availability, design and application engineering support. We believe the principal elements of competition in our served markets are the technical ability to meet customer specifications, product quality and reliability, brand names, price, application expertise and engineering capabilities and timely delivery and strong aftermarket support. Our management believes that we are a leading competitor in each of our markets.
Additionally, we utilize CBS to continuously improve our business, which we believe, in addition to our management team’s experience in the application of the CBS methodology, is one of our primary competitive strengths. CBS is our business system designed to encourage a culture of continuous improvement in all aspects of our operations and strategic markets.planning.
International Operations
Our products and services are available worldwide. We believe this geographic diversity allows us to draw on the skills of a worldwide workforce, provides stability to our operations, allows us to drive economies of scale, provides revenue streams that may offset economic trends in individual economies and offers us an opportunity to access new markets for products. Our principal markets outside the United States are in Europe, Asia, the Middle East and South America. In addition, we believe that future growth is dependent in part on our ability to develop products and sales models that target developing countries. We believe that the commercial marine market, we compete primarilyCharter Acquisition has increased our presence in developing countries and expect that our revenues in future years will be almost equally balanced between developed countries and emerging markets.
Our international operations subject us to certain risks. See Item 1A. “Risk Factors—Risks Related to Our Business—The majority of our sales are derived from international operations. We are subject to specific risks associated with Naniwa Pump Manufacturing Co., Ltd., Shinko Industries, Ltd., Shin Shin Machinery Group Co., Ltd. and Taiko Kikai Industries Co., Ltd. In the oil and gas market, we compete primarily with Joh. Heinr. Bornemann GmbH and Leistritz Pumpen GmbH. In the power generation market, we compete primarily with Buffalo Pumps, a subsidiary of Ampco-Pittsburgh Corporation. In the global navy market, we compete primarily with Buffalo Pumps, Carver Pump Company, Curtiss-Wright Corporation and Tyco International, Inc.
Research and Development
Our research and development activities vary by operating segment. We closely integrate research and development with marketing, manufacturing and product engineering in meeting the needs of our customers. Our research and development efforts focus on innovation and developing new product applications, lowering the cost of manufacturing our existing products and redesigning existing product lines to increase efficiency and enhance performance. Our business product engineering teams are continuously enhancing our existing products and developing new product applications for our growing base of customers that require custom solutions. We believe these capabilities provide a significant competitive advantage in the development of high quality fluid handling systems. Our product engineering teams focus on:
Research and development expense was $19.4 million, $5.7 million and $6.2 million in 2012, 2011 and 2010, respectively. We expect to continue making significant expenditures for research and development for the years ended December 31, 2009, 2008in order to maintain and 2007 were $5.9 million, $5.9 million and $4.2 million, respectively.
Intellectual Property
We rely on a combination of intellectual property rights, including patents, trademarks, copyrights, trade secrets and contractual provisions to protect our intellectual property. Although we highlight recent additions to our patent portfolio as part of our marketing efforts, we do not consider any one patent or trademark or any group thereof essential to our business as a whole or to any of our business operations. We also rely on proprietary product knowledge and manufacturing processes in our operations.
Raw Materials and Backlog
We obtain raw materials, component parts and supplies from a variety of sources, generally each from more than one supplier. Our principal raw materials are metals, castings, motors, seals and bearings. Our suppliers and sources of raw materials are based in both the United States and other countries, and weglobally based. We believe that our sources of raw materials are adequate for our needs for the foreseeable future. We believe thatfuture and the loss of any one supplier would not have a material adverse effect on our business or results of operations.
Manufacturing turnaround time for our gas- and fluid-handling operating segment is generally sufficiently short to allow us to manufacture to order for most of our products, which helps to limit inventory levels. Backlog generally is a function of requested customer delivery dates and may range from days to several years based on the actual requested delivery dates.years. Backlog of gas- and fluid-handling orders as of December 31, 20092012 was $290.9 million,$1.4 billion, compared with $349.0 million$1.3 billion of proforma order backlog as of December 31, 2008. We expect to ship approximately 70% of2011.
Seasonality
As our December 31, 2009 backlog during 2010; however, orders are subject to postponement or cancellation.
Working Capital
We maintain an adequate level of working capital to support our business needs. There are no unusual industry practices or requirements related to working capital items.
Associates
The following table presents our worldwide associate base as of the periodsdates indicated:
| December 31, | ||||||||||||
| 2009 | 2008 | 2007 | ||||||||||
| United States | 598 | 739 | 701 | |||||||||
| Europe | 1,189 | 1,276 | 1,219 | |||||||||
| Asia | 254 | 299 | 262 | |||||||||
| Total | 2,041 | 2,314 | 2,182 | |||||||||
| December 31, | ||||||||||||
| 2012 | 2011 | 2010 | ||||||||||
| North America | 2,805 | 728 | 638 | |||||||||
| Europe | 6,107 | 1,232 | 1,260 | |||||||||
| Asia and Middle East | 4,397 | 251 | 262 | |||||||||
| Central and South America | 2,424 | — | — | |||||||||
| Other | 553 | — | — | |||||||||
| Total associates | 16,286 | 2,211 | 2,160 | |||||||||
Approximately 2% of associates are 42 associates in the United States covered by a collective bargaining agreementagreements with the International Union of Electronic, Electrical, Salaried, Machine and Furniture Workers-Communications Workers of America (IUE-CWA). The contract with the union expires December 4, 2011 and provides for wage increases ranging from 3.5% to a maximum of 3.8% per year.U.S. trade unions. In addition, approximately 48%45% of our associates are represented by foreign trade unions by law,and work councils in Germany, SwedenEurope, Asia, Central and the Netherlands,South America, Canada, Africa and Australia, which subjects us to arrangements very similar to collective bargaining agreements. We have not experienced any work stoppages or strikes that have had a material adverse impact on operations. We consider our relations with our associates to be good.
Government Contracts
Sales to U.S. government defense agencies and government contractors constituted approximately 4%1% of our revenue in 2009.2012. We are subject to business and cost accounting regulations associated with our U.S. government defense contracts. Violations can result in civil, criminal or administrative proceedings involving fines, compensatory and treble damages, restitution, forfeitures, and suspension or debarment from U.S. government defense contracts.
Company Information and Access to SEC Reports
We were organized as a Delaware corporation in 1998. Our principal executive offices are located at 8730 Stony Point Parkway,8170 Maple Lawn Boulevard, Suite 150, Richmond, Virginia 23235,180, Fulton, MD 20759, and our main telephone number at that address is (804) 560-4070.(301) 323-9000. Our corporate website address is www.colfaxcorp.com.
We make available, free of charge through our website, our annual report on Form 10-K,and quarterly reports on Form 10-K and Form 10-Q (including related filings in XBRL format), current reports on Form 8-K and any amendments to those reports as soon as practicable after filing or furnishing the material to the SEC. You may also request a copy of these filings, at no cost, by writing or telephoning us at: Investor Relations, Colfax Corporation, 8730 Stony Point Parkway,8170 Maple Lawn Boulevard, Suite 150, Richmond, VA 23235,180, Fulton, MD 20759, telephone (804) 560-4070.(301) 323-9000. Information contained on our website is not incorporated by reference in this report.
Item 1A.Risk Factors
An investment in our commonCommon stock involves a high degree of risk. You should carefully consider the risks and uncertainties described below, together with the information included elsewhere in this Annual Report on Form 10-K/A10-K and other documents we file with the SEC. If any of the following risks actually occur, our business, financial condition or operating results could suffer. As a result, the trading price of our common stock could decline and you could lose all or part of your investment in our common stock. The risks and uncertainties described below are those that we have identified as material, but aremay not be the only risks to which Colfax might be exposed. Additional risks and uncertainties, facingwhich are currently unknown to us or that we do not currently consider to be material, may materially affect the business of Colfax and we caution that this listcould have material adverse effects on our business, financial condition and results of risk factors may notoperations. If any of the following risks were to occur, our business, financial condition and results of operations could be exhaustive.materially adversely affected, the value of our Common stock could decline and investors could lose all or part of the value of their investment in Colfax shares. Our business is also subject to general risks and uncertainties that affect many other companies, such as overall U.S. and non-U.S. economic and industry conditions, a global economic slowdown, geopolitical events, changes in laws or accounting rules, fluctuations in interest rates, terrorism, international conflicts, natural disasters or other disruptions of expected economic or business conditions. We operate in a continually changing business environment, and new risk factors emerge from time to time which we cannot predict. Additional risks and uncertainties not currently known to us or that we currently believe are immaterial also may impair our business, including our results of operations, liquidity and financial condition.
Risks Related to Our Business
Changes in the general economy including the current global economic downturn, and the cyclical nature of the markets that we serve could negatively impact the demand for our markets couldproducts and services and harm our operations and financial performance.
Colfax's financial performance depends, in large part, on conditions in the markets we serve and on the general condition of the global economy.economy, which impact these markets. Any sustained weakness in demand for our products and services resulting from a downturn of or uncertainty in the global economy could continue to reduce our sales and profitability, and result in restructuring efforts. Restructuring efforts are inherently risky and we may not be able to predict the cost and timing of such actions accurately or properly estimate the impact on demand, if any. We also may not be able to realize the anticipated savings we expected from restructuring activities. The current global economic downturn may continue to materially affect demand for our products and we may not be able to predict the effect on our results. profitability.
In addition, our products are sold in many industries, some of which are cyclical and may experience periodic downturns. Cyclical weakness in the industries we serve could lead to reduced demand for our products and affect our profitability and financial performance.
Further, our products are sold in many industries, some of which are cyclical and lackmay experience periodic downturns. Cyclical weakness in the industries that we serve could lead to reduced demand for our products and affect our profitability and financial performance.
The occurrence of liquidity by financial institutions could impact our ability to fully access our existing credit facility.
Acquisitions have formed a significant part of our growth strategy in the past and are expected to continue to do so. If we are unable to identify suitable acquisition candidates or successfully integrate the businesses we acquire or realize the intended benefits, our growth strategy may not succeed. Acquisitions involve numerous risks, including risks related to integration and undisclosed or underestimated liabilities.
Historically, our business strategy has relied on acquisitions. We expect to derive a significant portion of our growth by acquiring businesses and integrating those businesses into our existing operations. We intend to seek acquisition opportunities both to expand into new markets and to enhance our position in our existing markets. However, our ability to do so will depend on a number of steps, including our ability to:
If we fail to achieve any of these steps, our growth strategy may not be successful.
Acquisitions involve numerous risks, including risks related to integration, and we may not realize the anticipated benefits of our acquisitions.
Acquisitions, including the Charter Acquisition, involve numerous risks, including difficulties in the assimilation of the operations, systems, controls, technologies, personnel, services and products of the acquired company, the potential loss of key employees, customers and distributors of the acquired company and the diversion of our management’smanagement's attention from other business concerns. This is the case particularly in the fiscal quarters immediately following the completion of an acquisition because the operations of the acquired business are integrated into the acquiring businesses’businesses' operations during this period. We cannot be sure that we willmay not accurately anticipate all of the changing demands that any future acquisition may impose on our management, our operational and management information systems and our financial systems.
In addition, the anticipated benefits of an acquisition may not be realized fully or at all, or may take longer to realize than we expect. Actual operating, technological, strategic and sales synergies, if achieved at all, may be less significant than we expect or may take longer to achieve than anticipated. If we are not able to realize the anticipated benefits and synergies expected from our acquisitions within a reasonable time, our business, financial condition and results of operations may not achieve levelsbe adversely affected.
Acquisitions may result in significant integration costs, and unanticipated integration expense may harm our business, financial condition and results of revenue, profitability or productivity comparableoperations.
Integration efforts associated with those that our existing operations achieve, oracquisitions may otherwise not perform asrequire significant capital and operating expense. Such expenses may include transaction, consulting and third-party service fees. For example, during the year ended December 31, 2012, we expected.
Our acquisitions may expose us to significant unanticipated liabilities and could adversely affect our business, financial condition and results of operations.
We may underestimate or fail to discover liabilities relating to a future acquisitionacquisitions during theour due diligence investigationinvestigations, and we, as the successor owner of an acquired company, might be responsible for those liabilities. For example, two of our acquired subsidiaries are each one of many defendants in a large number of lawsuits that claimSuch liabilities could include employment, retirement or severance-related obligations under applicable law or other benefits arrangements, legal claims, tax liabilities, warranty or similar liabilities to customers, product liabilities and personal injury as a result of exposure to asbestos from products manufactured with components that are alleged to have contained asbestos. Although our due diligence investigations in connection with these acquisitions uncovered the existence of potential asbestos-related liabilities, the scope of such liabilities were greater than we had originally estimated. Although we seek to minimize the impact of underestimated or potential undiscovered liabilities by structuring acquisitions to minimizeclaims, environmental liabilities and obtaining indemnitiesclaims by or amounts owed to vendors. The indemnification and warranties from the selling party, these methodswarranty provisions in our acquisition agreements may not fully protect us from the impact of undiscovered liabilities. Indemnities or warranties are often limited in scope, amount or duration, and may not fully cover the liabilities for which they were intended. The liabilities that are not covered by the limited indemnities or warranties could have a material adverse effect on our business, financial condition and financial condition.
We may require additional capital to finance our operating needs and to finance our growth. If the terms on which the additional capital is available are unsatisfactory, if the additional capital is not available at all or we are not able to fully access our existing credit facility,under the Deutsche Bank Credit Agreement, we may not be able to pursue our growth strategy.
Our growth strategy will require additional capital investment to complete acquisitions, integrate the completed acquisitions into our existing operations and to expand into new markets.
We intend to pay for future acquisitions using a combination of cash, capital stock, notes, and assumption of indebtedness.indebtedness or any combination of the foregoing. To the extent that we do not generate sufficient cash internally to provide the capital we require to fund our growth strategy and future operations, we will require additional debt or equity financing. We cannot be sure that thisThis additional financing willmay not be available or, if available, willmay not be on terms acceptable to us. Further, high volatility in the equity markets and in our stock price may make it difficult for us to access the equity markets for additional capital at attractive prices, if at all. If we are unable to obtain sufficient additional capital in the future, it willmay limit our ability to implement fully our business strategy. Continued issues resulting from the current global economic downturn involving liquidity and capital adequacy affecting lenders could affect our ability to fully access our existing credit facilities. In addition, evenEven if future debt financing is available, it may result in (1)(i) increased interest expense, (2)(ii) increased term loan payments, (3)(iii) increased leverage and (4)(iv) decreased income available to fund further acquisitions and expansion. It may also limit our ability to withstand competitive pressures and make us more vulnerable to economic downturns. If future equity financing is available, itissuances of our equity securities may dilute the equity interests of our existing stockholders.
In addition, our credit facility agreement includes restrictive covenants which could limit our financial flexibility. IfSee “—The Deutsche Bank Credit Agreement contains restrictions that may limit our flexibility in operating our business.”below.
Our restructuring activities may subject us to additional uncertainty in our operating results.
We have implemented, and plan to continue to implement, restructuring programs designed to facilitate key strategic initiatives and maintain long-term sustainable growth. As such, we do not maintain compliance with these covenants, our creditors could declare a default. Our abilityhave incurred and expect to comply with the provisions of our indebtedness may be affected by changes in economic or business conditions beyond our control.
Available insurance coverage, the number of future asbestos-related claims and the average settlement value of current and future asbestos-related claims of two of ourcertain subsidiaries could be different than we have estimated, which could materially and adversely affect our business, financial condition and results of operations and cash flow.
Certain subsidiaries are each one of many defendants in a large number of lawsuits that claim personal injury as a result of exposure to asbestos from products manufactured with components that are alleged to have contained asbestos. Such components were acquired from third-party suppliers and were not manufactured by any of our subsidiaries nor were the subsidiaries producers or direct suppliers of asbestos. For the purposes of our financial statements, we have estimated the future claims exposure and the amount of insurance available based upon certain assumptions with respect to future claims and liability costs. We estimate the liability costs to be incurred in resolving pending and forecasted claims for the next 15-year period.
Our decision to use a 15-year period is based on our belief that this is the extent of our ability to forecast liability costs. We also estimate the amount of insurance proceeds available for such claims based on the current financial strength of the various insurers, our estimate of the likelihood of payment and applicable current law. We reevaluate these estimates regularly. Although we believe our current estimates are reasonable, a change in the time period used for forecasting our liability costs, the actual number of future claims brought against us, the cost of resolving these claims, the likelihood of payment by, and the solvency of, insurers and the amount of remaining insurance available could be substantially different than our estimates, and future revaluation of our liabilities and insurance recoverables could result in material adjustments to these estimates, any of which could materially and adversely affect our business, financial condition and results of operations and cash flow.operations. In addition, the company incurswe incur defense costs related to those claims, a portion of which has historically been reimbursed by our insurers. We also incur litigation costs in connection with actions against certain of the subsidiaries’subsidiaries' insurers relating to insurance coverage. While these costs may be significant, we may not be able to predict the amount or duration of such costs. Additionally, we may experience delays in receiving reimbursement from insurers, during which time we may be required to pay cash for settlement or legal defense costs. Any increase in the actual number of future claims brought against us, the defense costs of resolving these claims, the cost of pursuing claims against our insurers, the likelihood and timing of payment by, and the solvency of, insurers and the amount of remaining insurance available, could materially and adversely affect our business, financial condition and results of operations.
A material disruption at any of our manufacturing facilities could adversely affect our ability to generate sales and meet customer demand.
If operations at our manufacturing facilities were to be disrupted as a result of significant equipment failures, natural disasters, power outages, fires, explosions, terrorism, cyber-based attacks, adverse weather conditions, labor disputes or other reasons, our financial performance could be adversely affected as a result of our inability to meet customer demand for our products. Interruptions in production could increase our costs and cash flow.
Our international operations are subject to the laws and regulations of the United StatesU.S. and many foreign countries. Failure to comply with these laws may affect our ability to conduct business in certain countries and may affect our financial performance.
We are subject to a variety of laws regarding our international operations, including the U.S. Foreign Corrupt Practices Act and the U.K Bribery Act of 2010, and regulations issued by U.S. Customs and Border Protection, the U.S. Bureau of Industry and Security, and the regulationsU.S. Treasury Department’s Office of Foreign Assets Control (“OFAC”) and various foreign governmental agencies. We cannot predict the nature, scope or effect of future regulatory requirements to which our international sales and manufacturing operations might be subject or the manner in which existing laws might be administered or interpreted. Future regulations could limit the countries in which some of our products may be manufactured or sold, or could restrict our access to, and increase the cost of obtaining, products from foreign sources. In addition, actual or alleged violations of these laws could result in enforcement actions and financial penalties that could result in substantial costs. The occurrence of any of the foregoing could have a material adverse effect on our business, financial condition and results of operations.
Failure to comply with the U.S. Foreign Corrupt Practices Act, the U.K. Bribery Act or other applicable anti-bribery laws could have an adverse effect on our business.
The U.S. Foreign Corrupt Practices Act, the U.K. Bribery Act and similar anti-bribery laws in other jurisdictions generally prohibit companies and their intermediaries from making improper payments for the purpose of obtaining or retaining business. Recent years have seen a substantial increase in anti-bribery law enforcement activity with more frequent and aggressive investigations and enforcement proceedings by both the Department of Justice and the U.S. Securities and Exchange Commission, increased enforcement activity by non-U.S. regulators and increases in criminal and civil proceedings brought against companies and individuals. Our policies mandate compliance with all anti-bribery laws. However, we operate in certain countries that are recognized as having governmental and commercial corruption. Our internal control policies and procedures may not always protect us from reckless or criminal acts committed by our employees or third-party intermediaries. Violations of these anti-bribery laws may result in criminal or civil sanctions, which could have a material adverse effect on our business, financial condition and results of operations.
| 12 |
We have done and may continue to do business in countries subject to U.S. sanctions and embargoes, including Iran and Syria, and we may have limited managerial oversight over those activities. Failure to comply with these sanctions and embargoes may result in enforcement or other regulatory actions.
Certain of our independent foreign subsidiaries have conducted and may continue to conduct business in countries subject to U.S. sanctions and embargoes, and we have limited managerial oversight over those activities. Failure to comply properly with these sanctions and embargoes may result in enforcement or other regulatory actions. Specifically, from time to time, certain of our independent foreign subsidiaries sell products to companies and entities located in, or controlled by the governments of, certain countries that are or have previously been subject to sanctions and embargoes imposed by the U.S. government and/or the United Nations, such asNations. In March 2010, our Board of Directors affirmatively prohibited any new sales to Iran by us and Syria.all of our foreign subsidiaries. With the exception of the U.S. sanctions against Cuba and Iran, the applicable sanctions and embargoes generally do not prohibit our foreign subsidiaries from selling non-U.S.-origin products and services in those countries.to countries that are or have previously been subject to sanctions and embargoes. However, Colfax Corporation, itsour U.S. personnel, and itseach of our domestic subsidiaries, as well as our employees of our foreign subsidiaries who are U.S. citizens, are prohibited from participating in, approving or otherwise facilitating any aspect of the business activities in those countries.countries, including Syria. These constraints may negatively affect the financial or operating performance of such business activities. We cannot be certain that our attempts
Our efforts to comply with U.S. sanction laws and embargoes willmay not be effective, and as a consequence we may face enforcement or other actions if our compliance efforts are not wholly effective. Actual or alleged violations of these laws could result in substantial fines or other sanctions which could result in substantial costs. In addition, Syria, Iran and Syriacertain other sanctioned countries currently are identified by the U.S. State Department as state sponsors of terrorism, and may berecently have been subject to increasingly restrictive sanctions. Because certain of our independent foreign subsidiaries have contact with and transact limited business in suchcertain U.S. sanctioned countries, including sales to enterprises controlled by agencies of the governments of such countries, our reputation may suffer due to our association with these countries, which may have a material adverse effect on the price of our common stock. Further,shares. In addition, certain U.S. states and municipalities have recently enacted legislation regarding investments by pension funds and other retirement systems in companies that have business activities or contacts with countries that have been identified as state sponsors of terrorism and similar legislation may be pending in other states. As a result, pension funds and other retirement systems may be subject to reporting requirements with respect to investments in companies such as oursColfax or may be subject to limits or prohibitions with respect to those investments that may have a material adverse effect on the price of our shares.
One of our foreign subsidiaries made a small number of sales from 2003 through 2007 totaling approximately $60,000 in the aggregate to two customers in Cuba which may have been made in violation of regulations of the U.S. Treasury Department’s Office of Foreign Assets Control, or OFAC. Cuba is also identified by the U.S. State Department as a state sponsor of terrorism. We have submitted a disclosure report to OFAC regarding these transactions. On December 5, 2008, the Company executed a tolling agreement with the OFAC extending the statute of limitations for the investigation until May 1, 2010. As a result of these sales, we may be subject to fines or other sanctions.
If we fail to comply with export control regulations, we could be subject to substantial fines or other sanctions.
Some of our products manufactured or assembled in the United States are subject to the U.S. Export Administration Regulations, administered by the U.S. Department of Commerce, Bureau of Industry and Security, which require that we obtain an export license is obtained before we can export such products can be exported to specifiedcertain countries. Additionally, some of our products are subject to the International Traffic in Arms Regulations, which restrict the export of certain military or intelligence-related items, technologies and services to non-U.S. persons. Failure to comply with these laws could harm our business by subjecting us to sanctions by the U.S. government, including substantial monetary penalties, denial of export privileges and debarment from U.S. government contracts.
The majority of our sales are derived from international operations. We are subject to specific risks associated with international operations.
In the year ended December 31, 2012, we derived approximately 80% of our sales from operations outside of the U.S. and we have principal manufacturing facilities in 20 non-U.S. countries. Sales from international operations, export sales and the use of manufacturing facilities outside of the U.S. by us are subject to risks inherent in doing business outside the U.S. These risks include:
If any of these risks were to materialize, they may have a material adverse effect on our business, financial condition and results of operations.
If our employees are represented by foreign trade unions. Ifunions or works councils engage in a strike, work stoppage or other slowdown or if the representation committees responsible for negotiating with thesesuch trade unions on our behalfor works councils are unsuccessful in negotiating new and acceptable agreements when the existing agreements with our employees covered by the unionscollective bargaining expire,
As of December 31, 2009,2012, approximately 47% of our employees were represented by a number of different trade unions and works councils. Further, as of that date, we had 1,365approximately 13,500 employees, representing 83% of our worldwide employee base, in foreign locations. In certainCanada, Australia and various countries laborin Europe, Asia, and employment laws are more restrictive than in the U.S.Central and in many cases, grant significant job protection to employees, including rights on termination of employment. In Germany, Sweden and the Netherlands,South America, by law, somecertain of our employees are represented by a number of different trade unions in these jurisdictions,and works councils, which subjectssubject us to employment arrangements very similar to collective bargaining agreements. Further, the laws of certain foreign countries may place restrictions on our ability to take certain employee-related actions or require that we conduct additional negotiations with trade unions, works councils or other governmental authorities before we can take such actions.
If our employees represented by foreign trade unions or works councils were to engage in a strike, work stoppage or other slowdown in the future, we could experience a significant disruption of our operations. Such disruption could interfere with our business operations and could lead to decreased productivity, increased labor costs and lost revenue.
Our manufacturing business is subject to the possibility of product liability lawsuits, which could harm our business.
As the manufacturer of equipment for use in industrial markets, we face an inherent risk of exposure to other product liability claims. Although we maintain quality controls and procedures, we cannot be sure that ourOur products willmay not be free from defects. In addition, some of our products contain components manufactured by third parties, which may also have defects. We maintain insurance coverage for product liability claims. OurThe insurance policies have limits, however, that may not be sufficient to cover claims made against us.made. In addition, this insurance may not continue to be available to us at a reasonable cost. With respect to components manufactured by third-party suppliers, the contractual indemnification that we seek from our third-party suppliers may be limited and thus insufficient to cover claims made against us. If our insurance coverage or contractual indemnification is insufficient to satisfy product liability claims made against us the claims could have an adverse effect on our business and financial condition. Even claims without merit could harm our reputation, reduce demand for our products, cause us to incur substantial legal costs and distract the attention of our management. The occurrence of any of the foregoing could have a material and adverse effect on our business, financial condition and results of operations.
| 14 |
As a manufacturer,manufacturers, we are subject to a variety of environmental and health and safety laws for which compliance, or liabilities that arise as a result of noncompliance, could be costly. In addition, if we fail to comply with such laws, we could incur liability that could result in penalties and costs to correct any non-compliance.
Our business isbusinesses are subject to international, federal, state and local environmental and safety laws and regulations, including laws and regulations governing emissions of: regulated air pollutants; discharges of wastewater and storm water; storage and handling of raw materials; generation, storage, transportation and disposal of regulated wastes; and worker safety. These requirements impose on our businessbusinesses certain responsibilities, including the obligation to obtain and maintain various environmental permits. If we were to fail to comply with these requirements or fail to obtain or maintain a required permit, we could be subject to penalties and be required to undertake corrective action measures to achieve compliance. In addition, if our noncompliance with such regulations were to result in a release of hazardous materials to the environment, such as soil or groundwater, we could be required to remediate such contamination, which could be costly. Moreover, noncompliance could subject us to private claims for property damage or personal injury based on exposure to hazardous materials or unsafe working conditions. ChangesIn addition, changes in applicable requirements or stricter interpretation of existing requirements may result in costly compliance requirements or otherwise subject us to future liabilities.
As the present or former owner or operator of real property, or generator of waste, we could become subject to liability for environmental contamination, regardless of whether we caused such contamination.
Under various federal, state and local laws, regulations and ordinances, and, in some instances, international laws, relating to the protection of the environment, a current or former owner or operator of real property may be liable for the cost to remove or remediate contamination on, under, or released from such property and for any damage to natural resources resulting from such contamination. Similarly, a generator of waste can be held responsible for contamination resulting from the treatment or disposal of such waste at any off-site location (such as a landfill), regardless of whether the generator arranged for the treatment or disposal of the waste in compliance with applicable laws. Costs associated with liability for removal or remediation of contamination or damage to natural resources could be substantial and liability under these laws may attach without regard to whether the responsible party knew of, or was responsible for, the presence of the contaminants. In addition, the liability may be joint and several. Moreover, the presence of contamination or the failure to remediate contamination at our properties, or properties for which we are deemed responsible, may expose us to liability for property damage or personal injury, or materially adversely affect our ability to sell our real property interests or to borrow using the real property as collateral. We cannot be sure that we will notcould be subject to environmental liabilities in the future as a result of historic or current operations that have resulted or will result in contamination.
Failure to maintain and protect our trademarks, trade names and technologyintellectual property rights or challenges to these rights by third parties may affect our operations and financial performance.
The market for many of our products is, in part, dependent upon patent, trademark, copyright and trade secret laws, agreements with employees, customers and other third parties to establish and maintain our intellectual property rights, and the goodwill engendered by our trademarks and trade names. TrademarkThe protection of these intellectual property rights is therefore material to a portion of our business.businesses. The failure to protect our trademarks and trade namesthese rights may have a material adverse effect on our business, financial condition and operating results.results of operations. Litigation may be required to enforce our intellectual property rights, protect our trade secrets or determine the validity and scope of proprietary rights of others. It may be particularly difficult to enforce our intellectual property rights in countries where such rights are not highly developed or protected. Any action we take to protect our intellectual property rights could be costly and could absorb significant management time and attention. As a result of any such litigation, we could lose any proprietary rights we have.
In addition, itthird parties may claim that we or our customers are infringing upon their intellectual property rights. Claims of intellectual property infringement may subject us to costly and time-consuming defense actions and, should defenses not be successful, may result in the payment of damages, redesign of affected products, entry into settlement or license agreements, or a temporary or permanent injunction prohibiting us from manufacturing, marketing or selling certain of our products. It is also possible that others will independently develop technology that will compete with our patented or unpatented technology. The developmentoccurrence of new technologies by competitors that may compete with our technologies could reduce demand for our products and affect our financial performance.
| 15 |
The market priceloss of our common stock may experiencekey leadership could have a high level of volatility.
We may be recorded which would negatively affectadversely affected if we lose members of our results of operations.
The Deutsche Bank Credit Agreement contains restrictions that may limit our flexibility in operating our business.
The Deutsche Bank Credit Agreement contains various covenants that will limit our ability to useengage in specified types of transactions. These covenants would limit our NOLs existing at the timeability to, among other things:
In addition, under the ownership change is subjectDeutsche Bank Credit Agreement, we are required to satisfy and maintain compliance with a total leverage ratio and an annual limitation.interest coverage ratio. The amount of NOLs that we may utilize on an annual basis under Section 382 would generally be equal to the product of the value of our outstanding stock immediately prior to the ownership change (less certain capital contributions during the preceding two years)Deutsche Bank Credit Agreement's various covenants and the “long term tax exempt rate”additional leverage taken on by us could increase our vulnerability to general economic slowdowns which was 4.71% for May 2008. The amount of NOLs existing as of the time of the ownership change is estimated to be $65.3 millioncould have a materially adverse effect on our business, financial condition and will begin to expire in 2021.
Any impairment in the value of our intangible assets, including goodwill,Goodwill, would negatively affect our operating results and total capitalization.
Our totalTotal assets reflect substantial intangible assets, primarily goodwill.Goodwill. The goodwillGoodwill results from our acquisitions, representing the excess of cost over the fair value of the net assets we have acquired. We assess at least annually whether there has been impairment in the value of our intangible assets. If future operating performance at one or more of our business units were to fall significantly below current levels, if competing or alternative technologies emerge, or if market conditions for businesses acquired declines, we could incur, under current applicable accounting rules, a non-cash charge to operating earnings for goodwillGoodwill impairment. Any determination requiring the write-off of a significant portion of unamortized intangible assets would negativelyadversely affect our business, financial condition, results of operations and total capitalization, the effect of which could be material.
Our defined benefit pension plans and post-retirement medical and death benefit plans are or may become subject to financial market risksfunding requirements or obligations that could adversely affect our operating results,business, financial condition and cash flow.
We operate defined benefit pension plan obligations areplans and post-retirement medical and death benefit plans for our current and former employees worldwide. Each plan's funding position is affected by the investment performance of the plan's investments, changes in marketthe fair value of the plan's assets, the type of investments, the life expectancy of the plan's members, changes in the actuarial assumptions used to value the plan's liabilities, changes in the rate of inflation and interest rates, andour financial position, as well as other changes in economic conditions. Furthermore, since a significant proportion of the majority of planplans' assets are invested in publicly traded debt and equity securities, whichthey are, and will be, affected by market risks. Significant changesAny detrimental change in market interest rates, decreases inany of the fair valueabove factors is likely to worsen the funding position of plan assetseach of the relevant plans, and investment losses or lackthis is likely to require the plans' sponsoring employers to increase the contributions currently made to the plans to satisfy our obligations. Any requirement to increase the level of expected investment gainscontributions currently made could have a material adverse effect on plan assets may adversely impact our future operating results,business, financial condition and cash flow.
Significant movements in foreign currency exchange rates may harm our financial results.
We are exposed to fluctuations in currency exchange rates. During the year ended December 31, 2012, approximately 80% of our sales were derived from operations outside the U.S. A significant portion of our revenues and income are denominated in foreign currencies. Large fluctuations in the rate of exchange between foreign currencies and the U.S. dollar could have a material adverse effect on our business, financial condition and results of operations. Changes in the currency exchange rates may impact the financial results positively or negatively in one period and not another, which may make it difficult to compare our operating results from different periods.
We also face exchange risk from transactions with customers in countries outside the U.S. and from intercompany transactions between affiliates. Although we use the U.S dollar as our functional currency for reporting purposes, we have manufacturing sites throughout the world and a substantial portion of our costs are incurred and sales are generated in foreign currencies. Costs incurred and sales recorded by subsidiaries operating outside of the U.S. are translated into U.S. dollars using exchange rates effective during the respective period. As a result, we are exposed to movements in the exchange rates of various currencies against the U.S. dollar. In particular, the Company has more sales in European currencies than it has expenses in those currencies. Although a significant portion of this difference is hedged, when European currencies strengthen or weaken against the U.S. dollar, operating profits are increased or decreased, respectively.
We have identifiedgenerally accepted the exposure to exchange rate movements without using derivative financial instruments to manage this risk. Both positive and negative movements in currency exchange rates against the U.S. dollar will therefore continue to affect the reported amount of sales, profit, assets and liabilities in our Consolidated Financial Statements.
We are dependent on the availability of raw materials, as well as parts and components used in our products.
While we manufacture many of the parts and components used in our products, we require substantial amounts of raw materials and purchase parts and components from suppliers. The availability and prices for raw materials, parts and components may be subject to curtailment or change due to, among other things, suppliers' allocations to other purchasers, interruptions in production by suppliers, changes in exchange rates and prevailing price levels. Any significant change in the supply of, or price for, these raw materials or parts and components could materially affect our business, financial condition and results of operations. In addition, delays in delivery of components or raw materials by suppliers could cause delays in our delivery of products to our customers.
Our information technology infrastructure could be subject to service interruptions, data corruption, cyber-based attacks or network security breaches, which could result in the disruption of operations or the loss of data confidentiality.
We rely on information technology networks and systems, including the internet, to process, transmit and store electronic information, and to manage or support a variety of business processes and activities, including procurement, manufacturing, distribution, invoicing and collection. These technology networks and systems may be susceptible to damage, disruptions or shutdowns due to failures during the process of upgrading or replacing software, databases or components, power outages, hardware failures or computer viruses. In addition, we may be subject to cyber-based attacks and security breaches, which could result in unauthorized disclosure of confidential information or damage to our information technology networks and systems if our efforts to mitigate or otherwise contain any attacks or breaches are unsuccessful. If these information technology systems suffer severe damage, disruption or shutdown and business continuity plans do not effectively resolve the issues in a timely manner, our business, financial condition and results of operations could be materially adversely affected.
We may be subject to risks arising from changes in technology.
The supply chains in which we operate are subject to technological changes and changes in customer requirements. We may not successfully develop new or modified types of products or technologies that may be required by our customers in the future. Further, the development of new technologies by competitors that may compete with our technologies could reduce demand for our products and affect our financial performance. Should we not be able to maintain or enhance the competitive values of our products or develop and introduce new products or technologies successfully, or if new products or technologies fail to generate sufficient revenues to offset research and development costs, our business, financial condition and operating results could be materially adversely affected.
| 17 |
The markets we serve are highly competitive and some of our competitors may have superior resources. If we are unable to respond successfully to this competition, this could reduce our sales and operating margins.
We sell most of our products in highly fragmented and competitive markets. We believe that the principal elements of competition in our markets are:
In order to maintain and enhance our competitive position, we intend to continue investing in manufacturing quality, marketing, customer service and support and distribution networks. We may not have sufficient resources to continue to make these investments and we may not be able to maintain our competitive position. Our competitors may develop products that are superior to our products, develop methods of more efficiently and effectively providing products and services, or adapt more quickly than us to new technologies or evolving customer requirements. Some of our competitors may have greater financial, marketing and research and development resources than we have. As a result, those competitors may be better able to withstand the effects of periodic economic downturns. In addition, pricing pressures could cause us to lower the prices of some of our products to stay competitive. We may not be able to compete successfully with our existing competitors or with new competitors. If we fail to compete successfully, the failure may have a material weaknessadverse effect on our business, financial condition and results of operations.
Changes in our internal control over financial reporting. If our internal controls are not effective, investorstax rates or exposure to additional income tax liabilities could lose confidence inadversely affect our financial reporting.
Our management had previously concluded that our internal control over financial reporting wasfuture effective income tax rates could be unfavorably affected by various factors including, among others, changes in the tax rates, rules and regulations in jurisdictions in which we generate income or the repatriation of income held in foreign jurisdictions. Our Cash and cash equivalents as of December 31, 2009. 2012 includes $396.5 million held in jurisdictions outside the U.S., which may be subject to tax penalties and other restrictions if repatriated into the U.S. An increase in our effective tax rate could have a material adverse effect on our after-tax results of operations.
In addition, the amount of income taxes we pay is subject to ongoing audits by U.S. federal, state and local tax authorities and by non-U.S. tax authorities. If these audits result in assessments different from amounts recorded, our future financial results may include unfavorable tax adjustments.
Risks and Other Considerations Related to our Common Stock
The issuances of additional Common and Preferred stock or the resale of previously restricted Common stock may adversely affect the market price of Colfax Common stock.
In connection with the restatementCharter Acquisition, we issued a total of 20,182,293 shares of Colfax Common stock to correctBDT CF Acquisition Vehicle, LLC (the “BDT Investor”), Mitchell P. Rales, Steven M. Rales and Markel Corporation (collectively, the “Investors”) and 13,877,552 shares of Colfax Series A Preferred Stock, which are initially convertible into an additional 12,173,291 shares of Colfax Common stock, to the BDT Investor. Pursuant to registration rights agreements we entered into with the Investors in January 2012, the Investors and their permitted transferees have registration rights for the resale of the shares of Colfax Common stock acquired as a result of the Charter Acquisition and, with respect to the BDT Investor, shares of Colfax Common stock issuable upon conversion of the Series A Preferred Stock. In April 2012, we filed a prospectus supplement under which the Investors may resell these shares. In addition, Mitchell P. Rales and Steven M. Rales have registration rights for the resale of certain shares of Colfax Common stock pursuant to a 2003 registration rights agreement, as amended. These registration rights would facilitate the resale of such securities into the public market, and any such resale would increase the number of shares of Colfax Common stock available for public trading. Sales by the BDT Investor, Markel, Mitchell P. Rales or Steven M. Rales or their permitted transferees of a substantial number of shares of Colfax Common stock in the public market, or the perception that such sales might occur, could have a material adverse effect on the price of Colfax Common stock.
In March 2012, we sold 9,000,000 shares of newly issued Common stock to underwriters for public resale pursuant to a shelf registration statement. Under our Amended and Restated Certificate of Incorporation, there are additional authorized shares of Colfax Common stock, which, if subsequently issued, could have a further dilutive effect on outstanding Colfax Common stock.
Our Amended and Restated Certificate of Incorporation contains provisions that grant the BDT Investor certain rights which may limit our flexibility in operating our business and structuring our corporate governance.
So long as the BDT Investor and its permitted transferees beneficially own, in the aggregate, at least 50% of the Series A Preferred Stock issued to the BDT Investor under the securities purchase agreement with the BDT Investor (the “BDT Purchase Agreement”), the BDT Investor's written consent is required in order for us to take certain corporate actions, including:
The Amended and Restated Certificate of Incorporation also provides that, so long as the BDT Investor and certain permitted transferees beneficially own at least 10% of the Colfax Common stock (on a fully-diluted basis), the BDT Investor's written consent is required to alter, amend or repeal the provisions of the Amended and Restated Certificate of Incorporation which sets forth the authorized number of members of our Board and the BDT Investor's nomination rights in respect of members of our Board. The above factors could limit our financial statementsand operational flexibility, and as a result could have a material adverse effect on our business, financial condition and results of operations.
The BDT Investor may exercise significant influence over us, including through its ability to elect up to two members of our Board of Directors.
The shares of Colfax Common stock and Series A Preferred Stock owned by the BDT Investor represent approximately 22% of the voting rights in respect of the Company's issued share capital. The Amended and Restated Certificate of Incorporation provides that the BDT Investor's consent is required before we may take certain actions for so long as the BDT Investor and its permitted transferees beneficially own in the aggregate at least 50% of the Series A Preferred Stock issued pursuant to the BDT Purchase Agreement (as discussed above). As a result, the BDT Investor may have the ability to significantly influence the outcome of any matter submitted for the effects of an overstatementvote of our pension liability, discussedstockholders. The BDT Investor may have interests that diverge from, or even conflict with, those of Colfax and our other stockholders.
The Amended and Restated Certificate of Incorporation also provides that the BDT Investor will have the right to exclusively nominate (1) two out of eleven directors to our Board of Directors so long as the BDT Investor holds at least 20% of the outstanding Colfax Common stock (calculated on a fully diluted basis, assuming conversion of the Series A Preferred Stock at the then-existing conversion price), with one of its nominees to serve on the Audit Committee of our Board of Directors and one of its nominees to serve on the Compensation Committee of our Board of Directors, and (2) one out of ten directors to our Board of Directors so long as the BDT Investor and its permitted transferees beneficially own in Note 2the aggregate less than 20% but more than 10% of the outstanding Colfax Common stock (calculated on a fully diluted basis, assuming conversion of the Series A Preferred Stock at the then-existing conversion price), with such nominee to serve on the consolidated financial statements includedAudit Committee and the Compensation Committee of our Board of Directors. Further, so long as the BDT Investor and certain permitted transferees beneficially own at least 10% of the Colfax Common stock (calculated on a fully diluted basis, assuming conversion of the Series A Preferred Stock at the then-existing conversion price), the BDT Investor’s written consent is required to alter, amend or repeal the provisions of the Amended and Restated Certificate of Incorporation which sets forth the authorized number of members of our Board and the BDT Investor’s nomination rights in Part IIrespect of members of our Board.
In addition, the percentage of Colfax Common stock owned by the BDT Investor, Mitchell P. Rales and Steven M. Rales and the governance rights of the BDT Investor could discourage a third party from proposing a change of control or other strategic transaction concerning Colfax.
Provisions in our governing documents and Delaware law may delay or prevent an acquisition of Colfax, which could decrease the value of its shares.
Our Amended and Restated Certificate of Incorporation, Amended and Restated Bylaws, and Delaware law contain provisions that may make it difficult for a third-party to acquire us without the consent of our Board of Directors. These provisions include prohibiting stockholders from taking action by written consent, prohibiting special meetings of stockholders called by stockholders and prohibiting stockholder nominations and approvals without complying with specific advance notice requirements. In addition, our Board of Directors has the right to issue Preferred stock without stockholder approval, which our Board of Directors could use to effect a rights plan or “poison pill” that could dilute the stock ownership of a potential hostile acquirer and may have the effect of delaying, discouraging or preventing an acquisition of Colfax. Delaware law also imposes some restrictions on mergers and other business combinations between Colfax and any holder of 15% or more of its outstanding voting stock. Although the BDT Investor holds more than 20% of our outstanding voting stock, this report, management determinedprovision of Delaware law does not apply to it.
Item 1B.Unresolved Staff Comments
None.
Item 2.Properties
Our corporate headquarters are located in Fulton, Maryland in a material weakness in internal control over financial reporting existed asfacility that we lease. As of December 31, 2009. Accordingly, management has now concluded that2012, our internal control over financial reporting was not effective as of December 31, 2009. Also, as described in “Part II—Item 9A. Controlsgas- and Procedures” of this report, our Chief Executive Officer and Chief Financial Officer concluded that our disclosure controls and procedures were not effective as of December 31, 2009.
Item 3.Legal Proceedings
Discussion of legal matters is incorporated by reference to Part II, Item 8, Note 19,16, “Commitments and Contingencies,” in the Notes to the Consolidated Financial Statements.
Item 4.Mine Safety Disclosures
None.
EXECUTIVE OFFICERS OF THE REGISTRANT
Set forth below are the names, ages, positions and experience of our executive officers. All of our executive officers hold office at the pleasure of our Board of Directors.
Name | Age | Position | ||
| President and Chief Executive Officer and Director, Colfax Corporation | ||||
| Senior Vice President, Finance, | ||||
| 57 | Executive Vice President, Chief Executive Officer, ESAB Global and Director, Colfax Corporation | |||
| Ian Brander | 51 | Chief Executive Officer, Howden | ||
| William E. Roller | 50 | Executive Vice President, Colfax Fluid Handling | ||
| Lynn Clark | 55 | Senior Vice President, Global Human Resources | ||
| Daniel A. Pryor | 44 | Senior Vice President, | ||
| Senior Vice President, General Counsel and Secretary | ||||
| Senior Vice President, | ||||
Steven E. Simms has been President and Chief Executive Officer since April 2012. He has served as a Director of Colfax since July 2011. Mr. Simms also served as Chairman of the Board of Directors of Apex Tools and is a former Executive Vice President of Danaher Corporation. Mr. Simms held a variety of leadership roles during his 11-year career at Danaher. He became Executive Vice President in January2000 and served in that role through his retirement in 2007, during which time he was instrumental in Danaher’s international growth and success. He previously served as Vice President–Group Executive from 1998 to 2000 and as an executive in Danaher’s tools and components business from 1996 to 1998. Prior to joining Danaher, Mr. Simms held roles of increasing authority at Black & Decker Corporation, most notably President–European Operations and President–Worldwide Accessories. Mr. Simms started his career at the Quaker Oats Company where he held a number of brand management roles. He currently serves as a member of the Board of Trustees of The Boys’ Latin School of Maryland and is actively involved in a number of other educational and charitable organizations in the Baltimore area.
| 21 |
C. Scott Brannan has been the Senior Vice President, Finance, Chief Financial Officer and Treasurer since October 2010. Mr. Brannan served on the Colfax Board of Directors and was Chairman of the Audit Committee from 2008 to September 2010. Prior to joining Colfax in his current role‚ he was a partner at Aronson & Company‚ a public accounting firm‚ from 2003 to 2010. He was also previously employed at Danaher Corporation for 12 years in roles of increasing responsibility‚ including Chief Accounting Officer‚ Controller and Vice President of Administration. Prior to Danaher Corporation‚ he spent 8 years with Arthur Andersen & Co. He holds bachelors and masters degrees in accounting from Loyola University Maryland and is a certified public accountant.
Clay H. Kiefaberis Executive Vice President‚ Chief Executive Officer ESAB Global and a Director of Colfax Corporation. Mr. Kiefaber has served on the Colfax Board of Directors since the Company’s IPO in 2008.2008 and was previously the President and Chief Executive Officer of Colfax from January 2010 through April 2012. Before joining Colfax in January 2010,Colfax‚ he spent nearly 20 years in increasingly senior executive positions at Masco Corporation (“Masco”).Corporation. Most recently,recently‚ he was a Group President from 2006 to 2007,President‚ where he was responsible for a $2.8 billion group of building construction components.architectural coatings‚ windows‚ and spa business units. Prior to becoming a Group President at Masco,Masco‚ Mr. Kiefaber was Group Vice President of Masco Builder Cabinet Group. He previously spent 14 years in increasingly senior positions in Masco’s Merillat Industries subsidiary.
Ian Branderhas been the Chief Executive Officer of Howden since August 1, 2011. Prior to becoming Chief Executive Officer of Howden, he served as Operations Director beginning in 2008. His experience includes over 20 years at Howden in various roles in technical, project, commercial and general management positions associated with a wide range of products. He holds a Mechanical Engineering degree from the University of Strathclyde.
William E. DiDomenico
Lynn Clarkjoined Colfax Corporation in 2013 as Senior Vice President, General Manager—Engineered Solutions, which also includes Portland Valve, Fairmount and Tushaco following the acquisitions of those businesses.
Daniel A. Pryor has served as our Senior Vice President‚ Strategy and Business Development since January 2011. Prior to joining Colfax‚ he was a Partner and Managing Director with The Carlyle Group‚ a global alternative asset manager, where he focused on industrial leveraged buyouts and led numerous portfolio company Mr. Niemann wasand follow-on acquisitions. While at The Carlyle Group, he served on the boards of portfolio companies Veyance Technologies, Inc., John Maneely Co., and HD Supply Inc. Prior to The Carlyle Group‚ he spent 11 years at Danaher Corporation in roles of increasing responsibility‚ most recently as Vice President Marketing & eBusiness of Emerson Climate Technologies, a subsidiary of Emerson Electric Company, where he was employed– Strategic Development. Mr. Pryor earned his M.B.A. from 1990 to 2005.
A. Lynne Puckett has served as our Senior Vice President, General Counsel and Secretary since January 1998.
| 22 |
Stephen J. Wittig has served as ourbeen the Senior Vice President, General Manager—AmericasColfax Business System and Supply Chain Strategy since June 1999.August 2011. Prior to joining Colfax, Americas includes Imo as well as Zenith and LSC followinghe was the acquisitions of those businesses.
PART II
| Item 5. |
Our commonCommon stock began trading on the New York Stock Exchange under the symbol CFX on May 8, 2008. As of January 31, 2010,February 4, 2013, there were approximately 7,30018,916 holders of record of our commonCommon stock. The high and low sales prices per share of our commonCommon stock, as reported on the New York Stock Exchange, for the fiscal periods presented are as follows:
| 2009 | 2008 | |||||||||||||||
| High | Low | High | Low | |||||||||||||
| First Quarter | $ | 13.22 | $ | 5.33 | N/A | N/A | ||||||||||
| Second Quarter | $ | 9.48 | $ | 6.05 | $ | 25.76 | $ | 20.01 | ||||||||
| Third Quarter | $ | 12.66 | $ | 7.21 | $ | 28.35 | $ | 14.73 | ||||||||
| Fourth Quarter | $ | 13.91 | $ | 10.22 | $ | 18.16 | $ | 5.58 | ||||||||
| Year Ended December 31, | ||||||||||||||||
| 2012 | 2011 | |||||||||||||||
| High | Low | High | Low | |||||||||||||
| First Quarter | $ | 37.64 | $ | 27.61 | $ | 23.50 | $ | 17.79 | ||||||||
| Second Quarter | $ | 35.56 | $ | 26.01 | $ | 25.34 | $ | 20.46 | ||||||||
| Third Quarter | $ | 36.79 | $ | 24.43 | $ | 28.75 | $ | 20.10 | ||||||||
| Fourth Quarter | $ | 40.52 | $ | 33.14 | $ | 32.69 | $ | 17.90 | ||||||||
We have not paid any dividends on our commonCommon stock since inception, and we do not anticipate the declaration or payment of dividends at any time in the foreseeable future. Our credit agreementThe Deutsche Bank Credit Agreement (as defined and further discussed in Item 7. “Management’s Discussion and Analysis of Financial Condition and Results of Operations—Liquidity and Capital Resources”) limits the amount of cash dividends and commonCommon stock repurchases the Company may make to a total of $10$50 million annually.
Performance Graph
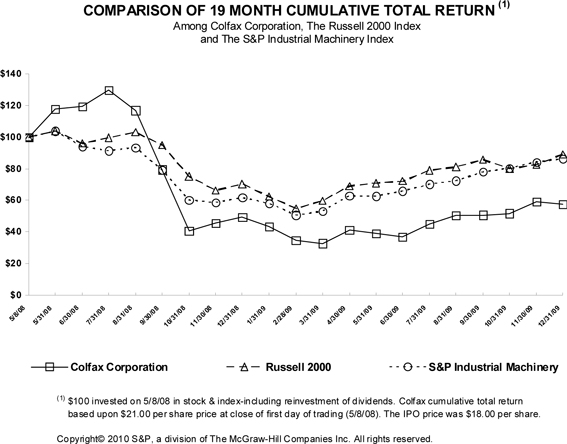
The graph below compares the cumulative total stockholder return on our Common stock with the cumulative total return of the Russell 2000 Index and the Standard & Poor’s (“S&P”) Industrial Machinery Index since the date of our initial public offering on May 8, 2008. The graph assumes that $100 was invested on May 8, 2008 in each of our Common stock, the Russell 2000 Index and the S&P Industrial Machinery Index, and that all dividends were reinvested.
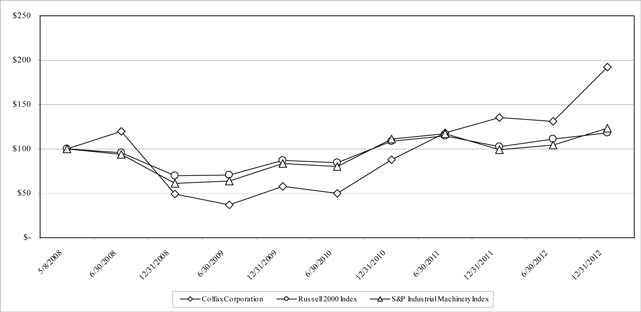
Issuer Purchase of Equity Securities
There were no commonCommon stock repurchases during 2009.
Item 6.Selected Financial Data
| Year Ended and As of December 31, | ||||||||||||||||||||
| 2012(1) | 2011(2) | 2010(3) | 2009(4) | 2008(5) | ||||||||||||||||
| (In thousands, except per share data) | ||||||||||||||||||||
| Statement of Operations Data: | ||||||||||||||||||||
| Net sales | $ | 3,913,856 | $ | 693,392 | $ | 541,987 | $ | 525,024 | $ | 604,854 | ||||||||||
| Cost of sales | 2,761,731 | 453,293 | 350,579 | 339,237 | 387,667 | |||||||||||||||
| Gross profit | 1,152,125 | 240,099 | 191,408 | 185,787 | 217,187 | |||||||||||||||
| Selling, general and administrative expense | 895,452 | 162,761 | 133,507 | 116,240 | 125,190 | |||||||||||||||
| Initial public offering-related cost | — | — | — | — | 57,017 | |||||||||||||||
| Charter acquisition-related expense | 43,617 | 31,052 | — | — | — | |||||||||||||||
| Restructuring and other related charges | 60,060 | 9,680 | 10,323 | 18,175 | — | |||||||||||||||
| Asbestos coverage litigation expense | 12,987 | 10,700 | 13,206 | 11,742 | 17,162 | |||||||||||||||
| Operating income | 140,009 | 25,906 | 34,372 | 39,630 | 17,818 | |||||||||||||||
| Interest expense | 91,570 | 5,919 | 6,684 | 7,212 | 11,822 | |||||||||||||||
| Provision for income taxes | 90,703 | 15,432 | 11,473 | 8,621 | 5,465 | |||||||||||||||
| Net (loss) income | (42,264 | ) | 4,555 | 16,215 | 23,797 | 531 | ||||||||||||||
| Less: income attributable to noncontrolling interest, net of taxes | 22,138 | — | — | — | — | |||||||||||||||
| Dividends on preferred stock | 18,951 | — | — | — | 3,492 | |||||||||||||||
| Net (loss) income available to Colfax Corporation common shareholders | $ | (83,353 | ) | $ | 4,555 | $ | 16,215 | $ | 23,797 | $ | (2,961 | ) | ||||||||
| Net (loss) income per share—basic and diluted | $ | (0.92 | ) | $ | 0.10 | $ | 0.37 | $ | 0.55 | $ | (0.08 | ) | ||||||||
| Balance Sheet Data: | ||||||||||||||||||||
| Cash and cash equivalents | $ | 482,449 | $ | 75,108 | $ | 60,542 | $ | 49,963 | $ | 28,762 | ||||||||||
| Goodwill and Intangible assets, net | 2,853,279 | 245,873 | 200,636 | 175,370 | 175,210 | |||||||||||||||
| Total assets | 6,129,727 | 1,088,543 | 1,022,077 | 1,006,301 | 907,550 | |||||||||||||||
| Total debt, including current portion | 1,728,311 | 111,518 | 82,500 | 91,485 | 97,121 | |||||||||||||||
__________
| Year ended December 31, | ||||||||||||||||||||
2009 Restated | 2008 Restated | 2007 Restated | 2006 Restated | 2005 Restated | ||||||||||||||||
| Statement of Operations Data: | ||||||||||||||||||||
| Net sales | $ | 525,024 | $ | 604,854 | $ | 506,305 | $ | 393,604 | $ | 345,478 | ||||||||||
| Cost of sales | 339,237 | 387,667 | 330,714 | 256,806 | 222,353 | |||||||||||||||
| Gross profit | 185,787 | 217,187 | 175,591 | 136,798 | 123,125 | |||||||||||||||
| Initial public offering-related costs | - | 57,017 | - | - | - | |||||||||||||||
| Selling, general and administrative expenses | 112,503 | 124,105 | 97,426 | 78,964 | 73,542 | |||||||||||||||
| Research and development expenses | 5,930 | 5,856 | 4,162 | 3,336 | 2,855 | |||||||||||||||
| Restructuring and other related charges | 18,175 | - | - | - | - | |||||||||||||||
| Asbestos liability and defense (income) costs | (2,193 | ) | (4,771 | ) | (63,978 | ) | 21,783 | 14,272 | ||||||||||||
| Asbestos coverage litigation expenses | 11,742 | 17,162 | 13,632 | 12,033 | 3,840 | |||||||||||||||
| Operating income | 39,630 | 17,818 | 124,349 | 20,682 | 28,616 | |||||||||||||||
| Interest expense | 7,212 | 11,822 | 19,246 | 14,186 | 9,026 | |||||||||||||||
| Provision for income taxes | 8,621 | 5,465 | 39,457 | 4,298 | 6,666 | |||||||||||||||
| Income from continuing operations | 23,797 | 531 | 65,646 | 2,198 | 12,924 | |||||||||||||||
Net income (1) | $ | 23,797 | $ | 531 | $ | 65,646 | $ | 801 | $ | 13,540 | ||||||||||
| Net income (loss) per share from continuing operations — basic and diluted | $ | 0.55 | $ | (0.08 | ) | $ | 1.82 | $ | 0.10 | $ | (0.03 | ) | ||||||||
| December 31, | ||||||||||||||||||||
2009 Restated | 2008 Restated | 2007 Restated | 2006 Restated | 2005 Restated | ||||||||||||||||
| Balance Sheet Data: | ||||||||||||||||||||
| Cash and cash equivalents | $ | 49,963 | $ | 28,762 | $ | 48,093 | $ | 7,608 | $ | 7,821 | ||||||||||
| Goodwill and intangibles, net | 175,370 | 175,210 | 181,517 | 150,395 | 145,957 | |||||||||||||||
| Asbestos insurance asset, including current portion | 389,449 | 304,015 | 305,228 | 297,106 | 261,941 | |||||||||||||||
| Total assets | 999,401 | 907,550 | 899,522 | 792,018 | 696,738 | |||||||||||||||
| Asbestos liability, including current portion | 443,769 | 357,258 | 376,233 | 388,920 | 338,535 | |||||||||||||||
Total debt, including current portion (2) | 91,485 | 97,121 | 206,493 | 188,720 | 158,454 | |||||||||||||||
| (1) |
| (2) | During 2011, we completed the acquisitions of Rosscor and COT-Puritech in February and December, respectively. See Part I, Item 1. “Business” and Note 4, “Acquisitions” in the accompanying Notes to Consolidated Financial Statements in this Form 10-K for additional information. |
| (3) | In August 2010, we acquired Baric. See Part I, Item 1. “Business” and Note 4, “Acquisitions” in the accompanying Notes to Consolidated Financial Statements in this Form 10-K for additional information. |
| (4) | In August 2009, we acquired PD Technik for $1.3 million, net of cash acquired. See Part I, Item 1. “Business” in this Form 10-K for additional information. |
| (5) | In May 2008, we refinanced our Debt in conjunction with our initial public offering. |
Item 7.Management’s Discussion and Analysis of PD-Technik in 2009, FairmountFinancial Condition and LSC in 2007 and Tushaco in 2005. See Item 1. Business and Note 5 to our Consolidated Financial Statements for further information.
Management’s Discussion and Analysis of Financial Condition and Results of Operations (MD&A)(“MD&A”) is designed to provide a reader of the Company’sour financial statements with a narrative from the perspective of CompanyCompany’s management. The Company’sThis MD&A is divided into four main sections:
| § | Overview |
| § | Results of Operations |
| § | Liquidity and Capital Resources |
| § | Critical Accounting Policies |
The following discussion of our financial condition and results of operationsMD&A should be read together with Item 6. “Selected Financial and Data,” Part I, Item 1A. “Risk Factors” and the financial statementsaccompanying Consolidated Financial Statements and related notesNotes to Consolidated Financial Statements included elsewhere in this Form 10-K/A.10-K. The following discussionMD&A includes forward-looking statements. For a discussion of important factors that could cause actual results to differ materially from the results referred to in thethese forward-looking statements, see “Special Note Regarding Forward-Looking Statements.”
Overview
Please see Part I, Item 1. “Business” for a discussion of Colfax’s objectives and methodologies for delivering shareholder value. Upon the closing of the Charter Acquisition, we changed the composition of our reportable segments to reflect the changes in our internal organization resulting from the integration of the acquired businesses. We now report our operations through the following discussion gives effectreportable segments:
| · | Gas & Fluid Handling – a global supplier of a broad range of gas- and fluid-handling products, including pumps, fluid-handling systems and controls, specialty valves, heavy-duty centrifugal and axial fans, rotary heat exchangers and gas compressors, which serves customers in the power generation, oil, gas and petrochemical, mining, marine (including defense) and general industrial and other end markets; and |
| · | Fabrication Technology–a global supplier of welding equipment and consumables, cutting equipment and consumables and automated welding and cutting systems. |
Certain amounts not allocated to the restatement oftwo reportable segments and intersegment eliminations are reported under the Company's consolidated financial statements as discussed in Note 2 to the Company's consolidated financial statements in Part II, Item 8.
Colfax Corporation ishas a global supplier of a broad range of fluid handling products, including pumps, fluid handling systems and controls, and specialty valves. We believe that we are a leading manufacturer of rotary positive displacement pumps, which include screw pumps, gear pumps and progressive cavity pumps. We design and engineer our products to high quality and reliability standards for use in critical fluid handling applications where performance is paramount. We also offer customized fluid handling solutions to meet individual customer needs based on our in-depth technical knowledge of the applications in which our products are used.
We employ a comprehensive set of tools that we refer to as CBS. CBS, modeled on the Danaher Business System, is our business beganmanagement system. It is a repeatable, teachable process that we use to create superior value for our customers, shareholders and associates. Rooted in 1995 withour core values, it is our culture. CBS provides the intentiontools and techniques to acquire, manage and createensure that we are continuously improving our ability to meet or exceed customer requirements on a world-class industrial manufacturing company. We seek to acquire businesses with leading market positions and brands that exhibit strong cash flow generation potential. With our management expertise and the introduction of CBS into our acquired businesses, we pursue growth in revenues and improvements in operating margins.
Outlook
We believe that we are well positioned to grow our businessbusinesses organically over the long term by enhancing our product offerings and expanding our customer base in our strategic markets. The current global economic downturn had a significant impact on our sales and operating profit in 2009 when compared to 2008.base. Our order rates declined significantly in 2009 and if current economic conditions continue, our business results will continuemix is expected to be negatively affected. In addition, we have had project delivery push-outs as well as order cancellations that may continuebalanced between long- and short-cycle businesses, sales in 2010. We will continueemerging markets and developed nations and fore- and aftermarket products and services. Given this balance, management no longer uses indices other than general economic trends to predict the overall outlook for the Company. Instead, the individual businesses monitor general global economic conditionskey competitors and expectcustomers, including to the following market conditions:
As a result of the significant growth in orders in 2009Charter Acquisition, we face a number of challenges and opportunities, including the timing of projects.
We also expect to continue to grow as a result of strategic acquisitions. We believe that the extensive experience of our managementleadership team in acquiring and effectively integrating acquisition targets should enable us to capitalize on opportunities in the future.
Results of Operations
The following discussion of our resultsResults of operations that follows focuses on someOperationsaddresses the comparison of the key financial measures that we use to evaluate our business. We evaluate our business using several measures, including net sales, orders and order backlog. Our sales, orders and backlog are affected by many factors, particularlyperiods presented. The Company’s management evaluates the impact of acquisitions, the impact of fluctuating foreign exchange rates and change from our existing businesses which may be driven by market conditions and other factors. To facilitate the comparison between reporting periods, we describe the impactoperating results of each of these three factors, to the extent they impact the periods presented, on ourits reportable segments based upon Net sales orders and backlog in tabular format under the heading “Salessegment operating income (loss), which represents operating income (loss) before Restructuring and Orders.”
Items Affecting the Comparability of Our Reported Results
Our financial performance and growth are driven by many factors, principally our ability to serve increasingly global markets, fluctuations in the relationship of foreign currencies to the U.S. dollar, the general economic conditions, within our five strategic markets, the global economy and capital spending levels, the availability of capital, our estimates concerning the availability of insurance proceeds to cover asbestos litigation expensesexpense and liabilities, the amountsamount of asbestos liabilities and litigation expenses and liabilities,expense, the impact of restructuring initiatives, our ability to pass through cost increases on through pricing, the impact of sales mix, and our ability to continue to grow through acquisitions. These key factors have impacted our results of operations in the past and are likely to affect them in the future.
Global Operations
Our products and services are available worldwide. The manner in which our products and services are sold differs by region. Most of our sales in non-U.S. markets are made by subsidiaries located outside the United States, though we also sell into non-U.S. markets through various representatives and distributors and directly from the U.S. In countries with low sales volumes, we generally sell through representatives and distributors. For the year ended December 31, 2009,During 2012, approximately 76%83% of our sales were shipped to locations outside of the U.S. Accordingly, we are affected by levels of industrial activity and economic and political factors in countries throughout the world. Our ability to grow and our financial performance will be affected by our ability to address a variety of challenges and opportunities that are a consequence of our global operations, including efficiently utilizing our global sales, manufacturing and distribution capabilities, the expansion of market opportunities in Asia, successfully completing global strategic acquisitions and engineering innovative new product applications for end users in a variety of geographic markets. However, we believe that our geographic, end market and product diversification may limit the impact that any one country or economy could have on our consolidated results.
Foreign Currency Fluctuations
A significant portion of our Net sales, approximately 66%80% for the year ended December 31, 2009, are2012 is derived from operations outside the U.S., with the majority of those sales denominated in currencies other than the U.S. dollar, especially the Euro and the Swedish Krona.dollar. Because much of our manufacturing and employee costs are outside the U.S., a significant portion of our costs are also denominated in currencies other than the U.S. dollar. Changes in foreign exchange rates can impact our results of operations and are quantified when significant into our discussion of our operations.
Economic Conditions in Strategic Markets
Demand for our products depends on the level of new capital investment and planned maintenance by our customers. The level of capital expenditures depends, in turn, on the general economic conditions within that market as well as access to capital at reasonable cost. While demand within each of these strategic markets can be cyclical, we believe the diversity of these markets may limitCharter Acquisition has diversified our operations and limits the impact of a downturn in any one of these marketsmarket on our consolidated results.
Seasonality
As our gas- and fluid-handling customers seek to fully utilize capital spending budgets before the end of the year, historically our shipments have peaked during the fourth quarter. Also, all of our European operations typically experience a slowdown during the July and August holiday season. General economic conditions may, however, impact future seasonal variations.
Pricing
We believe our customers place a premium on quality, reliability, availability, design and application engineering support. Our highly engineered fluid handlinggas and fluid-handling products typically have higher margins than products with commodity-like qualities. However, we are sensitive to price movements in our raw materials supply base. Our largest material purchases are for components and raw materials consisting ofincluding steel, iron, copper and aluminum. Historically, we have been generally successful in passing raw material price increases on to our customers. While we seek to take actions to manage this risk, including commodity hedging where appropriate, such increased costs may adversely impact earnings.
Sales and Cost Mix
Our profit margins vary in relation to the relative mix of many factors, including the type of product, the geographic location in which the product is manufactured, the end market for which the product is designed, and the percentage of total revenue represented by consumables and aftermarket sales and services. AftermarketConsumables are generally sold at lower margins in comparison to our foremarket products and equipment, whereas our aftermarket business, including spare parts and other value added services, is generally a higher margin businessbusiness. During 2012, our mix of consumables and is a significant componentaftermarket products and services was significantly impacted by the Charter Acquisition.
The mix of our profitability.
| Year Ended December 31, | ||||||||||||
| 2012 | 2011 | 2010 | ||||||||||
| Foremarket and equipment | 45 | % | 78 | % | 76 | % | ||||||
| Aftermarket and consumables | 55 | % | 22 | % | 24 | % | ||||||
Strategic Acquisitions
We complement our organic growth with strategic acquisitions. Acquisitions can significantly affect our reported results and can complicate period to period comparisons of results. As a consequence, we report the change in our Net sales between periods both from existing and acquired businesses. We intendOrders and order backlog are presented only for the gas- and fluid-handling segment, where this information is relevant. The discussion of Net sales, orders and order backlog for 2012 in comparison to continue2011 is a proforma comparison that includes the operations acquired in the Charter Acquisition for the comparable period of the prior year, which excludes the first 12 days of each annual period presented. The change in Net sales due to pursue acquisitions of complementary businesses that will broaden our product portfolio, expand our geographic footprint or enhance our position within our strategic markets.
On JanuaryOctober 31, 2007, we2012, the Company completed the acquisition of Lubrication Systems Companyapproximately 91% of Texas (“LSC”), a manufacturerthe outstanding common and investment shares of fluid handling systems, including oil mist lubricationSoldex for approximately $186.1 million (the “Soldex Acquisition”). Soldex is organized under the laws of Peru and oil purification systems. LSC strengthenscomplements our presenceexisting fabrication technology segment by supplying welding products from its plants in Colombia and Peru.
On September 13, 2012, Colfax completed the acquisition of the Co-Vent for $34.6 million. Co-Vent specializes in the oilcustom design, manufacture, and gas endtesting of industrial fans, with its primary operations based in Quebec, Canada. As a result of this acquisition, Colfax has expanded its product offerings in the industrial fan market.
In May 2012, Colfax acquired the remaining 83.7% of Sibes not already owned by its ESAB business for approximately $8.5 million, including the assumption of debt. Sibes is a leading supplier of welding electrodes to customers in Eastern Russia and strengthens ESAB’s position in the attractive Russian welding consumables market, particularly in the downstream refinery segment, broadens our overall lubrication portfolio,energy and presents the opportunity to expand its product application to othernatural resources end markets.
On November 29, 2007, we acquired Fairmount Automation, Inc. (“Fairmount”), an original equipment manufacturer of mission critical programmable automation controllers in fluid handling applications primarily for the U.S. Navy. In addition to strengthening our existing position with the U.S. Navy, we intend to leverage Fairmount’s experienced engineering talent and technology expertise to develop a portfolio of fluid handling solutions with diagnostic and prognostic capabilities for industrial applications.
On July 1, 2011, ESAB acquired 60% of Condor Equipamentos Industriais Ltda (“PD-Technik”Condor”), a providerleading Brazilian manufacturer of marine aftermarket related products and services locatedgas apparatus used in Hamburg, Germany. Thewelding applications, for cash consideration of R$25.2 million.
On March 28, 2011, Howden completed the acquisition of PD-Technik supportsThomassen Compression Systems BV (“Thomassen”), a leading supplier of high-powered engineered compressors to the oil, gas and petrochemical end market, for approximately €100 million.
On March 3, 2011, ESAB completed the acquisition of LLC Sychevsky Electrodny Zavod (“Sychevsky”), a leading Russian electrode manufacturer based in the Smolensk region for $19.2 million.
On February 14, 2011, Colfax completed the acquisition of Rosscor for $22.3 million, net of cash acquired. Rosscor is a supplier of multiphase pumping technology and certain other highly engineered fluid-handling systems, with its primary operations based in Hengelo, The Netherlands.
On August 19, 2010, Colfax completed the acquisition of Baric, a supplier of highly engineered fluid-handling systems primarily for lubrication applications, with its primary operations based in Blyth, United Kingdom.
Sales, Orders and Backlog
For 2012, our marine aftermarket growth initiatives, broadeningconsolidated Net sales increased from proforma net sales of $3.8 billion in 2011 to $3.9 billion (which excludes operations acquired in the Charter Acquisition for the first 12 days of each annual period presented). The following tables present components of our served marketproforma consolidated Net sales and, for our gas- and fluid-handling segment, proforma order and backlog growth:
| Net Sales | Orders(1) | Backlog at Period End | ||||||||||||||||||||||
| $ | % | $ | % | $ | % | |||||||||||||||||||
| (In millions) | ||||||||||||||||||||||||
| Proforma as of and for the year ended December 31, 2011 | $ | 3,839.1 | $ | 1,924.6 | $ | 1,288.3 | ||||||||||||||||||
| Components of Change: | ||||||||||||||||||||||||
| Existing businesses(2) | 202.2 | 5.3 | % | 54.0 | 2.8 | % | 117.5 | 9.1 | % | |||||||||||||||
| Acquisitions(3) | 86.5 | 2.2 | % | 100.4 | 5.2 | % | 9.4 | 0.7 | % | |||||||||||||||
| Foreign currency translation(4) | (213.9 | ) | (5.6 | )% | (83.0 | ) | (4.3 | )% | (33.8 | ) | (2.6 | )% | ||||||||||||
| 74.8 | 1.9 | % | 71.4 | 3.7 | % | 93.1 | 7.2 | % | ||||||||||||||||
| As of and for the year ended December 31, 2012 | $ | 3,913.9 | $ | 1,996.0 | $ | 1,381.4 | ||||||||||||||||||
__________
| (1) | Represents contracts for products or services, net of cancellations for the period. |
| (2) | Excludes the impact of foreign exchange rate fluctuations and acquisitions, thus providing a measure of growth due to factors such as price, product mix and volume. |
| (3) | Represents the incremental sales, orders and order backlog as |
| (4) | Represents the difference between sales from existing businesses valued at current year foreign exchange rates and sales from existing businesses at prior year foreign exchange rates. |
The proforma increase in Net sales from existing businesses in 2012 was attributable to increases of $161.5 million and $40.7 million in our gas- and fluid-handling and fabrication technology segments, respectively. Orders, net of cancellations, from existing businesses for our gas- and fluid-handling segment increased during 2012 in comparison to 2011 primarily due to growth in the power generation and mining end markets.
The following tables present components of our Net sales order and backlog growth for 2011:
| Net Sales | Orders(1) | Backlog at Period End | ||||||||||||||||||||||
| $ | % | $ | % | $ | % | |||||||||||||||||||
| (In millions) | ||||||||||||||||||||||||
| As of and for the year ended December 31, 2010 | $ | 542.0 | $ | 532.8 | $ | 313.5 | ||||||||||||||||||
| Components of Change: | ||||||||||||||||||||||||
| Existing businesses(2) | 48.8 | 9.0 | % | 65.0 | 12.2 | % | (1.1 | ) | (0.4 | )% | ||||||||||||||
| Acquisitions(3) | 81.3 | 15.0 | % | 64.0 | 12.0 | % | 40.2 | 12.8 | % | |||||||||||||||
| Foreign currency translation(4) | 21.3 | 3.9 | % | 21.0 | 4.0 | % | (5.4 | ) | (1.7 | )% | ||||||||||||||
| 151.4 | 27.9 | % | 150.0 | 28.2 | % | 33.7 | 10.7 | % | ||||||||||||||||
| As of and for the year ended December 31, 2011 | $ | 693.4 | $ | 682.8 | $ | 347.2 | ||||||||||||||||||
__________
| (1) | Represents contracts for products or services, net of cancellations for the period. |
| (2) | Excludes the impact of foreign exchange rate fluctuations and acquisitions, thus providing a measure of growth due to factors such as price, product mix and volume. |
| (3) | Represents the incremental sales, orders and order backlog as a result of acquisitions. |
| (4) | Represents the difference between sales from existing businesses valued at current year foreign exchange rates and sales from existing businesses at prior year foreign exchange rates. |
Net sales from existing businesses increased by $48.8 million, or 9.0%, during 2011 compared to 2010 due to an increase in demand in all end markets, except defense. The timing of sales and orders to customers in our defense end market, which we began including with marine end market sales and orders in 2012, vary from period to period due to the timing of specific ship programs. Net sales were positively impacted by the changes in foreign exchange rates during 2011 in comparison to 2010.
Orders, net of cancellations, from existing businesses increased during 2011 in comparison to 2010 due to increased demand in all end markets, except defense. Additionally, we experienced a decline in commercial marine order cancellations from $16.4 million during 2010 to $6.1 million in 2011 primarily due to the impact of improved economic conditions.
Segments
As discussed further above, the Company recorded pre-tax restructuringnow reports results in two reportable segments: gas and fluid handling and fabrication technology. The following tables summarize Net sales by reportable segment for each of the following periods:
| Year Ended December 31, | ||||||||
| Proforma | ||||||||
| 2012 | 2011 | |||||||
| (In millions) | ||||||||
| Gas and Fluid Handling | $ | 1,901.2 | $ | 1,757.1 | ||||
| Fabrication Technology | 2,012.7 | 2,082.0 | ||||||
| Total Net sales | $ | 3,913.9 | $ | 3,839.1 | ||||
The sales comparisons discussed above, for 2012 in comparison to 2011, are on a proforma basis (which excludes operations acquired in the Charter Acquisition for the first 12 days of each annual period presented). Sales comparisons for 2011 in comparison to 2010 represent the Net sales reported by Colfax for those periods as a proforma comparison is not considered meaningful for those periods. Further, cost information for Charter, ESAB and Howden is not available for 2011 under the presentation required by the Exchange Act and, as such, proforma discussions are limited to sales.
Gas and Fluid Handling
We design, manufacture, install and maintain gas- and fluid-handling products for use in a wide range of markets, including power generation, oil, gas and petrochemical, mining, marine (including defense) and general industrial and other. Our gas-handling products are principally marketed under the Howden brand name. Howden’s primary products are heavy-duty fans, rotary heat exchangers and compressors. The fans and heat exchangers are used in coal-fired and other related coststypes of $18.2 millionpower stations, both in combustion and emissions control applications, underground mines, steel sintering plants and other industrial facilities that require movement of large volumes of air in harsh applications. Howden’s compressors are mainly used in the oil, gas and petrochemical end market. Our fluid-handling products are marketed by Colfax Fluid Handling under a portfolio of brands including Allweiler, Baric, Fairmount Automation, Houttuin, Imo, LSC, COT-Puritech, Portland Valve, Tushaco, Warren and Zenith. Colfax Fluid Handling is a supplier of a broad range of fluid-handling products, including pumps, fluid-handling systems and controls, and specialty valves.
The following table summarizes the selected financial data for our gas- and fluid-handling segment:
| Year Ended December 31, | ||||||||||||
| 2012 | 2011 | 2010 | ||||||||||
| (Dollars in millions) | ||||||||||||
| Net sales | $ | 1,901.2 | $ | 693.4 | $ | 542.0 | ||||||
| Gross profit | 567.1 | 240.1 | 191.4 | |||||||||
| Gross profit margin | 29.8 | % | 34.6 | % | 35.3 | % | ||||||
| Restructuring and other related charges | $ | 8.7 | $ | 8.6 | $ | 5.8 | ||||||
| Selling, general and administrative expense | 412.6 | 142.7 | 112.8 | |||||||||
| Selling, general and administrative expense as a percentage of Net sales | 21.7 | % | 20.6 | % | 20.8 | % | ||||||
| Asbestos coverage litigation expense | $ | 13.0 | $ | 10.7 | $ | 13.2 | ||||||
| Segment operating income | 141.5 | 86.7 | 65.4 | |||||||||
| Segment operating income margin | 7.4 | % | 12.5 | % | 12.1 | % | ||||||
Year over year fluctuations for 2012 in comparison to 2011 for selected financial data are primarily due to the year ended December 31, 2009. As of December 31, 2009, we have reduced our company-wide workforce by 328 associates from December 31, 2008. Additionally, during 2009, approximately 630 associates participated in a German government-sponsored furlough program in which the government pays the wage-related costs for the portionaddition of the work week the associate is not working. Our agreement with the German works council allowing participationHowden operations. The $161.5 million sales growth due to existing businesses, as discussed and defined under “Sales, Orders and Backlog” above, during 2012 in the furlough program endscomparison to 2011 was primarily due to growth in February 2011. During 2009, we closed a repair facility in Aberdeen, NC and a production facility in Sanford, NC and moved the operations to two of our other facilities. We realized savings of approximately $17 million in 2009 from our restructuring activities implemented in 2009 and expect annualized savings of approximately $29 million in 2010. We continue to monitor our order rates and will adjust our manufacturing capacity and cost structure as demand warrants.
As further discussed above, Net sales increased by $151.4 million, or 27.9%, during 2011 compared to 2010 due to an increase in demand in all end markets, except defense. Gross profit margin for 2011 decreased compared to 2010 primarily due to lower gross margin associated with the year ended December 31, 2008 include a $4.1 million increase to legal reserves related to a non-asbestos legal matter that arose from the saleforemarket sales of Rosscor and subsequent repair of a product by a division of a subsidiary that was divested prior to our acquisition of the subsidiary. This legacy legal case was settledBaric during the third quarterperiod, partially offset by positive leverage of 2008.
Fabrication Technology
We formulate, develop, manufacture and actual defense costs expensedsupply consumable products and equipment for use in the period.
The following table below presentssummarizes the selected financial data for our fabrication technology segment:
Year Ended December 31. 2012 | ||||
| (Dollars in millions) | ||||
| Net sales | $ | 2,012.7 | ||
| Gross profit | 585.1 | |||
| Gross profit margin | 29.1 | % | ||
| Restructuring and other related charges | $ | 45.2 | ||
| Selling, general and administrative expense | 444.9 | |||
| Selling, general and administrative expense as a percentage of Net sales | 22.1 | % | ||
| Segment operating income | $ | 140.2 | ||
| Segment operating income margin | 7.0 | % | ||
The $40.7 million sales growth due to existing businesses, as discussed and defined under “Sales, Orders and Backlog” above, during 2012 in comparison to 2011 was primarily due to increased consumable and equipment sales in the Americas, Russia and the Middle East. Year over year comparison of the other selected financial data above is not practical, as further discussed above. Additionally, Gross profit and gross profit margin for 2012 were negatively impacted by acquisition-related inventory step-up expense of $18.7 million.
Gross Profit- Total Company
| Year Ended December 31, | ||||||||||||
| 2012 | 2011 | 2010 | ||||||||||
| (In millions) | ||||||||||||
| Gross profit | $ | 1,152.1 | $ | 240.1 | $ | 191.4 | ||||||
| Gross profit margin | 29.4 | % | 34.6 | % | 35.3 | % | ||||||
The $912.0 million increase in Gross profit during 2012 in comparison to 2011 was attributable to increases of $585.1 million in our fabrication technology segment and $326.9 million in our gas- and fluid-handling segment, which were primarily due to the Charter Acquisition.
The $48.7 million increase in Gross profit during 2011 in comparison to 2010 was attributable to increases of $20.0 million from existing businesses and $20.8 million due to the acquisitions of Rosscor and Baric. Additionally, changes in foreign exchange rates had a $7.9 million positive impact on Gross profit for 2011 in comparison to 2010. Gross profit margin for 2011 decreased compared to 2010 primarily due to the lower gross profit margin associated with the foremarket sales of Rosscor and Baric during the period, partially offset by positive leverage of fixed costs given substantially higher sales volume in 2011.
Operating Expenses - Total Company
| Year Ended December 31, | ||||||||||||
| 2012 | 2011 | 2010 | ||||||||||
| (In millions) | ||||||||||||
| Selling, general and administrative expense | $ | 895.5 | $ | 162.8 | $ | 133.5 | ||||||
| Selling, general and administrative expense as a percentage of Net sales | 22.9 | % | 23.5 | % | 24.6 | % | ||||||
| Charter acquisition-related expense | $ | 43.6 | $ | 31.1 | $ | — | ||||||
| Restructuring and other related charges | 60.1 | 9.7 | 10.3 | |||||||||
| Asbestos coverage litigation expense | 13.0 | 10.7 | 13.2 | |||||||||
Selling, general and administrative expense increased $732.7 million during 2012 in comparison to 2011 primarily due to the Charter Acquisition. The decrease in Selling, general and administrative expense as a percentage of Net sales during 2012 in comparison to 2011 resulted primarily from the benefit of higher sales volumes and efforts to reduce costs partially offset by $77.3 million of higher intangible amortization expense. During 2012, we incurred $12.5 million of increased advisory, legal, valuation and other professional service fees and losses on acquisition-related foreign exchange derivatives in connection with the Charter Acquisition in comparison to 2011.
Restructuring and other related charges increased significantly during 2012 in comparison to the comparable period of 2011, primarily as a result of the substantial cost reduction programs under way in the fabrication technology segment.
Selling, general and administrative expense increased $29.3 million during 2011 in comparison to 2010, $15.8 million of which resulted from the acquisitions of Rosscor, Baric and COT-Puritech. Selling, general and administrative expense from existing businesses increased primarily due to higher selling and commission costs and higher corporate overhead including the operation of two offices during the transition of our corporate headquarters to Maryland. Additionally, asbestos liability and defense income for the periods indicated:
| Year ended December 31, | ||||||||||||
| (Amounts in millions) | 2009 | 2008 | 2007 | |||||||||
| Asbestos liability and defense (income) | $ | (2.2 | ) | $ | (4.8 | ) | $ | (63.9 | ) | |||
| Year ended December 31, | ||||||||||||
| (Amounts in millions) | 2009 | 2008 | 2007 | |||||||||
| Asbestos coverage litigation expenses | $ | 11.7 | $ | 17.2 | $ | 13.6 | ||||||
| Backlog at | ||||||||||||||||||||||||
| (Amounts in millions) | Sales | Orders (1) | Period End (1) | |||||||||||||||||||||
| $ | % | $ | % | $ | % | |||||||||||||||||||
| Year ended December 31, 2007 | $ | 506.3 | $ | 589.0 | $ | 302.8 | ||||||||||||||||||
| Components of Change: | ||||||||||||||||||||||||
| Existing Businesses | 70.2 | 13.9 | % | 46.8 | 7.9 | % | 57.9 | 19.1 | % | |||||||||||||||
| Acquisitions | 5.5 | 1.1 | % | 11.7 | 2.0 | % | 15.2 | 5.0 | % | |||||||||||||||
| Foreign Currency Translation | 22.9 | 4.5 | % | 34.6 | 5.9 | % | (26.9 | ) | (8.9 | )% | ||||||||||||||
| Total | 98.6 | 19.5 | % | 93.1 | 15.8 | % | 46.2 | 15.3 | % | |||||||||||||||
| Year ended December 31, 2008 | $ | 604.9 | $ | 682.1 | $ | 349.0 | ||||||||||||||||||
| Components of Change: | ||||||||||||||||||||||||
| Existing Businesses | (48.8 | ) | (8.1 | )% | (198.0 | ) | (29.0 | )% | (66.8 | ) | (19.1 | )% | ||||||||||||
| Acquisitions | 1.0 | 0.2 | % | 1.4 | 0.2 | % | 0.7 | 0.2 | % | |||||||||||||||
| Foreign Currency Translation | (32.1 | ) | (5.3 | )% | (23.1 | ) | (3.4 | )% | 8.0 | 2.3 | % | |||||||||||||
| Total | (79.9 | ) | (13.2 | )% | (219.7 | ) | (32.2 | )% | (58.1 | ) | (16.6 | )% | ||||||||||||
| Year ended December 31, 2009 | $ | 525.0 | $ | 462.4 | $ | 290.9 | ||||||||||||||||||
| Year ended December 31, | ||||||||||||
| (Amounts in millions) | 2009 | 2008 | 2007 | |||||||||
| Net Sales by Product: | ||||||||||||
| Pumps, including aftermarket parts and service | $ | 443.1 | $ | 529.3 | $ | 441.7 | ||||||
| Systems, including installation service | 69.3 | 58.2 | 48.4 | |||||||||
| Valves | 10.1 | 10.1 | 9.5 | |||||||||
| Other | 2.5 | 7.3 | 6.7 | |||||||||
| Total net sales | $ | 525.0 | $ | 604.9 | $ | 506.3 | ||||||
| Year ended December 31, | ||||||||||||
| (Amounts in millions) | 2009 | 2008 | 2007 | |||||||||
| Gross profit | $ | 185.8 | $ | 217.2 | $ | 175.6 | ||||||
| Gross profit margin | 35.4 | % | 35.9 | % | 34.7 | % | ||||||
| Year ended December 31, | ||||||||||||
| (Amounts in millions) | 2009 Restated | 2008 Restated | 2007 Restated | |||||||||
| SG&A expenses | $ | 112.5 | $ | 124.1 | $ | 97.4 | ||||||
| SG&A expenses as a percentage of sales | 21.4 | % | 20.5 | % | 19.2 | % | ||||||
Interest Expense - Total Company
| Year Ended December 31, | ||||||||||||
| 2012 | 2011 | 2010 | ||||||||||
| (In millions) | ||||||||||||
| Interest expense | $ | 91.6 | $ | 5.9 | $ | 6.7 | ||||||
The increase in Interest expense during 2012 in comparison to 2011 was attributable to interest on the financing related to the Charter Acquisition. See “—Liquidity and Capital Resources—Borrowing Arrangements” below for additional discussion.
Provision for Income Taxes
During 2012, Income before income taxes was $48.4 million to $112.5 millionand the Provision for income taxes was $90.7 million. The provision was impacted by two significant items. Upon completion of the year ended December 31, 2009. ExcludingCharter Acquisition, certain deferred tax assets existing at that date were reassessed in light of the $6.1 million favorable impact of foreign exchange rates, SG&A declined $5.5 million from 2008, primarily duethe acquired businesses on expected future income or loss by country and future tax planning, including the impact of the post-acquisition capital structure. This assessment resulted in an increase in our valuation allowance to reductionsprovide full valuation allowances against U.S. deferred tax assets. The increased valuation allowances resulted in selling and commission expensesa non-cash increase in the Provision for income taxes for 2012 of $2.2 million and restructuring savings of $2.5$50.3 million. An additional $2.0In addition, $43.6 million of professional feesCharter acquisition-related expense and other costs associated with becoming a public companyincreased corporate overhead and $2.6 millionInterest expense reflected in the Consolidated Statement of pension and other postretirement benefit costsOperations are either non-deductible or were incurred in 2009, but were offset by lower legacy legal expenses and favorable changes injurisdictions where no tax benefit can be recognized. These two items are the fair valueprincipal cause of commodity and foreign currency derivatives.
| Year ended December 31, | ||||||||||||
| (Amounts in millions) | 2009 Restated | 2008 Restated | 2007 Restated | |||||||||
| Operating income | $ | 39.6 | $ | 17.8 | $ | 124.3 | ||||||
| Operating margin | 7.5 | % | 2.9 | % | 24.6 | % | ||||||
The effective income tax rate for the year ended December 31, 20092011 was 26.6%77.2% as compared to an effective tax rate of 91.1%41.4% for the year ended December 31, 2008.2010. Our effective tax rate for the year ended December 31, 2009 was lower than the U.S. federal statutory rate primarily due to international tax rates which are lower than the U.S. tax rate, including the impact of the reduction in 2009 of the Swedish tax rate from 28% to 26.3 % that is applied to our Swedish operations and a net decrease to our valuation allowance and unrecognized tax benefit liability.
Liquidity and Capital Resources
Overview
Historically, we have financed our capital and working capital requirements through a combination of cash flows from operating activities and borrowings under our bank credit facility.facilities (discussed below). Additionally, during the first quarter of 2012, we were successful in our efforts to raise additional funds in the form of debt and equity, as further discussed below. We expect that our primary ongoing requirements for cash will be for working capital, funding for potentialof acquisitions, capital expenditures, asbestos-related cash outflows and funding of our pension plan funding.plans. If additional funds are needed for strategic acquisitions or other corporate purposes, we believe we could raise additional funds in the form of debt or equity.
Equity Capital
In connection with the financing of the Charter Acquisition, on January 24, 2012, we sold to the BDT Investor (i) 14,756,945 shares of newly issued Colfax Common stock and (ii) 13,877,552 shares of newly created Series A perpetual convertible preferred stock, referred to as the Series A Preferred Stock, for an aggregate of $680 million (representing $24.50 per share of Series A Preferred Stock and $23.04 per share of Common stock) pursuant to a securities purchase agreement (the “BDT Purchase Agreement”) with the BDT Investor as well as BDT Capital Partners Fund I-A, L.P., and Mitchell P. Rales, Chairman of our Board of Directors, and his brother, Steven M. Rales (for the limited purpose of tag-along sales rights provided to the BDT Investor in the event of a sale or transfer of shares of our Common stock by either or both of Mitchell P. Rales and Steven M. Rales). Pursuant to the BDT Purchase Agreement, under the terms of the Series A Preferred Stock, holders are entitled to receive cumulative cash dividends, payable quarterly, at a per annum rate of 6% of the liquidation preference (defined as $24.50, subject to customary antidilution adjustments), provided that the dividend rate shall be increased to a per annum rate of 8% if Colfax fails to pay the full amount of any dividend required to be paid on such shares until the date that full payment is made.
The Series A Preferred Stock is convertible, in whole or in part, at the option of the holders at any time after the date the shares were issued into shares of Colfax Common stock at a conversion rate determined by dividing the liquidation preference by a number equal to 114% of the liquidation preference, subject to certain adjustments. The Series A Preferred Stock is also convertible, in whole or in part, at our option on or after the third anniversary of the issuance of the shares at the same conversion rate if, among other things: (i) for the preceding thirty trading days, the closing price of Colfax Common stock on the New York Stock Exchange exceeds 133% of the applicable conversion price and (ii) Colfax has declared and paid or set apart for payment all accrued but unpaid dividends on the Series A Preferred Stock.
On May 13, 2008, coincidingJanuary 24, 2012, we sold 2,170,139 shares of newly issued Colfax Common stock to each of Mitchell P. Rales and Steven M. Rales and 1,085,070 shares of newly issued Colfax Common stock to Markel Corporation (“Markel”) at $23.04 per share, for an aggregate of $125 million pursuant to separate securities purchase agreements with Mitchell P. Rales, Chairman of Colfax’s Board of Directors, and his brother Steven M. Rales, each of whom were beneficial owners of 20.9% of Colfax’s Common stock at the time of the sale, and Markel. Thomas S. Gayner, a member of Colfax’s Board of Directors, is President and Chief Investment Officer of Markel.
Consideration paid to Charter shareholders included 0.1241 shares of newly issued Colfax Common stock in exchange for each share of Charter’s ordinary stock, which resulted in the issuance of 20,735,493 shares of Common stock on January 24, 2012.
In conjunction with the issuance of the Common and Preferred stock discussed above, the Company recognized $14.7 million in equity issuance costs which were recorded as a reduction to Additional paid-in capital during 2012.
On March 5, 2012, we sold 8,000,000 shares of newly issued Common stock to underwriters for public resale pursuant to a shelf registration statement for an aggregate purchase price of $272 million. Further, on March 9, 2012, the underwriters of the March 5, 2012 equity offering exercised their over-allotment option and we sold an additional 1,000,000 shares of newly issued Common stock to the underwriters for public resale pursuant to a shelf registration statement for an aggregate purchase price of $34 million. In conjunction with these issuances, we recognized $12.6 million in equity issuance costs which were recorded as a reduction to Additional paid-in capital during 2012.
Borrowing Arrangements
We entered into the Deutsche Bank Credit Agreement on September 12, 2011. In connection with the closing of the IPO,Charter Acquisition, the Deutsche Bank Credit Agreement was amended on January 13, 2012 and we terminated our existingBank of America Credit Agreement (defined and further discussed below) as well as Charter’s outstanding indebtedness. The Deutsche Bank Credit Agreement has four tranches of term loans: (i) a $200 million term A-1 facility, (ii) a $500 million term A-2 facility, (iii) a €157.6 million term A-3 facility and (iv) a $900 million term B facility. In addition, the Deutsche Bank Credit Agreement has two revolving credit facility. Theresub-facilities which total $300 million in commitments (the “Revolver”). The Revolver includes a $200 million letter of credit sub-facility and a $50 million swingline loan sub-facility. The term A-1, term A-2, term A-3 and the Revolver variable-rate borrowings are subject to interest payments of LIBOR or EURIBOR plus a margin ranging from 2.50% to 3.25%, determined by our leverage ratio. Borrowings under the term B facility are also variable rate and are subject to interest payments of LIBOR plus a margin of 3.5%. The Revolver is subject to a commitment fee ranging from 37.5 to 50 basis points, determined by our leverage ratio. Additionally, as of December 31, 2012, there was an original issue discount of $55.4 million and deferred financing fees of $8.5 million, which will be accreted to Interest expense primarily using the effective interest method. As of December 31, 2012, the weighted-average interest rate on outstanding borrowings under the Deutsche Bank Credit Agreement was 3.93% and there was $291.9 million available under the Revolver, including $191.9 million available under the letter of credit sub-facility.
As of December 31, 2011, we were no material early termination penalties incurred asparty to a result of the termination. Deferred loan costs of $4.6 million were written off in connection with this termination. On the same day, we entered into a new credit agreement (the “Credit Agreement”). The Credit Agreement, led by Banc“Bank of America Securities LLCCredit Agreement”), led and administered by Bank of America, iswhich included a senior secured structure with a $150.0 million revolverrevolving credit facility and a Term A Noteterm credit facility. Upon the early termination of $100.0 million.
In connection with the Deutsche Bank Credit Agreement, we have pledged substantially all of a 2.25% margin. The Term A Note, as entered into on May 13, 2008, has $1.25 million due on a quarterly basis on the last day of each March, June, September and December beginning June 30, 2008 and ending March 31, 2010, $2.5 million due on a quarterly basis on the last day of each March, June, September and December beginning June 30, 2010 and ending March 31, 2013, and one installment of $60.0 million payable on May 13, 2013. On December 31, 2009, there was $91.3 million outstanding on the Term A Note.
Cash Flows
As of December 31, 2009,2012, we had approximately $136$482.4 million available on our $150of Cash and cash equivalents, an increase of $407.3 million revolving credit line. Present drawings underfrom $75.1 million as of December 31, 2011. The following table summarizes the credit line are letters of credit securing various obligations related to our business. The revolving credit line is provided by a consortium of financial institutions with varying commitment levels as show below (in millions):
| Amount | ||||
| Bank of America | $ | 32.4 | ||
| RBS Citizens | 14.4 | |||
| TD BankNorth | 14.4 | |||
| Wells Fargo | 14.4 | |||
| SunTrust Bank | 14.4 | |||
| Landesbank Baden-Wuerttemberg | 10.5 | |||
| DnB Nor Bank | 10.5 | |||
| HSBC | 10.5 | |||
| KeyBank | 10.5 | |||
| Carolina First Corp | 6.0 | |||
| UBS | 6.0 | |||
Lehman Brothers(1) | 6.0 | |||
| Total | $ | 150.0 | ||
| Year ended December 31, | ||||||||||||
| (Amounts in millions) | 2009 | 2008 | 2007 | |||||||||
| Net cash provided by (used in) operating activities | $ | 38.3 | $ | (33.0 | ) | $ | 74.5 | |||||
| Purchases of fixed assets | (11.0 | ) | (18.6 | ) | (13.7 | ) | ||||||
| Net cash paid for acquisitions | (1.3 | ) | (0.4 | ) | (33.0 | ) | ||||||
| Other sources, net | 0.3 | (0.1 | ) | 0.2 | ||||||||
| Net cash used in investing activities | $ | (12.0 | ) | $ | (19.1 | ) | $ | (46.5 | ) | |||
| Proceeds and repayments of borrowings, net | (5.0 | ) | (110.3 | ) | 14.7 | |||||||
| Net proceeds from IPO | - | 193.0 | - | |||||||||
| Dividends paid to preferred shareholders | - | (38.5 | ) | - | ||||||||
| Repurchases of common stock | - | (5.7 | ) | - | ||||||||
| Payments made for loan costs | - | (3.3 | ) | (1.4 | ) | |||||||
| Payment of deferred stock issuance costs | - | - | (1.2 | ) | ||||||||
| Other uses, net | (0.4 | ) | (0.4 | ) | (0.4 | ) | ||||||
| Net cash (used in) provided by financing activities | $ | (5.4 | ) | $ | 34.8 | $ | 11.7 | |||||
| Year Ended December 31, | ||||||||||||
| 2012 | 2011 | 2010 | ||||||||||
| (In millions) | ||||||||||||
| Net cash provided by operating activities | $ | 164.3 | $ | 57.2 | $ | 62.0 | ||||||
| Purchases of fixed assets, net | (83.2 | ) | (13.7 | ) | (12.4 | ) | ||||||
| Acquisitions, net of cash received | (1,859.6 | ) | (56.3 | ) | (28.0 | ) | ||||||
| Other sources, net | 1.8 | — | — | |||||||||
| Net cash used in investing activities | (1,941.0 | ) | (70.0 | ) | (40.4 | ) | ||||||
| Proceeds from (repayments of) borrowings, net | 1,159.8 | 29.0 | (8.8 | ) | ||||||||
| Proceeds from issuance of common stock, net | 756.8 | 3.7 | 0.9 | |||||||||
| Proceeds from issuance of preferred stock, net | 333.0 | — | — | |||||||||
| ESAB India repurchase of additional noncontrolling interest | (29.3 | ) | — | — | ||||||||
| Other sources (uses), net | (27.4 | ) | — | (0.1 | ) | |||||||
| Net cash provided by (used in) financing activities | 2,192.9 | 32.7 | (8.0 | ) | ||||||||
| Effect of exchange rates on Cash and cash equivalents | (8.9 | ) | (5.3 | ) | (3.0 | ) | ||||||
| Increase in Cash and cash equivalents | $ | 407.3 | $ | 14.6 | $ | 10.6 | ||||||
Cash flows from operating activities can fluctuate significantly from period to period asdue to changes in working capital needs,and the timing of payments for items such as asbestos-related cash flows, pension funding decisions and other items impact reported cash flows.
| Ÿ | Net cash received or paid for asbestos-related costs, net of insurance proceeds, including the disposition of claims, defense costs and legal expenses related to litigation against our insurers, creates variability in our operating cash flows. We had net cash outflows of $24.7 million, $7.9 million and $11.4 million for asbestos-related costs paid, net of insurance settlements received during 2012, 2011 and 2010, respectively. |
| Ÿ | Funding requirements of our defined benefit plans, including |
| Ÿ |
| Ÿ | Changes in net working capital also affected the operating cash flows for the |
There were significant cash outflows from investing activities consistassociated with the Charter Acquisition in 2012. The cash cost of the Charter Acquisition, net of cash acquired, was approximately $1.7 billion. During 2011, the acquisitions of Rosscor and COT-Puritech resulted in net cash outflows of $56.3 million. During 2010, we had cash outflows of $28.0 million related to the acquisition of Baric. Capital expenditures for 2012 of $83.6 million were significantly higher than $14.8 million and $12.5 million used in 2011 and 2010, respectively, due to the much larger scale of our operations in 2012.
Cash flows from financing activities in 2012 were also significantly impacted by the Charter Acquisition. As discussed above under “—Equity Capital,” we raised $805.0 million of cash from sales of our equity securities to the BDT Investor, Steven and Mitchell Rales and Markel in January 2012, and $293.4 million in a primary offering settled in March 2012. Also, as further discussed above under “—Borrowing Arrangements,” we borrowed approximately $1.7 billion of term loans, $70.3 million of which was repaid in 2012. The additional payment of borrowings under term loans of $455 million primarily represents the repayment of purchasesborrowings under our Bank of fixed assetsAmerica Credit Agreement, in conjunction with the financing of the Charter Acquisition. We also made cash payments for preferred stock dividends of $17.4 million.
Our cash flows from financing activities during 2012 were also impacted by a $29.3 million acquisition of shares in ESAB India Limited, a publicly traded, less than wholly owned subsidiary in which the Company acquired a controlling interest in the Charter Acquisition. This acquisition of shares was pursuant to a statutorily mandated tender offer triggered as a result of the Charter Acquisition.
Cash flows from financing activities during 2011 included net borrowings of $29.0 million, which were primarily related to the acquisitions of Rosscor and COT-Puritech.
See “—Borrowing Arrangements” above for additional information regarding our outstanding indebtedness as of December 31, 2012.
Our Cash and cash paid for acquisitions.
Contractual Obligations
The following table is a summary ofsummarizes our future contractual obligations as of December 31, 2009 (in millions):
| Total | Less than One Year | 1-3 Years | 3-5 Years | More Than 5 Years | ||||||||||||||||
Debt & Leases: | ||||||||||||||||||||
| Term Loan A | $ | 91.3 | $ | 8.8 | $ | 20.0 | $ | 62.5 | - | |||||||||||
Interest Payments on Long-Term Debt (1) | 10.9 | 4.7 | 5.6 | 0.6 | - | |||||||||||||||
| Capital Leases & Other Debt | 0.2 | 0.2 | - | - | - | |||||||||||||||
| Operating Leases | 9.8 | 3.9 | 4.1 | 1.6 | 0.2 | |||||||||||||||
Purchase Obligations (2) | 25.3 | 24.6 | 0.6 | - | 0.1 | |||||||||||||||
| Total | $ | 137.5 | $ | 42.2 | $ | 30.3 | $ | 64.7 | $ | 0.3 | ||||||||||
Less Than One Year | 1-3 Years | 3-5 Years | More Than 5 Years | Total | ||||||||||||||||
| (In millions) | ||||||||||||||||||||
| Debt | $ | 34.8 | $ | 204.9 | $ | 673.3 | $ | 870.7 | $ | 1,783.7 | ||||||||||
| Interest payments on debt(1) | 69.8 | 131.7 | 153.3 | 50.8 | 405.6 | |||||||||||||||
| Operating leases | 30.2 | 37.5 | 17.1 | 40.9 | 125.7 | |||||||||||||||
| Capital leases | 31.6 | 2.3 | — | — | 33.9 | |||||||||||||||
| Purchase obligations(2) | 359.8 | 20.1 | 0.3 | 0.4 | 380.6 | |||||||||||||||
| Total | $ | 526.2 | $ | 396.5 | $ | 844.0 | $ | 962.8 | $ | 2,729.5 | ||||||||||
__________
| Variable interest payments are estimated using a static rate of |
| Excludes open purchase orders for goods or services that are provided on demand, the timing of which is not certain. |
We have cash funding requirements associated with our pension and other post-retirement benefit plans as of December 31, 2012, which are estimated to be approximately $6.9$51.8 million for the year endingended December 31, 2010.2013. Other long-term liabilities, such as those for asbestos and other legal claims, employee benefit plan obligations, and deferred income taxes and liabilities for unrecognized income tax benefits, are excluded from the above table since they are not contractually fixed as to timing and amount.
Off-Balance Sheet Arrangements
We do not have any off-balance sheet arrangements that provide liquidity, capital resources, market or credit risk support that expose us to any liability that is not reflected in our consolidated financial statementsConsolidated Financial Statements other than outstanding letters of credit of $14.4$338.1 million and $59.7 million of bank guarantees at December 31, 20092012 and $125.7 million of future operating lease payments of $9.8 million.
The Company and its subsidiaries have in the past divested certain of its businesses and assets. In connection with these divestitures, certain representations, warranties and indemnities were made to purchasers to cover various risks or unknown liabilities. We cannot estimate the potential liability, if any, that may result from such representations, warranties and indemnities because they relate to unknown and unexpected contingencies; however, the Company doeswe do not believe that any such liabilities will have a material adverse effect on our financial condition, results of operations or liquidity.
Disclosure under Section 13(r)(1)(D)(iii) of the Exchange Act
During the fiscal year, a few of our independently operated foreign subsidiaries which we acquired in 2012 made the final shipments necessary to wind down four sales agreements involving parties identified in section 560.304 of title 31 of the Code of Federal Regulations. These foreign subsidiaries entered into the original sales agreements in the years before we acquired them. The shipments were made as part of our foreign subsidiaries’ voluntary withdrawal from the Iranian market, which was implemented as part of the foreign subsidiaries’ integration into our comprehensive international trade compliance program, which prohibits sales to Iran.
The transactions were conducted in accordance with economic sanctions statutes and regulations administered by the U.S. Department of the Treasury’s Office of Foreign Assets Controls, other U.S. statutes restricting trade with Iran, and with applicable local laws in Europe. As part of our effort to ensure our compliance with U.S. sanctions, the Company consulted with U.S. government personnel who administer certain Iranian sanctions prior to some of the shipments. The transactions did not involve U.S.-origin content and U.S. persons did not control, approve, facilitate or otherwise participate in the transactions. In addition, our foreign subsidiaries requested and obtained the required authorizations under local export control laws in Europe to complete the transactions. The gross revenue for each shipment was $653,718, $1,499,400, $2,527,797, and $5,524,525, with profit margins of 23.6% and 20.4% on the first two shipments and losses on the remaining two shipments. Colfax is committed to continuing to comply fully with all U.S. economic sanctions. As part of that commitment, all of the Company’s foreign subsidiaries have voluntarily withdrawn from selling into the Iranian market. As a result, neither Colfax nor any of its foreign subsidiaries intend to conduct any future shipments to Iran.
Critical Accounting Policies
The methods, estimates and judgments we use in applying our critical accounting policies have a significant impact on theour results we report in ourof operations and financial statements.position. We evaluate our estimates and judgments on an ongoing basis. Our estimates are based upon our historical experience, our evaluation of business and macroeconomic trends and information from other outside sources, as appropriate. Our experience and assumptions form the basis for our judgments about the carrying value of assets and liabilities that are not readily apparent from other sources. Actual results may vary from what our management anticipates and different assumptions or estimates about the future could changehave a material impact on our reported results.
We believe the following accounting policies are the most critical in that they are important to the financial statements and they require the most difficult, subjective or complex judgments in the preparation of the financial statements. For a detailed discussion on the application of these and other accounting policies, see Note 32, “Summary of Significant Accounting Policies” in the accompanying Notes to the Consolidated Financial Statements.
Asbestos Liabilities and Insurance Assets
Certain subsidiaries are each one of many defendants in a large number of lawsuits that claim personal injury as a result of exposure to asbestos from products manufactured with components that are alleged to have contained asbestos. Such components were acquired from third-party suppliers, and were not manufactured by any of ourthe Company’s subsidiaries nor were the subsidiaries producers or direct suppliers of asbestos. The manufactured products that are alleged to have contained asbestos generally were provided to meet the specifications of the subsidiaries’ customers, including the U.S. Navy.
| Year ended December 31, | ||||||||||||
| 2009 | 2008 | 2007 | ||||||||||
| Claims unresolved at the beginning of the period | 35,357 | 37,554 | 50,020 | |||||||||
Claims filed (2) | 3,323 | 4,729 | 6,861 | |||||||||
Claims resolved (3) | (13,385 | ) | (6,926 | ) | (19,327 | ) | ||||||
| Claims unresolved at the end of the period | 25,295 | 35,357 | 37,554 | |||||||||
Average cost of resolved claims (4) | $ | 11,106 | $ | 5,378 | $ | 5,232 | ||||||
We have projected each subsidiary’s future asbestos-related liability costs with regard to pending and future unasserted claims based upon the Nicholson methodology. The Nicholson methodology is thea standard approach used by most experts and has been accepted by numerous courts. This methodology is based upon risk equations, exposed population estimates, mortality rates, and other demographic statistics. In applying the Nicholson methodology for each subsidiary we performed: 1)(1) an analysis of the estimated population likely to have been exposed or claim to have been exposed to products manufactured by the subsidiaries based upon national studies undertaken of the population of workers believed to have been exposed to asbestos; 2) the use(2) a review of epidemiological and demographic studies to estimate the number of potentially exposed people that would be likely to develop asbestos-related diseases in each year; 3)(3) an analysis of the subsidiaries’ recent claims history to estimate likely filing rates for these diseases;diseases and 4)(4) an analysis of the historical asbestos liability costs to develop average values, which vary by disease type, jurisdiction and the nature of claim, to determine an estimate of costs likely to be associated with currently pending and projected asbestos claims. Our projections, based upon the Nicholson methodology, estimate both claims and the estimated cash outflows related to the resolution of such claims for periods up to and including the endpoint of asbestos studies referred to in item 2)(2) above. It is our policy to record a liability for asbestos-related liability costs for the longest period of time that we can reasonably estimate.
Projecting future asbestos-related liability costs is subject to numerous variables that are difficult to predict, including, among others, the number of claims that might be received, the type and severity of the disease alleged by each claimant, the latency period associated with asbestos exposure, dismissal rates, costs of medical treatment, the financial resources of other companies that are co-defendants in the claims, funds available in post-bankruptcy trusts, uncertainties surrounding the litigation process from jurisdiction to jurisdiction and from case to case, including fluctuations in the timing of court actions and rulings, and the impact of potential changes in legislative or judicial standards, including potential tort reform. Furthermore, any projections with respect to these variables are subject to even greater uncertainty as the projection period lengthens. These trend factors have both positive and negative effects on the dynamics of asbestos litigation in the tort system and the related best estimate of our asbestos liability, and these effects do not move in linear fashion but rather change over multiple year periods. Accordingly, we monitor these trend factors over time and periodically assesses whether an alternative forecast period is appropriate. Taking these factors into account and the inherent uncertainties, we believe that we can reasonably estimate the asbestos-related liability for pending and future claims that will be resolved in the next 15 years and hashave recorded that liability as our best estimate. While it is reasonably possible that the subsidiaries will incur costs after this period, we do not believe the reasonably possible loss or range of reasonably possible loss is estimable at the current time. Accordingly, no accrual has been recorded for any costs which may be paid after the next 15 years. Defense costs associated with asbestos-related liabilities as well as costs incurred related to litigation against the subsidiaries’ insurers are expensed as incurred.
We assessed the subsidiaries’ existing insurance arrangements and agreements, determinedestimated the applicability of insurance coverage for existing and expected future claims, analyzed publicly available information bearing on the current creditworthiness and solvency of the various insurers, and employed such insurance allocation methodologies as we believed appropriate to ascertain the probable insurance recoveries for asbestos liabilities. The analysis took into account self-insurance reserves,retentions, policy exclusions, pending litigation, liability caps and gaps in coverage, allocation agreements, indemnity arrangements with third-parties, existing and potential insolvencies of insurers as well as how legal and defense costs will be covered under the insurance policies.
Each subsidiary has separate insurance coverage resulting from the independent corporate historyacquired prior to our ownership of each independent entity. In our evaluation of the insurance asset, we useduse differing insurance allocation methodologies for each subsidiary based upon the stateapplicable law that will or is likely to apply for that subsidiary.
Management’s analyses are based on currently known facts and a number of assumptions. However, projecting future events, such as new claims to be filed each year, the average cost of resolving each claim, coverage issues among layers of insurers, the method in which losses will be allocated to the various insurance policies, interpretation of the effect on coverage of various policy terms and limits and their interrelationships, the continuing solvency of various insurance companies, the amount of remaining insurance available, as well as the numerous uncertainties inherent in asbestos litigation could cause the actual liabilities and insurance recoveries to be higher or lower than those projected or recorded which could materially affect our financial condition, results of operations or cash flow.
As of December 31, 2012, we had total asbestos liabilities, including current portion, of $434.0 million and total asbestos insurance assets, including current portion, of $394.8 million. See Note 16, “Commitments and Contingencies” in the accompanying Notes to Consolidated Financial Statements for additional information regarding our asbestos liabilities and insurance assets.
Retirement Benefits
Pension obligations and other post-retirement benefits are actuarially determined and are affected by several assumptions, including the discount rate, assumed annual rates of return on plan assets, and per capita cost of covered health care benefits. Changes in discount rate and differences from actual results for each assumption will affect the amounts of pension expense and other post-retirement expense recognized in future periods. These assumptions may also have an effect on the amount and timing of future cash contributions.
Impairment of Goodwill and Indefinite-Lived Intangible Assets
Goodwill represents the costs in excess of the fair value of net assets acquired associated with our acquisitions.
We evaluate the recoverability of goodwillGoodwill and indefinite-lived intangible assets annually on December 31 or more frequently if an event occurs or circumstances change in the interim that would more likely than not reduce the fair value of the asset below its carrying amount. Goodwill is considered to be impaired when the net book value of a reporting unit exceeds its estimated fair value.
In the evaluation of goodwillGoodwill for impairment, we first compareassess qualitative factors to determine whether it is more likely than not that the fair value of thea reporting unit toentity is less than its carrying value. If we determine that it is not likely for a reporting unit’s fair value to be less than its carrying value, a calculation of the fair value is not performed. If we determine that it is likely for a reporting unit’s fair value to be less than its carrying value, a calculation of the reporting entity’s fair value is performed and compared to the carrying value of that entity. If the carrying value of a reporting unit exceeds its fair value, the goodwillGoodwill of that reporting unit is potentially impaired and step two of the impairment analysis is performed. In step two of the analysis, an impairment loss is recorded equal to the excess of the carrying value of the reporting unit’s goodwillGoodwill over its implied fair value should such a circumstance arise.
We measure fair value of reporting units based on a present value of future discounted cash flows or a market valuation approach. The discounted cash flows model indicates the fair value of the reporting units based on the present value of the cash flows that the reporting units are expected to generate in the future. Significant estimates in the discounted cash flows model include: the weighted average cost of capital; long-term rate of growth and profitability of our business; and working capital effects. The market valuation approach indicates the fair value of the business based on a comparison of the Company against certain market information. Significant estimates in the market approach model include identifying appropriate market multiples and assessing earnings before interest, income taxes, depreciation and amortization (EBITDA) in estimating the fair value of the reporting units.
The analysisanalyses performed for eachas of the years ended December 31, 2009, 2008September 29, 2012, October 1, 2011 and 2007October 2, 2010 indicated no impairment to be present. However, actual results could differ from our estimates and projections, which would affect the assessment of impairment. As of December 31, 2009,2012, we have goodwillGoodwill of $163.4 million$2.1 billion that is subject to at least annual review of impairment.
Income Taxes
We account for income taxes under the asset and liability method, which requires that deferred tax assets and liabilities be recognized using enacted tax rates for the effect of temporary differences between the book and tax bases of recorded assets and liabilities. Deferred tax assets are reduced by a valuation allowance if it is more likely than not that some portion of the deferred tax asset will not be realized. In evaluating the need for a valuation allowance, we take into account various factors, including the expected level of future taxable income and available tax planning strategies. If actual results differ from the assumptions made in the evaluation of our valuation allowance, we record a change in valuation allowance through income tax expense in the period such determination is made.
During the year ending December 31, 2009,2012, the valuation allowance decreasedincreased from $45.2$79.9 million to $45.1 million with$372.0 million. The acquired Charter businesses operate in certain territories which have not historically been profitable or profitability is not expected in the decrease recognizednear term. As such, valuation allowances were established in income tax expense. The $0.1 million net decrease in 2009 was primarily attributable to a corresponding reduction inthe initial accounts where realization of deferred tax assets due towas not more likely than not. For Colfax, certain deferred tax assets existing at the pension restatement, offsetdate were reassessed in partlight of the impact of the acquired businesses on expected future income or loss by an increase attributable to certain separate company losses we believe may not be realized. Consideration was given to U.S.country and future tax planning, strategies and future U.S. taxable income as to how muchincluding the impact of the totalpost-acquisition capital structure. This assessment resulted in a $50.3 million increase in the Company’s valuation allowance to provide full valuation allowance against U.S. deferred tax asset could be realized on aassets.
In 2012, additional losses were recorded in territories, including the U.S., where full valuation allowances were established at the time of the Charter Acquisition. The more likely than not basis. If economic conditions adversely affectrealization standard was applied to these additional deferred tax assets and a full valuation allowance was provided.
Accounting Standards Codification 740, “Income Taxes” prescribes a recognition threshold and measurement attribute for a position taken in a tax return. Under this standard, we must presume the income tax position will be examined by a relevant tax authority and determine whether it is more likely than not that the income tax position will be sustained upon examination based on its technical merits. An income tax position that meets the more-likely-than-not recognition threshold is then measured to determine the amount of the benefit to be recognized in the financial statements. Liabilities for unrecognized income tax benefits are reviewed periodically and are adjusted as events occur that effect our abilityestimates, such as the availability of new information, the lapsing of applicable statutes of limitations, the conclusion of tax audits and, if applicable, the conclusion of any court proceedings. To the extent we prevail in matters for which liabilities for unrecognized tax benefits have been established or are required to generate future U.S. taxable income, additional valuation allowances may be needed.
Revenue Recognition
We recognize revenuesrevenue and costs from product sales under the completed contract method when all of the following criteria are met: persuasive evidence of an arrangement exists, the price is fixed or determinable, product delivery has occurred or services have been rendered, there are no further obligations to customers, and collectibility is probable. Product delivery occurs when title and risk of loss transfer to the customer. Our shipping terms vary based on the contract. If any significant obligations to the customer with respect to such sale remain to be fulfilled following shipment, typically involving obligations relating to installation and acceptance by the buyer, revenue recognition is deferred until such obligations have been fulfilled. Any customer allowances and discounts are recorded as a reduction in reported revenues at the time of sale because these allowances reflect a reduction in the purchasesales price for the products purchased.sold. These allowances and discounts are estimated based on historical experience and known trends. Revenue related to service agreements is recognized as revenue over the term of the agreement.
We follow this method when we can make reasonably dependable estimates of therecognize revenue and cost applicableof sales on gas-handling construction projects using the “percentage of completion method” in accordance with U.S. GAAP. Under this method, contract revenues are recognized over the performance period of the contract in direct proportion to the costs incurred as a percentage of total estimated costs for the entirety of the contract. Any recognized revenues that have not been billed to a customer are recorded as a component of Trade receivables and any billings of customers in excess of recognized revenues are recorded as a component of Accounts payable. As of December 31, 2012, there were $97.1 million of revenues in excess of billings and $178.3 million of billings in excess of revenues on construction contracts in the Consolidated Balance Sheet.
We have contracts in various stages of completion. Such contracts require estimates to determine the contract. Revisionsappropriate cost and revenue recognition. Significant management judgments and estimates, including estimated costs to complete projects, must be made and used in profitconnection with revenue recognized during each period. Current estimates may be revised as additional information becomes available. The revisions are reflectedrecorded in income in the period in which they are determined using the facts that gave rise to the revision become known and have historically been insignificant. Percentagecumulative catch-up method of completion revenue was approximately 2.2%, 0.9%, and 2.9% of consolidated revenues for the years ended December 31, 2009, 2008 and 2007, respectively. Service revenues are recognized as services are performed.
We maintain allowances for doubtful accounts for estimated losses resulting from the inability of our customers to make required payments. These allowances are based on recent trends of certain customers estimated to be a greater credit risk as well as general trends of the entire pool of customers. The allowance for doubtful accounts was $2.8$16.5 million and $2.5$2.6 million as of December 31, 20092012 and 2008,2011, respectively. If the financial condition of our customers were to deteriorate, resulting in an impairment of their ability to make payments, additional allowances maycould be required.
Recently Issued Accounting Pronouncements
For purposes of calculating stock-based compensation, the fair value of restricted stock or restricted stock units granted is equal to the market value of a share of common stock on the date of the grant. For grants that were awarded on May 7, 2008 in conjunction with our initial public offering, we used the initial public offering price as the fair value of the restricted stock and restricted stock units granted. For stock options, we estimate the fair value on the date of grant using the Black-Scholes option-pricing model. The determination of fair value using the Black-Scholes model requires a number of complex and subjective variables. One key input into the model is the fair value of our common stock on the date of grant, the initial public offering price in the case of stock optionsdetailed information regarding recently issued on May 7, 2008. Other key variables in the Black-Scholes option-pricing model include the expected volatility of our common stock price, the expected term of the award and the risk-free interest rate. In addition, we are required to estimate forfeitures of unvested awards when recognizing compensation expense. Significant assumptions used to calculate stock-based compensation during the years ended December 31, 2009 and 2008 were a stock price volatility of 32.5% and 32.4%, respectively, an expected option life of 4.5 years, a risk-free interest rate based on the 5-year treasury note yield on the date of grant ranging from 1.9% to 2.5% in 2009 and 2.5 % to 3.1% in 2008 and a 0% expected dividend yield.
Item 7A.Quantitative and Qualitative Disclosures About Market Risk
We are exposed to market risk from changes in short-term interest rates, foreign currency exchange rates and commodity prices that could impact our results of operations and financial condition. We address our exposure to these risks through our normal operating and financing activities.
Interest Rate Risk
We are subject to exposure from changes in short-term interest rates basedrelated to interest payments on our financing activities.borrowing arrangements. Under our credit facility,the Deutsche Bank Credit Agreement, all of our borrowings atas of December 31, 20092012 are variable ratevariable-rate facilities based on LIBOR or EURIBOR. In order to mitigate our interest rate risk, we periodically enter into interest rate swap or collar agreements. A hypothetical increase in the interest rate of 1.00% during 2009 on our variable rate debt that is not hedged would have increased our interest costInterest expense by approximately $0.2 million.
Exchange Rate Risk
We have manufacturing sites throughout the world and sell our products globally. As a result, we are exposed to movements in the exchange rates of various currencies against the U.S. dollar and against the currencies of other countries in which we manufacture and sell products and services. During 2009,2012, approximately 66%80% of our sales were derived from operations outside the U.S., We have significant manufacturing operations in European countries that are not part of the Eurozone. Sales revenues are more highly weighted toward the Euro and U.S. dollar. We also have significant contractual obligations, as discussed above, in U.S. dollars that are met with approximately 63% generatedcash flows in other currencies as well as U.S. dollars. To better match revenue and expense as well as cash needs from contractual liabilities, we regularly enter into cross currency swaps and forward contracts.
We also face exchange rate risk from our investments in subsidiaries owned and operated in foreign countries. The €157.6 million term A-3 facility under the Deutsche Bank Credit Agreement (the “Term Loan A-3”), discussed above, provides a natural hedge to a portion of our European operations.net asset position. The effect of a change in currency exchange rates on our net investment in international subsidiaries, net of the translation effect of the Company’s Term Loan A-3, is reflected in the Accumulated other comprehensive loss component of Equity. A 10% depreciation in major currencies, relative to the U.S. dollar as of December 31, 2012 (net of the translation effect of our Term Loan A-3) would result in a reduction in Equity of approximately $120 million.
We also face exchange rate risk from transactions with customers in countries outside the U.S. and from intercompany transactions between affiliates. Although we use the U.S dollar as our functional currency for reporting purposes, we have manufacturing sites throughout the world and a substantial portion of our costs are incurred and sales are generated in foreign currencies. Costs incurred and sales recorded by subsidiaries operating outside of the U.S. are translated into U.S. dollars using exchange rates effective during the respective period. As a result, we are exposed to movements in the exchange rates of various currencies against the U.S. dollar. In particular, we havethe Company has more sales in European currencies than we haveit has expenses in those currencies. Therefore,Although a significant portion of this difference is hedged, when European currencies strengthen or weaken against the U.S. dollar, operating profits are increased or decreased, respectively. To assist with
We have generally accepted the matchingexposure to exchange rate movements without using derivative financial instruments to manage this risk. Both positive and negative movements in currency exchange rates against the U.S. dollar will therefore continue to affect the reported amount of revenues and expenses andsales, profit, assets and liabilities in foreign currencies, we may periodically enter into derivative instruments such as cross currency swaps or forward contracts. To illustrate the potential impact of changes in foreign currency exchange rates, assuming a 10% increase in average foreign exchange rates compared to the U.S. dollar, 2009 income before income taxes would have increased by $3.1 million.
Commodity Price Risk
We are exposed to changes in the prices of raw materials used in our production processes. Commodity futures contracts are periodically used to manage such exposure. As of December 31, 2009,2012, we had no open commodity futures contracts.
See Note 14, “Financial Instruments and Fair Value Measurements” in our Notes to Consolidated Financial Statements included in this Form 10-K for additional information regarding our derivative instruments.
Item 8.Financial Statements and Supplementary Data
INDEX TO THE CONSOLIDATED FINANCIAL STATEMENTS
Page | ||
| Report of | ||
| 44 | ||
| Report of | – Consolidated Financial Statements | 45 |
| Consolidated Statements of Operations | 46 | |
| Consolidated Statements of Comprehensive Loss | 47 | |
| Consolidated Balance Sheets | ||
| 48 | ||
| Consolidated Statements of | ||
| 49 | ||
| Consolidated Statements of Cash Flows | ||
| 50 | ||
| Notes to Consolidated Financial Statements | 51 | |
| Note 1. Organization and Nature of Operations | ||
| Note 2. Summary of Significant Accounting Policies | 51 | |
| Note 3. Recently Issued Accounting Pronouncements | 56 | |
| Note 4. Acquisitions | 56 | |
| Note 5. Net (Loss) Income Per Share | 59 | |
| Note 6. Income Taxes | 60 | |
| Note 7. Goodwill and Intangible Assets | 63 | |
| Note 8. Property, Plant and Equipment, Net | 64 | |
| Note 9. Inventories, Net | 64 | |
| Note 10. Debt | 64 | |
| Note 11. Equity | 66 | |
| Note 12. Accrued Liabilities | 69 | |
| Note 13. Defined Benefit Plans | 71 | |
| Note 14. Financial Instruments and Fair Value Measurements | 78 | |
| Note 15. Concentration of Credit Risk | 81 | |
| Note 16. Commitments and Contingencies | 82 | |
| Note 17. Segment Information | 85 | |
| Note 18. Selected Quarterly Data—(unaudited) | 87 |
| 43 |
Report of Ernst & Young LLP, Independent Registered Public Accounting Firm
Internal Control Over Financial Reporting
The Board of Directors and Shareholders of Colfax Corporation
We have audited Colfax Corporation’s internal control over financial reporting as of December 31, 2009,2012, based on criteria established in Internal Control—Integrated Framework issued by the Committee of Sponsoring Organizations of the Treadway Commission (the COSO criteria). Colfax Corporation’s management is responsible for maintaining effective internal control over financial reporting, and for its assessment of the effectiveness of internal control over financial reporting included in the accompanying Management’s Annual Report on Internal Control overOver Financial Reporting. Our responsibility is to express an opinion on the company’s internal control over financial reporting based on our audit.
We conducted our audit in accordance with the standards of the Public Company Accounting Oversight Board (United States). Those standards require that we plan and perform the audit to obtain reasonable assurance about whether effective internal control over financial reporting was maintained in all material respects. Our audit included obtaining an understanding of internal control over financial reporting, assessing the risk that a material weakness exists, testing and evaluating the design and operating effectiveness of internal control based on the assessed risk, and performing such other procedures as we considered necessary in the circumstances. We believe that our audit provides a reasonable basis for our opinion.
A company’s internal control over financial reporting is a process designed to provide reasonable assurance regarding the reliability of financial reporting and the preparation of financial statements for external purposes in accordance with generally accepted accounting principles. A company’s internal control over financial reporting includes those policies and procedures that (1) pertain to the maintenance of records that, in reasonable detail, accurately and fairly reflect the transactions and dispositions of the assets of the company; (2) provide reasonable assurance that transactions are recorded as necessary to permit preparation of financial statements in accordance with generally accepted accounting principles, and that receipts and expenditures of the company are being made only in accordance with authorizations of management and directors of the company; and (3) provide reasonable assurance regarding prevention or timely detection of unauthorized acquisition, use, or disposition of the company’s assets that could have a material effect on the financial statements.
Because of its inherent limitations, internal control over financial reporting may not prevent or detect misstatements. Also, projections of any evaluation of effectiveness to future periods are subject to the risk that controls may become inadequate because of changes in conditions, or that the degree of compliance with the policies or procedures may deteriorate.
As indicated in the accompanying Management’s Annual Report on Internal Control Over Financial Reporting listed in the Index at Item 9A, management’s assessment of and conclusion on the effectiveness of internal control over financial reporting did not include the internal controls of Charter and Soldex, which are included in the 2012 consolidated financial statements of Colfax Corporation and collectively constituted 81% and 86% of total and net assets, respectively, as of December 31, 2012 and 83% of net sales for the year then ended. Our audit of internal control over financial reporting of Colfax Corporation also did not include an evaluation of the internal control over financial reporting of Charter and Soldex.
In our report dated February 25, 2010, we expressed an unqualified opinion, that the CompanyColfax Corporation maintained, in all material respects, effective internal control over financial reporting as of December 31, 2009,2012, based on the COSO criteria. Management has subsequently determined that a deficiency in controls relating to the maintenance and review of pension plan participant data existed as of the previous assessment date, and has further concluded that such deficiency represented a material weakness as of December 31, 2009. As a result, management has revised its assessment, as presented in the accompanying Management’s Report on Internal Control over Financial Reporting, to conclude that the Company’s internal control over financial reporting was not effective as of December 31, 2009. Accordingly, our present opinion on the effectiveness of the Company’s internal control over financial reporting as of December 31, 2009, as expressed herein, is different from that expressed in our previous report.
We also have also audited, in accordance with the standards of the Public Company Accounting Oversight Board (United States), the consolidated balance sheets of Colfax Corporation as of December 31, 20092012 and 20082011, and the related consolidated statements of income, shareholder’soperations and comprehensive loss, equity, (deficit) and cash flows for each of the three years in the period endingended December 31, 2009. This material weakness was considered in determining the nature, timing,2012 of Colfax Corporation and extent of audit tests applied in our audit of the 2009 financial statements and this report does not affect our report dated February 25, 2010, except for the effects of the matters described in Note 2, as to which the date is December 13, 2010, on those financial statements (as restated).
/s/ Ernst & Young LLP
Baltimore, Maryland
February 25, 2010
Report of Ernst & Young LLP, Independent Registered Public Accounting Firm
Consolidated Financial Statements
The Board of Directors and Shareholders of Colfax Corporation
We have audited the accompanying consolidated balance sheets of Colfax Corporation as of December 31, 20092012 and 2008,2011, and the related consolidated statements of income, shareholders’operations and comprehensive loss, equity, (deficit), and cash flows for each of the three years in the period ended December 31, 2009.2012. Our audits also included the financial statement schedule listed in the Index at Item 15(a).15. These financial statements and schedule are the responsibility of the Company’sCompany's management. Our responsibility is to express an opinion on these consolidated financial statements and schedule based on our audits.
We conducted our audits in accordance with the standards of the Public Company Accounting Oversight Board (United States). Those standards require that we plan and perform the audit to obtain reasonable assurance about whether the financial statements are free of material misstatement. An audit includes examining, on a test basis, evidence supporting the amounts and disclosures in the financial statements. An audit also includes assessing the accounting principles used and significant estimates made by management, as well as evaluating the overall financial statement presentation. We believe that our audits provide a reasonable basis for our opinion.
In our opinion, the financial statements referred to above present fairly, in all material respects, the consolidated financial position of Colfax Corporation at December 31, 20092012 and 2008,2011, and the consolidated results of its operations and its cash flows for each of the three years in the period ended December 31, 2009,2012, in conformity with U.S. generally accepted accounting principles. Also, in our opinion, the related financial statement schedule, when considered in relation to the basic financial statements taken as a whole, presents fairly in all material respects the information set forth therein.
We also have audited, in accordance with the standards of the Public Company Accounting Oversight Board (United States), Colfax Corporation’s internal control over financial reporting as of December 31, 2009,2012, based on criteria established in Internal Control—IntegratedControl-Integrated Framework issued by the Committee of Sponsoring Organizations of the Treadway Commission and our report dated February 25, 2010, except for the effects of the material weakness described in the sixth paragraph of that report, as to which the date is December 13, 2010,18, 2013 expressed an adverseunqualified opinion thereon.
/s/ Ernst & Young LLP
Baltimore, Maryland
February 25, 2010
COLFAX CORPORATION
CONSOLIDATED STATEMENTS OF OPERATIONS
(In thousands, except per share amountsamounts)
| Year Ended December 31, | ||||||||||||
| 2012 | 2011 | 2010 | ||||||||||
| Net sales | $ | 3,913,856 | $ | 693,392 | $ | 541,987 | ||||||
| Cost of sales | 2,761,731 | 453,293 | 350,579 | |||||||||
| Gross profit | 1,152,125 | 240,099 | 191,408 | |||||||||
| Selling, general and administrative expense | 895,452 | 162,761 | 133,507 | |||||||||
| Charter acquisition-related expense | 43,617 | 31,052 | — | |||||||||
| Restructuring and other related charges | 60,060 | 9,680 | 10,323 | |||||||||
| Asbestos coverage litigation expense | 12,987 | 10,700 | 13,206 | |||||||||
| Operating income | 140,009 | 25,906 | 34,372 | |||||||||
| Interest expense | 91,570 | 5,919 | 6,684 | |||||||||
| Income before income taxes | 48,439 | 19,987 | 27,688 | |||||||||
| Provision for income taxes | 90,703 | 15,432 | 11,473 | |||||||||
| Net (loss) income | (42,264 | ) | 4,555 | 16,215 | ||||||||
| Less: income attributable to noncontrolling interest, net of taxes | 22,138 | — | — | |||||||||
| Net (loss) income attributable to Colfax Corporation | (64,402 | ) | 4,555 | 16,215 | ||||||||
| Dividends on preferred stock | 18,951 | — | — | |||||||||
| Net (loss) income available to Colfax Corporation common shareholders | $ | (83,353 | ) | $ | 4,555 | $ | 16,215 | |||||
| Net (loss) income per share – basic and diluted | $ | (0.92 | ) | $ | 0.10 | $ | 0.37 | |||||
See Notes to Consolidated Financial Statements.
| 46 |
| Year ended December 31, | ||||||||||||
| 2009 | 2008 | 2007 | ||||||||||
| Restated | Restated | Restated | ||||||||||
| Net sales | $ | 525,024 | $ | 604,854 | $ | 506,305 | ||||||
| Cost of sales | 339,237 | 387,667 | 330,714 | |||||||||
| Gross profit | 185,787 | 217,187 | 175,591 | |||||||||
| Selling, general and administrative expenses | 112,503 | 124,105 | 97,426 | |||||||||
| Restructuring and other related charges | 18,175 | - | - | |||||||||
| Initial public offering related costs | - | 57,017 | - | |||||||||
| Research and development expenses | 5,930 | 5,856 | 4,162 | |||||||||
| Asbestos liability and defense income | (2,193 | ) | (4,771 | ) | (63,978 | ) | ||||||
| Asbestos coverage litigation expenses | 11,742 | 17,162 | 13,632 | |||||||||
| Operating income | 39,630 | 17,818 | 124,349 | |||||||||
| Interest expense | 7,212 | 11,822 | 19,246 | |||||||||
| Income before income taxes | 32,418 | 5,996 | 105,103 | |||||||||
| Provision for income taxes | 8,621 | 5,465 | 39,457 | |||||||||
| Net income | 23,797 | 531 | 65,646 | |||||||||
| Dividends on preferred stock | - | (3,492 | ) | (25,816 | ) | |||||||
| Net income (loss) available to common shareholders | $ | 23,797 | $ | (2,961 | ) | $ | 39,830 | |||||
| Net income (loss) per share—basic and diluted | $ | 0.55 | $ | (0.08 | ) | $ | 1.82 | |||||
COLFAX CORPORATION
| December 31, | ||||||||
| 2009 | 2008 | |||||||
| Restated | Restated | |||||||
| ASSETS | ||||||||
| CURRENT ASSETS: | ||||||||
| Cash and cash equivalents | $ | 49,963 | $ | 28,762 | ||||
| Trade receivables, less allowance for doubtful accounts of $2,837 and $2,486 | 88,493 | 101,064 | ||||||
| Inventories, net | 71,150 | 80,327 | ||||||
| Deferred income taxes, net | 7,114 | 6,489 | ||||||
| Asbestos insurance asset | 31,502 | 26,473 | ||||||
| Asbestos insurance receivable | 28,991 | 36,371 | ||||||
| Prepaid expenses | 11,109 | 9,632 | ||||||
| Other current assets | 2,426 | 5,901 | ||||||
| Total current assets | 290,748 | 295,019 | ||||||
| Deferred income taxes, net | 51,838 | 53,372 | ||||||
| Property, plant and equipment, net | 92,090 | 92,090 | ||||||
| Goodwill | 163,418 | 161,694 | ||||||
| Intangible assets, net | 11,952 | 13,516 | ||||||
| Long-term asbestos insurance asset | 357,947 | 277,542 | ||||||
| Long-term asbestos insurance receivable | 16,876 | - | ||||||
| Deferred loan costs, pension and other assets | 14,532 | 14,317 | ||||||
| Total assets | $ | 999,401 | $ | 907,550 | ||||
| LIABILITIES AND SHAREHOLDERS’ EQUITY | ||||||||
| CURRENT LIABILITIES: | ||||||||
| Current portion of long-term debt and capital leases | $ | 8,969 | $ | 5,420 | ||||
| Accounts payable | 36,579 | 52,138 | ||||||
| Accrued asbestos liability | 34,866 | 28,574 | ||||||
| Accrued payroll | 17,756 | 19,162 | ||||||
| Accrued taxes | 2,154 | 11,457 | ||||||
| Accrued termination benefits | 9,473 | - | ||||||
| Other accrued liabilities | 34,402 | 37,535 | ||||||
| Total current liabilities | 144,199 | 154,286 | ||||||
| Long-term debt, less current portion | 82,516 | 91,701 | ||||||
| Long-term asbestos liability | 408,903 | 328,684 | ||||||
| Pension and accrued post-retirement benefits | 105,230 | 110,218 | ||||||
| Deferred income tax liability | 10,375 | 7,685 | ||||||
| Other liabilities | 31,353 | 33,601 | ||||||
| Total liabilities | 782,576 | 726,175 | ||||||
| Shareholders’ equity: | ||||||||
| Common stock: $0.001 par value; authorized 200,000,000; issued and outstanding 43,229,104 and 43,211,026 | 43 | 43 | ||||||
| Additional paid-in capital | 402,852 | 400,259 | ||||||
| Retained deficit | (76,273 | ) | (100,070 | ) | ||||
| Accumulated other comprehensive loss | (109,797 | ) | (118,857 | ) | ||||
| Total shareholders’ equity | 216,825 | 181,375 | ||||||
| Total liabilities and shareholders' equity | $ | 999,401 | $ | 907,550 | ||||
CONSOLIDATED STATEMENTS OF SHAREHOLDERS’ EQUITY ANDCOMPREHENSIVE LOSS
(In thousands)
| Year Ended December 31, | ||||||||||||
| 2012 | 2011 | 2010 | ||||||||||
| Net (loss) income attributable to Colfax Corporation | $ | (64,402 | ) | $ | 4,555 | $ | 16,215 | |||||
| Other comprehensive income (loss): | ||||||||||||
| Foreign currency translation, net of tax of $(304), $(18), and $(1,224) | 117,703 | (11,465 | ) | (8,260 | ) | |||||||
| Unrealized loss on hedging activities, net of tax of $632, $0, and $0 | (4,008 | ) | (161 | ) | (1,201 | ) | ||||||
| Changes in unrecognized pension and other post-retirement benefits cost, net of tax of $(5,835), $(654), and $(1,717) | (91,495 | ) | (34,291 | ) | (18,690 | ) | ||||||
| Amounts reclassified to net (loss) income: | ||||||||||||
| Realized loss on hedging activities, net of tax of $0, $0, and $0 | 471 | 1,479 | 2,447 | |||||||||
| Pension and other post-retirement benefit cost, net of tax of $256, $114, and $89 | 8,557 | 4,160 | 4,986 | |||||||||
| Other comprehensive income (loss) | 31,228 | (40,278 | ) | (20,718 | ) | |||||||
| Less: other comprehensive income attributable to noncontrolling interest, net of tax of $0, $0 and $0 | 4,385 | — | — | |||||||||
| Other comprehensive income (loss) attributable to Colfax Corporation | 26,843 | (40,278 | ) | (20,718 | ) | |||||||
| Comprehensive loss attributable to Colfax Corporation common shareholders | $ | (37,559 | ) | $ | (35,723 | ) | $ | (4,503 | ) | |||
See Notes to Consolidated Financial Statements.
| 47 |
Preferred Stock | Common Stock | Additional Paid-In Capital | Retained Deficit (Restated) | Accumulated Other Comprehensive Loss (Restated) | Total (Restated) | |||||||||||||||||||
| Balance as previously reported at December 31, 2006 | $ | 1 | $ | 22 | $ | 201,660 | $ | (141,561 | ) | $ | (54,223 | ) | $ | 5,899 | ||||||||||
| Cumulative adjustment for restatement (see Note 2) | 11,365 | 1,751 | 13,116 | |||||||||||||||||||||
| Restated Balance at December 31, 2006 | 1 | 22 | 201,660 | (130,196 | ) | (52,472 | ) | 19,015 | ||||||||||||||||
| Comprehensive income: | ||||||||||||||||||||||||
| Net income | - | - | - | 65,646 | - | 65,646 | ||||||||||||||||||
| Foreign currency translation, net of $265 tax expense | - | - | - | - | 8,952 | 8,952 | ||||||||||||||||||
| Changes in unrecognized pension and postretirement benefit costs, net of $4,158 tax expense | - | - | - | - | 3,900 | 3,900 | ||||||||||||||||||
| Amounts reclassified to net income: | ||||||||||||||||||||||||
| Net realized investment gains, net of $409 tax benefit | - | - | - | - | (667 | ) | (667 | ) | ||||||||||||||||
| Net pension and other postretirement benefit costs, net of $1,590 tax expense | - | - | - | - | 2,149 | 2,149 | ||||||||||||||||||
| Total comprehensive income | - | - | - | 65,646 | 14,334 | 79,980 | ||||||||||||||||||
| Adoption of new accounting standard (see Note 6) | - | - | - | (6,743 | ) | - | (6,743 | ) | ||||||||||||||||
| Preferred dividends declared | - | - | - | (25,816 | ) | - | (25,816 | ) | ||||||||||||||||
| Balance at December 31, 2007 | 1 | 22 | 201,660 | (97,109 | ) | (38,138 | ) | 66,436 | ||||||||||||||||
| Comprehensive income (loss): | ||||||||||||||||||||||||
| Net income | - | - | - | 531 | - | 531 | ||||||||||||||||||
| Foreign currency translation, net of $-0- tax | - | - | - | - | (10,662 | ) | (10,662 | ) | ||||||||||||||||
| Unrealized losses on hedging activities, net of $-0- tax | - | - | - | - | (5,815 | ) | (5,815 | ) | ||||||||||||||||
| Changes in unrecognized pension and postretirement benefit costs, net of $1,731 tax benefit | - | - | - | - | (67,630 | ) | (67,630 | ) | ||||||||||||||||
| Amounts reclassified to net income: | ||||||||||||||||||||||||
| Losses on hedging activities, net of $-0- tax | - | - | - | - | 766 | 766 | ||||||||||||||||||
| Net pension and other postretirement benefit costs, net of $128 tax expense | - | - | - | - | 2,622 | 2,622 | ||||||||||||||||||
| Total comprehensive loss | - | - | - | 531 | (80,719 | ) | (80,188 | ) | ||||||||||||||||
| Net proceeds from initial public offering and conversion of preferred stock | (1 | ) | 22 | 192,999 | - | - | 193,020 | |||||||||||||||||
| Stock repurchase | - | (1 | ) | (5,730 | ) | - | - | (5,731 | ) | |||||||||||||||
| Stock-based compensation | - | - | 11,330 | - | - | 11,330 | ||||||||||||||||||
| Preferred dividends declared | - | - | - | (3,492 | ) | - | (3,492 | ) | ||||||||||||||||
| Balance at December 31, 2008 | - | 43 | 400,259 | (100,070 | ) | (118,857 | ) | 181,375 | ||||||||||||||||
| Comprehensive income: | ||||||||||||||||||||||||
| Net income | - | - | - | 23,797 | - | 23,797 | ||||||||||||||||||
| Foreign currency translation, net of $7 tax benefit | - | - | - | - | 5,401 | 5,401 | ||||||||||||||||||
| Unrealized gains on hedging activities, net of $-0- tax | - | - | - | - | (866 | ) | (866 | ) | ||||||||||||||||
| Changes in unrecognized pension and postretirement benefit costs, net of $572 tax benefit | - | - | - | - | (910 | ) | (910 | ) | ||||||||||||||||
| Amounts reclassified to net income: | ||||||||||||||||||||||||
| Losses on hedging activities, net of $-0- tax | - | - | - | - | 2,881 | 2,881 | ||||||||||||||||||
| Net pension and other postretirement benefit costs, net of $1,438 tax expense | - | - | - | - | 2,554 | 2,554 | ||||||||||||||||||
| Total comprehensive income | - | - | - | 23,797 | 9,060 | 32,857 | ||||||||||||||||||
| Stock-based compensation | - | - | 2,593 | - | - | 2,593 | ||||||||||||||||||
| Balance at December 31, 2009 | $ | - | $ | 43 | $ | 402,852 | $ | (76,273 | ) | $ | (109,797 | ) | $ | 216,825 | ||||||||||
COLFAX CORPORATION
CONSOLIDATED BALANCE SHEETS
(In thousands, except share data)
| December 31, | ||||||||
| 2012 | 2011 | |||||||
| ASSETS | ||||||||
| CURRENT ASSETS: | ||||||||
| Cash and cash equivalents | $ | 482,449 | $ | 75,108 | ||||
| Trade receivables, less allowance for doubtful accounts of $16,464 and $2,578 | 873,382 | 117,475 | ||||||
| Inventories, net | 493,649 | 56,136 | ||||||
| Other current assets | 281,302 | 102,489 | ||||||
| Total current assets | 2,130,782 | 351,208 | ||||||
| Property, plant and equipment, net | 688,570 | 90,939 | ||||||
| Goodwill | 2,074,230 | 204,844 | ||||||
| Intangible assets, net | 779,049 | 41,029 | ||||||
| Other assets | 457,096 | 400,523 | ||||||
| Total assets | $ | 6,129,727 | $ | 1,088,543 | ||||
| LIABILITIES AND EQUITY | ||||||||
| CURRENT LIABILITIES: | ||||||||
| Current portion of long-term debt | $ | 34,799 | $ | 10,000 | ||||
| Accounts payable | 699,626 | 54,035 | ||||||
| Accrued liabilities | 441,033 | 176,007 | ||||||
| Total current liabilities | 1,175,458 | 240,042 | ||||||
| Long-term debt, less current portion | 1,693,512 | 101,518 | ||||||
| Other liabilities | 1,104,471 | 557,708 | ||||||
| Total liabilities | 3,973,441 | 899,268 | ||||||
| Equity: | ||||||||
| Preferred stock, $0.001 par value; 20,000,000 and 10,000,000 shares authorized; 13,877,552 and none issued and outstanding | 14 | — | ||||||
| Common stock, $0.001 par value; 400,000,000 and 200,000,000 shares authorized; 94,067,418 and 43,697,570 issued and outstanding | 94 | 44 | ||||||
| Additional paid-in capital | 2,197,694 | 415,527 | ||||||
| Accumulated deficit | (138,856 | ) | (55,503 | ) | ||||
| Accumulated other comprehensive loss | (146,594 | ) | (170,793 | ) | ||||
| Total Colfax Corporation equity | 1,912,352 | 189,275 | ||||||
| Noncontrolling interest | 243,934 | — | ||||||
| Total equity | 2,156,286 | 189,275 | ||||||
| Total liabilities and equity | $ | 6,129,727 | $ | 1,088,543 | ||||
See Notes to Consolidated Financial Statements.
| 48 |
COLFAX CORPORATION
CONSOLIDATED STATEMENTS OF EQUITY
(In thousands, except share amounts and as noted)
| Common Stock | Preferred Stock | Additional Paid-In | Accumulated | Accumulated Other Comprehensive | Noncontrolling | |||||||||||||||||||||||||||||||
| Shares | $ Amount | Shares | $ Amount | Capital | Deficit | Loss | Interest | Total | ||||||||||||||||||||||||||||
| Balance at January 1, 2010 | 43,413,553 | $ | 43 | — | $ | — | $ | 402,852 | $ | (76,273 | ) | $ | (109,797 | ) | $ | — | $ | 216,825 | ||||||||||||||||||
| Net (loss) income | — | — | — | — | — | 16,215 | — | — | 16,215 | |||||||||||||||||||||||||||
| Other comprehensive income (loss) | — | — | — | — | — | — | (20,718 | ) | — | (20,718 | ) | |||||||||||||||||||||||||
| Common stock-based award activity | — | — | — | — | 4,049 | — | — | — | 4,049 | |||||||||||||||||||||||||||
| Balance at December 31, 2010 | 43,413,553 | $ | 43 | — | $ | — | $ | 406,901 | $ | (60,058 | ) | $ | (130,515 | ) | $ | — | $ | 216,371 | ||||||||||||||||||
| Net (loss) income | — | — | — | — | — | 4,555 | — | — | 4,555 | |||||||||||||||||||||||||||
| Other comprehensive income (loss) | — | — | — | — | — | — | (40,278 | ) | — | (40,278 | ) | |||||||||||||||||||||||||
| Common stock-based award activity | 284,017 | 1 | — | — | 8,626 | — | — | — | 8,627 | |||||||||||||||||||||||||||
| Balance at December 31, 2011 | 43,697,570 | $ | 44 | — | $ | — | $ | 415,527 | $ | (55,503 | ) | $ | (170,793 | ) | $ | — | $ | 189,275 | ||||||||||||||||||
| Net (loss) income | — | — | — | — | — | (64,402 | ) | — | 22,138 | (42,264 | ) | |||||||||||||||||||||||||
| Acquisitions | — | — | — | — | — | — | — | 259,229 | 259,229 | |||||||||||||||||||||||||||
| Sale of stock of entity previously controlled | — | — | — | — | — | — | — | (4,414 | ) | (4,414 | ) | |||||||||||||||||||||||||
| Distributions to noncontrolling owners | — | — | — | — | — | — | — | (9,721 | ) | (9,721 | ) | |||||||||||||||||||||||||
| ESAB India repurchase of additional noncontrolling interest | — | — | — | — | 1,035 | — | (2,644 | ) | (27,683 | ) | (29,292 | ) | ||||||||||||||||||||||||
| Preferred stock dividend | — | — | — | — | — | (18,951 | ) | — | — | (18,951 | ) | |||||||||||||||||||||||||
| Other comprehensive income, net of tax of $5.3 million | — | — | — | — | — | — | 26,843 | 4,385 | 31,228 | |||||||||||||||||||||||||||
| Common stock issuances, net of costs of $20.2 million | 49,917,786 | 50 | — | — | 1,432,921 | — | — | — | 1,432,971 | |||||||||||||||||||||||||||
| Preferred stock issuance, net of costs of $7.0 million | — | — | 13,877,552 | 14 | 332,958 | — | — | — | 332,972 | |||||||||||||||||||||||||||
| Common stock-based award activity | 452,062 | — | — | — | 15,253 | — | — | — | 15,253 | |||||||||||||||||||||||||||
| Balance at December 31, 2012 | 94,067,418 | $ | 94 | 13,877,552 | $ | 14 | $ | 2,197,694 | $ | (138,856 | ) | $ | (146,594 | ) | $ | 243,934 | $ | 2,156,286 | ||||||||||||||||||
See Notes to Consolidated Financial Statements.
| 49 |
COLFAX CORPORATION
CONSOLIDATED STATEMENTS OF CASH FLOWS
| Year ended December 31, | ||||||||||||
| 2009 | 2008 | 2007 | ||||||||||
| Restated | Restated | Restated | ||||||||||
| Cash flows from operating activities: | ||||||||||||
| Net income | $ | 23,797 | $ | 531 | $ | 65,646 | ||||||
| Adjustments to reconcile net income to cash provided by (used in) operating activities: | ||||||||||||
| Depreciation, amortization and fixed asset impairment charges | 15,074 | 14,788 | 15,239 | |||||||||
| Noncash stock-based compensation | 2,593 | 11,330 | - | |||||||||
| Write off of deferred loan costs | - | 4,614 | - | |||||||||
| Amortization of deferred loan costs | 677 | 934 | 1,644 | |||||||||
| Loss (gain) on sale of fixed assets | (64 | ) | 60 | (35 | ) | |||||||
| Deferred income taxes | 2,689 | (13,330 | ) | 22,496 | ||||||||
| Changes in operating assets and liabilities, net of acquisitions: | ||||||||||||
| Trade receivables | 16,280 | (20,612 | ) | (3,149 | ) | |||||||
| Inventories | 10,763 | (15,556 | ) | (2,279 | ) | |||||||
| Accounts payable and accrued liabilities, excluding asbestos related accrued expenses | (20,899 | ) | 7,044 | 8,748 | ||||||||
| Other current assets | 2,605 | (3,285 | ) | (2,304 | ) | |||||||
| Change in asbestos liability and asbestos-related accrued expenses, net of asbestos insurance asset and receivable | (10,166 | ) | (9,457 | ) | (27,807 | ) | ||||||
| Changes in other operating assets and liabilities | (5,063 | ) | (10,042 | ) | (3,716 | ) | ||||||
| Net cash provided by (used in) operating activities | 38,286 | (32,981 | ) | 74,483 | ||||||||
| Cash flows from investing activities: | ||||||||||||
| Purchases of fixed assets | (11,006 | ) | (18,645 | ) | (13,671 | ) | ||||||
| Acquisitions, net of cash received | (1,260 | ) | (439 | ) | (32,987 | ) | ||||||
| Proceeds from sale of fixed assets | 219 | 23 | 133 | |||||||||
| Net cash used in investing activities | (12,047 | ) | (19,061 | ) | (46,525 | ) | ||||||
| Cash flows from financing activities: | ||||||||||||
| Borrowings under term credit facility | - | 100,000 | 55,000 | |||||||||
| Payments under term credit facility | (5,000 | ) | (210,278 | ) | (11,791 | ) | ||||||
| Proceeds from borrowings on revolving credit facilities | - | 28,185 | 58,000 | |||||||||
| Repayments of borrowings on revolving credit facilities | - | (28,158 | ) | (86,500 | ) | |||||||
| Payments on capital leases | (417 | ) | (309 | ) | (449 | ) | ||||||
| Payments for loan costs | - | (3,347 | ) | (1,368 | ) | |||||||
| Payment of deferred stock issuance costs | - | - | (1,155 | ) | ||||||||
| Proceeds from the issuance of common stock, net of offering costs | - | 193,020 | - | |||||||||
| Repurchases of common stock | - | (5,731 | ) | - | ||||||||
| Dividends paid to preferred shareholders | - | (38,546 | ) | - | ||||||||
| Net cash (used in) provided by financing activities | (5,417 | ) | 34,836 | 11,737 | ||||||||
| Effect of exchange rates on cash | 379 | (2,125 | ) | 790 | ||||||||
| Increase (decrease) in cash and cash equivalents | 21,201 | (19,331 | ) | 40,485 | ||||||||
| Cash and cash equivalents, beginning of year | 28,762 | 48,093 | 7,608 | |||||||||
| Cash and cash equivalents, end of year | $ | 49,963 | $ | 28,762 | $ | 48,093 | ||||||
| Cash interest paid | $ | 6,615 | $ | 9,970 | $ | 16,978 | ||||||
| Cash income taxes paid | $ | 16,596 | $ | 18,534 | $ | 12,931 | ||||||
(In thousands)
| Year Ended December 31, | ||||||||||||
| 2012 | 2011 | 2010 | ||||||||||
| Cash flows from operating activities: | ||||||||||||
| Net (loss) income | $ | (42,264 | ) | $ | 4,555 | $ | 16,215 | |||||
| Adjustments to reconcile net (loss) income to net cash provided by operating activities: | ||||||||||||
| Depreciation, amortization and fixed asset impairment charges | 200,400 | 23,333 | 16,807 | |||||||||
| Stock-based compensation expense | 9,373 | 4,908 | 3,137 | |||||||||
| Unrealized loss on acquisition-related foreign currency derivatives | — | 21,146 | — | |||||||||
| Deferred income tax expense (benefit) | 7,222 | (1,722 | ) | (296 | ) | |||||||
| Changes in operating assets and liabilities, net of acquisitions: | ||||||||||||
| Trade receivables, net | (37,338 | ) | (5,972 | ) | (6,060 | ) | ||||||
| Inventories, net | 26,694 | 10,844 | 11,598 | |||||||||
| Accounts payable | 88,927 | (7,298 | ) | 12,615 | ||||||||
| Changes in other operating assets and liabilities | (88,715 | ) | 7,359 | 7,949 | ||||||||
| Net cash provided by operating activities | 164,299 | 57,153 | 61,965 | |||||||||
| Cash flows from investing activities: | ||||||||||||
| Purchase of fixed assets | (83,586 | ) | (14,786 | ) | (12,527 | ) | ||||||
| Acquisitions, net of cash received | (1,859,645 | ) | (56,346 | ) | (27,960 | ) | ||||||
| Proceeds from sale of stock of entity previously controlled | 4,730 | — | — | |||||||||
| Cash contribution to unconsolidated entity | (2,873 | ) | — | — | ||||||||
| Proceeds from sale of fixed assets | 399 | 1,162 | 74 | |||||||||
| Net cash used in investing activities | (1,940,975 | ) | (69,970 | ) | (40,413 | ) | ||||||
| Cash flows from financing activities: | ||||||||||||
| Borrowings under term credit facility | 1,731,523 | — | — | |||||||||
| Payments under term credit facility | (531,415 | ) | (10,000 | ) | (8,750 | ) | ||||||
| Proceeds from borrowings on revolving credit facilities | 13,149 | 141,203 | 5,500 | |||||||||
| Repayments of borrowings on revolving credit facilities | (53,414 | ) | (102,180 | ) | (5,500 | ) | ||||||
| Payments of deferred loan costs | (9,887 | ) | — | — | ||||||||
| Proceeds from the issuance of common stock, net | 756,762 | 3,719 | 912 | |||||||||
| Proceeds from the issuance of preferred stock, net | 332,969 | — | — | |||||||||
| ESAB India repurchase of additional noncontrolling interest | (29,292 | ) | — | — | ||||||||
| Payments of dividends on preferred stock | (17,446 | ) | — | — | ||||||||
| Payments on capital leases | — | — | (205 | ) | ||||||||
| Net cash provided by (used in) financing activities | 2,192,949 | 32,742 | (8,043 | ) | ||||||||
| Effect of foreign exchange rates on Cash and cash equivalents | (8,932 | ) | (5,359 | ) | (2,930 | ) | ||||||
| Increase in Cash and cash equivalents | 407,341 | 14,566 | 10,579 | |||||||||
| Cash and cash equivalents, beginning of period | 75,108 | 60,542 | 49,963 | |||||||||
| Cash and cash equivalents, end of period | $ | 482,449 | $ | 75,108 | $ | 60,542 | ||||||
| Supplemental Disclosure of Cash Flow Information: | ||||||||||||
| Interest payments | $ | 79,857 | $ | 5,209 | $ | 6,105 | ||||||
| Income tax payments, net | 70,677 | 16,731 | 5,819 | |||||||||
See accompanying notesNotes to consolidated financial statements.
COLFAX CORPORATION
NOTES TO CONSOLIDATED FINANCIAL STATEMENTS
1. Organization and Nature of Operations
Colfax Corporation (the “Company”, or “Colfax”, “we”, “our” or “us”) is a diversified global supplier of a broad range of fluid handlingindustrial manufacturing and engineering company that provides gas- and fluid-handling and fabrication technology products including pumps, fluid handling systems and controls, and specialty valves. We believe that we are a leading manufacturer of rotary positive displacement pumps, which include screw pumps, gear pumps and progressive cavity pumps. We have a global manufacturing footprint, with production facilities in Europe, North America and Asia, as well as worldwide sales and distribution channels. Our products serve a variety of applications in five strategic markets: commercial marine, oil and gas, power generation, global navy and general industrial. We design and engineer our productsservices to high quality and reliability standards for use in critical fluid handling applications where performance is paramount. We also offer customized fluid handling solutions to meet individual customer needs based on our in-depth technical knowledge ofcustomers around the applications in which our products are used. Our products are marketed principallyworld under the Allweiler, Fairmount, Houttuin, Imo, LSC, Portland Valve, Tushaco, Warren,Howden, ESAB and ZenithColfax Fluid Handling brand names. We believe that our brands are widely known and have a premium position in our industry. Allweiler, Houttuin, Imo and Warren are amongWith the oldest and most recognized brands in the fluid handling industry, with Allweiler dating back to 1860.
| Year Ended | ||||||||||||
| December 31, 2009 | ||||||||||||
| As | ||||||||||||
| Previously | As | |||||||||||
| Reported | Adjustment | Restated | ||||||||||
| Selling, general and administrative expenses | $ | 113,674 | $ | (1,171 | ) | $ | 112,503 | |||||
| Operating income | 38,459 | 1,171 | 39,630 | |||||||||
| Income before income taxes | 31,247 | 1,171 | 32,418 | |||||||||
| Provision for income taxes | 9,525 | (904 | ) | 8,621 | ||||||||
| Net income | 21,722 | 2,075 | 23,797 | |||||||||
| Net income available to common shareholders | 21,722 | 2,075 | 23,797 | |||||||||
| Net income per share—basic and diluted | $ | 0.50 | $ | 0.05 | $ | 0.55 | ||||||
| Year Ended | ||||||||||||
| December 31, 2008 | ||||||||||||
| As | ||||||||||||
| Previously | As | |||||||||||
| Reported | Adjustment | Restated | ||||||||||
| Selling, general and administrative expenses | $ | 125,234 | $ | (1,129 | ) | $ | 124,105 | |||||
| Operating income | 16,689 | 1,129 | 17,818 | |||||||||
| Income before income taxes | 4,867 | 1,129 | 5,996 | |||||||||
| Provision for income taxes | 5,438 | 27 | 5,465 | |||||||||
| Net (loss) income | (571 | ) | 1,102 | 531 | ||||||||
| Net (loss) income available to common shareholders | (4,063 | ) | 1,102 | (2,961 | ) | |||||||
| Net (loss) income per share—basic and diluted | $ | (0.11 | ) | $ | 0.03 | $ | (0.08 | ) | ||||
| Year Ended | ||||||||||||
| December 31, 2007 | ||||||||||||
| As | ||||||||||||
| Previously | As | |||||||||||
| Reported | Adjustment | Restated | ||||||||||
| Selling, general and administrative expenses | $ | 98,500 | $ | (1,074 | ) | $ | 97,426 | |||||
| Operating income | 123,275 | 1,074 | 124,349 | |||||||||
| Income before income taxes | 104,029 | 1,074 | 105,103 | |||||||||
| Provision for income taxes | 39,147 | 310 | 39,457 | |||||||||
| Net income | 64,882 | 764 | 65,646 | |||||||||
| Net income available to common shareholders | 39,066 | 764 | 39,830 | |||||||||
| Net income per share—basic and diluted | $ | 1.79 | $ | 0.03 | $ | 1.82 | ||||||
December 31, 2009 | December 31, 2008 | |||||||||||||||||||||||
| As | As | |||||||||||||||||||||||
| Previously | Adjustment and | As | Previously | As | ||||||||||||||||||||
Reported | Reclassifications | Restated | Reported | Adjustment | Restated | |||||||||||||||||||
| Deferred income taxes, net | $ | 6,823 | $ | 291 | $ | 7,114 | $ | 6,327 | $ | 162 | $ | 6,489 | ||||||||||||
| Asbestos insurance asset | 30,606 | 896 | 31,502 | 26,473 | - | 26,473 | ||||||||||||||||||
| Total current assets | 289,561 | 1,187 | 290,748 | 294,857 | 162 | 295,019 | ||||||||||||||||||
| Deferred income taxes, net | 52,023 | (185 | ) | 51,838 | 53,428 | (56 | ) | 53,372 | ||||||||||||||||
| Property, plant and equipment, net | 90,434 | 1,656 | 92,090 | 92,090 | - | 92,090 | ||||||||||||||||||
| Goodwill | 167,254 | (3,836 | ) | 163,418 | 165,530 | (3,836 | ) | 161,694 | ||||||||||||||||
| Long-term asbestos insurance asset | 358,843 | (896 | ) | 357,947 | 277,542 | - | 277,542 | |||||||||||||||||
| Deferred loan costs, pension and other assets | 16,188 | (1,656 | ) | 14,532 | 16,113 | (1,796 | ) | 14,317 | ||||||||||||||||
| Total assets | 1,003,131 | (3,730 | ) | 999,401 | 913,076 | (5,526 | ) | 907,550 | ||||||||||||||||
| Pension and accrued post-retirement benefits | 126,953 | (21,723 | ) | 105,230 | 130,188 | (19,970 | ) | 110,218 | ||||||||||||||||
| Total liabilities | 804,299 | (21,723 | ) | 782,576 | 746,145 | (19,970 | ) | 726,175 | ||||||||||||||||
| Retained deficit | (91,579 | ) | 15,306 | (76,273 | ) | (113,301 | ) | 13,231 | (100,070 | ) | ||||||||||||||
| Accumulated other comprehensive loss | (112,484 | ) | 2,687 | (109,797 | ) | (120,070 | ) | 1,213 | (118,857 | ) | ||||||||||||||
| Total shareholders’ equity | 198,832 | 17,993 | 216,825 | 166,931 | 14,444 | 181,375 | ||||||||||||||||||
| Total liabilities and shareholders' equity | $ | 1,003,131 | $ | (3,730 | ) | $ | 999,401 | $ | 913,076 | $ | (5,526 | ) | $ | 907,550 | ||||||||||
| Year Ended | ||||||||||||
| December 31, 2009 | ||||||||||||
| As | ||||||||||||
| Previously | As | |||||||||||
| Reported | Adjustment | Restated | ||||||||||
| Cash flows from operating activities: | ||||||||||||
| Net income | $ | 21,722 | $ | 2,075 | $ | 23,797 | ||||||
| Deferred income taxes | 3,593 | (904 | ) | 2,689 | ||||||||
| Accounts payable and accrued liabilities, excluding asbestos | (20,899 | ) | - | (20,899 | ) | |||||||
| Changes in other operating assets and liabilities | (3,892 | ) | (1,171 | ) | (5,063 | ) | ||||||
| Net cash provided by (used in) operating activities | 38,386 | - | 38,386 | |||||||||
| Year Ended | ||||||||||||
| December 31, 2008 | ||||||||||||
| As | ||||||||||||
| Previously | As | |||||||||||
| Reported | Adjustment | Restated | ||||||||||
| Cash flows from operating activities: | ||||||||||||
| Net income | $ | (571 | ) | $ | 1,102 | $ | 531 | |||||
| Deferred income taxes | (13,357 | ) | 27 | (13,330 | ) | |||||||
| Accounts payable and accrued liabilities, excluding asbestos | 7,020 | 24 | 7,044 | |||||||||
| Changes in other operating assets and liabilities | (8,889 | ) | (1,153 | ) | (10,042 | ) | ||||||
| Net cash provided by (used in) operating activities | (32,981 | ) | - | (32,981 | ) | |||||||
| Year Ended | ||||||||||||
| December 31, 2007 | ||||||||||||
| As | ||||||||||||
| Previously | As | |||||||||||
| Reported | Adjustment | Restated | ||||||||||
| Cash flows from operating activities: | ||||||||||||
| Net income | $ | 64,882 | $ | 764 | $ | 65,646 | ||||||
| Deferred income taxes | 22,186 | 310 | 22,496 | |||||||||
| Accounts payable and accrued liabilities, excluding asbestos | 8,772 | (24 | ) | 8,748 | ||||||||
| Changes in other operating assets and liabilities | (2,666 | ) | (1,050 | ) | (3,716 | ) | ||||||
| Net cash provided by (used in) operating activities | 74,483 | - | 74,483 | |||||||||
| As | ||||||||||||
| Previously | As | |||||||||||
| Reported | Adjustment | Restated | ||||||||||
| Year ended December 31, 2007 | $ | 14,829 | $ | (495 | ) | $ | 14,334 | |||||
| Year ended December 31, 2008 | $ | (80,676 | ) | $ | (43 | ) | $ | (80,719 | ) | |||
| Year ended December 31, 2009 | $ | 7,586 | $ | 1,474 | $ | 9,060 | ||||||
2. Summary of Significant Accounting Policies
Principles of Consolidation
The consolidated financial statementsCompany’s Consolidated Financial Statements include the accounts of the Company and its subsidiaries. Less than wholly owned subsidiaries, including joint ventures, are consolidated when it is determined that the Company has a controlling financial interest, which is generally determined when the Company holds a majority voting interest. When protective rights, substantive rights or other factors exist, further analysis is performed in order to determine whether or not there is a controlling financial interest. The Company owns 44%Consolidated Financial Statements reflect the assets, liabilities, revenues and expenses of consolidated subsidiaries and the common shares of Sistemas Centrales de Lubricación S.A. de C.V., a Mexican company and 28% of the common shares of Allweiler Al-Farid Pumps Company (S.A.E.), an Egyptian Corporation. These investments are recorded in these financial statements using the equity method of accounting. Accordingly, $6.6 million and $5.4 million are recorded in other assets on the consolidated balance sheets at December 31, 2009 and 2008, respectively. The Company records itsnoncontrolling parties’ ownership share of these investments’ net earnings, based on its economic ownership percentage. Accordingly, $1.5 million of earnings from equity investments were includedis presented as a reduction of selling, general and administrative expenses on the consolidated statements of operations for each of the three years ended December 31, 2009, 2008 and 2007, respectively.noncontrolling interest. All significant intercompany accounts and transactions have been eliminated.
Equity Method Investments
Investments in joint ventures, where the Company has a significant influence but not a controlling interest, are accounted for using the equity method of accounting. Investments accounted for under the equity method are initially recorded at the amount of the Company’s initial investment and adjusted each period for the Company’s share of the investee’s income or loss and dividends paid. All equity investments are reviewed periodically for indications of other than temporary impairment, including, but not limited to, significant and sustained decreases in quoted market prices or a series of historic and projected operating losses by investees. If the decline in fair value is considered to be other than temporary, an impairment loss is recorded and the investment is written down to a new carrying value. Investments in joint ventures acquired in the Charter Acquisition were recognized in the opening balance sheet at fair value. See Note 4, “Acquisitions” for additional information regarding the assets acquired in the Charter Acquisition.
Revenue Recognition
The Company generally recognizes revenues and costs from product sales when all of the following criteria are met: persuasive evidence of an arrangement exists, the price is fixed and determinable, product delivery has occurred or services have been rendered, there are no further obligations to customers, and collectibilitycollectability is probable.reasonably assured. Product delivery occurs when title and risk of loss transfer to the customer. The Company’s shipping terms vary based on the contract. If any significant obligations to the customer with respect to such sale remain to be fulfilled following shipments, typically involving obligations relating to installation and acceptance by the buyer, revenue recognition is deferred until such obligations have been fulfilled. Any customer allowances and discounts are recorded as a reduction in reported revenues at the time of sale because these allowances reflect a reduction in the sales price for the products sold. These allowances and discounts are estimated based on historical experience and known trends. Revenue related to service agreements is recognized as revenue over the term of the agreement. Progress billings are generally shown as a reduction of Inventories, net unless such billings are in excess of accumulated costs, in which case such balances are included in Accrued liabilities in the Consolidated Balance Sheets.
| 51 |
COLFAX CORPORATION
NOTES TO CONSOLIDATED FINANCIAL STATEMENTS – (Continued)
The Company recognizes revenue and installation or maintenance labor. The cost of sales on gas-handling construction projects using the “percentage of completion method” in accordance with accounting principles generally accepted in the United States of America (“GAAP”). Under this method, contract revenues are recognized over the performance period of the contract in direct proportion to the costs incurred as a percentage of total estimated costs for the entirety of the contract. Any recognized revenues that have not been billed to a customer are recorded as a component of Trade receivables and any billings of customers in excess of recognized revenues are recorded as a component of Accounts payable. As of December 31, 2012, there were $97.1 million of revenues in excess of billings and $178.3 million of billings in excess of revenues on construction contracts in the Consolidated Balance Sheet.
The Company has contracts in various stages of completion. Such contracts require estimates to determine the appropriate cost and revenue recognition. Significant management judgments and estimates, including estimated costs to complete projects, must be made and used in connection with revenue recognized during each period. Current estimates may be revised as additional information becomes available. The revisions are recorded in income in the period in which they are determined using the cumulative catch-up method of accounting. See Note 17, “Segment Information” for sales by major product group.
Customers may also request that the Company store products on their behalf until the product is generally quoted separately from the service costs, and the services that are provided are available from other vendors. Revenues from product shipments on this type of contract areneeded. Under these arrangements, revenue is recognized when title and risk of loss transferhave passed to the customer, and the service revenue components are recognized as services are performed.
Amounts billed for shipping and handling are recorded as revenue. Shipping and handling expenses are recorded as cost of sales. Progress billings are generally shown as a reduction of inventory unless such billings are in excess of accumulated costs, in which case such balances are included in accrued liabilities. The Company accrues for bad debts, as a component of selling, general, and administrative expenses, based upon estimatesCost of amounts deemed uncollectible and a specific review of significant delinquent accounts factoring in current and expected economic conditions. Product return reserves are accrued at the time of sale based on historical rates, and are recorded as a reduction to net sales.
Taxes Collected from Customers and Remitted to Governmental Authorities
The Company collects various taxes and fees as an agent in connection with the sale of products and remits these amounts to the respective taxing authorities. These taxes and fees have been presented on a net basis in the consolidated statementsConsolidated Statements of operationsOperations and are recorded as a liabilitycomponent of Accrued liabilities in the Consolidated Balance Sheets until remitted to the respective taxing authority.
Research and Development
Research and development costs are expensed as incurred.
Advertising Costs
Advertising costs of $15.7 million, $1.2 million, and $0.5 million for the years ended December 31, 2012, 2011 and 2010, respectively, are expensed as incurred and are included in Selling, general and administrative expense in the Consolidated Statements of Operations.
Cash and Cash Equivalents
Cash and cash equivalents include all financial instruments purchased with an initial maturity of three months or less.
Trade Receivables
Accounts receivable are presented net of allowancesan allowance for doubtful accounts. The Company records thean allowance for doubtful accounts based on its best estimateupon estimates of probable losses incurredamounts deemed uncollectible and a specific review of significant delinquent accounts factoring in the collection of accounts receivable.current and expected economic conditions. Estimated losses are based on historical collection experience, and are reviewed periodically by management.
Inventories
Inventories, net include the costscost of material, labor and overhead. Inventoriesoverhead and are stated at the lower of cost or market. Cost is primarily determined using the first-in, first-out method. The Company periodically reviews its quantities of inventories on hand and compares these amounts to the expected usage of each particular product. The Company records as a charge to costCost of sales any amounts required to reduce the carrying value of inventories to net realizable value.
COLFAX CORPORATION
NOTES TO CONSOLIDATED FINANCIAL STATEMENTS – (Continued)
Property, Plant and Equipment
Property, plant and equipment, net are stated at historical cost, which includes the fair values of such assets acquired. Depreciation of property,Property, plant and equipment is provided forrecorded on a straight-line basis over estimated useful lives ranging from three to 40 years.lives. Assets recorded under capital leases are amortized over the shorter of their estimated useful lives or the lease terms. The estimated useful lives or lease terms, of assetswhich range from three to 4015 years. RepairsRepair and maintenance expenditures are expensed as incurred unless the repair extends the useful life of the asset.
Impairment of Goodwill and Indefinite-Lived Intangible Assets
Goodwill represents the costs in excess of the fair value of net assets acquired associated with acquisitions by the Company.
The Company evaluates the recoverability of goodwillGoodwill and indefinite-lived intangible assets annually on December 31 or more frequently if an event occurs or circumstances change in the interim that would more likely than not reduce the fair value of the asset below its carrying amount. Goodwill is considered to be impaired when the net book value of a reporting unit exceeds its estimated fair value.
In the evaluation of goodwillGoodwill for impairment, the Company first comparesassesses qualitative factors to determine whether it is more likely than not that the fair value of thea reporting unit toentity is less than its carrying value. If the Company determines that it is not likely for a reporting unit’s fair value to be less than its carrying value, a calculation of the fair value is not performed. If the Company determines that it is likely for a reporting unit’s fair value to be less than its carrying value, a calculation of the reporting entity’s fair value is performed and compared to the carrying value of that entity. If the carrying value of a reporting unit exceeds its fair value, the goodwill ofGoodwill attributable to that reporting unit is potentially impaired and step two of the impairment analysis is performed. In step two of the analysis, an impairment loss is recorded equal to the excess of the carrying value of the reporting unit’s goodwillGoodwill over its implied fair value should such a circumstance arise.
The Company measures fair value of reporting units based on a present value of future discounted cash flows or a market valuation approach. The discounted cash flows model indicates the fair value of the reporting units based on the present value of the cash flows that the reporting units are expected to generate in the future. Significant estimates in the discounted cash flows model include: the weighted averageweighted-average cost of capital; long-term rate of growth and profitability of ourthe Company’s business; and working capital effects. The market valuation approach indicates the fair value of the business based on a comparison of the Company against certain market information. Significant estimates in the market approach model include identifying appropriate market multiples and assessing earnings before interest, income taxes, depreciation and amortization (EBITDA) in estimating the fair value of the reporting units.
In the evaluation of indefinite-lived intangible assets for impairment, the Company first assesses qualitative factors to determine whether it is more likely than not that the fair value of the indefinite-lived intangible asset is less than its carrying value. If the Company determines that it is not likely for the indefinite-lived intangible asset’s fair value to be less than its carrying value, a calculation of the fair value is not performed. If the Company determines that it is likely that the indefinite-lived intangible asset’s fair value is less than its carrying value, a calculation is performed and compared to the carrying value of the asset. If the carrying amount of the indefinite-lived intangible asset exceeds its fair value, an impairment loss is recognized in an amount equal to that excess. The analysis performedCompany measures the fair value of its indefinite-lived intangible assets using the “relief from royalty” method. Significant estimates in this approach include royalty and discount rates for each trade name evaluated.
The analyses performed as of the years ended December 31, 2009, 2008September 29, 2012, October 1, 2011 and 2007October 2, 2010 indicated no impairment to be present.
Impairment of Long-Lived Assets Other than Goodwill and Indefinite-Lived Intangible Assets
Intangibles primarily represent acquired customer relationships, acquired order backlog, acquired technology and software license agreements and patents.agreements. Acquired order backlog is amortized in the same period the corresponding revenue is recognized. A portion of the Company’s acquired customer relationships is being amortized over seven years based on the present value of the future cash flows expected to be generated from the acquired customers. All other intangibles are being amortized on a straight-line basis over their estimated useful lives, generally ranging from three to 1520 years.
COLFAX CORPORATION
NOTES TO CONSOLIDATED FINANCIAL STATEMENTS – (Continued)
The Company assesses its long-lived assets other than goodwillGoodwill and indefinite-lived intangible assets for impairment whenever facts and circumstances indicate that the carrying amounts may not be fully recoverable. To analyze recoverability, the Company projects undiscounted net future cash flows over the remaining lives of such assets. If these projected cash flows are less than the carrying amounts, an impairment loss would be recognized, resulting in a write-down of the assets with a corresponding charge to earnings. The impairment loss is measured based upon the difference between the carrying amounts and the fair values of the assets. Assets to be disposed of are reported at the lower of the carrying amounts or fair value less cost to sell. Management determines fair value using the discounted cash flow method or other accepted valuation techniques. The Company recorded asset impairment losses related to facility closures totaling $0.6$3.2 million during the year ended December 31, 2012 recorded in 2009Restructuring and other related charges in connection with the closureConsolidated Statement of two facilities.Operations and $0.1 million during the year ended December 31, 2011 as a component of Selling, general and administrative expense in the Consolidated Statement of Operations. No such impairments were recorded in 2008 or 2007.
Derivatives
The Company periodically enters intois subject to foreign currency interest rate swap, and commodity derivative contracts. The Company uses interest rate swaps to manage exposure to interest rate fluctuations. Foreign currency contracts are used to manage exchange rate fluctuations and generally hedge transactions betweenrisk associated with the Euro and the U.S. dollar. Commodity futures contracts are used to manage costs of raw materials used in the Company’s production processes.
Derivative instruments are generally recognized on a gross basis in the Consolidated Balance Sheets in either Other current assets, Other assets, Accrued liabilities or Other liabilities depending upon their respective fair values and maturity dates. The Company designates a portion of its foreign exchange contracts as fair value hedges. For all instruments designated as hedges, including net investment hedges, cash flow hedges for accounting purposes. For all derivatives designated asand fair value hedges, wethe Company formally documentdocuments the relationship between the hedging instrument and the hedged item, as well as the risk management objective and the strategy for using the hedging instrument. We assessThe Company assesses whether the hedging relationship between the derivativehedging instrument and the hedged item is highly effective at offsetting changes in the cash flowsfair value both at inception of the hedging relationship and on an ongoing basis. AnyFor cash flow hedges and net investment hedges, unrealized gains and losses are recognized as a component of Accumulated other comprehensive loss in the Consolidated Balance Sheets to the extent that it is effective at offsetting the change in the fair value of the derivative that is not effective at offsetting changeshedged item and realized gains and losses are recognized in the cash flows or fair valuesConsolidated Statements of Operations consistent with the underlying hedged item is recognized currently in earnings.
See Note 14, “Financial Instruments and Fair Value Measurements” for additional information regarding the Company’s derivative instruments.
Self-Insurance
The Company is self-insured for a portion of ourits product liability, workers’ compensation, general liability, medical coverage and certain other liability exposures. The Company accrues loss reserves up to the retention amounts when such amounts are reasonably estimable and probable. The accompanying consolidated balance sheets include estimated amounts for claims exposure based on experience factors and management estimates for known and anticipated claimsCompany’s reserves, included in Other accrued liabilities in the Consolidated Balance Sheets, related to self-insurance are as follows:
| December 31, | ||||||||
| 2012 | 2011 | |||||||
| (In thousands) | ||||||||
| Medical insurance | $ | 383 | $ | 1,086 | ||||
| Workers’ compensation | 260 | 246 | ||||||
| Total self-insurance reserves | $ | 643 | $ | 1,332 | ||||
| 54 |
| December 31, | ||||||||
| 2009 | 2008 | |||||||
| Medical insurance | $ | 697 | $ | 563 | ||||
| Workers' compensation | 189 | 173 | ||||||
| Total self-insurance reserves | $ | 886 | $ | 736 | ||||
COLFAX CORPORATION
NOTES TO CONSOLIDATED FINANCIAL STATEMENTS – (Continued)
Warranty Costs
Estimated expenses related to product warranties are accrued atas the timerevenue is recognized on products are sold to customers and recorded as partincluded in Cost of costsales in the Consolidated Statements of sales.Operations. Estimates are established using historical information as to the nature, frequency, and average costs of warranty claims.
The activity forin the years ended December 31, 2009 and 2008Company’s warranty liability, which is included in Other accrued liabilities in the Company’s Consolidated Financial Statements consisted of the following:
| 2009 | 2008 | |||||||
| Warranty liability at beginning of the year | $ | 3,108 | $ | 2,971 | ||||
| Accrued warranty expense, net of adjustments | 860 | 801 | ||||||
| Changes in estimates related to pre-existing warranties | (552 | ) | 374 | |||||
| Cost of warranty service work performed | (646 | ) | (869 | ) | ||||
| Foreign exchange translation effect | 82 | (169 | ) | |||||
| Warranty liability at end of the year | $ | 2,852 | $ | 3,108 | ||||
| Year Ended December 31, | ||||||||||||
| 2012 | 2011 | 2010 | ||||||||||
| (In thousands) | ||||||||||||
| Warranty liability, beginning of period | $ | 2,987 | $ | 2,963 | $ | 2,852 | ||||||
| Accrued warranty expense | 10,468 | 2,491 | 2,079 | |||||||||
| Changes in estimates related to pre-existing warranties | 9 | (368 | ) | (589 | ) | |||||||
| Cost of warranty service work performed | (23,457 | ) | (2,479 | ) | (1,264 | ) | ||||||
| Acquisitions | 51,367 | 477 | — | |||||||||
| Foreign exchange translation effect | (937 | ) | (97 | ) | (115 | ) | ||||||
| Warranty liability, end of period | $ | 40,437 | $ | 2,987 | $ | 2,963 | ||||||
Income Taxes
Income taxes for the Company are accounted for under the asset and liability method. Deferred income tax assets and liabilities are recognized for the future tax consequences attributable to differences between the financial statement carrying amounts of existing assets and liabilities in the Consolidated Financial Statements and their respective tax bases.basis. Deferred income tax assets and liabilities are measured using enacted tax rates expected to applybe applied to taxable income in the years in which those temporary differences are expected to be recovered or settled. The effect on deferredDeferred income tax assets and liabilities of a change in tax rates is generally recognized in Provision for income taxes in the period that includes the enactment date.
Valuation allowances are recorded if it is more likely than not that some portion of the deferred tax assetDeferred income taxes will not be realized. In evaluating the need for a valuation allowance, we takethe Company takes into account various factors, including the expected level of future taxable income and available tax planning strategies. If actual results differ fromAny changes in judgment about the assumptions madevaluation allowance are recorded through Provision for income taxes and are based on changes in facts and circumstances regarding realizability of deferred tax assets.
The Company must presume that an income tax position taken in a tax return will be examined by the relevant tax authority and determine whether it is more likely than not that the tax position will be sustained upon examination based upon the technical merits of the position. An income tax position that meets the more-likely-than-not recognition threshold is measured to determine the amount of benefit to recognize in the evaluation of our valuation allowance, we recordfinancial statements. The Company establishes a change in valuation allowance throughliability for unrecognized income tax expense or other comprehensivebenefits for income tax positions for which it is more likely than not that a tax position will not be sustained upon examination by the respective taxing authority to the extent such tax positions reduce the Company’s income tax liability. The Company recognizes interest and penalties related to unrecognized income tax benefits in the period such determination is made.
Foreign Currency Exchange Gains and Losses
The Company’s financial statements are presented in U.S. dollars. The functional currencies of the Company’s operating subsidiaries are generally the local currencies of the countries in which each subsidiary is located. Assets and liabilities denominated in foreign currencies are translated at rates of exchange in effect at the balance sheet date. Revenues and expenses are translated at average rates of exchange in effect during the year. The amounts recorded in each year are net of income taxes to the extent the underlying equity balances in the entities are not deemed to be permanently reinvested.
COLFAX CORPORATION
NOTES TO CONSOLIDATED FINANCIAL STATEMENTS – (Continued)
Transactions in foreign currencies are translated at the exchange rate in effect at the date of each transaction. Differences in exchange rates during the period between the date a transaction denominated in a foreign currency is consummated and the date on which it is either settled or translated for inclusion in the consolidated balance sheetsConsolidated Balance Sheets are recognized in Selling, general and administrative expense in the consolidated statementsConsolidated Statements of operationsOperations for that period. The net foreign currency transaction (loss) gain (loss) in income was $(1.4)$(1.2) million, $0.3$0.2 million, and $1.0$(0.4) million for the years ended December 31, 2009, 20082012, 2011 and 2007,2010, respectively.
Debt Issuance Costs
Costs directly related to the placement of debt are capitalized and amortized to Interest expense primarily using the straight-line method, which approximates the effective interest method over the term of the related obligation. Amounts written off due to early extinguishment of debt are charged to earnings. Cost and accumulated amortization related to debtDeferred issuance costs amounted to approximately $3.4of $11.4 million and $1.1$4.3 million, respectively, were included in Other assets in the Consolidated Balance Sheets as of December 31, 20092012 and $3.32011 net of $2.9 million and $0.4$2.5 million, respectively, as of December 31, 2008.
Use of Estimates
The preparation of financial statements in conformity with accounting principles generally accepted in the U.S. requires management to makeCompany makes certain estimates and assumptions thatin preparing its Consolidated Financial Statements in accordance with GAAP. These estimates and assumptions affect the reported amounts of assets and liabilities, andthe disclosure of contingent assets and liabilities at the date of the financial statementsConsolidated Financial Statements and the reported amounts of revenues and expenses for the periodsperiod presented. Actual results couldmay differ from those estimates.
Reclassifications
Given the impact of the Charter Acquisition on the Consolidated Financial Statements, certain prior period amounts have been reclassified to conform to current year presentations.
3. Recently Issued Accounting Pronouncements
In October 2009,July 2012, the Financial Accounting Standards Board issued Accounting Standards Update (ASU)(“ASU”) No. 2009-13, 2012-02, “IntangiblesMultiple-Deliverable Revenue Arrangements—a consensus of the FASB Emerging Issues Task Force—Goodwill and Other” (“ASU No. 2012-02”). ASU No. 2009-13 addresses2012-02 was intended to reduce the unitcost and complexity of accountingperforming an impairment test for arrangements involving multiple deliverables and how arrangement consideration should be allocatedindefinite-lived intangible assets by permitting an entity first to assess qualitative factors to determine whether it is more likely than not that the separate unitsfair value of accounting.an indefinite-lived intangible asset is less than its carrying amount. The Company will be required to adopt the provisionsadopted ASU No. 2012-02 in conjunction with its September 29, 2012 impairment analysis. The adoption of ASU No. 2009-13 prospectively beginning2012-02 did not have an impact on the Company’s Consolidated Financial Statements.
4. Acquisitions
Charter International plc
On January 1, 2011. Earlier retrospective application13, 2012, Colfax completed the Charter Acquisition for a total purchase price of approximately $2.6 billion. Under the terms of the Charter Acquisition, Charter shareholders received 730 pence in cash and 0.1241 newly issued shares of Colfax Common stock in exchange for each share of Charter’s ordinary stock. Charter is permitted.a global industrial manufacturing company focused on welding, cutting and automation and air and gas handling. The acquisition is expected to:
| • | enable Colfax to benefit from strong secular growth drivers, with a balance of short- and long-cycle businesses; and | |
See Note 10, “Debt” and Note 11, “Equity” for a discussion of the respective financing components of the Charter Acquisition.
COLFAX CORPORATION
NOTES TO CONSOLIDATED FINANCIAL STATEMENTS – (Continued)
In connection with the Charter Acquisition, the Company incurred advisory, legal, valuation and other professional service fees, termination payments to Charter executives and realized losses on acquisition-related foreign exchange derivatives, which comprised Charter Acquisition-related expense in the Consolidated Statements of Operations. See Note 14, “Financial Instruments and Fair Value Measurements” for additional information regarding the Company’s derivative instruments. The Charter Acquisition was accounted for using the acquisition method of accounting and accordingly, the Consolidated Financial Statements include the financial position and results of operations from the date of acquisition.
The following table summarizes the Company’s best estimate of the aggregate fair value of the assets acquired and liabilities assumed at the date of acquisition. These amounts are determined based upon certain valuations and studies that have yet to be finalized, and accordingly, the assets acquired and liabilities assumed, as detailed below, are subject to adjustment once the detailed analyses are completed. Substantially all of the Goodwill recognized is evaluatingnot expected to be deductible for income tax purposes.
| January 13, | ||||
| 2012 | ||||
| (In thousands) | ||||
| Trade receivables | $ | 683,976 | ||
| Inventories | 449,906 | |||
| Property, plant and equipment | 562,129 | |||
| Goodwill | 1,625,635 | |||
| Intangible assets | 715,643 | |||
| Accounts payable | (378,114 | ) | ||
| Debt | (399,466 | ) | ||
| Other assets and liabilities, net | (466,457 | ) | ||
| 2,793,252 | ||||
| Less: net assets attributable to noncontrolling interest | (241,201 | ) | ||
| Net consideration | $ | 2,552,051 | ||
The following table summarizes Intangible assets acquired, excluding Goodwill, as of January 13, 2012:
| Intangible | Weighted-Average | |||||||
| Asset | Amortization | |||||||
| (In thousands) | Period (Years) | |||||||
| Customer relationships | $ | 215,310 | 7.10 | |||||
| Acquired technology | 77,485 | 10.33 | ||||||
| Backlog | 54,805 | 1.00 | ||||||
| Trademarks | 4,415 | 5.00 | ||||||
| Total amortizable intangible assets | $ | 352,015 | 6.84 | |||||
| Trade names – indefinite life | $ | 363,628 | n/a | |||||
Soldex
On October 31, 2012, the effectsCompany completed the acquisition of implementingapproximately 91% of the provisionsoutstanding common and investment shares of this new guidance.
COLFAX CORPORATION
NOTES TO CONSOLIDATED FINANCIAL STATEMENTS – (Continued)
The following table summarizes the Company’s best estimate of the aggregate fair value of the assets acquired and liabilities assumed at the date of acquisition. These amounts are determined based upon certain valuations and studies that have yet to be finalized, and accordingly, the assets acquired and liabilities assumed, as detailed below, are subject to adjustment once the detailed analyses are completed. Substantially all of the Goodwill recognized is not expected to be deductible for income tax purposes.
| October 31, | ||||
| 2012 | ||||
| (In thousands) | ||||
| Trade receivables | $ | 22,848 | ||
| Inventories | 32,985 | |||
| Property, plant and equipment | 28,921 | |||
| Goodwill | 115,571 | |||
| Intangible assets | 65,325 | |||
| Accounts payable | (6,682 | ) | ||
| Debt | (36,734 | ) | ||
| Other assets and liabilities, net | (33,654 | ) | ||
| 188,580 | ||||
| Less: net assets attributable to noncontrolling interest | (18,028 | ) | ||
| Net consideration | $ | 170,552 | ||
The following table summarizes Intangible assets acquired, excluding Goodwill, as of October 31, 2012:
| Intangible | Weighted-Average | |||||||
| Asset | Amortization | |||||||
| (In thousands) | Period (Years) | |||||||
| Customer relationships | $ | 51,673 | 20.00 | |||||
| Acquired technology | 3,261 | 10.00 | ||||||
| Total amortizable intangible assets | $ | 54,934 | 19.41 | |||||
| Trade names – indefinite life | $ | 10,391 | n/a | |||||
Other
The following acquisitions were accounted for using the purchaseacquisition method of accounting and, accordingly, the accompanying financial statementsConsolidated Financial Statements include the financial position and the results of operations from the datesrespective date of acquisition.
Gas and Fluid Handling
On January 31, 2007,September 13, 2012, the Company purchased allcompleted the acquisition of the outstandingcommon stock of Lubrication Systems CompanyCo-Vent Group Inc. (“Co-Vent”) for $34.6 million. Co-Vent specializes in the custom design, manufacture, and testing of Texas (LSC), a manufacturer of fluid handling systems, including oil mist lubrication systems and lube oil purification systems, for $29.8 million.industrial fans, with its primary operations based in Quebec, Canada. As a result of thethis acquisition, of LSC, intangible assets of $22.6 million were recorded. The purchase of LSC complements the Company’s existing line of fluid handling products.
On December 31, 2010. In the fourth quarters of 2009 and 2008, the first two targets were achieved, resulting in payments of $0.4 million in each period, which were recorded as goodwill. Remaining contingent payments, if any, of up to $1.3 million will also be recorded as additional goodwill. In addition to strengthening its existing position with the U.S. Navy,6, 2011, the Company is leveraging Fairmount’s experienced engineering talent and technology expertise to develop a portfolio of fluid handling solutions with diagnostic and prognostic capabilities for use in industrial applications.
On February 14, 2011, the Company completed the acquisition of Rosscor Holding, B.V. (“Rosscor”) for $22.3 million, net of cash acquiredacquired. Rosscor is a supplier of multiphase pumping technology and certain other highly engineered fluid-handling systems, with its primary operations based in Hengelo, The Netherlands. As a result of this acquisition, the Company has expanded its product offerings in the transaction.
COLFAX CORPORATION
NOTES TO CONSOLIDATED FINANCIAL STATEMENTS – (Continued)
On August 19, 2010, the Company completed the acquisition of Baric Group (“Baric”) for $27.0 million, net of cash acquired. Additionally, during the year ended December 31, 2010, a final working capital settlement of $0.2 million was paid pursuant to terms of the Baric purchase agreements. Baric is a supplier of highly engineered fluid-handling systems primarily for lubrication applications, with its primary operations based in Blyth, United Kingdom.
Fabrication Technology
On April 13, 2012, the Company completed a $29.3 million acquisition of shares in ESAB India Limited, a publicly traded, less than wholly owned subsidiary in which the Company acquired assetsa controlling interest in the Charter Acquisition. This resulted in an increase in the Company’s ownership of the subsidiary from 56% to 74%. This acquisition of shares was pursuant to a statutorily mandated tender offer triggered as a result of the Charter Acquisition.
In May 2012, the Company completed an $8.5 million acquisition, including the assumption of debt, of the remaining ownership of CJSC Sibes (“Sibes”), a less than wholly owned subsidiary in which the Company did not have a controlling interest. This resulted in an increase in the Company’s ownership of Sibes from 16% to 100%.
Unaudited Pro Forma Financial Information
The following unaudited proforma financial information presents Colfax’s consolidated financial information assuming the acquisitions of Charter and liabilities. This information is obtained mainly through due diligence and other informationSoldex had taken place on January 1, 2011. These amounts are presented in accordance with GAAP, consistent with the Company’s accounting policies.
| Year Ended December 31, | ||||||||
| 2012 | 2011 | |||||||
| (Unaudited, in thousands) | ||||||||
| Net sales | $ | 4,096,401 | $ | 4,027,796 | ||||
| Net income (loss) available to Colfax common shareholders(1) | 88,212 | (116,862 | ) | |||||
__________
(1) Proforma net loss available to Colfax common shareholders for the year ended December 31, 2011 reflects the impact of certain expenses included in the Consolidated Statements of Operations for the year ended December 31, 2012, but excluded from the sellers, as well as tangiblecalculation of proforma net income for that period. These expenses include increased acquisition-related amortization expense of $79.9 million, $43.6 million of Charter acquisition-related expense, and intangible asset appraisals. The allocations for our significant acquisitions, Fairmount and LSC, are as follows:
| Fairmount | LSC | |||||||
| Cash | $ | 1,155 | $ | 74 | ||||
| Accounts receivable | 243 | 5,809 | ||||||
| Inventories | 469 | 4,248 | ||||||
| Prepaid expenses and other current assets | 77 | 301 | ||||||
| Property, plant and equipment | 109 | 428 | ||||||
| Goodwill | 3,028 | 15,065 | ||||||
| Trade name | 90 | 870 | ||||||
| Developed technology | 860 | 2,770 | ||||||
| Backlog of open orders | - | 552 | ||||||
| Customer relationships | 990 | 3,330 | ||||||
| Other long-term assets | - | 1,381 | ||||||
| Total assets acquired | $ | 7,021 | $ | 34,828 | ||||
| Accounts payable and accrued liabilities assumed | $ | 1,698 | $ | 5,078 | ||||
5. Net (Loss) Income Per Share
Net (loss) income per share available to Colfax Corporation common shareholders was computed as follows:
| Year Ended December 31, | ||||||||||||
| 2012 | 2011 | 2010 | ||||||||||
| (In thousands, except share data) | ||||||||||||
| Net (loss) income available to Colfax Corporation common shareholders | $ | (83,353 | ) | $ | 4,555 | $ | 16,215 | |||||
| Weighted-average shares of Common stock outstanding – basic | 91,069,640 | 43,634,937 | 43,389,878 | |||||||||
| Net effect of potentially dilutive securities(1) | — | 633,173 | 277,347 | |||||||||
| Weighted-average shares of Common stock outstanding – diluted | 91,069,640 | 44,268,110 | 43,667,225 | |||||||||
| Net (loss) income per share – basic and diluted | $ | (0.92 | ) | $ | 0.10 | $ | 0.37 | |||||
__________
| (1) | Potentially dilutive securities consist of stock options and restricted stock units. |
COLFAX CORPORATION
NOTES TO CONSOLIDATED FINANCIAL STATEMENTS – (Continued)
The Company calculates Net (loss) income per share under the two-class method as the shares of the Company’s Series A Preferred Stock are considered participating securities. However, since there was a net loss for the year ended December 31, 2012 and LSC acquisitions is $2.8losses are not allocated to the holders of the Series A Preferred Stock, there was no impact of participating securities for the year ended December 31, 2012. The weighted-average computation of the dilutive effect of potentially issuable shares of Common stock under the treasury stock method for the years ended December 31, 2012, 2011 and 2010 excludes approximately 2.8 million, 0.5 million and $14.41.3 million respectively.
| Pro Forma | ||||
| Year ended | ||||
| December 31, | ||||
2007 Restated | ||||
| Net sales | $ | 510,021 | ||
| Net income | 65,521 | |||
| Earnings per common share - basic and diluted | $ | 1.81 | ||
6. Income Taxes
Income before income taxes and the components of the provisionProvision for income taxes were as follows:
| Year ended December 31, | ||||||||||||
2009 Restated | 2008 Restated | 2007 Restated | ||||||||||
| Income (loss) before income tax expense: | ||||||||||||
| Domestic | $ | 698 | $ | (54,303 | ) | $ | 60,993 | |||||
| Foreign | 31,720 | 60,299 | 44,110 | |||||||||
| $ | 32,418 | $ | 5,996 | $ | 105,103 | |||||||
| Provision for income taxes: | ||||||||||||
| Current income tax expense (benefit): | ||||||||||||
| Federal | $ | (1,323 | ) | $ | (1,145 | ) | $ | 444 | ||||
| State | 344 | 239 | 199 | |||||||||
| Foreign | 6,911 | 19,701 | 16,318 | |||||||||
| 5,932 | 18,795 | 16,961 | ||||||||||
| Deferred income tax expense (benefit): | ||||||||||||
| Domestic | 2,241 | (12,607 | ) | 24,567 | ||||||||
| Foreign | 448 | (723 | ) | (2,071 | ) | |||||||
| 2,689 | (13,330 | ) | 22,496 | |||||||||
| $ | 8,621 | $ | 5,465 | $ | 39,457 | |||||||
| Year Ended December 31, | ||||||||||||
| 2012 | 2011 | 2010 | ||||||||||
| (In thousands) | ||||||||||||
| (Loss) income before income taxes: | ||||||||||||
| Domestic operations | $ | (73,467 | ) | $ | (27,645 | ) | $ | (12,737 | ) | |||
| Foreign operations | 121,906 | 47,632 | 40,425 | |||||||||
| $ | 48,439 | $ | 19,987 | $ | 27,688 | |||||||
| Provision for (benefit from) income taxes: | ||||||||||||
| Current: | ||||||||||||
| Federal | $ | — | $ | 182 | $ | (30 | ) | |||||
| State | 362 | (94 | ) | 261 | ||||||||
| Foreign | 83,119 | 17,066 | 11,538 | |||||||||
| 83,481 | 17,154 | 11,769 | ||||||||||
| Deferred: | ||||||||||||
| Domestic operations | 50,340 | — | — | |||||||||
| Foreign operations | (43,118 | ) | (1,722 | ) | (296 | ) | ||||||
| 7,222 | (1,722 | ) | (296 | ) | ||||||||
| $ | 90,703 | $ | 15,432 | $ | 11,473 | |||||||
The Company’s Provision for income taxes werediffers from the amount that would be computed by applying the U.S. federal statutory rate as follows:
| Year ended December 31, | ||||||||||||
2009 Restated | 2008 Restated | 2007 Restated | ||||||||||
| Tax at U.S. federal income tax rate | $ | 11,346 | $ | 2,099 | $ | 36,786 | ||||||
| State taxes | 34 | (1,500 | ) | 2,131 | ||||||||
| Effect of international tax rates | (2,260 | ) | (3,342 | ) | (2,230 | ) | ||||||
| Payment of non-deductible underwriting fee | - | 4,483 | - | |||||||||
| Changes in valuation and tax reserves | (710 | ) | 2,903 | 755 | ||||||||
| Inclusion of foreign earnings | - | - | 1,565 | |||||||||
| Other | 211 | 822 | 450 | |||||||||
| Provision for income taxes | $ | 8,621 | $ | 5,465 | $ | 39,457 | ||||||
| Year Ended December 31, | ||||||||||||
| 2012 | 2011 | 2010 | ||||||||||
| (In thousands) | ||||||||||||
| Taxes calculated at the U.S. federal statutory rate | $ | 16,954 | $ | 6,995 | $ | 9,691 | ||||||
| State taxes | 362 | (421 | ) | (5 | ) | |||||||
| Effect of international tax rates | (24,070 | ) | (2,988 | ) | (2,522 | ) | ||||||
| Change in enacted international tax rates | (12,305 | ) | — | — | ||||||||
| Changes in valuation allowance and tax reserves | 106,802 | 11,177 | 3,827 | |||||||||
| Other | 2,960 | 669 | 482 | |||||||||
| Provision for income taxes | $ | 90,703 | $ | 15,432 | $ | 11,473 | ||||||
COLFAX CORPORATION
NOTES TO CONSOLIDATED FINANCIAL STATEMENTS – (Continued)
Deferred income taxes, net reflect the net tax effects of temporary differences between the carrying amounts of assets and liabilities for financial reporting purposes and the amounts used for income tax purposes. Significant components of the deferred tax assets and liabilities wereare as follows:
| December 31, | ||||||||||||||||
| 2009 | 2008 | |||||||||||||||
| Restated | Restated | |||||||||||||||
| Current | Long-Term | Current | Long-Term | |||||||||||||
| Deferred tax assets: | ||||||||||||||||
| Post-retirement benefit obligations | $ | 1,003 | $ | 23,262 | $ | 602 | $ | 25,632 | ||||||||
| Expenses not currently deductible | 9,552 | 30,200 | 7,536 | 30,017 | ||||||||||||
| Net operating loss carryover | - | 42,268 | - | 42,770 | ||||||||||||
| Tax credit carryover | - | 5,560 | - | 7,518 | ||||||||||||
| Other | - | 837 | - | 1,094 | ||||||||||||
| Total deferred tax assets | 10,555 | 102,127 | 8,138 | 107,031 | ||||||||||||
| Valuation allowance for deferred tax assets | (2,649 | ) | (42,404 | ) | (1,649 | ) | (43,556 | ) | ||||||||
| Net deferred tax assets | 7,906 | 59,723 | 6,489 | 63,475 | ||||||||||||
| Net tax liabilities: | ||||||||||||||||
| Tax over book depreciation | - | 10,578 | - | 10,809 | ||||||||||||
| Other | 1,074 | 7,680 | - | 6,979 | ||||||||||||
| Total deferred tax liabilities | 1,074 | 18,258 | - | 17,788 | ||||||||||||
| Net deferred tax assets | $ | 6,832 | $ | 41,465 | $ | 6,489 | $ | 45,687 | ||||||||
| December 31, | ||||||||
| 2012 | 2011 | |||||||
| (In thousands) | ||||||||
| Deferred tax assets: | ||||||||
| Post-retirement benefit obligation | $ | 124,487 | $ | 39,172 | ||||
| Expenses currently not deductible | 124,537 | 50,121 | ||||||
| Net operating loss carryover | 288,017 | 51,614 | ||||||
| Tax credit carryover | 11,706 | 5,882 | ||||||
| Depreciation and amortization | 17,010 | — | ||||||
| Other | 7,228 | 1,358 | ||||||
| Valuation allowance | (372,039 | ) | (79,855 | ) | ||||
| Deferred tax assets, net | $ | 200,946 | $ | 68,292 | ||||
| Deferred tax liabilities: | ||||||||
| Depreciation and amortization | $ | (286,173 | ) | $ | (13,437 | ) | ||
| Post-retirement benefit obligation | (4,843 | ) | — | |||||
| Inventory | (4,400 | ) | — | |||||
| Other | (29,620 | ) | (14,688 | ) | ||||
| Total deferred tax liabilities | $ | (325,036 | ) | $ | (28,125 | ) | ||
| Total deferred tax (liabilities) assets, net | $ | (124,090 | ) | $ | 40,167 | |||
The Company evaluates the recoverability of its net deferred tax assets on a jurisdictional basis by considering whether net deferred tax assets will be realized on a more likely than not basis. To the extent a portion or all of the applicable deferred tax assets do not meet the more likely than not threshold, a valuation allowance is recorded. During the year ending December 31, 2009,2012, the valuation allowance decreasedincreased from $45.2$79.9 million to $45.1$372.0 million with the decrease$103.8 million recognized in Provision for income tax expense. The $0.1taxes, $167.7 million net decreaserecorded in 2009 wasthe opening accounts of the Charter Acquisition and $20.6 million recognized in Other comprehensive income. During the year ended December 31, 2011, the valuation allowance increased by $27.0 million, with $16.7 million and $10.3 million of the increase recognized in Provision for income taxes and Other comprehensive income, respectively, primarily attributabledue to a corresponding reduction inU.S. deferred tax assets due tothat the pension restatement, offset in part by an increase attributable to certain separate company losses the company believes mayCompany believed that it is more likely than not that they would be realized. Consideration was given to U.S. tax planning strategies and future U.S. taxable income as to how much of the relevant deferred tax asset could be realized on a more likely than not basis.
The Company has U.S. net operating loss carryforwards of approximately $109.6$293.9 million expiring in years 2021 through 2028,2032, and minimum tax credits of approximately $1.9$7.7 million that may be carried forward indefinitely. Tax credit carryforwards include foreign tax credits that have been offset by a valuation allowance. We experienced an “ownership change” within the meaning of Section 382 of the Internal Revenue Code of 1986, as amended, as a result of the IPO. The Company’s ability to use these various carryforwards existing at the time of the ownership change to offset any taxable income generated in future taxable periods after the ownership change may be limited under Section 382 and other federal tax provisions.
For the years ended December 31, 2009, 20082012, 2011 and 2007, the Company intends that2010, all undistributed earnings of itsthe Company’s controlled international subsidiaries willare considered to be permanently reinvested outside the U.S. and no tax expense in the U.S. has been recognized under the applicable accounting standard, for these reinvested earnings. The amount of unremitted earnings from thesethe Company’s international subsidiaries, subject to local statutory restrictions, as of December 31, 20092012 is approximately $128.2$251.1 million. It is not reasonably determinable as to theThe amount of deferred tax liability that would needhave been recognized had such earnings not been permanently reinvested is not reasonably determinable.
COLFAX CORPORATION
NOTES TO CONSOLIDATED FINANCIAL STATEMENTS – (Continued)
The Company records a liability for unrecognized income tax benefits for the amount of benefit included in its previously filed income tax returns and in its financial results expected to be provided if such earnings were not reinvested.
| Balance at December 31, 2007 | $ | 10,299 | ||
| Additions for tax positions in prior periods | 886 | |||
| Additions for tax positions in current period | 886 | |||
| Reductions for tax positions in prior periods | (1,658 | ) | ||
| Foreign exchange impact / other | (312 | ) | ||
| Balance at December 31, 2008 | $ | 10,101 | ||
| Additions for tax positions in prior periods | 73 | |||
| Additions for tax positions in current period | 308 | |||
| Reductions for tax positions in prior periods | (1,896 | ) | ||
| Foreign exchange impact / other | 160 | |||
| Balance at December 31, 2009 | $ | 8,746 |
| (In thousands) | ||||
| Balance, December 31, 2010 | $ | 8,896 | ||
| Addition for tax positions taken in prior periods | 852 | |||
| Addition for tax positions taken in the current period | 191 | |||
| Reduction for tax positions taken in prior periods | (5,802 | ) | ||
| Other, including the impact of foreign currency translation | (60 | ) | ||
| Balance, December 31, 2011 | 4,077 | |||
| Aquisitions | 73,249 | |||
| Addition for tax positions taken in prior periods | 1,391 | |||
| Addition for tax positions taken in the current period | 5,241 | |||
| Reduction for tax positions taken in prior periods | (3,695 | ) | ||
| Other, including the impact of foreign currency translation | 4,393 | |||
| Balance, December 31, 2012 | $ | 84,656 | ||
Prior year amounts were reclassified to be consistent with the current year presentation.
The Company is routinely examined by tax authorities around the world. Tax examinations remain in process in multiple countries, including but not limited to Sweden, Indonesia, France, Hungary, Italy, Brazil and various states. The Company files numerous group and separate tax returns in U.S. federal and state jurisdictions, as well as many international jurisdictions. In the U.S., tax years dating back to 2006 remain subject to examination, as well as the 2003 tax year due to tax attributes available to be carried forward to open or future tax years. With some exceptions, other major tax jurisdictions generally are not subject to tax examinations for years beginning before 2005.
The Company’s total unrecognized tax benefits were $84.7 million and $4.1 million as of December 31, 20092012 and 2008 totaled $9.32011, respectively, inclusive of $16.5 million and $11.1$0.4 million, inclusive of $0.5 million and $1.0 millionrespectively, of interest respectively.and penalties. These amounts were offset in part by tax benefits of approximately $0.7$0.5 million and $1.4 million for the years endedas of both December 31, 20092012 and 2008, respectively.2011. The net liabilities for uncertain tax positions for the years endedas of December 31, 20092012 and 20082011 were $8.6$84.2 million and $9.7$3.6 million, respectively, and if recognized, would favorably impact the effective tax rate.
Due to the difficulty in predicting with reasonable certainty when tax audits will be fully resolved and closed, the range of reasonably possible significant increases or decreases in the liability for unrecognized tax benefits that may occur within the next 12 months is difficult to ascertain. Currently, we estimatethe Company estimates that it is reasonably possible that the expiration of various statutes of limitations, and resolution of tax audits and court decisions may reduce ourits tax expense in the next 12 months ranging from zeroup to $1.3$60 million.
| Year Ended December 31, 2009 | ||||||||||||||||||||
| Restructuring | Foreign | Restructuring | ||||||||||||||||||
| Liability at | Currency | Liability at | ||||||||||||||||||
| Dec. 31, 2008 | Provisions | Payments | Translation | Dec. 31, 2009 | ||||||||||||||||
| Restructuring Charges: | ||||||||||||||||||||
Termination benefits (1) | $ | - | $ | 15,218 | $ | (5,545 | ) | $ | (200 | ) | $ | 9,473 | ||||||||
Furlough charges (2) | - | 1,187 | (1,273 | ) | 86 | - | ||||||||||||||
Facility closure charges (3) | - | 1,122 | (1,122 | ) | - | - | ||||||||||||||
| Total Restructuring Charges | $ | - | 17,527 | $ | (7,940 | ) | $ | (114 | ) | $ | 9,473 | |||||||||
| Other Related Charges: | ||||||||||||||||||||
Asset impairment charges (4) | 648 | |||||||||||||||||||
| Total Restructuring and Other Related Charges | $ | 18,175 | ||||||||||||||||||
COLFAX CORPORATION
NOTES TO CONSOLIDATED FINANCIAL STATEMENTS – (Continued)
7. Goodwill and Intangible Assets
The following table presentssummarizes the computation of basic and diluted earnings (loss) per share:
| Year ended December 31, | ||||||||||||
2009 Restated | 2008 Restated | 2007 Restated | ||||||||||
| Numerator: | ||||||||||||
| Net income | $ | 23,797 | $ | 531 | $ | 65,646 | ||||||
| Dividends on preferred stock | - | (3,492 | ) | (25,816 | ) | |||||||
| Net income (loss) available to common shareholders | $ | 23,797 | $ | (2,961 | ) | $ | 39,830 | |||||
| Denominator: | ||||||||||||
| Weighted-average shares of common stock outstanding - basic | 43,222,616 | 36,240,157 | 21,885,929 | |||||||||
| Net income (loss) per share - basic | $ | 0.55 | $ | (0.08 | ) | $ | 1.82 | |||||
| Weighted-average shares of common stock outstanding - basic | 43,222,616 | 36,240,157 | 21,885,929 | |||||||||
Net effect of potentally dilutive securities (1) | 103,088 | - | - | |||||||||
| Weighted-average shares of common stock outstanding - diluted | 43,325,704 | 36,240,157 | 21,885,929 | |||||||||
| Net income (loss) per share - diluted | $ | 0.55 | $ | (0.08 | ) | $ | 1.82 | |||||
Gas and Fluid Handling | Fabrication Technology | Total | ||||||||||
| (In thousands) | ||||||||||||
| Balance, January 1, 2011 | $ | 172,338 | $ | — | $ | 172,338 | ||||||
| Goodwill attributable to Rosscor acquisition | 10,212 | — | 10,212 | |||||||||
| Goodwill attributable to COT-Puritech acquisition | 25,073 | — | 25,073 | |||||||||
| Impact of foreign currency translation | (2,779 | ) | — | (2,779 | ) | |||||||
| Balance, December 31, 2011 | 204,844 | — | 204,844 | |||||||||
| Goodwill attributable to Charter Acquisition | 933,545 | 692,090 | 1,625,635 | |||||||||
| Goodwill attributable to Soldex Acquisition | — | 115,571 | 115,571 | |||||||||
| Goodwill attributable to other acquisitions | 21,376 | 5,699 | 27,075 | |||||||||
| Impact of foreign currency translation | 58,228 | 42,877 | 101,105 | |||||||||
| Balance, December 31, 2012 | $ | 1,217,993 | $ | 856,237 | $ | 2,074,230 | ||||||
The following table summarizes the Intangible assets, excluding Goodwill:
| December 31, | ||||||||||||||||
| 2012 | 2011 | |||||||||||||||
Gross Carrying Amount | Accumulated Amortization | Gross Carrying Amount | Accumulated Amortization | |||||||||||||
| (In thousands) | ||||||||||||||||
| Trade names – indefinite life | $ | 401,123 | $ | — | $ | 6,803 | $ | — | ||||||||
| Acquired customer relationships | 300,253 | (24,763 | ) | 29,798 | (12,987 | ) | ||||||||||
| Acquired technology | 107,018 | (12,466 | ) | 17,961 | (2,791 | ) | ||||||||||
| Acquired backlog | 63,984 | (62,432 | ) | 3,451 | (2,033 | ) | ||||||||||
| Other intangible assets | 12,352 | (6,020 | ) | 4,962 | (4,135 | ) | ||||||||||
| $ | 884,730 | $ | (105,681 | ) | $ | 62,975 | $ | (21,946 | ) | |||||||
See Note 4, “Acquisitions” for additional information regarding the activity in Goodwill and Intangible assets, net associated with acquisitions made by the Company during the years presented.
Amortization expense related to amortizable intangible assets was included in the Consolidated Statements of Operations as follows:
| Year Ended December 31, | ||||||||||||
| 2012 | 2011 | 2010 | ||||||||||
| (In thousands) | ||||||||||||
| Selling, general and administrative expense | $ | 85,106 | $ | 7,821 | $ | 3,501 | ||||||
As of December 31, 2012, total amortization expense for amortizable intangible assets is expected to be $40.3 million, $38.9 million, $37.3 million, $37.3 million and 0.5$33.5 million potentially dilutive stock options, restricted stock unitsfor the years ended December 31, 2013, 2014, 2015, 2016 and deferred stock units were excluded from the calculation of diluted loss per share since their effect would have been anti-dilutive.
| December 31, | ||||||||
| 2009 | 2008 | |||||||
| Raw materials | $ | 28,445 | $ | 34,074 | ||||
| Work in process | 32,888 | 33,691 | ||||||
| Finished goods | 21,013 | 21,600 | ||||||
| 82,346 | 89,365 | |||||||
| Less-Customer progress billings | (3,171 | ) | (2,115 | ) | ||||
| Less-Allowance for excess, slow-moving and obsolete inventory | (8,025 | ) | (6,923 | ) | ||||
| $ | 71,150 | $ | 80,327 | |||||
| Depreciable | December 31, | ||||||||||
| Lives in Years | 2009 | 2008 | |||||||||
| Land | - | $ | 16,618 | $ | 16,593 | ||||||
| Buildings and improvements | 3 - 40 | 36,651 | 34,784 | ||||||||
| Machinery and equipment | 3 - 15 | 119,727 | 114,857 | ||||||||
| Software | 3 - 5 | 17,324 | 14,487 | ||||||||
| 190,320 | 180,721 | ||||||||||
| Less-Accumulated depreciation | (98,230 | ) | (88,631 | ) | |||||||
| $ | 92,090 | $ | 92,090 | ||||||||
COLFAX CORPORATION
NOTES TO CONSOLIDATED FINANCIAL STATEMENTS – (Continued)
| 8. | Property, Plant and Equipment, Net |
| December 31, | ||||||||||
| Depreciable Life | 2012 | 2011 | ||||||||
| (In years) | (In thousands) | |||||||||
| Land | n/a | $ | 40,319 | $ | 14,786 | |||||
| Buildings and improvements | 5-40 | 314,216 | 38,642 | |||||||
| Machinery and equipment | 3-15 | 440,975 | 134,548 | |||||||
| Software | 3-5 | 70,092 | 16,948 | |||||||
| 865,602 | 204,924 | |||||||||
| Accumulated depreciation | (177,032 | ) | (113,985 | ) | ||||||
| Property, plant and equipment, net | $ | 688,570 | $ | 90,939 | ||||||
Depreciation expense, including the amortization of assets recorded under capital leases, for the years ended December 31, 2009, 20082012, 2011 and 2007,2010, was approximately $11.8$71.7 million, $12.1$13.1 million and $11.8$12.1 million, respectively. These amounts include depreciation expense related to software for the years ended December 31, 2009, 20082012, 2011 and 20072010 of $10.5 million, $1.7 million $2.0and $1.9 million, respectively.
| 9. | Inventories, Net |
Inventories, net consisted of the following:
| December 31, | ||||||||
| 2012 | 2011 | |||||||
| (In thousands) | ||||||||
| Raw materials | $ | 154,771 | $ | 25,241 | ||||
| Work in process | 99,459 | 26,376 | ||||||
| Finished goods | 263,211 | 20,378 | ||||||
| 517,441 | 71,995 | |||||||
| Less: customer progress billings | (14,571 | ) | (9,124 | ) | ||||
| Less: allowance for excess, slow-moving and obsolete inventory | (9,221 | ) | (6,735 | ) | ||||
| Inventories, net | $ | 493,649 | $ | 56,136 | ||||
| 10. | Debt |
Long-term debt consisted of the following:
| December 31, | ||||||||
| 2012 | 2011 | |||||||
| (In thousands) | ||||||||
| Term loans | $ | 1,682,177 | $ | 72,500 | ||||
| Revolving credit facilities and other | 46,134 | 39,018 | ||||||
| Total Debt | 1,728,311 | 111,518 | ||||||
| Less: current portion | (34,799 | ) | (10,000 | ) | ||||
| Long-term debt | $ | 1,693,512 | $ | 101,518 | ||||
As of December 31, 2011, the Company was party to a credit agreement (the “Bank of America Credit Agreement”), led and administered by Bank of America, which was a senior secured structure with a revolving credit facility and term credit facility. The term credit facility bore interest at the London Interbank Offered Rate (“LIBOR”) plus a margin ranging from 2.25% to 2.75% determined by the total leverage ratio calculated at the end of each quarter. As of December 31, 2011, the interest rate was 2.55% inclusive of a margin of 2.25%. Additionally, an annual commitment fee on the revolver ranged from 40 basis points to 50 basis points determined by the Company’s total leverage ratio calculated at the end of each quarter. As of December 31, 2011, the commitment fee was 40 basis points and there was $21.0 million outstanding on the letter of credit sub-facility.
COLFAX CORPORATION
NOTES TO CONSOLIDATED FINANCIAL STATEMENTS – (Continued)
During the year ended December 31, 2012, the Company terminated the Bank of America Credit Agreement in conjunction with the financing of the Charter Acquisition. Upon the early termination of the Bank of America Credit Agreement, the Company incurred a total pre-tax charge of $1.5 million, which included the write-off of $1.0 million of deferred financing fees and $0.5 million of losses reclassified from Accumulated other comprehensive loss in the Consolidated Balance Sheet for the related interest rate swap to Interest expense in the Consolidated Statement of Operations.
On January 13, 2012 and January 25, 2012, Colfax incurred debt consisting of: (i) a $200 million term A-1 facility, (ii) a $500 million term A-2 facility, (iii) a €157.6 million term A-3 facility and (iv) a $900 million term B facility pursuant to a credit agreement (the “Deutsche Bank Credit Agreement”) with Deutsche Bank Securities Inc., HSBC Securities (USA) Inc. and certain other lender parties named therein. In addition, the Deutsche Bank Credit Agreement has two revolving credit sub-facilities which total $300 million in commitments (the “Revolver”). The Revolver includes a $200 million letter of credit sub-facility and a $50 million swingline loan sub-facility. The term A-1, term A-2, term A-3 and the Revolver variable-rate borrowings are subject to interest payments of LIBOR or the Euro Interbank Offered Rate (“EURIBOR”) plus a margin ranging from 2.50% to 3.25%, determined by our leverage ratio. Borrowings under the term B facility are also variable rate and are subject to interest payments of LIBOR plus a margin of 3.5%. The Revolver is subject to a commitment fee ranging from 37.5 to 50 basis points, determined by the Company’s leverage ratio. Additionally, as of December 31, 2012 the Company had an original issue discount of $55.4 million and $2.6deferred financing fees of $8.5 million, respectively.
The Company is also party to additional letter of credit facilities with total borrowing capacity of $474.8 million, of which $330.0 million was outstanding as of December 31, 2012.
The contractual maturities of the Company’s debt as of December 31, 2012 are as follows(1):
| (In thousands) | ||||
| 2013 | $ | 34,799 | ||
| 2014 | 119,307 | |||
| 2015 | 190,557 | |||
| 2016 | 423,170 | |||
| 2017 | 145,167 | |||
| Thereafter | 870,667 | |||
| Total contractual maturities | 1,783,667 | |||
| Debt discount | (55,356 | ) | ||
| Total debt | $ | 1,728,311 | ||
__________
(1)Represents scheduled payments required under the Deutsche Bank Credit Agreement through the respective final maturities of the term A facilities through January 13, 2017 and the term B facility through January 13, 2019, as well as the contractual maturities of other debt outstanding as of December 31, 2012.
In March 2012, the Company used a portion of the proceeds from the sale of Common stock to pay off $35.0 million in borrowings under the term A facilities in advance of the scheduled payments. During the year ended December 31, 2012, the Company repaid an additional $26.3 million in borrowings under the term A facilities in advance of the scheduled payments. See Note 11, “Equity” for additional discussion regarding the Company’s stock issuances.
COLFAX CORPORATION
NOTES TO CONSOLIDATED FINANCIAL STATEMENTS – (Continued)
In connection with the Deutsche Bank Credit Agreement, the Company has pledged substantially all of its domestic subsidiaries’ assets and 65% of the shares of certain first tier international subsidiaries as collateral against borrowings to its U.S. companies. In addition, subsidiaries in certain foreign jurisdictions have guaranteed the Company’s obligations on borrowings of one of its European subsidiaries, as well as pledged substantially all of their assets for such borrowings to this European subsidiary under the Deutsche Bank Credit Agreement. The Deutsche Bank Credit Agreement contains customary covenants limiting the Company’s ability to, among other things, pay dividends, incur debt or liens, redeem or repurchase equity, enter into transactions with affiliates, make investments, merge or consolidate with others or dispose of assets. In addition, the Deutsche Bank Credit Agreement contains financial covenants requiring the Company to maintain a total leverage ratio, as defined therein, of not more than 4.95 to 1.0 and a minimum interest coverage ratio, as defined therein, of 2.0 to 1.0, measured at the end of each quarter, through the year ended December 31, 2012. The minimum interest coverage ratio increases by 25 basis points each year beginning in the carryingyear ending December 31, 2013 until it reaches 3.0 to 1.0 for the year ending December 31, 2016. The maximum total leverage ratio decreases to 4.75 to 1.0 for the year ending December 31, 2014 and decreases by 25 basis points for the two subsequent fiscal years until it reaches 4.25 to 1.0 for the year ending December 31, 2016. The Deutsche Bank Credit Agreement contains various events of default, including failure to comply with the financial covenants referenced above, and upon an event of default the lenders may, subject to various customary cure rights, require the immediate payment of all amounts outstanding under the term loans and the Revolver and foreclose on the collateral. The Company is in compliance with all such covenants as of December 31, 2012.
| 11. | Equity |
Common and Preferred Stock
During the years ended December 31, 2012, 2011 and 2010, 452,062, 248,017 and 194,999 shares of Common stock, respectively, were issued in connection with stock option exercises and employee share-based payment arrangements that vested during the year.
On January 24, 2012, following approval by the Company’s stockholders, the Company’s Certificate of Incorporation was amended to increase the number of authorized shares from 210,000,000 shares to 420,000,000 shares, comprised of an increase in Common stock from 200,000,000 shares to 400,000,000 shares and an increase in Preferred stock from 10,000,000 shares to 20,000,000 shares.
In connection with the financing of the Charter Acquisition, on January 24, 2012, the Company sold (i) 14,756,945 newly issued shares of Colfax Common stock and (ii) 13,877,552 shares of newly created Series A perpetual convertible preferred stock, referred to as the Series A Preferred Stock, for an aggregate of $680 million (representing $24.50 per share of Series A Preferred Stock and $23.04 per share of Common stock) pursuant to a securities purchase agreement (the “BDT Purchase Agreement”) with BDT CF Acquisition Vehicle, LLC (the “BDT Investor”) as well as BDT Capital Partners Fund I-A, L.P., and Mitchell P. Rales, Chairman of Colfax’s Board of Directors, and his brother, Steven M. Rales (for the limited purpose of tag-along sales rights provided to the BDT Investor in the event of a sale or transfer of shares of Colfax Common stock by either or both of Mitchell P. Rales and Steven M. Rales). Under the terms of the Series A Preferred Stock, holders are entitled to receive cumulative cash dividends, payable quarterly, at a per annum rate of 6% of the liquidation preference (defined as $24.50, subject to customary antidilution adjustments), provided that the dividend rate shall be increased to a per annum rate of 8% if Colfax fails to pay the full amount of goodwillany dividend required to be paid on such shares until the date that full payment is made.
The Series A Preferred Stock is convertible, in whole or in part, at the option of the holders at any time after the date the shares were issued into shares of Colfax Common stock at a conversion rate determined by dividing the liquidation preference by a number equal to 114% of the liquidation preference, subject to certain adjustments. The Series A Preferred Stock is also convertible, in whole or in part, at the option of Colfax on or after the third anniversary of the issuance of the shares at the same conversion rate if, among other things: (i) for the preceding thirty trading days, the closing price of Colfax Common stock on the New York Stock Exchange exceeds 133% of the applicable conversion price and (ii) Colfax has declared and paid or set apart for payment all accrued but unpaid dividends on the Series A Preferred Stock.
On January 24, 2012, Colfax sold 2,170,139 to each of Mitchell P. Rales, Chairman of Colfax’s Board of Directors, and his brother Steven M. Rales and 1,085,070 to Markel Corporation, a Virginia corporation (“Markel”) of newly issued Colfax Common stock at $23.04 per share, for a total aggregate of $125 million, pursuant to separate securities purchase agreements with Mitchell P. Rales and Steven M. Rales, each of whom were beneficial owners of 20.9% of Colfax’s Common stock at the time of the sale, and Markel. Thomas S. Gayner, a member of Colfax’s Board of Directors, is President and Chief Investment Officer of Markel.
Consideration paid to Charter shareholders included 0.1241 shares of newly issued Colfax Common stock in exchange for each share of Charter’s ordinary stock, which resulted in the issuance of 20,735,493 shares of Common stock on January 24, 2012.
COLFAX CORPORATION
NOTES TO CONSOLIDATED FINANCIAL STATEMENTS – (Continued)
In conjunction with the issuance of the Common and Preferred stock discussed above, the Company recognized $14.7 million in equity issuance costs which were recorded as a reduction to Additional paid-in capital during the year ended December 31, 2012.
On March 5, 2012, the Company sold 8,000,000 shares of newly issued Colfax Common stock to underwriters for public resale pursuant to a shelf registration statement for an aggregate purchase price of $272 million. Further, on March 9, 2012, the underwriters of the March 5, 2012 equity offering exercised their over-allotment option and the Company sold an additional 1,000,000 shares of newly issued Colfax Common stock to the underwriters for public resale pursuant to a shelf registration statement for an aggregate purchase price of $34 million. In conjunction with these issuances, the Company recognized $12.6 million in equity issuance costs which were recorded as a reduction to Additional paid-in capital during the year ended December 31, 2012.
Dividend Restrictions
The Company is subject to dividend restrictions under the Deutsche Bank Credit Agreement, which limit the total amount of cash dividends the Company may pay and Common stock repurchases the Company may make to $50 million annually, in the aggregate.
Accumulated Other Comprehensive Loss
The components of Accumulated other comprehensive loss, net of tax, are as follows:
| December 31, | ||||||||
| 2012 | 2011 | |||||||
| (In thousands) | ||||||||
| Foreign currency translation adjustment | $ | 104,718 | $ | (5,537 | ) | |||
| Unrealized loss on hedging activities | (3,980 | ) | (471 | ) | ||||
| Net unrecognized pension and other post-retirement benefit cost | (247,332 | ) | (164,785 | ) | ||||
| Accumulated other comprehensive loss | $ | (146,594 | ) | $ | (170,793 | ) | ||
The activity in Accumulated other comprehensive loss for the year ended December 31, 2012 excludes the $4.4 million of Other comprehensive income attributable to Noncontrolling interest, comprised of $4.8 million of foreign currency translation partially offset by $0.4 million of changes in unrecognized pension and other post-retirement benefits cost.
Share-Based Payments
The Company adopted the Colfax Corporation 2008 Omnibus Incentive Plan on April 21, 2008, as amended and restated on April 2, 2012 (the “2008 Plan”). The 2008 Plan provides the Compensation Committee of the Company’s Board of Directors discretion in creating employee equity incentives. Awards under the 2008 Plan may be made in the form of stock options, stock appreciation rights, restricted stock, restricted stock units, dividend equivalent rights, performance shares, performance units, and other stock-based awards.
The Company measures and recognizes compensation expense related to share-based payments based on the fair value of the instruments issued. Stock-based compensation expense is generally recognized as a component of Selling, general and administrative expense in the Consolidated Statements of Operations, as payroll costs of the employees receiving the awards are recorded in the same line item.
The Company’s Consolidated Statements of Operations reflect the following amounts related to stock-based compensation:
| Year Ended December 31, | ||||||||||||
| 2012 | 2011 | 2010 | ||||||||||
| (In thousands) | ||||||||||||
| Stock-based compensation expense | $ | 9,373 | $ | 4,908 | $ | 3,137 | ||||||
| Deferred tax benefit | 305 | 1,719 | 1,120 | |||||||||
COLFAX CORPORATION
NOTES TO CONSOLIDATED FINANCIAL STATEMENTS – (Continued)
As of December 31, 2012, the Company had $23.5 million of unrecognized compensation expense related to stock-based awards that will be recognized over a weighted-average period of approximately 2.4 years. The intrinsic value of awards exercised or converted was $9.9 million, $3.8 million and $1.2 million during the years ended December 31, 20092012, 2011 and 2010, respectively.
Stock Options
Under the 2008 are as follows:
Goodwill Restated | ||||
| Balance December 31, 2007 | $ | 165,123 | ||
| Contingent purchase price payment for Fairmount acquisition | 439 | |||
| Adjustments due to finalization of purchase price allocations | 165 | |||
| Impact of changes in foreign exchange rates | (4,033 | ) | ||
| Balance December 31, 2008 | 161,694 | |||
| Contingent purchase price payment for Fairmount acquisition | 418 | |||
| Attributable to 2009 acquisition of PD-Technik | 6 | |||
| Impact of changes in foreign exchange rates | 1,300 | |||
| Balance December 31, 2009 | $ | 163,418 | ||
| December 31, | ||||||||||||||||
| 2009 | 2008 | |||||||||||||||
Gross Carrying Amount | Accumulated Amortization | Gross Carrying Amount | Accumulated Amortization | |||||||||||||
| Acquired customer relationships | $ | 15,512 | $ | (8,989 | ) | $ | 14,450 | $ | (7,022 | ) | ||||||
| Trade names - indefinite life | 2,062 | - | 2,040 | - | ||||||||||||
| Acquired developed technology | 5,811 | (2,444 | ) | 5,808 | (1,760 | ) | ||||||||||
| Other intangibles | 146 | (146 | ) | 464 | (464 | ) | ||||||||||
| $ | 23,531 | $ | (11,579 | ) | $ | 22,762 | $ | (9,246 | ) | |||||||
Stock-based compensation expense for stock option awards is based upon the grant-date fair value using the Black-Scholes option pricing model. The Company recognizes compensation expense for stock option awards on a straight-line basis over the requisite service period of the entire award. The following table shows the weighted-average assumptions used to calculate the fair value of stock option awards using the Black-Scholes option pricing model, as well as the weighted-average fair value of options granted:
| Year Ended December 31, | ||||||||||||
| 2012 | 2011 | 2010 | ||||||||||
| Expected period that options will be outstanding (in years) | 5.41 | 4.50 | 4.50 | |||||||||
| Interest rate (based on U.S. Treasury yields at the time of grant) | 0.99 | % | 2.10 | % | 2.38 | % | ||||||
| Volatility | 42.59 | % | 52.50 | % | 52.22 | % | ||||||
| Dividend yield | — | — | — | |||||||||
| Weighted-average fair value of options granted | $ | 13.14 | $ | 9.68 | $ | 5.63 | ||||||
Expected volatility is estimated based on the historical volatility of comparable public companies. The Company considers historical data to estimate employee termination within the valuation model. Separate groups of employees that have similar historical exercise behavior are considered separately for valuation purposes. Since the Company has limited option exercise history, it has generally elected to estimate the expected life of an award based upon the Securities and Exchange Commission-approved “simplified method” noted under the provisions of Staff Accounting Bulletin No. 107 with the acquisitioncontinued use of PD-Technikthis method extended under the provisions of Staff Accounting Bulletin No. 110.
Stock option activity is as follows:
Number of Options | Weighted- Average Exercise Price | Weighted- Remaining Term (In years) | Aggregate Intrinsic Value(1) (In thousands) | |||||||||||||
| Outstanding at January 1, 2012 | 1,461,157 | $ | 14.76 | |||||||||||||
| Granted | 1,265,781 | 33.37 | ||||||||||||||
| Exercised | (425,782 | ) | 12.59 | |||||||||||||
| Forfeited | (73,494 | ) | 29.27 | |||||||||||||
| Expired | (17,546 | ) | 14.96 | |||||||||||||
| Outstanding at December 31, 2012 | 2,210,116 | $ | 25.35 | 5.63 | $ | 33,142 | ||||||||||
| Vested or expected to vest at December 31, 2012 | 2,178,251 | $ | 25.28 | 5.62 | $ | 32,828 | ||||||||||
| Exercisable at December 31, 2012 | 614,885 | $ | 14.40 | 4.20 | $ | 15,653 | ||||||||||
__________
| (1) | The aggregate intrinsic value is based upon the difference between the Company’s closing stock price at the date of the Consolidated Balance Sheet and the exercise price of the stock option for in-the-money stock options. The intrinsic value of outstanding stock options fluctuates based upon the trading value of the Company’s Common stock. |
| 68 |
COLFAX CORPORATION
NOTES TO CONSOLIDATED FINANCIAL STATEMENTS – (Continued)
Restricted Stock Units
Under the 2008 Plan, the Compensation Committee of the Board of Directors may award performance-based restricted stock units (“PRSUs”) whose vesting is contingent upon meeting various performance goals. The vesting of the stock units is determined based on whether the Company achieves the applicable performance criteria established by the Compensation Committee of the Board of Directors. If the performance criteria are satisfied, the units are subject to additional time vesting requirements, by which units will vest fully in 2009, customer relationship intangiblestwo equal installments on the fourth and fifth anniversary of $0.9 millionthe grant date, provided the individual remains an employee during this period. Under the 2008 Plan, the Compensation Committee of the Board of Directors may award non-performance-based restricted stock units (“RSUs”) to select executives, employees and outside directors. The Compensation Committee determines the terms and conditions of each award, including the restriction period and other criteria applicable to the awards. Directors may also elect to defer their annual board fees into RSUs with immediate vesting. Delivery of the shares underlying these director restricted stock units is deferred until termination of the director’s service on the Company’s Board of Directors.
The fair value of PRSUs and RSUs is equal to the market value of a share of Common stock on the date of grant and the related compensation expense is recognized ratably over the requisite service period and, for PRSUs when it is expected that any of the performance criterion will be achieved. The performance criterion was met for PRSUs granted during the year ended December 31, 2011, including PRSUs granted to the Company’s former Chief Executive Officer (“CEO”) as part of his initial employment agreement in January 2010, which were acquiredsubject to separate criterion.
The activity in the Company’s PRSUs and are being amortized over a periodRSUs is as follows:
| PRSUs | RSUs | |||||||||||||||
Number of Units | Weighted- Average Grant Date Fair Value | Number of Units | Weighted- Average Grant Date Fair Value | |||||||||||||
| Nonvested at January 1, 2012 | 324,447 | $ | 15.99 | 64,263 | $ | 14.71 | ||||||||||
| Granted | 283,804 | 33.48 | 38,511 | 33.30 | ||||||||||||
| Vested | (17,942 | ) | 18.11 | (44,140 | ) | 15.40 | ||||||||||
| Forfeited | (29,358 | ) | 23.12 | (3,758 | ) | 28.94 | ||||||||||
| Nonvested at December 31, 2012 | 560,951 | $ | 24.40 | 54,876 | $ | 26.23 | ||||||||||
The fair value of six years.
| 12. | Accrued Liabilities |
Accrued liabilities in the Consolidated Balance Sheets consisted of the following:
| December 31, | ||||||||
| 2012 | 2011 | |||||||
| (In thousands) | ||||||||
| Accrued payroll | $ | 99,583 | $ | 21,415 | ||||
| Advance payment from customers | 61,431 | 14,704 | ||||||
| Accrued taxes | 39,919 | 4,911 | ||||||
| Accrued asbestos-related liability | 58,501 | 76,295 | ||||||
| Warranty liability – current portion | 35,678 | 2,987 | ||||||
| Accrued restructuring liability – current portion | 25,406 | 4,573 | ||||||
| Accrued third-party commissions | 12,320 | 5,884 | ||||||
| Accrued Charter Acquisition-related liability | — | 29,430 | ||||||
| Other | 108,195 | 15,808 | ||||||
| Accrued liabilities | $ | 441,033 | $ | 176,007 | ||||
COLFAX CORPORATION
NOTES TO CONSOLIDATED FINANCIAL STATEMENTS – (Continued)
Accrued Restructuring Liability
The Company initiated a series of restructuring actions beginning in 2009 in response to then current and expected future economic conditions. The Company also communicated initiatives to improve productivity and reduce structural costs by rationalizing and leveraging its existing assets and back office functions. These initiatives include the consolidation of the Company’s commercial marine end-market operations, reduction in the back office personnel at several distribution centers in Europe, the closure of a small facility that previously produced units sold to certain customers located in the Middle East that the Company ceased supplying to during the year ended December 31, 2010, and the closure of a Portland, Maine production facility and consolidation of the operations with a Warren, Massachusetts facility.
During the year ended December 31, 2010, the Company participated in a German government-sponsored furlough program in which the government paid the wage-related costs for participating associates. Payroll taxes and other employee benefits related to employees’ furlough time are included in restructuring costs.
During the year ended December 31, 2011, the Company relocated its Richmond, Virginia corporate headquarters to Fulton, Maryland and eliminated an executive position in its German operations.
As a result of the Charter Acquisition in 2012, the Company’s restructuring programs expanded to include ongoing initiatives at the Company’s fabrication technology operations and efforts to reduce the structural costs and rationalize the corporate overhead of the combined businesses. Initiatives at the Company’s fabrication technology operations include the transfer of European capacity, a reduction in fixed overhead in Europe and the replacement of an old factory in the U.S. with a modern, lower cost and higher capacity facility.
The Company’s Consolidated Statements of Operations reflect the following amounts related to its restructuring activities:
| Year Ended December 31, | ||||||||||||
| 2012 | 2011 | 2010 | ||||||||||
| (In thousands) | ||||||||||||
| Restructuring and other related charges | $ | 60,060 | $ | 9,680 | $ | 10,323 | ||||||
COLFAX CORPORATION
NOTES TO CONSOLIDATED FINANCIAL STATEMENTS – (Continued)
A summary of the activity in the Company’s restructuring liability included in Accrued liabilities and Other liabilities in the Consolidated Balance Sheets is as follows:
| Year Ended December 31, 2012 | ||||||||||||||||||||||||
| Balance at Beginning of Year | Acquisitions | Provisions | Payments | Foreign Currency Translation | Balance at End of Year(3) | |||||||||||||||||||
| (In thousands) | ||||||||||||||||||||||||
| Restructuring and other related charges: | ||||||||||||||||||||||||
| Gas and Fluid Handling: | ||||||||||||||||||||||||
| Termination benefits(1) | $ | 3,868 | $ | — | $ | 7,062 | $ | (8,014 | ) | $ | 144 | $ | 3,060 | |||||||||||
| Facility closure costs(2) | 633 | — | 1,301 | (756 | ) | (1 | ) | 1,177 | ||||||||||||||||
| Other related charges | 72 | — | 289 | (363 | ) | 2 | — | |||||||||||||||||
| 4,573 | — | 8,652 | (9,133 | ) | 145 | 4,237 | ||||||||||||||||||
| Fabrication Technology: | ||||||||||||||||||||||||
| Termination benefits(1) | — | 6,276 | 30,292 | (22,277 | ) | 346 | 14,637 | |||||||||||||||||
| Facility closure costs(2) | — | 3,994 | 10,584 | (7,800 | ) | 147 | 6,925 | |||||||||||||||||
| Other related charges | — | — | 1,205 | (1,174 | ) | 2 | 33 | |||||||||||||||||
| — | 10,270 | 42,081 | (31,251 | ) | 495 | 21,595 | ||||||||||||||||||
| Non-cash impairment | 3,155 | |||||||||||||||||||||||
| 45,236 | ||||||||||||||||||||||||
| Corporate and Other: | ||||||||||||||||||||||||
| Termination benefits(1) | — | — | 3,020 | (3,020 | ) | — | — | |||||||||||||||||
| Facility closure costs(2) | — | — | 1,899 | (415 | ) | 38 | 1,522 | |||||||||||||||||
| Other related charges | — | — | 1,253 | (1,253 | ) | — | — | |||||||||||||||||
| — | — | 6,172 | (4,688 | ) | 38 | 1,522 | ||||||||||||||||||
| $ | 4,573 | $ | 10,270 | 56,905 | $ | (45,072 | ) | $ | 678 | $ | 27,354 | |||||||||||||
| Non-cash impairment | 3,155 | |||||||||||||||||||||||
| $ | 60,060 | |||||||||||||||||||||||
__________
| (1) | Includes severance and other termination benefits, including outplacement services. The Company recognizes the cost of involuntary termination benefits at the communication date or ratably over any remaining expected future service period. Voluntary termination benefits are recognized as a liability and an expense when employees accept the offer and the amount can be reasonably estimated. |
| (2) | Includes the cost of relocating associates, relocating equipment and lease termination expense in connection with the closure of facilities, discussed above. |
| (3) | As of December 31, 2012, $25.4 million and $1.9 million of the Company’s restructuring liability was included in Accrued liabilities and Other liabilities, respectively. |
The Company expects to incur an additional $30.0 million of employee termination benefits, facility closure costs, relocation expense forand operating lease exit costs during the next five fiscal years is expectedyear ending December 31, 2013 related to be: 2010—$2.5 million, 2011—$2.5 million, 2012—$2.2 million, 2013—$1.0 million, and 2014—$0.7 million.
| 13. | Defined Benefit Plans |
The Company sponsors various defined benefit plans, defined contribution plans and other post-retirement benefits plans, including health and life insurance, for certain eligible employees or former employees. We useThe Company uses December 31st as the measurement date for all of ourits employee benefit plans.
COLFAX CORPORATION
NOTES TO CONSOLIDATED FINANCIAL STATEMENTS – (Continued)
The following table summarizes the total changes in our pensionthe Company’s Pension and otheraccrued post-retirement benefit plan obligationsbenefits and plan assets and includes a statement of the plans’ funded status:
| Other | ||||||||||||||||
| Pension Benefits | Post-retirement Benefits | |||||||||||||||
| Year ended December 31, | 2009 Restated | 2008 Restated | 2009 | 2008 | ||||||||||||
| Change in benefit obligation: | ||||||||||||||||
| Projected benefit obligation at beginning of year | $ | 295,165 | $ | 303,654 | $ | 10,370 | $ | 7,304 | ||||||||
| Service cost | 1,381 | 1,160 | - | - | ||||||||||||
| Interest cost | 17,577 | 17,429 | 525 | 501 | ||||||||||||
| Plan amendments | - | - | - | 2,359 | ||||||||||||
| Actuarial loss | 10,662 | 3,740 | 772 | 901 | ||||||||||||
| Acquisitions | 72 | - | - | - | ||||||||||||
| Settlement/curtailment | - | - | - | - | ||||||||||||
| Foreign exchange effect | 2,958 | (7,844 | ) | - | - | |||||||||||
| Benefits paid | (21,244 | ) | (22,974 | ) | (808 | ) | (695 | ) | ||||||||
| Projected benefit obligation at end of year | $ | 306,571 | $ | 295,165 | $ | 10,859 | $ | 10,370 | ||||||||
| Accumulated benefit obligation at end of year | $ | 303,598 | $ | 290,007 | $ | - | $ | - | ||||||||
| Change in plan assets: | ||||||||||||||||
| Fair value of plan assets at beginning of year | $ | 192,859 | $ | 257,036 | $ | - | $ | - | ||||||||
| Actual return on plan assets | 29,193 | (42,694 | ) | - | - | |||||||||||
| Employer contribution | 7,517 | 5,695 | 808 | 695 | ||||||||||||
| Acquisitions | 60 | - | - | - | ||||||||||||
| Foreign exchange effect | 1,536 | (4,204 | ) | - | - | |||||||||||
| Benefits paid | (21,244 | ) | (22,974 | ) | (808 | ) | (695 | ) | ||||||||
| Fair value of plan assets at end of year | $ | 209,921 | $ | 192,859 | $ | - | $ | - | ||||||||
| Funded status at end of year | $ | (96,650 | ) | $ | (102,306 | ) | $ | (10,859 | ) | $ | (10,370 | ) | ||||
| Amounts recognized in the balance sheet at December 31: | ||||||||||||||||
| Non-current assets | $ | 244 | $ | 132 | $ | - | $ | - | ||||||||
| Current liabilities | (1,114 | ) | (1,153 | ) | (1,409 | ) | (1,437 | ) | ||||||||
| Non-current liabilities | (95,780 | ) | (101,285 | ) | (9,450 | ) | (8,933 | ) | ||||||||
| Total | $ | (96,650 | ) | $ | (102,306 | ) | $ | (10,859 | ) | $ | (10,370 | ) | ||||
| Pension Benefits | Other Post-Retirement Benefits | |||||||||||||||
| Year Ended December 31, | Year Ended December 31, | |||||||||||||||
| 2012 | 2011 | 2012 | 2011 | |||||||||||||
| (In thousands) | ||||||||||||||||
| Change in benefit obligation: | ||||||||||||||||
| Projected benefit obligation, beginning of year | $ | 347,911 | $ | 331,288 | $ | 15,397 | $ | 13,803 | ||||||||
| Acquisitions | 1,148,906 | — | 22,629 | — | ||||||||||||
| Service cost | 3,381 | 1,383 | 110 | — | ||||||||||||
| Interest cost | 67,745 | 16,408 | 1,507 | 690 | ||||||||||||
| Actuarial (gain) loss | 135,715 | 25,764 | (1,449 | ) | 1,507 | |||||||||||
| Settlement(1) | — | (2,857 | ) | — | — | |||||||||||
| Foreign exchange effect | 45,458 | (1,921 | ) | — | — | |||||||||||
| Benefits paid | (84,333 | ) | (22,154 | ) | (2,675 | ) | (603 | ) | ||||||||
| Other | 355 | — | — | — | ||||||||||||
| Projected benefit obligation, end of year | $ | 1,665,138 | $ | 347,911 | $ | 35,519 | $ | 15,397 | ||||||||
| Accumulated benefit obligation, end of year | $ | 1,641,252 | $ | 343,767 | $ | 33,405 | $ | — | ||||||||
| Change in plan assets: | ||||||||||||||||
| Fair value of plan assets, beginning of year | $ | 221,004 | $ | 231,240 | $ | — | $ | — | ||||||||
| Acquisitions | 954,919 | — | — | — | ||||||||||||
| Actual return on plan assets | 100,153 | 6,864 | — | — | ||||||||||||
| Employer contribution(2) | 58,494 | 8,684 | 2,675 | 603 | ||||||||||||
| Settlement(1) | — | (3,388 | ) | — | — | |||||||||||
| Foreign exchange effect | 37,359 | (242 | ) | — | — | |||||||||||
| Benefits paid | (84,333 | ) | (22,154 | ) | (2,675 | ) | (603 | ) | ||||||||
| Other | 248 | — | — | — | ||||||||||||
| Fair value of plan assets, end of year | $ | 1,287,844 | $ | 221,004 | $ | — | $ | — | ||||||||
| Funded status, end of year | $ | (377,294 | ) | $ | (126,907 | ) | $ | (35,519 | ) | $ | (15,397 | ) | ||||
| Amounts recognized on the Consolidated Balance Sheet at December 31: | ||||||||||||||||
| Non-current assets | $ | 31,826 | $ | — | $ | — | $ | — | ||||||||
| Current liabilities | (5,639 | ) | (1,079 | ) | (3,076 | ) | (795 | ) | ||||||||
| Non-current liabilities | (403,481 | ) | (125,828 | ) | (32,443 | ) | (14,602 | ) | ||||||||
| Total | $ | (377,294 | ) | $ | (126,907 | ) | $ | (35,519 | ) | $ | (15,397 | ) | ||||
__________
| (1) | Represents the change in benefit obligation and plan assets related to the termination of a frozen pension plan of one of the Company’s non-U.S. subsidiaries. |
| (2) | Contributions during the year ended December 31, 2012 included $18.9 million of supplemental contributions to pension plans in the United Kingdom as a result of financing the Charter Acquisition. |
The accumulated benefit obligation and fair value of plan assets for the pension plans with accumulated benefit obligations in excess of plan assets were $301.2 million$1.3 billion and $207.2$864.6 million, respectively, as of December 31, 20092012 and $288.1$343.8 million and $190.7$221.0 million, respectively, as of December 31, 2008.
The projected benefit obligation and fair value of plan assets for the pension plans with projected benefit obligations in excess of plan assets were $304.1 million$1.3 billion and $207.2$868.2 million, respectively, as of December 31, 20092012 and $293.1$347.9 million and $190.7$221.0 million, respectively, as of December 31, 2008.
COLFAX CORPORATION
NOTES TO CONSOLIDATED FINANCIAL STATEMENTS – (Continued)
The following table summarizes the changes in ourthe Company’s foreign pension plans’ obligationsPension benefit obligation, which is determined based upon an employee’s expected date of separation, and plan assets, included in the previous disclosure,table above, and includes a statement of the foreign plans’ funded status:
| Foreign Pension Benefits | ||||||||
| Year ended December 31, | 2009 | 2008 | ||||||
| Change in benefit obligation: | ||||||||
| Projected benefit obligation at beginning of year | $ | 82,253 | $ | 83,649 | ||||
| Service cost | 1,381 | 1,160 | ||||||
| Interest cost | 4,668 | 4,364 | ||||||
| Actuarial (gain) loss | (5,947 | ) | 5,786 | |||||
| Acquisitions | 72 | - | ||||||
| Foreign exchange effect | 2,958 | (7,844 | ) | |||||
| Benefits paid | (4,425 | ) | (4,862 | ) | ||||
| Projected benefit obligation at end of year | $ | 80,960 | $ | 82,253 | ||||
| Accumulated benefit obligation at end of year | $ | 77,988 | $ | 77,097 | ||||
| Change in plan assets | ||||||||
| Fair value of plan assets at beginning of year | $ | 23,219 | $ | 28,918 | ||||
| Actual return on plan assets | 1,390 | 69 | ||||||
| Employer contribution | 3,061 | 3,298 | ||||||
| Acquisitions | 60 | - | ||||||
| Foreign exchange effect | 1,536 | (4,204 | ) | |||||
| Benefits paid | (4,425 | ) | (4,862 | ) | ||||
| Fair value of plan assets at end of year | $ | 24,841 | $ | 23,219 | ||||
| Funded status at end of year | $ | (56,119 | ) | $ | (59,034 | ) | ||
| Foreign Pension Benefits | ||||||||
| Year Ended December 31, | ||||||||
| 2012 | 2011 | |||||||
| (In thousands) | ||||||||
| Change in benefit obligation: | ||||||||
| Projected benefit obligation, beginning of year | $ | 97,108 | $ | 95,136 | ||||
| Acquisitions | 957,080 | — | ||||||
| Service cost | 3,381 | 1,383 | ||||||
| Interest cost | 49,291 | 5,132 | ||||||
| Actuarial loss | 85,167 | 5,704 | ||||||
| Settlement(1) | — | (2,857 | ) | |||||
| Foreign exchange effect | 45,458 | (1,921 | ) | |||||
| Benefits paid | (56,816 | ) | (5,469 | ) | ||||
| Other | 355 | — | ||||||
| Projected benefit obligation, end of year | $ | 1,181,024 | $ | 97,108 | ||||
| Accumulated benefit obligation, end of year | $ | 1,157,140 | $ | 92,964 | ||||
| Change in plan assets: | ||||||||
| Fair value of plan assets, beginning of year | $ | 32,339 | $ | 34,071 | ||||
| Acquisitions | 817,258 | — | ||||||
| Actual return on plan assets | 58,139 | 3,039 | ||||||
| Employer contribution(2) | 49,640 | 4,328 | ||||||
| Settlement(1) | — | (3,388 | ) | |||||
| Foreign exchange effect | 37,359 | (242 | ) | |||||
| Benefits paid | (56,816 | ) | (5,469 | ) | ||||
| Other | 248 | — | ||||||
| Fair value of plan assets, end of year | $ | 938,167 | $ | 32,339 | ||||
| Funded status, end of year | $ | (242,857 | ) | $ | (64,769 | ) | ||
__________
| (1) | Represents the change in benefit obligation and plan assets related to the termination of a frozen pension plan of one of the Company’s non-U.S. subsidiaries. |
(2)Contributions during the year ended December 31, 2012 included $18.9 million of supplemental contributions to pension plans in the United Kingdom as a result of financing the Charter Acquisition.
Expected contributions to the Company’s pension and other post-employment benefit plans for 2010the year ended December 31, 2013, related to plans as of December 31, 2012, are $5.5 million. The$51.8 million.The following benefit payments are expected to be paid during the years ending December 31:
| Other | ||||||||||||
| Pension Benefits | Post-retirement | |||||||||||
| All Plans | Foreign Plans | Benefits | ||||||||||
| Restated | ||||||||||||
| 2010 | $ | 22,203 | $ | 4,664 | $ | 1,409 | ||||||
| 2011 | 23,308 | 4,760 | 843 | |||||||||
| 2012 | 22,290 | 4,793 | 850 | |||||||||
| 2013 | 22,219 | 4,858 | 840 | |||||||||
| 2014 | 22,281 | 4,969 | 817 | |||||||||
| Years 2015-2019 | 109,186 | 24,652 | 3,689 | |||||||||
| Pension Benefits | Other Post- | |||||||||||
| All Plans | Foreign Plans | Retirement Benefits | ||||||||||
| (In thousands) | ||||||||||||
| 2013 | $ | 88,543 | $ | 58,090 | $ | 3,076 | ||||||
| 2014 | 89,878 | 59,343 | 2,965 | |||||||||
| 2015 | 89,937 | 59,450 | 2,821 | |||||||||
| 2016 | 90,498 | 59,941 | 2,783 | |||||||||
| 2017 | 93,000 | 62,654 | 2,676 | |||||||||
| Thereafter | 469,090 | 321,728 | 9,899 | |||||||||
The Company’s primary investment objective for its pension plan assets is to provide a source of retirement income for the plans’ participants and beneficiaries. The assets are invested with the goal of preserving principal while providing a reasonable real rate of return over the long term. Diversification of assets is achieved through strategic allocations to various asset classes. Actual allocations to each asset class vary due to periodic investment strategy changes, market value fluctuations, the length of time it takes to fully implement investment allocation positions, and the timing of benefit payments and contributions. The asset allocation is monitored and rebalanced as required, as frequently as on a quarterly basis in some instances. The following are the actual and target allocation percentages for the Company’s pension plan assets:
| Actual Allocation | ||||||||||||
| December 31, | Target | |||||||||||
| 2009 | 2008 | Allocation | ||||||||||
| United States Plans: | ||||||||||||
| Equity securities: | ||||||||||||
| U.S. | 39 | % | 36 | % | 34% - 42 | % | ||||||
| International | 12 | 12 | 10% - 14 | % | ||||||||
| Fixed income securities | 34 | 37 | 27% - 43 | % | ||||||||
| Hedge fund | 15 | 15 | 13% - 17 | % | ||||||||
| Foreign Plans: | ||||||||||||
| Large cap equity securities | 15 | 19 | 0% - 20 | % | ||||||||
| Fixed income securities | 83 | 80 | 80% - 100 | % | ||||||||
| Cash and cash equivalents | 2 | 1 | 0% - 5 | % | ||||||||
COLFAX CORPORATION
NOTES TO CONSOLIDATED FINANCIAL STATEMENTS – (Continued)
Actual Asset Allocation December 31, |
Target | |||||||||
| 2012 | 2011 | Allocation | ||||||||
| U.S. Plans: | ||||||||||
| Equity securities: | ||||||||||
| U.S. | 36 | % | 32 | % | 30% - 45% | |||||
| International | 15 | % | 16 | % | 10% - 20% | |||||
| Fixed income | 37 | % | 33 | % | 30% - 50% | |||||
| Hedge funds | 11 | % | 19 | % | 0% - 20% | |||||
| Cash and cash equivalents | 1 | % | — | 0% - 5% | ||||||
| Foreign Plans: | ||||||||||
| Equity securities | 37 | % | 22 | % | 20% - 45% | |||||
| Fixed income securities | 58 | % | 54 | % | 50% - 80% | |||||
| Cash and cash equivalents | 2 | % | 23 | % | 0% - 25% | |||||
| Other | 3 | % | 1 | % | 0% -5% | |||||
A summary of the Company’s pension plan assets usingfor each fair value hierarchy level for the periods presented follows (See Note 14, “Financial Instruments and Fair Value Measurements” for further description of the levels within the fair value hierarchy):
| December 31, 2012 | ||||||||||||||||
Level One | Level Two | Level Three |
Total | |||||||||||||
| (In thousands) | ||||||||||||||||
| U.S. Plans: | ||||||||||||||||
| Cash and cash equivalents | $ | 2,645 | $ | — | $ | — | $ | 2,645 | ||||||||
| Equity securities: | ||||||||||||||||
| U.S. large cap | 89,293 | — | — | 89,293 | ||||||||||||
| U.S. small/mid cap | — | 37,671 | — | 37,671 | ||||||||||||
| International | 15,579 | 37,323 | — | 52,902 | ||||||||||||
| Fixed income mutual funds: | ||||||||||||||||
| U.S. government and corporate | 128,334 | — | — | 128,334 | ||||||||||||
| Multi-strategy hedge funds | — | — | 38,832 | 38,832 | ||||||||||||
| Foreign Plans: | ||||||||||||||||
| Cash and cash equivalents | 19,594 | — | — | 19,594 | ||||||||||||
| Equity securities | 234,228 | 108,598 | — | 342,826 | ||||||||||||
| Non-U.S. government and corporate bonds | 250,891 | 298,160 | — | 549,051 | ||||||||||||
| Other(1) | 2,108 | 24,588 | — | 26,696 | ||||||||||||
| $ | 742,672 | $ | 506,340 | $ | 38,832 | $ | 1,287,844 | |||||||||
__________
| (1) | Represents diversified portfolio funds and reinsurance contracts maintained for certain foreign plans. |
| 74 |
COLFAX CORPORATION
NOTES TO CONSOLIDATED FINANCIAL STATEMENTS – (Continued)
| December 31, 2011 | ||||||||||||||||
Level One | Level Two | Level Three |
Total | |||||||||||||
| (In thousands) | ||||||||||||||||
| U.S. Plans: | ||||||||||||||||
| Equity securities: | ||||||||||||||||
| U.S. large cap | $ | 50,572 | $ | — | $ | — | $ | 50,572 | ||||||||
| U.S. small/mid cap | 10,633 | — | — | 10,633 | ||||||||||||
| International | 29,400 | — | — | 29,400 | ||||||||||||
| Fixed income mutual funds: | ||||||||||||||||
| U.S. government and corporate | 40,561 | — | — | 40,561 | ||||||||||||
| High-yield bonds | 15,258 | — | — | 15,258 | ||||||||||||
| Emerging markets debt | 5,920 | — | — | 5,920 | ||||||||||||
| Multi-strategy hedge funds | — | — | 36,321 | 36,321 | ||||||||||||
| Foreign Plans: | ||||||||||||||||
| Cash and cash equivalents | 7,595 | — | — | 7,595 | ||||||||||||
| Equity securities | 6,953 | — | — | 6,953 | ||||||||||||
| Non-U.S. government bonds | — | 17,576 | — | 17,576 | ||||||||||||
| Other(1) | — | 215 | — | 215 | ||||||||||||
| $ | 166,892 | $ | 17,791 | $ | 36,321 | $ | 221,004 | |||||||||
__________
| (1) | Represents diversified portfolio funds and reinsurance contracts maintained for certain foreign plans. |
The Company’s pension assets included in Level Three of the fair value hierarchy asconsist of December 31, 2009. Themulti-strategy hedge funds and the fair value hierarchy has three levels based onis equal to the reliability of the inputs used to determine fair value. Level 1 refers to fair values determined based on quoted prices in active markets for identical assets. Level 2 refers to fair values estimated using significant observable inputs, and Level 3 includes fair values estimated using significant unobservable inputs.
| Total | Level 1 | Level 2 | Level 3 | |||||||||||||
| United States Plans: | ||||||||||||||||
| Cash and cash equivalents | $ | 1,180 | $ | 1,180 | $ | - | $ | - | ||||||||
| Equity mutual funds: | ||||||||||||||||
| U.S. large cap | 56,400 | 56,400 | - | - | ||||||||||||
| U.S. small / mid-cap | 15,992 | 15,992 | - | - | ||||||||||||
| Foreign | 22,548 | 22,548 | - | - | ||||||||||||
| Fixed income mutual funds: | ||||||||||||||||
| U.S. | 50,805 | 50,805 | - | - | ||||||||||||
| Foreign | 11,386 | 11,386 | - | - | ||||||||||||
| Hedge fund | 26,769 | - | - | 26,769 | ||||||||||||
| Foreign Plans: | ||||||||||||||||
| Cash and cash equivalents | 568 | 568 | - | - | ||||||||||||
| Large cap equity securities | 3,688 | 3,688 | - | - | ||||||||||||
| Fixed income securities | 20,585 | - | 20,585 | - | ||||||||||||
| $ | 209,921 | $ | 162,567 | $ | 20,585 | $ | 26,769 | |||||||||
| Balance at January 1, 2009 | $ | 25,983 | ||
| Unrealized gains | 786 | |||
| Balance at December 31, 2009 | $ | 26,769 |
| (In thousands) | ||||
| Balance, January 1, 2010 | $ | 26,769 | ||
| Net purchases and sales | 9,036 | |||
| Realized loss | (316 | ) | ||
| Unrealized gain | 853 | |||
| Balance, December 31, 2010 | 36,342 | |||
| Unrealized loss | (21 | ) | ||
| Balance, December 31, 2011 | 36,321 | |||
| Realized loss | 152 | |||
| Unrealized gain | 2,359 | |||
| Balance, December 31, 2012 | $ | 38,832 | ||
COLFAX CORPORATION
NOTES TO CONSOLIDATED FINANCIAL STATEMENTS – (Continued)
The following table sets forth the components of net periodic benefit cost and Other comprehensive loss (income) of the non-contributory defined benefit pension plans and the Company’s other post-retirement employee benefit plans:
| Pension Benefits | Other Post-Retirement Benefits | |||||||||||||||||||||||
| Year Ended December 31, | Year Ended December 31, | |||||||||||||||||||||||
| 2012 | 2011 | 2010 | 2012 | 2011 | 2010 | |||||||||||||||||||
| (In thousands) | ||||||||||||||||||||||||
| Components of Net Periodic Benefit Cost: | ||||||||||||||||||||||||
| Service cost | $ | 3,381 | $ | 1,383 | $ | 1,168 | $ | 110 | $ | — | $ | — | ||||||||||||
| Interest cost | 67,743 | 16,408 | 16,514 | 1,507 | 690 | 553 | ||||||||||||||||||
| Amortization | 8,091 | 5,839 | 4,593 | 801 | 852 | 482 | ||||||||||||||||||
| Plan combinations(1) | — | — | 2,877 | — | — | — | ||||||||||||||||||
| Settlement loss | — | 1,499 | — | — | — | — | ||||||||||||||||||
| Other | 28 | — | — | — | — | — | ||||||||||||||||||
| Expected return on plan assets | (61,094 | ) | (18,101 | ) | (19,331 | ) | — | — | — | |||||||||||||||
| Net periodic benefit cost | $ | 18,149 | $ | 7,028 | $ | 5,821 | $ | 2,418 | $ | 1,542 | $ | 1,035 | ||||||||||||
| Change in Plan Assets and Benefit Obligations Recognized in Other Comprehensive Loss (Income): | ||||||||||||||||||||||||
| Current year net actuarial loss (gain) | $ | 98,784 | $ | 37,037 | $ | 16,736 | $ | (1,449 | ) | $ | 1,507 | $ | 3,671 | |||||||||||
| Less amounts included in net periodic benefit cost: | ||||||||||||||||||||||||
| Amortization of net loss | (8,012 | ) | (5,839 | ) | (4,593 | ) | (553 | ) | (604 | ) | (234 | ) | ||||||||||||
| Settlement loss | — | (835 | ) | — | — | — | — | |||||||||||||||||
| Amortization of prior service cost | (79 | ) | — | — | (248 | ) | (248 | ) | (248 | ) | ||||||||||||||
| Total recognized in Other comprehensive loss (income) | $ | 90,693 | $ | 30,363 | $ | 12,143 | $ | (2,250 | ) | $ | 655 | $ | 3,189 | |||||||||||
__________
| (1) | Represents the transfer of assets associated with the pension obligation assumed by the Company for a group of former employees. |
The following table sets forth the components of net periodic benefit cost and Other comprehensive loss of the foreign non-contributory defined benefit pension plans, included in the table above:
| Foreign Pension Benefits | ||||||||||||
| Year Ended December 31, | ||||||||||||
| 2012 | 2011 | 2010 | ||||||||||
| (In thousands) | ||||||||||||
| Components of Net Periodic Benefit Cost: | ||||||||||||
| Service cost | $ | 3,381 | $ | 1,383 | $ | 1,168 | ||||||
| Interest cost | 49,291 | 5,132 | 4,138 | |||||||||
| Amortization | 944 | 588 | 385 | |||||||||
| Plan combinations(1) | — | — | 2,877 | |||||||||
| Settlement loss | — | 1,499 | — | |||||||||
| Other | 28 | — | — | |||||||||
| Expected return on plan assets | (36,535 | ) | (1,400 | ) | (1,259 | ) | ||||||
| Net periodic benefit cost | $ | 17,109 | $ | 7,202 | $ | 7,309 | ||||||
| Change in Plan Assets and Benefit Obligations Recognized in Other Comprehensive Loss: | ||||||||||||
| Current year net actuarial loss | $ | 65,689 | $ | 4,101 | $ | 5,062 | ||||||
| Less amounts included in net periodic benefit cost: | ||||||||||||
| Amortization of net loss | (865 | ) | (588 | ) | (385 | ) | ||||||
| Settlement loss | — | (835 | ) | — | ||||||||
| Amortization of prior service cost | (79 | ) | — | — | ||||||||
| Total recognized in Other comprehensive loss | $ | 64,745 | $ | 2,678 | $ | 4,677 | ||||||
__________
| (1) | Represents the transfer of assets associated with the pension obligation assumed by the Company for a group of former employees. |
COLFAX CORPORATION
NOTES TO CONSOLIDATED FINANCIAL STATEMENTS – (Continued)
The components of net periodic costunrecognized pension and other comprehensive (income) loss were as follows:
Pension Benefits | Other Post-retirement Benefits | |||||||||||||||||||||||
2009 Restated | 2008 Restated | 2007 Restated | 2009 | 2008 | 2007 | |||||||||||||||||||
| Components of net periodic benefit cost: | ||||||||||||||||||||||||
| Service cost | $ | 1,381 | $ | 1,160 | $ | 1,170 | $ | - | $ | - | $ | - | ||||||||||||
| Interest cost | 17,577 | 17,429 | 16,954 | 525 | 501 | 445 | ||||||||||||||||||
| Amortization | 3,639 | 2,523 | 3,606 | 353 | 227 | 133 | ||||||||||||||||||
| Expected return on plan assets | (19,570 | ) | (20,509 | ) | (19,667 | ) | - | - | - | |||||||||||||||
| Net periodic benefit cost | $ | 3,027 | $ | 603 | $ | 2,063 | $ | 878 | $ | 728 | $ | 578 | ||||||||||||
| Change in plan assets and benefit obligations recognized in other comprehensive (income) loss: | ||||||||||||||||||||||||
| Current year net actuarial loss (gain) | 710 | 66,101 | (8,225 | ) | 772 | 901 | 167 | |||||||||||||||||
| Prior service cost | - | - | - | - | 2,359 | - | ||||||||||||||||||
| Less amounts included in net periodic cost: | - | |||||||||||||||||||||||
| Amortization of net loss | (3,639 | ) | (2,523 | ) | (3,606 | ) | (104 | ) | (165 | ) | (133 | ) | ||||||||||||
| Amortization of prior service cost | - | - | - | (249 | ) | (62 | ) | - | ||||||||||||||||
| Total recognized in other comprehensive (income) loss | $ | (2,929 | ) | $ | 63,578 | $ | (11,831 | ) | $ | 419 | $ | 3,033 | $ | 34 | ||||||||||
| Foreign Pension Benefits | ||||||||||||
| 2009 | 2008 | 2007 | ||||||||||
| Components of net periodic benefit cost: | ||||||||||||
| Service cost | $ | 1,381 | $ | 1,160 | $ | 1,170 | ||||||
| Interest cost | 4,668 | 4,364 | 3,738 | |||||||||
| Recognized net actuarial loss | 808 | 348 | 718 | |||||||||
| Expected return on plan assets | (1,204 | ) | (1,456 | ) | (1,538 | ) | ||||||
| Net periodic benefit cost | $ | 5,653 | $ | 4,416 | $ | 4,088 | ||||||
| Change in plan assets and benefit obligations recognized in other comprehensive loss (income): | ||||||||||||
| Current year net actuarial (gain) loss | (6,464 | ) | 6,339 | (4,202 | ) | |||||||
| Less amounts included in net periodic cost: | ||||||||||||
| Amortization of net loss | (808 | ) | (348 | ) | (718 | ) | ||||||
| Total recognized in other comprehensive loss (income) | $ | (7,272 | ) | $ | 5,991 | $ | (4,920 | ) | ||||
| Other | ||||||||||||||||
| Pension Benefits | Post-retirement Benefits | |||||||||||||||
| At December 31, | 2009 Restated | 2008 Restated | 2009 | 2008 | ||||||||||||
| Net actuarial loss | $ | 141,614 | $ | 144,543 | $ | 3,337 | $ | 2,669 | ||||||||
| Prior service cost | - | - | 2,048 | 2,297 | ||||||||||||
| Total | $ | 141,614 | $ | 144,543 | $ | 5,385 | $ | 4,966 | ||||||||
| Pension Benefits | Other Post-Retirement Benefits | |||||||||||||||
| December 31, | December 31, | |||||||||||||||
| 2012 | 2011 | 2012 | 2011 | |||||||||||||
| (In thousands) | ||||||||||||||||
| Net actuarial loss | $ | 275,211 | $ | 184,532 | $ | 5,676 | $ | 7,677 | ||||||||
| Prior service cost | — | — | 1,303 | 1,552 | ||||||||||||
| Total | $ | 275,211 | $ | 184,532 | $ | 6,979 | $ | 9,229 | ||||||||
The components of accumulatednet unrecognized pension and other post-retirement benefit cost included in Accumulated other comprehensive incomeloss in the Consolidated Balance Sheets that are expected to be recognized inas a component of net periodic benefit cost during the year ended December 31, 20102013 are as follows:
| Pension | Other | |||||||
| Benefits | Post-retirement | |||||||
| Restated | Benefits | |||||||
| Net actuarial loss | $ | 4,565 | $ | 248 | ||||
| Prior service cost | - | 233 | ||||||
| Total | $ | 4,565 | $ | 481 | ||||
| Pension Benefits | Other Post- Retirement Benefits | |||||||
| (In thousands) | ||||||||
| Net actuarial loss | $ | 10,151 | $ | 465 | ||||
| Prior service cost | — | 248 | ||||||
| Total | $ | 10,151 | $ | 713 | ||||
The key economic assumptions used in the measurement of the Company’s pension and other post-retirement benefit obligations at December 31, 2009 and 2008 are as follows:
| Pension Benefits | Other Post-retirement Benefits | |||||||||||||||
| 2009 | 2008 | 2009 | 2008 | |||||||||||||
| Weighted-average discount rate: | ||||||||||||||||
| For all plans | 5.7 | % | 6.1 | % | 5.6 | % | 6.0 | % | ||||||||
| For all foreign plans | 5.6 | % | 5.8 | % | - | - | ||||||||||
| Weighted-average rate of increase in compensation levels for active foreign plans | 2.0 | % | 2.1 | % | - | - | ||||||||||
| Pension Benefits | Other Post-Retirement Benefits | |||||||||||||||
| December 31, | December 31, | |||||||||||||||
| 2012 | 2011 | 2012 | 2011 | |||||||||||||
| Weighted-average discount rate: | ||||||||||||||||
| All plans | 4.0 | % | 4.2 | % | 3.4 | % | 4.2 | % | ||||||||
| Foreign plans | 4.2 | % | 4.9 | % | — | — | ||||||||||
| Weighted-average rate of increase in compensation levels for active foreign plans | 1.5 | % | 2.6 | % | — | — | ||||||||||
The key economic assumptions used in the computation of net periodic benefit cost for the years ended December 31, 2009, 2008 and 2007 are as follows:
| Pension Benefits | Other Post-retirement Benefits | |||||||||||||||||||||||
| 2009 | 2008 | 2007 | 2009 | 2008 | 2007 | |||||||||||||||||||
| Weighted-average discount rate: | ||||||||||||||||||||||||
| For all plans | 6.1 | % | 6.0 | % | 5.9 | % | 6.0 | % | 6.3 | % | 6.0 | % | ||||||||||||
| For all foreign plans | 5.8 | % | 4.7 | % | 5.4 | % | - | - | - | |||||||||||||||
| Weighted-average expected return on plan assets: | ||||||||||||||||||||||||
| For all plans | 8.3 | % | 8.3 | % | 8.4 | % | - | - | - | |||||||||||||||
| For all foreign plans | 5.0 | % | 5.1 | % | 5.5 | % | - | - | - | |||||||||||||||
| Weighted-average rate of increase in compensation levels for active foreign plans | 2.1 | % | 2.2 | % | 2.6 | % | - | - | - | |||||||||||||||
| Pension Benefits | Other Post-Retirement Benefits | |||||||||||||||||||||||
| Year Ended December 31, | Year Ended December 31, | |||||||||||||||||||||||
| 2012 | 2011 | 2010 | 2012 | 2011 | 2010 | |||||||||||||||||||
| Weighted-average discount rate: | ||||||||||||||||||||||||
| All plans | 4.6 | % | 5.0 | % | 5.7 | % | 4.3 | % | 5.2 | % | 5.6 | % | ||||||||||||
| Foreign plans | 4.7 | % | 5.1 | % | 5.6 | % | — | — | — | |||||||||||||||
| Weighted-average expected return on plan assets: | ||||||||||||||||||||||||
| All plans | 5.3 | % | 7.7 | % | 8.3 | % | — | — | — | |||||||||||||||
| Foreign plans | 4.5 | % | 4.7 | % | 5.4 | % | — | — | — | |||||||||||||||
| Weighted-average rate of increase in compensation levels for active foreign plans | 1.3 | % | 2.6 | % | 2.2 | % | — | — | — | |||||||||||||||
In determining discount rates, the Company utilizes the single discount rate equivalent to discounting the expected future cash flows from each plan using the yields at each duration from a published yield curve as of the measurement date.
COLFAX CORPORATION
NOTES TO CONSOLIDATED FINANCIAL STATEMENTS – (Continued)
For measurement purposes, ana weighted-average annual rate of increase in the per capita cost of covered health care benefits of approximately 7.0%10.7% was assumed. The rate was assumed to decrease gradually to 4.5% by 2027 for three of the Company’s plans and to 5.0% by 20142019 for another plan and remain at that levelthose levels thereafter for benefits covered under the plans.
The expected long-term rate of return on plan assets was based on the Company’s investment policy target allocation of the asset portfolio between various asset classes and the expected real returns of each asset class over various periods of time that are consistent with the long-term nature of the underlying obligations of these plans.
Assumed health care cost trend rates have a significant effect on the amounts reported for the health care plan. A one-percentage point change in assumed health care cost trend rates would have the following pre-tax effects:
1 Percentage Point Increase | 1 Percentage Point Decrease | |||||||
| Effect on total service and interest cost components for 2009 | $ | 44 | $ | (35 | ) | |||
| Effect on post-retirement benefit obligation at December 31, 2009 | 1,201 | (945 | ) | |||||
| 1% Increase | 1% Decrease | |||||||
| (in thousands) | ||||||||
| Effect on total service and interest cost components for the year ended December 31, 2012 | $ | 165 | $ | (142 | ) | |||
| Effect on post-retirement benefit obligation at December 31, 2012 | 3,149 | (2,659 | ) | |||||
The Company maintains defined contribution plans covering substantially all of theirits non-union domestic employees, as well asand certain union domestic employees. Under the terms of the plans, eligible employees may generally contribute from 1% to 50% of their compensation on a pre-tax basis. The Company’s contributions are based on 50% of the first 6% of each participant’s pre-tax contribution. Additionally, the Company makes a unilateral contribution of 3% of all employees’ salary (including non-contributing participants) to the defined contribution plans. The Company’s expense for 2009, 2008 and 2007 was $2.4 million, $2.2 million and $2.0 million, respectively, related to these plans.
| December 31, | ||||||||
| 2009 | 2008 | |||||||
| Term A notes (senior bank debt) | $ | 91,250 | $ | 96,250 | ||||
| Capital leases and other | 235 | 871 | ||||||
| Total debt | 91,485 | 97,121 | ||||||
| Less-current portion Term A | (8,750 | ) | (5,000 | ) | ||||
| Less-current portion capital leases and other | (219 | ) | (420 | ) | ||||
| $ | 82,516 | $ | 91,701 | |||||
| Term Debt | Capital Leases & Other | Total | ||||||||||
| 2010 | $ | 8,750 | $ | 219 | $ | 8,969 | ||||||
| 2011 | 10,000 | 7 | 10,007 | |||||||||
| 2012 | 10,000 | 9 | 10,009 | |||||||||
| 2013 | 62,500 | - | 62,500 | |||||||||
| 2014 | - | - | - | |||||||||
| Total | $ | 91,250 | $ | 235 | $ | 91,485 | ||||||
| December 31, | ||||||||
2009 Restated | 2008 Restated | |||||||
| Foreign currency translation adjustment | $ | 14,188 | $ | 8,787 | ||||
| Unrealized losses on hedging activities | (3,035 | ) | (5,050 | ) | ||||
| Net unrecognized pension and other post-retirement benefit costs | (120,950 | ) | (122,594 | ) | ||||
| Total accumulated other comprehensive loss | $ | (109,797 | ) | $ | (118,857 | ) | ||
| Years Ended December 31, | ||||||||
| 2009 | 2008 | |||||||
| Weighted-average assumptions used in Black-Scholes model: | ||||||||
Expected period that options will be outstanding (in years) | 4.50 | 4.50 | ||||||
Interest rate (based on U.S. Treasury yields at time of grant) | 1.87 | % | 3.08 | % | ||||
| Volatility | 32.50 | % | 32.35 | % | ||||
| Dividend yield | - | - | ||||||
| Weighted-average fair value of options granted | $ | 2.24 | $ | 5.75 | ||||
| Shares | Weighted- Average Exercise Price | Remaining Contractual Term | Aggregate Intrinsic Value | |||||||||||||
| (Years) | ||||||||||||||||
| Outstanding at January 1, 2008 | - | $ | - | |||||||||||||
| Granted | 531,999 | 17.94 | ||||||||||||||
| Exercised | - | - | ||||||||||||||
| Forfeited | (17,008 | ) | 18.00 | |||||||||||||
| Outstanding at December 31, 2008 | 514,991 | $ | 17.93 | |||||||||||||
| Granted | 844,165 | 7.44 | ||||||||||||||
| Exercised | - | - | ||||||||||||||
| Forfeited | (91,523 | ) | 11.70 | |||||||||||||
| Outstanding at December 31, 2009 | 1,267,633 | $ | 11.40 | 5.88 | $ | 3,655 | ||||||||||
| Vested and expected to vest at December 31, 2009 | 1,150,635 | $ | 11.16 | 5.90 | $ | 3,439 | ||||||||||
| Exercisable at December 31, 2009 | 159,883 | $ | 17.93 | 5.36 | $ | 8 | ||||||||||
| PRSUs | RSUs | |||||||||||||||
| Nonvested shares | Shares | Weighted- Average Grant Date Fair Value | Shares | Weighted- Average Grant Date Fair Value | ||||||||||||
| Nonvested at January 1, 2008 | - | - | - | - | ||||||||||||
| Granted | 125,041 | 17.89 | 73,305 | 18.00 | ||||||||||||
| Vested | - | - | - | - | ||||||||||||
| Forfeited | (694 | ) | 18.00 | (1,116 | ) | 18.00 | ||||||||||
| Nonvested at December 31, 2008 | 124,347 | $ | 17.89 | 72,189 | $ | 18.00 | ||||||||||
| Granted | 337,716 | 7.44 | 69,610 | 8.35 | ||||||||||||
| Vested | - | - | (48,871 | ) | 15.72 | |||||||||||
| Forfeited | (31,566 | ) | 10.69 | - | - | |||||||||||
| Nonvested at December 31, 2009 | 430,497 | $ | 10.22 | 92,928 | $ | 11.97 | ||||||||||
| 14. | Financial Instruments and Fair Value Measurements |
The carrying values of financial instruments, including accounts receivable, accountsTrade receivables and Accounts payable, and other accrued liabilities, approximate their fair values due to their short-term maturities. The estimated fair value of the Company’s long-term debt of $88.6$1.7 billion and $110.9 million and $92.3 million atas of December 31, 20092012 and 2008,2011, respectively, was based on current interest rates for similar types of borrowings.borrowings and is in Level Two of the fair value hierarchy. The estimated fair values may not represent actual values of the financial instruments that could be realized as of the balance sheet date of the Consolidated Balance Sheets or that will be realized in the future.
COLFAX CORPORATION
NOTES TO CONSOLIDATED FINANCIAL STATEMENTS – (Continued)
A summary of the Company’s assets and liabilities that are measured at fair value on a recurring basis for each fair value hierarchy level foris as follows:
| December 31, 2012 | ||||||||||||||||
Level One | Level Two | Level Three | Total | |||||||||||||
| (In thousands) | ||||||||||||||||
| Assets: | ||||||||||||||||
| Cash equivalents | $ | 133,878 | $ | — | $ | — | $ | 133,878 | ||||||||
| Foreign currency contracts related to sales – designated as hedges | — | 6,832 | — | 6,832 | ||||||||||||
| Foreign currency contracts related to sales – not designated as hedges | — | 2,249 | — | 2,249 | ||||||||||||
| Foreign currency contracts related to purchases – designated as hedges | — | 213 | — | 213 | ||||||||||||
| Foreign currency contracts related to purchases – not designated as hedges | — | 1,077 | — | 1,077 | ||||||||||||
| Deferred compensation plans | — | 2,542 | — | 2,542 | ||||||||||||
| $ | 133,878 | $ | 12,913 | $ | — | $ | 146,791 | |||||||||
| Liabilities: | ||||||||||||||||
| Foreign currency contracts related to sales – designated as hedges | $ | — | $ | 1,024 | $ | — | $ | 1,024 | ||||||||
| Foreign currency contracts related to sales – not designated as hedges | — | 1,693 | — | 1,693 | ||||||||||||
| Foreign currency contracts related to purchases – designated as hedges | — | 896 | — | 896 | ||||||||||||
| Foreign currency contracts related to purchases – not designated as hedges | — | 1,062 | — | 1,062 | ||||||||||||
| Deferred compensation plans | — | 2,542 | — | 2,542 | ||||||||||||
| Liability for contingent payments | — | — | 6,517 | 6,517 | ||||||||||||
| $ | — | $ | 7,217 | $ | 6,517 | $ | 13,734 | |||||||||
| December 31, 2011 | ||||||||||||||||
Level One | Level Two | Level Three | Total | |||||||||||||
| (In thousands) | ||||||||||||||||
| Assets: | ||||||||||||||||
| Cash equivalents | $ | 15,540 | $ | — | $ | — | $ | 15,540 | ||||||||
| Foreign currency contracts – primarily related to customer sales contracts | — | 5 | — | 5 | ||||||||||||
| $ | 15,540 | $ | 5 | $ | — | $ | 15,545 | |||||||||
| Liabilities: | ||||||||||||||||
| Interest rate swap | $ | — | $ | 471 | $ | — | $ | 471 | ||||||||
| Foreign currency contracts – acquisition-related | — | 14,986 | — | 14,986 | ||||||||||||
| Foreign currency contracts – primarily related to customer sales contracts | — | 371 | — | 371 | ||||||||||||
| Liability for contingent payments | — | — | 4,359 | 4,359 | ||||||||||||
| $ | — | $ | 15,828 | $ | 4,359 | $ | 20,187 | |||||||||
There were no transfers in or out of Level One, Two or Three during the periods presented follows:years ended December 31, 2012 or 2011.
| 79 |
| Total | Level 1 | Level 2 | Level 3 | |||||||||||||
| As of December 31, 2009 | ||||||||||||||||
| Assets: | ||||||||||||||||
| Cash equivalents | $ | 33,846 | $ | 33,846 | $ | - | $ | - | ||||||||
| Liabilities: | ||||||||||||||||
| Derivatives | $ | 3,156 | $ | - | $ | 3,156 | $ | - | ||||||||
| As of December 31, 2008 | ||||||||||||||||
| Assets: | ||||||||||||||||
| Cash equivalents | $ | 17,965 | $ | 17,965 | $ | - | $ | - | ||||||||
| Derivatives | 1,651 | - | 1,651 | - | ||||||||||||
| $ | 19,616 | $ | 17,965 | $ | 1,651 | $ | - | |||||||||
| Liabilities: | ||||||||||||||||
| Derivatives | $ | 7,070 | $ | - | $ | 7,070 | $ | - | ||||||||
COLFAX CORPORATION
NOTES TO CONSOLIDATED FINANCIAL STATEMENTS – (Continued)
Cash Equivalents
The Company’s cash equivalents consist of investments in interest-bearing deposit accounts and money market mutual funds which are valued based on quoted market prices. The fair value of these investments approximate cost due to their short-term maturities and the high credit quality of the issuers of the underlying securities. Interest
Derivatives
The Company periodically enters into foreign currency, interest rate swap, and commodity derivative contracts. The Company uses interest rate swaps to manage exposure to interest rate fluctuations. Foreign currency contracts are valued based on forward curves observableused to manage exchange rate fluctuations. Commodity futures contracts are used to manage costs of raw materials used in the market. Other derivative contracts are measured using broker quotations or observable market transactions in either listed or over-the-counter markets. Company’s production processes.
There were no changes during the periods presented in the Company’s valuation techniques used to measure asset and liability fair values on a recurring basis.
Interest Rate Swap.The Company’s interest rate swap with an aggregateis valued based on forward curves observable in the market. The notional value of $75the Company’s interest rate swap was $25 million whereby itas of December 31, 2011, which exchanged its LIBOR-based variable ratevariable-rate interest for a fixed rate of 4.1375%. The notional value decreases to $50 million and then $25 million on June 30, 2010 and June 30, 2011, respectively, and expires on June 29, 2012. The fair valueOn January 11, 2012, the Company terminated its interest rate swap in conjunction with the repayment of the swap agreement, based on third-party quotes, was a liabilityBank of $3.0 millionAmerica Credit Agreement and $5.0 million at December 31, 2009 and 2008, respectively, which are recorded in “Other long term liabilities” on the consolidated balance sheet. The swap agreement has been designated as a cash flow hedge, and therefore changes in its fair value are recorded as an adjustment to other comprehensive income. There has been no ineffectiveness related to this arrangement since its inception. During the years ended December 31, 2009 and 2008, $2.9 million and $0.8 million, respectively, of losses on the swap were reclassified from AOCI to interest expense. At December 31, 2009, the Company expects to reclassify $2.3$0.5 million of net losses on the interest rate swap from accumulatedAccumulated other comprehensive incomeloss to earnings duringInterest expense in the next twelve months.
Foreign Currency Contracts.Foreign currency contracts are measured using broker quotations or observable market transactions in either listed or over-the-counter markets. The Company primarily uses foreign currency contracts to mitigate the Company entered into a cross currency swaprisk associated with customer forward sale agreements denominated in Euro with an aggregate notional value of $27.3 million. The notional value decreased ratably each month overcurrencies other than the term ofapplicable local currency, and to match costs and expected revenues where production facilities have a different currency than the agreement and expired on March 31, 2009. selling currency.
The fair value of the swap agreement, based on third-party quotes, was an asset of $1.0 million at December 31, 2008. The swap agreement was designated as a cash flow hedge, and therefore changes in its fair value were recorded as an adjustment to other comprehensive income. There was no ineffectiveness related to this arrangement.
| December 31, | ||||||||
| 2012 | 2011 | |||||||
| (In thousands) | ||||||||
| Foreign currency contracts sold – not designated as hedges | $ | 301,185 | $ | — | ||||
| Foreign currency contracts sold – designated as hedges | 238,537 | 5,116 | ||||||
| Foreign currency contracts purchased – not designated as hedges | 121,741 | — | ||||||
| Foreign currency contracts purchased – designated as hedges | 37,065 | — | ||||||
| Foreign currency contracts – acquisition related | — | 4,249,954 | ||||||
| Total foreign currency derivatives | $ | 698,528 | $ | 4,255,070 | ||||
COLFAX CORPORATION
NOTES TO CONSOLIDATED FINANCIAL STATEMENTS – (Continued)
The Company has not elected hedge accountingrecognized the following in its Consolidated Financial Statements related to its derivative instruments:
| Year Ended December 31, | ||||||||||||
| 2012 | 2011 | 2010 | ||||||||||
| (In thousands) | ||||||||||||
| Contracts Designated as Hedges: | ||||||||||||
| Interest Rate Swap: | ||||||||||||
| Unrealized loss | $ | — | $ | (161 | ) | $ | (1,201 | ) | ||||
| Realized loss | (471 | ) | (1,479 | ) | (2,447 | ) | ||||||
| Foreign Currency Contracts – related to customer sales contracts: | ||||||||||||
| Unrealized gain | 2,120 | — | — | |||||||||
| Realized gain | 2,297 | — | — | |||||||||
| Foreign Currency Contracts – related to supplier purchases contracts: | ||||||||||||
| Unrealized loss | (374 | ) | — | — | ||||||||
| Realized loss | (475 | ) | — | — | ||||||||
| Unrealized loss on net investment hedge | (7,783 | ) | — | — | ||||||||
| Contracts Not Designated in a Hedge Relationship: | ||||||||||||
| Foreign Currency Contracts – acquisition-related: | ||||||||||||
| Unrealized loss, net | — | (21,013 | ) | — | ||||||||
| Realized loss, net | (7,177 | ) | — | — | ||||||||
| Foreign Currency Contracts – primarily related to customer sales contracts: | ||||||||||||
| Unrealized gain (loss) | 778 | (204 | ) | 93 | ||||||||
| Realized gain (loss) | 712 | 152 | (838 | ) | ||||||||
Foreign Currency Contracts – related to supplier purchases contracts: | ||||||||||||
Unrealized (loss) gain | (560 | ) | 81 | — | ||||||||
Realized gain (loss) | 868 | (20 | ) | — | ||||||||
Liability for these contracts; therefore, changes inContingent Payments
The Company’s liability for contingent payments represents the fair value of estimated additional cash payments related to its acquisition of COT-Puritech in December of 2011, which are subject to the achievement of certain performance goals, and is included in Other liabilities in the Consolidated Balance Sheets. The fair value of the liability for contingent payments represents the present value of probability weighted expected cash flows based upon the Company’s internal model and projections and is included in Level Three of the fair value hierarchy. Accretion is recognized in Interest expense in the Consolidated Statements of Operations and realized or unrealized gains or losses are recognized as a component of selling,in Selling, general and administrative expense. Forexpense in the Consolidated Statements of Operations.
A summary of activity in the Company’s liability for contingent payments during the years ended December 31, 2009, 20082011 and 2007, the consolidated statements of operations include $(0.7) million, $0.3 million and $0.2 million, respectively, of unrealized gains (losses)2012 is as a result of changes in the fair value of these contracts. Realized gains (losses) on these contracts of $0.9 million, $(0.3) million and $0.5 million were recognized in the years ended December 31, 2009, 2008, and 2007, respectively.
| (In thousands) | ||||
| Balance, January 1, 2011 | $ | — | ||
| Additions | 4,300 | |||
| Interest accretion | 59 | |||
| Balance, December 31, 2011 | 4,359 | |||
| Interest accretion | 712 | |||
| Unrealized loss | (1,446 | ) | ||
| Balance, December 31, 2012 | $ | 6,517 | ||
| 15. | Concentration of Credit Risk |
The Company did not elect hedge accounting for the collar agreement, and therefore changes in the fair value were recognized in income as a component of interest expense. The collar agreement expired on July 1, 2008.
COLFAX CORPORATION
NOTES TO CONSOLIDATED FINANCIAL STATEMENTS – (Continued)
The Company may be exposed to credit-related losses in the event of non-performance by counterparties to financial instruments. Counterparties to the Company’s financial instruments represent, in general, internationalThe Company enters into derivative contracts with financial institutions or well-established financial institutions.
| Year ended December 31, | ||||||||||||
| 2009 | 2008 | 2007 | ||||||||||
| Net sales by origin: | ||||||||||||
| United States | $ | 177,373 | $ | 189,924 | $ | 173,713 | ||||||
| Foreign locations: | ||||||||||||
| Germany | 180,917 | 239,723 | 190,693 | |||||||||
| Other | 166,734 | 175,207 | 141,899 | |||||||||
| Total foreign locations | 347,651 | 414,930 | 332,592 | |||||||||
| Total net sales | $ | 525,024 | $ | 604,854 | $ | 506,305 | ||||||
| Net sales by product: | ||||||||||||
| Pumps, including aftermarket parts and service | $ | 443,073 | $ | 529,300 | $ | 441,692 | ||||||
| Systems, including installation service | 69,339 | 58,231 | 48,355 | |||||||||
| Valves | 10,081 | 10,094 | 9,537 | |||||||||
| Other | 2,531 | 7,229 | 6,721 | |||||||||
| Total net sales | $ | 525,024 | $ | 604,854 | $ | 506,305 | ||||||
| December 31, | ||||||||
| 2009 | 2008 | |||||||
| Long-lived assets: | ||||||||
| United States | $ | 24,785 | $ | 26,257 | ||||
| Foreign locations: | ||||||||
| Germany | 48,232 | 48,598 | ||||||
| Other | 19,073 | 17,235 | ||||||
| Total foreign locations | 67,305 | 65,833 | ||||||
| Total long-lived assets | $ | 92,090 | $ | 92,090 | ||||
| 16. | Commitments and Contingencies |
Asbestos and Other Product Liability Contingencies
Certain subsidiaries are each one of many defendants in a large number of lawsuits that claim personal injury as a result of exposure to asbestos from products manufactured with components that are alleged to have contained asbestos. Such components were acquired from third-party suppliers, and were not manufactured by any of ourthe Company’s subsidiaries nor were the subsidiaries producers or direct suppliers of asbestos. The manufactured products that are alleged to have contained asbestos generally were provided to meet the specifications of the subsidiaries’ customers, including the U.S. Navy.
The subsidiaries settle asbestos claims for amounts managementthe Company considers reasonable given the facts and circumstances of each claim. The annual average settlement payment per asbestos claimant has fluctuated during the past several years. ManagementThe Company expects such fluctuations to continue in the future based upon, among other things, the number and type of claims settled in a particular period and the jurisdictions in which such claims arise. To date, the majority of settled claims have been dismissed for no payment.
Claims activity since December 31 related to asbestos claims is as follows(1):
| Year ended December 31, | ||||||||||||
| 2009 | 2008 | 2007 | ||||||||||
| Claims unresolved at the beginning of the period | 35,357 | 37,554 | 50,020 | |||||||||
Claims filed (2) | 3,323 | 4,729 | 6,861 | |||||||||
Claims resolved (3) | (13,385 | ) | (6,926 | ) | (19,327 | ) | ||||||
| Claims unresolved at the end of the period | 25,295 | 35,357 | 37,554 | |||||||||
Average cost of resolved claims (4) | $ | 11,106 | $ | 5,378 | $ | 5,232 | ||||||
| Year Ended December 31, | ||||||||||||
| 2012 | 2011 | 2010 | ||||||||||
| (Number of Claims) | ||||||||||||
| Claims unresolved, beginning of period | 23,682 | 24,764 | 25,295 | |||||||||
| Acquisitions | 1,599 | — | — | |||||||||
| Claims filed(2) | 4,335 | 4,927 | 3,692 | |||||||||
| Claims resolved(3) | (6,093 | ) | (6,009 | ) | (4,223 | ) | ||||||
| Claims unresolved, end of period | 23,523 | 23,682 | 24,764 | |||||||||
| (In dollars) | ||||||||||||
| Average cost of resolved claims(4) | $ | 6,606 | $ | 15,397 | $ | 12,037 | ||||||
__________
| (1) | Excludes claims filed by one legal firm that have been “administratively dismissed.” |
| (2) | Claims filed include all asbestos claims for which notification has been received or a file has been opened. |
| (3) | Claims resolved include all asbestos claims that have been settled, |
| Excludes claims |
The Company has projected each subsidiary’s future asbestos-related liability costs with regard to pending and future unasserted claims based upon the Nicholson methodology. The Nicholson methodology is thea standard approach used by most experts and has been accepted by numerous courts. It is the Company’s policy to record a liability for asbestos-related liability costs for the longest period of time that it can reasonably estimate.
The Company believes that it can reasonably estimate the asbestos-related liability for pending and future claims that will be resolved in the next 15 years and has recorded that liability as its best estimate. While it is reasonably possible that the subsidiaries will incur costs after this period, the Company does not believe the reasonably possible loss or range of reasonably possible loss is estimable at the current time. Accordingly, no accrual has been recorded for any costs which may be paid after the next 15 years. Defense costs associated with asbestos-related liabilities as well as costs incurred related to litigation against the subsidiaries’ insurers are expensed as incurred.
COLFAX CORPORATION
NOTES TO CONSOLIDATED FINANCIAL STATEMENTS – (Continued)
Each subsidiary has separate substantial insurance coverage resulting from the independent corporate historyacquired prior to Company ownership of each independent entity. In its evaluation of the insurance asset, in addition to the criteria listed above, the Company used differing insurance allocation methodologies for each subsidiary based upon the applicable law pertaining to the affected subsidiary.
For one of the subsidiaries, on October 14, 2009, the Delaware Court of Chancery ruled on October 14, 2009 that asbestos-related costs should be allocated among excess insurers using an “all sums” allocation (which allows an insured to collect all sums paid in connection with a claim from any insurer whose policy is triggered, up to the policy’s applicable limits) and that the subsidiary has rights to excess insurance policies purchased by a former owner of the business. Based upon this ruling mandating an “all sums” allocation, as well as the language of the underlying insurance policies and the determinationassertion and belief that defense costs are outside policy limits, the Company as of October 2, 2009, increased itsCompany’s future expected recovery percentage from 67% tois 90% of asbestos-related costs following the exhaustion in the future of its primary and umbrella layers of insurance and recorded a pretax gain of $17.3 million. The subsidiary expects to be responsible for approximately 10% of allits future asbestos-related costs.
For this subsidiary, during the year ended December 31, 2010, an insolvent carrier that had written approximately $1.4 million in limits for which the subsidiary entered intohad assumed no recovery made a cash settlement agreement withoffer of approximately $0.7 million. As such, the subsidiary recorded a gain for this amount.
The subsidiary was notified in 2010 by the primary and umbrella carrier governing all aspectswho had been fully defending and indemnifying the subsidiary for 20 years that the limits of liability of its primary and umbrella layer policies had been exhausted. Since then, the subsidiary has sought coverage from certain excess layer insurers whose terms and conditions follow form to the umbrella carrier. Certain first-layer excess insurers have defended and/or indemnified the subsidiary, subject to their reservations of rights and their applicable policy limits. A trial concerning the payment obligations of the carrier’s pastCompany’s excess insurers concluded during fourth quarter of 2012, with a final ruling pending. The subsidiary continues to work with its excess insurers to obtain defense and future handlingindemnity payments while the litigation is proceeding. Given the uncertainties of litigation, there is a variety of possible outcomes, including but not limited to the subsidiary being required to fund all or a portion of the asbestos related bodily injurysubsidiary’s defense and indemnity payments until such time a final ruling orders payment by the insurers. While not impacting the results of operations, the funding requirement could range up to $10 million per quarter until final resolution. In addition, because a statistically significant increase in mesothelioma claims against the subsidiary. As a result ofhad occurred and was expected to continue to occur in certain regions, this agreement, during the third quarter of 2008, the Company increased its insurance asset by $7.0 million attributable to resolution of a dispute concerning certain pre-1966 insurance policies andsubsidiary recorded a corresponding pretax gain. The additional$1.8 million pre-tax charge, which was comprised of an increase in its asbestos-related liabilities of $18.1 million partially offset by an increase in expected insurance will be allocated by the carrier to cover any gaps in coverage up to $7.0recoveries of $16.3 million, resulting from exhaustion of umbrella policies and/or the failure of any excess carrier to pay amounts incurred in connection with asbestos claims. The Company reimbursed the primary insurer for $7.6 million in deductibles and retrospective premiums induring the fourth quarter of 2008 and has no further liability to the insurer under these provisions of the primary policies.
In 2003, the other subsidiary brought legal actionfiled a lawsuit against a large number of its insurers and its former parent to resolve a variety of disputes concerning insurance for asbestos-related bodily injury claims asserted against it. Although none of these insurance companies contested coverage, they disputed the timing, reasonableness and allocation of payments.
For this subsidiary it was determined by court ruling in the fourth quarter of 2007, that the allocation methodology mandated by the New Jersey courts will apply. Further court rulings in December of 2009, clarified the allocation calculation related to amounts currently due from insurers as well as amounts the Company expects to be reimbursed for asbestos-related costs incurred in future periods.
In connection with this litigation, the court engaged a special master to review the appropriate information and recommend an allocation formula in accordance with applicable law and the facts of the case. During 2010, the court-appointed special allocation master made its recommendation. As a result, in the fourth quarter of 2009, the Company increased its receivable for past costs by $11.9 million and decreased its insurance asset for future costs by $9.8 million and recorded a pretax gain of $2.1 million. The subsidiary expects to responsible for approximately 14% of all future asbestos-related costs.
COLFAX CORPORATION
NOTES TO CONSOLIDATED FINANCIAL STATEMENTS – (Continued)
The Company’s Consolidated Balance Sheets included the following amounts for asbestos-related litigation:
| December 31, | ||||||||
| 2012 | 2011 | |||||||
| (In thousands) | ||||||||
| Current asbestos insurance asset(1) | $ | 35,566 | $ | 43,452 | ||||
| Current asbestos insurance receivable(1) | 36,778 | 33,696 | ||||||
| Long-term asbestos insurance asset(2) | 315,363 | 326,838 | ||||||
| Long-term asbestos insurance receivable(2) | 7,063 | 14,034 | ||||||
| Accrued asbestos liability(3) | 58,501 | 76,295 | ||||||
| Long-term asbestos liability(4) | 375,493 | 382,394 | ||||||
__________
| (1) | Included in Other current assets in the Consolidated Balance Sheets. |
| (2) | Included in Other assets in the Consolidated Balance Sheets. |
| (3) | Represents current reserves for probable and reasonably estimable asbestos-related liability cost that the Company believes the subsidiaries will pay through the next 15 years, overpayments by certain insurers and unpaid legal costs related to defending themselves against asbestos-related liability claims and legal action against the Company’s insurers, which is included in Accrued liabilities in the Consolidated Balance Sheets. |
| (4) | Included in Other liabilities in the Consolidated Balance Sheets. |
Management’s analyses are based on currently known facts and a number of assumptions. However, projecting future events, such as new claims to be filed each year, the average cost of resolving each claim, coverage issues among layers of insurers, the method in which losses will be allocated to the various insurance policies, interpretation of the effect on coverage of various policy terms and limits and their interrelationships, the continuing solvency of various insurance companies, the amount of remaining insurance available, as well as the numerous uncertainties inherent in asbestos litigation could cause the actual liabilities and insurance recoveries to be higher or lower than those projected or recorded which could materially affect ourthe Company’s financial condition, results of operations or cash flow.
General Litigation
On June 3, 1997, one of ourthe Company’s subsidiaries was served with a complaint in a case brought by Litton Industries, Inc. (“Litton”) in the Superior Court of New Jersey which alleges damages in excess of $10.0 million incurred as a result of losses under a government contract bid transferred in connection with the sale of its former Electro-Optical Systems business. In the third quarter of 2004, this case was tried and the jury rendered a verdict of $2.1 million for the plaintiffs. After appeals by both parties, the Supreme Court of New Jersey upheld the plaintiffs’ right to a refund of their attorney’s fees and costs of trial, but remanded the issue to the trial court to reconsider the amount of fees using a proportionality analysis of the relationship between the fee requested and the damages recovered. In June 2012, the subsidiary entered into a settlement agreement for and made a payment of $8.5 million. The datesettlement did not have a significant impact on the Consolidated Statement of Operations for the new trial on additional claims allowed by the Appellate Division of the New Jersey Superior Court and the recalculation of attorney’s fees has not been set. The subsidiary intends to continue to defend this matter vigorously. Atyear ended December 31, 2009, the Company’s consolidated balance sheet includes a liability, reflected in “Other liabilities”, related to this matter of $9.5 million.
The Company is also involved in various other pending legal proceedings arising out of the ordinary course of the Company’s business. None of these legal proceedings are expected to have a material adverse effect on the financial condition, results of operations or cash flow of the Company. With respect to these proceedings and the litigation and claims described in the preceding paragraphs, management of the Company believes that it will either prevail, has adequate insurance coverage or has established appropriate reserves to cover potential liabilities. Any costs that management estimates may be paid related to these proceedings or claims are accrued when the liability is considered probable and the amount can be reasonably estimated. There can be no assurance, however, as to the ultimate outcome of any of these matters, and if all or substantially all of these legal proceedings were to be determined adverselyadverse to the Company, there could be a material adverse effect on the financial condition, results of operations or cash flow of the Company.
| 84 |
COLFAX CORPORATION
NOTES TO CONSOLIDATED FINANCIAL STATEMENTS – (Continued)
Guarantees
As of December 31, 2009, there were $14.4 million of letters of credit outstanding. Additionally, at December 31, 2009, we had issued $12.92012, the Company has $59.7 million of bank guarantees securing primarily customer prepayments, performance and product warranties in our European and Asian operations.
Minimum Lease Obligations
The Company has the followingCompany’s minimum rental obligations under non-cancelable operating leases are as follows:
| December 31, 2012 | ||||
| (In thousands) | ||||
| 2013 | $ | 30,166 | ||
| 2014 | 21,324 | |||
| 2015 | 16,235 | |||
| 2016 | 10,440 | |||
| 2017 | 6,639 | |||
| Thereafter | 40,885 | |||
| Total | $ | 125,689 | ||
The Company’s operating leases extend for certain property, plantvarying periods and, equipment. The remaining lease terms range from 1 to 5 years.
| Year ended December 31, | ||||
| 2010 | $ | 3,873 | ||
| 2011 | 2,428 | |||
| 2012 | 1,719 | |||
| 2013 | 1,087 | |||
| 2014 | 519 | |||
| Thereafter | 240 | |||
| Total | $ | 9,866 | ||
| 17. | Segment Information |
Upon the closing of the Charter Acquisition, the Company changed the composition of its reportable segments to reflect the changes in 2009, 2008 and 2007, respectively.
| · | Gas & Fluid Handling – a global supplier of a broad range of gas- and fluid-handling products, including pumps, fluid-handling systems and controls, specialty valves, heavy-duty centrifugal and axial fans, rotary heat exchangers and gas compressors, which serves customers in the power generation, oil, gas and petrochemical, mining, marine (including defense) and general industrial and other end markets; and |
| · | Fabrication Technology–a global supplier of welding equipment and consumables, cutting equipment and consumables and automated welding and cutting systems. |
Certain amounts not allocated to the restatementtwo reportable segments and intersegment eliminations are reported under the heading “Corporate and other.” The Company’s management evaluates the operating results of each of its reportable segments based upon Net sales and segment operating income (loss), which represents Operating income before Restructuring and other related charges.
COLFAX CORPORATION
NOTES TO CONSOLIDATED FINANCIAL STATEMENTS – (Continued)
The Company’s segment results were as follows:
| Year Ended December 31, | ||||||||||||
| 2012 | 2011 | 2010 | ||||||||||
| (In thousands) | ||||||||||||
| Net Sales: | ||||||||||||
| Gas and fluid handling | $ | 1,901,132 | $ | 693,392 | $ | 541,987 | ||||||
| Fabrication technology | 2,012,724 | — | — | |||||||||
| Total Net sales | $ | 3,913,856 | $ | 693,392 | $ | 541,987 | ||||||
| Segment operating income (loss)(1): | ||||||||||||
| Gas and fluid handling | $ | 141,524 | $ | 86,664 | $ | 65,357 | ||||||
| Fabrication technology | 140,184 | — | — | |||||||||
| Corporate and other | (81,639 | ) | (51,078 | ) | (20,662 | ) | ||||||
| Total segment operating income | $ | 200,069 | $ | 35,586 | $ | 44,695 | ||||||
| Depreciation and Amortization: | ||||||||||||
| Gas and fluid handling | $ | 112,389 | $ | 22,375 | $ | 15,823 | ||||||
| Fabrication technology | 69,708 | — | — | |||||||||
| Corporate and other | 18,303 | 958 | 984 | |||||||||
| Total depreciation and amortization | $ | 200,400 | $ | 23,333 | $ | 16,807 | ||||||
| Capital Expenditures: | ||||||||||||
| Gas and fluid handling | $ | 42,343 | $ | 14,420 | $ | 12,118 | ||||||
| Fabrication technology | 41,146 | — | — | |||||||||
| Corporate and other | 97 | 366 | 409 | |||||||||
| Total capital expenditures | $ | 83,586 | $ | 14,786 | $ | 12,527 | ||||||
________
| (1) | The following is a reconciliation of Income before income taxes to segment operating income: |
| Year Ended December 31, | ||||||||||||
| 2012 | 2011 | 2010 | ||||||||||
| (In thousands) | ||||||||||||
| Income before income taxes | $ | 48,439 | $ | 19,987 | $ | 27,688 | ||||||
| Interest expense | 91,570 | 5,919 | 6,684 | |||||||||
| Restructuring and other related charges | 60,060 | 9,680 | 10,323 | |||||||||
| Segment operating income | $ | 200,069 | $ | 35,586 | $ | 44,695 | ||||||
| Year Ended December 31, | ||||||||
| 2012 | 2011 | |||||||
| (In thousands) | ||||||||
| Investment in Equity Method Investees: | ||||||||
| Gas and fluid handling | $ | 11,451 | $ | 7,680 | ||||
| Fabrication technology | 44,106 | — | ||||||
| $ | 55,557 | $ | 7,680 | |||||
| Total Assets: | ||||||||
| Gas and fluid handling | $ | 3,329,948 | $ | 947,773 | ||||
| Fabrication technology | 2,565,582 | — | ||||||
| Corporate and other | 234,197 | 140,770 | ||||||
| $ | 6,129,727 | $ | 1,088,543 | |||||
COLFAX CORPORATION
NOTES TO CONSOLIDATED FINANCIAL STATEMENTS – (Continued)
The detail of the Company’s consolidatedoperations by geography and product type is as follows:
| Year Ended December 31, | ||||||||||||
| 2012 | 2011 | 2010 | ||||||||||
| (In thousands) | ||||||||||||
| Net Sales by Origin: | ||||||||||||
| United States | $ | 789,259 | $ | 207,459 | $ | 183,803 | ||||||
| Foreign locations | 3,124,597 | 485,933 | 358,184 | |||||||||
| Total Net sales | $ | 3,913,856 | $ | 693,392 | $ | 541,987 | ||||||
| Net Sales by Major Product: | ||||||||||||
| Gas handling | $ | 1,242,371 | $ | — | $ | — | ||||||
| Fluid handling | 658,761 | 693,392 | 541,987 | |||||||||
| Welding and cutting | 2,012,724 | — | — | |||||||||
| Total Net sales | $ | 3,913,856 | $ | 693,392 | $ | 541,987 | ||||||
| December 31, | ||||||||
| 2012 | 2011 | |||||||
| (In thousands) | ||||||||
| Property, Plant and Equipment, Net: | ||||||||
| United States | $ | 127,719 | $ | 28,699 | ||||
| Foreign locations | 560,851 | 62,240 | ||||||
| Property, plant and equipment, net | $ | 688,570 | $ | 90,939 | ||||
| 18. | Selected Quarterly Data–(unaudited) |
Provided below is selected unaudited quarterly financial statements as discussed in Note 2.
First Quarter | Second Quarter | |||||||||||||||||||||||
| As | As | |||||||||||||||||||||||
| Previously | As | Previously | As | |||||||||||||||||||||
Reported | Adjustment | Restated | Reported | Adjustment | Restated | |||||||||||||||||||
| 2009 | ||||||||||||||||||||||||
| Net sales | $ | 136,323 | $ | 136,323 | $ | 129,185 | $ | 129,185 | ||||||||||||||||
| Cost of sales | 88,308 | 88,308 | 84,630 | 84,630 | ||||||||||||||||||||
| Gross profit | 48,015 | 48,015 | 44,555 | 44,555 | ||||||||||||||||||||
| Selling, general and administrative expenses | 30,187 | (322 | ) | 29,865 | 28,586 | (193 | ) | 28,393 | ||||||||||||||||
| Restructuring and other related charges | - | - | 486 | - | 486 | |||||||||||||||||||
| Research and development expenses | 1,407 | 1,407 | 1,680 | 1,680 | ||||||||||||||||||||
| Asbestos liability and defense costs | 1,645 | 1,645 | 1,482 | 1,482 | ||||||||||||||||||||
| Asbestos coverage litigation expenses | 2,966 | 2,966 | 4,027 | 4,027 | ||||||||||||||||||||
| Operating income | 11,810 | 322 | 12,132 | 8,294 | 193 | 8,487 | ||||||||||||||||||
| Interest expense | 1,846 | 1,846 | 1,786 | 1,786 | ||||||||||||||||||||
| Income before income taxes | 9,964 | 322 | 10,286 | 6,508 | 193 | 6,701 | ||||||||||||||||||
| Provision for income taxes | 3,103 | 118 | 3,221 | 2,142 | 83 | 2,225 | ||||||||||||||||||
| Net income available to common shareholders | $ | 6,861 | $ | 204 | $ | 7,065 | $ | 4,366 | $ | 110 | $ | 4,476 | ||||||||||||
| Net income per share—basic and diluted | $ | 0.16 | $ | - | $ | 0.16 | $ | 0.10 | $ | - | $ | 0.10 | ||||||||||||
Third Quarter | Fourth Quarter | |||||||||||||||||||||||
| As | As | |||||||||||||||||||||||
| Previously | As | Previously | As | |||||||||||||||||||||
Reported | Adjustment | Restated | Reported | Adjustment | Restated | |||||||||||||||||||
| 2009 | ||||||||||||||||||||||||
| Net sales | $ | 128,545 | $ | 128,545 | $ | 130,971 | $ | 130,971 | ||||||||||||||||
| Cost of sales | 82,339 | 82,339 | 83,960 | 83,960 | ||||||||||||||||||||
| Gross profit | 46,206 | 46,206 | 47,011 | 47,011 | ||||||||||||||||||||
| Selling, general and administrative expenses | 28,136 | (258 | ) | 27,878 | 27,426 | (398 | ) | 27,028 | ||||||||||||||||
| Restructuring and other related charges | 9,608 | 9,608 | 7,420 | 7,420 | ||||||||||||||||||||
| Research and development expenses | 1,523 | 1,523 | 1,320 | 1,320 | ||||||||||||||||||||
| Asbestos liability and defense income | (4,303 | ) | (4,303 | ) | (1,017 | ) | (1,017 | ) | ||||||||||||||||
| Asbestos coverage litigation expenses | 1,845 | 1,845 | 2,904 | 2,904 | ||||||||||||||||||||
| Operating income | 9,397 | 258 | 9,655 | 8,958 | 398 | 9,356 | ||||||||||||||||||
| Interest expense | 1,834 | 1,834 | 1,746 | 1,746 | ||||||||||||||||||||
| Income before income taxes | 7,563 | 258 | 7,821 | 7,212 | 398 | 7,610 | ||||||||||||||||||
| Provision for income taxes | 2,188 | 103 | 2,291 | 2,092 | (1,208 | ) | 884 | |||||||||||||||||
| Net income available to common shareholders | $ | 5,375 | $ | 155 | $ | 5,530 | $ | 5,120 | $ | 1,606 | $ | 6,726 | ||||||||||||
| Net income per share—basic | $ | 0.12 | $ | 0.01 | $ | 0.13 | $ | 0.12 | $ | 0.04 | $ | 0.16 | ||||||||||||
| Net income per share—diluted | $ | 0.12 | $ | 0.01 | $ | 0.13 | $ | 0.12 | $ | 0.04 | $ | 0.15 | ||||||||||||
First Quarter | Second Quarter | |||||||||||||||||||||||
| As | As | |||||||||||||||||||||||
| Previously | As | Previously | As | |||||||||||||||||||||
Reported | Adjustment | Restated | Reported | Adjustment | Restated | |||||||||||||||||||
| 2008 | ||||||||||||||||||||||||
| Net sales | $ | 130,651 | $ | 130,651 | $ | 161,431 | $ | 161,431 | ||||||||||||||||
| Cost of sales | 82,473 | 82,473 | 104,654 | 104,654 | ||||||||||||||||||||
| Gross profit | 48,178 | 48,178 | 56,777 | 56,777 | ||||||||||||||||||||
| Selling, general and administrative expenses | 28,507 | (330 | ) | 28,177 | 35,776 | (331 | ) | 35,445 | ||||||||||||||||
| Initial public offering related costs | - | - | 57,017 | 57,017 | ||||||||||||||||||||
| Research and development expenses | 1,381 | 1,381 | 1,571 | 1,571 | ||||||||||||||||||||
| Asbestos liability and defense costs (income) | 278 | 278 | (715 | ) | (715 | ) | ||||||||||||||||||
| Asbestos coverage litigation expenses | 3,139 | 3,139 | 3,970 | 3,970 | ||||||||||||||||||||
| Operating income | 14,873 | 330 | 15,203 | (40,842 | ) | 331 | (40,511 | ) | ||||||||||||||||
| Interest expense | 4,497 | 4,497 | 3,236 | 3,236 | ||||||||||||||||||||
| Income before income taxes | 10,376 | 330 | 10,706 | (44,078 | ) | 331 | (43,747 | ) | ||||||||||||||||
| Provision for income taxes | 3,578 | 102 | 3,680 | (12,679 | ) | 88 | (12,591 | ) | ||||||||||||||||
| Net income (loss) | 6,798 | 228 | 7,026 | (31,399 | ) | 243 | (31,156 | ) | ||||||||||||||||
| Dividends on preferred stock | - | - | (3,492 | ) | (3,492 | ) | ||||||||||||||||||
| Net income (loss) available to common shareholders | $ | 6,798 | $ | 228 | $ | 7,026 | $ | (34,891 | ) | $ | 243 | $ | (34,648 | ) | ||||||||||
| Net income (loss) per share—basic and diluted | $ | 0.31 | $ | 0.01 | $ | 0.32 | $ | (1.01 | ) | $ | 0.01 | $ | (1.00 | ) | ||||||||||
Third Quarter | Fourth Quarter | |||||||||||||||||||||||
| As | As | |||||||||||||||||||||||
| Previously | As | Previously | As | |||||||||||||||||||||
Reported | Adjustment | Restated | Reported | Adjustment | Restated | |||||||||||||||||||
| 2008 | ||||||||||||||||||||||||
| Net sales | $ | 153,461 | $ | 153,461 | $ | 159,311 | $ | 159,311 | ||||||||||||||||
| Cost of sales | 98,983 | 98,983 | 101,557 | 101,557 | ||||||||||||||||||||
| Gross profit | 54,478 | 54,478 | 57,754 | 57,754 | ||||||||||||||||||||
| Selling, general and administrative expenses | 33,233 | (330 | ) | 32,903 | 27,718 | (138 | ) | 27,580 | ||||||||||||||||
| Research and development expenses | 1,478 | 1,478 | 1,426 | 1,426 | ||||||||||||||||||||
| Asbestos liability and defense (income) costs | (6,312 | ) | (6,312 | ) | 1,978 | 1,978 | ||||||||||||||||||
| Asbestos coverage litigation expenses | 5,148 | 5,148 | 4,905 | 4,905 | ||||||||||||||||||||
| Operating income | 20,931 | 330 | 21,261 | 21,727 | 138 | 21,865 | ||||||||||||||||||
| Interest expense | 1,951 | 1,951 | 2,138 | 2,138 | ||||||||||||||||||||
| Income before income taxes | 18,980 | 330 | 19,310 | 19,589 | 138 | 19,727 | ||||||||||||||||||
| Provision for income taxes | 5,329 | 173 | 5,502 | 9,210 | (336 | ) | 8,874 | |||||||||||||||||
| Net income available to common shareholders | $ | 13,651 | $ | 157 | $ | 13,808 | $ | 10,379 | $ | 474 | $ | 10,853 | ||||||||||||
| Net income per share—basic | $ | 0.31 | $ | - | $ | 0.31 | $ | 0.24 | $ | 0.01 | $ | 0.25 | ||||||||||||
| Quarter Ended | ||||||||||||||||
| March 30, 2012(1)(2) | June 29, 2012(1)(2) | September 28, 2012 | December 31, 2012 | |||||||||||||
| (In thousands, except per share data) | ||||||||||||||||
| Net sales | $ | 886,366 | $ | 1,045,653 | $ | 954,440 | $ | 1,027,397 | ||||||||
| Gross profit | 241,706 | 314,862 | 287,987 | 307,570 | ||||||||||||
| Net (loss) income | (100,461 | ) | 18,632 | 14,499 | 25,066 | |||||||||||
| Net (loss) income attributable to Colfax Corporation common shareholders | (109,332 | ) | 7,293 | 4,022 | 14,664 | |||||||||||
| Net (loss) income per share – basic | $ | (1.33 | ) | $ | 0.07 | $ | 0.04 | $ | 0.14 | |||||||
| Net (loss) income per share – diluted | $ | (1.33 | ) | $ | 0.07 | $ | 0.04 | $ | 0.13 | |||||||
__________
| Net (loss) income and Net (loss) income per share for the three months ended March 30, 2012 and June 29 2012, include |
| (2) | Gross profit for the three months ended March 30, 2012 and June 29, 2012 reflects the reclassification of $13.7 million and $13.0 million, respectively, of additional Cost of sales, which was included in Selling, general and administrative expense in the Condensed Consolidated Statements of Operations included in the respective quarterly report on Form 10-Q. These amounts were reclassified in order to comply with |
COLFAX CORPORATION
NOTES TO CONSOLIDATED FINANCIAL STATEMENTS – (Continued)
| Quarter Ended | ||||||||||||||||
| April 1, 2011 | July 1, 2011 | September 30, 2011(1) | December 31, 2011(1) | |||||||||||||
| (In thousands, except per share data) | ||||||||||||||||
| Net sales | $ | 158,558 | $ | 186,749 | $ | 170,294 | $ | 177,791 | ||||||||
| Gross profit | 53,254 | 64,674 | 60,627 | 61,544 | ||||||||||||
| Net income (loss) | 6,555 | 10,390 | 3,690 | (16,080 | ) | |||||||||||
| Net income (loss) per share – basic | $ | 0.15 | $ | 0.24 | $ | 0.08 | $ | (0.37 | ) | |||||||
| Net income (loss) per share – diluted | $ | 0.15 | $ | 0.23 | $ | 0.08 | $ | (0.37 | ) | |||||||
__________
| (1) | Net income (loss) and Net income (loss) per share for the three months ended September 30, 2011 and December 31, 2011 include $5.7 million and $25.3 million, respectively, of pre-tax Charter acquisition-related expense. See Note 4, “Acquisitions” for additional information regarding the Company’s acquisition of Charter. |
Item 9.Changes in and Chief Executive Officer effective January 9, 2010. Mr. Kiefaber succeeds John A. Young, who resigned as PresidentDisagreements with Accountants on Accounting and Chief Executive OfficerFinancial Disclosure
None.
Item 9A.Controls and as a director of the Company, effective January 9, 2010.
Disclosure Controls and Procedures
Under the supervision and with the participation of our management, including our Chief Executive Officer and Chief Financial Officer, the Company has re-evaluatedwe have evaluated the effectiveness of our disclosure controls and procedures, as defined in Rule 13a-15(e) under the Securities Exchange Act of 1934, as amended (the “Exchange Act”), as of the end of the period covered by this report. Management, in consultation with the Audit Committee, hasreport on this Annual Report on Form 10-K. Based upon that evaluation, our Chief Executive Officer and Chief Financial Officer concluded that the restatement errors, described in Note 2 to the Consolidated Financial Statements, constituted a material weakness in the Company’s internal control over financial reporting as of the date of the Original Form 10-K. As a result of the material weakness, management has concluded that the Company’sour disclosure controls and procedures were not effective in providing reasonable assurance that the information required to be disclosed in this report on Form 10-K has been recorded, processed, summarized and reported as of the end of the period covered by this report.
Disclosure controls and procedures include, without limitation, controls and procedures designed to ensure that information required to be disclosed by us in reports we file or submit under the Exchange Act is recorded, processed, summarized and reported within the time periods specified in the Securities and Exchange CommissionsCommission’s (the “SEC’s”) rules and forms, and that such information is accumulated and communicated to our management, including our Chief Executive Officer and Chief Financial Officer, as appropriate, to allow timely decisions regarding required disclosure.
Changes in Internal Control Over Financial Reporting
The Company completed the Charter Acquisition and the Board of Directors are committedSoldex Acquisition on January 13, 2012 and October 31, 2012, respectively. Management considers these transactions to be material to the remediationCompany’s Consolidated Financial Statements and believes that the internal controls and procedures of theCharter and Soldex have a material weakness set forth above as well as the continued improvement ofeffect on the Company’s overall system of internal control over financial reporting. Subsequent toWe are currently in the period covered by this report, management has implemented measures to remediateprocess of incorporating the material weakness in internal controlcontrols and procedures of Charter and Soldex into our internal controls over financial reporting described above. Specifically, we have implemented proceduresand extending our compliance program under the Sarbanes-Oxley Act of 2002 to enhanceinclude Charter and Soldex. The Company has elected to exclude Charter and Soldex from the maintenance and reviewscope of participant data for benefit plans. As part of the Company’s fiscal 2010its 2012 annual assessment of internal control over financial reporting management will conduct sufficient testingas provided by the Act and the applicable SEC rules and regulations concerning business combinations.
Other than the Charter Acquisition and the Soldex Acquisition noted above, there have been no changes in our internal control over financial reporting (as defined in Rule 13a-15(f)) identified in connection with the evaluation required by Rule 13a-15(d) of the implemented controlsExchange Act that occurred during the period covered by this report that have materially affected, or are reasonably likely to ascertain whether they are designed and operating effectively. Management believes the implemented controls will remediate the material weakness related to the maintenance and review of participant data for benefit plans discussed in Note 2 to the Consolidated Financial Statements.
Management’s Annual Report on Internal Control Over Financial Reporting
The management of Colfax Corporation is responsible for establishing and maintaining adequate internal control over financial reporting as defined in Rules 13a-15(f) and 15d-15(f) under the Securities Exchange Act of 1934. Our internal control over financial reporting is designed to provide reasonable assurance regarding the reliability of financial reporting and the preparation of financial statements for external purposes in accordance with U.S. GAAP. Internal control over financial reporting includes policies and procedures that:
| (i) | pertain to the maintenance of records that, in reasonable detail, accurately and fairly reflect the transactions and dispositions of the company’s assets; |
| (ii) | provide reasonable assurance that transactions are recorded as necessary to permit preparation of financial statements in accordance with |
| (iii) | provide reasonable assurance regarding prevention or timely detection of unauthorized acquisition, use or disposition of the company’s assets that could have a material effect on the financial statements. |
Because of inherent limitations, internal control over financial reporting may not prevent or detect misstatements. Also, projections of any evaluation of effectiveness to future periods are subject to the risk that controls may become inadequate because of changes in conditions, or that the degree of compliance with existing policies or procedures may deteriorate.
Under the supervision and with the participation of our Chief Executive Officer and Chief Financial Officer, our management conducted an assessment of the effectiveness of internal control over financial reporting as of December 31, 20092012 based on the criteria established inInternal Control – Integrated Framework, issued by the Committee of Sponsoring Organizations of the Treadway Commission. As a result of the material weakness discussed above,Based on this assessment, our management has concluded that our internal control over financial reporting were notwas effective as of December 31, 2009.
In making its assessment of the effectiveness of the Company’s internal control over financial reporting as of December 31, 2012, management excluded Charter and Soldex from its assessment, as provided by the Act and the applicable SEC rules and regulations concerning business combinations, because these entities were acquired by Colfax Corporation in January and October 2012, respectively, and the Company has not yet fully incorporated the internal control procedures of these businesses into the Company’s internal control over financial reporting. During the year ended December 31, 2012, Charter and Soldex represented 83% of the Company’s Net sales. See Note 4, “Acquisitions” in the accompanying Notes to Consolidated Financial Statements for further discussion regarding these acquisitions.
Our independent registered public accounting firm is engaged to express an opinion on our internal control over financial reporting, as stated in theirits report which is included in Part II, Item 8 of this Form 10-K/A10-K under the caption “Report of Ernst & Young LLP, Independent Registered Public Accounting Firm on —Internal Control Over Financial Reporting.”
Item 9B.Other Information
On February 18, 2013, the Company entered into an amendment to the registration rights agreement, dated May 30, 2003, by the Company and each of Mitchell P. Rales and Steven M. Rales.
The amendment extends the duration of the registration rights period for 18,271,832 shares of Colfax Common stock subject to the agreement until May 8, 2016. In consideration for entering into the amendment, each of Mitchell P. Rales and Steven M. Rales agreed to refrain from exercising their registration rights prior to May 8, 2013, the original expiration date of the registration rights period under the agreement.
PART III
Item 10.Directors, Executive Officers and Corporate Governance
Information relating to our Executive Officers is set forth in Part I of this Form 10-K/A10-K under the caption “Executive Officers of the Registrant.” Additional information regarding our directors, audit committeeDirectors, Audit Committee and compliance with Section 16(a) of the Exchange Act is incorporated by reference to such information included in our proxy statement for our 20102013 annual meeting to be filed with the SEC within 120 days after the end of the fiscal year covered by this Form 10-K (the “2010“2013 Proxy Statement”) under the captions “Election of Directors”, “Board of Directors and its Committees – Audit Committee” and “Section 16(a) Beneficial Ownership Reporting Compliance”.
As part of our system of corporate governance, our boardBoard of directorsDirectors has adopted a code of ethics that applies to all employees, including our principal executive officer, and our principal financial and accounting officer and principal accounting officer.or other persons performing similar functions. A copy of the code of ethics is available on our website atwww.colfaxcorp.com. We intend to satisfy any disclosure requirement under Item 5.05 of Form 8-K regarding an amendment to, or a waiver from, a provision of our code of ethics by posting such information on our website at the address above.
Item 11.Executive Compensation
Information responsive to this item is incorporated by reference to such information included in our 20102013 Proxy Statement under the captions “Executive Compensation”, “Director Compensation”, “Compensation Discussion and Analysis”, “Compensation Committee Report” and “Compensation Committee Interlocks and Insider Participation”,
Item 12.Security Ownership of Certain Beneficial Owners and Management and Related Stockholder Matters
Information responsive to this item is incorporated by reference to such information included in our 20102013 Proxy Statement under the captions “Beneficial Ownership of Our Common Stock” and “Equity Compensation Plan Information”.
Item 13.Certain Relationships and Related Transactions, and Director Independence
Information responsive to this item is incorporated by reference to such information included in our 20102013 Proxy Statement under the captions “Certain Relationships and Related Person Transactions” and “Director Independence”.
Item 14.Principal Accountant Fees and Services
Information responsive to this item is incorporated by reference to such information included in our 20102013 Proxy Statement under the captions “Independent Registered Public Accountant Fees and Services” and “Audit Committee’s Pre-Approval Policies and Procedures”.
PART IV
Item 15.Exhibits and Financial Statement Schedules
| (a) | The following documents are filed as part of this report. |
| (1) | Financial Statements. The financial statements are set forth under “Item 8. Financial Statements and Supplementary Data” of this report on Form |
| (2) | Schedules. An index of Exhibits and Schedules is on page |
| (b) | Exhibits. The exhibits listed in the accompanying Exhibit Index are filed or incorporated by reference as part of this report. |
| (c) | Not applicable. |
SIGNATURES
Pursuant to the requirements of Section 13 or 15(d) of the Securities Exchange Act of 1934, the Registrant has duly caused this report to be signed on its behalf by the undersigned, thereunto duly authorized on December 13, 2010.
| COLFAX CORPORATION | ||
/s/ STEVEN E. SIMMS | ||
| Steven E. Simms | ||
| President and Chief Executive Officer | ||
Pursuant to the requirements of Section 13 or 15(d) of the Securities Exchange Act of 1934, this report has been signed below by the following persons on behalf of the Registrant and in the capacities and on the date indicated.
| Date: February 18, 2013 | |
/s/ STEVEN E. SIMMS | |
| Steven E. Simms | |
| President, Chief Executive Officer and Director | |
| (Principal Executive Officer) | |
/s/ C. SCOTT BRANNAN | |
| C. Scott Brannan | |
| Senior Vice President, Chief Financial Officer and Treasurer | |
| (Principal Financial and Accounting Officer) | |
/s/ MITCHELL P. RALES | |
| Mitchell P. Rales | |
| Chairman of the Board | |
/s/ PATRICK W. ALLENDER | |
| Patrick W. Allender | |
| Director | |
/s/ THOMAS S. GAYNER | |
| Thomas S. Gayner | |
| Director | |
/s/ RHONDA L. JORDAN | |
| Rhonda L. Jordan | |
| Director | |
/s/ CLAY H. KIEFABER | |
| Clay H. Kiefaber | |
| Director | |
| /s/ SAN W. ORR, III | |
| San W. Orr, III | |
| Director | |
/s/ A. CLAYTON PERFALL | |
| A. Clayton Perfall | |
| Director | |
/s/ RAJIV VINNAKOTA | |
| Rajiv Vinnakota | |
| Director |
| 92 |
COLFAX CORPORATION
INDEX TO FINANCIAL STATEMENTS, SUPPLEMENTARY DATA AND FINANCIAL STATEMENT SCHEDULES
Page Number in Form | ||
| Schedules: | ||
| Valuation and Qualifying Accounts |
| 93 |
EXHIBIT INDEX
Exhibit No. | Description | Location* | |||
| 3.1 | Amended and Restated Certificate of Incorporation of Colfax Corporation | Incorporated by reference to Exhibit | |||
| 3.2 | Colfax Corporation Amended and Restated Bylaws | Incorporated by reference to Exhibit 3.2 to Colfax Corporation’s Form 8-K (File No. 001-34045) as filed with the Commission on May 13, 2008 | |||
| 3.3 | Certificate of Designations of Series A Perpetual Convertible Preferred Stock of Colfax Corporation | Incorporated by reference to Exhibit 3.02 to Colfax Corporation’s Form 8-K (File No. 001-34045) as filed with the Commission on January 30, 2012 | |||
| 4.1 | Specimen Common Stock Certificate | ||||
| 10.1 | Colfax Corporation 2008 Omnibus Incentive Plan** | ||||
| 10.2 | Colfax Corporation 2008 Omnibus Incentive Plan, as amended and restated April 2, 2012** | Incorporated by reference to Exhibit 10.07 to Colfax Corporation’s Form 10-Q (File No. 001-34045) as filed with the SEC on August 7, 2012 | |||
| Form of Non-Qualified Stock Option Agreement | |||||
| 10.4 | Form of Performance Stock Unit Agreement** | ||||
| 10.5 | Form of Outside Director Restricted Stock Unit Agreement (Three Year Vesting)** | ||||
| Form of | |||||
| Form of Outside Director Deferred Stock Unit Agreement for deferral of grants of restricted stock | |||||
| Form of Outside Director Deferred Stock Unit Agreement for deferral of director fees** | |||||
| 10.9 | Form of Outside Director Non-Qualified Stock Option Agreement** | Incorporated by reference to Exhibit 10.08 to Colfax Corporation’s Form 10-Q (File No. 001-34045) filed with the SEC on August 7,2012 | |||
| 10.10 | Form of Outside Director Restricted Stock Unit Agreement (One Year Vesting)** | Incorporated by reference to Exhibit 10.09 to Colfax Corporation’s Form 10-Q (File No. 001-34045) filed with the SEC on August 7,2012 | |||
| 10.11 | Form of Outside Director Deferred Stock Unit Agreement for | Incorporated by reference to Exhibit 10.10 to Colfax Corporation’s Form 10-Q (File No. 001-34045) filed with the |
Exhibit No. | Description | Location* | |||
| 10.12 | Form of Outside Director Deferred Stock Unit Agreement for deferral of grants of restricted stock units | ||||
| 10.13 | Colfax Corporation Amended and | ||||
| Incorporated by reference to Exhibit 10.1 to Colfax Corporation’s Form 8-K (File No. 001-34045) as filed with the SEC on April 23, 2012 | |||||
| 10.15 | Employment Agreement between Colfax Corporation and Clay | Incorporated by reference to Exhibit 10.1 to Colfax Corporation’s Form 8-K (File No. 001-34045) as filed with the Commission on |
| 10.16 | Amendment No. 1 to the Employment Agreement between Colfax Corporation and | Incorporated by reference to Exhibit 10.2 to Colfax Corporation’s Form 8-K (File No. 001-34045) as filed with the Commission on April 23, 2012 | |||
| 10.17 | Employment Agreement between Colfax Corporation and | Incorporated by reference to Exhibit 10.1 to Colfax Corporation’s Form 8-K (File No. 001-34045) as filed with the Commission on September 22, 2010 | |||
| 10.18 | Employment Agreement between Colfax Corporation and | Incorporated by reference to Exhibit 10.04 to Colfax Corporation’s Form 10-Q (File No. 001-34045) as filed with the SEC on August 7, 2012 | |||
| 10.19 | Employment Agreement between Colfax Corporation and A. Lynne Puckett** | Incorporated by reference to Exhibit 10.05 to Colfax Corporation’s Form 10-Q (File No. 001-34045) as filed with the SEC on August 7, 2012 | |||
| 10.20 | Employment Agreement between Colfax Corporation and William E. Roller** | Incorporated by reference to Exhibit 10.1 to Colfax Corporation’s Form 10-Q (File No. 001-34045) as filed with the Commission on May 8, 2009 | |||
| 10.21 | Amendment to the Employment Agreement between Colfax Corporation and William E. Roller** | Incorporated by reference to Exhibit 10.2 to Colfax Corporation’s Form 10-Q (File No. 001-34045) as filed with the Commission on May 8, 2009 | |||
| Incorporated by reference to Exhibit |
Exhibit No. | Description | Location* | |||
| 10.23 | Incorporated by reference to Exhibit |
| 10.24 | Colfax Corporation Annual Incentive Plan, as amended and restated April 2, 2012** | Filed herewith | |||
| 10.25 | Credit Agreement, dated | Incorporated by reference to Exhibit 99.6 to Colfax Corporation’s Form 8-K (File No. 001-34045) as filed with the Commission on September 15, 2011 | |||
| 10.26 | Amendment No. 1 to the Credit Agreement, dated January 13, 2012, by and among the Colfax Corporation, certain subsidiaries of Colfax Corporation identified therein, Deutsche Bank AG New York Branch and the lenders identified therein | Incorporated by reference to Exhibit 10.1 to Colfax Corporation’s Form 8-K (File No. 001-34045) as filed with the Commission on | |||
| 10.27 | Share Purchase Agreement, by and among Inversiones Breca S.A. and Colfax Corporation, dated as of May 26, 2012 | Incorporated by reference to Exhibit 2.1 to Colfax Corporation’s Form 8-K (File No. 001-34045) as filed with the Commission on May 31, 2012 | |||
| 10.28 | Amendment No. 1 to the Share Purchase Agreement by and among Inversiones Breca S.A. and Colfax Corporation, dated October 25, 2012 | Filed herewith | |||
| 10.29 | Registration Rights Agreement, dated May 30, 2003, by and among Colfax Corporation, Colfax Capital Corporation, Janalia Corporation, Equity Group Holdings, L.L.C., and Mitchell P. Rales and Steven M. Rales | ||||
| 10.30 | Amendment No. 1 to the Registration Rights Agreement, by and among Colfax Corporation and Mitchell P. Rales and Steven M. Rales, dated February 18, 2013 | Filed herewith | |||
| 10.31 | Securities Purchase Agreement, dated September 12, 2011, between BDT CF Acquisition Vehicle, LLC and Colfax Corporation | Incorporated by reference to Exhibit 99.2 to Colfax Corporation’s Form 8-K (File No. 001-34045) as filed with the Commission on September 15, 2011 | |||
| 10.32 | Securities Purchase Agreement, dated September 12, 2011, between Mitchell P. Rales and Colfax Corporation | Incorporated by reference to Exhibit 99.3 to Colfax Corporation’s Form 8-K (File No. 001-34045) as filed with the Commission on September 15, 2011 | |||
| 10.33 | Securities Purchase Agreement, dated September 12, 2011, between Steven M. Rales and Colfax Corporation | Incorporated by reference to Exhibit 99.4 to Colfax Corporation’s Form 8-K (File No. 001-34045) as filed with the Commission on September 15, 2011 |
Exhibit No. | Description | Location* | |||
| 10.34 | Securities Purchase Agreement, dated September 12, 2011, between Markel Corporation and Colfax Corporation | Incorporated by reference to Exhibit 99.5 to Colfax Corporation’s Form 8-K (File No. 001-34045) as filed with the Commission on September 15, 2011 | |||
| 10.35 | Registration Rights Agreement, dated as of January 24, 2012, between Colfax Corporation and BDT CF Acquisition Vehicle, LLC | Incorporated by reference to Exhibit 10.01 to Colfax Corporation’s Form 8-K (File No. 001-34045) as filed with the Commission on January 30, 2012 | |||
| 10.36 | Registration Rights Agreement, dated as of January 24, 2012, between Colfax Corporation and Mitchell P. Rales | Incorporated by reference to Exhibit 10.02 to Colfax Corporation’s Form 8-K (File No. 001-34045) as filed with the Commission on January 30, 2012 | |||
| 10.37 | Registration Rights Agreement, dated as of January 24, 2012, between Colfax Corporation and Steven M. Rales | Incorporated by reference to Exhibit 10.03 to Colfax Corporation’s Form 8-K (File No. 001-34045) as filed with the Commission on January 30, 2012 | |||
| 10.38 | Registration Rights Agreement, dated as of January 24, 2012, between Colfax Corporation and Markel Corporation | Incorporated by reference to Exhibit 10.04 to Colfax Corporation’s Form 8-K (File No. 001-34045) as filed with the Commission on January 30, 2012 | |||
| 12.1 | Computation of Ratio of Earnings to Fixed Charges | Filed herewith | |||
| 21.1 | Subsidiaries of | ||||
| 23.1 | Consent of | Filed herewith | |||
| 31.1 | Certification of Chief Executive Officer Pursuant to Item 601(b)(31) of Regulation S-K, as adopted pursuant to Section 302 of the Sarbanes-Oxley Act of 2002. | Filed herewith | |||
| 31.2 | Certification of Chief Financial Officer Pursuant to Item 601(b)(31) of Regulation S-K, as adopted pursuant to Section 302 of the Sarbanes-Oxley Act of 2002. | Filed herewith | |||
| 32.1 | Certification of Chief Executive Officer, Pursuant to 18 U.S.C. Section 1350, as adopted pursuant to Section 906 of the Sarbanes-Oxley Act of 2002 | Filed herewith | |||
| 32.2 | Certification of Chief Financial Officer, Pursuant to 18 U.S.C. Section 1350, as adopted pursuant to Section 906 of the Sarbanes-Oxley Act of 2002 | Filed herewith |
| 101.INS*** | XBRL Instance Document | Filed herewith |
Exhibit No. | Description | Location* | ||
| 101.SCH*** | XBRL Taxonomy Extension Schema Document | Filed herewith | ||
| 101.CAL*** | XBRL Extension Calculation Linkbase Document | Filed herewith | ||
| 101.DEF*** | XBRL Taxonomy Extension Definition Linkbase Document | Filed herewith | ||
| 101.LAB*** | XBRL Taxonomy Extension Label Linkbase Document | Filed herewith | ||
| 101.PRE*** | XBRL Taxonomy Extension Presentation Linkbase Document | Filed herewith |
* Unless otherwise noted, all exhibits are incorporated by reference to the Company’s Registration Statement on Form S-1 (File No. 001-34045).
** Indicates management contract or compensatory plan, contract or arrangement.
*** In accordance with Rule 406T of Regulation S-T, the XBRL related information in Exhibit 101 to this Annual Report on Form 10-K shall not be deemed to be “filed” for purposes of Section 18 of the Exchange Act, or otherwise subject to the liability of that section, and shall not be incorporated by reference into any registration statement or other document filed under the Securities Act of 1933, as amended, or the Exchange Act, except as shall be expressly set forth by specific reference in such filing.
COLFAX CORPORATION AND SUBSIDIARIES
SCHEDULE II—II–VALUATION AND QUALIFYING ACCOUNTS
Balance��at Beginning of Period | Charged to Cost and Expenses (a) | Charged to Other Accounts | Write-offs, Write-downs & Deductions | Foreign Currency Translation | Balance at End of Period | |||||||||||||||||||
| Year Ended December 31, 2009 | ||||||||||||||||||||||||
| Allowance for doubtful accounts | $ | 2,486 | 405 | - | (178 | ) | 124 | $ | 2,837 | |||||||||||||||
| Allowance for excess, slow-moving and obsolete inventory | $ | 6,923 | 1,368 | - | (413 | ) | 147 | $ | 8,025 | |||||||||||||||
| Valuation allowance for deferred tax assets (as restated) | $ | 45,206 | (82 | ) | - | - | (71 | ) | $ | 45,053 | ||||||||||||||
| Year Ended December 31, 2008 | ||||||||||||||||||||||||
| Allowance for doubtful accounts | $ | 1,812 | 828 | - | (33 | ) | (121 | ) | $ | 2,486 | ||||||||||||||
| Allowance for excess, slow-moving and obsolete inventory | $ | 7,589 | (334 | ) | - | (74 | ) | (258 | ) | $ | 6,923 | |||||||||||||
| Valuation allowance for deferred tax assets (as restated) | $ | 17,776 | 2,999 | 24,431 | (b) | - | - | $ | 45,206 | |||||||||||||||
| Year Ended December 31, 2007 | ||||||||||||||||||||||||
| Allowance for doubtful accounts | $ | 1,650 | 964 | (10 | ) (c) | (909 | ) | 117 | $ | 1,812 | ||||||||||||||
| Allowance for excess, slow-moving and obsolete inventory | $ | 6,412 | 1,735 | 144 | (c) | (1,309 | ) | 607 | $ | 7,589 | ||||||||||||||
| Valuation allowance for deferred tax assets (as restated) | $ | 17,884 | (108 | ) | - | - | - | $ | 17,776 | |||||||||||||||
| Balance at Beginning of Period | Charged to Expense(1) | Charged to Other Accounts(2) | Write-Offs Write-Downs and Deductions | Acquisitions | Foreign Currency Translation | Balance at End of Period | ||||||||||||||||||||||
| (In thousands) | ||||||||||||||||||||||||||||
| Year Ended December 31, 2012: | ||||||||||||||||||||||||||||
| Allowance for doubtful accounts | $ | 2,578 | $ | 13,917 | $ | — | $ | (192 | ) | $ | — | $ | 161 | $ | 16,464 | |||||||||||||
| Allowance for excess slow-moving and obsolete inventory | 6,735 | 3,341 | — | (1,001 | ) | — | 146 | 9,221 | ||||||||||||||||||||
| Valuation allowance for deferred tax assets | 79,855 | 103,785 | 20,676 | — | 167,723 | — | 372,039 | |||||||||||||||||||||
| Year Ended December 31, 2011: | ||||||||||||||||||||||||||||
| Allowance for doubtful accounts | $ | 2,562 | $ | 112 | $ | — | $ | (70 | ) | $ | — | $ | (26 | ) | $ | 2,578 | ||||||||||||
| Allowance for excess slow-moving and obsolete inventory | 7,777 | 181 | — | (1,258 | ) | — | 35 | 6,735 | ||||||||||||||||||||
| Valuation allowance for deferred tax assets | 52,891 | 16,621 | 10,346 | — | — | (3 | ) | 79,855 | ||||||||||||||||||||
| Year Ended December 31, 2010: | ||||||||||||||||||||||||||||
| Allowance for doubtful accounts | $ | 2,837 | $ | 218 | $ | — | $ | (405 | ) | $ | — | $ | (88 | ) | $ | 2,562 | ||||||||||||
| Allowance for excess slow-moving and obsolete inventory | 8,025 | 1,942 | — | (1,849 | ) | — | (341 | ) | 7,777 | |||||||||||||||||||
| Valuation allowance for deferred tax assets | 45,053 | 4,407 | 3,666 | (180 | ) | — | (55 | ) | 52,891 | |||||||||||||||||||
__________
| Amounts charged to other accounts is net of recoveries for the respective period. |
| (2) | Represents amount charged to Accumulated other comprehensive |
| 99 |