
UNITED STATES SECURITIES AND EXCHANGE COMMISSION
Washington, D.C. 20549
Form 10-K
Form 10-K/A
(Amendment No.1)
| x | ANNUAL REPORT PURSUANT TO SECTION 13 OR 15(d) OF THE SECURITIES EXCHANGE ACT OF 1934 |
For the fiscal year ended December 31, 20132016
| ¨ | TRANSITION REPORT PURSUANT TO SECTION 13 OR 15(d) OF THE SECURITIES EXCHANGE ACT OF 1934 |
For the transition period from to
Commission File No. 0-54615
VII Peaks Co-Optivist Income BDC II, Inc.
(Exact name of Registrant as specified in its charter)
| Maryland | 45-2918121 | |
| (State or other jurisdiction of incorporation or organization) | (I.R.S. Employer Identification Number) |
4 Orinda Way, Suite 125-A
Orinda, CA 94563
(Address of principal executive offices)
(855) 889-1778
(Registrant’s telephone number, including area code)
Not applicable
(Former Name, Former Address and Former Fiscal Year, if Changed Since Last Report)
Securities registered pursuant to Section 12(b) of the Act:
Common Stock, par value
None
Securities registered pursuant to Section 12(g) of the Act:
Common Stock, par value
$0.001 per share
Indicate by check mark if the registrant is a well-known seasoned issuer, as defined in Rule 405 of the Securities Act of 1933. Yes¨Nox
Indicate by check mark if the registrant is not required to file reports pursuant to Section 13 or Section 15(d) of the Securities Exchange Act of 1934. Yes¨Nox
Indicate by check mark whether the Registrant (1) has filed all reports required to be filed by Section 13 or 15(d) of the Securities Exchange Act of 1934 during the preceding 12 months (or for such shorter period that the Registrant was required to file such reports), and (2) has been subject to such filing requirements for the past 90 days: Yesx¨No¨x
Indicate by check mark whether the registrant has submitted electronically and posted on its corporate Web site, if any, every Interactive Data File required to be submitted and posted pursuant to Rule 405 of Regulation S-T during the preceding 12 months (or for such shorter period that the registrant was required to submit and post such files). Yes¨xNo¨
Indicate by check mark if disclosure of delinquent filers pursuant to Item 405 of Regulation S-K (§229.405 of this chapter) is not contained herein, and will not be contained, to the best of registrant’s knowledge, in definitive proxy or information statements incorporated by reference in Part III of this Form 10-K or any amendment to this Form 10-K.x
Indicate by check mark whether the registrant is a large accelerated filer, an accelerated filer, a non-accelerated filer, or a smaller reporting company, or an emerging growth company. See the definitions of “large accelerated filer,”filer”, “accelerated filer”, “smaller reporting company”, and “smaller reporting“emerging growth company” in Rule 12b-2 of the Exchange Act. (Check(check one):
Large accelerated filer¨ | Accelerated filer¨ | Non-accelerated filerx | Smaller reporting company¨ | Emerging growth companyx | |
| (Do not check if a smaller reporting company) | |||||
If an emerging growth company, indicate by check mark if the registrant has elected not to use the extended transition period for complying with any new or revised financial accounting standards provided pursuant to Section 7(a)(2)(B) of the Securities Act. ¨
Indicate by check mark whether the registrant is a shell company (as defined in Rule 12b-2 of the Act). Yes¨Nox
There is no established market for the Registrant’sRegistrant's shares of common stock. The Registrant is currently conducting an ongoing public offeringAs of its sharesJune 30, 2016, the last business day of common stock pursuant to a Registration Statementthe registrant's most recently completed second fiscal quarter, the aggregate market value of the registrant's equity held by non-affiliates of the registrant was approximately $32,180,186 based on Form N-2 (File No. 333-166636), which shares are being sold at $10.15 per share as of December 31, 2013, with discounts available for certain categories of purchasers, or at a price necessary to ensure that shares are not sold at a price below net asset value per share.share of the registrant's common stock on such date.
The number of shares of the Registrant’s common stock, par value $0.001 per share, outstanding as of March 10, 2014June 2, 2017 was 3,619,692.6,397,027.
Documents Incorporated by Reference
Portions of the registrant’s definitive Proxy Statement relating to the registrant’s 2014 Annual Meeting of Stockholders, to be filed with the Securities and Exchange Commission within 120 days following the end of the Company’s fiscal year, are incorporated by reference in Part III of this Annual Report on Form 10-K as indicated herein.None.
Explanatory Note
This Amendment No. 1 on Form 10-K/A to the Annual Report on Form 10-K of VII Peaks Co-Optivist Income BDC II, Inc. (the “Fund”) for the year ended December 31, 2013 (the “Annual Period”), as originally filed with the Securities and Exchange Commission (the “SEC”) on March 11, 2014 (the “Original Report”), is being filed to restate the Fund’s previously issued financial statements for the Annual Period and to revise related disclosures, including “Management’s Discussion and Analysis of Financial Condition and Results of Operations” for the Annual Period.
As more fully described in Note 3 to the accompanying financial statements, the restatement corrects an error relating to offering costs that were paid by the Fund but which should have been borne by the Fund manager and reimbursed in accordance with the limitations imposed by the agreement between the Fund and the Fund manager, which error primarily resulted from an incorrect interpretation of the agreements between the Fund and the Fund manager. At the same time, the Fund reclassified certain other operating expenses to conform with the Fund’s current method of classifying operating expenses to facilitate comparability of financial statements among different periods. For the convenience of the reader, this Form 10-K/A otherwise sets forth the Original Report in its entirety. In order to preserve the nature and character of the disclosures set forth in the Original Report, this Form 10-K/A speaks as of the date of the filing of the Original Report, March 11, 2014, and the disclosures contained in this Form 10-K/A have not been updated to reflect events occurring subsequent to that date, other than those associated with the restatement.
Forward Looking Statements
The following information contains statements that constitute forward-looking statements, within the meaning of Section 27A of the Securities Act of 1933, as amended, and Section 21E of the Securities Exchange Act of 1934, as amended (the “Exchange Act”).statements. These statements generally are characterized by the use of terms such as “may,” “should,” “plan,” “anticipate,” “estimate,” “intend,” “predict,” “believe,” and “expect” or the negative of these terms or other comparable terminology. Although we believe that the expectations reflected in such forward-looking statements are based upon reasonable assumptions, our actual results could differ materially from those set forth in the forward-looking statements.
Forward-looking statements contained in this Annual Report are subject to a number of risks and uncertainties, some of which are beyond our control, including statements as to:
| • | our ability to successfully employ our Co-OptivistTMapproach in executing our investment strategy; |
For a discussionOur actual results, performance, prospects or opportunities could differ materially from those expressed in or implied by our forward-looking statements. A description of factorssome of the risks that could cause our actual results to differ from forward-looking statements containedappears under the section “Risk Factors” and elsewhere in this Annual Report, please see the discussion under Part I, Item 1A “Risk Factors”. Youprospectus. Additional risks of which we are not currently aware or which we currently deem immaterial could also cause our actual results to differ.
In light of these risks, uncertainties and assumptions, you should not place undue reliance on theseany forward-looking statements. TheThese forward-looking statements are made in this Annual Report relate only to events as of the date on which the statements are made.of this prospectus. We undertake no obligation to publicly update or revise any forward-looking statement to reflect events or circumstances occurringstatements after the date of this Annual Report.prospectus, whether as a result of new information, future events or otherwise, except as required by law.
Forward-looking statements are subject to numerous assumptions, risks and uncertainties, which change over time. Forward-looking statements speak only as of the date they are made, and we assume no duty to and do not undertake to update forward-looking statements. These forward-looking statements contained in this prospectus do not meet the safe harbor for forward-looking statements pursuant to Section 27A of the Securities Act. Actual results could differ materially from those anticipated in forward-looking statements and future results could differ materially from historical performance.
| 2 |
VII PEAKS CO-OPTIVIST INCOME BDC II, INC.
FORM 10-K/A10-K FOR THE YEAR ENDED DECEMBER 31, 20132016
TABLE OF CONTENTS
| 3 |
Except as otherwise specified in this annual report on Form 10-K/A10-K (“Annual Report”), the terms:
| • | “we”, “us”, “our” and the “Fund” refer to VII Peaks Co-OptivistTM Income BDC II, Inc., a Maryland Corporation. |
General
We are a specialty finance company incorporated in Maryland on August 3, 2011. We are an externally managed, non-diversified closed-end management investment company that has elected to be treated as a business development company ("BDC"), under the Investment Company Act of 1940, as amended, or (the “1940 Act”). In addition, we
We are managed by VII Peaks Capital, LLC, or (the “Manager”), which is registered as an investment adviser with the Securities and Exchange Commission, or (the “SEC”). We have elected to be treated for federal income tax purpose, and intend to qualify annually,purposes as a regulated investment company, or RIC,(“RIC”) under Subchapter M of the Internal Revenue Code of 1986, as amended or the Code.
As of August 20, 2013, we are managed by VII Peaks Capital, LLC (the “Manager”), a registered investment adviser under the Investment Advisers Act of 1940, as amended, (the “Advisers Act”). Our Manager is responsible for sourcing and conducting research on prospective investments, analyzing opportunities, structuring our portfolio, and monitoring our investments and portfolio companies on an ongoing basis. Prior to August 20, 2013 the Fund was managed by VII Peaks-KBR BDC Advisor II, LLC who was wholly-owned by VII Peaks-KBR, LLC which was a joint venture between VII Peaks Capital, LLC and KBR Capital Advisors, LLC (“KBR”“Code”).
On August 9, 2011, we filed a registration statement on Form N-2 to sell up to 75,000,000 shares of common stock, $0.001 par value per share, at an initial public offering price of $10.00 per share. The registration statement was declared effective by the Securities Exchange Commission (the “SEC”)SEC on March 1, 2012. We commenced operations when we raised gross offering proceeds of over $1.0 million, all of which was from persons who were not affiliated with us or our manager by one year from the date the registration statement was declared effective by the SEC. Prior to the successful satisfaction of that condition, all subscription payments were placed in an account held by the escrow agent, UMB Bank, N.A., in trust for the benefit of our subscribers, pending release to us. We achieved the minimum offering requirement on July 10, 2012 and commenced operations on such date. As of December 31, 2013,2016, we issued 3.26.3 million shares of common stock for gross proceeds of $31.6$62.6 million, including $0.7$4.7 million under our distribution reinvestment plan (“DRIP”).
We invest primarily in discounted corporate debt, senior secured term loan and equity-linked debt securities of public and private companies that trade on the secondary loan market for institutional investors and provide distributions to investors. The debt is generally high-yield and non-investment grade. At the same time, we actively work with the target company’s management to restructure the underlying securities and improve the liquidity position of the target company’s balance sheet. We employ a proprietary “Co-Optivist”TM approach (“cooperative activism”, Co-OptivistTM is a registered trademark of VII Peaks Capital, LLC, or (“VII Peaks” or the “Manager”), and is being used with their permission) in executing our investment strategy, which entails proactively engaging the target company management on average 24 months prior to a redemption event (typically a put or maturity event) to create an opportunity for growth in the investments. We also make opportunistic debt and preferred equity investments in private companies.
Our strategy is not dependent on restructuringinvestment objectives are to generate distributions. current income and capital appreciation. We meet our investment objectives by: (i) realizing income and capital appreciation through the acquisition, management and orderly liquidation of corporate debt securities, (ii) making distributions of available distributable cash to our shareholders, and (iii) preserving the capital investments of our shareholders.There can be no assurance that any of these objectives be achieved.
Capital appreciation on securities is generally not realized evenly over the holding period. In some instances market prices for securities may continue to reflect a discount until a relatively short time period prior to a redemption event. The potential capital gain typically occurs during the end of the holding period of a bond in our portfolio when securities are either called by the company or exchanged to new securities during refinance. We have tendered certain debt securities well above the market-traded deep discount.
Our investment objectives are to generate current income and capital appreciation. We meet our investment objectives by: (i) realizing income and capital appreciation through the acquisition, management and orderly liquidation of corporate debt securities, (ii) making distributions of available distributable cash to our shareholders, and (iii) preserving the capital investments of our shareholders.
Our proprietary “Co-Optivist”TM approach entails investment in the corporate debt and equity-linked debt securities of target companies, or Target Investments, in conjunction with proactively engaging the target companies’ management. We acquire Target Investments whose debt securities trade on the over-the-counter market for institutional loans at a discount to their par redemption value, and will be subject to a “redemption event” within (on average) 24 months. We also invest directly in debt of private companies. We define a “redemption event” as a maturity event or a put event (where investors in the target companies’ debt security can have a redemption right at a pre-determined price). We hold such debt an average of 12 – 18 months, during which time we anticipate working actively with the target companies’ management to effect and/or participate in a restructuring or exchange of the invested securities for new securities.
We make investments in target companies that meet our investment criteria. The size of an individual investment will vary based on numerous factors. However, assuming we raise the maximum offering amount of $750$750.0 million, we expect to hold at least 50 investments, and we anticipate that the minimum investment size will be approximately $250,000. We do not anticipate being heavily invested in any one industry, and generally, we do not expect to invest in more than two different classes of debt of the same target company. We invest in debt and equity-linked debt of target companycompanies with a minimum enterprise value of $200$200.0 million and whose debt and equity-linked debt is actively traded in the secondary loan market. OurWe also make senior secured direct loan investments in companies with a minimum enterprise value of $5.0 million. For such senior secured direct loan investments, we may receive equity securities to boost overall returns. We expect our portfolio isto be predominantly composed of fixed-rate high-yield, senior secured term loan and equity-linked corporate debt securities. However, we may also purchase senior secured corporate debt securities, which may have variable interest rates. We currently anticipate that the portion of our portfolio composed of variable rate corporate debt securities, if any, will not exceed 20%, but we may increase that to 33% of our aggregate portfolio at the time of any purchase depending on market opportunities.
| 4 |
We offer our stockholdersshareholders the ability to receive distributions as well as the potential capital appreciation resulting from the restructuring of the debt of our Target Investments.target companies. To the extent we have distributable income available we anticipate declaringmaking distributions with a record and payment date on a semi-monthly basis. Please see Part II, Item 5. “Market for Registrant’s Common Equity, Related Stockholder Matters and Issuer Purchases of Equity Securities” for a detailed description of Distributions.monthly basis to our shareholders.
Between 2001 and 2008, corporate debt levels and the supply of leverage offered by banks and other investors steadily increased.began a steady increase. Since then, corporate debt has continued to increase, with the financing sources less available. We believe a significant amount of this debt will be subject to a redemption event prior to 2015.2021. Many of the companies that have outstanding issues of such debt have not, or been able to proactively refinance, creating a “refinancing wall” that we believe will create a liquidity shortfall for many issuers. The value of the debt securities of these companies as reflected in prices quoted in the secondary loan market, may be at a significant discount to par, and represent a premium yield to maturity reflective of these liquidity concerns, creating the opportunity for us to identify and invest in the debt securities of select companies at attractive current market valuations. We believe that our Co-OptivistTM approach can help our target companies achieve results that are beneficial to the long-term value of their businesses, which will in turn, result in capital gains through capital appreciation, or the exchange of invested securities into a current security or cash at a premium to its acquisition price. Our principals collectively have experience in principal investing, debt securities and general capital markets, and we believe we are well-positioned to capitalize on these opportunities.
Conversion to Closed End Interval Fund
At our adjourned annual meeting of stockholders held on December 28, 2016, our stockholders (i) approved the withdrawal of our election to be treated as a business development company; (ii) approved our reorganization as a Delaware Statutory Trust; (iii) approved the amended and restated investment management agreement with our Manager, and (iv) approval of a fundamental policy whereby we would become an “interval fund”, under which we would make annual repurchase offers of our shares on or about November 1stof each calendar year (collectively, the “Reorganization”). We will complete the Reorganization promptly after approval of an N-2 Registration Statement to be filed by VII Peaks Co-Optivist Income Fund, a Delaware Statutory Trust, which was formed on January 25, 2017.
Changes to Investment Advisory Agreement
Set forth below is a chart that summarizes the differences between our Manager’s current investment advisory agreement and the amended and restated investment management agreement approved by our shareholders:
| Current Investment Advisory Agreement | Proposed Amended and Restated Investment Advisory Agreement | |
| Fees-Management | 2.00% if ournet assets are below $100 million; 1.75% if ournet assets are between $100 million and $250 million; and 1.50% if ournet assets are above $250 million. Fee is payable monthly in arrears. | 2.00% if ourgross assets are below $100 million; 1.75% if ourgross assets are between $100 million and $250 million; and 1.50% if ourgross assets are above $250 million. Fee is payable monthly in arrears. |
| Incentive Fee on Net Investment Income | 20% of our net investment income above a hurdle rate of 8% per annum, paid quarterly. | No change. |
| Incentive Fee on Capital Gains | 20% of our realized capital gains, less realized and unrealized capital losses. | Eliminated. |
| Future Offering Expenses | Incurred by our manager and reimbursed at the rate of 1.5% of gross offering proceeds. | Incurred and paid by us. |
| Past Offering Expenses paid by Manager | Only reimbursable to the extent of 1.5% of our gross offering proceeds. | No change. |
Conversion to Interval Fund
In the event the Reorganization is consummated, our shareholders approved the adoption of a fundamental policy under which we would operate as an “interval fund” that makes periodic repurchase offers for our common stock. Set forth below is the fundamental policy approved by our shareholders:
(a) We will make offers to repurchase our shares at annual intervals pursuant to Rule 23c-3, as amended from time to time. Our Board of Directors may place such conditions and limitations on repurchases as may be permitted.
| 5 |
(b) November 1stof each year, or the next business day if November 1st is not a business day, will be the deadline (the “Repurchase Request Deadline”) by which we must receive repurchase requests submitted by our shareholders in response to the most recent repurchase offer.
(c) The date on which the repurchase price for shares is to be determined shall occur within fourteen (14) days after the Repurchase Request Deadline.
(d) Repurchase requests may be suspended or postponed under certain circumstances, as provided for in Rule 23c-3.
Fundamental Investment Policies and Restrictions
Following our withdrawal of our election to be treated as a business development company, we will no longer be required to invest at least 70% of our assets in eligible portfolio securities. Instead, we are required to adopt fundamental policies and restrictions that govern how we may invest our assets. The stated fundamental policies may only be changed by the affirmative vote of a majority of our outstanding voting securities. As defined by the Investment Company Act of 1940 (the “1940 Act”), the vote of a “majority of the outstanding voting securities of the company” means the vote, at an annual or special meeting of the company’s shareholders duly called, (a) of 66- 2 ⁄ 3 % or more of the voting securities present at such meeting, if the holders of more than 50% of the outstanding voting securities of the company are present or represented by proxy; or (b) of more than 50% of the outstanding voting securities of the company, whichever is less.
Set forth below are the fundamental policies and restrictions that we expect to adopt upon consummation of the Reorganization:
| (1) | we may borrow money, except to the extent permitted by the 1940 Act, or any rules, exemptions or interpretations thereunder that may be adopted, granted or issued by the SEC. |
| (2) | we may not act as an underwriter of securities of other issuers, except to the extent we may be deemed to be an underwriter when disposing of our own securities. |
| (3) | we may not make loans if, as a result, more than 33 1/3% of our total assets would be lent to other persons, including other investment companies to the extent permitted by the 1940 Act or any rules, exemptions or interpretations thereunder that may be adopted, granted or issued by the SEC. This limitation does not apply to (1) the lending of portfolio securities, (2) the purchase of debt securities, other debt instruments, loan participations and/or engaging in direct corporate loans in accordance with our investment goals and policies, and (3) repurchase agreements to the extent the entry into a repurchase agreement is deemed to be a loan. |
| (4) | we may not purchase or sell real estate unless acquired as a result of ownership of securities or other instruments and provided that this restriction does not prevent us from (i) purchasing or selling securities or instruments secured by real estate or interests therein, securities or instruments representing interests in real estate or securities or instruments of issuers that invest, deal or otherwise engage in transactions in real estate or interests therein, and (ii) making, purchasing or selling real estate mortgage loans. |
| (5) | we may not purchase or sell physical commodities, unless acquired as a result of ownership of securities or other instruments, provided that this restriction does not prevent us from investing in commodities contracts for the purpose of hedging its investment portfolio, including currency futures, stock index futures, interest rate futures and options thereon. |
| (6) | we may not issue senior securities, except to the extent permitted by the 1940 Act or any rules, exemptions or interpretations thereunder that may be adopted, granted or issued by the SEC. |
| (7) | we may not invest more than 25% of our net assets in securities of issuers in any one industry (other than securities issued or guaranteed by the U.S. government or any of its agencies or instrumentalities or securities of other investment companies). |
| (8) | we will not be limited in the percentage of our assets that may be invested in the securities of any one issuer. |
With respect to these investment restrictions (except our policy on borrowings set forth above), if a percentage restriction is adhered to at the time of our investment or transaction, a later change in percentage resulting from a change in the values of our investments or the value of our total assets, unless otherwise stated, will not constitute a violation of such restriction or policy.
The 1940 Act currently limits borrowing to no more than 33-1/3% of the value of our total net assets. In addition, the 1940 Act currently limits the issuance of a class of senior securities that is indebtedness to no more than 33-1/3% of the value of our total assets or, if the class of senior security is stock, to no more than 50% of the value of our total assets.
| 6 |
Our Manager
Our investment activities are managed by our Manager who is registered as an investment adviser under the Investment Advisers Act.Act of 1940, as amended, or (the “Advisers Act”). Our Manager is responsible for sourcing potential investments, conducting research on prospective investments, analyzing investment opportunities, structuring our investments, and monitoring our investments and portfolio companies on an ongoing basis. Our Manager is led by Gurpreet (Gurprit) S. Chandhoke, who also serves as our Chief Executive Officer, and Stephen F. Shea. They are supported by the Manager’s team of employees, including investment professionals who hashave extensive experience in underwriting and issuing debt products that include high-yield, bank debt and convertible debt and hashave acted as financial adviseradvisers to private equity funds, venture capital firms and corporations in mergers and acquisitions, recapitalization and corporate finance transactions, and hashave served as principal investorinvestors in private equity and leveraged buyout transactions.
Our Manager has an investment committee that is responsible for reviewing, discussing and approving each investment opportunity we seek to pursue. Our investment committee meets routinely to discuss new and existing opportunities and developments on current investments. Our investment committee currently is led byconsists of Mr. Chandhoke, our Chief Executive Officer, withand Mr. Shea.
Our Affiliates
Our Manager is owned and managed by Gurpreet (Gurprit) S. Chandhoke, our Chief Executive Officer, and Stephen F. Shea,Shea. Founded in April 2009 with principal offices in Orinda, California, our Manager is an investment management firm that currently serves as a Managing Partnersub-advisor to a number of separate managed accounts managed by large global financial institutions and other private funds.
Our Manager also manages VII Peaks Co-Optivist B Fund I, LLC, VII Peaks Co-Optivist R Fund I, LLC and VII Peaks Co-Optivist B Fund II, LLC, private funds that were formed to conduct private placements of securities and which have substantially similar investment objectives as the Fund. As of December 31, 2016, VII Peaks Co-Optivist B Fund I, LLC, VII Peaks Co-Optivist R Fund I, LLC and VII Peaks Co-Optivist B Fund II, LLC had aggregate net assets of $2.5 million.
The investment objective, strategy and fee structure of the private funds are substantially similar to those of VII Peaks Capital, LLC.
As aCo-Optivist Income BDC we are required to comply with certain regulatory requirements. For instance, we have to invest at least 70%II, Inc. However, the performance of the private funds is not necessarily indicative of our total assets in “qualifying assets,” including securities of U.S. operating companies whose securities are not listed on a national securities exchange (i.e., New York Stock Exchange, American Stock Exchange and The NASDAQ Global Market), U.S. operating companies with listed securities that have equity market capitalizations of less than $250 million, cash, cash equivalents, U.S. government securities and high-quality debt investments that mature in one year or less. In addition, we are only allowed to borrow money such that our asset coverage, which, as defined in the 1940 Act, measures the ratio of total assets less total liabilities (excluding borrowings) to total borrowings, equals at least 200% after such borrowing, with certain limited exceptions.future performance.
Market Opportunity
In the upcoming years, we believe many companies will face maturities and redemptions on significant amounts of outstanding debt and will have to find ways to refinance those obligations. See below a chart compiled from S&P for Investment grade and speculative grade USD Bonds maturing from 2016 to 2034. The chart shows approximately $6.9 trillion of U.S. based investment and speculative grade bonds to mature between 2016 and 2034.
| 7 |
While companies have recently taken advantage of the low-interest rate environment to amend and extend their debt maturities, we believe this is only a temporary push-out of the debt maturity wall without a meaningful reduction in overall outstanding debt. For the foreseeable future, we expect continued low demand for collateralized debt and soft economic growth to keep credit markets tight. The amount of speculative-grade debt (“BB+” and lower) coming due will continue to be a large share of overall maturing debt. Corporate borrowers whose debt carries lower ratings have had difficulty obtaining refinancing and face what we call a “refinancing wall”. As a result, many companies with speculative-grade debt have chosen to amend-and-extend their maturities rather than fully refinancerefinancing their debt.
Our strategy is to invest in debt securities that are issued by companies with solid fundamentals and business prospects but who are facing a liquidity shortfall as they approach the “refinancing wall”. We believe that the expertise and experience of the officers of our Manager provide us with the ability to identify debt securities that we believe are currently mispriced in the secondary loan market and thus provide an opportunity for returns as their values recover and appreciate.
Potential Competitive Strengths
We believe that we have the following potential competitive strengths as compared to investment funds that also invest in discounted corporate debt, senior secured term loan and equity-linked debt securities:
| • | We Are Not a Traditional Distressed Fund. Traditional distressed debt investors typically seek to own the debt and engage in a bankruptcy process with the issuing company and eventually become equity holders. Through equity ownership, traditional distressed debt investors then intend to restructure operations of the |
| • | Investment Hold Period. We will not actively trade in and out of positions. Rather, we hold our investments for an average of 12 – 18 months. During this hold period we anticipate working co-operatively with target company management and other debt holders on a debt restructuring or exchange. |
| • | Comprehensive Private Equity Due Diligence Approach. We employ a comprehensive private equity approach to our investment due diligence process. This approach involves performing comprehensive business and industry due diligence and in-depth, bottoms-up valuation analyses for each investment, comparable to what a private equity firm with a long-term ownership position would conduct prior to investing in a target company. We believe this disciplined approach serves as an effective risk management tool for our investment process. |
| • | Relevant Capital Markets and Investment Experience. Our investment team consists of individuals who collectively have expertise and experience in principal investing, debt securities and general capital markets. The members of our investment team combined have been involved in the issuance of over $20 billion of debt securities, advised on a number of merger and acquisition transactions and invested in a number of private equity and leveraged buyout transactions. |
Investment Criteria and Strategy
WeSecondary Market Debt Securities
With respect to corporate debt, senior secured term loan and equity-linked debt securities that we acquire on the secondary market, we invest in discounted corporate debt and equity-linked debt securities of companies that have a perceived risk of near term liquidity issues but have solid business fundamentals and prospects, including historical revenue growth, positive cash flow, significant and sustainable market presence, and sufficient asset coverage. We take a principal position in discounted debt securities with the primary goal of restructuring the terms of the debt to allow the target company to increase its liquidity and strengthen its balance sheet. Our typical target company has a debt redemption event (typically either a put or maturity event) on average within 24 months of our investment and has experienced a significant decline in its equity value reflective of a highly leverageleveraged capital structure or general market conditions. We believe that proactively guiding such companies to restructure their debt will allow them to increase liquidity and free up resources to grow their businesses rather than focusing on managing their debt obligations. We also believe that our involvement can allow the target company more flexibility to explore strategic alternatives, since the terms of the existing debt structure often limits strategic options for the target company.
The following is our primary investment criteria for our target company:
| 8 |
The securities that we target include high-yield debt, bank debt, convertible debt, and collateralized loan obligations (“CLO”), which are high-yield loans securitized into pools containing varying degrees of credit rating. Our portfolio is predominantly composed of fixed-rate high-yield and equity-linked corporate debt securities. However, we may also purchase senior secured corporate debt securities which may have variable interest rates. We currently anticipate that the portion of our portfolio composed of variable rate corporate debt securities, if any, will not exceed 20%, but we may increase that to 33% of our aggregate portfolio at the time of any purchase depending on market opportunities. In addition to the investments noted above, we may invest up to 30% of our portfolio in opportunistic investments, including, but not limited to, high-yield bonds, private equity investments, distressed debt investments and securities of public companies that are not thinly traded. We expect that these public companies generally will have debt securities that are non-investment grade. We also may invest in debt securities of middle-market companies located outside of the United States. All investments by us will be subject to oversight by our boardBoard of directors,Directors, a majority of whom will be independent directors with no material interests in such transactions.
In each of our debt investments, we seek to become an influential investor, typically either through the size of our position or cooperation with other debt holders to pursue the shared goal of a beneficial debt restructuring. We actively work with other debt holders and the target company management to potentially restructure and exchange the existing debt for new securities with amended terms. We believe that a debt restructuring can be a positive outcome for not just the issuer but also its other stakeholders.
We employ our Co-OptivistTM approach in executing our investment strategy, which entails taking an influential position and proactively engaging the target company management on average 24 months prior to a redemption event (typically a put or maturity event). This approach differs from traditional activist debt holders who typically wait until a company is near or at bankruptcy before beginning formal discussions regarding debt restructuring options. In addition, our strategy does not involve taking an operational role in the target company or changing management or members of the target companies’ boardBoard of directorsDirectors or actively negotiating the terms of the restructuring. Rather, we look to establish a positive working relationship in assisting our target company to achieve shared goals.
We apply strict investment criteria to, and perform comprehensive due diligence on, each investment opportunity prior to making an investment decision. We define a base case as a situation where no debt restructuring occurs and the target company management chooses to meet the redemption event. With a successful restructuring, we see a potential for further upside in returns that could potentially exceed our base case. In connection with our investments, we actively pursue various hedging strategies to manage the volatility and risk profile of our overall investment portfolio, which may include purchasing derivatives or other securities. We do not anticipate that such equity exposure including overall hedging costs will exceed 5% of the overall portfolio.
| 9 |
Investment Selection Process
Our investment committee is responsible for reviewing, discussing and approving each investment idea we seek to pursue. Our investment committee meets routinely, to discuss new and existing ideas and developments on current investments. Our investment committee currently is led by Mr. Chandhoke, who also serves as our Chief Executive Officer, and Mr. Shea, a Managing Partner of VII Peaks Capital, LLC.
At the start of the investment selection process, the investment team distributes to the investment committee a preliminary memorandum for each investment opportunity detailing how the investment fits our investment criteria and the associated opportunities and risks of such investment. The investment committee then decides whether to expend resources and proceed with further due diligence on a particular investment opportunity. For the opportunities that are approved for further diligence, the investment team commences detailed due diligence. Upon completion of due diligence, the investment team circulates a final due diligence report to the investment committee, which will include a full investment memorandum detailing the investment opportunities and risks along with all supplemental due diligence materials and exhibits, including industry and market research, due diligence summaries and financial analyses. The investment committee reviews and discusses all materials and conducts a final vote on whether to execute on an investment. We will only make investments that are approved by a majority of the investment committee members, and no investment can be approved without the favorable vote on the investment by our Chief Executive Officer.
Below is a summary of our investment and approval process:


Originated Investment Positions
We also expect to generate current income through debt and equity investments that we originate, in addition to investments that we acquire on the secondary market. A secondary objective is to generate long-term capital appreciation through such investments. We anticipate that during our offering period we will invest largely in over-the-counter debt securities and customized debt and equity investments in lower middle market companies. We have adopted the following business strategy to achieve our investment objective:
Focus on middle market companies with stable cash flow. We believe that there are relatively few finance companies focused on transactions involving middle market companies, and this is one factor that allows us to negotiate favorable investment terms. Such favorable terms include higher debt yields and lower leverage levels, more significant covenant protection and greater equity participation than typical of transactions involving larger companies. We will generally invest in established companies with positive cash flow. We believe that established companies possess better risk-adjusted return profiles than newer companies that are building management or in early stages of building a revenue base. These middle market companies represent a significant portion of the U.S. economy and often require substantial capital investment to grow their businesses.
Employ disciplined underwriting policies and rigorous portfolio management. We employ an extensive underwriting process that includes a review of the prospects, competitive position, financial performance and industry dynamics of each potential portfolio company. In addition, we perform substantial due diligence on potential investments and seek to invest with management teams and/or private equity sponsors who have proven capabilities in building value. Through our Manager, we offer managerial assistance to our portfolio companies, giving them access to our investment experience, direct industry expertise and contacts, and allowing us to continually monitor their progress. As part of the monitoring process, our Manager analyzes monthly and quarterly financial statements versus the previous periods and year, review financial projections, meet with management, attend board meetings and review all compliance certificates and covenants.
Focus on long-term credit performance and principal protection. We will structure our customized loan investments on a conservative basis with high cash yields, first and/or second lien security interests where possible, cash origination fees, and lower relative leverage levels. Portfolio companies may pay fund manager due diligence fees to cover legal, due diligence, and loan structuring costs. We will seek strong deal protections for our customized debt investments, including default penalties, information rights, board observation rights, and affirmative, negative and financial covenants, such as lien protection and prohibitions against change of control. We believe these protections will reduce our risk of capital loss.
Diversification. We seek to diversify our portfolio broadly among companies in a multitude of different industries and end markets, thereby reducing the concentration of credit risk in any one company or sector of the economy. We cannot guarantee that we will be successful in this effort.
In addition to the investments noted above, we may invest up to 30% of our portfolio in opportunistic investments, including, but not limited to, securities of public companies that are not thinly traded and debt securities of companies located outside of the United States.
| 10 |
Investment Exit Strategy
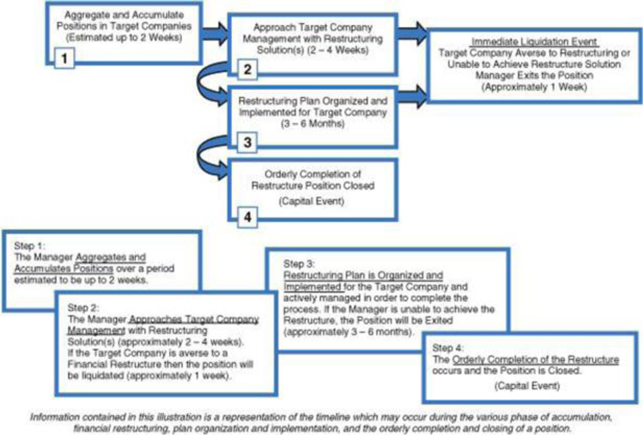
We employ a strict sell discipline to our investments. As mentioned in our investment selection process, we look for investment opportunities that provide us with the potential to generate income to support sustainable distributions, even if no restructuring of the debt occurs. If a debt restructuring has not occurred upon an investment reaching this return threshold, we will continue our efforts to drive towards a restructuring. If a successful restructuring of the target company debt occurs, we sell a portion of our holdings upon the next pre-determined sell threshold (which we estimate will be approximately twice the average current yield of high yield bonds), usually within one to two quarters after the restructuring event. At that time, depending on the market response to the proposed restructuring, we may choose to exit the entire investment or maintain a small portion to further augment returns.
We anticipate that it will take approximately two weeks to accumulate our position in a target company. Following that, we expect that it will take a minimum of an additional two to four weeks to approach management of the target company with a debt restructuring proposal. Assuming the target company wishes to pursue our debt restructuring proposal, we expect that the restructuring itself will take approximately three to six months to implement. At any time during this process, if we feel the target company is unwilling to pursue our debt restructuring proposal, we will seek to dispose of our position in the target company in an orderly manner. We avoid holding the discounted debt if a redemption event is approaching within six months and there is no existing evidence that this debt will be restructured.
The diagram below is illustrative of how we may use our position as an influential debtholder of a target company to restructure its indebtedness.
Portfolio Monitoring
Valuation process. Each quarter, we value investments in our portfolio, and such values are disclosed in reports filed with the SEC. Investments for which market quotations are readily available are recorded at such market quotations. With respect to investments for which market quotations are not readily available, our boardBoard of directorsDirectors, or a committee thereof, will determine the fair value of such investments in good faith, utilizing the input of our valuation committee, our Manager and any other professionals or materials that our boardBoard of directorsDirectors, or a committee thereof, deems worthy and relevant, including independent third-party valuation firms, if applicable.
Managerial assistance. As a BDC,business development company, we must offer, and provide upon request, managerial assistance to certain of our portfolio companies. This assistance could involve, among other things, monitoring the operations of our portfolio companies, participating in board and management meetings, consulting with and advising officers of portfolio companies and providing other organizational and financial guidance. Depending on the nature of the assistance required, our Manager will provide such managerial assistance on our behalf to portfolio companies that request this assistance. To the extent fees are paid for these services, we, rather than our Manager, will retain any fees paid for such assistance.
| 11 |
Determination of Net Asset Value
We determine the net asset value of our investment portfolio each quarter. Securities that are publicly-traded are valued at the reported closing price on the valuation date. Securities that are not publicly-traded are valued at fair value as determined in good faith by our boardBoard of directors.Directors, or a committee thereof. In connection with that determination, our Manager will prepare portfolio company valuations using relevant inputs, including, but not limited to, indicative dealer quotes, values of like securities, the most recent portfolio company financial statements and forecasts, and valuations prepared by third-party valuation services.
With respect to investments for which market quotations are not readily available, we undertake a multi-step valuation process each quarter, as described below:
Investments are valued utilizing a market approach, an income approach, or both approaches, as appropriate. The market approach uses prices and other relevant information generated by market transactions involving identical or comparable assets or liabilities (including a business). The income approach uses valuation techniques to convert future amounts (for example, cash flows or earnings) to a single present value amount (discounted) calculated based on an appropriate discount rate. The measurement is based on the net present value indicated by current market expectations about those future amounts. In following these approaches, the types of factors that we may take into account in fair value pricing our investments include, as relevant: available current market data, including relevant and applicable market trading and transaction comparables, applicable market yields and multiples, security covenants, call protection provisions, information rights, the nature and realizable value of any collateral, the portfolio company’s ability to make payments, its earnings and discounted cash flows, the markets in which the portfolio company does business, comparisons of financial ratios of peer companies that are public, M&A comparables, the principal market and enterprise values, among other factors.
We have adopted Financial Accounting Standards Board, or FASB, Accounting Standards Codification, or ASC,(“ASC”), Topic 820,Fair Value Measurements and Disclosures (formerly Statement of Financial Accounting Standards No. 157,Fair Value Measurements ),, which defines fair value, establishes a framework for measuring fair value in accordance with generally accepted accounting principles and expands disclosures about fair value measurements.
ASC Topic 820 clarifies that the exchange price is the price in an orderly transaction between market participants to sell an asset or transfer a liability in the market in which the reporting entity would transact for the asset or liability, that is, the principal or most advantageous market for the asset or liability. The transaction to sell the asset or transfer the liability is a hypothetical transaction at the measurement date, considered from the perspective of a market participant that holds the asset or owes the liability. ASC Topic 820 provides a consistent definition of fair value which focuses on exit price and prioritizes, within a measurement of fair value, the use of market-based inputs over entity-specific inputs. In addition, ASC Topic 820 provides a framework for measuring fair value and establishes a three-level hierarchy for fair value measurements based upon the transparency of inputs to the valuation of an asset or liability as of the measurement date. The three levels of valuation hierarchy established by ASC Topic 820 are defined as follows:
Level 1: Quoted prices in active markets for identical assets or liabilities, accessible by the companyFund at the measurement date.
Level 2: Quoted prices for similar assets or liabilities in active markets, or quoted prices for identical or similar assets or liabilities in markets that are not active, or other observable inputs other than quoted prices.
Level 3: Unobservable inputs for the asset or liability.
In all cases, the level in the fair value hierarchy within which the fair value measurement in its entirety falls has been determined based on the lowest level of input that is significant to the fair value measurement.
| 12 |
Determinations in Connection With Offerings
We offerlast sold our shares on ashare in our continuous basisoffering at a current offering price of $10.15$8.75 per share;share: however, towe have not sold shares in our continuous offering since April 30, 2015. To the extent that our net asset value increases, we will sell at a price necessary to ensure that shares are not sold at a price per share, after deduction of selling commissions and dealer manager fees, that is below the net asset value per share. The closings are typically on a semi-monthlymonthly basis. To the extent that the net asset value per share increases subsequent to the last closing, the price per share may increase. Therefore, persons who subscribe for shares of our common stock in our continuous offering must submit subscriptions for a certain dollar amount, rather than a number of shares of common stock and, as a result, may receive fractional shares of our common stock. In connection with each closing on the sale of shares of our common stock offered pursuant to our prospectus on a continuous basis, the boardBoard of directorsDirectors or a committee thereof is required within 48 hours of the time that each closing and sale is made to make the determination that we are not selling shares of our common stock at a price which, after deducting selling commissions and dealer manager fees, is below our then current net asset value per share. The boardBoard of directorsDirectors or a committee thereof will consider the following factors, among others, in making such determination:
Importantly, this determination does not require that we calculate net asset value in connection with each closing and sale of shares of our common stock, but instead it involves the determination by the boardBoard of directorsDirectors or a committee thereof that we are not selling shares of our common stock at a price which, after deducting selling commissions and dealer manager fees, is below the then current net asset value at the time at which the closing and sale is made.
Effective for the February 28, 2013 close and onwards, the Pricing Committee of our Board of Directors increased the share price for new investments from $10.00 to $10.15 per share due to an increase in our NAV generated from successful refinancings of portfolio companies. On August 8, 2014, the Pricing Committee of our Board of Directors decreased the share price for new investments from $10.15 to $10.00 per share, and on November 18, 2014 the Pricing Committee of our Board of Directors decreased the share price for new investments from $10.00 to $9.75 per share. On November 24, 2015, the Board of Directors of the Fund and the Pricing Committee of the Board made a decision to approve a price reduction from $9.75 to $9.25 per share effective for the Funds next closing date and next declared distribution date. On May 23, 2016, the Board of Directors of the Fund and the Pricing Committee of the Board made a final decision to approve a price reduction from $9.25 to $8.75 per share. The decreases in August and November 2014 and November 2015 were made as a result of reductions in the net asset value per share of the Fund’s common stock, which resulted from three factors: overall declines in the market prices of high yield debt instruments; declines in the market value of specific positions that have defaulted or which the market perceives will need to restructure or the ones that have already been restructured into 144A private placement equity positions for which real pricing is not available; and as a result of distributions made to date in excess of net investment income. The Fund has also not been able to raise any additional capital since May 2015 because the N-2 has not been made effective by the SEC. The Pricing Committee of our Board of Directors is required to reassess our offering price when there is a decrease in NAV per share of more than 5% below our current net offering price, and is required to reduce the offering price where the decrease in the NAV per share is the result of a non-temporary movement in the credit markets or in the value of our assets. Our board reviewed market data regarding movements in the credit markets, and the specific circumstances surrounding each of the positions in our portfolio which had experienced the greatest decline in value, including recent earnings announcements, collateral, priority in the capital structure, and current indications as to the terms of any restructuring.
Moreover, to the extent that there is even a remote possibility that we may (i) issue shares of our common stock at a price which, after deducting selling commissions and dealer manager fees, is below the then current net asset value of our common stock at the time at which the closing and sale is made or (ii) trigger the undertaking (which we provided to the SEC in the registration statement to which our prospectus is a part) to suspend the offering of shares of our common stock pursuant to our prospectus if the net asset value fluctuates by certain amounts in certain circumstances until our prospectus is amended, the boardBoard of directorsDirectors or a committee thereof will elect, in the case of clause (i) above, either to postpone the closing until such time that there is no longer the possibility of the occurrence of such event or to undertake to determine net asset value within two days prior to any such sale to ensure that such sale will not be at a price which, after deducting selling commissions and dealer manager fees, is below our then current net asset value, and, in the case of clause (ii) above, to comply with such undertaking or to undertake to determine net asset value to ensure that such undertaking has not been triggered.
These processes and procedures are part of our compliance policies and procedures. Records will be made contemporaneously with all determinations described in this section and these records will be maintained with other records we are required to maintain under the 1940 Act. Promptly following any adjustment to the offering price per share of our common stock, we will update our prospectus by filing a prospectus supplement with the SEC. We will also make updated information available via our website.
| 13 |
Taxation and Election to be taxed asof a Regulated Investment Company (RIC)(“RIC”)
We have elected to be treated as a RIC under Subchapter M of the Code effective for our taxable year ended December 31, 2013,2016, and to annually qualify as a RIC thereafter. As a RIC, we generally will not have to pay corporate-level U.S. federal income taxes on any income that we distribute to our stockholders from our tax earnings and profits. To qualify as a RIC, we must, among other things, meet certain source-of-income and asset diversification requirements (as described below). In addition, in order to obtain RIC tax treatment, we must distribute to our stockholders, for each taxable year, at least 90% of our “investment company taxable income,” which is generally our net ordinary income plus the excess, if any, of realized net short-term capital gain over realized net long-term capital loss, or the Annual Distribution Requirement. Even if we qualify as a RIC, we generally will be subject to corporate-level U.S. federal income tax on our undistributed taxable income and could be subject to U.S. federal excise, state, local and foreign taxes.
In order to qualify as a RIC for U.S. federal income tax purposes, we must, among other things:
Provided that we qualify as a RIC and satisfy the Annual Distribution Requirement, we will not be subject to U.S. federal income tax on the portion of our investment company taxable income and net capital gain (which we define as net long-term capital gain in excess of net short-term capital loss) that we timely distribute to stockholders. We will be subject to U.S. federal income tax at the regular corporate rates on any income or capital gain not distributed (or deemed distributed) to our stockholders.
We will be subject to a 4% nondeductible U.S. Federal excise tax on certain undistributed income of RICs unless we distribute in a timely manner an amount at least equal to the sum of (1) 98% of our ordinary income for each calendar year, (2) 98.2% of our capital gain net income for the one-year period endingended October 31st in that calendar year and (3) any income recognized, but not distributed, in preceding years and on which we paid no U.S. federal income tax. We generally will endeavor in each taxable year to avoid any U.S. Federal excise tax on our earnings.
Overview of Our Manager
Our investment activities are managed by our Manager who is registered as an investment adviser under the Investment Advisers Act of 1940. Our Manager is responsible for sourcing potential investments, conducting research on prospective investments, analyzing investment opportunities, structuring our investments, and monitoring our investments and portfolio companies on an ongoing basis. Our Manager is led by Mr. Chandhoke, who also serves as our Chief Executive Officer, and Mr. Shea, Managing Partner of VII Peaks Capital, LLC. They are supported by the Manager’s team of employees, including investment professionals who have extensive experience in underwriting and issuing debt products that include high-yield, bank debt and convertible debt and have acted as financial advisers to private equity funds, venture capital firms and corporations in mergers and acquisitions, recapitalization and corporate finance transactions, and have served as principal investors in private equity and leveraged buyout transactions.
Our Manager has an investment committee that is responsible for reviewing, discussing and approving each investment opportunity we seek to pursue. Our investment committee routinely meets to discuss new and existing opportunities and developments on current investments. Our investment committee is currently led by Mr. Chandhoke, who also serves as our Chief Executive Officer, and Mr. Shea, a managing Partner of VII Peaks Capital, LLC.
Management Services and Responsibilities
Under the terms of the investment advisory agreement, our Manager:
Under the investment advisory agreement, theour Manager has a fiduciary responsibility for the safeguarding and use of our assets. TheOur Manager is also subject to liability under both the 1940 Act and the Advisers Act for a breach of these fiduciary duties.
| 14 |
Our Manager’s services under the investment advisory agreement may not be exclusive, and it is free to furnish similar services to other entities so long as its services to us are not impaired. In addition, our Manager performs certain administrative services under the administration agreement. See “Administration Agreement”.
Administration Agreement
Our Manager serves as our administrator. Pursuant to an administration agreement, our Manager furnishes us with office facilities, equipment and clerical, bookkeeping and record keeping services at such facilities. Under the administration agreement, our Manager also performs, or oversees the performance of, our required administrative services, which include, among other things, being responsible fortransfer agency and other service providers supervision and oversight, preparation and supervision of the financial records for which we are required to maintain for SEC reporting, stockholder reporting and preparing reports to our stockholders.other Fund needs, implementation and supervision of a robust compliance program and oversight and administration of the quarterly share repurchase program. In addition, our Manager assists us in activities which include, among other things, performance and supervision of investor relations, the Fund’s Board of Directors communication and reporting, determining and publishing our net asset value, overseesoverseeing the preparation and filing of our tax returns, and the communication, printing and dissemination of reports to our stockholders, and generally oversees the payment of our expenses and other events such as distributions, and the performance of administrative and professional services rendered to us by others. Under the administration agreement, we are obligated to reimburse our Manager for our allocable portion of our Manager’s overhead in performing its obligations under the administration agreement, including rent, the fees and expenses associated with overseeing and performing the compliance functions and our allocable portion of the compensation of our chief financial officer, chief compliance officer and any administrative support staff.staff; however, to date, cost of the chief financial officer, fund administration accounting and the chief compliance officer are charged directly to the Fund. Under the administration agreement, our Manager will also provide on our behalf managerial assistance to those portfolio companies that request such assistance. The administration agreement also provides the reimbursement to the Fund by the Manager for the Manager’s share of the Directors and Officers insurance, which is paid by the Fund in full. Either party may be terminated by either partyterminate the administration agreement without penalty upon 60 days’ written notice to the other party.
The administration agreement provides that, absent willful misfeasance, bad faith or negligence in the performance of its duties or by reason of the reckless disregard of its duties and obligations, our Manager and its officers, managers, partners, agents, employees, controlling persons, members and any other person or entity affiliated with it are entitled to indemnification from us for any damages, liabilities, costs and expenses (including reasonable attorneys’ fees and amounts reasonably paid in settlement) arising from the rendering of our Manager’s services under the administration agreement or otherwise as administrator for us.
License Agreements
We have entered into a license agreement with VII Peaks under which VII Peaks has agreed to grant us a non-exclusive, royalty-free license to use the names “VII Peaks” and “Co-Optivist.” Under these agreements, we will have a right to use the “VII Peaks,” and “Co-Optivist” names for so long as our Manager or one of its affiliates remains our investment adviser. Other than with respect to these limited licenses, we will have no legal right to the “VII Peaks,” and “Co-Optivist” names. These license agreements will remain in effect for so long as the investment advisory agreement with our Manager is in effect.
Certain Relationship and Related Party Transactions
Conflicts of interest between the operation of the CompanyFund and other activities of the Manager and its affiliates and principals are expected to occur from time to time. The Manager, in its sole judgment and discretion, will try to mitigate such potential adversity by the exercise of its business judgment in an attempt to fulfill its obligations. However, the Manager has not developed, and does not expect to develop, any formal process for resolving conflicts of interest. Such conflicts may include:
Competing Programs
Conflicts of interest between us and the various roles, activities and duties of the Manager and its affiliates may occur from time to time. The Manager, its officers and other affiliates may act as a manager or general partner of other private or public entities, some of whom may have the same or a similar investment objective as the Company.Fund. As a result, conflicts of interest between us and the other activities of the Manager and its affiliates may occur from time to time. None of the agreements or arrangements, including those relating to compensation, between the Company,Fund, the Manager or their affiliates, is the result of arm’s-length negotiations. As a result, there may be conflicts between us, on the one hand, and our Manager, including members of its management team, on the other, regarding the allocation of resources to the management of our day-to-day activities.
Further, the officers of VII Peaks are involved in other ventures, some of which may compete with us for investment opportunities, including certain affiliated funds or managed accounts, and may be incentivized to offer investment opportunities to such other ventures rather than to us which would make it more difficult to achieve our investment objectives objectives.
| 15 |
As a BDC,business development company, we will be subject to certain regulatory restrictions in making our investments. For example, we generally will not be permitted to co-invest with certain entities affiliated with our Manager in transactions originated by our Manager or its affiliates unless we obtain an exemptive order from the SEC or co-invest alongside our Manager or its affiliates in accordance with existing regulatory guidance and our allocation policy. Under existing regulatory guidance, we will be permitted to, and may co-invest in syndicated deals and secondary loan market transactions where price is the only negotiated point.
We may seek exemptive relief from the SEC to engage in co-investment transactions with our Manager and/or its affiliates. However, there can be no assurance that we will obtain such exemptive relief, if requested. Even if we receive exemptive relief, neither our Manager nor its affiliates are obligated to offer us the right to participate in any transactions originated by them. Prior to obtaining exemptive relief, we may co-invest alongside our Manager or its affiliates only in accordance with existing regulatory guidance and our allocation policy.
Compensation Arrangements
The compensation we pay to our Manager was not entered into on an arm’s-length basis with unaffiliated third parties. As a result, the form and amount of such compensation may be less favorable to us than they might have been had they been entered into through arm’s-length transactions with unaffiliated parties. See “Investment Advisory Agreement”.
Affiliated Dealer Manager
Prior to August 20, 2013, the dealer manager for our offering was KBR Capital Markets, LLC, which was an affiliate of us and our Manager. This relationship might have created conflicts in connection with KBR Capital Markets, LLC due diligence obligations under the federal securities laws. As of August 20, 2013, the agreement with KBR was terminated due to KBR’s decision to discontinue operations. Effective September 23, 2013 Axiom Capital Management, Inc. (the “Dealer Manager”) was selected as the new dealer manager for the funds. Axiom Capital Management, Inc. is not an affiliate of the Fund or Manager.
Regulation
We have elected to be regulatedThe election as a BDCbusiness development company under the 1940 Act. The 1940 Act contains prohibitions and restrictions relating to transactions between BDCsbusiness development companies and their affiliates (including any investment advisers or sub-advisers), principal underwriters and affiliates of those affiliates or underwriters and requires that a majority of the directors be persons other than “interested persons”, as that term is defined in the 1940 Act. In addition, the 1940 Act provides that we may not change the nature of our business so as to cease to be, or to withdraw our election as, a BDCbusiness development company unless approved by “a majority of our outstanding voting securities” as defined in the 1940 Act.
We may invest up to 100% of our assets in securities acquired directly from issuers in privately negotiated transactions. We do not intend to acquire securities issued by any investment company that exceed the limits imposed by the 1940 Act. Under these limits, except for registered money market funds, we generally cannot acquire more than 3% of the voting stock of any investment company, invest more than 5% of the value of our total assets in the securities of one investment company or invest more than 10% of the value of our total assets in the securities of more than one investment company. With regard to that portion of our portfolio invested in securities issued by investment companies, it should be noted that such investments might subject our stockholders to additional expenses. None of our investment policies are fundamental and any may be changed without stockholder approval.
As a BDC,business development company, we may be periodically examined by the SEC for compliance with the 1940 Act. Our Adviser is a registered investment adviser and is also subject to examination by the SEC.
We are required to provide and maintain a bond issued by a reputable fidelity insurance company to protect us against larceny and embezzlement. Furthermore, as a BDC,business development company, we are prohibited from protecting any director or officer against any liability to us or our stockholders arising from willful misconduct, bad faith, gross negligence or reckless disregard of the duties involved in the conduct of such person’s office.
Qualifying Assets
Under the 1940 Act, a BDCbusiness development company may not acquire any asset other than assets of the type listed in section 55(a) of the 1940 Act, which are referred to as qualifying assets, unless, at the time the acquisition is made, qualifying assets represent at least 70% of the company’s total assets. The principal categories of qualifying assets relevant to our business are the following:
Securities purchased in transactions not involving any public offering from the issuer of such securities, which issuer (subject to certain limited exceptions) is an eligible portfolio company, or from any person who is, or has been during the preceding 13 months, an affiliated person of an eligible portfolio company, or from any other person, subject to such rules as may be prescribed by the SEC. An eligible portfolio company is defined in the 1940 Act as any issuer which:
| 16 |
Managerial Assistance to Portfolio Companies
A BDCbusiness development company must have been organized and have its principal place of business in the United States and must be operated for the purpose of making investments in the types of securities described in “Regulation – Qualifying Assets” above. However, in order to count portfolio securities as qualifying assets for the purpose of the 70% test, the BDCbusiness development company must either control the issuer of the securities or must offer to make available to the issuer of the securities (other than small and solvent companies described above) significant managerial assistance. Where the BDCbusiness development company purchases such securities in conjunction with one or more other persons acting together, the BDCbusiness development company will satisfy this test if one of the other persons in the group makes available such managerial assistance. Making available managerial assistance means, among other things, any arrangement whereby the BDC,business development company, through its directors, officers or employees, offers to provide, and, if accepted, does so provide, significant guidance and counsel concerning the management, operations or business objectives and policies of a portfolio company.
Temporary Investments
Pending investment in other types of “qualifying assets,” as described above, our investments may consist of cash, cash equivalents, U.S. Government securities or high-quality debt securities maturing in one year or less from the time of investment, which we refer to, collectively, as temporary investments, so that 70% of our assets are qualifying assets. Typically, we invest in money market funds which invest in highly rated commercial paper, U.S. Government agency notes, U.S. Treasury bills or in repurchase agreements relating to such securities that are fully collateralized by cash or securities issued by the U.S. Government or its agencies. A repurchase agreement involves the purchase by an investor, such as us, of a specified security and the simultaneous agreement by the seller to repurchase it at an agreed-upon future date and at a price which is greater than the purchase price by an amount that reflects an agreed-upon interest rate. There is no percentage restriction on the proportion of our assets that may be invested in such repurchase agreements. However, certain diversification tests in order to qualify as a RIC for federal income tax purposes will typically require us to limit the amount we invest with any one counterparty. Our Manager will monitor the creditworthiness of the counterparties with which we enter into repurchase agreement transactions.
Senior Securities
We are permitted, under specified conditions, to issue multiple classes of indebtedness and one class of stock senior to our common stock if our asset coverage, as defined in the 1940 Act, is at least equal to 200% immediately after each such issuance. In addition, while any preferred stock or publicly traded debt securities are outstanding, we may be prohibited from making distributions to our stockholders or the repurchasing of such securities or shares unless we meet the applicable asset coverage ratios at the time of the distribution or repurchase. We may also borrow amounts up to 5% of the value of our total assets for temporary or emergency purposes without regard to asset coverage.
Code of Ethics
We and our Manager have each adopted a code of ethics pursuant to Rule 17j-1 under the 1940 Act that establishes procedures for personal investments and restricts certain personal securities transactions. Personnel subject to each code may invest in securities for their personal investment accounts, including securities that may be purchased or held by us, so long as such investments are made in accordance with the code’s requirements. You may read and copy the code of ethics at the SEC’s Public Reference Room in Washington, D.C. You may obtain information on the operation of the Public Reference Room by calling the SEC at (202) 551-8090. In addition, the code of ethics is attached as an exhibit to the registration statement of which the prospectus is a part, and is available on the EDGAR Database on the SEC’s Internet site athttp://www.sec.gov. You may also obtain copies of the code of ethics, after paying a duplicating fee, by electronic request at the following e-mail address:publicinfo@sec.gov, or by writing the SEC’s Public Reference Section, 100 F Street, N.E., Washington, D.C. 20549.
| 17 |
Compliance Policies and Procedures
We have adopted and implemented written policies and procedures reasonably designed to prevent violation of the federal securities laws. We are required to review these compliance policies and procedures annually for their adequacy and the effectiveness of their implementation. Our Chief Compliance Officer is responsible for administering these policies and procedures.
Proxy Voting Policies and Procedures
We have delegated our proxy voting responsibility to our Manager. The Proxy Voting Policies and Procedures of our Manager are set forth below. The guidelines are reviewed periodically by our Manager and our independent directors, and, accordingly, are subject to change.
Introduction
Our Manager is registered with the SEC as an investment adviser registered under the Advisers Act. As an investment advisor registered under the Advisers Act, our Manager has fiduciary duties to us. As part of this duty, our Manager recognizes that it must vote client securities in a timely manner free of conflicts of interest and in our best interests and the best interests of our stockholders. Our Manager’s Proxy Voting Policies and Procedures have been formulated to ensure decision-making consistent with these fiduciary duties.
These policies and procedures for voting proxies for our investment advisory clients are intended to comply with Section 206 of, and Rule 206(4)-6 under, the Advisers Act.
Proxy Policies
OurThe Fund primarily invests in debt securities, therefore on a rare occasion would the Manager vote a proxy. If a proxy is received, our Manager evaluates routine proxy matters, such as proxy proposals, amendments or resolutions on a case-by-case basis. Routine matters are typically proposed by management and our Manager will normally support such matters so long as they do not measurably change the structure, management control, or operation of the corporation and are consistent with industry standards as well as the corporate laws of the state of incorporation.
Our Manager also evaluates non-routine matters on a case-by-case basis. Non-routine proposals concerning social issues are typically proposed by stockholders who believe that the corporation’s internally adopted policies are ill-advised or misguided. If our Manager has determined that management is generally socially responsible, our Manager will generally vote against these types of non-routine proposals. Non-routine proposals concerning financial or corporate issues are usually offered by management and seek to change a corporation’s legal, business or financial structure. Our Manager will generally vote in favor of such proposals provided the position of current stockholders is preserved or enhanced. Non-routine proposals concerning stockholder rights are made regularly by both management and stockholders. They can be generalized as involving issues that transfer or realign board or stockholder voting power. Our Manager typically would oppose any proposal aimed solely at thwarting potential takeovers by requiring, for example, super-majority approval. At the same time, our Manager believes stability and continuity promote profitability. Our Manager’s guidelines in this area seek a middle road and individual proposals will be carefully assessed in the context of their particular circumstances. If a vote may involve a material conflict of interest, prior to approving such vote, our Manager must consult with its Chief Compliance Officer to determine whether the potential conflict is material and if so, the appropriate method to resolve such conflict. If the conflict is determined not to be material, our Manager’s employees shall vote the proxy in accordance with our Manager’s proxy voting policy.
Proxy Voting Records
You may obtain information about how we voted proxies by making a written request for proxy voting information to:
Chief Compliance Officer
VII Peaks Co-Optivist Income BDC II, Inc.
100 Pine Street,Grove Financial Center
4 Orinda Way, Bldg. A, Suite 500125A
San Francisco, California 94111Orinda, CA 94563
| 18 |
Available Information
We have filed a registration statement with the SEC on Form N-2, including amendments, relating to the shares we are offering. We have filed a prospectus with the SEC. The prospectus does not contain all of the information set forth in the registration statement, including any exhibits and schedules it may contain. For further information concerning us or the shares we are offering, please refer to the registration statement and prospectus. Statements contained in the prospectus and this 10-K/A10-K as to the contents of any contract or other document referred to are not necessarily complete and in each instance reference is made to the copy of any contract or other document filed as an exhibit to the registration statement or prospectus. Each statement is qualified in all respects by this reference. Any stockholder and its designated representative are permitted access to our records to which it is entitled under applicable law by all reasonable times, and may inspect and copy any of them for a reasonable charge. Please see our charter and bylaws for additional information regarding stockholders’ rights to access our records.
We are required to file with or submit to the SEC annual, quarterly and current periodic reports, proxy statements and other information meeting the informational requirements of the Securities Exchange Act of 1934. You may inspect and copy these reports, proxy statements and other information, as well as the registration statement and prospectus with all related exhibits and schedules at the Public Reference Room of the SEC at 100 F Street, N.E., Washington, D.C. 20549. You may obtain information on the operation of the Public Reference Room by calling the SEC at 1-800-SEC-0330. Copies of these reports, proxy and information statements and other information may be obtained, after paying a duplicating fee, by electronic request at the following e-mail address:publicinfo@sec.gov , or by writing the SEC’s Public Reference Section, Washington, D.C. 20549-0102. In addition, the SEC maintains an Internet website that contains reports, proxy and information statements and other information filed electronically by us with the SEC athttp://www.sec.gov.www.sec.gov.
Our Manager provides quarterly reports to shareholders within 60 days after the end of each quarter. Our manager shall also provide an annual report to shareholders within 120 days after the end of each fiscal year. These reports will also be available on the SEC’s website at www.sec.gov. These reports should not be considered a part of or as incorporated by reference in the prospectus or registration statement of which the prospectus is a part.
An investment in shares of our common stock involves a high degree of riskrisk. You should carefully read and may be considered speculative. Theconsider all of the risks set forthdescribed below, are nottogether with all of the only risks we face.other information contained or referred to in this prospectus, before making a decision to invest in our shares. If any of the following risksevents occur, our financial condition, business and financial condition couldresults of operation, may be materially adversely affected. In such case, the net asset value of our common stockthat event, you could decline, and you may lose all or part of your investment. This prospectus also contains forward-looking statements that involve risks and uncertainties. Our actual results could differ materially from those anticipated in the forward-looking statements as a result of specific factors, including but not limited to the risks described below.
Risks Related to Our Business and Structure
We are a recently formed entity withrelatively new company and have a limited operating history, and revenues,are subject to the business risks and you have a limited `basis on which to evaluate our ability touncertainties associated with any new business, including the risk that we will not achieve our business objectives.
We were formed on 2011, and commenced operations in July 2012 when we raised an aggregate of $1.0 million from investors unaffiliated with us or our Manager. Because we lack an extended operating history, there is a limited basis on which to evaluate our ability to achieve our business objectives. We are subject to all of the business risks and uncertainties associated with any new business, including the risk that we will not achieve our investment objectives and that the value of our common shares could decline substantially.
We face competition for investment opportunities.
We facecompete for investments with other business development companies and investment funds (including private equity funds and mezzanine funds), as well as traditional financial services companies such as commercial banks and other sources of funding. Moreover, alternative investment vehicles, such as hedge funds, also make investments in middle market private U.S. companies. As a result, competition for investment opportunities from a range of competitors, including mutual funds,in private equity, hedge funds, and leveraged buyout funds.U.S. companies may intensify. Many of these entitiesour competitors are substantially larger and have considerably greater financial, technical and marketing resources than we do. For example, some competitors may have a lower cost of capital and access to funding sources that are not available to us. In addition, some of our competitors may have higher risk tolerances or different risk assessments than we have. These characteristics could allow our competitors to consider a wider variety of investments, establish more relationships and offer better pricing and more flexible structuring than we are able to do. We may lose investment opportunities if we do not match our competitors’ pricing, terms and structure. If we are forced to match our competitors’ pricing, terms and structure, we may not be able to achieve acceptable returns on our investments or may bear substantial risk of capital loss. A significant part of our competitive advantage stems from the fact that the market for investments in private U.S. companies is under served by traditional commercial banks and other financial sources. A significant increase in the number and/or the size of our competitors in this target market could force us to accept less attractive investment terms. Furthermore, many of our competitors may have greater financial resources than we doexperience operating under, or accessare not subject to, financingthe regulatory restrictions under the 1940 Act that are imposed on more favorable terms than we will. These entities could make it more difficult or expensive to make investments in the debt securities of our target company at appropriate price levels.us as a business development company.
We face competition for assets to manage.
We face competition from a range of competitors, including mutual funds, private equity, hedge funds, and leveraged buyout funds, for assets to manage. Many of these entities may have greater financial resources than we do or access to financing on more favorable terms than we will. Our operating expenses are relatively fixed, and therefore we will have a higher expense ratio, which will decrease returns to shareholders, to extent we are unable to increase the amount of assets that we manage.
| 19 |
Price declines in the medium- and large-sized corporate leveraged loan market may adversely affect the fair value of our portfolio, reducing our net asset value through increased net unrealized depreciation.
Prior to the onset of the financial crisis that began in 2007, securitized investment vehicles, hedge funds and other highly leveraged non-bank financial institutions comprised the majority of the market for purchasing and holding senior and subordinated debt. As the trading price of the loans underlying these portfolios began to deteriorate beginning in the first quarter of 2007, we believe that many institutions were forced to raise cash by selling their interests in performing assets in order to satisfy margin requirements or the equivalent of margin requirements imposed by their lenders and/or, in the case of hedge funds and other investment vehicles, to satisfy widespread redemption requests. This resulted in a forced deleveraging cycle of price declines, compulsory sales, and further price declines, with falling underlying credit values, and other constraints resulting from the credit crisis generating further selling pressure.
Conditions in the medium and large-sized U.S. corporate debt market may experience similar disruption or deterioration in the future, which may cause pricing levels to similarly decline or be volatile. As a result, our net asset value could decline through an increase in unrealized depreciation and incurrence of realized losses in connection with the sale of our investments, which could have a material adverse impact on our business, financial condition and results of operations.
Our boardBoard of directorsDirectors has full authority and discretion over the timing and amount of distributions we make, and it may decide to reduce or eliminate distributions at any time, which may have an adverse affecteffect on your investment.
To the extent that we have income available, we willWe expect to continue to authorize and declare distributions with record and payment dates distributions on a semi-monthlymonthly basis to our shareholders. Our distributions, if any, will be determined by our boardBoard of directors.Directors. There can be no assurances that we will be able to make distributions or, to the extent we make distributions, the level of distributions declared and paid to our shareholders or our ability to pay distributions. The target companies in which we invest will generally have near-term liquidity issues that make investments in them highly speculative. If one or more of our investments in our target companies is not successful, it may adversely impact our ability to make distributions to shareholders.
Our distributions may exceed our earnings. Therefore, portions of the distributions that we make may represent a return of capital to you for tax purposes that will lower your tax basis in your common stock and reduce the amount of funds we have for investment in targeted assets.
If
Since the Fall of 2013, our cash distributions to shareholders have been funded partly from capital contributed by shareholders. Prior to the Fall of 2013, a substantial portion of our distributions were funded by expense reimbursements from our then manager, which are subject to recoupment. In August 2013, we replaced our then manager with our current Manager, and our current Manager has not entered into an expense support agreement with us. As a consequence, we do not expect to generate net investment income sufficient to support our projected dividends unless our current Manager enters into an expense support agreement with us, our mix of interest and dividend paying assets increase, or until our expense ratio decreases, which we do not expect will happen until we have significantly more assets than we do at present.
Our ability to pay distributions might be adversely affected by, among other things, the impact of one or more of the risk factors described in this prospectus. All distributions are unsuccessful in raising significant proceeds inand will be paid at the discretion of our ongoing, continuous “best efforts” public offering,Board of Directors and will depend on our earnings, our financial condition, maintenance of our RIC status, compliance with applicable business development company regulations and such other factors as our Board of Directors may deem relevant from time to time. We cannot assure you that we will be limitedcontinue to pay distributions to our shareholders in the number and typefuture. A return of investments we may make, and the valuecapital is a return of your investment, rather than a return of earnings or gains derived from our investment activities. A shareholder will not be subject to immediate taxation on the amount of any distribution treated as a return of capital to the extent of the shareholder’s basis in us mayits shares; however, the shareholder’s basis in its shares will be reduced (but not below zero) by the amount of the return of capital, which will result in the event our assets under-perform.
Our continuous offering is being made onshareholder recognizing additional gain (or a best efforts basis, wherebylower loss) when the dealer manager and broker-dealers participating in the offeringshares are only required to use their best efforts to sell our shares and have no firm commitment or obligation to purchase any of the shares.sold. To the extent that less than the maximum numberamount of the return of capital exceeds the shareholder’s basis in its shares, is subscribed for,such excess amount will be treated as gain from the opportunity forsale of the allocationshareholder’s shares. Distributions from the proceeds of our investments among various issuers and industries may be decreased, andpublic offering or from borrowings also could reduce the returns achieved on those investments may be reduced as a resultamount of allocating all ofcapital we ultimately invest in our expenses over a smaller capital base. portfolio companies.
Purchases of debt securities of financially stressed companies create an enhanced risk of substantial loss or loss of entire investment.
We may purchase debt securities of companies that are experiencing significant financial or business stress, including companies involved in bankruptcy or other reorganization and liquidation proceedings. Such purchases involve a substantial degree of risk and may not show any return for a considerable period of time. In fact, many of these instruments ordinarily remain unpaid unless and until the company reorganizes and/or emerges from bankruptcy proceedings, and as a result may have to be held for an extended period of time. The level of analytical sophistication, both financial and legal, necessary for successful investment in companies experiencing significant business and financial stress is unusually high. There is no assurance that we will correctly evaluate the nature and magnitude of the various factors that could affect the prospects for a successful reorganization or similar action. In any reorganization or liquidation proceeding relating to a company in which we invest, we may lose our entire investment or may be required to accept cash or securities with a value less than our original investment. Under such circumstances, the returns generated from our investments may not compensate shareholders adequately for the risks assumed.
| 20 |
Resources could be expendedEconomic activity in researching investment opportunities that are not consummated, which could materially adversely affect subsequent attempts to locate and invest in other businesses.
It is anticipated that the investigationUnited States was impacted by the global financial crisis of each specific target company and the negotiation, drafting, and execution of relevant agreements, disclosure documents, and other instruments necessary to restructure and de-lever their balance sheets will require substantial management time and attention and substantial costs for accountants, attorneys, and others. If a decision is made not to complete a specific investment, the costs incurred up to that point for the proposed transaction may not be recoverable. Furthermore, even if an agreement is reached relating to a specific target company, we may fail to consummate the transaction for any number of reasons including those beyond our control. Any such event will result in a loss to us of the related costs incurred which could materially adversely affect subsequent attempts to locate additional investment opportunities.
The recovery from the 2008 and 2009 recession remains challenging.has yet to fully recover.
Beginning in the third quarter of 2007, global credit and other financial markets suffered substantial stress, volatility, illiquidity and disruption. These forces reached extraordinary levels in late 2008, resulting in the bankruptcy of, the acquisition of, or government intervention in the affairs of several major domestic and international financial institutions. In particular, the financial services sector was negatively impacted by significant write-offs as the value of the assets held by financial firms declined, impairing their capital positions and abilities to lend and invest. We believe that such value declines were exacerbated by widespread forced liquidations as leveraged holders of financial assets, faced with declining prices, were compelled to sell to meet margin requirements and maintain compliance with applicable capital standards. Such forced liquidations also impaired or eliminated many investors and investment vehicles, leading to a decline in the supply of capital for investment and depressed pricing levels for many assets. These events significantly diminished overall confidence in the debt and equity markets, engendered unprecedented declines in the values of certain assets, and caused extreme economic uncertainty. These conditions may reoccur for a prolonged period of time again or materially worsen in the future, including as a result of the U.S. government spending cuts that took effect March 1, 2013, the government shutdown in October 2013, or any further spending cuts or shutdowns.
AccordingEconomic activity continues to be somewhat subdued as unemployment rates remain high. As a D&B Global Economic Outlook,result, corporate interest rate risk premiums, otherwise known as credit spreads, declined significantly throughout most of 2009 and 2010. However, credit spreads remain slightly above historical averages, particularly in the loan market. The improving economic activity followingand market conditions that have driven these declines in credit spreads may reverse themselves if uncertainty returns to the 2008 – 2009 recession will continuemarkets. Such a reversal could negatively impact credit spreads as well as our ability to make slow progress overobtain financing, particularly from the next five years. debt markets.
The significant restructuringtightening of the US private sector ismonetary policy through the increase in Fed interest rate, which has been anticipated for several months, finally began in December 2015. The increase in the Fed rate can have a chief driver, resultingnegative effect on our investments by making it harder and more expensive to refinance capital structures or even obtain financing.
The tightening of US monetary policy through increases in slowing bankruptcies across most sectorsthe Fed interest rate happened for the first time in nine years in December of 2015. The Fed made projections to raise the rate four times in 2016 but only increased the rate once in December 2016. Per the Fed’s statement, interest rates will rise at a slow (.25%) but steady pace and improved payment performance. Furthermore,are expected to raise three or four times in 2017. Fed officials suggest that policy makers may raise rates so long as gauges of U.S. inflation and economic growth improve. However, due to the boomstrengthening dollar at the beginning of 2017, the Fed has indicated that it may potentially hold off raising rates due to geopolitical and economic risks of too strong of a dollar. There can be no guarantee the Fed will raise rates at the pace they proposed nor can there be any assurance that the Fed will make sound decisions as to when to raise rates. The increase in unconventional gasthe Fed rate can have a negative effect on our investments by making it harder and oilmore expensive to refinance capital structures or even obtain financing. Default rates in the US high yield market currently stand around 4.2% at the end of February according to Fitch Ratings. The ratings company forecasts that by mid-year 2017 the measure will drop below 3% and hit a low of 2% during the summer months before rebounding to settle at 3% to end the year. The average yield on a U.S. junk bond is driving down energy prices, boosting business confidence and supporting growth in key sectors. Despite this cautious optimism, a numbernow around 6.1%, according to Bank of risks remain including high levelsAmerica Merrill Lynch indexes, below the mean of debt, particularly in the public sector. The increase in public sector debt since 2008 is concerning, as governments ramped up spending to boost the economic growth. As a result, government spending in many countries will remain constrained and tax levels high over the next few years a governments attempt to balance their books. This will, in turn, constrain growth in economies such as the US, where private sector restructuring has begun. There also may be some longer-term unintended consequences of quantitative easing policies, including excessive risk-taking. Already, yields between high-risk bonds and US treasuries are narrowing, stock markets have boomed in many countries, speculative activity in commodity markets are keeping prices higher than fundamentals would dictate.last 10 years.
A potential downgradeHigh volatility in both bond and equity markets as well as slowing global growth could have a material effect on the U.S.’s credit rating by a second rating agency and very slow growth with continued high unemployment in Europe could materially adversely affect our business, financial condition and results of operations.companies we invest in.
On August 5, 2011, Standard & Poor’s downgraded the U.S.’s credit rating to AA+ fromGlobal equity and debt markets continued its top rank of AAA, resulting in an immediate droperratic behavior with extreme volatility in the Dowfinal quarter of 2,000the 2016 and gold soaringstart of 2017. In December of 2015, the Fed raised the central bank interest rate for the first time in nine years, and again in December of 2016. For the second time in three months, on March 15th, the Federal Reserve increased its benchmark interest rate a quarter point amid rising confidence that the economy is poised for more robust growth. In terms of global debt, some estimates calculate there is over $9 trillion in negative-yielding debt as of December 29, 2016. The Bank of Japan kept its rates in negative territory but raised its economic growth forecast to $1,895 an ounce. Standard & Poor’s downgrading was largely1.5% from 1.3% in January 2017. The current US high yield default rate stands around 4.2% at the end of February and is expected to fall below 3% by May 2017 according to Fitch ratings. This is fueled by the fact that many large defaults will be over a year old as well as a decrease in overall defaults since January 2017. The S&P 500 Index rally is due in part to lackthe high correlation to the election of political backboneTrump, the promise of U.S. jobs to come, together to reduce spending and debtthe recent rally of bank stocks. However, the rising rate credit environment and balance the budget, while keeping the economy growing. The current U.S. debt ceiling and budget deficit concerns have increased the possibility of further credit-rating agency downgrades, such as from Fitch Ratings, warning that the repeated casting of uncertainty over the full faith and credit of the U.S. risks undermines confidence in the U.S. Dollar. On the plus side, Fitch Ratingweak global economic growth, is considering the U.S economy has experiencedcreating a 1.9% GDP growth in 2013, according the Bureau of Economic Analysis advance estimates, with projections for a 3% GDP growth in 2014, according to the Congressional Budget Office. Further, the U.S. dollar is still the most liquid in the world. On the minus side for a potential Fitch Rating downgrade, Fitch has indicated that the continued political environment is not a characteristic of an AAA sovereign. Additionally, Fitch Ratings noted that the U.S. is the most heavily indebted AAA rated sovereign, with a gross debt ratio equivalent to double that of the AAA median. The potential downgrade from Fitch Ratings with the current S&P rating of the U.S.’s credit, together with signs of deteriorating sovereign debt and conditions in Europe,highly volatile global economic landscape. This could have a material adverse effect on the financial markets and economic conditions in the U.S.United States and throughoutthe rest of the world. Additionally, austerity measures necessaryIt could also limit our ability and the ability of our portfolio companies to reduceobtain financing; it can also have an adverse material effect on the U.S.’s deficit could accelerate an already slowing U.S. economyvaluation of our portfolio companies. Consequently, the continued uncertainty in the near term.
The U.S.’s S&P credit rating downgrade and potential same from Fitch Ratings could negatively impact the trading market for U.S. government securities and would likely impact the credit risk associated with our investmentsgeneral economic environment, as well in U.S. Treasury securities. This could reduce the valuespecific economies of the U.S. Treasury securities that we may holdseveral individual geographic markets in our portfolio. In addition, adverse market and economic conditions that could occur due to a downgrade of the U.S.’s credit rating on the U.S.’s debt could result in rapidly rising interest rates, a falling dollar, shakier financial markets and slowing or negative economic growth in the near term. These events could adversely affect our business in many ways, including, but not limited to, adversely impactingwhich our portfolio companies’ ability to obtain financing, or obtaining financing but at significantly lower valuations than the preceding financing rounds. If any of these events were to occur, itcompanies operate, could materially adversely affect our business, financial condition and results of operations.
| 21 |
A substantial portion of our investment portfolio may be recorded at fair value as determined in good faith by our boardBoard of directorsDirectors, or a committee thereof, and, as a result, there will be uncertainty as to the value of our portfolio investments.
Under the 1940 Act, we are required to carry our portfolio investments at market value or, if there is no readily available market value, at fair value as determined by our boardBoard of directors.Directors, and a committee thereof. We expect that a substantial portion of our investments will not trade on a national securities exchange or actively trade on a secondary market, but instead will trade on a privately negotiated over-the-counter secondary market for institutional investors. As a result, we will value these securities quarterly at fair value as determined in good faith by our boardBoard of directors.Directors, and a committee thereof.
Certain factorsTo the extent that may be considered in determiningan investment is not traded, we determine the fair value of our investments includethe investment by analyzing various fundamental factors, including the nature and realizable value of any collateral, the portfolio company’s earnings and its ability to make payments on its indebtedness, the markets in which the portfolio company does business, comparison to comparable publicly-traded companies, discounted cash flow and other relevant factors. Because such valuations, and particularly valuations of private securities and private companies, are inherently uncertain, may fluctuate over short periods of time and may be based on estimates, our determinations of fair value may differ materially from the values that would have been used if a ready market for these non-tradedinfrequently traded securities existed.
Where a security is traded on a market, including the over-the-counter secondary market for institutional investors described above, we normally value the security using only market data, even if the market data consists solely of bid and ask quotes rather than actual trades, and we disregard fundamental factors that may suggest a different value. The over the counter market for high yield securities has recently suffered distress due to investor redemptions from high yield debt funds as well as the forced liquidation of a major high yield debt fund, which has caused the fair value of many of our investments to deviate materially from the values that we estimate internally based on fundamental factors. Due to this uncertainty,these uncertainties, our fair value determinations may cause our net asset value on a given date to materially understate or overstate the value that we may ultimately realize upon the sale of one or more of our investments.
Any unrealized losses we experience on our portfolio may be an indication of future realized losses, which could reduce our income available for distribution.
As a business development company, we are required to carry our investments at market value or, if no market value is ascertainable, at the fair value as determined in good faith by our Board of Directors. Decreases in the market values or fair values of our investments are recorded as unrealized depreciation. Any unrealized losses in our portfolio could be an indication of a portfolio company’s inability to meet its repayment obligations to us with respect to the affected investments. This could result in realized losses in the future and ultimately in reductions of our income available for distribution in future periods. In addition, decreases in the market value or fair value of our investments will reduce our net asset value.
Our ability to achieve our investment objective depends on our Manager’s ability to manage and support our investment process. If our Manager were to lose any members of its senior management team, our ability to achieve our investment objective could be significantly harmed.
We are externally managed and depend upon the investment expertise, diligence, skill and network of business contacts of our Manager. We also depend, to a significant extent, on our Manager’s access to the investment professionals and the information and deal flow generated by these investment professionals in the course of their investment and portfolio management activities. Our Manager will evaluate, negotiate, structure, close, monitor and service our investments. Our success depends to a significant extent on the continued service and coordination of our Manager, including its key professionals. The departure of a significant number of our Manager’s key professionals could have a materially adverse effect on our ability to achieve our investment objective. In addition, we can offer no assurance that our Manager will remain our investment adviser and sub-adviser or that we will continue to have access to their investment professionals or their information and deal flow.
Changes in laws or regulations governing our operations may adversely affect our business or cause us to alter our business strategy.
We and our portfolio companies are subject to regulation at the local, state and federal level. New legislation may be enacted or new interpretations, rulings or regulations could be adopted, including those governing the types of investments we are permitted to make, any of which could harm us and our shareholders, potentially with retroactive effect.
Additionally, any changes to the laws and regulations governing our operations relating to permitted investments may cause us to alter our investment strategy to avail ourselves of new or different opportunities. Such changes could result in material differences to our strategies and plans as set forth in our prospectus and may result in our investment focus shifting from the areas of expertise of our Manager to other types of investments in which our Manager may have less expertise or little or no experience. Thus, any such changes, if they occur, could have a material adverse effect on our results of operations and the value of your investment.
| 22 |
As a public company, we are subject to regulations not applicable to private companies, such as provisions of the Sarbanes-Oxley Act. Efforts to comply with such regulations will involve significant expenditures, and non-compliance with such regulations may adversely affect us.
We are subject to regulations not applicable to private companies, including provisions of the Sarbanes-Oxley Act and the related rules and regulations promulgated by the SEC. Beginning with our fiscal year ending December 31, 2013, ourOur management will beis required to report on our internal control over financial reporting pursuant to Section 404 of the Sarbanes-Oxley Act and rules and regulations of the SEC thereunder. We will beare required to review on an annual basis our internal control over financial reporting, and on a quarterly and annual basis, to evaluate and disclose changes in our internal control over financial reporting. As
Subsequent to December 31, 2016, our Board of Directors elected to restate our financial statements for the three and six months ended June 30, 2016, and for the three and nine months ended September 30, 2016, in order to correct an error in the accounting for certain warrants received in connection with direct loans that we made. Specifically, we did not assign a newly-formed company, developingcost to the warrants based upon their fair value on the date of receipt relative to the total fair value of the debt and warrants received. The difference between the face amount of the debt and its recorded cost resulting from the assignment of value to the warrants is to be treated as original issue discount, and accreted into interest income over the life of the loan. The change will result in an increase in net investment income, and a decrease in unrealized appreciation in the same amount, in each period, and will have no impact on our net asset value per share, as previously reported. Management previously concluded that its disclosure controls were effective systemfor those periods. In response, in 2017 we implemented additional controls whereby officers will seek outside guidance in regard to accounting for transactions that we have not historically engaged in and which present novel issues. We believe the material deficiency has been remediated by the additional controls and procedures that have been implemented.
We may in the future identify internal control deficiencies that could rise to the level of internal controls may require significant expenditures,a material weakness or uncover errors in our financial reporting, and such material weaknesses could have a material adverse effect on the accuracy, timeliness and reliability of our financial reporting, which may negatively impacthave an adverse effect on our financial performancecondition and our ability to make distributions. This process will also result in a diversionresults of management’s time and attention. We cannot be certainoperation as towell as the timing of the completionprice of our evaluation, testing and remediation actions or the impact of the same on our operations and we may not be able to ensure that the process is effective or that our internal control over financial reporting is or will be effective in a timely manner. In the event that we are unable to develop or maintain an effective system of internal controls and maintain or achieve compliance with the Sarbanes-Oxley Act and related rules, we may be adversely affected.common stock.
The impact of recent financial reform legislation on us is uncertain.
In light of current conditions in the U.S. and global financial markets and the U.S. and global economy, legislators, the presidential administration and regulators have increased their focus on the regulation of the financial services industry. The recently enacted Dodd-Frank Wall Street Reform and Consumer Protection Act, or the Dodd-Frank Act, institutes a wide range of reforms that will have an impact on all financial institutions. Many of the requirements called for in the Dodd-Frank Act will be implemented over time, most of which will be subject to implementing regulations over the course of several years. Given the uncertainty associated with the manner in which the provisions of the Dodd-Frank Act will be implemented by the various regulatory agencies and through regulations, the full impact such requirements will have on our business, results of operations or financial condition is unclear. The changes resulting from the Dodd-Frank Act may require us to invest significant management attention and resources to evaluate and make necessary changes in order to comply with new statutory and regulatory requirements. Failure to comply with any such laws, regulations or principles, or changes thereto, may negatively impact our business, results of operations and financial condition. While we cannot predict what effect any changes in the laws or regulations or their interpretations would have on us as a result of the Dodd-Frank Act, these changes could be materially adverse to us and our shareholders.
We may experience fluctuations in our quarterly results.
We could experience fluctuations in our quarterly operating results due to a number of factors, including our ability or inability to make investments in companies that meet our investment criteria, the interest rate payable on the debt securities we acquire, the level of our expenses, variations in and the timing of the recognition of realized and unrealized gains or losses, the degree to which we encounter competition in our markets and general economic conditions. As a result of these factors, results for any previous period should not be relied upon as being indicative of performance in future periods.
Your interest in us will be diluted if we issue additional shares, which could reduce the overall value of an investment in us.
Potential investors will not have preemptive rights to any shares we issue in the future. Our certificate of incorporation authorizes us to issue 200,000,000 shares of common stock. Pursuant to our certificate of incorporation, a majority of our entire board of directors may amend our certificate of incorporation to increase the number of authorized shares without shareholder approval. To the extent we issue additional equity interests after an investor purchases shares of our common stock, an investor’s percentage ownership interest in us will be diluted. In addition, depending upon the terms and pricing of any additional offerings and the value of our investments, an investor may also experience dilution in the book value and fair value of his/her shares.
We may acquire various structured financial instruments for purposes of “hedging” or reducing our risks, which may be costly and ineffective and could reduce our cash available for distribution to our stockholders.
We may seek to hedge against interest rate and currency exchange rate fluctuations and credit risk by using structured financial instruments such as futures, options, swaps and forward contracts, subject to the requirements of the 1940 Act. Use of structured financial instruments for hedging purposes may present significant risks, including the risk of loss of the amounts invested. Defaults by the other party to a hedging transaction can result in losses in the hedging transaction. Hedging activities also involve the risk of an imperfect correlation between the hedging instrument and the asset being hedged, which could result in losses both on the hedging transaction and on the instrument being hedged. Use of hedging activities may not prevent significant losses and could increase our losses. Further, hedging transactions may reduce cash available to pay distributions to our stockholders.
If we internalize our management functions, your interest in us could be diluted, and we could incur other significant costs associated with being self-managed.
Our boardBoard of directorsDirectors may decide in the future to internalize our management functions. If we do so, we may elect to negotiate to acquire our Manager’s assets and personnel. At this time, we cannot anticipate the form or amount of consideration or other terms relating to any such acquisition. Such consideration could take many forms, including cash payments, promissory notes and shares of our common stock. The payment of such consideration could result in dilution of your interests as a stockholder and could reduce the earnings per share attributable to your investment.
In addition, while we would no longer bear the costs of the various fees and expenses we expect to pay to our Manager under the investment advisory agreement, we would incur the compensation and benefits costs of our officers and other employees and consultants that are being paid by our Manager or its affiliates. In addition, we may issue equity awards to officers, employees and consultants. These awards would decrease net income and may further dilute your investment. We cannot reasonably estimate the amount of fees we would save or the costs we would incur if we became self-managed. If the expenses we assume as a result of an internalization are higher than the expenses we avoid paying to our Manager, our earnings per share would be lower as a result of the internalization than it otherwise would have been, potentially decreasing the amount of funds available to distribute to our stockholders and the value of our shares. As we are currently organized, we do not have any employees. If we elect to internalize our operations, we would employ personnel and would be subject to potential liabilities commonly faced by employers, such as workers disability and compensation claims and other employee-related liabilities and grievances.
| 23 |
If we internalize our management functions, we could have difficulty integrating these functions as a standalone entity. Currently, individuals employed by our Manager and its affiliates perform asset management and general and administrative functions, including accounting and financial reporting, for multiple entities. These personnel have a great deal of know-how and experience. We may fail to properly identify the appropriate mix of personnel and capital needs to operate as a stand-alone entity. An inability to manage an internalization transaction effectively could thus result in our incurring excess costs and/or suffering deficiencies in our disclosure controls and procedures or our internal control over financial reporting. Such deficiencies could cause us to incur additional costs, and our management’s attention could be diverted from effectively managing our investments.
In recent years, management internalization transactions have been the subject of shareholder litigation. Shareholder litigation can be costly and time-consuming, and there can be no assurance that any litigation expenses we might incur if we were to internalize our management functions would not be significant or that the outcome of litigation would be favorable to us. Any amounts we are required to expend defending any such litigation will reduce our net investment income.
Security breaches and other disruptions could compromise our and our Manager’s information and expose us and our Manager to liability, which would cause our business and reputation to suffer.
In the ordinary course of our business, we and our Manager store sensitive data, including our proprietary business information and that of our portfolio companies, and personally identifiable information of our directors, officers and other employees, in our and our Manager’s data centers and networks. The secure processing, maintenance and transmission of this information is important to our and our Manager’s operations and business strategy. Despite our security measures, our and our Manager’s information technology and infrastructure may be vulnerable to attacks by hackers or breached due to employee error, malfeasance or other disruptions. Any such breach could compromise our and our Manager’s networks and the information stored there could be accessed, publicly disclosed, lost or stolen. Any such access, disclosure or other loss of information could result in legal claims or proceedings, liability under laws that protect the privacy of personal information, and regulatory penalties, disrupt our operations, and damage our and our Manager’s reputations, and cause a loss of confidence in us and our Manager’s products and services, which could adversely affect our business.
Risks Related to our Manager
Our Manager has limited prior experience managing a BDCBusiness Development Company or a RIC.
Our Manager iswas formed in 2009, has only managed a new entitybusiness development company since 2012, and has limited prior experience managing a BDCbusiness development company or a RIC. Similarly, members of our Manager’s management team, including our Chief Executive Officer and our Chief Financial Officer, have no prior experience managing a BDCbusiness development company or RIC. Therefore, our Manager and its management team may not be able to successfully operate our business or achieve our investment objectives. As a result, an investment in our shares may entail more risk than the shares of a comparable company with a substantial operating history.
The 1940 Act and the Code impose numerous constraints on the operations of BDCsbusiness development companies and RICs that do not apply to the other types of investment vehicles. For example, under the 1940 Act, BDCsbusiness development companies are required to invest at least 70% of their total assets primarily in securities of qualifying U.S. private or thinly traded companies. Moreover, qualification for RIC tax treatment under subchapter M of the Code requires satisfaction of source-of-income, diversification and other requirements. The failure to comply with these provisions in a timely manner could prevent us from qualifying as a BDCbusiness development company or a RIC or could force us to pay unexpected taxes and penalties, which could be material. Our Manager has no experience managing a BDCbusiness development company or RIC. Its lack of experience in managing a portfolio of assets under such constraints may hinder its ability to take advantage of attractive investment opportunities and, as a result, achieve our investment objectives.
Members of our Manager’s management team may engage in other activities that compete with us.
The officers of our Manager anticipate devoting a significant portion of their time to the affairs of our Manager and performing services for other entities. As a result, there may be conflicts between us on the one hand, and our Manager, including members of its management team on the other, regarding the allocation of resources to the management of our day-to-day activities.
Further, theour Manager’s officers of VII Peaks are involved in other ventures, some of which may compete with us for investment opportunities and may be incentivized to offer investment opportunities to such other ventures rather than to us which would make it more difficult to achieve our investment objectives.
In addition, the officers of Axiom may also be involved in other ventures, some of which may compete with us for investment opportunities.
Our Manager will receive compensation regardless of profitability.
Our Manager is entitled to receive certain fees and other compensation, payments and reimbursements regardless of us being profitable. For example, we will pay our Manager an annualized management fee calculated as follows and payable monthly in arrears:
The management fee will be calculated based on the net asset value of our assets under management as of the last business day of each month and paid monthly in arrears.
We may be obligated to pay our Manager incentive compensation even if we incur a net loss due to a decline in the value of our portfolio.
Our investment advisory agreement entitles our Manager to receive an incentive fee based on our net investment income regardless of any capital losses. In such case, we may be required to pay our Manager an incentive fee for a fiscal quarter even if there is a decline in the value of our portfolio or if we incur a net loss for that quarter.
Any incentive fee payable by us that relates to our net investment income may be computed and paid on income that may include interest that has been accrued, but not yet received. If a portfolio company defaults onreceived, including original issue discount, which may arise if we receive warrants in connection with the origination of a loan that is structuredor possibly in other circumstances, or contractual payment-in-kind, or (“PIK”), interest, which represents contractual interest added to providethe loan balance and due at the end of the loan term. To the extent we do not distribute accrued PIK interest, it is possible that accruedthe deferral of PIK interest previously included inhas the calculationsimultaneous effects of increasing the assets under management and increasing the base management fee at a compounding rate, while generating investment income and increasing the incentive fee will become uncollectible. Our Manager isat a compounding rate. In addition, the deferral of PIK interest would also increase the loan-to-value ratio at a compounding rate if the issuer’s assets do not obligated to reimburse us for any part of the incentive fee it received that was basedincrease in value, and investments with a deferred interest feature, such as PIK interest, may represent a higher credit risk than loans on accrued income that we never received as a result of a subsequent default. Such circumstances would result in us paying an incentive fee on income we never receive captured in one reporting period, with the related reduction in the incentive feewhich interest must be paid in the subsequent period.full in cash on a regular basis.
| 24 |
For federal income tax purposes, we are required to recognize taxable income in some circumstances in which we do not receive a corresponding payment in cash (such as deferred interest that is accrued as original issue discount)discount or PIK interest) and to make distributions with respect to such income to maintain our status as a RIC. Under such circumstances, we may have difficulty meeting the annual distribution requirement necessary to obtain and maintain RIC tax treatment under the Code. This difficulty in making the required distribution may be amplified to the extent that we are required to pay an incentive fee with respect to such accrued income. As a result, we may have to sell some of our investments at times and/or at prices we would not consider advantageous, raise additional debt or equity capital, or forgo new investment opportunities for this purpose. If we are not able to obtain cash from other sources, we may fail to qualify for RIC tax treatment and thus become subject to corporate-level income tax.
Our incentive fee may induce our Manager to make speculative investmentinvestments.s.
The incentive fee payable by us to our Manager may create an incentive for it to make investments on our behalf that are risky or more speculative than would be the case in the absence of such compensation arrangement. The way in which the incentive fee payable to our Manager is determined may encourage it to use leverage to increase the return on our investments.
Shares of our common stock may be purchased by the Manager or its affiliates.
Our Manager and its affiliates may purchase shares of our common stock for any reason deemed appropriate; provided, however, that the Manager and its affiliates will not purchase or hold more than 5% of our outstanding shares of common stock. The Manager and its affiliates will not acquire any shares of our common stock with the intention to resell or re-distribute such shares. The purchase of shares by the Manager or its affiliates could create certain risks, including, but not limited to, the following:
Our Manager relies on key personnel, the loss of any of whom could impair its ability to successfully manage us.
Our future success depends, to a significant extent, on the continued services of the employees of our Manager or its affiliates. The loss of services of one or more members of our Manager’s management team, including members of our investment committee, could adversely affect our financial condition, business and results of operations.
The compensation we pay to our Manager was determined without independent assessment on our behalf, and these terms may be less advantageous to us than if they had been the subject of arm’s-length negotiations.
The compensation we pay to our Manager was not entered into on an arm’s-length basis with an unaffiliated third party. As a result, the form and amount of such compensation may be less favorable to us than they might have been had they been entered into through arm’s-length transactions with an unaffiliated third party. However, we believe that the terms of the base management fee that we pay our Manager is generally more favorable to us than what most or all other externally-managed BDC’sbusiness development company’s pay their manager, and the terms of the incentive fee on income and capital gains are roughly the same as what other externally-managed BDC’sbusiness development company’s pay their manager.
OurSecurity breaches and other disruptions could compromise our and our Manager’s influence on conductinginformation and expose us and our operations, including onManager to liability, which would cause our conducting of transactions, gives it the abilitybusiness and reputation to increase its fees, which may reduce the amount of cash flow available for distribution to our shareholders.suffer.
Our Manager is paid a management fee calculated as a percentageIn the ordinary course of our net assetsbusiness, we and our Manager store sensitive data, including our proprietary business information and that of our portfolio companies, and personally identifiable information of our directors, officers and other employees, in our and our Manager’s data centers and networks. The secure processing, maintenance and transmission of this information is unrelatedimportant to net incomeour and our Manager’s operations and business strategy. Despite our security measures, our and our Manager’s information technology and infrastructure may be vulnerable to attacks by hackers or anybreached due to employee error, malfeasance or other performance basedisruptions. Any such breach could compromise our and our Manager’s networks and the information stored there could be accessed, publicly disclosed, lost or measure. Our Manager may advise us to consummate transactionsstolen. Any such access, disclosure or conductother loss of information could result in legal claims or proceedings, liability under laws that protect the privacy of personal information, and regulatory penalties, disrupt our operations, in a manner that, inand damage our and our Manager’s reasonable discretion, arereputations, and cause a loss of confidence in the best interests ofus and our shareholders. These transactions, however, may increase the amount of fees paid toManager’s products and services, which could adversely affect our Manager. Our Manager’s ability to influence the management fee paid to it by us could reduce the amount of cash flow available for distribution to our shareholders.business.
| 25 |
Risks Related to Business Development Companies
The requirement that we invest a sufficient portion of our assets in qualifying assets could preclude us from investing in accordance with our current business strategy; conversely, the failure to invest a sufficient portion of our assets in qualifying assets could result in our failure to maintain our status as a BDC.business development company.
As a BDC,business development company, we may not acquire any assets other than “qualifying assets” unless, at the time of and after giving effect to such acquisition, at least 70% of our total assets are qualifying assets. Therefore, we may be precluded from investing in what we believe are attractive investments if such investments are not qualifying assets. Conversely, if we fail to invest a sufficient portion of our assets in qualifying assets, we could lose our status as a BDC,business development company, which would have a material adverse effect on our business, financial condition and result of operations. Similarly, these rules could prevent us from making additional investments in existing portfolio companies, which could result in the dilution of our position, or could require us to dispose of investments at an inopportune time to comply with the 1940 Act. If we were forced to sell non-qualifying investments in the portfolio for compliance purposes, the proceeds from such sale could be significantly less than the current value of such investments.
Failure to maintain our status as a BDCbusiness development company would reduce our operating flexibility.
If we do not remain a BDC,business development company, we might be regulated as a registered closed-end investment company under the 1940 Act, which would subject us to substantially more regulatory restrictions under the 1940 Act and correspondingly decrease our operating flexibility.
Regulations governing our operation as a BDCbusiness development company and RIC will affect our ability to raise, and the way in which we raise, additional capital or borrow for investment purposes, which may have a negative effect on our growth.
As a result of the annual distribution requirement to qualify as a RIC, we may need to periodically access the capital markets to raise cash to fund new investments. We may issue “senior securities,” including borrowing money from banks or other financial institutions only in amounts such that our asset coverage, as defined in the 1940 Act, equals at least 200% after such incurrence or issuance. Our ability to issue different types of securities is also limited. Compliance with these requirements may unfavorably limit our investment opportunities and reduce our ability in comparison to other companies to profit from favorable spreads between the rates at which we can borrow and the rates at which we can lend. As a BDC,business development company, therefore, we continuously issue equity at a rate more frequent than our privately owned competitors, which may lead to greater shareholder dilution.
Although we do not currently use any leverage, we reserve the right to utilize leverage to generate capital to make additional investments. If the value of our assets declines, we may be unable to satisfy the asset coverage test under the 1940 Act, which could prohibit us from paying distributions and could prevent us from qualifying as a RIC. If we cannot satisfy the asset coverage test, we may be required to sell a portion of our investments and, depending on the nature of our debt financing, repay a portion of our indebtedness at a time when such sales and repayments may be disadvantageous.
Under the 1940 Act, we generally are prohibited from issuing or selling our shares at a price below net asset value per share, which may be a disadvantage as compared with other public companies. We may, however, sell our shares, or warrants, options or rights to acquire our shares, at a price below the current net asset value of the shares if our boardBoard of directorsDirectors and independent directors determine that such sale is in our best interests and the best interests of our shareholders, and our shareholders as well as those shareholders that are not affiliated with us approve such sale. In any such case, the price at which our securities are to be issued and sold may not be less than a price that, in the determination of our boardBoard of directors,Directors, closely approximates the fair value of such securities.
Various conflicts of interest exist between us and the roles, activities and duties of the Manager and its affiliates.
Conflicts of interest between us and the various roles, activities and duties of the Manager and its affiliates may occur from time to time. The Manager, its officers and other affiliates may act as a manager or general partner of other private or public entities, some of whom may have the same or a similar investment objective as the Fund. As a result, conflicts of interest between us and the other activities of the Manager and its affiliates may occur from time to time. None of the agreements or arrangements, including those relating to compensation, between us, the Manager or their affiliates, is the result of arm’s-length negotiations.
Our ability to enter into transactions with our affiliates will be restricted.
We are prohibited under the 1940 Act from participating in certain transactions with certain of our affiliates without the prior approval of a majority of the independent members of our boardBoard of directorsDirectors and, in some cases, the SEC. Any person that owns, directly or indirectly, 5% or more of our outstanding voting securities is considered our affiliate for purposes of the 1940 Act and we are generally prohibited from buying or selling any securities from or to such affiliate, absent the prior approval of our boardBoard of directors.Directors. The 1940 Act also prohibits certain “joint” transactions with certain of our affiliates, which could include investments in the same portfolio company (whether at the same or different times), without prior approval of our boardBoard of directorsDirectors and, in some cases, the SEC. If a person acquires more than 25% of our voting securities, we will be prohibited from buying or selling any security from or to such person or certain of that person’s affiliates, or entering into prohibited joint transactions with such persons, absent the prior approval of the SEC or adherence to certain interpretive advice from the SEC. Similar restrictions limit our ability to transact business with our officers or directors or their affiliates. As a result of these restrictions, we may be prohibited from buying or selling any security from or to any portfolio company of a private equity fund managed by our Manager or its affiliates without the prior approval of the SEC, which may limit the scope of investment opportunities that would otherwise be available to us.
| 26 |
We are uncertain of our sources for funding our future capital needs; if we cannot obtain debt or equity financing on acceptable terms, our ability to acquire investments and to expand our operations will be adversely affected.
The net proceeds from the sale of common stock will be used for our investment opportunities, operating expenses and for payment of various fees and expenses such as base management fees, incentive fees and other expenses. Any working capital reserves we maintain may not be sufficient for investment purposes, and we may require debt or equity financing to operate. Accordingly, in the event that we develop a need for additional capital in the future for investments or for any other reason, these sources of funding may not be available to us. Consequently, if we cannot obtain debt or equity financing on acceptable terms, our ability to acquire investments and to expand our operations will be adversely affected. As a result, we would be less able to create and maintain a broad portfolio of investments and achieve our investment objective, which may negatively impact our results of operations and reduce our ability to make distributions to our shareholders.
We are a non-diversified investment company within the meaning of the 1940 Act, and therefore we are not limited with respect to the proportion of our assets that may be invested in securities of a single issuer.
We are classified as a non-diversified investment company within the meaning of the 1940 Act, which means that we are not limited by the 1940 Act with respect to the proportion of our assets that we may invest in securities of a single issuer. To the extent that we assume large positions in the securities of a small number of issuers, or within a particular industry, our net asset value may fluctuate to a greater extent than that of a diversified investment company as a result of changes in the financial condition or the market’s assessment of the issuer. We may also be more susceptible to any single economic or regulatory occurrence than a diversified investment company. However, we will be subject to the diversification requirements applicable to RICs under Subchapter M of the Code.
Risks Related to our Target Investments
Our investments in prospective portfolio companies may be risky, and we could lose all or part of our investment.
We intend to invest primarily in senior secured loans, second lien secured loans and subordinated debt of private U.S. companies. We may also invest in equity securities or securities of foreign companies.
Senior secured loans and second lien secured loans. There is a risk that any collateral pledged by portfolio companies in which we have taken a security interest may decrease in value over time or lose its entire value, may be difficult to sell in a timely manner, may be difficult to appraise and may fluctuate in value based upon the success of the business and market conditions, including as a result of the inability of the portfolio company to raise additional capital. To the extent our debt investment is collateralized by the securities of a portfolio company’s subsidiaries, such securities may lose some or all of their value in the event of the bankruptcy or insolvency of the portfolio company. Also, in some circumstances, our security interest may be contractually or structurally subordinated to claims of other creditors. In addition, deterioration in a portfolio company’s financial condition and prospects, including its inability to raise additional capital, may be accompanied by deterioration in the value of the collateral for the loan. Loans that are under-collateralized involve a greater risk of loss. Consequently, the fact that a loan is secured does not guarantee that we will receive principal and interest payments according to the loan’s terms, or at all, or that we will be able to collect on the loan should we be forced to enforce our remedies.
Subordinated debt. Our subordinated debt investments will generally rank junior in priority of payment to senior loans and will generally be unsecured. This may result in a heightened level of risk and volatility or a loss of principal, which could lead to the loss of the entire investment. These investments may involve additional risks that could adversely affect our investment returns. To the extent interest payments associated with such debt are deferred, such debt may be subject to greater fluctuations in valuations, and such debt could subject us and our stockholders to non-cash income. Since we will not receive any principal repayments prior to the maturity of some of our subordinated debt investments, such investments will be of greater risk than amortizing loans.
Equity investments. We expect to make select equity investments. In addition, when we invest in senior secured and second lien secured loans or subordinated debt, we may acquire warrants to purchase equity securities. The equity interests we receive may not appreciate in value and, in fact, may decline in value. Accordingly, we may not be able to realize gains from our equity interests, and any gains that we do realize on the disposition of any equity interests may not be sufficient to offset any other losses we experience.
Non-U.S. securities. We may invest in non-U.S. securities, which may include securities denominated in U.S. dollars or in non-U.S. currencies, to the extent permitted by the 1940 Act. Because evidences of ownership of such securities usually are held outside the United States, we would be subject to additional risks if we invested in non-U.S. securities, which include possible adverse political and economic developments, seizure or nationalization of foreign deposits and adoption of governmental restrictions which might adversely affect or restrict the payment of principal and interest on the non-U.S. securities to investors located outside the country of the issuer, whether from currency blockage or otherwise. Since non-U.S. securities may be purchased with and payable in foreign currencies, the value of these assets as measured in U.S. dollars may be affected unfavorably by changes in currency rates and exchange control regulations.
| 27 |
In addition, we invest in securities that are rated below investment grade by rating agencies or that would be rated below investment grade if they were rated. Below investment grade securities, which are often referred to as “junk,” have predominantly speculative characteristics with respect to the issuer’s capacity to pay interest and repay principal. They may also be difficult to value and illiquid.
Our portfolio companies may incur debt that ranks equally with, or senior to, our investments in such companies.
Our portfolio companies may have, or may be permitted to incur, other debt that ranks equally with, or senior to, the debt in which we invest. By their terms, such debt instruments may entitle the holders to receive payment of interest or principal on or before the dates on which we are entitled to receive payments with respect to the debt instruments in which we invest. Also, in the event of insolvency, liquidation, dissolution, reorganization or bankruptcy of a portfolio company, holders of debt instruments ranking senior to our investment in that portfolio company would typically be entitled to receive payment in full before we receive any proceeds. After repaying such senior creditors, such portfolio company may not have any remaining assets to use for repaying its obligation to us. In the case of debt ranking equally with debt instruments in which we invest, we would have to share on an equal basis any distributions with other creditors holding such debt in the event of an insolvency, liquidation, dissolution, reorganization or bankruptcy of the relevant portfolio company.
There may be circumstances where our debt investments could be subordinated to claims of other creditors or we could be subject to lender liability claims.
If one of our portfolio companies were to go bankrupt, depending on the facts and circumstances, including the extent to which we actually provided managerial assistance to that portfolio company, a bankruptcy court might recharacterize our debt investment and subordinate all or a portion of our claim to that of other creditors. In situations where a bankruptcy carries a high degree of political significance, our legal rights may be subordinated to other creditors. We may also be subject to lender liability claims for actions taken by us with respect to a borrower’s business or in instances where we exercise control over the borrower or render significant managerial assistance.
Second priority liens on collateral securing debt investments that we own may be subject to control by senior creditors with first priority liens. If there is a default, the value of the collateral may not be sufficient to repay in full both the first priority creditors and us.
Certain debt investments that we own may be secured on a second priority basis by the same collateral securing first priority debt of such companies. The first priority liens on the collateral will secure the portfolio company’s obligations under any outstanding senior debt and may secure certain other future debt that may be permitted to be incurred by such company under the agreements governing the loans. The holders of obligations secured by the first priority liens on the collateral will generally control the liquidation of and be entitled to receive proceeds from any realization of the collateral to repay their obligations in full before us. In addition, the value of the collateral in the event of liquidation will depend on market and economic conditions, the availability of buyers and other factors. There can be no assurance that the proceeds, if any, from the sale or sales of all of the collateral would be sufficient to satisfy the debt obligations secured by the second priority liens after payment in full of all obligations secured by the first priority liens on the collateral. If such proceeds are not sufficient to repay amounts outstanding under the debt obligations secured by the second priority liens, then we, to the extent not repaid from the proceeds of the sale of the collateral, will only have an unsecured claim against such company’s remaining assets, if any.
The rights we may have with respect to the collateral securing the debt investments we own with senior debt outstanding may also be limited pursuant to the terms of one or more intercreditor agreements that we enter into with the holders of senior debt. Under such an intercreditor agreement, at any time that obligations that have the benefit of the first priority liens are outstanding, any of the following actions that may be taken in respect of the collateral will be at the direction of the holders of the obligations secured by the first priority liens: the ability to cause the commencement of enforcement proceedings against the collateral; the ability to control the conduct of such proceedings; the approval of amendments to collateral documents; releases of liens on the collateral; and waivers of past defaults under collateral documents. We may not have the ability to control or direct such actions, even if our rights are adversely affected.
To the extent original issue discount constitutes a portion of our income, we will be exposed to risks associated with the deferred receipt of cash representing such income.
Our investments may include original issue discount instruments. To the extent original issue discount constitutes a portion of our income, we will be exposed to typical risks associated with such income being required to be included in taxable and accounting income prior to receipt of cash, including the following:
| 28 |
We do not expect to control our portfolio companies.
We do not expect to control our portfolio companies. As a result, we are subject to the risk that a portfolio company in which we invest may make business decisions with which we disagree and the management of such company, as representatives of the holders of their common equity, may take risks or otherwise act in ways that do not serve our interests as debt investors. Due to the limited liquidity for our debt investments in our portfolio companies, we may not be able to dispose of our interests in our portfolio companies as readily as we would like or at an appropriate valuation. As a result, a portfolio company may make decisions that could decrease the value of our portfolio holdings.
We will be exposed to risks associated with changes in interest rates.
We are subject to financial market risks, including changes in interest rates. We expect our portfolio to be predominantly composed of fixed-rate high-yield and equity-linked corporate debt securities, but we may also purchase senior secured corporate debt securities which may have variable interest rates. We currently anticipate that the portion of our portfolio composed of variable rate corporate debt securities, if any, will not exceed 20%, but we may increase that to 33% of our aggregate portfolio at the time of any purchase depending on market opportunities. Accordingly, general interest rate fluctuations may have a substantial negative impact on our investments and investment opportunities and, therefore may have a material adverse effect on our investment objectives and our rate of return on invested capital.
To the extent we borrow funds the potential for gain or loss on amounts invested in us is magnified and may increase the risk of investing in us.
Borrowings, also known as leverage, magnify the potential for gain or loss on invested equity capital. To the extent we use leverage to partially finance our investments, you will experience increased risks associated with investing in our securities. We may borrow from banks and other lenders, and may issue debt securities or enter into other types of borrowing arrangements in the future. Our loan agreements may contain financial and operating covenants that could restrict our business activities. Breach of any of those covenants could cause a default under those instruments. Such a default, if not cured or waived, could have a material adverse effect on us. If the value of our assets increases, then leveraging would cause the net asset value attributable to our common stock to increase more sharply than it would have had we not leveraged. Conversely, if the value of our assets decreases, leveraging would cause net asset value to decline more sharply than it otherwise would have had we not leveraged. Similarly, any increase in our income in excess of interest payable on the borrowed funds would cause our net investment income to increase more than it would without the leverage, while any decrease in our income would cause our net investment income to decline more sharply than it would have had we not borrowed. Such a decline could negatively affect our ability to make distributions to our stockholders. Leverage is generally considered a speculative investment technique. At December 31, 2016, we had a leverage of $6.4 million which represents almost 19% of our net assets.
We invest a portion of our assets in privately held companies which presents certain challenges, including the lack of available information about these companies.
We invest a portion of our assets in privately held companies. Investments in private companies pose certain incremental risks as compared to investments in public companies including that they:
| 29 |
In addition, investments in private companies tend to be less liquid. The securities of private companies are often not publicly traded or actively traded on the secondary market and are, instead, traded on a privately negotiated over-the-counter secondary market for institutional investors. These privately negotiated over-the-counter secondary markets may be inactive during an economic downturn or a credit crisis. In addition, the securities in these companies will be subject to legal and other restrictions on resale or will otherwise be less liquid than publicly traded securities. Also, under the 1940 Act, if there is no readily available market for these investments, we are required to carry these investments at fair value as determined by our boardBoard of directors.Directors. As a result, if we are required to liquidate all or a portion of our portfolio quickly, we may realize significantly less than the value at which we had previously recorded these investments. We may also face other restrictions on our ability to liquidate an investment in a portfolio company to the extent that we, our Manager or any of their respective affiliates have material nonpublic information regarding such portfolio company or where the sale would be an impermissible joint transaction. The reduced liquidity of our investments may make it difficult for us to dispose of them at a favorable price, and, as a result, we may suffer losses.
Finally, little public information generally exists about private companies and these companies may not have third-party debt ratings or audited financial statements. We must therefore rely on the ability of our Manager to obtain adequate information through due diligence to evaluate the creditworthiness and potential returns from investing in these companies. Additionally, these companies and their financial information will not generally be subject to the Sarbanes-Oxley Act and other rules that govern public companies. If we are unable to uncover all material information about these companies, we may not make a fully informed investment decision, and we may lose money on our investments.
Economic recessions or downturns could impair our portfolio companies and harm our operating results.
Many of our portfolio companies may be susceptible to economic slowdowns or recessions and may be unable to repay our debt investments during these periods. Therefore, our non-performing assets are likely to increase, and the value of our portfolio is likely to decrease, during these periods. Adverse economic conditions may also decrease the value of any collateral securing our first lien or second lien secured loans. A prolonged recession may further decrease the value of such collateral and result in losses of value in our portfolio and a decrease in our revenues, net income and net asset value. Unfavorable economic conditions also could increase our funding costs, limit our access to the capital markets or result in a decision by lenders not to extend credit to us on terms we deem acceptable. These events could prevent us from increasing investments and harm our operating results.
A covenant breach by our portfolio companies may harm our operating results.
A portfolio company’s failure to satisfy financial or operating covenants imposed by us or other lenders could lead to defaults and, potentially, termination of its loans and foreclosure on its secured assets, which could trigger cross-defaults under other agreements and jeopardize a portfolio company’s ability to meet its obligations under the debt or equity securities that we hold. We may incur expenses to the extent necessary to seek recovery upon default or to negotiate new terms, which may include the waiver of certain financial covenants, with a defaulting portfolio company.
An investment strategy focused primarily on privately held companies presents certain challenges, including the lack of available information about these companies.
Our investments are primarily in privately-held companies. Investments in private companies pose significantly greater risks than investments in public companies. First, private companies have reduced access to the capital markets, resulting in diminished capital resources and the ability to withstand financial distress. As a result, these companies, which may present greater credit risk than public companies, may be unable to meet their obligations under their debt securities that we hold. Second, the investments themselves often may be less liquid. The securities of many of the companies in which we invest are not publicly-traded or actively traded on the secondary market and are, instead, traded on a privately negotiated over-the-counter secondary market for institutional investors. In addition, such securities may be subject to legal and other restrictions on resale.
A lack of liquidity in certain of our investments may adversely affect our business.
We invest in certain companies whose securities are not publicly-traded or actively traded on the secondary market and are, instead, traded on a privately negotiated over-the-counter secondary market for institutional investors and whose securities are subject to legal and other restrictions on resale or are otherwise less liquid than publicly-traded securities. We also invest in certain companies who issue us warrants for the shares of their equity which are not traded on the secondary market. The illiquidity of certain of ourthese investments may make it difficult for us to sell these investments when desired. In addition, if we are required to liquidate all or a portion of our portfolio quickly, we may realize significantly less than the value at which we had previously recorded these investments. The reduced liquidity of our investments may make it difficult for us to dispose of them at a favorable price, and, as a result, we may suffer losses.
| 30 |
Certain macro-economic events may adversely affect the value of our bond positions and thus may impair our investment performance.
The following risks may adversely affect the value of our bond positions and thus may impair our investment performance:
| • | Recession. If the U.S. economy slides back into a recession it may cause a correction in bond prices driving them lower and increasing the cost of borrowing for companies. |
| • | Correction in U.S. Treasuries or Broader Bond Markets. U.S. Treasuries and corporate bonds have seen a continued dramatic increase in prices over the past several quarters, driving down yields. A correction or trade out of these fixed income securities could correct bond prices across the board, from Treasuries to corporate debt. |
| • | Increase in Corporate Default Rates. Corporate debt default rates and bankruptcy rates have remained relatively flat and remain at extremely low levels (less than 2%). Any significant increase in default rates would depress bond prices as corporate borrowing costs increase. |
| • | Inflation. Core inflation in the United States remains under |
| • | Monetary Tightening and Rising Interest Rates. The U.S. Federal Reserve |
| • | Devaluation of the U.S. Dollar. We invest in the debt securities of issuers domiciled in the United States. As such, the debt securities that we purchase will pay coupons denominated in U.S. dollars. A significant devaluation of the U.S. dollar could lead to lower bond prices as real returns are diminished due to a devalued currency. |
Revenue from our investments may not be guaranteed ..
We generate investment income in the form of interest and fees earned on senior secured loans, senior secured notes, subordinated debt, senior unsecured debt and collateralized securities in our portfolio. The level of income we receive is directly related to the balance of collectible income producing investments multiplied by the weighted average yield of our investments. There is no guarantee that the companies we invest in will pay the coupon interest when due.
We may be subject to litigation claims from Relativity.
On July 30, 2015, Relativity Media, LLC (“Relativity”) filed a voluntary Chapter 11 case in the United States Bankruptcy Court for the Southern District of New York (the “Bankruptcy Court”). We own 855,079 shares of Series E Preferred Stock of Relativity. In October 2015, Relativity filed an adversary proceeding against our Manager in the Bankruptcy Court alleging that our Manager breached a commitment to provide $30 million of financing as part of a proposed reorganization of Relativity. We were not named as a defendant in the adversary proceeding. However, on October 20, 2015, Relativity sought and obtained from the Bankruptcy Court an ex parte temporary restraining order, or TRO, that bars our Manager and “its agents, servants, officers, employees and attorneys, and all persons in active concert or participation with them from transferring, assigning, encumbering, or taking any other action with respect to any and all funds” in our US Bank and Wells Fargo accounts. Neither we nor our Manager were provided with prior notice of the hearing on the TRO or was present at the hearing. The two accounts affected by the TRO contained substantially all of our assets at the time. The TRO was dissolved pursuant to a Stipulation and Agreed Order entered by the Bankruptcy Court on October 28, 2015, pursuant to which the parties agreed to engage in negotiations to resolve their dispute. The negotiations did not result in a settlement.
Our Manager reached a settlement with Relativity in 2016 which is subject to Bankruptcy Court approval. However, the motion to approve the settlement was withdrawn on January 23, 2017. Relativity’s confirmed plan provides that Relativity’s claims against VII Peaks will be assigned to a trust established for its creditors under its plan of reorganization if they are not settled. However, on February 8, 2017, the principal secured lender to Relativity and Relativity’s co-manager filed a joint motion to convert Relativity’s case to Chapter 7 liquidation, citing an inability by Relativity to raise capital for its operations and significant defaults on its debts. A hearing on the conversion motion is currently scheduled for May 17, 2017. Given the uncertainty surrounding Relativity, it is not clear if the lawsuit against us and our Manager will be pursued or dropped. In the event the creditors trust elects to continue the case, our Manager intends to defend the case vigorously. Our Manager contends, among other things, that the parties never reached a binding agreement on the terms of an investment and that Relativity has suffered no harm since it has obtained alternative financing to replace the financing it contends that our Manager did not provide.
| 31 |
Risks Related to Our Continuous Offering and Our Shares
This is a speculative investment.
Our business objectives should be considered highly speculative, and there are no assurances that the Manager will satisfy those objectives. No assurances can be given that the Manager will realize a substantial return, if any, on its investment purchases, or that you will not lose your entire investment in us.
There is no market for the shares of our common stock nor do we expect a market to develop in the foreseeable future, which adversely affects the liquidity and price of our shares.
There is no market for the shares of our common stock and no market for our shares is expected to develop in the foreseeable future. Shareholders therefore have no access to information about prior market history on which to base their investment decision. As a result, shareholders may be unable to sell their shares unless a market can be established and sustained.
If we are unable to raise substantial funds in our continuous “best efforts” offering, we will be limited in the number and type of investments we may make, our expense ratio will be higher, and the value of your investment in us may be reduced in the event our assets under-perform.
Our continuous offering is being made on a best efforts basis, whereby Axiom CapitalArete Wealth Management, Inc.LLC (“Arete”) our managing broker/dealer and distributor of the Fund’s shares, and any selected dealers who enter into distribution agreements with Axiom Capital Management, Inc.Arete, are only required to use their best efforts to sell our shares and have no firm commitment or obligation to purchase any of our shares. However, we have not been able to complete the comment review process with respect to the annual amendment to our Form N-2 registration statement for fiscal 2015, and therefore have not been able to issue any shares in our continuous offering since April 30, 2015. Our inability to obtain approval of our Form N-2 amendment in 2015 was partially due to issues that arose from a material weakness in our internal controls that we discovered in 2015, which has since been remedied, as well as uncertainties regarding the valuation of a material investment we made in Relativity Media, LLC in 2015. In the middle of 2016, the Board of Directors voted to withdraw our election to be treated as a business development company, and convert the Fund into a closed end fund that elects to be an “interval fund” (the “Reorganization”). The Reorganization was approved by our shareholders at an adjourned shareholder meeting held on December 28, 2016. As a result of the Reorganization, we did not resubmit our Form N-2 to the SEC for approval in 2016. We expect to resume offering shares after the Form N-2 for the reorganized fund is approved by the SEC, and the Reorganization is completed.
To the extent that less than the maximum number of shares is sold, the opportunity for diversification of our investments may be decreased and the returns achieved on those investments may be reduced as a result of allocating all of our expenses among a smaller capital base.
Investors will not know the purchase price per share at the time they submit their subscription agreements and could receive fewer shares than anticipatedpay a premium for their common stock if our boardBoard of directors determines to increaseDirectors does not decrease the offering price to comply within the requirement that we avoid sellingevent of a decline in our shares below net asset value, or (“NAV”) per share.
ThePrior to consummation of the Reorganization, our policy has been that the purchase price at which shareholdersyou purchase shares of common stock will be determined at each monthly closing date to ensure that the sales price, after deducting selling commissions and dealer manager fees, is equal to or greater than the net asset value of our shares. As a result, in the event of an increase to our net asset value per share, an investor’s purchase price may be higher than the prior closing price per share, and therefore shareholders may receive a smaller number of shares than if shareholders had subscribed at the prior closing price.
Investors will not know the purchase price per share at the time they submit their subscription agreements and could pay a premium for their shares of common stock if our board of directors, or delegated committee, does not decrease the offering price in the event of a decline to our net asset value per share.
The purchase price at which shareholders purchase shares will be determined at each closing date to ensure that the sales price is equal to or greater than the net asset value of our shares, after deducting selling commissions and dealer manager fees.stock. In the event of a decrease to our net asset value per share, shareholdersyou could pay a premium of more than 5.0% for their shares ofyour common stock if our boardBoard of directors, or delegated committee,Directors does not decrease the offering price. Closing datesA decline in our net asset value per share to an amount more than 5.0% below our current offering price, net of selling commissions and dealer manager fees, creates a rebuttable presumption that there has been a material change in the value of our assets such that a reduction in the offering price per share is warranted. This presumption may only be rebutted if our Board of Directors, in consultation with our management, reasonably and in good faith determines that the decline in net asset value per share is the result of a temporary movement in the credit markets or the value of our assets, rather than a more fundamental shift in the valuation of our portfolio. In the event that (i) net asset value per share decreases to more than 5.0% below our current net offering price and (ii) our Board of Directors believes that such decrease in net asset value per share is the result of a non-temporary movement in the credit markets or the value of our assets, our Board of Directors will undertake to establish a new net offering price that is not more than 5.0% above our net asset value per share. If our Board of Directors determines that the decline in our net asset value per share is the result of a temporary movement in the credit markets or the value of our assets, investors will purchase common stock at an offering price per share, net of selling commissions and dealer manager fees, which represents a premium to the net asset value per share of greater than 5.0%.
In the fiscal years ended 2015 and 2016, the net asset value of our common stock decreased to an amount more than 5% below our then current offering price. The declines resulted from three factors: overall declines in the market prices of high yield debt instruments; declines in the market value of specific positions that have defaulted or which the market perceives will need to restructure or the ones that have already been restructured into 144A private placement equity positions for which real pricing is not available; and as a result of distributions made to date in excess of net investment income. The Pricing Committee of our Board of Directors reviewed market data regarding movements in the credit markets, and the specific circumstances surrounding each of the positions in our portfolio which had experienced the greatest decline in value, including recent earnings announcements, collateral, priority in the capital structure, and current indications as to the terms of any restructuring. Based on that analysis, the Board of Directors determined that a reduction in our gross offering price to $9.25 per share in 2015 and then to $8.75 in 2016 accurately reflected the extent to which the decline was the result of non-temporary factors in the markets and specific positions. However, the current offering price of $8.75 is more than 5% greater than the net asset value per share of our common stock. Therefore, investors in our common stock will experience immediate dilution of their investments.
| 32 |
In the event the Reorganization is completed, our policy will be that the purchase price of our common stock in monthly closings will be offered at the Fund’s net asset value (“NAV”) per share, plus the sales load (as described below), as of the first business day of each month. The NAV per share is computed by dividing the Fund’s NAV by the total number of shares outstanding at the time the determination is made. A sales load, which includes selling commissions of 6% of the gross proceeds from sales made by selected dealers, which includes 2% for dealer manager fees, will be paid or charged on sales of shares. The sales load will be deducted from the proceeds paid to the Fund.
If we are typically semi-annual.unable to raise substantial funds in our continuous “best efforts” offering, our distributions may continue to constitute a return of capital or we may have to reduce our distribution rate.
Since we have commenced operations, we have implemented a policy of declaring monthly distributions at an annual distribution rate of 7.35% per annum of our offering price. Our distributions have not been based on our investment performance. Prior to September 2013, our distributions were supported by our Manager in the form of operating expense support payments to us, and a portion of our distributions constituted a return of capital. Since September 2013, we have not had an expense support agreement with our Manager and as a result a greater portion of our distributions have constituted a return of capital. We expect to continue paying distributions at the same distribution rate, and that a substantial part of those distributions will constitute a return of capital for the foreseeable future. Furthermore, our ability to generate net investment income sufficient to cover our monthly dividend has been hindered by the fact that we have a number of portfolio investments that are on non-accrual status, and because we hold more equity investments that do not generate regular interest or dividend income. Our distributions will continue to constitute a return of capital until our net investment income is sufficient to support our distribution rate, which will probably not occur until our Manager enters into an expense support agreement with us, our mix of interest and dividend paying assets increase, or our assets increase enough to lower our expense ratio, which we do not expect to occur until we have significantly more net assets than we do at present.
Our continuous offering is being made on a best efforts basis, whereby Arete and any selected dealers who enter into agreements with Arete are only required to use their best efforts to sell our shares and have no firm commitment or obligation to purchase any of our shares. If we are unable to increase our net assets to a level sufficient to make our distributions from investment income, we may have to reduce our distribution rate. If we do not increase our net assets sufficiently, and do not decrease our distribution rate, a substantial part of our distributions will continue to constitute a return of capital, which will decrease the net asset value per share of our common stock. Furthermore, if the Reorganization is completed, our offering price will be determined each month based on the Fund’s net asset value (“NAV”) per share, plus the sales load (as described below), as of the first business day of each month. The NAV per share is computed by dividing the Fund’s NAV by the total number of shares outstanding at the time the determination is made. A sales load, which includes selling commissions of 6% of the gross proceeds from sales made by selected dealers, which includes 2% for dealer manager fees, will be paid or charged on sales of shares. The sales load will be deducted from the proceeds paid to the Fund.
If our Board of Directors elects to maintain the same policy declaring monthly distributions at an annual distribution rate of 7.35% per annum of our offering price, our distributions may decrease as our offering price decreases.
The shares sold in our continuous offering will not be listed on an exchange or quoted through a quotation system for the foreseeable future, if ever. Therefore, if an investor purchase shares in our continuous offering, they will have limited liquidity and may not receive a full return of their invested capital if they sell their shares.
The shares offered by us are illiquid assets for which there is not expected to be any secondary market nor is it expected that any will develop in the foreseeable future. WithinWhen we initially elected to be treated as a business development corporation, our Board of Directors resolved that it would, within four years following the completion of our public offering or any subsequent follow-on offering, our board of directors is required to recommend that we pursue a liquidity event for our shareholders. However, there can bewas no assurance that we willwould be able to complete a liquidity event within such time or at all. A liquidity event could include: (i) a listing of our shares on a national securities exchange; (ii) a merger or another transaction approved by our boardBoard of directorsDirectors in which our shareholders will receive cash or shares of a listed company; or (iii) a sale of all or substantially all of our assets either on a complete portfolio basis or individually followed by a liquidation.
Prior to the completion of a liquidity event, our tender offer program may provideprovided a limited opportunity for investors to achieve liquidity, subject to certain restrictions and limitations, at a price which may reflect a discount from the purchase price they paid for their shares being repurchased. However, we suspended our tender offer program in the third quarter of 2015, and have not determined when we will resume the tender offer program. Unless and until we resume the tender offer program, or effect another type of liquidity event, shareholders will not have any realistic options to liquidate their shares.
In mid-2016, our Board of Directors approved resolutions to withdraw our election to be treated as a business development company, and convert the Fund into a closed end fund that elects to be an “interval fund” (the “Reorganization”). The Reorganization was approved by our shareholders at an adjourned shareholder meeting held on December 28, 2016. We expect to resume offering shares after the Form N-2 for the reorganized fund is approved by the SEC, and the Reorganization is completed. The Reorganization includes the adoption of a fundamental policy under which we would make annual tender offers of between 5% and 25% of our shares on an annual basis at our net asset value at the time, which will provide shareholders with some liquidity for their shares. Therefore, if the Reorganization is consummated, we no longer expect to complete an alternative liquidity event.
| 33 |
If the Reorganization is not completed for any reason, we may still seek to undertake an alternative liquidity event. In making a determination of what type of liquidity event is in the best interest of our shareholders, our boardBoard of directors,Directors, including our independent directors, may consider a variety of criteria, including, but not limited to, market conditions, portfolio diversification, portfolio performance, our financial condition, potential access to capital as a listed company, market conditions for the sale of our assets or listing of our shares, internal management requirements to become a perpetual life company and the potential for shareholder liquidity. We can offer no assurance that we will be able to effect a liquidity event. Further, even if we do complete a liquidity event, you may not receive a return of all of your invested capital.
We are not obligated to complete a liquidity event by a specified date; therefore, it will be difficult for an investor to sell his or her shares.
Within four years following the completion of our public offering or any subsequent follow-on offering, our board of directors is required to recommend that we pursue a liquidity event for our shareholders. A liquidity event could include: (i) a listing of our shares on a national securities exchange; (ii) a merger or another transaction approved by our board of directors in which our shareholders will receive cash or shares of a listed company; or (iii) a sale of all or substantially all of our assets either on a complete portfolio basis or individually followed by a liquidation. We expect that the liquidity event recommended by our board of directors will be completed within twelve months following the recommendation by our board of directors. We do not know at this time what circumstances will exist in the future and therefore we do not know what factors our board of directors will consider in determining what form of liquidity event to pursue. There may be economic or other factors that negatively impact our ability to complete a liquidity event within this timeframe or at all. As a result, it may be difficult for investors to sell their shares.
Our ability to successfully conduct our continuous offering is dependent, in part, on the ability of Axiom Capital Management, Inc.Arete to successfully establish, operate and maintain a network of broker-dealers.
The success of our public offering, and correspondingly our ability to implement our business strategy, is dependent upon the ability of Axiom Capital Management, Inc.Arete to establish and maintain a network of licensed securities broker-dealers and other agents to sell our shares. If Axiom Capital Management, Inc.Arete fails to perform, we may not be able to raise adequate proceeds through our public offering to implement our investment strategy. If we are unsuccessful in implementing our investment strategy, shareholders could lose all or a part of their investment.
Beginning with the fourth calendar quarter of 2013, we began offering a repurchase program for shareholdersshareholders’ shares on a quarterly basis. However, we are not required to make repurchases and there can be no assurance we will do so. However, we suspended our tender offer program in the third quarter of 2015, and have not determined when we will resume the tender offer program.As a result, shareholders may be unable to sell their shares and, to the extent they are able to sell their shares under the tender offer program, they may not be able to recover the amount of their investment in our shares.
Beginning with the fourth calendar quarter of 2013, we began offering a repurchase program for shareholders to tender their shares on a quarterly basis at a price equal to 90% of orour current offering price as of the date of repurchase. To the extent that we make purchases, the tender offer program will include numerous restrictions that limit their ability to sell their shares. We intend to limit the number of shares repurchased pursuant to our proposed tender offer program as follows: (1) we currently intend to limit the number of shares to be repurchased during any calendar year to 20% of the weighted average number of shares outstanding in the prior calendar year, or 5% in each quarter; (2) unless shareholders tender all of their shares, shareholders must tender at least 25% of the amount of shares they have purchased in the offering and must maintain a minimum balance of $5,000 subsequent to submitting a portion of their shares for repurchase by us; and (3) to the extent that the number of shares put to us for repurchase exceeds the number of shares that we are able to purchase, we will repurchase shares on a pro rata basis, not on a first-come, first-served basis. Further, we will have no obligation to repurchase shares if the repurchase would violate the restrictions on distributions under federal law or Maryland law, which prohibits distributions that would cause a corporation to fail to meet statutory tests of solvency. These limits may prevent us from accommodating all repurchase requests made in any year. Our boardBoard of directorsDirectors may amend, suspend or terminate the tender offer program upon 30 daysdays’ notice. We will notify shareholders of such developments (1) in our quarterly reports or (2) by means of a separate mailing to shareholders, accompanied by disclosure in a current or periodic report under the Exchange Act. In addition, although we have adopted a tender offer program, we have discretion to not repurchase shareholdersshareholders’ shares, to suspend the plan, and to cease repurchases. Further, the plan has many limitations and should not be relied upon as a method to sell shares promptly and at a desired price. We suspended our tender offer program in the third quarter of 2015, and have not determined when we will resume the tender offer program. Unless and until we resume the tender offer program, or effect another type of liquidity event, shareholders will not have any realistic options to liquidate their shares.
The timing of our repurchase offers pursuant to our tender offer program may be at a time that is disadvantageous to our shareholders.
When we make quarterly repurchase offers pursuant to our tender offer program, we may offer to repurchase shares at a price that is lower than the price that investors paid for shares in our offering. As a result, to the extent investors have the ability to sell their shares to us as part of our tender offer program, the price at which an investor may sell shares, which will be equal to the net asset value per share on the date of repurchase, may be lower than what an investor paid in connection with the purchase of shares in our offering.
In addition, in the event an investor chooses to participate in our tender offer program, the investor will be required to provide us with notice of intent to participate prior to knowing what the net asset value per share will be on the repurchase date. Although an investor will have the ability to withdraw a repurchase request prior to the repurchase date, to the extent an investor seeks to sell shares to us as part of our tender offer program, the investor will be required to do so without knowledge of what the repurchase price of our shares will be on the repurchase date.
Various conflictsYour interest in us will be diluted if we issue additional shares, which could reduce the overall value of an investment in us.
Shareholders do not have preemptive rights to any shares we issue in the future. Our certificate of incorporation authorizes us to issue 200,000,000 shares of common stock. Pursuant to our certificate of incorporation, a majority of our entire Board of Directors may amend our certificate of incorporation to increase the number of authorized shares without shareholder approval. After an investor purchases shares, our board may elect to sell additional shares in the future, issue equity interests in private offerings, or issue share-based awards to our independent directors or persons associated with the Advisor. To the extent we issue additional equity interests after an investor purchases shares of our common stock, an investor’s percentage ownership interest exist betweenin us will be diluted. In addition, depending upon the terms and pricing of any additional offerings and the roles, activitiesvalue of our investments, you may also experience dilution in the book value and dutiesfair value of your shares of common stock.
| 34 |
Under the Manager1940 Act, we generally are prohibited from issuing or selling our common stock at a price below net asset value per share, which may be a disadvantage as compared with certain public companies. We may, however, sell our common stock, or warrants, options, or rights to acquire our common stock, at a price below the current net asset value of our common stock if our Board of Directors and its affiliates.independent directors determine that such sale is in our best interests and the best interests of our stockholders, and our stockholders, including a majority of those stockholders that are not affiliated with us, approve such sale. In any such case, the price at which our securities are to be issued and sold may not be less than a price that, in the determination of our Board of Directors, closely approximates the fair value of such securities (less any distributing commission or discount). If we raise additional funds by issuing common stock or senior securities convertible into, or exchangeable for, our common stock, then the percentage ownership of our stockholders at that time will decrease and you will experience dilution.
Under the terms of our charter, our Board of Directors is authorized to issue shares of preferred stock with rights and privileges superior to common stockholders without common stockholder approval.
ConflictsUnder the terms of interest between usour charter, our Board of Directors is authorized to issue shares of preferred stock in one or more classes or series without stockholder approval. The board has discretion to set the terms, preferences, conversion or other rights, voting powers, restrictions, limitations as to dividends or other distributions, qualifications and terms or conditions of redemption for each class or series of preferred stock. Every issuance of preferred stock will be required to comply with the various roles, activities and dutiesrequirements of the Manager1940 Act. The 1940 Act requires, among other things, that (1) immediately after issuance and its affiliatesbefore any distribution is made with respect to our common stock and before any purchase of common stock is made, such preferred stock together with all other senior securities must not exceed an amount equal to 50% of our total assets after deducting the amount of such distribution or purchase price, as the case may occur from time to time. The Manager, its officersbe, and other affiliates may act(2) the holders of shares of preferred stock, if any are issued, must be entitled as a manager or general partner of other private or public entities, some of whom may have the same orclass to elect two directors at all times and to elect a similar investment objective as the Company. As a result, conflicts of interest between us and the other activitiesmajority of the Manager and its affiliates may occur from time to time. Nonedirectors if distributions on such preferred stock are in arrears by two years or more. Certain matters under the 1940 Act require the separate vote of the agreements or arrangements, including those relating to compensation, between us, the Manager or their affiliates, is the resultholders of arm’s-length negotiations.any issued and outstanding preferred stock.
Certain provisions of the Maryland Corporation Law could deter takeover attempts.
Our bylaws exempt us from the Maryland Control Share Acquisition Act, which significantly restricts the voting rights of control shares of a Maryland corporation acquired in a control share acquisition. If our boardBoard of directorsDirectors were to amend our bylaws to repeal this exemption from the Maryland Control Share Acquisition Act, that statute may make it more difficult for a third party to obtain control of us and increase the difficulty of consummating such a transaction. There can be no assurance, however, that we will not amend our bylaws at some time in the future. We will not, however, amend our bylaws to make us subject to the Maryland Control Share Acquisition Act without our boardBoard of directorsDirectors determining that doing so would not conflict with the 1940 Act and obtaining confirmation from the SEC that it does not object to that determination.
Additionally, our boardBoard of directorsDirectors may, without stockholder action, authorize the issuance of shares of stock in one or more classes or series, including preferred stock. Our boardBoard of directorsDirectors may also, without stockholder action, amend our articles of incorporation to increase the number of shares of stock of any class or series that we have authority to issue. These anti-takeover provisions may inhibit a change of control in circumstances that could give the holders of our common stock the opportunity to realize a premium over the value of our common stock.
Investing in our common stock involves a high degree of risk.
The investments we make in accordance with our investment objective may result in a higher amount of risk and volatility or loss of principal than alternative investment options. Our investments in portfolio companies may be highly speculative and aggressive and, therefore, an investment in our common stock may not be suitable for someone with lower risk tolerance.
The net asset value of our common stock may fluctuate significantly.
The net asset value and liquidity, if any, of the market for shares of our common stock may be significantly affected by numerous factors, some of which are beyond our control and may not be directly related to our operating performance. These factors include:
| 35 |
Risks Related to Taxation
We will be subject to corporate-level income tax if we are unable to qualify as a RIC under Subchapter M of the Code or to satisfy RIC distribution requirements.
To maintain RIC tax treatment under the Code, we must meet the following minimum annual distribution, income source and asset diversification requirements.
The minimum annual distribution requirement for a RIC will be satisfied if we distribute to our stockholders on an annual basis at least 90% of our net ordinary taxable income and realized net short-term capital gains in excess of realized net long-term capital losses, if any. We would also be taxed on any retained income and/or gains, including any short-term capital gains or long-term capital gains. We must also satisfy an additional annual distribution requirement during each calendar year in order to avoid a 4% excise tax on the amount of the under-distribution. Because we may use debt financing, we are subject to an asset coverage ratio requirement under the 1940 Act and may in the future become subject to certain financial covenants under loan and credit agreements that could, under certain circumstances, restrict us from making distributions necessary to satisfy the distribution requirements. If we are unable to obtain cash from other sources, we could fail to qualify for RIC tax treatment, or could be required to retain a portion of our income or gains, and thus become subject to corporate-level income tax.
The income source requirement will be satisfied if we obtain at least 90% of our income for each year from dividends, interest, gains from the sale of stock or securities, or similar sources.
The asset diversification requirement will be satisfied if we meet certain asset diversification requirements at the end of each quarter of our taxable year. To satisfy this requirement, at least 50% of the value of our assets must consist of cash, cash equivalents, U.S. Government securities, securities of other RICs, and other acceptable securities; and no more than 25% of the value of our assets can be invested in the securities, other than U.S. government securities or securities of other RICs, of one issuer, of two or more issuers that are controlled, as determined under applicable Code rules, by us and that are engaged in the same or similar or related trades or businesses or of certain “qualified publicly traded partnerships.” Failure to meet these requirements may result in our having to dispose of certain investments quickly in order to prevent the loss of RIC status. Because a portion of our investments are expected to be in private companies, and therefore will be relatively illiquid, any such dispositions could be made at disadvantageous prices and could result in substantial losses.
If we fail to qualify for or maintain RIC tax treatment for any reason and are subject to corporate income tax, the resulting corporate taxes could substantially reduce our net assets, the amount of income available for distribution, and the amount of our distributions.
You may have current tax liability on distributions you elect to reinvest in shares of our common stock but would not receive cash from such distributions to pay such tax liability.
If we do not qualify as a “publicly offered regulated investment company,” as definedyou participate in the Code, shareholdersour distribution reinvestment plan, you will be deemed to have received, and for U.S. federal income tax purposes will be taxed as though they received a distribution of someon, the amount reinvested in shares of our expenses.
A “publicly offered regulated investment company” is a RIC whose shares are either (i) continuously offered pursuant to a public offering, (ii) regularly traded on an established securities market or (iii) held by at least 500 persons at all times during the taxable year. If we are not a publicly offered RIC for any period, a non-corporate stockholder’s allocable portion of our affected expenses, including our management fees, will be treated as an additional distribution to the stockholder and will be deductible by such stockholder onlycommon stock to the extent permitted under the limitations described below. For non-corporate stockholders, including individuals, trusts, and estates, significant limitations generally applyamount reinvested was not a tax-free return of capital. As a result, unless you are a tax-exempt entity, you may have to use funds from other sources to pay your tax liability on the deductibilityvalue of certain expenses of a non-publicly offered RIC, including advisory fees. In particular, these expenses, referred to as miscellaneous itemized deductions, are deductible to an individual only toour common stock received from the extent they exceed 2% of such a stockholder’s adjusted gross income, and are not deductible for alternative minimum tax purposes.distribution.
We may have difficulty paying our required distributions if we recognize income before or without receiving cash representing such income.
For federal income tax purposes, we may be required to recognize taxable income in circumstances in which we do not receive a corresponding payment in cash. For example, if we hold debt obligations that are treated under applicable tax rules as having original issue discount (such as debt instruments with PIK, interest or, in certain cases, increasing interest rates or debt instruments that were issued with warrants), we must include in income each year a portion of the original issue discount that accrues over the life of the obligation, regardless of whether cash representing such income is received by us in the same taxable year. We may also have to include in income other amounts that we have not yet received in cash, such as deferred loan origination fees that are paid after origination of the loan or are paid in non-cash compensation such as warrants or stock. Furthermore, we may invest in non-U.S. corporations (or other non-U.S. entities treated as corporations for U.S. federal income tax purposes) that could be treated under the Code and U.S. Treasury regulations as “passive foreign investment companies” and/or “controlled foreign corporations.” The rules relating to investment in these types of non-U.S. entities are designed to ensure that U.S. taxpayers are either, in effect, taxed currently (or on an accelerated basis with respect to corporate level events) or taxed at increased tax rates at distribution or disposition. In certain circumstances this could require us to recognize income where we do not receive a corresponding payment in cash.
| 36 |
We anticipate that a portion of our income may constitute original issue discount or other income required to be included in taxable income prior to receipt of cash. Further, we may elect to amortize market discounts and include such amounts in our taxable income in the current year, instead of upon disposition, as an election not to do so would limit our ability to deduct interest expenses for tax purposes.
Because any original issue discount or other amounts accrued will be included in our investment company taxable income for the year of the accrual, we may be required to make a distribution to our stockholders in order to satisfy the annual distribution requirement, even if we will not have received any corresponding cash amount. As a result, we may have difficulty meeting the annual distribution requirement necessary to obtain and maintain RIC tax treatment under the Code. We may have to sell some of our investments at times and/or at prices we would not consider advantageous, raise additional debt or equity capital, make a partial share distribution, or forgo new investment opportunities for this purpose. If we are not able to obtain cash from other sources, and choose not to make a qualifying share distribution, we may fail to qualify for RIC tax treatment and thus become subject to corporate-level income tax.
ITEM 1B. UNRESOLVED STAFF COMMENTS
Not applicable.
We do not own any real estate or other physical properties materially important to our operation. Our executive offices are located at 100 Pine Street,Grove Financial Center, 4 Orinda Way, Bldg A, Suite 500, San Francisco, California 94111.125-A, Orinda, CA 94563. We believe that our current office facilities are adequate for our business as we intend to conduct it.
On July 30, 2015, Relativity Media, LLC (“Relativity”) filed a voluntary Chapter 11 case in the United States Bankruptcy Court for the Southern District of New York (the “Bankruptcy Court”). We own 855,079 shares of Series E Preferred Stock of Relativity. On October 19, 2015, Relativity filed an adversary proceeding against our Manager in the Bankruptcy Court, styled Relativity Fashion, LLC, et al. v. VII Peaks Capital, LLC, Adversary No. 15-1361 (the “Adversary Proceeding”), alleging that our Manager breached a commitment to provide $30.0 million of financing as part of a proposed reorganization of Relativity. We were not named as a defendant in the Adversary Proceeding. On October 20, 2015, Relativity sought and obtained from the Bankruptcy Court an ex parte temporary restraining order (the “TRO”) that barred our Manager and “its agents, servants, officers, employees and attorneys, and all persons in active concert or participation with them from transferring, assigning, encumbering, or taking any other action with respect to any and all funds” in the US Bank and Wells Fargo accounts which belong to us. Neither weus nor our Manager are currently subjectwere provided with prior notice of the hearing on the TRO or was present at the hearing. The two accounts affected by the TRO contained substantially all of our assets. The TRO was dissolved pursuant to any material legal proceedings, nor,a Stipulation and Agreed Order entered by the Bankruptcy Court on October 28, 2015 (the “Stipulation”), pursuant to our knowledge, is any material legal proceeding threatened against us. From timewhich the parties agreed to time, we may beengage in negotiations to resolve their dispute. The negotiations did not result in a party to certain legal proceedings insettlement.
Relativity then filed a reorganization plan, which provided that the ordinary course of business, including proceedings relatingSeries E preferred stock would receive no consideration under the plan. We filed an objection to the enforcementplan. On February 2, 2016, at the hearing on confirmation Relativity’s plan, our Manager and Relativity reached a memorandum of understanding regarding a settlement of Relativity’s claims against our Manager and us, as well as our objection to the plan. On March 18, 2016, the Bankruptcy Court approved Relativity’s plan of reorganization, and the plan became effective on April 14, 2016.
On October 18, 2016, Relativity filed a motion with the Bankruptcy Court to approve a revised settlement with our Manager under Bankruptcy Rule 9019. Under the settlement, Relativity would dismiss all claims against our Manager and the funds it manages in consideration for the entry by Relativity into an Output Distribution Agreement with Divine Distribution, LLC, an affiliate of our rightsManager. Under the Output Distribution Agreement, Relativity agreed to grant two US output distribution slots per year for five years for films to be distributed by Relativity in exchange for a prescribed fee. The motion to approve the settlement agreement was withdrawn on January 23, 2017, by mutual agreement between our Manager and Relativity. Relativity’s confirmed plan provides that Relativity’s claims will be assigned to a trust established for its creditors under contracts withits plan of reorganization if they are not settled. However, on February 8, 2017, the principal secured lender to Relativity and Relativity’s co-manager filed a joint motion to convert Relativity’s case to Chapter 7 liquidation, citing an inability by Relativity to raise capital for its operations and significant defaults on its debts. A hearing on the conversion motion is currently scheduled for May 17, 2017. Given the uncertainty surrounding Relativity, it is not clear if the lawsuit against us and our portfolio companies. WhileManager will be pursued or dropped. In the outcomeevent the creditors trust elects to continue the case, our Manager intends to defend the case vigorously. Our Manager contends, among other things, that the parties never reached a binding agreement on the terms of these legal proceedings cannot be predicted with certainty, we doan investment and that Relativity has suffered no harm since it has obtained alternative financing to replace the financing it contends that our Manager did not expect that these proceedings will have a material effect upon our financial condition or results of operations.provide.
ITEM 4. MINE SAFETY DISCLOSURES
Not applicable.
| 37 |
ITEM 5. MARKET FOR REGISTRANT’S COMMON EQUITY, RELATED STOCKHOLDER MATTERS AND ISSUER PURCHASES OF EQUITY SECURITIES
Our authorized stock consists of 250,000,000 shares of stock, par value $0.001 per share, of which 200,000,000 shares are classified as common stock and 50,000,000 shares are classified as preferred stock. There is currently no market for our common stock, and we do not expect that a market for our shares will develop in the future. No stock has been authorized for issuance under any equity compensation plans. Under Maryland law, our stockholders generally will not be personally liable for our debts or obligations.
We are currently sellinglast sold our shares on ain our continuous basisoffering at a price of $10.15$8.75 per share; however, to the extent that our net asset value per share increases, we will sell at a price necessary to ensure that shares arehave not sold at a price per share, after deduction of selling commissions and dealer manager fees, that is below net asset value per share. Closings are typically semi-monthly.shares in our continuous offering since April 30, 2015. In connection with each closing on the sale of shares of our common stock pursuant to our prospectus, as amended or supplemented, which relates to our public offering of common stock on a continuous basis, our boardBoard of directorsDirectors or a committee thereof is required to make the determination that we are not selling shares of our common stock at a price per share, after deduction of selling commissions and dealer manager fees, that is below our then current net asset value per share within 48 hours of the time that we price our shares. Closings are typically monthly. For the year ended December 31, 2014, we had two price reductions of our offering price. On August 8, 2014, the Pricing Committee of our Board of Directors decreased the share price for new investments from $10.15 to $10.00 per share, and on November 18, 2014, the Pricing Committee of our Board of Directors decreased the share price for new investments from $10.00 to $9.75 per share. For the year ended December 31, 2015, we had one price reduction. On November 24, 2015, the Board of Directors of the Fund and the Pricing Committee of the Board made a final decision to approve a price reduction from $9.75 to $9.25 per share effective for the Funds next closing date and next declared distribution date. For the year ended December 31, 2016, we had one price reduction. On May 23, 2016, the Board of Directors of the Fund and the Pricing Committee of the Board made a final decision to approve a price reduction from $9.25 to $8.75 per share.
A decline in our net asset value per share to an amount more than 5.0% below our current offering price, net of selling commissions and dealer manager fees, creates a rebuttable presumption that there has been a material change in the value of our assets such that a reduction in the offering price per share is warranted. This presumption may only be rebutted if our boardBoard of directors,Directors, in consultation with its management, reasonably and in good faith determines that the decline in net asset value per share is the result of a temporary movement in the credit markets or the value of our assets, rather than a more fundamental shift in the valuation of our portfolio. In the event that (i) net asset value per share decreases to more than 5.0% below our current net offering price and (ii) our boardBoard of directorsDirectors believes that such decrease in net asset value per share is the result of a non-temporary movement in the credit markets or the value of our assets, the boardBoard of directorsDirectors will undertake to establish a new net offering price that is not more than 5.0% above our net asset value per share.
In the fiscal years ended 2015 and 2016, the net asset value of our common stock decreased to an amount more than 5% below our then current offering price. The declines resulted from three factors: overall declines in the market prices of high yield debt instruments; declines in the market value of specific positions that have defaulted or which the market perceives will need to restructure or the ones that have already been restructured into 144A private placement equity positions for which real pricing is not available; and as a result of distributions made to date in excess of net investment income. The Pricing Committee of our Board of Directors reviewed market data regarding movements in the credit markets, and the specific circumstances surrounding each of the positions in our portfolio which had experienced the greatest decline in value, including recent earnings announcements, collateral, priority in the capital structure, and current indications as to the terms of any restructuring. Based on that analysis, the Board of Directors determined that a reduction in our gross offering price to $9.25 per share in 2015 and then to $8.75 in 2016 accurately reflected the extent to which the decline was the result of non-temporary factors in the markets and specific positions. However, the current offering price of $8.75 is more than 5% greater than the net asset value per share of our common stock. Therefore, investors in our common stock will experience immediate dilution of their investments.
Set forth below is a chart describing the classes of our securities outstanding as of December 31, 2013:2016:
| Title of Class | Amount Authorized | Amount Issued | Amount Authorized | Amount Outstanding | ||||||||||||
| Common Stock, par value $0.001 per share | $ | 200,000,000 | 3,151,376 | $ | 200,000,000 | 6,337,606 | ||||||||||
During the three months ending December 31, 2016, we issued 36,897.85 shares of common stock for consideration of $306,713 under our dividend reinvestment program. As of December 31, 2013, gross proceeds from the sale of common stock were $31.6 million, including stock issued pursuant to the distribution reinvestment plan (“DRIP”) and the purchase made by our Manager for our initial capitalization. As of December 31, 2013,2016, we had 8921,530 record holders of our common stock.
As of December 31, 2012, gross proceeds from the sale of common stock were $9.5 million, including stock issued pursuant to the DRIP and the purchase made by our Manager for our initial capitalization. As of December 31, 2012, we had 263 record holders of our common stock.
Distributions
Subject to our boardBoard of director'sDirector’s discretion and applicable legal restrictions, we authorizehave historically declared and declarepaid ordinary cash distributions at a rate equal to 7.35% of our latest offering price per share. Since the distribution paid to shareholders on September 30, 2015, with a record date of August 30, 2015, we have paid distributions monthly. Prior to the September 30, 2015, we paid distributions on a semi-monthly basis and pay suchbasis. We changed to paying distributions on a semi-monthly basis.monthly in order to reduce costs. Any distributions to our shareholders will be declared out of assets legally available for distribution. We may fund our cash distributions to shareholders from any sources of funds available to us, including offering proceeds, borrowings, net investment income from operations, capital gains proceeds from the sale of assets, non-capital gains proceeds from the sale of assets, and dividends or other distributions paid to us on account of preferred and common equity investments in portfolio companies. We have not established limits on the amount of funds we may use from available sources to make distributions.
| 38 |
When we commenced
Based upon our current level of operations, we initiated a policy of declaring semi-monthly distributions at an annual distribution rate of 7.35% per annumestimate that about 85.3% of our offering price. We have authorized, declared and paid distributions to our shareholders at that rate onwill constitute a semi-monthly basis since July 2012.return of capital. Our distributions historically have not been based on our investment performance. Prior to September 2013, our distributions were supported by our Manager in the form of operating expense support payments to us, and a portion of our distributions constituted a return of capital. Since September 2013, we have not had an expense support agreement with our Manager and as a result a greater portion of our distributions have constituted a return of capital. A return of capital generally is a return of your investment rather than a return of earnings or gains derived from our investment activities constitutes the return of capital previously paid to us for shares of our common stock.
The following table shows the percentage of our distributions, which have been funded from net investment income, realized capital gains and paid inreturn of capital since the inception of operations:
| Net | Realized | |||||||||||||||||||||||||||||||
| Investment | Gain From | Return of | ||||||||||||||||||||||||||||||
| Period | Per Share | Income | Investments | Capital | Per Share | Net Investment Income | Realized Gain From Investments | Return of Capital | ||||||||||||||||||||||||
| July 12, 2012 - September 30, 2012 | $ | 0.18375 | 64 | % | 0 | % | 36 | % | $ | 0.183750 | 64 | % | — | % | 36 | % | ||||||||||||||||
| October 1, 2012 - December 31, 2012* | 0.26075 | 59 | % | 0 | % | 41 | % | 0.260750 | 59 | % | — | % | 41 | % | ||||||||||||||||||
| January 1, 2013 - March 31, 2013 * | 0.26259 | 67 | % | 13 | % | 20 | % | |||||||||||||||||||||||||
| January 1, 2013 - March 31, 2013* | 0.262586 | 67 | % | 13 | % | 20 | % | |||||||||||||||||||||||||
| April 1, 2013 - June 30, 2013 | 0.18650 | 77 | % | 14 | % | 9 | % | 0.186504 | 77 | % | 14 | % | 9 | % | ||||||||||||||||||
| July 1, 2013 - September 30, 2013 | 0.18650 | 51 | % | 10 | % | 39 | % | 0.186504 | 51 | % | 10 | % | 39 | % | ||||||||||||||||||
| October 1, 2013 - December 31, 2013 | 0.18650 | 13 | % | 47 | % | 40 | % | 0.186504 | 4 | % | 47 | % | 49 | % | ||||||||||||||||||
| January 1, 2014 - March 31, 2014 | 0.186504 | 27 | % | 13 | % | 60 | % | |||||||||||||||||||||||||
| April 1, 2014 - June 30, 2014 | 0.186504 | 49 | % | — | % | 51 | % | |||||||||||||||||||||||||
| July 1, 2014 - September 30, 2014 | 0.184668 | 17 | % | 3 | % | 80 | % | |||||||||||||||||||||||||
| October 1, 2014 - December 31, 2014 | 0.181467 | 15 | % | 6 | % | 79 | % | |||||||||||||||||||||||||
| January 1, 2015 - March 31, 2015 | 0.179154 | 15 | % | 5 | % | 80 | % | |||||||||||||||||||||||||
| April 1, 2015 - June 30, 2015 | 0.179154 | 63 | % | 15 | % | 22 | % | |||||||||||||||||||||||||
| July 1, 2015 - September 30, 2015 | 0.209015 | 19 | % | 11 | % | 70 | % | |||||||||||||||||||||||||
| October 1, 2015 - December 31, 2015 ** | 0.170315 | — | % | 6 | % | 94 | % | |||||||||||||||||||||||||
| January 1, 2016 – March 31, 2016 *** | 0.169969 | 1 | % | — | % | 99 | % | |||||||||||||||||||||||||
| April 1, 2016 – June 30, 2016**** | 0.107188 | — | % | — | % | 100 | % | |||||||||||||||||||||||||
| July 1, 2016 – September 30, 2016***** | 0.214372 | 23 | % | — | % | 77 | % | |||||||||||||||||||||||||
| October 1, 2016 – December 31, 2016 | 0.107186 | 24 | % | 11 | % | 65 | % | |||||||||||||||||||||||||
(*)* Includes a special distribution of $0.077 per share.
** For the period from October 31, 2015 to December 31, 2015, the Fund had a net investment loss of approximately $268 thousand. That amount is reflected on the source of distributions table below in the distributions from paid in capital amount.
*** For the period from January 1, 2016 to March 31, 2016, the Fund had a realized loss from investments of approximately $700 thousand. That amount is reflected on the source of distributions table below in the distributions from paid in capital amount.
**** For the period from April 1, 2016 to June 30, 2016, the Fund had a net investment loss of approximately $4 thousand and a realized loss from investments of approximately $12.6 million. These amounts are reflected on the source of distributions table below in the distributions from paid in capital amount. The allocation of the distributions between net investment income and return of capital are different than previously reported as a result of the correction of an accounting error. For further detail, please see Item 9A Controls and Procedures.
***** For the period from July 1, 2016 to September 30, 2016, the Fund had a realized loss from investments of approximately $0.04 million. That amount is reflected on the source of distributions table below in the distributions from paid in capital amount. The allocation of the distributions between net investment income and return of capital are different than previously reported as a result of the correction of an accounting error. For further detail, please see Item 9A Controls and Procedures.
We expect to continue making distributions at the same distribution rate, based on the current offering price, unless our results of operations, our general financial condition, general economic conditions, or other factors prohibit us from doing so. From time to time, but not less than quarterly, we review our accounts to determine whether distributions to our shareholders are appropriate. There can be no assurance that we will be able to sustain distributions at any particular level.
| 39 |
Each year a statement on Internal Revenue Service Form 1099-DIV (or such successor form) identifying the source of the distribution (i.e., paid from ordinary income, paid from net capital gain on the sale of securities, or a return of capital) will be mailed to our shareholdersshareholders.We expect to continue paying distributions at the same distribution rate, based on the current offering price, and that a substantial part of those distributions will constitute a return of capital for the foreseeable future. Furthermore, our ability to generate net investment income sufficient to cover our monthly dividend has been hindered by the fact that we have a number of portfolio investments that are on non-accrual status, and because we hold more equity investments that do not generate regular interest or dividend income.Our distributions will continue to constitute a return of capital until our net investment income is sufficient to support our distribution rate, which will probably not occur until our Manager enters into an expense support agreement with us, our mix of interest and dividend paying assets increase, or our assets increase enough to lower our expense ratio, which we do not expect to occur until we have significantly more assets than $100 million in assets, neither of which may ever occur.we do at present. As a result, for the foreseeable future, a portion of the distributions we make will represent a return of capital for tax purposes. The tax basis of shares must be reduced by the amount of any return of capital distributions, which will result in an increase in the amount of any taxable gain (or a reduction in any deductible loss) on the sale of shares.
The determination of the tax attributes of our distributions is made annually as of the end of our fiscal year based upon our taxable income for the full year and distributions paid for the full year. Therefore, a determination made on a quarterly basis may not be representative of the actual tax attributes of our distributions for a full year. The actual tax characteristics of distributions to shareholders are reported to shareholders annually on a Form 1099-DIV.
We have elected to be treated, beginning with our taxable year ended December 31, 2012,2013, as a RIC under the Code. To obtain and maintain RIC tax treatment, we must, among other things, distribute at least 90% of our net ordinary income and net short-term capital gains in excess of net long-term capital losses, if any, to our shareholders. In order to avoid certain excise taxes imposed on RICs, we currently intend to distribute during each calendar year an amount at least equal to the sum of: (i) 98% of our ordinary income for the calendar year, (ii) 98.2% of our capital gains in excess of capital losses for the one-year period generally ended on October 31 of the calendar year (unless an election is made by us to use our taxable year) and (iii) any ordinary income and net capital gains for preceding years that were not distributed during such years and on which we paid no federal income tax.
The determinationfollowing table reflects the sources of the tax attributes of ourcash distributions is made annually as of the end of our fiscal year based upon our taxable income for the full year and distributions paid for the full year. Therefore, a determination made on a quarterlytax basis may not be representative ofthat the actual tax attributes of our distributions for a full year. The actual tax characteristics of distributions to shareholders are reported to shareholders annuallyFund has paid on a Form 1099-DIV.its common stock (dollars in thousands) during the fiscal years ended December 31, 2016, 2015 and 2014:
| Source of Distributions: | Year ended December 31, 2016 | Year ended December 31, 2015 | Year ended December 31, 2014 | |||||||||||||||||||||
| Distributions from net investment income | $ | 473 | 12.6 | % | $ | 830 | 18.5 | % | $ | 819 | 26.1 | % | ||||||||||||
| Distributions from realized gains | 78 | 2.1 | % | 425 | 9.5 | % | 166 | 5.3 | % | |||||||||||||||
| Distributions from paid in capital | 3,195 | 85.3 | % | 3,235 | 72.0 | % | 2,153 | 68.6 | % | |||||||||||||||
| Total | $ | 3,746 | 100.0 | % | $ | 4,490 | 100.0 | % | $ | 3,138 | 100.0 | % | ||||||||||||
Distribution Reinvestment Plan
We have adopted an “opt-in” distribution reinvestment plan (“DRIP”) pursuant to which youshareholders may elect to have the full amount of yourtheir cash distributions reinvested in additional shares of our common stock. If youthey wish to receive yourtheir distribution in cash, no action will be required on yourtheir part to do so. There will be no selling commissions, dealer manager fees or other sales charges to youshareholders if youthey elect to participate in the distribution reinvestment plan. We will pay the plan administrator’s fees under the plan. YourDRIP. Shareholders distribution amount will purchase shares of our common stock at 95% of the price that the shares are sold in the offering at the closing immediately following the distribution date.offered pursuant to our effective registration statement for our continuous public offering. Shares issued pursuant to our distribution reinvestment plan will have the same voting rights as our shares of common stock offered.offered pursuant to our prospectus.
The following table reflects the sources of the cash distributions on a tax basis that the Company has paid on its common stock (dollars in thousands) during the fiscal years ended December 31, 2013 and 2012:
| Year ended | Year ended | |||||||||||||||
| Source of Distributions: | December 31, 2013 | December 31, 2012 | ||||||||||||||
| (Restated) | (Restated) | |||||||||||||||
| Distributions from net investment income | $ | 798 | 47.0 | % | $ | 150 | 60.0 | % | ||||||||
| Distributions from realized gains | 395 | 23.3 | % | - | 0.0 | % | ||||||||||
| Distributions from paid in capital | 504 | 29.7 | % | 100 | 40.0 | % | ||||||||||
| Total | $ | 1,697 | 100.0 | % | $ | 250 | 100.0 | % | ||||||||
We are in a fund raising stage. As such, we incur offering expenses of 1.5% of the gross offering proceeds. The chart below shows the percentages of distributions from Net Investment Income excluding offering costs:
| Offering Expenses | Net Investment Income excluding offering costs | % Distribution from Net Investment Income excluding offering costs | % Distributions from Realized Gains excluding offering costs | % Distributions from Paid In Capital excluding offering costs | ||||||||||||||||
| 2013 (Restated) | $ | 322 | $ | 1,120 | 66 | % | 23 | % | 11 | % | ||||||||||
| 2012 (Restated) | $ | 142 | $ | 292 | 100 | % | 0 | % | 0 | % | ||||||||||
ITEM 6. SELECTED FINANCIAL DATA
The following selected financial data as of and for the yearsyear ended December 31, 2013 and December 31, 2012 and for the period from August 3, 2011 (date of inception) to December 31, 20112016 is derived from our financial statements, which havehas been audited by Burr Pilger Mayer, Inc.,OUM & Co. LLP, our independent registered public accounting firm as stated in their report. The selected financial data as of and for the years ended December 31, 2015, 2014, 2013, and 2012 was derived from our financial statements, which was audited by BPM LLP. The data should be read in conjunction with our financial statements and related notes thereto and “Item 7. Management’s Discussion and Analysis of Financial Condition and Results of Operations” included elsewhere in this Annual Report on Form 10-K/Areport (dollars in thousands except share and per share data):
| For the Year Ended December 31, 2013 | For the Year Ended December 31, 2012 | For the Period from August 3, 2011 (Date of Inception) to December 31, 2011 | ||||||||||
| (Restated) | (Restated) | (Restated) | ||||||||||
| Statement of operations data: | ||||||||||||
| Total investment income | $ | 1,659 | $ | 146 | $ | - | ||||||
| Operating expenses | ||||||||||||
| Total expenses | 1,637 | 520 | 4 | |||||||||
| Less: Expense waivers and reimbursements | (776 | ) | (524 | ) | - | |||||||
| Net expenses (income) | 861 | (4 | ) | 4 | ||||||||
| Net investment income (loss) | 798 | 150 | (4 | ) | ||||||||
| Realized and unrealized gain (loss), net | (101 | ) | (119 | ) | - | |||||||
| Net increase (decrease) in net assets resulting from operations | $ | 697 | $ | 31 | $ | (4 | ) | |||||
| Per share data - basic and diluted: | ||||||||||||
| Net investment income (loss) | $ | 0.37 | $ | 0.61 | $ | (44.44 | ) | |||||
| Net realized and unrealized gain (loss) on investments | $ | (0.05 | ) | $ | (0.48 | ) | $ | - | ||||
| Net increase (decrease) in net assets resulting from operations | $ | 0.32 | $ | 0.13 | $ | (44.44 | ) | |||||
| Distributions declared | $ | (0.79 | ) | $ | (1.02 | ) | $ | - | ||||
| Balance sheet data: | ||||||||||||
| Investments at fair value | $ | 23,154 | $ | 5,823 | $ | - | ||||||
| Investments in money market funds - at fair value | $ | 1,644 | $ | 1,304 | $ | 201 | ||||||
| Total assets | $ | 27,764 | $ | 8,548 | $ | 201 | ||||||
| Total liabilities | $ | 340 | $ | 212 | $ | 4 | ||||||
| Total net assets | $ | 27,424 | $ | 8,336 | $ | 197 | ||||||
| Other data: | ||||||||||||
| Total return | 7.72 | % | 10.98 | % | - | % | ||||||
| Number of portfolio company investments at period end | 39 | 22 | - | |||||||||
| Total portfolio investments for the period | $ | 27,685 | $ | 7,166 | $ | - | ||||||
| Investment sales and prepayments for the period | $ | 10,314 | $ | 1,250 | $ | - | ||||||
| 40 |
| As of and for the Year Ended December 31, 2016 | As of and for the Year Ended December 31, 2015 | As of and for the Year Ended December 31, 2014 | As of and for the Year Ended December 31, 2013 | As of and for the Year Ended December 31, 2012 | ||||||||||||||||
| Statement of operations data: | ||||||||||||||||||||
| Total investment income | $ | 3,120 | $ | 3,512 | $ | 3,260 | $ | 1,659 | $ | 146 | ||||||||||
| Operating expenses | ||||||||||||||||||||
| Total expenses | 2,651 | 2,682 | 2,441 | 1,637 | 520 | |||||||||||||||
| Less: Expense waivers and reimbursements | - | - | - | (776 | ) | (524 | ) | |||||||||||||
| Net expenses (income) | 2,651 | 2,682 | 2,441 | 861 | (4 | ) | ||||||||||||||
| Net investment income | 469 | 830 | 819 | 798 | 150 | |||||||||||||||
| Realized and unrealized gain (loss), net | 7,145 | (14,189 | ) | (6,093 | ) | (101 | ) | (119 | ) | |||||||||||
| Net increase (decrease) in net assets resulting from operations | $ | 7,614 | $ | (13,359 | ) | $ | (5,274 | ) | $ | 697 | $ | 31 | ||||||||
| Per share data - basic and diluted: | ||||||||||||||||||||
| Net investment income | $ | 0.07 | $ | 0.14 | $ | 0.19 | $ | 0.37 | $ | 0.61 | ||||||||||
| Net realized and unrealized gain (loss) on investments | $ | 1.15 | $ | (2.34 | ) | $ | (1.42 | ) | $ | (0.05 | ) | $ | (0.48 | ) | ||||||
| Net increase (decrease) in net assets resulting from operations | $ | 1.22 | $ | (2.20 | ) | $ | (1.23 | ) | $ | 0.32 | $ | 0.13 | ||||||||
| Distributions declared | $ | (0.60 | ) | $ | (0.74 | ) | $ | (0.73 | ) | $ | (0.79 | ) | $ | (1.02 | ) | |||||
| Balance sheet data: | ||||||||||||||||||||
| Investments at fair value | $ | 40,345 | $ | 26,722 | $ | 37,428 | $ | 23,154 | $ | 5,823 | ||||||||||
| Investments in money market funds – at fair value | $ | 157 | $ | 6,210 | $ | 3,104 | $ | 1,644 | $ | 1,304 | ||||||||||
| Total assets | $ | 41,219 | $ | 33,689 | $ | 42,381 | $ | 27,764 | $ | 8,548 | ||||||||||
| Total liabilities | $ | 7,537 | $ | 5,199 | $ | 1,693 | $ | 340 | $ | 212 | ||||||||||
| Total net assets | $ | 33,682 | $ | 28,490 | $ | 40,688 | $ | 27,424 | $ | 8,336 | ||||||||||
| Other data: | ||||||||||||||||||||
| Total return | 23.62 | % | (31.96 | )% | (8.88 | )% | 7.72 | % | 10.98 | % | ||||||||||
| Number of portfolio company investments at period end | 29 | 33 | 45 | 39 | 22 | |||||||||||||||
| Total portfolio investments for the year | $ | 36,545 | $ | 23,245 | $ | 31,308 | $ | 27,685 | $ | 7,166 | ||||||||||
| Investment sales and prepayments for the year | $ | 30,593 | $ | 19,688 | $ | 11,765 | $ | 10,314 | $ | 1,250 | ||||||||||
| 41 |
ITEM 7. MANAGEMENT'SMANAGEMENT’S DISCUSSION AND ANALYSIS OF FINANCIAL CONDITION AND RESULTS OF OPERATIONOPERATIONS
The following discussion should be read in conjunction with the accompanying financial statements of VII Peaks Co-Optivist Income BDC II, Inc., and the notes thereto. As used herein, the terms “we,“we”, “us,” “our” and “us”the “Fund” refer to VII Peaks Co-Optivist Income BDC II, Inc., a Maryland corporation and, as required by context to VII Peaks Advisor II,Capital, LLC (the “Manager”), which serves as our investment adviser and administrator. We are externally managed by our Manager.
Overview
We invest in discounted corporate debt, senior secured term loan and equity-linked debt securities of publiccompanies that have a perceived risk of near term liquidity issues but have solid business fundamentals and private companies whoseprospects, including historical revenue growth, positive cashflow, significant and sustainable market presence, and sufficient asset coverage. We take a principal position in discounted debt securities trade on the secondary loan market for institutional investors and provide distributions to investors. At the same time, we actively work with the target company’s management to restructureprimary goal of restructuring the underlying securities and improve the liquidity positionterms of the target company’s balance sheet. We employ a proprietary “Co-OptivistTM ” approach (“cooperative activism”, Co-OptivistTM is a registered trademark of VII Peaks Capital, LLC, or VII Peaks, and is being used with their permission) in executing our investment strategy, which entails proactively engagingdebt to allow the target company management on average 24 months prior to increase its liquidity and strengthen its balance sheet. Our typical target company has a debt redemption event (typically either a put or maturity event) on average within 24 months of our investment and has experienced a significant decline in its equity value reflective of a highly leverage capital structure or general market conditions. We believe that proactively guiding such companies to create an opportunityrestructure their debt will allow them to increase liquidity and free up resources to grow their businesses rather than focusing on managing their debt obligations. We also believe that our involvement can allow the target company more flexibility to explore strategic alternatives, since the terms of the existing debt structure often limits strategic options for growth in the investments. Our strategy is not dependent on restructuringtarget company.In addition, we also provide direct loans with equity warrant coverage to generate distributions.portfolio companies to help facilitate corporate expansion.
Our investment objectivesactivities are to generate current income and capital appreciation. We meetmanaged by our Manager. Our Manager is responsible for sourcing potential investments, conducting research on prospective investments, analyzing investment objectives by: (i) realizing income and capital appreciation through the acquisition, management and orderly liquidation of corporate debt securities, (ii) making distributions of available distributable cash toopportunities, structuring our shareholders, and (iii) preserving the capital investments of our stockholders.
We make investments in target companies that meet our investment criteria. The size of an individual investment will vary based on numerous factors, including the amount of funds raised in our offering. However, assuming we raise the maximum offering amount of $750.0 million, we expect to hold at least 50 investments, and we anticipate that the minimum investment size will be approximately $0.25 million. We do not anticipate being heavily invested in any one industry,monitoring our investments and generally, we do not expect to invest in more than two different classes of debt of the same Target Investment. We invest in debt and equity-linked debt of targetportfolio companies with a minimum enterprise value of $200.0 million and whose debt and equity-linked debt is actively traded in the secondary loan market. We expect our portfolio to be predominantly composed of fixed-rate high-yield and equity-linked corporate debt securities. However, we may also purchase senior secured corporate debt securities which may have variable interest rates. We currently anticipate that the portion of our portfolio composed of variable rate corporate debt securities, if any, will not exceed 20%, but we may increase that to 33% of our aggregate portfolio at the time of any purchase depending on market opportunities.
We offer our stockholders the ability to receive distributions as well as the potential capital appreciation resulting from the restructuring of the debt of our target companies. To the extent we have distributable income available we anticipate declaring distributions with a semi-monthly record and payment datean ongoing basis. We declared and paid distributions beginning in August 2012 at $0.03063 per share each (an annualized rate of 7.35% based on our initial public offering price of $10.00 per share) to stockholders. On December 27, 2012, for shareholders of record on December 27, 2012, and a payable date of January 17, 2013, the board of directors authorized a special distribution of $0.07664 per share, together with the routine distribution of $0.03063 per share for a total one time annualized return of 8.11%.
Please see Part II, Item 8. “Financial Statements and Supplementary Data” for a detailed description of Distributions in the Notes to Financial Statements.
Our Manager has an investment committee that is responsible for reviewing, discussing and approving each investment opportunity we seek to pursue. Our investment committee meets routinely to discuss new and existing opportunities and developments on current investments. Our investment committee currently
Summary of Significant Accounting Policies
Basis of Presentation
The financial statements of the Fund included herein were prepared in conformity with accounting principles generally accepted in the United States of America ("U.S. GAAP") and with the instructions to Form 10-K and Articles 6 or 10 of Regulation S-X. Accordingly, and include all of the information and footnotes required by U.S. GAAP for complete financial statements. In the opinion of management, these financial statements include all adjustments, consisting only of normal recurring adjustments and accruals, necessary for a fair presentation of the results for the period. The Fund is led by Mr. Chandhoke, our Chief Executive Officer,a single reportable segment.
Use of Estimates in the Preparation of Financial Statements
The preparation of the accompanying financial statements in conformity with Mr. Shea, Managing PartnerU.S. GAAP requires management to make estimates and assumptions that affect the reported amounts of VII Peaks Capital, LLC.assets and liabilities, and disclosure of contingent assets and liabilities at the date of the financial statements, and income, gains (losses) and expenses during the period reported. Actual results could differ materially from those estimates.
Investments - Money Market
The Fund has classified its money market investments as investments carried at fair value.
Investment Classification
The Fund classifies its investments in accordance with the requirements of the 1940 Act. Under the 1940 Act, “Control Investments” are defined as investments in companies in which we own more than 25.0% of the voting securities or maintain greater than 50.0% of the board representation. Under the 1940 Act, “Affiliated Investments” are defined as those non-control investments in companies in which we own between 5.0% and 25.0% of the voting securities. Under the 1940 Act, “Non-affiliated Investments” are defined as investments that are neither Control Investments nor Affiliated Investments.
| 42 |
Critical Accounting Policies
The financial statements are prepared in accordance with accounting principles generally accepted in the United States of America (“U.S. GAAP”), which require us to make estimates and judgments that affect the reported amounts of assets, liabilities, revenues and expenses, and related disclosure of contingent assets and liabilities. On an on-going basis, we evaluate our estimates, including those related to the valuation of portfolio securities. We base our estimates on historical experience and on various other assumptions that are believed to be reasonable under the circumstances, the results of which form the basis for making judgments about the carrying values of assets and liabilities that are not readily apparent from other sources. Actual results could differ from those estimates. We believe the following critical accounting policies affect our more significant judgments and estimates used in the preparation of our financial statements.
Organizational and Offering Costs
The Fund is a closed-end fund with a continuous offering period. Under the investment advisory agreement between the Fund and the Manager, our Manager fronts the initial cost of the organizational and offering expenses, but the Fund is obligated to reimburse the Manager for such costs to the extent of 1.5% of the gross offering proceeds in our continuous offering. The Fund also agreed to reimburse the Manager for organization and offering expenses incurred by a prior manager in consideration for the Manager’s agreement to pay $1.3 million owed to the Fund by the prior manager under an expense reimbursement agreement, which amount the Manager paid in full during the year ended December 31, 2014. The Fund expenses organizational and offering costs as they become payable under the investment advisory agreement.
U.S. Federal Income Taxes
The Fund has elected to be treated for federal income tax purposes as a RIC under Subchapter M of the Code and to operate in a manner so as to qualify for the tax treatment applicable to RICs. In order to qualify as a RIC, among other things, the Fund is required to annually distribute to its stockholders at least 90% of investment company taxable income, as defined by the Code. So long as the Fund maintains its status as a RIC, it generally will not pay corporate-level U.S. federal income taxes on any ordinary income or capital gains that it distributes at least annually to its stockholders as distributions. Rather, any tax liability related to income earned by the Fund represents obligations of the Fund’s investors and will not be reflected in the financial statements of the Fund. The Fund will also be subject to nondeductible federal excise taxes if it does not distribute at least 98% of net ordinary income, 98.2% of capital gain net income, if any, and any recognized and undistributed income from prior years for which it paid no federal income taxes.
The Fund has evaluated the implications of Accounting Standards Codification (“ASC”) Topic 740,Accounting for Income Taxes, (“ASC Topic 740”) for all tax years and in all major tax jurisdictions, and determined that there is no material impact on the financial statements.
Valuation of Portfolio Investments
We have adopted Financial Accounting Standards Board (“FASB”), ASC Topic 820,Fair Value Measurements and Disclosures (“ASC Topic 820”), which defines fair value, establishes a framework for measuring fair value in accordance with U.S. GAAP and expands disclosures about fair value measurements.
ASC Topic 820 clarifies that the exchange price is the price in an orderly transaction between market participants to sell an asset or transfer a liability in the market in which the reporting entity would transact for the asset or liability, that is, the principal or most advantageous market for the asset or liability. The transaction to sell the asset or transfer the liability is a hypothetical transaction at the measurement date, considered from the perspective of market participants. ASC Topic 820 provides a consistent definition of fair value which focuses on exit price and prioritizes, within a measurement of fair value, the use of market-based inputs over entity-specific inputs. In addition, ASC Topic 820 provides a framework for measuring fair value and establishes a three-level hierarchy for fair value measurements based upon the transparency of inputs to the valuation of an asset or liability as of the measurement date. The three levels of valuation hierarchy established by ASC Topic 820 are defined as follows:
| Level 1: | Quoted prices in active markets for identical assets or liabilities, accessible by the Fund at the measurement date. |
| Level 2: | Quoted prices for similar assets or liabilities in active markets, or quoted prices for identical or similar assets or liabilities in markets that are not active, or other observable inputs other than quoted prices. US Bank is the Fund custodian. Through US Bank, the Fund uses FT Interactive, a third-party valuation firm, to price the notes. The prices are reviewed by the CEO. |
| Level 3: | Unobservable inputs for the asset or liability. |
The investment portfolio is recorded on a trade date basis. We determine the net asset value of our investment portfolio each quarter. Securities that are publicly-traded are valued at the reported closing price on the valuation date. Twenty of the forty-seven investments were valued using the closing market price at year end December 31, 2016.
| 43 |
The following table presents investments that were not valued using the closing market price, as of December 31, 2016:
| Portfolio Company | Asset Type | Investment Coupon Rate | Maturity Date | |||||
| Ansgar Media, LLC - Class B Units | Equity – Preferred Stock | - | - | |||||
| Ansgar Media, LLC | Senior Secured First Lien Debt | 12.00 | % | September 18, 2017 | ||||
| Ansgar Media, LLC | Senior Secured First Lien Debt | 12.00 | % | January 11, 2018 | ||||
| Ansgar Media, LLC | Senior Secured First Lien Debt | 12.00 | % | October 24, 2018 | ||||
| Ansgar Media, LLC | Senior Secured First Lien Debt | 12.00 | % | October 27, 2018 | ||||
| Aspire Holdings(1) | Equity – Common Stock | - | - | |||||
| Aspect Software, Inc.(2) | Equity – Common Stock | - | - | |||||
| Claire’s Stores, Inc. Term Loan.(3) | Senior Secured First Lien Debt | 9.00 | % | September 20, 2021 | ||||
| CLSIP, LLC Term Loan(3) | Senior Secured First Lien Debt | 9.00 | % | September 20, 2021 | ||||
| Claire’s (Gibraltar) Holdings Limited Term Loan(3) | Senior Unsecured Debt | 9.00 | % | September 20, 2021 | ||||
| Colt Defense, LLC(4) | Senior Unsecured Debt | 8.00 | % | July 12, 2021 | ||||
| Education Management, LLC | Equity – Common Stock | - | - | |||||
| Education Management, LLC | Warrant | - | - | |||||
| GeoCommerce, Inc. | Senior Secured First Lien Debt | 12.00 | % | April 27, 2018 | ||||
| GeoCommerce, Inc. | Senior Secured First Lien Debt | 12.00 | % | May 15, 2018 | ||||
| GeoCommerce, Inc. | Senior Secured First Lien Debt | 12.00 | % | October 14, 2018 | ||||
| GeoCommerce, Inc. | Senior Secured First Lien Debt | 12.00 | % | December 21, 2018 | ||||
| GeoCommerce, Inc. | Warrant | - | - | |||||
| Logan’s Roadhouse, Inc.(5) | Senior Secured Second Lien Debt | 10.75 | % | October 15, 2017 | ||||
| Logan’s Roadhouse, Inc. PIK Exit Facility Term Loan(5) | Senior Secured Second Lien Debt | 9.50 | % | November 23, 2020 | ||||
| Nima, LLC | Senior Secured First Lien Debt | 12.00 | % | May 20, 2018 | ||||
| Nima, LLC | Senior Secured First Lien Debt | 12.00 | % | August 11, 2018 | ||||
| Nima, LLC | Senior Secured First Lien Debt | 12.00 | % | November 2, 2018 | ||||
| Nima, LLC | Senior Secured First Lien Debt | 12.00 | % | December 21, 2018 | ||||
| Nima, LLC | Warrant | - | - | |||||
| Nuverra Environmental Solutions, Inc. | Senior Secured Second Lien Debt | 12.50 | % | April 15, 2022 | ||||
| Nuverra Environmental Solutions, Inc. | Warrant | - | - | |||||
| (1) | Converted from exchange of 12.00% Endeavour International Corp, senior secured first lien debt. |
| (2) | The original 10.63% senior secured second lien notes due on May 15, 2017 defaulted. As part of Aspect’s bankruptcy and planned reorganization process, the Fund participated in a rights offering to purchase a new 3.00% PIK senior unsecured convertible note maturing on May 23, 2023 in an effort to facilitate recovery of its previous investment in the senior secured lien notes in Aspect. On November 25, 3.00% PIK senior unsecured convertible notes were exchanged out for mandatory conversion to shares of common stock of Aspect Software Parent, Inc. at a rate of 1/30 i.e. one common share per $30.00 in principal amount of notes outstanding. |
| (3) | On September 20, 2016, all of 10.50% senior subordinated notes and 8.88% senior secured second lien notes were exchanged for 9.00% of Claire’s Stores, Inc. Term Loan, CLSIP Term Loans and of Claire’s Gibralter Term Loans. |
| (4) | On January 19, 2016, there was a mandatory exchange offer to exchange all of the 8.75% senior unsecured notes to 8.00% PIK third lien notes. |
| (5) | The company filed for bankruptcy in Delaware on August 8, 2016, and is in the final stages of restructuring. The Fund participated in DIP financing as part of company’s restructuring process during bankruptcy and has received PIK Second Lien Exit Facility T/L in exchange. The Fund also participated in Equity exchange which is still in process and is expected to complete soon. |
Securities that are not publicly-traded are valued at fair value as determined in good faith by our boardBoard of directors.Directors, or a committee thereof. In connection with that determination, our Manager prepares portfolio company valuations using relevant inputs, including, but not limited to, indicative dealer quotes, values of like securities, the most recent portfolio company financial statements and forecasts, and valuations prepared by third-party valuation services.
With respect to investments for which market quotations are not readily available, we will undertake a multi-step valuation process each quarter, as described below:
Investments are valued utilizing a market approach, an income approach, or both approaches, as appropriate. The market approach uses prices and other relevant information generated by market transactions involving identical or comparable assets or liabilities (including a business). The income approach uses valuation techniques to convert future amounts (for example, cash flows or earnings) to a single present value amount (discounted) calculated based on an appropriate discount rate. The measurement is based on the net present value indicated by current market expectations about those future amounts. In following these approaches, the types of factors that we may take into account in fair value pricing our investments include, as relevant: available current market data, including relevant and applicable market trading and transaction comparables, applicable market yields and multiples, security covenants, call protection provisions, information rights, the nature and realizable value of any collateral, the portfolio company’s ability to make payments, its earnings and discounted cash flows, the markets in which the portfolio company does business, comparisons of financial ratios of peer companies that are public, M&A comparables, the principal market and enterprise values, among other factors.
We have adopted Financial Accounting Standards Board, or FASB, Accounting Standards Codification, or ASC, Topic 820,Fair Value Measurements and Disclosures (formerly Statement of Financial Accounting Standards No. 157,Fair Value Measurements ), which defines fair value, establishes a framework for measuring fair value in accordance with generally accepted accounting principles and expands disclosures about fair value measurements.
ASC Topic 820 clarifies that the exchange price is the price in an orderly transaction between market participants to sell an asset or transfer a liability in the market in which the reporting entity would transact for the asset or liability, that is, the principal or most advantageous market for the asset or liability. The transaction to sell the asset or transfer the liability is a hypothetical transaction at the measurement date, considered from the perspective of market participants. ASC Topic 820 provides a consistent definition of fair value which focuses on exit price and prioritizes, within a measurement of fair value, the use of market-based inputs over entity-specific inputs. In addition, ASC Topic 820 provides a framework for measuring fair value and establishes a three-level hierarchy for fair value measurements based upon the transparency of inputs to the valuation of an asset or liability as of the measurement date. The three levels of valuation hierarchy established by ASC Topic 820 are defined as follows:
Level 1: Quoted prices in active markets for identical assets or liabilities, accessible by the Fund at the measurement date.
Level 2: Quoted prices for similar assets or liabilities in active markets, or quoted prices for identical or similar assets or liabilities in markets that are not active, or other observable inputs other than quoted prices.
Level 3: Unobservable inputs for the asset or liability.
In all cases, the level in the fair value hierarchy within which the fair value measurement in its entirety falls has been determined based on the lowest level of input that is significant to the fair value measurement.
Revenue Recognition
Securities transactions are accounted for on the trade date. We generate investment income in the form of interest, dividend and fees earned on senior secured loans, senior secured notes, subordinated debt, senior unsecured debt, senior unsecured convertible debt and collateralized securities in our portfolio. The level of income we receive is directly related to the balance of collectible income producing investments multiplied by the coupon rate of our investments. Coupon interest income is adjusted for the amortization of premiums and accretion of discounts. We record interest income on an accrual basis to the extent that we expect to collect such amounts. The Fund stops accruing when the invested company defaults in payment and has passed the 30-day grace period, files for bankruptcy or goes through reorganization converting bonds to equity. We expect the dollar amount of interest and any dividend income that we earn to increase as the size of our investment portfolio increases.
Dividend income is recognized on the ex-dividend date for common equity securities and on an accrual basis for preferred equity securities to the extent that such amounts are expected to be collected or realized. In determining the amount of dividend income to recognize, if any, from cash distributions on common equity securities, we will assess many factors including a portfolio company’s cumulative undistributed income and operating cash flow. Cash distributions from common equity securities received in excess of such undistributed amounts are recorded first as a reduction of our investment and then as a realized gain on investment. We stop accruing interest or dividends on our investments when it is determined that the interest or dividend is not collectible. We assess the collectability of the interest and dividends based on many factors including the portfolio company’s ability to service our loan based on current and projected cash flows as well as the current valuation of the portfolio company’s current total enterprise value. For investments with payment-in-kind (“PIK”) interest and cumulative dividends, we base income and dividend accruals on the valuation of the PIK notes or securities received from the borrower or the redemption value of the security. If the portfolio company valuation indicates a value of the PIK notes or securities or redemption value that is not sufficient to cover the contractual interest or dividend, we will not accrue interest or dividend income on the notes or securities and will record an allowance for any accrued interest or dividend receivable as a reduction of interest or dividend income in the period we determine it is not collectible.
In connection with our debt investments, we may receive warrants or similar equity-related securities ("Warrants"). We determine the cost basis of Warrants based upon their fair values on the date of receipt relative to the total fair value of the debt and Warrants received. Any resulting difference between the face amount of the debt and its recorded cost resulting from the assignment of value to the Warrants is treated as original issue discount (“OID”), and accreted into interest income over the life of the debt investment using a method that approximates the effective interest method. Similarly, loan origination fees are capitalized and amortized as other income over the life of the loan.
For loans and debt securities with contractual payment-in-kind (“PIK”)PIK interest, which represents contractual interest accrued and added to the principal balance, we generally will not accrue PIK interest for accounting purposes if the portfolio company valuation indicates that such PIK interest is not collectible. We do not accrue as a receivable interest on loans and debt securities for accounting purposes if we have reason to doubt our ability to collect such interest. Original issue discounts, market discounts or premiums are accreted or amortized using the effective interest method as interest income. We record prepayment premiums on loans and debt securities as interest income. Dividend income, if any, is recognized on an accrual basis to the extent that we expect to collect such amount. Our totalWe record prepayment premiums on loans and debt securities as interest income was $1.7 millionwhen we receive such amounts. In addition, we may generate revenue in the form of commitment, origination, structuring or diligence fees, monitoring fees, fees for the fiscal year ended December 31, 2013, as compared to $0.1 million for the fiscal year ended 2012. The increase is due to a larger note portfolio earning interestproviding managerial assistance and possibly consulting fees and performance-based fees. Any such fees generated in 2013 as compared to 2012. At December 31, 2013, the weighted average coupon yield was 10.7%, as compared to 9.8% as of December 31, 2012.
Expense Reimbursementconnection with investments will be recognized when earned.
We entered into an expense reimbursementLoans and debt securities, including those that are individually identified as being impaired under ASC Topic 310 — Receivables (“ASC Topic 310”), are generally placed on non-accrual status immediately if, in the opinion of management, principal or interest is not likely to be paid in accordance with the terms of the debt agreement, with our prior manager under whichor when principal or interest is past due 90 days or more. Interest accrued but not collected at the prior manager agreed to reimburse us for certain GAAP compliant expensesdate a loan or security is placed on non-accrual status is reversed against interest income. Interest income is recognized on our quarterly financial statements for 2012, retroactivenon-accrual loans or debt securities only to the dateextent received in cash. However, where there is doubt regarding the ultimate collectability of formation on August 3, 2011. In 2013,principal, cash receipts, whether designated as principal or interest, are thereafter applied to reduce the expense reimbursement agreement was modifiedcarrying value of the loan or debt security. Loans or securities are restored to exclude management feesaccrual status only when interest and incentive fees payable to the prior manager effective as of January 1, 2013. We recognized a receivable on our books for the amount due from the prior manager under the expense reimbursement agreement,principal payments are brought current and the prior manager recognized a liability on its books in the same amount. The expense reimbursement agreement allowed the prior manage and us to offset the related receivables and payables to each other resulting in a net receivable, or payable position.future payments are reasonably assured.
On August 20, 2013, we terminated our investment management agreement with our prior manager, and entered into a new investment management agreement with our current Manager. Our current Manager has not entered into an expense reimbursement agreement with us, but has agreed to assume the prior manager’s obligation to pay us the $1.3 million which had accrued under the prior manager’s expense reimbursement agreement. In consideration for such assumption, we have agreed to pay our current Manager any amounts otherwise due our prior manager for organization and offering expenses funded by our prior manager.
Net Realized Gains or Losses and Net Change in Unrealized Appreciation or Depreciation
We measure net realized gains or losses by the difference between the net proceeds from the repayment or sale and the weighted-average amortized cost basis of the investment, without regard to unrealized appreciation or depreciation previously recognized, but considering unamortized upfront fees and prepayment penalties. Net change in unrealized appreciation or depreciation will reflectreflects the change in portfolio investment values during the reporting period, including any reversal of previously recorded unrealized appreciation or depreciation when gains or losses are realized. Our total net realized gain from investments was $0.4 million for the fiscal year ended December 31, 2013, as compared to no realized gain or loss from investments for the fiscal year ended 2012. The 2013 gains were from notes sold or tendered. No gains in 2012 were due to the first year of operations and a smaller investment portfolio.
| 45 |
Our total net unrealized depreciation on investments was a $0.5 million for the fiscal year ended December 31, 2013 as compared to $0.1 million in 2012. The fiscal year 2013 had a larger investment portfolio.
Payment-in-Kind Interest
We may have investments in our portfolio that contain a PIK interest provision. Any PIK interest will be added to the principal balance of such investments and is recorded as income, if the portfolio company valuation indicates that such PIK interest is collectible. In order to maintain our status as a regulated investment company, or (“RIC”), substantially all of this income must be paid out to stockholders in the form of distributions, even if we have not collected any cash.
Organization and Offering Expenses
The Fund is a closed-end fund with a continuous offering period. Under the investment advisory agreement between the fund and the Manager, our Manager fronts the cost of the offering expenses which are reimbursable by the Fund with up to 1.5% of the gross offering proceeds. The Fund expenses organizational and offering costs as they become payable under the investor advisory agreement. Our total offering expense was $0.3 million for the fiscal year ended December 31, 2013, as compared to $0.1 million for the fiscal year ended December 31, 2012. The year 2013 had a higher amount of investor closings as compared to the year 2012.
Federal Income Taxes
We have elected to be treated for federal income tax purposes as a RIC under Subchapter M of the Code. As a RIC, we generally will not have to pay corporate-level federal income taxes on any ordinary income or capital gains that we distribute to our shareholders from our tax earnings and profits. To obtain and maintain our RIC tax treatment, we must meet, among other things, specified source-of-income and asset diversification requirements and distribute annually at least 90% of our ordinary income and realized net short-term capital gains in excess of realized net long-term capital losses, if any.
Portfolio and Investment Activity
ForDuring the year ended December 31, 2013,2016, we made $27.7$36.5 million of investments in new and existing portfolio companies and had $10.3$30.6 million in aggregate amount of exits, maturities and repayments, resulting in net investments of $5.9 million for the year. During the year ended December 31, 2015, we made $23.2 million of investments in new and existing portfolio companies and had $19.7 million in aggregate amount of exits, maturities and repayments, resulting in net repayments of $3.5 million for the year. During the year ended December 31, 2014, we made $31.3 million of investments in new and existing portfolio companies and had $11.8 million in aggregate amount of exits and repayments, resulting in net investments of $17.4$19.5 million for the period. Foryear.
As of December 31, 2016, we have invested an aggregate of approximately $41.6 million in forty-seven investment positions in twenty-nine portfolio companies. On December 31, 2016, the fair value of our investment positions was $40.9 million (including money market investments and the accrued interest of $0.4 million). As of such date, our estimated gross annual portfolio yield was 8.6% and gross annual portfolio yield to maturity was 8.6% (excluding equity investments and non-accrual investments) based on the purchase price of our investments. The average duration of our debt portfolio was approximately 1.6 years. During the year ended December 31, 2012,2016, six T-bills matured, one T-bill was sold, and we made $7.2 million of investments in newexited eight portfolio companies and had $1.2in full, for aggregate sales proceeds of $30.6 million.
As of December 31, 2015, we have invested an aggregate of approximately $54.4 million in 42 investment positions in 33 portfolio companies. At December 31, 2015, the fair value of our investment positions was $33.5 million (including money market investments and the accrued interest and dividends of $0.5 million). As of such date, our estimated gross annual portfolio yield was 7.6% and gross annual portfolio yield to maturity was 7.6% (excluding equity investments and non-accrual investments) based on the purchase price of our investments. The average duration of our debt portfolio was approximately 1.8 years. During the year ended December 31, 2015, we exited 12 portfolio companies in full and 4 partially for aggregate sales proceeds of $19.7 million. As of December, 2015, we had one portfolio investment in default of payment of its par value at maturity date, Suntech Power Holdings Company, with a fair value of $250 which represented a negligible amount of exitsour total portfolio. As of December 31, 2015, in addition to the investment in maturity date default, seven additional debt investments had not paid coupon interest as due beyond the thirty day grace period. These investments are Colt Defense LLC, 8.75%, November 15, 2017; Caesars Entertainment Corp, 11.25%, June 1, 2017; Caesars Entertainment Corp, 10.75%, February 1, 2016; Endeavour International Corp., 12%, March 1, 2018; Endeavour International Corp., 12%, June 1, 2018; QuickSilver Resources, Inc., 7.13%, April 1, 2016; and repayments, resulting in netSaratoga Resources, Inc., 12.50% July 1, 2016. Interest on these investments of $6.0 million forwas accrued through the period. We had nodate that the last coupon payment was received. There are six equity investments which are non-income producing as of December 31, 2011.2015. These six are Affinion Group, common stock; Ansgar Media, LLC, membership interests; Education Management, LLC, common stock and warrant; NII Holdings, Inc., common stock; and Relativity Media LLC, preferred stock.
The following table presents three debt investments that had not paid coupon interest as due beyond the thirty-day grace period, as of December 31, 2016. Interest on these investments was accrued through the date that the last coupon payment was received:
| Portfolio Company | Asset Type | Investment Coupon Rate | Maturity Date | |||||
| Logan's Roadhouse, Inc.(1) | Senior Secured Second Lien Debt | 10.75 | % | October 15, 2017 | ||||
| Saratoga Resources, Inc. | Senior Secured Second Lien Debt | 12.50 | % | July 1, 2016 | ||||
| UCI International, Inc. | Senior Unsecured Debt | 8.63 | % | February 15, 2019 | ||||
| (1) | The company filed for bankruptcy in Delaware on August 8, 2016 and is in the final stages of restructuring. The Fund participated in DIP financing as part of company’s restructuring process during bankruptcy and has received PIK Second Lien Exit Facility T/L in exchange. The Fund also participated in Equity exchange which is still in process and is expected to complete soon. |
The following table presents ten equity investments that are non-income producing, as of December 31, 2016:
| Portfolio Company | Asset Type | |
| Affinion Group, Inc. (2) | Equity – Common Stock | |
| Ansgar Media, LLC - Class B Units | Equity – Preferred Stock | |
| Aspect Software, Inc.(3) | Equity – Common Stock | |
| Aspire Holdings(1) | Equity – Common Stock | |
| Education Management, LLC | Equity – Common Stock | |
| Education Management, LLC(4) | Warrant | |
| GeoCommerce, Inc. | Warrant | |
| NII Holdings, Inc. (5) | Equity – Common Stock | |
| Nima, LLC | Warrant | |
| Nuverra Environmental Solutions, Inc.(6) | Warrant |
| (1) | Converted from exchange of 12.00% Endeavour International Corp First Lien Bonds. |
| (2) | Converted from exchange of 3.00% PIK senior unsecured convertible notes. |
| (3) | Converted from exchange of 3.00% PIK senior unsecured convertible notes. |
| (4) | Received in exchange of 15.00% Cash/PIK bonds. |
| (5) | Received in exchange of 10.00% senior unsecured debt. |
| (6) | Received early exchange fees in form of warrants for participating in the exchange offer. |
| 46 |
The following table presents four investments that were completely written off during the year ended December 31, 2016:
| Portfolio Company | Investment Type | Investment Coupon Rate | Maturity Date | |||||
| Aspect Software, Inc. | Senior Secured Second Lien Debt | 10.63 | % | May 15, 2017 | ||||
| Suntech Power Holdings Company, Ltd. | Senior Unsecured Debt | 3.00 | % | May 15, 2013 | ||||
| QuickSilver Resources, Inc. | Senior Subordinated Debt | 7.13 | % | April 1, 2016 | ||||
| Relativity Media, LLC - Class E Units | Equity – Preferred Stock | - | - | |||||
Aspect Software, Inc. filed for bankruptcy and hence defaulted on their 10.63% notes. As part of restructuring program, the company offered its noteholders to participate in the rights offering, which in turn would convert to equity. The 10.63% notes were hence written off completely. There is no scope of recovery on the Suntech Power Holdings Company, Ltd and Quicksilver Resources, Inc., hence these two have also been written off. Relativity Media, LLC, the entity in which we made our original investment, was dissolved as part of the Relativity Media reorganization process during the year ended December 31, 2016. The investment was removed from the Schedule of Investments and the loss of $10.4 million was realized.
The following table shows the weighted average yield of our portfolio composition based on fair value at December 31, 2013:2016:
| At December 31, 2013 | At December 31, 2016 | |||||||||||||||
| Percentage of Total Portfolio | Weighted Average Current Coupon Yield | Percentage of Total Portfolio | Weighted Average Current Coupon Yield | |||||||||||||
| Investments – Money Market | 6.6 | % | — | % | 0.4 | % | — | % | ||||||||
| U.S. Government Securities | 17.7 | 0.7 | ||||||||||||||
| Senior Secured First Lien Debt | 18.2 | 10.7 | 42.1 | 11.4 | ||||||||||||
| Senior Secured Second Lien Debt | 21.3 | 10.8 | 1.3 | 11.1 | ||||||||||||
| Senior Unsecured Debt | 30.0 | 10.4 | 12.0 | 10.1 | ||||||||||||
| Senior Subordinated Debt | 23.9 | 11.0 | 2.6 | 9.3 | ||||||||||||
| Equity Securities | 23.9 | n/a | ||||||||||||||
| Total | 100.0 | % | 10.7 | % | 100.0 | % | 8.6 | %* | ||||||||
* 8.6% yield is on non-defaulted, non-equity positions and excludes money market investments.
As of December 31, 2013,2016, our investmentnon-defaulted, non-equity portfolio had a yield to maturity of 11.16%8.6%, and an average duration of 2.361.60 years.
The following table presentsshows the weighted average yield of our portfolio composition based on fair value at December 31, 2012:2015:
| At December 31, 2012 | At December 31, 2015 | |||||||||||||||
| Percentage of Total Portfolio | Weighted Average Current Coupon Yield | Percentage of Total Portfolio | Weighted Average Current Coupon Yield | |||||||||||||
| Investments – Money Market | 18.3 | % | — | % | 18.9 | % | — | % | ||||||||
| U.S. Government Securities | 15.0 | 0.2 | ||||||||||||||
| Senior Secured First Lien Debt | 11.5 | 10.4 | 27.4 | 9.5 | ||||||||||||
| Senior Secured Second Lien Debt | 12.1 | 11.0 | 5.4 | 10.6 | ||||||||||||
| Senior Unsecured Debt | 43.7 | 9.5 | 19.0 | 10.0 | ||||||||||||
| Senior Subordinated Debt | 14.4 | 9.4 | 4.5 | 9.6 | ||||||||||||
| Equity Securities | 9.8 | n/a | ||||||||||||||
| Total | 100.0 | % | 9.8 | % | 100.0 | % | 7.6 | %* | ||||||||
* 7.6% yield is on non-defaulted, non-equity positions and excludes money market investments.
As of December 31, 2012,2015, our investmentnon-defaulted, non-equity portfolio had a yield to maturity of 12.17%.7.6%, and an average duration of 1.80 years.
| 47 |
The following table shows the portfolio composition by industry grouping at fair value at December 31, 20132016 (dollars in thousands):
| At December 31, 2013 | At December 31, 2016 | |||||||||||||||
| Investments at Fair Value | Percentage of Total Portfolio | Investments at Fair Value | Percentage of Total Portfolio | |||||||||||||
| Healthcare & Pharmaceuticals | $ | 3,160 | 12.7 | % | ||||||||||||
| Services: Business | 3,015 | 12.2 | ||||||||||||||
| Media: Broadcasting & Subscription | $ | 10,418 | 25.7 | % | ||||||||||||
| Technology | 7,684 | 19.0 | ||||||||||||||
| US Government | 7,173 | 17.7 | ||||||||||||||
| Consumer Electronics | 6,500 | 16.0 | ||||||||||||||
| Aerospace and Defense | 2,616 | 10.6 | 2,124 | 5.3 | ||||||||||||
| Energy: Oil & Gas | 2,604 | 10.5 | 1,460 | 3.6 | ||||||||||||
| Services: Consumer | 1,428 | 3.5 | ||||||||||||||
| Retail | 1,084 | 2.7 | ||||||||||||||
| Healthcare & Pharmaceuticals | 1,050 | 2.6 | ||||||||||||||
| Telecommunications | 2,289 | 9.2 | 607 | 1.5 | ||||||||||||
| Environmental Industries | 279 | 0.7 | ||||||||||||||
| Beverage, Food & Tobacco | 249 | 0.6 | ||||||||||||||
| Automobile | 238 | 0.6 | ||||||||||||||
| Investments – Money Market | 1,644 | 6.6 | 157 | 0.4 | ||||||||||||
| Media: Advertising, Printing & Publishing | 1,541 | 6.2 | 51 | 0.1 | ||||||||||||
| Services: Consumer | 1,282 | 5.2 | ||||||||||||||
| Metals & Mining | 1,222 | 4.9 | ||||||||||||||
| High Tech Industries | 1,158 | 4.7 | ||||||||||||||
| Banking, Finance, Insurance & Real Estate | 1,069 | 4.3 | ||||||||||||||
| Retail | 968 | 3.9 | ||||||||||||||
| Media: Broadcasting & Subscription | 875 | 3.5 | ||||||||||||||
| Hotel, Gaming & Leisure | 790 | 3.2 | ||||||||||||||
| Beverage, Food & Tobacco | 557 | 2.2 | ||||||||||||||
| Environmental Industries | 8 | 0.1 | ||||||||||||||
| Total | $ | 24,798 | 100.0 | % | $ | 40,502 | 100.0 | % | ||||||||
The following table shows the portfolio composition by industry grouping at fair value at December 31, 20122015 (dollars in thousands):
| At December 31, 2012 | At December 31, 2015 | |||||||||||||||
| Investments at Fair Value | Percentage of Total Portfolio | Investments at Fair Value | Percentage of Total Portfolio | |||||||||||||
| Investments – Money Market | $ | 1,304 | 18.3 | % | $ | 6,210 | 18.9 | % | ||||||||
| U.S. Government Securities | 4,946 | 15.0 | ||||||||||||||
| Media: Broadcasting & Subscription | 4,641 | 14.1 | ||||||||||||||
| Metals & Mining | 2,137 | 6.5 | ||||||||||||||
| Media: Advertising, Printing & Publishing | 2,116 | 6.4 | ||||||||||||||
| Retail | 1,969 | 6.0 | ||||||||||||||
| Aerospace and Defense | 1,734 | 5.3 | ||||||||||||||
| Telecommunications | 1,640 | 5.0 | ||||||||||||||
| Energy: Oil & Gas | 1,593 | 4.8 | ||||||||||||||
| Automobile | 1,578 | 4.8 | ||||||||||||||
| Services: Consumer | 1,476 | 4.5 | ||||||||||||||
| Healthcare & Pharmaceuticals | 830 | 11.7 | 1,139 | 3.4 | ||||||||||||
| High Tech Industries | 771 | 10.8 | ||||||||||||||
| Hotel, Gaming & Leisure | 765 | 2.3 | ||||||||||||||
| Beverage, Food & Tobacco | 769 | 10.8 | 531 | 1.6 | ||||||||||||
| Telecommunications | 764 | 10.7 | ||||||||||||||
| Retail | 564 | 7.9 | ||||||||||||||
| Services: Consumer | 541 | 7.6 | ||||||||||||||
| Consumer Goods: Non-durable | 415 | 5.8 | ||||||||||||||
| Consumer Goods: Durable | 401 | 5.6 | ||||||||||||||
| Services: Business | 365 | 5.1 | ||||||||||||||
| Banking, Finance, Insurance & Real Estate | 358 | 5.0 | ||||||||||||||
| Environmental Industries | 45 | 0.7 | 457 | 1.4 | ||||||||||||
| Total | $ | 7,127 | 100.0 | % | $ | 32,932 | 100.0 | % | ||||||||
Our fair value of total investments was $24.8$40.5 million for the fiscal year endedas of December 31, 20132016 as compared to $7.1$32.9 million as of December 31, 2015. The increase in the fair value of our investments was attributable to three factors: 1) new investments in senior secured notes of Geocommerce, Inc. and Nima, LLC granted us with in-the-money warrants, which increased the value of our investments significantly. 2) increased investments in Ansgar Media, LLC and an increase in the valuation estimate of Ansgar Media, LLC equity based on recent financial projections provided by the company and 3) for the fiscal year ended December 31, 2012. The portfolio increase in 2013 is mainly due to invested proceeds2016, the high yield market returned 17.49%, the third best year over the past 20, surpassed only by 2003 (when the markets recovered from continuous investor closings in 2013. The additional proceedsthe WorldCom fraud) and 2009 (when the U.S. economy emerged from investor closings throughout 2013 also led to a more diverse portfolio by industry, as compared to 2012.the Great Recession).
Discussion and Analysis of Results of Operations
Results of Operations
We were formed on August 3, 2011, and commenced operations on July 10, 2012, when we raised in excess of $1,000,000 from persons who were not affiliated with us or our Manager. Prior to satisfying the minimum offering requirement, we had no operations except for matters relating to our organization and registration as a non-diversified, closed-end management investment company. As a result, our operating results for 2013 are not necessarily applicable to our results in 2012. The results of operations are based on revenue less expenses, adjusted for the impact of the realized gain/loss and change in unrealized gain/loss on our investment portfolio. RevenueTo the extent that it is expected to be received, revenue is recognized on an accrual basis. Income is earned as coupon interest adjusted for the amortization of premiums and accretion of discounts on the high-yield corporate debt investments. Expenses include professional services, management fees, administrative services, organizational and offering costs and other general and administrative. Realized gain/lossgains/losses are from investments sold, written off, or called at an advantageous price. The unrealized gain/lossgain (loss) is the change in the market price on investments in the portfolio at period end. end, subject to significant fluctuation.
| 48 |
Operating results for the years ended December 31, 20132016, 2015 and 2012 and for the period from August 3, 2011 (date of inception) to December 31, 2011 are2014 were as follows (dollars in thousands):
| For the Year Ended December 31, 2013 | For the Year Ended December 31, 2012 | For the Period from August 3, 2011 (Date of Inception) to December 31, 2011 | ||||||||||
| (Restated) | (Restated) | (Restated) | ||||||||||
| Total investment income | $ | 1,659 | $ | 146 | $ | - | ||||||
| Total expenses (income), net | 861 | (4 | ) | 4 | ||||||||
| Net investment income (loss) | 798 | 150 | (4 | ) | ||||||||
| Net realized gains | 395 | - | - | |||||||||
| Net unrealized depreciation | (496 | ) | (119 | ) | - | |||||||
| Net increase (decrease) in net assets resulting from operations | $ | 697 | $ | 31 | $ | (4 | ) | |||||
| For the Year Ended December 31, 2016 | For the Year Ended December 31, 2015 | For the Year Ended December 31, 2014 | ||||||||||
| Total investment income | $ | 3,120 | $ | 3,512 | $ | 3,260 | ||||||
| Total operating expenses | 2,651 | 2,682 | 2,441 | |||||||||
| Net investment income | 469 | 830 | 819 | |||||||||
| Net realized gain (loss) from investments | (13,263 | ) | 425 | 166 | ||||||||
| Net unrealized appreciation (depreciation) on investments | 20,408 | (14,614 | ) | (6,259 | ) | |||||||
| Net increase (decrease) in net assets resulting from operations | $ | 7,614 | $ | (13,359 | ) | $ | (5,274 | ) | ||||
Revenues
We generated investment income of $1.7$3.1 million for the fiscal year ended December 31, 2013,2016, as compared to $3.5 million for the year ended December 31, 2015, and $3.3 million for the year ended December 31, 2014. Interest revenue was $3.0 million for the year ended December 31, 2016, as compared to $2.9 million for the year ended December 31, 2015, and $3.2 million for the year ended December 31, 2014. The increase in interest revenue in 2016 as compared to 2015 was attributable to higher yield earned on investments in senior secured notes of Ansgar, GeoCommerce and Nima, partially offset by an increase in debt investments placed on non-accrual status and restructuring of certain debt investments into equity investments. Fee income was $0.1 million for the year ended December 31, 2012,2016, as compared to $0.6 million and zero for the years ended December 31, 2015 and 2014, respectively. The decrease in fee income in 2016 as compared to 2015 was attributable to a 5% origination fee that was earned and immediately accrued on our investment in Relativity Media, LLC in 2015. The fee income earned on investments in 2016 was lower and is being amortized over the term of the loan instead of realized upon receipt.
Interest from debt investments is in the form of interest and fees earned on senior secured loans, senior secured bonds,notes, subordinated debt, senior unsecured debt and collateralized securities in our debt portfolio. Our debt portfolio constituted approximately 75.7% of investment portfolio at December 31, 2016 (excluding money market investments). The level of interest income we receive is directly related to the balance of collectible income producing investments multiplied by the weighted average yieldcoupon rate of our investments.investments, offset by debt investments held in non-accrual status. We expect the dollar amount of interest and any dividend income that we earn to increase as the size of our investment portfolio increases. The average balance of the debt portfolio during the year ended December 31, 2013 note portfolio2016 was significantly higher than the year ended December 31, 2012 balance.2015, which was attributable to – 1) new investments in senior secured notes of Geocommerce, Inc. and Nima, LLC and increased investments in senior secured notes of Ansgar Media, LLC; and 2) increased investments in US Treasury Bills to keep up with the collateral requirements of the priority credit line. At December 31, 2016, the weighted average coupon yield of our debt investments was 8.6%, as compared to 7.6% at December 31, 2015, and 10.0% at December 31, 2014. For the year ended December 31, 2016, the average net assets were $31.8 million, as compared to $39.2 million for the year ended December 31, 2015, and $36.7 million for the year ended December 31, 2014.
Since becoming operational in the third quarter of 2012, we generate revenue primarily from the cash interest we collect on our debt investments and, to a lesser extent, from the early termination fees that many of our debt investments require the borrower to pay. Going forward, we may generate revenue in the form of commitment, origination, structuring or diligence fees. Any such fees will be generated in connection with our investments and recognized as earned.
Expenses
Our total operating expenses were $1.6 million for the fiscal year ended December 31, 2013, as compared to $0.5 million for the fiscal year ended December 31, 2012. Our operating expenses were offset by an expense reimbursement from our prior manager of $0.8 million in 2013 and $0.5 million in 2012. Our operating expenses include professional services of $0.3 million in 2013, as compared to $0.1 million in 2012. Professional Services include legal and audit services. The increase in 2013 is due to legal fees for the prospectus update and a full year of service provider support in 2013 as compared to 2012. Our operating expenses also include base management fees attributed to our Manager and the prior manager of $0.4 million in 2013, as compared to $0.06 million in 2012. The management fees increase in 2013 is due to higher assets under management as compared to 2012. General and administrative expenses include the transfer agent service, printing and mailing, and other service providers of compliance, custody and fund administration. The year 2013 is higher than 2012 due to the portfolio growth and a full year of operations in 2013 as compared to 2012. Our Manager is eligible to receive incentive fees based on performance. We did not pay or accrue any incentive fees in either 2013 or 2012. We generally expect our operating expenses related to our ongoing operations to increase because of the anticipated growth in the size of our asset base, although the increase should be slower than the growth in our assets.
The composition of our operating expenses for the years ended December 31, 20132016, 2015 and 2012 and for the period from August 3, 2011 (date of inception) to December 31, 20112014 was as follows (dollars in thousands):
| For the Year Ended December 31, 2013 | For the Year Ended December 31, 2012 | For the Period from August 3, 2011 (Date of Inception) to December 31, 2011 | ||||||||||
| (Restated) | (Restated) | (Restated) | ||||||||||
| Professional fees | $ | 334 | $ | 119 | $ | — | ||||||
| Director fees | 42 | 31 | — | |||||||||
| Insurance | 83 | 49 | — | |||||||||
| Management fees | 429 | 61 | — | |||||||||
| General and administrative expenses | 427 | 118 | 4 | |||||||||
| Organizational and offering expense | 322 | 142 | — | |||||||||
| Operating expenses before expense waivers and reimbursements | 1,637 | 520 | 4 | |||||||||
| Expense reimbursement | (776 | ) | (524 | ) | — | |||||||
| Total operating expenses (income) net of expense waivers and reimbursement | $ | 861 | $ | (4 | ) | $ | 4 | |||||
| For the Year Ended December 31, 2016 | For the Year Ended December 31, 2015 | For the Year Ended December 31, 2014 | ||||||||||
| Professional fees | $ | 800 | $ | 521 | $ | 258 | ||||||
| Director fees | 37 | 50 | 49 | |||||||||
| Insurance | 114 | 96 | 95 | |||||||||
| Interest expense | 206 | 33 | - | |||||||||
| Management fees – related parties | 640 | 784 | 732 | |||||||||
| Administrative services – related parties | 228 | 216 | 108 | |||||||||
| General and administrative (includes CFO salary and related party travel expenses) | 489 | 721 | 664 | |||||||||
| Transfer agent fees | 137 | 165 | 183 | |||||||||
| Offering expense | - | 96 | 352 | |||||||||
| Total operating expenses | $ | 2,651 | $ | 2,682 | $ | 2,441 | ||||||
Expense Reimbursement
| 49 |
We entered into an expense reimbursement agreement withFor the years ended December 31, 2016, 2015 and 2014, our prior manager under whichoperating expenses were $2.7 million, $2.7 million and $2.4 million, respectively. Included within general and administrative expenses for the prior manager agreed to reimburse usyears ended December 31, 2016, 2015 and 2014, were $0.1 million, $0.1 million and $0.1 million respectively for all U.S. GAAP compliant expenses recognized onthe cost of our quarterlychief financial statements for 2012, retroactiveofficer’s salary reimbursed to the dateManager. Also included within general and administrative expenses for the years ended December 31, 2016, 2015 and 2014 were $0.04 million, $0.1 million and $0.2 million, respectively, for related party travel expenses reimbursed to the Manager.
The slight decrease in expenses for the year ended December 31, 2016 as compared to December 31, 2015 was primarily due to reduced offering expenses as a result of formation on August 3, 2011. In 2013, the expense reimbursement agreement was modified to excludefact that the Fund has not raised new capital since April 30, 2015 as our registration statement has not been declared effective by the SEC, reduced management fees as our net assets have decreased, reduced general and incentiveadministrative expenses, offset by increases in professional fees payableattributable to the Manager effective as of January 1, 2013. We recognized a receivable onlitigation relating to our booksinvestment in Relativity Media, LLC.
Management fees for the amount due fromyears ended December 31, 2016, 2015 and 2014 remain at 2% of the prior manager undernet asset value. The offering costs are consistent at 1.5% of the gross closing proceeds for the years ended December 31, 2016, 2015 and 2014. However, since the Fund has not been open to new investments, there has not been any offering costs expense reimbursement agreement, and the prior manager recognized a liability on its books in the same amount. The expense reimbursement agreement allowed the prior manager and us to offset the related receivables from and payables to each other resulting in a net receivable, or payable position. Our prior manager was obligated to reimburse us for $0.8 million in 2013 and $0.5 million in 2012.since June 30, 2015.
On August 20, 2013, we terminated our investment management agreement with our prior manager, and entered into a new investment management agreement with our current Manager. Our current Manager has not entered into an expense reimbursement agreement with us, but has agreed to assume the prior manager’s obligation to pay us $1.3 million which had accrued under the prior manager’s expense reimbursement agreement. In consideration for such assumption, we have agreed to pay our current Manager any amounts otherwise due our prior manager for organization and offering expenses funded by our prior manager.
Net Investment Income
Our net investment income totaled $0.5 million, $0.8 million and $0.2$0.8 million for the periodsyears ended December 31, 20132016, 2015 and 2012,2014, respectively. Of ourOur net investment income in each period, $0.8 million and $0.5 million for the periods ending December 31, 2013 and 2012, respectively, was attributable to expense reimbursements by our prior manager, and the balance was attributable to investment income less operating expenses for the period. For the fiscalyear ended December 31, 2016, total investment income was $3.1 million, which included $0.1 million of non-recurring fees.
The decrease in net investment income for the year ended December 31, 2016 as compared to the year ended December 31, 2015 was primarily due to two factors: 1) decrease in fee income in 2016 as compared to 2015 because in 2015 the 5.0% origination fee was earned and immediately accrued on our investment in Relativity Media, LLC. The fee income earned on investments in 2016 was lower and is being amortized over the term of the loan instead of realized upon receipt and 2) although general and administrative expenses were lower in 2016; the decrease was offset by substantial increase in legal expenses due to the lawsuits related to Relativity Media, LLC. For the years ended December 31, 2013,2016, 2015 and 2012,2014, total investment income was $1.7operating expenses were $2.7 million, $2.7 million and $0.1$2.4 million, respectively. The 2013 increase is due to a higher average balance in the investment portfolio in 2013. For the fiscal year ended December 31, 2013, total expenses before expense waivers and reimbursements was $1.6 million and $0.5 million for the fiscal year ended December 31, 2012. Drivers of the higher expenses in 2013 include larger management fees due to more assets under management and professional services increase due to legal expenses for the prospectus update and service providers in for a full year as compared to 2012.
Net Realized Gains or Losses from Investments
For the years ended December 31, 20132016, 2015 and 2012,2014, we had $10.3$30.6 million, $19.7 million and $1.2$11.8 million of sales, maturities, write-offs and principal repayments, resulting in $(13.3) million, $0.4 million and $233$0.2 million of realized gains (losses), respectively.
Net Change in Unrealized Appreciation or Depreciation on Investments
For the years ended December 31, 20132016, 2015 and 2012,2014, we had $0.5experienced $20.4 million, $(14.6) million and $0.1$(6.3) million of unrealized depreciation,appreciation (depreciation), respectively. The increase in unrealized appreciation during fiscal 2016 was due to four main factors.
First,despite the negative trends and volatility early in the year, the high-yield index has swiftly recovered. For the year 2016, the high yield market returned 17.49%, the third best year over the past 20, surpassed only by 2003 (when the markets recovered from the WorldCom fraud) and 2009 (when the U.S. economy emerged from the Great Recession). Much of this was due to the recovery in oil prices and an insatiable demand for yield. With oil prices comfortably above $50 at year end following the OPEC production agreement, many energy issuers have addressed their liquidity concerns by either raising capital in the financial markets or by restructuring their balance sheets. This should limit the amount of defaults from energy issuers going forward. From a demand standpoint, high yield investors were especially attracted to the asset class in 2016 when more than $12 trillion of global debt (roughly 25% of the outstanding supply) yielded less than 0%.
Second, the Fund invested in senior secured first lien notes of two companies – GeoCommerce, Inc. and Nima, LLC, which provided the Fund with in-the-money warrants amounting to just over $2.8 million of unrealized appreciation.
Third, an increase in the equity value of Ansgar Media, LLC based on recently provided financial projections of the company.
Fourth, an unrealized depreciation of $10.4 million from our investment in Relativity Media, LLC was reclassified as a realized loss.
| 50 |
The unrealized appreciation in fiscal year 2016 has been partially offset by substantial increase in net realized loss mainly due to writing off four of our investments completely, including a $10.4 million loss on our investment in Relativity Media, LLC Series E preferred stock. Some portion of unrealized depreciation in fiscal year 2015 was because we encountered greater than average declines in certain positions that were caused by conditions unique to the company or industry. We had a number of positions that either initiated a restructuring of their indebtedness (either in Chapter 11 bankruptcy or prepackaged bankruptcy) or announced that they were considering a restructuring. Such announcements generally reduce liquidity in the secondary market creating greater mispricing in underlying bonds. Until the bankruptcy or other restructuring process is complete, it becomes difficult to ascertain whether some of these positions will result in a loss of principal or full recovery of principal given their position in the capital structure of the issuer and the underlying asset values. Generally, we expect much higher recoveries or full payment for senior secured first lien type bonds, as compared to senior secured second lien or unsecured bonds for defaulted bonds.
Changes in Net Assets from Operations
For the years ended December 31, 20132016, 2015 and 2012,2014, we recorded a net increase (decrease) in net assets resulting from operations of $0.7$7.6 million, $(13.4) million and $0.03$(5.3) million, respectively. For the years ended December 31, 2016, 2015 and 2014, this increase (decrease) is mainly due to net unrealized appreciation (depreciation) of $20.4 million, $(14.6) million and $(6.3) million, respectively, and net investment income of $0.5 million, $0.8 million and $0.8 million, respectively, partially offset by net realized gain (loss) from investments of $(13.3) million, $0.4 million and $0.2 million, respectively, on our portfolio investments. The increase in 2016 is largely due to a strong rally in high yield markets because of increases in the market price of oil, easing concerns about global economic growth, a continued search for yield and the completion of restructuring plans by a few of our bond investment companies. Overall, the portfolio experienced a market value increase, with an increase in net unrealized appreciation on investments of $20.4 million for the year ended December 31, 2016. Based on 2,150,0196,256,208, 6,077,127 and 246,2314,281,647 weighted average common shares outstanding for the years ended December 31, 20132016, 2015 and 2012,2014, respectively, our per share net increase and decrease(decrease) in net assets resulting from operations was $0.32$1.22, $(2.20) and $0.13,$(1.23), respectively. For the period from August 3, 2011 (date of inception) to December 31, 2011, we held no investments.
Liquidity and Capital Resources
On August 4, 2015, we entered an agreement with Wells Fargo Advisors, LLC for obtaining a revolving line of credit. The amount we can borrow is based upon the value of cash deposited in an account at Wells Fargo Advisors, LLC and the treasury notes that Wells Fargo purchases, which serve as collateral for the loan. On August 27, 2015, we initially drew down $2.0 million. As of December 31, 2016 and December 31, 2015, the outstanding balance under this credit line was $6.4 million and $4.5 million, respectively. The interest rate on the outstanding balance is a negotiated rate based on our assets under management with Wells Fargo Advisors, LLC and is currently 3.25%. The term of the line of credit is indefinite and may be terminated by us or Wells Fargo Advisors, LLC at any time.
On September 10, 2015, we entered an agreement with the Morgan Stanley Private Bank, N.A. The amount we can borrow is based upon the value of cash deposited in an account at Morgan Stanley Private Bank, N.A., which serve as collateral for the loan. The maximum amount which we may borrow under the line of credit is $1.8 million. The line was paid off during the second quarter and the account was closed as of June 30, 2016.
We generate cash primarily from the net proceeds of our ongoing continuous public offering and from cash flows from fees, interest and dividends earned from our investments as well as principal repayments and proceeds from sales of our investments. On July 10, 2012, we satisfied our minimum offering requirement of raising gross offering proceeds in excess of $1.0 million from persons who are not affiliated with us or our Manager, and commenced operations on such date.operations. As of December 31, 2013,2016, we had issued 3.26.3 million shares of common stock, forincluding 0.5 million shares under our distribution reinvestment plan (“DRIP”) less 0.3 million shares redeemed under our tender offer. As of December 31, 2016, we had received gross proceeds from our continuous offering of $31.6 million. We currentlytotal $62.6 million, including $4.7 million under our DRIP less $2.9 million paid to redeem shares in our quarterly tenders.
| 51 |
When we are open to new business, we will sell our shares on a continuous basis atbasis. On May 23, 2016, our Board of Directors and the Pricing Committee of the Board made a current offeringfinal decision to approve a price reduction from $9.25 to $8.75 per share. On November 24, 2015, our Board of $10.15; however,Directors and the Pricing Committee of the Board had approved a price reduction from $9.75 to $9.25 per share effective for our next closing date and next declared distribution date. To the extent that our net asset value per share increases, we will sell at a price necessary to ensure that our shares are not sold at a price, after deduction of selling commissions and dealer manager fees that is below our net asset value per share.
Prior However, since April 30, 2015, we have not been able to investingsell any shares in debt securities, we invest the net proceeds from our continuous offering primarily in money market funds that invest in U.S. government securities and high-quality debt instruments maturing in one year or less frombecause our registration statement has been under review by the time of investment. As of December 31, 2013, we had $1.6 million invested in money market investments pending investment in debt instruments. As of December 31, 2012, we had $1.3 million invested in money market investments pending investment in debt instruments.SEC.
For the year ended December 31, 2013,2016, we experienced a net increasedecrease in money market investments of $0.3$6.1 million. For the year ended December 31, 2013,2016, approximately $18.4$0.9 million was generated fromused for our financing activities, which primarily consisted of $19.4$11.7 million repayments of the priority credit line and $2.8 million in net offering proceeds received,distributions, partially offset by $1.0$13.5 million in distributions.received through the priority credit line. We usedgenerated approximately $18.4$0.9 million of cash inprovided by our operating activities primarilymainly as the result of the purchase of new portfolio debt investments of $27.7 million, offset by the receipt of proceeds from the sale of, repayment of and principal payments on portfolio debt investments of $10.3 million. Cash used in operating activities was also affected by increases in receivables for interest and due from related party.
For the year ended December 31, 2012, we experienced a net increase in money market investments of $1.1 million. For the year ended December 31, 2012, approximately $7.5$30.6 million, was generated from our financing activities, which primarily consisted of $7.6 million in net offering proceeds received,partially offset by $0.1 million in distributions. We used approximately $7.5 million of cash in our operating activities primarily as the result of the purchase of new portfolio debt investments of $7.2 million, offset by the receipt of proceeds from the sale of, repayment of and principal payments on portfolio debt investments of $1.3$36.5 million. Cash used in operating activities was also affected by increases in receivables for interest and due from related party.
We do not expect to borrow funds during the following twelve months to make investments. In the future, however, if the market for debt financing presents attractively priced debt financing opportunities, or if our board of directors determines that leveraging our portfolio would be in our best interests and the best interests of our shareholders, we may decide to borrow funds to make investments. We do not currently anticipate issuing any preferred shares.
Distributions
Subject to our boardBoard of trustees'Director’s discretion and applicable legal restrictions, we authorizehave historically declared and declarepaid ordinary cash distributions at a rate equal to 7.35% of our latest offering price per share. Since the distribution paid to shareholders on September 30, 2015, with a record date of August 30, 2015, we have paid distributions monthly. Prior to the September 30, 2015, we paid distributions on a semi-monthly basis and pay suchbasis. We changed to paying distributions on a semi-monthly basis.monthly in order to reduce costs. Any distributions to our shareholders will be declared out of assets legally available for distribution. We may fund our cash distributions to shareholders from any sources of funds available to us, including offering proceeds, borrowings, net investment income from operations, capital gains proceeds from the sale of assets, non-capital gains proceeds from the sale of assets, and dividends or other distributions paid to us on account of preferred and common equity investments in portfolio companies. We have not established limits on the amount of funds we may use from available sources to make distributions.
When we commencedBased upon our current level of operations, we initiated a policy of declaring semi-monthly distributions at an annual distribution rate of 7.35% per annumestimate that about 85.3% of our offering price. We have authorized, declared and paid distributions to our shareholders at that rate onwill constitute a semi-monthly basis since July 2012.return of capital. Our distributions historically have not been based on our investment performance. Prior to September 2013, our distributions were supported by our Manager in the form of operating expense support payments to us, and a portion of our distributions constituted a return of capital. Since September 2013, we have not had an expense support agreement with our Manager and as a result a greater portion of our distributions have constituted a return of capital. A return of capital generally is a return of your investment rather than a return of earnings or gains derived from our investment activities constitutes the return of capital previously paid to us for shares of our common stock.
The following table shows the percentage of our distributions, which have been funded from net investment income, realized capital gains and paid in capital since the inception of operations:
| Net | Realized | |||||||||||||||||||||||||||||||
| Investment | Gain From | Return of | ||||||||||||||||||||||||||||||
| Period | Per Share | Income | Investments | Capital | Per Share | Net Investment Income | Realized Gain From Investments | Return of Capital | ||||||||||||||||||||||||
| July 12, 2012 - September 30, 2012 | $ | 0.18375 | 64 | % | 0 | % | 36 | % | $ | 0.183750 | 64 | % | — | % | 36 | % | ||||||||||||||||
| October 1, 2012 - December 31, 2012* | 0.26075 | 59 | % | 0 | % | 41 | % | 0.260750 | 59 | % | — | % | 41 | % | ||||||||||||||||||
| January 1, 2013 - March 31, 2013 * | 0.26259 | 67 | % | 13 | % | 20 | % | |||||||||||||||||||||||||
| January 1, 2013 - March 31, 2013* | 0.262586 | 67 | % | 13 | % | 20 | % | |||||||||||||||||||||||||
| April 1, 2013 - June 30, 2013 | 0.18650 | 77 | % | 14 | % | 9 | % | 0.186504 | 77 | % | 14 | % | 9 | % | ||||||||||||||||||
| July 1, 2013 - September 30, 2013 | 0.18650 | 51 | % | 10 | % | 39 | % | 0.186504 | 51 | % | 10 | % | 39 | % | ||||||||||||||||||
| October 1, 2013 - December 31, 2013 | 0.18650 | 13 | % | 47 | % | 40 | % | 0.186504 | 4 | % | 47 | % | 49 | % | ||||||||||||||||||
| January 1, 2014 - March 31, 2014 | 0.186504 | 27 | % | 13 | % | 60 | % | |||||||||||||||||||||||||
| April 1, 2014 - June 30, 2014 | 0.186504 | 49 | % | — | % | 51 | % | |||||||||||||||||||||||||
| July 1, 2014 - September 30, 2014 | 0.184668 | 17 | % | 3 | % | 80 | % | |||||||||||||||||||||||||
| October 1, 2014 - December 31, 2014 | 0.181467 | 15 | % | 6 | % | 79 | % | |||||||||||||||||||||||||
| January 1, 2015 - March 31, 2015 | 0.179154 | 15 | % | 5 | % | 80 | % | |||||||||||||||||||||||||
| April 1, 2015 - June 30, 2015 | 0.179154 | 63 | % | 15 | % | 22 | % | |||||||||||||||||||||||||
| July 1, 2015 - September 30, 2015 | 0.209015 | 19 | % | 11 | % | 70 | % | |||||||||||||||||||||||||
| October 1, 2015 - December 31, 2015 ** | 0.170315 | — | % | 6 | % | 94 | % | |||||||||||||||||||||||||
| January 1, 2016 – March 31, 2016 *** | 0.169969 | 1 | % | — | % | 99 | % | |||||||||||||||||||||||||
| April 1, 2016 – June 30, 2016**** | 0.107188 | — | % | — | % | 100 | % | |||||||||||||||||||||||||
| July 1, 2016 – September 30, 2016***** | 0.214372 | 23 | % | — | % | 77 | % | |||||||||||||||||||||||||
| October 1, 2016 – December 31, 2016 | 0.107186 | 24 | % | 11 | % | 65 | % | |||||||||||||||||||||||||
(*)* Includes a special distribution of $0.077 per share.
| 52 |
** For the period from October 31, 2015 to December 31, 2015, the Fund had a net investment loss of approximately $268 thousand. That amount is reflected on the source of distributions table below in the distributions from paid in capital amount.
*** For the period from January 1, 2016 to March 31, 2016, the Fund had a realized loss from investments of approximately $700 thousand. That amount is reflected on the source of distributions table below in the distributions from paid in capital amount.
**** For the period from April 1, 2016 to June 30, 2016, the Fund had a net investment loss of approximately $4 thousand and a realized loss from investments of approximately $12.6 million. These amounts are reflected on the source of distributions table below in the distributions from paid in capital amount. The allocation of the distributions between net investment income and return of capital are different than previously reported as a result of the correction of an accounting error. For further detail, please see Item 9A Controls and Procedures.
***** For the period from July 1, 2016 to September 30, 2016, the Fund had a realized loss from investments of approximately $0.04 million. That amount is reflected on the source of distributions table below in the distributions from paid in capital amount. The allocation of the distributions between net investment income and return of capital are different than previously reported as a result of the correction of an accounting error. For further detail, please see Item 9A Controls and Procedures.
We expect to continue making distributions at the same distribution rate, based on the current offering price, unless our results of operations, our general financial condition, general economic conditions, or other factors prohibit us from doing so. From time to time, but not less than quarterly, we review our accounts to determine whether distributions to our shareholders are appropriate. There can be no assurance that we will be able to sustain distributions at any particular level.
Each year a statement on Internal Revenue Service Form 1099-DIV (or such successor form) identifying the source of the distribution (i.e., paid from ordinary income, paid from net capital gain on the sale of securities, or a return of capital) will be mailed to our shareholders.We expect to continue paying distributions at the same distribution rate, based on the current offering price, and that a substantial part of those distributions will constitute a return of capital for the foreseeable future. Furthermore, our ability to generate net investment income sufficient to cover our monthly dividend has been hindered by the fact that we have several investments that are on non-accrual status, and because we hold more equity investments that do not generate regular interest or dividend income. Our distributions will continue to constitute a return of capital until our net investment income is sufficient to support our distribution rate, which will probably not occur until our Manager enters into an expense support agreement with us, our mix of interest and dividend paying assets increase, or our assets increase enough to lower our expense ratio, which we do not expect to occur until we have significantly more net assets than $100 million in assets, neither of which may ever occur.we do at present. As a result, for the foreseeable future, a significant portion of the distributions we make will represent a return of capital for tax purposes. The tax basis of shares must be reduced by the amount of any return of capital distributions, which will result in an increase in the amount of any taxable gain (or a reduction in any deductible loss) on the sale of shares.
The determination of the tax attributes of our distributions is made annually as of the end of our fiscal year based upon our taxable income for the full year and distributions paid for the full year. Therefore, a determination made on a quarterly basis may not be representative of the actual tax attributes of our distributions for a full year. The actual tax characteristics of distributions to shareholders are reported to shareholders annually on a Form 1099-DIV.
We have elected to be treated, beginning with our taxable year ended December 31, 2013, as a RIC under the Code. To obtain and maintain RIC tax treatment, we must, among other things, distribute at least 90% of our net ordinary income and net short-term capital gains in excess of net long-term capital losses, if any, to our shareholders. In order to avoid certain excise taxes imposed on RICs, we currently intend to distribute during each calendar year an amount at least equal to the sum of: (i) 98% of our ordinary income for the calendar year, (ii) 98.2% of our capital gains in excess of capital losses for the one-year period generally ended on October 31st of the calendar year (unless an election is made by us to use our taxable year) and (iii) any ordinary income and net capital gains for preceding years that were not distributed during such years and on which we paid no federal income tax.
The following table reflects the sources of the cash distributions on a tax basis that the CompanyFund has paid on its common stock (dollars in thousands) during the fiscal years ended December 31, 20132016, 2015 and 2012:2014:
| Year ended | Year ended | |||||||||||||||||||||||||||||||||||||||
| Source of Distributions: | December 31, 2013 | December 31, 2012 | Year ended December 31, 2016 | Year ended December 31, 2015 | Year ended December 31, 2014 | |||||||||||||||||||||||||||||||||||
| (Restated) | (Restated) | |||||||||||||||||||||||||||||||||||||||
| Distributions from net investment income | $ | 798 | 47.0 | % | $ | 150 | 60.0 | % | $ | 473 | 12.6 | % | $ | 830 | 18.5 | % | $ | 819 | 26.1 | % | ||||||||||||||||||||
| Distributions from realized gains | 395 | 23.3 | % | - | 0.0 | % | 78 | 2.1 | 425 | 9.5 | 166 | 5.3 | ||||||||||||||||||||||||||||
| Distributions from paid in capital | 504 | 29.7 | % | 100 | 40.0 | % | 3,195 | 85.3 | 3,235 | 72.0 | 2,153 | 68.6 | ||||||||||||||||||||||||||||
| Total | $ | 1,697 | 100.0 | % | $ | 250 | 100.0 | % | $ | 3,746 | 100.0 | % | $ | 4,490 | 100.0 | % | $ | 3,138 | 100.0 | % | ||||||||||||||||||||
| 53 |
Distribution Reinvestment Plan
We have adopted an “opt-in” DRIP pursuant to which shareholders may elect to have the full amount of their cash distributions reinvested in additional shares of our common stock. If shareholders wish to receive their distribution in cash, no action will beis required on their part to do so. There will be noIf shareholders elect to participate in the DRIP program, they are not charged selling commissions, dealer manager fees or other sales charges to shareholders if, they elect to participate infor the DRIP. We will paypurchase of DRIP shares. The purchase price of the plan administrator’s fees under the plan. Shareholders distribution amount will purchaseDRIP shares atis 95% of the current offering price thatof the shares are offered pursuant toat the effective registration statementtime of the public offering.distribution. Shares issued pursuant to our DRIP will have the same voting rights as our shares of common stock offered pursuant to our prospectus.
We are in a fund raising stage. As such, we incurWhen the Fund is able to raise new capital, it incurs offering expenses of 1.5% of the gross offering proceeds. However, the Fund has not be able to raise additional capital since April 2015. The chart below shows the percentages of distributions from Net Investment Income excluding offering costs:
| Offering Expenses | Distribution from Net Investment Income excluding offering costs | % Distribution from Net Investment Income excluding offering costs | % Distributions from Realized Gains excluding offering costs | % Distributions from Paid In Capital excluding offering costs | |||||||||||||||||
| 2016 | $ | — | $ | 473 | 13 | % | 2 | % | 85 | % | |||||||||||
| 2015 | $ | 96 | $ | 926 | 21 | % | 9 | % | 70 | % | |||||||||||
| 2014 | $ | 352 | $ | 1,171 | 37 | % | 5 | % | 58 | % | |||||||||||
| 2013 | $ | 322 | $ | 1,120 | 66 | % | 23 | % | 11 | % | |||||||||||
| 2012 | $ | 142 | $ | 292 | 100 | % | 0 | % | 0 | % | |||||||||||
| Offering Expenses | Net Investment Income excluding offering costs | % Distribution from Net Investment Income excluding offering costs | % Distributions from Realized Gains excluding offering costs | % Distributions from Paid In Capital excluding offering costs | ||||||||||||||||
| 2013 (Restated) | $ | 322 | $ | 1,120 | 66 | % | 23 | % | 11 | % | ||||||||||
| 2012 (Restated) | $ | 142 | $ | 292 | 100 | % | 0 | % | 0 | % | ||||||||||
Election as a RIC
We elected to be treated as a RIC under Subchapter M of the Code for U.S. federal income tax purposes beginning with the taxable year ended December 31, 2012.purposes. As a RIC, we generally will not have to pay corporate-level U.S. federalFederal income taxes on any income that we distribute to our stockholders from our tax earnings and profits. To qualify as a RIC, we must, among other things, meet certain source-of-income and asset diversification requirements. In addition, in order to obtain RIC tax treatment, we must distribute to our stockholders, for each taxable year, at least 90% of our “investment company taxable income,” which is generally our net ordinary income plus the excess, if any, of realized net short-term capital gain over realized net long-term capital loss, or the annual distribution requirement. Even if we qualify as a RIC, we generally will be subject to corporate-level U.S. federalFederal income tax on our undistributed taxable income and could be subject to U.S. federalFederal excise, state, local and foreign taxes.
Related-Party Transactions and Agreements
We have entered into agreements with the Manager, whereby we pay it certain fees and reimbursements. These include payments to our Manager for reimbursement of organization and offering costs, as well as,costs. In addition, we make payments for certain services that include, but are not limited to, the identification, execution, and management of our investments and also the management of our day-to-day operations provided to us by our Manager.Manager, pursuant to various agreements that we have entered into. See Note 54 to the financial statements included elsewhere in this annual reportAnnual Report on Form 10-K/A10-K for additional information regarding such contractual obligations.
Conflicts of interest between us and the various roles, activities and duties of the Manager and its affiliates may occur from time to time. The Manager, its officers and other affiliates may act as a manager or general partner of other private or public entities, some of whom may have the same or a similar investment objective as us. As a result, conflicts of interest between us and the other activities of the Manager and its affiliates may occur from time to time. None of the agreements or arrangements, including those relating to compensation, between us, the Manager or their affiliates, is the result of arm’s-length negotiations. As a result, there may be conflicts between us, on the one hand, and our Manager, including members of its management team, on the other, regarding the allocation of resources to the management of our day-to-day activities.
The compensation we pay to our Manager was not entered into on an arm’s-length basis with unaffiliated third parties. As a result, the form and amount of such compensation may be less favorable to us than they might have been had they been entered into through arm’s-length transactions with unaffiliated parties. See Note 5 to the financial statements included elsewhere in this annual report on Form 10-K/A“Contractual Obligations” for a discussion of the investment advisory agreement we have with the Manager.
| 54 |
Further, our officers are involved in other ventures, some of which may compete with us for investment opportunities, including certain affiliated funds or managed accounts, and may be incentivized to offer investment opportunities to such other ventures rather than to us which would make it more difficult to achieve our investment objectives. In addition, the officers of VII Peaks may also be involved in other ventures, some of which may compete with us for investment opportunities.
As a BDC,business development company (“BDC”), we are subject to certain regulatory restrictions in making our investments. For example, we generally are not permitted to co-invest with certain entities affiliated with our Manager in transactions originated by our Manager or its affiliates unless we obtain an exemptive order from the SEC or co-invest alongside our Manager or its affiliates in accordance with existing regulatory guidance and our allocation policy. Under existing regulatory guidance, we are permitted to, and may co-invest in syndicated deals and secondary loan market transactions where price is the only negotiated point. We may seek exemptive relief from the SEC to engage in co-investment transactions with our Manager and/or its affiliates. However, there can be no assurance that we will obtain such exemptive relief, if requested. Even if we receive exemptive relief, neither our Manager nor its affiliates are obligated to offer us the right to participate in any transactions originated by them. Prior to obtaining exemptive relief, we may co-invest alongside our Manager or its affiliates only in accordance with existing regulatory guidance and our allocation policy.
Contractual Obligations
We have entered into agreements withDue from related party consists of $67,000 of true up for management fees from writing down certain portfolio investments at the end of a quarter in prior quarters, $67,000 in Blue Sky state filing fees paid by the Fund instead of our Manager, $13,000 in allocation of the Directors and the Dealer Manager, whereby we pay certain fees and reimbursements to these entities. These include payments to the Dealer Manager for selling commissions and the Dealer Manager fee and paymentsOfficers insurance policy costs to our Manager, for reimbursement of organization and offering costs. In addition, we make payments for certain services that include, but are not limited$90,000 in expenses related to the identification, execution,legal and management of our investments and also the management of our day-to-day operations providedother operational costs allocated to us by our Manager pursuant to various agreements that we have entered into.instead of the Fund.
Off-Balance Sheet Arrangements
We have no off-balance sheet arrangements that have or are reasonably likely to have a current or future effect on our financial condition, changes in financial condition, revenues or expenses, results of operations, liquidity, capital expenditures or capital resources.
ITEM 7A. QUANTITATIVE AND QUALITATIVE DISCLOSURES ABOUT MARKET RISK
We are subject to financial market risks, including changes in interest rates. Any investments we make that are denominated in a foreign currency will be subject to risks associated with changes in currency exchange rates. These risks include the possibility of significant fluctuations in the foreign currency markets, the imposition or modification of foreign exchange controls and potential illiquidity in the secondary market. These risks will vary depending upon the currency or currencies involved.
We may hedge against interest rate and currency exchange rate fluctuations by using standard hedging instruments such as futures, options and forward contracts subject to the requirements of the 1940 Act. While hedging activities may insulate us against adverse changes in interest rates, they may also limit our ability to participate in benefits of lower interest rates with respect to our portfolio of investments with fixed interest rates. During the periods covered by this report, we did not engage in interest rate hedging activities. We would not hold or issue these derivative contracts for trading or speculative purposes. We do not have any foreign operations and thus we are not exposed to foreign currency fluctuations.
Assuming that our current balance sheet wasfinancial condition were to remain constant and no actions were taken to alter our existing interest rate sensitivity, a 100 basis point move in prime interest rates up or down from their December 31, 2013 levels, would increase or decrease our net income by $0.2 million annually. The effect of a 100 basis point increase or decrease in prime interest rates from their December 31, 20132016 levels would result in an increase or decrease in net asset value of $0.2$0.5 million or 0.92%1.6%.
| 55 |
ITEM 8. FINANCIAL STATEMENTS AND SUPPLEMENTARY DATA
Index to Financial Statements
| 56 |
REPORT OF INDEPENDENT REGISTERED PUBLIC ACCOUNTING FIRM
To the
The Board of Directors and Stockholders of
VII Peaks Co-Optivist Income BDC II, Inc.
We have audited the accompanying statementsstatement of assets and liabilities of VII Peaks Co-Optivist Income BDC II, Inc. (the Fund) as of December 31, 2013 and 2012,(“Fund”), including the schedulesschedule of investments, as of December 31, 2013 and 2012,2016, and the related statements of operations, changes in net assets, and cash flows for the year then ended. These financial statements are the responsibility of the Fund’s management. Our responsibility is to express an opinion on these financial statements based on our audit.
We conducted our audit in accordance with the standards of the Public Company Accounting Oversight Board (United States). Those standards require that we plan and perform the audit to obtain reasonable assurance about whether the financial statements are free of material misstatement. The Fund is not required to have, nor were we engaged to perform, an audit of its internal control over financial reporting. Our audit included consideration of internal control over financial reporting as a basis for designing audit procedures that are appropriate in the circumstances, but not for the purpose of expressing an opinion on the effectiveness of the Fund’s internal control over financial reporting. Accordingly, we express no such opinion. An audit also includes examining, on a test basis, evidence supporting the amounts and disclosures in the financial statements, assessing the accounting principles used and significant estimates made by management, as well as evaluating the overall financial statement presentation. Our procedures included confirmation of securities owned as of December 31, 2016, by correspondence with the custodian and management of the portfolio companies, or by other auditing procedures where replies were not received. We believe that our audit provides a reasonable basis for our opinion.
In our opinion, the financial statements referred to above present fairly, in all material respects, the financial position of VII Peaks Co-Optivist Income BDC II, Inc. as of December 31, 2016, and the results of its operations, changes in its net assets and its cash flows for the year then ended, in conformity with accounting principles generally accepted in the United States of America.
/s/ OUM & Co. LLP
San Francisco, California
June 2, 2017
| F-1 |
REPORT OF PREVIOUS INDEPENDENT REGISTERED PUBLIC ACCOUNTING FIRM
To the Board of Directors and Stockholders of
VII Peaks Co-Optivist Income BDC II, Inc.
We have audited the accompanying statement of assets and liabilities of VII Peaks Co-Optivist Income BDC II, Inc. (the “Fund”), including the schedule of investments, as of December 31, 2015, and the related statements of operations, changes in net assets and cash flows for each of the years in the two-year period ended December 31, 2013 and 2012 and for the period from August 3, 2011 (date of inception) to December 31, 2011.2015. These financial statements are the responsibility of the Fund’s management. Our responsibility is to express an opinion on these financial statements based on our audits.
We conducted our audits in accordance with the standards of the Public Company Accounting Oversight Board (United States). Those standards require that we plan and perform the audit to obtain reasonable assurance about whether the financial statements are free of material misstatement. The Fund is not required to have, nor were we engaged to perform, an audit of its internal control over financial reporting. Our audits included consideration of internal control over financial reporting as a basis for designing audit procedures that are appropriate in the circumstances, but not for the purpose of expressing an opinion on the effectiveness of the Fund’s internal control over financial reporting. Accordingly, we express no such opinion. An audit also includes examining, on a test basis, evidence supporting the amounts and disclosures in the financial statements, assessing the accounting principles used and significant estimates made by management, as well as evaluating the overall financial statement presentation. Our procedures included confirmation of securities owned as of December 31, 2013,2015, by correspondence with the custodian. We believe that our audits provide a reasonable basis for our opinion.
As discussed in Note 3 to the financial statements, the Fund has restated its 2013 financial statements to correct errors related to its related party offering costs.
In our opinion, the financial statements referred to above present fairly, in all material respects, the financial position of VII Peaks Co-Optivist Income BDC II, Inc. as of December 31, 2013 and 2012,2015, and the results of its operations, changes in its net assets and its cash flows for each of the years in the two-year period ended December 31, 2013 and 2012 and for the period from August 3, 2011 (date of inception) to December 31, 2011,2015, in conformity with accounting principles generally accepted in the United States of America.
/s/ Burr Pilger Mayer, Inc.BPM LLP
San Francisco, California
April 14, 2016
March 11, 2014, except for the effects of the restatement discussed in Note 3 and as to Note 11 to the financial statements, as to which the date is July 16, 2015
| F-2 |
VII PEAKS CO-OPTIVIST INCOME BDC II, INC.
STATEMENTS OF ASSETS AND LIABILITIES
(in thousands, except share and per share data)
| As of | ||||||||
| December 31, 2013 | December 31, 2012 | |||||||
| (Restated) | (Restated)(a) | |||||||
| ASSETS | ||||||||
| Investments, at fair value (amortized cost of $23,769 and $5,942, respectively) | $ | 23,154 | $ | 5,823 | ||||
| Investments, money market at fair value (cost of $1,644 and $1,304, respectively) | 1,644 | 1,304 | ||||||
| Total investments, at fair value | $ | 24,798 | $ | 7,127 | ||||
| Interest receivable | 579 | 132 | ||||||
| Prepaid expenses | 8 | 5 | ||||||
| Due from related party | 1,405 | 555 | ||||||
| Receivable for common stock purchased | 974 | 729 | ||||||
| Total assets | $ | 27,764 | $ | 8,548 | ||||
| LIABILITIES | ||||||||
| Payable for unsettled trades | $ | 104 | $ | - | ||||
| Management and incentive fees payable | 8 | 21 | ||||||
| Accounts payable and accrued liabilities | 129 | 71 | ||||||
| Stockholder distributions payable | 99 | 120 | ||||||
| Total liabilities | $ | 340 | $ | 212 | ||||
| NET ASSETS | ||||||||
| Preferred stock, par value, $.001 per share, 50,000,000 authorized; none issued and outstanding | $ | - | $ | - | ||||
| Common stock, par value, $.001 per share, 200,000,000 authorized; 3,151,376 and 950,733 shares issued and outstanding, respectively | 3 | 1 | ||||||
| Paid-in capital in excess of par value | 28,645 | 8,558 | ||||||
| Accumulated distribution in excess of net investment income | (609 | ) | (104 | ) | ||||
| Net unrealized depreciation on investments | (615 | ) | (119 | ) | ||||
| Total net assets | 27,424 | 8,336 | ||||||
| Total liabilities and net assets | $ | 27,764 | $ | 8,548 | ||||
| Net asset value per share | $ | 8.70 | $ | 8.77 | ||||
| As of | ||||||||
| December 31, 2016 | December 31, 2015 | |||||||
| ASSETS | ||||||||
| Investments, at fair value | ||||||||
| Non-controlled/non-affiliate investments (cost of $35,575 and $46,210, respectively) | $ | 30,977 | $ | 22,620 | ||||
| Affiliate investments (cost of $5,850 and $2,000, respectively) | 9,368 | 4,102 | ||||||
| Investments, money market at fair value (cost of $157 and $6,210, respectively) | 157 | 6,210 | ||||||
| Total investments, at fair value | 40,502 | 32,932 | ||||||
| Interest receivable | 402 | 529 | ||||||
| Prepaid expenses | 76 | 12 | ||||||
| Origination fee receivable | - | 63 | ||||||
| Due from related party, net | 239 | 153 | ||||||
| Total assets | $ | 41,219 | $ | 33,689 | ||||
| LIABILITIES | ||||||||
| Priority credit line -Wells Fargo | $ | 6,366 | $ | 4,531 | ||||
| Interest payable | 3 | 1 | ||||||
| Deferred loan fee | 268 | 50 | ||||||
| Prepaid interest from investments (includes prepaid interest of $333 from Nima, LLC, $258 from GeoCommerce, Inc. and $188 from Ansgar Media, LLC) | 779 | - | ||||||
| Accounts payable and accrued liabilities | 121 | 267 | ||||||
| Stockholder distributions payable | - | 350 | ||||||
| Total liabilities | 7,537 | 5,199 | ||||||
| NET ASSETS | ||||||||
| Preferred stock, par value, $.001 per share, 50,000,000 authorized; none issued and outstanding | $ | - | $ | - | ||||
| Common stock, par value, $.001 per share, 200,000,000 authorized; 6,639,019 and 6,482,927 shares issued as of December 31, 2016 and 2015, respectively and 6,337,606 and 6,181,515 outstanding as of December 31, 2016 and 2015, respectively | 7 | 6 | ||||||
| Paid-in capital in excess of par value | 60,184 | 58,860 | ||||||
| Treasury stock at cost, 301,413 and 301,413 shares, respectively | (2,891 | ) | (2,891 | ) | ||||
| Accumulated distribution in excess of net investment income and net realized gain (loss) on investments | (22,538 | ) | (5,997 | ) | ||||
| Net unrealized depreciation on investments | (1,080 | ) | (21,488 | ) | ||||
| Total net assets | 33,682 | 28,490 | ||||||
| Total liabilities and net assets | $ | 41,219 | $ | 33,689 | ||||
| Net asset value per share | $ | 5.31 | $ | 4.61 | ||||
The accompanying notes are an integral part of these financial statements.
| F-3 |
VII PEAKS CO-OPTIVIST INCOME BDC II, INC.
STATEMENTS OF OPERATIONS
(in thousands, except share and per share data)
| For the Year Ended December 31, 2013 | For the Year Ended December 31, 2012 | For the Period from August 3, 2011 (Date of Inception) to December 31, 2011 | ||||||||||
| (Restated) | (Restated)(a) | (Restated)(a) | ||||||||||
| Investment income: | ||||||||||||
| Interest from investments | $ | 1,657 | $ | 146 | $ | - | ||||||
| Interest from cash and cash equivalents | 1 | - | - | |||||||||
| Total interest income | 1,658 | 146 | - | |||||||||
| Other income | 1 | - | - | |||||||||
| Total investment income | $ | 1,659 | $ | 146 | $ | - | ||||||
| Operating expenses: | ||||||||||||
| Professional fees | 334 | 119 | - | |||||||||
| Directors fees | 42 | 31 | - | |||||||||
| Insurance | 83 | 49 | - | |||||||||
| Management fees | 429 | 61 | - | |||||||||
| General and administrative | 427 | 118 | 4 | |||||||||
| Organizational and offering expense | 322 | 142 | - | |||||||||
| Expenses before expense waivers and reimbursements | 1,637 | 520 | 4 | |||||||||
| Expense reimbursement | (776 | ) | (524 | ) | - | |||||||
| Total expenses (income) net of expense waivers and reimbursements | 861 | (4 | ) | 4 | ||||||||
| Net investment income (loss) | 798 | 150 | (4 | ) | ||||||||
| Realized and unrealized gain (loss) on investments: | ||||||||||||
| Net realized gain from investments | 395 | - | - | |||||||||
| Net unrealized depreciation on investments | (496 | ) | (119 | ) | - | |||||||
| Net realized and unrealized loss on investments | (101 | ) | (119 | ) | - | |||||||
| Net increase (decrease) in net assets resulting from operations | $ | 697 | $ | 31 | $ | (4 | ) | |||||
| Per share information - basic and diluted: | ||||||||||||
| Net investment income (loss) | $ | 0.37 | $ | 0.61 | $ | (44.44 | ) | |||||
| Net increase (decrease) in net assets resulting from operations | $ | 0.32 | $ | 0.13 | $ | (44.44 | ) | |||||
| Weighted average common shares outstanding | 2,150,019 | 246,231 | 90 | |||||||||
| For the Year Ended | For the Year Ended | For the Year Ended | ||||||||||
| December 31, 2016 | December 31, 2015 | December 31, 2014 | ||||||||||
| Investment income: | ||||||||||||
| Interest from investments | ||||||||||||
| Non-controlled/non-affiliate investments | $ | 2,513 | $ | 2,863 | $ | 3,157 | ||||||
| Affiliate investments | 504 | 80 | - | |||||||||
| Interest from cash and cash equivalents | ||||||||||||
| Non-controlled/non-affiliate investments | - | 1 | - | |||||||||
| Fee income | ||||||||||||
| Non-controlled/non-affiliate investments | 66 | 545 | - | |||||||||
| Affiliate investments | 37 | 10 | - | |||||||||
| Other income | ||||||||||||
| Non-controlled/non-affiliate investments | - | 13 | - | |||||||||
| Affiliate investments | - | - | 103 | |||||||||
| Total investment income | 3,120 | 3,512 | 3,260 | |||||||||
| Operating expenses: | ||||||||||||
| Professional fees | 800 | 521 | 258 | |||||||||
| Directors fees | 37 | 50 | 49 | |||||||||
| Insurance | 114 | 96 | 95 | |||||||||
| Interest expense | 206 | 33 | - | |||||||||
| Management fees - related parties | 640 | 784 | 732 | |||||||||
| Administrative services - related parties | 228 | 216 | 108 | |||||||||
| General and administrative (includes $124, $110 and $106 of CFO salary (accounting) and $42, $118 and $169 of related party travel expenses, respectively) | 489 | 721 | 664 | |||||||||
| Transfer agent fees | 137 | 165 | 183 | |||||||||
| Offering expense | - | 96 | 352 | |||||||||
| Total operating expenses | 2,651 | 2,682 | 2,441 | |||||||||
| Net investment income | 469 | 830 | 819 | |||||||||
| Realized and unrealized gain (loss) on investments: | ||||||||||||
| Net realized gain (loss) from investments | (13,263 | ) | 425 | 166 | ||||||||
| Net unrealized appreciation (depreciation) on investments | 20,408 | (14,614 | ) | (6,259 | ) | |||||||
| Net realized and unrealized gain (loss) on investments | 7,145 | (14,189 | ) | (6,093 | ) | |||||||
| Net increase (decrease) in net assets resulting from operations | $ | 7,614 | $ | (13,359 | ) | $ | (5,274 | ) | ||||
| Per share information - basic and diluted: | ||||||||||||
| Net investment income | $ | 0.07 | $ | 0.14 | $ | 0.19 | ||||||
| Net increase (decrease) in net assets resulting from operations | $ | 1.22 | $ | (2.20 | ) | $ | (1.23 | ) | ||||
| Weighted average common shares outstanding | 6,256,208 | 6,077,127 | 4,281,647 | |||||||||
The accompanying notes are an integral part of these financial statements.
| F-4 |
VII PEAKS CO-OPTIVIST INCOME BDC II, INC.
STATEMENTS OF CHANGES IN NET ASSETS
(in thousands, except share and per share data)
| For the Year Ended December 31, 2013 | For the Year Ended December 31, 2012 | For the Period from August 3, 2011 (Date of Inception) to December 31, 2011 | ||||||||||
| (Restated) | (Restated)(a) | (Restated)(a) | ||||||||||
| Operations: | ||||||||||||
| Net investment income (loss) | $ | 798 | $ | 150 | $ | (4 | ) | |||||
| Net realized gain from investments | 395 | - | - | |||||||||
| Net unrealized depreciation on investments | (496 | ) | (119 | ) | - | |||||||
| Net increase (decrease) in net assets from operations | 697 | 31 | (4 | ) | ||||||||
| Stockholder distributions: | ||||||||||||
| Distributions from net investment income | (798 | ) | (150 | ) | - | |||||||
| Distributions from net realized gain on investments | (395 | ) | - | - | ||||||||
| Distributions from paid in capital | (504 | ) | (100 | ) | - | |||||||
| Net decrease in net assets from stockholder distributions | (1,697 | ) | (250 | ) | - | |||||||
| Capital share transactions: | ||||||||||||
| Issuance of common stock, net of issuance costs | 19,407 | 8,358 | 201 | |||||||||
| Reinvestment of stockholder distributions | 681 | - | - | |||||||||
| Net increase in net assets from capital share transactions | 20,088 | 8,358 | 201 | |||||||||
| Total increase in net assets | 19,088 | 8,139 | 197 | |||||||||
| Net assets at beginning of period | 8,336 | 197 | - | |||||||||
| Net assets at end of period | $ | 27,424 | $ | 8,336 | $ | 197 | ||||||
| Net asset value per common share | $ | 8.70 | $ | 8.77 | $ | 8.82 | ||||||
| Common shares outstanding at end of period | 3,151,376 | 950,733 | 22,333 | |||||||||
| Accumulated distribution in excess of net investment income | $ | (609 | ) | $ | (104 | ) | $ | (4 | ) | |||
| For the Year Ended December 31, 2016 | For the Year Ended December 31, 2015 | For the Year Ended December 31, 2014 | ||||||||||
| Operations: | ||||||||||||
| Net investment income | $ | 469 | $ | 830 | $ | 819 | ||||||
| Net realized gain (loss) from investments | (13,263 | ) | 425 | 166 | ||||||||
| Net unrealized appreciation (depreciation) on investments | 20,408 | (14,614 | ) | (6,259 | ) | |||||||
| Net increase (decrease) in net assets from operations | 7,614 | (13,359 | ) | (5,274 | ) | |||||||
| Stockholder distributions: | ||||||||||||
| Distributions from net investment income | (473 | ) | (830 | ) | (819 | ) | ||||||
| Distributions from net realized gain on investments | (78 | ) | (425 | ) | (166 | ) | ||||||
| Distributions from paid in capital | (3,195 | ) | (3,235 | ) | (2,153 | ) | ||||||
| Net decrease in net assets from stockholder distributions | (3,746 | ) | (4,490 | ) | (3,138 | ) | ||||||
| Capital share transactions: | ||||||||||||
| Issuance of common stock, net of issuance costs | - | 6,232 | 20,562 | |||||||||
| Reinvestment of stockholder distributions | 1,324 | 1,532 | 1,134 | |||||||||
| Total investment contributions transferred in-kind | - | - | 758 | |||||||||
| Treasury capital (redemptions) | - | (2,113 | ) | (778 | ) | |||||||
| Net increase in net assets from capital share transactions | 1,324 | 5,651 | 21,676 | |||||||||
| Total increase (decrease) in net assets | 5,192 | (12,198 | ) | 13,264 | ||||||||
| Net assets at beginning of year | 28,490 | 40,688 | 27,424 | |||||||||
| Net assets at end of year | $ | 33,682 | $ | 28,490 | $ | 40,688 | ||||||
| Net asset value per common share | $ | 5.31 | $ | 4.61 | $ | 7.34 | ||||||
| Common shares outstanding at end of year | 6,337,606 | 6,181,515 | 5,546,292 | |||||||||
| Accumulated distribution in excess of net investment income and net realized gain (loss) on investments | $ | (22,538 | ) | $ | (5,997 | ) | $ | (2,762 | ) | |||
The accompanying notes are an integral part of these financial statements.
| F-5 |
VII PEAKS CO-OPTIVIST INCOME BDC II, INC.
STATEMENTS OF CASH FLOWS
(in thousands)thousands, except share and per share data)
| For the Year Ended December 31, 2013 | For the Year Ended December 31, 2012 | For the Period from August 3, 2011 (Date of Inception) to December 31, 2011 | ||||||||||
| (Restated) | (Restated)(a) | (Restated)(a) | ||||||||||
| Operating activities: | ||||||||||||
| Net increase (decrease) in net assets from operations | $ | 697 | $ | 31 | $ | (4 | ) | |||||
| Adjustments to reconcile net increase (decrease) in net assets from operations to net cash used in operating activities: | ||||||||||||
| Net accretion of discount on investments | (61 | ) | (26 | ) | - | |||||||
| Repayments of investments | 10,314 | 1,250 | - | |||||||||
| Purchase of investments | (27,685 | ) | (7,166 | ) | - | |||||||
| Repayments of investments - money market | 29,777 | - | - | |||||||||
| Purchase of investments - money market | (30,117 | ) | (1,103 | ) | (201 | ) | ||||||
| Net realized gain from investments | (395 | ) | - | - | ||||||||
| Net unrealized depreciation on investments | 496 | 119 | - | |||||||||
| (Increase) decrease in operating assets: | ||||||||||||
| Interest receivable | (447 | ) | (132 | ) | - | |||||||
| Prepaid expenses | (3 | ) | (5 | ) | - | |||||||
| Due from related party | (850 | ) | (555 | ) | - | |||||||
| Receivable for common stock purchased | (245 | ) | - | - | ||||||||
| Increase (decrease) in operating liabilities: | ||||||||||||
| Payable for unsettled trades | 104 | - | - | |||||||||
| Management and incentive fees payable | (13 | ) | 21 | 4 | ||||||||
| Accounts payable and accrued liabilities | 58 | 67 | - | |||||||||
| Net cash used in operating activities | (18,370 | ) | (7,499 | ) | (201 | ) | ||||||
| Financing activities: | ||||||||||||
| Proceeds from issuance of shares of common stock, net | 19,407 | 7,581 | 201 | |||||||||
| Stockholder distributions | (1,037 | ) | (82 | ) | - | |||||||
| Net cash provided by financing activities | 18,370 | 7,499 | 201 | |||||||||
| Net increase in cash and cash equivalents | - | - | - | |||||||||
| Cash and cash equivalents, beginning of period | - | - | - | |||||||||
| Cash and cash equivalents, end of period | $ | - | $ | - | $ | - | ||||||
| Supplemental non-cash information: | ||||||||||||
| DRIP distribution payable | $ | 35 | $ | 46 | $ | - | ||||||
| Cash distribution payable | $ | 64 | $ | 74 | $ | - | ||||||
| DRIP distribution paid | $ | 680 | $ | 49 | $ | - | ||||||
| For the Year Ended December 31, 2016 | For the Year Ended December 31, 2015 | For the Year Ended December 31, 2014 | ||||||||||
| Operating activities: | ||||||||||||
| Net increase (decrease) in net assets from operations | $ | 7,614 | $ | (13,359 | ) | $ | (5,274 | ) | ||||
| Adjustments to reconcile net increase (decrease) in net assets from operations to net cash provided by (used in) operating activities: | ||||||||||||
| Paid-in-kind interest income | (12 | ) | - | (19 | ) | |||||||
| Net accretion of discounts and amortization of premiums | (513 | ) | 74 | (67 | ) | |||||||
| Repayments of investments | 30,593 | 19,688 | 11,765 | |||||||||
| Purchase of investments | (36,545 | ) | (23,245 | ) | (31,308 | ) | ||||||
| Repayments of investments - money market | 37,314 | 44,215 | 34,047 | |||||||||
| Purchase of investments - money market | (31,262 | ) | (47,319 | ) | (35,507 | ) | ||||||
| Net realized (gain) loss from investments | 13,263 | (425 | ) | (166 | ) | |||||||
| Net unrealized (appreciation) depreciation on investments | (20,408 | ) | 14,614 | 6,259 | ||||||||
| Proceeds from loan fees received | 310 | 60 | - | |||||||||
| Accretion of deferred loan fees | (92 | ) | (10 | ) | - | |||||||
| (Increase) decrease in operating assets: | ||||||||||||
| Interest receivable | 127 | 521 | (471 | ) | ||||||||
| Prepaid expenses | (64 | ) | 6 | (10 | ) | |||||||
| Due from related party, net | (86 | ) | 14 | 1,228 | ||||||||
| Origination fee receivable | 63 | (63 | ) | - | ||||||||
| Receivable for common stock purchased | - | 614 | 361 | |||||||||
| Increase (decrease) in operating liabilities: | ||||||||||||
| Payable for unsettled trades | - | (1,340 | ) | 1,236 | ||||||||
| Management fees payable | - | (7 | ) | (1 | ) | |||||||
| Prepaid interest from investments | 779 | - | - | |||||||||
| Accounts payable and accrued liabilities | (146 | ) | 84 | 54 | ||||||||
| Interest payable | 2 | 1 | - | |||||||||
| Net cash provided by (used in) operating activities | 937 | (5,877 | ) | (17,873 | ) | |||||||
| Financing activities: | ||||||||||||
| Proceeds from issuance of shares of common stock, net | - | 6,232 | 20,562 | |||||||||
| Stockholder distributions | (2,772 | ) | (2,773 | ) | (1,958 | ) | ||||||
| Treasury stock, net of redemption of common stock | - | (2,113 | ) | (731 | ) | |||||||
| Borrowings - priority credit line | 13,522 | 4,531 | - | |||||||||
| Repayments - priority credit line | (11,687 | ) | - | - | ||||||||
| Net cash provided by (used in) financing activities | (937 | ) | 5,877 | 17,873 | ||||||||
| Net change in cash and cash equivalents | - | - | - | |||||||||
| Cash and cash equivalents, beginning of year | - | - | - | |||||||||
| Cash and cash equivalents, end of year | $ | - | $ | - | $ | - | ||||||
| Supplemental disclosure of non-cash information: | ||||||||||||
| Distribution reinvestment plan distribution payable | $ | - | $ | 123 | $ | 102 | ||||||
| Cash distribution payable | $ | - | $ | 227 | $ | 61 | ||||||
| Distribution reinvestment plan distribution paid | $ | 1,324 | $ | 1,532 | $ | 1,116 | ||||||
| Supplemental disclosure of cash flow information: | ||||||||||||
| Cash interest paid during the year | $ | 204 | $ | 32 | $ | - | ||||||
The accompanying notes are an integral part of these financial statements.
| F-6 |
VII PEAKS CO-OPTIVIST INCOME BDC II, INC.
SCHEDULE OF INVESTMENTS
(dollars and shares in thousands)
December 31, 20132016
| Portfolio Company (a) | Industry | Investment Coupon Rate, Maturity Date | Principal | Amortized Cost | Fair Value | % of Net Assets | ||||||||||||||
| Senior Secured First Lien Debt – 16.4% (b) | ||||||||||||||||||||
| Alion Science and Technology Corp. | Aerospace and Defense | 12.00%, 11/1/2014 | $ | 1,030 | $ | 1,038 | $ | 1,051 | 3.8 | % | ||||||||||
| American Media, Inc. | Media: Advertising, Printing & Publishing | 11.50%, 12/15/2017 | 670 | 704 | 729 | 2.7 | % | |||||||||||||
| Endeavour International Corp. | Energy: Oil & Gas | 12.00%, 3/1/2018 | 525 | 551 | 539 | 2.0 | % | |||||||||||||
| EuraMax International Inc. | Metals & Mining | 9.50%, 4/1/2016 | 775 | 779 | 777 | 2.8 | % | |||||||||||||
| GXS Worldwide, Inc. | Services: Business | 9.75%, 6/15/2015 | 940 | 965 | 971 | 3.5 | % | |||||||||||||
| Ryerson Inc./Joseph T Ryerson & Son, Inc. | Metals & Mining | 9.00%, 10/15/2017 | 420 | 438 | 445 | 1.6 | % | |||||||||||||
| Sub Total Senior Secured First Lien Debt | 4,360 | 4,475 | 4,512 | 16.4 | % | |||||||||||||||
| Senior Secured Second Lien Debt - 19.3% (b) | ||||||||||||||||||||
| Apria Healthcare Group, Inc. | Healthcare & Pharmaceuticals | 12.38%, 11/1/2014 | $ | 571 | $ | 581 | $ | 576 | 2.1 | % | ||||||||||
| Aspect Software, Inc. | Telecommunications | 10.63%, 5/15/2017 | 692 | 696 | 697 | 2.6 | % | |||||||||||||
| Bon-ton Department Stores, Inc. | Retail | 10.63%, 7/15/2017 | 40 | 41 | 40 | 0.1 | % | |||||||||||||
| Caesar's Entertainment Corp. | Hotel, Gaming & Leisure | 10.00%, 12/15/2015 | 505 | 481 | 432 | 1.6 | % | |||||||||||||
| Cenveo Corp. | Services: Business | 8.88%, 2/1/2018 | 585 | 589 | 585 | 2.1 | % | |||||||||||||
| Endeavour International Corp. | Energy: Oil & Gas | 12.00%, 6/1/2018 | 700 | 688 | 655 | 2.4 | % | |||||||||||||
| Logan's Roadhouse, Inc. | Beverage, Food & Tobacco | 10.75%, 10/15/2017 | 750 | 715 | 557 | 2.0 | % | |||||||||||||
| Radiation Therapy Services, Inc. | Healthcare & Pharmaceuticals | 8.88%, 1/15/2017 | 935 | 922 | 944 | 3.5 | % | |||||||||||||
| Saratoga Resources, Inc. | Energy: Oil & Gas | 12.50%, 7/1/2016 | 860 | 888 | 804 | 2.9 | % | |||||||||||||
| Sub Total Senior Secured Second Lien Debt | 5,638 | 5,601 | 5,290 | 19.3 | % | |||||||||||||||
| Senior Unsecured Debt – 27.1% (b) | ||||||||||||||||||||
| Avaya, Inc. | Telecommunications | 9.75%, 11/1/2015 | $ | 650 | $ | 633 | $ | 645 | 2.4 | % | ||||||||||
| Avaya, Inc. | Telecommunications | 10.13%, 11/1/2015 | 460 | 442 | 457 | 1.7 | % | |||||||||||||
| Caesar's Entertainment Corp. | Hotel, Gaming & Leisure | 10.75%, 2/1/2016 | 445 | 416 | 358 | 1.3 | % | |||||||||||||
| Cenveo Corp. | Services: Business | 11.50%, 5/15/2017 | 510 | 492 | 502 | 1.8 | % | |||||||||||||
| Ceridian Corporation | Services: Business | 11.25%, 11/15/15 | 390 | 402 | 393 | 1.4 | % | |||||||||||||
| Ceridian Corporation | Services: Business | 12.25%, 11/15/15 | 560 | 576 | 564 | 2.1 | % | |||||||||||||
| Colt Defense LLC | Aerospace and Defense | 8.75%, 11/15/2017 | 853 | 718 | 737 | 2.7 | % | |||||||||||||
| DynCorp International Inc. | Aerospace and Defense | 10.38%, 7/1/2017 | 810 | 850 | 828 | 3.0 | % | |||||||||||||
| Education Management LLC (d) | Services: Consumer | 15.00%, 7/1/2018 | 270 | 232 | 293 | 1.1 | % | |||||||||||||
| Harland Clarke Corp. | Banking, Finance, Insurance & Real Estate | 9.50%, 5/15/5015 | 691 | 692 | 694 | 2.5 | % | |||||||||||||
| Hutchinson Technology, Inc. | High Tech Industries | 8.50%, 1/15/2026 | 443 | 406 | 388 | 1.4 | % | |||||||||||||
| NII Capital Corp. | Telecommunications | 10.00%, 8/15/2016 | 925 | 907 | 490 | 1.8 | % | |||||||||||||
| Suntech Power Holdings Company, Ltd. (c) | Environmental Industries | 3.00%, 2/28/2014 | 100 | 98 | 8 | 0.0 | % | |||||||||||||
| Toys R Us Inc. | Retail | 10.38%, 8/15/2017 | 825 | 790 | 707 | 2.6 | % | |||||||||||||
| Travelport LLC | Services: Consumer | 13.88%, 3/1/2016 | 340 | 308 | 361 | 1.3 | % | |||||||||||||
| Sub Total Senior Unsecured Debt | 8,272 | 7,962 | 7,425 | 27.1 | % | |||||||||||||||
| Senior Subordinated Debt - 21.6% (b) | ||||||||||||||||||||
| Accelent, Inc. | Healthcare & Pharmaceuticals | 10.00%, 11/1/2017 | $ | 775 | $ | 732 | $ | 800 | 2.9 | % | ||||||||||
| Affinion Group, Inc. | Media: Advertising, Printing & Publishing | 13.50%, 8/15/2018 | 816 | 689 | 812 | 2.9 | % | |||||||||||||
| Claires Stores, Inc | Retail | 10.50%, 6/1/2017 | 215 | 220 | 220 | 0.8 | % | |||||||||||||
| DJO Finance, LLC. | Healthcare & Pharmaceuticals | 9.75%, 10/15/2017 | 825 | 864 | 840 | 3.1 | % | |||||||||||||
| First Data Corp. | Banking, Finance, Insurance & Real Estate | 11.25%, 3/31/2016 | 374 | 375 | 375 | 1.4 | % | |||||||||||||
| QuickSilver Resources, Inc. | Energy: Oil & Gas | 7.13%, 4/1/2016 | 620 | 594 | 606 | 2.2 | % | |||||||||||||
| Radio One, Inc. | Media: Broadcasting & Subscription | 12.50%, 5/24/16 | 875 | 889 | 875 | 3.2 | % | |||||||||||||
| Serena Software, Inc. | High Tech Industries | 10.38%, 3/15/2016 | 770 | 786 | 770 | 2.8 | % | |||||||||||||
| Travelport LLC | Services: Consumer | 11.88%, 9/1/2016 | 620 | 582 | 629 | 2.3 | % | |||||||||||||
| Sub Total Senior Subordinated Debt | 5,890 | 5,731 | 5,927 | 21.6 | % | |||||||||||||||
| Investments - Money Market - 6.0% | ||||||||||||||||||||
| Investments - Money Market | $ | 1,644 | 1,644 | 1,644 | 6.0 | % | ||||||||||||||
| Sub Total Investments - Money Market | 1,644 | 1,644 | 6.0 | % | ||||||||||||||||
| TOTAL INVESTMENTS - 90.4% (b) | $ | 25,413 | $ | 24,798 | 90.4 | % | ||||||||||||||
| Portfolio Company | Industry | Investment Coupon Rate, Maturity Date | Principal / No. of Shares | Amortized Cost | Fair Value | % of Net Assets | |||||||||||
| Senior Secured First Lien Debt -50.6%(b) | |||||||||||||||||
| Ansgar Media, LLC(e) | Media: Broadcasting & Subscription | 12.00%, 1/11/2018 | $ | 2,000 | $ | 2,000 | $ | 2,000 | 5.9 | % | |||||||
| Ansgar Media, LLC(e) | Media: Broadcasting & Subscription | 12.00%, 9/18/2017 | 2,000 | 2,000 | 2,000 | 5.9 | % | ||||||||||
| Ansgar Media, LLC(e) | Media: Broadcasting & Subscription | 12.00%, 10/24/2018 | 310 | 310 | 310 | 0.9 | % | ||||||||||
| Ansgar Media, LLC(e) | Media: Broadcasting & Subscription | 12.00%, 10/27/2018 | 1,540 | 1,540 | 1,540 | 4.6 | % | ||||||||||
| APX Group, Inc. | Services: Consumer | 6.38%, 12/1/2019 | 825 | 825 | 849 | 2.6 | % | ||||||||||
| Claire's Stores, Inc. Term Loan(h) | Retail | 9.00%, 9/20/2021 | 125 | 263 | 125 | 0.4 | % | ||||||||||
| CLSIP LLC Term Loan(h) | Retail | 9.00%, 9/20/2021 | 407 | 856 | 407 | 1.2 | % | ||||||||||
| GeoCommerce, Inc. | Technology | 12.00%, 4/27/2018 | 1,500 | 898 | 1,500 | 4.5 | % | ||||||||||
| GeoCommerce, Inc. | Technology | 12.00%, 5/15/2018 | 1,000 | 745 | 1,000 | 3.0 | % | ||||||||||
| GeoCommerce, Inc. | Technology | 12.00%, 10/14/2018 | 750 | 390 | 750 | 2.2 | % | ||||||||||
| GeoCommerce, Inc. | Technology | 12.00%, 12/21/2018 | 750 | 368 | 750 | 2.2 | % | ||||||||||
| Nima, LLC | Consumer Electronics | 12.00%, 5/20/2018 | 2,000 | 1,201 | 2,000 | 5.9 | % | ||||||||||
| Nima, LLC | Consumer Electronics | 12.00%, 8/11/2018 | 1,000 | 1,000 | 1,000 | 3.0 | % | ||||||||||
| Nima, LLC | Consumer Electronics | 12.00%, 11/2/2018 | 750 | 750 | 750 | 2.2 | % | ||||||||||
| Nima, LLC | Consumer Electronics | 12.00%, 12/21/2018 | 750 | 750 | 750 | 2.2 | % | ||||||||||
| Goodman Networks, Inc. | Telecommunications | 12.13%, 7/1/2018 | 800 | 823 | 240 | 0.7 | % | ||||||||||
| Kratos Defense & Security Solutions, Inc. | Aerospace and Defense | 7.00%, 5/15/2019 | 1,112 | 1,015 | 1,079 | 3.2 | % | ||||||||||
| Sub Total Senior Secured First Lien Debt | $ | 17,619 | $ | 15,734 | $ | 17,050 | 50.6 | % | |||||||||
| Senior Secured Second Lien Debt - 1.5%(b) | |||||||||||||||||
| Nuverra Environmental Solutions, Inc. | Environmental Industries | 12.50%, 4/15/2022 | $ | 1,408 | $ | 1,362 | $ | 269 | 0.8 | % | |||||||
| Logan's Roadhouse, Inc. (c) (f) | Beverage, Food & Tobacco | 10.75%, 10/15/2017 | 674 | 633 | 87 | 0.2 | % | ||||||||||
| Logan's Roadhouse, Inc. PIK Exit Facility Term Loan(f) | Beverage, Food & Tobacco | 9.50% PIK, 11/23/2020 | 162 | 146 | 162 | 0.5 | % | ||||||||||
| Saratoga Resources, Inc.(c) | Energy: Oil & Gas | 12.50%, 7/1/2016 | 885 | 912 | 2 | 0.0 | % | ||||||||||
| Sub Total Senior Secured Second Lien Debt | $ | 3,129 | $ | 3,053 | $ | 520 | 1.5 | % | |||||||||
| Senior Unsecured Debt - 14.5%(b) | |||||||||||||||||
| APX Group, Inc. | Services: Consumer | 8.75%, 12/1/2020 | $ | 575 | $ | 559 | $ | 579 | 1.7 | % | |||||||
| Claire’s (Gibraltar) Holdings Limited Term Loan(h) | Retail | 9.00%, 9/20/2021 | 188 | 395 | 188 | 0.6 | % | ||||||||||
| Clear Channel Communications | Media: Broadcasting & Subscription | 10.00%, 1/15/2018 | 1,400 | 1,375 | 1,050 | 3.1 | % | ||||||||||
| Colt Defense, LLC | Aerospace and Defense | 8.00%, 7/12/2021 | 137 | 1,033 | 137 | 0.4 | % | ||||||||||
| DynCorp International Inc. | Aerospace and Defense | 11.88%, 11/30/2020 | 1,020 | 1,032 | 908 | 2.7 | % | ||||||||||
| Gymboree Corp. | Retail | 9.13%, 12/1/2018 | 810 | 785 | 364 | 1.1 | % | ||||||||||
| Seitel, Inc. | Energy: Oil & Gas | 9.50%, 4/15/2019 | 1,575 | 1,575 | 1,418 | 4.2 | % | ||||||||||
| UCI International, Inc.(c) (i) | Automobile | 8.63%, 2/15/2019 | 1,400 | 1,354 | 238 | 0.7 | % | ||||||||||
| Sub Total Senior Unsecured Debt | $ | 7,105 | $ | 8,108 | $ | 4,882 | 14.5 | % | |||||||||
| Senior Subordinated Debt - 3.1%(b) | |||||||||||||||||
| DJO Finance, LLC | Healthcare & Pharmaceuticals | 10.75%, 4/15/2020 | 1,265 | 1,320 | 1,050 | 3.1 | % | ||||||||||
| Sub Total Senior Subordinated Debt | $ | 1,265 | $ | 1,320 | $ | 1,050 | 3.1 | % | |||||||||
| Equity Securities - 28.7% (b) | |||||||||||||||||
| Affinion Group, Inc.(c) | Media: Advertising, Printing & Publishing | 13 | $ | 689 | $ | 50 | 0.2 | % | |||||||||
| Aspire Holdings(c) | Energy: Oil & Gas | 26 | 551 | 40 | 0.1 | % | |||||||||||
| Aspect Software, Inc.(c) (g) | Telecommunications | 8 | 244 | 331 | 1.0 | % | |||||||||||
| Education Management, LLC(c) | Services: Consumer | 2,530 | 4 | - | 0.0 | % | |||||||||||
| NII Holdings, Inc.(a) (c) | Telecommunications | 17 | 768 | 36 | 0.1 | % | |||||||||||
| Total Common Stock | 2,256 | 457 | 1.4 | % | |||||||||||||
| Ansgar Media, LLC- Class B Units (c) (d) (e) | Media: Broadcasting & Subscription | - | - | 3,519 | 10.4 | % | |||||||||||
| Total Preferred Stock | - | 3,519 | 10.4 | % | |||||||||||||
| GeoCommerce, Inc.(c) | Technology | 875 | 1,883 | 3,684 | 11.0 | % | |||||||||||
| Nuverra Environmental Solutions, Inc.(c) | Environmental Industries | 61 | - | 10 | 0.0 | % | |||||||||||
| Nima, LLC (c) | Consumer Electronics | 2,000 | 1,000 | 2,000 | 5.9 | % | |||||||||||
| Education Management, LLC (c) | Services: Consumer | 1,554 | 876 | - | 0.0 | % | |||||||||||
| Total Warrants | 3,759 | 5,694 | 16.9 | % | |||||||||||||
| Sub Total Equity Securities | $ | 6,015 | $ | 9,670 | 28.7 | % | |||||||||||
| U.S. Government Securities - 21.3%(b) | |||||||||||||||||
| U.S. Treasury Bill | 0.63%, 8/31/2017 | $ | 800 | $ | 799 | $ | 799 | 2.4 | % | ||||||||
| U.S. Treasury Bill | 0.75%, 10/31/2017 | 1,600 | 1,599 | 1,598 | 4.8 | % | |||||||||||
| U.S. Treasury Bill | 0.75%, 8/15/2019 | 1,710 | 1,700 | 1,684 | 5.0 | % | |||||||||||
| U.S. Treasury Bill | 0.63%, 11/30/2017 | 1,700 | 1,699 | 1,696 | 5.0 | % | |||||||||||
| U.S. Treasury Bill | 0.75%, 4/15/2018 | 1,400 | 1,398 | 1,396 | 4.1 | % | |||||||||||
| Sub Total U.S. Government Securities | $ | 7,210 | $ | 7,195 | $ | 7,173 | 21.3 | % | |||||||||
| Investments - Money Market - 0.5%(b) | |||||||||||||||||
| Investments - U.S. Bank Money Market | 0.10% | $ | 34 | $ | 34 | $ | 34 | 0.1 | % | ||||||||
| Investments - Wells Fargo Money Market | 0.01% | 123 | 123 | 123 | 0.4 | % | |||||||||||
| Sub Total Investments - Money Market | $ | 157 | $ | 157 | $ | 157 | 0.5 | % | |||||||||
| TOTAL INVESTMENTS - 120.2%(b) | $ | 41,582 | $ | 40,502 | 120.2 | % | |||||||||||
(a) All of our investments are issued by eligible U.S. portfolio companies, as defined in the Investment Company Act of 1940, except for Caesar's Entertainment Corp., Education Management LLC, NII Capital Corp., QuickSilver Resources, Inc., and Suntech Power Holdings Company, Ltd. Non-qualifying assets represent 8.8% of the Company's portfolio at fair value. As a BDC, the Company can only invest 30% of its portfolio in non-qualifying assets.
(b) Percentages are based on net assets of $27,424 as of December 31, 2013.
(c) Non-U.S. company. The principal place of business for Suntech Power Holdings Company, Ltd. is China.
(d) The issuer has the option of paying interest in additional notes, in which event the interest rate is 15%.
| (a) | Represents a non-qualifying investment as defined under Section 55 (a) of the Investment Company Act of 1940, as amended. Non-qualifying investments represent 0.1% of the Fund's (VII Peaks Co-OptivistTM Income BDC, II, Inc.) portfolio at fair value. As a BDC, the Fund can only invest 30% of its portfolio in non-qualifying assets. |
| (b) | Percentages are based on net assets of $33,682 as of December 31, 2016. |
| (c) | Non-income producing as of December 31, 2016. |
| (d) | 2,500 Class B Units, which are not entitled to an allocation of profits or losses until the earlier to occur of 9/30/2020 or a change of control of Ansgar Media, LLC. |
| (e) | As defined in the 1940 Act, Affiliated Investments are defined as those Non-Control Investments in companies in which we own between 5.0% and 25.0% of the voting securities. |
| (f) | The company filed for bankruptcy in Delaware on August 8, 2016 and is in the final stages of restructuring. The Fund participated in DIP financing as part of company’s restructuring process during bankruptcy and has received PIK Second Lien Exit Facility T/L in exchange. The Fund also participated in Equity exchange which is still in process and is expected to complete soon. |
| (g) | On November 25, 3.00% PIK senior unsecured convertible notes were exchanged out for mandatory conversion to shares of common stock of Aspect Software Parent, Inc. at a rate of 1/30 i.e. one common share per $30.00 in principal amount of notes outstanding. |
| (h) | On September 20, 2016, Claire's Stores 10.50% senior subordinated notes and 8.875% senior secured second lien notes were exchanged out for mandatory conversion to Claire's Stores, Inc. First Lien Term Loan, CLSIP LLC Term Loan and Claire's (Gibraltar) Holdings Limited Term Loan. |
| (i) | On December 6, 2016, the bankruptcy court entered an order confirming the plan of reorganization of UCI International, LLC according to which the holders of senior unsecured notes will receive new common stock at the rate of $21.94 per $1,000 par value of notes. The exchange is still in progress. |
The accompanying notes are an integral part of these financial statements.
| F-7 |
VII PEAKS CO-OPTIVIST INCOME BDC II, INC.
SCHEDULE OF INVESTMENTS
(dollars and shares in thousands)
December 31, 20122015
| Portfolio Company (a) | Industry | Investment Coupon Rate, MaturityDate | Principal | Amortized Cost | Fair Value | % of Net Assets | ||||||||||||||
| Senior Secured First Lien Debt - 10.0% (b) | ||||||||||||||||||||
| Apria Healthcare Group, Inc. | Healthcare & Pharmaceuticals | 11.25%, 11/01/2014 | $ | 150 | $ | 155 | $ | 155 | 2.0 | % | ||||||||||
| GXS Worldwide, Inc. | Services: Business | 9.75%, 6/15/2015 | 350 | 364 | 365 | 4.4 | % | |||||||||||||
| Rotech Healthcare, Inc. | Healthcare & Pharmaceuticals | 10.75%, 10/15/2015 | 300 | 300 | 299 | 3.6 | % | |||||||||||||
| Sub Total Senior Secured First Lien Debt | 800 | 819 | 819 | 10.0 | % | |||||||||||||||
| Senior Secured Second Lien Debt - 10.3% (b) | ||||||||||||||||||||
| Apria Healthcare Group, Inc. | Healthcare & Pharmaceuticals | 12.38%, 11/1/2014 | $ | 150 | $ | 149 | $ | 149 | 1.8 | % | ||||||||||
| Aspect Software, Inc. | Telecommunications | 10.63%, 5/15/2017 | 400 | 409 | 362 | 4.3 | % | |||||||||||||
| Logan's Roadhouse, Inc. | Beverage, Food & Tobacco | 10.75%, 10/15/2017 | 375 | 353 | 348 | 4.2 | % | |||||||||||||
| Sub Total Senior Secured Second Lien Debt | 925 | 911 | 859 | 10.3 | % | |||||||||||||||
| Senior Unsecured Debt - 37.3% (b) | ||||||||||||||||||||
| Alliance HealthCare Services, Inc. | Healthcare & Pharmaceuticals | 8.00%, 12/1/2016 | $ | 250 | $ | 217 | $ | 227 | 2.7 | % | ||||||||||
| Alliance One International, Inc. | Beverage, Food & Tobacco | 10.00%, 7/15/2016 | 400 | 418 | 421 | 5.1 | % | |||||||||||||
| Avaya, Inc. | Telecommunications | 9.75%, 11/01/2015 | 225 | 198 | 200 | 2.4 | % | |||||||||||||
| Avaya, Inc. | Telecommunications | 10.13%, 11/01/2015 | 225 | 198 | 201 | 2.4 | % | |||||||||||||
| Bon-ton Department Stores, Inc. | Retail | 10.25%, 3/15/2014 | 350 | 351 | 347 | 4.2 | % | |||||||||||||
| Claire's Stores, Inc. | Retail | 9.63%, 6/01/2015 | 235 | 219 | 217 | 2.6 | % | |||||||||||||
| Education Management LLC | Services: Consumer | 8.75%, 6/1/2014 | 400 | 343 | 321 | 3.9 | % | |||||||||||||
| First Data Corp. | Banking, Finance, Insurance & Real Estate | 10.55%, 9/24/2015 | 175 | 181 | 179 | 2.1 | % | |||||||||||||
| First Data Corp. | Banking, Finance, Insurance & Real Estate | 9.88%, 9/24/2015 | 175 | 180 | 179 | 2.1 | % | |||||||||||||
| Seitel, Inc. | High Tech Industries | 9.75%, 2/15/2014 | 350 | 355 | 351 | 4.2 | % | |||||||||||||
| Suntech Power Holdings Company, Ltd. (c) | Environmental Industries | 3.00%, 3/15/2013 | 100 | 91 | 46 | 0.5 | % | |||||||||||||
| Travelport LLC | Services: Consumer | 9.88%, 9/01/2014 | 250 | 216 | 220 | 2.6 | % | |||||||||||||
| YCC Holdings LLC (d) | Consumer goods: Non-durable | 10.25%, 2/15/2016 | 200 | 207 | 206 | 2.5 | % | |||||||||||||
| Sub Total Senior Unsecured Debt | 3,335 | 3,174 | 3,115 | 37.3 | % | |||||||||||||||
| Senior Subordinated Debt -12.3% (b) | ||||||||||||||||||||
| Sealy Mattress Co. | Consumer goods: Durable | 8.25%, 6/15/2014 | $ | 400 | $ | 404 | $ | 401 | 4.8 | % | ||||||||||
| Serena Software, Inc. | High Tech Industries | 10.38%, 3/15/2016 | 410 | 424 | 420 | 5.0 | % | |||||||||||||
| The Yankee Candle Company, Inc. | Consumer goods: Non-durable | 9.75%, 2/15/2017 | 200 | 210 | 209 | 2.5 | % | |||||||||||||
| Sub Total Senior Subordinated Debt | 1,010 | 1,038 | 1,030 | 12.3 | % | |||||||||||||||
| Investments - Money Market -15.6% | ||||||||||||||||||||
| Investments - Money Market | $ | 1,304 | 1,304 | 1,304 | 15.6 | % | ||||||||||||||
| Sub Total Investments - Money Market | 1,304 | 1,304 | 1,304 | 15.6 | % | |||||||||||||||
| TOTAL INVESTMENTS - 85.5% (b) | $ | 7,246 | $ | 7,127 | 85.5 | % | ||||||||||||||
| Portfolio Company | Industry | Investment Coupon Rate, Maturity Date | Principal / No. of Shares | Amortized Cost | Fair Value | % of Net Assets | |||||||||||
| Senior Secured First Lien Debt - 31.6%(b) | |||||||||||||||||
| American Media, Inc. | Media: Advertising, Printing & Publishing | 11.50%, 12/15/2017 | $ | 1,320 | $ | 1,363 | $ | 1,300 | 4.6 | % | |||||||
| Ansgar Media, LLC(f) | Media: Broadcasting & Subscription | 12.00%, 9/8/2017 | 2,000 | 2,000 | 2,000 | 7.0 | % | ||||||||||
| APX Group, Inc. | Services: Consumer | 6.38%, 12/1/2019 | �� | 825 | 825 | 796 | 2.8 | % | |||||||||
| Caesars Entertainment Operating Co., Inc.(a) (d) | Hotel, Gaming & Leisure | 11.25%, 6/1/2017 | 860 | 751 | 639 | 2.2 | % | ||||||||||
| EarthLink Holdings Corp. | Telecommunications | 7.38%, 6/1/2020 | 40 | 41 | 41 | 0.1 | % | ||||||||||
| Endeavour International Corp.(d) | Energy: Oil & Gas | 12.00%, 3/1/2018 | 525 | 551 | 525 | 1.8 | % | ||||||||||
| Goodman Networks, Inc. | Telecommunications | 12.13%, 7/1/2018 | 800 | 837 | 216 | 0.8 | % | ||||||||||
| Kratos Defense & Security Solutions, Inc. | Aerospace and Defense | 7.00%, 5/15/2019 | 1,112 | 981 | 758 | 2.7 | % | ||||||||||
| Ryerson Inc./Joseph T Ryerson & Son, Inc. | Metals & Mining | 9.00%, 10/15/2017 | 1,315 | 1,355 | 1,018 | 3.6 | % | ||||||||||
| Titan International, Inc. | Automobile | 6.88%, 10/1/2020 | 1,500 | 1,390 | 1,095 | 3.8 | % | ||||||||||
| Toys R Us Property Co II, LLC | Retail | 8.50%, 12/1/2017 | 725 | 732 | 620 | 2.2 | % | ||||||||||
| Sub Total Senior Secured First Lien Debt | $ | 11,022 | $ | 10,826 | $ | 9,008 | 31.6 | % | |||||||||
| Senior Secured Second Lien Debt - 6.3%(b) | |||||||||||||||||
| Aspect Software, Inc. | Telecommunications | 10.63%, 5/15/2017 | $ | 1,302 | $ | 1,314 | $ | 1,016 | 3.5 | % | |||||||
| Claire's Stores, Inc. | Retail | 8.88%, 3/15/2019 | 825 | 809 | 190 | 0.7 | % | ||||||||||
| Endeavour International Corp.(d) | Energy: Oil & Gas | 12.00%, 6/1/2018 | 725 | 708 | 8 | 0.0 | % | ||||||||||
| Logan's Roadhouse, Inc. | Beverage, Food & Tobacco | 10.75%, 10/15/2017 | 770 | 748 | 531 | 1.9 | % | ||||||||||
| Saratoga Resources, Inc.(d) | Energy: Oil & Gas | 12.50%, 7/1/2016 | 885 | 912 | 44 | 0.2 | % | ||||||||||
| Sub Total Senior Secured Second Lien Debt | $ | 4,507 | $ | 4,491 | $ | 1,789 | 6.3 | % | |||||||||
| Senior Unsecured Debt - 22.0%(b) | |||||||||||||||||
| APX Group, Inc. | Services: Consumer | 8.75%, 12/1/2020 | $ | 575 | $ | 556 | $ | 472 | 1.6 | % | |||||||
| Caesar's Entertainment Corp.(a) (d) | Hotel, Gaming & Leisure | 10.75%, 2/1/2016 | 495 | 451 | 126 | 0.4 | % | ||||||||||
| Clear Channel Communications | Media: Broadcasting & Subscription | 10.00%, 1/15/2018 | 1,400 | 1,354 | 539 | 1.9 | % | ||||||||||
| Colt Defense, LLC(d) | Aerospace and Defense | 8.75%, 11/15/2017 | 1,253 | 1,029 | 132 | 0.5 | % | ||||||||||
| DynCorp International, Inc. | Aerospace and Defense | 10.38%, 7/1/2017 | 1,135 | 1,143 | 846 | 3.0 | % | ||||||||||
| EarthLink Holdings Corp. | Telecommunications | 8.88%, 5/15/2019 | 279 | 274 | 284 | 1.0 | % | ||||||||||
| Gymboree Corp. | Retail | 9.13%, 12/1/2018 | 810 | 774 | 182 | 0.6 | % | ||||||||||
| Nuverra Environmental Solutions, Inc. | Environmental Industries | 9.88%, 4/15/2018 | 1,325 | 1,351 | 457 | 1.6 | % | ||||||||||
| Ryerson Inc./Joseph T Ryerson & Son, Inc. | Metals & Mining | 11.25%, 10/15/2018 | 1,500 | 1,528 | 1,117 | 3.9 | % | ||||||||||
| Seitel, Inc. | Energy: Oil & Gas | 9.50%, 4/15/2019 | 1,575 | 1,574 | 1,016 | 3.6 | % | ||||||||||
| Suntech Power Holdings Company, Ltd.(a) (c) (d) | Environmental Industries | 3.00%, 5/15/2013 | 100 | 109 | - | 0.0 | % | ||||||||||
| Toys R Us, Inc. | Retail | 10.38%, 8/15/2017 | 860 | 820 | 619 | 2.2 | % | ||||||||||
| UCI International, Inc. | Automobile | 8.63%, 2/15/2019 | 1,400 | 1,367 | 483 | 1.7 | % | ||||||||||
| Sub Total Senior Unsecured Debt | $ | 12,707 | $ | 12,330 | $ | 6,273 | 22.0 | % | |||||||||
| Senior Subordinated Debt - 5.2%(b) | |||||||||||||||||
| Claire's Stores, Inc. | Retail | 10.50%, 6/1/2017 | $ | 715 | $ | 713 | $ | 357 | 1.2 | % | |||||||
| DJO Finance, LLC | Healthcare & Pharmaceuticals | 10.75%, 4/15/2020 | 1,265 | 1,322 | 1,139 | 4.0 | % | ||||||||||
| QuickSilver Resources, Inc.(d) | Energy: Oil & Gas | 7.13%, 4/1/2016 | 890 | 843 | - | 0.0 | % | ||||||||||
| Sub Total Senior Subordinated Debt | $ | 2,870 | $ | 2,878 | $ | 1,496 | 5.2 | % | |||||||||
| Equity Securities - 11.3%(b) | |||||||||||||||||
| Affinion Group, Inc.(d) | Media: Advertising, Printing & Publishing | 13 | $ | 689 | $ | 816 | 2.9 | % | |||||||||
| Ansgar Media, LLC(d) (f) | Media: Broadcasting & Subscription | - | - | 2,102 | 7.4 | % | |||||||||||
| Education Management, LLC(d) | Services: Consumer | 2,530 | 5 | 177 | 0.6 | % | |||||||||||
| NII Holdings, Inc. (a) (d) | Telecommunications | 17 | 768 | 84 | 0.3 | % | |||||||||||
| Total Common Stock | 1,462 | 3,179 | 11.2 | % | |||||||||||||
| Relativity Media, LLC(d) (e) | Media: Broadcasting & Subscription | 855 | 10,400 | - | 0.0 | % | |||||||||||
| Total Preferred Stock | 10,400 | - | 0.0 | % | |||||||||||||
| Education Management LLC(d) | Services: Consumer | 1,554 | 876 | 31 | 0.1 | % | |||||||||||
| Total Warrants | 876 | 31 | 0.1 | % | |||||||||||||
| Sub Total Equity Securities | $ | 12,738 | $ | 3,210 | 11.3 | % | |||||||||||
| U.S. Government Securities -17.4%(b) | |||||||||||||||||
| U.S. Treasury Bill | 0.18%, 4/28/2016 | $ | 4,950 | $ | 4,947 | $ | 4,946 | 17.4 | % | ||||||||
| Sub Total U.S. Government Securities | $ | 4,950 | $ | 4,947 | $ | 4,946 | 17.4 | % | |||||||||
| Investments - Money Market - 21.8%(b) | |||||||||||||||||
| Investments - Morgan Stanley Money Market | 0.01% | $ | 3,191 | $ | 3,191 | $ | 3,191 | 11.2 | % | ||||||||
| Investments - U.S. Bank Money Market | 0.02% | - | - | - | 0.0 | % | |||||||||||
| Investments - Wells Fargo Money Market | 0.01% | 3,019 | 3,019 | 3,019 | 10.6 | % | |||||||||||
| Sub Total Investments - Money Market | $ | 6,210 | $ | 6,210 | $ | 6,210 | 21.8 | % | |||||||||
| TOTAL INVESTMENTS - 115.6%(b) | $ | 54,420 | $ | 32,932 | 115.6 | % | |||||||||||
(a) All of our investments are issued by eligible U.S. portfolio companies, as defined in the Investment Company Act of 1940, except for Alliance One International, Inc., Education Management LLC and Suntech Power Holdings Company, Ltd. Non-qualifying assets represent 11.1% of the Company's portfolio at fair value. As a BDC, the Company can only invest 30% of its portfolio in non-qualifying assets.
(b) Percentages are based on net assets of $8,336 as of December 31, 2012.
(c) Non-U.S. company. The principal place of business for Suntech Power Holdings Company, LTD is China.
(d) The issuer has the option of paying interest in additional notes, in which event the interest rate is 11%
| (a) | Represents a non-qualifying investment as defined under Section 55 (a) of the Investment Company Act of 1940, as amended. Non-qualifying investments represent 2.6% of the Company's portfolio at fair value. As a BDC, the Company can only invest 30% of its portfolio in non-qualifying assets. |
| (b) | Percentages are based on net assets of $28,490 as of December 31, 2015. |
| (c) | Non-U.S. company. The principal place of business for Suntech Power Holdings Company, Ltd. is China. |
| (d) | Non-income producing as of December 31, 2015. |
| (e) | The Class E Units are entitled to PIK dividends at the rate of 12.5% per annum, payable in additional Class E Units. The PIK dividends accrue quarterly in advance on the first day of each quarter, but are only issuable immediately prior to the mandatory redemption of the Class E Units, and are not issuable upon a conversion of the Class E Units to other equity interests of the issuer. We stopped accruing dividends starting July 30, 2015 when Relativity Media, LLC and certain of its subsidiaries filed voluntarily petitions under Chapter 11 of the United States Bankruptcy Code. |
| (f) | As defined in the 1940 Act, Affiliated Investments are defined as those Non-Control Investments in companies in which we own between 5.0% and 25.0% of the voting securities. |
The accompanying notes are an integral part of these financial statements.
| F-8 |
VII PEAKS CO-OPTIVIST INCOME BDC II, INC.
NOTES TO FINANCIAL STATEMENTS
December 31, 20132016
Note 1. Nature of Operations
VII Peaks Co-OptivistTM Income BDC II, Inc. (the “Fund”, “our” or “we”), a Maryland corporation formed on August 3, 2011, is an externally managed, non-diversified closed-end management investment company that has elected to be treated as a business development company (“BDC”) under the Investment Company Act of 1940, as amended (the “1940or (“1940 Act”). The Fund hasIn addition, we have elected to be treated for federal income tax purposespurpose, and intend to qualify annually, as a regulated investment company, or (“RIC”), under subchapterSubchapter M of the Internal Revenue Code of 1986, as amended, or (the “Code”). The Fund intends to
We invest in discounted corporate debt, senior secured term loan and equity-linked debt securities of public and private companies whose securitiesthat trade on the secondary loan market for institutional investors and provide distributions to investors. The debt is generally high-yield and non-investment grade. At the same time, we actively work with the target company’s management to restructure the underlying securities and improve the liquidity position of the target company’s balance sheet. We employ a proprietary “Co-Optivist”TM approach (“cooperative activism”) in executing our investment strategy, which entails proactively engaging the target company management on average 24 months prior to a redemption event (typically a put or maturity event) to create an opportunity for growth in the investments. Co-OptivistTM is a registered trademark of VII Peaks Capital, LLC, or (“VII Peaks” or the “Manager”), and is being used with their permission. Our strategy is not dependent on restructuring to generate distributions. Capital appreciation on securities is generally not realized evenly over the holding period. In some instances market prices for securities may continue to reflect a discount until a relatively short time period prior to a redemption event. The potential capital gain typically occurs during the end of the holding period of a bond in our portfolio when securities are either called by the company or exchanged for new securities during refinance. We have tendered certain debt securities well above the market-traded deep discount. In addition, we also provide direct loans with equity warrant coverage to portfolio companies to help facilitate corporate expansion.
Our investment objectives are to generate current income and capital appreciation. We meet our investment objectives by: (i) realizing income and capital appreciation through the acquisition, management and orderly liquidation of corporate debt securities, (ii) making distributions of available distributable cash to our shareholders, and (iii) preserving the capital investments of our shareholders.
Our proprietary “Co-Optivist”TM approach entails investment in the corporate debt and equity-linked debt securities of target companies, or Target Investments, in conjunction with proactively engaging the target companies’ management. We acquire Target Investments whose debt securities trade on the over-the-counter market for institutional loans at a discount to their par redemption value, and will be subject to a “redemption event” within (on average) 24 months. We also invest directly in debt of private companies. We define a “redemption event” as a maturity event or a put event (where investors in the target company’s debt security can have a redemption right at a pre-determined price). We hold such debt an average of 12 – 18 months, during which time we anticipate working actively with the target company’s management to effect and/or participate in a restructuring or exchange of the invested securities for new securities.
We make investments in target companies that meet our investment criteria. The size of an individual investment will vary based on numerous factors, including the amount of funds raised in our offering. However, assuming we raise the maximum offering amount of $750.0 million, we expect to hold at least 50 investments, and we anticipate that the minimum investment size will be approximately $250,000. We do not anticipate being heavily invested in any one industry, and generally, we do not expect to invest in more than two different classes of debt of the same target company. We invest in debt and equity-linked debt of target companies with a minimum enterprise value of $200.0 million and whose debt and equity-linked debt is actively traded in the secondary loan market. We also make senior secured direct loan investments in companies with a minimum enterprise value of $5.0 million. For such senior secured direct loan investments, we may receive equity securities to boost overall returns. We expect our portfolio to be predominantly composed of fixed-rate high-yield, senior secured term loan and equity-linked corporate debt securities. However, we may also purchase senior secured corporate debt securities which may have variable interest rates. We currently anticipate that the portion of our portfolio composed of variable rate corporate debt securities, if any, will not exceed 20%, but we may increase that to 33% of our aggregate portfolio at the time of any purchase depending on market opportunities.
We offer our shareholders the ability to receive distributions as well as the potential capital appreciation resulting from the restructuring of the debt of our target companies. To the extent we have distributable income available we anticipate making distributions on a monthly basis to our shareholders.
We are managed by VII Peaks Capital, LLC, which is registered as an investment adviser with the Securities and Exchange Commission, or (“SEC”). Our Manager is responsible for sourcing potential investments, analyzing investment opportunities, structuring our investments, and monitoring our investments and portfolio companies on an ongoing basis.
| F-9 |
On August 9, 2011, the Fundwe filed a registration statement on Form N-2 to sell up to 75,000,000 shares of common stock, $0.001 par value per share, at an initial public offering price of $10.00 per share. The registration statement was declared effective by the Securities Exchange Commission (the “SEC”)SEC on March 1, 2012. The Fund was to commenceWe commenced operations when itwe raised gross offering proceeds of over $1.0 million, all of which was from persons who were not affiliated with the Fundus or VII Peaks-KBR BDC Advisor II, LLCour Manager by one year from the date the registration statement was declared effective by the SEC. Prior to the successful satisfaction of that condition, all subscription payments were placed in an account held by the escrow agent, UMB Bank, N.A., in trust for the benefit of the Fund’sour subscribers, pending release to the Fund. The Fundus. We achieved the minimum offering requirement on July 10, 2012 and commenced operations on such date. As of December 31, 2013, the Fund2016, we issued 3.26.3 million shares of common stock, for gross proceeds of $31.6including 0.5 million including $0.7 million ofshares under our distribution reinvestment plan (“DRIP”).
As of August 20, 2013, the independent Board Members of the Fund by unanimous vote agreed, less 0.3 million shares redeemed under our tender offer. Gross proceeds from our common stock issuances total $62.6 million, including $4.7 million under our DRIP less $2.9 million paid to terminate the investment advisory agreement between the Fund and VII Peaks-KBR BDC Advisor II, LLC (the “Prior Manager”) and enter into an investment advisory agreement with VII Peaks Capital, LLC (the “Manager” or “VII Peaks”) that provides for the same compensation as set forthredeem shares in the Fund’s agreement with itsour prior investment advisor, VII Peaks-KBR BDC Advisor II, LLC.quarterly tender offers.
Note 2. Summary of Significant Accounting Policies
Basis of Presentation
The accompanying financial statements of the Fund have beenincluded herein were prepared in conformity with accounting principles generally accepted in the United States of America ("U.S. GAAP") and pursuant to the requirements for reporting on Form 10-K.
During the second quarter10-K and Articles 6 or 10 of fiscal 2013, the Fund restated its financial statements for organization and offering expenses in order to comply with the terms of the investment advisory agreement between the Fund and the Manager. Previously, the Fund expensed all organization costs as they were incurred by the Manager. Previously, the Fund capitalized all offering expenses incurred prior to the date of commencement of operations as deferred offering costs and amortized that amount over 12 months from the date of commencement of operations, and expensed all offering costs incurred by the Manager after the commencement of operations as they were incurred by the Manager. However, because theRegulation S-X. The Fund is only obligated to reimburse the Manager to the extent of 1.5% of gross offering proceeds, the Fund restated its financial statements to reflect the expense and obligation to the Manager only as they are payable to the Manager at 1.5% of offering proceeds.a single reportable segment.
Use of Estimates in the Preparation of Financial Statements
The preparation of the accompanying financial statements in conformity with U.S. GAAP requires management to make estimates and assumptions that affect the reported amounts of assets and liabilities, and disclosure of contingent assets and liabilities at the date of the financial statements, and income, gains (losses) and expenses during the period reported. Actual results could differ materially from those estimates.
Investments – Money Market
The Fund has classified its money market investments as investments carried at fair value.
Investment Classification
The Fund classifies its investments in accordance with the requirements of the 1940 Act. Under the 1940 Act, “Control Investments” are defined as investments in companies in which we own more than 25.0% of the voting securities or maintain greater than 50.0% of the board representation. Under the 1940 Act, “Affiliated Investments” are defined as those non-control investments in companies in which we own between 5.0% and 25.0% of the voting securities. Under the 1940 Act, “Non-affiliated Investments” are defined as investments that are neither Control Investments nor Affiliated Investments.
Organizational and Offering Costs
The Fund is a closed-end fund with a continuous offering period. Under the investment advisory agreement between the Fund and the Manager, our Manager fronts the initial cost of the organizational and offering expenses, which are reimbursable bybut the Fund with upis obligated to areimburse the Manager for such costs to the extent of 1.5% of the gross offering proceeds.proceeds in our continuous offering. The Fund also agreed to reimburse the Manager for organization and offering expenses incurred by a prior manager in consideration for the Manager’s agreement to pay $1.3 million owed to the Fund by the prior manager under an expense reimbursement agreement, which amount the Manager paid in full during the year ended December 31, 2014. The Fund expenses organizational and offering costs as they become payable under the investment advisory agreement.
U.S. Federal Income Taxes
The Fund has elected to be treated for federal income tax purposes as a RIC under subchapterSubchapter M of the Code (the “Code”) and to operate in a manner so as to qualify for the tax treatment applicable to RICs. In order to qualify as a RIC, among other things, the Fund is required to annually distribute to its stockholders at least 90% of investment company taxable income, as defined by the Code. So long as the Fund maintains its status as a RIC, it generally will not pay corporate-level U.S. federal income taxes on any ordinary income or capital gains that it distributes at least annually to its stockholders as distributions. Rather, any tax liability related to income earned by the Fund represents obligations of the Fund’s investors and will not be reflected in the financial statements of the Fund. The Fund will also be subject to nondeductible federal excise taxes if it does not distribute at least 98% of net ordinary income, 98.2% of capital gain net income, if any, and any recognized and undistributed income from prior years for which it paid no federal income taxes.
The Fund has evaluated the implications of Accounting Standards Codification (“ASC”) Topic 740,Accounting for Income Taxes,(“ASC Topic 740,740”) for all open tax years and in all major tax jurisdictions, and determined that there is no material impact on the financial statements. The Fund continues to remain subject to examination by U.S. federal and state authorities for the years 2010 through 2013.
| F-10 |
New Accounting Pronouncements
In June 2013,November 2016, the Financial Accounting Standards Board (“FASB”) issued Accounting Standards Update (“ASU”) 2013-08, Financial Services – Investment Companies (Accounting Standards Codification2016-18,Statement of Cash Flows (Topic 230):Restricted Cash (“ASC”ASU 2016-18”) Topic 946), which affects the scope, measurement and disclosure requirements for investment companies under GAAP. The amendments (i) change the approach to the investment company assessment in ASC Topic 946, clarify the characteristics of an investment company, and provide comprehensive guidance for assessing whether an entity is an investment company; (ii) require an investment company to measure non-controlling ownership interests in other investment companies at fair value rather than the equity method of accounting; and (iii) require the following additional disclosures (a) the fact. ASU 2016-18 requires that the entity is an investment companystatements of cash flows explain the change during the period in the total of cash, cash equivalents, and is applyingamounts generally described as restricted cash or restricted cash equivalents. Therefore, amounts generally described as restricted cash and restricted cash equivalents should be included with cash and cash equivalents when reconciling the guidance in ASC Topic 946, (b) information about changes, if any, in an entity’s status as an investment company,beginning-of-period and (c) information about financial support provided or contractually required to be provided by an investment company to anyend-of-period total amounts shown on the statements of its investees. Thiscash flows. The new guidance is effective for interim an annual reportingand interim periods, beginning on or after December 15, 2013. The Fund2017, and early adoption is permitted and is to be applied on a retrospective basis. Management is currently assessingevaluating the impacts ASU 2013-08impact this guideline will have on itsthe Fund's financial statements.
In January 2013,2016, the FASB issued ASU 2016-01, Financial Instruments —Overall (Subtopic 825-10):Recognition and Measurement of Financial Assets and Financial Liabilities (“ASU 2016-01”). ASU 2016-01 retains many current requirements for the classification and measurement of financial instruments; however, it significantly revises an entity’s accounting related to (1) the classification and measurement of investments in equity securities and (2) the presentation of certain fair value changes for financial liabilities measured at fair value. ASU 2016-01 also amends certain disclosure requirements associated with the fair value of financial instruments. This guidance is effective for annual and interim periods beginning after December 15, 2017, and early adoption is not permitted for public business entities. Management is currently evaluating the impact this guideline will have on the Fund's financial statements.
In August 2014, FASB issued ASU No. 2014-15, Presentation of Financial Statements- Going Concern (Subtopic 205-40) ("ASU 2014-15"). ASU 2014-15 requires management to assess an entity's ability to continue as a going concern by incorporating and expanding upon certain principles that are currently in U.S. auditing standards. Specifically, the amendments (1) provide a definition of the term substantial doubt, (2) require an evaluation every reporting period, including interim periods, (3) provide principles for considering the mitigating effect of Management's plans, (4) require certain disclosures when substantial doubt is alleviated as a result of consideration of Management's plans, (5) require an express statement and other disclosures when substantial doubt is not alleviated, and (6) require an assessment for a period of one year after the date that the financial statements are issued (or available to be issued). The amendments in ASU 2014-15 are effective for the annual period ending after December 15, 2016, and for any annual periods and interim periods thereafter. We adopted the provisions of ASU 2014-15 in 2016. The adoption of ASU 2014-15 did not require any additional disclosures in our financial statements for the year ended December 31, 2016.
In May 2014, the FASB issued ASU No. 2013-01, Balance Sheet2014-09,Revenue with Contracts from Customers (Topic 210): Clarifying606). ASU No. 2014-09 provides clarification on the Scopeprinciples to recognize revenue and to develop a common standard between GAAP and IFRS. In August 2015, the FASB issued ASU 2015-14, which defers the effective date of Disclosures about Offsetting AssetsASU 2014-09,Revenue with Contracts from Customers, to annual reporting periods beginning after December 15, 2017, including interim reporting periods within that reporting period. Management continues to review the requirements and Liabilities, which clarifies which instruments and transactions are subject tobelieves the offsetting disclosure requirements originally established by ASU 2011-11. The new ASU addresses preparer concerns that the scopeadoption of the disclosure requirements under ASU 2011-11 was overly broad and imposed unintended costs that were not commensurate with estimated benefits to financial statement users. In choosing to narrow the scope of the offsetting disclosures, the Board determined that it could make them more operable and cost effective for preparers while still giving financial statement users sufficient information to analyze the most significant presentation differences between financial statements prepared in accordance with GAAP and those prepared under International Financial Reporting Standards (“IFRS”). Like ASU 2011-11, the amendments in this update will be effective for fiscal periods beginning on, or after January 1, 2013. The adoption of ASU 2013-01 did not have a material impact on our financial position or results of operations.
In December 2011, the FASB issued ASU No. 2011-11, Disclosures about Offsetting Assets and Liabilities, which requires entities to disclose information about offsetting and related arrangements to enable users of its financial statements to understand the effect of those arrangements on its financial position. The guidance is effective for fiscal years and interim periods beginning on or after January 1, 2013 with retrospective application for all comparative periods presented. The adoption of this guidance, which is related to disclosure only, did not have a material impact on the Fund’s financial position, results of operations or cash flows.statements.
Revenue Recognition
We generate investment income in the form of interest, dividend and fees earned on senior secured loans, senior secured notes, subordinated debt, senior unsecured debt, senior unsecured convertible debt and collateralized securities in our portfolio. The level of income we receive is directly related to the balance of collectible income producing investments multiplied by the coupon rate of our investments. Coupon interest income is adjusted for the amortization of premiums and accretion of discounts. We record interest income on an accrual basis to the extent that we expect to collect such amounts. The Fund stops accruing when the invested company defaults in payment and has passed the 30-day grace period, files for bankruptcy or goes through reorganization converting bonds to equity. We expect the dollar amount of interest and any dividend income that we earn to increase as the size of our investment portfolio increases.
Dividend income is recognized on the ex-dividend date for common equity securities and on an accrual basis for preferred equity securities to the extent that such amounts are expected to be collected or realized. In determining the amount of dividend income to recognize, if any, from cash distributions on common equity securities, we will assess many factors including a portfolio company’s cumulative undistributed income and operating cash flow. Cash distributions from common equity securities received in excess of such undistributed amounts are recorded first as a reduction of our investment and then as a realized gain on investment. We stop accruing interest or dividends on our investments when it is determined that the interest or dividend is not collectible. We assess the collectability of the interest and dividends based on many factors including the portfolio company’s ability to service our loan based on current and projected cash flows as well as the current valuation of the portfolio company’s current total enterprise value. For investments with payment-in-kind (“PIK”) interest and cumulative dividends, we base income and dividend accruals on the valuation of the PIK notes or securities received from the borrower or the redemption value of the security. If the portfolio company valuation indicates a value of the PIK notes or securities or redemption value that is not sufficient to cover the contractual interest or dividend, we will not accrue interest or dividend income on the notes or securities and will record an allowance for any accrued interest or dividend receivable as a reduction of interest or dividend income in the period we determine it is not collectible.
In connection with our debt investments, we may receive warrants or similar equity-related securities ("Warrants"). We determine the cost basis of Warrants based upon their fair values on the date of receipt relative to the total fair value of the debt and Warrants received. Any resulting difference between the face amount of the debt and its recorded cost resulting from the assignment of value to the Warrants is treated as original issue discount (“OID”), and accreted into interest income over the life of the debt investment using a method that approximates the effective interest method. Similarly, loan origination fees are capitalized and amortized as other income over the life of the loan.
For loans and debt securities with contractual payment-in-kind (“PIK”)PIK interest, which represents contractual interest accrued and added to the principal balance, we generally will not accrue PIK interest for accounting purposes if the portfolio company valuation indicates that such PIK interest is not collectible. We do not accrue as a receivable interest on loans and debt securities for accounting purposes if we have reason to doubt our ability to collect such interest. Original issue discounts, market discounts or premiums are accreted or amortized using the effective interest method as interest income. We record prepayment premiums on loans and debt securities as interest income. Dividend income if any, is recognized on an accrual basis to the extent thatwhen we expect to collectreceive such amount.amounts.
Expense Reimbursement Agreement
On November 9, 2012, the Fund entered into an expense reimbursement agreement with the Prior Manager, under which the Prior Manager agreed to reimburse the Fund for all operating expenses recognized on the quarterly financial statements of the Fund for 2012, retroactive to the date of formation of the Fund on August 3, 2011. In 2013, the expense reimbursement agreementOur total investment income was modified to exclude management fees and incentive fees payable to the Manager effective as of January 1, 2013. The Fund recognizes a receivable on its books for the amount due from the Prior Manager under the expense reimbursement agreement, and the Prior Manager recognizes a liability on its books in the same amount. The expense reimbursement agreement allows the Prior Manager and the Fund to offset the receivable in favor of the Fund created under the expense reimbursement agreement against the contingent payable owed by the Fund to the Prior Manager under the investment advisory agreement, resulting in a net receivable or payable position. As of December 31, 2013, the Prior Manager was indebted to the Fund for $1.4$3.1 million of expense reimbursements under the expense reimbursement agreement.
Effective August 20, 2013, the Manager has terminated the expense reimbursement agreement.
Note 3. Restatement of previously issued financial statements.
We determined that we had incorrectly accounted for certain offering costs. The Fund’s agreement with its Manager provides that the Manager is to bear all offering costs, but the Fund is obligated to reimburse the Manager for such offering costs at the rate of 1.5% of gross offering proceeds. The Fund determined that some offering costs were paid by the Fund instead of the Manager during the period from the fourth quarter of 2013 to the fourth quarter of 2014. The restatement reduces operating expenses (and increases net investment income) by the amount of offering costs erroneously paid by the Fund in the relevant period, and reflects the amount as a receivable from the Manager. In the period ending June 30, 2015, the Manager repaid the receivable. At the same time, we have reclassified certain other operating expenses to conform with the Fund’s current method of classifying operating expenses to facilitate comparability of financial statements among different periods. We have restated our financial statements and related footnotes for the year ended December 31, 2013.2016, as compared to $3.5 million for the year ended December 31, 2015 and $3.3 million for the year ended December 31, 2014, respectively. The following tables reconciledecrease in total investment income for the amountsyear ended December 31, 2016 as previously reported in the applicable financial statementcompared to the corresponding restated amounts includedyear ended December 31, 2015 was primarily due to the decrease in this Annual Reportfee income in 2016 as compared to 2015, because in 2015 the 5.0% origination fee was earned and immediately accrued on Form 10-K/A (in thousands, except per share data).our investment in Relativity Media, LLC. The fee income earned on investments in 2016 was lower and is being amortized over the term of the loan instead of realized upon receipt. At December 31, 2016, the weighted average coupon yield was 8.6%, as compared to 7.6% at December 31, 2015 and 10.7% at December 31, 2014. This coupon yield is for the non-defaulted and non-equity positions. Based on current and prior three quarter’s net assets, average net assets as of December 31, 2016 were $31.8 million, as compared to $39.2 and $36.7 million for the years ended December 31, 2015 and 2014, respectively.
| December 31, 2013 | ||||||||
| As previously reported | As restated | |||||||
| Statement of Assets and Liabilities | ||||||||
| Due from related party | $ | 1,354 | $ | 1,405 | ||||
| Total assets | $ | 27,713 | $ | 27,764 | ||||
| Accumulated distribution in excess of net investment income | $ | (660 | ) | $ | (609 | ) | ||
| Total net assets | $ | 27,373 | $ | 27,424 | ||||
| Total liabilities and net assets | $ | 27,713 | $ | 27,764 | ||||
| Net asset value per share | $ | 8.69 | $ | 8.70 | ||||
| Statement of Operations | ||||||||
| Professional fees | $ | 444 | $ | 334 | ||||
| General and administrative | $ | 317 | $ | 427 | ||||
| Organizational and offering expense | $ | 373 | $ | 322 | ||||
| Expenses before expense waivers and reimbursements | $ | 1,688 | $ | 1,637 | ||||
| Total expenses (income) net expense waivers and reimbursements | $ | 912 | $ | 861 | ||||
| Net investment income (loss) | $ | 747 | $ | 798 | ||||
| Net increase (decrease) in net assets resulting from operations | $ | 646 | $ | 697 | ||||
| Per share information - basic and diluted: | ||||||||
| Net investment income (loss) | $ | 0.35 | $ | 0.37 | ||||
| Net increase (decrease) in net assets resulting from operations | $ | 0.30 | $ | 0.32 | ||||
| Statement of Changes in Net Assets | ||||||||
| Net investment income (loss) | $ | 747 | $ | 798 | ||||
| Net increase (decrease) in net assets resulting from operations | $ | 646 | $ | 697 | ||||
| Distributions from net investment income | $ | (746 | ) | $ | (798 | ) | ||
| Distributions from paid in capital | $ | (556 | ) | $ | (504 | ) | ||
| Total increase in net assets | $ | 19,037 | $ | 19,088 | ||||
| Net assets at end of period | $ | 27,373 | $ | 27,424 | ||||
| Accumulated distribution in excess of net investment income | $ | (660 | ) | $ | (609 | ) | ||
| Statement of Cash Flows | ||||||||
| Net increase (decrease) in net assets resulting from operations | $ | 646 | $ | 697 | ||||
| Due from related party | $ | (799 | ) | $ | (850 | ) | ||
| F-11 |
For the year ended December 31, 2016, thirteen of the investments in the portfolio did not accrue interest as either the investment is an equity security or the issuers were in default of the coupon payment for more than the thirty-day grace period. Interest income was accrued through the date of the last coupon payment received for the debt investments. The following table presents those thirteen investments:
| Portfolio Company | Asset Type | Investment Coupon Rate | Maturity Date | |||||
| Affinion Group, Inc. (2) | Equity – Common Stock | - | - | |||||
| Ansgar Media, LLC - Class B Units | Equity – Preferred Stock | - | - | |||||
| Aspect Software, Inc.(3) | Equity – Common Stock | - | - | |||||
| Aspire Holdings(1) | Equity – Common Stock | - | - | |||||
| Education Management, LLC | Equity – Common Stock | - | - | |||||
| Education Management, LLC(4) | Warrant | - | - | |||||
| GeoCommerce, Inc. | Warrant | - | - | |||||
| Logan's Roadhouse, Inc.(7) | Senior Secured Second Lien Debt | 10.75 | % | October 15, 2017 | ||||
| NII Holdings, Inc. (5) | Equity – Common Stock | - | - | |||||
| Nima, LLC | Warrant | - | - | |||||
| Nuverra Environmental Solutions, Inc.(6) | Warrant | - | - | |||||
| Saratoga Resources, Inc. | Senior Secured Second Lien Debt | 12.50 | % | July 1, 2016 | ||||
| UCI International, Inc. | Senior Unsecured Debt | 8.63 | % | February 15, 2019 | ||||
| (1) | Converted from exchange of 12.00% Endeavour International Corp first lien bonds. |
| (2) | Received in exchange of 13.50% senior subordinated bonds. |
| (3) | Converted from exchange of 3.00% PIK senior unsecured convertible notes. |
| (4) | Received in exchange of 15.00% Cash/PIK bonds. |
| (5) | Received in exchange of 10.00% senior unsecured debt. |
| (6) | Received early exchange fees in form of warrants for participating in the exchange offer. |
| (7) | The company filed for bankruptcy in Delaware on August 8, 2016 and is in the final stages of restructuring. The Fund participated in DIP financing as part of company’s restructuring process during bankruptcy and has received PIK Second Lien Exit Facility T/L in exchange. The Fund also participated in Equity exchange which is still in process and is expected to complete soon. |
The following table presents four investments that were completely written off during the year ended December 31, 2016:
| Portfolio Company | Asset Type | Investment Coupon Rate | Maturity Date | |||||
| Aspect Software, Inc. | Senior Secured Second Lien Debt | 10.63 | % | May 15, 2017 | ||||
| Suntech Power Holdings Company, Ltd. | Senior Unsecured Debt | 3.00 | % | May 15, 2013 | ||||
| QuickSilver Resources, Inc. | Senior Subordinated Debt | 7.13 | % | April 1, 2016 | ||||
| Relativity Media, LLC - Class E Units | Equity – Preferred Stock | - | - | |||||
Aspect Software, Inc. filed for bankruptcy and hence defaulted on their 10.63% notes. As part of restructuring program, the company offered its noteholders to participate in the rights offering, which in turn would convert to equity. The 10.63% notes were hence written off completely. There is no scope of recovery on the Suntech Power Holdings Company, Ltd and Quicksilver Resources, Inc., hence these two have also been written off. Relativity Media, LLC, the entity in which we made our original investment, was dissolved as part of the Relativity Media reorganization process during the year ended December 31, 2016. The investment was removed from the Schedule of Investments and the loss of $10.4 million was realized. The company has now emerged out of bankruptcy as a new operating company.
Note 4.3. Valuation of Portfolio Investments
The Fund determines the net asset value of its investment portfolio each quarter. Securities that are publicly-traded are valued at the reported closing price on the valuation date. Securities that are not publicly-traded are valued at fair value as determined in good faith by the board of directors. In connection with that determination, the Manager will prepare portfolio company valuations using relevant inputs, including, but not limited to, indicative dealer quotes, values of like securities, the most recent portfolio company financial statements and forecasts, and valuations prepared by third-party valuation services.
With respect to investments for which market quotations are not readily available, the Fund will undertake a multi-step valuation process each quarter, as described below:
Investments are valued utilizing a market approach, an income approach, or both approaches, as appropriate. The market approach uses prices and other relevant information generated by market transactions involving identical or comparable assets or liabilities (including a business). The income approach uses valuation techniques to convert future amounts (for example, cash flows or earnings) to a single present value amount (discounted) calculated based on an appropriate discount rate. The measurement is based on the net present value indicated by current market expectations about those future amounts. In following these approaches, the types of factors that we may take into account in fair value pricing our investments include, as relevant: available current market data, including relevant and applicable market trading and transaction comparables, applicable market yields and multiples, security covenants, call protection provisions, information rights, the nature and realizable value of any collateral, the portfolio company’s ability to make payments, its earnings and discounted cash flows, the markets in which the portfolio company does business, comparisons of financial ratios of peer companies that are public, mergers and acquisition comparables, the principal market and enterprise values, among other factors.
The Fund has adopted FASB ASC Topic 820,Fair Value Measurements and Disclosures (formerly Statement of Financial Accounting Standards No. 157,Fair Value Measurements ),(“ASC Topic 820”), which defines fair value, establishes a framework for measuring fair value in accordance with generally accepted accounting principlesU.S. GAAP and expands disclosures about fair value measurements.
| F-12 |
ASC Topic 820 clarifies that the exchange price is the price in an orderly transaction between market participants to sell an asset or transfer a liability in the market in which the reporting entity would transact for the asset or liability, that is, the principal or most advantageous market for the asset or liability. The transaction to sell the asset or transfer the liability is a hypothetical transaction at the measurement date, considered from the perspective of market participants. ASC Topic 820 provides a consistent definition of fair value which focuses on exit price and prioritizes, within a measurement of fair value, the use of market-based inputs over entity-specific inputs. In addition, ASC Topic 820 provides a framework for measuring fair value and establishes a three-level hierarchy for fair value measurements based upon the transparency of inputs to the valuation of an asset or liability as of the measurement date. The three levels of valuation hierarchy established by ASC Topic 820 are defined as follows:
Level 1: Quoted prices in active markets for identical assets or liabilities, accessible by the Fund at the measurement date.
Level 2: Quoted prices for similar assets or liabilities in active markets, or quoted prices for identical or similar assets or liabilities in markets that are not active, or other observable inputs other than quoted prices.
Level 3: Unobservable inputs for the asset or liability.
The investment portfolio is recorded on a trade date basis. The Fund determines the net asset value of its investment portfolio each quarter. Securities that are publicly-traded are valued at the reported closing price on the valuation date. Twenty of the forty-seven investments were valued using the closing market price at period end December 31, 2016.
Due to the inherent uncertainty of determining the fair value of Level 3 investments, the fair value of the investments may differ significantly from the values that would have been used had a ready market or observable inputs existed for such investments and may differ materially from the values that may ultimately be received or settled. If the Company were required to liquidate a portfolio in a forced or liquidation sale, the Company might realize significantly less than the value at which such investment had previously recorded.
The following table presents investments that were not valued using the closing market price, as of December 31, 2016:
| Portfolio Company | Asset Type | Investment Coupon Rate | Maturity Date | ||||||
| Ansgar Media, LLC - Class B Units | Equity – Preferred Stock | - | - | ||||||
| Ansgar Media, LLC | Senior Secured First Lien Debt | 12.00 | % | September 18, 2017 | |||||
| Ansgar Media, LLC | Senior Secured First Lien Debt | 12.00 | % | January 11, 2018 | |||||
| Ansgar Media, LLC | Senior Secured First Lien Debt | 12.00 | % | October 24, 2018 | |||||
| Ansgar Media, LLC | Senior Secured First Lien Debt | 12.00 | % | October 27, 2018 | |||||
| Aspire Holdings(1) | Equity – Common Stock | - | - | ||||||
| Aspect Software, Inc.(2) | Equity – Common Stock | - | - | ||||||
| Claire’s Stores, Inc. Term Loan.(3) | Senior Secured First Lien Debt | 9.00 | % | September 20, 2021 | |||||
| CLSIP, LLC Term Loan(3) | Senior Secured First Lien Debt | 9.00 | % | September 20, 2021 | |||||
| Claire’s (Gibraltar) Holdings Limited Term Loan(3) | Senior Unsecured Debt | 9.00 | % | September 20, 2021 | |||||
| Colt Defense, LLC(4) | Senior Unsecured Debt | 8.00 | % | July 12, 2021 | |||||
| Education Management, LLC | Equity – Common Stock | - | - | ||||||
| Education Management, LLC | Warrant | - | - | ||||||
| GeoCommerce, Inc. | Senior Secured First Lien Debt | 12.00 | % | April 27, 2018 | |||||
| GeoCommerce, Inc. | Senior Secured First Lien Debt | 12.00 | % | May 15, 2018 | |||||
| GeoCommerce, Inc. | Senior Secured First Lien Debt | 12.00 | % | October 14, 2018 | |||||
| GeoCommerce, Inc. | Senior Secured First Lien Debt | 12.00 | % | December 21, 2018 | |||||
| GeoCommerce, Inc. | Warrant | - | - | ||||||
| Logan’s Roadhouse, Inc.(5) | Senior Secured Second Lien Debt | 10.75 | % | October 15, 2017 | |||||
| Logan’s Roadhouse, Inc. PIK Exit Facility Term Loan(5) | Senior Secured Second Lien Debt | 9.50 | % | November 23, 2020 | |||||
| Nima, LLC | Senior Secured First Lien Debt | 12.00 | % | May 20, 2018 | |||||
| Nima, LLC | Senior Secured First Lien Debt | 12.00 | % | August 11, 2018 | |||||
| Nima, LLC | Senior Secured First Lien Debt | 12.00 | % | November 2, 2018 | |||||
| Nima, LLC | Senior Secured First Lien Debt | 12.00 | % | December 21, 2018 | |||||
| Nima, LLC | Warrant | - | - | ||||||
| Nuverra Environmental Solutions, Inc. | Senior Secured Second Lien Debt | 12.50 | % | April 15, 2022 | |||||
| Nuverra Environmental Solutions, Inc. | Warrant | - | - | ||||||
| (1) | Converted from exchange of 12.00% Endeavour International Corp, senior secured first lien debt. |
| (2) | The original 10.63% senior secured second lien notes due on May 15, 2017 defaulted. As part of Aspect’s bankruptcy and planned reorganization process, the Fund participated in a rights offering to purchase a new 3.00% PIK senior unsecured convertible note maturing on May 23, 2023 in an effort to facilitate recovery of its previous investment in the senior secured lien notes in Aspect. On November 25, 3.00% PIK senior unsecured convertible notes were exchanged out for mandatory conversion to shares of common stock of Aspect Software Parent, Inc. at a rate of 1/30 i.e. one common share per $30.00 in principal amount of notes outstanding. |
| (3) | On September 20, 2016, all of 10.50% senior subordinated notes and 8.88% senior secured second lien notes were exchanged for 9.00% of Claire’s Stores, Inc. Term Loan, CLSIP Term Loans and of Claire’s Gibralter Term Loans. |
| F-13 |
| (4) | On January 19, 2016, there was a mandatory exchange offer to exchange all of the 8.75% senior unsecured notes to 8.00% PIK third lien notes. |
| (5) | The company filed for bankruptcy in Delaware on August 8, 2016 and is in the final stages of restructuring. The Fund participated in DIP financing as part of company’s restructuring process during bankruptcy and has received PIK Second Lien Exit Facility T/L in exchange. The Fund also participated in Equity exchange which is still in process and is expected to complete soon. |
Securities that are not publicly-traded are valued at fair value as determined in good faith by the Board of Directors, or a committee thereof. In connection with that determination, the Manager will prepare portfolio company valuations using relevant inputs, including, but not limited to, indicative dealer quotes, values of like securities, the most recent portfolio company financial statements and forecasts, and valuations prepared by third-party valuation services. With respect to investments for which market quotations are not readily available, the Fund undertakes a multi-step valuation process each quarter, as described below:
| • | the quarterly valuation process begins with each portfolio company or investment being initially valued by members of the investment committee, with such valuation taking into account information received from an independent valuation firm, if applicable; | |
| • | preliminary valuation conclusions are then documented and discussed with the members of the Board of Directors, or committee thereof; and | |
| • | the Board of Directors, or committee thereof, discusses valuations and determines the fair value of each investment in the portfolio in good faith based on various statistical and other factors, including the input and recommendation of members of the investment committee and any third-party valuation firm, if applicable. |
Investments are valued utilizing a market approach, an income approach, or both approaches, as appropriate. The market approach uses prices and other relevant information generated by market transactions involving identical or comparable assets or liabilities (including a business). The income approach uses valuation techniques to convert future amounts (for example, cash flows or earnings) to a single present value amount (discounted) calculated based on an appropriate discount rate. The measurement is based on the net present value indicated by current market expectations about those future amounts.
In following these approaches, the types of factors that we may take into account in fair value pricing our investments include, as relevant: available current market data, including relevant and applicable market trading and transaction comparables, applicable market yields and multiples, security covenants, call protection provisions, information rights, the nature and realizable value of any collateral, the portfolio company’s ability to make payments, its earnings and discounted cash flows, the markets in which the portfolio company does business, comparisons of financial ratios of peer companies that are public, mergers and acquisition comparables, the principal market and enterprise values, among other factors.
In all cases, the level in the fair value hierarchy within which the fair value measurement in its entirety falls has been determined based on the lowest level of input that is significant to the fair value measurement.
The following table presents fair value measurements of investments, by major class, as of December 31, 2013 according to2016 per the fair value hierarchy (dollars in thousands):
| Level 1 | Level 2 | Total | Level 1 | Level 2 | Level 3 | Total | ||||||||||||||||||||||
| Investments – Money Market | $ | 1,644 | $ | — | $ | 1,644 | $ | 157 | $ | — | $ | — | $ | 157 | ||||||||||||||
| U.S. Government Securities | — | 7,173 | — | 7,173 | ||||||||||||||||||||||||
| Senior Secured First Lien Debt | — | 4,512 | 4,512 | — | 2,168 | 14,882 | 17,050 | |||||||||||||||||||||
| Senior Secured Second Lien Debt | — | 5,290 | 5,290 | — | 2 | 518 | 520 | |||||||||||||||||||||
| Senior Unsecured Debt | — | 7,425 | 7,425 | — | 4,557 | 325 | 4,882 | |||||||||||||||||||||
| Senior Subordinated Debt | — | 5,927 | 5,927 | — | 1,050 | — | 1,050 | |||||||||||||||||||||
| Equity Securities | — | 86 | 9,584 | 9,670 | ||||||||||||||||||||||||
| Total | $ | 1,644 | $ | 23,154 | $ | 24,798 | $ | 157 | $ | 15,036 | $ | 25,309 | $ | 40,502 | ||||||||||||||
The following table presents fair value measurements of investments, by major class, as of December 31, 2012 according to2015 per the fair value hierarchy (dollars in thousands):
| Level 1 | Level 2 | Total | Level 1 | Level 2 | Level 3 | Total | ||||||||||||||||||||||
| Investments – Money Market | $ | 1,304 | $ | — | $ | 1,304 | $ | 6,210 | $ | — | $ | — | $ | 6,210 | ||||||||||||||
| U.S. Government Securities | — | 4,946 | — | 4,946 | ||||||||||||||||||||||||
| Senior Secured First Lien Debt | — | 819 | 819 | — | 6,483 | 2,525 | 9,008 | |||||||||||||||||||||
| Senior Secured Second Lien Debt | — | 859 | 859 | — | 1,781 | 8 | 1,789 | |||||||||||||||||||||
| Senior Unsecured Debt | — | 3,115 | 3,115 | — | 6,141 | 132 | 6,273 | |||||||||||||||||||||
| Senior Subordinated Debt | — | 1,030 | 1,030 | — | 1,496 | — | 1,496 | |||||||||||||||||||||
| Equity Securities | — | 84 | 3,126 | 3,210 | ||||||||||||||||||||||||
| Total | $ | 1,304 | $ | 5,823 | $ | 7,127 | $ | 6,210 | $ | 20,931 | $ | 5,791 | $ | 32,932 | ||||||||||||||
No
| F-14 |
There were five transfers from Level 2 to Level 3 for the year ended December 31, 2016. Transfers were Claire’s Stores, Inc. Term Loan. 9.00% senior secured first lien debt, due September 20, 2021; CLSIP, LLC Term Loan 9.00% senior secured first lien debt, due September 20, 2021; Claire’s (Gibraltar) Holdings Limited Term Loan 9.00% senior unsecured debt, due September 20, 2021; Nuverra Environmental Solutions, Inc. senior secured second lien debt 12.50%, due April 15, 2022; and Logan’s Roadhouse, Inc. 10.75% senior secured second lien debt, due October 15, 2017, which will be converted to senior secured term loans once the company’s restructuring completes. There was one transfer from Level 3 to Level 2 for the year ended December 31, 2016. The transfer was Affinion Group, Inc. common stock equity.
During the year ended December 31, 2016, the following were the transfers in or out of levels (dollars in thousands):
| Level 1 | Level 2 | Level 3 | Total | |||||||||||||
| Senior Secured First Lien Debt | $ | — | $ | (533 | ) | $ | 533 | $ | — | |||||||
| Senior Secured Second Lien Debt | — | (356 | ) | 356 | — | |||||||||||
| Senior Unsecured Debt | — | (188 | ) | 188 | — | |||||||||||
| Equity Securities | — | 51 | (51 | ) | — | |||||||||||
| Total | $ | — | $ | (1,026 | ) | $ | 1,026 | $ | — | |||||||
There were two transfers between levels have occurred duringfor the periods presented.year ended December 31, 2015. One transfer was Affinion Group, Inc.’s, 13.5% notes due August 15, 2018, which were restructured by the company to a non-interest bearing private equity holding and hence transferred to Level 3. The other transfer was Colt Defense, LLC’s 8.75% senior unsecured notes, due November 15, 2017, which were exchanged for 8.00% senior unsecured notes due July 12, 2021 at $105.08 for every $1,000 of old notes. Although the restructuring process completed after December 31, 2015, the plan for reorganization was already proposed prior to year-end.
During the year ended December 31, 2015, the following were the transfers in or out of levels (dollars in thousands):
| Level 1 | Level 2 | Level 3 | Total | |||||||||||||
| Senior Unsecured Debt | $ | — | $ | (132 | ) | $ | 132 | $ | — | |||||||
| Senior Subordinated Debt | — | (816 | ) | — | (816 | ) | ||||||||||
| Equity Securities | — | — | 816 | 816 | ||||||||||||
| Total | $ | — | $ | (948 | ) | $ | 948 | $ | — | |||||||
The following table presents additional information about Level 3 assets measured at fair value. Both observable and unobservable inputs may be used to determine the fair value of positions that the Fund has classified within the Level 3 category. As a result, the net unrealized gains and losses for assets within the Level 3 category may include changes in fair value that were attributable to both observable and unobservable inputs.
Changes in Level 3 assets measured at fair value for the year ended December 31, 2016 are as follows (dollars in thousands):
Fair Value | Transfers in / (out) | Reclassification | Purchases and | Amortization and Accretion of Fixed Income Premiums and Discounts | Realized and Unrealized Gains | Fair Value December 31, 2016 | Change in Unrealized Gains and (Losses) for Investments held as of December 31, 2016 | |||||||||||||||||||||||||
| Senior Secured First Lien Debt | $ | 2,525 | $ | 533 | $ | (525 | ) | $ | 12,349 | $ | - | $ | - | $ | 14,882 | $ | (586 | ) | ||||||||||||||
| Senior Secured Second Lien Debt | 8 | 356 | - | 139 | - | 15 | 518 | (513 | ) | |||||||||||||||||||||||
| Senior Unsecured Debt | 132 | 188 | - | - | 4 | 1 | 325 | (205 | ) | |||||||||||||||||||||||
| Equity Securities | 3,126 | (51 | ) | 525 | 244 | - | 5,740 | 9,584 | 5,740 | |||||||||||||||||||||||
| Total | $ | 5,791 | $ | 1,026 | $ | - | $ | 12,732 | $ | 4 | $ | 5,756 | $ | 25,309 | $ | 4,436 | ||||||||||||||||
(1) Includes purchases of new investments, effects of refinancing and restructurings, premium and discount accretion and amortization, PIK interest, net proceeds from investments sold and principal payments received.
| F-15 |
Realized and unrealized gains and losses are included in net realized gain (loss) from investments and net unrealized appreciation (depreciation) on investments in the statements of operations. The change in unrealized appreciation for Level 3 investments still held as of December 31, 2016 of $4.4 million is included in net unrealized appreciation on investments in the statements of operations for the year ended December 31, 2016.
Changes in Level 3 assets measured at fair value for the year ended December 31, 2015 are as follows (dollars in thousands):
Fair Value 2014 | Transfers in | Purchases (Sales and Settlement)(1) | Amortization and Accretion of Fixed Income Premiums and Discounts | Realized and Unrealized Gains (Losses) | Fair Value 2015 | Change in 2015 | ||||||||||||||||||||||
| Senior Secured First Lien Debt | $ | 578 | $ | — | $ | 2,000 | $ | — | $ | (53 | ) | $ | 2,525 | $ | (53 | ) | ||||||||||||
| Senior Secured Second Lien Debt | 239 | — | — | — | (231 | ) | 8 | (231 | ) | |||||||||||||||||||
| Senior Unsecured Debt | — | 132 | — | (43 | ) | 43 | 132 | 43 | ||||||||||||||||||||
| Equity Securities | 874 | 816 | 10,400 | (18 | ) | (8,946 | ) | 3,126 | (8,946 | ) | ||||||||||||||||||
| Total | $ | 1,691 | $ | 948 | $ | 12,400 | $ | (61 | ) | $ | (9,187 | ) | $ | 5,791 | $ | (9,187 | ) | |||||||||||
| (1) | Includes purchases of new investments, effects of refinancing and restructurings, premium and discount accretion and amortization, PIK interest, net proceeds from investments sold and principal payments received. |
Realized and unrealized gains and losses are included in net realized gain (loss) from investments and net unrealized appreciation (depreciation) on investments in the statements of operations. The change in unrealized depreciation for Level 3 investments still held as of December 31, 2015 of $9.2 million is included in net unrealized appreciation (depreciation) on investments in the statements of operations for the year ended December 31, 2015.
The following table provides quantitative information regarding Level 3 fair value measurements as of December 31, 2016 (dollars in thousands):
| Range | ||||||||||||||||||||
Fair Value | Valuation Technique | Unobservable Input | Mean | Minimum | Maximum | |||||||||||||||
| Senior Secured First Lien Debt | $ | 14,882 | Discounted Cash Flow analysis / EBITDA multiples / Enterprise Value | Transaction Value Market premium for loan interest rate | $ | 14,882 | $ | 14,882 | $ | 14,882 | ||||||||||
| Senior Secured Second Lien Debt | 518 | Liquidation | Transaction Value | 518 | 518 | 518 | ||||||||||||||
| Senior Unsecured Debt | 325 | Liquidation | Transaction Value | 325 | 325 | 325 | ||||||||||||||
| Equity Securities | 9,584 | Income Approach/ Market Approach | Transaction Value / Discounted Cash Flows | 12,825 | 9,584 | 16,066 | ||||||||||||||
| Total | $ | 25,309 | ||||||||||||||||||
As part of liquidation analysis, the Fund performs a Leveraged Buyout Analysis of its Portfolio Companies and calculates asset coverage and recovery value for each individual loan.
The following table provides quantitative information regarding Level 3 fair value measurements as of December 31, 2015 (dollars in thousands):
| Range | ||||||||||||||||||||
Fair Value | Valuation Technique | Unobservable Input | Mean | Minimum | Maximum | |||||||||||||||
| Senior Secured First Lien Debt | $ | 2,525 | Liquidation | Transaction Value | $ | 2,525 | $ | 2,525 | $ | 2,525 | ||||||||||
| Senior Secured Second Lien Debt | 8 | Liquidation | Transaction Value | 8 | 8 | 8 | ||||||||||||||
| Senior Unsecured Debt | 132 | Liquidation | Transaction Value | 132 | 132 | 132 | ||||||||||||||
| Equity Securities | 3,126 | Liquidation | Transaction Value / Discounted Cash Flows | 9,155 | 3,126 | 15,184 | ||||||||||||||
| Total | $ | 5,791 | ||||||||||||||||||
The primary significant unobservable inputs used in the fair value measurement of the Fund's senior secured second lien debt and senior unsecured debt were the fair value of the exchanged bonds/equity offered by the issuer or the price as evidenced by trades in the secondary market (Colt Defense, LLC, Claire's Stores Gibraltar T/L, two Logan's Roadhouse, Inc. and Nuverra Environmental Co.).
| F-16 |
The composition of the Fund’s investments as of December 31, 2013,2016, at amortized cost and fair value were as follows (dollars in thousands):
| Investments at Amortized Cost | Investments at Fair Value | Fair Value Percentage of Total Portfolio | Investments at | Investments at | Fair Value Percentage of Total Portfolio | |||||||||||||||||||
| Investments – Money Market | $ | 1,644 | $ | 1,644 | 6.6 | % | $ | 157 | $ | 157 | 0.4 | % | ||||||||||||
| U.S. Government Securities | 7,195 | 7,173 | 17.7 | |||||||||||||||||||||
| Senior Secured First Lien Debt | 4,475 | 4,512 | 18.2 | 15,734 | 17,050 | 42.1 | ||||||||||||||||||
| Senior Secured Second Lien Debt | 5,601 | 5,290 | 21.3 | 3,053 | 520 | 1.3 | ||||||||||||||||||
| Senior Unsecured Debt | 7,962 | 7,425 | 30.0 | 8,108 | 4,882 | 12.0 | ||||||||||||||||||
| Senior Subordinated Debt | 5,731 | 5,927 | 23.9 | 1,320 | 1,050 | 2.6 | ||||||||||||||||||
| Equity Securities | 6,015 | 9,670 | 23.9 | |||||||||||||||||||||
| Total | $ | 25,413 | $ | 24,798 | 100.0 | % | $ | 41,582 | $ | 40,502 | 100.0 | % | ||||||||||||
The composition of the Fund’s investments as of December 31, 2012,2015, at amortized cost and fair value were as follows (dollars in thousands):
| Investments at Amortized Cost | Investments at Fair Value | Fair Value Percentage of Total Portfolio | Investments at | Investments at | Fair Value Percentage of Total Portfolio | |||||||||||||||||||
| Investments – Money Market | $ | 1,304 | $ | 1,304 | 18.3 | % | $ | 6,210 | $ | 6,210 | 18.9 | % | ||||||||||||
| U.S. Government Securities | 4,947 | 4,946 | 15.0 | |||||||||||||||||||||
| Senior Secured First Lien Debt | 819 | 819 | 11.5 | 10,826 | 9,008 | 27.4 | ||||||||||||||||||
| Senior Secured Second Lien Debt | 911 | 859 | 12.1 | 4,491 | 1,789 | 5.4 | ||||||||||||||||||
| Senior Unsecured Debt | 3,174 | 3,115 | 43.7 | 12,330 | 6,273 | 19.0 | ||||||||||||||||||
| Senior Subordinated Debt | 1,038 | 1,030 | 14.4 | 2,878 | 1,496 | 4.5 | ||||||||||||||||||
| Equity Securities | 12,738 | 3,210 | 9.8 | |||||||||||||||||||||
| Total | $ | 7,246 | $ | 7,127 | 100.0 | % | $ | 54,420 | $ | 32,932 | 100.0 | % | ||||||||||||
Note 5.4. Related Party Transactions
We have entered agreements with the Manager, whereby we pay it certain fees and reimbursements. These include payments to our Manager for reimbursement of organization and offering costs, as well as payments for certain services that include, but are not limited to, the identification, execution, and management of our investments and also the management of our day-to-day operations provided to us by our Manager.
As a BDC, we are subject to certain regulatory restrictions in making our investments. For example, we generally are not permitted to co-invest with certain entities affiliated with our Manager in transactions originated by our Manager or its affiliates unless we obtain an exemptive relief order from the SEC or co-invest alongside our Manager or its affiliates in accordance with existing regulatory guidance and our allocation policy. Under existing regulatory guidance, we are permitted to, and may co-invest in syndicated deals and secondary loan market transactions where price is the only negotiated point.
We may seek exemptive relief from the SEC to engage in co-investment transactions with our Manager and/or its affiliates. However, there can be no assurance that we will obtain such exemptive relief, if requested. Even if we receive exemptive relief, neither our Manager nor its affiliates are obligated to offer us the right to participate in any transactions originated by them. Prior to obtaining exemptive relief, we may co-invest alongside our Manager or its affiliates only in accordance with existing regulatory guidance and our allocation policy.
Due from related party consists of August 20, 2013,$67,000 of true up for management fees from writing down certain portfolio investments at the end of a quarter in prior quarters, $67,000 in Blue Sky state filing fees by the Fund is managedinstead of our Manager, $13,000 in allocation of the Directors and Officers insurance policy costs to our Manager, and $90,000 in expenses related to legal and other operational costs allocated to our Manager instead of the Fund.
At December 31, 2016, $70,000 of the $76,000 of prepaid expenses was prepaid management fees for the first quarter of 2017.
Due diligence fees received by the Manager. PriorFund from the borrowers related to August 20, 2013the Fund’s direct lending transactions are remitted to our Manager, VII Peaks Capital, LLC, as the collateral and administrative agent (Agent) for the loans. Due diligence fees received are not revenues or expenses of the Fund was managed by VII Peaks-KBR BDC Advisor II, LLC (the “Prior Manager”), which was wholly-owned by VII Peaks-KBR, LLC which was a joint venture betweenand therefore are not reflected in the Managerfinancial statements and KBR Capital Advisors, LLC (“KBR”).such fees for 2016 totaled $475,000.
Investment Advisory Agreement
The Fund has entered into an investment advisory agreement with the Manager to manage the Fund’s investment activities dated August 20, 2013. Prior to August 20, 2013, the Fund’s investment activities were managed by the Prior Manager pursuant to an investment advisory agreement that had substantially the same terms as the Fund’s present agreement with the Manager.activities. Pursuant to the investment advisory agreement, the Manager implements the Fund’s business strategy on a day-to-day basis and performs certain services for us, subject to oversight by our boardBoard of directors.Directors, or a committee thereof. The Manager is responsible for, among other duties, determining investment criteria, sourcing, analyzing and executing investment transactions, asset sales, financings and performing asset management duties. The initial investment advisory agreement was signed on August 20, 2013 and was effective for two years. The agreement must be re-approved annually thereafter by a majority of the non-interested members of the Board of Directors. On August 22, 2016, the non-interested members of the Board of Directors re-approved the agreement between the Manager and the Fund under the agreement’s existing terms.
| F-17 |
Under the investment advisory agreement, the Manager is entitled to a base management and incentive fee as outlined in the investment advisory agreement with the Fund. The base management fee is 2% of net assets below $100$100.0 million; 1.75% of net assets between $100$100.0 million and $250$250.0 million; and 1.5% of net assets over $250$250.0 million. For the years ended December 31, 20132016, 2015 and 2012,2014, the Fund incurred $0.4$0.6 million, $0.8 million and $0.06$0.7 million of base management fees, respectively.
The incentive fee has two parts. The first part, the subordinated incentive fee on income, is calculated and payable quarterly in arrears based upon the Fund’s “pre-incentive fee net investment income” for the immediately preceding quarter. The subordinated incentive fee on income is 20% of pre-incentive net investment income subject to a quarterly return to investors, expressed as a rate of return on adjusted capital at the beginning of the most recently completed calendar quarter, of 2.0% (8.0% annualized). The second part of the incentive fee, the incentive fee on capital gains, is an incentive fee on capital gains earned on liquidated investments from the portfolio and is determined and payable in arrears as of the end of each calendar year (or upon termination of the investment advisory agreement). This fee equals 20% of the Fund’s incentive fee capital gains, which will equal the Fund’s realized capital gains on a cumulative basis from inception, calculated as of the end of each calendar year, computed net of all realized capital losses and unrealized capital depreciation on a cumulative basis, less the aggregate amount of any previously paid capital gains and incentive fees. Forfees.For the years ended December 31, 20132016, 2015 and 2012,2014, the Fund did not incur any incentive fees related to net investment income or capital gains.
Under U.S. GAAP, the Fund calculates capital gains incentive fees as if the Fund had realized all assets at their fair values and liabilities at their settlement amounts as of the reporting date. U.S. GAAP requires that the capital gains incentive fee accrual assume the cumulative aggregate unrealized capital appreciation is realized, even though such unrealized capital appreciation is not payable under the investment advisory agreement. Accordingly, the Fund accrues a provisional capital gains incentive fee taking into account any unrealized gains or losses. There can be no assurance that such unrealized capital appreciation will be realized in the future and that the provisional capital gains incentive fee will become payable.
Under the investment advisory agreement, the Manager bears all offering and organizational expenses. Pursuant to the terms of the investment advisory agreement, the Fund has agreed to reimburse the Manager for any such organizational and offering expenses incurred by the Manager not to exceed 1.5% of the gross subscriptions raised by the Fund over the course of the offering period, which is currently scheduled to terminate two years from the initial offering date, unless extended.period. From each sale of common stock, the Fund pays the Manager the lesser of 1.5% of the gross offering proceeds or the amount of unreimbursed offering and organizational expenses incurred by the Manager.
During the years ended December 31, 2013 and 2012 and for the period from August 3, 2011 (inception) through December 31, 2011, the Prior Manager incurred organizational and offering costs of $0.3 million, $1.0 million, and $0.4 million, respectively. Of the total $1.7 million organizational and offering costs incurred from inception through December 31, 2013, $0.3 million was reimbursed to the Prior Manager during the year ended December 31, 2013, and an aggregate of $0.5 million had been reimbursed since the Fund commenced operations on July 10, 2012.
The Manager agreed to assume and pay the Fund all amounts due the Fund from the Prior Manager as reflected in the Fund’s books and records as of August 20, 2013, including any amounts due under the Expense Reimbursement Agreement between the Fund and the Prior Manager. The Fund agreed to pay the Manager any reimbursable organization and offering expenses incurred by Prior Manager which the Fund would otherwise be obligated to reimburse Prior Manager from future sales of the Company’s securities, beginning with any sales of securities occurring after August 20, 2013.
The Fund expects that the Manager will continue to incur organizational and offering costs as the Fund’s offering continues, and such additional organizational and offering costs will increase the amount to which the Manager will be entitled to reimbursement from gross offering proceeds. The unreimbursed amount will be eligible for reimbursement to the extent the Fund receives subscriptions until March 1, 2014. Organizational and offering expenses paid for by the Manager and reimbursed by the Fund are expensed on the Fund’s statement of operations as they arebecome payable to the Manager.
From time to time, the Fund has paid directly certain expenses that were classified as organization or offering expenses that should have been borne by the Prior Manager and for which the Prior Manager is obligated to reimburse the Fund. As of December 31, 2013 and December 31, 2012, the unreimbursed amount of organization and offering expenses was $0.1 million and $0.1 million, respectively, which amount is included in “Due from related party” on the Fund’s balance sheet as of those dates. From time to time, the Fund has paid directly certain expenses that were classified as offering expenses that should have been borne by the Manager and for which the Manager is obligated to reimburse the Fund. As of December 31, 2013, the unreimbursed amount of offering expenses was $0.1 million, which amount is included in “Due from related party” on the Fund’s balance sheet as of that date.
Expense Reimbursement Agreement
On November 9, 2012, the Fund entered into an expense reimbursement agreement with the Prior Manager, under which the Prior Manager agreed to reimburse the Fund for all operating expenses, excluding management fees recognized on the quarterly financial statements of the Fund for 2012, retroactive to the date of formation of the Fund on August 3, 2011. In 2013, the expense reimbursement agreement was modified to exclude management fees and incentive fees payable to the Manager effective as of January 1, 2013. The Fund recognizes a receivable on its books for the amount due from the Prior Manager under the expense reimbursement agreement, and the Prior Manager recognizes a liability on its books in the same amount. The expense reimbursement agreement allows the Prior Manager and the Fund to offset the receivable in favor of the Fund created under the expense reimbursement agreement against the contingent payable owed by the Fund to the Prior Manager under the investment advisory agreement, resulting in a net receivable or payable position. The Fund terminated the expense reimbursement agreement with the Prior Manager when it terminated the investment advisory agreement with the Prior Manager on August 20, 2013. While the Fund entered into a new investment advisory agreement with the Manager on August 20, 2013, it did not enter into a new expense reimbursement agreement with the Manager. However, the investment advisory agreement with the Manager includes the Manager’s undertaking the assume and pay all amounts due by the Prior Manager under the expense reimbursement agreement, and also that the Fund is obligated to pay the Manager all organization and offering costs previously borne by the Prior Manager (but only to the extent such costs are reimbursable from gross offering proceeds).agreement.
Administration Agreement
The Fund has also entered intoOur Manager serves as our administrator. Pursuant to an administration agreement, with theour Manager under which the Manager provides the Fundfurnishes us with office facilities, equipment, and clerical, bookkeeping and record keeping services at such facilities and providesfacilities. Under the administration agreement, our Manager also performs, or oversees the performance of the Fund’sour required administrative services, which include, among other things, being responsible fortransfer agency and other service providers supervision and oversight, preparation and supervision of the financial records for which the Fund iswe are required to maintain for SEC reporting, stockholder reporting and preparingother Fund needs, implementation and supervision of a robust compliance program and oversight and administration of the quarterly share repurchase program. In addition, our Manager assists us in activities which include, among other things, performance and supervision of investor relations, the Fund’s Board of Directors communication and reporting, determining and publishing our net asset value, overseeing the preparation and filing of our tax returns, the communication, printing and dissemination of reports to its stockholders.our stockholders, and generally oversees the payment of our expenses and other events such as distributions, and the performance of administrative and professional services rendered to us by others. Under the administration agreement, we are obligated to reimburse our Manager for our allocable portion of our Manager’s overhead cost incurred by the Manager. During the years ended December 31, 2013 and 2012, the Fund reimbursed the Manager for $0.1 million and $0.02 million in administration expensesperforming its obligations under the administration agreement, respectively. including rent, the fees and expenses associated with overseeing and performing the compliance functions and our allocable portion of the compensation of our chief financial officer, chief compliance officer and any administrative support staff; however, to date, cost of the chief financial officer, fund administration accounting and the chief compliance officer are charged directly to the Fund. Under the administration agreement, our Manager will also provide on our behalf managerial assistance to those portfolio companies that request such assistance. The administration agreement also provides the reimbursement to the Fund by the Manager for the Manager’s share of the Directors and Officers insurance, which is paid by the Fund in full. The administration agreement may be terminated by either party without penalty upon 60 days’ written notice to the other party.
The administration agreement provides that, absent willful misfeasance, bad faith or negligence in the performance of its duties or by reason of the reckless disregard of its duties and obligations, our Manager and its officers, managers, partners, agents, employees, controlling persons, members and any other person or entity affiliated with it are entitled to indemnification from us for any damages, liabilities, costs and expenses (including reasonable attorneys’ fees and amounts reasonably paid in settlement) arising from the rendering of our Manager’s services under the administration agreement or otherwise as administrator for us.
| F-18 |
Note 6.5. Common Stock
TheInitially, the Manager purchased 111 and 22,222 shares of common stock on August 31, 2011 and December 31, 2011, respectively. These shares were purchased at a price of $9.00 per share, which represents the initial public offering (“IPO”) price of $10.00 per share, net of selling commissions and dealer manager fees. The Manager sold these shares on June 27, 2014.
On July 10, 2012, the Fund had raised sufficient proceeds to break escrow on its IPO and through December 31, 2013,2016, the Fund has sold 3.26.6 million shares of common stock for gross proceeds of $31.6$65.5 million including the purchases made by the Manager.
During the year ended December 31, 2013,2016, the Fund sold 2,200,643did not sell any shares of common stock as its prospectus was not effective. Also, for the year ended December 31, 2016, there we no treasury shares repurchased.
Note 6. Borrowings
Wells Fargo Credit Facility
On August 4, 2015, the Fund entered an agreement with Wells Fargo Advisors, LLC for a revolving line of credit. The amount the Fund can borrow is based upon the value of cash deposited in its offeringan account at Wells Fargo Advisors, LLC and the treasury notes that Wells Fargo purchases, which serve as collateral for net proceedsthe loan. On August 27, 2015, the Fund initially drew down $2.0 million. As of $20.1 million, including shares issuedDecember 31, 2015, the outstanding balance was $4.5 million. As of December 31, 2016, the outstanding balance under this credit line was $6.4 million. The interest rate on the outstanding balance is a negotiated rate based on the Fund’s assets under management with Wells Fargo Advisors, LLC and is currently 3.25%. The term of the line of credit is indefinite and may be terminated by the Fund or Wells Fargo Advisors, LLC at any time.
Morgan Stanley Credit Facility
On September 10, 2015, the Fund entered an agreement with Morgan Stanley Private Bank, N.A. The amount the Fund can borrow is based upon the value of cash deposited in an account at Morgan Stanley Private Bank, N.A., which serves as a collateral for the loan. The maximum amount, which the Fund may borrow under the distribution reinvestment plan (“DRIP”).line of credit, is $1.8 million. The line was paid off during the second quarter and the account was closed as of June 30, 2016.
Note 7. Income Taxes
The Fund has elected to be treated as a RIC under Subchapter M of the Code. As a RIC, the Fund is not taxed on any investment company taxable income or capital gains which it distributes to shareholders. The Fund intends to make the requisite distributions to its stockholders which will relieve the Fund from U.S. federal income taxes. Accordingly, no provision for U.S. federal income tax has been made in the consolidated financial statements.
Dividends from net investment income and distributions from net realized capital gains are determined in accordance with U.S. federal tax regulations, which may differ from amounts in accordance with U.S. GAAP and those differences could be material.
Note 8. Earnings (Loss) Per Share
In accordance with the provisions of FASB ASC 260, “EarningsEarnings per Share”Share (“ASC 260”), basic earnings per share is computed by dividing earnings available to common shareholders by the weighted average number of shares outstanding during the period. Other potentially dilutive common shares, and the related impact to earnings, are considered when calculating earnings per share on a diluted basis.
The following information sets forth the computation of the weighted average basic and diluted net increase (decrease) in net assets per share from operations for the years ended December 31, 20132016, 2015 and December 31, 2012 and for the period from August 3, 2011 (date of inception) to December 31, 20112014 (dollars in thousands except share and per share amounts):
| For the Year Ended December 31 | For the Year Ended December 31 | For the Period from August 3, 2011 (Date of Inception) to December 31 | For the Year Ended December 31, | For the Year Ended December 31, | For the Year Ended December 31, | |||||||||||||||||||
| 2013 | 2012 | 2011 | 2016 | 2015 | 2014 | |||||||||||||||||||
| (Restated) | (Restated) | (Restated) | ||||||||||||||||||||||
| Basic and diluted | ||||||||||||||||||||||||
| Basic and diluted: | ||||||||||||||||||||||||
| Net increase (decrease) in net assets resulting from operations | $ | 697 | $ | 31 | $ | (4 | ) | $ | 7,614 | $ | (13,359 | ) | $ | (5,274 | ) | |||||||||
| Weighted average common shares outstanding | 2,150,019 | 246,231 | 90 | 6,256,208 | 6,077,127 | 4,281,647 | ||||||||||||||||||
| Net increase (decrease) in net assets resulting from operations per share | $ | 0.32 | $ | 0.13 | $ | (44.44 | ) | $ | 1.22 | $ | (2.20 | ) | $ | (1.23 | ) | |||||||||
The Fund had no potentially dilutive securities as of December 31, 20132016, 2015 or December 31, 2012,2014, resulting in the same number of shares for basic and diluted.
| F-19 |
Note 8.9. Tender Offer Program
We do not currently intend to list our shares on any securities exchange and do not expect a public market for them to develop in the foreseeable future. Therefore, shareholders should not expect to be able to sell their shares promptly or at a desired price. Beginning with the fourth calendar quarter of 2013, and on a quarterly basis through June 30, 2015, the Board of Directors approved a tender offer to repurchase shares of our common stock at a price equal to 90% of our offering price on the date of repurchase. In the third quarter of 2015, the Board of Directors decided to suspend the repurchase program, as the Fund was not raising any new capital. When a tender offer is approved by the Board of Directors, we intend to limit the number of shares to be repurchased during any calendar year to 20% of the weighted average number of shares outstanding in the prior calendar year, or 5.0% in each quarter, though the actual number of shares that we offer to repurchase may be less considering the limitations noted above. We will offer to repurchase such shares on each date of repurchase at a price equal to 90% of our offering price. For the year ended December 31, 2016, no tender offer was approved by the Board of Directors.
The following table reflects certain information regarding the tender offers that we have conducted to date:
| For the Three Months Ended | Repurchase Date | Shares Repurchased | Percent of Shares Tendered that were Repurchased | Repurchase Price Per Share | Aggregate Consideration For Repurchased Shares (‘000s)* | |||||||||||||
| December 13, 2013 | December 12, 2013 | 548 | 100 | % | $ | 9.135 | $ | 5 | ||||||||||
| March 31, 2014 | March 14, 2014 | 550 | 100 | % | 9.135 | 5 | ||||||||||||
| June 30, 2014 | June 27, 2014 | 34,025 | 100 | % | 9.135 | 319 | ||||||||||||
| September 30, 2014 | September 30, 2014 | 38,482 | 100 | % | 9.000 | 346 | ||||||||||||
| December 31, 2014 | December 30, 2014 | 6,061 | 100 | % | 8.775 | 55 | ||||||||||||
| March 31, 2015 | March 30, 2015 | 5,811 | 100 | % | 8.775 | 51 | ||||||||||||
| June 30, 2015 | June 29, 2015 | 215,935 | 69 | % | 8.775 | 1,895 | ||||||||||||
| September 30, 2015 | September 30, 2015** | — | — | — | — | |||||||||||||
| December 31, 2015 | December 31, 2015** | — | — | — | — | |||||||||||||
| March 31, 2016 | March 31, 2016** | — | — | — | — | |||||||||||||
| June 30, 2016 | June 30, 2016** | — | — | — | — | |||||||||||||
| September 30, 2016 | September 30, 2016** | — | — | — | — | |||||||||||||
| December 31, 2016 | December 31, 2016** | — | — | — | — | |||||||||||||
| $ | 2,676 | |||||||||||||||||
* The difference between an increase in treasury capital and aggregate consideration for repurchased shares is allocated to the capital/owners, equity account dealer fees.
**The Board of Directors did not declare a tender offer for the quarters ended September 30, 2015, December 31, 2015, March 31, 2016, June 30, 2016, September 30, 2016 and December 31, 2016.
Our quarterly repurchases will be conducted on such terms as may be determined by our Board of Directors, or a committee thereof, in its complete and absolute discretion unless, in the judgment of the independent directors of our Board of Directors, or a committee thereof, such repurchases would not be in the best interests of our stockholders or would violate applicable law. We will conduct such repurchase offers in accordance with the requirements of Rule 13e-4 of the Securities Exchange Act of 1934, as amended, or the Exchange Act, and the 1940 Act. In the months in which we repurchase shares, we will conduct repurchases on the same date that we hold our first monthly closing for the sale of shares in this offering. Any offer to repurchase shares will be conducted solely through tender offer materials mailed to each stockholder.
Note 10. Distributions
Subject to our boardBoard of trustees'Director’s discretion and applicable legal restrictions, we authorizehave historically declared and declarepaid ordinary cash distributions at a rate equal to 7.35% of our latest offering price per share. Since the distribution paid to shareholders on September 30, 2015, with a semi-monthly basis and pay suchrecord date of August 30, 2015, we have paid distributions monthly. Prior to the September 30, 2015, we paid distributions on a semi-monthly basis. AnyWe changed to paying distributions monthly in order to our shareholders will be declared out of assets legally available for distribution.reduce costs. We may fund our cash distributions to shareholders from any sources of funds available to us, including offering proceeds, borrowings, net investment income from operations, capital gains proceeds from the sale of assets, non-capital gains proceeds from the sale of assets, and dividends or other distributions paid to us on account of preferred and common equity investments in portfolio companies. We have not established limits on the amount of funds we may use from available sources to make distributions.
When we commenced operations, we initiated a policy of declaring semi-monthly distributions at an annual distribution rate of 7.35% per annum of our offering price. We have authorized, declared and paid distributions to our shareholders at that rate on a semi-monthly basis since July 2012.Our distributions historically have not been based on our investment performance.Prior to September 2013, our distributions were supported by our Manager in the form of operating expense support payments to us, and a portion of our distributions constituted a return of capital.Since September 2013, we have not had an expense support agreement with our Manager and as a result a greater portion of our distributions have constituted a return of capital. A return of capital generally is a return of your investment rather than a return of earnings or gains derived from our investment activities.
| F-20 |
As of December 31, 2013,2016, the Fund hashad not accrued $0.1 million inany stockholder distributions that were unpaid. All amounts with record date in December 2013 and paid in January 2014 have been accrued in the December 31, 2013 financial statements. As of December 31, 2012,2015, the Fund hashad accrued $0.1$0.3 million in stockholder distributions that were unpaid. All amounts with record dates in December 20122015 and paid in January 2013 have2016 had been accrued in the December 31, 20122015 financial statements.
The following table reflects the distributions per share paid or payable in cash or with the distribution reinvestment plan (“DRIP”)DRIP on the Fund’s common stock to date (dollars in thousands except per share amounts), as well as the source of the distributions:
Source of Distribution by Cash vs. DRIP:
| Net | Realized | Net | Realized | |||||||||||||||||||||||||||||||||||||||||||||||||||||
| Investment | Gain From | Return of | Paid in | Investment | Gain From | Return of | Paid in | |||||||||||||||||||||||||||||||||||||||||||||||||
| Period | Per Share | Income | Investments | Capital | Total | Cash | DRIP | Per Share | Income | Investments | Capital | Total | Cash | DRIP | ||||||||||||||||||||||||||||||||||||||||||
| July 12, 2012 - September 30, 2012 | $ | 0.18375 | 32 | - | 18 | 50 | 34 | 16 | $ | 0.183750 | $ | 32 | $ | - | $ | 18 | $ | 50 | $ | 34 | $ | 16 | ||||||||||||||||||||||||||||||||||
| October 1, 2012 - December 31, 2012 * | $ | 0.26075 | 118 | - | 82 | 200 | 123 | 77 | ||||||||||||||||||||||||||||||||||||||||||||||||
| January 1, 2013 - March 31, 2013 * | $ | 0.26259 | 247 | 47 | 75 | 369 | 221 | 148 | ||||||||||||||||||||||||||||||||||||||||||||||||
| October 1, 2012 - December 31, 2012* | 0.260750 | 118 | - | 82 | 200 | 123 | 77 | |||||||||||||||||||||||||||||||||||||||||||||||||
| January 1, 2013 - March 31, 2013* | 0.262586 | 247 | 47 | 75 | 369 | 221 | 148 | |||||||||||||||||||||||||||||||||||||||||||||||||
| April 1, 2013 - June 30, 2013 | $ | 0.18650 | 235 | 43 | 27 | 305 | 186 | 119 | 0.186504 | 235 | 43 | 27 | 305 | 186 | 119 | |||||||||||||||||||||||||||||||||||||||||
| July 1, 2013 - September 30, 2013 | $ | 0.18650 | 244 | 47 | 183 | 474 | 274 | 200 | 0.186504 | 244 | 47 | 183 | 474 | 274 | 200 | |||||||||||||||||||||||||||||||||||||||||
| October 1, 2013 - December 31, 2013 | $ | 0.18650 | 72 | 258 | 219 | 549 | 345 | 204 | 0.186504 | 72 | 258 | 219 | 549 | 345 | 204 | |||||||||||||||||||||||||||||||||||||||||
| January 1, 2014 - March 31, 2014 | 0.186504 | 168 | 85 | 379 | 632 | 405 | 227 | |||||||||||||||||||||||||||||||||||||||||||||||||
| April 1, 2014 - June 30, 2014 | 0.186504 | 372 | - | 382 | 754 | 491 | 263 | |||||||||||||||||||||||||||||||||||||||||||||||||
| July 1, 2014 - September 30, 2014 | 0.184668 | 135 | 29 | 644 | 808 | 511 | 297 | |||||||||||||||||||||||||||||||||||||||||||||||||
| October 1, 2014 - December 31, 2014 | 0.181467 | 144 | 52 | 748 | 944 | 584 | 360 | |||||||||||||||||||||||||||||||||||||||||||||||||
| January 1, 2015 - March 31, 2015 | 0.179154 | 153 | 52 | 824 | 1,029 | 654 | 375 | |||||||||||||||||||||||||||||||||||||||||||||||||
| April 1, 2015 - June 30, 2015 | 0.179154 | 705 | 163 | 243 | 1,111 | 719 | 392 | |||||||||||||||||||||||||||||||||||||||||||||||||
| July 1, 2015 - September 30, 2015 | 0.209015 | 240 | 142 | 904 | 1,286 | 836 | 450 | |||||||||||||||||||||||||||||||||||||||||||||||||
| October 1, 2015 - December 31, 2015** | 0.170315 | — | 68 | 996 | 1,064 | 685 | 379 | |||||||||||||||||||||||||||||||||||||||||||||||||
| January 1, 2016 – March 31, 2016 *** | 0.169969 | 8 | — | 1,045 | 1,053 | 684 | 369 | |||||||||||||||||||||||||||||||||||||||||||||||||
| April 1, 2016 - June 30, 2016**** | 0.107188 | — | — | 669 | 669 | 452 | 217 | |||||||||||||||||||||||||||||||||||||||||||||||||
| July 1, 2016 - September 30, 2016***** | 0.214372 | 305 | — | 1,042 | 1,347 | 934 | 413 | |||||||||||||||||||||||||||||||||||||||||||||||||
| October 1, 2016 - December 31, 2016 | 0.107186 | 160 | 78 | 439 | 677 | 473 | 204 | |||||||||||||||||||||||||||||||||||||||||||||||||
| TOTAL | 948 | 395 | 604 | 1,947 | 1,183 | 764 | $ | 3.342094 | $ | 3,338 | $ | 1,064 | $ | 8,919 | $ | 13,321 | $ | 8,611 | $ | 4,710 | ||||||||||||||||||||||||||||||||||||
* Includes a special distribution of $0.077 per share.
** For the period from October 31, 2015 to December 31, 2015, the Fund had a net investment loss of approximately $268 thousand. That amount is reflected on the source of distributions table below in the distributions from paid in capital amount.
*** For the period from January 1, 2016 to March 31, 2016, the Fund had a realized loss from investments of approximately $700 thousand. That amount is reflected on the source of distributions table below in the distributions from paid in capital amount.
**** For the period from April 1, 2016 to June 30, 2016, the Fund had a net investment loss of approximately $4 thousand and a realized loss from investments of approximately $12.6 million. These amounts are reflected on the source of distributions table below in the distributions from paid in capital amount. The allocation of the distributions between net investment income and return of capital are different than previously reported as a result of the correction of an accounting error. For further detail, please see Item 9A Controls and Procedures.
***** For the period from July 1, 2016 to September 30, 2016, the Fund had a realized loss from investments of approximately $0.04 million. That amount is reflected on the source of distributions table below in the distributions from paid in capital amount. The allocation of the distributions between net investment income and return of capital are different than previously reported as a result of the correction of an accounting error. For further detail, please see Item 9A Controls and Procedures.
The following table shows the percentage of our distributions, which have been funded from net investment income, realized capital gains and paid in capital since the inception of operations:
Percentage of Distributions by Source:
| Net | Realized | Net | Realized | Return | ||||||||||||||||||||||||||||
| Investment | Gain From | Return of | Investment | Gain From | of | |||||||||||||||||||||||||||
| Period | Per Share | Income | Investments | Capital | Per Share | Income | Investments | Capital | ||||||||||||||||||||||||
| July 12, 2012 - September 30, 2012 | $ | 0.18375 | �� | 64 | % | 0 | % | 36 | % | $ | 0.183750 | 64 | % | 0 | % | 36 | % | |||||||||||||||
| October 1, 2012 - December 31, 2012* | 0.26075 | 59 | % | 0 | % | 41 | % | |||||||||||||||||||||||||
| October 1, 2012 - December 31, 2012 * | 0.260750 | 59 | % | 0 | % | 41 | % | |||||||||||||||||||||||||
| January 1, 2013 - March 31, 2013* | 0.26259 | 67 | % | 13 | % | 20 | % | 0.262586 | 67 | % | 13 | % | 20 | % | ||||||||||||||||||
| April 1, 2013 - June 30, 2013 | 0.18650 | 77 | % | 14 | % | 9 | % | 0.186504 | 77 | % | 14 | % | 9 | % | ||||||||||||||||||
| July 1, 2013 - September 30, 2013 | 0.18650 | 51 | % | 10 | % | 39 | % | 0.186504 | 51 | % | 10 | % | 39 | % | ||||||||||||||||||
| October 1, 2013 - December 31, 2013 | 0.18650 | 13 | % | 47 | % | 40 | % | 0.186504 | 4 | % | 47 | % | 49 | % | ||||||||||||||||||
| January 1, 2014 - March 31, 2014 | 0.186504 | 27 | % | 13 | % | 60 | % | |||||||||||||||||||||||||
| April 1, 2014 - June 30, 2014 | 0.186504 | 49 | % | 0 | % | 51 | % | |||||||||||||||||||||||||
| July 1, 2014 - September 30, 2014 | 0.184668 | 17 | % | 3 | % | 80 | % | |||||||||||||||||||||||||
| October 1, 2014 - December 31, 2014 | 0.181467 | 15 | % | 6 | % | 79 | % | |||||||||||||||||||||||||
| January 1, 2015 - March 31, 2015 | 0.179154 | 15 | % | 5 | % | 80 | % | |||||||||||||||||||||||||
| April 1, 2015 - June 30, 2015 | 0.179154 | 63 | % | 15 | % | 22 | % | |||||||||||||||||||||||||
| July 1, 2015 - September 30, 2015 | 0.209015 | 19 | % | 11 | % | 70 | % | |||||||||||||||||||||||||
| October 1, 2015 - December 31, 2015 | 0.170315 | — | % | 6 | % | 94 | % | |||||||||||||||||||||||||
| January 1, 2016 – March 31, 2016 | 0.169969 | 1 | % | — | % | 99 | % | |||||||||||||||||||||||||
| April 1, 2016 - June 30, 2016** | 0.107188 | — | % | — | % | 100 | % | |||||||||||||||||||||||||
| July 1, 2016 - September 30, 2016** | 0.214372 | 23 | % | — | % | 77 | % | |||||||||||||||||||||||||
| October 1, 2016 – December 31, 2016 | 0.107186 | 24 | % | 11 | % | 65 | % | |||||||||||||||||||||||||
(*)* Includes a special distribution of $0.077 per share.
** The allocation of the distributions between net investment income and return of capital are different than previously reported as a result of the correction of an accounting error.
The following table reflects the sources of the cash distributions on a tax basis that the CompanyFund has paid on its common stock (dollars in thousands) during the fiscal years ended December 31, 20132016, 2015 and 2012: 2014:
| Year ended | Year ended | |||||||||||||||||||||||||||||||||||||||
| Source of Distributions: | December 31, 2013 | December 31, 2012 | Year ended December 31, 2016 | Year ended December 31, 2015 | Year ended December 31, 2014 | |||||||||||||||||||||||||||||||||||
| (Restated) | (Restated) | |||||||||||||||||||||||||||||||||||||||
| Distributions from net investment income | $ | 798 | 47.0 | % | $ | 150 | 60.0 | % | $ | 473 | 12.6 | % | $ | 830 | 18.5 | % | $ | 819 | 26.1 | % | ||||||||||||||||||||
| Distributions from realized gains | 395 | 23.3 | % | - | 0.0 | % | 78 | 2.1 | 425 | 9.5 | 166 | 5.3 | ||||||||||||||||||||||||||||
| Distributions from paid in capital | 504 | 29.7 | % | 100 | 40.0 | % | 3,195 | 85.3 | 3,235 | 72.0 | 2,153 | 68.6 | ||||||||||||||||||||||||||||
| Total | $ | 1,697 | 100.0 | % | $ | 250 | 100.0 | % | $ | 3,746 | 100.0 | % | $ | 4,490 | 100.0 | % | $ | 3,138 | 100.0 | % | ||||||||||||||||||||
There were no distributions paid with borrowings, non-capital gain proceeds from sale of assets, distribution on account of preferred and common equity or expense reimbursement from sponsor.equity.
We expect to continue paying distributions at the same distribution rate, based on the current offering price, and that a substantial part of those distributions will constitute a return of capital for the foreseeable future. Our distributions will continue to constitute return of capital until our net investment income is sufficient to support our distribution rate, which will probably not occur until our Manager enters into an expense support agreement with us, our mix of interest and dividend paying assets increase, or our assets increase enough to lower our expense ratio, which we do not expect to occur until we have significantly more net assets than $100 million in assets.we do at present.
We are in a fund raising stage. As such, we incurWhen the Fund is able to raise new capital, it incurs offering expenses of 1.5% of the gross offering proceeds. However, the Fund has not be able to raise additional capital since April 2015. The chart below shows the percentages of distributions from Net Investment Income excluding offering costs: (dollars in thousands)
| Offering Expenses | Net Investment Income excluding offering costs | % Distribution from Net Investment Income excluding offering costs | % Distributions from Realized Gains excluding offering costs | % Distributions from Paid In Capital excluding offering costs | ||||||||||||||||
| 2013 (Restated) | $ | 322 | $ | 1,120 | 66 | % | 23 | % | 11 | % | ||||||||||
| 2012 (Restated) | $ | 142 | $ | 292 | 100 | % | 0 | % | 0 | % | ||||||||||
| Offering Expenses | Distribution from Net Investment Income excluding offering costs | % Distribution from Net Investment Income excluding offering costs | % Distributions from Realized Gains excluding offering costs | % Distributions from Paid In Capital excluding offering costs | ||||||||||||||||
| 2016 | $ | — | $ | 473 | 13 | % | 2 | % | 85 | % | ||||||||||
| 2015 | $ | 96 | $ | 926 | 21 | % | 9 | % | 70 | % | ||||||||||
| 2014 | $ | 352 | $ | 1,171 | 37 | % | 5 | % | 58 | % | ||||||||||
| 2013 | $ | 322 | $ | 1,120 | 66 | % | 23 | % | 11 | % | ||||||||||
| 2012 | $ | 142 | $ | 292 | 100 | % | — | % | — | % | ||||||||||
| F-22 |
Note 9.11. Financial Highlights
The following is a schedule of financial highlights for the years ended December 31, 2016, 2015, 2014, 2013 and 2012:
| For the year ended December 31, 2013 | For the year ended December 31, 2012 | For the year ended December 31, 2016 | For the year ended December 31, 2015 | For the year ended December 31, 2014 | For the year ended December 31, 2013 | For the year ended December 31, 2012 | ||||||||||||||||||||||
| (Restated) | (Restated) | |||||||||||||||||||||||||||
| Per share data: | ||||||||||||||||||||||||||||
| Net asset value, beginning of period | $ | 8.77 | $ | 8.82 | $ | 4.61 | $ | 7.34 | $ | 8.70 | $ | 8.77 | $ | 8.82 | ||||||||||||||
| Results of operations (1) | ||||||||||||||||||||||||||||
| Net investment income | 0.37 | 0.61 | 0.07 | 0.14 | 0.19 | 0.37 | 0.61 | |||||||||||||||||||||
| Net realized gain on investments | 0.18 | - | ||||||||||||||||||||||||||
| Net unrealized loss on investments | (0.23 | ) | (0.48 | ) | ||||||||||||||||||||||||
| Net increase(decrease) in net assets resulting from operations | 0.32 | 0.13 | ||||||||||||||||||||||||||
| Net realized gain (loss) on investments | (2.12 | ) | 0.06 | 0.04 | 0.18 | — | ||||||||||||||||||||||
| Net unrealized gain (loss) on investments | 3.27 | (2.40 | ) | (1.46 | ) | (0.23 | ) | (0.48 | ) | |||||||||||||||||||
| Net increase (decrease) in net assets resulting from operations | 1.22 | (2.20 | ) | (1.23 | ) | 0.32 | 0.13 | |||||||||||||||||||||
| Stockholder distributions (2) | ||||||||||||||||||||||||||||
| Distributions from net investment income | (0.37 | ) | (0.59 | ) | (0.08 | ) | (0.14 | ) | (0.19 | ) | (0.37 | ) | (0.59 | ) | ||||||||||||||
| Distributions from realized gains | (0.18 | ) | - | (0.01 | ) | (0.06 | ) | (0.04 | ) | (0.18 | ) | — | ||||||||||||||||
| Distributions from capital | (0.24 | ) | (0.43 | ) | (0.51 | ) | (0.54 | ) | (0.50 | ) | (0.24 | ) | (0.43 | ) | ||||||||||||||
| Net decrease in net assets resulting from stockholder distributions | (0.79 | ) | (1.02 | ) | (0.60 | ) | (0.74 | ) | (0.73 | ) | (0.79 | ) | (1.02 | ) | ||||||||||||||
| Capital share transactions | ||||||||||||||||||||||||||||
| Impact from issuance of common stock (3) | 0.40 | 0.84 | — | 0.21 | 0.60 | 0.40 | 0.84 | |||||||||||||||||||||
| Impact from reinvestment of stockholder distributions(4) | 0.10 | — | — | — | — | |||||||||||||||||||||||
| Net increase in net assets resulting from capital share transactions | 0.40 | 0.84 | 0.10 | 0.21 | 0.60 | 0.40 | 0.84 | |||||||||||||||||||||
| Other(5) | (0.02 | ) | — | — | — | — | ||||||||||||||||||||||
| Net asset value, end of period | $ | 8.70 | $ | 8.77 | $ | 5.31 | $ | 4.61 | $ | 7.34 | $ | 8.70 | $ | 8.77 | ||||||||||||||
| Shares outstanding at end of period | 3,151,376 | 950,733 | 6,337,606 | 6,181,515 | 5,546,292 | 3,151,376 | 950,733 | |||||||||||||||||||||
| Total return (5) | 7.72 | % | 10.98 | % | ||||||||||||||||||||||||
| Total return(7) | 23.62 | % | (31.96 | )% | (8.88 | )% | 7.72 | % | 10.98 | % | ||||||||||||||||||
| Ratio/Supplemental data: | ||||||||||||||||||||||||||||
| Net assets, end of period (in thousands) | $ | 27,424 | $ | 8,336 | $ | 33,682 | $ | 28,490 | $ | 40,688 | $ | 27,424 | $ | 8,336 | ||||||||||||||
| Average net assets (in thousands) | $ | 21,372 | $ | 5,831 | $ | 31,831 | $ | 39,246 | $ | 36,686 | $ | 21,372 | $ | 5,831 | ||||||||||||||
| Ratio of net investment income to average net assets (4) | 3.49 | % | 5.14 | % | ||||||||||||||||||||||||
| Ratio of operating expenses to average net assets (4) | 4.27 | % | - | |||||||||||||||||||||||||
| Ratio of expenses reimbursed to average net assets | 3.63 | % | (17.97 | )% | ||||||||||||||||||||||||
| Portfolio turnover ratio (6) | 59.80 | % | 30.60 | % | ||||||||||||||||||||||||
| Ratio of net investment income to average net assets(6)(9) | 1.47 | % | 2.12 | % | 2.23 | % | 3.73 | % | 5.14 | % | ||||||||||||||||||
| Ratio of operating expenses to average net assets(6)(9) | 8.33 | % | 6.83 | % | 6.65 | % | 4.03 | % | — | % | ||||||||||||||||||
| Ratio of expenses reimbursed to average net assets(9) | 0.65 | % | — | % | — | % | 3.63 | % | (17.97 | )% | ||||||||||||||||||
| Portfolio turnover ratio(8) | 83.71 | % | 56.67 | % | 36.08 | % | 59.80 | % | 30.60 | % | ||||||||||||||||||
_________________________
| (1) | The per share | |
| (2) | The per share data for distributions reflects the actual amount of distributions declared per share during the period. |
| F-23 |
| (3) | The issuance of common stock on a per share basis reflects the incremental net asset value changes as a result of the issuance of shares of common stock in the | |
| (4) | The impact from reinvestment of stockholder distributions on a per share basis reflects the incremental net asset value changes as a result of the reinvestment of stockholder distributions. | |
| (5) | Includes the impact of different share amounts used in calculating per share data as a result of calculating certain per share data based on weighted average shares outstanding during the period and certain per share data based on shares outstanding as of a period end or transaction date. | |
| (6) | The ratios are after giving effect to amounts reimbursed by the Manager under an expense reimbursement agreement. See “Note 4 – Related Party Transactions.” For the years ended December 31, 2016, December 31, 2015 and December 31, 2014, there was no expense waiver and reimbursement. For the year ended December 31, 2013, excluding the expense reimbursement, the ratio of net investment income and operating expenses to average net assets is (0.14)% and 7.90%, respectively. For the year ended December 31, 2012, excluding the expense reimbursement, the ratio of net investment income and operating expenses to average net assets is (12.83)% and 17.84%, respectively. | |
| (7) | Total return is calculated assuming a purchase of shares at the current net asset value on the first day and a sale at the current net asset value on the last day of the periods reported. Distributions, if any, are assumed for purposes of this calculation to be reinvested at prices obtained under the DRIP. For the years ended December 31, 2016, December 31, 2015 and December 31, 2014, there was no expense reimbursement. The total return based on net asset value for the year ended December 31, 2013, includes the effect of the expense reimbursement which equaled 3.63%. The total return based on net asset value for the year ended December 31, 2012, includes the effect of the expense reimbursement which equaled 6.24%. | |
| (8) | Portfolio turnover rate is calculated using the lesser of year-to-date sales or purchases over the average of the invested assets at fair value. | |
| (9) | Ratios calculated based on average net assets using current and prior 3 quarters net assets. |
Note 10.12. Selected Quarterly Data (Unaudited)
The following is the quarterly results of operations for the yearyears ended December 31, 20132016 and 2012.2015. The operating results for any quarter are not necessarily indicative of results for any future period (dollars in thousands except share and per share amounts):
| Quarter Ended | ||||||||||||||||||||||||||||||||
| December 31, 2013 | September 30, 2013 | June 30, 2013 | March 31, 2013 | Quarter Ended | ||||||||||||||||||||||||||||
| (Restated) | (Restated) | December 31, 2016 | September 30, | June 30, | March 31, 2016 | |||||||||||||||||||||||||||
| Investment income | $ | 558 | $ | 456 | $ | 401 | $ | 244 | $ | 785 | $ | 959 | $ | 739 | $ | 637 | ||||||||||||||||
| Operating expenses | ||||||||||||||||||||||||||||||||
| Total Expenses | 438 | 502 | 349 | 348 | 625 | 654 | 743 | 629 | ||||||||||||||||||||||||
| Less: Waiver of incentive fees | - | - | - | - | ||||||||||||||||||||||||||||
| Less: Expense reimbursements | (41 | ) | (201 | ) | (285 | ) | (249 | ) | ||||||||||||||||||||||||
| Net expenses | 397 | 301 | 64 | 99 | 625 | 654 | 743 | 629 | ||||||||||||||||||||||||
| Net investment income (loss) | 161 | 155 | 337 | 145 | 160 | 305 | (4 | ) | 8 | |||||||||||||||||||||||
| Realized and unrealized gain (loss), net | (253 | ) | 182 | (266 | ) | 236 | ||||||||||||||||||||||||||
| Net increase (decrease) in net assets resulting from operations | $ | (92 | ) | $ | 337 | $ | 71 | $ | 381 | |||||||||||||||||||||||
| Realized and unrealized gain, net | 812 | 1,630 | 4,132 | 571 | ||||||||||||||||||||||||||||
| Net increase in net assets resulting from operations | $ | 972 | $ | 1,935 | $ | 4,128 | $ | 579 | ||||||||||||||||||||||||
| Per share information - basic and diluted | ||||||||||||||||||||||||||||||||
| Net investment income | $ | 0.05 | $ | 0.06 | $ | 0.18 | $ | 0.11 | $ | 0.03 | $ | 0.05 | $ | 0.00 | $ | 0.00 | ||||||||||||||||
| Net increase (decrease) in net assets resulting from operations | $ | (0.03 | ) | $ | 0.14 | $ | 0.04 | $ | 0.29 | |||||||||||||||||||||||
| Net increase in net assets resulting from operations | $ | 0.15 | $ | 0.31 | $ | 0.66 | $ | 0.09 | ||||||||||||||||||||||||
| Weighted average shares outstanding | 2,928,299 | 2,443,182 | 1,914,889 | 1,292,508 | 6,313,427 | 6,276,081 | 6,237,728 | 6,196,289 | ||||||||||||||||||||||||
| Quarter Ended | ||||||||||||||||
| December 31, 2012 | September 30, 2012 | June 30, 2012 | March 31, 2012 | |||||||||||||
| (Restated) | (Restated) | (Restated) | (Restated) | |||||||||||||
| Investment income | $ | 114 | $ | 32 | $ | - | $ | - | ||||||||
| Operating expenses | ||||||||||||||||
| Total Expenses | 243 | 186 | 56 | 35 | ||||||||||||
| Less: Waiver of incentive fees | - | - | - | - | ||||||||||||
| Less: Expense reimbursements | (242 | ) | (282 | ) | - | - | ||||||||||
| Net expenses (income) | 1 | (96 | ) | 56 | 35 | |||||||||||
| Net investment income (loss) | 113 | 128 | (56 | ) | (35 | ) | ||||||||||
| Realized and unrealized gain (loss), net | (47 | ) | (72 | ) | - | - | ||||||||||
| Net increase (decrease) in net assets resulting from operations | $ | 66 | $ | 56 | $ | (56 | ) | $ | (35 | ) | ||||||
| Per share information - basic and diluted | ||||||||||||||||
| Net investment income (loss) | $ | 0.16 | $ | 0.52 | $ | (2.51 | ) | $ | (1.57 | ) | ||||||
| Net increase (decrease) in net assets resulting from operations | $ | 0.10 | $ | 0.23 | $ | (2.51 | ) | $ | (1.57 | ) | ||||||
| Weighted average shares outstanding | 691,405 | 243,985 | 22,333 | 22,333 | ||||||||||||
| (1) | For the quarters ended September 30, 2016 and June 30, 2016, the investment income, net investment income and realized and unrealized gain, net amounts are different than previously reported as a result of the correction of an accounting error. For further detail, please see Note 13 Subsequent Events. |
| Quarter Ended | ||||||||||||||||
| December 31, 2015 | September 30, 2015 | June 30, 2015 | March 31, 2015 | |||||||||||||
| Investment income | $ | 335 | $ | 851 | $ | 1,412 | $ | 914 | ||||||||
| Operating expenses | ||||||||||||||||
| Total Expenses | 603 | 611 | 707 | 761 | ||||||||||||
| Net expenses | 603 | 611 | 707 | 761 | ||||||||||||
| Net investment income | (268 | ) | 240 | 705 | 153 | |||||||||||
| Realized and unrealized gain (loss), net | (9,521 | ) | (4,333 | ) | (363 | ) | 28 | |||||||||
| Net increase (decrease) in net assets resulting from operations | $ | (9,789 | ) | $ | (4,093 | ) | $ | 342 | $ | 181 | ||||||
| Per share information - basic and diluted | ||||||||||||||||
| Net investment income | $ | 0.04 | $ | 0.04 | $ | 0.11 | $ | 0.03 | ||||||||
| Net increase (decrease) in net assets resulting from operations | $ | (1.59 | ) | $ | (0.66 | ) | $ | 0.06 | $ | 0.03 | ||||||
| Weighted average shares outstanding | 6,153,563 | 6,193,309 | 6,199,493 | 5,763,005 | ||||||||||||
| F-24 |
Note 11.13. Subsequent Events
Management of the Fund has evaluated subsequent events in the preparation of the Fund’s financial statements and has determined that no events require recognition or disclosure in the financial statements except for the following:
From January 1, 2014 to July 16, 2015,On May 23, 2016, the Board of Directors of the Fund approved resolutions to reorganize the Fund as a closed end fund that would operate as an “Interval Fund”.
On September 29, 2016, the Fund filed a final proxy statement with the SEC to reorganize the Fund as a closed end fund that would operate as an “Interval Fund”. An Interval Fund is a closed end fund that has adopted a fundamental policy of making periodic repurchase offers of the fund’s shares pursuant to SEC Rule 23c-3. The reorganization is subject to shareholder approval. The final proxy statement was submitted to shareholders on October 7, 2016 and requests shareholder approval with the following resolutions relating to the reorganization:
| · | Withdrawal of the Fund’s election to be treated as a BDC; |
| · | Reorganization of the Fund from a Maryland corporation to a Delaware Statutory Trust; |
| · | Approval of a fundamental policy under which the Fund will make annual repurchases offers of between 5% and 25% at the net asset value per share of the Fund; |
| · | Approval of fundamental restrictions of the Fund’s investments that are consistent with the Fund’s current investment strategy; |
| · | Approval of a new investment management agreement with the current Manager, which would result in the following changes to its management agreement: management fees would be calculated on gross assets instead of net assets; elimination of the current incentive fee on capital gains; all organization and offering expenses would be payable directly by the Fund, whereas they are now incurred by the Manager and reimbursed to the extent of 1.5% of gross offering proceeds. |
The annual shareholder meeting was adjourned twice during the fourth quarter of 2016 as the proxy voting did not reach a quorum. During the last week of December 2016, the quorum was reached and the shareholders approved the conversion to an Interval Fund. Management anticipates the completion of the conversion during the second quarter of 2017. In the meantime, the Fund will continue to operate as a BDC.
On January 11, 2017, the Fund signed a senior secured loan agreement to invest $2.0 million in Digital Golf Technologies, LLC. The loan agreement specifies that the investment will be made in four draws of $0.5 million per draw. The initial draw of $0.5 million was made on January 17, 2017 and the second draw was made on March 3, 2017. The two remaining draws are due on or around June 1, 2017 and September 1, 2017. In conjunction with this investment, the Fund will also receive, per $0.5 million draw, a Warrant to purchase 11,111 Series A Preferred Units for an aggregate purchase price of $1.00 in total with an aggregate value of $0.05 million. In the first quarter 2017, the Fund received warrants to purchase a total of 22,222 Series A Preferred Units.
On January 12, 2017, the Fund sold $0.6 million par value of investments in APX Group, Inc.'s 8.75% senior unsecured notes at the rate of $102.50.
On January 23, 2017, the Board of Directors of the Fund declared one monthly distribution, and voted to keep the annual distribution rate at 7.35% of the current $8.75 gross offering price. The distribution was to stockholders of record on January 23, 2017 and was paid on January 30, 2017.
On January 24, 2017, Goodman Networks, Inc. entered into a restructuring support agreement of the company's 12.125% senior secured notes due 2018. The restructuring support agreement sets forth the commitment of the company, the consenting noteholders, and the consenting equity holders to support a comprehensive restructuring of over $325.0 million of the company’s long term debt. The restructuring will be effectuated no later than February 27, 2017, through a joint prepackaged plan of reorganization to be filed under chapter 11 of the Bankruptcy Code in the United States Bankruptcy Court.
On February 1, 2017, APX Group Holdings, Inc. issued 3.1an additional $300.0 million sharesaggregate principal amount of common stock for gross7.875% senior secured notes due 2022. The net proceeds from this offering are intended to redeem $300.0 million aggregate principal amount of $29.9 million. The proceedsits 6.375% senior secured notes due 2019. In connection to the same redemption, $0.3 million of Fund's 6.375% senior secured notes were substantially invested in new debt securities.partially called at the rate of $103.188 on January 23, 2017.
On February 6, 20142017, iHeartCommunications, Inc. announced the expiration of its private offer to holders of outstanding 10.0% senior notes due 2018 to exchange outstanding notes for newly-issued 11.25% priority guarantee notes due 2021. The Fund submitted its consent to accept the exchange offer on February 7, 2017.
On February 6, 2017, the Fund gavesubmitted its voluntary consent to tenderreceive 128.40 shares of the full positionnew reorganized holding common stock for every $1,000 in principal amount of Radio One Inc, 12.5%, 5/24/2016unexchanged 10.75% senior subordinatedsecured second lien Logan's Roadhouse, Inc. notes. The fund chose the cash option for tender. The terms were $1,007.50 per $1,000 par, which is a combination of $977.50 tender offer and $30 consent payment.
On February 13, 201416, 2017, the Fund gave its voluntary consentmade an additional investment of $0.45 million in a senior secured first lien loan to tenderNima, LLC.
On February 16, 2017, the full positionBoard of Accellent,Directors of the Fund declared one monthly distribution, and voted to keep the annual distribution rate at 7.35% of the current $8.75 gross offering price. The distribution was to stockholders of record on February 16, 2017 and was paid on February 28, 2017.
On February 27, 2017, the Board of Directors of the Fund declared one monthly distribution, and voted to keep the annual distribution rate at 7.35% of the current $8.75 gross offering price. The distribution was to stockholders of record on March 1, 2017 and was paid on March 30, 2017.
On March 31, 2017, the VII Peaks Co-Optivist Income BDC II Inc. 10% Senior Subordinated Notes(the “Fund”), in consultation with the Fund’s independent registered public accounting firm, concluded that certain of the Fund’s financial statements for the three and six months ended June 30, 2016 and the three and nine months ended September 30, 2016 included in the Fund’s Form 10-Q should no longer be relied upon due 11/01/2017. to the accounting error described below. The financial statements affected for these periods are the Statements of Assets and Liabilities, Statements of Operations, Statements of Changes in Net Assets, Statements of Cash Flows and Schedule of Investments.
The Fund choseis restating these financial statements to correct errors in the tenderaccounting for certain warrants received in connection with early premium option, atdirect loans that the Fund made. Specifically, the Fund did not assign a cost to the warrants based upon their fair value on the date of receipt relative to the total fair value of the debt and warrants received. The difference between the face amount of the debt and its recorded cost resulting from the assignment of value to the warrants is to be treated as original issue discount, and accreted into interest income over the life of the loan.
For the quarter ended June 30, 2016, compared to what was previously reported, the Fund’s restated net investment income increased by $85,000 and its unrealized capital gains decreased by the same amount. For the quarter ended September 30, 2016, compared to what was previously reported, the Fund’s restated net investment income increased by $175,000 and its unrealized capital gains decreased by the same amount. There was no effect on the Fund’s net asset value per share (NAV) for those periods. The Fund intends to file amended Forms 10-Q/A for the quarters affected.
On April 6, 2017, the Fund made an additional investment of $0.5 million in a senior secured first lien loan to Nima, LLC.
On April 7, 2017, the Fund made an investment of $1.34 million in a senior secured first lien loan to Vieste Group, LLC. In conjunction with this investment, the Fund received a Warrant to purchase 94,628.5017 Class A Units for an aggregate purchase price of $1,080 per $1,000 par. This is a combination$1.00 in total with an aggregate value of $1,050 tender offer consideration$0.1 million.
On April 24, 2017 the Board of Directors of the Fund declared one monthly distribution, and $30 early tender premium.voted to keep the annual distribution rate at 7.35% of the current $8.75 gross offering price. The distribution was to stockholders of record on April 24, 2017 and was paid on April 28, 2017.
On May 17, 2017, in the Relativity Media case, the pending motion to convert the bankruptcy case to chapter 7 liquidation was dismissed with prejudice by the petitioning creditors. The court did not discuss the adversary case related to the Fund's matter.
On May 9, 2014,22, 2017, the Fund gave its voluntary consent to tender the full position of Caesar’s Entertainment Corp. 10%, 12/15/2015 senior secured second lien notes. The fund chose cash option for tender. The terms were $1,022.50 per $1,000 par, which is a combination of $992.50 tender offer and $30 consent payment. The tender offer was completed and Fund received proceeds including all accrued interest on July 28, 2014.
During the quarter ending June 30, 2014, our Manager paid in full the Due from Affiliate balance of $1.3 million. In addition, in the same period, we accrued $0.1 million of interest on such amount at the rate of 7.35% per annum which was subsequently paid as well.
On July 10, 2014 the Fund gave its voluntary consent to tender the full position of Armored AutoGroup, 9.25%, 11/01/2018 senior unsecured notes. The Fund chose the cash option for tender. The terms were cash payment of $5.00 per $1,000 par.
On July 23, 2014 the Fund gave its voluntary consent to tender the full position of Clear Channel Communications, 11.0%, 8/01/2016 senior unsecured notes. The Fund chose the cash option for tender. The terms were $1,006.42 per $1,000 par, which is a combination of $976.42 tender offer and $30 consent payment.
On July 29, 2014, Cenveo, Inc. redeemed all of its 8.875% Notes due 2018 for $1,044.40 per $1,000 par including all accrued interest from the proceeds of its newly issued senior secured notes due 2019 and 2022.
On August 8, 2014, the Pricing Committee of our Board of Directors decreasedof the share price for new investments from $10.15Fund declared two monthly distributions, and voted to $10.00 per share,keep the annual distribution rate at 7.35% of the current $8.75 gross offering price. The distributions was to stockholders of record on May 22, 2017, and was paid on November 18, 2014 the Pricing CommitteeMay 30, 2017; and to stockholders of our Board of Directors decreased the share price for new investments from $10.00 to $9.75 per share.record on June 1, 2017, payable on June 30, 2017.
On September 2, 2014, the Fund was informed by Endeavour International Corporation (NYSE: ENDV), the “company”, that it had decided not to pay the coupon interest due on the 12% First Priority Notes, 3-1-2018 and 12% Second Priority Notes, 6-1-2018. At September 30, 2014, the Fund held $0.5 million principal amount of 12% First Priority Notes with an amortized cost of $0.6 million, and $0.7 million in 12% Second Priority Notes with an amortized cost of $0.7 million. Under the terms of the indentures, there was a thirty day grace period during which the company had the right to make the interest payment and cure any potential event of default for non-payment. Because the interest payments were not made during the grace period, an event of default occurred. On October 10, 2014, the company announced its restructuring agreement for the notes. In connection therewith, the company and certain of its subsidiaries filed a voluntary petition for relief under Chapter 11 of the Bankruptcy code. Pursuant to the agreement, the company’s debt will be reduced by 43%. In consideration for the cancellation of debt, the Fund will receive 9.75% new notes for its 12% First Priority Notes and new 3.5% convertible preferred shares for its 12% First Priority Notes and 12% Second Priority Notes.
On October 20, 2014, the Fund accepted the voluntary corporate action exchange for the Education Management LLC 15.00%, 7/1/2018 multi coupon notes offered at par. Of the options offered, the Fund chose the exchange in preferred shares and warrants for the full 869,582 par value.
On January 13, 2015, we received a mandatory full call from Hutchinson Technology on the convertible note 8.5%, put date of January 1, 2026. We hold a par value position of $858. The price will be par value and accrued interest with a redemption date of January 15, 2015. No action was required on behalf of the fund. The notice was for informational purposes only.
On February 4, 2015, we received a mandatory partial call from Central Garden Pet Company on the notes held at 8.25%, maturity date of March 1, 2018. We hold a par value position of $1,400. Of this, $154 par value is called at a premium price of $102.063 per share with a redemption date of March 1, 2015. No action was required on behalf of the fund. The notice was for informational purposes only.
During the second quarter of 2015, VII Peaks repaid the outstanding balance of $138, along with the accrued interest of $15, resulting from offering costs paid by the Fund that should have been borne by the Manager under the terms of our agreement with the Manager.
| F-25 |
ITEM 9. CHANGES IN AND DISAGREEMENTS WITH ACCOUNTANTS ON ACCOUNTING AND FINANCIAL DISCLOSURE
| (a) | Dismissal of BPM LLP |
None.
| (1) | Effective June 27, 2016, we dismissed BPM LLP as our principal independent registered public accounting firm. Our audit committee approved the dismissal of BPM LLP. |
| (2) | The report of BPM on our financial statements for the fiscal years ended December 31, 2015 and 2014 did not contain an adverse opinion or disclaimer of opinion, nor was it modified as to uncertainty, audit scope or accounting principles. |
| (3) | During the fiscal year ended December 31, 2015 and during the subsequent period through the date of BPM’s dismissal, there were no disagreements between us and BPM, whether or not resolved, on any matter of accounting principles or practices, financial statement disclosure, or auditing scope or procedure, which if not resolved to the satisfaction of BPM, would have caused BPM to make reference thereto in its report on our audited financial statements. In connection with the audits of the fiscal years ended December 31, 2015 and 2014, and the interim period ended March 31, 20167, there have been no “reportable events” (as defined in Item 304(a)(1)(v) of Regulation S-K). |
| (b) | Engagement of OUM & Co. LLP |
| (1) | Effective June 27, 2016, we engaged OUM & Co. LLP (“OUM”) as our independent registered public accounting firm. The engagement was approved by the board of directors, which also serves the role of audit committee. |
| (2) | In connection with our appointment of OUM as our independent registered accounting firm, we had not consulted OUM on any matter relating to the application of accounting principles to a specific transaction, either completed or contemplated, or the type of audit opinion that might be rendered on our financial statements. |
ITEM 9A. CONTROLS AND PROCEDURES
Disclosure Controls and Procedures
In accordance with Rules 13a-15(b) and 15d-15(b) of the Securities Exchange Act of 1934, as amended (the “Exchange Act”), we, under the supervision and with the participation of our Chief Executive Officer and Chief Financial Officer, carried out an evaluation of the effectiveness of our disclosure controls and procedures (as defined in Rule 13a-15(e) and Rule 15d-15(e) of the Exchange Act) as of the end of the period covered by this Annual Report on Form 10-K/A10-K and determined that the disclosure controls and procedures are effective.were not effective as a result of material weaknesses.
| 57 |
Management’s Reportreport on Internal Control Over Financial Reporting
Our management is responsible for establishing and maintaining adequate internal control over financial reporting. As defined in Exchange Act Rules 13a-15(f) and 15d-15(f), internal control over financial reporting is a process designed by, or under the supervision of, the Chief Executive Officer and Chief Financial Officer, or persons performing similar functions, and effected by the Fund’s boardBoard of directors,Directors, management and other personnel, to provide reasonable assurance regarding the reliability of financial reporting and the preparation of financial statements for external purposes in accordance with U.S. GAAP. Based on our management’s evaluation under the framework inInternal Control—Integrated Framework (2013) issued by the Committee of Sponsoring Organizations of the Treadway Commission (COSO), management concluded that our internal controls over financial reporting were effective as of December 31, 2013.2016.
Because of its inherent limitations, a system of internal control over financial reporting can provide only reasonable assurance with respect to financial statement preparation and presentation and may not prevent or detect misstatements. Also, projections of any evaluation of effectiveness to future periods are subject to the risk that controls may become inadequate because of changes in conditions, or that the degree of compliance with the policies or procedures may deteriorate.
Management has concluded it has material weaknesses resulting from the following:
Subsequent to December 31, 2016, our Board of Directors elected to restate our financial statements for the three and six months ended June 30, 2016, and for the three and nine months ended September 30,2016, in order to correct an error in the accounting for certain warrants received in connection with direct loans that we made. Specifically, we did not assign a cost to the warrants based upon their fair value on the date of receipt relative to the total fair value of the debt and warrants received. The difference between the face amount of the debt and its recorded cost resulting from the assignment of value to the warrants is to be treated as original issue discount, and accreted into interest income over the life of the loan. The change resulted in an increase in net investment income, and a decrease in unrealized appreciation in the same amount, in each period, and had no impact on our net asset value per share, as previously reported. Management previously concluded that its disclosure controls were effective for those periods. In response, in 2017 we implemented additional controls whereby officers will seek outside guidance in regard to accounting for transactions that we have not historically engaged in and which present novel issues.
In addition, we will also obtain third party valuations of certain Level III assets in certain situations to corroborate managements’ internal valuations or guide management in valuing such assets, as well as to assist us in enhancing our documentation related to valuing such investments.
We believe the material weaknesses have been remediated by the additional controls and procedures that have been implemented.
Change in Internal Control Over Financial Reporting
No change occurredThere were no changes in our internal control over financial reporting (as defined in Rule 13a-15(f) and 15d-15(f) of the Exchange Act) during the year ended December 31, 20132016 that has materially affected, or is reasonably likely to materially affect, our internal control over financial reporting. However, in 2015, we determined that a deficiency in internal control over financial reporting existed relating to the determination of offering expenses that should have been borne by our Fund manager instead of us, and reimbursed to our manager at the rate of 1.5% of gross offering proceeds in accordance with our investment management agreement with the Fund manager, and that the deficiency existed during the period covered by this report. In response, in 2015 we implemented additional controls whereby officers will map out financial statement line items to the relevant portions of the agreements with our Fund manager to ensure compliance and proper accounting for amounts due thereunder.
None.
| 58 |
We will file a definitive Proxy Statement for our 2014 Annual Meeting of Stockholders with the Securities and Exchange Commission (the “SEC”), pursuant to Regulation 14A, not later than 120 days after the end of our fiscal year. Accordingly, certain information required by Part III has been omitted under General Instruction 6(3) to Form 10-K. Only those sections of our definitive Proxy Statement that specifically address the items set forth herein are incorporated by reference.
ITEM 10. DIRECTORS, EXECUTIVE OFFICERS AND CORPORATE GOVERNANCE
Our business and affairs are managed under the direction of our Board of Directors. The responsibilities of the Board of Directors include, among other things, the oversight of our investment activities, the quarterly valuation of our assets, oversight of our financing arrangements and corporate governance activities. Pursuant to our charter, the Board is divided into three classes, designated Class I, Class II, and Class III. At each annual meeting of our stockholders, the successors to the class of directors whose terms expire at such meeting will be elected to hold office for a term expiring at the annual meeting of stockholders held in the third year following the year of their election. Each director will hold office for the term to which he or she is elected and until his or her successor is duly elected and qualifies.
Biographical Information
Biographical information requiredfor each of our executive officers and directors is set forth below. The address for each executive officer and director is c/o VII Peaks Co-Optivist Income BDC II, Inc., 4 Orinda Way, Suite 125-A, Orinda, CA 94563.
Directors
The following persons serve as our directors and on the committees indicated:
| Nominee | Age | Director Since | Independent | Expiration of Term | Principal Occupation or Affiliation | Committees | ||||||
| Jeya Kumar | 62 | 2012 | Yes | 2019 | Advisor at MediaLink Singapore | Audit; Nominating and Corporate Governance | ||||||
| Robert Winspear | 51 | 2012 | Yes | 2017 | President of Winspear Investments, LLC | Audit, Nominating and Corporate Governance | ||||||
| Stephen F. Shea | 47 | 2015 | No | 2017 | Director and Member of Investment Committee | Managing Partner | ||||||
| Gurpreet (Gurprit) S. Chandhoke | 42 | 2012 | No | 2018 | Director and Member of Audit Committees | Chairman | ||||||
| Amit Mahajan | 41 | 2012 | Yes | 2018 | Director at PineBridge Investments | Nominating and Corporate Governance |
Executive Officers
The following persons serve as our executive officers in the following capacities:
| Name | Age | Position Held | ||
| Gurpreet (Gurprit) S. Chandhoke | 42 | Chief Executive Officer and President | ||
| Michelle MacDonald | 49 | Chief Financial Officer, Treasurer and Secretary | ||
| Emily Silva | 52 | Chief Compliance Officer | ||
| Garima Kakani | 32 | Controller |
Information about Directors
Gurpreet (Gurprit) S. Chandhoke
Mr. Chandhoke has been our Chief Executive Officer and President since our inception. Mr. Chandhoke has also been a Managing Partner and Chief Investment Officer of the Manager since its inception in April 2009. From August 2006 to February 2009, Mr. Chandhoke was Senior Vice President of Deutsche Bank Technology Investment Banking Group in San Francisco. From August 2005 to August 2006, Mr. Chandhoke worked for UBS Investment Bank as an Associate Director.
| 59 |
Before founding the Manager in 2009, Mr. Chandhoke had more than six years investment banking experience. Mr. Chandhoke led several different types of debt issuances and restructuring discussions and transactions with technology companies and financial sponsors while at Deutsche Bank and UBS Investment Bank. During his tenure at both institutions he also participated in diverse corporate finance and M&A transactions in the internet, enterprise software and infrastructure and communications technology sectors. Mr. Chandhoke’s responsibilities at Deutsche Bank and UBS Investment Bank also involved the issuance of debt securities ranging from bank debt, corporate debt, high yield and convertible debt securities. Mr. Chandhoke also worked on corporate finance transactions ranging from mergers and acquisitions, initial public offerings, follow-on offerings, debt issuances and recapitalizations at both Deutsche Bank and UBS Investment Bank.
Mr. Chandhoke received a Master of Business Administration in Finance and Entrepreneurship from the Wharton School of Business. Mr. Chandhoke also received a Master Degree of Science in Electrical Engineering and a Master Degree of Science in Mechanical Engineering from the University of Minnesota and a Bachelor’s Degree in Electrical Engineering from the Government College of Engineering, University of Pune, India. Mr. Chandhoke was chosen as a J.N. Tata Scholar to pursue his graduate studies in the United States.
Mr. Chandhoke’s broad and extensive investment banking experience and involvement in a number of diverse corporate finance and M&A transactions as well as his experience as Chief Investment Officer for the Manager supports his appointment to the Board.
Mr. Chandhoke is a registered representative with Arete, which is the principal underwriter of the Fund. The Manager and Arete have entered into a joint venture to acquire investment advisers, but the joint venture had not made any acquisitions as of June 2, 2017.
Stephen F. Shea
Mr. Shea has been a Managing Partner of the Manager since August 2009. Prior to joining the Manager, Mr. Shea worked as a consultant with investment banking and venture/private equity teams and helped registered investment advisers integrate and build out offerings into distribution channels with his long standing connections at a number of wire houses. Mr. Shea also advised hedge funds on new seeding opportunities in the commodities/futures space. Prior to his consulting work, from October 2005 to March 2007, Mr. Shea was Vice President of Institutional Sales RIA Team for Fidelity Investments in San Francisco, spending the majority of his time as a director of sales for Institutional Investment Managers, RIA wealth management teams and banks and trust companies. In addition, Mr. Shea was responsible for the signing, business development and retention of SEC registered RIA relationship in San Francisco and the Pacific Northwest. Prior to working for Fidelity Investments, Mr. Shea worked for Wentworth, Hauser and Violich Investment Counsel. At Wentworth, Mr. Shea was a member of Stock Selection and Investment Policy committees. He co-developed an open architecture WRAP, Sub-Advised, RIA platform. Before that, from December 1999 to March 2001, Mr. Shea worked at Deutsche Bank/Alex Brown. At Deutsche Bank/Alex Brown, Mr. Shea acted as a lead broker for many of the top technology executives.
Mr. Shea holds a BS in Business and Finance from St. Mary’s College in California.
Mr. Shea is a registered representative with Arete Wealth Management, LLC (“Arete”), which is the principal underwriter of the Fund. The Manager and Arete have entered into a joint venture to acquire investment advisers, but the joint venture had not made any acquisitions as of June 2, 2017.
Jeya Kumar
Since July 2013 to the present, Mr. Kumar has been an advisor at MediaLink Singapore, which is engaged in Media and IT services. From April 2012 to the present, he has served as an Independent Director at Spring Seed Capital in Singapore. Spring Seed Capital is a Singapore government entity investing in Singapore based startups. From November 2011 to July 2013 he was the CEO (Asia Pacific) for IPSoft Inc., which is engaged in technology led IT management services. Prior to joining IpSoft, he was the Advisor to Patni Computer Systems, Ltd. (“Patni”), which provides consulting, technology and business process outsourcing, and product engineering services. Prior to being an advisor to Patni, from February 2009 to May 2011, Mr. Kumar served as the Chief Executive Officer of Patni, where he drove the Fund’s global operations and defined and executed the Fund’s long-term strategy.
From January 2008 to January 2009, Mr. Kumar served as the Chief Executive Officer of MphasiS Limited, which provides applications services, infrastructure services, and business process outsourcing services. Prior to MphasiS, from September 2006 to January 2008, Mr. Kumar was Senior Vice-President of Sun Microsystems (“Sun”), which sold computers, computer components, computer software, and information technology services, and was a member of Sun’s Executive Management Group. At Sun, Mr. Kumar was responsible for his business unit’s financial performance, strategy, marketing, portfolio management, in-market management, product engineering, technology development, M&A and channels in more than 120 countries. Prior to this, he held various management and executive positions with a number of global technology firms.
Mr. Kumar has a Masters of Business degree from Curtin University, Australia; Bachelors of Business degree from the Royal Melbourne Institute of Technology, Australia; and postgraduate diplomas in Computer Science, Management Studies and Marketing Management. He also attended the Advanced Management Program at Oxford University.
| 60 |
Mr. Kumar’s broad and extensive experience as an executive officer for global companies, including being responsible for such companies’ performance and strategy support his appointment to the Board.
Robert Winspear
Robert Winspear has served as the Chief Financial Officer of Excel Corporation since May 2014. Excel Corporation (OTC: EXCC) provides transaction processing and related services to medium and small businesses in the US.
Mr. Winspear has been the President of Winspear Investments LLC, a Dallas based private investment firm specializing in lower middle market transactions, since September 2002. Winspear Investments has made investments in a wide range of industries including banking, real estate, distribution, supply chain management, mega yacht marinas and hedge funds.
Prior to forming Winspear Investments, Mr. Winspear was Vice President and Chief Financial Officer of Associated Materials Incorporated, a nationwide manufacturer and distributor of residential building products consisting primarily of vinyl siding and windows, from June 1993 to May 2002.
Mr. Winspear began his professional career in the Dallas office of Arthur Andersen where he worked as an auditor from 1988 to 1993. He holds a Bachelor of Business Administration and a Master of Professional Accounting from the University of Texas at Austin.
Mr. Winspear is on the Board of Directors of Alpha Financial Technologies/EAM Corporation, located in Grapevine Texas.
Mr. Winspear’s extensive investment experience as Vice President and Chief Financial Officer of Associated Materials Incorporated and service on the Board of Directors Alpha Financial Technologies/EAM Corporation support his appointment to the Board.
Amit Mahajan
Since August 2005, Mr. Mahajan has been a Director at PineBridge Investments, a global multi-asset investment manager, where he has been responsible for sourcing, due diligence, and negotiating secondary private equity transactions. Before assuming his current duties at PineBridge, Mr. Mahajan was previously responsible for executing private equity investments across several industries with a focus on global emerging markets.
Mr. Mahajan has over ten years of experience in private equity, banking, and consulting, and began his career with Deloitte Consulting, where he advised multinational clients in energy, telecom, insurance, utilities, and the technology sector. He holds a Bachelor of Science in Computer Science and Engineering from the Institute of Technology, Delhi, India, and a Master of Business Administration from Columbia Business School.
Mr. Mahajan’s extensive experience with investments and private equity transactions at various companies support his appointment to the Board.
Mr. Mahajan owns interests in the following investment funds managed by Item 10the Manager:
| Name of Director | Name of Owners and Relationships to Director | Company | Title of Class | Value of Securities | Percent of Class | |||||||||
| Amit Mahajan | CXI Valley I, LLC(1) | VII Peaks Venture Capital II, LLC(2) | Series A-1 Preferred Shares | $ | (674) | (3) | 0.89 | % | ||||||
| Amit Mahajan | CXI Valley I, LLC(1) | VII Peaks BDC Investors, LLC(4) | Class A Interests | $ | 0 | (5) | 0 | % | ||||||
| (1) | Mr. Mahajan and his spouse are the owners of CXI Valley I, LLC. |
| (2) | VII Peaks Capital, LLC is the manager of the Fund. |
| (3) | Valuation is the capital account value as of December 31, 2015. |
| (4) | VII Peaks Capital, LLC is the managing member of the Fund. In addition, the Class A Interests are entitled to receive their pro rata share of a royalty payable by VII Peaks Capital, LLC in the amount of $25,000 per month. |
| (5) | Valuation is the capital account value as of December 31, 2015. |
| 61 |
Information about Executive Officers Who Are Not Directors
The following information pertains to our executive officers who are not directors of the Fund.
| Name, Address and Age | Position(s) Held with Company | Principal Occupation(s) during Past Five Years | ||
| Michelle E. MacDonald (49) | Chief Financial Officer, Treasurer and Secretary | Vice President of Compliance for VII Peaks Capital, LLC since August 2014; Chief Compliance Officer at KBR Capital Markets from April 2013 to September 2013; Chief Financial Officer for a real estate fund manager from July 2012 to April 2013; Chief Operating Office for a broker dealer from May 2006 to December 2012; instructor and tutor in securities licensing review courses from 1998 to 2015. | ||
| Emily Silva (52) | Chief Compliance Officer | Director at Cipperman Compliance Services (February 2014 to present); Various positions at The Vanguard Group from 1999 to January 2014, including Advertising Compliance Manager. | ||
| Garima Kakani (32) | Controller | Senior Analyst with VII Peaks Capital, LLC since December 2013; Manager of Reporting and Analytics with KBR Capital Markets from March 2011 to September 2013; Various positions at D.E. Shaw (Indian branch) from March 2007 to September 2009. |
Corporate Governance and Board Matters
Our business and affairs are managed under the direction of our Board of Directors. The responsibilities of the Board of Directors include, among other things, the oversight of our investment activities, the quarterly valuation of our assets, oversight of our financing arrangements and corporate governance activities. Our Board of Directors is hereby incorporateddivided into three classes. Each class of directors holds office for a three-year term. However, the initial members of the three classes have initial terms of one, two and three years, respectively. At each annual meeting of our stockholders, the successors to the class of directors whose terms expire at such meeting will be elected to hold office for a term expiring at the annual meeting of stockholders held in the third year following the year of their election. Each director will hold office for the term to which he or she is elected and until his or her successor is duly elected and qualifies.
The Board of Directors currently has an audit committee and a nominating and corporate governance committee and may establish additional committees from time to time as necessary. Although the number of directors may be increased or decreased, a decrease will not have the effect of shortening the term of any incumbent director. Any director may resign at any time and may be removed with or without cause by referencethe stockholders upon the affirmative vote of at least a majority of all the votes entitled to be cast at a meeting called for the purpose of the proposed removal. The notice of the meeting shall indicate that the purpose, or one of the purposes, of the meeting is to determine if the director shall be removed.
A vacancy created by an increase in the number of directors or the death, resignation, removal, adjudicated incompetence or other incapacity of a director may be filled only by a vote of a majority of the remaining directors. As provided in our charter, nominations of individuals to fill the vacancy of a Board of Directors seat previously filled by an independent director will be made by the remaining independent directors.
Committees of the Board of Directors
Our Board of Directors has the following committees:
Audit Committee and Financial Expert.The audit committee is responsible for selecting, engaging and discharging our independent accountants, reviewing the plans, scope and results of the audit engagement with our independent accountants, approving professional services provided by our independent accountants (including compensation therefore), reviewing the independence of our independent accountants and reviewing the adequacy of our internal controls over financial reporting. The members of the audit committee are Jeya Kumar and Robert Winspear, each of whom is independent. Robert Winspear serves as the chairman of the audit committee. Our Board of Directors has determined that Robert Winspear is an “audit committee financial expert” as defined under SEC rules.
| 62 |
Nominating and Corporate Governance Committee.The nominating and corporate governance committee selects and nominates directors for election by our stockholders, selects nominees to fill vacancies on our Board of Directors or a committee thereof, develops and recommends to our Board of Directors a set of corporate governance principles and oversees the evaluation of our Board of Directors and our management. The nominating and corporate governance committee is currently composed of Jeya Kumar, Amit Mahajan and Robert Winspear, all of whom are independent. Jeya Kumar is expected to serve as chairman of the nominating and corporate governance committee.
Board Leadership Structure
Our business and affairs are managed under the direction of our Board of Directors. Among other things, our Board of Directors sets broad policies for us and approves the appointment of our investment adviser, administrator and officers. The role of our Board of Directors, and of any individual director, is one of oversight and not of management of our day-to-day affairs.
Under our bylaws, our Board of Directors may designate one of our directors as chair to preside over meetings of our Board of Directors and meetings of stockholders and to perform such other duties as may be assigned to him or her by our Board of Directors.
Presently, Mr. Gurpreet S. Chandhoke serves as the Chairman of our Board. Mr. Chandhoke is an “interested person” of the Fund as defined in Section 2(a)(19) of the 1940 Act by virtue of his role as Chief Executive Officer of the Fund, his service on the Investment Committee and is a Managing Member of the Manager. We believe that Mr. Chandhoke’s history with the Fund, familiarity with its investment platform, and extensive knowledge of the financial services industry qualify him to serve as the Chairman of our Board of Directors. We believe that the Fund is best served through this existing leadership structure, as Mr. Chandhoke’s relationship with the Manager provides an effective bridge and encourages an open dialogue between management and the Board of Directors, ensuring that both groups act with a common purpose.
Our Board of Directors does not currently have a designated lead independent director. We are aware of the potential conflicts that may arise when a non-independent director is chairman of the Board of Directors, but believe these potential conflicts are offset by our strong corporate governance policies. Our corporate governance policies include regular meetings of the independent directors in executive session without the presence of interested directors and management, the establishment of the audit committee and the nominating and corporate governance committee, each comprised solely of independent directors and the appointment of a chief compliance officer, with whom the independent directors meet at least once a year without the presence of interested directors and other members of management, for administering our compliance policies and procedures.
We recognize that different board leadership structures are appropriate for companies in different situations. We re-examine our corporate governance policies on an ongoing basis to ensure that they continue to meet our needs.
All of the independent directors play an active role on the Board of Directors. The independent directors compose a majority of our Board of Directors and are closely involved in all material deliberations related to us. Our Board of Directors believes that, with these practices, each independent director has an equal involvement in the actions and oversight role of our Board of Directors and equal accountability to us and our stockholders. Our independent directors are expected to meet separately (i) as part of each regular board meeting and (ii) with our Chief Compliance Officer, as part of at least one board meeting each year.
Our Board of Directors believes that its leadership structure is the optimal structure for us at this time. Our Board of Directors, which will review its leadership structure periodically as part of its annual self-assessment process, further believes that its structure is presently appropriate to enable it to exercise its oversight of us.
Risk Oversight and Board Structure
Through its direct oversight role, and indirectly through its committees, the Board of Directors performs a risk oversight function for the Fund consisting of, among other things, the following activities: (1) at regular and special board meetings, and on an ad hoc basis as needed, receiving and reviewing reports related to the performance and operations of the Fund; (2)reviewing and approving, as applicable, the compliance policies and procedures of the Fund; (3) meeting with the portfolio management team to review investment strategies, techniques and the processes used to manage related risks; (4) meeting with, or reviewing reports prepared by, the representatives of key service providers, including the investment adviser, administrator, distributor, transfer agent, custodian and independent registered public accounting firm of the Fund, to review and discuss the activities of the Fund and to provide direction with respect thereto; and (5) engaging the services of the chief compliance officer of the Fund to test the compliance procedures of the Fund and its service providers. Gurpreet Chandhoke, who is an “interested person” of the Fund as defined in Section 2(a)(19) of the 1940 Act, serves as both the chief executive officer and chairman of the Board of Directors. The Board of Directors feels that Mr. Chandhoke, as chief executive officer of the Fund, is the director with the most knowledge of the Fund’s business strategy and is best situated to serve as chairman of the Board of Directors. The Fund’s charter, as well as regulations governing business development companies generally, requires that a majority of the Board of Directors be persons other than “interested persons” of the Fund, as defined in Section 2(a)(19) of the 1940 Act. The Board of Directors does not currently have a lead independent director. The Board, after considering various factors, has concluded that its structure is appropriate at this time given the fact that it is a newly-formed entity with no assets. As the Fund’s assets increase, the Board of Directors will continue to monitor its structure and determine whether it remains appropriate based on the complexity of the Fund’s operations.
| 63 |
Procedure for Contacting the Board of Directors
Our board of directors welcomes communications from our definitive Proxy Statement relatingstockholders. Stockholders may send communications to the board of directors or to any particular director to the following address: VII Peaks Capital, LLC, Pine Grove Financial Center, 4 Orinda Way, Suite 125A, Orinda, CA 94563, attention Chief Financial Officer. Stockholders should indicate clearly the director or directors to whom the communication is being sent. All stockholder communications received in this manner will be delivered to one or more members of the board of directors.
Compensation Committee Interlocks and Insider Participation
Our board of directors did not have a separate compensation committee during the fiscal year ended December 31, 2016, and as a result our 2014 Annual Meetingfull board served as the compensation committee. Gurpreet Chandhoke and Stephen Shea were the only members of Stockholders,our board of directors who were officers during the fiscal year ended December 31, 2016. The board does not pay compensation to be filedits officers, and therefore the board of directors did not engage in deliberations regarding executive compensation. Messrs. Chandhoke and Shea are each partial owners of our Manager, which receives compensation under an investment advisory agreement with us.
No executive officer of us served as a member of (i) the compensation committee of another entity of which one of the executive officers of such entity served on our compensation committee (or board committee performing equivalent functions) or (ii) the board of directors of another entity of which one of the executive officers of such entity served on our board, during the fiscal year ended December 31, 2016.
Section 16(a) Beneficial Ownership Reporting Compliance
Pursuant to Section 16(a) of the Exchange Act, the Fund’s directors and executive officers, and any persons holding more than 10% of its common stock, are required to report their beneficial ownership and any changes therein to the SEC within 120 days followingand the endFund. Specific due dates for those reports have been established, and the Fund is required to report herein any failure to file such reports by those due dates. Based solely on a review of our fiscal year.the copies of such reports and written representations delivered to the Fund by such persons, all filings were made timely during the year ending December 31, 2016.
ITEM 11. EXECUTIVE COMPENSATION
We currently have no employees. We are managed by our Manager who is registered as an investment adviser under the Investment Advisers Act of 1940, as amended, or the Advisers Act. We do not compensate our executive officers directly. Our Manager is responsible for managing our business, as well as sourcing potential investments, conducting research on prospective investments, analyzing investment opportunities, structuring our investments, and monitoring our investments and portfolio companies on an ongoing basis. Our Manager is led by Gurpreet (Gurprit) S. Chandhoke, who also serves as our Chief Executive Officer, and Stephen F. Shea. They are supported by the Manager’s team of employees, including investment professionals who have extensive experience in underwriting and issuing debt products that include high-yield, bank debt and convertible debt and have acted as financial advisers to private equity funds, venture capital firms and corporations in mergers and acquisitions, recapitalization and corporate finance transactions, and have served as principal investors in private equity and leveraged buyout transactions. See “Item 13. Certain Relationships and Related Transactions, and Director Independence” for a discussion of fees and expenses payable to our Advisers and their respective affiliates.
Our Manager has an investment committee that is responsible for reviewing, discussing and approving each investment opportunity we seek to pursue. We anticipate that our investment committee will meet once a week to discuss new and existing opportunities and developments on current investments. Our investment committee currently consists of Mr. Chandhoke, our Chief Executive Officer, and Mr. Shea.
We entered into our current investment advisory agreement on August 20, 2013, and it was approved by our shareholders on December 13, 2013. The informationcurrent agreement will remain in effect for a period of two years from the date that it was approved by our shareholders, and will remain in effect from year-to-year thereafter if approved annually by our Board of Directors or by the affirmative vote of the holders of a majority of our outstanding voting securities, including, in either case, approval by a majority of our directors who are not interested persons.
As required by Item 11 is hereby incorporated by reference from our definitive Proxy Statement relatingthe 1940 Act, the investment advisory agreement provides that we may terminate the agreement without penalty upon 60 days’ written notice to our 2014 Annual MeetingManager. If our Manager wishes to voluntarily terminate the investment advisory agreement, it must give stockholders a termination and must pay all expenses associated with its termination. The investment advisory agreement may also be terminated, without penalty, upon the vote of Stockholders,a majority of our outstanding voting securities.
| 64 |
Without the vote of a majority of our outstanding voting securities, our investment advisory agreement may not be materially amended, nor may we engage in a merger or other reorganization with our Manager. In addition, should we or our Manager elect to terminate the investment advisory agreement, a new investment adviser may not be filedappointed without approval of a majority of our outstanding common stock, except in limited circumstances where a temporary adviser may be appointed without stockholder consent, consistent with the SEC within 1201940 Act, for a time period not to exceed 150 days following the date on which the previous contract terminates.
On August 22, 2016, the board conducted an annual review of the current advisory agreement. In connection with the foregoing approvals, the Board determined that the Manager had the capabilities, resources and personnel necessary to provide the services to the Fund required under the current advisory agreement. The disinterested members of the board noted that, in their consideration of the amended and restated advisory agreement, they relied upon the information provided to them in connection with their most recent approval of the current advisory agreement. The disinterested members further noted that the Manager confirmed that there were no material changes to such previously provided information.
The Board of Directorsdid not identify any particular information that was most relevant to its consideration to approve the amended and restated advisory agreement and each director may have afforded different weight to the various factors.
In voting to approve the amended and restated advisory agreement, the Board of Directorsconsidered the overall fairness of the amended and restated advisory agreement and factors it deemed relevant, including, but not limited to: (i) the nature, extent and quality of the services to be provided by the Manager, (ii) the investment performance of the Fund and the Manager’s investment personnel who would manage the Fund, (iii) the proposed fees and expenses of the Fund, including comparative expense information, (iv) the projected profitability of the Fund to the Manager and its affiliates; (v) whether the projected economies of scale would be realized as the Fund grows and whether the proposed breakpoints or any other breakpoints are appropriate and (vi) other benefits that may accrue to the Manager from its relationship with the Fund.
Advisory Fees
We pay our Manager a fee for its services under the investment advisory agreement consisting of two components — a base management fee and an incentive fee. The cost of both the base management fee payable to our Manager and any incentive fees it earns are ultimately borne by our stockholders.
Base Management Fee
Our base management fee is calculated as follows and payable monthly in arrears: 2.00% if our net assets are below $100 million; 1.75% if our net assets are between $100 million and $250 million; and 1.50% if our net assets are above $250 million. The base management fee may or may not be taken in whole or in part at the discretion of our Manager. All or any part of the base management fee not taken as to any month shall be deferred without interest and may be taken in such other month as our Manager shall determine. The base management fee for any partial month will be appropriately pro-rated.
Incentive Fee
The incentive fee has two parts. The first part, which we refer to as the subordinated incentive fee on income, is calculated and payable quarterly in arrears based upon our “pre-incentive fee net investment income” for the immediately preceding quarter. The subordinated incentive fee on income is 20% of pre-incentive net investment income subject to a quarterly return to investors, expressed as a rate of return on adjusted capital at the beginning of the most recently completed calendar quarter, of 2.0% (8.0% annualized). For this purpose, “pre-incentive fee net investment income” means interest income, dividend income and any other income (including any other fees, other than fees for providing managerial assistance, such as commitment, origination, structuring, diligence and consulting fees or other fees that we receive from portfolio companies) accrued during the calendar quarter, minus our operating expenses for the quarter (including the base management fee, expenses reimbursed to our Manager under the investment advisory agreement and any interest expense and distributions paid on any issued and outstanding preferred stock, but excluding the incentive fee). Pre-incentive fee net investment income includes, in the case of investments with a deferred interest feature (such as original issue discount, debt instruments with payment-in-kind interest and zero coupon securities), accrued income that we have not yet received in cash. Pre-incentive fee net investment income does not include any realized capital gains, realized capital losses or unrealized capital appreciation or depreciation. The calculation of the subordinated incentive fee on income for each quarter is as follows:
| 65 |
“Adjusted capital” shall mean cumulative gross proceeds generated from sales of our common stock (including our distribution reinvestment plan) reduced for distributions to investors of proceeds from non-liquidating dispositions of our investments and amounts paid for share repurchases pursuant to our tender offer program.
The second part of the incentive fee, which we refer to as the incentive fee on capital gains, is an incentive fee on capital gains earned on liquidated investments from the portfolio and is determined and payable in arrears as of the end of each calendar year (or upon termination of the investment advisory agreement). This fee equals 20.0% of our fiscal year.incentive fee capital gains, which equals our realized capital gains on a cumulative basis from inception, calculated as of the end of each calendar year, computed net of all realized capital losses and unrealized capital depreciation on a cumulative basis, less the aggregate amount of any previously paid capital gains incentive fees.
Director Compensation
Each of our independent directors is entitled to compensation for his services as a director in the amounts depicted below. We will not pay compensation to our interested directors. In addition, the independent directors will be reimbursed for reasonable out-of-pocket expenses incurred in connection with attending board and committee meetings. There are no pension or retirement benefits being offered to our directors at this time. Amounts payable under this arrangement are determined and paid quarterly in arrears as follows:
| Net Asset Value | Annual Retainer Fee | Board Meeting and Committee Meeting Fees (in Person) | Board Meeting and Committee Meeting Fees (by Phone) | Annual Chairperson Fee | |||||||||||
| $0 to $100 million | $ | 10,000 | $ | 500/$250 | $ | 250 | $ | 1,500 | |||||||
| $100 million to $300 million | $ | 20,000 | $ | 1,000/$500 | $ | 250 | $ | 2,500 | |||||||
| $300 million to $500 million | $ | 30,000 | $ | 1,500/$750 | $ | 250 | $ | 3,500 | |||||||
| Above $500 million | $ | 40,000 | $ | 2,000/$1,000 | $ | 250 | $ | 5,000 | |||||||
The following table sets forth the compensation of the Fund’s directors for the year ended December 31, 2016 :
| Name | Fees Earned and Payable in Cash | All Other Compensation | Total | |||||||||
| Interested Directors | ||||||||||||
| Gurpreet S. Chandhoke | — | — | — | |||||||||
| Stephen F. Shea | — | — | — | |||||||||
| Independent Directors | — | — | — | |||||||||
| Jeya Kumar | $ | 13,281 | — | $ | 13,281 | |||||||
| Amit Mahajan | $ | 10,757 | — | $ | 10,757 | |||||||
| Robert Winspear | $ | 13,281 | — | $ | 13,281 | |||||||
ITEM 12. SECURITY OWNERSHIP OF CERTAIN BENEFICIAL OWNERS AND MANAGEMENT AND RELATED STOCKHOLDER MATTERS
The following table sets forth, as of the June 2, 2017, information required by Item 12with respect to the beneficial ownership of our common stock by:
| 66 |
Beneficial ownership is hereby incorporated by reference fromdetermined in accordance with the rules of the SEC and includes voting or investment power with respect to the securities. There is no common stock subject to options that are currently exercisable or exercisable within 60 days of the offering. Percentage of beneficial ownership is based on 6,397,027 shares of common stock outstanding as of June 2, 2017.
Shares Beneficially Owned | ||||||||
| Name | Number | Percentage | ||||||
| 5% Stockholders | ||||||||
| None | — | — | % | |||||
| Executive Officers: | ||||||||
| Michelle E. MacDonald | — | — | % | |||||
| Emily Silva | — | — | % | |||||
| Garima Kakani | — | — | % | |||||
| Interested Directors: | ||||||||
| Gurpreet (Gurprit) S. Chandhoke | — | — | % | |||||
| Stephen F. Shea | — | — | % | |||||
| Independent Directors: | ||||||||
| Jeya Kumar | — | — | % | |||||
| Amit Mahajan | — | — | % | |||||
| Robert Winspear | — | — | % | |||||
| All officers and directors as a group (6 persons) | — | — | % | |||||
The following table sets forth, as of the date of this proxy statement, the dollar range of our definitive Proxy Statement relating to our 2014 Annual Meeting of Stockholders,equity securities that is expected to be filed with the SEC within 120 days following the endbeneficially owned by each of our fiscal year.directors.
| Dollar Range of Equity Securities Beneficially Owned (1)(2)(3) | ||||
| Interested Directors: | ||||
| Gurpreet (Gurprit) S. Chandhoke | None | |||
| Stephen F. Shea | None | |||
| Independent Directors: | ||||
| Jeya Kumar | None | |||
| Amit Mahajan | None | |||
| Robert Winspear | None | |||
ITEM 13. CERTAIN RELATIONSHIPS AND RELATED TRANSACTIONS, AND DIRECTOR INDEPENDENCE
Since August 20, 2013, the Fund has been managed by VII Peaks Capital, LLC (the “Manager”). Prior to August 20, 2013 the Fund was managed by VII Peaks-KBR BDC Advisor II, LLC (the “Prior Manager”), which was wholly-owned by VII Peaks-KBR, LLC which was a joint venture between the Manager and KBR Capital Advisors, LLC (“KBR”).
Investment Advisory Agreement
The information required by Item 13 is hereby incorporated by reference from our definitive Proxy Statement relating to our 2014 Annual Meeting of Stockholders, to be filedFund has entered into an investment advisory agreement with the SEC within 120 days followingManager to manage the Company’s investment activities dated August 20, 2013. Prior to August 20, 2013, the Fund’s investment activities were managed by the Prior Manager pursuant to an investment advisory agreement that had substantially the same terms as the Fund’s present agreement with the Manager. On August 22, 2016, the non-interested Board Members re-approved the agreement between the Manager and the Fund under the agreement’s existing terms. Pursuant to the investment advisory agreement, the Manager implements the Fund’s business strategy on a day-to-day basis and performs certain services for us, subject to oversight by our Board. The Manager is responsible for, among other duties, determining investment criteria, sourcing, analyzing and executing investment transactions, asset sales, financings and performing asset management duties. Under the investment advisory agreement, the Manager is entitled to a base management and incentive fee as outlined in the investment advisory agreement with the Fund. The base management fee is 2% of net assets below $100 million; 1.75% of net assets between $100 million and $250 million; and 1.5% of net assets over $250 million. For the years ended December 31, 2016 and 2015, the Fund incurred $0.6 million and $0.8 million of base management fees, respectively.
| 67 |
The incentive fee has two parts. The first part, the subordinated incentive fee on income, is calculated and payable quarterly in arrears based upon the Fund’s “pre-incentive fee net investment income” for the immediately preceding quarter. The subordinated incentive fee on income is 20% of pre-incentive net investment income subject to a quarterly return to investors, expressed as a rate of return on adjusted capital at the beginning of the most recently completed calendar quarter, of 2.0% (8.0% annualized). The second part of the incentive fee, the incentive fee on capital gains, is an incentive fee on capital gains earned on liquidated investments from the portfolio and is determined and payable in arrears as of the end of each calendar year (or upon termination of the investment advisory agreement). This fee equals 20% of the Fund’s incentive fee capital gains, which will equal the Fund’s realized capital gains on a cumulative basis from inception, calculated as of the end of each calendar year, computed net of all realized capital losses and unrealized capital depreciation on a cumulative basis, less the aggregate amount of any previously paid capital gains incentive fees. For the years ended December 31, 2016 and 2015, the Fund did not incur any incentive fees related to net investment income or capital gains.
Under GAAP, the Fund calculates capital gains incentive fees as if the Fund had realized all assets at their fair values and liabilities at their settlement amounts as of the reporting date. GAAP requires that the capital gains incentive fee accrual assume the cumulative aggregate unrealized capital appreciation is realized, even though such unrealized capital appreciation is not payable under the investment advisory agreement. Accordingly, the Fund accrues a provisional capital gains incentive fee taking into account any unrealized gains or losses. There can be no assurance that such unrealized capital appreciation will be realized in the future and that the provisional capital gains incentive fee will become payable.
Under the investment advisory agreement, the Manager bears all offering and organizational expenses. Pursuant to the terms of the investment advisory agreement, the Fund has agreed to reimburse the Manager for any such organizational and offering expenses incurred by the Manager not to exceed 1.5% of the gross subscriptions raised by the Fund over the course of the offering period, which is currently scheduled to terminate two years from the initial offering date, unless extended. From each sale of common stock, the Fund pays the Manager the lesser of 1.5% of the gross offering proceeds or the amount of unreimbursed offering and organizational expenses incurred by the Manager.
The Manager agreed to assume and pay the Fund all amounts due the Fund from the Prior Manager as reflected in the Fund’s books and records as of August 20, 2013, including any amounts due under the Expense Reimbursement Agreement between the Fund and the Prior Manager, and in consideration the Fund agreed to pay the Manager any reimbursable organization and offering expenses incurred by Prior Manager which the Fund would otherwise be obligated to reimburse Prior Manager from future sales of the Fund’s securities, beginning with any sales of securities occurring after August 20, 2013.
The Fund expects that the Manager will continue to incur organizational and offering costs as the Fund’s offering continues, and such additional organizational and offering costs will increase the amount to which the Manager will be entitled to reimbursement from gross offering proceeds. Organizational and offering expenses paid for by the Manager and reimbursed by the Fund are expensed on the Fund’s statement of operations as they are payable to the Manager.
Expense Reimbursement Agreement
On November 9, 2012, the Fund entered into an expense reimbursement agreement with the Prior Manager under which the Prior Manager agreed to reimburse the Fund for all operating expenses, excluding management fees recognized on the quarterly financial statements of the Fund for 2012, retroactive to the date of formation of the Fund on August 3, 2011. In 2013, the expense reimbursement agreement was modified to exclude management fees and incentive fees payable to the Manager effective as of January 1, 2013. The Fund terminated the expense reimbursement agreement with the Prior Manager when it terminated the investment advisory agreement with the Prior Manager on August 20, 2013. While the Fund entered into a new investment advisory agreement with the Manager on August 20, 2013, it did not enter into a new expense reimbursement agreement with the Manager. However, the investment advisory agreement with the Manager includes the Manager’s undertaking to assume and pay the Prior Manager’s obligation to pay us the $1.3 million which had accrued under the Prior Manager’s expense reimbursement agreement. In consideration for such assumption, the Fund agreed to pay the Manager all organization and offering costs previously borne by the Prior Manager, subject to the limitation that such organization and offering costs may only be reimbursed to the extent of 1.5% of offering proceeds. The Manager’s right to recoup amounts paid by the Manager under the expense reimbursement agreement expired in 2016.
Administration Agreement
The Fund has also entered into an administration agreement with the Manager under which the Manager provides the Fund with office facilities, equipment and clerical, bookkeeping and record keeping services at such facilities and provides or oversees the performance of, the Fund’s required administrative services, which include, among other things, being responsible for the financial records which the Fund is required to maintain and preparing reports to its stockholders. Under the administration agreement, we are obligated to reimburse our fiscal year.Manager for our allocable portion of overhead cost incurred by the Manager. During the years ended December 31, 2016 and 2015, the Fund reimbursed the Manager for $0.2 million and $0.2 million in administration expenses under the administration agreement, respectively.
| 68 |
ITEM 14. PRINCIPAL ACCOUNTANT FEES AND SERVICES
The information requiredtable below summarizes the fees billed for the years ending December 31, 2016 and 2015 by Item 14 is hereby incorporatedour auditors, BPM LLP and OUM & Co., LLP.
| 2016 | 2015 | |||||||
| Audit Fees | $ | 100,377 | $ | 103,290 | ||||
| Audit Related Fees | — | — | ||||||
| Tax Fees | 6,343 | 5,250 | ||||||
| Other | 10,311 | 77,370 | ||||||
| Total | $ | 117,031 | $ | 185,910 | ||||
Audit Fees: Audit fees include fees for services that normally would be provided by reference fromeither BPM or OUM in connection with statutory and regulatory filings or engagements and that generally only an independent accountant can provide. In addition to fees for the audit of our definitive Proxy Statement relating toannual financial statements and the review of our 2014 Annual Meetingquarterly financial statements in accordance with generally accepted auditing standard, this category contains fees for comfort letters, statutory audits, consents, and assistance with and review of Stockholders, to bedocuments filed with the SEC within 120 days followingSEC.
Audit-Related Fees: Audit-related services consist of fees billed for assurance and related services that are reasonably related to the endperformance of the audit or review of our fiscal year. financial statements and are not reported under “Audit Fees.” These services include attest services that are not required by statute or regulation and consultations concerning financial accounting and reporting standards.
Tax Services Fees: Tax services fees consist of fees billed for professional tax services. These services also include assistance regarding federal, state, and local tax compliance.
All Other Fees: Other fees would include fees for products and services other than the services reported above.
| 69 |
ITEM 15. EXHIBITS AND FINANCIAL STATEMENT SCHEDULES
| a. | The following documents are filed as part of this Annual Report: |
The following financial statements are set forth in Item 8:
| b. | Exhibits: |
The following exhibits are included, or incorporated by reference to exhibits previously filed with the SEC, in this Annual Report on Form 10-K/A10-K for the year ended December 31, 20132016 (and are numbered in accordance with Item 601 of Regulation S-K):
Exhibit | Description of Document | |
| 3.1 | Articles of Incorporation of VII Peaks-KBR Co-Optivist Income BDC II, Inc. (Incorporated by reference to Exhibit (a)(1) to Amendment No. 1 to registration statement on Form N-2 filed on December 19, 2011 ) | |
| 3.2 | Articles of Amendment and Restatement of of VII Peaks-KBR Co-Optivist Income BDC II, Inc. (Incorporated by reference to Exhibit (a)(2) to Amendment No. 1 to registration statement on Form N-2 filed on March 1, 2012 ) | |
| 3.3 | Second Articles of Amendment and Restatement to Articles of Incorporation of VII Peaks-KBR Co-Optivist Income BDC II, Inc. (Incorporated by reference to Exhibit 3.1 to Form 8-K filed on June 28, 2012 ) | |
| 3.4 | Articles of Amendment to Articles of Incorporation of VII Peaks Co-Optivist Income BDC II, Inc. (Incorporated by reference to Exhibit (a) to Form 8-K filed on September 16, 2013 ) | |
| 3.5 | Bylaws of the Registrant (Incorporated by reference to Exhibit (b) to Amendment No. 1 to registration statement on Form N-2 filed on December 19, | |
| 4.1 | Form of Subscription Agreement ( | |
| 4.2 | Form of Additional Subscription Agreement ( | |
| 4.3 | Distribution Reinvestment Plan (Incorporated by reference to Exhibit (e) to Amendment No. 2 to the registration statement on Form N-2 filed on February 15, 2012 ) | |
| 10.1 | Investment Advisory Agreement between VII Peaks Co-Optivist Income BDC II, Inc. and VII Peaks Capital, LLC dated August 20, 2013 (Incorporated by reference to Exhibit (g) to Form 8-K filed on August 23, 2013 ) | |
| 10.2 | Dealer Manager Agreement between VII Peaks Co-Optivist Income BDC II, Inc. and | |
| 10.3 | Form of Selected Dealer Agreement (Included as Exhibit A to the Dealer Manager Agreement) (Incorporated by reference to Exhibit (h) to Form 8-K filed on | |
| 10.4 | Form of Custody Agreement (Incorporated by reference to Exhibit (j) to Amendment No. 2 to the registration statement on Form N-2 filed on February 15, 2012 ) | |
| 10.5 | Custodian Agreement with Wells Fargo Bank, N.A. (Incorporated by reference to Exhibit 10.1 to the Current Report on Form 8-K filed on November 30, 2016) | |
| 10.6 | Administration Agreement between VII Peaks Co-Optivist Income BDC II, Inc. and VII Peaks Capital, LLC dated February 24, 2014 ( | |
| License Agreement between VII Peaks Capital, LLC, VII Peaks-KBR BDC Advisor II, LLC and VII Peaks Co-Optivist Income BDC II, Inc. (Incorporated by reference to Exhibit (k)(2) to Amendment No. 2 to the registration statement on Form N-2 filed on February 15, 2012 ) | ||
| 14 | Code of Ethics (Incorporated by reference to Exhibit (r) to Amendment No. 2 to the registration statement on Form N-2 filed on February 15, 2012 ) | |
| 21.1* | Subsidiaries of VII Peaks Co-Optivist Income BDC II, Inc. | |
| 31.1* | Certification of Chief Executive Officer pursuant to Rule 13a-14 of the Securities Exchange Act of 1934, as amended |
| 70 |
31.2* | Certification of Chief Financial Officer pursuant to Rule 13a-14 of the Securities Exchange Act of 1934, as amended | |
| 32.1* | Certification of Chief Executive Officer pursuant to Section 1350, Chapter 63 of Title 18, United States Code, as adopted pursuant to Section 906 of the Sarbanes-Oxley Act of 2002 | |
| 32.2* | Certification of Chief Financial Officer pursuant to Section 1350, Chapter 63 of Title 18, United States Code, as adopted pursuant to Section 906 of the Sarbanes-Oxley Act of 2002 |
| * | Filed herewith. |
None.
| 71 |
Pursuant to the requirements of Section 13 or 15(d) of the Securities Exchange Act of 1934, the registrant has duly caused this annual report to be signed on its behalf by the undersigned, thereunto duly authorized.
| VII Peaks Co-Optivist Income BDC II, Inc. | ||
| Date: | By | /s/ Gurpreet S. Chandhoke |
| Gurpreet S. Chandhoke | ||
| Chairman of the Board of Directors, | ||
| Chief Executive Officer and President | ||
Pursuant to the requirements of the Securities Exchange Act of 1934, the registrant has duly caused this report to be signed on its behalf by the undersigned, thereunto duly authorized.
| VII Peaks Co-Optivist Income BDC II, Inc. | ||
| Date: | By | /s/ Gurpreet S. Chandhoke |
| Gurpreet S. Chandhoke | ||
| Chairman of the Board of Directors, | ||
| Chief Executive Officer and President | ||
| VII Peaks Co-Optivist Income BDC II, Inc. | ||
| Date: | By | /s/ Michelle |
Michelle E. MacDonald | ||
| Chief Financial Officer, | ||
| Treasurer and Secretary | ||
| Date: June 2, 2017 | By | /s/ Stephen Shea |
| Stephen Shea | ||
| (Interested Director) |
| Date: June 2, 2017 | By | /s/ Jeya Kumar |
| Jeya Kumar | ||
| (Independent Director) |
| Date: June 2, 2017 | By | /s/ Amit Mahajan |
| Amit Mahajan | ||
| (Independent Director) |
| Date: June 2, 2017 | By | /s/ Robert Winspear |
| Robert Winspear | ||
| (Independent Director) |
| 72 |