UNITED STATES
SECURITIES AND EXCHANGE COMMISSION
WASHINGTON, D.C. 20549
FORM 10-K/A
AMENDMENT NO. 1
10-K
(Mark(Mark One) |
x | Annual report pursuant to Section 13 or 15(d) of the Securities Exchange Act of 1934 |
| | |
o | Transition report pursuant to Section 13 or 15(d) of the Securities Exchange Act of 1934 |
For the fiscal year ended December 31, 20102013
Commission File No. 1-8726
RPC, INC.
Delaware (State of Incorporation) | 58-1550825 (I.R.S. Employer Identification No.) |
2801 BUFORD HIGHWAY NE, SUITE 520
ATLANTA, GEORGIA 30329
(404) 321-2140
Securities registered pursuant to Section 12(b) of the Act:
Title of each class COMMON STOCK, $0.10 PAR VALUE | Name of each exchange on which registered NEW YORK STOCK EXCHANGE |
Securities registered pursuant to Section 12(g) of the Act: NONE
Indicate by check mark if the registrant is a well-known seasoned issuer, as defined in Rule 405 of the Securities Act.
xYeso Yes x No
Indicate by check mark if the registrant is not required to file reports pursuant to Section 13 or Section 15(d) of the Act. oYes x No
Indicate by check mark whether the registrant (1) has filed all reports required to be filed by Section 13 or 15(d) of the Securities Exchange Act of 1934 during the preceding 12 months (or for such shorter period that the registrant was required to file such reports), and (2) has been subject to such filing requirements for the past 90 days. Yes xNoo
Indicate by check mark whether the registrant has submitted electronically and posted on its corporate Website,website, if any, every Interactive Data Fileinteractive data file required to be submitted and posted pursuant to Rule 405 of Regulations S-T (§232.405 of this chapter) during the preceding 12 months (or for such shorter period that the registrant was required to submit and post such files). Yes xNoo No o
Indicate by check mark if disclosure of delinquent filers pursuant to Item 405 of Regulation S-K is not contained herein, and will not be contained, to the best of registrant’s knowledge, in definitive proxy or information statements incorporated by reference in Part III of this Form 10-K or any amendment to this Form 10-K.x
Indicate by check mark whether the registrant is a large accelerated filer, an accelerated filer, a non-accelerated filer or a smaller reporting company. See definitions of “large accelerated filer,” “accelerated filer” and “smaller reporting company” in Rule 12b-2 of the Exchange Act. (Check one):
Large accelerated filerox | Accelerated filerxo | Non-accelerated filero | Smaller reporting companyo |
Indicate by check mark whether the registrant is a shell company (as defined in Rule 12b-2 of the Exchange Act). Yes oNo x
The aggregate market value of RPC, Inc. Common Stock held by non-affiliates on June 30, 2010,2013, the last business day of the registrant’s most recently completed second fiscal quarter, was $384,671,517$852,785,460 based on the closing price on the New York Stock Exchange on June 30, 20102013 of $13.65$13.81 per share.
RPC, Inc. had 147,964,000219,289,400 shares of Common Stock outstanding as of February 18, 2011.14, 2014.
Documents Incorporated by Reference
Portions of the Proxy Statement for the 20112014 Annual Meeting of Stockholders of RPC, Inc. are incorporated by reference into Part III, Items 10 through 14 of this report.
EXPLANATORY NOTE
The sole purpose of this Amendment No. 1 to our Annual Report on Form 10-K for the year ended December 31, 2010 (“Form 10-K”), as filed with the Securities and Exchange Commission on March 4, 2011, is to amend Exhibits 31.1, 31.2 and 32.1 to correct certain typographical errors contained in those exhibits. In accordance with Compliance and Disclosure Interpretations of the staff of the Securities and Exchange Commission, the Form 10-K is set forth herein in its entirety; however, no other amendments or changes have been made to the Form 10-K. This Amendment No. 1 does not reflect subsequent events occurring after the original filing date of the Form 10-K or modify or update in any way disclosures made in the Form 10-K.
PART I
Throughout this report, we refer to RPC, Inc., together with its subsidiaries, as “we,” “us,” “RPC” or “the Company.”
Forward-Looking Statements
Certain statements made in this report that are not historical facts are “forward-looking statements” under the Private Securities Litigation Reform Act of 1995. Such forward-looking statements may include, without limitation, statements that relate to our business strategy, plans and objectives, and our beliefs and expectations regarding future demand for our products and services and other events and conditions that may influence the oilfield services market and our performance in the future. Forward-looking statements made elsewhere in this report include without limitation statements regarding our belief that the long-term prospects for our business are favorable due to growing demand for oilbeliefs regarding natural gas prices, production levels and natural gas; drilling activities; our belief that the long-term demand outlook for natural gas is still favorable; our belief that the lack of foreign competition with domestic natural gas production tends to keep prices high enough to ensure that domestic drilling and production will continue at certain minimum levels; our belief that gas-directedoil-directed drilling will continue to represent the majority of the total drilling rig count inunless the foreseeable future; sustained level of demand for natural gas increases tremendously; our expectation to continue to focus on the development of international business opportunities in current and other international markets; our ability to obtain other customers in the event of a loss of our largest customers; the adequacy of our insurance coverage; the impact of lawsuits, legal proceedings and claims on our business and financial condition; our expectation to continue to pay cash dividends to the common stockholders subject to the earnings and financial condition of the Company and other relevant factors; our belief that no catalysts exist which will change overall industry activity in the near term; our belief that the favorable long-term returns on our purchasesconsistently high price of revenue producing equipment will continue, thus justifyingoil over the fundingpast three years and during the beginning of these expenditures with debt; the first quarter of 2014 holds positive implications for RPC’s activity levels for 2014; our belief that continued increasesthe percentage of wells drilled for oil will remain high in 2014; our expectation not to enter into additional contractual arrangements with customers on terms similar to those having expired during 2012 and 2013; our belief that the high price of oil should continue to have a positive impact on our customers’ activity levels and our financial results; our belief that the overall rig count will not increase significantly during 2014 unless the price of natural gas observed during the beginning of the first quarter of 2014 is sustained during the year; our belief that the excess service capacity in the industry is still an issue in the U.S. domestic rig count during 2011 may be limited bymarket; our plans not to significantly increase the numbersize of rigs available to drill new wells; that the outlook for the U.S. domestic rig count is for it to remain stable or increase slightly during 2011 with the service-intensive natureour revenue-producing fleet of the activity being projected to continue to increase; our belief that an increase in the supply in oilfield equipment in our markets can cause a decrease in the price we receive for our services if commodity prices and drilling activity do not also increase; our expectations to take delivery of a large amount of revenue-producing equipment during the first and second quarters of 2011; our expectation that our consolidated revenues and financial performance will improve;2014; our ability to maintain sufficient liquidity and a conservative capital structure; our belief about the amount of the contribution to the defined benefit pension plan in 2011;2013; our ability to fund capital requirements in the future; the estimated amount of our capital expenditures and contractual obligations for future periods; estimates made with respect to our critical accounting policies; and the effect of new accounting standards.
The words “may,” “will,” “expect,” “believe,” “anticipate,” “project,” “estimate,” and similar expressions generally identify forward-looking statements. Such statements are based on certain assumptions and analyses made by our management in light of its experience and its perception of historical trends, current conditions, expected future developments and other factors it believes to be appropriate. We caution you that such statements are only predictions and not guarantees of future performance and that actual results, developments and business decisions may differ from those envisioned by the forward-looking statements. See “Risk Factors” contained in Item 1A. for a discussion of factors that may cause actual results to differ from our projections.
Item 1. Business
Organization and Overview
RPC is a Delaware corporation originally organized in 1984 as a holding company for several oilfield services companies and is headquartered in Atlanta, Georgia.
RPC provides a broad range of specialized oilfield services and equipment primarily to independent and major oil and gas companies engaged in the exploration, production and development of oil and gas properties throughout the United States, including the southwest, mid-continent, Gulf of Mexico, mid-continent, southwest, Rocky Mountain and northeastAppalachian regions, and in selected international markets. The services and equipment provided include, among others, (1) pressure pumping services, (2) downhole tool services, (3) coiled tubing services, (3)(4) snubbing services (also referred to as hydraulic workover services), (4)(5) nitrogen services, (5)(6) the rental of drill pipe and other specialized oilfield equipment, (6) downhole tool services and (7) well control. RPC acts as a holding company for its operating units, Cudd Energy Services, Patterson Rental and Fishing Tools, Bronco Oilfield Services, Thru Tubing Solutions, Well Control School, and others. As of December 31, 2010,2013, RPC had approximately 2,5003,900 employees.
Business Segments
RPC’s service lines have been aggregated into two reportable oil and gas services business segments, Technical Services and Support Services, because of the similarities between the financial performance and approach to managing the service lines within each of the segments, as well as the economic and business conditions impacting their business activity levels.
During 2010,2013, approximately three percent of RPC’s consolidated revenues were generated from offshore operations in the U.S. Gulf of Mexico. In addition, approximately one percent of RPC’s consolidated revenues were generated from offshore operationsMexico and in the offshore territoryGulf of other countries, principally in New Zealand.Alaska. We also estimate that 3364 percent of our 20102013 revenues were related to drilling and production activities for oil, and 6736 percent were related to drilling and production activities for natural gas.
Technical Services include RPC’s oil and gas service lines that utilize people and equipment to perform value-added completion, production and maintenance services directly to a customer’s well. The demand for these services is generally influenced by customers’ decisions to invest capital toward initiating production in a new oil or natural gas well, improving production flows in an existing formation, or to address well control issues. This business segment consists primarily of pressure pumping, downhole tools, coiled tubing, snubbing, nitrogen, well control, wireline and fishing. The principal markets for this business segment include the United States, including the southwest, mid-continent, Gulf of Mexico, mid-continent, southwest, Rocky Mountain and Appalachian regions, and contract or project work in selected international locations in the last three years including primarily Africa, Canada, China, Eastern Europe, Latin America, the Middle East and New Zealand.markets. Customers include major multi-national and independent oil and gas producers, and selected nationally owned oil companies.
Support Services include RPC’s oil and gas service lines that primarily provide equipment for customer use or services to assist customer operations. The equipment and services include drill pipe and related tools, pipe handling, pipe inspection and storage services, and oilfield training services. The demand for these services tends to be influenced primarily by customer drilling-related activity levels. The principal markets for this segment include the United States, including the Gulf of Mexico, mid-continent, Rocky Mountain and Appalachian regions and project work in selected international locations in the last three years including primarily Canada, Latin America and the Middle East. Customers primarily include domestic operations of major multi-national and independent oil and gas producers, and selected nationally owned oil companies.
Technical Services
The following is a description of the primary service lines conducted within the Technical Services business segment:
Pressure Pumping. Pressure pumping services, which accounted for approximately 4855 percent of 20102013 revenues, 3853 percent of 20092012 revenues and 4155 percent of 20082011 revenues are provided to customers throughout Texas, and the Gulf Coast,Appalachian, mid-continent and Rocky Mountain regions of the United States and are generally utilizedStates. We primarily provide these services to initiatecustomers in order to enhance the initial production of hydrocarbons in new or enhance production in existing customer wells.formations that have low permeability. Pressure pumping services involve using complex, truck or skid-mounted equipment designed and constructed for each specific pumping service offered. The mobility of this equipment permits pressure pumping services to be performed in varying geographic areas. Principal materials utilized in the pressure pumping business include fracturing proppants, acid and bulk chemical additives. Generally, these items are available from several suppliers, and the Company utilizes more than one supplier for each item. Pressure pumping services offered include:
Fracturing — Fracturing services are performed to stimulate production of oil and natural gas by increasing the permeability of a formation. Fracturing is particularly important in shale formations, which have low permeability, and unconventional completion, because the formation containing hydrocarbons is not concentrated in one area and requires multiple fracturing operations. The fracturing process consists of pumping nitrogen or a fluid gel and sometimes nitrogen into a cased well at sufficient pressure to fracture the formation at desired locations and depths. Sand, bauxite or synthetic proppant, which is often suspended in the gel, is pumped into the fracture. When the pressure is released at the surface, the fluid gel returns to the well surface, but the proppant remains in the fracture, thus keeping it open so that oil and natural gas can flow through the fracture into the well.production tubing and ultimately the well surface. In some cases, fracturing is performed in formations with a high amount of carbonate rock by an acid solution pumped under pressure without a proppant or with small amounts of proppant.
Acidizing — Acidizing services are also performed to stimulate production of oil and natural gas, but they are used in wells that have undergone formation damage due to the buildup of various materials that block the formation. Acidizing entails pumping large volumes of specially formulated acids into reservoirs to dissolve barriers and enlarge crevices in the formation, thereby eliminating obstacles to the flow of oil and natural gas. Acidizing services can also enhance production in limestone formations.
Downhole Tools. Thru Tubing Solutions (“TTS”) accounted for approximately 16 percent of 2013 revenues, 14 percent of 2012 revenues and 12 percent of 2010 revenues, 15 percent of 2009 revenues and nine percent of 20082011 revenues. TTS provides services and proprietary downhole motors, fishing tools and other specialized downhole tools and processes to operators and service companies in drilling and production operations, including casing perforation at the completion stage of an oil or gas well. The services that TTS provides are especially suited for unconventional drilling and completion activities. TTS’ experience providing reliable tool services allows it to work in a pressurized environment with virtually any coiled tubing unit or snubbing unit.
Coiled Tubing. Coiled tubing services, which accounted for approximately 10 percent of 2010 revenues and nine percent of 20092013 revenues and 200811 percent of 2012 and 2011 revenues, involve the injection of coiled tubing into wells to perform various applications and functions for use principally in well-servicing operations and more recently to facilitate completion of horizontal wells. Coiled tubing is a flexible steel pipe with a diameter of less than four inches manufactured in continuous lengths of thousands of feet and wound or coiled around a large reel. It can be inserted through existing production tubing and used to perform workovers without using a larger, more costly workover rig. Principal advantages of employing coiled tubing in a workover operation include: (i) not having to “shut-in” the well during such operations, (ii) the ability to reel continuous coiled tubing in and out of a well significantly faster than conventional pipe, (iii) the ability to direct fluids into a wellbore with more precision, and (iv) enhanced access to remote or offshore fields due to the smaller size and mobility of a coiled tubing unit compared to a workover rig. Increasingly, coiled tubing units are also used to support completion activities in directional and horizontal wells. Such completion activities usually require multiple entrances in a wellbore in order to complete multiple fractures in a pressure pumping operation. A coiled tubing unit can accomplish this type of operation because its flexibility allows it to be steered in a direction other than vertical, which is necessary in this type of wellbore. At the same time, the strength of the coiled tubing string allows various types of tools or motors to be conveyed into the well effectively. The uses for coiled tubing in directional and horizontal wells have been enhanced by improved fabrication techniques and higher-diameter coiled tubing which allows coiled tubing units to be used effectively over greater distances, thus allowing them to function in more of the completion activities currently taking place in the U.S. domestic market. There are several manufacturers of flexible steel pipe used in coiled tubing services, and the Company believes that its sources of supply are adequate.
Snubbing. Snubbing (also referred to as hydraulic workover services), which accounted for approximately fivefour percent of 2010 revenues eight percent of 2009 revenues,in 2013, 2012 and seven percent of 2008 revenues,2011, involves using a hydraulic workover rig that permits an operator to repair damaged casing, production tubing and downhole production equipment in a high-pressure environment. A snubbing unit makes it possible to remove and replace downhole equipment while maintaining pressure on the well. Customers benefit because these operations can be performed without removing the pressure from the well, which stops production and can damage the formation, and because a snubbing rig can perform many applications at a lower cost than other alternatives. Because this service involves a very hazardous process that entails high risk, the snubbing segment of the oil and gas services industry is limited to a relative few operators who have the experience and knowledge required to perform such services safely and efficiently. Increasingly, snubbing units are used for unconventional completions at the outer reaches of long wellbores which cannot be serviced by coiled tubing because coiled tubing has a more limited range than drill pipe conveyed by a snubbing unit.
Nitrogen. Nitrogen accounted for approximately fivefour percent of 2010 revenues seven percent of 2009 revenues,in 2013, 2012 and eight percent of 2008 revenues.2011. There are a number of uses for nitrogen, an inert, non-combustible element, in providing services to oilfield customers and industrial users outside of the oilfield. For our oilfield customers, nitrogen can be used to clean drilling and production pipe and displace fluids in various drilling applications. Increasingly, it is used as a displacement medium to increase production in older wells in which production has depleted. It also can be used to create a fire-retardant environment in hazardous blowout situations and as a fracturing medium for our fracturing service line. In addition, nitrogen can be complementary to our snubbing and coiled tubing service lines, because it is a non-corrosive medium and is frequently injected into a well using coiled tubing. Nitrogen is complementary to our pressure pumping service line as well, because foam-based nitrogen stimulation is appropriate in certain sensitive formations in which the fluids used in fracturing or acidizing would damage a customer’s well.
For non-oilfield industrial users, nitrogen can be used to purge pipelines and create a non-combustible environment. RPC stores and transports nitrogen and has a number of pumping unit configurations that inject nitrogen in its various applications. Some of these pumping units are set up for use on offshore platforms or inland waters. RPC purchases its nitrogen in liquid form from several suppliers and believes that these sources of supply are adequate.
Well Control. Cudd Energy Services specializes in responding to and controlling oil and gas well emergencies, including blowouts and well fires, domestically and internationally. In connection with these services, Cudd Energy Services, along with Patterson Services, has the capacity to supply the equipment, expertise and personnel necessary to restore affected oil and gas wells to production. TheDuring the past several years, the Company has responded to well control situations in several international locations including Algeria, Argentina, Australia, Bolivia, Canada, Colombia, Egypt, Hungary, India, Kuwait, Libya, Mexico, Peru, Qatar, Taiwan, Trinidad, Turkmenistan, Tanzania, Abu Dhabi and Venezuela.
The Company’s professional firefighting staff has many years of aggregate industry experience in responding to well fires and blowouts. This team of experts responds to well control situations where hydrocarbons are escaping from a well bore,wellbore, regardless of whether a fire has occurred. In the most critical situations, there are explosive fires, the destruction of drilling and production facilities, substantial environmental damage and the loss of hundreds of thousands of dollars per day in well operators’ production revenue. Since these events ordinarily arise from equipment failures or human error, it is impossible to predict accurately the timing or scope of this work. Additionally, less critical events frequently occur in connection with the drilling of new wells in high-pressure reservoirs. In these situations, the Company is called upon to supervise and assist in the well control effort so that drilling operations can resume as promptly as safety permits.
Wireline Services. Wireline is classified into two types of services: slick or braided line and electric line. In both, a spooled wire is unwound and lowered into a well, conveying various types of tools or equipment. Slick or braided line services use a non-conductive line primarily for jarring objects into or out of a well, as in fishing or plug-setting operations. Electric line services lower an electrical conductor line into a well allowing the use of electrically-operated tools such as perforators, bridge plugs and logging tools. Wireline services can be an integral part of the plug and abandonment process, near the end of the life cycle of a well.
Fishing. Fishing involves the use of specialized tools and procedures to retrieve lost equipment from a well drilling operation and producing wells. It is a service required by oil and gas operators who have lost equipment in a well. Oil and natural gas production from an affected well typically declines until the lost equipment can be retrieved. In some cases, the Company creates customized tools to perform a fishing operation. The customized tools are maintained by the Company after the particular fishing job for future use if a similar need arises.
Support Services
The following is a description of the primary service lines conducted within the Support Services business segment:
Rental Tools. Rental tools accounted for approximately eightfour percent of 2010 and 20092013 revenues, five percent of 2012 revenues and 11six percent of 20082011 revenues. The Company rents specialized equipment for use with onshore and offshore oil and gas well drilling, completion and workover activities. The drilling and subsequent operation of oil and gas wells generally require a variety of equipment. The equipment needed is in large part determined by the geological features of the production zone and the size of the well itself. As a result, operators and drilling contractors often find it more economical to supplement their tool and tubular inventories with rental items instead of owning a complete inventory. The Company’s facilities are strategically located to serve the major staging points for oil and gas activities in Texas, the Gulf of Mexico, mid-continent region, northeastAppalachian region and the Rocky Mountains.
Patterson Rental Tools offers a broad range of rental tools including:
| Blowout Preventors | Diverters |
| High Pressure Manifolds and Valves | Drill Pipe |
| Hevi-wate Drill Pipe | Drill Collars |
| Tubing | Handling Tools |
| Production Related Rental Tools | Coflexip® Hoses |
| Pumps | Wear KnotTM Drill Pipe |
Oilfield Pipe Inspection Services, Pipe Management and Pipe Storage. Storage. Pipe inspection services include Full Body Electromagnetic and Phased Array Ultrasonic inspection of pipe used in oil and gas wells. These services are provided at both the Company’s inspection facilities and at independent tubular mills in accordance with negotiated sales and/or service contracts. Our customers are major oil companies and steel mills, for which we provide in-house inspection services, inventory management and process control of tubing, casing and drill pipe. Our locations in Channelview, Texas and Morgan City, Louisiana are equipped with large capacity cranes, specially designed forklifts and a computerized inventory system to serve a variety of storage and handling services for both the oilfield and non-oilfield customers.
Well Control School. Well Control School provides industry and government accredited training for the oil and gas industry both in the United States and in limited international locations. Well Control School provides this training in various formats including conventional classroom training, interactive computer training including training delivered over the internet, and mobile simulator training.
Energy Personnel International. Energy Personnel International provides drilling and production engineers, well site supervisors, project management specialists, and workover and completion specialists on a consulting basis to the oil and gas industry to meet customers’ needs for staff engineering and well site management.
Refer to Note 12 in the Notes to the Consolidated Financial Statements for additional financial information on our business segments.
Industry
United States. RPC provides its services to its domestic customers through a network of facilities strategically located to serve oil and gas drilling and production activities of its customers in Texas, the Gulf of Mexico, the mid-continent, the southwest, the Rocky Mountains and the northeast production fields.Appalachian regions. Demand for RPC’s services in the U.S. tends to be extremely volatile and fluctuates with current and projected price levels of oil and natural gas and activity levels in the oil and gas industry. Customer activity levels are influenced by their decisions about capital investment toward the development and production of oil and gas reserves.
Due to aging oilfields and lower-cost sources of oil internationally, the drilling rig count in the U.S. has declined by approximately 6361 percent from its peak in 1981. DueHowever, due to recently enhanced technology, however, more wells are being drilled, and these wells are increasingly productive. For these reasons, the domestic production of oil and natural gas remains roughly equivalenthas risen to prior years. Record low drillingrecord levels, and we estimate that the domestic production of crude oil during 2013 was at its highest level since 1989. Oil and gas industry activity levels were experiencedhave historically been volatile, experiencing multiple cycles, including down cycle troughs in 1986, 1992, 1999 (with April 1999 recording the lowest U.S. drilling rig count in the industry’s history), 2002 and again in 2009.
The rig count during the peak of the most recent prior cycle peakedoccurred at the end of the third quarter of 2008, and began to decline sharply during the fourth quarter of 2008. U.S. domestic drilling activity declined by 57 percent from the third quarter of 2008 to the second quarter of 2009, which was the steepest annualized decline rate in the industry’s history. Between the second quarter of 2009 and the endfourth quarter of 2010,2011, U.S. domestic drilling activity increased by 93129 percent but is 17before declining gradually throughout the remainder of 2011 and 2012. At the end of 2013, the U.S. domestic rig count was approximately 100 percent lowerhigher than the prior cyclical peak intrough recorded during the thirdsecond quarter of 2008. As of a recent date2009.
The fluctuations in 2011, U.S. domestic drilling activity has increased by approximately two percent compared tosince 2008 are consistent with the fourth quarterchanges in the prices of 2010.
oil and natural gas, the overall economic recovery following the recession in 2008 and 2009, and the financial returns from drilling in unconventional shale plays during the past several years. During 20102013 the average price of natural gas increased by approximately 1236 percent and the price of benchmark natural gas liquids was unchanged compared to prior year. The average price of oil increased by approximately 17 percent.four percent during 2013 compared to 2012. The changecurrent sustained high price of oil has increased the attractiveness of drilling for oil in several unconventional basins in the U.S. domestic market. During 2013, oil-directed drilling activity increased slightly, offset by a decrease in natural gas-directed drilling during 2010the year. The price of natural gas liquids has become an increasingly important determinant of our customers’ activity levels, since it is produced in many of the shale resource plays which also produce oil, and production of various natural gas liquids has increased to a level comparable to that of natural gas. The price of benchmark natural gas liquids peaked during the third quarter of 2008, and declined by approximately 69 percent during the third and fourth quarters of 2008. Thereafter, the price of benchmark natural gas liquids climbed steadily until the third quarter of 2011, but declined by 45 percent by the end of 2012. The average price of benchmark natural gas liquids was consistent withunchanged in 2013 compared to 2012, but its price increased by approximately 46 percent between the recoverybeginning and the end of 2013, and early in the pricesfirst quarter of oil and natural gas, as well as2014 increased by approximately 43 percent compared to the improvementaverage price in the overall economy following the financial crisis and recession in 2008 and 2009. Although our business has repeatedly demonstrated that it is cyclical, we continue to believe that the long-term prospects for our business are favorable due to growing global demand for oil and natural gas. In addition, we believe in the long-term growth of our business due to increased need for RPC’s services demanded by current drilling and completion techniques.2013.
SinceFrom 2001 andto 2009, gas drilling rigs represented an increasing percentage of the total drilling rig count, and have represented over 7080 percent of the drilling rig count during these years.count. In 2010, the percentage of drilling rigs drilling for natural gas declined,began to decline, and represented 61by the end of 2013 had fallen to approximately 21 percent of total drilling activity. Although the demand trend for natural gas is continuing to rise,has remained stable, the price of natural gas has remained lowfallen in recent years due to increased domestic reserves and productivity of new wells. In contrast,The price of natural gas rose during 2013 and has risen again early in 2014 to levels not observed since the first quarter of 2010, and the amount of U.S. domestic natural gas in storage was approximately 27 percent below its five-year average. Although the current industry metrics regarding natural gas are favorable, we do not believe that they are sufficient to encourage renewed natural gas-directed drilling because of continued record natural gas production levels and the opinion among our customers that the high price of natural gas is due to unseasonably cold weather in the first quarter of 2014 and will not be sustainable in the near term. Although the price of oil has increased,did not increase significantly during 2013 or early in the first quarter of 2014, it remains high, and producers in the domestic market have started to exploit neware exploiting resource plays that are economical at current high oil prices Theprices. Although natural gas-directed drilling activity has declined to its lowest level in almost 19 years, the long-term demand outlook for natural gas is still favorable because, unlike oil, foreign imports of natural gas do not compete with domestic production to a meaningful degree. This lack of foreign competition tends to keep prices high enough to ensure that domestic drilling and production will continue at certain minimum levels. Based on current demand levels for natural gas as well as the high oil and gas well depletion rates experienced over the past several years, it is anticipatedWe anticipate that gas-directedoil-directed drilling will continue to represent the majority of the total drilling rig count unless the sustained level of demand for natural gas increases significantly due to U.S. exports of natural gas or changes in demand due to increased use of natural gas as a transportation fuel or for other purposes. We continue to believe in the foreseeable future.long-term growth opportunities for our business due to the continued high demand for hydrocarbons generally and the growing production of oil in the domestic U.S. market in particular. Furthermore, we note that the techniques used to extract oil and natural gas in the U.S. domestic market increasingly require the types of services that RPC provides to its customers, so the composition of the U.S. domestic drilling rig count is not as meaningful as the overall level of drilling activity.
In addition, thereThere are certain types of wells being drilled in the U.S. domestic market for which there is a higher demand for RPC’s services. Known as either directional or horizontal wells, these wells are more difficult and costly to complete. These wells are predominantly natural gas wells, although they areThey have become an increasingly being drilled for oil as well.large percentage of the U.S. domestic market, and since the third quarter of 2008, have consistently comprised the majority of U.S. domestic drilling. Because they are drilled through a typically narrow formation and the formation is typically a relatively impermeable formation such as shale, they require additional stimulation when they are completed. Also, many of these formations require high pumping rates of stimulation fluids under high pressures, which in turn means that there isrequires a great deal of pressure pumping horsepower required to complete the well. Furthermore, since they are not drilled in a straight vertical direction from the Earth’s surface, they require tools and drilling mechanisms that are flexible, rather than rigid, and can be steered once they are downhole. Specifically, these types of wells require RPC’s pressure pumping and coiled tubing services, as well as our downhole tools and services.
International.RPC has historically operated in several countries outside of the United States, although international revenues have never accounted for more than 10 percent of total revenues. Over the past several years, RPC has continued its focus on developing international opportunities, although ourRPC’s equipment investments over the last couple ofseveral years have emphasized domestic rather than international expansion.expansion because of higher expected financial returns. International revenues for 2010 increased2013 decreased compared to 2012 due to higherlower customer activity levels in Canada, Columbia,New Zealand and Qatar, among other countries, partially offset by decreases in Mexico, and in the eliminationaggregate accounted for approximately four percent of revenueconsolidated RPC revenues. International revenues in Egypt.2013 compared to 2012 increased in Equatorial Guinea, Gabon, Australia, Argentina and Bolivia. During 2010,2013, RPC provided snubbing, well control and oilfield training services in New Zealand, Qatar, Columbia,several countries including Gabon, Saudi Arabia,Australia and Mexico, among other countries.China. We also provided rental tools in Columbia and Argentina, and downhole motors and tools in Canada, Tunisia, Mexico, the CongoChina, Argentina, Tunisia and Oman. We continue to focus on the selectiveselected development of international opportunities in these and other markets, although we believe that it will continue to be less than 10 percent of total revenues.revenues in 2014.
RPC provides services to its international customers through branch locations or wholly owned foreign subsidiaries. The international market is prone to political uncertainties, including the risk of civil unrest and conflicts. However, due to the significant investment requirement and complexity of international projects, customers’ drilling decisions relating to such projects tend to be evaluated and monitored with a longer-term perspective with regard to oil and natural gas pricing, and therefore have the potential to be more stable than most U.S. domestic operations. Additionally, the international market is dominated by major oil companies and national oil companies which tend to have different objectives and more operating stability than the typical independent oil and gas producer in the U.S. Predicting the timing and duration of contract work is not possible. Pursuing selective international opportunities for revenue growth continues to be a strong emphasis for RPC. Refer to Note 12 in the Notes to Consolidated Financial Statements for further information on our international operations.
Growth Strategies
RPC’s primary objective is to generate excellent long-term returns on investment through the effective and conservative management of its invested capital thus yieldingto generate strong cash flow. This objective continues to be pursued through strategic investments and opportunities designed to enhance the long-term value of RPC while improving market share, product offerings and the profitability of existing businesses. Growth strategies are focused on selected customers and markets in which we believe there exist opportunities for higher growth, customer and market penetration, or enhanced returns achieved through consolidations or through providing proprietary value-added products and services. RPC intends to focus on specific market segments in which it believes that it has a competitive advantage and on potential large customers who have a long-term need for our services in markets in which we operate.
RPC seeks to expand its service capabilities through a combination of internal growth, acquisitions, joint ventures and strategic alliances. Because of the fragmented nature of the oil and gas services industry, RPC believes a number of attractive acquisition opportunities exist. However, currentthe favorable long-term outlook for our industry and the strong business conditions havehistorical profitability of many potential acquisitions has encouraged potential sellers of businesses to expect high pricesvaluations for their businesses. Due to these high valuations and the potential difficulty of integrating acquired businesses sointo our existing operations, we believe we generate better returns on investments growing organically in service lines and geographic locations in which we have experience and presence. We will continue to be selective in pursuing growth through acquisitions of existing businesses.
RPC has a revolving credit facility to fund the purchase of revenue-producing equipment and other working capital requirements. During the third quarter of 2010, we renewed ourIn January 2014, this facility to fund our ongoing capital needs.was extended for five years. We have pursued this capital source because of the high returns on investment that have been generated by many of our service lines during the previous several years, and because of the low cost and ready availability of debt capital. During 2009 we reduced capital expenditures due to the industry downturn2011 and the resulting lowerfirst two quarters of 2012, we purchased additional revenue-producing equipment to support high industry activity levels. Our scheduled purchases of equipment declined during the third and fourth quarters of 2012 and during 2013 as pricing for our services became increasingly competitive, and the anticipated near-term expectedfinancial returns on investment. However, we increased our purchasesof a larger fleet of revenue-producing equipment in 2010also declined. The outstanding balance on our credit facility at the end of 2013 was lower than at the end of the prior year due to support new and projected significant customer agreements. In spite of increaseda reduction in capital expenditures and working capital, requirements during 2010, at the end of the yearand our levelratio of debt wasto total capitalization continues to be conservative compared to a number of our peers. Furthermore, we believe that the favorable long-term returns on investment in our revenue-producing equipment justify financing their purchase using debt.
Customers
Demand for RPC’s services and products depends primarily upon the number of oil and natural gas wells being drilled, the depth and drilling conditions of such wells, the number of well completions and the level of production enhancement activity worldwide. RPC’s principal customers consist of major and independent oil and natural gas producing companies. During 2010,2013, RPC provided oilfield services to several hundred customers. Of these customers, only one, Chesapeake Energy Corporation at approximately 15 percentnone of revenues,which accounted for more than 10 percent of revenues. RPC believes that its relationship with this customer is good. Although the Company believes that we would be able to obtain other customers for our services in the event of the loss of this major customer, the loss of this customer could have a material adverse effect on Company revenues and operating results in the near term.
Sales are generated by RPC’s sales force and through referrals from existing customers. During 2010Over the past three years we have from time to time entered into several agreements, with terms beyond one year, to provide services to certain domestic customers. These agreements represent a growing percentage of our revenues, and weWe monitor closely the financial condition of these customers, their capital expenditure plans, and other indications of their drilling and completion activities. Due to the short lead time between ordering services or equipment and providing services or delivering equipment, there is no significant sales backlog in most of our service lines.
Competition
RPC operates in highly competitive areas of the oilfield services industry. RPC’sOur products and services are sold in highly competitive markets, and itsthe revenues and earnings generated are affected by changes in prices for our services, fluctuations in the level of customer activity in major markets, general economic conditions and governmental regulation. RPC competes with many large and small oilfield industry competitors, including the largest integrated oilfield services companies. Strong oilfield activity during the past several years and the availability of capital have encouraged several new, smaller companies to seek debt and equity capital and accelerate their growth rates. The presence of these new competitors has increased competitive pricing pressures as domestic oilfield activity moderated during the third and fourth quarters of 2011 and throughout 2012 and 2013. Although the growth in the overall domestic fleet of revenue-producing equipment has moderated, pricing for our services remains competitive. RPC believes that the principal competitive factors in the market areas that it serves are product availability and quality of our equipment and raw materials used to provide our services, service quality, and availability, reputation for safety and technical proficiency, and price.
The oil and gas services industry includes a small number of dominant global competitors including, among others, Halliburton Energy Services Group, a division of Halliburton Company, Baker Hughes and Schlumberger Ltd., and a significant number of locally oriented businesses.
Facilities/Equipment
RPC’s equipment consists primarily of oil and gas services equipment used either in servicing customer wells or provided on a rental basis for customer use. Substantially all of this equipment is Company owned. RPC purchases oilfield service equipment from a limited number of manufacturers. These manufacturers of our oilfield service equipment may not be able to meet our requests for timely delivery during periods of high demand which may result in delayed deliveries of equipment and higher prices for equipment.
RPC both owns and leases regional and district facilities from which its oilfield services are provided to land-based and offshore customers. RPC’s principal executive offices in Atlanta, Georgia are leased. The Company ownshas two primary administrative buildings, one it leases in Houston,The Woodlands, Texas that includes the Company’s operations, engineering, sales and marketing headquarters, and one it owns in Houma, Louisiana that includes certain administrative functions. RPC believes that its facilities are adequate for its current operations. For additional information with respect to RPC’s lease commitments, see Note 9 of the Notes to Consolidated Financial Statements.
Governmental Regulation
RPC’s business is affected by state, federal and foreign laws and other regulations relating to the oil and gas industry, as well as laws and regulations relating to worker safety and environmental protection. RPC cannot predict the level of enforcement of existing laws and regulations or how such laws and regulations may be interpreted by enforcement agencies or court rulings, whether additional laws and regulations will be adopted, or the effect such changes may have on it, its businesses or financial condition.
In addition, our customers are affected by laws and regulations relating to the exploration for and production of natural resources such as oil and natural gas. These regulations are subject to change, and new regulations may curtail or eliminate our customers’ activities in certain areas where we currently operate. We cannot determine the extent to which new legislation may impact our customers’ activity levels, and ultimately, the demand for our services.
Intellectual Property
RPC uses several patented items in its operations, which management believes are important but are not indispensable to RPC’s success. Although RPC anticipates seeking patent protection when possible, it relies to a greater extent on the technical expertise and know-how of its personnel to maintain its competitive position.
Availability of Filings
RPC makes available, free of charge, on its website, www.rpc.net, its annual report on Form 10-K, quarterly reports on Form 10-Q, current reports on Form 8-K, and all amendments to those reports on the same day as they are filed with the Securities and Exchange Commission.
Item 1A. Risk Factors
Demand for our products and services is affected by the volatility of oil and natural gas prices.
Oil and natural gas prices affect demand throughout the oil and gas industry, including the demand for our products and services. Our business depends in large part on the conditions of the oil and gas industry, and specifically on the capital investments of our customers related to the exploration and production of oil and natural gas. When these capital investments decline, our customers’ demand for our services declines.
Although the production sector of the oil and gas industry is less immediately affected by changing prices, and, as a result, less volatile than the exploration sector, producers react to declining oil and gas prices by curtailing capital spending, which would adversely affect our business. A prolonged low level of customer activity in the oil and gas industry will adversely affect the demand for our products and services and our financial condition and results of operations.
The relationship between the prices of oil and natural gas and our customers’ drilling and production activities may not be highly correlated in the future.
Historically, fluctuations in the prices of oil and natural gas have led to corresponding changes in our customers’ drilling and production activities as measured by the domestic rig count. As drilling and production activities increase (or remain active) or decrease (or remain stagnant), our operating results are correspondingly favorably or adversely impacted. If this correlation weakens in the future, then it is possible that increases in the prices of oil and natural gas will not lead to corresponding increases in our customers’ activities, and our future operating results could be negatively impacted.
We may be unable to compete in the highly competitive oil and gas industry in the future.
We operate in highly competitive areas of the oilfield services industry. The products and services in our industry segments are sold in highly competitive markets, and our revenues and earnings have in the past been affected by changes in competitive prices, fluctuations in the level of activity in major markets and general economic conditions. We compete with the oil and gas industry’s many large and small industry competitors, including the largest integrated oilfield service providers. We believe that the principal competitive factors in the market areas that we serve are product and service quality and availability, reputation for safety, technical proficiency and price. Although we believe that our reputation for safety and quality service is good, we cannot assure you that we will be able to maintain our competitive position.
We may be unable to identify or complete acquisitions.
Acquisitions have been and may continue to be a key element of our business strategy. We cannot assure you that we will be able to identify and acquire acceptable acquisition candidates on terms favorable to us in the future. We may be required to incur substantial indebtedness to finance future acquisitions and also may issue equity securities in connection with such acquisitions. The issuance of additional equity securities could result in significant dilution to our stockholders. We cannot assure you that we will be able to integrate successfully the operations and assets of any acquired business with our own business. Any inability on our part to integrate and manage the growth from acquired businesses could have a material adverse effect on our results of operations and financial condition.
Our operations are affected by adverse weather conditions.
Our operations are directly affected by the weather conditions in several domestic regions, including the Gulf of Mexico, the Gulf Coast, the mid-continent, the Rocky Mountains and the Northeast.Appalachian region. Hurricanes and other storms prevalent in the Gulf of Mexico and along the Gulf Coast during certain times of the year may also affect our operations, and severe hurricanes may affect our customers’ activities for a period of several years. While the impact of these storms may increase the need for certain of our services over a longer period of time, such storms can also decrease our customers’ activities immediately after they occur. Such hurricanes may also affect the prices of oil and natural gas by disrupting supplies in the short term, which may increase demand for our services in geographic areas not damaged by the storms. Prolonged rain, snow or ice in many of our locations may temporarily prevent our crews and equipment from reaching customer work sites. Due to seasonal differences in weather patterns, our crews may operate more days in some periods than others. Accordingly, our operating results may vary from quarter to quarter, depending on the impact of these weather conditions.
Our ability to attract and retain skilled workers may impact growth potential and profitability.
Our ability to be productive and profitable will depend substantially on our ability to attract and retain skilled workers. Our ability to expand our operations is, in part, impacted by our ability to increase our labor force. A significant increase in the wages paid by competing employers could result in a reduction in our skilled labor force, increases in the wage rates paid by us, or both. If either of these events occurred, our capacity and profitability could be diminished, and our growth potential could be impaired.
Our concentration of customers in one industry may impact our overall exposure to credit risk.
Substantially all of our customers operate in the energy industry. This concentration of customers in one industry may impact our overall exposure to credit risk, either positively or negatively, in that customers may be similarly affected by changes in economic and industry conditions. We perform ongoing credit evaluations of our customers and do not generally require collateral in support of our trade receivables.
Reliance upon a large customer may adversely affect our revenues and operating results.
During 2010,At times our business has had a concentration of one or more major customers. In 2013 and 2012, none of our customers exceeded 10 percent of our total revenues, while in 2011, one of our largest customers accounted for approximately 1512 percent of our total revenues. This relianceIn addition, no customer accounted for more than ten percent of accounts receivable as of December 31, 2013 and 2012. Reliance on a large customer for a significant portion of our total revenues exposescould expose us to the risk that the loss or reduction in revenues from this customer, which could occur unexpectedly, could have a material and disproportionate adverse impact upon our revenues and operating results.
Our business has potential liability for litigation, personal injury and property damage claims assessments.
RPC’s subsidiaries have a number of agreements of various types in place with our customers. In general, these agreements indemnify RPC and its subsidiaries against damage or liabilities that arise from the actions of our employees or the operation of our equipment. The provisions in these agreements do not make a distinction among the types of services that RPC provides or the location of the work. These agreements also require that RPC maintain a certain level and type of insurance coverage against any claims that are determined to be our responsibility. RPC has insurance coverage in place with several well-capitalized insurance companies for accidental environmental claims.
Our operations involve the use of heavy equipment and exposure to inherent risks, including blowouts, explosions and fires. If any of these events were to occur, it could result in liability for personal injury and property damage, pollution or other environmental hazards or loss of production. Litigation may arise from a catastrophic occurrence at a location where our equipment and services are used. This litigation could result in large claims for damages. The frequency and severity of such incidents will affect our operating costs, insurability and relationships with customers, employees and regulators. These occurrences could have a material adverse effect on us. We maintain what we believe is prudent insurance protection. We cannot assure you that we will be able to maintain adequate insurance in the future at rates we consider reasonable or that our insurance coverage will be adequate to cover future claims and assessments that may arise.
Our operations may be adversely affected if we are unable to comply with regulatoryregulations and environmental laws.
Our business is significantly affected by stringent environmental laws and other regulations relating to the oil and gas industry and by changes in such laws and the level of enforcement of such laws. We are unable to predict the level of enforcement of existing laws and regulations, how such laws and regulations may be interpreted by enforcement agencies or court rulings, or whether additional laws and regulations will be adopted. The adoption of laws and regulations curtailing exploration and development of oil and gas fields in our areas of operations for economic, environmental or other policy reasons would adversely affect our operations by limiting demand for our services. We also have potential environmental liabilities with respect to our offshore and onshore operations, and could be liable for cleanup costs, or environmental and natural resource damage due to conduct that was lawful at the time it occurred, but is later ruled to be unlawful. We also may be subject to claims for personal injury and property damage due to the generation of hazardous substances in connection with our operations. We believe that our present operations substantially comply with applicable federal and state pollution control and environmental protection laws and regulations. We also believe that compliance with such laws has had no material adverse effect on our operations to date. However, such environmental laws are changed frequently. We are unable to predict whether environmental laws will, in the future, materially adversely affect our operations and financial condition. Penalties for noncompliance with these laws may include cancellation of permits, fines, and other corrective actions, which would negatively affect our future financial results.
Compliance with federal and state regulations relating to hydraulic fracturing and designation of economic development zones related to natural gas-directed drilling from shale formations could increase our operating costs, cause operational delays, and could reduce or eliminate the demand for our pressure pumping services.
RPC’s pressure pumping services are the subject of continuing federal, state and local regulatory oversight. This scrutiny is prompted in part by public concern regarding the potential impact on drinking and ground water and other environmental issues arising from the growing use of hydraulic fracturing. Among these regulatory entities is the White House Council on Environmental Quality, which is coordinating a review of hydraulic fracturing practices. In addition, a committee of the United States House of Representatives has investigated hydraulic fracturing practices and publicized information regarding the materials used in hydraulic fracturing. The U.S. Environmental Protection Agency has also undertaken a study of the environmental impact of hydraulic fracturing practices, and is expected to issue its findings in 2014. One of the results of this scrutiny has been to require disclosure of materials used in hydraulic fracturing on certain public lands. RPC participates in this disclosure process and has cooperated fully with all governmental requests for information regarding our operations. In addition, during the first quarter of 2014, the federal government proposed that specific geographic areas in which natural gas-directed drilling and production from shale formations be set aside as economic development zones. Such designations, if they arise in geographic areas in which RPC conducts its operations, may increase demand for our customers’ natural gas production, thus increasing demand for RPC’s services. Such designations may also increase our operating costs due to the cost of compliance with increased regulation as well as subsidies paid by firms engaged in natural gas-directed drilling to other industries which establish operations in these economic development zones. We are unable to predict whether the scrutiny of RPC’s pressure pumping business and any resulting regulatory change will impact our business through increased operational costs, operational delays, or a reduction in demand for hydraulic fracturing services. Also, we are unable to predict the magnitude and timing of the impact on our operations and operational costs, if any, of the creation of economic development zones in geographic areas in which natural gas-directed drilling and production from shale formations take place.
Our international operations could have a material adverse effect on our business.
Our operations in various countries including, but not limited to, Africa, Canada, China, Eastern Europe, Latin America, the Middle East and New Zealand are subject to risks. These risks include, but are not limited to, political changes, expropriation, currency restrictions and changes in currency exchange rates, taxes, boycotts and other civil disturbances. The occurrence of any one of these events could have a material adverse effect on our operations.
Our common stock price has been volatile.
Historically, the market price of common stock of companies engaged in the oil and gas services industry has been highly volatile. Likewise, the market price of our common stock has varied significantly in the past.
Our management has a substantial ownership interest, and public stockholders may have no effective voice in the management of the Company.
The Company has elected the “Controlled Corporation” exemption under RuleSection 303A of the New York Stock Exchange (“NYSE”) Listed Company Guide.Manual. The Company is a “Controlled Corporation” because a group that includes the Company’s Chairman of the Board, R. Randall Rollins and his brother, Gary W. Rollins, who is also a director of the Company, and certain companies under their control, controls in excess of fifty percent of the Company’s voting power. As a “Controlled Corporation,” the Company need not comply with certain NYSE rules including those requiring a majority of independent directors.
RPC’s executive officers, directors and their affiliates hold directly or through indirect beneficial ownership, in the aggregate, approximately 7172 percent of RPC’s outstanding shares of common stock. As a result, these stockholders effectively control the operations of RPC, including the election of directors and approval of significant corporate transactions such as acquisitions and other matters requiring stockholder approval. This concentration of ownership could also have the effect of delaying or preventing a third party from acquiring control over the Company at a premium.
Our management has a substantial ownership interest, and the availability of the Company’s common stock to the investing public may be limited.
The availability of RPC’s common stock to the investing public may be limited to those shares not held by the executive officers, directors and their affiliates, which could negatively impact RPC’s stock trading prices and affect the ability of minority stockholders to sell their shares. Future sales by executive officers, directors and their affiliates of all or a portion of their shares could also negatively affect the trading price of our common stock.
Provisions in RPC’s Certificatecertificate of Incorporationincorporation and Bylawsbylaws may inhibit a takeover of RPC.
RPC’s certificate of incorporation, bylaws and other documents contain provisions including advance notice requirements for stockholder proposals and staggered terms for the Board of Directors. These provisions may make a tender offer, change in control or takeover attempt that is opposed by RPC’s Board of Directors more difficult or expensive.
Some of our equipment and several types of materials used in providing our services are available from a limited number of suppliers.
We purchase equipment provided by a limited number of manufacturers who specialize in oilfield service equipment. During periods of high demand, these manufacturers may not be able to meet our requests for timely delivery, resulting in delayed deliveries of equipment and higher prices for equipment. There are a limited number of suppliers for certain materials used in pressure pumping services, our largest service line. While these materials are generally available, supply disruptions can occur due to factors beyond our control. Such disruptions, delayed deliveries, and higher prices can limit our ability to provide services, or increase the costs of providing services, thus reducing our revenues and profits.
We have used outside financing to accomplish our growth strategy, and outside financing may become unavailable or may be unfavorable to us.
Our business requires a great deal of capital in order to maintain our equipment and increase our fleet of equipment to expand our operations, and we have access to our $350 million credit facility to fund our necessary working capital and equipment requirements. Most of our existing credit facility bears interest at a floating rate, which exposes us to market risks as interest rates rise. If our existing capital resources become unavailable, inadequate or unfavorable for purposes of funding our capital requirements, we would need to raise additional funds through alternative debt or equity financings to maintain our equipment and continue our growth. Such additional financing sources may not be available when we need them, or may not be available on favorable terms. If we fund our growth through the issuance of public equity, the holdings of stockholders will be diluted. If capital generated either by cash provided by operating activities or outside financing is not available or sufficient for our needs, we may be unable to maintain our equipment, expand our fleet of equipment, or take advantage of other potentially profitable business opportunities, which could reduce our future revenues and profits.
Item 1B. Unresolved Staff Comments
None.
Item 2. Properties
RPC owns or leases approximately 100120 offices and operating facilities. The Company leases approximately 17,25018,600 square feet of office space in Atlanta, Georgia that serves as its headquarters, a portion of which is allocated and charged to Marine Products Corporation. See “Related Party Transactions” contained in Item 7. The lease agreement on the headquarters is effective through October 2013.2020. RPC believes its current operating facilities are suitable and adequate to meet current and reasonably anticipated future needs. Descriptions of the major facilities used in our operations are as follows:
Owned Locations
Broussard, Louisiana — Operations, sales and equipment storage yards
Vilonia, Arkansas — Maintenance and rebuild facilities
Elk City, Oklahoma — Operations, sales and equipment storage yards
Houma, Louisiana — Administrative office
Houston, Texas — Pipe storage terminal and inspection sheds
Houston,Kilgore, Texas — Operations, sales and administrative officeequipment storage yards
Elk City, OklahomaOdessa, Texas — Operations, sales and equipment storage yards
Rock Springs, Wyoming — Operations, sales and equipment storage yards
Lafayette, LouisianaVernal, Utah — Operations, sales and equipment storage yards
Conway, ArkansasWilliston, North Dakota — Operations, sales and equipment storage yards
Kilgore, TexasLeased Locations
Canton, Pennsylvania — Pumping services facility
Leased Locations
Seminole, OklahomaHobbs, New Mexico — Pumping services facility
Odessa, Texas — Operations, sales and equipment storage yards
Oklahoma City, Oklahoma — Operations, sales and administrative office
Houston, Texas — Operations, sales and administrative office
Odessa,San Antonio, Texas — Operations, sales and equipment storage yards
Seminole, Oklahoma — Pumping services facility
The Woodlands, Texas — Operations, sales and administrative office
Washington, Pennsylvania — Operations, sales and equipment storage yards
Item 3. Legal Proceedings
RPC is a party to various routine legal proceedings primarily involving commercial claims, workers’ compensation claims and claims for personal injury. RPC insures against these risks to the extent deemed prudent by its management, but no assurance can be given that the nature and amount of such insurance will, in every case, fully indemnify RPC against liabilities arising out of pending and future legal proceedings related to its business activities. While the outcome of these lawsuits, legal proceedings and claims cannot be predicted with certainty, management believes that the outcome of all such proceedings, even if determined adversely, would not have a material adverse effect on RPC’s business or financial condition.
Item 4. Mine Safety Disclosures
The information required by Section 1503(a) of the Dodd-Frank Wall Street Reform and Consumer Protection Act and Item 4. Reserved104 of Regulation S-K is included in Exhibit 95.1 to this Form 10-K.
Item 4A. Executive Officers of the Registrant
Each of the executive officers of RPC was elected by the Board of Directors to serve until the Board of Directors’ meeting immediately following the next annual meeting of stockholders or until his or her earlier removal by the Board of Directors or his or her resignation. The following table lists the executive officers of RPC and their ages, offices, and terms of office with RPC.
Name and Office with Registrant | Age | Date First Elected to Present Office |
| R. Randall Rollins (1) | 7982 | 1/24/84 |
| | | |
| Chairman of the Board | | |
| | |
| Richard A. Hubbell (2) | 6669 | 4/22/03 |
| | |
President and Chief Executive Officer | | |
| | |
| Linda H. Graham (3) | 7477 | 1/27/87 |
| | |
Vice President and Secretary | | |
| | |
| Ben M. Palmer (4) | 5053 | 7/8/96 |
| | |
Vice President, Chief Financial Officer and Treasurer | | |
| (1) | R. Randall Rollins began working for Rollins, Inc. (consumer services) in 1949. Mr. Rollins has served as Chairman of the Board of RPC since the spin-off of RPC from Rollins, Inc. in 1984. He has served as Chairman of the Board of Marine Products Corporation (boat manufacturing) since it was spun off from RPC in 2001 and Chairman of the Board of Rollins, Inc. since October 1991. He is also a director of Dover Downs Gaming and Entertainment, Inc. and Dover Motorsports, Inc. |
| (2) | Richard A. Hubbell has been the President of RPC since 1987 and Chief Executive Officer since 2003. He has also been the President and Chief Executive Officer of Marine Products Corporation since it was spun off from RPC in February 2001. Mr. Hubbell serves on the Board of Directors forof both of these companies. |
| (3) | Linda H. Graham has been the Vice President and Secretary of RPC since 1987. She has also been the Vice President and Secretary of Marine Products Corporation since it was spun off from RPC in 2001. Ms. Graham serves on the Board of Directors forof both of these companies. |
| (4) | Ben M. Palmer has been the Vice President, Chief Financial Officer and Treasurer of RPC since 1996. He has also been the Vice President, Chief Financial Officer and Treasurer of Marine Products Corporation since it was spun off from RPC in 2001. |
PART II
Item 5. Market for Registrant’s Common Equity, Related Stockholder Matters and Issuer Purchases of Equity Securities
RPC’s common stock is listed for trading on the New York Stock Exchange under the symbol RES. On October 26, 2010 RPC’s BoardAs of Directors declared a three-for-two stock split of the Company’s common shares. The additional shares were distributed on December 10, 2010 to stockholders of record on November 10, 2010. All share, earnings per share, and dividends per share data presented throughout this document have been adjusted to reflect this stock split. At February 18, 201114, 2014 there were 147,964,000219,289,400 shares of common stock outstanding and approximately 7,80022,300 beneficial holders of our common stock. The following table sets forth the high and low prices of RPC’s common stock and dividends paid for each quarter in the years ended December 31, 20102013 and 2009:2012:
| | | 2010 | | | 2009 | | | 2013 | | | 2012 | |
| Quarter | | High | | | Low | | | Dividends | | | High | | | Low | | | Dividends | | | High | | | Low | | | Dividends | | | High | | | Low | | | Dividends | |
| First | | $ | 9.00 | | | $ | 7.07 | | | $ | 0.027 | | | $ | 7.63 | | | $ | 3.45 | | | $ | 0.047 | | | $ | 17.40 | | | $ | 12.46 | | | $ | 0.10 | | | $ | 14.03 | | | $ | 9.31 | | | $ | 0.08 | |
| Second | | | 10.00 | | | | 6.61 | | | | 0.027 | | | | 7.98 | | | | 4.29 | | | | 0.047 | | | | 15.55 | | | | 12.41 | | | | 0.10 | | | | 11.95 | | | | 8.75 | | | | 0.08 | |
| Third | | | 14.47 | | | | 8.69 | | | | 0.040 | | | | 7.29 | | | | 4.73 | | | | 0.027 | | | | 15.94 | | | | 13.48 | | | | 0.10 | | | | 14.64 | | | | 11.04 | | | | 0.08 | |
| Fourth | | | 22.53 | | | | 13.64 | | | | 0.047 | | | | 7.57 | | | | 6.10 | | | | 0.027 | | | | 18.88 | | | | 15.34 | | | | 0.10 | | | | 12.70 | | | | 10.45 | | | | 0.28 | |
On January 26, 2011, the28, 2014 RPC’s Board of Directors approved a $0.07$0.105 per share cash dividend, payable March 10, 20112014 to stockholders of record at the close of business on February 10, 2011.2014. The Company expects to continue to pay cash dividends to the common stockholders, subject to the earnings and financial condition of the Company and other relevant factors.
Issuer Purchases of Equity Securities
SharesThe Company has a stock buyback program initially adopted in 1993 that authorizes the repurchase of up to 26,578,125 shares. On June 5, 2013, the Board of Directors authorized an additional 5,000,000 shares for repurchase under this program. There were no shares repurchased inas part of this program during the fourth quarter of 20102013. As of December 31, 2013, there are outlined below.
| Period | | Total Number of Shares (or Units) Purchased | | | | | | Average Price Paid Per Share (or Unit) | | | Total Number of Shares (or Units) Purchased as Part of Publicly Announced Plans or Programs | | | Maximum Number (or Approximate Dollar Value) of Shares (or Units) that May Yet Be Purchased Under the Plans or Programs | |
| | | | | | | | | | | | | | | | |
| October 1, 2010 to October 31, 2010 | | | - | | | | | | $ | - | | | | - | | | | 4,210,898 | |
| | | | | | | | | | | | | | | | | | | | |
| November 1, 2010 to November 30, 2010 | | | - | | | | | | | - | | | | - | | | | 4,210,898 | |
| | | | | | | | | | | | | | | | | | | | |
| December 1, 2010 to December 31, 2010 | | | 2,700 | | | (1) | | | | 14.03 | | | | - | | | | 4,210,898 | |
| | | | | | | | | | | | | | | | | | | | | |
| Totals | | | 2,700 | | | | | | | $ | 14.03 | | | | - | | | | 4,210,898 | |
| (1) | Consists of shares repurchased by the Company in connection with option exercises. |
The Company’s Board of Directors announced a stock buyback program in March 1998 authorizing4,712,234 shares available to be repurchased under the repurchase of 17,718,750 shares in the open market.current authorization. Currently the program does not have a predetermined expiration date.
Performance Graph
The following graph shows a five yearfive-year comparison of the cumulative total stockholder return based on the performance of the stock of the Company, assuming dividend reinvestment, as compared with both a broad equity market index and an industry or peer group index. The indices included in the following graph are the Russell 20001000 Index (“Russell 2000”1000”), the Philadelphia Stock Exchange’s Oil Service Index (“OSX”), and a peer group which includes companies that are considered peers of the Company as discussed below (the “Peer Group”). The Company has voluntarily chosen to provide both an industry and a peer group index.
The Russell 2000 is a stock index representing small capitalization U.S. stocks. The components of the index had an average market capitalization in 2010 of $1.255 billion, and the Company was a component of the Russell 20001000 during 2010.2013. The Russell 20001000 is a stock index representing large capitalization U.S. stocks with high historical growth in revenues and earnings. The components of the index had a weighted average market capitalization in 2013 of $108.9 billion, and a median market capitalization of $7.5 billion. The Russell 1000 was chosen because it represents companies with comparable market capitalizations to the Company.Company, and because the Company is a component of the index. The OSX is a stock index of 15 companies that provide oil drilling and production services, oilfield equipment, support services and geophysical/reservoir services. The Company is not a component of the OSX, but this index was chosen because it represents a large group of companies that provide the same or similar products and services as the Company. The companies included in the Peer Group are Weatherford International, Inc., Basic Energy Services, Inc., Superior Energy Services, Inc., and Halliburton Company. BJ Services, Inc., a member of the 2009 Peer Group, is no longer publicly traded and was substituted with Basic Energy Services, Inc. for the 2010 Peer Group. The companies included in the Peer Group have been weighted according to each respective issuer’s stock market capitalization at the beginning of each year.
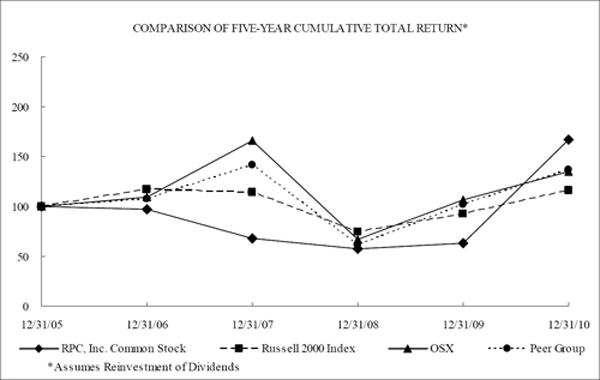
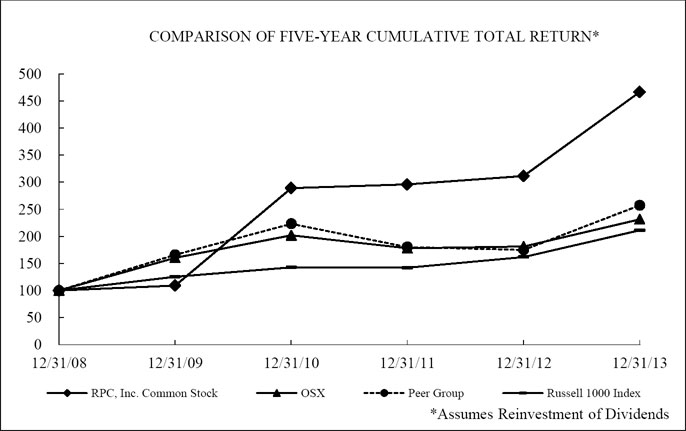
Item 6. Selected Financial Data
The following table summarizes certain selected financial data of the Company. The historical information may not be indicative of the Company’s future results of operations. The information set forth below should be read in conjunction with “Management’s Discussion and Analysis of Financial Condition and Results of Operations” and the Consolidated Financial Statements and the notes thereto included elsewhere in this document.
STATEMENT OF OPERATIONS DATA:
| Years Ended December 31, | | 2010 | | | 2009 | | | 2008 | | | 2007 | | | 2006 | | | 2013 | | | 2012 | | | 2011 | | | 2010 | | | 2009 | |
| | | (in thousands, except employee and per share amounts) | | | (in thousands, except employee and per share amounts) | |
| Revenues | | $ | 1,096,384 | | | $ | 587,863 | | | $ | 876,977 | | | $ | 690,226 | | | $ | 596,630 | | | $ | 1,861,489 | | | $ | 1,945,023 | | | $ | 1,809,807 | | | $ | 1,096,384 | | | $ | 587,863 | |
| Cost of revenues | | | 606,098 | | | | 393,806 | | | | 503,631 | | | | 368,175 | | | | 287,037 | | | | 1,178,412 | | | | 1,105,886 | | | | 992,704 | | | | 606,098 | | | | 393,806 | |
| Selling, general and administrative expenses | | | 121,839 | | | | 97,672 | | | | 117,140 | | | | 107,800 | | | | 91,051 | | | | 185,165 | | | | 175,749 | | | | 151,286 | | | | 121,839 | | | | 97,672 | |
| Depreciation and amortization | | | 133,360 | | | | 130,580 | | | | 118,403 | | | | 78,506 | | | | 46,711 | | | | 213,128 | | | | 214,899 | | | | 179,905 | | | | 133,360 | | | | 130,580 | |
| Gain on disposition of assets, net | | | (3,758 | ) | | | (1,143 | ) | | | (6,367 | ) | | | (6,293 | ) | | | (5,969 | ) | |
| Loss (gain) on disposition of assets, net | | | | 9,371 | | | | 6,099 | | | | 3,831 | | | | (3,758 | ) | | | (1,143 | ) |
| Operating profit (loss) | | | 238,845 | | | | (33,052 | ) | | | 144,170 | | | | 142,038 | | | | 177,800 | | | | 275,413 | | | | 442,390 | | | | 482,081 | | | | 238,845 | | | | (33,052 | ) |
| Interest expense | | | (2,662 | ) | | | (2,176 | ) | | | (5,282 | ) | | | (4,179 | ) | | | (356 | ) | | | (1,822 | ) | | | (1,976 | ) | | | (3,453 | ) | | | (2,662 | ) | | | (2,176 | ) |
| Interest income | | | 46 | | | | 147 | | | | 73 | | | | 70 | | | | 319 | | | | 419 | | | | 30 | | | | 18 | | | | 46 | | | | 147 | |
| Other income (expense), net | | | 1,303 | | | | 1,582 | | | | (1,176 | ) | | | 1,905 | | | | 1,085 | | |
| Other income, net | | | | 2,260 | | | | 2,175 | | | | 169 | | | | 1,303 | | | | 1,582 | |
| Income (loss) before income taxes | | | 237,532 | | | | (33,499 | ) | | | 137,785 | | | | 139,834 | | | | 178,848 | | | | 276,270 | | | | 442,619 | | | | 478,815 | | | | 237,532 | | | | (33,499 | ) |
| Income tax provision (benefit) | | | 90,790 | | | | (10,754 | ) | | | 54,382 | | | | 52,785 | | | | 68,054 | | | | 109,375 | | | | 168,183 | | | | 182,434 | | | | 90,790 | | | | (10,754 | ) |
| Net income (loss) | | $ | 146,742 | | | $ | (22,745 | ) | | $ | 83,403 | | | $ | 87,049 | | | $ | 110,794 | | | $ | 166,895 | | | $ | 274,436 | | | $ | 296,381 | | | $ | 146,742 | | | $ | (22,745 | ) |
| Earnings (loss) per share: | | | | | | | | | | | | | | | | | | | | | | | | | | | | | | | | | | | | | | | | |
Basic (a) | | $ | 1.01 | | | $ | (0.16 | ) | | $ | 0.57 | | | $ | 0.60 | | | $ | 0.77 | | | $ | 0.77 | | | $ | 1.28 | | | $ | 1.36 | | | $ | 0.67 | | | $ | (0.11 | ) |
Diluted (a) | | $ | 1.00 | | | $ | (0.16 | ) | | $ | 0.57 | | | $ | 0.59 | | | $ | 0.75 | | | $ | 0.77 | | | $ | 1.27 | | | $ | 1.35 | | | $ | 0.67 | | | $ | (0.11 | ) |
Dividends paid per share (a) | | $ | 0.140 | | | $ | 0.147 | | | $ | 0.160 | | | $ | 0.133 | | | $ | 0.089 | | | $ | 0.40 | | | $ | 0.52 | | | $ | 0.21 | | | $ | 0.09 | | | $ | 0.10 | |
| OTHER DATA: | | | | | | | | | | | | | | | | | | | | | | | | | | | | | | | | | | | | | | | | |
| Operating margin percent | | | 21.8 | % | | | (5.6 | )% | | | 16.4 | % | | | 20.6 | % | | | 29.8 | % | | | 14.8 | % | | | 22.7 | % | | | 26.6 | % | | | 21.8 | % | | | (5.6 | )% |
| Net cash provided by operating activities | | $ | 168,657 | | | $ | 168,740 | | | $ | 177,320 | | | $ | 141,872 | | | $ | 118,228 | | | $ | 365,624 | | | $ | 559,933 | | | $ | 386,007 | | | $ | 168,657 | | | $ | 168,740 | |
| Net cash used for investing activities | | | (171,769 | ) | | | (61,144 | ) | | | (158,953 | ) | | | (239,624 | ) | | | (151,085 | ) | | | (207,654 | ) | | | (315,838 | ) | | | (391,637 | ) | | | (171,769 | ) | | | (61,144 | ) |
| Net cash provided (used for) by financing activities | | | 7,658 | | | | (106,144 | ) | | | (21,668 | ) | | | 101,361 | | | | 22,777 | | |
| Depreciation and amortization | | | 133,360 | | | | 130,580 | | | | 118,403 | | | | 78,506 | | | | 46,711 | | |
| Net cash (used for) provided by financing activities | | | | (163,433 | ) | | | (237,325 | ) | | | 3,988 | | | | 7,658 | | | | (106,144 | ) |
| Capital expenditures | | $ | 187,486 | | | $ | 67,830 | | | $ | 170,318 | | | $ | 248,758 | | | $ | 159,831 | | | $ | 201,681 | | | $ | 328,936 | | | $ | 416,400 | | | $ | 187,486 | | | $ | 67,830 | |
| Employees at end of period | | | 2,500 | | | | 1,980 | | | | 2,532 | | | | 2,370 | | | | 2,000 | | | | 3,900 | | | | 3,600 | | | | 3,400 | | | | 2,500 | | | | 1,980 | |
| BALANCE SHEET DATA AT END OF YEAR: | BALANCE SHEET DATA AT END OF YEAR: | | | | | | | | | | | | | | | | | |
BALANCE SHEET DATA AT END OF YEAR:
| | | | | | | | | | | | | | | | | |
| Accounts receivable, net | | $ | 294,002 | | | $ | 130,619 | | | $ | 210,375 | | | $ | 176,154 | | | $ | 148,469 | | | $ | 437,132 | | | $ | 387,530 | | | $ | 461,272 | | | $ | 294,002 | | | $ | 130,619 | |
| Working capital | | | 281,174 | | | | 151,681 | | | | 200,494 | | | | 144,338 | | | | 111,302 | | | | 436,873 | | | | 403,316 | | | | 447,089 | | | | 281,174 | | | | 151,681 | |
| Property, plant and equipment, net | | | 453,017 | | | | 396,222 | | | | 470,115 | | | | 433,126 | | | | 262,797 | | | | 726,307 | | | | 756,326 | | | | 675,360 | | | | 453,017 | | | | 396,222 | |
| Total assets | | | 887,871 | | | | 649,043 | | | | 793,461 | | | | 701,015 | | | | 478,007 | | | | 1,383,860 | | | | 1,367,163 | | | | 1,338,211 | | | | 887,871 | | | | 649,043 | |
Long-term debt (b) | | | 121,250 | | | | 90,300 | | | | 174,450 | | | | 156,400 | | | | 35,600 | | |
| Long-term debt | | | | 53,300 | | | | 107,000 | | | | 203,300 | | | | 121,250 | | | | 90,300 | |
| Total stockholders’ equity | | $ | 538,895 | | | $ | 409,723 | | | $ | 449,084 | | | $ | 409,272 | | | $ | 335,287 | | | $ | 968,702 | | | $ | 899,232 | | | $ | 762,592 | | | $ | 538,895 | | | $ | 409,723 | |
| (a) | Earnings (loss) per share and dividends paid per share have been restated to reflect the December 2010 stock split.16 |
| | (b) | During the third quarter of 2010, the company closed on a new $350 million revolving credit facility. This facility replaced the revolving credit facility that was effective beginning in September 2006. |
Item 7. Management’s Discussion and Analysis of Financial Condition and Results of Operations |
Item 7. Management’s Discussion and Analysis of Financial Condition and Results of Operations
Overview
The following discussion should be read in conjunction with “Selected Financial Data,” and the Consolidated Financial Statements included elsewhere in this document. See also “Forward-Looking Statements” on page 2.
RPC, Inc. (“RPC”) provides a broad range of specialized oilfield services primarily to independent and major oilfield companies engaged in exploration, production and development of oil and gas properties throughout the United States, including the southwest, mid-continent, Gulf of Mexico, mid-continent, southwest, northeast, the Rocky MountainsMountain and Appalachian regions, and in selected international locations.markets. The Company’s revenues and profits are generated by providing equipment and services to customers who operate oil and gas properties and invest capital to drill new wells and enhance production or perform maintenance on existing wells.
Our key business and financial strategies are:
| | - | To focus our management resources on and invest our capital in equipment and geographic markets that we believe will earn high returns on capital, and maintain an appropriate capital structure.capital. |
| | |
| | - | To maintain a flexible cost structure that can respond quickly to volatile industry conditions and business activity levels. |
| | - | To maintain an efficient, low-cost capital structure which includes an appropriate use of debt financing. |
| | - | To maintain an appropriate blend of revenues between long-term committed contractual relationships and spot market revenues. Committed contractual relationships allow us to plan our operations with more certainty and efficiency. Under spot market work, we work at prevailing market rates and can take advantage of short-term opportunities which may be more profitable under certain circumstances. |
| - | To maintain high asset utilization which leads to increased revenues and leverage of direct and overhead costs, while also ensuring that increased maintenance resulting from high utilization does not interfere with customer performance requirements or jeopardize safety. |
| | - | To deliver equipment and services to our customers safely. |
| | |
| | - | To secure adequate sources of supplies of certain high-demand raw materials used in our operations, both in order to conduct our operations and to enhance our competitive position. |
| | |
| | - | To maintain and selectively increase market share. |
| | | |
| | To maximize stockholder return by optimizing the balance between cash invested in the Company’s productive assets, the payment of dividends to stockholders, and the repurchase of our common stock on the open market. |
| | |
| | - | To align the interests of our management and stockholders. |
| | |
| - | To maintain an efficient, low-cost capital structure, which includes an appropriate use of debt financing. |
In assessing the outcomes of these strategies and RPC’s financial condition and operating performance, management generally reviews periodic forecast data, monthly actual results, and other similar information. We also consider trends related to certain key financial data, including revenues, utilization of our equipment and personnel, maintenance and repair expenses, pricing for our services and equipment, profit margins, selling, general and administrative expenses, cash flows and the return on our invested capital. We continuously monitor factors that impact the level of current and expected customer activity levels, such as the price of oil and natural gas, changes in pricing for our services and equipment and utilization of our equipment and personnel. Our financial results are affected by geopolitical factors such as political instability in the petroleum-producing regions of the world, overall economic conditions and weather in the United States, the prices of oil and natural gas, and our customers’ drilling and production activities.
Current industry conditions are characterized by natural gas pricesoverall industry metrics which stabilizedare significantly less volatile than historical norms. Moreover, we do not believe that any catalysts exist which will change overall industry activity in the near term. For example, although the average U.S. domestic rig count declined by 8.2 percent during 2010 at higher levels2013 as compared to 2012, the domestic rig count during 2013 changed by less than in 2009,one percent. The average price of oil during 2013 increased by 3.9 percent and are stable duringremained high enough that our customers continued to conduct oil-directed drilling activities. During the beginning of the first quarter of 20112014, each of these industry indicators remained essentially unchanged compared to the fourth quarterend of 2010. Oil prices also increased during 2010 compared to 2009, and have continued to increase during the first quarter of 2011. Compared to the first quarter of 2010,2013. In contrast, the price of natural gas in 2011 is approximately 12 percent lower, butincreased significantly during 2013 and the pricebeginning of oil is approximately 14 percent higher. The average U.S. rig count increased by 41 percent during 2010, all of which took place during the second through the fourth quarters. During the first quarter of 2011,2014, partially due to winter weather that was colder than average in both years. However, these price increases have not been sufficient to encourage our customers to increase their natural gas-related drilling activities, which during the beginning of the first quarter of 2014 remained at depressed levels not observed since the second quarter of 1995. Furthermore, we do not believe that natural gas-directed drilling will increase during the near term because domestic natural gas production during 2013 was higher than in 2012, due to the high natural gas production from existing wells including residual production from new oil-directed wells. The consistently high price of oil over the past three years and during the beginning of the first quarter of 2014 holds positive implications for RPC’s activity levels for 2014. RPC has operations in most of the areas in which drilling activity is directed towards oil, and we maintained our presence in these areas during 2013. During the beginning of the first quarter of 2014, the rig count was approximately 27less than one percent higher than the first quarter of 2010same period in 2013 and slightly higher than the fourth quarter of 2010. Continued increases in the2013. The U.S. domestic rig count may increase during 2011 may2014, but any increases are likely to be limitedprompted by the numbercurrent high natural gas prices and probably will not lead to a long-term trend of rigs available to drill new wells.increased drilling directed towards natural gas.
In addition to the overall rig count, the Company also monitors the number of horizontal and directional wells drilled in the U.S. domestic market, because this type of well is more service-intensive than a vertical oil or gas well, thus requiring more of the Company’s services provided for a longer period of time. The average number of horizontal and directional wells drilled in the United States increaseddecreased by approximately three percent in 2010,2013, and was 6775 percent of total wells drilled during the year. During the first part of 2011,2014, the percentage of horizontal and directional wells drilled as a percentage of total wells increased towas approximately 7078 percent. In addition, the percentage of wells drilled for oil increased to 78 percent during 2010, and we2013 compared to 71 percent during 2012. During the beginning of the first quarter of 2014, the percentage of wells drilled for oil increased slightly to 79 percent. We believe that this percentage will increaseremain high in 20112014 due to the continued high price of oil and the renewed civil unrest inhigh production levels of natural gas. During 2013 we also began to monitor the Middle East. During 2010, the increase in U.S. domestic oilfieldwell count, which is a measure of wells drilled by the existing drilling rig fleet. We believe that the well count is an important measure of our potential activity levels because it reflects changes in rig efficiencies. During 2013, the total U.S. domestic well count decreased by approximately three percent. In the markets in which RPC has operational locations, the well count increased by approximately seven percent. During 2013, a combination of a larger U.S. domestic fleet of revenue-producing equipment and the increasingly service-intensive nature of thisrelatively flat activity caused the demandlevels continued to negatively impact pricing for the Company’s services to increase significantly. This increased demand was especially evidentservices. These negative impacts were most pronounced in the Company’s pressure pumping service linesline, which are usedis highly utilized in unconventional completion work, such as pressure pumping, coiled tubing and downhole tools. Also, due tois a service line which has seen a significant increase in the repetitive natureoverall fleet of this work andrevenue-producing equipment during the long-term capital commitment required by our customers to execute their drilling programs,last several years. During the past several years, a number of our large customers entered into contractual relationships with us to provide services to support their drillingcompletion programs. Such arrangements were advantageous to our customers because of the repetitive nature of this type of activity and completiontheir need to have service providers dedicated exclusively to their drilling programs. These arrangements typically havealso positively impacted the Company’s financial results, because of increased utilization of our revenue-producing equipment and increased efficiency. All of these arrangements expired during 2012 and 2013 and were not renewed at the same or similar terms. We do not expect to enter into additional contractual arrangements with such terms that are greater than one year, and have specific pricing and other financial arrangements which provide satisfactory financial returns to us in the event that the customer’s activities decline for any reason.during 2014.
The Company’s response toDuring 2013 the Company reduced our current operating environment has been to increasepurchases of revenue-producing equipment, and concentrated instead on optimizing the utilization of our existing fleet of revenue-producing equipment. In support of this objective, we have increased the capitalized maintenance expenditures of our equipment and in some cases, to open new operational locations, to support these significant customer relationships. The capital expenditures have been funded by cashfleet. Cash flows from operating activities as well as borrowings under our revolving credit facility. Duringfacility have been sufficient to fund the third quarter of 2010 theCompany’s lower capital expenditures which decreased to $201.7 million in 2013 compared to $328.9 million in 2012. The Company re-financed its existinghas a syndicated revolving credit facility in order to maintain sufficient liquidity to fund its capital expenditure and other funding requirements.
Income before income taxes was $237.5 million in 2010 compared toRevenues during 2013 totaled $1.9 billion, a loss before taxesdecrease of $33.5 million in the prior year. The effective tax rate for 2010 was 38.24.3 percent compared to 32.1 percent in the prior year. Diluted earnings per share were $1.00 in 2010 compared to a loss per share2012. Cost of $0.16 for the prior year. Cash flows from operating activities were $168.7revenues increased $72.5 million in 2010, the same as in2013 compared to the prior year due to higher materials and cashsupplies expense and cash equivalents were $9.0 million at December 31, 2010, an increaseemployment costs associated with higher activity levels and was approximately 63 percent of $4.5 millionrevenues in 2013 compared to December 31, 2009. As of December 31, 2010, there was $121.3 million in outstanding borrowings under our credit facility.
Cost57 percent of revenues as a percentage of revenues decreased approximately 11.8 percentage points in 2010 compared to 2009, because of higher utilization of equipment and personnel, which improved operational leverage, and improved pricing for our services.
2012. Selling, general and administrative expenses as a percentage of revenues decreasedincreased approximately 11.10.9 percentage points in 20102013 compared to 2009, which was2012.
Income before income taxes declined due to the fixed nature of many of these expenses which we were ablecompetitive pricing to leverage over higher revenues.
Consistent with our strategy to selectively grow our capacity, support our significant customer relationships and maintain our existing fleet of high demand equipment, capital expenditures increased to $187.5$276.3 million in 2010, a significant increase2013 compared to $67.8$442.6 million lastin the prior year. Diluted earnings per share were $0.77 in 2013 compared to $1.27 for the prior year.
Cash flows from operating activities decreased primarily due to lower earnings to $365.6 million in 2013 compared to $559.9 million in 2012. As of December 31, 2013, there were $53.3 million in outstanding borrowings under our credit facility, a decline from $107.0 million at December 31, 2012.
Outlook
Drilling activity in the U.S. domestic oilfields, as measured by the rotary drilling rig count, had been gradually increasing since about 2003 when rig count was just over 800 throughreached a recent cyclical peak in the latter half of 2008 when the U.S. rig count peaked at 2,031 during the third quarter.quarter of 2008. The global recession that began induring the fourth quarter of 2007 precipitated the steepest annualized rig count decline in U.S. domestic oilfield history. From the third quarter of 2008 to the second quarter of 2009, the U.S. domestic rig count dropped almost 57 percent, reaching a trough of 876 in June 2009. Since June 2009, the rig count has increased by 98 percent to 1,732 early in the first quarter of 2011. The outlook for the U.S. domestic rig count is for it to remain stable or increase slightly during 2011, although the service-intensive nature of the activity is projected to continue to increase. From a low of $34 per barrel early in 2009, the price of oil increased to $92 per barrel during the fourth quarter of 2010. The average price of oil in 2010 was approximately $79 per barrel, an increase of 17 percent compared to 2009. During the first quarter of 2011, the price of oil increased to over $100, an increase of 27 percent compared to the average price of oil in 2010. The price of natural gas fell by 85 percent from approximately $13 per McfBetween its cyclical trough in the second quarter of 2008 to slightly below $2 per Mcf in2009 and the thirdfourth quarter of 2009. The average price2011, U.S. domestic drilling activity increased by approximately 129 percent, before declining during the remainder of natural gas in 2010 was approximately $4 per Mcf, 12.3 percent higher than2011 and throughout 2012. Between the average price in 2009. Duringbeginning of 2013 and the first quarter of 2011, the price of natural gas increased slightly compared to 2010. Unconventional2014, domestic drilling activity which requireswas essentially unchanged, varying by slightly more of RPC’s services, accounted for 67than one percent of total U.S. domestic drilling during 2010. Unconventionalthe period. However, unconventional activity as a percentage of total oilfield activity hadhas grown steadily over the past several years and was 75 percent of total wells drilled during 2013. Early in the first quarter of 2014, unconventional drilling activity was 78 percent of total U.S. domestic drilling activity.
The current and projected prices of oil and natural gas are important catalysts for U.S. domestic drilling activity. The price of natural gas declined steadily during 2011 and the first quarter of 2012. The price of natural gas began to 70 percentrecover during the third and fourth quarters of 2012 and throughout 2013, and during the first quarter of 2011.2014 had risen to the highest price observed since the first quarter of 2010. In spite of these increases, the price expectations for natural gas has not risen adequately to encourage drilling in the service-intensive natural gas resource shale plays in the U.S. domestic market due in part to record U.S. natural gas production. The price of natural gas liquids has become an increasingly important determinant of our customers’ activities, since its sales comprise a large part of our customers’ revenues, and it is produced in many of the shale resource plays that also produce oil. During 2013, the average price of benchmark natural gas liquids was unchanged compared to the prior year, but it increased by 43 percent early in the first quarter of 2014 compared to the prior year. The average price of oil has remained high during 2013 and early in the first quarter of 2014. In general, these trends have positive implications for our near-term activity levels. In particular, the high price of oil should continue to have a positive impact on our customers’ activity levels and our financial results, since many U.S. domestic shale resource plays produce oil and petroleum liquids, and RPC has operational locations and revenue-producing equipment in these locations.
The effect of the sustained high price of oil is evident in the current composition of the U.S. domestic rig count, approximately 79 percent of which was directed towards oil during the beginning of the first quarter of 2014. We believe that oil-directed drilling will remain a very high percentage of domestic drilling, and that natural gas-directed drilling will remain a low percentage of U.S. domestic drilling in the near term. We believe that this relationship will continue due to relatively low prices for natural gas, high production from existing natural gas wells, and industry projections of limited increases in domestic natural gas demand during the near term. We do not believe that the overall rig count will increase significantly during 2014 unless the price of natural gas observed during the beginning of the first quarter of 2014 is sustained during the year.
We continue to monitor the market for our services and the competitive environment in 2011, and while we2014. We are concerned aboutencouraged that the low price of natural gas,oil has remained high and that our customers’ oil-directed drilling activities have remained high also. Furthermore, we are encouraged by the increasingly service-intensive naturerecent increases in the prices of natural gas and natural gas liquids, although we believe that these increases are the completion activitiesresult of unseasonably cold weather in the first quarter of 2014 and thus may not be sustainable for a long period of time. We also monitor the competitive environment because many new service companies have entered the industry over the past few years, and existing service companies have purchased additional revenue-producing equipment. The new entrants and larger service companies in the oilfield services industry have created downward pressure on pricing for our markets. We are also encouragedservices, as well as increased the costs for skilled labor by recruiting skilled employees from existing service companies. Although these increased competitive pressures have begun to subside, we believe that excess service capacity is still an issue in the high price of oil, andU.S. domestic market, given the fact that early in 2011 approximately 47 percent of U.S. domestic drilling activity was directed towards oil,has not changed since the highest percentagebeginning of U.S. domestic drilling activity directed to oil since 1995. We are also monitoring the amount2013. Because of new oilfield equipment that is projected to be placed in service during 2011, because an increase in the supply of oilfield equipment in our markets can cause a decrease in the pricethese concerns, we receive for our services if commodity prices and drilling activity do not also increase. We increasedplan to significantly increase the size of our commitments to purchase equipment in 2010 and also intend to take deliveryrevenue-producing fleet of a large amount of revenue-producing equipment during the first and second quarters of 2011. This is2014. Our consistent with our business and financial strategies because we believe that the equipment will produce high financial returns. However, we understand that factors influencing the industry are unpredictable, and our response to the industry’s potential uncertainty is to maintain sufficient liquidity and a conservative capital structure and monitor our discretionary spending. Although we have used our bank credit facility to finance our expansion, we will stillcontinue to maintain a conservative financial and capital structure by industry standards. Based on current industry conditions, we believe that the Company’s consolidated revenues will increase in 2011 compared to 2010 and financial performance for the same period will also improve.
Results of Operations
| Years Ended December 31, | | 2010 | | | 2009 | | | 2008 | | | 2013 | | | 2012 | | | 2011 | |
(in thousands except per share amounts and industry data) | | | | | | | | | | |
| Consolidated revenues | | $ | 1,096,384 | | | $ | 587,863 | | | $ | 876,977 | | | $ | 1,861,489 | | | $ | 1,945,023 | | | $ | 1,809,807 | |
| Revenues by business segment: | | | | | | | | | | | | | | | | | | | | | | | | |
| Technical | | $ | 979,834 | | | $ | 513,289 | | | $ | 745,991 | | | $ | 1,729,732 | | | $ | 1,794,015 | | | $ | 1,663,793 | |
| Support | | | 116,550 | | | | 74,574 | | | | 130,986 | | | | 131,757 | | | | 151,008 | | | | 146,014 | |
| | | | | | | | | | | | | | | | | | | | | | | | | |
| Consolidated operating profit (loss) | | $ | 238,845 | | | $ | (33,052 | ) | | $ | 144,170 | | |
| Operating profit (loss) by business segment: | | | | | | | | | | | | | |
| Consolidated operating profit | | | $ | 275,413 | | | $ | 442,390 | | | $ | 482,081 | |
| Operating profit by business segment: | | | | | | | | | | | | | |
| Technical | | $ | 217,144 | | | $ | (20,328 | ) | | $ | 110,648 | | | $ | 276,246 | | | $ | 420,231 | | | $ | 451,259 | |
| Support | | | 31,086 | | | | (1,636 | ) | | | 36,515 | | | | 26,223 | | | | 45,912 | | | | 51,672 | |
| Corporate expenses | | | (13,143 | ) | | | (12,231 | ) | | | (9,360 | ) | | | (17,685 | ) | | | (17,654 | ) | | | (17,019 | ) |
| Gain on disposition of assets, net | | | 3,758 | | | | 1,143 | | | | 6,367 | | |
| Loss on disposition of assets, net | | | | (9,371 | ) | | | (6,099 | ) | | | (3,831 | ) |
| | | | | | | | | | | | | | | | | | | | | | | | | |
| Net income (loss) | | $ | 146,742 | | | $ | (22,745 | ) | | $ | 83,403 | | |
| Earnings (loss) per share — diluted | | $ | 1.00 | | | $ | (0.16 | ) | | $ | 0.85 | | |
| Net income | | | $ | 166,895 | | | $ | 274,436 | | | $ | 296,381 | |
| Earnings per share — diluted | | | $ | 0.77 | | | $ | 1.27 | | | $ | 1.35 | |
| Percentage of cost of revenues to revenues | | | 55 | % | | | 67 | % | | | 57 | % | | | 63 | % | | | 57 | % | | | 55 | % |
| Percentage of selling, general and administrative expenses to revenues | | | 11 | % | | | 17 | % | | | 13 | % | | | 10 | % | | | 9 | % | | | 8 | % |
| Percentage of depreciation and amortization expense to revenues | | | 12 | % | | | 22 | % | | | 14 | % | |
| Percentage of depreciation and amortization expenses to revenues | | | | 11 | % | | | 11 | % | | | 10 | % |
| Effective income tax rate | | | 38.2 | % | | | 32.1 | % | | | 39.5 | % | | | 39.6 | % | | | 38.0 | % | | | 38.1 | % |
| Average U.S. domestic rig count | | | 1,536 | | | | 1,089 | | | | 1,879 | | | | 1,762 | | | | 1,919 | | | | 1,877 | |
| Average natural gas price (per thousand cubic feet (mcf)) | | $ | 4.38 | | | $ | 3.90 | | | $ | 8.81 | | | $ | 3.71 | | | $ | 2.73 | | | $ | 3.95 | |
| Average oil price (per barrel) | | $ | 79.27 | | | $ | 61.90 | | | $ | 99.96 | | | $ | 98.06 | | | $ | 94.20 | | | $ | 94.94 | |
Year Ended December 31, 20102013 Compared To Year Ended December 31, 20092012
Revenues.Revenues in 2010 increased $508.52013 decreased $83.5 million or 86.54.3 percent compared to 2009.2012. The Technical Services segment revenues for 2010 increased 90.92013 decreased 3.6 percent from the prior year due primarily to lower pricing experienced in most of our service lines within this segment partially offset by higher service intensity and activity levels from expanded customer commitments and improved pricing.in our pressure pumping service line. The Support Services segment revenues for 2010 increased 56.32013 decreased 12.7 percent fromcompared to 2012 due primarily to lower pricing in the prior yearrental tool service line, which is the largest service line within this segment. Operating profit in the both Technical Services and Support Services segment declined due to lower pricing. Operating profit in the Technical Services segment also declined due to higher activity levelsmaterials and improved pricing.supplies expense consistent with increased service intensity.
Domestic revenues increased 92decreased 4.0 percent during 20102013 compared to 20092012 to $1,041.5 million$1.8 billion due primarily to continued competitive pricing for our services in most service lines. The average price of oil increased customer activity levels coupled with increased capacity of equipment. Theby four percent while the average price of natural gas increased by 12 percent and the average price of oil increased by approximately 2836 percent during 20102013 compared to the prior year. In conjunction with the increase in natural gas prices, theThe average domestic rig count during 20102013 was 41eight percent higherlower than in 2009. This increase in drilling activity had a positive impact on2012. Increasingly competitive pricing for our financial results. Weservices negatively impacted our operating income, income before income taxes, net income and earnings per share. At the present time, we believe that our activity levels are affected more by the price of natural gas thanprimarily by the price of oil, becausesince oil-directed activity has become the majority of total U.S. domestic drilling activity relates todrill activity. The prices of natural gas and manynatural gas liquids also impact our activity levels because of the service-intensive nature of the drilling and completion associated with this type of drilling and completion. We also believe that the total number of directional and horizontal wells more directly affect our activity levels, regardless of whether the wells are directed towards oil or natural gas. This belief is based on the fact that directional and horizontal wells require more of some of the services are more appropriate for gas wells than oil wells.within our technical services segment. International revenues, which increaseddecreased from $44.8$74.2 million in 20092012 to $54.9$65.9 million in 2010,2013, were fivefour percent of consolidated revenues.revenues in 2013 and 2012. These international revenue increasesdecreases were due mainly to higherlower customer activity levels in CanadaNew Zealand and Qatar,Mexico in 2013 partially offset by an increase in activity in Equatorial Guinea, Gabon, Australia, Argentina and Bolivia, compared to the prior year. Our international revenues are impacted by the timing of project initiation and their ultimate duration.
Cost of revenues. Cost of revenues in 20102013 was $606.1$1.2 billion compared to $1.1 billion in 2012, an increase of $72.5 million or 6.6 percent. The increase in these costs was due to the variable nature of these expenses especially materials and supplies expenses and employment costs associated with higher activity levels. Cost of revenues, as a percent of revenues, increased in 2013 compared to 2012 due primarily to competitive pricing for our services.
Selling, general and administrative expenses. Selling, general and administrative expensesincreased 5.4 percent to $185.2 million in 2013 compared to $175.7 million in 2012. This increase was due primarily to increases in total employment costs and bad debt expense. As a percentage of revenues, selling, general and administrative expenses increased to 9.9 percent in 2013 compared to 9.0 percent in 2012.
Depreciation and amortization. Depreciation and amortization were $213.1 million in 2013, a decrease of $1.8 million, compared to $393.8$214.9 million in 2009,2012. As a percentage of revenues, depreciation and amortization remained relatively unchanged at 11.4 percent in 2013 compared to 11.0 percent in 2012.
Loss on disposition of assets, net.Loss on disposition of assets, net was $9.4 million in 2013 compared to $6.1 million in 2012. The loss of disposition of assets, net includes gains or losses related to various property and equipment dispositions including certain equipment components experiencing increased wear and tear which requires early dispositions, or sales to customers of lost or damaged rental equipment.
Other income,net. Other income, net was $2.3 million in 2013 compared to $2.2 million in 2012. Other income, net primarily includes mark to market gains and losses of investments in the non-qualified benefit plan.
Interest expense and interest income. Interest expense was $1.8 million in 2013 compared to $2.0 million in 2012. The decrease in 2013 is due to a lower average debt balance on our revolving credit facility partially offset by slightly higher interest rates net of interest capitalized on equipment and facilities under construction. Interest income increased to $419 thousand in 2013 compared to $30 thousand in 2012.
Income tax provision. The income tax provision was $109.4 million in 2013 compared to $168.2 million in 2012. This decrease was due to lower income before taxes in 2013 compared to 2012 partially offset by an increase in the effective tax rate to 39.6 percent in 2013 compared to the effective tax rate of 38.0 percent in 2012.
Net income and diluted earnings per share. Net income was $166.9 million in 2013, or $0.77 per diluted share, compared to net income of $274.4 million, or $1.27 per diluted share in 2012. This decline was due to lower profitability.
Year Ended December 31, 2012 Compared To Year Ended December 31, 2011
Revenues.Revenues in 2012 increased $135.2 million or 7.5 percent compared to 2011. The Technical Services segment revenues for 2012 increased 7.8 percent from the prior year due primarily to an increase in the fleet of revenue-producing equipment and higher activity levels partially offset by lower pricing for our services within this segment. The Support Services segment revenues for 2012 increased 3.4 percent compared to 2011 due primarily to higher activity levels in several of the service lines. Operating profit in the Technical Services segment declined due to lower personnel and equipment utilization as well as lower pricing. Operating profit in the Support Services segment declined due primarily to lower utilization and pricing in our rental tools service line.
Domestic revenues increased 6.4 percent during 2012 compared to 2011 to $1.9 billion due primarily to a larger fleet of revenue-producing equipment and higher activity levels in several service lines partially offset by lower pricing for our services in most service lines. The average price of oil remained stable while the average price of natural gas decreased by 31 percent during 2012 compared to the prior year. The average domestic rig count during 2012 was two percent higher than in 2011. Our revenues grew at a higher rate than the changes in our industry indicators because of increases in our fleet of revenue-producing equipment compared to 2011. However, increasingly competitive pricing for our services, as well as lower utilization of our revenue-producing equipment and personnel in 2012 compared to 2011, negatively impacted our operating income, income before income taxes, net income and earnings per share. International revenues, which increased from $52.1 million in 2011 to $74.2 million in 2012, were four percent of consolidated revenues in 2012 compared to three percent of revenues in 2011. These international revenue increases were due mainly to higher customer activity levels in Canada, China, Mexico and New Zealand in 2012 partially offset by a decrease in activity in Australia, Gabon and Saudi Arabia, compared to the prior year.
Cost of revenues. Cost of revenues in 2012 was $1.1 billion compared to $992.7 million in 2011, an increase of $212.3$113.2 million or 53.911.4 percent. The increase in these costs was due to the variable nature of most of these expenses. However, costCost of revenues, as a percent of revenues, decreased significantly due to leverage of employment and other direct costs over higher activity levels coupled with improved pricing for our servicesincreased in 20102012 compared to 2009.2011 due primarily to lower pricing and inefficiencies resulting from lower utilization of our equipment and personnel.
Selling, general and administrative expenses. Selling, general and administrative expensesincreased 24.716.2 percent to $121.8$175.7 million in 20102012 compared to $97.7$151.3 million in 2009.2011. This increase was primarily due to increases in total employment costs, including increased incentive compensation consistent with improved operating results. However, as a percentage of revenues, selling, general and administrative expenses decreased to 11.1 percent in 2010 compared to 16.6 percent in 2009 due to leverage of the fixed costs over higher revenues.
Depreciation and amortization. Depreciation and amortization were $133.4 million in 2010, an increase of $2.8 million or 2.1 percent compared to $130.6 million in 2009. This increase resulted from a higher level of capital expenditures during recent quarters within both Support Services and Technical Services to increase capacity and to maintain our existing equipment.
Gain on disposition of assets, net. Gain on the disposition of assets, net increased due primarily to increased gains related to various property and equipment dispositions or sales to customers of lost or damaged rental equipment due to the increased intensity of work.
Other income, net. Other income, net was $1.3 million in 2010, a decrease of $279 thousand compared to other expense of $1.6 million in 2009. The increase is mainly due to the current year increase in the fair value of trading securities held in the non-qualified Supplemental Retirement Plan. In addition to changes in the fair value of trading securities, other income (expense) includes gains (losses) from settlements of various legal and insurance claims and royalty payments.
Interest expense. Interest expense was $2.7 million in 2010 compared to $2.2 million in 2009. The increase is primarily due to higher interest rates in 2010 incurred on outstanding interest bearing advances on our revolving credit facility.
Interest income. Interest income decreased to $46 thousand in 2010 compared to $147 thousand in 2009 as a result of a lower average investable cash balance in 2010 compared to 2009.
Income tax provision (benefit). The income tax provision was $90.8 million in 2010 compared to an income tax benefit of $10.8 million in 2009. The change is due to the level of income before income tax in 2010, coupled with an increase in the effective tax rate to 38.2 percent in 2010 from 32.1 percent in 2009.
Net income (loss)and diluted earnings (loss) per share. Net income was $146.7 million in 2010, or $1.00 per diluted share, compared to net loss of $22.7 million, or $0.16 per share in 2009. This improvement was due to increased revenues and lower, as a percentage of revenues, costs of revenues, selling, general and administrative expenses and depreciation expense.
Year Ended December 31, 2009 Compared To Year Ended December 31, 2008
Revenues. Revenues in 2009 decreased $289.1 million or 33.0 percent compared to 2008. The Technical Services segment revenues for 2009 decreased 31.2 percent from the prior year due primarily to highly competitive pricing coupled with lower equipment utilization. The Support Services segment revenues for 2009 decreased 43.1 percent from 2008 due to decreased customer activity and significantly lower pricing in the rental tool service line, the largest within this segment.
Domestic revenues decreased 36 percent to $543.0 million during 2009 compared to 2008 due to decreased customer activity and competitive pricing in our largest service lines, such as pressure pumping and rental tools. The average price of natural gas decreased by 56 percent and the average price of oil decreased by approximately 38 percent during 2009 compared to 2008. In conjunction with the decrease in natural gas prices, the average domestic rig count during 2009 was 42 percent lower than in 2008. This decrease in drilling activity had a negative impact on our financial results. We believe that our activity levels are affected more by the price of natural gas than by the price of oil, because the majority of U.S. domestic drilling activity relates to natural gas, and many of our services are more appropriate for gas wells than oil wells. Foreign revenues, which increased from $30.8 million in 2008 to $44.8 million in 2009, were eight percent of consolidated revenues. These revenue increases were due mainly to higher customer activity levels in New Zealand and Mexico compared to 2008. Our international revenues are impacted by the timing of project initiation and their ultimate duration.
Cost of revenues. Cost of revenues in 2009 was $393.8 million compared to $503.6 million in 2008, a decrease of $109.8 million or 21.8 percent. The decrease in these costs was due to the variable nature of most of these expenses as well as the impact of expense reduction measures taken during 2009, including employment cost reductions. Cost of revenues, as a percent of revenues, increased in 2009 from 2008 due to lower pricing for our services.
Selling, general and administrative expenses. Selling, general and administrative expenses decreased 16.6 percent to $97.7 million in 2009 compared to $117.1 million in 2008. This decrease was primarily due to lower employment costs and other expenses resulting from expense reduction efforts instituted during 2009. In response to the industry downturn that RPC experienced in the third and fourth quarters of 2008 and most of 2009, the Company undertook several measures which it believes reduced its operating and net losses for the 12 months ended December 31, 2009. Primary among these measures was a reduction in employment costs, which we accomplished by headcount reductions among both field and administrative employees. During 2009, RPC reduced its headcount by 22 percent. This headcount reduction, along with other compensation reductions, resulted in a 22 percent decrease in total employment costs in 2009 as compared to 2008.costs. As a percentage of revenues, selling, general and administrative expenses increased to 16.69.0 percent in 20092012 compared to 13.48.4 percent in 2008.2011.
Depreciation and amortization. Depreciation and amortization expense were $130.6$214.9 million in 2009,2012, an increase of $12.2$35.0 million or 10.319.5 percent, compared to $118.4$179.9 million in 2008.2011. This increase resulted from a higher level of capital expenditures during 2009 within both SupportTechnical Services and TechnicalSupport Services to increase capacity and to maintain our existing fleet of equipment. As a percentage of revenues, depreciation and amortization increased to 11.0 percent in 2012 compared to 9.9 percent in 2011.
GainLoss on disposition of assets, net.GainLoss on the disposition of assets, net decreased due primarilywas $6.1 million in 2012 compared to decreased$3.8 million in 2011. The loss of disposition of assets, net includes gains or losses related to various property and equipment dispositions including certain equipment components experiencing increased wear and tear which requires early dispositions, or sales to customers of lost or damaged rental equipment.
Other income, (expense), net. Other income, net was $1.6$2.2 million in 2009,2012, an increase of $2.8$2.0 million compared to other expense of $1.2$0.2 million in 2008. The increase is mainly due2011. Other income, net primarily includes mark to the 2009 increase in the fair valuemarket gains and losses of trading securities heldinvestments in the non-qualified Supplemental Retirement Plan. In addition to changes in the fair value of trading securities, other income (expense) includes gains (losses) from settlements of various legal and insurance claims and royalty payments.benefit plan.
Interest expense. expense and interest income. Interest expense was $2.2$2.0 million in 20092012 compared to $5.3$3.5 million in 2008.2011. The decrease in 2012 is due to a lower interest expense in 2009 incurred on lower outstanding interest bearing advancesaverage debt balance on our revolving credit facility. During 2009 RPC also reduced its capital expenditures due to the industry downturn. While we reduced capital expenditures in order to strengthen our balance sheetfacility coupled with slightly lower interest rates net of interest capitalized on equipment and preserve cash, and because we did not believe the potential expenditures met our financial return criteria, this action also had the effect of reducing interest expense.
Interest income. facilities under construction. Interest income increased to $147$30 thousand in 20092012 compared to $73$18 thousand in 2008 as a result of a higher average investable cash balance in 2009 compared to 2008.2011.
Income tax (benefit) provision. The income tax benefitprovision was $10.8$168.2 million in 20092012 compared to a tax provision of $54.4$182.4 million in 2008. The change is2011. This decrease was due to 2009’s losslower income before income tax, partially offset by a decreasetaxes in 2012 compared to 2011 as the effective tax rate to 32.1of 38.0 percent in 2009 from 39.52012 was comparable to the effective tax rate of 38.1 percent in 2008.2011.
Net (loss) income and diluted (loss) earnings per share. Net lossincome was $22.7$274.4 million in 2009,2012, or $0.16$1.27 per diluted share, compared to net income of $83.4$296.4 million, or $0.57$1.35 per diluted share in 2008.2011. This decrease isdecline was due to decreased revenues and higher, as a percentage of revenues, costs of revenues, selling, general and administrative expenses, and depreciation expense.and amortization expenses.
Liquidity and Capital Resources
Cash and Cash Flows
The Company’s cash and cash equivalents were $9.0$8.7 million as of December 31, 2010, $4.52013, $14.2 million as of December 31, 20092012 and $3.0$7.4 million as of December 31, 2008.2011.
The following table sets forth the historical cash flows for the years ended December 31:
| | | (in thousands) | |
| | | 2010 | | | 2009 | | | 2008 | |
| Net cash provided by operating activities | | $ | 168,657 | | | $ | 168,740 | | | $ | 177,320 | |
| Net cash used for investing activities | | | (171,769 | ) | | | (61,144 | ) | | | (158,953 | ) |
| Net cash provided by (used for) financing activities | | | 7,658 | | | | (106,144 | ) | | | (21,668 | ) |
| | | (in thousands) | |
| | | 2013 | | | 2012 | | | 2011 | |
| Net cash provided by operating activities | | $ | 365,624 | | | $ | 559,933 | | | $ | 386,007 | |
| Net cash used for investing activities | | | (207,654 | ) | | | (315,838 | ) | | | (391,637 | ) |
| Net cash (used for) provided by financing activities | | | (163,433 | ) | | | (237,325 | ) | | | 3,988 | |
Cash provided by operating activities was comparabledecreased $194.3 million in 20102013 compared to the prior year despitedue primarily to a decrease in net income increasing significantlyof $107.5 million, an unfavorable change in deferred taxes of $17.9 million due to $146.7 milliona decrease in 2010 compared to net loss of $22.7 million in 2009. This contribution of net income to cash provided by operating activities was largely offset by increasestax depreciation benefits resulting from lower capital expenditures coupled with an unfavorable change in working capital requirements. Increasedof $83.2 million.
The unfavorable change in working capital is primarily due to the following: an unfavorable change of $123.8 million in accounts receivable due to slightly higher business activity levels at the end of 2013 compared to declining activity levels at the end of the prior year; an unfavorable change of $25.1 million in other current assets due to lower deposits for raw materials; an unfavorable net change of $9.8 million in net current income taxes receivable/payable; and revenuesan unfavorable change of $4.6 million in 2010 resulted in higher accounts receivableaccrued state, local and increased inventory,other taxes due to the timing of payments. These unfavorable changes were partially offset by increasesa favorable change of $54.4 million in accounts payableinventories due to improved sourcing of critical materials and accrued payroll including bonuses, consistent with higher activity levels and profitability.supplies that require longer lead times.
Cash used for investing activities in 2010 increased2013 decreased by $110.6$108.2 million compared to 2009,2012, primarily as a result of higherlower capital expenditures.expenditures in response to highly competitive pricing.
Cash provided by (used for)used for financing activities in 2010 increased2013 decreased by $113.8$73.9 million primarily as a result of lower net loan repayments coupled with lower open market share repurchases, partially offset by a 25 percent increase in the per share common stock dividend declared during 2013 compared to 2009, primarily due to the net increase in borrowings under our credit facility during 2010 to fund working capital requirements and capital expenditures.prior year.
Cash provided by operating activities decreased by $8.6increased $173.9 million in 20092012 compared to 2008. Net loss was $22.7 millionthe prior year due primarily to a net decrease in 2009working capital requirements in 2012 compared to net income of $83.4 million2011. This decrease in 2008, decreasing cash provided by operating activitiesworking capital requirements was partially offset by decreasesa decrease in working capital requirements. Decreasedthe deferred tax provision and net income. Decreasing business activity levels and revenues in 20092012 resulted in lowerdecreased accounts receivable, other current assets and prepaid expensesaccounts payable partially offset by increased inventory and declinesan increase in accounts payable and accrued payroll including bonuses, consistent with lower activity levels and profitability.inventory.
Cash used for investing activities in 20092012 decreased by $97.8$75.8 million compared to 2008,2011, primarily as a result of lower capital expenditures.
Cash used for financing activities in 20092012 increased by $84.5$241.3 million primarily as a result of higher net loan repayments during 2012 compared to 2008, primarily due to the reductionprior year as a result of improvements in notes payable to banks during 2009, partially offset by a decreaseworking capital and an increase in common stock purchased and retired.dividends during 2012 compared to the prior year.
Financial Condition and Liquidity
The Company’s financial condition as of December 31, 2010,2013, remains strong. We believe the liquidity provided by our existing cash and cash equivalents, our overall strong capitalization which includes a revolving credit facility and cash expected to be generated from operations will provide sufficient capital to meet our requirements for at least the next twelve months. TheOn January 17, 2014, the Company currently hasamended a $350 million revolving credit facility that matures in August 2015.which extended the maturity of the loan to January 2019. The facility contains customary terms and conditions, including certain financial covenants including covenants restricting RPC’s ability to incur liens, merge or consolidate with another entity. A total of $209.9$272.6 million was available under the facility as of December 31, 2010; approximately $18.82013; $24.1 million of the facility supports outstanding letters of credit relating to self-insurance programs or contract bids. For additional information with respect to RPC’s facility, see Note 6 of the Notes to Consolidated Financial Statements.
The Company’s decisions about the amount of cash to be used for investing and financing purposes are influenced by its capital position, including access to borrowings under our facility, and the expected amount of cash to be provided by operations. We believe our liquidity will continue to provide the opportunity to grow our asset base and revenues during periods with positive business conditions and strong customer activity levels. The Company’s decisions about the amount of cash to be used for investing and financing activities could be influenced by the financial covenants in our credit facility but we do not expect the covenants to restrict our planned activities. The Company is in compliance with these financial covenants.
Cash Requirements
Capital expenditures were $187.5$201.7 million in 2010,2013, and we currently expect capital expenditures to be in excess of $250.0approximately $200 million in 2011.2014. We expect that a majority of these expenditures toin 2014 will be primarily directed towards maintenance of our revenue-producing equipment and refurbishment of our existing fleet of pressure pumping equipment. The remaining capital expenditures will be directed towards the purchase of revenue-producing equipment in several of our larger, core service lines, including pressure pumping, snubbing, nitrogen,coiled tubing and rental tools. The actual amount of 2011 expenditures will depend primarily on equipment maintenance requirements, expansioncustomer opportunities, and equipment delivery schedules.
The Company’s Retirement Income Plan, a multiple employer trusteed defined benefit pension plan, provides monthly benefits upon retirement at age 65 to eligible employees. During the second quarter of 2010,2013, the Company contributed $0.6$0.8 million to the pension plan. The Company expects that additional contributions to the defined benefit pension plan of $0.6approximately $0.8 million will be required in 20112014 to achieve the Company’s funding objective.
The Company’s Board of Directors announcedCompany has a stock buyback program on March 9,initially adopted in 1998 authorizingthat authorizes the repurchase of up to 17,718,75026,578,125 shares. On June 5, 2013, the Board of Directors authorized an additional 5,000,000 shares of which 4,210,898 additionalfor repurchase under this program. There were 1,511,614 shares werepurchased on the open market during 2013, and 4,712,234 shares remain available to be repurchased under the current authorization as of December 31, 2010.2013. The Company may repurchase outstanding common shares periodically based on market conditions and our capital allocation strategies considering restrictions under our credit facility. The stock buyback program does not have a predetermined expiration date.
On January 26, 2011,28, 2014, the Board of Directors approved a $0.07$0.105 per share cash dividend, payable March 10, 20112014 to stockholders of record at the close of business on February 10, 2011.2014. The Company expects to continue to pay cash dividends to common stockholders, subject to the earnings and financial condition of the Company and other relevant factors.
Contractual Obligations
The Company’sCompany��s obligations and commitments that require future payments include our credit facility, certain non-cancelable operating leases, purchase obligations and other long-term liabilities. The following table summarizes the Company’s significant contractual obligations as of December 31, 2010:2013:
| Contractual obligations | | Payments due by period | | | Payments due by period | |
| (in thousands) | | Total | | | Less than 1 year | | | 1-3 years | | | 3-5 years | | | More than 5 years | | | Total | | | Less than 1 year | | | 1-3 years | | | 3-5 years | | | More than 5 years | |
| Long-term debt obligations | | $ | 121,250 | | | $ | - | | | $ | - | | | $ | 121,250 | | | $ | - | | | $ | 53,300 | | | $ | — | | | $ | — | | | $ | — | | | $ | 53,300 | |
| Interest on long-term debt obligations | | | 21,898 | | | | 4,692 | | | | 9,385 | | | | 7,821 | | | | - | | | | 9,917 | | | | 1,951 | | | | 3,901 | | | | 3,901 | | | | 164 | |
| Capital lease obligations | | | - | | | | - | | | | - | | | | - | | | | - | | | | — | | | | — | | | | — | | | | — | | | | — | |
| Operating leases (1) | | | 14,098 | | | | 5,202 | | | | 6,051 | | | | 2,559 | | | | 286 | | | | 35,408 | | | | 11,604 | | | | 12,594 | | | | 5,220 | | | | 5,990 | |
| Purchase obligations (2) | | | 209 | | | | 209 | | | | - | | | | - | | | | - | | | | 16,467 | | | | 16,467 | | | | — | | | | — | | | | — | |
| Other long-term liabilities (3) | | | 2,415 | | | | - | | | | 2,415 | | | | - | | | | - | | | | 2,885 | | | | — | | | | 2,785 | | | | 100 | | | | — | |
| Total contractual obligations | | $ | 159,870 | | | $ | 10,103 | | | $ | 17,851 | | | $ | 131,360 | | | $ | 286 | | | $ | 117,977 | | | $ | 30,022 | | | $ | 19,280 | | | $ | 9,221 | | | $ | 59,454 | |
| (1) | Operating leases include agreements for various office locations, office equipment, and certain operating equipment. |
| (2) | Includes agreements to purchase raw materials, goods or services that have been approved and that specify all significant terms (pricing, quantity, and timing). As part of the normal course of business the Company occasionally enters into purchase commitments to manage its various operating needs. |
| (3) | Includes expected cash payments for long-term liabilities reflected on the balance sheet where the timing of the payments are known. These amounts include incentive compensation. These amounts exclude pension obligations with uncertain funding requirements and deferred compensation liabilities. |
Fair Value Measurements
The Company’s assets and liabilities measured at fair value are classified in the fair value hierarchy (Level 1, 2 or 3) based on the inputs used for valuation. Assets and liabilities that are traded on an exchange with a quoted price are classified as Level 1. Assets and liabilities that are valued using significant observable inputs in addition to quoted market prices are classified as Level 2. The Company currently has no assets or liabilities measured on a recurring basis that are valued using unobservable inputs and therefore no assets or liabilities measured on a recurring basis are classified as Level 3. For defined benefit plan assets classified as Level 3, the values are computed using inputs such as cost, discounted future cash flows, independent appraisals and market based comparable data or on net asset values calculated by the fund and not publicly available.
In 2009, the Company transferred trading securities from assets utilizing Level 1 inputs to assets utilizing Level 2 inputs because significant observable inputs in addition to quoted market prices were used to value these trading securities.
Inflation
The Company purchases its equipment and materials from suppliers who provide competitive prices, and employs skilled workers from competitive labor markets. If inflation in the general economy increases, the Company’s costs for equipment, materials and labor could increase as well. Also, increases in activity in the domestic oilfield can cause upward wage pressures in the labor markets from which it hires employees as well as increases in the costs of certain materials and key equipment components used to provide services to the Company’s customers. During 2010,2012 and 2013, the Company incurred higher fuelemployment costs due to increased commodity prices compared to 2009. Also,a continued shortage of skilled labor in many of its markets. Although these costs pressure subsided somewhat during the third and fourth quarters of 2013, our employment costs remain high and the Company believesexpects that itthey will be subjectremain high during 2014. During 2012, the prices of certain raw materials used to upward wage pressures 2011.provide the Company’s services fluctuated significantly. The Company mitigated some of the cost increases for raw materials by securing materials through additional sources, and the Company continued to source raw materials from these additional sources in 2013. Increased availability of many of these raw materials in response to high market prices has caused prices of some of these raw materials to decline. Furthermore, favorable crop yields have improved the availability of certain of these raw materials, thus decreasing these costs. Finally, the costsprice of certain materials and equipment used to provide services to RPC’sthe Company’s customers remain highhas remained relatively constant in spite of declining demand, and may increase during 2011 ifin certain cases has decreased due to lower demand in the current environment for such equipment by oilfield activity remains strong. The Company has attempted to mitigate the risk of cost increases by securing materials and equipment through additional sources and increasing amounts held in inventory, although no assurance can be given that these efforts will be successful.service companies.
Off Balance Sheet Arrangements
The Company does not have any material off balance sheet arrangements.
Related Party Transactions
Marine Products Corporation
Effective February 28,in 2001, the Company spun off the business conducted through Chaparral Boats, Inc. (“Chaparral”), RPC’s former powerboat manufacturing segment. RPC accomplished the spin-off by contributing 100 percent of the issued and outstanding stock of Chaparral to Marine Products Corporation (a Delaware corporation) (“Marine Products”), a newly formed wholly owned subsidiary of RPC, and then distributing the common stock of Marine Products to RPC stockholders. In conjunction with the spin-off, RPC and Marine Products entered into various agreements that define the companies’ relationship.
In accordance with a Transition Support Services agreement, which may be terminated by either party, RPC provides certain administrative services, including financial reporting and income tax administration, acquisition assistance, etc., to Marine Products. Charges from the Company (or from corporations that are subsidiaries of the Company) for such services aggregated approximately $689,000were $670,000 in 2010, $713,0002013, $544,000 in 20092012, and $842,000$639,000 in 2008.2011. The Company’s receivable due from Marine Products for these services was $145,000 as of December 31, 20102013 and 2009 was approximately $65,000.$94,000 as of December 31, 2012. The Company’s directors are also directors of Marine Products and all of the executive officers are employees of both the Company and Marine Products.
Other
The Company periodically purchases in the ordinary course of business products or services from suppliers, who are owned by significant officers or stockholders, or affiliated with the directors of RPC. The total amounts paid to these affiliated parties were approximately $551,000$1,039,000 in 2010, $409,0002013, $1,676,000 in 20092012 and $393,000$1,469,000 in 2008.2011.
RPC receives certain administrative services and rents office space from Rollins, Inc. (a company of which Mr. R. Randall Rollins is also Chairman and which is otherwise affiliated with RPC). The service agreements between Rollins, Inc. and the Company provide for the provision of services on a cost reimbursement basis and are terminable on six monthsmonths’ notice. The services covered by these agreements include office space, administration of certain employee benefit programs, and other administrative services. Charges to the Company (or to corporations which are subsidiaries of the Company) for such services and rent totaled $94,000$83,000 in 2010, $87,0002013 and 2012, and $102,000 in 2009 and $90,000 in 2008.2011.
A group that includes the Company’s Chairman of the Board, R. Randall Rollins and his brother Gary W. Rollins, who is also a director of the Company, and certain companies under their control, controls in excess of fifty percent of the Company’s voting power.
Critical Accounting Policies
The consolidated financial statements are prepared in accordance with accounting principles generally accepted in the United States, which require significant judgment by management in selecting the appropriate assumptions for calculating accounting estimates. These judgments are based on our historical experience, terms of existing contracts, trends in the industry, and information available from other outside sources, as appropriate. Senior management has discussed the development, selection and disclosure of its critical accounting estimates with the Audit Committee of our Board of Directors. The Company believes the following critical accounting policies involve estimates that require a higher degree of judgment and complexity:
Allowance for doubtful accounts — Substantially all of the Company’s receivables are due from oil and gas exploration and production companies in the United States, selected international locations and foreign, nationally owned oil companies. Our allowance for doubtful accounts is determined using a combination of factors to ensure that our receivables are not overstated due to uncollectibility. Our established credit evaluation procedures seek to minimize the amount of business we conduct with higher risk customers. Our customers’ ability to pay is directly related to their ability to generate cash flow on their projects and is significantly affected by the volatility in the price of oil and natural gas. Provisions for doubtful accounts are recorded in selling, general and administrative expenses. Accounts are written off against the allowance for doubtful accounts when the Company determines that amounts are uncollectible and recoveries of amounts previously written off are recorded when collected. Significant recoveries will generally reduce the required provision in the period of recovery. Therefore, the provision for doubtful accounts can fluctuate significantly from period to period. Recoveries were insignificant in 20102013, 2012 and 2009. Recoveries in 2008 totaled $1.5 million, causing a reduction in bad debt expense in 2008.2011. We record specific provisions when we become aware of a customer’s inability to meet its financial obligations to us, such as in the case of bankruptcy filings or deterioration in the customer’s operating results or financial position. If circumstances related to customers change, our estimates of the realizability of receivables would be further adjusted, either upward or downward.
The estimated allowance for doubtful accounts is based on our evaluation of the overall trends in the oil and gas industry, financial condition of our customers, our historical write-off experience, current economic conditions, and in the case of international customers, our judgments about the economic and political environment of the related country and region. In addition to reserves established for specific customers, we establish general reserves by using different percentages depending on the age of the receivables which we adjust periodically based on management judgment and the economic strength of our customers. Excluding the effect of the recoveries referred to above, theThe net provisions for doubtful accounts have ranged from 0.100.47 percent to 0.450.15 percent of revenues over the last three years. Increasing or decreasing the estimated general reserve percentages by 0.50 percentage points as of December 31, 20102013 would have resulted in a change of approximately $1.5$2.2 million to the allowance for doubtful accounts and a corresponding change to selling, general and administrative expenses.
Income taxes— The effective income tax rates were 38.239.6 percent in 2010, 32.12013, 38.0 percent in 20092012 and 39.538.1 percent in 2008.2011. Our effective tax rates vary due to changes in estimates of our future taxable income, fluctuations in the tax jurisdictions in which our earnings and deductions are realized, and favorable or unfavorable adjustments to our estimated tax liabilities related to proposed or probable assessments. As a result, our effective tax rate may fluctuate significantly on a quarterly or annual basis.
We establish a valuation allowance against the carrying value of deferred tax assets when we determine that it is more likely than not that the asset will not be realized through future taxable income. Such amounts are charged to earnings in the period in which we make such determination. Likewise, if we later determine that it is more likely than not that the net deferred tax assets would be realized, we would reverse the applicable portion of the previously provided valuation allowance. We have considered future market growth, forecasted earnings, future taxable income, the mix of earnings in the jurisdictions in which we operate, and prudent and feasible tax planning strategies in determining the need for a valuation allowance.
We calculate our current and deferred tax provision based on estimates and assumptions that could differ from the actual results reflected in income tax returns filed during the subsequent year. Adjustments based on filed returns are recorded when identified, which is generally in the third quarter of the subsequent year for U.S. federal and state provisions. Deferred tax liabilities and assets are determined based on the differences between the financial and tax bases of assets and liabilities using enacted tax rates in effect in the year the differences are expected to reverse.
The amount of income taxes we pay is subject to ongoing audits by federal, state and foreign tax authorities, which may result in proposed assessments. Our estimate for the potential outcome for any uncertain tax issue is highly judgmental. We believe we have adequately provided for any reasonably foreseeable outcome related to these matters. However, our future results may include favorable or unfavorable adjustments to our estimated tax liabilities in the period the assessments are made or resolved or when statutes of limitation on potential assessments expire. Additionally, the jurisdictions in which our earnings or deductions are realized may differ from our current estimates.
Insurance expenses – The Company self insures, up to certain policy-specified limits, certain risks related to general liability, workers’ compensation, vehicle and equipment liability. The cost of claims under these self-insurance programs is estimated and accrued using individual case-based valuations and statistical analysis and is based upon judgment and historical experience; however, the ultimate cost of many of these claims may not be known for several years. These claims are monitored and the cost estimates are revised as developments occur relating to such claims. The Company has retained an independent third party actuary to assist in the calculation of a range of exposure for these claims. As of December 31, 2010,2013, the Company estimates the range of exposure to be from $12.0$14.1 million to $15.3$18.6 million. The Company has recorded liabilities at December 31, 20102013 of approximately $13.6$16.3 million which represents management’s best estimate of probable loss.
Depreciable life of assets — RPC’s net property, plant and equipment at December 31, 20102013 was $453.0$726.3 million representing 51.052.5 percent of the Company’s consolidated assets. Depreciation and amortization expenses for the year ended December 31, 20102013 were $133.4$215.4 million. Management judgment is required in the determination of the estimated useful lives used to calculate the annual and accumulated depreciation and amortization expense.
Property, plant and equipment are reported at cost less accumulated depreciation and amortization, which is provided on a straight-line basis over the estimated useful lives of the assets. The estimated useful life represents the projected period of time that the asset will be productively employed by the Company and is determined by management based on many factors including historical experience with similar assets. Assets are monitored to ensure changes in asset lives are identified and prospective depreciation and amortization expense is adjusted accordingly. We have not made any changes to the estimated lives of assets resulting in a material impact in the last three years.
Defined benefit pension plan– In 2002, the Company ceased all future benefit accruals under the defined benefit plan, although the Company remains obligated to provide employees benefits earned through March 2002. The Company accounts for the defined benefit plan in accordance with the provisions of FASB ASC 715, “Compensation – Retirement Benefits” and engages an outside actuary to calculate its obligations and costs. With the assistance of the actuary, the Company evaluates the significant assumptions used on a periodic basis including the estimated future return on plan assets, the discount rate, and other factors, and makes adjustments to these liabilities as necessary.
The Company chooses an expected rate of return on plan assets based on historical results for similar allocations among asset classes, the investments strategy, and the views of our investment adviser. Differences between the expected long-term return on plan assets and the actual return are amortized over future years. Therefore, the net deferral of past asset gains (losses) ultimately affects future pension expense. The Company’s assumption for the expected return on plan assets was seven percent for 20102013, 2012 and 2009 and eight percent for 2008.2011.
The discount rate reflects the current rate at which the pension liabilities could be effectively settled at the end of the year. In estimating this rate, the Company utilizes a yield curve approach. The approach utilizes an economic model whereby the Company’s expected benefit payments over the life of the plan are forecasted and then compared to a portfolio of investment grade corporate bonds that will mature at the same time that the benefit payments are due in any given year. The economic model then calculates the one discount rate to apply to all benefit payments over the life of the plan which will result in the same total lump sum as the payments from the corporate bonds. A lower discount rate increases the present value of benefit obligations. The discount rate was 5.495.20 percent as of December 31, 20102013 compared to 6.004.16 percent as of December 31, 2012 and 5.00 percent in 2009 and 6.84 percent in 2008.2011.
As set forth in note 10 to the Company’s financial statements, included among the asset categories for the Plan’s investments are real estate and tactical composite and alternative investments comprised of investments in real estate funds and hedgeprivate equity funds. These investments are categorized as level 3 investments and are valued using significant non-observable inputs which do not have a readily determinable fair value. In accordance with ASU No. 2009-12 “Investments In Certain Entities That Calculate Net Asset Value per Share (Or Its Equivalent),” these investments are valued based on the net asset value per share calculated by the funds in which the plan has invested. These valuations are subject to judgments and assumptions of the funds which may prove to be incorrect, resulting in risks of incorrect valuation of these investments. The Company seeks to mitigate against these risks by evaluating the appropriateness of the funds’ judgments and assumptions by reviewing the financial data included in the funds’ financial statements for reasonableness.
As of December 31, 2010,2013, the defined benefit plan was under-funded and the recorded change within accumulated other comprehensive loss decreasedincreased stockholders’ equity by $1.4approximately $4.9 million after tax. Holding all other factors constant, a change in the discount rate used to measure plan liabilities by 0.500.25 percentage points would not result in a significant pre-tax changeincrease or decrease of approximately $1.1 million to the net loss related to pension reflected in accumulated other comprehensive loss.
The Company recognized pre-tax pension (income) expense of $0.6$0.5 million in 2010, $2.02013, $0.7 million in 20092012 and $(0.4)$0.5 million in 2008.2011. Based on the under-funded status of the defined benefit plan as of December 31, 2010,2013, the Company expects to recognize pension expense of $0.5$0.1 million in 2011.2014. Holding all other factors constant, a change in the expected long-term rate of return on plan assets by 0.50 percentage points would result in an increase or decrease in pension expense of approximately $0.1$0.2 million in 2011.2014. Holding all other factors constant, a change in the discount rate used to measure plan liabilities by 0.25 percentage points would result in an increase or decrease in pension expense of approximately $1.0 million$3 thousand in 2011.2014.
NewRecent Accounting Pronouncements
Recently Adopted Accounting Pronouncements:
●
| ASU 2010-01, Equity (Topic 505): Accounting for Distributions to Shareholders with Components of Stock and Cash. The amendments to the Codification in this ASU clarify that the stock portion of a distribution to shareholders that allows them to elect to receive cash or stock with a potential limitation on the total amount of cash that all shareholders can elect to receive in the aggregate is considered a share issuance that is reflected in earnings per share prospectively and not a share dividend. The Company adopted these provisions in the first quarter of 2010 and the adoption did not have a material impact on the Company’s consolidated financial statements.
|
● | ASU 2010-06, Fair Value Measurements and Disclosures (Topic 820): Improving Disclosures about Fair Value Measurements. The amendments to the Codification in this ASU now require
|
| 1. | the amounts of significant transfers in and out of Level 1 and Level 2 fair value measurements and the reasons for the transfer be disclosed separately and |
| 2. | in the reconciliation for fair value measurements using significant unobservable inputs, a reporting entity should present separately information about purchases, sales, issuances and settlements. |
| 3. | judgment in determining the appropriate classes of assets and liabilities when reporting fair value measurements for each class |
| 4. | disclosures about valuation techniques and inputs used to measure fair value for both recurring and nonrecurring fair value measurements. |
The Company complied with these disclosure requirements in its annual report on Form 10-K forDuring the year ended December 31, 20092013, the Financial Accounting Standards Board (FASB) issued the following applicable Accounting Standards Updates (ASU):
Recently Adopted Accounting Pronouncements:
Accounting Standards Update 2013-02, Comprehensive Income (Topic 220): Reporting of Amounts Reclassified Out of Accumulated Other Comprehensive Income. The amendments in this ASU do not change the current requirements for reporting net income or other comprehensive income in financial statements. All of the information that this ASU requires already is required to be disclosed elsewhere in the financial statements under U.S. GAAP. In addition, an entity is required to present (either on the face of the statement where net income is presented or in the notes) the effects on the line items of net income of significant amounts reclassified out of accumulated other comprehensive income, but only if the item reclassified is required under U.S. GAAP to be reclassified to net income in its entirety in the same reporting period. The Company adopted these provisions in the first quarter of 2013 and has included the required additional disclosures in the accompanying financial statements and notes.
Recently Issued Accounting Pronouncements Not Yet Adopted:
Accounting Standards Update 2013-05, Foreign Currency Matters (Topic 830): Parent’s Accounting for the Cumulative Translation Adjustment upon Derecognition of Certain Subsidiaries or Groups of Assets within a Foreign Entity or of an Investment in a Foreign EntityThe amendments in this ASU requires that when a reporting entity (parent) ceases to have a controlling financial interest in a subsidiary or group of assets within a foreign entity, the parent should release the cumulative translation adjustment into net income only if the sale or transfer results in the complete or substantially complete liquidation of the foreign entity in which the subsidiary or group of assets had resided. Additionally, the amendments in this ASU clarify that the sale of an investment in a foreign entity includes both: (1) events that result in the loss of a controlling financial interest in a foreign entity; and (2) events that result in an acquirer obtaining control of an acquiree in which it held an equity interest immediately before the acquisition date. Upon the occurrence of those events, the cumulative translation adjustment should be released into net income. The amendments in this ASU are effective prospectively for fiscal years beginning after December 15, 2013 and for interim reporting periods within those years, with early adoption being permitted. The Company plans to provideadopt these provisions in the disclosures in every reporting period as necessary. Adoptionfirst quarter of these disclosure requirements did2014 and does not expect the adoption to have a material impact on the Company’s consolidated financial statements.
Recently Issued Accounting Pronouncements Not Yet Adopted:Standards Update 2013-11,Income Taxes (Topic 740): Presentation of an Unrecognized Tax Benefit When a Net Operating Loss Carryforward, a Similar Tax Loss, or a Tax Credit Carryforward Exists. The amendments in this ASU requires an unrecognized tax benefit, or a portion of thereof, to be presented in the financial statements as a reduction to a deferred tax asset for a net operating loss carryforward, a similar tax loss, or a tax credit carryforward. The only exception would be if the deferred taxes related to these items are not available to settle any additional income taxes that would result from the disallowance of a tax position either by statute or at the entity’s choosing. In such cases, the unrecognized tax benefit should be presented in the financial statements as a liability and should not be combined with deferred tax assets. The amendments in this ASU are effective prospectively for fiscal years beginning after December 15, 2013 and for interim reporting periods within those years, with early adoption being permitted. The Company plans to adopt these provisions in the first quarter of 2014 and does not expect the adoption to have a material impact on the Company’s consolidated financial statements.
● | ASU 2010-13, Compensation – Stock Compensation (topic 718): Effect of Denominating the Exercise Price of a Share-Based Payment Award in the Currency of the Market in Which the Underlying Equity Security Trades. The amendments to the Codification in this ASU provide guidance on share-based payment awards to employees with an exercise price denominated in the currency of a market in which a substantial portion of the entity’s equity shares trade. The ASU states that if such awards meet all the criteria for equity should be classified as such and not liability based solely on the currency it is denominated in. The amendments are effective beginning in 2011 with adoption required in the first quarter of that year. Adoption of these provisions is not expected to have a material impact on the Company’s consolidated financial statements.
|
● | ASU 2010-28,Intangibles - Goodwill and Other (Topic 350): When to Perform Step 2 of the Goodwill Impairment Test for Reporting Units with Zero or Negative Carrying Amounts. The amendments to the Codification in this ASU modify Step 1 of the goodwill impairment test for reporting units with zero or negative carrying amounts. For those reporting units, an entity is required to perform Step 2 of the goodwill impairment test if it is more likely than not that a goodwill impairment exists. Goodwill of a reporting unit is required to be tested for impairment between annual tests if an event occurs or circumstances change that would more likely than not reduce the fair value of a reporting unit below its carrying amount. These amendments are effective starting in the first quarter of 2011 with early adoption not permitted. Adoption of these provisions is not expected to have a material impact on the Company’s consolidated financial statements.
|
● | ASU 2010-29, Business Combinations (Topic 805): Disclosure of Supplementary Pro Forma Information for Business Combinations. The amendments to the Codification in this ASU apply to any public entity that enters into business combinations that are material on an individual or aggregate basis and specify that the entity presents comparative financial statements, the entity should disclose revenue and earnings of the combined entity as though the business combination(s) that occurred during the current year had occurred as of the beginning of the comparable prior annual reporting period only. The amendments also expand the supplemental pro forma disclosures to include a description of the nature and amount of material, nonrecurring pro forma adjustments directly attributable to the business combination included in the reported pro forma revenue and earnings. The amendments are effective prospectively for business combinations for which the acquisition date is on or after the beginning of the first annual reporting period beginning in January 2011 with early adoption permitted. The Company plans to adopt these provisions for all acquisitions completed beginning in 2011 and provide the appropriate disclosures.
|
Item 7A. Quantitative and Qualitative Disclosures about Market Risk
The Company is subject to interest rate risk exposure through borrowings on its credit facility.agreement. As of December 31, 2010,2013, there are outstanding interest-bearing advances of $121.3$53.3 million on our credit facility which bear interest at a floating rate. Effective December 2008, we entered into an interest rate swap agreement that effectively converted $50 million of the outstanding variable-rate borrowings under the revolving credit facility to a fixed-rate basis, thereby hedging against the impact of potential interest rate changes. Under this agreement, the Company and the issuing lender settle each month for the difference between a fixed interest rate of 2.07 percent and a comparable one month variable-rate interest paid to the syndicate of lenders under our credit facility on the same notional amount, excluding the margin. The swap agreement terminates on September 8, 2011. As of December 31, 2010 the interest rate swap had a negative fair value of $610,000. An increase in interest rates of one half of one percent would result in the interest rate swap having a negative fair value of approximately $458,000 at December 31, 2010. A decrease in interest rates of one half of one percent would result in the interest rate swap having a negative fair value $765,000 at December 31, 2010. A change in interest rates will have no impact on the interest expense associated with the $50,000,000 of borrowings under the credit facility that are subject to the interest rate swap. A change in interest rates of one percent on the balance outstanding on the credit facility at December 31, 2010 not subject to the interest rate swap2013 would cause a change of $0.7approximately $0.5 million in total annual interest costs.
Additionally, the Company is exposed to market risk resulting from changes in foreign exchange rates. However, since the majority of the Company’s transactions occur in U.S. currency, this risk is not expected to have a material effect on its consolidated results of operations or financial condition.
MANAGEMENT’S REPORT ON INTERNAL CONTROL OVER FINANCIAL REPORTING
To the Stockholders of RPC, Inc.:
The management of RPC, Inc. is responsible for establishing and maintaining adequate internal control over financial reporting for the Company. RPC, Inc. maintains a system of internal accounting controls designed to provide reasonable assurance, at a reasonable cost, that assets are safeguarded against loss or unauthorized use and that the financial records are adequate and can be relied upon to produce financial statements in accordance with accounting principles generally accepted in the United States of America. The internal control system is augmented by written policies and procedures, an internal audit program and the selection and training of qualified personnel. This system includes policies that require adherence to ethical business standards and compliance with all applicable laws and regulations.
There are inherent limitations to the effectiveness of any controls system. A controls system, no matter how well designed and operated, can provide only reasonable, not absolute, assurance that the objectives of the controls system are met. Also, no evaluation of controls can provide absolute assurance that all control issues and any instances of fraud, if any, within the Company will be detected. Further, the design of a controls system must reflect the fact that there are resource constraints, and the benefits of controls must be considered relative to their costs. The Company intends to continually improve and refine its internal controls.
Under the supervision and with the participation of our management, including our principal executive officer and principal financial officer, we conducted an evaluation of the effectiveness of the design and operations of our internal control over financial reporting as of December 31, 20102013 based on criteria established in the 1992 Internal Control—Integrated Framework issued by the Committee of Sponsoring Organizations of the Treadway Commission.Commission (COSO). Based on this evaluation, management’s assessment is that RPC, Inc. maintained effective internal control over financial reporting as of December 31, 2010.2013.
The independent registered public accounting firm, Grant Thornton LLP, has audited the consolidated financial statements as of and for the year ended December 31, 2010,2013, and has also issued their report on the effectiveness of the Company’s internal control over financial reporting, included in this report on page 31.30.
| | | |
| /s/ Richard A. Hubbell | | /s/ Ben M. Palmer |
Richard A. Hubbell President and Chief Executive Officer | | Ben M. Palmer Chief Financial Officer and Treasurer |
Atlanta, Georgia
March 4, 2011February 28, 2014
Report of Independent Registered Public Accounting Firm on Internal Control Over Financial Reporting
Board of Directors and StockholdersShareholders
RPC, Inc.
We have audited RPC, Inc. (a Delaware Corporation) and subsidiaries’ (the “Company”)the internal control over financial reporting of RPC, Inc. (a Delaware corporation) and subsidiaries (the “Company”) as of December 31, 2010,2013, based on criteria established in the 1992 Internal Control—Integrated Framework issued by the Committee of Sponsoring Organizations of the Treadway Commission (COSO). The Company’s management is responsible for maintaining effective internal control over financial reporting and for its assessment of the effectiveness of internal control over financial reporting, included in the accompanying Management’s Report on Internal Control Overover Financial Reporting. Our responsibility is to express an opinion on the Company’s internal control over financial reporting based on our audit.
We conducted our audit in accordance with the standards of the Public Company Accounting Oversight Board (United States). Those standards require that we plan and perform the audit to obtain reasonable assurance about whether effective internal control over financial reporting was maintained in all material respects. Our audit included obtaining an understanding of internal control over financial reporting, assessing the risk that a material weakness exists, testing and evaluating the design and operating effectiveness of internal control based on the assessed risk, and performing such other procedures as we considered necessary in the circumstances. We believe that our audit provides a reasonable basis for our opinion.
A company’s internal control over financial reporting is a process designed to provide reasonable assurance regarding the reliability of financial reporting and the preparation of financial statements for external purposes in accordance with generally accepted accounting principles. A company’s internal control over financial reporting includes those policies and procedures that (1) pertain to the maintenance of records that, in reasonable detail, accurately and fairly reflect the transactions and dispositions of the assets of the company; (2) provide reasonable assurance that transactions are recorded as necessary to permit preparation of financial statements in accordance with generally accepted accounting principles, and that receipts and expenditures of the company are being made only in accordance with authorizations of management and directors of the company; and (3) provide reasonable assurance regarding prevention or timely detection of unauthorized acquisition, use, or disposition of the company’s assets that could have a material effect on the financial statements.
Because of its inherent limitations, internal control over financial reporting may not prevent or detect misstatements. Also, projections of any evaluation of effectiveness to future periods are subject to the risk that controls may become inadequate because of changes in conditions, or that the degree of compliance with the policies or procedures may deteriorate.
In our opinion, the Company maintained, in all material respects, effective internal control over financial reporting as of December 31, 2010,2013, based on criteria established in the 1992 Internal Control—Integrated Framework issued by COSO.
We also have audited, in accordance with the standards of the Public Company Accounting Oversight Board (United States), the consolidated balance sheetsfinancial statements of the Company as of December 31, 2010 and 2009, andfor the related consolidated statements of operations, stockholders’ equity, and cash flows for each of the three years in the periodyear ended December 31, 20102013, and our report dated March 4, 2011February 28, 2014 expressed an unqualified opinion on those consolidated financial statements.statements
/s/ Grant ThorntonS/ GRANT THORNTON LLP
Atlanta, Georgia
March 4, 2011
February 28, 2014
Report of Independent Registered Public Accounting Firm on Consolidated Financial Statements
Board of Directors and StockholdersShareholders
RPC, Inc.
We have audited the accompanying consolidated balance sheets of RPC, Inc. (a Delaware corporation) and subsidiaries (the “Company”) as of December 31, 20102013 and 2009,2012, and the related consolidated statements of operations, comprehensive income, stockholders’ equity, and cash flows for each of the three years in the period ended December 31, 2010.2013. Our audits of the basic consolidated financial statements included the financial statement schedule listed in the index appearing under Item 15.15(2). These financial statements and financial statement schedule are the responsibility of the Company’s management. Our responsibility is to express an opinion on these financial statements and financial statement schedule based on our audits.
We conducted our audits in accordance with the standards of the Public Company Accounting Oversight Board (United States). Those standards require that we plan and perform the audit to obtain reasonable assurance about whether the financial statements are free of material misstatement. An audit includes examining, on a test basis, evidence supporting the amounts and disclosures in the financial statements. An audit also includes assessing the accounting principles used and significant estimates made by management, as well as evaluating the overall financial statement presentation. We believe that our audits provide a reasonable basis for our opinion.
In our opinion, the consolidated financial statements referred to above present fairly, in all material respects, the financial position of the CompanyRPC, Inc. and subsidiaries as of December 31, 20102013 and 2009,2012, and the results of itstheir operations and itstheir cash flows for each of the three years in the period ended December 31, 20102013 in conformity with accounting principles generally accepted in the United States of America. Also in our opinion, the related financial statement schedule, when considered in relation to the basic consolidated financial statements taken as a whole, presents fairly, in all material respects, the information set forth therein.
We also have audited, in accordance with the standards of the Public Company Accounting Oversight Board (United States), the Company’s internal control over financial reporting as of December 31, 2010,2013, based on criteria established in the 1992 Internal Control—Integrated Framework issued by the Committee of Sponsoring Organizations of the Treadway Commission (COSO), and our report dated March 4, 2011February 28, 2014 expressed an unqualified opinion thereon.thereon..
/s/ Grant ThorntonS/ GRANT THORNTON LLP
Atlanta, Georgia
March 4, 2011February 28, 2014
Item 8. Financial Statements and Supplementary Data
CONSOLIDATED BALANCE SHEETS
RPC, INC. AND SUBSIDIARIES
(in thousands except share information)
| | | | | | | |
| December 31, | | 2010 | | | 2009 | | 2013 | | | 2012 | |
| ASSETS | ASSETS | | ASSETS | |
| Cash and cash equivalents | | $ | 9,035 | | | $ | 4,489 | | | $ | 8,700 | | | $ | 14,163 | |
| Accounts receivable, net | | | 294,002 | | | | 130,619 | | | | 437,132 | | | | 387,530 | |
| Inventories | | | 64,059 | | | | 55,783 | | | | 126,604 | | | | 140,867 | |
| Deferred income taxes | | | 7,426 | | | | 4,894 | | | | 14,185 | | | | 5,777 | |
| Income taxes receivable | | | 17,251 | | | | 18,184 | | | | 5,720 | | | | 4,234 | |
| Prepaid expenses and other current assets | | | 6,905 | | | | 5,485 | | |
| Prepaid expenses | | | | 9,143 | | | | 10,762 | |
| Other current assets | | | | 3,441 | | | | 4,494 | |
| Current assets | | | 398,678 | | | | 219,454 | | | | 604,925 | | | | 567,827 | |
| Property, plant and equipment, net | | | 453,017 | | | | 396,222 | | | | 726,307 | | | | 756,326 | |
| Goodwill | | | 24,093 | | | | 24,093 | | | | 31,861 | | | | 24,093 | |
| Other assets | | | 12,083 | | | | 9,274 | | | | 20,767 | | | | 18,917 | |
| Total assets | | $ | 887,871 | | | $ | 649,043 | | | $ | 1,383,860 | | | $ | 1,367,163 | |
| LIABILITIES AND STOCKHOLDERS’ EQUITY | | | | | | | | | | | | | | | | |
| LIABILITIES | | | | | | | | | | | | | | | | |
| Accounts payable | | $ | 78,743 | | | $ | 49,882 | | | $ | 119,170 | | | $ | 109,846 | |
| Accrued payroll and related expenses | | | 23,881 | | | | 10,708 | | | | 36,638 | | | | 32,053 | |
| Accrued insurance expenses | | | 5,141 | | | | 4,315 | | | | 6,072 | | | | 6,152 | |
| Accrued state, local and other taxes | | | 2,988 | | | | 2,001 | | | | 5,002 | | | | 7,326 | |
| Income taxes payable | | | 5,788 | | | | 647 | | | | — | | | | 6,428 | |
| Other accrued expenses | | | 963 | | | | 220 | | | | 1,170 | | | | 2,706 | |
| Current liabilities | | | 117,504 | | | | 67,773 | | | | 168,052 | | | | 164,511 | |
| Long-term accrued insurance expenses | | | 8,489 | | | | 8,597 | | | | 10,225 | | | | 10,400 | |
| Notes payable to banks | | | 121,250 | | | | 90,300 | | | | 53,300 | | | | 107,000 | |
| Long-term pension liabilities | | | 18,397 | | | | 14,647 | | | | 21,966 | | | | 26,543 | |
| Deferred income taxes | | | | 153,176 | | | | 155,007 | |
| Other long-term liabilities | | | 2,448 | | | | 1,838 | | | | 8,439 | | | | 4,470 | |
| Deferred income taxes | | | 80,888 | | | | 56,165 | | |
| Total liabilities | | | 348,976 | | | | 239,320 | | | | 415,158 | | | | 467,931 | |
| Commitments and contingencies | | | | | | | | | |
| Commitments and contingencies (Note 9) | | | | | | | | | |
| STOCKHOLDERS’ EQUITY | | | | | | | | | | | | | | | | |
| Preferred stock, $0.10 par value, 1,000,000 shares authorized, none issued | | | - | | | | - | | | | — | | | | — | |
| Common stock, $0.10 par value, 159,000,000 shares authorized, 148,175,995 and 147,547,004 shares issued and outstanding in 2010 and 2009, respectively | | | 14,818 | | | | 14,754 | | |
| Common stock, $0.10 par value, 349,000,000 shares authorized, 218,985,816 and 220,144,287 shares issued and outstanding in 2013 and 2012, respectively | | | | 21,899 | | | | 22,014 | |
| Capital in excess of par value | | | 6,460 | | | | 2,720 | | | | — | | | | — | |
| Retained earnings | | | 527,150 | | | | 401,055 | | | | 956,918 | | | | 891,464 | |
| Accumulated other comprehensive loss | | | (9,533 | ) | | | (8,806 | ) | | | (10,115 | ) | | | (14,246 | ) |
| Total stockholders’ equity | | | 538,895 | | | | 409,723 | | | | 968,702 | | | | 899,232 | |
| Total liabilities and stockholders’ equity | | $ | 887,871 | | | $ | 649,043 | | | $ | 1,383,860 | | | $ | 1,367,163 | |
The accompanying notes are an integral part of these statements.
CONSOLIDATED STATEMENTS OF OPERATIONS
RPC, INC. AND SUBSIDIARIES
(in thousands except per share data)
| | | | | | | | | | | | | |
Years ended December 31, | | 2013 | | | 2012 | | | 2011 | |
| REVENUES | | $ | 1,861,489 | | | $ | 1,945,023 | | | $ | 1,809,807 | |
| COSTS AND EXPENSES: | | | | | | | | | | | | |
| Cost of revenues (exclusive of items shown separately below) | | | 1,178,412 | | | | 1,105,886 | | | | 992,704 | |
| Selling, general and administrative expenses | | | 185,165 | | | | 175,749 | | | | 151,286 | |
| Depreciation and amortization | | | 213,128 | | | | 214,899 | | | | 179,905 | |
| Loss on disposition of assets, net | | | 9,371 | | | | 6,099 | | | | 3,831 | |
| Operating profit | | | 275,413 | | | | 442,390 | | | | 482,081 | |
| Interest expense | | | (1,822 | ) | | | (1,976 | ) | | | (3,453 | ) |
| Interest income | | | 419 | | | | 30 | | | | 18 | |
| Other income, net | | | 2,260 | | | | 2,175 | | | | 169 | |
| Income before income taxes | | | 276,270 | | | | 442,619 | | | | 478,815 | |
| Income tax provision | | | 109,375 | | | | 168,183 | | | | 182,434 | |
| Net income | | $ | 166,895 | | | $ | 274,436 | | | $ | 296,381 | |
EARNINGS PER SHARE | | | | | | | | | | | | |
| Basic | | $ | 0.77 | | | $ | 1.28 | | | $ | 1.36 | |
| Diluted | | $ | 0.77 | | | $ | 1.27 | | | $ | 1.35 | |
Dividends paid per share | | $ | 0.40 | | | $ | 0.52 | | | $ | 0.21 | |
| Years ended December 31, | | 2010 | | | 2009 | | | 2008 | |
| REVENUES | | $ | 1,096,384 | | | $ | 587,863 | | | $ | 876,977 | |
| COSTS AND EXPENSES: | | | | | | | | | | | | |
| Cost of revenues | | | 606,098 | | | | 393,806 | | | | 503,631 | |
| Selling, general and administrative expenses | | | 121,839 | | | | 97,672 | | | | 117,140 | |
| Depreciation and amortization | | | 133,360 | | | | 130,580 | | | | 118,403 | |
| Gain on disposition of assets, net | | | (3,758 | ) | | | (1,143 | ) | | | (6,367 | ) |
| Operating profit (loss) | | | 238,845 | | | | (33,052 | ) | | | 144,170 | |
| Interest expense | | | (2,662 | ) | | | (2,176 | ) | | | (5,282 | ) |
| Interest income | | | 46 | | | | 147 | | | | 73 | |
| Other income (expense), net | | | 1,303 | | | | 1,582 | | | | (1,176 | ) |
| Income (loss) before income taxes | | | 237,532 | | | | (33,499 | ) | | | 137,785 | |
| Income tax provision (benefit) | | | 90,790 | | | | (10,754 | ) | | | 54,382 | |
| Net income (loss) | | $ | 146,742 | | | $ | (22,745 | ) | | $ | 83,403 | |
| EARNINGS (LOSS) PER SHARE | | | | | | | | | | | | |
| Basic | | $ | 1.01 | | | $ | (0.16 | ) | | $ | 0.57 | |
| Diluted | | $ | 1.00 | | | $ | (0.16 | ) | | $ | 0.57 | |
| Dividends paid per share | | $ | 0.141 | | | $ | 0.148 | | | $ | 0.160 | |
The accompanying notes are an integral part of these statements.
CONSOLIDATED STATEMENTS OF STOCKHOLDERS’ EQUITYCOMPREHENSIVE INCOME
RPC, INC. AND SUBSIDIARIES
(in thousands)thousands except per share data)
| | | | | | | | | | | | | | | | | | Accumulated Other Comprehensive Income (Loss) | | | | |
| | | Comprehensive Income (Loss) | | | | | | | | | Capital in Excess of Par Value | | | | | | | | | |
| Three Years Ended December 31, 2010 | | | | Common Stock | | | | | Retained Earnings | | | | | | |
| | | | Shares | | | Amount | | | | | | | | | Total | |
| Balance, December 31, 2007 | | | | | | 98,040 | | | $ | 9,804 | | | $ | 16,728 | | | $ | 385,281 | | | $ | (2,541 | ) | | $ | 409,272 | |
| Stock issued for stock incentive plans, net | | | | | | 1,288 | | | | 128 | | | | 5,654 | | | | — | | | | — | | | | 5,782 | |
| Stock purchased and retired | | | | | | (1,623 | ) | | | (162 | ) | | | (19,238 | ) | | | — | | | | — | | | | (19,400 | ) |
| Net income | | $ | 83,403 | | | | — | | | | — | | | | — | | | | 83,403 | | | | — | | | | 83,403 | |
| Pension adjustment, net of taxes | | | (6,053 | ) | | | — | | | | — | | | | — | | | | — | | | | (6,053 | ) | | | (6,053 | ) |
| Loss on cash flow hedge, net of taxes | | | (527 | ) | | | — | | | | — | | | | — | | | | — | | | | (527 | ) | | | (527 | ) |
| Unrealized loss on securities, net of taxes | | | (585 | ) | | | — | | | | — | | | | — | | | | — | | | | (585 | ) | | | (585 | ) |
| Foreign currency translation, net of taxes | | | (326 | ) | | | — | | | | — | | | | — | | | | — | | | | (326 | ) | | | (326 | ) |
| Comprehensive income | | $ | 75,912 | | | | | | | | | | | | | | | | | | | | | | | | | |
| Dividends declared | | | | | | | — | | | | — | | | | — | | | | (23,328 | ) | | | — | | | | (23,328 | ) |
| Excess tax benefits for share-based payments | | | | | | | — | | | | — | | | | 846 | | | | — | | | | — | | | | 846 | |
| Three-for-two stock split | | | | | | | 48,853 | | | | 4,885 | | | | (4,885 | ) | | | | | | | | | | | — | |
| Balance, December 31, 2008 | | | | | | | 146,558 | | | | 14,655 | | | | (895 | ) | | | 445,356 | | | | (10,032 | ) | | | 449,084 | |
| Stock issued for stock incentive plans, net | | | | | | | 911 | | | | 91 | | | | 4,323 | | | | — | | | | — | | | | 4,414 | |
| Stock purchased and retired | | | | | | | (252 | ) | | | (25 | ) | | | (2,096 | ) | | | — | | | | — | | | | (2,121 | ) |
| Net loss | | $ | (22,745 | ) | | | — | | | | — | | | | — | | | | (22,745 | ) | | | — | | | | (22,745 | ) |
| Pension adjustment, net of taxes | | | 897 | | | | — | | | | — | | | | — | | | | — | | | | 897 | | | | 897 | |
| Gain on cash flow hedge, net of taxes | | | 7 | | | | — | | | | — | | | | — | | | | — | | | | 7 | | | | 7 | |
| Unrealized gain on securities, net of taxes | | | 91 | | | | — | | | | — | | | | — | | | | — | | | | 91 | | | | 91 | |
| Foreign currency translation, net of taxes | | | 231 | | | | — | | | | — | | | | — | | | | — | | | | 231 | | | | 231 | |
| Comprehensive loss | | $ | (21,519 | ) | | | | | | | | | | | | | | | | | | | | | | | | |
| Dividends declared | | | | | | | — | | | | — | | | | — | | | | (21,556 | ) | | | — | | | | (21,556 | ) |
| Excess tax benefits for share-based payments | | | | | | | — | | | | — | | | | 1,421 | | | | — | | | | — | | | | 1,421 | |
| Three-for-two stock split | | | | | | | 330 | | | | 33 | | | | (33 | ) | | | | | | | | | | | — | |
| Balance, December 31, 2009 | | | | | | | 147,547 | | | $ | 14,754 | | | $ | 2,720 | | | $ | 401,055 | | | $ | (8,806 | ) | | $ | 409,723 | |
| Stock issued for stock incentive plans, net | | | | | | | 587 | | | | 59 | | | | 4,889 | | | | — | | | | — | | | | 4,948 | |
| Stock purchased and retired | | | | | | | (144 | ) | | | (14 | ) | | | (1,781 | ) | | | — | | | | — | | | | (1,795 | ) |
| Net income | | $ | 146,742 | | | | — | | | | — | | | | — | | | | 146,742 | | | | — | | | | 146,742 | |
| Pension adjustment, net of taxes | | | (1,350 | ) | | | — | | | | — | | | | — | | | | — | | | | (1,350 | ) | | | (1,350 | ) |
| Gain on cash flow hedge, net of taxes | | | 133 | | | | — | | | | — | | | | — | | | | — | | | | 133 | | | | 133 | |
| Unrealized gain on securities, net of taxes | | | 281 | | | | — | | | | — | | | | — | | | | — | | | | 281 | | | | 281 | |
| Foreign currency translation, net of taxes | | | 209 | | | | — | | | | — | | | | — | | | | — | | | | 209 | | | | 209 | |
| Comprehensive income | | $ | 146,015 | | | | | | | | | | | | | | | | | | | | | | | | | |
| Dividends declared | | | | | | | — | | | | — | | | | — | | | | (20,647 | ) | | | — | | | | (20,647 | ) |
| Excess tax benefits for share-based payments | | | | | | | — | | | | — | | | | 651 | | | | — | | | | — | | | | 651 | |
| Three-for-two stock split | | | | | | | 186 | | | | 19 | | | | (19 | ) | | | | | | | | | | | — | |
| Balance, December 31, 2010 | | | | | | | 148,176 | | | $ | 14,818 | | | $ | 6,460 | | | $ | 527,150 | | | $ | (9,533 | ) | | $ | 538,895 | |
| | | | | | | | | | | | | |
Years ended December 31, | | 2013 | | | 2012 | | | 2011 | |
| NET INCOME | | $ | 166,895 | | | $ | 274,436 | | | $ | 296,381 | |
| OTHER COMPREHENSIVE INCOME, NET OF TAXES: | | | | | | | | | | | | |
| Pension adjustment | | | 4,928 | | | | (1,707 | ) | | | (3,048 | ) |
| Cash flow hedge | | | — | | | | — | | | | 387 | |
| Foreign currency translation | | | (778 | ) | | | 265 | | | | (138 | ) |
| Unrealized loss on securities and reclassification adjustments | | | (19 | ) | | | (158 | ) | | | (314 | ) |
| COMPREHENSIVE INCOME | | $ | 171,026 | | | $ | 272,836 | | | $ | 293,268 | |
The accompanying notes are an integral part of these statements.
CONSOLIDATED STATEMENTS OF CASH FLOWSSTOCKHOLDERS’ EQUITY
RPC, Inc. and SubsidiariesINC. AND SUBSIDIARIES
(in thousands)
| Years ended December 31, | | 2010 | | | 2009 | | | 2008 | |
| OPERATING ACTIVITIES | | | | | | | | | |
| Net income (loss) | | $ | 146,742 | | | $ | (22,745 | ) | | $ | 83,403 | |
| Adjustments to reconcile net income (loss) to net cash provided by operating activities: | | | | | | | | | | | | |
| Depreciation, amortization and other non-cash charges | | | 133,253 | | | | 130,581 | | | | 118,444 | |
| Stock-based compensation expense | | | 4,909 | | | | 4,440 | | | | 3,732 | |
| Gain on disposition of assets, net | | | (3,758 | ) | | | (1,143 | ) | | | (6,367 | ) |
| Deferred income tax provision | | | 22,262 | | | | 1,669 | | | | 27,199 | |
| Excess tax benefits for share-based payments | | | (651 | ) | | | (1,421 | ) | | | (846 | ) |
| Changes in current assets and liabilities: | | | | | | | | | | | | |
| Accounts receivable | | | (163,162 | ) | | | 80,035 | | | | (34,508 | ) |
| Income taxes receivable | | | 1,584 | | | | (1,159 | ) | | | (2,462 | ) |
| Inventories | | | (8,130 | ) | | | (5,798 | ) | | | (20,377 | ) |
| Prepaid expenses and other current assets | | | (852 | ) | | | 2,575 | | | | (2,231 | ) |
| Accounts payable | | | 14,191 | | | | (5,711 | ) | | | 9,691 | |
| Income taxes payable | | | 5,141 | | | | (2,712 | ) | | | (981 | ) |
| Accrued payroll and related expenses | | | 13,173 | | | | (9,690 | ) | | | 2,426 | |
| Accrued insurance expenses | | | 826 | | | | (325 | ) | | | (113 | ) |
| Accrued state, local and other taxes | | | 987 | | | | (394 | ) | | | 676 | |
| Other accrued expenses | | | 112 | | | | (167 | ) | | | (203 | ) |
| Changes in working capital | | | (136,130 | ) | | | 56,654 | | | | (48,082 | ) |
| Changes in other assets and liabilities: | | | | | | | | | | | | |
| Pension liabilities | | | 1,628 | | | | 4,882 | | | | (481 | ) |
| Accrued insurance expenses | | | (108 | ) | | | 199 | | | | 232 | |
| Other non-current assets | | | (920 | ) | | | (2,597 | ) | | | (20 | ) |
| Other non-current liabilities | | | 1,430 | | | | (1,779 | ) | | | 106 | |
| Net cash provided by operating activities | | | 168,657 | | | | 168,740 | | | | 177,320 | |
| INVESTING ACTIVITIES | | | | | | | | | | | | |
| Capital expenditures | | | (187,486 | ) | | | (67,830 | ) | | | (170,318 | ) |
| Proceeds from sale of assets | | | 15,717 | | | | 6,686 | | | | 11,365 | |
| Net cash used for investing activities | | | (171,769 | ) | | | (61,144 | ) | | | (158,953 | ) |
| FINANCING ACTIVITIES | | | | | | | | | | | | |
| Payment of dividends | | | (20,647 | ) | | | (21,556 | ) | | | (23,328 | ) |
| Borrowings from notes payable to banks | | | 516,600 | | | | 276,100 | | | | 392,300 | |
| Repayments of notes payable to banks | | | (485,650 | ) | | | (360,250 | ) | | | (374,250 | ) |
| Debt issue costs for notes payable to banks | | | (1,886 | ) | | | (234 | ) | | | (94 | ) |
| Excess tax benefits for share-based payments | | | 651 | | | | 1,421 | | | | 846 | |
| Cash paid for common stock purchased and retired | | | (1,650 | ) | | | (1,747 | ) | | | (17,489 | ) |
| Proceeds received upon exercise of stock options | | | 240 | | | | 122 | | | | 347 | |
| Net cash provided by (used for) financing activities | | | 7,658 | | | | (106,144 | ) | | | (21,668 | ) |
| Net increase (decrease) in cash and cash equivalents | | | 4,546 | | | | 1,452 | | | | (3,301 | ) |
| Cash and cash equivalents at beginning of year | | | 4,489 | | | | 3,037 | | | | 6,338 | |
| Cash and cash equivalents at end of year | | $ | 9,035 | | | $ | 4,489 | | | $ | 3,037 | |
Three Years Ended
December 31, 2013 | | Common Stock | | | Capital in
Excess of
Par Value | | | Retained
Earnings | | | Accumulated
Other
Comprehensive
Income (Loss) | | | Total | |
Shares | | | Amount |
| Balance, December 31, 2010 | | | 222,264 | | | $ | 22,227 | | | $ | — | | | $ | 526,201 | | | $ | (9,533 | ) | | $ | 538,895 | |
| Stock issued for stock incentive plans, net | | | 1,218 | | | | 122 | | | | 9,455 | | | | — | | | | — | | | | 9,577 | |
| Stock purchased and retired | | | (1,936 | ) | | | (194 | ) | | | (12,862 | ) | | | (22,136 | ) | | | — | | | | (35,192 | ) |
| Net income | | | — | | | | — | | | | — | | | | 296,381 | | | | — | | | | 296,381 | |
| Pension adjustment, net of taxes | | | — | | | | — | | | | — | | | | — | | | | (3,048 | ) | | | (3,048 | ) |
| Gain on cash flow hedge, net of taxes | | | — | | | | — | | | | — | | | | — | | | | 387 | | | | 387 | |
| Foreign currency translation, net of taxes | | | — | | | | — | | | | — | | | | — | | | | (138 | ) | | | (138 | ) |
| Unrealized gain on securities, net of taxes | | | — | | | | — | | | | — | | | | — | | | | (314 | ) | | | (314 | ) |
| Dividends declared | | | — | | | | — | | | | — | | | | (47,327 | ) | | | — | | | | (47,327 | ) |
| Excess tax benefits for share-based payments | | | — | | | | — | | | | 3,371 | | | | — | | | | — | | | | 3,371 | |
| Three-for-two stock split | | | (358 | ) | | | (36 | ) | | | 36 | | | | | | | | | | | | — | |
| Balance, December 31, 2011 | | | 221,188 | | | | 22,119 | | | | — | | | | 753,119 | | | | (12,646 | ) | | | 762,592 | |
| Stock issued for stock incentive plans and other, net | | | 1,530 | | | | 152 | | | | 11,105 | | | | — | | | | — | | | | 11,257 | |
| Stock purchased and retired | | | (2,011 | ) | | | (201 | ) | | | (13,885 | ) | | | (16,515 | ) | | | — | | | | (30,601 | ) |
| Increased ownership interest in subsidiary, net of taxes | | | — | | | | — | | | | — | | | | (5,507 | ) | | | — | | | | (5,507 | ) |
| Net income | | | — | | | | — | | | | — | | | | 274,436 | | | | — | | | | 274,436 | |
| Pension adjustment, net of taxes | | | — | | | | — | | | | — | | | | — | | | | (1,707 | ) | | | (1,707 | ) |
| Foreign currency translation, net of taxes | | | — | | | | — | | | | — | | | | — | | | | 265 | | | | 265 | |
| Unrealized loss on securities, net of taxes | | | — | | | | — | | | | — | | | | — | | | | (158 | ) | | | (158 | ) |
| Dividends declared | | | — | | | | — | | | | — | | | | (114,069 | ) | | | — | | | | (114,069 | ) |
| Excess tax benefits for share-based payments | | | — | | | | — | | | | 2,724 | | | | — | | | | — | | | | 2,724 | |
| Three-for-two stock split | | | (563 | ) | | | (56 | ) | | | 56 | | | | | | | | | | | | — | |
| Balance, December 31, 2012 | | | 220,144 | | | | 22,014 | | | | — | | | | 891,464 | | | | (14,246 | ) | | | 899,232 | |
| Stock issued for stock incentive plans and other, net | | | 699 | | | | 70 | | | | 8,107 | | | | — | | | | — | | | | 8,177 | |
| Stock purchased and retired | | | (1,857 | ) | | | (185 | ) | | | (11,285 | ) | | | (13,652 | ) | | | — | | | | (25,122 | ) |
| Net income | | | — | | | | — | | | | — | | | | 166,895 | | | | — | | | | 166,895 | |
| Pension adjustment, net of taxes | | | — | | | | — | | | | — | | | | — | | | | 4,928 | | | | 4,928 | |
| Foreign currency translation, net of taxes | | | — | | | | — | | | | — | | | | — | | | | (778 | ) | | | (778 | ) |
| Unrealized loss on securities, net of taxes | | | — | | | | — | | | | — | | | | — | | | | (19 | ) | | | (19 | ) |
| Dividends declared | | | — | | | | — | | | | — | | | | (87,789 | ) | | | — | | | | (87,789 | ) |
| Excess tax benefits for share-based payments | | | — | | | | — | | | | 3,178 | | | | — | | | | — | | | | 3,178 | |
| Balance, December 31, 2013 | | | 218,986 | | | $ | 21,899 | | | $ | — | | | $ | 956,918 | | | $ | (10,115 | ) | | $ | 968,702 | |
The accompanying notes are an integral part of these statements.
NOTES TO CONSOLIDATED FINANCIAL STATEMENTS OF CASH FLOWS
RPC, Inc. and Subsidiaries
Years ended December 31, 2010, 2009 and 2008(in thousands)
| | | | | | | | | | |
Years ended December 31, | | 2013 | | | 2012 | | | 2011 | |
OPERATING ACTIVITIES | | | | | | | | | |
| Net income | | $ | 166,895 | | | $ | 274,436 | | | $ | 296,381 | |
| Adjustments to reconcile net income to net cash provided by operating activities: | | | | | | | | | | | | |
| Depreciation, amortization and other non-cash charges | | | 215,812 | | | | 214,153 | | | | 179,787 | |
| Stock-based compensation expense | | | 8,177 | | | | 7,860 | | | | 8,075 | |
| Loss on disposition of assets, net | | | 9,371 | | | | 6,099 | | | | 3,831 | |
| Deferred income tax (benefit) provision | | | (13,060 | ) | | | 4,821 | | | | 77,074 | |
| Excess tax benefits for share-based payments | | | (3,178 | ) | | | (2,724 | ) | | | (3,371 | ) |
| (Increase) decrease in assets: | | | | | | | | | | | | |
| Accounts receivable | | | (49,959 | ) | | | 73,809 | | | | (167,312 | ) |
| Income taxes receivable | | | 1,692 | | | | 9,295 | | | | 9,817 | |
| Inventories | | | 14,078 | | | | (40,354 | ) | | | (36,511 | ) |
| Prepaid expenses | | | 1,519 | | | | (2,284 | ) | | | (2,783 | ) |
| Other current assets | | | 1,114 | | | | 26,189 | | | | (30,524 | ) |
| Other non-current assets | | | (1,881 | ) | | | (6,415 | ) | | | 294 | |
| (Increase) decrease in liabilities: | | | | | | | | | | | | |
| Accounts payable | | | 14,062 | | | | (4,929 | ) | | | 30,102 | |
| Income taxes payable | | | (6,428 | ) | | | (4,277 | ) | | | 4,917 | |
| Accrued payroll and related expenses | | | 4,585 | | | | (1,627 | ) | | | 9,799 | |
| Accrued insurance expenses | | | (80 | ) | | | 408 | | | | 603 | |
| Accrued state, local and other taxes | | | (2,324 | ) | | | 2,260 | | | | 2,078 | |
| Other accrued expenses | | | (1,548 | ) | | | 1,412 | | | | 958 | |
| Pension liabilities | | | 3,183 | | | | (589 | ) | | | 1,249 | |
| Long-term accrued insurance expenses | | | (175 | ) | | | 1,400 | | | | 511 | |
| Other long-term liabilities | | | 3,769 | | | | 990 | | | | 1,032 | |
| Net cash provided by operating activities | | | 365,624 | | | | 559,933 | | | | 386,007 | |
INVESTING ACTIVITIES | | | | | | | | | | | | |
| Capital expenditures | | | (201,681 | ) | | | (328,936 | ) | | | (416,400 | ) |
| Increased ownership interest in subsidiary | | | — | | | | (6,211 | ) | | | — | |
| Proceeds from sale of assets | | | 11,071 | | | | 19,309 | | | | 24,763 | |
| Purchase of business | | | (17,044 | ) | | | — | | | | — | |
| Net cash used for investing activities | | | (207,654 | ) | | | (315,838 | ) | | | (391,637 | ) |
FINANCING ACTIVITIES | | | | | | | | | | | | |
| Payment of dividends | | | (87,789 | ) | | | (114,069 | ) | | | (47,327 | ) |
| Borrowings from notes payable to banks | | | 686,700 | | | | 844,050 | | | | 940,850 | |
| Repayments of notes payable to banks | | | (740,400 | ) | | | (940,350 | ) | | | (858,800 | ) |
| Debt issue costs for notes payable to banks | | | — | | | | — | | | | (415 | ) |
| Excess tax benefits for share-based payments | | | 3,178 | | | | 2,724 | | | | 3,371 | |
| Cash paid for common stock purchased and retired | | | (25,122 | ) | | | (30,224 | ) | | | (34,419 | ) |
| Proceeds received upon exercise of stock options | | | — | | | | 544 | | | | 728 | |
| Net cash (used for) provided by financing activities | | | (163,433 | ) | | | (237,325 | ) | | | 3,988 | |
| Net (decrease) increase in cash and cash equivalents | | | (5,463 | ) | | | 6,770 | | | | (1,642 | ) |
| Cash and cash equivalents at beginning of year | | | 14,163 | | | | 7,393 | | | | 9,035 | |
| Cash and cash equivalents at end of year | | $ | 8,700 | | | $ | 14,163 | | | $ | 7,393 | |
The accompanying notes are an integral part of these statements.
Note 1: Significant Accounting Policies
Principles of Consolidation and Basis of Presentation
The consolidated financial statements include the accounts of RPC, Inc. and its wholly-owned subsidiaries (“RPC” or the “Company”). All significant intercompany accounts and transactions have been eliminated.
Nature of Operations
RPC provides a broad range of specialized oilfield services and equipment primarily to independent and major oil and gas companies engaged in the exploration, production and development of oil and gas properties throughout the United States, including the southwest, mid-continent, Gulf of Mexico, mid-continent, southwest, northeastRocky Mountain and Rocky MountainAppalachian regions, and in selected international markets. The services and equipment provided include Technical Services such as pressure pumping services, coiled tubing services, snubbing services (also referred to as hydraulic workover services), nitrogen services, and firefighting and well control, and Support Services such as the rental of drill pipe and other specialized oilfield equipment and oilfield training.
Common Stock
RPC is authorized to issue 159,000,000349,000,000 shares of common stock, $0.10 par value. Holders of common stock are entitled to receive dividends when, as, and if declared by the Board of Directors out of legally available funds. Each share of common stock is entitled to one vote on all matters submitted to a vote of stockholders. Holders of common stock do not have cumulative voting rights. In the event of any liquidation, dissolution or winding up of the Company, holders of common stock are entitled to ratable distribution of the remaining assets available for distribution to stockholders.
Preferred Stock
RPC is authorized to issue up to 1,000,000 shares of preferred stock, $0.10 par value. As of December 31, 2010,2013, there were no shares of preferred stock issued. The Board of Directors is authorized, subject to any limitations prescribed by law, to provide for the issuance of preferred stock as a class without series or, if so determined from time to time, in one or more series, and by filing a certificate pursuant to the applicable laws of the state of Delaware and to fix the designations, powers, preferences and rights, exchangeability for shares of any other class or classes of stock. Any preferred stock to be issued could rank prior to the common stock with respect to dividend rights and rights on liquidation.
Dividends
On January 26, 2011,28, 2014, the Board of Directors approved a $0.07$0.105 per share cash dividend payable March 10, 20112014 to stockholders of record at the close of business on February 10, 2011.2014.
Use of Estimates in the Preparation of Financial Statements
The preparation of financial statements in conformity with accounting principles generally accepted in the United States of America requires management to make estimates and assumptions that affect the reported amounts of assets and liabilities and disclosure of contingent assets and liabilities at the date of the financial statements and the reported amounts of revenues and expenses during the reporting period. Actual results could differ from those estimates.
Significant estimates are used in the determination of the allowance for doubtful accounts, income taxes, accrued insurance expenses, depreciable lives of assets, and pension liabilities.
Revenues
RPC’s revenues are generated principally from providing services and the related equipment. Revenues are recognized when the services are rendered and collectibility is reasonably assured. Revenues from services and equipment are based on fixed or determinable priced purchase orders or contracts with the customer and do not include the right of return. Rates for services and equipment are priced on a per day, per unit of measure, per man hour or similar basis. Sales tax charged to customers is presented on a net basis within the consolidated statement of operations and excluded from revenues.
NOTES TO CONSOLIDATED FINANCIAL STATEMENTS
RPC, Inc. and Subsidiaries
Years ended December 31, 2010, 2009 and 2008
Concentration of Credit Risk
Substantially all of the Company’s customers are engaged in the oil and gas industry. This concentration of customers may impact overall exposure to credit risk, either positively or negatively, in that customers may be similarly affected by changes in economic and industry conditions. The Company provided oilfield services to several hundred customers. One customer at, 15 percent, accounted for more than ten percent of the Company’s 2010 revenues. TwoIn 2013 and 2012, there were no customers individually accounted for 13 percent and 12 percent of the Company’s 2009 revenues. No customersthat accounted for more than 10 percent of 2008the Company’s revenues. In 2011, one of our customers accounted for approximately 12 percent of revenues. Additionally, oneno customer accounted for 15more than 10 percent of accounts receivable as of December 31, 20102013 and one customer accounted for 12 percent of accounts receivable as of December 31, 2009.2012.
Cash and Cash Equivalents
Highly liquid investments with original maturities of three months or less when acquired are considered to be cash equivalents. The Company maintains its cash in bank accounts which, at times, may exceed federally insured limits. RPC maintains cash equivalents and investments in one or more large financial institutions, and RPC’s policy restricts investment in any securities rated less than “investment grade” by national rating services.
Investments
Investments classified as available-for-sale securities are stated at their fair values, with the unrealized gains and losses, net of tax, reported as a separate component of stockholders’ equity. The cost of securities sold is based on the specific identification method. Realized gains and losses, declines in value judged to be other than temporary, interest, and dividends with respect to available-for-sale securities are included in interest income. The Company did not realize any gains or losses on securities during 2010, 20092013, 2012 or 20082011 on its available-for-sale securities. Securities that are held in the non-qualified Supplemental Executive Retirement Plan (“SERP”) are classified as trading. See Note 10 for further information regarding the SERP. The change in fair value of trading securities is presented in other income (expense) on the consolidated statements of operations.
Management determines the appropriate classification of investments at the time of purchase and re-evaluates such designations as of each balance sheet date.
Accounts Receivable
The majority of the Company’s accounts receivable areis due principally from major and independent oil and natural gas exploration and production companies. Credit is extended based on evaluation of a customer’s financial condition and, generally, collateral is not required. Accounts receivable are considered past due after 60 days and are stated at amounts due from customers, net of an allowance for doubtful accounts.
Allowance for Doubtful Accounts
Accounts receivable are carried at the amount owed by customers, reduced by an allowance for estimated amounts that may not be collectible in the future. The estimated allowance for doubtful accounts is based on an evaluation of industry trends, financial condition of customers, historical write-off experience, current economic conditions, and in the case of international customers, judgments about the economic and political environment of the related country and region. Accounts are written off against the allowance for doubtful accounts when the Company determines that amounts are uncollectible and recoveries of previously written-off accounts are recorded when collected.
Inventories
Inventories, which consist principally of (i) raw materials and supplies that are consumed providing services to the Company’s customers, (ii) spare parts for equipment used in providing these services and (iii) manufactured components and attachments for equipment used in providing services, are recorded at the lower of weighted average cost or market value. Cost is determined using first-in, first-out (“FIFO”) method or the weighted average cost method. Market value is determined based on replacement cost for materialmaterials and supplies. The Company regularly reviews inventory quantities on hand and records provisions for excess or obsolete inventory based primarily on its estimated forecast of product demand, market conditions, production requirements and technological developments.
NOTES TO CONSOLIDATED FINANCIAL STATEMENTS
RPC, Inc. and Subsidiaries
Years ended December 31, 2010, 2009 and 2008
Derivative Instruments and Hedging Activities
The Company is subject to interest rate risk on the variable component of the interest rate under our credit facility. Effective December 2008, the Company entered into a $50 million interest rate swap agreement. The agreement terminates on September 8, 2011. The Company has designated the interest rate swap as a cash flow hedge. Changes in the fair value of the effective portion of the interest rate swap arewere recognized in other comprehensive loss until the hedged item iswas recognized in earnings. This agreement terminated in September 2011.
Property, Plant and Equipment
Property, plant and equipment, including software costs, are reported at cost less accumulated depreciation and amortization, which is provided on a straight-line basis over the estimated useful lives of the assets. Annual depreciation and amortization expense isexpenses are computed using the following useful lives: operating equipment, 3 to 1020 years; buildings and leasehold improvements, 15 to 3039 years; furniture and fixtures, 5 to 7 years; software, 5 years; and vehicles, 3 to 5 years. The cost of assets retired or otherwise disposed of and the related accumulated depreciation and amortization are eliminated from the accounts in the year of disposal with the resulting gain or loss credited or charged to income from operations. Expenditures for additions, major renewals, and betterments are capitalized. Expenditures for restoring an identifiable asset to working condition or for maintaining the asset in good working order constitute repairs and maintenance and are expensed as incurred.
RPC records impairment losses on long-lived assets used in operations when events and circumstances indicate that the assets might be impaired and the undiscounted cash flows estimated to be generated by those assets are less than the carrying amount of those assets. The Company periodically reviews the values assigned to long-lived assets, such as property, plant and equipment and other assets, to determine if any impairments should be recognized. Management believes that the long-lived assets in the accompanying balance sheets have not been impaired.
Goodwill and Other Intangibles
Goodwill represents the excess of the purchase price over the fair value of net assets of businesses acquired. The carrying amount of goodwill was $31,861,000 at December 31, 2013 and $24,093,000 at December 31, 2010 and 2009.2012. During 2013, the Company completed an acquisition of assets of a business totaling $17,044,000 that included goodwill of $7,768,000. Goodwill is reviewed annually, or more frequently if events occur or circumstances change that would more likely than not reduce the fair value of the reporting unit below its carrying amount, for impairment. In reviewingThe Company completed a comprehensive qualitative assessment of the various factors that impact goodwill for impairment, potential impairmentand concluded it is measured by comparingmore likely than not that the estimated fair value of aits reporting unit with itsunits exceeds their carrying value.amounts on the annual test date. Therefore the Company did not proceed to Step 1 of the goodwill impairment test in 2013, 2012 and 2011. Based uponon the results of these analyses,qualitative assessment, the Company has concluded that no impairment of its goodwill has occurred for the years ended December 31, 2010, 20092013, 2012 and 2008.2011.
Other intangibles primarily represent non-compete agreements related to businesses acquired. Non-compete agreements are amortized on a straight-line basis over the period of the agreement, as this method best estimates the ratio that current revenues bear to the total of current and anticipated revenues. These non-compete agreements are fully amortized as of December 31, 2010 and 2009.
Advertising
Advertising expenses are charged to expense during the period in which they are incurred. Advertising expenses totaled $1,782,000$3,458,000 in 2010, $1,065,0002013, $2,965,000 in 20092012, and $1,957,000$2,406,000 in 2008.2011.
Insurance Expenses
RPC self insures, up to certain policy-specified limits, certain risks related to general liability, workers’ compensation, vehicle and equipment liability, and employee health insurance plan costs. The estimated cost of claims under these self-insurance programs is estimated and accrued as the claims are incurred (although actual settlement of the claims may not be made until future periods) and may subsequently be revised based on developments relating to such claims. The portion of these estimated outstanding claims expected to be paid more than one year in the future is classified as long-term accrued insurance expenses.
Income Taxes
Deferred tax liabilities and assets are determined based on the difference between the financial and tax bases of assets and liabilities using enacted tax rates in effect for the year in which the differences are expected to reverse. The Company establishes a valuation allowance against the carrying value of deferred tax assets when the Company determines that it is more likely than not that the asset will not be realized through future taxable income.
NOTES TO CONSOLIDATED FINANCIAL STATEMENTS
RPC, Inc. and Subsidiaries
Years ended December 31, 2010, 2009 and 2008
Defined Benefit Pension Plan
The Company has a defined benefit pension plan that provides monthly benefits upon retirement at age 65 to eligible employees with at least one year of service prior to 2002. In 2002, the Company’s Board of Directors approved a resolution to cease all future retirement benefit accruals under the defined benefit pension plan. See Note 10 for a full description of this plan and the related accounting and funding policies.
Share Repurchases
The Company records the cost of share repurchases in stockholders’ equity as a reduction to common stock to the extent of par value of the shares acquired and the remainder is allocated to capital in excess of par value.value and retained earnings if capital in excess of par value is depleted.
Three-for-Two Stock Split
On October 26, 2010 RPC’s Board of Directors declared a three-for-two stock split of the Company’s common shares. The additional shares were distributed on December 10, 2010, to stockholders of record on November 10, 2010. All share, earnings per share, and dividends per share data presented in the accompanying financial statements have been adjusted to reflect this stock split.
Earnings per Share
FASB ASC Topic 260-10 “Earnings Per Share-Overall,” requires a basic earnings per share and diluted earnings per share presentation. During 2009, theThe Company adopted certain amendments to ASC 260-10 which requires thatconsiders all outstanding unvested share-based payment awards that contain non-forfeitable rights to dividends or dividend equivalents, whether paid or unpaid, to be considered participating securities and included in the calculation of its basic earnings per share.
securities. The Company has periodically issued share-based payment awards that contain non-forfeitable rights to dividends, and therefore are considered participating securities. See Note 10 for further information on restricted stock granted to employees.
The basic and diluted calculations differ as a result of the dilutive effect of stock options and time lapse restricted shares and performance restricted shares included in diluted earnings per share, but excluded from basic earnings per share. Basic and diluted earnings per share are computed by dividing net income (loss) by the weighted average number of shares outstanding during the respective periods.
A reconciliation of weighted average shares outstanding along with the earnings (loss) per share attributable to restricted shares of common stock (participating securities) is as follows:
| (In thousands except per share data ) | | 2010 | | | 2009 | | | 2008 | |
| Net income (loss) available for stockholders: | | $ | 146,742 | | | $ | (22,745 | ) | | $ | 83,403 | |
| Less: Dividends paid | | | | | | | | | | | | |
| Common stock | | | (20,294 | ) | | | (21,229 | ) | | | (22,905 | ) |
| Restricted shares of common stock | | | (353 | ) | | | (327 | ) | | | (423 | ) |
| Undistributed earnings (loss) | | $ | 126,095 | | | $ | (44,301 | ) | | $ | 60,075 | |
| | | | | | | | | | | | | |
| Allocation of undistributed earnings: | | | | | | | | | | | | |
| Common stock | | $ | 123,536 | | | $ | (43,408 | ) | | $ | 58,992 | |
| Restricted shares of common stock | | | 2,559 | | | | (893 | ) | | | 1,083 | |
| | | | | | | | | | | | | |
| Basic shares outstanding: | | | | | | | | | | | | |
| Common stock | | | 141,866 | | | | 141,390 | | | | 142,125 | |
| Restricted shares of common stock | | | 3,123 | | | | 3,068 | | | | 2,723 | |
| | | | 144,989 | | | | 144,458 | | | | 144,848 | |
| Diluted shares outstanding: | | | | | | | | | | | | |
| Common stock | | | 141,866 | | | | 141,390 | | | | 142,125 | |
| Dilutive effect of options | | | 1,548 | | | | - | | | | 1,950 | |
| | | | 143,414 | | | | 141,390 | | | | 144,075 | |
| Restricted shares of common stock | | | 3,123 | | | | 3,068 | | | | 2,723 | |
| | | | 146,537 | | | | 144,458 | | | | 146,798 | |
| Basic earnings per share: | | | | | | | | | | | | |
| Common stock: | | | | | | | | | | | | |
| Distributed earnings | | $ | 0.14 | | | $ | 0.15 | | | $ | 0.16 | |
| Undistributed earnings (loss) | | | 0.87 | | | | (0.31 | ) | | | 0.42 | |
| | | $ | 1.01 | | | $ | (0.16 | ) | | $ | 0.58 | |
| Restricted shares of common stock: | | | | | | | | | | | | |
| Distributed earnings | | $ | 0.11 | | | $ | 0.11 | | | $ | 0.16 | |
| Undistributed earnings (loss) | | | 0.82 | | | | (0.29 | ) | | | 0.40 | |
| | | $ | 0.93 | | | $ | (0.18 | ) | | $ | 0.56 | |
| Diluted earnings per share: | | | | | | | | | | | | |
| Common Stock: | | | | | | | | | | | | |
| Distributed earnings | | $ | 0.14 | | | $ | 0.15 | | | $ | 0.16 | |
| Undistributed earnings (loss) | | | 0.86 | | | | (0.31 | ) | | | 0.41 | |
| | | $ | 1.00 | | | $ | (0.16 | ) | | $ | 0.57 | |
(In thousands except per share data ) | | 2013 | | | 2012 | | | 2011 | |
| Net income available for stockholders: | | $ | 166,895 | | | $ | 274,436 | | | $ | 296,381 | |
| Less: Dividends paid | | | | | | | | | | | | |
| Common stock | | | (86,282 | ) | | | (111,966 | ) | | | (46,479 | ) |
| Restricted shares of common stock | | | (1,507 | ) | | | (2,103 | ) | | | (848 | ) |
| Undistributed earnings | | $ | 79,106 | | | $ | 160,367 | | | $ | 249,054 | |
| | | | | | | | | | | | | |
| Allocation of undistributed earnings: | | | | | | | | | | | | |
| Common stock | | $ | 77,620 | | | $ | 157,093 | | | $ | 244,053 | |
| Restricted shares of common stock | | | 1,486 | | | | 3,274 | | | | 5,001 | |
| | | | | | | | | | | | | |
Basic shares outstanding: | | | | | | | | | | | | |
| Common stock | | | 211,305 | | | | 210,707 | | | | 213,153 | |
| Restricted shares of common stock | | | 4,199 | | | | 4,534 | | | | 4,530 | |
| | | | 215,504 | | | | 215,241 | | | | 217,683 | |
| Diluted shares outstanding: | | | | | | | | | | | | |
| Common stock | | | 211,305 | | | | 210,707 | | | | 213,153 | |
| Dilutive effect of stock-based awards | | | 1,229 | | | | 1,555 | | | | 2,567 | |
| | | | 212,534 | | | | 212,262 | | | | 215,720 | |
| Restricted shares of common stock | | | 4,199 | | | | 4,534 | | | | 4,530 | |
| | | | 216,733 | | | | 216,796 | | | | 220,250 | |
| Basic earnings per share: | | | | | | | | | | | | |
| Common stock: | | | | | | | | | | | | |
| Distributed earnings | | $ | 0.40 | | | $ | 0.53 | | | $ | 0.22 | |
| Undistributed earnings | | | 0.37 | | | | 0.75 | | | | 1.14 | |
| | | $ | 0.77 | | | $ | 1.28 | | | $ | 1.36 | |
| Restricted shares of common stock: | | | | | | | | | | | | |
| Distributed earnings | | $ | 0.36 | | | $ | 0.46 | | | $ | 0.19 | |
| Undistributed earnings | | | 0.35 | | | | 0.72 | | | | 1.10 | |
| | | $ | 0.71 | | | $ | 1.18 | | | $ | 1.29 | |
| Diluted earnings per share: | | | | | | | | | | | | |
| Common Stock: | | | | | | | | | | | | |
| Distributed earnings | | $ | 0.40 | | | $ | 0.53 | | | $ | 0.22 | |
| Undistributed earnings | | | 0.37 | | | | 0.74 | | | | 1.13 | |
| | | $ | 0.77 | | | $ | 1.27 | | | $ | 1.35 | |
NOTES TO CONSOLIDATED FINANCIAL STATEMENTS
RPC, Inc. and Subsidiaries
Years ended December 31, 2010, 2009 and 2008
During the year ended December 31, 2009, the Company incurred a net loss from continuing operations and consequently the common stock equivalents were excluded from the computation of diluted loss per share because the effect would have been anti-dilutive.
Fair Value of Financial Instruments
The Company’s financial instruments consist primarily of cash and cash equivalents, accounts receivable, marketable securities,investments, accounts payable, an interest rate swap, and debt. The carrying value of cash and cash equivalents, accounts receivable and accounts payable approximate their fair value due to the short-term nature of such instruments. The marketable securitiesCompany’s investments are classified as available-for-sale andsecurities with the securitiesexception of investments held in the SERPnon-qualified Supplemental Executive Retirement Plan (“SERP”) which are classified as trading securities. All of these securities are carried at fair value in the accompanying consolidated balance sheets. The interest rate swap is carried at fair value, which is based on quotes from the issuer of the swap and represents the estimated amounts that we would expect to pay to terminate the swap. See Note 8 for additional information.
Stock-Based Compensation
Stock-based compensation expense is recognized for all share-based payment awards, net of an estimated forfeiture rate. Thus, compensation cost is amortized for those shares expected to vest on a straight-line basis over the requisite service period of the award. See Note 10 for additional information.
NewRecent Accounting Pronouncements
Recently Adopted Accounting Pronouncements:
● | ASU 2010-01, Equity (Topic 505): Accounting for Distributions to Shareholders with Components of Stock and Cash. The amendments to the Codification in this ASU clarify that the stock portion of a distribution to shareholders that allows them to elect to receive cash or stock with a potential limitation on the total amount of cash that all shareholders can elect to receive in the aggregate is considered a share issuance that is reflected in earnings per share prospectively and not a share dividend. The Company adopted these provisions in the first quarter of 2010 and the adoption did not have a material impact on the Company’s consolidated financial statements.
|
● | ASU 2010-06, Fair Value Measurements and Disclosures (Topic 820): Improving Disclosures about Fair Value Measurements. The amendments to the Codification in this ASU now require
|
| 1. | the amounts of significant transfers in and out of Level 1 and Level 2 fair value measurements and the reasons for the transfer be disclosed separately and |
| 2. | in the reconciliation for fair value measurements using significant unobservable inputs, a reporting entity should present separately information about purchases, sales, issuances and settlements. |
| 3. | judgment in determining the appropriate classes of assets and liabilities when reporting fair value measurements for each class |
NOTES TO CONSOLIDATED FINANCIAL STATEMENTS
RPC, Inc. and Subsidiaries
Years ended December 31, 2010, 2009 and 2008
| 4. | disclosures about valuation techniques and inputs used to measure fair value for both recurring and nonrecurring fair value measurements. |
The Company complied with these disclosure requirements in its annual report on Form 10-K forDuring the year ended December 31, 20092013, the Financial Accounting Standards Board (FASB) issued the following applicable accounting Standards Updates (ASU):
Recently Adopted Accounting Pronouncements:
Accounting Standards Update 2013-02, Comprehensive Income (Topic 220): Reporting of Amounts Reclassified Out of Accumulated Other Comprehensive Income. The amendments in this ASU do not change the current requirements for reporting net income or other comprehensive income in financial statements. All of the information that this ASU requires already is required to be disclosed elsewhere in the financial statements under U.S. GAAP. In addition, an entity is required to present (either on the face of the statement where net income is presented or in the notes) the effects on the line items of net income of significant amounts reclassified out of accumulated other comprehensive income - but only if the item reclassified is required under U.S. GAAP to be reclassified to net income in its entirety in the same reporting period. The Company adopted these provisions in the first quarter of 2013 and has included the required additional disclosures in the accompanying financial statements and notes.
Recently Issued Accounting Pronouncements Not Yet Adopted:
Accounting Standards Update 2013-05, Foreign Currency Matters (Topic 830): Parent’s Accounting for the Cumulative Translation Adjustment upon Derecognition of Certain Subsidiaries or Groups of Assets within a Foreign Entity or of an Investment in a Foreign EntityThe amendments in this ASU requires that when a reporting entity (parent) ceases to have a controlling financial interest in a subsidiary or group of assets within a foreign entity, the parent should release the cumulative translation adjustment into net income only if the sale or transfer results in the complete or substantially complete liquidation of the foreign entity in which the subsidiary or group of assets had resided. Additionally, the amendments in this ASU clarify that the sale of an investment in a foreign entity includes both: (1) events that result in the loss of a controlling financial interest in a foreign entity; and (2) events that result in an acquirer obtaining control of an acquiree in which it held an equity interest immediately before the acquisition date. Upon the occurrence of those events, the cumulative translation adjustment should be released into net income. The amendments in this ASU are effective prospectively for fiscal years beginning after December 15, 2013 and for interim reporting periods within those years, with early adoption being permitted. The Company plans to provideadopt these provisions in the disclosures in every reporting period as necessary. Adoptionfirst quarter of these disclosure requirements did2014 and does not expect the adoption to have a material impact on the Company’s consolidated financial statements.
Recently Issued Accounting Pronouncements Not Yet Adopted:Standards Update 2013-11,Income Taxes (Topic 740): Presentation of an Unrecognized Tax Benefit When a Net Operating Loss Carryforward, a Similar Tax Loss, or a Tax Credit Carryforward Exists. The amendments in this ASU requires an unrecognized tax benefit, or a portion of thereof, to be presented in the financial statements as a reduction to a deferred tax asset for a net operating loss carryforward, a similar tax loss, or a tax credit carryforward. The only exception would be if the deferred taxes related to these items are not available to settle any additional income taxes that would result from the disallowance of a tax position either by statute or at the entity’s choosing. In such cases, the unrecognized tax benefit should be presented in the financial statements as a liability and should not be combined with deferred tax assets. The amendments in this ASU are effective prospectively for fiscal years beginning after December 15, 2013 and for interim reporting periods within those years, with early adoption being permitted. The Company plans to adopt these provisions in the first quarter of 2014 and does not expect the adoption to have a material impact on the Company’s consolidated financial statements.
● | ASU 2010-13, Compensation – Stock Compensation (Topic 718): Effect of Denominating the Exercise Price of a Share-Based Payment Award in the Currency of the Market in Which the Underlying Equity Security Trades. The amendments to the Codification in this ASU provide guidance on share-based payment awards to employees with an exercise price denominated in the currency of a market in which a substantial portion of the entity’s equity shares trade. The ASU states that if such awards meet all the criteria for equity should be classified as such and not liability based solely on the currency it is denominated in. The amendments are effective beginning in 2011 with adoption required in the first quarter of that year. Adoption of these provisions is not expected to have a material impact on the Company’s consolidated financial statements.
|
● | ASU 2010-28,Intangibles - Goodwill and Other (Topic 350): When to Perform Step 2 of the Goodwill Impairment Test for Reporting Units with Zero or Negative Carrying Amounts. The amendments to the Codification in this ASU modify Step 1 of the goodwill impairment test for reporting units with zero or negative carrying amounts. For those reporting units, an entity is required to perform Step 2 of the goodwill impairment test if it is more likely than not that a goodwill impairment exists. Goodwill of a reporting unit is required to be tested for impairment between annual tests if an event occurs or circumstances change that would more likely than not reduce the fair value of a reporting unit below its carrying amount. These amendments are effective starting in the first quarter of 2011 with early adoption not permitted. Adoption of these provisions is not expected to have a material impact on the Company’s consolidated financial statements.
|
● | ASU 2010-29, Business Combinations (Topic 805): Disclosure of Supplementary Pro Forma Information for Business Combinations. The amendments to the Codification in this ASU apply to any public entity that enters into business combinations that are material on an individual or aggregate basis and specify that the entity presents comparative financial statements, the entity should disclose revenue and earnings of the combined entity as though the business combination(s) that occurred during the current year had occurred as of the beginning of the comparable prior annual reporting period only. The amendments also expand the supplemental pro forma disclosures to include a description of the nature and amount of material, nonrecurring pro forma adjustments directly attributable to the business combination included in the reported pro forma revenue and earnings. The amendments are effective prospectively for business combinations for which the acquisition date is on or after the beginning of the first annual reporting period beginning in January 2011 with early adoption permitted. The Company plans to adopt these provisions for all acquisitions completed beginning in 2011 and provide the appropriate disclosures.
|
Note 2: Accounts Receivable
Accounts receivable, net consists of the following:
| December 31, | | 2010 | | | 2009 | |
| (in thousands) | | | | | | |
| Trade receivables: | | | | | | |
| Billed | | $ | 216,201 | | | $ | 98,275 | |
| Unbilled | | | 84,977 | | | | 34,753 | |
| Other receivables | | | 1,519 | | | | 801 | |
| Total | | | 302,697 | | | | 133,829 | |
| Less: allowance for doubtful accounts | | | (8,695 | ) | | | (3,210 | ) |
| Accounts receivable, net | | $ | 294,002 | | | $ | 130,619 | |
NOTES TO CONSOLIDATED FINANCIAL STATEMENTS
RPC, Inc. and Subsidiaries
Years ended December 31, 2010, 2009 and 2008
December 31, | | 2013 | | | 2012 | |
(in thousands) | | | | | | |
| Trade receivables: | | | | | | |
| Billed | | $ | 368,583 | | | $ | 310,997 | |
| Unbilled | | | 80,806 | | | | 82,649 | |
| Other receivables | | | 1,240 | | | | 2,994 | |
| Total | | | 450,629 | | | | 396,640 | |
| Less: allowance for doubtful accounts | | | (13,497 | ) | | | (9,110 | ) |
| Accounts receivable, net | | $ | 437,132 | | | $ | 387,530 | |
Trade receivables relate to sale of our services and products, for which credit is extended based on our evaluation of the customer’s credit worthiness. Unbilled receivables represent revenues earned but not billed to the customer until future dates, usually within one month. Other receivables consist primarily of amounts due from purchasers of Company property and rebates from suppliers.
Changes in the Company’s allowance for doubtful accounts are as follows:
| Years Ended December 31, | | 2010 | | | 2009 | | | 2013 | | | 2012 | |
| (in thousands) | | | | | | | | | | | | |
| Beginning balance | | $ | 3,210 | | | $ | 6,199 | | | $ | 9,110 | | | $ | 8,093 | |
| Bad debt expense | | | 4,812 | | | | 660 | | | | 8,815 | | | | 1,784 | |
| Accounts written-off | | | (730 | ) | | | (3,763 | ) | | | (5,421 | ) | | | (1,132 | ) |
| Recoveries | | | 1,403 | | | | 114 | | | | 993 | | | | 365 | |
| Ending balance | | $ | 8,695 | | | $ | 3,210 | | | $ | 13,497 | | | $ | 9,110 | |
Note 3: Inventories
Inventories are $64,059,000$126,604,000 at December 31, 20102013 and $55,783,000$140,867,000 at December 31, 20092012 and consist of raw materials, parts and supplies.
Note 4: Property, Plant and Equipment
Property, plant and equipment are presented at cost net of accumulated depreciation and consist of the following:
| December 31, | | 2010 | | | 2009 | | | 2013 | | | 2012 | |
| (in thousands) | | | | | | | | | | | | |
| Land | | $ | 15,053 | | | $ | 14,980 | | | $ | 19,264 | | | $ | 17,420 | |
| Buildings and leasehold improvements | | | 82,457 | | | | 80,928 | | | | 130,072 | | | | 111,986 | |
| Operating equipment | | | 755,028 | | | | 631,666 | | | | 1,231,504 | | | | 1,155,600 | |
| Capitalized software | | | 15,899 | | | | 15,391 | | |
| Computer software | | | | 17,121 | | | | 20,581 | |
| Furniture and fixtures | | | 4,690 | | | | 4,342 | | | | 7,737 | | | | 7,232 | |
| Vehicles | | | 219,555 | | | | 180,408 | | | | 387,854 | | | | 357,913 | |
| Construction in progress | | | 1,821 | | | | 35 | | | | 2,076 | | | | 9,829 | |
| Gross property, plant and equipment | | | 1,094,503 | | | | 927,750 | | | | 1,795,628 | | | | 1,680,561 | |
| Less: accumulated depreciation | | | (641,486 | ) | | | (531,528 | ) | | | (1,069,321 | ) | | | (924,235 | ) |
| Net property, plant and equipment | | $ | 453,017 | | | $ | 396,222 | | | $ | 726,307 | | | $ | 756,326 | |
Depreciation expense was $133.4$215.4 million in 2010, $130.62013, $214.9 million in 20092012, and $118.4$179.9 million in 2008.2011, and includes amounts recorded as costs of sales and inventory. There arewere no capital leases outstanding as of December 31, 20102013 and December 31, 2009.2012. The Company had accounts payable for purchases of property and equipment of approximately $18.1 million, $3.7 million and $9.4$19.7 million as of December 31, 2010, 20092013, $24.4 million as of December 31, 2012, and 2008.$32.7 million as of December 31, 2011.
NOTES TO CONSOLIDATED FINANCIAL STATEMENTS
RPC, Inc. and Subsidiaries
Years ended December 31, 2010, 2009 and 2008
Note 5: Income Taxes
The following table lists the components of the provision (benefit) for income taxes:
| Years ended December 31, | | 2010 | | | 2009 | | | 2008 | | | 2013 | | | 2012 | | | 2011 | |
| (in thousands) | | | | | | | | | | | | | | | | | | |
| Current provision (benefit): | | | | | | | | | | |
| Current provision: | | | | | | | | | | |
| Federal | | $ | 56,289 | | | $ | (13,490 | ) | | $ | 20,793 | | | $ | 104,890 | | | $ | 147,580 | | | $ | 91,415 | |
| State | | | 11,180 | | | | 235 | | | | 5,453 | | | | 15,627 | | | | 14,673 | | | | 12,938 | |
| Foreign | | | 1,059 | | | | 832 | | | | 937 | | | | 1,918 | | | | 1,109 | | | | 1,007 | |
| Deferred provision (benefit): | | | | | | | | | | | | | |
| Deferred (benefit) provision: | | | | | | | | | | | | | |
| Federal | | | 22,833 | | | | 1,698 | | | | 25,486 | | | | (12,025 | ) | | | 5,027 | | | | 70,599 | |
| State | | | (571 | ) | | | (29 | ) | | | 1,713 | | | | (1,035 | ) | | | (206 | ) | | | 6,475 | |
| Total income tax provision (benefit) | | $ | 90,790 | | | $ | (10,754 | ) | | $ | 54,382 | | |
| Total income tax provision | | | $ | 109,375 | | | $ | 168,183 | | | $ | 182,434 | |
Reconciliation between the federal statutory rate and RPC’s effective tax rate is as follows:
| Years ended December 31, | | 2010 | | | 2009 | | | 2008 | | | 2013 | | | 2012 | | | 2011 | |
| Federal statutory rate | | | 35.0 | % | | | 35.0 | % | | | 35.0 | % | | | 35.0 | % | | | 35.0 | % | | | 35.0 | % |
| State income taxes, net of federal benefit | | | 2.9 | | | | (2.4 | ) | | | 3.2 | | | | 3.8 | | | | 3.2 | | | | 3.1 | |
| Tax credits | | | (0.6 | ) | | | 1.3 | | | | (0.8 | ) | | | (0.3 | ) | | | (0.3 | ) | | | (0.2 | ) |
| Non-deductible expenses | | | 0.4 | | | | (2.6 | ) | | | 0.9 | | | | 0.5 | | | | 0.5 | | | | 0.4 | |
| Other | | | 0.5 | | | | 0.8 | | | | 1.2 | | | | 0.6 | | | | (0.4 | ) | | | (0.2 | ) |
| Effective tax rate | | | 38.2 | % | | | 32.1 | % | | | 39.5 | % | | | 39.6 | % | | | 38.0 | % | | | 38.1 | % |
Significant components of the Company’s deferred tax assets and liabilities are as follows:
| December 31, | | 2010 | | | 2009 | | | 2013 | | | 2012 | |
| (in thousands) | | | | | | | | | | | | |
| Deferred tax assets: | | | | | | | | | | | | |
| Self-insurance | | $ | 5,643 | | | $ | 5,445 | | | $ | 7,247 | | | $ | 7,417 | |
| Pension | | | 6,715 | | | | 5,346 | | | | 8,018 | | | | 9,688 | |
| State net operating loss carryforwards | | | 2,955 | | | | 1,742 | | | | 484 | | | | 1,165 | |
| Bad debts | | | 3,219 | | | | 1,361 | | | | 4,748 | | | | 3,489 | |
| Accrued payroll | | | 1,460 | | | | 866 | | | | 2,019 | | | | 2,038 | |
| Stock-based compensation | | | 2,538 | | | | 2,413 | | | | 5,183 | | | | 4,567 | |
| Tangible property regulations 481(a) | | | | 7,665 | | | | — | |
| All others | | | 232 | | | | 149 | | | | 1,541 | | | | 274 | |
| Valuation allowance | | | (1,295 | ) | | | (1,550 | ) | | | (83 | ) | | | (1,003 | ) |
| Gross deferred tax assets | | | 21,467 | | | | 15,772 | | | | 36,822 | | | | 27,635 | |
| Deferred tax liabilities: | | | | | | | | | | | | | | | | |
| Depreciation | | | (89,456 | ) | | | (62,640 | ) | | | (165,960 | ) | | | (168,717 | ) |
| Goodwill amortization | | | (5,020 | ) | | | (4,403 | ) | | | (7,094 | ) | | | (6,394 | ) |
| All others | | | (453 | ) | | | - | | |
| All Others | | | | (2,759 | ) | | | (1,754 | ) |
| Gross deferred tax liabilities | | | (94,929 | ) | | | (67,043 | ) | | | (175,813 | ) | | | (176,865 | ) |
| Net deferred tax liabilities | | $ | (73,462 | ) | | $ | (51,271 | ) | | $ | (138,991 | ) | | $ | (149,230 | ) |
Historically and currently,As of December 31, 2013, undistributed earnings of the Company’s foreign subsidiaries amounted to $12.0 million. Those earnings are considered to be indefinitely reinvested and, accordingly, no provision for U.S. federal and state income taxes hashave been recorded. Deferred taxes are provided for earnings outside the United States whenthereon. Upon distribution of those earnings are not considered indefinitely reinvested.
NOTES TO CONSOLIDATED FINANCIAL STATEMENTS
RPC, Inc.in the form of dividends or otherwise, the Company would be subject to both U.S. income taxes and Subsidiaries
Years ended December 31, 2010, 2009withholding taxes payable to the foreign countries. The Company’s current intention is to permanently reinvest funds held in our foreign subsidiaries outside of the U.S., with the possible exception of repatriation of funds that have been previously subject to U.S. federal and 2008
state taxation or when it would be tax effective through the utilization of foreign tax credits, or would otherwise create no additional U.S. tax cost.
As of December 31, 2010,2013, the Company has net operating loss carryforwardscarry forwards related to state income taxes of approximately $68.2$11.8 million that will expire between 20112014 and 2030.2033. As of December 31, 20102013 the Company has a valuation allowance of approximately $1.3$0.1 million, representing the tax affected amount of loss carryforwardscarry forwards that the Company does not expect to utilize, against the corresponding deferred tax asset.
Total net income tax payments (refunds) were $61,632,000$122,916,000 in 2010, ($8,351,000)2013, $158,700,000 in 20092012, and $29,714,000$90,729,000 in 2008.
The Company’s policy is to record interest and penalties related to income tax matters as income tax expense. Accrued interest and penalties were immaterial to the financial statements as of December 31, 2010 and 2009.
The Company’s liability for unrecognized tax benefits was $33 thousand as of December 31, 2010 and $30 thousand as of December 31, 2009, all of which would affect our effective rate if recognized. A reconciliation of the beginning and ending amount of unrecognized tax benefits for 2010 and 2009 are as follows:
| | Years Ended December 31, | | 2010 | | | 2009 | |
| | (in thousands) | | | | | | |
| | Beginning balance | | $ | 30 | | | $ | 11 | |
| | Additions based on tax positions related to current year | | | - | | | | - | |
| | Additions for tax positions of prior years | | | 3 | | | | 19 | |
| | Reductions for tax positions of prior years | | | - | | | | - | |
| | Ending balance | | $ | 33 | | | $ | 30 | |
The Company and its subsidiaries are subject to U.S. federal and state income tax in multiple jurisdictions. In many cases our uncertain tax positions are related to tax years that remain open and subject to examination by the relevant taxing authorities. The Company’s 20072010 through 20102013 tax years remain open to examination. Additional years may be open to the extent attributes are being carried forward to an open year. The Internal Revenue Service (IRS) commenced an examination of the Company’s US federal income tax return for the 2011 tax year during the fourth quarter of 2013 that is anticipated to be completed by the end of 2014. As of December 31, 2013, the IRS has not proposed any adjustments in connection with the examination.
In accordance with the accounting guidance relating to the accounting for uncertainty in income tax reporting, which provides criteria for the recognition, measurement, presentation and disclosure of uncertain tax positions, the Company recognized a significant increase in its liability for unrecognized tax benefits in the current year related primarily to refund claims filed for state income taxes.
A reconciliation of the beginning and ending amount of unrecognized tax benefits is as follows:
| | | 2013 | | | 2012 | |
| Balance at January 1 | | $ | 38,000 | | | $ | 35,000 | |
| Additions based on tax positions related to the current year | | | 3,430,000 | | | | — | |
| Additions for tax positions of prior years | | | 12,877,000 | | | | 3,000 | |
| Balance at December 31 | | $ | 16,345,000 | | | $ | 38,000 | |
The Company’s liability for unrecognized tax benefits as disclosed above, would affect our effective rate if recognized. Additionally, interest and penalties related to the unrecognized tax benefits as disclosed above as of December 31, 2013 and December 31, 2012 amounted to $276,000 and $3,000, respectively.
The Company’s policy is to record interest and penalties related to income tax matters as income tax expense. Accrued interest and penalties were immaterial to the financial statements as of December 31, 2013 and 2012.
It is reasonably possible that the amount of the unrecognized tax benefits with respect to our unrecognized tax positions will increase orsignificantly decrease in the next 12 months. These changes may be the result of, among other things, state tax settlements under Voluntary Disclosure Agreements.or conclusions of ongoing examinations or reviews. However, quantification of an estimated range cannot be made at this time.
The American Taxpayer Relief Act of 2012 was signed into law on January 2, 2013 and included an extension for one year of the 50% bonus depreciation allowance. The provision specifically applied to qualifying property placed in service before January 1, 2014. The acceleration of deductions on 2013 qualifying capital expenditures resulting from the bonus depreciation provision had no impact on our 2013 effective tax rate.
On September 23, 2013, the U.S. Department of the Treasury issued final regulations under Internal Revenue Code Sections 162(a) and 263(a) that provide guidance on the deduction and capitalization of expenditures related to tangible property. These regulations will result in our adoption of certain mandatory and elective accounting methods with respect to property and equipment, inventory and supplies. The regulations are generally effective for taxable years beginning on or after January 1, 2014.
In connection with the issuance of the regulations, RPC has assessed and estimated the impact of the method changes on its financial statements. We have estimated favorable IRC Section 481(a) adjustments of approximately $21 million (gross). The tax affected amount of the assessment ($7.7 million) has been separately disclosed in our schedule of deferred tax assets and liabilities. This amount is subject to change as we finalize our analysis and file method changes under the new regulations during 2014.
Note 6: Long-Term Debt
OnIn August 31, 2010, the Company replaced its $200 million credit facility with a new $350 million revolving credit facility with Banc of America Securities, LLC, SunTrust Robinson Humphrey, Inc., and Regions Capital Markets as Joint Lead Arrangers and Joint Book Managers, and a syndicate of other lenders. The facility includes a full and unconditional guarantee by the Company’s 100% owned domestic subsidiaries whose assets equal substantially all of the consolidated assets of RPC and its subsidiaries. The subsidiaries of the Company that are not guarantors are considered minor.
The facility has a general term of five years and provides for an unsecured line of credit of up to $350 million, which includes a $50 million letter of credit subfacility, and a $25 million swingline subfacility. The maturity date of all revolving loans under the facilityCredit Agreement is August 31, 2015. The Company has incurred loan origination fees and other debt related costs associated with the facilityRevolving Credit Agreement in the aggregate of approximately $1.9$2.3 million. These costs are being amortized to interest expense over the five year term of the loan, and the net amount is classified as non-current other assets on the consolidated balance sheets.
Revolving loans under the Revolving Credit Agreementfacility bear interest at one of the following two rates, at the Company’s election:
| ● | the Base Rate, which is the highest of Bank of America’s “prime rate” for the day of the borrowing, a fluctuating rate per annum equal to the Federal Funds Rate plus 0.50%, and a rate per annum equal to the one (1) month LIBOR rate plus 1.00%, in each case plus a margin that ranges from 0.25% to 1.25% based on a quarterly debt covenant calculation; or |
● the Base Rate, which is the highest of Bank of America’s “prime rate” for the day of the borrowing, a fluctuating rate per annum equal to the Federal Funds Rate plus .50%, and a rate per annum equal to the one (1) month LIBOR rate plus 1.00%, in each case plus a margin that ranges from 0.75% to 1.50% based on a quarterly debt covenant calculation; or
NOTES TO CONSOLIDATED FINANCIAL STATEMENTS
RPC, Inc. and Subsidiaries
Years ended December 31, 2010, 2009 and 2008
● with respect to any Eurodollar borrowings, Adjusted LIBOR (which equals LIBOR as increased to account for the maximum reserve percentages established by the U.S. Federal Reserve) plus a margin ranging from 1.75% to 2.50%, based upon a quarterly debt covenant calculation. | ● | with respect to any Eurodollar borrowings, Adjusted LIBOR (which equals LIBOR as increased to account for the maximum reserve percentages established by the U.S. Federal Reserve) plus a margin ranging from 1.25% to 2.25%, based upon a quarterly debt covenant calculation. |
In addition, the Company pays an annuala commitment fee ranging from .25%0.25% to .40%0.35%, based on a quarterly debt covenant calculation, of the unused portion of the credit facility.
The facility contains customary terms and conditions, including certain financial covenants and restrictions on indebtedness, dividend payments, business combinations and other related items. Further, the facility contains financial covenants limiting the ratio of the Company’s consolidated debt-to-EBITDA to no more than 2.5 to 1, and limiting the ratio of the Company’s consolidated EBITDA to interest expense to no less than 2 to 1. The Company was in compliance with these covenants as of and for the year ended December 31, 2010.2013.
As of December 31, 2010,2013, RPC has outstanding borrowings of $121.3$53.3 million under the facility. Interest incurred and recorded as expense on the facility was $3,170,000 in 2010, $2,327,000 in 2009 and $5,188,000 in 2008. The weighted average interest rate was 3.0% in 2010, 1.8% in 2009 and 3.6% in 2008. The Company capitalized interest incurred of $554,000 in 2010, $150,000 in 2009 and $1,064,000 in 2008 related to facilities and equipment under construction. Additionally there were letters of credit relating to self-insurance programs and contract bids outstanding for $18.8$24.1 million as of December 31, 2010.2013. Interest incurred and paid on the credit facility, interest capitalized related to facilities and equipment under construction, and the related weighted average interest rates were as follows for the periods indicated:
Cash interest paid (net of capitalized interest) was approximately $1,899,000 in 2010, $2,192,000 in 2009 and $5,232,000 in 2008.Years Ended December 31, | | 2013 | | | 2012 | | | 2011 | |
(in thousands except interest rate data) | | | | | | | | | |
| Interest incurred | | $ | 2,090 | | | $ | 2,936 | | | $ | 4,146 | |
| Capitalized interest | | $ | 935 | | | $ | 1,026 | | | $ | 627 | |
| Interest paid (net of capitalized interest) | | $ | 618 | | | $ | 1,498 | | | $ | 3,168 | |
| Weighted average interest rate | | | 3.7 | % | | | 2.3 | % | | | 2.8 | % |
Effective December 2008 the Company entered into an interest rate swap agreement that effectively converted $50 million of the Company’s variable-rate debt to a fixed rate basis, thereby hedging against the impact of potential interest rate changes on future interest expense. The agreement terminates on September 8, 2011. Under this agreement the Company and the issuing lender settlesettled on a monthly basis for the difference between a fixed interest rate of 2.07% and a comparable one month LIBOR rate. This agreement terminated in September 2011.
NOTES TO CONSOLIDATED FINANCIAL STATEMENTS
On January 17, 2014, the Company amended the Credit Agreement which extended the maturity date of all the revolving loans from August 31, 2015 to January 17, 2019 (as amended, the “Credit Agreement”.) RPC Inc.incurred commitment fees and Subsidiaries
Years ended December 31, 2010, 2009 and 2008
other debt related costs associated with the amendment of approximately $0.7 million. Interest rates on the revolving loans under the Credit Agreement are reduced by 0.125% at all pricing levels under the Credit Agreement. The amount of the swing line sub-facility under the Credit Agreement has increased from $25 million to $35 million.
Note 7: Accumulated Other Comprehensive (Loss) Income
Accumulated other comprehensive (loss) income consists of the following (in thousands):
| | | Pension Adjustment | | | Unrealized Gain (Loss) On Securities | | | Foreign Currency Translation | | | Net Loss On Cash Flow Hedge | | | Total | |
| Balance at December 31, 2008 | | $ | (9,480 | ) | | $ | 129 | | | $ | (154 | ) | | $ | (527 | ) | | $ | (10,032 | ) |
| Change during 2009: | | | | | | | | | | | | | | | | | | | | |
| Before-tax amount | | | 1,413 | | | | 143 | | | | 530 | | | | 11 | | | | 2,097 | |
| Tax benefit | | | (516 | ) | | | (52 | ) | | | (299 | ) | | | (4 | ) | | | (871 | ) |
| Total activity in 2009 | | | 897 | | | | 91 | | | | 231 | | | | 7 | | | | 1,226 | |
| Balance at December 31, 2009 | | $ | (8,583 | ) | | $ | 220 | | | $ | 77 | | | $ | (520 | ) | | $ | (8,806 | ) |
| Change during 2010: | | | | | | | | | | | | | | | | | | | | |
| Before-tax amount | | | (2,125 | ) | | | 441 | | | | 329 | | | | 209 | | | | (1,146 | ) |
| Tax expense (benefit) | | | 775 | | | | (160 | ) | | | (120 | ) | | | (76 | ) | | | 419 | |
| Total activity in 2010 | | | (1,350 | ) | | | 281 | | | | 209 | | | | 133 | | | | (727 | ) |
| Balance at December 31, 2010 | | $ | (9,933 | ) | | $ | 501 | | | $ | 286 | | | $ | (387 | ) | | $ | (9,533 | ) |
| | | Pension Adjustment | | | Unrealized Gain (Loss) On Securities | | | Foreign
Currency
Translation | | | Total | |
| Balance at December 31, 2011 | | $ | (12,981 | ) | | $ | 187 | | | $ | 148 | | | $ | (12,646 | ) |
| Change during 2012: | | | | | | | | | | | | | | | | |
| Before-tax amount | | | (3,355 | ) | | | (249 | ) | | | 180 | | | | (3,424 | ) |
| Tax benefit | | | 1,224 | | | | 91 | | | | 85 | | | | 1,400 | |
| Reclassification adjustment, net of taxes: | | | | | | | | | | | | | | | | |
Amortization of net loss(1) | | | 424 | | | | — | | | | — | | | | 424 | |
| Total activity in 2012 | | | (1,707 | ) | | | (158 | ) | | | 265 | | | | (1,600 | ) |
| Balance at December 31, 2012 | | $ | (14,688 | ) | | $ | 29 | | | $ | 413 | | | $ | (14,246 | ) |
| Change during 2013: | | | | | | | | | | | | | | | | |
| Before-tax amount | | | 6,976 | | | | (30 | ) | | | (778 | ) | | | 6,168 | |
| Tax (expense) benefit | | | (2,546 | ) | | | 11 | | | | — | | | | (2,535 | ) |
| Reclassification adjustment, net of taxes: | | | | | | | | | | | | | | | | |
Amortization of net loss(1) | | | 498 | | | | — | | | | — | | | | 498 | |
| Total activity in 2013 | | | 4,928 | | | | (19 | ) | | | (778 | ) | | | 4,131 | |
| Balance at December 31, 2013 | | $ | (9,760 | ) | | $ | 10 | | | $ | (365 | ) | | $ | (10,115 | ) |
| (1) | Reported as part of selling, general and administrative expenses. |
NOTES TO CONSOLIDATED FINANCIAL STATEMENTS
RPC, Inc. and Subsidiaries
Years ended December 31, 2010, 2009 and 2008
Note 8: Fair Value Disclosures
The various inputs used to measure assets at fair value establish a hierarchy that distinguishes between assumptions based on market data (observable inputs) and the Company’s assumptions (unobservable inputs). The hierarchy consists of three broad levels as follows:
| | 1. | Level 1 – Quoted market prices in active markets for identical assets or liabilities. |
| | 2. | Level 2 – Quoted prices for similar instruments in active markets, quoted prices for identical or similar instruments in markets that are not active, and model-based valuation techniques for which all significant assumptions are observable in the market or can be corroborated by observable market data for substantially the full term of the assets or liabilities. |
| | 3. | Level 3 – Unobservable inputs developed using the Company’s estimates and assumptions, which reflect those that market participants would use. |
The following table summarizes the valuation of financial instruments measured at fair value on a recurring basis on the balance sheet as of December 31, 20102013 and 2009:2012:
| | | Fair Value Measurements at December 31, 2010 with: | | | Fair Value Measurements at December 31, 2013 with: | |
(in thousands) | | Quoted prices in active markets for identical assets | | | Significant other observable inputs | | | Significant unobservable inputs | | | Quoted prices in active
markets for identical
assets | | | Significant other
observable inputs | | | Significant
unobservable inputs | |
| | | (Level 1) | | | (Level 2) | | | (Level 3) | | | (Level 1) | | | (Level 2) | | | (Level 3) | |
| Assets: | | | | | | | | | | | | | | | | | | |
| Trading securities | | $ | - | | | $ | 8,445 | | | $ | - | | | $ | — | | | $ | 13,963 | | | $ | — | |
| Available-for-sale securities – equity securities | | | 1,124 | | | | - | | | | - | | | $ | 445 | | | $ | — | | | $ | — | |
| Liabilities: | | | | | | | | | | | | | |
| Interest rate swap | | $ | - | | | $ | 610 | | | $ | - | | |
| | | Fair Value Measurements at December 31, 2009 with: | | | Fair Value Measurements at December 31, 2012 with: | |
(in thousands) | | Quoted prices in active markets for identical assets | | | Significant other observable inputs | | | Significant unobservable inputs | | | Quoted prices in active markets for identical
assets | | | Significant other
observable inputs | | | Significant
unobservable inputs | |
| | | (Level 1) | | | (Level 2) | | | (Level 3) | | | (Level 1) | | | (Level 2) | | | (Level 3) | |
| Assets: | | | | | | | | | | | | | | | | | | |
| Trading securities | | $ | - | | | $ | 6,905 | | | $ | - | | | $ | — | | | $ | 11,103 | | | $ | — | |
| Available-for-sale securities – equity securities | | | 653 | | | | - | | | | - | | | $ | 380 | | | $ | — | | | $ | — | |
| Liabilities: | | | | | | | | | | | | | |
| Interest rate swap | | $ | - | | | $ | 820 | | | $ | - | | |
The Company determines the fair value of the marketable securities that are available-for-sale through quoted market prices. The total fair value is the final closing price, as defined by the exchange in which the asset is actively traded, on the last trading day of the period, multiplied by the number of units held without consideration of transaction costs. The trading securities are comprised of the SERP assets, as described in Note 10, and are recorded primarily at their net cash surrender values, which approximates fair value, as provided by the issuing insurance company. Significant observable inputs, in addition to quoted market prices, were used to value the trading securities. As a result, the Company classified these investments as using level 2 inputs. The Company’s policy is to recognize transfers between levels at the beginning of quarterly reporting periods. For the year ended December 31, 2013 there were no significant transfers in or out of levels 1, 2 or 3.
At December 31, 20102013 and 2009, there was $121,250,000 and $90,300,0002012, amounts outstanding under the Company’s credit facility. The fair value of these borrowings was $121,250,000 in 2010facility were $53,300,000 and $88,043,000 in 2009. The fair value of these borrowings was$107,000,000 and based on quotes from the lender (level 2 inputs). is similar to the fair values of these amounts at the respective dates. The borrowings under our revolving credit facility bear interest at the variable rate described in Note 6. We areThe Company is subject to interest rate risk on the variable component of the interest rate. Our risk management objective is to lock in the interest cash outflows on a portion of our debt. As a result, as described in Note 6, we entered into an interest rate swap agreement effectively converting a portion of the outstanding borrowings under the revolving credit facility to a fixed-rate, thereby hedging against the impact of potential interest rate changes on future interest expense. The fair value of this swap was negative $610,000 at December 31, 2010 and is recorded in other accrued expenses. At December 31, 2009 the fair value of this swap was negative $820,000 and is recorded in other long-term liabilities. The fair value of the interest rate swap was based on quotes from the issuer of the swap and represents the estimated amounts that we would expect to pay to terminate the swap.
NOTES TO CONSOLIDATED FINANCIAL STATEMENTS
RPC, Inc. and Subsidiaries
Years ended December 31, 2010, 2009 and 2008
The carrying amounts of other financial instruments reported in the balance sheet for current assets and current liabilities approximate their fair values because of the short maturity of these instruments. The Company currently does not use the fair value option to measure any of its existing financial instruments and has not determined whether or not it will elect this option for financial instruments it may acquire in the future.
Note 9: Commitments and Contingencies
Lease Commitments - Minimum annual rentals, principally for noncancelable real estate and equipment leases with terms in excess of one year, in effect at December 31, 2010,2013, are summarized in the following table:
| (in thousands) | | | | | | |
| 2011 | | $ | 4,105 | | |
| 2012 | | | 3,612 | | |
| 2013 | | | 2,439 | | |
| 2014 | | | 1,565 | | | $ | 8,984 | |
| 2015 | | | 994 | | | | 7,664 | |
| 2016 | | | | 4,929 | |
| 2017 | | | | 2,989 | |
| 2018 | | | | 2,231 | |
| Thereafter | | | 286 | | | | 5,991 | |
| Total rental commitments | | $ | 13,001 | | | $ | 32,788 | |
Total rental expense, including short-term rentals, charged to operations was approximately $11,970,000$20,582,000 in 2010, $10,787,0002013, $18,224,000 in 2009 and $9,109,0002012, $19,814,000 in 2008.2011.
Income Taxes - The amount of income taxes the Company pays is subject to ongoing audits by federal and state tax authorities, which often result in proposed assessments. Other long-term liabilities include $33,000 as of December 31, 2010 and $30,000 as of December 31, 2009, that represents the Company’s estimated liabilities for the probable assessments payable.
Sales and Use Taxes - The Company has ongoing sales and use tax audits in various jurisdictions and may be subjected to varying interpretations of statute that could result in unfavorable outcomes that cannot be currently estimated.outcomes. Any probable and estimable assessment costs are included in accrued state, local and other taxes.
Litigation - RPC is a party to various routine legal proceedings primarily involving commercial claims, workers’ compensation claims and claims for personal injury. RPC insures against these risks to the extent deemed prudent by its management, but no assurance can be given that the nature and amount of such insurance will, in every case, fully indemnify RPC against liabilities arising out of pending and future legal proceedings related to its business activities. While the outcome of these lawsuits, legal proceedings and claims cannot be predicted with certainty, management, after consultation with legal counsel, believes that the outcome of all such proceedings, even if determined adversely, would not have a material adverse effect on the Company’s business or financial condition.
Note 10: Employee Benefit Plans
Defined Benefit Pension Plan
The Company’s Retirement Income Plan, a trusteed defined benefit pension plan, provides monthly benefits upon retirement at age 65 to substantially all employees with at least one year of service prior to 2002. As of February 28,During 2001, the plan became a multiple employer plan, with Marine Products Corporation as an adopting employer.
In 2002, the Company’s Board of Directors approved a resolution to cease all future retirement benefit accruals under the Retirement Income Plan. In lieu thereof, the Company began providing enhanced benefits in the form of cash contributions for certain longer serviced employees that had not reached the normal retirement age of 65 as of March 31, 2002. The contributions were discretionary and made annually based on continued employment over a seven year period ending in 2008. These discretionary contributions were made to either the SERP established by the Company or to the 401(k) plan for each employee that was entitled to the enhanced benefit. There was no expense related to the enhanced benefits for 2010 or 2009. The expense related to enhanced benefits was $295,000 for 2008.
NOTES TO CONSOLIDATED FINANCIAL STATEMENTSRPC, Inc. and Subsidiaries
Years ended December 31, 2010, 2009 and 2008
The Company’s projected benefit obligation exceeds the fair value of the plan assets under its pension plan by $9,351,000$5.1 million and thus the plan was under-funded as of December 31, 2010.2013.
The following table sets forth the funded status of the Retirement Income Plan and the amounts recognized in RPC’s consolidated balance sheets:
| December 31, | | 2010 | | | 2009 | | | 2013 | | | 2012 | |
| (in thousands) | | | | | | | | | | | | |
| Accumulated Benefit Obligation at end of year | | $ | 35,873 | | | $ | 32,190 | | | $ | 37,528 | | | $ | 42,699 | |
| | | | | | | | | | | | | | | | | |
| CHANGE IN PROJECTED BENEFIT OBLIGATION: | | | | | | | | | | | | | | | | |
| Benefit obligation at beginning of year | | $ | 32,190 | | | $ | 29,203 | | | $ | 42,699 | | | $ | 38,278 | |
| Service cost | | | — | | | | — | | | | — | | | | — | |
| Interest cost | | | 1,893 | | | | 1,938 | | | | 1,741 | | | | 1,869 | |
| Amendments | | | — | | | | — | | | | — | | | | — | |
| Actuarial (gain) loss | | | 3,362 | | | | 2,706 | | |
| Actuarial loss | | | | (5,199 | ) | | | 4,221 | |
| Benefits paid | | | (1,572 | ) | | | (1,657 | ) | | | (1,713 | ) | | | (1,669 | ) |
| Projected benefit obligation at end of year | | $ | 35,873 | | | $ | 32,190 | | | $ | 37,528 | | | $ | 42,699 | |
| CHANGE IN PLAN ASSETS: | | | | | | | | | | | | | | | | |
| Fair value of plan assets at beginning of year | | $ | 24,932 | | | $ | 22,488 | | | $ | 29,519 | | | $ | 24,180 | |
| Actual return on plan assets | | | 2,548 | | | | 4,101 | | | | 3,820 | | | | 2,712 | |
| Employer contribution | | | 614 | | | | — | | | | 800 | | | | 4,296 | |
| Benefits paid | | | (1,572 | ) | | | (1,657 | ) | | | (1,713 | ) | | | (1,669 | ) |
| Fair value of plan assets at end of year | | | 26,522 | | | | 24,932 | | | | 32,426 | | | | 29,519 | |
| | | | | | | | | | | | | | | | | |
| Funded status at end of year | | $ | (9,351 | ) | | $ | (7,258 | ) | | $ | (5,102 | ) | | $ | (13,180 | ) |
| December 31, | | 2010 | | | 2009 | | | 2013 | | | 2012 | |
| (in thousands) | | | | | | | | | | | | |
| AMOUNTS RECOGNIZED IN THE CONSOLIDATED BALANCE SHEETS CONSIST OF: | | | | | | | | | | | | |
| Noncurrent assets | | $ | — | | | $ | — | | | $ | — | | | $ | — | |
| Current liabilities | | | — | | | | — | | | | — | | | | — | |
| Noncurrent liabilities | | | (9,351 | ) | | | (7,258 | ) | | | (5,102 | ) | | | (13,180 | ) |
| | | $ | (9,351 | ) | | $ | (7,258 | ) | | $ | (5,102 | ) | | $ | (13,180 | ) |
NOTES TO CONSOLIDATED FINANCIAL STATEMENTS
RPC, Inc. and Subsidiaries
Years ended December 31, 2010, 2009 and 2008
| December 31, | | 2010 | | | 2009 | | | 2013 | | | 2012 | |
| (in thousands) | | | | | | | | | | | | |
| AMOUNTS (PRE-TAX) RECOGNIZED IN ACCUMULATED OTHER COMPREHENSIVE INCOME (LOSS) CONSIST OF: | | | | | | | | | | | | |
| Net loss (gain) | | $ | 15,642 | | | $ | 13,517 | | | $ | 15,369 | | | $ | 23,129 | |
| Prior service cost (credit) | | | — | | | | — | | | | — | | | | — | |
| Net transition obligation (asset) | | | — | | | | — | | | | — | | | | — | |
| | | $ | 15,642 | | | $ | 13,517 | | | $ | 15,369 | | | $ | 23,129 | |
The accumulated benefit obligation for the Retirement Income Plan at December 31, 20102013 and 20092012 has been disclosed above. The Company uses a December 31 measurement date for this qualified plan.
Amounts recognized in the consolidated balance sheets consist of:
| December 31, | | 2010 | | | 2009 | | | 2013 | | | 2012 | |
| (in thousands) | | | | | | | | | | | | |
| Funded status | | $ | (9,351 | ) | | $ | (7,258 | ) | | $ | (5,102 | ) | | $ | (13,180 | ) |
| SERP contributions/deferrals | | | (9,046 | ) | | | (7,389 | ) | |
| Long-term pension liabilities | | $ | (18,397 | ) | | $ | (14,647 | ) | |
| SERP liability | | | | (16,864 | ) | | | (13,363 | ) |
| Long-term pension liability | | | $ | (21,966 | ) | | $ | (26,543 | ) |
RPC’s funding policy is to contribute to the defined benefit pension plan the amount required, if any, under the Employee Retirement Income Security Act of 1974. RPCAmounts contributed $614,000to the plan totaled $800,000 in 2010 but made no contributions2013 and $4,296,000 in 2009.2012.
The components of net periodic benefit cost are summarized as follows:
| Years ended December 31, | | 2010 | | | 2009 | | | 2008 | | | 2013 | | | 2012 | | | 2011 | |
| (in thousands) | | | | | | | | | | | | | | | | | | |
| Service cost for benefits earned during the period | | $ | — | | | $ | — | | | $ | — | | | $ | — | | | $ | — | | | $ | — | |
| Interest cost on projected benefit obligation | | | 1,893 | | | | 1,938 | | | | 1,841 | | | | 1,741 | | | | 1,869 | | | | 1,916 | |
| Expected return on plan assets | | | (1,720 | ) | | | (1,521 | ) | | | (2,543 | ) | | | (2,043 | ) | | | (1,846 | ) | | | (1,831 | ) |
| Amortization of net loss | | | 409 | | | | 1,538 | | | | 285 | | | | 784 | | | | 667 | | | | 463 | |
| Net periodic benefit plan cost (credit) | | $ | 582 | | | $ | 1,955 | | | $ | (417 | ) | |
| Net periodic benefit plan cost | | | $ | 482 | | | $ | 690 | | | $ | 548 | |
The Company recognized pre-tax (increases) decreases (increases) to the funded status in accumulated other comprehensive loss of $2,125,000$(7,760,000) in 2010, $(1,413,000)2013, $2,688,000 in 20092012 and $9,532,000$4,800,000 in 2008.2011. There were no previously unrecognized prior service costs as of December 31, 2010, 20092013, 2012 and 2008.2011. The pre-tax amounts recognized in accumulated other comprehensive loss for the years ended December 31, 2010, 20092013, 2012 and 20082011 are summarized as follows:
| (in thousands) | | 2010 | | | 2009 | | | 2008 | |
| Net loss (gain) | | $ | 2,534 | | | $ | 125 | | | $ | 9,817 | |
| Amortization of net (loss) gain | | | (409 | ) | | | (1,538 | ) | | | (285 | ) |
| Net transition obligation (asset) | | | — | | | | — | | | | — | |
| Amount recognized in other comprehensive loss | | $ | 2,125 | | | $ | (1,413 | ) | | $ | 9,532 | |
NOTES TO CONSOLIDATED FINANCIAL STATEMENTS
RPC, Inc. and Subsidiaries
Years ended December 31, 2010, 2009 and 2008
(in thousands) | | 2013 | | | 2012 | | | 2011 | |
| Net (gain) loss | | $ | (6,976 | ) | | $ | 3,355 | | | $ | 5,263 | |
| Amortization of net loss | | | (784 | ) | | | (667 | ) | | | (463 | ) |
| Net transition obligation (asset) | | | — | | | | — | | | | — | |
| Amount recognized in accumulated other comprehensive loss | | | (7,760 | ) | | $ | 2,688 | | | $ | 4,800 | |
The amounts in accumulated other comprehensive loss expected to be recognized as components of net periodic benefit cost in 20112014 are as follows:
| (in thousands) | | 2011 | | | 2014 | |
| Amortization of net loss (gain) | | $ | 458 | | |
| Amortization of net loss | | | $ | 484 | |
| Prior service cost (credit) | | | — | | | | — | |
| Net transition obligation (asset) | | | — | | | | — | |
| Estimated net periodic benefit plan cost | | $ | 458 | | | $ | 484 | |
The weighted average assumptions as of December 31 used to determine the projected benefit obligation and net benefit cost were as follows:
| December 31, | | 2010 | | | 2009 | | | 2008 | | | 2013 | | | 2012 | | | 2011 | |
Projected Benefit Obligation: | | | | | | | | | | | | | | | | | | |
| Discount rate | | | 5.49 | % | | | 6.00 | % | | | 6.84 | % | | | 5.20 | % | | | 4.16 | % | | | 5.00 | % |
| Rate of compensation increase | | | N/A | | | | N/A | | | | N/A | | | | N/A | | | | N/A | | | | N/A | |
| Net Benefit Cost: | | | | | | | | | | | | | | | | | | | | | | | | |
| Discount rate | | | 6.00 | % | | | 6.84 | % | | | 6.25 | % | | | 4.16 | % | | | 5.00 | % | | | 5.49 | % |
| Expected return on plan assets | | | 7.00 | % | | | 7.00 | % | | | 8.00 | % | | | 7.00 | % | | | 7.00 | % | | | 7.00 | % |
| Rate of compensation increase | | | N/A | | | | N/A | | | | N/A | | | | N/A | | | | N/A | | | | N/A | |
The Company’s expected return on assets assumption is derived from a detailed periodic assessment conducted by its management and its investment adviser.advisor. It includes a review of anticipated future long-term performance of individual asset classes and consideration of the appropriate asset allocation strategy given the anticipated requirements of the plan to determine the average rate of earnings expected on the funds invested to provide for the pension plan benefits. While the study gives appropriate consideration to recent fund performance and historical returns, the rate of return assumption is derived primarily from a long-term, prospective view. Based on its recent assessment, the Company has concluded that its expected long-term return assumption of seven percent is reasonable.
The Plan’splan’s weighted average asset allocation at December 31, 20102013 and 20092012 by asset category along with the target allocation for 20112014 are as follows:
| Asset Category | | Target Allocation for 2011 | | | Percentage of Plan Assets as of December 31, 2010 | | | Percentage of Plan Assets as of December 31, 2009 | | | Target Allocation for 2014 | | | Percentage of Plan Assets as of December 31, 2013 | | | Percentage of Plan Assets as of December 31, 2012 | |
| | | | | | | | | | | | | | |
| Cash and Cash Equivalents | | | | 0% - 5 | % | | | 0.6 | % | | | 0.2 | % |
| Debt Securities – Core Fixed Income | | | 30.0 | % | | | 26.2 | % | | | 26.2 | % | | | 15% - 50 | % | | | 25.3 | % | | | 20.2 | % |
| Tactical – Fund of Equity and Debt Securities | | | 20.0 | % | | | 10.1 | % | | | 5.2 | % | | | — | | | | — | | | | 15.1 | % |
| Domestic Equity Securities | | | 25.0 | % | | | 26.4 | % | | | 25.0 | % | | | 0% - 30 | % | | | 26.6 | % | | | 15.2 | % |
| Global Equity Securities | | | 2.8 | % | | | 4.3 | % | | | 4.4 | % | | | — | | | | — | | | | 16.0 | % |
| International Equity Securities | | | 8.9 | % | | | 13.8 | % | | | 13.8 | % | | | 0% - 30 | % | | | 31.4 | % | | | 15.1 | % |
| Real Estate | | | 5.6 | % | | | 4.6 | % | | | 4.2 | % | | | 0% - 20 | % | | | 8.3 | % | | | 9.2 | % |
| Real Return | | | 5.6 | % | | | 5.6 | % | | | - | | | | 0% - 20 | % | | | 7.8 | % | | | 9.0 | % |
| Other | | | 2.1 | % | | | 9.0 | % | | | 21.2 | % | |
| Total | | | 100.0 | % | | | 100.0 | % | | | 100.0 | % | | | 100 | % | | | 100.0 | % | | | 100.0 | % |
The Company’s overall investment strategy is to achieve a mix of approximately 70 percent of investments for long-term growth and 30 percent for near-term benefit payments, with a wide diversification of asset types, fund strategies and fund managers. Equity securities primarily include investments in large-cap and mid-cap companies.small-cap companies domiciled domestically and internationally. Fixed-income securities include corporate bonds, of companies in diversifiedmortgage-backed securities, mortgage-backed securities,sovereign bonds, and U.S. Treasuries. Other types of investments include hedgereal estate funds and private equity funds that follow several different investment strategies. For each of the asset categories in the pension plan, the investment strategy is identical – maximize the long-term rate of return on plan assets with an acceptable level of risk in order to minimize the cost of providing pension benefits. The investment policy establishes a target allocation for each asset class which is rebalanced as required.
NOTES TO CONSOLIDATED FINANCIAL STATEMENTS
RPC, Inc. The plans utilize a number of investment approaches, including but not limited to individual market securities, equity and Subsidiaries
Years ended December 31, 2010, 2009fixed income funds in which the underlying securities are marketable, and 2008
debt funds to achieve this target allocation. The Company expects to contribute approximately $765,000 to the pension plan during fiscal year 2014.
Some of our assets, primarily our private equity and real estate and hedge funds, do not have readily determinable market values given the specific investment structures involved and the nature of the underlying investments. For the December 31, 20102013 plan asset reporting, publicly traded asset pricing was used where possible. For assets without readily determinable values, estimates were derived from investment manager statements combined with discussions focusing on underlying fundamentals and significant events.
Included among the asset categories for the Plans’ investments are real estate and other investments comprised of investments in real estate and hedge funds. These Additionally, these investments are categorized as level 3 investments and are valued using significant non-observable inputs which do not have a readily determinable fair value. In accordance with ASU No. 2009-12 “Investments In Certain Entities That Calculate Net Asset Value per Share (Or Its Equivalent),” these investments are valued based on the net asset value per share calculated by the funds in which the plan has invested. These valuations are subject to judgments and assumptions of the funds which may prove to be incorrect, resulting in risks of incorrect valuation of these investments. The Company seeks to mitigate against these risks by evaluating the appropriateness of the funds’ judgments and assumptions by reviewing the financial data included in the funds’ financial statements for reasonableness.
The following table presentstables present our plan assets using the fair value hierarchy as of December 31, 20102013 and December 31, 2009.2012. The fair value hierarchy has three levels based on the reliability of the inputs used to determine fair value. See Note 8 for a brief description of the three levels under the fair value hierarchy.
Fair Value Hierarchy as of December 31, 2010:2013:
Investments (in thousands) | | | | | Total | | | Level 1 | | | Level 2 | | | Level 3 | | | | | | Total | | | Level 1 | | | Level 2 | | | Level 3 | |
| Cash and Cash Equivalents | | | (1) | | | $ | 2,081 | | | $ | 2,081 | | | $ | - | | | $ | - | | | | (1 | ) | | $ | 210 | | | $ | 210 | | | $ | — | | | $ | — | |
| Fixed Income Securities | | | (2) | | | | 6,937 | | | | - | | | | 6,937 | | | | - | | | | (2 | ) | | | 8,201 | | | | — | | | | 8,201 | | | | — | |
| Domestic Equity Securities | | | | | | | 7,015 | | | | 7,015 | | | | - | | | | - | | | | | | | | 8,590 | | | | 8,590 | | | | — | | | | — | |
| Global Equity Securities | | | | | | | 1,153 | | | | - | | | | 1,153 | | | | - | | | | | | | | — | | | | — | | | | — | | | | — | |
| International Equity Securities | | | (3) | | | | 3,672 | | | | 1,636 | | | | 2,036 | | | | - | | | | (3 | ) | | | 10,192 | | | | — | | | | 10,192 | | | | — | |
| Tactical Composite | | | (4) | | | | 2,687 | | | | - | | | | 2,687 | | | | - | | | | (4 | ) | | | — | | | | — | | | | — | | | | — | |
| Real Estate | | | (5) | | | | 1,210 | | | | - | | | | - | | | | 1,210 | | | | (5 | ) | | | 2,705 | | | | — | | | | — | | | | 2,705 | |
| Real Return | | | (6) | | | | 1,492 | | | | - | | | | 1,492 | | | | - | | | | (6 | ) | | | 2,528 | | | | — | | | | 2,528 | | | | — | |
| Alternative Investments | | | (7) | | | | 275 | | | | - | | | | - | | | | 275 | | |
| | | | | | | $ | 26,522 | | | $ | 10,732 | | | $ | 14,305 | | | $ | 1,485 | | | | | | | $ | 32,426 | | | $ | 8,800 | | | $ | 20,921 | | | $ | 2,705 | |
| | | | | | | | | | | | | | | | | | | | | | |
Fair Value Hierarchy as of December 31, 2009:2012:
Investments (in thousands) | | | | | Total | | | Level 1 | | | Level 2 | | | Level 3 | | | | | | Total | | | Level 1 | | | Level 2 | | | Level 3 | |
| Cash and Cash Equivalents | | | (1) | | | $ | 943 | | | $ | 943 | | | $ | - | | | $ | - | | | | (1 | ) | | $ | 61 | | | $ | 61 | | | $ | — | | | $ | — | |
| Fixed Income Securities | | | (2) | | | | 6,529 | | | | - | | | | 6,529 | | | | - | | | | (2 | ) | | | 5,959 | | | | — | | | | 5,959 | | | | — | |
| Domestic Equity Securities | | | | | | | 6,237 | | | | 6,237 | | | | - | | | | - | | | | | | | | 4,475 | | | | 4,475 | | | | — | | | | — | |
| Global Equity Securities | | | | | | | 1,085 | | | | - | | | | 1,085 | | | | - | | | | | | | | 4,446 | | | | 4,446 | | | | — | | | | — | |
| International Equity Securities | | | (3) | | | | 3,440 | | | | 1,475 | | | | 1,965 | | | | - | | | | (3 | ) | | | 4,737 | | | | 2,205 | | | | 2,532 | | | | — | |
| Tactical Composite | | | | (4 | ) | | | 4,454 | | | | — | | | | 4,454 | | | | — | |
| Real Estate | | | (5) | | | | 1,039 | | | | - | | | | - | | | | 1,039 | | | | (5 | ) | | | 2,730 | | | | — | | | | — | | | | 2,730 | |
| Alternative Investments | | | (7) | | | | 5,659 | | | | - | | | | 1,302 | | | | 4,357 | | |
| Real Return | | | | (6 | ) | | | 2,657 | | | | — | | | | 2,657 | | | | — | |
| | | | | | | $ | 24,932 | | | $ | 8,655 | | | $ | 10,881 | | | $ | 5,396 | | | | | | | $ | 29,519 | | | $ | 11,187 | | | $ | 15,602 | | | $ | 2,730 | |
| | | | | | | | | | | | | | | | | | | | | | |
| | (1) | Cash and cash equivalents, which are used to pay benefits and plan administrative expenses, are held in Rule 2a-7 money market funds. |
| | (2) | Fixed income securities are primarily valued using a market approach with inputs that include broker quotes, benchmark yields, base spreads and reported trades. |
| | (3) | Some international equity securities are valued using a market approach based on the quoted market prices of identical instruments in their respective markets. |
| | (4) | Tactical composite funds invest in stocks, bonds and cash, both domestic and international. These assets are valued primarily using a market approach based on the quoted market prices of identical instruments in their respective markets. |
| | (5) | Real estate fund values are primarily reported by the fund manager and are based on valuation of the underlying investments, which include inputs such as cost, discounted future cash flows, independent appraisals and market based comparable data. |
NOTES TO CONSOLIDATED FINANCIAL STATEMENTS
RPC, Inc. and Subsidiaries
Years ended December 31, 2010, 2009 and 2008
| | (6) | Real return funds invest in global equities, commodities and inflation protected core bonds that are valued primarily using a market approach based on the quoted market prices of identical instruments in their respective markets. |
| (7) | Alternative investments consist of fund-of-fund LLC or commingled fund structures. The LLCs are primarily valued based on Net Asset Values [NAV] calculated by the fund and are not publicly available. Liquidity for the LLCs is monthly and is subject to liquidity of the underlying funds. The commingled fund NAV is calculated by the manager on a daily basis and has monthly liquidity. |
The following table presents a reconciliation of Level 3 assets held during the year ended December 31, 2013:
Investments (in thousands) | | Balance at December 31, 2012 | | | Net Realized and Unrealized Gains/(Losses) | | | Net Purchases, Issuances and Settlements | | | Net
Transfers
In to (Out
of) Level 3 | | | Balance at December 31, 2013 | |
| Real Estate | | $ | 2,730 | | | $ | 217 | | | $ | (242 | ) | | $ | — | | | $ | 2,705 | |
The following table presents a reconciliation of Level 3 assets held during the year ended December 31, 2010:
| | | | | | | | | | | |
Investments (in thousands) | | Balance at December 31, 2009 | | Net Realized and Unrealized Gains/(Losses) | | Net Purchases, Issuances and Settlements | | Net Transfers In to (Out of) Level 3 | | Balance at December 31, 2010 |
| Real Estate | $ | 1,039 | $ | 171 | $ | - | $ | - | $ | 1,210 |
| Alternative Investments | | 4,357 | | (235) | | (2,127) | | (1,720) | | 275 |
| | $ | 5,396 | $ | (64) | $ | (2,127) | $ | (1,720) | $ | 1,485 |
The following table presents a reconciliation of Level 3 assets held during the year ended December 31, 2009:
| | | | | | | | | | | |
Investments (in thousands) | | Balance at December 31, 2009 | | Net Realized and Unrealized Gains/(Losses) | | Net Purchases, Issuances and Settlements | | Net Transfers In to (Out of) Level 3 | | Balance at December 31, 2010 |
| Real Estate | $ | 1,723 | $ | (360) | $ | (324) | $ | - | $ | 1,039 |
| Alternative Investments | | 4,114 | | 243 | | - | | - | | 4,357 |
| | $ | 5,837 | $ | (117) | $ | (324) | $ | - | $ | 5,396 |
The Company expects to contribute approximately $600,000 to the Retirement Income Plan in 2011 and does not expect to receive a refund in 2011. Investments (in thousands) | | Balance at December 31, 2011 | | | Net Realized and Unrealized Gains/(Losses) | | | Net Purchases, Issuances and Settlements | | | Net
Transfers
In to (Out
of) Level 3 | | | Balance at December 31, 2012 | |
| Real Estate | | $ | 1,350 | | | $ | 365 | | | $ | 1,015 | | | $ | — | | | $ | 2,730 | |
The Company estimates that the future benefits payable for the Retirement Income Plan over the next ten years are as follows:
| (in thousands) | | | |
| 2011 | | $ | 1,659 | |
| 2012 | | | 1,761 | |
| 2013 | | | 1,867 | |
| 2014 | | | 1,962 | |
| 2015 | | | 2,036 | |
| 2016-2020 | | | 11,716 | |
(in thousands) | | | |
| 2014 | | $ | 1,896 | |
| 2015 | | | 1,989 | |
| 2016 | | | 2,189 | |
| 2017 | | | 2,254 | |
| 2018 | | | 2,346 | |
| 2019-2023 | | | 12,614 | |
Supplemental Executive Retirement Plan (SERP)
The Company permits selected highly compensated employees to defer a portion of their compensation into the SERP. The SERP assets are invested primarily in company-owned life insurance (“COLI”) policies as a funding source forto satisfy the deferred compensation obligations inof the SERP. The assets are subject to claims by creditors, and the Company can designate them to another purpose at any time. Investments in COLI policies consisted of $17.3$47.4 million in variable life insurance policies as of December 31, 20102013 and $44.3 million as of December 31, 2009.2012. In the COLI policies, the Company is able to allocate investment of the assets across a set of choices provided by the insurance company, including fixed income securities and equity funds. The COLI policies are recorded at their net cash surrender values, which approximates fair value, as provided by the issuing insurance company, whose Standard & Poor’s credit rating was A+.
NOTES TO CONSOLIDATED FINANCIAL STATEMENTS
RPC, Inc. and Subsidiaries
Years ended December 31, 2010, 2009 and 2008
The Company classifies the SERP assets as trading securities as described in Note 1. The fair value of these assets totaled $8,445,000$13,963,000 as of December 31, 20102013 and $6,905,000$11,103,000 as of December 31, 2009.2012. The SERP assets are reported in other assets on the balance sheet. The changes in the fair value of these assets, and normal insurance expenses are recorded in the consolidated statement of operations as part of other income (expense), net. Trading gains (losses) related to the SERP assets totaled $701,000$2,026,000 in 2013, $1,352,000 in 2012, and $(194,000) for 2010, $1,373,000 for 2009 and $(1,661,000) for 2008.2011. The SERP deferrals and the contributions areliability is recorded on the balance sheet in long-term pension liabilities with any change in the fair value of the liabilities recorded as compensation cost within selling, general and administrative expenses in the statement of operations.
401(k) Plan
RPC sponsors a defined contribution 401(k) plan that is available to substantially all full-time employees with more than three months of service. This plan allows employees to make tax-deferred contributions from one to 25 percent of their annual compensation, not exceeding the permissible contribution imposed by the Internal Revenue Code. RPC matches 50 percent of each employee’s contributions that do not exceed six percent of the employee’s compensation, as defined by the plan. Employees vest in the RPC contributions after three years of service. The charges to expense for the Company’s contributions to the 401(k) plan were approximately $2,485,000$5,451,000 in 2010, $2,621,0002013, $5,088,000 in 20092012, and $2,814,000$4,074,000 in 2008.2011.
Stock Incentive Plans
The Company has issued stock options and restricted stock to employees under two 10 year stock incentive plans that were approved by stockholders in 1994 and 2004. The 1994 plan expired in 2004. The Company reserved 7,593,750 shares of common stock under the 2004 Plan which expires in 2014. This plan provides for the issuance of various forms of stock incentives, including, among others, incentive and non-qualified stock options and restricted stock which are discussed in detail below. As of December 31, 2010,2013, there were approximately 2,700,0001,355,431 shares available for grants. The Company issues new shares from its authorized but unissued share pool.
The Company recognizes compensation expense for the unvested portion of awards outstanding over the remainder of the service period. The compensation cost recorded for these awards is based on their fair value at the grant date less the cost of estimated forfeitures. Forfeitures are estimated at the time of grant and revised, if necessary, in subsequent periods to reflect actual forfeitures. Cash flows related to share-based payment awards to employees that result in tax benefits in excess of recognized cumulative compensation cost (excess tax benefits) are classified as a financing activity in the accompanying consolidated statements of cash flows.
Pre-tax stock-based employee compensation expense was $4,909,000$8,177,000 in 20102013 ($3,117,0005,192,000 after tax), $4,440,000$7,860,000 in 20092012 ($2,819,0004,991,000 after tax) and $3,732,000$8,075,000 in 20082011 ($2,382,0005,128,000 after tax).
Stock Options
Stock options are granted at an exercise price equal to the fair market value of the Company’s common stock at the date of grant except for grants of incentive stock options to owners of greater than 10 percent of the Company’s voting securities which must be made at 110 percent of the fair market value of the Company’s common stock. Options generally vest ratably over a period of five years and expire in 10 years, except incentive stock options granted to owners of greater than 10 percent of the Company’s voting securities, which expire in five years.
The Company estimates the fair value of stock options as of the date of grant using the Black-Scholes option pricing model. The Company has not granted stock options to employees since 2003.
NOTES TO CONSOLIDATED FINANCIAL STATEMENTS
RPC, Inc.There were no stock options exercised during 2013 and Subsidiaries
Years endedthere have been no stock options outstanding since December 31, 2010, 2009 and 2008
Transactions involving RPC’s stock options for the year ended December 31, 2010 were as follows:
| | | Shares | | | Weighted Average Exercise Price | | | Weighted Average Remaining Contractual Life | | Aggregate Intrinsic Value | |
| Outstanding at January 1, 2010 | | | 1,291,091 | | | $ | 2.26 | | | 2.25 years | | | | |
| Granted | | | - | | | | - | | | N/A | | | |
| Exercised | | | (180,192 | ) | | | 2.73 | | | N/A | | | |
| Forfeited | | | (40,511 | ) | | | 2.13 | | | N/A | | | |
| Expired | | | - | | | | - | | | N/A | | | | |
| Outstanding at December 31, 2010 | | | 1,070,388 | | | $ | 2.26 | | | 1.23 years | | | $ | 16,977,000 | |
| Exercisable at December 31, 2010 | | | 1,070,388 | | | $ | 2.26 | | | 1.23 years | | | $ | 16,977,000 | |
2012. The total intrinsic value of stock options exercised was approximately $2,293,000$7,467,000 during 2010, $1,519,0002012 and $11,882,000 during 2009 and $6,214,000 during 2008. There were no recognized excess tax2011. Tax benefits associated with the exercise of stock options exercised totaled $431,000 during 2010, since all2012 and $799,000 during 2011 and were credited to capital in excess of the stock options exercised in 2010 were incentive stock options which do not generate tax deductions for the Company. Recognized excess tax benefits associated with the exercise of stock options were approximately $353,000 during 2009par value and $344,000 during 2008.are classified as financing cash flows.
Restricted Stock
The Company has granted employees two forms of restricted stock: time lapse restricted and performance restricted.
Time lapse restricted shares
Time lapse restricted sharesstock which vest after a stipulated number of years from the grant date, depending on the terms of the issue. Time lapse restricted shares issued in years 2003 and prior vest after ten years. Time lapse restricted shares issued subsequent to fiscal year 2003 vest in 20 percent increments annually starting with the second anniversary of the grant, over six years from the date of grant. Grantees receive dividends declared and retain voting rights for the granted shares.
Performance restricted shares
The performance restricted shares are granted, but not earned and issued until certain five-year tiered performance criteria are met. The performance criteria are predetermined market prices of RPC’s common stock. On the date the common stock appreciates to each level (determination date), 20 percent of performance shares are earned. Once earned, the performance shares vest five years from the determination date. After the determination date, the grantee will receive dividends declared and voting rights to the shares. The Company has not granted performance restricted shares since 1999.
The agreementsagreement under which the restricted stock is issued provideprovides that shares awarded may not be sold or otherwise transferred until restrictions or, established under the stock plans have lapsed. Upon termination of employment from RPC (other than due to death, disability or in certain cases, termination of employment from Marine Products Corporationretirement on or Chaparral Boats, Inc.after age 65), shares with restrictions must be returned to RPC.the Company.
The following is a summary of the changes in non-vested restricted shares for the year ended December 31, 2010:2013:
| | | Shares | | | Weighted Average Grant-Date Fair Value | | | Shares | | | Weighted Average Grant- Date Fair Value | |
| Non-vested shares at January 1, 2010 | | | 2,973,174 | | | $ | 7.25 | | |
| Non-vested shares at January 1, 2013 | | | | 4,494,191 | | | $ | 8.12 | |
| Granted | | | 849,000 | | | | 8.21 | | | | 850,500 | | | | 13.68 | |
| Vested | | | (629,933 | ) | | | 7.25 | | | | (1,078,534 | ) | | | 6.36 | |
| Forfeited | | | (184,888 | ) | | | 7.31 | | | | (151,357 | ) | | | 9.72 | |
| Non-vested shares at December 31, 2010 | | | 3,007,353 | | | $ | 7.58 | | |
| Non-vested shares at December 31, 2013 | | | | 4,114,800 | | | $ | 9.67 | |
The fair value of restricted share awards is based on the market price of the Company’s stock on the date of the grant and is amortized to compensation expense on a straight-line basis over the requisite service period. The weighted average grant date fair value of these restricted stock awards was $8.21, $5.70$13.68 for 2013, $11.69 for 2012 and $6.54$11.59 for the years ended December 31, 2010, 2009 and 2008.2011. The total fair value of shares vested was approximately $5,079,000$15,471,000 during 2010, $3,976,0002013, $10,695,000 during 20092012 and $3,675,000$11,861,000 during 2008.2011. The tax benefit for compensation tax deductions in excess of compensation expense was credited to capital in excess of par value aggregating $651,000$3,178,000 for 2010, $1,068,0002013, $2,293,000 for 20092012 and $502,000$2,572,000 for 2008.2011. The excess tax deductions are classified as a financing activity in the accompanying consolidated statements of cash flows.
NOTES TO CONSOLIDATED FINANCIAL STATEMENTS
RPC, Inc. and Subsidiaries
Years ended December 31, 2010, 2009 and 2008
Other Information
As of December 31, 2010,2013, total unrecognized compensation cost related to non-vested restricted shares was approximately $20,812,000$34,614,000 which is expected to be recognized over a weighted-average period of 3.63.2 years. As of December 31, 2010,2013, there was no unrecognized compensation cost related to non-vested stock options.
The Company received cash from options exercised of $240,000$544,000 during 2010, $122,0002012 and $728,000 during 2009 and $347,000 during 2008.2011. These cash receipts are classified as a financing activity in the accompanying consolidated statements of cash flows. The fair value of shares tendered to exercise employee stock options totaled approximately $144,000$377,000 during 2010, $389,0002012 and $720,000 during 2009 and $1,911,000 during 20082011 and have been excluded from the consolidated statements of cash flows.
Note 11: Related Party Transactions
Related Party Transactions
Marine Products Corporation
Effective February 28,in 2001, the Company spun-offspun off the business conducted through Chaparral Boats, Inc. (“Chaparral”), RPC’s former powerboat manufacturing segment. RPC accomplished the spin-off by contributing 100 percent of the issued and outstanding stock of Chaparral to Marine Products Corporation (a Delaware corporation) (“Marine Products”), a newly formed wholly-ownedwholly owned subsidiary of RPC, and then distributing the common stock of Marine Products to RPC stockholders. In conjunction with the spin-off, RPC and Marine Products entered into various agreements that define the companies’ relationship.
In accordance with a Transition Support Services agreement, which may be terminated by either party, RPC provides certain administrative services, including financial reporting and income tax administration, acquisition assistance, etc., to Marine Products. Charges from the Company (or from corporations that are subsidiaries of the Company) for such services aggregated approximately $689,000were $670,000 in 2010, $713,0002013, $544,000 in 20092012, and $842,000$639,000 in 2008.2011. The Company’s receivable due from Marine Products for these services was $145,000 as of December 31, 20102013 and 2009 was approximately $65,000.$94,000 as of December 31, 2012. The Company’s directors are also directors of Marine Products and all of the executive officers are employees of both the Company and Marine Products.
Other
The Company periodically purchases in the ordinary course of business products or services from suppliers, who are owned by significant officers or stockholders, or affiliated with the directors of RPC. The total amounts paid to these affiliated parties were approximately $551,000$1,039,000 in 2010, $409,0002013, $1,676,000 in 20092012 and $393,000$1,469,000 in 2008.2011.
RPC receives certain administrative services and rents office space from Rollins, Inc. (a company of which Mr. R. Randall Rollins is also Chairman and which is otherwise affiliated with RPC). The service agreements between Rollins, Inc. and the Company provide for the provision of services on a cost reimbursement basis and are terminable on six monthsmonths’ notice. The services covered by these agreements include office space, administration of certain employee benefit programs, and other administrative services. Charges to the Company (or to corporations which are subsidiaries of the Company) for such services and rent totaled $94,000$83,000 in 2010, $87,0002013 and 2012, and $102,000 in 2009 and $90,000 in 2008.2011.
A group that includes the Company’s Chairman of the Board, R. Randall Rollins and his brother Gary W. Rollins, who is also a director of the Company, and certain companies under their control, controls in excess of fifty percent of the Company’s voting power.
Note 12: Business Segment Information
RPC’s service lines have been aggregated into two reportable oil and gas services segments — Technical Services and Support Services — because of the similarities between the financial performance and approach to managing the service lines within each of the segments, as well as the economic and business conditions impacting their business activity levels. Corporate includes selected administrative costs incurred by the Company.
NOTES TO CONSOLIDATED FINANCIAL STATEMENTS
RPC, Inc. and Subsidiaries
Years ended December 31, 2010, 2009 and 2008
Technical Services include RPC’s oil and gas service lines that utilize people and equipment to perform value-added completion, production and maintenance services directly to a customer’s well. These services include pressure pumping services, coiled tubing, snubbing, nitrogen pumping, well control consulting and firefighting, downhole tools, wireline, and fluid pumping services. These Technical Services are primarily used in the completion, production and maintenance of oil and gas wells. The principal markets for this segment include the United States, including the Gulf of Mexico, the mid-continent, southwest, Rocky Mountain and northeastAppalachian regions, and international locations including primarily Africa, Canada, China, Latin America, the Middle East and New Zealand. Customers include major multi-national and independent oil and gas producers, and selected nationally-owned oil companies.
Support Services include RPC’s oil and gas service lines that primarily provide equipment for customer use or services to assist customer operations. The equipment and services include drill pipe and related tools, pipe handling, inspection and storage services, and oilfield training services. The demand for these services tends to be influenced primarily by customer drilling-related activity levels. The principal markets for this segment include the United States, including the Gulf of Mexico, the mid-continent and Appalachian regions, and international locations, including primarily Canada, Latin America, and the Middle East. Customers include domestic operations of major multi-national and independent oil and gas producers, and selected nationally-owned oil companies.
The accounting policies of the reportable segments are the same as those described in Note 1 to these consolidated financial statements. RPC evaluates the performance of its segments based on revenues, operating profits and return on invested capital. Gains or losses on disposition of assets are reviewed by the Company’s chief decision maker on a consolidated basis, and accordingly the Company does not report gains or losses at the segment level. Inter-segment revenues are generally recorded in segment operating results at prices that management believes approximate prices for arm’s length transactions and are not material to operating results.
Summarized financial information concerning RPC’s reportable segments for the years ended December 31, 2010, 20092013, 2012 and 20082011 are shown in the following table.table:
| | | Technical Services | | | Support Services | | | Corporate | | | Gain on disposition of assets, net | | | Total | |
| (in thousands) | | | | | | | | | | | | | | | |
| 2010 | | | | | | | | | | | | | | | |
| Revenues | | $ | 979,834 | | | $ | 116,550 | | | $ | — | | | $ | — | | | $ | 1,096,384 | |
| Operating profit (loss) | | | 217,144 | | | | 31,086 | | | | (13,143 | ) | | | 3,758 | | | | 238,845 | |
| Capital expenditures | | | 163,362 | | | | 23,012 | | | | 1,112 | | | | — | | | | 187,486 | |
| Depreciation and amortization | | | 106,480 | | | | 26,640 | | | | 240 | | | | — | | | | 133,360 | |
| Identifiable assets | | | 668,081 | | | | 158,577 | | | | 61,213 | | | | — | | | | 887,871 | |
| 2009 | | | | | | | | | | | | | | | | | | | | |
| Revenues | | $ | 513,289 | | | $ | 74,574 | | | $ | — | | | $ | — | | | $ | 587,863 | |
| Operating profit (loss) | | | (20,328 | ) | | | (1,636 | ) | | | (12,231 | ) | | | 1,143 | | | | (33,052 | ) |
| Capital expenditures | | | 48,175 | | | | 19,220 | | | | 435 | | | | — | | | | 67,830 | |
| Depreciation and amortization | | | 101,780 | | | | 28,085 | | | | 715 | | | | — | | | | 130,580 | |
| Identifiable assets | | | 453,133 | | | | 144,905 | | | | 51,005 | | | | — | | | | 649,043 | |
| 2008 | | | | | | | | | | | | | | | | | | | | |
| Revenues | | $ | 745,991 | | | $ | 130,986 | | | $ | — | | | $ | — | | | $ | 876,977 | |
| Operating profit (loss) | | | 110,648 | | | | 36,515 | | | | (9,360 | ) | | | 6,367 | | | | 144,170 | |
| Capital expenditures | | | 127,054 | | | | 42,238 | | | | 1,026 | | | | — | | | | 170,318 | |
| Depreciation and amortization | | | 92,738 | | | | 24,798 | | | | 867 | | | | — | | | | 118,403 | |
| Identifiable assets | | | 564,708 | | | | 181,991 | | | | 46,762 | | | | — | | | | 793,461 | |
NOTES TO CONSOLIDATED FINANCIAL STATEMENTS
RPC, Inc. and Subsidiaries
Years ended December 31, 2010, 2009 and 2008
| | | Technical Services | | | Support Services | | | Corporate | | | Loss on disposition of assets, net | | | Total | |
(in thousands) | | | | | | | | | | | | | | | |
2013 | | | | | | | | | | | | | | | |
| Revenues | | $ | 1,729,732 | | | $ | 131,757 | | | $ | — | | | $ | — | | | $ | 1,861,489 | |
| Operating profit (loss) | | | 276,246 | | | | 26,223 | | | | (17,685 | ) | | | (9,371 | ) | | | 275,413 | |
| Capital expenditures | | | 167,586 | | | | 32,250 | | | | 1,845 | | | | — | | | | 201,681 | |
| Depreciation and amortization | | | 181,026 | | | | 31,417 | | | | 685 | | | | — | | | | 213,128 | |
| Identifiable assets | | | 1,113,877 | | | | 202,243 | | | | 67,740 | | | | — | | | | 1,383,860 | |
2012 | | | | | | | | | | | | | | | | | | | | |
| Revenues | | $ | 1,794,015 | | | $ | 151,008 | | | $ | — | | | $ | — | | | $ | 1,945,023 | |
| Operating profit (loss) | | | 420,231 | | | | 45,912 | | | | (17,654 | ) | | | (6,099 | ) | | | 442,390 | |
| Capital expenditures | | | 277,686 | | | | 46,053 | | | | 5,197 | | | | — | | | | 328,936 | |
| Depreciation and amortization | | | 183,762 | | | | 30,707 | | | | 430 | | | | — | | | | 214,899 | |
| Identifiable assets | | | 1,128,124 | | | | 175,611 | | | | 63,428 | | | | — | | | | 1,367,163 | |
2011 | | | | | | | | | | | | | | | | | | | | |
| Revenues | | $ | 1,663,793 | | | $ | 146,014 | | | $ | — | | | $ | — | | | $ | 1,809,807 | |
| Operating profit (loss) | | | 451,259 | | | | 51,672 | | | | (17,019 | ) | | | (3,831 | ) | | | 482,081 | |
| Capital expenditures | | | 369,568 | | | | 42,837 | | | | 3,995 | | | | — | | | | 416,400 | |
| Depreciation and amortization | | | 152,252 | | | | 27,464 | | | | 189 | | | | — | | | | 179,905 | |
| Identifiable assets | | | 1,103,341 | | | | 177,974 | | | | 56,896 | | | | — | | | | 1,338,211 | |
The following summarizes selected information between the United States and all international locations combined for the years ended December 31, 2010, 20092013, 2012 and 2008.2011. The revenues are presented based on the location of the use of the product or service. Assets related to international operations are less than 10 percent of RPC’s consolidated assets, and therefore are not presented.
| Years ended December 31, | | 2010 | | | 2009 | | | 2008 | | | 2013 | | | 2012 | | | 2011 | |
| (in thousands) | | | | | | | | | | | | | | | | | | |
| United States Revenues | | $ | 1,041,461 | | | $ | 543,026 | | | $ | 846,202 | | | $ | 1,795,592 | | | $ | 1,870,815 | | | $ | 1,757,661 | |
| International Revenues | | | 54,923 | | | | 44,837 | | | | 30,775 | | | | 65,897 | | | | 74,208 | | | | 52,146 | |
| | | $ | 1,096,384 | | | $ | 587,863 | | | $ | 876,977 | | | $ | 1,861,489 | | | $ | 1,945,023 | | | $ | 1,809,807 | |
Item 9. Changes in and Disagreements with Accountants on Accounting and Financial Disclosure
None.
Item 9A. Controls and Procedures
Evaluation of disclosure controls and procedures— The Company maintains disclosure controls and procedures that are designed to ensure that information required to be disclosed in its Exchange Act reports is recorded, processed, summarized and reported within the time periods specified in the Commission’s rules and forms, and that such information is accumulated and communicated to its management, including the Chief Executive Officer and Chief Financial Officer, as appropriate, to allow timely decisions regarding required disclosure.
As of the end of the period covered by this report, December 31, 20102013 (the “Evaluation Date”), the Company carried out an evaluation, under the supervision and with the participation of its management, including the Chief Executive Officer and Chief Financial Officer, of the effectiveness of the design and operation of its disclosure controls and procedures. Based upon this evaluation, the Chief Executive Officer and the Chief Financial Officer concluded that the Company’s disclosure controls and procedures were effective at a reasonable assurance level as of the Evaluation Date.
Management’s report on internal control over financial reporting— Management is responsible for establishing and maintaining adequate internal control over financial reporting, as such term is defined in Exchange Act Rules 13a-15(f) and 15d-15(f). Management’s report on internal control over financial reporting is included on page 3029 of this report. Grant Thornton LLP, the Company’s independent registered public accounting firm, has audited the effectiveness of internal control as of December 31, 20102013 and issued a report thereon which is included on page 3130 of this report.
Changes in internal control over financial reporting— Management’s evaluation of changes in internal control did not identify any changes in the Company’s internal control over financial reporting that occurred during the Company’s most recent fiscal quarter that have materially affected, or are reasonably likely to materially affect, the Company’s internal control over financial reporting.
Item 9B. Other Information
None.
PART III
Item 10. Directors, Executive Officers and Corporate Governance
Information concerning directors and executive officers will be included in the RPC Proxy Statement for its 20112014 Annual Meeting of Stockholders, in the section titled “Election of Directors.” This information is incorporated herein by reference. Information about executive officers is contained on page 1413 of this document.
Audit Committee and Audit Committee Financial Expert
Information concerning the Audit Committee of the Company and the Audit Committee Financial Expert(s) will be included in the RPC Proxy Statement for its 20112014 Annual Meeting of Stockholders, in the section titled “Corporate Governance and Board of Directors, Committees and Meetings – Audit Committee.” This information is incorporated herein by reference.
Code of Ethics
RPC, Inc. has a Code of Business Conduct that applies to all employees. In addition, the Company has a Code of Business Conduct and Ethics for Directors and Executive Officers and Related Party Transaction Policy. Both of these documents are available on the Company’s websiteWeb site at www.rpc.net. Copies are available at no charge by writing to Attention: Human Resources, RPC, Inc., 2801 Buford Highway, Suite 520, N.E., Atlanta GA 30329.
RPC, Inc. intends to satisfy the disclosure requirement under Item 10 of Form 8-K regarding an amendment to, or waiver from, a provision of its code that relates to any elements of the code of ethics definition enumerated in SEC rules by posting such information on its internet website, the address of which is provided above.
Section 16(a) Beneficial Ownership Reporting Compliance
Information regarding compliance with Section 16(a) of the Exchange Act will be included under “Section 16(a) Beneficial Ownership Reporting Compliance” in the Company’s Proxy Statement for its 20112014 Annual Meeting of Stockholders, which is incorporated herein by reference.
Item 11. Executive Compensation
Information concerning director and executive compensation will be included in the RPC Proxy Statement for its 20112014 Annual Meeting of Stockholders, in the sections titled “Compensation Committee Interlocks and Insider Participation,” “Director Compensation,” “Compensation Discussion and Analysis,” “Compensation Committee Report” and “Executive Compensation.” This information is incorporated herein by reference.
Item 12. Security Ownership of Certain Beneficial Owners and Management and Related Stockholder Matters
Information concerning security ownership will be included in the RPC Proxy Statement for its 20112014 Annual Meeting of Stockholders, in the sections “Capital Stock” and “Election of Directors.” This information is incorporated herein by reference.
Securities Authorized for Issuance Under Equity Compensation Plans
The following table sets forth certain information regarding equity compensation plans as of December 31, 2010.2013.
| Plan Category | | (A) Number of Securities To Be Issued Upon Exercise of Outstanding Options, Warrants and Rights | | | (B) Weighted Average Exercise Price of Outstanding Options, Warrants and Rights | | | (C) Number of Securities Remaining Available for Future Issuance Under Equity Compensation Plans (Excluding Securities Reflected in Column (A)) | | | (A) Number of Securities To Be Issued Upon Exercise of Outstanding Options, Warrants and Rights | | | (B) Weighted Average Exercise Price of Outstanding Options, Warrants and Rights | | | (C) Number of Securities Remaining Available for Future Issuance Under Equity Compensation Plans (Excluding Securities Reflected in Column (A)) | |
| Equity compensation plans approved by securityholders | | | 1,070,388 | | | $ | 2.26 | | | 2,676,129 | (1) | | | — | | | | $ — | | | | | | | | 1,355,431 | (1) |
| Equity compensation plans not approved by securityholders | | | - | | | | - | | | - | | | | — | | | | — | | | | | | | | — | |
| Total | | | 1,070,388 | | | $ | 2.26 | | | 2,676,129 | | | | — | | | | $ — | | | | | | | | 1,355,431 | |
| (1) | All of the securities can be issued in the form of restricted stock or other stock awards. |
See Note 10 to the Consolidated Financial Statements for information regarding the material terms of the equity compensation plans.
Item 13. Certain Relationships and Related Party Transactions and Director Independence
Information concerning certain relationships and related party transactions will be included in the RPC Proxy Statement for its 20112014 Annual Meeting of Stockholders, in the sections titled, “Certain Relationships and Related Party Transactions.” Information regarding director independence will be included in the RPC Proxy Statement for its 20112014 Annual Meeting of Stockholders in the section titled “Director Independence and NYSE Requirements.” This information is incorporated herein by reference.
Item 14. Principal Accounting Fees and Services
Information regarding principal accountant fees and services will be included in the section titled “Independent Registered Public Accounting Firm” in the RPC Proxy Statement for its 20112014 Annual Meeting of Stockholders. This information is incorporated herein by reference.
PART IV
PART IV
Item 15. Exhibits and Financial Statement Schedules
Consolidated Financial Statements, Financial Statement Schedule and Exhibits
| 1. | Consolidated financial statements listed in the accompanying Index to Consolidated Financial Statements and Schedule are filed as part of this report. |
| 2. | The financial statement schedule listed in the accompanying Index to Consolidated Financial Statements and Schedule is filed as part of this report. |
| 3. | Exhibits listed in the accompanying Index to Exhibits are filed as part of this report. The following such exhibits are management contracts or compensatory plans or arrangements: |
| | 10.1 | 2004 Stock Incentive Plan (incorporated herein by reference to Appendix B to the Registrant’s definitive Proxy Statement filed on March 24, 2004). |
| | 10.6 | Form of stock option grant agreement (incorporated herein by reference to Exhibit 10.1 to Form 10-Q filed on November 2, 2004). |
| 10.7 | Form of time lapse restricted stock grant agreement (incorporated herein by reference to Exhibit 10.2 to Form 10-Q filed on November 2, 2004). |
| | 10.810.7 | Form of performance restricted stock grant agreement (incorporated herein by reference to Exhibit 10.3 to Form 10-Q filed on November 2, 2004). |
| | 10.8 | Supplemental Retirement Plan (incorporated herein by reference to Exhibit 10.11 to the Form 10-K filed on March 16, 2005). |
| | 10.1010.9 | First Amendment to 1994 Employee Stock Incentive Plan and 2004 Stock Incentive Plan (incorporated herein by reference to Exhibit 10.14 to the Form 10-K filed on March 2, 2007). |
| | 10.1110.10 | Performance-Based Incentive Cash Compensation Plan (incorporated by reference to Exhibit 10.1 to the Form 8-K filed April 28, 2006). |
| | 10.12 | Summary of “At-Will” of Compensation Arrangements with Executive Officers as of February 28, 2008 (incorporated by reference to Exhibit 10.16 to the Form 10-K filed on March 4, 2008). |
| 10.13 | Summary of Compensation Arrangements with Non-Employee Directors as of February 28, 2008 (incorporated by reference to Exhibit 10.17 to the Form 10-K filed on March 4, 2008). |
| 10.16 | Summary of “At-Will” of Compensation Arrangements with Executive Officers as of February 28, 2009 (incorporated by reference to Exhibit 10.18 to the Form 10-K filed on March 5, 2009). |
| 10.1710.11 | Summary of Compensation Arrangements with Executive Officers (incorporated herein by reference to Exhibit 10.17 to the Form 10-K filed on March 3, 2010). |
| | 10.1910.14 | Form of Time Lapse Restricted Stock Agreement (incorporated herein by reference to Exhibit 10.1 to the Form 10-Q filed on May 2, 2012). |
| 10.15 | Summary of Compensation Arrangements with Non-Employee Directors (incorporated herein by reference to Exhibit 10.1910.18 to the Form 10-K filed on March 4, 2011)1, 2013). |
Exhibits (inclusive of item 3 above):
Exhibit Number | | Description |
| 3.1A | | Restated certificate of incorporation of RPC, Inc. (incorporated herein by reference to exhibit 3.1 to the Annual Report on Form 10-K for the fiscal year ended December 31, 1999). |
| | | |
| 3.1B | | Certificate of Amendment of Certificate of Incorporation of RPC, Inc. (incorporated by reference to Exhibit 3.1(B) to the Quarterly Report on Form 10-Q filed May 8, 2006). |
| | |
| 3.1C | | Certificate of Amendment of Certificate of Incorporation of RPC, Inc. (incorporated by reference to Exhibit 3.1(C) to the Quarterly Report on Form 10-Q filed August 2, 2011). |
| | | |
| 3.2 | | Bylaws of RPC, Inc. (incorporated herein by reference to Exhibit 3.1 to the Form 8-K filed on October 25, 2007). |
| | | |
| 4 | | Form of Stock Certificate (incorporated herein by reference to the Annual Report on Form 10-K for the fiscal year ended December 31, 1998). |
| | | |
| 10.1 | | 2004 Stock Incentive Plan (incorporated herein by reference to Appendix B to the Registrant’s definitive Proxy Statement filed on March 24, 2004). |
| | | |
| 10.2 | | Agreement Regarding Distribution and Plan of Reorganization, dated February 12, 2001, by and between RPC, Inc. and Marine Products Corporation (incorporated herein by reference to Exhibit 10.2 to the Form 10-K filed on February 13, 2001). |
| | | |
| 10.3 | | Employee Benefits Agreement dated February 12, 2001, by and between RPC, Inc., Chaparral Boats, Inc. and Marine Products Corporation (incorporated herein by reference to Exhibit 10.3 to the Form 10-K filed on February 13, 2001). |
| | | |
| 10.4 | | Transition Support Services Agreement dated February 12, 2001 by and between RPC, Inc. and Marine Products Corporation (incorporated herein by reference to Exhibit 10.4 to the Form 10-K filed on February 13, 2001). |
| | | |
| 10.5 | | Tax Sharing Agreement dated February 12, 2001, by and between RPC, Inc. and Marine Products Corporation (incorporated herein by reference to Exhibit 10.5 to the Form 10-K filed on February 13, 2001). |
| | | |
| 10.6 | | Form of stock option grant agreement (incorporated herein by reference to Exhibit 10.1 to the Form 10-Q filed on November 2, 2004). |
| | |
10.7 | | Form of time lapse restricted stock grant agreement (incorporated herein by reference to Exhibit 10.2 to the Form 10-Q filed on November 2, 2004). |
| | | |
10.810.7 | | Form of performance restricted stock grant agreement (incorporated herein by reference to Exhibit 10.3 to the Form 10-Q filed on November 2, 2004). |
| | | |
10.910.8 | | Supplemental Retirement Plan (incorporated herein by reference to Exhibit 10.11 to the Form 10-K filed on March 16, 2005). |
| | | |
10.1010.9 | | First Amendment to 1994 Employee Stock Incentive Plan and 2004 Stock Incentive Plan (incorporated herein by reference to Exhibit 10.14 to the Form 10-K filed on March 2, 2007). |
| | | |
10.1110.10 | | Performance-Based Incentive Cash Compensation Plan (incorporated by reference to Exhibit 10.1 to the Form 8-K filed April 28, 2006). |
| | | |
10.12 | | Summary of “At-Will” of Compensation Arrangements with Executive Officers as of February 28, 2008 (incorporated by reference to Exhibit 10.16 to the Form 10-K filed on March 4, 2008). |
| | |
10.13 | | Summary of Compensation Arrangements with Non-Employee Directors as of February 28, 2008 (incorporated by reference to Exhibit 10.17 to the Form 10-K filed on March 4, 2008). |
| | |
10.14 | | Revolving Credit Agreement dated September 8, 2006 between RPC, Banc of America, N.A., SunTrust Bank and certain other Lenders party thereto (incorporated by reference to Exhibit 99.1 to the Form 8-K dated September 8, 2006). |
| | |
10.15 | | Commitment Increase Amendment to Revolving Credit Agreement dated as of June 9, 2008, by and among the Company, the several banks and other financial institutions from time to time party thereto and SunTrust Bank, in its capacity as Administrative Agent (incorporated herein by reference to Exhibit 99.1 to the Company’s Current Report on Form 8-K dated June 9, 2008). |
| | |
10.16 | | Summary of “At-Will” of Compensation Arrangements with Executive Officers as of February 28, 2009 (incorporated herein by reference to Exhibit 10.18 to the Form 10-K filed on March 5, 2009). |
| | |
10.1710.11 | | Summary of Compensation Arrangements with Executive Officers (incorporated herein by reference to Exhibit 10.17 to the Form 10-K filed on March 3, 2010). |
| | | |
10.18 | | Second Amendment to Revolving Credit Agreement dated as of September 2, 2009 by and among the Company, the several banks and other financial institutions from time to time party thereto and SunTrust Bank, in its capacity as administrative agent (incorporated herein by reference to Exhibit 99.1 to the Company’s Current Report on Form 8-K dated September 2, 2009). |
| | |
10.19 | | Summary of Compensation Arrangements with Non-Employee Directors. (incorporated herein by reference to Exhibit 10.19 to the Form 10-K filed on March 4, 2011) |
| | |
10.2010.12 | | Credit Agreement dated August 31, 2010 between the Company, Banc of America, N.A., SunTrust Bank, Regions Bank and certain other lenders party thereto (incorporated herein by reference to Exhibit 99.1 to the Form 8-K filed on September 7, 2010). |
| | |
| 10.13 | | Amendment and No. 1 to Credit Agreement dated as of June 16, 2011 between the Company, the Subsidiary Loan Parties party thereto, Bank of America, N.A. and certain other lenders party thereto (incorporated herein by reference to Exhibit 10.16 to the Form 10-K filed on February 29, 2012). |
| | |
| 10.14 | | Form of Time Lapse Restricted Stock Agreement (incorporated herein by reference to Exhibit 10.1 to the Form 10-Q filed on May 2, 2012). |
| | |
| 10.15 | | Summary of Compensation Arrangements with Non-Employee Directors (incorporated herein by reference to Exhibit 10.18 to the Form 10-K filed on March 1, 2013). |
| | |
| 10.16 | | Amendment No. 2 to Credit Agreement and Amendment No. 1 to Subsidiary Guaranty Agreement dated as of January 17, 2014 between RPC, Bank of America, N.A., certain other Lenders party thereto, and the Subsidiary Loan Parties party thereto (incorporated herein by reference to Exhibit 99.1 to the Company’s Form 8-K dated January 17, 2014). |
| | | |
| 21 | | Subsidiaries of RPC (incorporated herein by reference to Exhibit 21 to the Form 10-K filed on March 4, 2011) |
| | | |
| 23 | | Consent of Grant Thornton LLP |
| | | |
| 24 | | Powers of Attorney for Directors (incorporated herein by reference to Exhibit 24 to the Form 10-K filed on March 4, 2011) |
| | | |
| 31.1 | | Section 302 certification for Chief Executive Officer |
| | | |
| 31.2 | | Section 302 certification for Chief Financial Officer |
| | | |
| 32.1 | | Section 906 certifications for Chief Executive Officer and Chief Financial Officer |
| | |
| 95.1 | | Mine Safety Disclosure |
| | |
| 101.INS | | XBRL Instance Document |
| | |
| 101.SCH | | XBRL Taxonomy Extension Schema Document |
| | |
| 101.CAL | | XBRL Taxonomy Extension Calculation Linkbase Document |
| | |
| 101.LAB | | XBRL Taxonomy Extension Label Linkbase Document |
| | |
| 101.PRE | | XBRL Taxonomy Extension Presentation Linkbase Document |
| | |
| 101.DEF | | XBRL Taxonomy Extension Definition Linkbase Document |
SIGNATURES
Pursuant to the requirements of Section 13 or 15(d) of the Securities Exchange Act of 1934, the Registrant has duly caused this report to be signed on its behalf by the undersigned, thereunto duly authorized.
| | RPC, Inc. | |
| | |
| | | |
| | /s/ Richard A. Hubbell | |
| | Richard A. Hubbell | |
| | President and Chief Executive Officer | |
| | (Principal Executive Officer) | |
| | | |
| | December 19, 2011February 28, 2014 | |
Pursuant to the requirements of the Securities Exchange Act of 1934, this report has been signed below by the following persons on behalf of the Registrant and in the capacities and on the dates indicated.
| Name | | | | Title | | | | Date | |
| | | | | | | | | | |
| /s/ Richard A. Hubbell | | | | |
| Richard A. Hubbell | | President and Chief Executive Officer (Principal Executive Officer) | | February 28, 2014 |
| | | | |
| /s/ Ben M. Palmer | | | | |
| Ben M. Palmer | | Chief Financial Officer (Principal Financial and Accounting Officer) | | February 28, 2014 |
| R. Randall Rollins, Director | James A. Lane, Jr., Director |
| Gary W. Rollins, Director | Linda H. Graham, Director |
| Henry B. Tippie, Director | Bill J. Dismuke, Director |
| James B. Williams, Director | Larry L. Prince, Director |
| /s/ Richard A. Hubbell | |
| Richard A. Hubbell | |
| Director and as Attorney-in-fact | |
| February 28, 2014 | |
INDEX TO CONSOLIDATED FINANCIAL STATEMENTS, REPORTS AND SCHEDULE
The following documents are filed as part of this report.
| |
FINANCIAL STATEMENTS AND REPORTS | PAGE |
| | |
| Management’s Report on Internal Control Over Financial Reporting | 29 |
| |
| Report of Independent Registered Public Accounting Firm on Internal Control Over Financial Reporting | 30 |
| | |
Report of Independent Registered Public Accounting Firm on Internal Control Over Financial Reporting | 31 |
| |
Report of Independent Registered Public Accounting Firm on Consolidated Financial Statements | 3231 |
| | |
Consolidated Balance Sheets as of December 31, 20102013 and 20092012 | 3332 |
| | |
Consolidated Statements of Operations for the three years ended December 31, 20102013 | 33 |
| |
| Consolidated Statements of Comprehensive Income for the three years ended December 31, 2013 | 34 |
| | |
Consolidated Statements of Stockholders’ Equity for the three years ended December 31, 20102013 | 35 |
| | |
Consolidated Statements of Cash Flows for the three years ended December 31, 20102013 | 36 |
| | |
| Notes to Consolidated Financial Statements | 37 - 5954 |
SCHEDULE | |
Schedule II — Valuation and Qualifying Accounts | 6660 |
Schedules not listed above have been omitted because they are not applicable or the required information is included in the consolidated financial statements or notes thereto.
SCHEDULE II — VALUATION AND QUALIFYING ACCOUNTS
| | | | | | | | | | | | | | | |
| | | For the years ended December 31, 2010, 2009 and 2008 | | | For the years ended December 31, 2013, 2012 and 2011 |
| (in thousands) | | Balance at Beginning of Period | | | Charged to Costs and Expenses | | Net Recoveries (Deductions) | | | Balance at End of Period | | | Balance at Beginning of Period | | | Charged to Costs and Expenses | | | Net (Deductions)
Recoveries | | | Balance at End of Period | |
| Year ended December 31, 2010 | | | | | | | | | | | | |
| Year ended December 31, 2013 | | | | | | | | | | | | | |
| Allowance for doubtful accounts | | $ | 3,210 | | | $ | 4,812 | | | $ | 672 | | (1) | | | $ | 8,694 | | | $ | 9,110 | | | $ | 8,815 | | | $ | (4,428 | ) (1) | | $ | 13,497 | |
| Deferred tax asset valuation allowance | | $ | 1,550 | | | $ | — | | | $ | (255 | ) | (2) | | | $ | 1,295 | | | $ | 1,003 | | | $ | — | | | $ | (920 | ) (2) | | $ | 83 | |
| Year ended December 31, 2009 | | | | | | | | | | | | | | | | | |
| Year ended December 31, 2012 | | | | | | | | | | | | | | | | | |
| Allowance for doubtful accounts | | $ | 6,199 | | | $ | 660 | | | $ | (3,649 | ) | (1) | | | $ | 3,210 | | | $ | 8,093 | | | $ | 1,784 | | | $ | (767 | ) (1) | | $ | 9,110 | |
| Deferred tax asset valuation allowance | | $ | 1,454 | | | $ | 96 | | | $ | — | | (2) | | | $ | 1,550 | | | $ | 1,295 | | | $ | — | | | $ | (292 | ) (2) | | $ | 1,003 | |
| Year ended December 31, 2008 | | | | | | | | | | | | | | | | | | |
| Year ended December 31, 2011 | | | | | | | | | | | | | | | | | |
| Allowance for doubtful accounts | | $ | 5,217 | | | $ | (84 | ) | | $ | 1,066 | | (1) | | | $ | 6,199 | | | $ | 8,694 | | | $ | 2,868 | | | $ | (3,469 | ) (1) | | $ | 8,093 | |
| Deferred tax asset valuation allowance | | $ | 1,503 | | | $ | — | | | $ | (49 | ) | (2) | | | $ | 1,454 | | | $ | 1,295 | | | $ | — | | | $ | — | | | $ | 1,295 | |
| (1) | DeductionsNet (deductions) recoveries in the allowance for doubtful accounts principally reflect the write-off of previously reserved accounts net of recoveries. |
| (2) | The valuation allowance for deferred tax assets is increased or decreased each year to reflect the state net operating losses that management believes will not be utilized before they expire. |
SELECTED QUARTERLY FINANCIAL DATA (UNAUDITED)
| Quarters ended | | March 31 | | | June 30 | | | September 30 | | | December 31 | |
| (in thousands except per share data) | | | | | | | | | | | | |
| 2010 | | | | | | | | | | | | |
| Revenues | | $ | 213,144 | | | $ | 252,896 | | | $ | 302,200 | | | $ | 328,144 | |
| Net income | | $ | 13,400 | | | $ | 31,602 | | | $ | 46,269 | | | $ | 55,471 | |
Net income per share — basic (a) | | $ | 0.09 | | | $ | 0.22 | | | $ | 0.32 | | | $ | 0.38 | |
Net income per share — diluted (a) | | $ | 0.09 | | | $ | 0.21 | | | $ | 0.31 | | | $ | 0.38 | |
| 2009 | | | | | | | | | | | | | | | | |
| Revenues | | $ | 176,271 | | | $ | 127,018 | | | $ | 132,159 | | | $ | 152,415 | |
| Net (loss) income | | $ | 4,466 | | | $ | (11,624 | ) | | $ | (10,385 | ) | | $ | (5,202 | ) |
Net (loss) income per share — basic (a) | | $ | 0.03 | | | $ | (0.08 | ) | | $ | (0.07 | ) | | $ | (0.03 | ) |
Net (loss) income per share — diluted (a) | | $ | 0.03 | | | $ | (0.08 | ) | | $ | (0.07 | ) | | $ | (0.03 | ) |
Quarters ended | | March 31 | | | June 30 | | | September 30 | | | December 31 | |
(in thousands except per share data) | | | | | | | | | | | | |
2013 | | | | | | | | | | | | |
| Revenues | | $ | 425,821 | | | $ | 457,566 | | | $ | 491,121 | | | $ | 486,981 | |
| Operating profit | | $ | 57,219 | | | $ | 67,853 | | | $ | 85,839 | | | $ | 64,502 | |
| Net income | | $ | 35,076 | | | $ | 40,416 | | | $ | 53,760 | | | $ | 37,643 | |
Net income per share — basic(a) | | $ | 0.16 | | | $ | 0.19 | | | $ | 0.25 | | | $ | 0.18 | |
Net income per share — diluted(a) | | $ | 0.16 | | | $ | 0.19 | | | $ | 0.25 | | | $ | 0.17 | |
2012 | | | | | | | | | | | | | | | | |
| Revenues | | $ | 502,557 | | | $ | 500,106 | | | $ | 472,418 | | | $ | 469,942 | |
| Operating profit | | $ | 130,857 | | | $ | 119,858 | | | $ | 102,368 | | | $ | 89,307 | |
| Net income | | $ | 80,755 | | | $ | 72,260 | | | $ | 66,040 | | | $ | 55,381 | |
Net income per share — basic(a) | | $ | 0.37 | | | $ | 0.34 | | | $ | 0.31 | | | $ | 0.26 | |
Net income per share — diluted(a) | | $ | 0.37 | | | $ | 0.33 | | | $ | 0.30 | | | $ | 0.26 | |
| (a) | The sum of the income (loss) per share for the four quarters may differ from annual amounts due to the required method of computing the weighted average shares for the respective periods. |
68