UNITED STATES
SECURITIES AND EXCHANGE COMMISSION
WASHINGTON, D.C. 20549
FORM 10-K/A10-K
AMENDMENT NO. 1 to the
| x | ANNUAL REPORT PURSUANT TO SECTION 13 OR 15(d) OF THE SECURITIES EXCHANGE ACT OF 1934 |
For the Fiscal Year Ended December 31, 20022004
| ¨ | TRANSITION REPORT PURSUANT TO SECTION 13 OR 15(d) OF THE SECURITIES EXCHANGE ACT OF 1934 |
For the Transition Period From to
Commission File Number 001-13533
NOVASTAR FINANCIAL, INC.
(Exact nameName of registrantRegistrant as specifiedSpecified in its charter)Charter)
| Maryland | 74-2830661 | |
(State or
| (I.R.S. Employer Identification No.) | |
8140 Ward Parkway, Suite 300, Kansas City, MO | 64114 | |
(Address of | (Zip Code) | |
Registrant’s telephone number, including area code:Telephone Number, Including Area Code: (816) 237-7000
Securities registered pursuantRegistered Pursuant to Section 12(b) of the Act:
| Title of Each Class | Name of Each Exchange on Which Registered | |
Common Stock, $0.01 par value | New York Stock Exchange |
Securities registered pursuantRegistered Pursuant to Section 12(g) of the Act:
None
Indicate by check mark whether the registrant (1) has filed all reports required to be filed by Section 13 or 15(d) of the Securities Exchange Act of 1934 during the preceding 12 months (or for such shorter period that the registrant was required to file such reports), and (2) has been subject to such filing requirements for the past 90 days. Yes x No ¨
Indicate by check mark if disclosure of delinquent filers pursuant to Item 405 of Regulation S-K is not contained herein, and will not be contained, to the best of registrant’s knowledge, in definitive proxy or information statements incorporated by reference in Part III of this Form 10-K or any amendment to this Form 10-K. x
Indicate by check mark whether the registrant is an accelerated filer (as defined in Exchange Act Rule 12b-2). Yes x No ¨
The aggregate market value of voting stock held by non-affiliates of the registrant as of March 12, 2003June 30, 2004 was approximately $351,842,695$948,751,931 as reported by the New York Stock Exchange Composite Transactions on such date.
The number of shares of the Registrant’s Common Stock outstanding on March 12, 200311, 2005 was 10,502,767.27,860,629.
DOCUMENTS INCORPORATED BY REFERENCEDocuments Incorporated by Reference
N/AItems 10, 11, 12, 13 and 14 of Part III are incorporated by reference to the NovaStar Financial, Inc. definitive proxy statement to shareholders, which will be filed with the Commission no later than 120 days after December 31, 2004.
FORM 10-K/A
AMENDMENT NO. 1 to FORM 10-K
For the Fiscal Year Ended December 31, 2004
TABLE OF CONTENTS
Item 1.Business
Overview
We are a Maryland corporation formed on September 13, 1996 as a specialty finance company that originates, purchases, invests in and services residential nonconforming loans. We operate through three separate but inter-related units—mortgage lending and loan servicing, mortgage portfolio management and branch operations. We offer a wide range of mortgage loan products to borrowers, commonly referred to as “nonconforming borrowers,” who generally do not satisfy the credit, collateral, documentation or other underwriting standards prescribed by conventional mortgage lenders and loan buyers, including United States of America government-sponsored entities such as Fannie Mae or Freddie Mac. We retain significant interests in the nonconforming loans we originate and purchase through our mortgage securities investment portfolio. Through our servicing platform, we then service all of the loans we retain interests in, in order to better manage the credit performance of those loans.
We have elected to be taxed as a real estate investment trust, or REIT, under the Internal Revenue Code of 1986, as amended (Code). Management believes the tax-advantaged structure of a REIT maximizes the after-tax returns from mortgage assets. We must meet numerous rules established by the Internal Revenue Service (IRS) to retain our status as a REIT. In summary, they require us to:
As long as we maintain our REIT status, distributions to stockholders will generally be deductible by us for income tax purposes. This deduction effectively eliminates REIT level income taxes. Management believes it has and will continue to meet the requirements to maintain our REIT status.
Mortgage Portfolio Management
Earnings from our portfolio of mortgage loans and securities generate a substantial portion of our earnings. Gross interest income was $224.0 million, $170.4 million and $107.1 million in the three years ended December 31, 2004, 2003 and 2002, respectively. Net interest income before credit losses/recoveries from the portfolio was $171.4 million, $130.1 million and $79.4 million in the three years ended December 31, 2004, 2003 and 2002, respectively. See our discussion of interest income under the heading “Results of Operations” and “Net Interest Income”. See Note 15 to our consolidated financial statements for a summary of operating results and total assets for mortgage portfolio management.
A significant risk to our operations, relating to our portfolio management, is the risk that interest rates on our assets will not adjust at the same times or amounts that rates on our liabilities adjust. Many of the loans in our portfolio have fixed rates of interest for a period of time ranging from 2 to 30 years. Our funding costs are generally not constant or fixed. We use derivative instruments to mitigate the risk of our cost of funding increasing or decreasing at a faster rate than the interest on the loans (both those on the balance sheet and those that serve as collateral for mortgage securities – available-for-sale).
In certain circumstances, because we enter into interest rate agreements that do not meet the hedging criteria set forth in accounting principles generally accepted in the United States of America, we are required to record the change in the value of derivatives as a component of earnings even though they may reduce our interest rate risk. In times where short-term rates rise or drop significantly, the value of our agreements will increase or decrease, respectively. As a result, we recognized losses on these derivatives of $8.9 million, $30.8 million and $36.8 million in 2004, 2003 and 2002, respectively.
Mortgage Lending and Loan Servicing
The mortgage lending operation is significant to our financial results as it produces the loans that ultimately collateralize the mortgage securities – available-for-sale that we hold in our portfolio. During 2004, we originated and purchased $8.4 billion in nonconforming mortgage loans, the majority of which were retained in our servicing portfolio and serve as collateral for our securities. The loans we originate and purchase are sold, either in securitization transactions or in outright sales to third parties. We recognized gains on sales of mortgage assets totaling $145.0 million, $144.0 million and $53.3 million during the three years ended December 31, 2004, 2003 and 2002, respectively. In securitization transactions accounted for as sales, we retain interest-only, prepayment penalty, overcollateralization and other subordinated securities, along with the right to service the loans. See Note 15 to our consolidated financial statements for a summary of operating results and total assets for mortgage lending and loan servicing.
Our wholly-owned subsidiary, NovaStar Mortgage, Inc., originates and purchases primarily nonconforming, single-family residential mortgage loans. In our nonconforming lending operations, we lend to individuals who generally do not qualify for agency/conventional lending programs because of a lack of available documentation or previous credit difficulties. These types of borrowers are generally willing to pay higher mortgage loan origination fees and interest rates than those charged by conventional lending sources. Because these borrowers typically use the proceeds of the mortgage loans to consolidate debt and to finance home improvements, education and other consumer needs, loan volume is generally less dependent on general levels of interest rates or home sales and therefore less cyclical than conventional mortgage lending.
Our nationwide loan origination network includes wholesale loan brokers, correspondent institutions and direct to consumer operations. We have developed a nationwide network of wholesale loan brokers and mortgage lenders who submit mortgage loans to us. Except for NovaStar Home Mortgage brokers described below, these brokers and mortgage lenders are independent from any of the NovaStar entities. Our sales force, which includes account executives in 39 states, develops and maintains relationships with this network of independent retail brokers. Our correspondent origination channel consists of a network of institutions from which we purchase nonconforming mortgage loans on a bulk or flow basis. Our direct to consumer origination channel consists of call centers, which use telemarketing and internet loan lead sources to originate mortgage loans.
We underwrite, process, fund and service the nonconforming mortgage loans sourced through our broker network in centralized facilities. Further details regarding the loan originations are discussed under the “Mortgage Loans” section of “Management’s Discussion and Analysis of Financial Condition and Results of Operations”.
A significant risk to our mortgage lending operations is liquidity risk – the risk that we will not have financing facilities and cash available to fund and hold loans prior to their sale or securitization. We maintain committed lending facilities with large banking and investment institutions to reduce this risk. On a short-term basis, we finance mortgage loans using warehouse repurchase agreements. In addition, we have access to facilities secured by our mortgage securities – available-for-sale. Details regarding available financing arrangements and amounts outstanding under those arrangements are included in “Management’s Discussion and Analysis of Financial Condition and Results of Operations” and Note 7 to the consolidated financial statements.
For long-term funding, we pool our mortgage loans and issue asset-backed bonds (ABB). Primary bonds – AAA through BBB rated – are issued to the public. We retain the interest-only, prepayment penalty, overcollateralization and other subordinated bonds. We also retain the right to service the loans. Prior to 1999, our ABB transactions were executed and designed to meet accounting rules that resulted in securitizations being treated as financing transactions. The mortgage loans and related debt continue to be presented on our consolidated balance sheets, and no gain was recorded. Beginning in 1999, our securitization transactions have been structured to qualify as sales for accounting and income tax purposes. The loans and related bond liability are not recorded in our consolidated financial statements. We do, however, record the value of the securities and servicing rights we retain. Details regarding ABBs we issued can be found in “Management’s Discussion and Analysis of Financial Condition and Results of Operations” and in Note 7 to our consolidated financial statements.
Loan servicing remains a critical part of our business operation. In the opinion of management, maintaining contact with our borrowers is critical in managing credit risk and in borrower retention. Nonconforming borrowers are more prone to late payments and are more likely to default on their obligations than conventional borrowers. By servicing our loans, we strive to identify problems with borrowers early and take quick action to address problems. Borrowers may be motivated to refinance their mortgage loans either by improving their personal credit or due to a decrease in interest rates. By keeping in close touch with borrowers, we can provide them with information about company products to encourage them to refinance with us. Mortgage servicing yields fee income for us in the form of fees paid by the borrowers for normal customer service and processing fees. In addition we receive contractual fees approximating 0.50% of the outstanding balance and rights to future cash flows arising after the investors in the securitization trusts have received the return for which they contracted. We recognized $41.5 million, $21.1 million and $10.0 million in loan servicing fee income from the securitization trusts during the three years ended December 31, 2004, 2003 and 2002, respectively. See also “Mortgage Loan Servicing” under “Management’s Discussion and Analysis of Financial Condition and Results of Operations” for further discussion and analysis of the servicing operations.
Branch Operations
In 1999, we opened our retail mortgage broker business operating under the name NovaStar Home Mortgage, Inc. (“NHMI”). Prior to 2004, many of these NHMI branches were supported by LLC’s operating under LLC agreements where we owned a minority interest in the LLC and the branch manager was the majority interest holder. In December 2003, we decided to terminate the LLC’s effective January 1, 2004. As of January 1, 2004, continuing branches that formerly operated under LLC agreements became operating units of NHMI and their financial results are included in the consolidated financial statements. See Note 14 to our consolidated financial statements for further discussion. Branch offices offer conforming and nonconforming loans to potential borrowers. Loans are brokered for approved investors, including NovaStar Mortgage. The NHMI branches are considered departmental functions of NHMI under which the branch manager (department head) is an employee of NHMI and receives compensation based on the profitability of the branch (department) as bonus compensation. See Note 15 to our consolidated financial statements for a summary of operating results and total assets for our branches.
We routinely close branches and branch managers voluntarily terminate their employment with us, which generally results in the branch’s closure. As the demand for conforming loans declined significantly during 2004, many branches were not able to produce sufficient fees to meet operating expense demands. As a result of these conditions, a significant number of branch managers voluntarily terminated employment with us. We have also terminated many branches when loan production results were substandard. In these terminations, the branch and all operations are eliminated. Note 14 to our consolidated financial statements provides detail regarding the impact of the discontinued operations and modifications to our branch program.
The branch business provides an additional source for mortgage loan originations that, in most cases, we will eventually sell, either in securitizations or in outright sales to third parties. During 2004 and 2003, our branches brokered $3.7 billion and $6.4 billion, respectively, in nonconforming loans, of which we funded $1.7 billion and $1.2 billion, respectively.
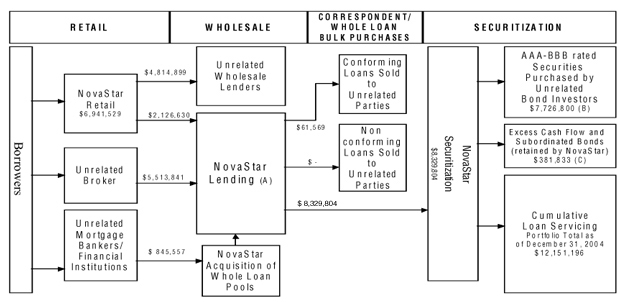
Following is a diagram of the industry in which we operate and our loan production including nonconforming and conforming during 2004 (in thousands).
| (A) | A portion of the loans securitized or sold to unrelated parties as of December 31, 2004 were originated prior to 2004, but due to timing were not yet securitized or sold at the end of 2003. Loans originated and purchased in 2004 that we have not securitized or sold to unrelated parties as of December 31, 2004 are included in our mortgage loans held-for-sale |
| (B) | The AAA-BBB rated securities related to NMFT Series 2004-1, 2004-2, 2004-3 and 2004-4 were purchased by bond investors during 2004. |
| (C) | The excess cash flow and subordinated bonds retained by NovaStar includes the securitization transactions that occurred during 2004 for NMFT Series 2003-4, 2004-1, 2004-2, 2004-3 and 2004-4. |
Market in Which NovaStar Operates and Competes
We face intense competition in the business of originating, purchasing, selling and securitizing mortgage loans. The number of market participants is believed to be well in excess of 100 companies who originate and purchase nonconforming loans. No single participant holds a dominant share of the lending market. We compete for borrowers with consumer finance companies, conventional mortgage bankers, commercial banks, credit unions, thrift institutions and other independent wholesale mortgage lenders. Our principal competition in the business of holding mortgage loans and mortgage securities – available-for-sale are life insurance companies, institutional investors such as mutual funds and pension funds, other well-capitalized publicly-owned mortgage lenders and certain other mortgage acquisition companies structured as REITs. Many of these competitors are substantially larger than we are and have considerably greater financial resources than we do.
Competition among industry participants can take many forms, including convenience in obtaining a loan, amount and term of the loan, customer service, marketing/distribution channels, loan origination fees and interest rates. To the extent any competitor significantly expands their activities in the nonconforming and subprime market, we could be materially adversely affected.
One of our key competitive strengths is our employees and the level of service they are able to provide our borrowers. We service our nonconforming loans and, in doing so, we are able to stay in close contact with our borrowers and identify potential problems early.
We also believe we compete successfully due to our:
Risk Management
Management recognizes the following primary risks associated with the business and industry in which it operates.
Interest Rate/Market Risk
Our investment policy sets the following general goals:
(1) Maintain the net interest margin between assets and liabilities, and
(2) Diminish the effect of changes in interest rate levels on our market value
Interest Rate Risk. When interest rates on our assets do not adjust at the same rates as our liabilities or when the assets have fixed rates and the liabilities are adjusting, future earnings potential is affected. We express this interest rate risk as the risk that the market value of assets will increase or decrease at different rates than that of the liabilities. Expressed another way, this is the risk that net asset value will experience an adverse change when interest rates change. We assess the risk based on the change in market values given increases and decreases in interest rates. We also assess the risk based on the impact to net income in changing interest rate environments.
Management primarily uses financing sources where the interest rate resets frequently. As of December 31, 2004, borrowings under all financing arrangements adjust daily or monthly. On the other hand, very few of the mortgage assets we own adjust on a monthly or daily basis. Most of the mortgage loans contain features where their rates are fixed for some period of time and then adjust frequently thereafter. For example, one of our loan products is the “2/28” loan. This loan is fixed for its first two years and then adjusts every six months thereafter.
While short-term borrowing rates are low and long-term asset rates are high, this portfolio structure produces good results. However, if short-term interest rates rise rapidly, earning potential is significantly affected and impairments may be incurred, as the asset rate resets would lag the borrowing rate resets.
Interest Rate Sensitivity Analysis. To assess interest sensitivity as an indication of exposure to interest rate risk, management relies on models of financial information in a variety of interest rate scenarios. Using these models, the fair value and interest rate sensitivity of each financial instrument, or groups of similar instruments is estimated, and then aggregated to form a comprehensive picture of the risk characteristics of the balance sheet. The risks are analyzed on a market value basis.
The following table summarizes management’s estimates of the changes in market value our same mortgage assets and interest rate agreements assuming interest rates were 100 and 200 basis points, or 1 and 2 percent higher and lower. The cumulative change in market value represents the change in market value of mortgage assets, net of the change in market value of interest rate agreements. The change in market value, due to a change in interest rates, of the liabilities on our balance sheet which finance our mortgage assets is insignificant.
Interest Rate Sensitivity - Market Value
(dollars in thousands)
| Basis Point Increase (Decrease) in Interest Rate (A) | |||||||||||||||
| (200) (C) | (100) | 100 | 200 | ||||||||||||
As of December 31, 2004: | |||||||||||||||
Change in market values of: | |||||||||||||||
Assets | 70,438 | $ | 33,198 | $ | (34,045 | ) | $ | (72,840 | ) | ||||||
Interest rate agreements | (54,085 | ) | (28,046 | ) | 27,832 | 55,113 | |||||||||
Cumulative change in market value | 16,353 | $ | 5,152 | $ | (6,213 | ) | $ | (17,727 | ) | ||||||
Percent change of market value portfolio equity (B) | 3.3 | % | 1.0 | % | (1.3 | )% | (3.6 | )% | |||||||
As of December 31, 2003: | |||||||||||||||
Change in market values of: | |||||||||||||||
Assets | N/A | $ | 34,499 | $ | (65,216 | ) | $ | (144,343 | ) | ||||||
Interest rate agreements | N/A | (31,250 | ) | 34,073 | 69,497 | ||||||||||
Cumulative change in market value | N/A | $ | 3,249 | $ | (31,143 | ) | $ | (74,846 | ) | ||||||
Percent change of market value portfolio equity (B) | N/A | 1.0 | % | (9.1 | )% | (21.9 | )% | ||||||||
| (A) | Change in market value of assets or interest rate agreements in a parallel shift in the yield curve, up and down 1% and 2%. |
| (B) | Total change in estimated market value as a percent of market value portfolio equity as of December 31. |
| (C) | A decrease in interest rates by 200 basis points (2%) would imply one-month LIBOR at or below zero at December 31, 2003. |
Hedging.In order to address a mismatch of interest rate indices and adjustment periods on our assets and liabilities, the hedging section of the investment policy is followed, as approved by the Board. Specifically, the interest rate risk management program is formulated with the intent to offset the potential adverse effects resulting from rate adjustment limitations on mortgage assets and the differences between interest rate adjustment indices and interest rate adjustment periods of adjustable-rate mortgage loans and related borrowings.
We use interest rate cap and swap contracts to mitigate the risk of the cost of variable rate liabilities increasing at a faster rate than the earnings on assets during a period of rising rates. In this way, management intends generally to hedge as much of the interest rate risk as determined to be in our best interest, given the cost and risk of hedging transactions and the need to maintain REIT status.
We seek to build a balance sheet and undertake an interest rate risk management program that is likely, in management’s view, to enable us to maintain an equity liquidation value sufficient to maintain operations given a variety of potentially adverse circumstances. Accordingly, the hedging program addresses both income preservation, as discussed in the first part of this section, and capital preservation concerns.
Interest rate cap agreements are legal contracts between us and a third-party firm or “counterparty”. The counterparty agrees to make payments to us in the future should the one-month LIBOR interest rate rise above the strike rate specified in the contract. We make either quarterly or monthly premium payments or have chosen to pay the premiums at the beginning to the counterparties under contract. Each contract has either a fixed or amortizing notional face amount on which the interest is computed, and a set term to maturity. When the referenced LIBOR interest rate rises above the contractual strike rate, we earn cap income. Payments on an annualized basis equal the contractual notional face amount times the difference between actual LIBOR and the strike rate. Interest rate swaps have similar characteristics. However, interest rate swap agreements allow us to pay a fixed rate of interest while receiving a rate that adjusts with one-month LIBOR.
The following table summarizes the key contractual terms associated with our interest rate risk management contracts. Substantially all of the pay-fixed swaps and interest rate caps are indexed to one-month LIBOR.
We have determined the following estimated net fair value amounts by using available market information and valuation methodologies we deem appropriate as of December 31, 2004.
Interest Rate Risk Management Contracts
(dollars in thousands)
| Maturity Range | |||||||||||||||||||
Net Fair Value | Total Notional Amount | 2005 | 2006 | 2007 | |||||||||||||||
Pay-fixed swaps: | |||||||||||||||||||
Contractual maturity | $ | 6,143 | $ | 1,350,000 | $ | 285,000 | $ | 840,000 | $ | 225,000 | |||||||||
Weighted average pay rate | 3.0 | % | 2.4 | % | 3.1 | % | 3.5 | % | |||||||||||
Weighted average receive rate | 2.4 | % | (A | ) | (A | ) | (A | ) | |||||||||||
Interest rate caps: | |||||||||||||||||||
Contractual maturity | $ | 5,819 | $ | 650,000 | $ | 450,000 | $ | 200,000 | $ | — | |||||||||
Weighted average strike rate | 1.7 | % | 1.6 | % | 2.0 | % | — | ||||||||||||
| (A) | The pay-fixed swaps receive rate is indexed to one-month and three-month LIBOR. |
Liquidity/Funding Risk
Mortgage lending requires significant cash to fund loan originations and purchases. Our warehouse lending arrangements, including repurchase agreements, support the mortgage lending operation. Our warehouse mortgage lenders allow us to borrow between 98% and 100% of the outstanding principal. Funding for the difference – generally 2% of the principal - must come from cash on hand. If we are unable to obtain sufficient cash resources, we may not be able to operate our mortgage lending (banking) segment.
We are currently dependent upon a limited number of primary credit facilities for funding of our mortgage loan originations and acquisitions. Any failure to renew or obtain adequate funding under these financing arrangements could harm our lending operations and our overall performance. An increase in the cost of financing in excess of any change in the income derived from our mortgage assets could also harm our earnings and reduce the cash available for distributions to our stockholders. In October 1998, the subprime mortgage loan market faced a liquidity crisis with respect to the availability of short-term borrowings from major lenders and long-term borrowings through securitization. At that time, we faced significant liquidity constraints that harmed our business and our profitability. We can provide no assurance that those adverse circumstances will not recur.
We use repurchase agreements to finance the acquisition of mortgage assets in the short-term. In a repurchase agreement, we sell an asset and agree to repurchase the same asset at some period in the future. Generally, the repurchase agreements we entered into stipulate that we must repurchase the asset in 30 days. For financial accounting purposes, these arrangements are treated as secured financings. We retain the assets on our balance sheet and record an obligation to repurchase the asset. For our repurchase agreements secured by mortgage loans, the amount we may borrow is generally 98% of the mortgage loan market value. For our repurchase agreements secured by mortgage securities, the amount we may borrow is generally 75% of the mortgage securities market value. When asset market values decrease, we are required to repay the margin, or difference in market value. To the extent the market values of assets financed with repurchase agreements decline rapidly, we will be required to meet cash margin calls. If cash is unavailable, we may default on our obligations under the applicable repurchase agreement. In that event, the lender retains the right to liquidate the collateral we provided to it to settle the amount due from us.
We are dependent on the securitization market for the sale of our loans because we securitize loans directly and many of our whole loan buyers purchase our loans with the intention to securitize. The securitization market is dependent upon a number of factors, including general economic conditions, conditions in the securities market generally and conditions in the asset-backed securities market specifically. In addition, poor performance of our previously securitized loans could harm our access to the securitization market. Accordingly, a decline in the securitization market, the ability to obtain attractive terms or a change in the market’s demand for our loans could have a material adverse effect on our results of operations, financial condition and business prospects.
See the “Liquidity and Capital Resources” section of “Management’s Discussion and Analysis of Financial Condition and Results of Operations” for further discussion of liquidity risks and resources available to us.
Credit Risk
Credit risk is the risk that we will not fully collect the principal we have invested in mortgage loans or securities. Nonconforming mortgage loans comprise substantially our entire mortgage loan portfolio and serve as collateral for our mortgage securities – available-for-sale. Our nonconforming borrowers include individuals who do not qualify for agency/conventional lending programs because of a lack of conventional documentation or previous credit difficulties, but have considerable equity in their homes. Often, they are individuals or families who have built up high-rate consumer debt and are attempting to use the equity in their home to consolidate debt and reduce the amount of money it takes to service their monthly debt obligations. Our underwriting guidelines are intended to evaluate the credit history of the potential borrower, the capacity and willingness of the borrower to repay the loan, and the adequacy of the collateral securing the loan.
Underwriting staff work under the credit policies established by our Chief Credit Officer. Underwriters are given approval authority only after their work has been reviewed for a period of time. Thereafter, the Chief Credit Officer re-evaluates the authority levels of all underwriting personnel on an ongoing basis. All loans in excess of $350,000 currently require the approval of an underwriting supervisor. Our Chief Credit Officer or our President must approve loans in excess of $1,000,000.
The underwriting guidelines take into consideration the number of times the potential borrower has recently been late on a mortgage payment and whether that payment was 30, 60 or 90 days past due. Factors such as FICO score, bankruptcy and foreclosure filings, debt-to-income ratio, and loan-to-value ratio are also considered. The credit grade that is assigned to the borrower is a reflection of the borrower’s historical credit and the loan-to-value determined by the amount of documentation the borrower could produce to support income. Maximum loan-to-value ratios for each credit grade depend on the level of income documentation provided by the potential borrower. In some instances, when the borrower exhibits strong compensating factors, exceptions to the underwriting guidelines may be approved.
Key to our successful underwriting process is the use of NovaStarIS®. NovaStarIS® is the second generation of our proprietary automated underwriting system. IS provides more consistency in underwriting loans and allows underwriting personnel to focus more of their time on loans that are not initially accepted by the IS system.
Our mortgage loan portfolio by credit grade, all of which are nonconforming can be accessed via our website at www.novastarmortgage.com.
A tool for managing credit risk is to diversify the markets in which we originate, purchase and own mortgage loans. Presented via our website at www.novastarmortgage.com is a breakdown of the geographic diversification of our loans. Details regarding loans charged off are disclosed in Note 2 to our consolidated financial statements.
We have purchased mortgage insurance on many of the loans that are held in our portfolio – on the balance sheet and those that serve as collateral for our mortgage securities – available-for-sale. The use of mortgage insurance is discussed under “Premiums for Mortgage Loan Insurance” in “Management’s Discussion and Analysis of Financial Condition and Results of Operations”.
Prepayment Risk
Generally speaking, when market interest rates decline, borrowers are more likely to refinance their mortgages. The higher the interest rate a borrower currently has on his or her mortgage the more incentive he or she has to refinance the mortgage when rates decline. In addition, the higher the credit grade, the more incentive there is to refinance when credit ratings improve. When a borrower has a low loan-to-value ratio, he or she is more likely to do a “cash-out” refinance. Each of these factors increases the chance for higher prepayment speeds during the term of the loan.
The majority of our securities are “interest-only” in nature. These securities represent the net cash flow – interest income – on the underlying loans in excess of the cost to finance the loans. When borrowers repay the principal on their mortgage loans early, the effect is to shorten the period over which interest is earned, and therefore, reduce the cash flow and yield on our securities.
We mitigate prepayment risk by originating and purchasing loans that include a penalty if the borrower repays the loan in the early months of the loan’s life. For the majority of our loans, a prepayment penalty is charged equal to 80% of six months interest on the principal balance that is to be paid in full. As of December 31, 2004, 73% of our securitized loans had a prepayment penalty. These loans serve as collateral for our mortgage securities – available-for-sale. As of December 31, 2004, 65% of our mortgage loans - held-for-sale had a prepayment penalty, which serve as collateral for our short-term borrowings. During 2004, 72% of the loans we originated and purchased had prepayment penalties.
Regulatory Risk
As a mortgage lender, we are subject to many laws and regulations. Any failure to comply with these rules and their interpretations or with any future interpretations or judicial decisions could harm our profitability or cause a change in the way we do business. For example, several lawsuits have been filed challenging types of payments made by mortgage lenders to mortgage brokers. Similarly, in our branch operations, we allow our branch managers considerable autonomy, which could result in our facing greater exposure to third-party claims if our compliance programs are not strictly adhered to.
Several states and cities are considering or have passed laws, regulations or ordinances aimed at curbing predatory lending practices. The federal government is also considering legislative and regulatory proposals in this regard. In general, these proposals involve lowering the existing federal Homeownership and Equity Protection Act thresholds for defining a “high-cost” loan, and establishing enhanced protections and remedies for borrowers who receive such loans. Passage of these laws and rules could reduce our loan origination volume. In addition, many whole loan buyers may elect not to purchase any loan labeled as a “high cost” loan under any local, state or federal law or regulation. Rating agencies likewise may refuse to rate securities backed by such loans. Accordingly, these laws and rules could severely restrict the secondary market for a significant portion of our loan production. This would effectively preclude us from continuing to originate loans either in jurisdictions unacceptable to the rating agencies or otherwise within newly defined thresholds and could have a material adverse effect on our business.
Recently enacted and effective laws, regulations and standards relating to corporate governance and disclosure requirements applicable to public companies, including the Sarbanes-Oxley Act of 2002, new Securities and Exchange Commission regulations and New York Stock Exchange rules have increased the costs of corporate governance, reporting and disclosure practices. These costs may increase in the future due to our continuing implementation of compliance programs mandated by these requirements. In addition, these new laws, rules and regulations create new legal bases for administrative enforcement and civil and criminal proceedings against us in case of non-compliance, thereby increasing our risks of liability and potential sanctions.
Other Risk Factors
Although management considers the risk components set forth above to be its primary business risks, the following are other risks that should be considered by our investors. Further information regarding these risks is included in our registration statements filed with the Commission.
| • | Changes in interest rates may harm our results of operations. Our results of operations are likely to be harmed during any period of unexpected or rapid changes in interest rates. For example, a substantial or sustained increase in interest rates could harm our ability to acquire mortgage loans in expected volumes. This could result in a decrease in our earnings and our ability to support our fixed overhead expense levels. Interest rate fluctuations may harm our earnings as a result of potential changes in the spread between the interest rates on our borrowings and the interest rates on our mortgage assets. In addition, mortgage prepayment rates vary depending on such factors as mortgage interest rates and market conditions. Changes in anticipated prepayment rates may harm our earnings. |
| • | Failure to hedge effectively against interest rate changes may harm our results of operations.We attempt to minimize exposure to interest rate fluctuations by hedging. Asset/liability management hedging strategies involve risk and may not be effective in reducing our exposure to interest rate changes. Moreover, compliance with the REIT provisions of the Code may prevent us from effectively implementing the strategies that we determine, absent such compliance, would best insulate us from the risks associated with changing interest rates. |
| • | Mortgage insurers may not pay claims resulting in increased credit losses or may in the future change their pricing or underwriting guidelines.From time to time we use mortgage insurance to mitigate the risk of credit losses. The inclination to obtain mortgage insurance coverage is dependent on pricing trends. In the future there can be no assurance that mortgage insurance coverage on our new mortgage loan production will be available at rates that we believe are economically viable for us. In addition, mortgage insurers have the right to deny a claim if the loan is not properly serviced or has been improperly originated. We also face the risk that mortgage insurance providers will revise their guidelines to such an extent that we will no longer be able to acquire coverage on our new mortgage loan production or will set their premiums at levels that we believe are not economically viable. Any of those events could increase our credit losses and harm our results of operations. |
| • | Differences in our actual experience compared to the assumptions that we use to determine the value of our mortgage securities – available-for-sale could adversely affect our financial position.Currently, our securitization transactions are structured to be treated as sales for financial reporting purposes and, therefore, result in gain recognition at closing. Delinquency, loss, prepayment and discount rate assumptions have a material impact on the amount of gain recognized and on the carrying value of the retained mortgage securities – available-for-sale. The gain on sale method of accounting may create volatile earnings in certain environments, including when loan securitizations are not completed on a consistent schedule. If our actual experience differs materially from the assumptions that we use to determine the value of our mortgage securities – available-for-sale, future cash flows, earnings and equity could be negatively affected. |
| • | Changes in accounting standards might cause us to alter the way we structure or account for securitizations. Changes could be made to current accounting standards which would limit the types of transactions eligible for gain on sale treatment. These changes could cause us to alter the way we either structure or account for securitizations. |
| • | We face loss exposure due to the underlying real estate.A substantial portion of our mortgage assets consist of single-family mortgage loans or mortgage securities – available-for-sale evidencing interests in single-family mortgage loans. Any material decline in real estate values would weaken our collateral loan-to-value ratios and increase the possibility of loss if a borrower defaults. In such event, we will be subject to the risk of loss on such mortgage assets arising from borrower defaults to the extent not covered by third-party credit enhancement. |
| • | We face loss exposure due to fraudulent and negligent acts on the part of loan applicants, employees, mortgage brokers and other vendors.When we originate and purchase mortgage loans, we rely heavily upon information provided to us by third parties, including information relating to the loan application, property appraisal, title information and employment and income documentation. If any of this information is fraudulently or negligently misrepresented to us and such misrepresentation is not detected by us prior to loan funding, the value of the loan may be significantly lower than we expected. Whether a misrepresentation is made by the loan applicant, the loan broker, one of our employees, or any other third party, we generally bear the risk of loss associated with the misrepresentation. A loan subject to misrepresentation typically cannot be sold or is subject to repurchase by us if it is sold prior to our detection of the misrepresentation. Even though we may have rights against the person(s) who knew or made the misrepresentation, we may not be able to recover against such persons the amount of the monetary loss caused to us by the misrepresentation. |
| • | Loans made to nonconforming mortgage borrowers entail relatively higher delinquency and loss rates.Lenders in the nonconforming mortgage banking industry make loans to borrowers who have impaired or limited credit histories, limited documentation of income and higher debt-to-income ratios than traditional mortgage lenders allow. Mortgage loans made to nonconforming mortgage loan borrowers generally entail a relatively higher risk of delinquency and foreclosure than mortgage loans made to borrowers with better credit and, therefore, may result in higher levels of realized losses. Any failure by us to adequately address the risks of nonconforming lending would harm our results of operations, financial condition and business prospects. |
| • | Current loan performance data may not be indicative of future results.When making capital budgeting and other decisions, we use projections, estimates and assumptions based on our experience with mortgage loans. Actual results and the timing of certain events could differ materially in adverse ways from those projected, due to factors including changes in general economic conditions, fluctuations in interest rates, fluctuations in mortgage loan prepayment speeds and fluctuations in losses due to defaults on mortgage loans. These differences and fluctuations could rise to levels that may harm our profitability. |
| • | Market factors may limit our ability to acquire mortgage assets at yields that are favorable relative to borrowing costs. Despite our experience in the acquisition of mortgage assets and our relationships with various mortgage suppliers, we face the risk that we might not be able to acquire mortgage assets which earn interest rates greater than our cost of funds or that we might not be able to acquire a sufficient number of such mortgage assets to maintain our profitability. |
| • | Intense competition in the nonconforming mortgage loan industry may result in reduced net income or in revised underwriting standards that would harm our operations. We face intense competition, primarily from commercial banks, savings and loans, other independent mortgage lenders and other mortgage REITs. The government-sponsored entities Fannie Mae and Freddie Mac may also expand their participation in the subprime mortgage industry. Any increase in the competition among lenders to originate or purchase nonconforming mortgage loans may result in either reduced interest income on such mortgage loans compared to present levels which may reduce net income, or revised underwriting standards permitting higher loan-to-value ratios on properties securing nonconforming mortgage loans which may harm our operations. In addition, certain of the states where we originate mortgage loans restrict or prohibit prepayment penalties on mortgage loans. In the past, we have been able to rely on the federal Alternative Mortgage Transaction Parity Act (the “Parity Act”) to preempt these state restrictions and prohibitions. However, on September 25, 2002, the Office of Thrift Supervision (the “OTS”) released a rule that reduced the scope of the federal preemption. As a result, we are required to comply with state restrictions on prepayment penalties, which may put us at a competitive disadvantage relative to other financial institutions that will continue to benefit from the federal preemption rule. |
| • | If we fail to maintain REIT status, we would be subject to tax as a regular corporation. We conduct a substantial portion of our business through our taxable REIT subsidiaries, which creates additional compliance requirements. We must comply with various tests to continue to qualify as a REIT for federal income tax purposes. We conduct a substantial portion of our business through taxable REIT subsidiaries, such as NovaStar Mortgage. Despite our qualification as a REIT, our taxable REIT subsidiaries must pay federal income tax on their taxable income. Our income from and investments in our taxable REIT subsidiaries generally do not constitute permissible income and investments for some of the REIT qualification tests. While we attempt to ensure that our dealings with our taxable REIT subsidiaries will not adversely affect our REIT qualification, no assurance can be given that we will successfully achieve that result. Furthermore, we may be subject to a 100% penalty tax, or our taxable REIT subsidiary may be denied deductions, to the extent that our dealings with our taxable REIT subsidiaries (such as our receipt of loan guarantee payments) are deemed not to be arm’s length in nature. |
| • | Restrictions on ownership of capital stock may inhibit market activity and the resulting opportunity for holders of our capital stock to receive a premium for their securities.In order for us to meet the requirements for qualification as a REIT, our charter generally prohibits any person from acquiring or holding, directly or indirectly, shares of capital stock in excess of 9.8% of the outstanding shares. This restriction may inhibit market activity and the resulting opportunity for the holders of our capital stock to receive a premium for their stock that might otherwise exist in the absence of such restrictions. |
| • | Various legal proceedings could adversely affect our financial condition or results of operations. In the normal course of our business, we are subject to various legal proceedings and claims. The resolution of these legal matters could adversely affect our financial condition or results of operation. |
Federal Income Tax Consequences
General. We believe we have complied, and intend to comply in the future, with the requirements for qualification as a REIT under the Code. To the extent that we qualify as a REIT for federal income tax purposes, we generally will not be subject to federal income tax on the amount of income or gain that is distributed to shareholders. However, origination and broker operations are conducted through NovaStar Mortgage and NovaStar Home Mortgage, which are owned by NFI Holding – a taxable REIT subsidiary (TRS). Consequently, all of the taxable income of NFI Holding is subject to federal and state corporate income taxes. In general, a TRS may hold assets that a REIT cannot hold directly and generally may engage in any real estate or non-real estate related business. However, special rules do apply to certain activities between a REIT and its TRS. For example, a TRS will be subject to earnings stripping limitations on the deductibility of interest paid to its REIT. In addition, a REIT will be subject to a 100% excise tax on certain excess amounts to ensure that (i) tenants who pay a TRS for services are charged an arm’s-length amount by the TRS, (ii) fees paid to a REIT by its TRS are reflected at fair market value and (iii) interest paid by a TRS to its REIT is commercially reasonable.
The REIT rules generally require that a REIT invest primarily in real estate related assets, its activities be passive rather than active and it distribute annually to its shareholders substantially all of its taxable income. We could be subject to a number of taxes if we failed to satisfy those rules or if we acquired certain types of income-producing real property through foreclosure. Although no complete assurance can be given, we do not expect that we will be subject to material amounts of such taxes.
Failure to satisfy certain Code requirements could cause loss of REIT status. If we fail to qualify as a REIT for any taxable year, we would be subject to federal income tax (including any applicable minimum tax) at regular corporate rates and would not receive deductions for dividends paid to shareholders. As a result, the amount of after-tax earnings available for distribution to shareholders would decrease substantially. While we intend to operate in a manner that will enable us to qualify as a REIT in future taxable years, there can be no certainty that such intention will be realized.
Qualification as a REIT. Qualification as a REIT requires that we satisfy a variety of tests relating to income, assets, distributions and ownership. The significant tests are summarized below.
Sources of Income. We must satisfy two tests with respect to the sources of income: the 75% income test, and the 95% income test. The 75% income test requires that we derive at least 75% of gross income, excluding gross income from prohibited transactions, from certain passive real estate-related activities. In order to satisfy the 95% income test, at least 95% of gross income must be derived from the same sources as the 75% income test or from dividends or interest from any source. Management believes that we were in compliance with both of the income tests for the 2004 and 2003 calendar years.
Nature and Diversification of Assets. As of the last day of each calendar quarter, we must meet six requirements under the two asset tests. Under the 75% of assets test, at least 75% of the value of our total assets must represent cash or cash items (including receivables), government securities or real estate assets. Under the 25% assets test, no more than 25% of our total assets can be represented by securities, other than government securities, stock of a qualified REIT subsidiary, and securities that qualify as real estate assets under the 75% assets test (collectively “75% Securities”). Additionally, under the 25% assets test, no more than 20% of the value of our total assets can be represented by securities of one or more taxable REIT subsidiaries and no more than 5% of the value of our total assets can be represented by the securities of a single issuer, excluding 75% Securities. Furthermore, we may not own more than 10% of the total voting power or the total value of the outstanding securities of any one issuer, excluding 75% Securities.
If we inadvertently fail to satisfy one or more of the asset tests at the end of a calendar quarter, such failure would not cause us to lose our REIT status. We could still avoid disqualification by eliminating any discrepancy within 30 days after the close of the calendar quarter in which the discrepancy arose. Management believes that we are in compliance with all of the requirements of both asset tests for all quarters during 2004 and 2003.
Ownership of Common Stock. Our capital stock must be held by a minimum of 100 persons for at least 335 days of each year. In addition, at all times during the second half of each taxable year, no more than 50% in value of our capital stock may be owned directly or indirectly by 5 or fewer individuals. We use the calendar year as our taxable year for income tax purposes. The Code requires us to send annual information questionnaires to specified shareholders in order to assure compliance with the ownership tests. Management believes that we have complied with these stock ownership tests for 2004 and 2003.
Distributions. We must distribute at least 90% of our taxable income and any after-tax net income from certain types of foreclosure property less any non-cash income. No distributions are required in periods in which there is no income.
Taxable Income. We use the calendar year for both tax and financial reporting purposes. However, there may be differences between taxable income and income computed in accordance with accounting principles generally accepted in the United States of America (GAAP). These differences primarily arise from timing and character differences in the recognition of revenue and expense and gains and losses for tax and GAAP purposes. Additionally, taxable income does not include the taxable income of our taxable subsidiary, although the subsidiary’s operating results are included in our GAAP results.
Personnel
As of December 31, 2004, we employed 3,502 people. Of these, 1,738 were employed in our mortgage portfolio management and mortgage lending and loan servicing operations. Our branches employed 1,721 people as of December 31, 2004. The remaining employees were employed in our branch administrative functions.
Available Information
A copy of the filings we have made with the Securities and Exchange Commission (SEC) may be obtained on our website (www.novastarmortgage.com), through the website of the SEC (www.sec.gov) or by contacting us directly. Our investor relations contact information follows.
Investor Relations
8140 Ward Parkway, Suite 300
Kansas City, MO 64114
816.237.7000
Email: ir@novastar1.com
Our executive, administrative and loan servicing offices are located in Kansas City, Missouri, and consist of approximately 200,000 square feet of leased office space. The lease agreements on the premises expire in January 2011. The current annual rent for these offices is approximately $4.1 million.
We lease office space for our mortgage lending operations in Lake Forest, California; Independence, Ohio; Richfield, Ohio; Troy, Michigan; Columbia, Maryland and Vienna, Virginia. Currently, these offices consist of approximately 255,000 square feet. The leases on the premises expire from January 2005 through May 2012, and the current annual rent is approximately $4.1 million.
Since April 2004, a number of substantially similar class action lawsuits have been filed and consolidated into a single action in United States District Court for the Western District of Missouri. The consolidated complaint names as defendants the Company and three of its executive officers and generally alleges that the defendants made public statements that were misleading for failing to disclose certain regulatory and licensing matters. The plaintiffs purport to have brought this consolidated action on behalf of all persons who purchased the Company’s common stock (and sellers of put options on the Company’s stock) during the period October 29, 2003 through April 8, 2004. The Company believes that these claims are without merit and intends to vigorously defend against them.
In the wake of the securities class action, the Company has also been named as a nominal defendant in several derivative actions brought against certain of the Company’s officers and directors in Missouri and Maryland. The complaints in these actions generally claim that the defendants are liable to the Company for failing to monitor corporate affairs so as to ensure compliance with applicable state licensing and regulatory requirements.
In July 2004, an employee of NHMI filed a class and collective action lawsuit against NHMI and NovaStar Mortgage, Inc. (“NMI”) in the California superior Court for the County of Los Angeles. Subsequently, NHMI and NMI removed the matter to the United States District court for the Central District of California. The plaintiff brought this class and collective action on behalf of herself and all past and present employees of NHMI and NMI who were employed since May 1, 2000 in the capacity generally described as Loan Officer. The plaintiff alleged that NHMI and NMI failed to pay her and the members of the class she purported to represent overtime premium and minimum wage as required by the Fair Labor Standards Act and California state laws for the period commencing May 1, 2000. In January 2005, the plaintiff and NHMI agreed upon a nationwide settlement in the nominal amount of $3.1 million on behalf of a class of all NHMI Loan Officers nationwide. The settlement, which is subject to court approval, covers all minimum wage and overtime claims going back to July 30, 2001, and includes the dismissal with prejudice of the claims against NMI. Since not all class members will elect to be part of the settlement, the Company estimated the probable obligation related to the settlement to be in a range of $1.3 million to $1.7 million. In accordance with SFAS No. 5,Accounting for Contingencies, the Company recorded a charge to earnings of $1.3 million in 2004.
In addition to those matters listed above, the Company is currently party to various other legal proceedings and claims. While management, including internal counsel, currently believes that the ultimate outcome of these proceedings and claims, individually and in the aggregate, will not have a material adverse effect on the Company’s financial condition or results of operations, litigation is subject to inherent uncertainties. If an unfavorable ruling were to occur, there exists the possibility of a material adverse impact on the results of operations for the period in which the ruling occurs.
In April 2004, the Company also received notice of an informal inquiry from the Securities & Exchange Commission requesting that it provide various documents relating to its business. The Company has been cooperating fully with the Commission’s inquiry.
Item 4.Submission of Matters to a Vote of Security Holders
None
Item 5.Market for Registrant’s Common Equity and Related Stockholder Matters and Issuer Purchases of Equity Securities
Market Price of and Dividends on the Registrant’s Common and Preferred Equity and Related Stockholder Matters. The common stock of NovaStar Financial, Inc (“NFI”) is traded on the NYSE under the symbol “NFI”. Our Series C Cumulative Redeemable Perpetual Preferred Stock is traded on the NYSE under the symbol “NFI-PC”. The following table sets forth, for the periods indicated, the high and low sales prices per share of common stock on the NYSE and the cash dividends paid or payable per share of capital stock.
Common Stock Prices | Cash Dividends | ||||||||||||||
| High | Low | Class of Stock | Declared | Paid or Payable | Amount Per Share | ||||||||||
1/1/03 to 3/31/03 | $ | 18.10 | $ | 13.90 | Common Common | 1/29/03 4/22/03 | 2/11/03 5/15/03 | $ | 0.17 1.13 | ||||||
4/1/03 to 6/30/03 | 30.50 | 17.15 | Common | 7/30/03 | 8/20/03 | 1.25 | |||||||||
7/1/03 to 9/30/03 | 37.75 | 24.25 | Common | 10/29/03 | 11/19/03 | 1.25 | |||||||||
10/1/03 to 12/31/03 | 45.80 | 28.63 | Common | 12/17/03 | 1/6/04 | 1.25 | |||||||||
1/1/04 to 3/31/04 | 70.32 | 42.50 | Preferred Common | 1/28/04 4/28/04 | 3/31/04 5/26/04 | | 0.43 1.35 | ||||||||
4/1/04 to 6/30/04 | 66.59 | 28.75 | Preferred Common | 4/28/04 7/28/04 | 6/30/04 8/26/04 | | 0.56 1.35 | ||||||||
7/1/04 to 9/30/04 | 48.69 | 37.29 | Preferred Common | 7/28/04 10/28/04 | 9/30/04 11/22/04 | | 0.56 1.40 | ||||||||
10/1/04 to 12/31/04 | 58.04 | 40.19 | Preferred Common | 10/28/04 12/22/04 | 12/31/04 1/14/05 | | 0.56 2.65 | ||||||||
As of March 11, 2005, approximately 27,000 stockholders held our 27,860,629 shares of common stock as provided by third-party brokers and transfer agent reports.
We intend to make distributions to stockholders of all or substantially all of taxable income in each year, subject to certain adjustments, so as to qualify for the tax benefits accorded to a REIT under the Code. All distributions will be made at the discretion of the Board of Directors and will depend on earnings, financial condition, maintenance of REIT status and other factors as the Board of Directors may deem relevant.
Recent Sales of Unregistered Securities. None.
Purchase of Equity Securities by the Issuer.
Issuer Purchases of Equity Securities
(dollars in thousands)
Total Number of Shares Purchased | Average Price Paid per Share | Total Number of Shares Purchased as Part of Publicly Announced Plans or Programs | Approximate Dollar that May Yet Be Purchased Under the Plans or Programs (A) | ||||||
October 1, 2004 – October 31, 2004 | — | — | — | $ | 1,020 | ||||
November 1, 2004 – November 30, 2004 | — | — | — | $ | 1,020 | ||||
December 1, 2004 – December 31, 2004 | — | — | — | $ | 1,020 | ||||
| (A) | Current report on Form 8-K was filed on October 2, 2000 announcing that the Board of Directors authorized the company to repurchase its common shares, bringing the total authorization to $9 million. |
Item 6.Selected Financial Data
The following selected consolidated financial data is derived from our audited consolidated financial statements for the periods presented and should be read in conjunction with the more detailed information therein and “Management’s Discussion and Analysis of Financial Condition and Results of Operations” included elsewhere in this annual report. Operating results are not necessarily indicative of future performance.
Selected Consolidated Financial and Other Data
(dollars in thousands, except per share amounts)
| For the Year Ended December 31, | ||||||||||||||||||||
| 2004 | 2003 | 2002 | 2001 | 2000 (A) | ||||||||||||||||
Consolidated Statement of Operations Data: | ||||||||||||||||||||
Interest income | $ | 224,024 | $ | 170,420 | $ | 107,143 | $ | 57,904 | $ | 47,627 | ||||||||||
Interest expense | 52,590 | 40,364 | 27,728 | 27,366 | 34,696 | |||||||||||||||
Net interest income before credit recoveries (losses) | 171,434 | 130,056 | 79,415 | 30,538 | 12,931 | |||||||||||||||
Credit (losses) recoveries | (726 | ) | 389 | 432 | (3,608 | ) | (5,449 | ) | ||||||||||||
Gains (losses) on sales of mortgage assets | 144,950 | 144,005 | 53,305 | 37,347 | (826 | ) | ||||||||||||||
Losses on derivative instruments | (8,905 | ) | (30,837 | ) | (36,841 | ) | (3,953 | ) | — | |||||||||||
Impairment on mortgage securities – available for sale | (15,902 | ) | — | — | — | — | ||||||||||||||
General and administrative expenses | 271,125 | 174,408 | 84,594 | 46,505 | 3,017 | |||||||||||||||
Income from continuing operations | 119,497 | 111,996 | 48,761 | 32,308 | 5,626 | |||||||||||||||
Loss from discontinued operations, net of income tax (C) | (4,108 | ) | — | — | — | — | ||||||||||||||
Net income available to common shareholders | 109,124 | 111,996 | 48,761 | 32,308 | 5,626 | |||||||||||||||
Basic income per share: | ||||||||||||||||||||
Income from continuing operations available to common shareholders | $ | 4.47 | $ | 5.04 | $ | 2.35 | $ | 1.61 | $ | 0.26 | ||||||||||
Loss from discontinued operations, net of income tax (C) | (0.16 | ) | — | — | — | — | ||||||||||||||
Net income available to common shareholders | $ | 4.31 | $ | 5.04 | $ | 2.35 | $ | 1.61 | $ | 0.26 | ||||||||||
Diluted income per share: | ||||||||||||||||||||
Income from continuing operations available to common shareholders | $ | 4.40 | $ | 4.91 | $ | 2.25 | $ | 1.51 | $ | 0.25 | ||||||||||
Loss from discontinued operations, net of income tax (C) | (0.16 | ) | — | — | — | — | ||||||||||||||
Net income available to common shareholders | $ | 4.24 | $ | 4.91 | $ | 2.25 | $ | 1.51 | $ | 0.25 | ||||||||||
| As of December 31, | ||||||||||||||||||||
| 2004 | 2003 | 2002 | 2001 | 2000 (A) | ||||||||||||||||
Consolidated Balance Sheet Data: | ||||||||||||||||||||
Mortgage Assets: | ||||||||||||||||||||
Mortgage loans | $ | 807,121 | $ | 792,709 | $ | 1,133,509 | $ | 365,560 | $ | 375,927 | ||||||||||
Mortgage securities – available-for-sale | 489,175 | 382,287 | 178,879 | 71,584 | 46,650 | |||||||||||||||
Mortgage securities - trading | 143,153 | — | — | — | — | |||||||||||||||
Total assets | 1,861,311 | 1,399,957 | 1,452,497 | 512,380 | 494,482 | |||||||||||||||
Borrowings | 1,295,422 | 1,005,516 | 1,225,228 | 362,398 | 382,437 | |||||||||||||||
Stockholders’ equity | 426,344 | 300,224 | 183,257 | 129,997 | 107,919 | |||||||||||||||
Other Data: Loans originated and purchased, principal Loans securitized, principal Nonconforming loans sold, principal Loan servicing portfolio, principal Annualized return on assets Annualized return on equity Taxable income (loss) available to common shareholders (D) Taxable income (loss) per common share (B) (D) Dividends declared per common share (B) Dividends declared per preferred share For the Year Ended December 31, 2004 2003 2002 2001 2000 $ 8,486,028 $ 5,994,492 $ 2,781,539 $ 1,333,366 $ 719,341 $ 8,329,804 $ 5,319,435 $ 1,560,001 $ 1,215,100 $ 584,350 $ — $ 151,210 $ 142,159 $ 73,324 $ 172,839 $ 12,151,196 $ 7,206,113 $ 3,657,640 $ 1,994,448 $ 1,112,615 7.01 % 9.93 % 6.05 % 6.03 % 0.97 % 34.29 % 58.90 % 30.30 % 27.04 % 5.50 % $ 250,501 $ 137,851 $ 49,511 $ 5,221 $ (2 ) $ 9.04 $ 5.64 $ 2.36 $ 0.45 $ — $ 6.75 $ 5.04 $ 2.15 $ 0.48 $ — $ 2.11 $ — $ — $ 1.08 $ 0.49
| (A) | Does not include the assets, liabilities, equity and results of operations for NFI Holding Corporation. The common stock of NFI Holding Corporation was acquired on January 1, 2001. |
| (B) | On January 29, 2003, a $0.165 special dividend related to 2002 taxable income was declared per common share. |
| (C) | Discussion and detail regarding the loss from discontinued operations is provided in Note 14 to the consolidated financial statements. |
| (D) | Taxable income (loss) for years prior to 2004, are actual while 2004 taxable income is an estimate. For a reconciliation of taxable income to GAAP income see “Income Taxes” included in “Management’s Discussion and Analysis of Financial Condition and Results of Operations.” The common shares outstanding as of the end of each period presented is used in calculating the taxable income (loss) per common share. |
Item 7.Management’s Discussion and Analysis of Financial Condition and Results of Operations
The following discussion should be read in conjunction with the consolidated financial statements of NovaStar Financial, Inc. and the notes thereto included elsewhere in this report.
Safe Harbor Statement
“Safe Harbor” statement under the Private Securities Litigation Reform Act of 1995: Statements in this discussion regarding NovaStar Financial, Inc. and its business, which are not historical facts, are “forward-looking statements” that involve risks and uncertainties. Certain matters discussed in this report may constitute forward-looking statements within the meaning of the federal securities laws that inherently include certain risks and uncertainties. Actual results and the time of certain events could differ materially from those projected in or contemplated by the forward-looking statements due to a number of factors, including general economic conditions, fluctuations in interest rates, fluctuations in prepayment speeds, fluctuations in losses due to defaults on mortgage loans, the availability of nonconforming residential mortgage loans, the availability and access to financing and liquidity resources, and other risk factors previously outlined in this annual report on Form 10-K for the fiscal year ended December 31, 2004. Other factors not presently identified may also cause actual results to differ. Management continuously updates and revises these estimates and assumptions based on actual conditions experienced. It is not practicable to publish all revisions and, as a result, no one should assume that results projected in or contemplated by the forward-looking statements will continue to be accurate in the future.
Overview of Performance
During 2004, we reported income from continuing operations available to common shareholders of $113.2 million, or $4.40 per diluted share, as compared to $112.0 million, or $4.91 per diluted share in 2003. We also reported a loss from discontinued operations, net of income tax, of $4.1 million, or $0.16 per diluted share in 2004. See further discussion of discontinued operations under the heading “Results of Operations.”
Our income from continuing operations available to common shareholders was driven largely by the income generated by our mortgage securities portfolio, which increased from $382.3 million as of December 31, 2003 to $489.2 million as of December 31, 2004. These securities are retained from securitizations of the mortgage loans we originate and purchase. We securitized $8.3 billion of mortgage loans in 2004 as compared to $5.3 billion in 2003. The increased volume of mortgage loans we securitized is directly attributable to the increase in our loan origination and purchase volume. During 2004 and 2003, we originated and purchased $8.4 billion and $5.3 billion, respectively, in nonconforming, residential mortgage loans. We increased our loan production through adding sales personnel primarily in new and underserved markets. Although we securitized approximately $3.0 billion more of nonconforming, residential mortgage loans in 2004 as compared to 2003, our income from continuing operations available to common shareholders increased only slightly by $1.2 million as a result of the decline in profit margins in our mortgage lending (banking) segment and the impairments on our mortgage securities available-for-sale within our mortgage portfolio segment.
Our profit margins within the mortgage lending (banking) segment were down as a result of the significant increase in short-term rates while the coupons on the mortgage loans we originated and purchased increased only slightly from 2003. One-month LIBOR and the two-year swap rate increased from 1.12% and 2.15%, respectively, at December 31, 2003 to 2.40% and 3.45%, respectively, at December 31, 2004 while the weighted average coupon on our nonconforming originations and purchases in 2004 was 7.6% as compared to 7.3% in 2003. These factors contributed to the whole loan price used in valuing our mortgage securities to significantly decrease in 2004, which is directly correlated to the decrease in gains on sales of mortgage loans as a percentage of the collateral securitized. For the years ended December 31, 2004 and 2003, the weighted average net whole loan price used in the initial valuation of our retained securities was 103.28 and 104.21, respectively, and the weighted average gain on securitization as a percentage of the collateral securitized was 1.7% and 2.6%, respectively.
We recognized impairments on our mortgage securities available-for-sale of $15.9 million in 2004. The impairments were related to the significant increase in short-term interest rates during 2004 as well as higher than anticipated prepayments which resulted from substantial increases in housing prices in recent years. The impairments were primarily related to our 2004 mortgage securities. As discussed under the heading “Mortgage Securities Available-for-Sale” under “Critical Accounting Estimates,” to the extent that the cost basis of our mortgage securities exceeds the fair value and the unrealized loss is considered other than temporary, an impairment charge is recognized in earnings. Conversely, when the fair value of our mortgage securities exceeds the cost basis then the unrealized gain is recorded in accumulated other comprehensive income which is a component of the stockholders’ equity section of our consolidated balance sheet.
Summary of Operations and Key Performance Measurements
Our net income is highly dependent upon our mortgage securities - available-for-sale portfolio, which is generated from the securitization of nonconforming loans we have originated and purchased. These mortgage securities represent the right to receive the net future cash flows from a pool of nonconforming loans. Generally speaking, the more nonconforming loans we originate and purchase, the larger our securities portfolio and, therefore, the greater earnings potential. As a result, earnings are related to the volume of nonconforming loans and related performance factors for those loans, including their average coupon, borrower default rate and borrower prepayment rate. Information regarding our lending volume is presented under the heading “Mortgage Loans.”
The primary function of our mortgage lending operations is to generate nonconforming loans, the majority of which will serve as collateral for our mortgage securities - available-for-sale. While our mortgage lending operations generate sizable revenues in the form of gains on sales of mortgage loans and fee income from borrowers and third party investors, the revenue serves largely to offset the related costs.
We also service the mortgage loans we originate and purchase and that serve as collateral for our mortgage securities - available-for-sale. The servicing function is critical to the management of credit risk (risk of borrower default and the related economic loss) within our mortgage portfolio. Again, while this operation generates significant fee revenue, its revenue serves largely to offset the cost of this function.
The key performance measures for management are:
Management’s discussion and analysis of financial condition and results of operations, along with other portions of this report, are designed to provide information regarding our performance and these key performance measures.
Known Material Trends
Over the last ten years, the nonconforming lending market has grown from less than $50 billion to approximately $530 billion in 2004 as estimated by the National Mortgage News. A significant portion of these loans are made to borrowers who are using equity in their primary residence to consolidate low-balance, installment or consumer debt. The nonconforming market has grown through a variety of interest rate environments. One of the main drivers of growth in this market has been the rise in housing prices which gives borrowers the opportunity to use the equity in their home to consolidate their high interest rate, short-term, non-tax deductible consumer or installment debt into lower interest rate, long-term, often tax deductible mortgage debt. Management estimates that NovaStar has a 1-2% market share. While management cannot predict consumer spending and borrowing habits, historical trends indicate that the market in which we operate is relatively stable and should continue to experience long term growth.
We depend on the capital markets to finance the mortgage loans we originate and purchase. The primary bonds we issue in our loan securitizations are sold to large, institutional investors and United States of America government-sponsored enterprises. The equity marketplace provides capital to operate our business. The trend has been favorable in the capital markets for the types of securitization transactions we execute. Investor appetite for the bonds created has been strong. Additionally, commercial and investment banks have provided significant liquidity to finance our mortgage lending operations through warehouse repurchase facilities. While management cannot predict the future liquidity environment, we are unaware of any material reason that would disrupt continued liquidity support in the capital markets for our business. See the “Liquidity and Capital Resources” section of “Management’s Discussion and Analysis of Financial Condition and Results of Operations” for further discussion of liquidity risks and resources available to us.
Within the past two years, the mortgage REIT industry has seen a significant increase in the desire for raising public capital. Additionally, there have been several new entrants to the mortgage REIT business and other mortgage lender conversions (or proposed conversions) to REIT status. This increased activity may impact the pricing and underwriting guidelines within the nonconforming marketplace.
State and local governing bodies are focused on the nonconforming lending business and any excessive fees borrowers incur in obtaining a mortgage loan – generally termed “predatory lending” within the mortgage industry. In several instances, states or local governing bodies have imposed strict laws on lenders to curb predatory lending. To date, these laws have not had a significant impact on our business. We have capped fee structures consistent with those adopted by federal mortgage agencies and have implemented rigid processes to ensure that our lending practices are not predatory in nature.
Critical Accounting Estimates
We prepare our consolidated financial statements in conformity with accounting principles generally accepted in the United States of America and, therefore, are required to make estimates regarding the values of our assets and liabilities and in recording income and expenses. These estimates are based, in part, on our judgment and assumptions regarding various economic conditions that we believe are reasonable based on facts and circumstances existing at the time of reporting. The results of these estimates affect reported amounts of assets, liabilities and accumulated other comprehensive income at the date of the consolidated financial statements and the reported amounts of income, expenses and other comprehensive income during the periods presented. The following summarizes the components of our consolidated financial statements where understanding accounting policies is critical to understanding and evaluating our reported financial results, especially given the significant estimates used in applying the policies. The discussion is intended to demonstrate the significance of estimates to our financial statements and the related accounting policies. Detailed accounting policies are provided in Note 1 to our consolidated financial statements. Our critical accounting estimates impact only two of our three reportable segments; our mortgage portfolio management and mortgage lending and loan servicing segments. Management has discussed the development and selection of these critical accounting estimates with the audit committee of our board of directors and the audit committee has reviewed our disclosure.
Transfers of Assets (Loan and Mortgage Security Securitizations) and Related Gains. In a loan securitization, we combine the mortgage loans we originate and purchase in pools to serve as collateral for asset-backed bonds that are issued to the public. In a mortgage security securitization (also known as a “Resecuritization”), we combine mortgage securities - available-for-sale retained in previous loan securitization transactions to serve as collateral for asset-backed bonds that are issued to the public. The loans or mortgage securities - available-for-sale are transferred to a trust designed to serve only for the purpose of holding the collateral. The trust is considered a qualifying special purpose entity as defined by SFAS No. 140,Accounting for Transfers and Servicing of Financial Assets and Extinguishments of Liabilities – a replacement of FASB Statement No. 125. The owners of the asset-backed bonds have no recourse to us in the event the collateral does not perform as planned except where defects have occurred in the loan documentation and underwriting process.
In order for us to determine proper accounting treatment for each securitization or resecuritization, we evaluate whether or not we have retained or surrendered control over the transferred assets by reference to the conditions set forth in SFAS No. 140. All terms of these transactions are evaluated against the conditions set forth in these statements. Some of the questions that must be considered include:
Generally, we intend to structure our securitizations so that control over the collateral is transferred and the transfer is accounted for as a sale. For resecuritizations, we intend to structure these transactions to be accounted for as secured borrowings.
When these transfers are executed in a manner such that we have surrendered control over the collateral, the transfer is accounted for as a sale. In accordance with SFAS No. 140, a gain or loss on the sale is recognized based on the carrying amount of the financial assets involved in the transfer, allocated between the assets transferred and the retained interests based on their relative fair value at the date of transfer. In a loan securitization, we do retain the right to service the underlying mortgage loans and we also retain certain mortgage securities - available-for-sale issued by the trust (see Mortgage Securities – Available-for-Sale below). As previously discussed, the gain recognized upon securitization depends on, among other things, the estimated fair value of the components of the securitization – the loans or mortgage securities - available-for-sale transferred, the securities retained and the mortgage servicing rights. The estimated fair value of the securitization components is considered a “critical accounting estimate” as 1) these gains or losses represent a significant portion of our operating results and 2) the valuation assumptions used regarding economic conditions and the make-up of the collateral, including interest rates, principal payments, prepayments and loan defaults are highly uncertain and require a large degree of judgment.
We believe the best estimate of the initial value of the securities we retain in a whole loan securitization is derived from the market value of the pooled loans. The initial value of the loans is estimated based on the expected open market sales price of a similar pool. In open
market transactions, the purchaser has the right to reject loans at its discretion. In a loan securitization, loans cannot generally be rejected. As a result, we adjust the market price for the loans to compensate for the estimated value of rejected loans. The market price of the securities retained is derived by deducting the percent of net proceeds received in the securitization (i.e. the economic value of the loans transferred) from the estimated adjusted market price for the entire pool of the loans.
An implied yield (discount rate) is calculated based on the initial value derived above and using projected cash flows generated using assumptions for prepayments, expected credit losses and interest rates. We ascertain the resulting implied yield is commensurate with current market conditions. Additionally, this yield serves as the initial accretable yield used to recognize income on the securities.
For purposes of valuing our mortgage securities - available-for-sale, it is important to know that in recent securitization transactions we not only have transferred loans to the trust, but we have also transferred interest rate agreements to the trust with the objective of reducing interest rate risk within the trust. During the period before loans are transferred in a securitization transaction, as discussed under “Net Interest Income”, “Interest Rate/Market Risk” and “Hedging”, we enter into interest rate swap or cap agreements to reduce interest rate risk. We use interest rate cap and swap contracts to mitigate the risk of the cost of variable rate liabilities increasing at a faster rate than the earnings on assets during a period of rising rates. Certain interest rate agreements are then transferred into the trust at the time of securitization. Therefore, the trust assumes the obligation to make payments and obtains the right to receive payments under these agreements.
In valuing our mortgage securities - available-for-sale it is also important to understand what portion of the underlying mortgage loan collateral is covered by mortgage insurance. The cost of the insurance is paid by the trust from proceeds the trust receives from the underlying collateral. The trust legally assumes the responsibility to pay the mortgage insurance premiums and the rights to receive claims for credit losses. Therefore, we have no obligation to pay these insurance premiums. This information is significant for valuation as the mortgage insurance significantly reduces the credit losses born by the owner of the loan. Mortgage insurance claims on loans where a defect occurred in the loan origination process will not be paid by the mortgage insurer. The assumptions we use to value our mortgage securities - available-for-sale consider this risk. We discuss mortgage insurance premiums under the heading “Premiums for Mortgage Loan Insurance”.
The weighted average net whole loan market price used in the initial valuation of our retained securities was 103.28 and 104.21 during 2004 and 2003, respectively. The weighted average implied discount rate for the years ended December 31, 2004 and 2003 was 22%. If the whole loan market price used in the initial valuation of our mortgage securities - available-for-sale in 2004 had been increased or decreased by 50 basis points, the initial value of our mortgage securities - available-for-sale and the gain we recognized would have increased or decreased by $41.6 million.
Information regarding the assumptions we used is discussed under “Mortgage Securities – Available-for-Sale” in the following discussion.
When we do have the ability to exert control over the transferred collateral, the assets remain on our financial records and a liability is recorded for the related asset-backed bonds. The servicing agreements that we execute for loans we have securitized includes a removal of accounts provision which gives us the right, not the obligation, to repurchase mortgage loans from the trust. The removal of accounts provision can be exercised for loans that are 90 days to 119 days delinquent. We record the mortgage loans subject to the removal of accounts provision in mortgage loans held-for-sale at fair value and the related repurchase obligation as a liability. The clean up call option can be exercised when the aggregate principal balance of the mortgage loans has declined to ten percent or less of the original aggregated mortgage loan principal balance.
Mortgage Securities – Available-for-Sale. Our mortgage securities represent beneficial interests we retain in securitization transactions. The beneficial interests we retain in securitization transactions primarily consist of the right to receive the future cash flows from a pool of securitized mortgage loans which include:
The cash flows we receive are highly dependent upon the interest rate environment. The cost of financing for the securitized loans is indexed to short-term interest rates, while the loan coupons are less interest sensitive. As a result, as rates rise and fall, our cash flows will fall and rise, which in turn will decrease or increase the value of our mortgage securities. Additionally, the cash flows we receive are dependent on the default and prepayment experience of the borrowers of the underlying mortgage security collateral. Increasing or decreasing cash flows will increase or decrease the yield on our securities.
We believe the accounting estimates related to the valuation of our mortgage securities - available-for-sale and establishing the rate of income recognition on mortgage securities - available-for-sale are “critical accounting estimates” because they can materially affect net income and stockholders’ equity and require us to forecast interest rates, mortgage principal payments, prepayments and loan default assumptions which are highly uncertain and require a large degree of judgment. The rate used to discount the projected cash flows is also critical in the valuation of our mortgage securities - available-for-sale. We use internal, historical collateral performance data and published forward yield curves when modeling future expected cash flows and establishing the rate of income recognized on mortgage securities - available-for-sale. We believe the value of our mortgage securities - available-for-sale is fair, but can provide no assurance that future prepayment and loss experience or changes in their required market discount rate will not require write-downs of the residual assets. Impairments would reduce income in future periods when deemed other-than-temporary.
As payments are received they are applied to the cost basis of the mortgage related security. Each period, the accretable yield for each mortgage security is evaluated and, to the extent there has been a change in the estimated cash flows, it is adjusted and applied prospectively. The estimated cash flows change as management’s assumptions for credit losses, borrower prepayments and interest rates are updated. The assumptions are established using internally developed models. We prepare analyses of the yield for each security using a range of these assumptions. The accretable yield used in recording interest income is generally set within a range of base assumptions. The accretable yield is recorded as interest income with a corresponding increase to the cost basis of the mortgage security.
At each reporting period subsequent to the initial valuation of the retained securities, the fair value of mortgage securities - available-for-sale is estimated based on the present value of future expected cash flows to be received. Management’s best estimate of key assumptions, including credit losses, prepayment speeds, the market discount rates and forward yield curves commensurate with the risks involved, are used in estimating future cash flows. To the extent that the cost basis of mortgage securities - available-for-sale exceeds the fair value and the unrealized loss is considered to be other than temporary, an impairment charge is recognized and the amount recorded in accumulated other comprehensive income or loss is reclassified to earnings as a realized loss. During the year ended December 31, 2004, we recorded an impairment loss of $15.9 million on NMFT Series 1999-1, 2004-1, 2004-2 and 2004-3. The impairments were a result of a significant increase in short-term interest rates during the year as well as higher than anticipated prepayments. While we do use forward yield curves in valuing our securities, the increase in two-year and three-year swap rates was greater than the forward yield curve had anticipated, thus causing a greater than expected decline in value. Prepayments were higher than expected due to substantial increases in housing prices in the past few years. Increases in housing prices give borrowers the opportunity to use the increase in the equity in their homes to refinance their existing mortgage into lower-rate mortgages. See Table 4 for a quarterly summary of the cost basis, unrealized gain (loss) and fair value of our mortgage securities - - available-for-sale.
Our average security yield has decreased to 31.4% for the year ended December 31, 2004 from 34.3% for the same period of 2003. This decrease is a result of the significant rise in short-term interest rates in 2004. Mortgage securities – available-for-sale income has increased from $98.8 million for the year ended December 31, 2003 to $133.6 million for the same period of 2004 due to the increase in the average balance of our securities portfolio. If the rates used to accrue income on our mortgage securities - available-for-sale during 2004 had increased or decreased by 10%, net income during the year ended 2004 would have increased by $34.1 million and decreased by $36.8 million, respectively.
As of December 31, 2004 and 2003, the weighted average discount rate used in valuing our mortgage securities - available-for-sale was 22%. The weighted average constant prepayment rate used in valuing our mortgage securities - available-for-sale as of December 31, 2004 was 39 versus 33 as of December 31, 2003. If the discount rate used in valuing our mortgage securities - available-for-sale as of December 31, 2004 had been increased by 500 basis points, the value of our mortgage securities - available-for-sale would have decreased $24.8 million. If we had decreased the discount rate used in valuing our mortgage securities - available-for-sale by 500 basis points, the value of our mortgage securities - available-for-sale would have increased $28.6 million.
Mortgage Loans and Allowance for Credit Losses. Mortgage loans held-for-sale are recorded at the lower of cost or market determined on an aggregate basis. Mortgage loan origination fees and direct costs on mortgage loans held-for-sale are deferred until the related loans are sold. Premiums paid to acquire mortgage loans held-for-sale are also deferred until the related loans are sold. Mortgage loans held-in-portfolio are recorded at their cost, adjusted for the amortization of net deferred costs and for credit losses inherent in the portfolio. Mortgage loan origination fees and associated direct costs on mortgage loans held-in-portfolio are deferred and recognized over the life of the loan as an adjustment to yield using the level yield method. Premiums paid to acquire mortgage loans held-in-portfolio are also deferred and recognized over the life of the loan as an adjustment to yield using the level yield method. An allowance for credit losses is maintained for mortgage loans held-in-portfolio.
The allowance for credit losses on mortgage loans held-in-portfolio, and therefore the related adjustment to income, is based on the assessment by management of various factors affecting our mortgage loan portfolio, including current economic conditions, the
makeup of the portfolio based on credit grade, loan-to-value, delinquency status, mortgage insurance we purchase and other relevant factors. The allowance is maintained through ongoing adjustments to operating income. The assumptions used by management regarding key economic indicators are highly uncertain and involve a great deal of judgment.
Derivative Instruments and Hedging Activities. Our objective and strategy for using derivative instruments is to mitigate the risk of increased costs on our variable rate liabilities during a period of rising rates (i.e. interest rate risk). Our primary goals for managing interest rate risk are to maintain the net interest margin between our assets and liabilities and diminish the effect of changes in general interest rate levels on our market value. We primarily enter into interest rate swap agreements and interest rate cap agreements to manage our sensitivity to changes in market interest rates. The interest rate agreements we use have an active secondary market, and none are obtained for a speculative nature, for instance, trading. These interest rate agreements are intended to provide income and cash flows to offset potential reduced net interest income and cash flows under certain interest rate environments. The determination of effectiveness is the primary assumption and estimate used in hedging. At trade date, these instruments and their hedging relationship are identified, designated and documented.
SFAS No. 133,Accounting for Derivative Instruments and Hedging Activities (as amended), standardizes the accounting for derivative instruments, including certain instruments embedded in other contracts, by requiring that an entity recognize those items as assets or liabilities in the balance sheet and measure them at fair value. If certain conditions are met, an entity may elect to designate a derivative instrument either as a cash flow hedge, a fair value hedge or a hedge of foreign currency exposure. SFAS No. 133 requires derivative instruments to be recorded at their fair value with hedge ineffectiveness recognized in earnings.
Our derivative instruments that meet the hedge accounting criteria of SFAS No. 133 are considered cash flow hedges. We also have derivative instruments that do not meet the requirements for hedge accounting. However, these instruments also contribute to our overall risk management strategy by serving to reduce interest rate risk on average short-term borrowings used to fund loans held-for-sale.
Any changes in fair value of derivative instruments related to hedge effectiveness are reported in accumulated other comprehensive income. Changes in fair value of derivative instruments related to hedge ineffectiveness and non-hedge activity are recorded as adjustments to earnings. For those derivative instruments that do not qualify for hedge accounting, changes in the fair value of the instruments are recorded as adjustments to earnings.
Mortgage Servicing Rights (MSR). MSR are recorded at allocated cost based upon the relative fair values of the transferred loans and the servicing rights. MSR are amortized in proportion to and over the projected net servicing revenues. Periodically, we evaluate the carrying value of originated MSR based on their estimated fair value. If the estimated fair value, using a discounted cash flow methodology, is less than the carrying amount of the mortgage servicing rights, the mortgage servicing rights are written down to the amount of the estimated fair value. For purposes of evaluating and measuring impairment of MSR we stratify the mortgage servicing rights based on their predominant risk characteristics. The most predominant risk characteristic considered is period of origination. The mortgage loans underlying the MSR are pools of homogeneous, nonconforming residential loans.
The fair value of MSR is highly sensitive to changes in assumptions. Changes in prepayment speed assumptions have the most significant impact on the fair value of MSR. Generally, as interest rates decline, prepayments accelerate due to increased refinance activity, which results in a decrease in the fair value of MSR. As interest rates rise, prepayments slow down, which generally results in an increase in the fair value of MSR. All assumptions are reviewed for reasonableness on a quarterly basis and adjusted as necessary to reflect current and anticipated market conditions. Thus, any measurement of the fair value of MSR is limited by the existing conditions and the assumptions utilized as of a particular point in time. Those same assumptions may not be appropriate if applied at a different point in time.
Stock-Based Compensation. Prior to 2003, we accounted for our stock-based compensation plan using the recognition and measurement principles of Accounting Principles Board (APB) Opinion No. 25,Accounting for Stock Issued to Employees and related interpretations. We accounted for stock options based on the specific terms of the options granted. Options with variable terms, including those options for which the strike price has been adjusted and options issued by us with attached dividend equivalent rights, resulted in adjustments to compensation expense to the extent the market price of the common stock changed. No expense was recognized for options with fixed terms.
During the fourth quarter of 2003, we adopted the fair value recognition provisions of Statement of Financial Accounting Standards (SFAS) No. 123,Accounting for Stock-Based Compensation. SFAS No. 123 requires that all options be valued at the date of grant and expensed over their vesting period. We use the Black-Scholes option pricing model to value options granted.
Additionally, we selected the modified prospective method of adoption described in SFAS No. 148,Accounting for Stock-Based Compensation-Transition and Disclosure. Under this method, the change is retroactive to January 1, 2003 and compensation cost
recognized in 2003 is the same as that which would have been recognized had the fair value method of SFAS No. 123 been applied from its original effective date. The pretax impact of adopting the provisions under the modified prospective method for the nine months ended September 30, 2003 was a decrease to compensation expense of $7.1 million. In accordance with the modified prospective method of adoption, results for prior years have not been restated. SFAS No. 123 states that the adoption of the fair value based method is a change to a preferable method of accounting. We believe that use of the fair value based method to record stock-based compensation expense is consistent with the accounting for all other forms of compensation.
In accordance with the provisions of SFAS No. 123 and SFAS No. 148, $1.8 million and $1.3 million was recorded for total stock-based compensation expense in 2004 and 2003, respectively. In accordance with APB No. 25, total stock-based compensation expense was $2.5 million for the year ended December 31, 2002.
Financial Condition as of December 31, 2004 and 2003
Mortgage Loans. We classify our mortgage loans into two categories: “held-for-sale” and “held-in-portfolio”. Loans we have originated and purchased, but have not yet sold or securitized, are classified as “held-for-sale”. We expect to sell these loans outright in third-party transactions or in securitization transactions that will be, for tax and accounting purposes, recorded as sales. We use warehouse mortgage repurchase agreements to finance our held-for-sale loans. As such, the fluctuations in mortgage loans held-for-sale and short-term borrowings between December 31, 2004 and December 31, 2003 is dependent on loans we have originated and purchased during the period as well as loans we have sold outright or through securitization transactions.
The volume and cost of our loan production is critical to our financial results. The loans we produce serve as collateral for our mortgage securities - available-for-sale and generate gains as they are sold or securitized. The cost of our production is also critical to our financial results as it is a significant factor in the gains we recognize. The following table summarizes our loan production for 2004 and 2003. We discuss our cost of production under “General and Administrative Expenses” under “Results of Operations”. Also, detail regarding mortgage loans sold or securitized and the gains recognized during 2004 can be found in the “Gains on Sales of Mortgage Assets and Gains (Losses) on Derivative Instruments” section of this document.
Table 1 — Nonconforming Loan Originations and Purchases
(dollars in thousands, except for average loan balance)
| Number | Principal | Average Loan Balance | Price Paid to Broker | Weighted Average | Percent with Prepayment Penalty | |||||||||||||||||
Loan to Value | FICO Score | Coupon | ||||||||||||||||||||
2004 | 55,974 | $ | 8,424,361 | $ | 150,505 | 101.3 | % | 82 | % | 622 | 7.6 | % | 72 | % | ||||||||
2003 | 36,911 | $ | 5,250,978 | $ | 142,261 | 101.2 | % | 81 | % | 638 | 7.3 | % | 77 | % | ||||||||
A portion of the mortgage loans on our balance sheet serve as collateral for asset-backed bonds we have issued and are classified as “held-in-portfolio.” The carrying value of “held-in-portfolio” mortgage loans as of December 31, 2004 was $59.5 million compared to $94.7 million as of December 31, 2003.
Premiums are paid on substantially all mortgage loans. Premiums on mortgage loans held-in-portfolio are amortized as a reduction of interest income over the estimated lives of the loans. For mortgage loans held-for-sale, premiums are deferred until the related loans are sold. To mitigate the effect of prepayments on interest income from mortgage loans, we generally strive to originate and purchase mortgage loans with prepayment penalties.
In periods of decreasing interest rates, borrowers are more likely to refinance their mortgages to obtain a better interest rate. Even in rising rate environments, borrowers tend to repay their mortgage principal balances earlier than is required by the terms of their mortgages. Nonconforming borrowers, as they update their credit rating and as housing prices increase, are more likely to refinance their mortgage loan to obtain a lower interest rate.
The operating performance of our mortgage loan portfolio, including net interest income, allowance for credit losses and effects of hedging, are discussed under “Results of Operations” and “Interest Rate/Market Risk.” Gains on the sales of mortgage loans, including impact of securitizations treated as sales, is also discussed under “Results of Operations.” Additional information relating to our loans held-in-portfolio and loans held-for-sale can be accessed via our website at www.novastarmortgage.com. Such information includes a summary of our loans held-in-portfolio and loans held-for-sale by FICO score and geographic concentration. For held-in-portfolio loans, loan performance characteristics such as credit quality and prepayment experience are also available.
Table 2 — Carrying Value of Mortgage Loans
(dollars in thousands)
December 31, 2004 | December 31, 2003 | |||||||
Held-in-portfolio: | ||||||||
Current principal | $ | 58,859 | $ | 94,162 | ||||
Premium | $ | 1,175 | $ | 1,874 | ||||
Coupon | 10.0 | % | 10.0 | % | ||||
Percent with prepayment penalty | — | % | — | % | ||||
Held-for-sale: | ||||||||
Current principal | $ | 719,904 | $ | 673,405 | ||||
Premium | $ | 6,760 | $ | 10,112 | ||||
Coupon | 7.7 | % | 7.7 | % | ||||
Percent with prepayment penalty | 65 | % | 74 | % | ||||
Mortgage Securities– Available-for-Sale.Since 1998, we have pooled the majority of the loans we have originated or purchased to serve as collateral for asset-backed bonds in securitizations that are treated as sales for accounting and tax purposes. In these transactions, the loans are removed from our balance sheet. However, we retain excess interest, prepayment penalty and subordinated principal securities. Additionally, we service the loans sold in these securitizations (see “Mortgage Servicing Rights” under the header “Financial Condition as of December 31, 2004 and 2003”). As of December 31, 2004 and 2003, the fair value of our mortgage securities was $489.2 million and $382.3 million, respectively. During 2004 and 2003, we executed securitizations totaling $8.3 billion and $5.3 billion, respectively, in mortgage loans and retained mortgage securities with a cost basis of $381.8 million and $292.7 million, respectively. See Note 3 to the consolidated financial statements for a summary of the activity in our mortgage securities portfolio.
The value of our mortgage securities represents the present value of the securities’ cash flows that we expect to receive over their lives, considering estimated prepayment speeds and credit losses of the underlying loans, discounted at an appropriate risk-adjusted market rate of return. The cash flows are realized over the life of the loan collateral as cash distributions are received from the trust that owns the collateral.
In estimating the fair value of our mortgage securities, management must make assumptions regarding the future performance and cash flow of the mortgage loans collateralizing the securities. These estimates are based on management’s judgments about the nature of the loans. The cash flows we receive on our mortgage securities will be the net of the gross coupon and the bond cost less administrative costs (servicing and trustee fees) and the cost of mortgage insurance. Additionally, the trust is a party to interest rate agreements. Our cash flow will include (exclude) payments from (to) the interest rate agreement counterparty. Table 3 provides a summary of the critical assumptions used in estimating the cash flows of the collateral and the resulting estimated fair value of the mortgage securities.
In 2002 and 2003, interest expense on asset-backed bonds was unexpectedly low. As a result, the spread between the coupon interest and the bond cost was unusually high and our cost basis in many of our older mortgage securities was significantly reduced. For example, our cost basis in NMFT Series 2000-2, 2001-1 and 2001-2 has been reduced to zero (see Table 3). When our cost basis in the retained securities (interest-only, prepayment penalty and subordinated securities) reaches zero, the remaining future cash flows received on the securities are recognized entirely as income.
The operating performance of our mortgage securities portfolio, including net interest income and effects of hedging are discussed under “Results of Operations” and “Interest Rate/Market Risk.” Additional information relating to our loans collateralizing our mortgage securities can be accessed via our website at www.novastarmortgage.com. Such information includes a summary of our loans collateralizing our mortgage securities by FICO score and geographic concentration, as well as, loan performance characteristics such as credit quality and prepayment experience.
Table 3 — Valuation of Individual Mortgage Securities – Available-for-Sale and Assumptions
(dollars in thousands)
| Cost | Net Unrealized Gain | Estimated Fair Value of Mortgage Securities | Current Assumptions | Assumptions at Trust Securitization | |||||||||||||||||||||||
Discount Rate | Constant Prepayment Rate | Expected Credit Losses (A) | Discount Rate | Constant Prepayment Rate | Expected Credit Losses (A) | ||||||||||||||||||||||
December, 2004: | |||||||||||||||||||||||||||
NMFT 1999-1 | |||||||||||||||||||||||||||
Subordinated securities | $ | 7,001 | $ | — | $ | 7,001 | 17 | % | 33 | % | 4.8 | % | 17 | % | 30 | % | 2.5 | % | |||||||||
NMFT 2000-1 | |||||||||||||||||||||||||||
Interest-only | — | 352 | 352 | ||||||||||||||||||||||||
Prepayment penalty | — | 28 | 28 | ||||||||||||||||||||||||
Subordinated securities | 681 | 158 | 839 | ||||||||||||||||||||||||
| 681 | 538 | 1,219 | 15 | 46 | 1.2 | 15 | 27 | 1.0 | |||||||||||||||||||
NMFT 2000-2 | |||||||||||||||||||||||||||
Interest-only | — | 2,019 | 2,019 | ||||||||||||||||||||||||
Prepayment penalty | — | 105 | 105 | ||||||||||||||||||||||||
Subordinated securities | — | 166 | 166 | ||||||||||||||||||||||||
| — | 2,290 | 2,290 | 15 | 34 | 1.0 | 15 | 28 | 1.0 | |||||||||||||||||||
NMFT 2001-1 | |||||||||||||||||||||||||||
Interest-only | — | 2,262 | 2,262 | ||||||||||||||||||||||||
Prepayment penalty | — | 161 | 161 | ||||||||||||||||||||||||
Subordinated securities | — | 688 | 688 | ||||||||||||||||||||||||
| — | 3,111 | 3,111 | 20 | 37 | 1.1 | 20 | 28 | 1.2 | |||||||||||||||||||
NMFT 2001-2 | |||||||||||||||||||||||||||
Interest-only | — | 6,182 | 6,182 | ||||||||||||||||||||||||
Prepayment penalty | — | 458 | 458 | ||||||||||||||||||||||||
Subordinated securities | — | 1,961 | 1,961 | ||||||||||||||||||||||||
| — | 8,601 | 8,601 | 25 | 33 | 0.8 | 25 | 28 | 1.2 | |||||||||||||||||||
NMFT 2002-1 | |||||||||||||||||||||||||||
Interest-only | 3,553 | 242 | 3,795 | ||||||||||||||||||||||||
Prepayment penalty | 111 | 457 | 568 | ||||||||||||||||||||||||
Subordinated securities | 1,314 | 5,413 | 6,727 | ||||||||||||||||||||||||
| 4,978 | 6,112 | 11,090 | 20 | 42 | 0.9 | 20 | 32 | 1.7 | |||||||||||||||||||
NMFT 2002-2 | |||||||||||||||||||||||||||
Interest-only | 2,713 | — | 2,713 | ||||||||||||||||||||||||
Prepayment penalty | 151 | 251 | 402 | ||||||||||||||||||||||||
Subordinated securities | 2,184 | 1,391 | 3,575 | ||||||||||||||||||||||||
| 5,048 | 1,642 | 6,690 | 25 | 40 | 1.4 | 25 | 27 | 1.6 | |||||||||||||||||||
Net Unrealized Gain (Loss) Estimated Fair Value of Mortgage Securities Discount Rate Constant Prepayment Rate Expected Credit Losses (A) Discount Rate Constant Prepayment Rate Expected Credit Losses (A) NMFT 2002-3 Interest-only Prepayment penalty Subordinated securities NMFT 2003-1 Interest-only Prepayment penalty Subordinated securities NMFT 2003-2 Interest-only Prepayment penalty Subordinated securities NMFT 2003-3 Interest-only Prepayment penalty Subordinated securities NMFT 2003-4 Interest-only Prepayment penalty Subordinated securities NMFT 2004-1 Interest-only Prepayment penalty Subordinated securities NMFT 2004-2 Interest-only Prepayment penalty Subordinated securities Cost Current Assumptions Assumptions at Trust Securitization 8,148 — 8,148 509 686 1,195 2,387 3,131 5,518 11,044 3,817 14,861 20 41 0.7 20 30 1.0 17,963 363 18,326 2,316 956 3,272 11,783 3,912 15,695 32,062 5,231 37,293 20 39 1.8 20 28 3.3 15,404 2,422 17,826 4,089 2,133 6,222 2,487 3,368 5,855 21,980 7,923 29,903 28 38 1.5 28 25 2.7 20,825 3,449 24,274 5,108 3,427 8,535 6,842 2,363 9,205 32,775 9,239 42,014 20 37 1.6 20 22 3.6 21,466 5,480 26,946 4,994 5,408 10,402 — 6,839 6,839 26,460 17,727 44,187 20 44 1.7 20 30 5.1 35,731 — 35,731 6,816 5,968 12,784 — 1,335 1,335 42,547 7,303 49,850 20 43 3.5 20 33 5.9 31,062 — 31,062 5,313 4,814 10,127 3,481 881 4,362 39,856 5,695 45,551 26 41 3.8 26 31 5.1
Net Unrealized Gain (Loss) Estimated Fair Value of Mortgage Securities Discount Rate Constant Prepayment Rate Expected Credit Losses (A) Discount Rate Constant Prepayment Rate Expected Credit Losses (A) NMFT 2004-3 (B) NMFT 2004-4 (B) Total Cost Current Assumptions Assumptions at Trust Securitization 89,442 — 89,442 19 39 3.9 19 34 4.5 96,072 — 96,072 25 36 3.7 25 35 4.0 $ 409,946 $ 79,229 $ 489,175
| (A) | Represents expected credit losses for the life of the securitization up to the expected date in which the related asset-backed bonds can be called. |
| (B) | The interest-only, prepayment penalty and subordinated securities are packaged in one bond for the Series NMFT 2004-3 and 2004-4. |
Net Unrealized Gain (Loss) Estimated Fair Value of Mortgage Securities Discount Rate Constant Prepayment Rate Expected Credit Losses (A) Discount Rate Constant Prepayment Rate Expected Credit Losses (A) December 31, 2003: NMFT 1999-1 Subordinated securities NMFT 2000-1 Interest-only Prepayment penalty Subordinated securities NMFT 2000-2 Interest-only Prepayment penalty Subordinated securities NMFT 2001-1 Interest-only Prepayment penalty Subordinated securities NMFT 2001-2 Interest-only Prepayment penalty Subordinated securities NMFT 2002-1 Interest-only Prepayment penalty Subordinated securities NMFT 2002-2 Interest-only Prepayment penalty Subordinated securities Cost Current Assumptions Assumptions at Trust Securitization $ 6,119 $ (101 ) $ 6,018 17 % 39 % 5.2 % 17 % 30 % 2.5 % — 1,942 1,942 — 244 244 299 708 1,007 299 2,894 3,193 15 57 1.3 15 27 1.0 — 3,074 3,074 — 274 274 754 1,993 2,747 754 5,341 6,095 15 63 1.0 15 28 1.0 — 6,386 6,386 — 518 518 — 1,629 1,629 — 8,533 8,533 20 53 1.1 20 28 1.2 — 16,343 16,343 — 1,469 1,469 185 3,164 3,349 185 20,976 21,161 25 41 0.9 25 28 1.2 8,437 5,285 13,722 550 937 1,487 1,183 3,444 4,627 10,170 9,666 19,836 20 45 1.3 20 32 1.7 7,093 1,489 8,582 582 678 1,260 1,750 1,315 3,065 9,425 3,482 12,907 25 44 1.8 25 27 1.6
Net Unrealized Gain (Loss) Estimated Fair Value of Mortgage Securities Discount Rate Constant Prepayment Expected Credit Losses (A) Discount Rate Constant Prepayment Rate Expected Credit Losses (A) NMFT 2002-3 Interest-only Prepayment penalty Subordinated securities NMFT 2003-1 Interest-only Prepayment penalty Subordinated securities NMFT 2003-2 Interest-only Prepayment penalty Subordinated securities NMFT 2003-3 Interest-only Prepayment penalty Subordinated securities NMFT 2003-4 Interest-only Prepayment penalty Subordinated securities Total Cost Current Assumptions Assumptions at Trust Securitization
Rate 20,801 5,362 26,163 1,348 1,662 3,010 2,225 1,847 4,072 24,374 8,871 33,245 20 39 0.9 20 30 1.0 47,352 2,280 49,632 3,949 1,814 5,763 6,698 2,877 9,575 57,999 6,971 64,970 20 28 2.8 20 28 3.3 58,709 4,863 63,572 3,042 2,513 5,555 25 265 290 61,776 7,641 69,417 28 30 2.6 28 25 2.7 72,637 3,128 75,765 3,098 1,830 4,928 1,628 3,535 5,163 77,363 8,493 85,856 20 26 3.4 20 22 3.6 41,668 4,107 45,775 4,430 61 4,491 — 790 790 46,098 4,958 51,056 20 33 5.3 20 30 5.1 $ 294,562 $ 87,725 $ 382,287
| (A) | Represents expected credit losses for the life of the securitization up to the expected date in which the related asset-backed bonds can be called. |
The following table summarizes the cost basis, unrealized gain (loss) and fair value of our mortgage securities—available-for-sale with the mortgage securities—available-for-sale grouped by year of issue. For example, under the “Year of Issue for Mortgage Securities Retained” column, the year 2003 is a combination of NMFT Series 2003-1, NMFT Series 2003-2, NMFT Series 2003-3 and NMFT Series 2003-4.
Table 4 — Summary of Mortgage Securities – Available-for-Sale Retained by Year of Issue
(in thousands)
| 2004 | ||||||||||||||||||||||||||||||||||||
Year of Mortgage | As of December 31 | As of September 30 | As of June 30 | As of March 31 | ||||||||||||||||||||||||||||||||
| Cost | Unrealized Gain (Loss) | Fair Value | Cost | Unrealized (Loss) | Fair Value | Cost | Unrealized Gain (Loss) | Fair Value | Cost | Unrealized Gain (Loss) | Fair Value | |||||||||||||||||||||||||
1999 | $ | 7,001 | $ | — | $ | 7,001 | $ | 6,818 | $ | — | $ | 6,818 | $ | 6,597 | $ | — | $ | 6,597 | $ | 6,353 | $ | 185 | $ | 6,538 | ||||||||||||
2000 | 681 | 2,828 | 3,509 | 539 | 3,046 | 3,585 | 412 | 5,161 | 5,573 | 1,298 | 8,194 | 9,492 | ||||||||||||||||||||||||
2001 | — | 11,712 | 11,712 | — | 16,064 | 16,064 | 321 | 20,910 | 21,231 | 233 | 27,579 | 27,812 | ||||||||||||||||||||||||
2002 | 21,070 | 11,571 | 32,641 | 23,978 | 14,181 | 38,159 | 29,202 | 14,067 | 43,269 | 36,201 | 18,899 | 55,100 | ||||||||||||||||||||||||
2003 | 113,277 | 40,120 | 153,397 | 142,796 | 28,458 | 171,254 | 184,097 | 8,841 | 192,938 | 226,676 | 16,090 | 242,766 | ||||||||||||||||||||||||
2004 | 267,917 | 12,998 | 280,915 | 218,898 | 7,709 | 226,607 | 118,684 | 758 | 119,442 | 60,961 | 1,334 | 62,295 | ||||||||||||||||||||||||
Total | $ | 409,946 | $ | 79,229 | $ | 489,175 | $ | 393,029 | $ | 69,458 | $ | 462,487 | $ | 339,313 | $ | 49,737 | $ | 389,050 | $ | 331,722 | $ | 72,281 | $ | 404,003 | ||||||||||||
| 2003 | ||||||||||||||||||||||||||||||||||||||||
Year Mortgage | As of December 31 | As of September 30 | As of June 30 | As of March 31 | ||||||||||||||||||||||||||||||||||||
| Cost | Unrealized Gain (Loss) | Fair Value | Cost | Unrealized Gain (Loss) | Fair Value | Cost | Unrealized Gain (Loss) | Fair Value | Cost | Unrealized Gain (Loss) | Fair Value | |||||||||||||||||||||||||||||
1999 | $ | 6,119 | $ | (101 | ) | $ | 6,018 | $ | 6,014 | $ | (423 | ) | $ | 5,591 | $ | 5,938 | $ | (363 | ) | $ | 5,575 | $ | 5,864 | $ | (655 | ) | $ | 5,209 | ||||||||||||
2000 | 1,053 | 8,235 | 9,288 | 1,040 | 10,154 | 11,194 | 1,289 | 11,929 | 13,218 | 2,327 | 12,352 | 14,679 | ||||||||||||||||||||||||||||
2001 | 185 | 29,509 | 29,694 | 1,419 | 35,459 | 36,878 | 5,426 | 41,359 | 46,785 | 10,310 | 43,527 | 53,837 | ||||||||||||||||||||||||||||
2002 | 43,969 | 22,019 | 65,988 | 50,848 | 25,869 | 76,717 | 58,883 | 27,345 | 86,228 | 66,928 | 26,775 | 93,703 | ||||||||||||||||||||||||||||
2003 | 243,236 | 28,063 | 271,299 | 189,710 | 17,542 | 207,252 | 132,959 | 16,167 | 149,126 | 67,134 | 7,515 | 74,649 | ||||||||||||||||||||||||||||
Total | $ | 294,562 | $ | 87,725 | $ | 382,287 | $ | 249,031 | $ | 88,601 | $ | 337,632 | $ | 204,495 | $ | 96,437 | $ | 300,932 | $ | 152,563 | $ | 89,514 | $ | 242,077 | ||||||||||||||||
Mortgage Securities – Trading. Mortgage securities – trading consist of mortgage securities purchased by us that we intend to sell in the near term. These securities are recorded at fair value with gains and losses, realized and unrealized, included in earnings. As of December 31, 2004, mortgage securities—trading consisted of an adjustable-rate mortgage-backed security with a fair market value of $143.2 million. For the year ended December 31, 2004, we recorded no gains or losses related to the security. As of December 31, 2004, we had pledged the security as collateral for financing purposes.
Mortgage Servicing Rights. As discussed under Mortgage Securities – Available for Sale, we retain the right to service mortgage loans we originate, purchase and have securitized. Servicing rights for loans we sell to third parties are not retained and we have not purchased the right to service loans. As of December 31, 2004, we have $42.0 million in capitalized mortgage servicing rights compared with $19.7 million as of December 31, 2003. The increase in our mortgage servicing rights is attributable to the increase in the size of our securitizations during 2004 as compared to 2003. The value of the mortgage servicing rights we retained in our securitizations during 2004 and 2003 was $39.3 million and $20.8 million, respectively. Amortization of mortgage servicing rights was $16.9 million, $9.0 million and $4.6 million for the years ended December 31, 2004, 2003 and 2002, respectively.
Servicing Related Advances.Advances on behalf of borrowers for taxes, insurance and other customer service functions are made by NovaStar Mortgage and aggregated $20.2 million as of December 31, 2004 compared with $19.3 million as of December 31, 2003.
Derivative Instruments, net.Derivative instruments, net decreased from $19.5 million at December 31, 2003 to $18.8 million at December 31, 2004. Derivative instruments include the collateral (margin deposits) required under the terms of our derivative instrument contracts, net of the derivative instrument market values. Due to the nature of derivative instruments we use, the margin deposits required will generally increase as interest rates decline and decrease as interest rates rise. On the other hand, the market value of our derivative instruments will decline as interest rates decline and increase as interest rates rise.
Other Assets. Included in other assets are receivables from securitizations, warehouse loans receivable, tax assets and other miscellaneous assets. Our receivables from securitizations were $4.8 million and $6.2 million at December 31, 2004 and December 31, 2003, respectively. These receivables represent cash due to us on our mortgage securities - available-for-sale. As of December 31, 2004 we had warehouse loans receivable of $5.9 million. In 2004, we began lending to independent mortgage loan brokers in an effort to strengthen our relationships with these brokers and, in turn, increase our nonconforming loan production. As of December 31, 2004, we had a deferred tax asset of $11.2 million compared to $10.5 million as of December 31, 2003. As of December 31, 2004, we had a current tax receivable of $17.2 million. We had a current tax liability as of December 31, 2003 as discussed under the heading “Accounts Payable and Other Liabilities”. The change from a current tax liability to a current tax receivable was primarily the result of an overpayment of estimated 2004 income taxes.
Short-term Borrowings. Mortgage loan originations and purchases are funded with various financing facilities prior to securitization. Repurchase agreements are used as interim, short-term financing before loans are transferred in our securitization transactions. The balances outstanding under our short-term arrangements fluctuate based on lending volume, cash flows from operating, investing and other financing activities and equity transactions. As shown in Table 5, we have $268.6 million in immediately available funds as of December 31, 2004. We have borrowed approximately $765.6 million of the $3.7 billion in committed mortgage securities repurchase facilities, leaving approximately $2.9 billion available to support the mortgage lending and mortgage portfolio operations. See the “Liquidity and Capital Resources” section of “Management’s Discussion and Analysis of Financial Condition and Results of Operations” for a further discussion of liquidity risks and resources available to us.
Table 5 — Short-term Financing Resources
(in thousands)
Credit Limit | Lending Value of Collateral | Borrowings | Availability | |||||||||
Unrestricted cash | $ | 268,563 | ||||||||||
Mortgage securities and mortgage loans repurchase facilities | $ | 3,650,000 | $ | 765,645 | $ | 765,645 | — | |||||
Other | 235,912 | 139,883 | 139,883 | — | ||||||||
Total. | $ | 3,885,912 | $ | 905,528 | $ | 905,528 | $ | 268,563 | ||||
Asset-backed Bonds. During 1997 and 1998, we completed the securitization of loans in transactions that were structured as financing arrangements for accounting purposes. These non-recourse financing arrangements match the loans with the financing arrangement for long periods of time, as compared to repurchase agreements that mature frequently with interest rates that reset frequently and have liquidity risk in the form of margin calls. Under the terms of our asset-backed bonds we are entitled to repurchase the mortgage loan collateral and repay the remaining bond obligations when the aggregate collateral principal balance falls below 35% of their original balance for the loans in NHES 97-01 and 25% for the loans in NHES 97-02, 98-01 and 98-02. We have not exercised our right to repurchase any loans and repay bond obligations.
During 2004, we issued three asset-backed bonds, NIMs, totaling $515.1 million compared to one issue in 2003 for $54 million. These NIMs are secured by the interest-only, prepayment penalty and subordinated mortgage securities of our mortgage securities – available-for-sale as a means for long-term financing. The resecuritizations were structured as secured borrowings for financial reporting and income tax purposes. In accordance with SFAS No. 140, control over the transferred assets was not surrendered and thus the transaction was considered a financing for the mortgage securities - available-for-sale. Therefore, the mortgage securities are recorded as assets and the asset-backed bonds are recorded as debt. Note 7 to the consolidated financial statements provides additional detail regarding these transactions.
Due to trusts.Due to trusts represents the fair value of the loans we have the right to repurchase from the securitization trusts. The servicing agreements we execute for loans we have securitized include a removal of accounts provision which gives us the right, not the obligation, to repurchase mortgage loans from the trust. The removal of accounts provision can be exercised for loans that are 90 days to 119 days delinquent. As of December 31, 2004 and December 31, 2003, our liability related to this provision was $20.9 million and $14.5 million, respectively.
Accounts Payable and Other Liabilities. Included in accounts payable and other liabilities is accrued payroll and other liabilities. Our accrued payroll increased from $18.1 million at December 31, 2003 to $24.9 million at December 31, 2004. The increase in accrued payroll is due to our change from paying employees twice a month to every two weeks. Our current income tax liability was $7.9 million as of December 31, 2003.
Stockholders’ Equity.The increase in our stockholders’ equity as of December 31, 2004 compared to December 31, 2003 is a result of the following increases and decreases.
Stockholders’ equity increased by:
Stockholders’ equity decreased by:
The Board of Directors declared a two-for-one split of its common stock, providing shareholders of record as of November 17, 2003, with one additional share of common stock for each share owned. The additional shares resulting from the split were issued on December 1, 2003 increasing the number of common shares outstanding to 24.1 million shares.
Results of Operations
Continuing Operations.During the year ended December 31, 2004, we earned income from continuing operations available to common shareholders of $113.2 million, or $4.40 per diluted share, compared with income from continuing operations available to common shareholders of $112.0 million, or $4.91 per diluted share and of $48.8 million, or $2.25 per diluted share, for the same periods of 2003 and 2002, respectively.
Our primary sources of revenue are interest earned on our mortgage loan and securities portfolios, fee income and gains on sales and securitizations of mortgage loans. As discussed under “Overview of Performance,” income from continuing operations available to common shareholders increased during 2004 as compared to 2003 due primarily to higher volumes of average mortgage securities - available-for-sale held and mortgage loan originations and purchases securitized. The effects of the higher mortgage security volume are displayed in Table 6. Details regarding higher mortgage loan origination and purchase volumes and gains on securitization of these assets are shown in Tables 1, 8 and 9.
Discontinued Operations.As the demand for conforming loans declined significantly during 2004, many branches have not been able to produce sufficient fees to meet operating expense demands. As a result of these conditions, a significant number of branch managers voluntarily terminated employment with us. We also terminated branches when loan production results were substandard. In these terminations, the branch and all operations are eliminated. The operating results for these discontinued operations have been segregated from our on-going operating results. Our loss from discontinued operations net of income tax for the year ended December 31, 2004 was $4.1 million. Note 14 to our consolidated financial statements provides detail regarding the impact of the discontinued operations.
Net Interest Income.Our mortgage securities available-for-sale primarily represent our ownership in the net cash flows of the underlying mortgage loan collateral in excess of bond expenses and cost of funding. The cost of funding is indexed to one-month LIBOR and resets monthly while the coupon on the mortgage loan collateral adjusts more slowly depending on the contractual terms of the loan. In 2002, we began transferring interest rate agreements at the time of securitization into the securitization trusts to help reduce this interest rate risk and to decrease the volatility of future cash flows related to the securitized mortgage loans. As a result, future interest income on our mortgage securities is expected to be less volatile. The spreads on our newer mortgage securities - available-for-sale have returned to expected or normal levels as a result of this interest rate risk management strategy and also as a result of the coupon on the mortgage loans adjusting downward. The significant increase in one-month LIBOR in 2004 has also contributed to the decline in our overall securities yield from 2003.
While the spreads on our securities have decreased, the overall interest income continues to be high due to the sizeable increase in our mortgage securities - available-for-sale retained. Based on these factors, as shown in Table 6, we experienced a decrease in the average net yield on our securities from 31.3% for the year ended December 31, 2003 to 27.2% for the same period of 2004. Mortgage security net yield for the year ended December 31, 2002 was 40.6%.
The overall dollar volume of interest income has increased primarily because the size of our mortgage securities - available-for-sale portfolio has increased significantly during the past year. As shown in Tables 6 and 7, the average value of our mortgage securities - available-for-sale increased from $288.4 million and $132.3 million during the years ended December 31, 2003 and 2002, respectively, to $425.4 million during the year ended December 31, 2004. The average balance of mortgage loans collateralizing our securities increased from $4.3 billion in 2003 to $8.4 billion in 2004. We expect to increase the amount of mortgage securities - available-for-sale we own as we securitize the mortgage loans we originate and purchase.
As previously discussed, the trust that issues our interest-only securities owns interest rate agreements. These agreements reduce interest rate risk within the trust and, as a result, the cash flows we receive on our interest-only securities are less volatile as interest rates change. Table 6 is a summary of the interest income and expense related to our mortgage securities and the related yields as a percentage of the fair market value of these securities for the three years ended December 31, 2004.
Table 6 - Mortgage Securities Interest Analysis
(dollars in thousands)
| December 31, | ||||||||||||
| 2004 | 2003 | 2002 | ||||||||||
Average fair market value of mortgage securities – available-for-sale | $ | 425,400 | $ | 288,361 | $ | 132,250 | ||||||
Average borrowings | 337,282 | 222,653 | 89,612 | |||||||||
Interest income | 133,633 | 98,804 | 56,481 | |||||||||
Interest expense | 18,091 | 8,676 | 2,834 | |||||||||
Net interest income | $ | 115,542 | $ | 90,128 | $ | 53,647 | ||||||
Yields: | ||||||||||||
Interest income | 31.4 | % | 34.3 | % | 42.7 | % | ||||||
Interest expense | 5.4 | 3.9 | 3.2 | |||||||||
Net interest spread | 26.0 | % | 30.4 | % | 39.5 | % | ||||||
Net Yield | 27.2 | % | 31.3 | % | 40.6 | % | ||||||
Net interest income on mortgage loans represents income on loans held-for-sale during their warehouse period as well as loans held-in-portfolio, which are maintained on our balance sheet as a result of the four securitization transactions we executed in 1997 and 1998. Net interest income on mortgage loans before other expense increased from $39.9 million and $25.8 million for the years ended December 31, 2003 and 2002, respectively to $55.9 million for the same period of 2004. The net interest income from mortgage loans is primarily driven by loan volume and the amount of time held-for-sale loans are in the warehouse.
Future net interest income will be dependent upon the size and volume of our mortgage securities - available-for-sale and loan portfolios and economic conditions.
Our portfolio income comes from mortgage loans either directly (mortgage loans held-in-portfolio) or indirectly (mortgage securities). Table 7 attempts to look through the balance sheet presentation of our portfolio income and present income as a percentage of average assets under management. The net interest income for mortgage securities, mortgage loans held-for-sale and mortgage loans held-in-portfolio reflects the income after interest expense, hedging, prepayment penalty income and credit expense (mortgage insurance and credit (losses) recoveries). This metric allows us to be more easily compared to other finance companies or financial institutions that use on balance sheet portfolio accounting, where return on assets is a common performance calculation. Over time, we believe a sustainable return on these assets should be in the range of 1% to 1.25%.
Our portfolio net interest yield on assets was 1.53% for the year ended December 31, 2004 as compared to 2.25% and 2.49%, respectively, for the same period of 2003 and 2002. As previously discussed, the decrease in our net interest yield on assets primarily resulted from the decrease in the spreads on our mortgage securities. Table 7 shows the net yield in both assets under management and the return on assets during the three years ended December 31, 2004.
Table 7 — Mortgage Portfolio Management Net Interest Income Analysis
(dollars in thousands)
Mortgage Securities | Mortgage Loans Held-for- Sale | Mortgage Loans Held-in- Portfolio | Total | |||||||||||||
For the Year Ended: | ||||||||||||||||
December 31, 2004 | ||||||||||||||||
Interest income | $ | 133,633 | $ | 83,718 | $ | 6,673 | $ | 224,024 | ||||||||
Interest expense: | ||||||||||||||||
Short-term borrowings (A) | 4,836 | 30,005 | — | 34,841 | ||||||||||||
Asset-backed bonds | 13,255 | — | 1,422 | 14,677 | ||||||||||||
Cash flow hedging net settlements | — | 1,514 | 1,558 | 3,072 | ||||||||||||
Total interest expense | 18,091 | 31,519 | 2,980 | 52,590 | ||||||||||||
Mortgage portfolio net interest income before other expense | 115,542 | 52,199 | 3,693 | 171,434 | ||||||||||||
Other expense (B) | 368 | (23,123 | ) | (1,254 | ) | (24,009 | ) | |||||||||
Mortgage portfolio net interest income | $ | 115,910 | $ | 29,076 | $ | 2,439 | $ | 147,425 | ||||||||
Average balance of the underlying loans | $ | 8,431,708 | $ | 1,113,736 | $ | 71,784 | $ | 9,617,228 | ||||||||
Net interest yield on assets | 1.37 | % | 2.61 | % | 3.40 | % | 1.53 | % | ||||||||
December 31, 2003 | ||||||||||||||||
Interest income | $ | 98,804 | $ | 60,878 | $ | 10,738 | $ | 170,420 | ||||||||
Interest expense: | ||||||||||||||||
Short-term borrowings (A) | 3,450 | 20,060 | — | 23,510 | ||||||||||||
Asset-backed bonds | 5,226 | — | 2,269 | 7,495 | ||||||||||||
Cash flow hedging net settlements | — | 2,871 | 6,488 | 9,359 | ||||||||||||
Total interest expense | 8,676 | 22,931 | 8,757 | 40,364 | ||||||||||||
Mortgage portfolio net interest income before other expense | 90,128 | 37,947 | 1,981 | 130,056 | ||||||||||||
Other expense (B) | — | (11,507 | ) | (895 | ) | (12,402 | ) | |||||||||
Mortgage portfolio net interest income | $ | 90,128 | $ | 26,440 | $ | 1,086 | $ | 117,654 | ||||||||
Average balance of the underlying loans | $ | 4,316,599 | $ | 792,991 | $ | 116,048 | $ | 5,225,638 | ||||||||
Net interest yield on assets | 2.09 | % | 3.33 | % | 0.94 | % | 2.25 | % | ||||||||
December 31, 2002 | ||||||||||||||||
Interest income | $ | 56,481 | $ | 33,736 | $ | 16,926 | $ | 107,143 | ||||||||
Interest expense: | ||||||||||||||||
Short-term borrowings (A) | 2,107 | 10,406 | — | 12,513 | ||||||||||||
Asset-backed bonds | 727 | — | 4,195 | 4,922 | ||||||||||||
Cash flow hedging net settlements | — | 1,672 | 8,621 | 10,293 | ||||||||||||
Total interest expense | 2,834 | 12,078 | 12,816 | 27,728 | ||||||||||||
Mortgage portfolio net interest income before other expense | 53,647 | 21,658 | 4,110 | 79,415 | ||||||||||||
Other expense (B) | — | (11,782 | ) | (1,624 | ) | (13,406 | ) | |||||||||
Mortgage portfolio net interest income | $ | 53,647 | $ | 9,876 | $ | 2,486 | $ | 66,009 | ||||||||
Average balance of the underlying loans | $ | 2,080,955 | $ | 395,394 | $ | 172,954 | $ | 2,649,303 | ||||||||
Net interest yield on assets | 2.58 | % | 2.50 | % | 1.44 | % | 2.49 | % | ||||||||
| (A) | Primarily includes mortgage loan and securities repurchase agreements. |
| (B) | Other expense includes prepayment penalty income, net settlements on non-cash flow hedges and credit expense (mortgage insurance and credit (losses) recoveries). |
Impact of Interest Rate Agreements.We have executed interest rate agreements designed to mitigate exposure to interest rate risk on short-term borrowings. Interest rate cap agreements require us to pay either a one-time “up front” premium or a monthly or quarterly premium, while allowing us to receive a rate that adjusts with LIBOR when rates rise above a certain agreed-upon rate. Interest rate swap agreements allow us to pay a fixed rate of interest while receiving a rate that adjusts with one-month LIBOR. These agreements are used to alter, in effect, the interest rates on funding costs to more closely match the yield on interest-earning assets. We incurred expenses of $22.1 million, $18.7 million and $21.5 million related to the net settlements of our interest rate agreements for the three years ended December 31, 2004, 2003 and 2002, respectively. Fluctuations in these expenses are solely dependent upon the movement in LIBOR as well as our average notional amount outstanding.
Credit (Losses) Recoveries.We originate, purchase and own loans in which the borrower possesses credit risk higher than that of conforming borrowers. Delinquent loans and losses are expected to occur. We maintain an allowance for credit losses for our mortgage loans – held-in-portfolio. Provisions for credit losses are made in amounts considered necessary to maintain an allowance at a level sufficient to cover probable losses inherent in the loan portfolio. Charge-offs are recognized at the time of foreclosure by recording the value of real estate owned property at its estimated realizable value. One of the principal methods used to estimate expected losses is a delinquency migration analysis. This analysis takes into consideration historical information regarding foreclosure and loss severity experience and applies that information to the portfolio at the reporting date.
We use several techniques to mitigate credit losses including pre-funding audits by quality control personnel and in-depth appraisal reviews. Another loss mitigation technique allows a borrower to sell their property for less than the outstanding loan balance prior to foreclosure in transactions known as short sales, when it is believed that the resulting loss is less than what would be realized through foreclosure. Loans are charged-off in full when the cost of pursuing foreclosure and liquidation exceed recorded balances. While short sales have served to reduce the overall severity of losses incurred, they also accelerate the timing of losses. As discussed further under the caption “Premiums for Mortgage Loan Insurance”, lender paid mortgage insurance is also used as a means of managing credit risk exposure. Generally, the exposure to credit loss on insured loans is considered minimal.
During the year ended December 31, 2004 we recognized net credit losses of $0.7 million compared with net credit recoveries of $0.4 million and $0.4 million for the years ended December 31, 2003 and 2002, respectively. We incurred net charge-offs of $1.5 million, $1.3 million and $2.1 million for the years ended December 31, 2004, 2003 and 2002, respectively. A rollforward of the allowance for credit losses for the three years ended December 31, 2004 is presented in Note 2 to the consolidated financial statements.
Fee Income.Fee income in 2004 primarily consists of broker fees and service fee income. During 2003 and 2002, NHMI branch management fees were also a component of fee income. Due to the elimination of the LLC’s and their subsequent inclusion in the consolidated financial statements, branch management fees are eliminated in consolidation in 2004.
Broker fees are paid by borrowers and other lenders for placing loans with third-party investors (lenders) and are based on negotiated rates with each lender to whom we broker loans. Revenue is recognized upon loan origination.
Service fees are paid to us by either the investor on mortgage loans serviced or the borrower. Fees paid by investors on loans serviced are determined as a percentage of the principal collected for the loans serviced and are recognized in the period in which payments on the loans are received. Fees paid by borrowers on loans serviced are considered ancillary fees related to loan servicing and include late fees, processing fees and, for loans held-in-portfolio, prepayment penalties. Revenue is recognized on fees received from borrowers when an event occurs that generates the fee and they are considered to be collectible.
NHMI branch management fees, a source of fee income in 2003 and 2002, were charged to LLC’s formed to support NHMI branches to manage branch administrative operations, which included providing accounting, payroll, human resources, loan investor management and license management services. The amount of the fees was agreed upon when entering the LLC agreements and recognized as services were rendered. NHMI branch management fees were $13.0 million and $5.2 million for the years ended December 31, 2003 and 2002, respectively.
Overall, fee income increased from $68.3 million and $36.0 million for the years ended December 31, 2003 and 2002, respectively, to $102.8 million for the same period of 2004 due primarily to the termination of the LLC’s and the inclusion of those branches in our consolidated financial statements. This had a significant impact on fee income due to the volume of broker fee income that these branches generate. For comparative purposes, if the LLC’s had been operating units during 2003 and 2002 fee income would have been $91.8 million and $41.5 million for the years ended December 31, 2003 and 2002, respectively.
Additionally, fee income increased due to the increase in our servicing portfolio from $7.2 billion and $3.7 billion as of December 31, 2003 and 2002, respectively, to $12.2 billion as of December 31, 2004.
Gains on Sales of Mortgage Assets and Losses on Derivative Instruments. We execute securitization transactions in which we transfer mortgage loan collateral to an independent trust. The trust holds the mortgage loans as collateral for the securities it issues to finance the sale of the mortgage loans. In those transactions, certain securities are issued to entities unrelated to us, and we retain the interest-only, prepayment penalty and non-investment grade subordinated securities. In addition, we continue to service the loan collateral. These transactions were structured as sales for accounting and income tax reporting during the three years ended December 31, 2004. Whole loan sales have also been executed whereby we sell loans to third parties. In the outright sales of mortgage loans, we retain no assets or servicing rights. Table 9 provides a summary of mortgage loans sold outright and transferred in securitizations.
We have entered into derivative instrument contracts that do not meet the requirements for hedge accounting treatment, but contribute to our overall risk management strategy by serving to reduce interest rate risk related to short-term borrowing rates. Changes in the fair value of these derivative instruments are credited or charged to current earnings. We recognized losses of $8.9 million during the year ended December 31, 2004, compared with $30.8 million and $36.8 million for the same period of 2003 and 2002, respectively.
Table 8 provides the components of our gains on sales of mortgage assets and losses on derivative instruments.
Table 8 — Gains on Sales of Mortgage Assets and Losses on Derivative Instruments
(in thousands)
| For the Year Ended December 31, | ||||||||||||
| 2004 | 2003 | 2002 | ||||||||||
Gains on sales of mortgage loans transferred in securitizations | $ | 144,252 | $ | 136,302 | $ | 47,894 | ||||||
Gains on sales of mortgage loans to third parties – nonconforming | — | 3,404 | 2,299 | |||||||||
Gains on sales of mortgage loans to third parties – conforming | 1,435 | 6,942 | 3,903 | |||||||||
Losses on sales of real estate owned | (737 | ) | (2,643 | ) | (791 | ) | ||||||
Gains on sales of mortgage assets | 144,950 | 144,005 | 53,305 | |||||||||
Losses on derivatives | (8,905 | ) | (30,837 | ) | (36,841 | ) | ||||||
Net gains on sales of mortgage assets and derivative instruments | $ | 136,045 | $ | 113,168 | $ | 16,464 | ||||||
Table 9 — Mortgage Loan Sales and Securitizations
(dollars in thousands)
| Outright Mortgage Loan Sales (A) | |||||||||||
For the Year Ended December 31, | Principal Amount | Percent of Total Sales | Net Gain (Loss) Recognized | Weighted Average Price To Par | |||||||
2004 | There were no outright mortgage loan sales in 2004. | ||||||||||
2003 | $ | 151,210 | 2.8 | % | $ | 3,404 | 104.1 | ||||
2002 | $ | 142,159 | 8.4 | % | $ | 2,299 | 102.9 | ||||
Mortgage Loans Transferred in Securitizations | |||||||||||||||||||||
Principal Amount | Percent of Total Sales | Net Gain Recognized | Initial Cost Basis of Mortgage Securities | Weighted Average Assumptions Underlying Initial Value of Mortgage Securities – Available-for-Sale | |||||||||||||||||
For the Year Ended December 31, | Constant Prepayment Rate | Discount Rate | Expected Total Credit Losses, Net of Mortgage Insurance | ||||||||||||||||||
2004 | $ | 8,329,804 | 100.0 | % | $ | 144,252 | $ | 381,833 | 33 | % | 22 | % | 4.77 | % | |||||||
2003 | $ | 5,319,435 | 97.2 | % | $ | 136,302 | $ | 292,675 | 26 | % | 22 | % | 3.55 | % | |||||||
2002 | $ | 1,560,001 | 91.6 | % | $ | 47,894 | $ | 90,785 | 29 | % | 21 | % | 1.50 | % | |||||||
| (A) | Does not include conforming loan sales. |
Premiums for Mortgage Loan Insurance. The use of mortgage insurance is one method of managing the credit risk in the mortgage asset portfolio. Premiums for mortgage insurance on loans maintained on our balance sheet are paid by us and are recorded as a portfolio cost and included in the income statement under the caption “Premiums for Mortgage Loan Insurance”. These premiums totaled $4.2 million, $3.1 million and $2.3 million in 2004, 2003 and 2002, respectively. We received mortgage insurance proceeds on claims filed of $2.2 million, $1.9 million and $2.1 million in 2004, 2003 and 2002, respectively.
Some of the mortgage loans that serve as collateral for our mortgage securities - available-for-sale carry mortgage insurance. When loans are securitized in transactions treated as sales, the obligation to pay mortgage insurance premiums is legally assumed by the trust. Therefore, we have no obligation to pay for mortgage insurance premiums on these loans.
We intend to continue to use mortgage insurance coverage as a credit management tool as we continue to originate, purchase and securitize mortgage loans. Mortgage insurance claims on loans where a defect occurred in the loan origination process will not be paid by the mortgage insurer. The assumptions we use to value our mortgage securities - available-for-sale consider this risk. The percentage of loans with mortgage insurance has decreased in 2004 and 2003 and generally should be lower than 50% in the future. For the 2004-1, 2004-2, 2004-3 and 2004-4 securitizations, the mortgage loans that were transferred into the trusts had mortgage insurance coverage at the time of transfer of 26%, 38%, 35% and 51%, respectively. As of December 31, 2004, 45% of our securitized loans had mortgage insurance coverage.
We have the risk that mortgage insurance providers will revise their guidelines to an extent where we will no longer be able to acquire coverage on all of our new production. Similarly, the providers may also increase insurance premiums to a point where the cost of coverage outweighs its benefit. We monitor the mortgage insurance market and currently anticipate being able to obtain affordable coverage to the extent we deem it is warranted.
Other Income, net.Other income, net increased from $0.4 million and $1.4 million for the years ended December 31, 2003 and 2002, respectively, to $6.6 million for the same period of 2004. Included in other income, net is primarily interest income on our cash accounts and deposits with derivative instrument counterparties (swap margin). The increase from prior years to 2004 is primarily attributable to the increase in our cash on hand and the increase in the interest rates we are earning on this cash.
General and Administrative Expenses.The main categories of our general and administrative expenses are compensation and benefits, loan expense, marketing, office administration and professional and outside services. Compensation and benefits includes employee base salaries, benefit costs and incentive compensation awards. For discussion on stock-based compensation expense included in compensation and benefits, see discussion of the adoption of SFAS No. 123 under “Critical Accounting Estimates” and “Results of Operations.” Loan expense primarily includes expenses relating to the underwriting of mortgage loans that do not fund successfully and servicing costs. Marketing primarily includes costs of purchased loan leads, advertising and business promotion. Office administration includes items such as rent, depreciation, telephone, office supplies, postage, delivery, maintenance and repairs. Professional and outside services include fees for legal, accounting and other consulting services.
The increase in general and administrative expenses from $174.4 million and $84.6 million in 2003 and 2002, respectively, to $271.1 million in 2004 is primarily attributable to the termination of the LLC’s and the inclusion of those branches in our consolidated financial statements. Our new retail lines of business, growth in our wholesale business and our expanding servicing operations also contributed to the increase in general and administrative expenses. Nonrecurring costs related to the implementation of requirements under the Sarbanes-Oxley Act also contributed to the increase in general and administrative expenses in 2004. We employed 1,738 people as of December 31, 2004 compared with 1,409 and 913 as of December 31, 2003 and 2002, respectively, in our mortgage portfolio management and mortgage lending and loan servicing operations.
Note 15 to the consolidated financial statements presents an income statement for our three segments, detailing our expenses by segment. For comparative purposes, Table 10 presents the general and administrative expenses assuming the LLC’s had been included in our consolidated financial statements during 2003 and 2002.
Table 10 — General and Administrative Expenses
(dollars in thousands)
| For the Year Ended December 31, | |||||||||
| 2004 | 2003 Pro Forma | 2002 Pro Forma | |||||||
Compensation and benefits | $ | 138,516 | $ | 107,708 | $ | 54,509 | |||
Office administration | 38,625 | 28,278 | 12,196 | ||||||
Marketing | 37,812 | 43,911 | 16,477 | ||||||
Professional and outside services | 19,887 | 7,462 | 3,254 | ||||||
Loan expense | 18,753 | 19,707 | 6,262 | ||||||
Other | 17,532 | 11,260 | 4,092 | ||||||
Total general and administrative expenses | $ | 271,125 | $ | 218,326 | $ | 96,790 | |||
Employees Other | 3,502 | 2,661 | 1,457 | ||||||
The loan costs of production table below includes all costs paid and fees collected during the wholesale loan origination cycle, including loans that do not fund. This distinction is important as we can only capitalize as deferred broker premium and costs, those costs (net of fees) directly associated with a “funded” loan. Costs associated with loans that do not fund are recognized immediately as a component of general and administrative expenses. For loans held-for-sale, deferred net costs are recognized when the related loans are sold outright or transferred in securitizations. For loans held-in-portfolio, deferred net costs are recognized over the life of the loan as a reduction to interest income. The cost of our production is also critical to our financial results as it is a significant factor in the gains we recognize. Increased efficiencies in the nonconforming lending operation correlate to lower general and administrative costs and higher gains on sales of mortgage assets.
Table 11 — Wholesale Loan Costs of Production, as a Percent of Principal
Overhead Costs | Premium Paid to Broker, Net of Fees Collected | Total Acquisition Cost | ||||
2004 | 1.79 | 0.74 | 2.53 | |||
2003 | 1.69 | 0.71 | 2.40 | |||
2002 | 1.93 | 0.78 | 2.71 |
The following table is a reconciliation of our overhead costs to the general and administrative expenses of the mortgage lending and loan servicing segment as shown in Note 15 to the consolidated financial statements, presented in accordance with GAAP. The reconciliation does not address premiums paid to brokers since they are deferred at origination under GAAP and recognized when the related loans are sold or securitized. The presentation of overhead costs allows us to monitor the performance of our core operations, which is more difficult when looking at GAAP financial statements. This provides useful information regarding our financial performance. However, this presentation is not intended to be used as a substitute for financial results prepared in accordance with GAAP.
Table 12 – Reconciliation of Overhead Costs
(dollars in thousands, except overhead as a percentage)
| 2004 | 2003 | 2002 | ||||||||||
Mortgage lending and loan servicing general and administrative expenses (A) | $ | 149,908 | $ | 133,196 | $ | 59,306 | ||||||
Direct origination costs classified as a reduction in gain-on-sale | 44,641 | 26,351 | 13,334 | |||||||||
Costs of servicing | (22,845 | ) | (14,261 | ) | (7,703 | ) | ||||||
Other lending expenses (B) | (42,930 | ) | (65,402 | ) | (17,995 | ) | ||||||
Overhead costs | $ | 128,774 | $ | 79,884 | $ | 46,942 | ||||||
Wholesale production, principal | $ | 7,185,773 | $ | 4,735,061 | $ | 2,427,048 | ||||||
Overhead, as a percentage | 1.79 | % | 1.69 | % | 1.93 | % | ||||||
| (A) | Mortgage lending and loan servicing general and administrative expenses are presented in Note 15 to the consolidated financial statements. |
| (B) | In 2003 and 2002, other lending expenses primarily includes costs related to our retail, correspondent and conforming operations. In 2004, we did not have conforming operations. |
Income Taxes.Since our inception, NFI has elected to be treated as a REIT for income tax purposes. As a REIT, NFI is not required to pay any corporate level income taxes as long as we distribute 100 percent of our taxable income in the form of dividend distributions to our shareholders. To maintain our REIT status, NFI must meet certain requirements prescribed by the Code. We intend to operate NFI in a manner that allows us to meet these requirements.
Below is a summary of the taxable net income available to common shareholders for the years ended December 31, 2004, 2003 and 2002.
Table 13 — Taxable Net Income
(dollars in thousands)
| For the Year Ended December 31, | ||||||||||||
2004 Estimated | 2003 Actual | 2002 Actual | ||||||||||
Consolidated net income | $ | 115,389 | $ | 111,996 | $ | 48,761 | ||||||
Equity in net income of NFI Holding Corp. | (2,517 | ) | (27,737 | ) | 9,013 | |||||||
Consolidation eliminations between the REIT and TRS | 2,800 | 7,686 | — | |||||||||
REIT net income | 115,672 | 91,945 | 57,774 | |||||||||
Adjustments to net income to compute taxable income | 141,094 | 45,906 | (8,263 | ) | ||||||||
Taxable income before preferred dividends | 256,766 | 137,851 | 49,511 | |||||||||
Preferred dividends | (6,265 | ) | — | — | ||||||||
Taxable income available to common shareholders | $ | 250,501 | $ | 137,851 | $ | 49,511 | ||||||
Taxable income per common share (A) | $ | 9.04 | $ | 5.64 | $ | 2.36 | ||||||
| (A) | The common shares outstanding as of the end of each period presented is used in calculating the taxable income per common share. |
The primary difference between consolidated net income and taxable income is due to differences in the recognition of income on our portfolio of interest-only mortgage securities – available-for-sale. Generally, the accrual of interest on interest-only securities is accelerated for income tax purposes. This is the result of the current original issue discount rules as promulgated by Internal Revenue Code Sections 1271 through 1275. On September 30, 2004, the IRS released Announcement 2004-75. This Announcement describes rules that may be included in proposed regulations regarding the timing of income and/or deductions attributable to interest-only securities. No proposed regulations that would impact income for 2004 have been issued. Based on the Announcement, we believe that if the IRS does propose and adopt new regulations on this issue, the change will have the effect of narrowing the spread between book income and taxable income on interest-only mortgage securities, and thus, will have a similar impact to NFI in years following the effective date of the rules.
To maintain its qualification as a REIT, NFI is required to declare dividend distributions of at least 90 percent of our taxable income by the filing date of our federal tax return, including extensions. Any taxable income that has not been declared to be distributed by this date is subject to corporate income taxes. At this time, NFI intends to declare dividends equal to 100 percent of our taxable income for 2004 by the required distribution date. Accordingly, we have not accrued any corporate income tax for NFI for the year ended December 31, 2004.
As a REIT, NFI may be subject to a federal excise tax. An excise tax is incurred if NFI distributes less than 85 percent of its taxable income by the end of the calendar year. As part of the amount distributed by the end of the calendar year, NFI may include dividends that were declared in October, November or December and paid on or before January 31 of the following year. To the extent that 85 percent of our taxable income exceeds our dividend distributions in any given year, an excise tax of 4 percent is due and payable on the shortfall. For the year ended December 31, 2004, we have provided for excise tax of $2.1 million. Excise taxes are reflected as a component of general and administrative expenses on our Consolidated Statements of Income. As of December 31, 2004 and 2003, accrued excise tax payable was $1.8 million and $0.2 million, respectively. The excise tax payable is reflected as a component of accounts payable and other liabilities on our Consolidated Balance Sheets.
NFI Holding Corporation, a wholly-owned subsidiary of NFI, and its subsidiaries (collectively known as “the TRS”) are treated as “taxable REIT subsidiaries.” The TRS is subject to corporate income taxes and files a consolidated federal income tax return. The TRS reported net income (loss) from continuing operations before income taxes of $12.0 million for the year ended December 31, 2004 compared with $50.6 million and $(11.0) million for the same period of 2003 and 2002. As shown in our statement of income, this resulted in an income tax expense (benefit) of $5.4 million, $22.9 million and $(2.0) million for the years ended December 31, 2004, 2003 and 2002 respectively. Additionally, the TRS reported a net loss from discontinued operations before income taxes of $6.7 million for the year ended December 31, 2004 resulting in an income tax benefit of $2.6 million.
During the past five years, we believe that a minority of our shareholders have been non-United States holders. Accordingly, we anticipate that NFI will qualify as a “domestically-controlled REIT” for United States federal income tax purposes. Investors who are non-United States holders should contact their tax advisor regarding the United States federal income tax consequences of dispositions of shares of a “domestically-controlled REIT.”
Pro Forma 2003 and 2002 Statements of Income.Prior to 2004, we were party to limited liability company (“LLC”) agreements governing LLC’s formed to facilitate the operation of retail mortgage broker businesses as branches of NHMI. The LLC agreements were terminated effective January 1, 2004. Continuing branches that formerly operated under these agreements became our operating units and their financial results are included in the consolidated financial statements. The inclusion resulted in expected increases in general and administrative expenses, which were substantially offset by increases in related fee income. We did not purchase any assets or liabilities as a result of these branches becoming operating units.
The following table compares the year ended December 31, 2003 and 2002 as reported Pro Forma as if the LLC’s had been our operating units. The Pro Forma only includes LLC’s that are still in existence as of December 31, 2004.
Table 14 – Pro Forma 2003 and 2002
(dollars in thousands, except per share amounts)
For the Year Ended December 31, 2003 | For the Year Ended December 31, 2002 | |||||||||||||||
| Actual | Pro Forma | Actual | Pro Forma | |||||||||||||
Net interest income | $ | 130,445 | $ | 130,445 | $ | 79,847 | $ | 79,847 | ||||||||
Gains on sales of mortgage assets | 144,005 | 165,879 | 53,305 | 59,506 | ||||||||||||
Fee income | 68,341 | 91,784 | 35,983 | 41,542 | ||||||||||||
Other expense, net | (33,527 | ) | (33,527 | ) | (37,811 | ) | (37,811 | ) | ||||||||
General and administrative expenses | (174,408 | ) | (218,326 | ) | (84,594 | ) | (96,790 | ) | ||||||||
Income before income tax expense (benefit) | 134,856 | 136,255 | 46,730 | 46,294 | ||||||||||||
Income tax expense (benefit) | 22,860 | 23,207 | (2,031 | ) | (1,913 | ) | ||||||||||
Income from continuing operations | 111,996 | 113,048 | 48,761 | 48,207 | ||||||||||||
Loss from discontinued operations, net of income tax | — | (2,505 | ) | — | (605 | ) | ||||||||||
Net income | $ | 111,996 | $ | 110,543 | $ | 48,761 | $ | 47,602 | ||||||||
Basic earnings per share: | ||||||||||||||||
Income from continuing operations | $ | 5.04 | $ | 5.09 | $ | 2.35 | $ | 2.32 | ||||||||
Loss from discontinued operations, net of income tax | — | (0.11 | ) | — | (0.03 | ) | ||||||||||
Net income available to common shareholders | $ | 5.04 | $ | 4.98 | $ | 2.35 | $ | 2.29 | ||||||||
Diluted earnings per share: | ||||||||||||||||
Income from continuing operations | $ | 4.91 | $ | 4.96 | $ | 2.25 | $ | 2.23 | ||||||||
Loss from discontinued operations, net of income tax | — | (0.11 | ) | — | (0.03 | ) | ||||||||||
Net income available to common shareholders | $ | 4.91 | $ | 4.85 | $ | 2.25 | $ | 2.20 | ||||||||
Mortgage Loan Servicing.Loan servicing is a critical part of our business. In the opinion of management, maintaining contact with borrowers is vital in managing credit risk and in borrower retention. Nonconforming borrowers are prone to late payments and are more likely to default on their obligations than conventional borrowers. We strive to identify issues and trends with borrowers early and take quick action to address such matters. Our annualized costs of servicing per unit decreased from $263 and $267 at December 31, 2003 and 2002, respectively, to $261 at December 31, 2004.
Table 15 — Summary of Servicing Operations
(dollars in thousands, except per loan cost)
| 2004 | 2003 | 2002 | ||||||||||||||||||||||
| Amount | Per Unit | Amount | Per Unit | Amount | Per Unit | |||||||||||||||||||
Unpaid principal | $ | 12,151,196 | $ | 7,206,113 | $ | 3,657,640 | ||||||||||||||||||
Number of loans | 87,543 | 54,196 | 28,849 | |||||||||||||||||||||
Servicing income, before amortization of mortgage servicing rights | $ | 35,773 | $ | 409 | $ | 20,486 | $ | 378 | $ | 12,796 | $ | 444 | ||||||||||||
Costs of servicing | (22,845 | ) | (261 | ) | (14,261 | ) | (263 | ) | (7,703 | ) | (267 | ) | ||||||||||||
Net servicing income, before amortization of mortgage servicing rights | 12,928 | 148 | 6,225 | 115 | 5,093 | 177 | ||||||||||||||||||
Amortization of mortgage servicing rights | (16,934 | ) | (193 | ) | (8,995 | ) | (166 | ) | (4,609 | ) | (160 | ) | ||||||||||||
Net servicing income (loss) | $ | (4,006 | ) | $ | (45 | ) | $ | (2,770 | ) | $ | (51 | ) | $ | 484 | $ | 17 | ||||||||
Liquidity and Capital Resources
Liquidity means the need for, access to and uses of cash. Our primary needs for cash include the acquisition of mortgage loans, principal repayment and interest on borrowings, operating expenses and dividend payments. Substantial cash is required to support the operating activities of the business, especially the mortgage origination operation. Mortgage asset sales, principal, interest and fees collected on mortgage assets support cash needs. Drawing upon various borrowing arrangements typically satisfies major cash requirements. As shown in Table 5, we have $268.6 million in immediately available funds.
Mortgage lending requires significant cash to fund loan originations and purchases. Our warehouse lending arrangements, which include repurchase agreements, support the mortgage lending operation. Our warehouse mortgage lenders allow us to borrow between 98% and 100% of the outstanding principal. Funding for the difference – generally 2% of the principal - must come from cash on hand.
Loans financed with warehouse repurchase credit facilities are subject to changing market valuation and margin calls. The market value of our loans is dependent on a variety of economic conditions, including interest rates (and borrower demand) and end investor desire and capacity. Market values have been consistent over the past three years. However, there is no certainty that the prices will remain constant. To the extent the value of the loans declines significantly, we would be required to repay portions of the amounts we have borrowed. The value of our loans held-for-sale, excluding the loans under removal of accounts provision, as of December 31, 2004 would need to decline by approximately 37% before we would use all immediately available funds, assuming no other constraints on our immediately available funds.
In the ordinary course of business, we sell loans with recourse where a defect occurred in the loan origination process and guarantee to cover investor losses should origination defects occur. Defects may occur in the loan documentation and underwriting process, either through processing errors made by us or through intentional or unintentional misrepresentations made by the borrower or agents during those processes. If a defect is identified, we are required to repurchase the loan. As of December 31, 2004 and 2003, we had loans sold with recourse with an outstanding principal balance of $11.4 billion and $6.4 billion, respectively. Repurchases of loans where a defect has occurred have been insignificant, as such, there is minimal liquidity risk.
The derivative financial instruments we use also subject us to “margin call” risk. Under our interest rate swaps, we pay a fixed rate to the counterparties while they pay us a floating rate. While floating rates are low, on a net basis we are paying the counterparty. In order to mitigate credit exposure to us, the counterparty requires us to post margin deposits with them. As of December 31, 2004, we have approximately $6.7 million on deposit. A decline in interest rates would subject us to additional exposure for cash margin calls. However, the asset side of the balance sheet should increase in value in a further declining interest rate scenario. Incoming cash on our mortgage loans and securities is a principal source of cash. The volume of cash depends on, among other things, interest rates. While short-term interest rates (the basis for our funding costs) are low and the coupon rates on our loans are high, our net interest margin (and therefore incoming cash flow) is high. Severe and immediate changes in interest rates will impact the volume of our incoming cash flow. To the extent rates increase dramatically, our funding costs will increase quickly. While many of our loans are adjustable, they typically will not reset as quickly as our funding costs. This circumstance would temporarily reduce incoming cash flow. As noted above, derivative financial instruments are used to mitigate the effect of interest rate volatility. In this rising rate situation, our interest rate swaps and caps would provide additional cash flows to mitigate the lower cash flows on loans and securities.
Loans we originate and purchase can be sold to a third-party, which also generates cash to fund on-going operations. When market prices exceed our cost to originate, we believe we can operate in this manner, provided that the level of loan originations is at or near the capacity of the loan production infrastructure.
Cash activity during the years ended December 31, 2004, 2003 and 2002 is presented in the consolidated statement of cash flows.
As noted above, proceeds from equity offerings have supported our operations. Since inception, we have raised $362 million in net proceeds through private and public equity offerings. Equity offerings provide another future liquidity source.
Off Balance Sheet Arrangements
As discussed previously, we pool the loans we originate and purchase and securitize them to obtain long-term financing for the assets. The loans are transferred to a trust where they serve as collateral for asset-backed bonds, which the trust issues to the public. Our ability to use the securitization capital market is critical to the operations of our business. Table 3 summarizes our off balance sheet securitizations.
External factors that are reasonably likely to affect our ability to continue to use this arrangement would be those factors that could disrupt the securitization capital market. A disruption in the market could prevent us from being able to sell the securities at a favorable price, or at all. Factors that could disrupt the securitization market include an international liquidity crisis such as occurred in the fall of 1998, a terrorist attack, outbreak of war or other significant event risk, and market specific events such as a default of a comparable type of securitization. If we were unable to access the securitization market, we may still be able to finance our mortgage operations by selling our loans to investors in the whole loan market. We were able to do this following the liquidity crisis in 1998.
Specific items that may affect our ability to use the securitizations to finance our loans relate primarily to the performance of the loans that have been securitized. Extremely poor loan performance may lead to poor bond performance and investor unwillingness to buy bonds supported by our collateral. Our financial performance and condition has little impact on our ability to securitize, as evidenced by our ability to securitize in 1998, 1999 and 2000 when our financial trend was weak.
We have commitments to borrowers to fund residential mortgage loans as well as commitments to purchase and sell mortgage loans to third parties. As of December 31, 2004, we had outstanding commitments to originate loans of $361.2 million. We had no commitments to purchase or sell loans at December 31, 2004. As of December 31, 2003, we had outstanding commitments to originate and purchase loans of $228 million and $60 million, respectively. We had no commitments to sell loans to third parties at December 31, 2003. The commitments to originate and purchase loans do not necessarily represent future cash requirements, as some portion of the commitments are likely to expire without being drawn upon or may be subsequently declined for credit or other reasons.
Contractual Obligations
We have entered into certain long-term debt and lease agreements, which obligate us to make future payments to satisfy the related contractual obligations. Notes 7 and 8 of the consolidated financial statements discuss these obligations in further detail.
The following table summarizes our contractual obligations with regard to our long-term debt and lease agreements as of December 31, 2004.
Table 16 — Contractual Obligations
(in thousands)
| Payments Due by Period | |||||||||||||||
Contractual Obligations | Total | Less than 1 Year | 1-3 Years | 4-5 Years | After 5 Years | ||||||||||
Short-term borrowings | $ | 905,528 | $ | 905,528 | — | — | — | ||||||||
Long-term debt (A) | $ | 407,242 | $ | 292,325 | $ | 100,887 | $ | 10,579 | $ | 3,451 | |||||
Operating leases | $ | 48,965 | $ | 8,540 | $ | 16,471 | $ | 16,052 | $ | 7,902 | |||||
Premiums due to counterparties related to interest rate cap agreements | $ | 1,874 | $ | 1,372 | $ | 502 | — | — | |||||||
| (A) | Repayment of the asset-backed bonds is dependent upon payment of the underlying mortgage loans, which collateralize the debt. The repayment of these mortgage loans is affected by prepayments. Interest obligations on our variable-rate long-term debt are based on the prevailing interest rate at December 31, 2004 for each respective obligation. |
We entered into various lease agreements in which the lessor agreed to repay us for certain existing lease obligations. We received approximately $61,000, $2.3 million and $62,000 related to these agreements in 2004, 2003 and 2002, respectively. These agreements expired in 2004. We entered into various sublease agreements for office space formerly occupied by us. We received approximately $1.2 million, $537,000 and $704,000 in 2004, 2003 and 2002, respectively related to these agreements. These agreements expired in 2004.
Inflation
Virtually all of our assets and liabilities are financial in nature. As a result, interest rates and other factors drive company performance far more than does inflation. Changes in interest rates do not necessarily correlate with inflation rates or changes in inflation rates. Our financial statements are prepared in accordance with accounting principles generally accepted in the United States of America and dividends are based on taxable income. In each case, financial activities and the balance sheet are measured with reference to historical cost or fair market value without considering inflation.
Impact of Recently Issued Accounting Pronouncements
In December 2004, the FASB issued a revision of FASB Statement No. 123,Accounting for Stock-Based Compensation. This Statement establishes standards for the accounting for transactions in which an entity exchanges its equity instruments for goods or services. It also addresses transactions in which an entity incurs liabilities in exchange for goods or services that are based on the fair value of the entity’s equity instruments or that may be settled by the issuance of those equity instruments. This Statement focuses primarily on accounting for transactions in which an entity obtains employee services in share-based payment transactions and does not change the accounting guidance for share-based payment transactions with parties other than employees provided in SFAS No. 123 and Emerging Issues Task Force of the Financial Accounting Standards Board (EITF) Issue No. 96-18,Accounting for Equity Instruments That Are Issued to Other Than Employees for Acquiring, or in Conjunction with Selling, Goods or Services. Entities no longer have the option to use the intrinsic value method of APB 25 that was provided in SFAS 123 as originally issued, which generally resulted in the recognition of no compensation cost. Under SFAS No. 123(R), the cost of employee services received in exchange for an equity award must be based on the grant-date fair value of the award. The cost of the awards under SFAS 123(R) will be recognized over the period an employee provides service, typically the vesting period. No compensation cost is recognized for equity instruments in which the requisite service is not provided. For employee awards that are treated as liabilities, initial cost of the awards will be measured at fair value. The fair value of the liability awards will be remeasured subsequently at each reporting date through the settlement date with changes in fair value during the period an employee provides service recognized as compensation cost over that period. This Statement is effective as of the first interim or annual reporting period that begins after June 15, 2005. As discussed in Note 1 of the consolidated financial statements, we implemented the fair value provisions of SFAS No. 123 during 2003. As such, the adoption of this statement is not anticipated to have a significant impact on the consolidated financial statements.
In March 2004, SEC Staff Accounting Bulletin (SAB) No. 105,Application of Accounting Principles to Loan Commitments was released. This release summarizes the SEC staff position regarding the application of accounting principles generally accepted in the United States of America to loan commitments accounted for as derivative instruments. We account for interest rate lock commitments issued on mortgage loans that will be held for sale as derivative instruments. Consistent with SAB No. 105, we considered the fair value of these commitments to be zero at the commitment date, with subsequent changes in fair value determined solely on changes in market interest rates. As of December 31, 2004, we had interest rate lock commitments on mortgage loans with principal balances of $361.2 million, the fair value of which was $(75,000).
At the March 17-18, 2004 EITF meeting, the EITF reached a consensus on Issue No. 03-1,The Meaning of Other-Than-Temporary Impairment and its Application to Certain Investments. Issue 03-1 provides guidance for determining when an investment is other-than-temporarily impaired and disclosure requirements regarding impairments that have not been recognized as other-than-temporary. In September 2004, the FASB delayed the effective date of paragraphs 10-20 of this issue. These paragraphs give guidance on how to evaluate and recognize an impairment loss that is other than temporary. The delay does not suspend the requirements to recognize other than temporary impairments as required by existing authoritative literature. The disclosure requirements were effective for reporting periods beginning after June 15, 2004. Issue 03-1 is not expected to have a material impact on the consolidated financial statements.
In December 2003, the American Institute of Certified Public Accountants (AICPA) issued Statement of Position (SOP) 03-3,Accounting for Certain Loans or Debt Securities Acquired in a Transfer.This SOP addresses accounting for differences between contractual cash flows and cash flows expected to be collected from an investor’s initial investment in loans or debt securities (loans) acquired in a transfer if those differences are attributable, at least in part, to credit quality. It includes such loans acquired in purchase business combinations and applies to all nongovernmental entities, including not-for-profit organizations. This SOP does not apply to loans originated by the entity, loans acquired in a business combination accounted for at historical cost, mortgage-backed securities in securitization transactions, acquired loans classified as held-for-sale, trading securities and derivatives. This SOP limits the yield that may be accreted to the excess of the investor’s estimate of undiscounted expected principal, interest, and other cash flows (cash flows expected at acquisition to be collected) over the investor’s initial investment in the loan. This SOP requires that the excess of contractual cash flows over cash flows expected to be collected (nonaccretable difference) not be recognized as an adjustment of yield, loss accrual, or valuation allowance. This SOP prohibits investors from displaying the accretable yield and nonaccretable difference in the balance sheet. Subsequent increases in cash flows expected to be collected generally should be recognized prospectively through adjustment of the loan’s yield over its remaining life. Decreases in cash flows expected to be collected should be recognized as impairment. This SOP prohibits “carrying over” or creation of valuation allowances in the initial accounting of all loans acquired in a transfer that are within the scope of this SOP. The prohibition of the valuation allowance carryover applies to the purchase of an individual loan, a pool of loans, a group of loans, and loans acquired in a purchase business combination. This SOP is effective for loans acquired in fiscal years beginning after December 15, 2004. Early adoption is encouraged. For loans acquired in fiscal years beginning on or before December 15, 2004, this SOP should be applied prospectively for fiscal years beginning after December 15, 2004. SOP 03-3 is not expected to have a significant impact on the consolidated financial statements.
Item 7A.Quantitative and Qualitative Disclosures about Market Risk
See discussion under “Interest Rate/Market Risk” in “Item 1. Business”.
Item 8.Financial Statements and Supplementary Data
NOVASTAR FINANCIAL, INC.
CONSOLIDATED BALANCE SHEETS
(dollars in thousands, except share amounts)
| December 31, | ||||||||
| 2004 | 2003 | |||||||
Assets | ||||||||
Cash and cash equivalents | $ | 268,563 | $ | 118,180 | ||||
Mortgage loans – held-for-sale | 747,594 | 697,992 | ||||||
Mortgage loans – held-in-portfolio | 59,527 | 94,717 | ||||||
Mortgage securities – available-for-sale | 489,175 | 382,287 | ||||||
Mortgage securities – trading | 143,153 | — | ||||||
Mortgage servicing rights | 42,010 | 19,685 | ||||||
Servicing related advances | 20,190 | 19,281 | ||||||
Derivative instruments, net | 18,841 | 19,492 | ||||||
Property and equipment, net | 15,476 | 14,537 | ||||||
Other assets | 56,782 | 33,786 | ||||||
Total assets | $ | 1,861,311 | $ | 1,399,957 | ||||
Liabilities and Stockholders’ Equity | ||||||||
Liabilities: | ||||||||
Short-term borrowings secured by mortgage loans | $ | 720,791 | $ | 639,852 | ||||
Short-term borrowings secured by mortgage securities | 184,737 | 232,684 | ||||||
Asset-backed bonds secured by mortgage loans | 53,453 | 89,384 | ||||||
Asset-backed bonds secured by mortgage securities | 336,441 | 43,596 | ||||||
Dividends payable | 73,431 | 30,559 | ||||||
Due to trusts | 20,930 | 14,475 | ||||||
Accounts payable and other liabilities | 45,184 | 49,183 | ||||||
Total liabilities | 1,434,967 | 1,099,733 | ||||||
Commitments and contingencies (Note 8) | ||||||||
Stockholders’ equity: | ||||||||
Capital stock, $0.01 par value, 50,000,000 shares authorized: | ||||||||
Redeemable preferred stock, $25 liquidating preference per share; 2,990,000 shares authorized, issued and outstanding | 30 | — | ||||||
Common stock, 27,709,984 and 24,447,315 shares authorized, issued and outstanding, respectively | 277 | 245 | ||||||
Additional paid-in capital | 433,107 | 231,294 | ||||||
Accumulated deficit | (85,354 | ) | (15,522 | ) | ||||
Accumulated other comprehensive income | 79,120 | 85,183 | ||||||
Other | (836 | ) | (976 | ) | ||||
Total stockholders’ equity | 426,344 | 300,224 | ||||||
Total liabilities and stockholders’ equity | $ | 1,861,311 | $ | 1,399,957 | ||||
See notes to consolidated financial statements.
NOVASTAR FINANCIAL, INC.
CONSOLIDATED STATEMENTS OF INCOME
(dollars in thousands, except per share amounts)
| For the Year Ended December 31, | ||||||||||||
| 2004 | 2003 | 2002 | ||||||||||
Interest income: | ||||||||||||
Mortgage securities | $ | 133,633 | $ | 98,804 | $ | 56,481 | ||||||
Mortgage loans held-for-sale | 83,718 | 60,878 | 33,736 | |||||||||
Mortgage loans held-in-portfolio | 6,673 | 10,738 | 16,926 | |||||||||
Total interest income | 224,024 | 170,420 | 107,143 | |||||||||
Interest expense: | ||||||||||||
Short-term borrowings secured by mortgage loans | 30,005 | 20,060 | 10,406 | |||||||||
Short-term borrowings secured by mortgage securities | 4,836 | 3,450 | 2,107 | |||||||||
Asset-backed bonds secured by mortgage loans | 1,422 | 2,269 | 4,195 | |||||||||
Asset-backed bonds secured by mortgage securities | 13,255 | 5,226 | 727 | |||||||||
Net settlements of derivative instruments used in cash flow hedges | 3,072 | 9,359 | 10,293 | |||||||||
Total interest expense | 52,590 | 40,364 | 27,728 | |||||||||
Net interest income before credit (losses) recoveries | 171,434 | 130,056 | 79,415 | |||||||||
Credit (losses) recoveries | (726 | ) | 389 | 432 | ||||||||
Net interest income | 170,708 | 130,445 | 79,847 | |||||||||
Gains on sales of mortgage assets | 144,950 | 144,005 | 53,305 | |||||||||
Fee income | 102,756 | 68,341 | 35,983 | |||||||||
Premiums for mortgage loan insurance | (4,218 | ) | (3,102 | ) | (2,326 | ) | ||||||
Losses on derivative instruments | (8,905 | ) | (30,837 | ) | (36,841 | ) | ||||||
Impairment on mortgage securities – available-for-sale | (15,902 | ) | — | — | ||||||||
Other income, net | 6,609 | 412 | 1,356 | |||||||||
General and administrative expenses: | ||||||||||||
Compensation and benefits | 138,516 | 89,954 | 49,060 | |||||||||
Office administration | 38,625 | 22,945 | 10,092 | |||||||||
Marketing | 37,812 | 23,109 | 9,986 | |||||||||
Professional and outside services | 19,887 | 7,482 | 3,263 | |||||||||
Loan expense | 18,753 | 19,433 | 6,667 | |||||||||
Other | 17,532 | 11,485 | 5,526 | |||||||||
Total general and administrative expenses | 271,125 | 174,408 | 84,594 | |||||||||
Income from continuing operations before income tax expense (benefit) | 124,873 | 134,856 | 46,730 | |||||||||
Income tax expense (benefit) | 5,376 | 22,860 | (2,031 | ) | ||||||||
Income from continuing operations | 119,497 | 111,996 | 48,761 | |||||||||
Loss from discontinued operations, net of income tax | (4,108 | ) | — | — | ||||||||
Net income | 115,389 | 111,996 | 48,761 | |||||||||
Dividends on preferred shares | (6,265 | ) | — | — | ||||||||
Net income available to common shareholders | $ | 109,124 | $ | 111,996 | $ | 48,761 | ||||||
Basic earnings per share: | ||||||||||||
Income from continuing operations available to common shareholders | $ | 4.47 | $ | 5.04 | $ | 2.35 | ||||||
Loss from discontinued operations, net of income tax | (0.16 | ) | — | — | ||||||||
Net income available to common shareholders | $ | 4.31 | $ | 5.04 | $ | 2.35 | ||||||
Diluted earnings per share: | ||||||||||||
Income from continuing operations available to common shareholders | $ | 4.40 | $ | 4.91 | $ | 2.25 | ||||||
Loss from discontinued operations, net of income tax | (0.16 | ) | — | — | ||||||||
Net income available to common shareholders | $ | 4.24 | $ | 4.91 | $ | 2.25 | ||||||
Weighted average basic shares outstanding | 25,290 | 22,220 | 20,758 | |||||||||
Weighted average diluted shares outstanding | 25,763 | 22,821 | 21,660 | |||||||||
Dividends declared per common share | $ | 6.75 | $ | 5.04 | $ | 2.15 | ||||||
See notes to consolidated financial statements.
NOVASTAR FINANCIAL, INC.
CONSOLIDATED STATEMENTS OF STOCKHOLDERS’ EQUITY
(dollars in thousands, except share amounts)
Preferred Stock | Common Stock | Additional Paid-in Capital | Accumulated Deficit | Accumulated Other Comprehensive Income | Other | Total Stockholders’ Equity | ||||||||||||||||||||
Balance, January 1, 2002 | $ | 43 | $ | 116 | $ | 137,802 | $ | (15,887 | ) | $ | 9,177 | $ | (1,254 | ) | $ | 129,997 | ||||||||||
Conversion of preferred stock to common, 8,571,428 shares | (43 | ) | 86 | (43 | ) | — | — | — | — | |||||||||||||||||
Acquisition of warrants, 812,731 | — | — | (9,499 | ) | — | — | — | (9,499 | ) | |||||||||||||||||
Conversion of 350,000 warrants for 421,406 shares of common stock | — | 4 | (4 | ) | — | — | — | — | ||||||||||||||||||
Forgiveness of founders’ notes receivable | — | — | — | — | — | 139 | 139 | |||||||||||||||||||
Exercise of stock options, 358,476 shares | — | 4 | 1,782 | — | — | — | 1,786 | |||||||||||||||||||
Compensation recognized under stock option plan | — | — | 3,215 | — | — | — | 3,215 | |||||||||||||||||||
Dividends on common stock ($2.15 per share) | — | — | — | (44,900 | ) | — | — | (44,900 | ) | |||||||||||||||||
Increase in common stock held in rabbi trusts | — | — | — | — | — | (911 | ) | (911 | ) | |||||||||||||||||
Increase in deferred compensation obligation | — | — | — | — | — | 911 | 911 | |||||||||||||||||||
Comprehensive income: | ||||||||||||||||||||||||||
Net income | 48,761 | — | 48,761 | |||||||||||||||||||||||
Other comprehensive income | — | 53,758 | 53,758 | |||||||||||||||||||||||
Total comprehensive income | 102,519 | |||||||||||||||||||||||||
Balance, December 31, 2002 | — | 210 | 133,253 | (12,026 | ) | 62,935 | (1,115 | ) | 183,257 | |||||||||||||||||
Forgiveness of founders’ notes receivable | — | — | — | — | — | 139 | 139 | |||||||||||||||||||
Issuance of common stock, 3,188,620 shares | — | 32 | 93,889 | — | — | — | 93,921 | |||||||||||||||||||
Exercise of stock options, 298,875 shares | — | 3 | 1,644 | — | — | — | 1,647 | |||||||||||||||||||
Compensation recognized under stock option plan | — | — | 1,310 | — | — | — | 1,310 | |||||||||||||||||||
Dividend equivalent rights (DERs) on vested options | — | — | 1,198 | (1,198 | ) | — | — | — | ||||||||||||||||||
Dividends on common stock ($5.04 per share) | — | — | — | (114,294 | ) | — | — | (114,294 | ) | |||||||||||||||||
Increase in common stock held in rabbi trusts | — | — | — | — | — | (3,145 | ) | (3,145 | ) | |||||||||||||||||
Increase in deferred compensation obligation | — | — | — | — | — | 3,145 | 3,145 | |||||||||||||||||||
Comprehensive income: | ||||||||||||||||||||||||||
Net income | 111,996 | — | 111,996 | |||||||||||||||||||||||
Other comprehensive income | — | 22,248 | 22,248 | |||||||||||||||||||||||
Total comprehensive income | 134,244 | |||||||||||||||||||||||||
Balance, December 31, 2003 | — | 245 | 231,294 | (15,522 | ) | 85,183 | (976 | ) | 300,224 | |||||||||||||||||
Continued
Preferred Stock Common Stock Additional Paid-in Capital Total Stockholders’ Equity Forgiveness of founders’ notes receivable Issuance of common stock, 2,829,488 shares Issuance of preferred stock, 2,990,000 shares Issuance of stock under stock compensation plans, 433,181 shares Compensation recognized under stock compensation plans Dividend equivalent rights (DERs) on vested options Dividends on common stock ($6.75 per share) Dividends on preferred stock ($2.11 per share) Tax benefit derived from stock compensation plans Increase in common stock held in rabbi trusts Increase in deferred compensation obligation Comprehensive income: Net income Other comprehensive loss Total comprehensive income Balance, December 31, 2004 Accumulated
Deficit Accumulated
Other
Comprehensive
Income Other — — — — — 140 140 — 28 121,306 — — — 121,334 30 — 72,089 — — — 72,119 — 4 3,811 — — — 3,815 — — 1,810 — — — 1,810 — — 1,900 (1,900 ) — — — — — — (177,056 ) — — (177,056 ) — — — (6,265 ) — — (6,265 ) — — 897 — — — 897 — — — — — (2,290 ) (2,290 ) — — — — — 2,290 2,290 115,389 — 115,389 — (6,063 ) (6,063 ) 109,326 $ 30 $ 277 $ 433,107 $ (85,354 ) $ 79,120 $ (836 ) $ 426,344 Concluded
See notes to consolidated financial statements.
NOVASTAR FINANCIAL, INC.
CONSOLIDATED STATEMENTS OF CASH FLOWS
(in thousands)
| For the Year Ended December 31, | ||||||||||||
| 2004 | 2003 | 2002 | ||||||||||
Cash flows from operating activities: | ||||||||||||
Income from continuing operations | $ | 119,497 | $ | 111,996 | $ | 48,761 | ||||||
Adjustments to reconcile net income to net cash provided by (used in) operating activities: | ||||||||||||
Amortization of mortgage servicing rights | 16,934 | 8,995 | 4,609 | |||||||||
Impairment on mortgage securities – available-for-sale | 15,902 | — | — | |||||||||
Losses on derivative instruments | 8,905 | 30,837 | 36,841 | |||||||||
Depreciation expense | 6,090 | 3,872 | 1,203 | |||||||||
Amortization of deferred debt issuance costs | 5,036 | 1,100 | 172 | |||||||||
Compensation recognized under stock compensation plans | 1,810 | 1,310 | 3,215 | |||||||||
Tax benefit derived from stock compensation plans | 897 | — | — | |||||||||
Credit losses (recoveries) | 726 | (389 | ) | (432 | ) | |||||||
Amortization of premiums on mortgage loans | 699 | 1,120 | 1,930 | |||||||||
Forgiveness of founders’ promissory notes | 140 | 139 | 139 | |||||||||
Provision for deferred income taxes | (1,322 | ) | (5,848 | ) | (4,652 | ) | ||||||
Accretion of available-for-sale securities | (100,666 | ) | (78,097 | ) | (56,481 | ) | ||||||
Originations and purchases of mortgage loans held-for-sale | (8,560,314 | ) | (6,071,042 | ) | (2,811,315 | ) | ||||||
Repayments of mortgage loans held-for-sale | 27,979 | 18,474 | 10,943 | |||||||||
Proceeds from sale of mortgage loans held-for-sale to third parties | 64,476 | 966,537 | 394,240 | |||||||||
Proceeds from sale of mortgage loans held-for-sale in securitizations | 8,173,829 | 5,207,525 | 1,520,712 | |||||||||
Gains on sales of mortgage assets | (144,950 | ) | (144,005 | ) | (53,305 | ) | ||||||
Purchase of mortgage securities - trading | (143,153 | ) | — | — | ||||||||
Changes in: | ||||||||||||
Servicing related advances | (707 | ) | (6,247 | ) | (3,173 | ) | ||||||
Derivative instruments, net | 13,553 | (9,577 | ) | (41,866 | ) | |||||||
Other assets | (43,753 | ) | (25,074 | ) | 3,093 | |||||||
Accounts payable and other liabilities | (24,204 | ) | 30,422 | (2,936 | ) | |||||||
Net cash provided by (used in) operating activities from continuing operations | (562,596 | ) | 42,048 | (948,302 | ) | |||||||
Net cash used in operating activities from discontinued operations | (3,110 | ) | — | — | ||||||||
Net cash provided by (used in) operating activities | (565,706 | ) | 42,048 | (948,302 | ) | |||||||
Cash flows from investing activities: | ||||||||||||
Proceeds from paydowns on available-for-sale securities | 346,558 | 179,317 | 100,071 | |||||||||
Mortgage loan repayments—held-in-portfolio | 31,781 | 49,101 | 65,505 | |||||||||
Proceeds from sales of assets acquired through foreclosure | 4,905 | 6,719 | 14,876 | |||||||||
Purchases of property and equipment | (7,029 | ) | (13,000 | ) | (5,280 | ) | ||||||
Net cash provided by investing activities | 376,215 | 222,137 | 175,172 | |||||||||
Cash flows from financing activities: | ||||||||||||
Proceeds from issuance of asset-backed bonds, net of debt issuance costs | 506,745 | 52,271 | 66,906 | |||||||||
Payments on asset-backed bonds | (254,867 | ) | (120,083 | ) | (86,434 | ) | ||||||
Proceeds from issuance of capital stock and exercise of equity instruments, net of offering costs | 193,615 | 94,321 | 1,786 | |||||||||
Change in short-term borrowings | 32,992 | (153,000 | ) | 882,186 | ||||||||
Repurchase of warrants | — | — | (9,499 | ) | ||||||||
Dividends paid on preferred stock | (6,265 | ) | — | (2,014 | ) | |||||||
Dividends paid on common stock | (132,346 | ) | (99,256 | ) | (30,876 | ) | ||||||
Net cash provided by (used in) financing activities | 339,874 | (225,747 | ) | 822,055 | ||||||||
Net increase in cash and cash equivalents | 150,383 | 38,438 | 48,925 | |||||||||
Cash and cash equivalents, beginning of year | 118,180 | 79,742 | 30,817 | |||||||||
Cash and cash equivalents, end of year | $ | 268,563 | $ | 118,180 | $ | 79,742 | ||||||
See notes to consolidated financial statements.
NOVASTAR FINANCIAL, INC.
NOTES TO CONSOLIDATED FINANCIAL STATEMENTS
Note 1. Summary of Significant Accounting and Reporting Policies
Description of Operations NovaStar Financial, Inc. and subsidiaries (the “Company”) operates as a specialty finance company that originates, purchases, invests in and services residential nonconforming loans. The Company offers a wide range of mortgage loan products to borrowers, commonly referred to as “nonconforming borrowers,” who generally do not satisfy the credit, collateral, documentation or other underwriting standards prescribed by conventional mortgage lenders and loan buyers, including United States of America government-sponsored entities such as Fannie Mae or Freddie Mac. The Company retains significant interests in the nonconforming loans originated and purchased through their mortgage securities investment portfolio. The Company services all of the loans they retain interests in through their servicing platform, in order to better manage the credit performance of those loans.
Financial Statement PresentationThe Company’s consolidated financial statements have been prepared in conformity with accounting principles generally accepted in the United States of America and prevailing practices within the financial services industry. The preparation of financial statements requires management to make estimates and assumptions that affect the reported amounts of assets and liabilities at the date of the financial statements and the reported amounts of income and expense during the period. The Company uses estimates and employs the judgments of management in determining the amount of its allowance for credit losses, amortizing premiums or accreting discounts on its mortgage assets, amortizing mortgage servicing rights and establishing the fair value of its mortgage securities, derivative instruments, mortgage servicing rights and estimating appropriate accrual rates on mortgage securities – available-for-sale. While the consolidated financial statements and footnotes reflect the best estimates and judgments of management at the time, actual results could differ significantly from those estimates. For example, it is possible that credit losses or prepayments could rise to levels that would adversely affect profitability if those levels were sustained for more than brief periods.
The consolidated financial statements of the Company include the accounts of all wholly-owned subsidiaries. Intercompany accounts and transactions have been eliminated during consolidation.
Cash and Cash Equivalents The Company considers investments with original maturities of three months or less at the date of purchase to be cash equivalents.
Mortgage LoansMortgage loans include loans originated by the Company and acquired from other originators. Mortgage loans are recorded net of deferred loan origination fees and associated direct costs and are stated at amortized cost. Mortgage loan origination fees and associated direct mortgage loan origination costs on mortgage loans held-in-portfolio are deferred and recognized over the estimated life of the loan as an adjustment to yield using the level yield method. Mortgage loan origination fees and direct mortgage loan origination costs on mortgage loans held-for-sale are deferred until the related loans are sold. Mortgage loans held-for-sale are carried at the lower of cost or market determined on an aggregate basis.
Interest is recognized as revenue when earned according to the terms of the mortgage loans and when, in the opinion of management, it is collectible. For all mortgage loans held-for-sale and only mortgage loans held-in-portfolio which do not carry mortgage insurance, the accrual of interest on loans is discontinued when, in management’s opinion, the interest is not collectible in the normal course of business, but in no case beyond when a loan becomes ninety days delinquent. For mortgage loans held-in-portfolio, which do carry mortgage insurance, the accrual of interest is only discontinued when in management’s opinion, the interest is not collectible. Interest collected on non-accrual loans is recognized as income upon receipt.
The mortgage loan portfolio is collectively evaluated for impairment as the loans are smaller-balance and are homogeneous in nature. For mortgage loans held-in-portfolio, the Company maintains an allowance for credit losses inherent in the portfolio at the balance sheet date. The allowance is based upon the assessment by management of various factors affecting its mortgage loan portfolio, including current economic conditions, the makeup of the portfolio based on credit grade, loan-to-value, delinquency status, historical credit losses, Company purchased mortgage insurance and other factors deemed to warrant consideration. The Company uses contractual terms in determining past due or delinquency status of loans.
The servicing agreements the Company executes for loans it has securitized include a removal of accounts provision which gives it the right, not the obligation, to repurchase mortgage loans from the trust. The removal of accounts provision can be exercised for loans that are 90 days to 119 days delinquent. The Company records the mortgage loans subject to the removal of accounts provision in mortgage loans held-for-sale at fair value.
Mortgage Securities – Available-for-SaleMortgage securities – available-for-sale represent beneficial interests the Company retains in securitization and resecuritization transactions and include interest-only mortgage securities, prepayment penalty bonds,
over-collateralization bonds and other subordinated securities. Interest-only mortgage securities represent the contractual right to receive excess interest cash flows from a pool of securitized mortgage loans. Interest payments received by the independent trust are first applied to the principal and interest bonds (held by outside investors), servicing fees and administrative fees. The excess, if any, is remitted to the Company related to its ownership of the interest-only mortgage security. Prepayment penalty bonds give the holder the contractual right to receive prepayment penalties collected by the independent trust on the underlying mortgage loans. Overcollateralization bonds represent the contractual right to excess principal payments resulting from over collateralization of the obligations of the trust.
Subordinated securities retained in resecuritizations represent the contractual right to receive the remaining cash flows from the trust after the obligations to the outside bond holders have been satisfied. When those obligations have been satisfied, the trust returns the transferred securities to the subordinated interest holders.
Mortgage securities classified as available for sale are reported at their estimated fair value with unrealized gains and losses reported in accumulated other comprehensive income. The specific identification method was used in computing realized gains or losses.
As previously described, mortgage securities represent the retained interests in certain components of the cash flows of the underlying mortgage loans or mortgage securities transferred to securitization trusts. As payments are received the payments are applied to the cost basis of the mortgage related security. Each period, the accretable yield for each mortgage security is evaluated and, to the extent there has been a change in the estimated cash flows, it is adjusted and applied prospectively. The estimated cash flows change as management’s assumptions for credit losses, borrower prepayments and interest rates are updated. The assumptions are established using proprietary models the Company has developed. The accretable yield is recorded as interest income with a corresponding increase to the cost basis of the mortgage security.
At each reporting period subsequent to the initial valuation of the retained securities, the fair value of mortgage securities is estimated based on the present value of future expected cash flows to be received. Management’s best estimate of key assumptions, including credit losses, prepayment speeds, the market discount rates and forward yield curves commensurate with the risks involved, are used in estimating future cash flows. To the extent that the cost basis of mortgage securities exceeds the fair value and the unrealized loss is considered to be other than temporary, an impairment charge is recognized and the amount recorded in accumulated other comprehensive income or loss is reclassified to earnings as a realized loss.
Mortgage Securities - TradingMortgage securities – trading consist of mortgage securities purchased by the Company with the principal intent to sell in the near term. These securities are recorded at fair value with gains and losses, realized and unrealized, included in earnings. The Company uses the specific identification method in computing realized gains or losses. The fair value is estimated using quoted market prices.
Mortgage Servicing Rights Mortgage servicing rights are recorded at allocated cost based upon the relative fair values of the transferred loans and the servicing rights. Mortgage servicing rights are amortized in proportion to and over the projected net servicing revenues. Periodically, the Company evaluates the carrying value of mortgage servicing rights based on their estimated fair value. If the estimated fair value, using a discounted cash flow methodology, is less than the carrying amount of the mortgage servicing rights, the mortgage servicing rights are written down to the amount of the estimated fair value. For purposes of evaluating and measuring impairment of mortgage servicing rights the Company stratifies the mortgage servicing rights based on their predominant risk characteristics. The significant risk characteristic considered by the Company is period of origination. The mortgage loans underlying the mortgage servicing rights are pools of homogenous, nonconforming residential loans.
Servicing Related AdvancesThe Company advances funds on behalf of borrowers for taxes, insurance and other customer service functions. These advances are routinely assessed for collectibility and any uncollectible advances are appropriately charged to earnings.
Derivative Instruments, netThe Company uses derivative instruments with the objective of hedging interest rate risk. Interest rates on the Company’s liabilities typically adjust more frequently than interest rates on the Company’s assets. Derivative instruments are recorded at their fair value with hedge ineffectiveness recognized in earnings. For derivative instruments that qualify for hedge accounting, any changes in fair value of derivative instruments related to hedge effectiveness are reported in accumulated other comprehensive income. Changes in fair value of derivative instruments related to hedge ineffectiveness and non-hedge activity are recorded as adjustments to earnings. For those derivative instruments that do not qualify for hedge accounting, changes in the fair value of the instruments are recorded as adjustments to earnings. The fair value of the Company’s derivative instruments, along with any margin accounts associated with the contracts, are included in derivative instruments, net.
Property and Equipment, net Leasehold improvements, furniture and fixtures and office and computer equipment are stated at cost less accumulated depreciation. Depreciation is computed using the straight-line method over the estimated useful lives of the related assets. The estimated useful lives of the assets are as follows:
Leasehold improvements | 5 years | |
Furniture and fixtures | 5 years | |
Office and computer equipment | 3 years |
Maintenance and repairs are charged to expense. Major renewals and improvements are capitalized. Gains and losses on dispositions are credited or charged to earnings as incurred.
Due to TrustsDue to trusts represents the fair value of the mortgage loans the Company has the right to repurchase from the securitization trusts. The servicing agreements the Company executes for loans it has securitized include a removal of accounts provision which gives it the right, not the obligation, to repurchase mortgage loans from the trust. The removal of accounts provision can be exercised for loans that are 90 days to 119 days delinquent. Upon exercise of the call options, the related obligation to the trusts is removed from the Company’s balance sheet.
Premiums for Mortgage Loan InsuranceThe Company uses lender paid mortgage insurance to mitigate the risk of loss on loans that are originated. For those loans held-in-portfolio the premiums for mortgage insurance are expensed by the Company as the cost of the premiums are incurred. For those loans sold in securitization transactions accounted for as a sale, the independent trust assumes the obligation to pay the premiums and obtains the right to receive insurance proceeds.
Transfers of Assets A transfer of mortgage loans or mortgage securities – available-for-sale in which the Company surrenders control over the financial assets is accounted for as a sale. When the Company retains control over transferred mortgage loans or mortgage securities – available-for-sale, the transaction is accounted for as a secured borrowing. When the Company sells mortgage loans or mortgage securities – available-for-sale in securitization and resecuritization transactions, it may retain one or more bond classes and servicing rights in the securitization. Gains and losses on the assets transferred are recognized based on the carrying amount of the financial assets involved in the transfer, allocated between the assets transferred and the retained interests based on their relative fair value at the date of transfer.
Management believes the best estimate of the initial value of the securities it retains in a whole loan securitization is derived from the market value of the pooled loans. The initial value of the loans is estimated based on the expected open market sales price of a similar pool. In open market transactions, the purchaser has the right to reject loans at its discretion. In a loan securitization, loans cannot generally be rejected. As a result, management adjusts the market price for loans to compensate for the estimated value of rejected loans. The market price of the securities retained is derived by deducting the net proceeds received in the securitization (i.e. the economic value of the loans transferred) from the estimated adjusted market price for the entire pool of the loans.
An implied yield (discount rate) is calculated based on the initial value derived above and using projected cash flows generated using assumptions for prepayments, expected credit losses and interest rates. We ensure the resulting implied yield is commensurate with current market conditions. Additionally, this yield serves as the initial accretable yield used to recognize income on the securities.
The Company estimates fair value for the securities it retains in a resecuritization transaction based on the present value of future expected cash flows estimated using management’s best estimate of the key assumptions, including credit losses, prepayment speeds, forward yield curves, and discount rates commensurate with the risks involved.
The following is a description of the methods used by the Company to transfer assets, including the related accounting treatment under each method:
| • | Whole Loan Sales Whole loan sales represent loans sold with servicing released. Gains and losses on whole loan sales are recognized in the period the sale occurs and the Company has determined that the criteria for sales treatment has been achieved as it has surrendered control over the assets transferred. The Company generally has an obligation to repurchase whole loans sold in circumstances in which the borrower fails to make the first payment. Additionally, the Company is also required to repay all or a portion of the premium it receives on the sale of whole loans in the event that the loan prepays in its entirety in the first year. The Company records the fair value of recourse obligations upon the sale of the mortgage loans. See Note 8. |
| • | Loans and Securities Sold Under Agreements to Repurchase (Repurchase Agreements)Repurchase agreements represent legal sales of loans or mortgage securities – available-for-sale and an agreement to repurchase the loans or mortgage |
securities – available-for-sale at a later date. Repurchase agreements are accounted for as secured borrowings because the Company has not surrendered control of the transferred assets as it is both entitled and obligated to repurchase the transferred assets prior to their maturity.
| • | Securitization TransactionsThe Company regularly securitizes mortgage loans by transferring mortgage loans to independent trusts which issue securities to investors. The securities are collateralized by the mortgage loans transferred into the independent trusts. The Company retains interests in some of the securities issued by the trust. Certain of the securitization agreements require the Company to repurchase loans that are found to have legal deficiencies, subsequent to the date of transfer. The Company is also required to buy back any loan for which the borrower converts from an adjustable rate to a fixed rate. The fair values of these recourse obligations are recorded upon the transfers of the mortgage loans and on an ongoing basis. The Company also has the right, but not the obligation, to acquire loans when they are 90 to 119 days delinquent and at the time a property is liquidated. As discussed above, the accounting treatment for transfers of assets upon securitization depends on whether or not the Company has retained control over the transferred assets. The Company records an asset and a liability on the balance sheet for the aggregate fair value of delinquent loans that it has a right to call as of the balance sheet date. |
| • | Resecuritization Transactions The Company also engages in resecuritization transactions. A resecuritization is the transfer or sale of mortgage securities – available-for-sale that the Company has retained in previous securitization transactions to an independent trust. Similar to a securitization, the trust issues securities that are collateralized by the mortgage securities – available-for-sale transferred to the trust. Resecuritization transactions are accounted for as either a sale or a secured borrowing based on whether or not the Company has retained or surrendered control over the transferred assets. In the resecuritization transaction, the Company may retain an interest in a security that represents the right to receive the cash flows on the underlying mortgage security collateral after the senior bonds, issued to third parties, have been repaid in full. |
Fee Income The Company receives fee income from several sources. The following describes significant fee income sources and the related accounting treatment:
| • | Broker FeesBroker fees are paid by other lenders for placing loans with third-party investors (lenders) and are based on negotiated rates with each lender to whom the Company brokers loans. Revenue is recognized upon loan origination and delivery. |
| • | Loan Origination Fees Loan origination fees represent fees paid to the Company by borrowers and are associated with the origination of mortgage loans. Loan origination fees are determined based on the type and amount of loans originated. Loan origination fees and direct origination costs on mortgage loans held-in-portfolio are deferred and recognized over the life of the loan using the level yield method. Loan origination fees and direct origination costs on mortgage loans held-for-sale are deferred and considered as part of the carrying value of the loan when sold. |
| • | Service Fee Income Service fees are paid to the Company by either the investor on mortgage loans serviced or the borrower. Fees paid by investors on loans serviced are determined as a percentage of the principal collected for the loans serviced and are recognized in the period in which payments on the loans are received. Fees paid by borrowers on loans serviced are considered ancillary fees related to loan servicing and include late fees, processing fees and, for loans held-in-portfolio, prepayment penalties. Revenue is recognized on fees received from borrowers when an event occurs that generates the fee and they are considered to be collectible. |
| • | NovaStar Home Mortgage, Inc. (“NHMI”) Branch Management Fees During 2003 and 2002, these fees were charged to LLC’s formed to support NHMI branches to manage branch administrative operations, which included providing accounting, payroll, human resources, loan investor management and license management. The amount of the fees was agreed upon when entering the LLC agreements and recognized as services were rendered. Due to the elimination of the LLC’s and their subsequent inclusion in the consolidated financial statements, branch management fees were eliminated in consolidation in 2004. |
Stock-Based Compensation Prior to 2003, the Company accounted for its stock-based compensation plan using the recognition and measurement principles of Accounting Principles Board (APB) Opinion No. 25,Accounting for Stock Issued to Employees and related interpretations. The Company accounted for stock options based on the specific terms of the options granted. Options with variable terms, including those options for which the strike price has been adjusted and options issued by the Company with attached dividend equivalent rights, resulted in adjustments to compensation expense to the extent the market price of the common stock changed. No expense was recognized for options with fixed terms.
During the fourth quarter of 2003, the Company adopted the fair value recognition provisions of Statement of Financial Accounting Standards (SFAS) No. 123,Accounting for Stock-Based Compensation. The Company selected the modified
prospective method of adoption described in SFAS No. 148,Accounting for Stock-Based Compensation-Transition and Disclosure. Under this method, the change is retroactive to January 1, 2003 and compensation cost recognized in 2003 is the same as that which would have been recognized had the fair value method of SFAS No. 123 been applied from its original effective date. In accordance with the modified prospective method of adoption, results for prior years have not been restated.
The following table illustrates the effect on net income and earnings per share as if the fair value method had been applied to all outstanding and unvested awards in each period (in thousands, except per share amounts):
| For the Year Ended December 31, | ||||||||||||
| 2004 | 2003 | 2002 | ||||||||||
Net income, as reported | $ | 115,389 | $ | 111,996 | $ | 48,761 | ||||||
Add: Stock-based employee compensation expense included in reported net income, net of related tax effects | 1,810 | 1,310 | 2,473 | |||||||||
Deduct: Total stock-based employee compensation expense determined under fair value based method for all awards, net of related tax effects | (1,810 | ) | (1,310 | ) | (600 | ) | ||||||
Pro forma net income | $ | 115,389 | $ | 111,996 | $ | 50,634 | ||||||
Earnings per share: | ||||||||||||
Basic – as reported | $ | 4.31 | $ | 5.04 | $ | 2.35 | ||||||
Basic – pro forma | $ | 4.31 | $ | 5.04 | $ | 2.44 | ||||||
Diluted – as reported | $ | 4.24 | $ | 4.91 | $ | 2.25 | ||||||
Diluted – pro forma | $ | 4.24 | $ | 4.91 | $ | 2.34 | ||||||
The following table summarizes the weighted average fair value of the granted options, determined using the Black-Scholes option pricing model and the assumptions used in their determination.
| 2004 | 2003 | 2002 | ||||||||||
Weighted average: | ||||||||||||
Fair value, at date of grant | $ | 21.24 | $ | 22.48 | $ | 10.29 | ||||||
Expected life in years | 6 | 7 | 7 | |||||||||
Annual risk-free interest rate | 4.7 | % | 3.3 | % | 4.1 | % | ||||||
Volatility | 0.7 | 2.0 | 2.1 | |||||||||
Dividend yield | 0.0 | % | 0.0 | % | 2.2 | % | ||||||
Income TaxesThe Company is taxed as a Real Estate Investment Trust (REIT) under Section 857 of the Internal Revenue Code of 1986, as amended. As a REIT, the Company generally is not subject to federal income tax. To maintain its qualification as a REIT, the Company must distribute at least 90% of its REIT taxable income to its stockholders and meet certain other tests relating to assets and income. If the Company fails to qualify as a REIT in any taxable year, the Company will be subject to federal income tax on its taxable income at regular corporate rates. The Company may also be subject to certain state and local taxes. Under certain circumstances, even though the Company qualifies as a REIT, federal income and excise taxes may be due on its undistributed taxable income. Because the Company has paid or intends to pay dividends in the amount of its taxable income by the statutorily required due date, no provision for income taxes has been provided in the accompanying financial statements related to the REIT. However, NFI Holding Corporation, a wholly-owned subsidiary, and its subsidiaries have not elected REIT-status and, therefore, are subject to corporate income taxes. Accordingly, a provision for income taxes has been provided for the Company’s non-REIT subsidiaries.
The Company has elected to treat NFI Holding Corporation and its subsidiaries as taxable REIT subsidiaries (collectively the “TRS”). In general, the TRS may hold assets that the Company cannot hold directly and generally may engage in any real estate or non-real estate related business. The subsidiaries comprising the TRS are subject to corporate federal income tax and are taxed as regular C corporations. However, special rules do apply to certain activities between a REIT and a TRS. For example, the TRS will be subject to earnings stripping limitations on the deductibility of interest paid to its REIT. In addition, a REIT will be subject to a 100% excise tax on certain excess amounts to ensure that (i) tenants who pay the TRS for services are charged an arm’s-length amount by the TRS, (ii) fees paid to a REIT by the TRS are reflected at fair market value and (iii) interest paid by the TRS to its REIT is commercially reasonable.
The TRS records deferred tax assets and liabilities for the future tax consequences attributable to differences between the financial statement carrying amounts of existing assets and liabilities and their respective income tax bases. The Company has recorded a valuation allowance as discussed in Note 11. The deferred tax asset is included in other assets on the consolidated balance sheet.
Earnings Per Share (EPS)Basic earnings per share excludes dilution and is computed by dividing net income available to common stockholders by the weighted-average number of common shares outstanding for the period. Diluted earnings per share reflects the potential dilution that could occur if securities or other contracts to issue common stock were exercised or converted into common stock or resulted in the issuance of common stock that then shared in the earnings of the entity. Diluted EPS is calculated assuming all options, performance based awards and warrants on the Company’s common stock have been exercised, unless the exercise would be antidilutive.
Commitments to Originate Mortgage Loans Commitments to originate mortgage loans meet the definition of a derivative and are recorded at fair value and are classified as other liabilities in the Company’s consolidated balance sheets. The Company uses the Black-Scholes option pricing model to determine the value of its commitments. Significant assumptions used in the valuation determination include volatility, strike price, current market price, expiration and one-month LIBOR.
New Accounting PronouncementsIn December 2004, the FASB issued a revision of FASB Statement No. 123,Accounting for Stock-Based Compensation. This Statement establishes standards for the accounting for transactions in which an entity exchanges its equity instruments for goods or services. It also addresses transactions in which an entity incurs liabilities in exchange for goods or services that are based on the fair value of the entity’s equity instruments or that may be settled by the issuance of those equity instruments. This Statement focuses primarily on accounting for transactions in which an entity obtains employee services in share-based payment transactions and does not change the accounting guidance for share-based payment transactions with parties other than employees provided in SFAS No. 123 and Emerging Issues Task Force of the Financial Accounting Standards Board (EITF) Issue No. 96-18,Accounting for Equity Instruments That Are Issued to Other Than Employees for Acquiring, or in Conjunction with Selling, Goods or Services. Entities no longer have the option to use the intrinsic value method of APB 25 that was provided in SFAS 123 as originally issued, which generally resulted in the recognition of no compensation cost. Under SFAS No. 123(R), the cost of employee services received in exchange for an equity award must be based on the grant-date fair value of the award. The cost of the awards under SFAS 123(R) will be recognized over the period an employee provides service, typically the vesting period. No compensation cost is recognized for equity instruments in which the requisite service is not provided. For employee awards that are treated as liabilities, initial cost of the awards will be measured at fair value. The fair value of the liability awards will be remeasured subsequently at each reporting date through the settlement date with changes in fair value during the period an employee provides service recognized as compensation cost over that period. This Statement is effective as of the first interim or annual reporting period that begins after June 15, 2005. As discussed previously in Note 1, the Company implemented the fair value provisions of SFAS No. 123 during 2003. As such, the adoption of this Statement is not anticipated to have a significant impact on the consolidated financial statements.
In March 2004, SEC Staff Accounting Bulletin (SAB) No. 105,Application of Accounting Principles to Loan Commitments was released. This release summarizes the SEC staff position regarding the application of accounting principles generally accepted in the United States of America to loan commitments accounted for as derivative instruments. The Company accounts for interest rate lock commitments issued on mortgage loans that will be held for sale as derivative instruments. Consistent with SAB No. 105, the Company considers the fair value of these commitments to be zero at the commitment date, with subsequent changes in fair value determined solely on changes in market interest rates. As of December 31, 2004, the Company had interest rate lock commitments on mortgage loans with principal balances of $361.2 million, the fair value of which was $(75,000).
At the March 17-18, 2004 EITF meeting, the EITF reached a consensus on Issue No. 03-1,The Meaning of Other-Than-Temporary Impairment and its Application to Certain Investments. Issue 03-1 provides guidance for determining when an investment is other-than-temporarily impaired and disclosure requirements regarding impairments that have not been recognized as other-than-temporary. An impairment exists when the carrying amount of an asset exceeds its fair value and is determined to be other-than-temporary. In September 2004, the FASB delayed the effective date of paragraphs 10-20 of this issue. These paragraphs give guidance on how to evaluate and recognize an impairment loss that is other than temporary. The delay does not suspend the requirements to recognize other than temporary impairments as required by existing authoritative literature. The disclosure requirements were effective for reporting periods beginning after June 15, 2004. Issue 03-1 is not expected to have a significant impact on the consolidated financial statements.
In December 2003, the American Institute of Certified Public Accountants (AICPA) issued Statement of Position (SOP) 03-3,Accounting for Certain Loans or Debt Securities Acquired in a Transfer.This SOP addresses accounting for differences between contractual cash flows and cash flows expected to be collected from an investor’s initial investment in loans or debt securities (loans) acquired in a transfer if those differences are attributable, at least in part, to credit quality. It includes such loans acquired in purchase business combinations and applies to all nongovernmental entities, including not-for-profit organizations. This SOP does not apply to loans originated by the entity, loans acquired in a business combination accounted for at historical cost, mortgage-backed securities in securitization transactions, acquired loans classified as held-for-sale, trading securities and derivatives. This SOP limits the yield that may be accreted to the excess of the investor’s estimate of undiscounted expected
principal, interest, and other cash flows (cash flows expected at acquisition to be collected) over the investor’s initial investment in the loan. This SOP requires that the excess of contractual cash flows over cash flows expected to be collected (nonaccretable difference) not be recognized as an adjustment of yield, loss accrual, or valuation allowance. This SOP prohibits investors from displaying the accretable yield and nonaccretable difference in the balance sheet. Subsequent increases in cash flows expected to be collected generally should be recognized prospectively through adjustment of the loan’s yield over its remaining life. Decreases in cash flows expected to be collected should be recognized as impairment. This SOP prohibits “carrying over” or creation of valuation allowances in the initial accounting of all loans acquired in a transfer that are within the scope of this SOP. The prohibition of the valuation allowance carryover applies to the purchase of an individual loan, a pool of loans, a group of loans, and loans acquired in a purchase business combination. This SOP is effective for loans acquired in fiscal years beginning after December 15, 2004. Early adoption is encouraged. For loans acquired in fiscal years beginning on or before December 15, 2004, this SOP should be applied prospectively for fiscal years beginning after December 15, 2004. SOP 03-3 is not expected to have a significant impact on the consolidated financial statements.
Reclassifications Reclassifications to prior year amounts have been made to conform to current year presentation.
Note 2. Mortgage Loans
Mortgage loans, all of which are secured by residential properties, consisted of the following as of December 31, (in thousands):
| 2004 | 2003 | |||||||
Mortgage loans – held-for-sale: | ||||||||
Outstanding principal | $ | 719,904 | $ | 673,405 | ||||
Net premium | 6,760 | 10,112 | ||||||
| 726,664 | 683,517 | |||||||
Loans under removal of accounts provision | 20,930 | 14,475 | ||||||
Mortgage loans – held-for-sale | $ | 747,594 | $ | 697,992 | ||||
Mortgage loans – held-in-portfolio: | ||||||||
Outstanding principal | $ | 58,859 | $ | 94,162 | ||||
Net unamortized premium | 1,175 | 1,874 | ||||||
Amortized cost | 60,034 | 96,036 | ||||||
Allowance for credit losses | (507 | ) | (1,319 | ) | ||||
Mortgage loans – held-in-portfolio | $ | 59,527 | $ | 94,717 | ||||
Activity in the allowance for credit losses is as follows for the three years ended December 31, (in thousands):
| 2004 | 2003 | 2002 | ||||||||||
Balance, January 1 | $ | 1,319 | $ | 3,036 | $ | 5,557 | ||||||
Credit losses (recoveries) | 726 | (389 | ) | (432 | ) | |||||||
Amounts charged off, net of recoveries | (1,538 | ) | (1,328 | ) | (2,089 | ) | ||||||
Balance, December 31 | $ | 507 | $ | 1,319 | $ | 3,036 | ||||||
The servicing agreements the Company executes for loans it has securitized include a “clean up” call option which gives it the right, not the obligation, to repurchase mortgage loans from the trust. The clean up call option can be exercised when the aggregate principal balance of the mortgage loans has declined to ten percent or less of the original aggregated mortgage loan principal balance. At December 31, 2004, the Company had the right, not the obligation to repurchase $32.8 million of mortgage loans from the NMFT Series 2000-2 securitization trust.
The majority of mortgage loans serve as collateral for borrowing arrangements discussed in Note 7. The weighted-average interest rate on mortgage loans as of December 31, 2004 and 2003 was 7.88% and 7.94%, respectively.
Collateral for 18% and 17% of the mortgage loans outstanding as of December 31, 2004 was located in California and Florida, respectively. The Company has no other significant concentration of credit risk on mortgage loans.
The recorded investment in loans in non-accrual status and in loans past due 90 days or more, but still accruing interest was $2.7 million and $9.8 million as of December 31, 2004, respectively.
Details of loan securitization transactions on the date of the securitization are as follows (in thousands):
Net Bond | Allocated Value of Retained Interests | Principal Balance | Gain | ||||||||||||
| Mortgage Servicing Rights | Subordinated Bond Classes | ||||||||||||||
Year ended December 31, 2004: | |||||||||||||||
NMFT Series 2004-4 | $ | 2,459,875 | $ | 13,628 | $ | 94,911 | $ | 2,500,000 | $ | 21,721 | |||||
NMFT Series 2004-3 | 2,149,260 | 9,520 | 104,901 | 2,199,995 | 40,443 | ||||||||||
NMFT Series 2004-2 | 1,370,021 | 6,244 | 67,468 | 1,399,999 | 8,961 | ||||||||||
NMFT Series 2004-1 | 1,722,282 | 7,987 | 92,059 | 1,750,000 | 64,112 | ||||||||||
NMFT Series 2003-4 (A) | 472,391 | 1,880 | 22,494 | 479,810 | 9,015 | ||||||||||
| $ | 8,173,829 | $ | 39,259 | $ | 381,833 | $ | 8,329,804 | $ | 144,252 | ||||||
Year ended December 31, 2003: | |||||||||||||||
NMFT Series 2003-4 | $ | 1,004,427 | $ | 3,986 | $ | 47,499 | $ | 1,019,922 | $ | 22,035 | |||||
NMFT Series 2003-3 | 1,472,920 | 5,829 | 84,268 | 1,499,374 | 34,544 | ||||||||||
NMFT Series 2003-2 | 1,476,358 | 5,843 | 78,686 | 1,499,998 | 50,109 | ||||||||||
NMFT Series 2003-1 | 1,253,820 | 5,116 | 82,222 | 1,300,141 | 29,614 | ||||||||||
| $ | 5,207,525 | $ | 20,774 | $ | 292,675 | $ | 5,319,435 | $ | 136,302 | ||||||
Year ended December 31, 2002: | |||||||||||||||
NMFT Series 2002-3 | $ | 734,584 | $ | 2,939 | $ | 39,099 | $ | 750,003 | $ | 29,353 | |||||
NMFT Series 2002-2 | 300,304 | 1,173 | 22,021 | 310,000 | 10,459 | ||||||||||
NMFT Series 2002-1 | 485,824 | 1,958 | 29,665 | 499,998 | 8,082 | ||||||||||
| $ | 1,520,712 | $ | 6,070 | $ | 90,785 | $ | 1,560,001 | $ | 47,894 | ||||||
| (A) | On January 14, 2004 NovaStar Mortgage delivered the remaining $479.8 million in loans collateralizing NMFT Series 2003-4. All of the bonds were issued to the third-party investor at the date of initial close, but the Company did not receive the escrowed proceeds related to the final close until January 14, 2004. |
In the securitizations, the Company retains interest-only, prepayment penalty and other subordinated interests in the underlying cash flows and servicing responsibilities. The value of the Company’s retained interests is subject to credit, prepayment, and interest rate risks on the transferred financial assets.
During 2004 and 2003, United States of America government-sponsored enterprises purchased 55% and 70%, respectively, of the bonds sold to the third-party investors in the Company’s securitization transactions. The investors and securitization trusts have no recourse to the Company’s assets for failure of borrowers to pay when due except when defects occur in the loan documentation and underwriting process, either through processing errors made by the Company or through intentional or unintentional misrepresentations made by the borrower or agents during those processes. Refer to Note 8 for further discussion.
Fair value of the subordinated bond classes at the date of securitization is measured by estimating the open market sales price of a similar loan pool. An implied yield (discount rate) is calculated based on the value derived and using projected cash flows generated using key economic assumptions. Key economic assumptions used to project cash flows at the time of loan securitization during the three years ended December 31, 2004 were as follows:
Mortgage Loan Collateral for NovaStar Mortgage Funding Trust Series | Constant Prepayment Rate | Average Life (in Years) | Expected Total Credit Losses, Net of Mortgage Insurance (A) | Discount Rate | |||||||
2004-4 | 35 | % | 2.29 | 4.0 | % | 25 | % | ||||
2004-3 | 34 | 2.44 | 4.5 | 19 | |||||||
2004-2 | 31 | 2.70 | 5.1 | 26 | |||||||
2004-1 | 33 | 2.71 | 5.9 | 20 | |||||||
2003-4 | 30 | 3.06 | 5.1 | 20 | |||||||
2003-3 | 22 | 3.98 | 3.6 | 20 | |||||||
2003-2 | 25 | 3.54 | 2.7 | 28 | |||||||
2003-1 | 28 | 3.35 | 3.3 | 20 | |||||||
2002-3 | 30 | 3.09 | 1.0 | 20 | |||||||
2002-2 | 27 | 3.13 | 1.6 | 25 | |||||||
2002-1 | 32 | 2.60 | 1.7 | 20 |
| (A) | Represents expected credit losses for the life of the securitization up to the expected date in which the related asset-backed bonds can be called. |
Note 3. Mortgage Securities – Available-for-Sale
Available-for-sale mortgage securities consisted of the Company’s investment in the interest-only, prepayment penalty and other subordinated securities that the trust issued. The primary bonds were sold to parties independent of the Company. Management estimates their fair value by discounting the expected future cash flow of the collateral and bonds. The average yield on mortgage securities is the interest income for the year as a percentage of the average fair market value on mortgage securities. The cost basis, unrealized gains and losses, estimated fair value and average yield of mortgage securities as of December 31, 2004 and 2003 were as follows (dollars in thousands):
| Cost Basis | Gross Unrealized | Estimated Fair Value | Average Yield | ||||||||||||
| Gains | Losses | ||||||||||||||
As of December 31, 2004 | $ | 409,946 | $ | 79,229 | $ | — | $ | 489,175 | 31.4 | % | |||||
As of December 31, 2003 | 294,562 | 87,826 | 101 | 382,287 | 34.3 | ||||||||||
The $101,000 gross unrealized loss as of December 31, 2003 was on NMFT Series 1999-1. During 2004, management concluded that the decline in value on this security and other securities in the Company’s mortgage securities portfolio were other-than-temporary. As a result, the Company recognized an impairment on mortgage securities - available-for-sale of $15.9 million in 2004. The impairments were a result of a significant increase in short-term interest rates during the year as well as higher than anticipated prepayments. While the Company uses forward yield curves in valuing mortgage securities, the increase in two-year and three-year swap rates was greater than the forward yield curve had anticipated, thus causing a greater than expected decline in value. Prepayments were higher than expected due to substantial increases in housing prices in the past few years.
The following table is a rollforward of mortgage securities – available-for-sale from January 1, 2003 to December 31, 2004 (in thousands):
| Cost Basis | Net Unrealized Gain | Estimated Fair Value of Mortgage Securities | ||||||||||
As of January 1, 2003 | $ | 102,665 | $ | 76,214 | $ | 178,879 | ||||||
Increases (decreases) to mortgage securities: | ||||||||||||
New securities retained in securitizations | 292,675 | 7,077 | 299,752 | |||||||||
Accretion of income (A) | 78,097 | — | 78,097 | |||||||||
Proceeds from paydowns of securities (A) (B) | (178,875 | ) | — | (178,875 | ) | |||||||
Mark-to-market value adjustment | — | 4,434 | 4,434 | |||||||||
Net increase to mortgage securities | 191,897 | 11,511 | 203,408 | |||||||||
As of December 31, 2003 | 294,562 | 87,725 | 382,287 | |||||||||
Increases (decreases) to mortgage securities: | ||||||||||||
New securities retained in securitizations | 381,833 | 6,637 | 388,470 | |||||||||
Accretion of income (A) | 100,666 | — | 100,666 | |||||||||
Proceeds from paydowns of securities (A)(B) | (351,213 | ) | — | (351,213 | ) | |||||||
Impairment on mortgage securities - available-for-sale | (15,902 | ) | — | (15,902 | ) | |||||||
Mark-to-market value adjustment | — | (15,133 | ) | (15,133 | ) | |||||||
Net increase (decrease) to mortgage securities | 115,384 | (8,496 | ) | 106,888 | ||||||||
As of December 31, 2004 | $ | 409,946 | $ | 79,229 | $ | 489,175 | ||||||
| (A) | Cash received on mortgage securities with no cost basis was $32.2 million for the year ended December 31, 2004 and $20.7 million for the year ended December 31, 2003. |
| (B) | For mortgage securities with a remaining cost basis, the Company reduces the cost basis by the amount of cash that is contractually due from the securitization trusts. In contrast, for mortgage securities in which the cost basis has previously reached zero, the Company records in interest income the amount of cash that is contractually due from the securitization trusts. In both cases, there are instances where the Company may not receive a portion of this cash until after the balance sheet reporting date. Therefore, these amounts are recorded as receivables from the securitization trusts and included in other assets. As of December 31, 2004 and December 31, 2003, the Company had receivables from securitization trusts of $4.0 million and $0.1 million, respectively, related to mortgage securities with a remaining cost basis. Also, the Company had receivables from securitization trusts of $0.7 million related to mortgage securities with a zero cost basis as of December 31, 2004. |
Maturities of mortgage securities owned by the Company depend on repayment characteristics and experience of the underlying financial instruments. The Company expects the securities it owns as of December 31, 2004 to mature in one to five years.
All mortgage securities owned by the Company are pledged for borrowings as discussed in Note 7.
During 2004 and 2003, the Company securitized the interest-only, prepayment penalty and subordinated securities of various securitizations and issued NovaStar Net Interest Margin Certificates (NIMs). These resecuritizations were accounted for as secured borrowings. In accordance with SFAS No. 140,Accounting for Transfers and Servicing of Financial Assets and Extinguishments of Liabilities, control over the transferred assets was not surrendered and thus the transactions were recorded as financings for the mortgage securities. The detail of these transactions is shown in Note 7.
As of December 31, 2004, key economic assumptions and the sensitivity of the current fair value of retained interests owned by the Company to immediate adverse changes in those assumptions are as follows, on average for the portfolio (dollars in thousands):
Carrying amount/fair value of retained interests | $ | 489,175 | |
Weighted average life (in years) | 1.8 | ||
Weighted average prepayment speed assumption (CPR) | 39 | ||
Fair value after a 10% increase | $ | 479,571 | |
Fair value after a 25% increase | $ | 478,020 | |
Weighted average expected annual credit losses (percent of current collateral balance) | 3.3 | ||
Fair value after a 10% increase | $ | 467,837 | |
Fair value after a 25% increase | $ | 440,032 | |
Weighted average residual cash flows discount rate (percent) | 22 | ||
Fair value after a 500 basis point increase | $ | 464,423 | |
Fair value after a 1000 basis point increase | $ | 442,335 | |
Market interest rates | |||
Fair value after a 100 basis point increase | $ | 456,057 | |
Fair value after a 200 basis point increase | $ | 422,580 | |
These sensitivities are hypothetical and should be used with caution. As the analysis indicates, changes in fair value based on a 10% variation in assumptions generally cannot be extrapolated because the relationship of the change in assumption to the change in fair value may not be linear. Also, in this table the effect of a variation in a particular assumption on the fair value of the retained interest is calculated without changing any other assumption; in reality, changes in one factor may result in changes in another (for example, increases in market interest rates may result in lower prepayments and increased credit losses), which might magnify or counteract the sensitivities.
The actual static pool credit loss as of December 31, 2004 was 0.21% and the cumulative projected static pool credit loss for the remaining life of the securities is 2.49%. Static pool losses are calculated by summing the actual and projected future credit losses and dividing them by the original balance of each pool of assets.
The table below presents quantitative information about delinquencies, net credit losses, and components of securitized financial assets and other assets managed together with them (in thousands):
| December 31, | ||||||||||||||||||||
Total Principal Amount of Loans (A) | Principal Amount of Loans 30 Days or More Past Due | Net Credit Losses During the Year Ended December 31, | ||||||||||||||||||
| 2004 | 2003 | 2004 | 2003 | 2004 | 2003 | |||||||||||||||
Loans securitized (C) | $ | 11,350,311 | $ | 6,428,364 | $ | 324,333 | $ | 201,774 | $ | 21,535 | $ | 7,700 | ||||||||
Loans held-for-sale | 720,035 | 674,031 | 3,383 | 3,125 | 1,097 | 498 | ||||||||||||||
Loans held-in-portfolio | 59,836 | 96,729 | 10,174 | 15,313 | 2,490 | (B) | 4,402 | (B) | ||||||||||||
| �� | ||||||||||||||||||||
Total loans managed or securitized | $ | 12,130,182 | $ | 7,199,124 | $ | 337,890 | $ | 220,212 | $ | 25,122 | $ | 12,600 | ||||||||
| (A) | Includes assets acquired through foreclosure. |
| (B) | Excludes mortgage insurance proceeds on policies paid by the Company and includes interest accrued on loans 90 days or more past due for which the Company had discontinued interest accrual. |
| (C) | Loans under removal of accounts provision have not been repurchased from the securitization trusts, therefore, they are included in loans securitized. |
Note 4. Mortgage Securities - Trading
As of December 31, 2004, mortgage securities - trading consisted of an adjustable-rate mortgage-backed security with a fair market value of $143.2 million. For the year ended December 31, 2004, the Company recorded no gains or losses related to the security. As of December 31, 2004, the Company had pledged the security as collateral for financing purposes.
Note 5. Mortgage Servicing Rights
The Company records mortgage servicing rights arising from the transfer of loans to the securitization trusts. The following schedule summarizes the carrying value of mortgage servicing rights and the activity during 2004, 2003 and 2002 (in thousands):
| 2004 | 2003 | 2002 | ||||||||||
Balance, January 1 | $ | 19,685 | $ | 7,906 | $ | 6,445 | ||||||
Amount capitalized in connection with transfer of loans to securitization trusts | 39,259 | 20,774 | 6,070 | |||||||||
Amortization | (16,934 | ) | (8,995 | ) | (4,609 | ) | ||||||
Balance, December 31 | $ | 42,010 | $ | 19,685 | $ | 7,906 | ||||||
The estimated fair value of the servicing rights aggregated $58.6 million and $33.8 million at December 31, 2004 and December 31, 2003, respectively. The fair value is estimated by discounting estimated future cash flows from the servicing assets using discount rates that approximate current market rates. The fair value as of December 31, 2004 was determined utilizing a 15% discount rate, credit losses net of mortgage insurance (as a percent of current principal balance) of 3.3% and an annual prepayment rate of 39%. The fair value as of December 31, 2003 was determined utilizing a 15% discount rate, credit losses net of mortgage insurance (as a percent of current principal balance) of 2.8% and an annual prepayment rate of 26%. There was no allowance for the impairment of mortgage servicing rights as of December 31, 2004, 2003 and 2002.
Mortgage servicing rights are amortized in proportion to and over the estimated period of net servicing income. The estimated amortization expense for 2005, 2006, 2007, 2008, 2009 and thereafter is $16.4 million, $8.7 million, $4.7 million, $3.1 million, $2.2 million and $6.9 million, respectively.
The Company receives annual servicing fees approximating 0.50% of the outstanding balance and rights to future cash flows arising after the investors in the securitization trusts have received the return for which they contracted. Servicing fees received from the securitization trusts were $41.5 million, $21.1 million and $10.0 million for the years ended December 31, 2004, 2003 and 2002, respectively.
The Company holds, as custodian, principal and interest collected from borrowers on behalf of the securitization trusts, as well as, funds collected from borrowers to ensure timely payment of hazard and primary mortgage insurance and property taxes related to the properties securing the loans. These funds are not owned by the Company and are held in trust. The Company held, as custodian, $471.5 million and $188.8 million at December 31, 2004 and 2003, respectively.
Note 6. Property and Equipment, Net
Property and equipment consisted of the following at December 31, (in thousands):
| 2004 | 2003 | |||||
Office and computer equipment | $ | 18,957 | $ | 13,617 | ||
Furniture and fixtures | 8,406 | 7,209 | ||||
Leasehold improvements | 3,423 | 3,048 | ||||
| 30,786 | 23,874 | |||||
Less accumulated depreciation | 15,310 | 9,337 | ||||
Property and equipment, net | $ | 15,476 | $ | 14,537 | ||
Depreciation expense for the years ended December 31, 2004, 2003 and 2002 was $6.1 million, $3.9 million and $1.2 million, respectively.
Note 7. Borrowings
Short-term Borrowings The following tables summarize the Company’s repurchase agreements as of December 31, 2004 and 2003 (dollars in thousands):
| Maximum Borrowing Capacity | Rate | Days to Reset | Balance | Average Balance Year | Weighted Average Interest Rate During the Year | Maximum Amount Outstanding During the Year | ||||||||||||||
December 31, 2004 | ||||||||||||||||||||
Short-term borrowings (indexed to one-month LIBOR): | ||||||||||||||||||||
Repurchase agreement expiring November 15, 2005 | $ | 1,000,000 | 3.39 | % | 1 | $ | 488,089 | |||||||||||||
Repurchase agreement expiring March 30, 2005 | 800,000 | 3.25 | 11 | 128,107 | ||||||||||||||||
Repurchase agreement expiring October 7, 2005 | 800,000 | 3.30 | 25 | 104,693 | ||||||||||||||||
Repurchase agreement expiring June 30, 2005 | 750,000 | 2.88 | 1 | 36,113 | ||||||||||||||||
Repurchase agreement expiring April 30, 2005 | 300,000 | 2.93 | 25 | 8,643 | ||||||||||||||||
Repurchase agreement expiring August 26, 2005 | 100,000 | 3.90 | 12 | 3,971 | ||||||||||||||||
Repurchase agreement, expiring January 24, 2005 | 135,912 | 2.47 | 24 | 135,912 | ||||||||||||||||
Total short-term borrowings | $ | 3,885,912 | $ | 905,528 | $ | 1,226,313 | 2.96 | % | $ | 2,587,112 | ||||||||||
December 31, 2003 | ||||||||||||||||||||
Short-term borrowings (indexed to one-month LIBOR): | ||||||||||||||||||||
Repurchase agreement expiring March 31, 2004 | $ | 600,000 | 2.91 | % | 22 | $ | 100,161 | |||||||||||||
Repurchase agreement expiring June 5, 2004 | 600,000 | 1.87 | 16 | 431,515 | ||||||||||||||||
Repurchase agreement expiring April 30, 2004 | 300,000 | 1.64 | 26 | 28,179 | ||||||||||||||||
Repurchase agreement expiring September 8, 2004 | 500,000 | — | — | — | ||||||||||||||||
Repurchase agreement expiring May 22, 2004 | 300,000 | 2.25 | 15 | 214,899 | ||||||||||||||||
Repurchase agreement expiring October 23, 2004 | 575,000 | 2.17 | 15 | 97,782 | ||||||||||||||||
Total short-term borrowings | $ | 2,875,000 | $ | 872,536 | $ | 915,689 | 2.57 | % | $ | 1,574,156 | ||||||||||
The Company’s mortgage loans and securities are pledged as collateral on borrowings. All short-term financing arrangements require the Company to maintain minimum tangible net worth, meet a minimum equity ratio test and comply with other customary debt covenants. Management believes the Company is in compliance with all debt covenants.
Repurchase agreements generally contain margin calls under which a portion of the borrowings must be repaid if the fair value of the mortgage securities – available-for-sale or mortgage loans collateralizing the repurchase agreements falls below a contractual ratio to the borrowings outstanding.
Asset-backed Bonds (ABB) The Company issued ABB secured by its mortgage loans as a means for long-term financing. For financial reporting and tax purposes, the mortgage loans held-in-portfolio as collateral are recorded as assets of the Company and the ABB are recorded as debt. Interest and principal on each ABB is payable only from principal and interest on the underlying mortgage loans collateralizing the ABB. Interest rates reset monthly and are indexed to one-month LIBOR. The estimated weighted-average months to maturity is based on estimates and assumptions made by management. The actual maturity may differ from expectations. However, the Company retains the option to repay the ABB, and reacquire the mortgage loans, when the remaining unpaid principal balance of the underlying mortgage loans falls below 35% of their original amounts for issue 1997-1 and 25% on 1997-2, 1998-1 and 1998-2.
The Company issued NIMs secured by its mortgage securities available-for-sale as a means for long-term financing. For financial reporting and tax purposes, the mortgage securities available-for-sale collateral are recorded as assets of the Company and the ABB are recorded as debt. The performance of the mortgage loan collateral underlying these securities, as presented in Note 2 directly affects the performance of these bonds. The estimated weighted average months to maturity are based on estimates and assumptions made by management. The actual maturity may differ from expectations. The following table summarized the NIMs transactions for the years ending December 31, 2004 and 2003 (dollars in thousands):
Date Issued | Bonds Issued | Interest Rate | Collateral (NMFT Series) (A) | |||||||
Year ended December 31, 2004: | ||||||||||
Issue 2004-N1 | February 19, 2004 | $ | 156,600 | 4.46 | % | 2003-3 and 2003-4 | ||||
Issue 2004-N2 | July 23, 2004 | 157,500 | 4.46 | 2004-1 and 2004-2 | ||||||
Issue 2004-N3 | December 21, 2004 | 201,000 | 3.97 | 2004-3 and 2004-4 | ||||||
Year ended December 31, 2003: | ||||||||||
Issue 2003-N1 | July 2, 2003 | 54,000 | 7.39 | 2003-2 | ||||||
| (A) | The NIMs transactions are secured by the interest-only, prepayment penalty and subordinated securities of the respective mortgage securities – available-for-sale. |
Following is a summary of outstanding ABB and related loans (dollars in thousands):
| Asset-backed Bonds | Mortgage Loans | ||||||||||||||||
| Remaining Principal | Interest Rate | Remaining Principal (A) | Weighted Average Coupon | Estimated Weighted to Call | |||||||||||||
As of December 31, 2004: | |||||||||||||||||
NovaStar Home Equity Series: | |||||||||||||||||
Collateralizing Mortgage Loans: | |||||||||||||||||
Issue 1997-1 | $ | 5,508 | 2.69 | % | $ | 6,939 | 10.36 | % | — | ||||||||
Issue 1997-2 | 8,333 | 2.69 | 9,414 | 10.29 | — | ||||||||||||
Issue 1998-1 | 13,827 | 2.58 | 16,152 | 9.95 | — | ||||||||||||
Issue 1998-2 | 25,785 | 2.59 | 27,331 | 9.76 | — | ||||||||||||
| $ | 53,453 | $ | 59,836 | ||||||||||||||
Collateralizing Mortgage Securities – Available-for-Sale: | |||||||||||||||||
Issue 2003-N1 | $ | 5,825 | 7.39 | %(C) | (C | ) | (C | ) | (C | ) | |||||||
Issue 2004-N1 | 48,830 | 4.46 | (D) | (D | ) | (D | ) | (D | ) | ||||||||
Issue 2004-N2 | 93,586 | 4.46 | (E) | (E | ) | (E | ) | (E | ) | ||||||||
Issue 2004-N3 | 193,093 | 3.97 | (F) | (F | ) | (F | ) | (F | ) | ||||||||
Unamortized debt issuance costs, net | (4,893 | ) | |||||||||||||||
| $ | 336,441 | ||||||||||||||||
As of December 31, 2003: | |||||||||||||||||
NovaStar Home Equity Series: | |||||||||||||||||
Collateralizing Mortgage Loans: | |||||||||||||||||
Issue 1997-1 | $ | 10,249 | 1.63 | % | $ | 11,721 | 10.17 | % | — | ||||||||
Issue 1997-2 | 13,177 | 1.63 | 14,629 | 10.51 | — | ||||||||||||
Issue 1998-1 | 24,337 | 1.54 | 27,118 | 9.94 | — | ||||||||||||
Issue 1998-2 | 41,621 | 1.55 | 43,261 | 9.87 | — | ||||||||||||
| $ | 89,384 | $ | 96,729 | ||||||||||||||
Collateralizing Mortgage Securities - Available-for-Sale: | |||||||||||||||||
Issue 2002-C1 | $ | 7,070 | 7.15 | %(B) | (B | ) | (B | ) | (B | ) | |||||||
Issue 2003-N1 | 38,100 | 7.39 | (C) | (C | ) | (C | ) | (C | ) | ||||||||
Unamortized debt issuance costs, net | (1,574 | ) | |||||||||||||||
| $ | 43,596 | ||||||||||||||||
| (A) | Includes assets acquired through foreclosure. |
| (B) | Collateral for the 2002-C1 asset backed bond is the AAA-IO and prepayment penalty mortgage securities of NMFT 2001-1 and NMFT 2001-2. |
| (C) | Collateral for the 2003-N1 asset backed bond is the interest-only, prepayment penalty and subordinated mortgage securities of NMFT 2003-2. |
| (D) | Collateral for the 2004-N1 asset backed bond is the interest-only, prepayment penalty and subordinated mortgage securities of NMFT 2003-3 and NMFT 2003-4. |
| (E) | Collateral for the 2004-N2 asset backed bond is the interest-only, prepayment penalty and subordinated mortgage securities of NMFT 2004-1 and NMFT 2004-2. |
| (F) | Collateral for the 2004-N3 asset backed bond is the interest-only, prepayment penalty and subordinated mortgage securities of NMFT 2004-3 and NMFT 2004-4. |
The following table summarizes the expected repayment requirements relating to the securitization bond financing at December 31, 2004. Amounts listed as bond payments are based on anticipated receipts of principal and interest on underlying mortgage loan collateral using expected prepayment speeds (in thousands):
| Asset-backed Bonds | |||
2005 | $ | 283,058 | |
2006 | 82,503 | ||
2007 | 15,665 | ||
2008 | 5,649 | ||
2009 | 4,505 | ||
Thereafter | 3,407 | ||
In connection with the lending agreement with UBS Warburg Real Estate Securities, Inc. (UBS), NovaStar Mortgage SPV I (NovaStar Trust), a Delaware statutory trust, has been established by NovaStar Mortgage, Inc. (NMI) as a wholly owned special-purpose warehouse finance subsidiary whose assets and liabilities are included in the Company’s consolidated financial statements.
NovaStar Trust has agreed to issue and sell to UBS mortgage notes (the “Notes”). Under the legal agreements which document the issuance and sale of the Notes:
| 1) | any cash portion of the purchase price paid from time to time by NovaStar Trust in consideration of Mortgage Loans sold to NovaStar Trust by NMI; and |
| 2) | the value of NMI’s net equity investment in NovaStar Trust. |
As of December 31, 2004, NovaStar Trust had the following assets:
| 1) | whole loans: $488.9 million |
| 2) | real estate owned properties: $0, and |
| 3) | cash and cash equivalents: $1.3 million. |
As of December 31, 2004, NovaStar Trust had the following liabilities and equity:
| 1) | short-term debt due to UBS: $488.1 million, and |
| 2) | $2.1 million in members’ equity investment. |
Note 8. Commitments and Contingencies
Commitments The Company has commitments to borrowers to fund residential mortgage loans as well as commitments to purchase and sell mortgage loans to third parties. At December 31, 2004, the Company had outstanding commitments to originate loans of $361.2 million. The Company had no commitments to purchase and sell loans at December 31, 2004. At December 31, 2003, the Company had outstanding commitments to originate, purchase and sell loans of $228 million, $60 million and $0, respectively. The commitments to originate and purchase loans do not necessarily represent future cash requirements, as some portion of the commitments are likely to expire without being drawn upon or may be subsequently declined for credit or other reasons.
The Company leases office space under various operating lease agreements. Rent expense for 2004, 2003 and 2002, aggregated $15.9 million, $7.5 million and $2.4 million, respectively. At December 31, 2004, future minimum lease commitments under those leases are as follows (in thousands):
Lease Obligations | |||
2005 | $ | 8,540 | |
2006 | 8,344 | ||
2007 | 8,127 | ||
2008 | 8,030 | ||
2009 | 8,022 | ||
Thereafter | 7,902 | ||
The Company has entered into various lease agreements in which the lessor agreed to repay the Company for certain existing lease obligations. The Company received approximately $61,000, $2.3 million and $62,000 related to these agreements in 2004, 2003 and 2002, respectively. These agreements expired in 2004.
The Company has also entered into various sublease agreements for office space formerly occupied by the Company. The Company received approximately $1.2 million, $537,000 and $704,000 in 2004, 2003 and 2002, respectively under these agreements. These agreements expired in 2004.
In the ordinary course of business, the Company sells loans with recourse for borrower defaults. For loans that have been sold with recourse and are no longer on the Company’s balance sheet, the recourse component is considered a guarantee. The Company sold no loans with recourse for borrower defaults in 2004, compared to $151.2 million in 2003. The Company’s reserve related to these guarantees totaled $45,000 and $41,000 as of December 31, 2004 and 2003, respectively.
In the ordinary course of business, the Company sells loans with recourse where a defect occurred in the loan origination process and guarantees to cover investor losses should origination defects occur. Defects may occur in the loan documentation and underwriting process, either through processing errors made by the Company or through intentional or unintentional misrepresentations made by the borrower or agents during those processes. If a defect is identified, the Company is required to repurchase the loan. As of December 31, 2004 and 2003, the Company had loans sold with recourse with an outstanding principal balance of $11.4 billion and $6.4 billion, respectively. Repurchases of loans where a defect has occurred have been insignificant.
Contingencies Since April 2004, a number of substantially similar class action lawsuits have been filed and consolidated into a single action in United States District Court for the Western District of Missouri. The consolidated complaint names as defendants the Company and three of its executive officers and generally alleges that the defendants made public statements that were misleading for failing to disclose certain regulatory and licensing matters. The plaintiffs purport to have brought this consolidated action on behalf of all persons who purchased the Company’s common stock (and sellers of put options on the Company’s stock) during the period October 29, 2003 through April 8, 2004. The Company believes that these claims are without merit and intends to vigorously defend against them.
In the wake of the securities class action, the Company has also been named as a nominal defendant in several derivative actions brought against certain of the Company’s officers and directors in Missouri and Maryland. The complaints in these actions generally claim that the defendants are liable to the Company for failing to monitor corporate affairs so as to ensure compliance with applicable state licensing and regulatory requirements.
In July 2004, an employee of NHMI filed a class and collective action lawsuit against NHMI and NMI in the California superior Court for the County of Los Angeles. Subsequently, NHMI and NMI removed the matter to the United States District court for the Central District of California. The plaintiff brought this class and collective action on behalf of herself and all past and present employees of NHMI and NMI who were employed since May 1, 2000 in the capacity generally described as Loan Officer. The plaintiff alleged that NHMI and NMI failed to pay her and the members of the class she purported to represent overtime premium and minimum wage as required by the Fair Labor Standards Act and California state laws for the period commencing May 1, 2000. In January 2005, the plaintiff and NHMI agreed upon a nationwide settlement in the nominal amount of $3.1 million on behalf of a class of all NHMI Loan Officers nationwide. The settlement, which is subject to court approval, covers all minimum wage and overtime claims going back to July 30, 2001, and includes the dismissal with prejudice of the claims against NMI. Since not all class members will elect to be part of the settlement, the Company estimated the probable obligation related to the settlement to be in a range of $1.3 million to $1.7 million. In accordance with SFAS No. 5,Accounting for Contingencies, the Company recorded a charge to earnings of $1.3 million in 2004.
In addition to those matters listed above, the Company is currently party to various other legal proceedings and claims. While management, including internal counsel, currently believes that the ultimate outcome of these proceedings and claims, individually and in the aggregate, will not have a material adverse effect on the Company’s financial condition or results of operations, litigation is subject to inherent uncertainties. If an unfavorable ruling were to occur, there exists the possibility of a material adverse impact on the results of operations for the period in which the ruling occurs.
In April 2004, the Company also received notice of an informal inquiry from the Securities & Exchange Commission requesting that it provide various documents relating to its business. The Company has been cooperating fully with the Commission’s inquiry.
Note 9. Stockholders’ Equity
In November 2004, the Company completed a public offering of 1,725,000 shares of its common stock at $42.50 per share. The Company raised $70.1 million in net proceeds from this offering.
In the first quarter of 2004, the Company sold 2,990,000 shares of Series C Cumulative Redeemable Perpetual Preferred Stock, raising $72.1 million in net proceeds. The shares have a liquidation value of $25.00 per share and pay an annual coupon of 8.90% and are not convertible into any other securities. The Company may, at its option, redeem the preferred stock, in the aggregate or in part, at any time on or after January 22, 2009. As such, this stock is not considered mandatorily or contingently redeemable under the provisions of SFAS 150,Accounting for Certain Financial Instruments with Characteristics of both Liabilities and Equity and is therefore classified as a component of equity.
On May 21, 2003, the Company completed a public offering of 1,207,500 shares of its common stock at $22.13 per share. The Company raised $25.2 million in net proceeds from this offering. The Company completed another public offering of 1,403,000 shares of its common stock at $38.50 per share on November 7, 2003, resulting in $51.7 million in net proceeds.
On May 2, 2003, the Company established a direct stock purchase and dividend reinvestment plan. The Plan allows for the purchase of stock directly from the Company and/or the automatic reinvestment of all or a percentage of the dividends shareholders receive. The Plan allows for a discount from market of up to 3%. The Company sold 1,104,488 shares of its common stock during 2004 at a weighted average discount of 1.4%. Net proceeds of $51.2 million were raised under these sales of common stock. Under the Plan, the Company sold 578,120 shares of its common stock during 2003 at a weighted average discount of 1.9%. Net proceeds of $17.0 million were raised under these sales of common stock.
The Board of Directors declared a two-for-one split of its common stock, providing shareholders of record as of November 17, 2003, with one additional share of common stock for each share owned. The additional shares resulting from the split were issued on December 1, 2003 increasing the number of common shares outstanding to 24.1 million. Share amounts and earnings per share disclosures for 2002 have been restated to reflect the stock split.
The Company’s Board of Directors has approved the purchase of up to $9 million of the Company’s common stock. No shares were purchased during the three years ended December 31, 2004. Under Maryland law, shares purchased under this plan are to be returned to the Company’s authorized but unissued shares of common stock. Common stock purchased under this plan is charged against additional paid-in capital.
In connection with various regulatory lending requirements, certain wholly-owned subsidiaries of the Company are required to maintain minimum levels of net worth. At December 31, 2004, the highest minimum net worth requirement applicable to each subsidiary was $250,000. The wholly-owned subsidiaries were in compliance with these requirements as of December 31, 2004.
The following is a rollforward of accumulated other comprehensive income for the three years ended December 31, 2004 (in thousands):
Available- for-Sale | Derivative Used in Cash Flow | Total | ||||||||||
Balance, January 1, 2002 | $ | 16,990 | $ | (7,813 | ) | $ | 9,177 | |||||
Change in unrealized gain (loss), net of related tax effects | 55,649 | (11,492 | ) | 44,157 | ||||||||
Net settlements reclassified to earnings | — | 9,704 | 9,704 | |||||||||
Other amortization | — | (103 | ) | (103 | ) | |||||||
Other comprehensive income (loss) | 55,649 | (1,891 | ) | 53,758 | ||||||||
Balance, December 31, 2002 | 72,639 | (9,704 | ) | 62,935 | ||||||||
Change in unrealized gain (loss), net of related tax effects | 15,086 | (1,038 | ) | 14,048 | ||||||||
Net settlements reclassified to earnings | — | 8,303 | 8,303 | |||||||||
Other amortization | — | (103 | ) | (103 | ) | |||||||
Other comprehensive income | 15,086 | 7,162 | 22,248 | |||||||||
Balance, December 31, 2003 | 87,725 | (2,542 | ) | 85,183 | ||||||||
Change in unrealized (loss), net of related tax effects | (24,398 | ) | (38 | ) | (24,436 | ) | ||||||
Impairment reclassified to earnings | 15,902 | — | 15,902 | |||||||||
Net settlements reclassified to earnings | — | 2,497 | 2,497 | |||||||||
Other amortization | — | (26 | ) | (26 | ) | |||||||
Other comprehensive income (loss) | (8,496 | ) | 2,433 | (6,063 | ) | |||||||
Balance, December 31, 2004 | $ | 79,229 | $ | (109 | ) | $ | 79,120 | |||||
Note 10. Derivative Instruments and Hedging Activities
The Company’s Form 10-K Annual Reportobjective and strategy for using derivative instruments is to mitigate the risk of increased costs on its variable rate liabilities during a period of rising rates. The Company’s primary goals for managing interest rate risk are to maintain the net interest margin between its assets and liabilities and diminish the effect of changes in general interest rate levels on the market value of the Company.
The derivative instruments used by the Company to manage this risk are interest rate caps and interest rate swaps. Interest rate caps are contracts in which the Company pays either an upfront premium or monthly or quarterly premium to a counterparty. In return, the Company receives payments from the counterparty when interest rates rise above a certain rate specified in the contract. During 2004, 2003 and 2002, premiums paid related to interest rate cap agreements aggregated $1.6 million, $7.4 million and $3.9 million, respectively. When premiums are financed by the Company, a liability is recorded for the Fiscalpremium obligation. Premiums due to counterparties as of December 31, 2004 and 2003 were $1.9 million and $3.5 million, respectively, and bear a weighted average interest rate of 1.9% in 2004 and 2003. The future contractual maturities of premiums due to counterparties as of December 31, 2004 are $1.4 million and $0.5 million due in 2005 and 2006, respectively. The interest rate swap agreements to which the Company is party stipulate that the Company pay a fixed rate of interest to the counterparty and the counterparty pays the company a variable rate of interest based on the notional amount of the contract. The liabilities the Company hedges are asset-backed bonds and borrowings under its mortgage loan and mortgage security repurchase agreements as discussed in Note 7.
All of the Company’s derivative instruments that meet the hedge accounting criteria of SFAS No. 133 are considered cash flow hedges. During the three years ended December 31, 2004, there was no hedge ineffectiveness. The Company also has derivative instruments that do not meet the requirements for hedge accounting. However, these instruments also contribute to the Company’s overall risk management strategy by serving to reduce interest rate risk on average short-term borrowings used to fund loans held-for-sale. The following tables present derivative instruments as of December 31, 2004 and 2003 (dollars in thousands):
Maximum Days to Maturity As of December 31, 2004: Cash flow hedge derivative instruments Non-hedge derivative instruments Total derivative instruments As of December 31, 2003: Cash flow hedge derivative instruments Non-hedge derivative instruments Total derivative instruments Notional
Amount Fair
Value $ 35,000 $ (179 ) 84 1,965,000 12,141 1,089 $ 2,000,000 $ 11,962 $ 250,000 $ (3,224 ) 450 2,085,144 1,255 1,090 $ 2,335,144 $ (1,969 )
The Company recognized $3.1 million, $9.4 million and $10.3 million during the three years ended December 31, 2004, 2003 and 2002, respectively, in net expense on derivative instruments qualifying as cash flow hedges, which is recorded as a component of interest expense.
The net amount included in other comprehensive income expected to be reclassified into earnings within the next twelve months is a charge to earnings of approximately $179,000 ($109,000, net of income tax benefit).
The derivative financial instruments we use also subject us to “margin call” risk. The Company’s deposits with derivative counterparties were $6.7 million and $20.9 million as of December 31, 2004 and 2003, respectively.
The Company’s derivative instruments involve, to varying degrees, elements of credit and market risk in addition to the amount recognized in the consolidated financial statements.
Credit RiskThe Company’s exposure to credit risk on derivative instruments is limited to the cost of replacing contracts should the counterparty fail. The Company seeks to minimize credit risk through the use of credit approval and review processes, the selection of only the most creditworthy counterparties, continuing review and monitoring of all counterparties, exposure reduction techniques and thorough legal scrutiny of agreements. Before engaging in negotiated derivative transactions with any counterparty, the Company has in place fully executed written agreements. Agreements with counterparties also call for full two-way netting of payments. Under these agreements, on each payment exchange date all gains and losses of counterparties are netted into a single amount, limiting exposure to the counterparty to any net receivable amount due.
Market RiskThe potential for financial loss due to adverse changes in market interest rates is a function of the sensitivity of each position to changes in interest rates, the degree to which each position can affect future earnings under adverse market conditions, the source and nature of funding for the position, and the net effect due to offsetting positions. The derivative instruments utilized leave the Company in a market position that is designed to be a better position than if the derivative instrument had not been used in interest rate risk management.
Other Risk ConsiderationsThe Company is cognizant of the risks involved with derivative instruments and has policies and procedures in place to mitigate risk associated with the use of derivative instruments in ways appropriate to its business activities, considering its risk profile as a limited end-user.
Note 11. Income Taxes
The components of income tax expense (benefit) attributable to continuing operations for the years ended December 31, 2004, 2003 and 2002 were as follows (in thousands):
| For the Year Ended December 31, | ||||||||||||
| 2004 | 2003 | 2002 | ||||||||||
Current: | ||||||||||||
Federal | $ | 6,078 | $ | 24,181 | $ | 2,303 | ||||||
State and local | 620 | 4,527 | 318 | |||||||||
Total current | 6,698 | 28,708 | 2,621 | |||||||||
Deferred: (A) | ||||||||||||
Federal | (1,258 | ) | (4,926 | ) | (4,088 | ) | ||||||
State and local | (64 | ) | (922 | ) | (564 | ) | ||||||
Total deferred | (1,322 | ) | (5,848 | ) | (4,652 | ) | ||||||
Total income tax expense (benefit) | $ | 5,376 | $ | 22,860 | $ | (2,031 | ) | |||||
| (A) | Does not reflect the deferred tax effects of unrealized gains and losses on derivative financial instruments that are included in stockholders’ equity. As a result of these tax effects, stockholders’ equity decreased by $587,000 and $779,000 in 2004 and 2003, respectively. |
A reconciliation of the expected federal income tax expense using the federal statutory tax rate of 35 percent to the taxable REIT subsidiary’s actual income tax expense and resulting effective tax rate from continuing operations for the years ended December 31, 2004, 2003 and 2002 were as follows (in thousands):
| For the Year Ended December 31, | |||||||||||
| 2004 | 2003 | 2002 | |||||||||
Income tax at statutory rate (taxable REIT subsidiary) | $ | 4,200 | $ | 18,102 | $ | (3,755 | ) | ||||
Taxable gain on security sale to REIT | 1,342 | 2,761 | 805 | ||||||||
State income taxes, net of federal tax benefit | 362 | 1,549 | (442 | ) | |||||||
Nondeductible expenses | 240 | 228 | 117 | ||||||||
Reduction of estimated income tax accruals | (904 | ) | — | — | |||||||
Other | 136 | 220 | 1,244 | ||||||||
Total income tax expense (benefit) | $ | 5,376 | $ | 22,860 | $ | (2,031 | ) | ||||
Significant components of the taxable REIT subsidiary’s deferred tax assets and liabilities at December 31, 2004 and 2003 were as follows (in thousands):
| December 31, | ||||||||
| 2004 | 2003 | |||||||
Deferred tax assets: | ||||||||
Excess inclusion income | $ | 18,449 | $ | 10,242 | ||||
Deferred compensation | 5,158 | 2,319 | ||||||
Deferred lease incentive income | 1,026 | — | ||||||
Deferred loan fees, net | 548 | — | ||||||
Mark-to-market adjustment on held-for-sale loans | 4,871 | 7,724 | ||||||
State net operating loss carryforwards | 2,353 | 1,470 | ||||||
Accrued expenses for branch closings | 743 | 87 | ||||||
Accrued expenses, other | 666 | 630 | ||||||
Allowance for losses on loans and other real estate | 552 | 142 | ||||||
Other | 427 | 671 | ||||||
Gross deferred tax asset | 34,793 | 23,285 | ||||||
Valuation allowance | (2,353 | ) | (1,470 | ) | ||||
Deferred tax asset | 32,440 | 21,815 | ||||||
Deferred tax liabilities: | ||||||||
Mortgage servicing rights | 16,199 | 7,677 | ||||||
Mark-to-market adjustment on derivative instruments | 2,706 | — | ||||||
Premises and equipment | 2,119 | 2,319 | ||||||
Other | 226 | 1,364 | ||||||
Deferred tax liability | 21,250 | 11,360 | ||||||
Net deferred tax asset | $ | 11,190 | $ | 10,455 | ||||
The valuation allowance included in the taxable REIT subsidiary’s deferred tax assets at December 31, 2004 and 2003 represent state net operating loss carryforwards for which it is more likely than not that realization will not occur. The state net operating losses will expire in varying amounts through 2024. The $0.9 million increase in the valuation allowance for deferred tax assets resulted from state net operating losses being generated by the taxable REIT subsidiary in 2004 where realization is not expected to occur.
Note 12. Employee Benefit Plans
The NovaStar Financial, Inc. 401(k) Plan (the Plan) is a defined contribution plan which allows eligible employees to save for retirement through pretax contributions. Under the Plan, employees of the Company may contribute up to the statutory limit. The Company may elect to match a certain percentage of participants’ contributions. The Company may also elect to make a discretionary contribution, which is allocated to participants based on each participant’s compensation. Contributions to the Plan by the Company for the years ended December 31, 2004, 2003 and 2002 were $3.1 million, $2.0 million and $806,000, respectively.
The Company’s Deferred Compensation Plan (the DCP) is a nonqualified deferred compensation plan that benefits certain designated key members of management and highly compensated employees and allows them to defer payment of a portion of their compensation to future years. Under the DCP, an employee may defer up to 50% of his or her base salary, bonus and/or commissions on a pretax basis. The Company may make both voluntary and/or matching contributions to the DCP on behalf of DCP participants. All DCP assets are corporate assets rather than individual property and are therefore subject to creditors’ claims against the Company. The Company made contributions to the DCP for the years ended December 31, 2004, 2003 and 2002 of $371,000, $643,000 and $482,000, respectively.
Note 13. Stock Compensation Plans
On June 8, 2004, the Company’s 1996 Stock Option Plan terminated except for outstanding awards that remain to become vested, exercised or free of restrictions and was replaced by the 2004 Incentive Stock Plan (the Plan). The Plan provides for the grant of qualified incentive stock options (ISOs), non-qualified stock options (NQSOs), deferred stock, restricted stock, performance share awards, dividend equivalent rights (DERs) and stock appreciation and limited stock appreciations awards (SARs). The Company has granted ISOs, NQSOs, restricted stock, performance share awards and DERs. ISOs may be granted to the officers and employees of the Company. NQSOs, DERs, SARs and stock awards may be granted to the directors, officers, employees, agents and consultants of the Company or any subsidiaries. Under the terms of the Plan, the number of shares available for grant is equal to 2.5 million shares of common stock. The Plan will remain in effect unless terminated by the Board of Directors or no shares of stock remain available for awards to be granted.
Prior to 2003, the Company accounted for stock-based compensation plans under the recognition and measurement provisions of APB No. 25 and related interpretations. Effective January 1, 2003, the Company adopted the fair value recognition provisions of SFAS No. 123. The Company selected the modified prospective method of adoption described in SFAS No. 148. Compensation cost recognized in 2003 is the same as that which would have been recognized had the fair value method of SFAS No. 123 been applied from its original effective date. See Note 1.
In accordance with the provisions of SFAS No. 123 and SFAS No. 148, $1.8 million and $1.3 million of stock-based compensation expense was recorded in 2004 and 2003. In accordance with APB No. 25, total stock-based compensation expense was $2.5 million for the year ended December 31, 2002.
All options have been granted at exercise prices greater than or equal to the estimated fair value of the underlying stock at the date of grant. Outstanding options vest equally over four years and expire ten years after the date of grant. The following table summarizes stock option activity for 2004, 2003 and 2002, respectively:
| 2004 | 2003 | 2002 | ||||||||||||||||
Stock Options | Shares | Weighted Average Price | Shares | Weighted Average Price | Shares | Weighted Average Price | ||||||||||||
Outstanding at the beginning of year | 746,800 | $ | 8.22 | 1,032,670 | $ | 7.40 | 1,078,840 | $ | 4.69 | |||||||||
Granted | 15,000 | 33.59 | 15,000 | 22.66 | 314,000 | 12.05 | ||||||||||||
Exercised | (305,700 | ) | 6.55 | (275,390 | ) | 5.98 | (355,250 | ) | 3.05 | |||||||||
Forfeited | (22,500 | ) | 10.50 | (25,480 | ) | 7.79 | (4,920 | ) | 8.25 | |||||||||
Outstanding at the end of year | 433,600 | $ | 10.16 | 746,800 | $ | 8.22 | 1,032,670 | $ | 7.40 | |||||||||
Exercisable at the end of year | 215,600 | $ | 7.48 | 275,050 | $ | 7.67 | 294,420 | $ | 7.63 | |||||||||
Options granted since 2002 were granted with DERs. Under the terms of the DERs, a recipient is entitled to receive additional shares of stock upon the exercise of options. For employees, the DERs accrue at a rate equal to the number of options outstanding times sixty percent of the dividends per share amount at each dividend payment date. For directors, the DERs accrue at a rate equal to the number of options outstanding times the dividends per share amount at each dividend payment date. The accrued DERs convert to shares based on the stock’s fair value on the dividend payment date. Certain of the options exercised in 2004, 2003 and 2002 had DERs attached to them when issued. As a result of these exercises, an additional 47,969, 23,485 and 3,226 shares of common stock were issued in 2004, 2003 and 2002, respectively.
During 2004, the Company granted and issued 41,200 shares of restricted stock at an average fair market value of $46.42. The restricted stock awards vest over four years. Of these shares, 800 shares were forfeited in 2004.
Additionally, during the first quarter of 2004, the Company issued 39,112 shares of restricted stock as payment for bonus compensation earned by certain executives of the Company in 2003. The shares were issued at an average fair market value of $46.42. The shares are fully vested upon issuance.
In November 2004, the Company entered into a Performance Contingent Deferred Stock Award Agreement with an executive of the Company. Under the agreement, the Company will grant shares of restricted stock if certain performance targets based on wholesale nonconforming origination volume are achieved by the Company within a five-year period. The total number of shares that can be issued under this agreement is 100,000.
The following table presents information on stock options outstanding as of December 31, 2004.
| Outstanding | Exercisable | |||||||||||
Exercise Price | Quantity | Weighted Average (Years) | Weighted Average Exercise Price | Quantity | Weighted Average Exercise Price | |||||||
$1.53 – $7.16 | 169,250 | 6.46 | $ | 4.65 | 118,500 | $ | 3.78 | |||||
$7.91 - $12.22 | 220,600 | 7.56 | 11.78 | 87,100 | 11.46 | |||||||
$12.97 - $33.59 | 43,750 | 8.43 | 23.36 | 10,000 | 16.60 | |||||||
| 433,600 | 7.22 | $ | 10.16 | 215,600 | $ | 7.48 | ||||||
Note 14. Branch Operations
Prior to 2004, the Company was party to limited liability company (“LLC”) agreements governing LLC’s formed to facilitate the operation of retail mortgage broker businesses as branches of NHMI. The LLC agreements provided for initial capitalization and membership interests of 99.9% to each branch manager and 0.1% to the Company. The Company accounted for its interest in the LLC agreements using the equity method of accounting. In December 2003, the Company determined it would terminate the LLC’s effective January 1, 2004. During February 2004, the Company notified the branch managers of the limited liability companies that the Company was terminating these agreements effective January 1, 2004. Continuing branches that formerly operated under these agreements became operating units of the Company and their financial results are included in the consolidated financial statements. The inclusion resulted in expected increases in general and administrative expenses, which were substantially offset by increases in related fee income. The Company did not purchase any assets or liabilities as a result of these branches becoming operating units.
As the demand for conforming loans has declined significantly during 2004, many branches have not been able to produce sufficient fees to meet operating expense demands. As a result of these conditions, a significant number of branch managers have voluntarily terminated employment with the Company. The Company has also terminated branches when loan production results were substandard. The Company considers a branch to be discontinued upon its termination date, which is the point in time when the operations cease. The discontinued operations apply to the branch operations segment presented in Note 15. The operating results for these discontinued operations have been segregated from the on-going operating results of the Company. The operating results of all discontinued operations are summarized as follows (in thousands):
For the Year Ended December 31, 2004 | ||||
Fee income | $ | 60,309 | ||
General and administrative expenses | 66,989 | |||
Loss before income tax benefit | (6,680 | ) | ||
Income tax benefit | (2,572 | ) | ||
Loss from discontinued operations | $ | (4,108 | ) | |
As of December 31, 2004, the Company has $1.0 million in cash, $0.2 million in receivables included in other assets and $1.2 million in payables included in accounts payable and other liabilities pertaining to discontinued operations, which are included in the consolidated balance sheets.
As of December 31, 2003, there were 423 such branches. For the years ended December 31, 2003 and 2002, the Company recorded fee income aggregating $12.8 million and $5.2 million, respectively, for providing administrative services for the branches. During 2003 and 2002, the aggregate amount of loans brokered by these branches was approximately $5.7 billion and $2.2 billion, respectively. Of those amounts, approximately $1.3 billion and $399.6 million, respectively, were acquired by the Company’s mortgage subsidiary. The aggregate premiums paid by the Company for loans brokered by these branches were approximately $15.1 million and $5.1 million for the years ended December 31, 2003 and 2002, respectively.
Note 15. Segment Reporting
The Company reviews, manages and operates its business in three segments. These business segments are: mortgage portfolio management, mortgage lending and loan servicing and branch operations. Mortgage portfolio management operating results are driven from the income generated on the assets the Company manages less associated management costs. Mortgage lending and loan servicing operations include the marketing, underwriting and funding of loan production. Servicing operations represent the income and costs to service the Company’s on and off -balance sheet loans. Branch operations include the collective income generated by NovaStar Home Mortgage, Inc. (NHMI) brokers and the associated operating costs. Also, the corporate-level income and costs to support the NHMI branches are represented in the branch operations segment. As discussed in Note 14, the LLC agreements were terminated effective January 1, 2004. Continuing branch operations that formerly operated under these agreements became operating units of the Company and their financial results are included in the consolidated financial statements. Branches that have terminated in 2004 have been segregated from the results of the ongoing operations of the Company for the year ended December 31, 2004. Following is a summary of the operating results of the Company’s primary operating units for the year ended December 31, 2004, 2003 and 2002 (in thousands):
For the Year Ended December 31, 2002 is being amended hereby solely2004
| Mortgage Portfolio Management | Mortgage Lending and | Branch Operations | Eliminations | Total | ||||||||||||||||
Interest income | $ | 140,304 | $ | 83,759 | $ | — | $ | (39 | ) | $ | 224,024 | |||||||||
Interest expense | 21,071 | 39,727 | 108 | (8,316 | ) | 52,590 | ||||||||||||||
Net interest income before credit losses | 119,233 | 44,032 | (108 | ) | 8,277 | 171,434 | ||||||||||||||
Credit losses | (726 | ) | — | — | — | (726 | ) | |||||||||||||
Gains on sales of mortgage assets | 360 | 113,211 | — | 31,379 | 144,950 | |||||||||||||||
Fee income | — | 29,269 | 129,149 | (55,662 | ) | 102,756 | ||||||||||||||
Losses on derivative instruments | (111 | ) | (8,794 | ) | — | — | (8,905 | ) | ||||||||||||
Impairment on mortgage securities – available-for-sale | (15,902 | ) | — | — | — | (15,902 | ) | |||||||||||||
Other income (expense) | 20,291 | (10,135 | ) | 35 | (7,800 | ) | 2,391 | |||||||||||||
General and administrative expenses | (7,473 | ) | (149,908 | ) | (135,842 | ) | 22,098 | (271,125 | ) | |||||||||||
Income (loss) before income tax | 115,672 | 17,675 | (6,766 | ) | (1,708 | ) | 124,873 | |||||||||||||
Income tax expense (benefit) | — | 7,540 | (2,638 | ) | 474 | 5,376 | ||||||||||||||
Income (loss) from continuing operations | 115,672 | 10,135 | (4,128 | ) | (2,182 | ) | 119,497 | |||||||||||||
Income (loss) from discontinued operations, net of income tax | — | — | (2,562 | ) | (1,546 | ) | (4,108 | ) | ||||||||||||
Net income (loss) | $ | 115,672 | $ | 10,135 | $ | (6,690 | ) | $ | (3,728 | ) | $ | 115,389 | ||||||||
December 31, 2004: | ||||||||||||||||||||
Total assets | $ | 1,078,064 | $ | 915,360 | $ | 35,283 | $ | (167,396 | ) | $ | 1,861,311 | |||||||||
For the Year Ended December 31, 2003
| Mortgage Portfolio Management | Mortgage Lending and | Branch Operations | Eliminations | Total | ||||||||||||||||
Interest income | $ | 109,542 | $ | 60,878 | $ | — | $ | — | $ | 170,420 | ||||||||||
Interest expense | 17,433 | 31,055 | — | (8,124 | ) | 40,364 | ||||||||||||||
Net interest income before credit recoveries | 92,109 | 29,823 | — | 8,124 | 130,056 | |||||||||||||||
Credit recoveries | 389 | — | — | — | 389 | |||||||||||||||
Gains (losses) on sales of mortgage assets | (1,911 | ) | 140,870 | — | 5,046 | 144,005 | ||||||||||||||
Fee income | 65 | 37,505 | 40,290 | (9,519 | ) | 68,341 | ||||||||||||||
Losses on derivative instruments | (894 | ) | (29,943 | ) | — | — | (30,837 | ) | ||||||||||||
Other income (expense) | 15,934 | (14,563 | ) | 53 | (4,114 | ) | (2,690 | ) | ||||||||||||
General and administrative expenses | (6,667 | ) | (133,196 | ) | (34,545 | ) | — | (174,408 | ) | |||||||||||
Income (loss) before income tax | 99,025 | 30,496 | 5,798 | (463 | ) | 134,856 | ||||||||||||||
Income tax expense | — | 20,580 | 2,280 | — | 22,860 | |||||||||||||||
Net income (loss) | $ | 99,025 | $ | 9,916 | $ | 3,518 | $ | (463 | ) | $ | 111,996 | |||||||||
December 31, 2003: | ||||||||||||||||||||
Total assets | $ | 563,930 | $ | 834,980 | $ | 17,276 | $ | (16,229 | ) | $ | 1,399,957 | |||||||||
For the Year Ended December 31, 2002
|
| |||||||||||||||||||
| Mortgage Portfolio Management | Mortgage Lending and | Branch Operations | Eliminations | Total | ||||||||||||||||
Interest income | $ | 73,407 | $ | 33,736 | $ | — | $ | — | $ | 107,143 | ||||||||||
Interest expense | 15,650 | 20,715 | — | (8,637 | ) | 27,728 | ||||||||||||||
Net interest income before credit recoveries | 57,757 | 13,021 | — | 8,637 | 79,415 | |||||||||||||||
Credit recoveries | 432 | — | — | — | 432 | |||||||||||||||
Gains (losses) on sales of mortgage assets | (791 | ) | 52,282 | — | 1,814 | 53,305 | ||||||||||||||
Fee income | 432 | 18,084 | 21,495 | (4,028 | ) | 35,983 | ||||||||||||||
Losses on derivative instruments | (2,282 | ) | (34,559 | ) | — | — | (36,841 | ) | ||||||||||||
Other income (expense) | 12,466 | (6,532 | ) | 62 | (6,966 | ) | (970 | ) | ||||||||||||
General and administrative expenses | (6,991 | ) | (59,306 | ) | (18,840 | ) | 543 | (84,594 | ) | |||||||||||
Income (loss) before income tax | 61,023 | (17,010 | ) | 2,717 | — | 46,730 | ||||||||||||||
Income tax expense (benefit) | — | (3,372 | ) | 1,341 | — | (2,031 | ) | |||||||||||||
Net income (loss) | $ | 61,023 | $ | (13,638 | ) | $ | 1,376 | $ | — | $ | 48,761 | |||||||||
December 31, 2002: | ||||||||||||||||||||
Total assets | $ | 387,600 | $ | 1,053,477 | $ | 11,814 | $ | (394 | ) | 1,452,497 | ||||||||||
Intersegment revenues and expenses that were eliminated in consolidation were as follows (in thousands):
| 2004 | 2003 | 2002 | ||||||||||
Amounts paid to (received from) mortgage portfolio from (to) mortgage lending and loan servicing: | ||||||||||||
Loan servicing fees | $ | (423 | ) | $ | (685 | ) | $ | (1,074 | ) | |||
Administrative fees | — | — | (449 | ) | ||||||||
Intercompany interest income | 8,200 | 8,124 | 8,637 | |||||||||
Guaranty, commitment, loan sale and securitization fees | 10,833 | 9,244 | 6,001 | |||||||||
Interest income on warehouse borrowings | 47 | — | — | |||||||||
Gain on sale of mortgage securities – available-for-sale retained in securitizations | (2,800 | ) | — | — | ||||||||
Amounts paid to (received from) branch operations from (to) mortgage lending and loan servicing: | ||||||||||||
Lender premium | 27,269 | 5,509 | 1,814 | |||||||||
Subsidized fees | 24 | 3,325 | 1,139 | |||||||||
Interest income on warehouse line | (39 | ) | — | — | ||||||||
Fee income on warehouse line | (30 | ) | — | — | ||||||||
Administrative fees | — | — | (94 | ) | ||||||||
Additionally, as previously discussed, the LLC agreements were terminated effective January 1, 2004 and all continuing branches that formerly operated under these agreements became operating units of the Company. As a result, during consolidation, the Company applied the provisions of SFAS No. 91 “Accounting for Nonrefundable Fees and Costs Associated with Originating or Acquiring Loans and Initial Direct Costs of Leases” to its branch operations segment. Based on SFAS No. 91, the Company defers certain nonrefundable fees and direct costs associated with the origination of loans in the branch operations segment which are subsequently brokered to the mortgage lending and servicing segment. The mortgage lending and servicing segment ultimately funds the loans and then sells the loans either through securitizations or outright sales to third parties. The net deferred cost (income) becomes part of the cost basis of the loans and serves to either increase (net deferred income) or decrease (net deferred cost) the gain or loss recognized by the mortgage lending and servicing segment. These transactions are accounted for in the eliminations column of the Company’s segment reporting. The following table summarizes these amounts for the purposeyear ended December 31, 2004 (in thousands):
| 2004 | ||||
Gains on sales of mortgage assets | $ | 8,472 | ||
Fee income | (36,913 | ) | ||
General & administrative expenses | 28,582 | |||
Note 16. Fair Value of amending the Exhibit 23.4—ConsentsFinancial Instruments
The following disclosure of the Independent Accountants.estimated fair value of financial instruments presents amounts that have been determined using available market information and appropriate valuation methodologies. However, considerable judgment is required to interpret market data to develop the estimates of fair value. Accordingly, the estimates presented herein are not necessarily indicative of the amounts that could be realized in a current market exchange. The use of different market assumptions or estimation methodologies could have a material impact on the estimated fair value amounts.
The estimated fair values of the Company’s financial instruments are as follows as of December 31, (in thousands):
| 2004 | 2003 | |||||||||||||
| Carrying Value | Fair Value | Carrying Value | Fair Value | |||||||||||
Financial assets: | ||||||||||||||
Cash and cash equivalents | $ | 268,563 | $ | 268,563 | $ | 118,180 | $ | 118,180 | ||||||
Mortgage loans: | ||||||||||||||
Held-for-sale | 747,594 | 758,932 | 697,992 | 715,414 | ||||||||||
Held-in-portfolio | 59,527 | 61,214 | 94,717 | 96,455 | ||||||||||
Mortgage securities - available-for-sale | 489,175 | 489,175 | 382,287 | 382,287 | ||||||||||
Mortgage securities - trading | 143,153 | 143,153 | — | — | ||||||||||
Mortgage servicing rights | 42,010 | 58,616 | 19,685 | 33,788 | ||||||||||
Deposits with derivative instrument counterparties | 6,700 | 6,700 | 20,900 | 20,900 | ||||||||||
Financial liabilities: | ||||||||||||||
Borrowings: | ||||||||||||||
Short-term | 905,528 | 905,528 | 872,536 | 872,536 | ||||||||||
Asset-backed bonds secured by mortgage loans | 53,453 | 53,453 | 89,384 | 89,384 | ||||||||||
Asset-backed bonds secured by mortgage securities | 336,441 | 336,726 | 43,596 | 44,253 | ||||||||||
Derivative instruments: | ||||||||||||||
Interest rate cap agreements | 5,819 | 5,819 | 6,679 | 6,679 | ||||||||||
Interest rate swap agreements | 6,143 | 6,143 | (8,648 | ) | (8,648 | ) | ||||||||
Cash and cash equivalents – The fair value of cash and cash equivalents approximates its carrying value.
Mortgage loans – The fair value for all loans is estimated by discounting the projected future cash flows using market discount rates at which similar loans made to borrowers with similar credit ratings and maturities would be discounted in the market.
Mortgage securities – available-for-sale—The fair value of mortgage securities – available-for-sale is estimated by discounting future projected cash flows using a discount rate commensurate with the risks involved.
Mortgage securities- trading – The fair value of mortgage securities - trading is estimated using quoted market prices.
Mortgage servicing rights – The fair value of mortgage servicing rights is calculated based on a discounted cash flow methodology incorporating numerous assumptions, including servicing income, servicing costs, market discount rates and prepayment speeds.
Deposits with derivative instrument counterparties – The fair value of deposits with counterparties approximates its carrying value.
Borrowings – The fair value of short-term borrowings and asset-backed bonds secured by mortgage loans approximates carrying value as the borrowings bear interest at rates that approximate current market rates for similar borrowings. The fair value of asset-backed bonds secured by mortgage securities is determined by the present value of future payments based on interest rate conditions at December 31, 2004 and 2003.
Derivative instruments – The fair value of derivative instruments is estimated by discounting the projected future cash flows using appropriate rates. The fair value of commitments to originate mortgage loans is estimated using the Black-Scholes option pricing model.
Note 17. Supplemental Disclosure of Cash Flow Information
(in thousands) | 2004 | 2003 | 2002 | |||||||||
Cash paid for interest | $ | 51,431 | $ | 41,058 | $ | 37,546 | ||||||
Cash paid for income taxes | $ | 27,944 | $ | 18,831 | $ | 3,581 | ||||||
Cash received on mortgage securities – available-for-sale with no cost basis | $ | 32,244 | $ | 20,707 | $ | — | ||||||
Non-cash operating, investing and financing activities: | ||||||||||||
Cost basis of securities retained in securitizations | $ | 381,833 | $ | 292,675 | $ | 90,785 | ||||||
Retention of mortgage servicing rights | $ | 39,259 | $ | 20,774 | $ | 6,070 | ||||||
Change in loans under removal of accounts provision | $ | 6,455 | $ | 3,020 | $ | 11,455 | ||||||
Change in due to trusts | $ | (6,455 | ) | $ | (3,020 | ) | $ | (11,455 | ) | |||
Assets acquired through foreclosure | $ | 3,558 | $ | 6,619 | $ | 8,417 | ||||||
Dividends payable | $ | 73,431 | $ | 30,559 | $ | 16,768 | ||||||
Dividend reinvestment plan program | $ | 1,839 | $ | 1,247 | $ | — | ||||||
Restricted stock issued in satisfaction of prior year accrued bonus | $ | 1,816 | $ | — | $ | — | ||||||
Surrender of warrants | $ | — | $ | — | $ | 3,673 | ||||||
Note 18. Earnings Per Share
The computations of basic and diluted earnings per share for the years ended December 31, 2004, 2003 and 2002 are as follows (in thousands, except per share amounts):
��
| For the Year Ended December 31, | ||||||||||
| 2004 | 2003 | 2002 | ||||||||
Numerator: | ||||||||||
Income from continuing operations | $ | 119,497 | $ | 111,996 | $ | 48,761 | ||||
Dividends on preferred shares | (6,265 | ) | — | — | ||||||
Income from continuing operations available to common shareholders | 113,232 | 111,996 | 48,761 | |||||||
Loss from discontinued operations, net of income tax | (4,108 | ) | — | — | ||||||
Net income available to common shareholders | $ | 109,124 | $ | 111,996 | $ | 48,761 | ||||
Denominator: | ||||||||||
Weighted average common shares outstanding – basic: | ||||||||||
Common shares outstanding | 25,290 | 22,220 | 19,537 | |||||||
Convertible preferred stock | — | — | 1,221 | |||||||
Weighted average common shares outstanding – basic | 25,290 | 22,220 | 20,758 | |||||||
Weighted average common shares outstanding – dilutive: | ||||||||||
Weighted average common shares outstanding – basic | 25,290 | 22,220 | 20,758 | |||||||
Stock options | 435 | 601 | 524 | |||||||
Restricted stock | 38 | — | — | |||||||
Warrants | — | — | 378 | |||||||
Weighted average common shares outstanding – dilutive | 25,763 | 22,821 | 21,660 | |||||||
Basic earnings per share: | ||||||||||
Income from continuing operations | $ | 4.72 | $ | 5.04 | $ | 2.35 | ||||
Dividends on preferred shares | (0.25 | ) | — | — | ||||||
Income from continuing operations available to common shareholders | 4.47 | 5.04 | 2.35 | |||||||
Loss from discontinued operations, net of income tax | (0.16 | ) | — | — | ||||||
Net income available to common shareholders | $ | 4.31 | $ | 5.04 | $ | 2.35 | ||||
Diluted earnings per share: | ||||||||||
Income from continuing operations | $ | 4.64 | $ | 4.91 | $ | 2.25 | ||||
Dividends on preferred shares | (0.24 | ) | — | — | ||||||
Income from continuing operations available to common shareholders | 4.40 | 4.91 | 2.25 | |||||||
Loss from discontinued operations, net of income tax | (0.16 | ) | — | — | ||||||
Net income available to common shareholders | $ | 4.24 | $ | 4.91 | $ | 2.25 | ||||
The following stock options and warrants to purchase shares of common stock were outstanding during each period presented, but were not included in the computation of diluted earnings per share because the number of shares assumed to be repurchased, as calculated was greater than the number of shares to be obtained upon exercise, therefore, the effect would be antidilutive:
| For the Year Ended December 31, | |||||||||
| 2004 | 2003 | 2002 | |||||||
Number of stock options and warrants (in thousands) | 15 | 15 | 300 | ||||||
Weighted average exercise price | $ | 33.59 | $ | 22.66 | $ | 12.50 | |||
Note 19. Subsequent Events
On February 22, 2005, the Company executed a securitization, NovaStar Mortgage Funding Trust Series 2005-1, which offered 15 rated classes of certificates with a face value of $2,073,750,000. The Company retained the Class C certificate, which was not covered by the prospectus. Class C has a notional amount of $2.1 billion, entitles the Company to excess and prepayment penalty fee cash flow from the underlying loan collateral and serves as overcollateralization. Other than prepayment penalty fee cash flow, Class C is subordinated to the other classes, all of which were offered pursuant to the prospectus. On February 22, 2005, $1.3 billion in loans collateralizing NMFT Series 2005-1 were delivered to the trust. The remaining $0.8 billion in loans is expected to be delivered to the trust by March 31, 2005.
On March 15, 2005, the Company issued $51.6 million of unsecured floating rate junior subordinated notes (“Trust Preferred Securities”). The floating interest rate is three-month LIBOR plus 3.5% and resets quarterly. The notes will mature in 30 years and are redeemable, in whole or in part, anytime without penalty after five years.
Note 20. Condensed Quarterly Financial Information (unaudited)
Following is condensed consolidated quarterly operating results for the Company (in thousands, except per share amounts):
| 2004 Quarters | 2003 Quarters | |||||||||||||||||||||||||||||||
| First | Second | Third | Fourth | First | Second | Third | Fourth | |||||||||||||||||||||||||
Net interest income before credit (losses) recoveries | $ | 39,638 | $ | 42,947 | $ | 45,439 | $ | 43,410 | $ | 28,687 | $ | 31,547 | $ | 33,469 | $ | 36,353 | ||||||||||||||||
Credit (losses) recoveries | (146 | ) | (515 | ) | (182 | ) | 117 | 92 | 171 | 875 | (749 | ) | ||||||||||||||||||||
Gains on sales of mortgage assets | 51,780 | 25,174 | 46,415 | 21,581 | 29,443 | 44,031 | 34,188 | 36,343 | ||||||||||||||||||||||||
Gains (losses) on derivative instruments | (25,398 | ) | 27,115 | (19,536 | ) | 8,914 | (9,149 | ) | (15,037 | ) | (8,144 | ) | 1,493 | |||||||||||||||||||
Income from continuing operations before income tax expense (benefit) | 33,073 | 44,505 | 24,364 | 22,931 | 27,100 | 32,904 | 30,952 | 43,900 | ||||||||||||||||||||||||
Income tax expense (benefit) | 1,101 | 7,720 | (1,547 | ) | (1,898 | ) | 4,141 | 4,183 | 5,844 | 8,692 | ||||||||||||||||||||||
Income from continuing operations | 31,972 | 36,785 | 25,911 | 24,829 | 22,959 | 28,721 | 25,108 | 35,208 | ||||||||||||||||||||||||
Loss from discontinued operations, net of income tax | (1,047 | ) | (1,159 | ) | (1,523 | ) | (379 | ) | — | — | — | — | ||||||||||||||||||||
Net income | 30,925 | 35,626 | 24,388 | 24,450 | 22,959 | 28,721 | 25,108 | 35,208 | ||||||||||||||||||||||||
Dividends on preferred stock | 1,275 | 1,663 | 1,663 | 1,664 | — | — | — | — | ||||||||||||||||||||||||
Net income available to common shareholders | 29,650 | 33,963 | 22,725 | 22,786 | 22,959 | 28,721 | 25,108 | 35,208 | ||||||||||||||||||||||||
Basic earnings per share: | ||||||||||||||||||||||||||||||||
Income from continuing operations available to common shareholders | $ | 1.24 | $ | 1.41 | $ | 0.97 | $ | 0.87 | $ | 1.09 | $ | 1.32 | $ | 1.12 | $ | 1.49 | ||||||||||||||||
Loss from discontinued operations, net of income tax | (0.04 | ) | (0.05 | ) | (0.06 | ) | (0.01 | ) | — | — | — | — | ||||||||||||||||||||
Net income available to common shareholders | $ | 1.20 | $ | 1.36 | $ | 0.91 | $ | 0.86 | $ | 1.09 | $ | 1.32 | $ | 1.12 | $ | 1.49 | ||||||||||||||||
Diluted earnings per share: | ||||||||||||||||||||||||||||||||
Income from continuing operations available to common shareholders | $ | 1.21 | $ | 1.39 | $ | 0.95 | $ | 0.86 | $ | 1.07 | $ | 1.28 | $ | 1.09 | $ | 1.45 | ||||||||||||||||
Loss from discontinued operations, net of income tax | (0.04 | ) | (0.05 | ) | (0.06 | ) | (0.01 | ) | — | — | — | — | ||||||||||||||||||||
Net income available to common shareholders | $ | 1.17 | $ | 1.34 | $ | 0.89 | $ | 0.85 | $ | 1.07 | $ | 1.28 | $ | 1.09 | $ | 1.45 | ||||||||||||||||
During 2004, the Company changed policies governing its broker branches. As a result, a significant number of branch managers have voluntarily terminated employment with the Company and the Company has terminated branches when loan production results were substandard. The operating results for these discontinued operations have been segregated from the on-going operating results of the Company. The following amounts from the Company’s financial statements for the three months ended March 31, June 30 and September 30, 2004 have been revised from amounts previously reported to account for the discontinued operations (in thousands, except per share amounts):
| March 31, 2004 | June 30, 2004 | September 30, 2004 | ||||||||||||||||||||
| As Previously Reported | As Adjusted | As Previously Reported | As Adjusted | As Previously Reported | As Adjusted | |||||||||||||||||
Fee Income | $ | 45,519 | $ | 25,452 | $ | 43,231 | $ | 23,056 | $ | 34,265 | $ | 24,692 | ||||||||||
General and administrative expenses | 80,383 | 58,735 | 89,506 | 67,706 | 79,733 | 69,862 | ||||||||||||||||
Income from continuing operations before income tax expense (benefit) | 31,371 | 33,073 | 42,620 | 44,505 | 24,066 | 24,364 | ||||||||||||||||
Income tax expense (benefit) | 446 | 1,101 | 6,994 | 7,720 | (1,385 | ) | (1,547 | ) | ||||||||||||||
Income from continuing operations | 30,925 | 31,972 | 35,626 | 36,785 | 25,451 | 25,911 | ||||||||||||||||
Loss from discontinued operations, net of income tax | — | (1,047 | ) | — | (1,159 | ) | (1,063 | ) | (1,523 | ) | ||||||||||||
Net income | $ | 30,925 | $ | 30,925 | $ | 35,626 | $ | 35,626 | $ | 24,388 | $ | 24,388 | ||||||||||
Basic earnings per share: | ||||||||||||||||||||||
Income from continuing operations available to common shareholders | $ | 1.20 | $ | 1.24 | $ | 1.36 | $ | 1.41 | $ | 0.95 | $ | 0.97 | ||||||||||
Loss from discontinued operations, net of income tax | — | (0.04 | ) | — | (0.05 | ) | (0.04 | ) | (0.06 | ) | ||||||||||||
Net income available to common shareholders | $ | 1.20 | $ | 1.20 | $ | 1.36 | $ | 1.36 | $ | 0.91 | $ | 0.91 | ||||||||||
Diluted earnings per share: | ||||||||||||||||||||||
Income from continuing operations available to common shareholders | $ | 1.17 | $ | 1.21 | $ | 1.34 | $ | 1.39 | $ | 0.93 | $ | 0.95 | ||||||||||
Loss from discontinued operations, net of income tax | — | (0.04 | ) | — | (0.05 | ) | (0.04 | ) | (0.06 | ) | ||||||||||||
Net income available to common shareholders | $ | 1.17 | $ | 1.17 | $ | 1.34 | $ | 1.34 | $ | 0.89 | $ | 0.89 | ||||||||||
REPORT OF INDEPENDENT REGISTERED PUBLIC ACCOUNTING FIRM
To the Board of Directors and Stockholders of
NovaStar Financial, Inc.
Kansas City, Missouri
We have audited the accompanying consolidated balance sheets of NovaStar Financial, Inc. and subsidiaries (the “Company”) as of December 31, 2004 and 2003, and the related consolidated statements of income, stockholders’ equity, and cash flows for each of the three years in the period ended December 31, 2004. These financial statements are the responsibility of the Company’s management. Our responsibility is to express an opinion on these financial statements based on our audits.
We conducted our audits in accordance with the standards of the Public Company Accounting Oversight Board (United States). Those standards require that we plan and perform the audit to obtain reasonable assurance about whether the financial statements are free of material misstatement. An audit includes examining, on a test basis, evidence supporting the amounts and disclosures in the financial statements. An audit also includes assessing the accounting principles used and significant estimates made by management, as well as evaluating the overall financial statement presentation. We believe that our audits provide a reasonable basis for our opinion.
In our opinion, such consolidated financial statements present fairly, in all material respects, the financial position of the Company as of December 31, 2004 and 2003, and the results of its operations and its cash flows for each of the three years in the period ended December 31, 2004 in conformity with accounting principles generally accepted in the United States of America.
As discussed in Note 1 to the consolidated financial statements, the Company changed its method of accounting for stock-based compensation to conform to Statement of Financial Accounting Standards No. 123,Accounting for Stock-Based Compensation effective January 1, 2003.
We have also audited, in accordance with the standards of the Public Company Accounting Oversight Board (United States), the effectiveness of the Company’s internal control over financial reporting as of December 31, 2004, based on the criteria established inInternal Control—Integrated Framework issued by the Committee of Sponsoring Organizations of the Treadway Commission and our report dated March 15, 2005 expressed an unqualified opinion on management’s assessment of the effectiveness of the Company’s internal control over financial reporting and an unqualified opinion on the effectiveness of the Company’s internal control over financial reporting.
/s/ Deloitte & Touche LLP
Kansas City, Missouri
March 15, 2005
Item 9.Changes in and Disagreements with Accountants on Accounting and Financial Disclosure
None
Item 9A.Controls and Procedures
Disclosure Controls and Procedures
The Company maintains a system of disclosure controls and procedures which are designed to ensure that information required to be disclosed by the Company in reports that it files or submits under the federal securities laws, including this report, is recorded, processed, summarized and reported on a timely basis. These disclosure controls and procedures include controls and procedures designed to ensure that information required to be disclosed under the federal securities laws is accumulated and communicated to the Company’s management on a timely basis to allow decisions regarding required disclosure. The Company’s principal executive officer and principal financial officer evaluated the Company’s disclosure controls and procedures (as defined in Exchange Act Rules 13a-15(e) and 15d-15(d)) as of the end of the period covered by this report and concluded that the Company’s controls and procedures were effective.
Internal Control over Financial Reporting
Management’s Report on Internal Control over Financial Reporting
Management of NovaStar Financial, Inc. and subsidiaries (the “Company”) is responsible for establishing and maintaining adequate internal control over financial reporting as defined in Rule 13a-15(f) of the Securities Exchange Act of 1934. This internal control system has been designed to provide reasonable assurance to the Company’s management and board of directors regarding the preparation and fair presentation of the company’s published financial statements.
All internal control systems, no matter how well designed, have inherent limitations. Therefore, even those systems determined to be effective can provide only reasonable assurance with respect to financial statement preparation and presentation.
Management of the Company has assessed the effectiveness of the company’s internal control over financial reporting as of December 31, 2004. To make this assessment, management used the criteria for effective internal control over financial reporting described inInternal Control—Integrated Framework, issued by the Committee of Sponsoring Organizations of the Treadway Commission. Based on our assessment, we believe that, as of December 31, 2004, the Company’s internal control over financial reporting met those criteria.
Our independent registered public accounting firm, Deloitte & Touche LLP, have issued an attestation report, included herein, on our assessment of the Company’s internal control over financial reporting.
March 15, 2005 |
| /s/ SCOTT F. HARTMAN |
Scott F. Hartman Chairman of the Board of Directors and Chief Executive Officer |
| /s/ GREGORY S. METZ |
Gregory S. Metz Chief Financial Officer |
Changes in Internal Control over Financial Reporting
There were no changes in our internal controls over financial reporting during the quarter ended December 31, 2004 that have materially affected, or is reasonably likely to materially affect our internal control over financial reporting.
Attestation Report of the Registered Public Accounting Firm
REPORT OF INDEPENDENT REGISTERED PUBLIC ACCOUNTING FIRM
To the Board of Directors and Stockholders of
NovaStar Financial, Inc.
Kansas City, Missouri
We have audited management’s assessment, included in the accompanying Management’s Report on Internal Control Over Financial Reporting, that NovaStar Financial, Inc. and subsidiaries (the “Company”) maintained effective internal control over financial reporting as of December 31, 2004, based on criteria established inInternal Control—Integrated Framework issued by the Committee of Sponsoring Organizations of the Treadway Commission. The Company’s management is responsible for maintaining effective internal control over financial reporting and for its assessment of the effectiveness of internal control over financial reporting. Our responsibility is to express an opinion on management’s assessment and an opinion on the effectiveness of the Company’s internal control over financial reporting based on our audit.
We conducted our audit in accordance with the standards of the Public Company Accounting Oversight Board (United States). Those standards require that we plan and perform the audit to obtain reasonable assurance about whether effective internal control over financial reporting was maintained in all material respects. Our audit included obtaining an understanding of internal control over financial reporting, evaluating management’s assessment, testing and evaluating the design and operating effectiveness of internal control, and performing such other procedures as we considered necessary in the circumstances. We believe that our audit provides a reasonable basis for our opinions.
A company’s internal control over financial reporting is a process designed by, or under the supervision of, the company’s principal executive and principal financial officers, or persons performing similar functions, and effected by the company’s board of directors, management, and other personnel to provide reasonable assurance regarding the reliability of financial reporting and the preparation of financial statements for external purposes in accordance with generally accepted accounting principles. A company’s internal control over financial reporting includes those policies and procedures that (1) pertain to the maintenance of records that, in reasonable detail, accurately and fairly reflect the transactions and dispositions of the assets of the company; (2) provide reasonable assurance that transactions are recorded as necessary to permit preparation of financial statements in accordance with generally accepted accounting principles, and that receipts and expenditures of the company are being made only in accordance with authorizations of management and directors of the company; and (3) provide reasonable assurance regarding prevention or timely detection of unauthorized acquisition, use, or disposition of the company’s assets that could have a material effect on the financial statements.
Because of the inherent limitations of internal control over financial reporting, including the possibility of collusion or improper management override of controls, material misstatements due to error or fraud may not be prevented or detected on a timely basis. Also, projections of any evaluation of the effectiveness of the internal control over financial reporting to future periods are subject to the risk that the controls may become inadequate because of changes in conditions, or that the degree of compliance with the policies or procedures may deteriorate.
In our opinion, management’s assessment that the Company maintained effective internal control over financial reporting as of December 31, 2004, is fairly stated, in all material respects, based on the criteria established inInternal Control—Integrated Framework issued by the Committee of Sponsoring Organizations of the Treadway Commission. Also in our opinion, the Company maintained, in all material respects, effective internal control over financial reporting as of December 31, 2004, based on the criteria established inInternal Control—Integrated Framework issued by the Committee of Sponsoring Organizations of the Treadway Commission.
We have also audited, in accordance with the standards of the Public Company Accounting Oversight Board (United States), the consolidated financial statements as of and for the year ended December 31, 2004 of the Company and our report dated March 15, 2005 expressed an unqualified opinion on those financial statements.
/s/ Deloitte & Touche LLP
Kansas City, Missouri
March 15, 2005
None
Item 10.Directors and Executive Officers of the Registrant
Information with respect to Item 401 and Item 405 of Regulation S-K is incorporated by reference to the information included on NovaStar Financial’s Proxy Statement dated April 18, 2005, for the Annual Meeting of Shareholders to be held at May 20, 2005 at 10:00 a.m., Central Daylight Time, at the NovaStar Financial, Inc. Corporate Offices, 8401 Ward Parkway, Kansas City, Missouri 64114.
Information with respect to our corporate governance guidelines, charters of audit, compensation, nominating and corporate governance committees, and code of conduct may be obtained on our website (www.novastarmortgage.com) or by contacting us directly. The code of conduct applies to our principal executive officer, principal financial officer, principal accounting officer, directors and other employees performing similar functions. A Form 8-K will be filed and a posting on our website will be made upon any amendment to or waiver from a provision of the code of conduct that applies to any officer or director. Our investor relations contact information follows.
Investor Relations
8140 Ward Parkway, Suite 300
Kansas City, MO 64114
816.237.7000
Email: ir@novastar1.com
Because our common stock is listed on NYSE, our chief executive officer is required to make an annual certification to the NYSE stating that he is not aware of any violation by NovaStar Financial, Inc. of the NYSE Corporate Governance listing standards. Last year, our chief executive officer submitted such annual certification to the NYSE. In addition, NovaStar Financial, Inc. has filed, as exhibits to last year’s Annual Report on Form 10-K and is filing as exhibits to this Annual Report, the certifications of its chief executive officer and chief financial officer required under Section 302 of the Sarbanes-Oxley Act of 2002 to be filed with the Securities and Exchange Commission regarding the quality of NovaStar Financial, Inc. public disclosure.
Item 11.Executive Compensation
Information with respect to Item 402 of Regulation S-K is incorporated by reference to the information included on NovaStar Financial’s Proxy Statement dated April 18, 2005, for the Annual Meeting of Shareholders to be held at May 20, 2005 at 10:00 a.m., Central Daylight Time, at the NovaStar Financial, Inc. Corporate Offices, 8401 Ward Parkway, Kansas City, Missouri 64114.
Item 12.Security Ownership of Certain Beneficial Owners and Management and Related Stockholder Matters
Information with respect to Item 403 of Regulation S-K is incorporated by reference to the information included on NovaStar Financial’s Proxy Statement dated April 18, 2005, for the Annual Meeting of Shareholders to be held at May 20, 2005 at 10:00 a.m., Central Daylight Time, at the NovaStar Financial, Inc. Corporate Offices, 8401 Ward Parkway, Kansas City, Missouri 64114.
The following table sets forth information as of December 31, 2004 with respect to compensation plans under which our common stock may be issued.
Equity Compensation Plan Information
Plan Category | Number of Securities to be Issued Upon Exercise of Outstanding Options, Warrants and Rights | Weighted Average Exercise Price of Outstanding Options, Warrants and Rights | Number of Securities Remaining Available for Future Issuance Under Equity Compensation Plans (Excluding Shares Reflected in the First Column) | |||||
Equity compensation plans approved by stockholders | 433,600 | (A) | $ | 10.16 | 2,500,000 | |||
Equity compensation plans not approved by stockholders | — | — | — | |||||
Total | 433,600 | $ | 10.16 | 2,500,000 | ||||
| (A) | Certain of the options have dividend equivalent rights (DERs) attached to them when issued. As of December 31, 2004, these options have 85,124 DERs attached. |
Item 13.Certain Relationships and Related Transactions.
Information with respect to Item 404 of Regulation S-K is incorporated by reference to the information included on NovaStar Financial’s Proxy Statement dated April 18, 2005, for the Annual Meeting of Shareholders to be held at May 20, 2005 at 10:00 a.m., Central Daylight Time, at the NovaStar Financial, Inc. Corporate Offices, 8401 Ward Parkway, Kansas City, Missouri 64114.
Item 14.Principal Accountant Fees and Services.
Information with respect to Item 9(e) of Schedule 14A is incorporated by reference to the information included on NovaStar Financial’s Proxy Statement dated April 18, 2005, for the Annual Meeting of Shareholders to be held at May 20, 2005 at 10:00 a.m., Central Daylight Time, at the NovaStar Financial, Inc. Corporate Offices, 8401 Ward Parkway, Kansas City, Missouri 64114.
Item 15.Exhibits and Financial StatementStatements Schedules
Financial Statements and ReportsSchedules
(1) The financial statements as set forth under Item 8 of this report on Form 8-K10-K are included herein.
(2) The required financial statement schedules are omitted because the information is disclosed elsewhere herein.
Exhibit Listing
Exhibit No. | Description of Document | |
| 3.1(1) | Articles of Amendment and Restatement of the Registrant | |
| ||
| 3.3(1) | Bylaws of the Registrant | |
| 3.3a(2) | Amendment to Bylaws of the Registrant, adopted February 2, 2000 | |
| 3.3.1 | Amended and Restated Bylaws of the Registrant, adopted February 7, 2005 | |
| 3.4(8) | Articles Supplementary of the Registrant adopted January 15, 2004 | |
| 4.1(1) | Specimen Common Stock Certificate | |
| 4.3(9) | Specimen certificate for Preferred Stock | |
| 10.6(1) | Form of Master Repurchase Agreement for mortgage loan financing | |
| 10.7.1 | Form of Master Repurchase Agreement of the Registrant | |
| 10.8(6) | Employment Agreement, dated September 30, 1996, between the Registrant and Scott F. Hartman | |
| 10.9(6) | Employment Agreement, dated September 30, 1996, between the Registrant and W. Lance Anderson | |
| 10.14(1) | 1996 Executive and Non-Employee Director Stock Option Plan, as last amended December 6, 1996 | |
| 10.25(4) | NovaStar Financial Inc. 2004 Incentive Stock Plan | |
| 10.25.1(5) | Stock Option Agreement under NovaStar Financial, Inc. 2004 Incentive Stock Plan | |
| 10.25.2(5) | Restricted Stock Agreement under NovaStar Financial, Inc. 2004 Incentive Stock Plan | |
| 10.25.3(5) | Performance Contingent Deferred Stock Award Agreement under NovaStar Financial, Inc. 2004 Incentive Stock Plan | |
| 10.26(5) | NovaStar Financial, Inc. Executive Officer Bonus Plan | |
| 10.27(7) | Employment Agreement between NovaStar Mortgage, Inc. and David A. Pazgan, Executive Vice President of NovaStar Mortgage, Inc. | |
| 10.28(7) | Description of Oral At-Will Agreement between NovaStar Financial, Inc. and Jeffrey D. Ayers, Senior Vice President, General Counsel and Secretary | |
| 10.29(7) | 2004 Supplemental Compensation for Independent Directors | |
| 10.30(7) | 2005 Compensation Plan for Independent Directors | |
| 10.31(7) | Employment Agreement between NovaStar Financial, Inc. and Gregory S. Metz, Senior Vice President and Chief Financial Officer | |
| 10.32(7) | Employment Agreement between NovaStar Financial, Inc. and Michael L. Bamburg, Senior Vice President and Chief Investment Officer | |
| 10.33(7) | Description of Oral At-Will Agreement between NovaStar Financial, Inc. and Rodney E. Schwatken, Vice President, Controller and Chief Accounting Officer | |
| 11.1(3) | Statement regarding computation of per share earnings | |
| 21.1 | Subsidiaries of the Registrant | |
| 23.1 | Consents of Deloitte & Touche LLP | |
| 31.1 | Chief Executive Officer Certification - Section 302 of the Sarbanes-Oxley Act of 2002 | |
| 31.2 | Principal Financial Officer Certification - Section 302 of the Sarbanes-Oxley Act of 2002 | |
| 32.1 | Chief Executive Officer Certification - Section 906 of the Sarbanes-Oxley Act of 2002 | |
| 32.2 | Principal Financial Officer Certification - Section 906 of the Sarbanes-Oxley Act of 2002 | |
| (1) | Incorporated by reference to the correspondingly numbered exhibit to the Registration Statement on Form S-11 (373-32327) filed by the Registrant with the SEC on July 29, 1997, as amended. |
| (2) | Incorporated by reference to the correspondingly numbered exhibit to the Annual Report on Form 10-K filed by the Registrant with the SEC on March 20, 2000. |
| (3) | See Note 19 to the consolidated financial statements. |
| (4) | Incorporated by reference to Exhibit 10.15 to the Registration Statement on Form S-8 (333-116998) filed by the Registrant with the SEC on June 30, 2004. |
| (5) | Incorporated by reference to the correspondingly numbered exhibit to Form 8-K filed by the Registrant with the SEC on February 4, 2005. |
| (6) | Incorporated by reference to the correspondingly numbered exhibit to Form S-11 filed by the Registrant with the SEC on July 29, 1997. |
| (7) | Incorporated by reference to the correspondingly numbered exhibit to Form 8-K filed by the Registrant with the SEC on February 11, 2005. |
| (8) | Incorporated by reference to the correspondingly numbered exhibit to Form 8-A/A filed by the Registrant with the SEC on January 20, 2004. |
| (9) | Incorporated by reference to the correspondingly numbered exhibit to Form 8-A/A filed by the Registrant with the SEC on January 20, 2004. |
SIGNATURESSignatures
Pursuant to the requirements of Section 13 or 15(d) of the Securities Exchange Act of 1934, the registrant has duly caused this amendment to its report on Form 10-K to be signed on its behalf by the undersigned, thereunto duly authorized.
NovaStar Financial, Inc.
(Registrant)
| Date:March 16, 2005 | By: |
| ||||||
|
|
|
| |||||
Scott F. Hartman, Chairman of the Board
| ||||||||
|
|
|
| |||||
| of Directors and Chief Executive Officer | ||||||||
| Date:March 16, 2005 | By: | /s/ W. LANCE ANDERSON | ||||||
| W. Lance Anderson, President, | ||||||||
| Chief Operating Officer and Director | ||||||||
| Date:March 16, 2005 | By: | /s/ GREGORY S. METZ | ||||||
| Gregory S. Metz, Chief Financial Officer | ||||||||
| Date:March 16, 2005 | By: | /s/ RODNEY E. SCHWATKEN | ||||||
| Rodney E. Schwatken, Vice President,
| ||||||||
| Controller and
| ||||||||
| Date:March 16, 2005 | By: | /s/ EDWARD W. MEHRER | ||||||
| Edward W. Mehrer, Director | ||||||||
| Date:March 16, 2005 | By: | /s/ GREGORY T. BARMORE | ||||||
| Gregory T. Barmore, Director | ||||||||
| Date:March 16, 2005 | By: | /s/ ART N. BURTSCHER | ||||||
| Art N. Burtscher, Director | ||||||||
91
CERTIFICATION
I, Scott F. Hartman, certify that:
Date: May 7, 2003
|
| |
|
| |
|
|
CERTIFICATION
I, Rodney E. Schwatken, certify that:
Date: May 7, 2003
|
| |
|
| |
|
|