UNITED STATES
SECURITIES AND EXCHANGE COMMISSION
Washington, D.C. 20549
FORM 10-K/A10-K
(Mark One)
x | ANNUAL REPORT PURSUANT TO SECTION 13 OR 15(d) OF THE SECURITIES EXCHANGE ACT OF 1934 |
For the fiscal year ended December 31, 20042006
OR
¨ | TRANSITION REPORT PURSUANT TO SECTION 13 OR 15(d) OF THE SECURITIES EXCHANGE ACT OF 1934 |
For the transition period from to
Commission File Number 000-30975
TRANSGENOMIC, INC.
(Exact Name of Registrant as Specified in its Charter)
| Delaware | 91-1789357 | |
(State or Other Jurisdiction of Incorporation or Organization) | (IRS Employer Identification Number) |
12325 Emmet Street Omaha, NE 68164 | 68164 | ||
| (Address of Principal Executive Offices) | (Zip Code) | ||
(402) 452-5400
(Registrant’s Telephone Number, Including Area Code)
Securities registered pursuant to Section 12(b) of the Act:
Title of Each Class | Name of Each Exchange On Which Registered | |
None | N/A |
Securities registered pursuant to Section 12(g) of the Act:
Common Stock, par value $.01 per share
(Title of Class)
Indicate by check mark if the registrant is a well-known seasoned issuer, as defined in Rule 405 of the Securities Act.
Yes No X
Indicate by check mark if the registrant is not required to file reports pursuant to Section 13 or Section 15(d) of the Exchange Act.
Yes No X
Indicate by check mark whether the registrant (1) has filed all reports required to be filed by Section 13 or 15(d) of the Securities Exchange Act of 1934 during the preceding 12 months (or for such shorter period that the registrant was required to file such reports), and (2) has been subject to such filing requirements for the past 90 days.
Yes x X No ¨
Indicate by check mark if disclosure of delinquent filers pursuant to Item 405 of Regulation S-K is not contained herein, and will not be contained, to the best of registrant’s knowledge, in definitive proxy or information statements incorporated by reference in Part III of this Form 10-K or any amendment to this Form10-K x X
Indicate by check mark whether the registrant is a large accelerated filer, an accelerated filer (as definedor a non-accelerate filer. See definition of “accelerated filer” and “large accelerated filer” in Rule 12b-2 of the Act). YesExchange Act.
Large Accelerated Filer ¨ NoAccelerated Filer ¨ Non-Accelerated Filer x
Indicate by check mark whether the registrant is a shell company (as defined in Exchange Act Rule 12b-2).
Yes No X
The aggregate market value of the voting and non-voting common equity held by non-affiliates of the registrant based on the last reported closing price per share of Common Stock as reported on The Nasdaq NationalGlobal Market on the last business day of the registrant’s most recently completed second fiscal quarter was approximately $38.4$22.63 million.
As of April 14, 2005,At March 30, 2007, the registrant had 34,238,97049,189,672 shares of Common Stock outstanding.
DOCUMENTS INCORPORATED BY REFERENCE
Portions of the registrant Proxy Statement relating to its 2007 Annual Meeting of Stockholders (the “Proxy Statement”) have been incorporated into Part III of this Report on Form 10-K.
Explanatory NoteTRANSGENOMIC, INC.
Transgenomic, Inc (the “Company”) is amending its annual report onIndex to Form 10-K for the year endedFiscal Year Ended December 31, 2004 (“Form 10-K”) to include the information required by Part III of the Form 10-K. The Company filed its Form 10-K on April 15, 2005, which indicated that it would incorporate many sections of Part III by reference to the Company’s definitive proxy statement. At this time, the Company no longer expects to be able to file its definitive proxy statement within the applicable time frame required for incorporating by reference information into the Company’s Form 10-K. Therefore, the Company is filing this amended Form 10-K/A to include such information and to remove references to the proxy statement. Except as indicated, the Company has made no other changes to its annual report on Form 10-K for the year ended December 31, 2004.
Part III2006
Item 10. Directors and Executive Officers of the Registrant.
Directors
The following table sets forth information about our directors, including the nominees who are to be voted on at our annual meeting. There are no arrangements or understandings pursuant to which either nominee was selected. The Board of Directors has determined that Messrs. Saxena, Sloma, Sklar and Santoni are independent directors of the Company under the listing standards adopted by the Nasdaq Stock Market. All directors have held the positions with the companies (or their predecessors) set forth under “Principal Occupation” for at least five years, unless otherwise indicated.
Name | Age | Principal Occupation | Director Since | Term To Expire | ||||
| NOMINEES | ||||||||
| Gregory T. Sloma | 53 | Executive Vice President and Chief Financial Officer of SpeedNet Services, Inc.(1) | 2004 | 2005 | ||||
| Jeffrey L. Sklar, M.D., Ph.D. | 57 | Professor of Pathology, Yale University School of Medicine(2) | 1997 | 2005 | ||||
| DIRECTORS CONTINUING IN OFFICE | ||||||||
| Gregory J. Duman | 49 | President of Prism Technologies LLC(3) | 2000 | 2006 | ||||
| Roland J. Santoni | 63 | Vice President of West Development, Inc.(4) | 2000 | 2006 | ||||
| Collin J. D’Silva | 48 | President and Chief Executive Officer of the Company(5) | 1997 | 2007 | ||||
| Parag Saxena | 49 | Chief Executive Officer of INVESCO Private Capital, Inc. | 1999 | 2007 | ||||
The Board of Directors has established and assigned certain responsibilities to an Audit Committee and a Compensation Committee. We do not have a standing nominating committee. The Board determined that due to the relatively small size of the Board, and due to the policy on director nominations, which is described below, it was not necessary to form a separate committee to evaluate director nominations. Under the director nomination policy, director candidates are identified primarily through suggestions made by directors, management and stockholders of the Company. We have implemented no material changes to the procedures by which shareholders may recommend nominees for the Board of Directors. The Board of Directors will consider director nominees
recommended by stockholders that are submitted in writing to the Secretary of the Company in a timely manner and which provide necessary biographical and business experience information regarding the nominee. All candidates for director will be evaluated based on their independence, character, judgment, diversity of experience, financial or business acumen, ability to represent and act on behalf of all shareholders, and the needs of the Board. In general, the Board expects to nominate incumbent directors who express an interest in continuing to serve on the Board. The independent directors of the Company review and consider all candidates to serve as a director of the Company who are properly suggested by directors, management and stockholders of the Company, and that the Board of Directors will select its nominees to serve as a director of the Company from among those candidates who are recommended to the Board of Directors by a majority of the independent directors of the Company.
Audit Committee. The Audit Committee’s primary duties and responsibilities include monitoring the integrity of our financial statements, monitoring the independence and performance of our external auditors, and monitoring our compliance with applicable legal and regulatory requirements. The functions of the Audit Committee also include reviewing periodically with independent auditors the performance of the services for which they are engaged, including reviewing the scope of the annual audit and its results, reviewing with management and the auditors the adequacy of our internal accounting controls, reviewing with management and the auditors the financial results prior to the filing of quarterly and annual reports, and reviewing fees charged by our independent auditors. Our independent auditors report directly and are accountable solely to the Audit Committee. The Audit Committee has the sole authority to hire and fire the independent auditors and is responsible for the oversight of the performance of their duties, including ensuring the independence of the independent auditors. The Audit Committee also approves in advance the retention of, and all fees to be paid to, the independent auditors. The rendering of any auditing services and all non-auditing services by the independent auditors is subject to the approval in advance of the Audit Committee. The Audit Committee operates under a written charter which is available on our website at www.transgenomic.com. The Audit Committee is required to be composed of directors who are independent of the Company under the rules of the Securities and Exchange Commission and under the listing standards of the Nasdaq Stock Market. The current members of the Audit Committee are directors Santoni, Saxena and Sloma. The Board of Directors has determined that Mr. Sloma qualifies as an “audit committee financial expert” under the rules of the Securities and Exchange Commission.
Compensation Committee.The Compensation Committee reviews and approves our compensation policy, changes in salary levels and bonus payments to our executive officers and other management and determines the timing and terms of awards made pursuant to our stock option plan. The Compensation Committee currently consists of directors Sklar, Santoni and Saxena, each of whom has been determined by the Board of Directors to be independent under the listing standards of the Nasdaq Stock Market.
Executive Officers.
Our executive officers are appointed annually by the Board of Directors at the first meeting following the annual stockholder’s meeting. Other officers are appointed by the Board of Directors from time to time. Each officer holds office until a successor has been duly appointed and qualified or until the death, resignation or removal of such officer.
Our officers and their ages as of December 31, 2004 are listed below followed by a brief biography.
This Annual Report on Form 10-K references the following registered trademarks which are the property of Transgenomic: DNASEP® Columns, WAVE® System, WAVEMAKER® Software, TRANSFORMING THE WORLD® for Laboratory Equipment, TRANSGENOMIC® and the Globe Logo®; MutationDiscovery.com® Website, OLIGOSEP® for Systems and Reagents, OPTIMASE® Polymerase, RNASEP® Columns, SURVEYOR® WAVE OPTIMIZED® reagents, and WAVE® MD Systems. Additionally, this Annual Report on Form 10-K references the following trademarks which are the property of Transgenomic: MitoScreen™ Kits, ProtocolWriter™ Software, Navigator™ Software, THE POWER OF DISCOVERY™ for Lab Reagents and Educational Programs, and Surveyor™ Nuclease. All other trademarks or trade names referred to in this Annual Report on Form 10-K are the property of their respective owners.
FORWARD-LOOKING STATEMENTS
This Annual Report on Form 10-K contains or incorporates by reference certain forward-looking statements. Many of these forward-looking statements refer to our plans, objectives, expectations and intentions, as well as our future financial results and are subject to risk and uncertainty. You can identify these forward-looking statements by words such as “expects,” “anticipates,” “intends,” “plans,” “may,” “will,” “believes,” “seeks,” “estimates” and similar expressions. Because these forward-looking statements involve risks and uncertainties, there are many factors that could cause our actual results to differ materially from those expressed or implied by these forward-looking statements, including those discussed under “Risks Related to Our Business” and other factors identified by cautionary language used elsewhere in the Annual Report on Form 10-K.
Business |
Transgenomic, Inc. (the “Company”) provides innovative products for the synthesis, purification and analysis of nucleic acids used in the life sciences industry for research focused on molecular genetics and diagnostics. We also provide genetic variation analytical services to the medical research, clinical and pharmaceutical markets. Net sales are categorized as bioinstruments, bioconsumables and discovery services.
· | Bioinstruments. Our flagship product is the WAVE System which has broad applicability to genetic variation detection in both molecular genetic research and molecular diagnostics. There is a world-wide installed base of over 1,350 WAVE Systems as of December 31, 2006. We also distribute bioinstruments produced by other manufacturers through our sales and distribution network. Service contracts to maintain installed systems are sold and supported by technical support personnel. |
· | Bioconsumables. The installed WAVE base and some third-party installed platforms generate a demand for consumables that are required for the system’s continued operation. We develop, manufacture and sell these products. In addition, we manufacture and sell consumable products that can be used on multiple, independent platforms. These products include SURVEYOR Nuclease and a range of HPLC separation columns. |
· | Discovery Services. We provide various genetic laboratory services through a contract research lab in Gaithersburg, Maryland and a second laboratory in Omaha, Nebraska that operates in a Good Laboratory Practices (“GLP”) compliant environment and is certified under the Clinical Laboratory Improvement Amendment. The services provided primarily include (1) genomic biomarker analysis services to pharmaceutical and biopharmaceutical companies to support preclinical and clinical development of targeted therapeutics; and (2) molecular-based testing for hematology, oncology and certain inherited diseases for physicians and third-party laboratories. |
Historically, we operated a segment (the “Nucleic Acids operating segment”) that developed, manufactured and marketed chemical building blocks for nucleic acid synthesis. In the fourth quarter of 2005, we implemented a plan to exit the Nucleic Acids operating segment and have recently completed the sale of the remaining assets associated with this segment. Accordingly, the assets and results of the Nucleic Acids operating segment are reflected as discontinued operations for all periods presented in this filing.
Business Strategy
Since inception, our business strategy has been to provide products and services to biomedical researchers, medical institutions, diagnostic and pharmaceutical companies that are tied to advancements in the field of genomics. Advances in genomics have fueled efforts to understand individual differences in disease susceptibility, disease progression, and response to therapy. Accordingly, a principal component of our strategy has been to establish our WAVE System as an industry standard in the biomedical research market and to develop additional markets for the WAVE System such as clinical research and diagnostics. Through an expanding base of installed systems, we expect to increase the sales of consumable products used with the WAVE System and create opportunities to market additional products to this customer base.
In addition, through our Discovery Services offerings, we have gained exposure to the translational and clinical research markets, laying the foundation for increasing our participation in the full value chain associated with activities ranging from basic biomedical research to development of diagnostic and therapeutic products. During the fourth quarter of 2005, our laboratory in Omaha, Nebraska was certified under the Clinical Laboratory Improvement Amendments and we received our first patient samples for molecular-based testing for hematology, oncology and certain inherited diseases for physicians and third-party laboratories. We believe there is a significant opportunity for us to capitalize on the increasing demand for molecular-based personalized medicine by leveraging on our technologies and experience gained from the genomic biomarker analysis that our Discovery Services Group has and will continue to provide to pharmaceutical and biopharmaceutical companies.
Significant Recent Events
There have been key changes to our senior management.
On April 3, 2006, Collin J. D’Silva.D’Silva resigned as our President and Chief Executive Officer. Mr. D’Silva has served as our Chairman until January 19, 2007, when he also resigned from our Board of Directors and as our Chairman. The Board of Directors appointed Gregory Sloma, a current independent director, to serve as the interim Chairman of the BoardBoard.
Craig J. Tuttle joined the Company as the President and Chief Executive Officer since 1997on July 12, 2006, Mr. Tuttle, age 54, has over 25 years of general management, sales and is alsomarketing, and research and development experience in medical diagnostic and biotechnology companies. During 2004 and 2005, Mr. Tuttle was the President and Chief Operating Officer of Duke Scientific, a Director. Mr. D’Silva, a co-founderNorthern California specialty chemistry manufacturer, and led the sale of Transgenomic, has worked forDuke Scientific to Fisher Healthcare in 2005.
On September 20, 2006, Michael A. Summers, resigned as our Chief Financial Officer in order to pursue another professional opportunity. On December 4, 2006, Debra A. Schneider, age 48, joined the Company and its predecessors since 1988. Mr. D’Silva was employed by AT&T from 1980 to 1988. At AT&T, he held various positions in engineering, materials management, sales support and business development. His last position at AT&T was Business Unit Manager and Engineering Manager for a network distribution products division. Mr. D’Silva holds a B.S. degree and a M.Eng. degree in industrial engineering from Iowa State University and an M.B.A. from Creighton University.
Michael A. Summers.Mr. Summers joined Transgenomic, Inc. in August 2004 and currently serves as Chief Financial Officer. Mr. Summers was employed with C&A Industries, Inc. from 2003 to 2004 where as General Manager he was responsible for the operations of various divisions that provided human capital management and consulting services. From 2001 to 2003, he was Executive Vice President and Chief Financial Officer. Ms. Schneider also serves as the Secretary and Treasurer of the Company. Ms. Schneider was most recently employed by First Data Corporation, a provider of processing and related services to institutions issuing credit and debit cards. Ms Schneider’s tenure at First Data Corporation covered seventeen years during which she served in a number of roles including finance planning, accounting and Chief Financial Officer for Nexterna, Inc.,various business units. Most recently she served as Senior Vice President of Finance.
The Company has been engaged in a wholly-owned technology subsidiaryprocess of exploring strategic alternatives, which it recently terminated.
The Company’s Board of Directors hired an independent financial advisor to assist the Board in its evaluation of potential strategic alternatives available to the Company that included but were not
limited to (i) the sale of all or a portion of the Union Pacific Corporation. From 2000 to 2001, he wascontinuing business or related assets; (ii) the Chief Accounting Officer for Able Telcom Holding Corp.,acquisition of complementary businesses or assets; (iii) a publicly-owned projectmerger; and (iv) other complementary business partnerships and collaborations. Although the financial advisor contacted a substantial number of companies, both in and outside of the genomics industry, regarding a potential strategic transaction, and management and construction company. Mr. Summers graduated from Creighton University in 1987entered into negotiations with a B.S. degree in business administrationnumber of these companies, no agreements were reached with an accounting major. He isany company with respect to such a Certified Public Accountant.
Keith A. Johnson.Mr. Johnson joined us in 2002 as Vice President, General Counsel. Mr. Johnson has a B.A. in Biochemistry from Kalamazoo College, an M.B.A. in International Business and Marketing from Michigan State, and a law degree from the University of San Diego. Before joining Transgenomic Mr. Johnson was Director of Intellectual Property, Technology Development and Licensing at Integra LifeSciences in Plainsboro, NJ, from 1999 to 2001. Mr. Johnson’s previous experience also includes Senior Licensing Manager, Rutgers University, from 1998 to 1999 and Technology Licensing Officer, Washington State University, from 1995 to 1998. Mr. Johnson is a member of the state bars of California, Washington, New Jersey and Nebraska and is admitted to practice before the United States Patent and Trade Office.
Mitchell L. Murphy.Mr. Murphy joined us in 1992. His current duties include the overall corporate administration and shareholder relations. Prior to joining Transgenomic, he held accounting and financial management positions for 15 years with companies involved in manufacturing, steel distribution and rebar fabrication. He spent over two years as an auditor for the Omaha, Nebraska office of Deloitte, Haskins & Sells (now Deloitte & Touche LLP) working in a broad range of industries. Mr. Murphy graduated with honors from Creighton University in 1978 with a B.S. degree in business administration with an accounting major.
Section16(a) Beneficial Ownership Reporting Compliance. Item 405 of Regulation S-K requires disclosure of any known late filing or failure by an insider to file a report required by Section 16 of the Securities Exchange Act of 1934. We believe all Section 16 reports were filed in a timely manner during 2004.
Code of Ethics.transaction. The Board of Directors has adoptedelected to terminate its contract with the independent financial advisor effective April 25, 2007.
We exited our former Nucleic Acids operating segment.
On December 22, 2005, the Company’s Directors voted to either sell or close and liquidate the Nucleic Acids operating segment, which consisted primarily of a codemanufacturing facility in Glasgow, Scotland. This decision was made after an evaluation of, ethical conduct that appliesamong other things, short and long-term sales projections for products sold by this operating segment, including estimates of 2006 sales to our principal executive officersthe operating segment’s largest customer. While opportunities to sell this operating segment as a going concern were evaluated, we did not receive any offers to purchase the Nucleic Acids operating segment. Accordingly, we closed the Glasgow facility and senior financial officers as required by Section 406began the liquidation of the Sarbanes Oxley Act of 2002. This code of ethical conduct is embodied within our Business Ethics Policy, which applies to all personsassets associated with the Company,Nucleic Acids operating segment. All employees of this operating segment were either dismissed or redeployed to our Bioinstruments operating segment. The Glasgow facility was sold on February 28, 2007 for approximately $2.7 million after associated selling costs. Proceeds will be used in the normal operations of the Company.
We have continued to work to reduce operating costs
On February 20, 2007, we announced a cost reduction plan designed to align our cost structure with anticipated revenues. The plan is expected to yield annualized savings of approximately $1.5 million once all components of the plan are fully implemented. The closing of the Company’s Cramlington, England production facility is the principal component of this plan. We expect to incur aggregate charges estimated at $1.2 to $1.4 million during the first and second quarters of 2007, relating primarily to severance, benefits and facility closure costs.
Our stock has been delisted from the Nasdaq Capital Market and is now trading on the OTC Bulletin Board (OTCBB)
On February 1, 2007, we received a staff determination letter from Nasdaq’s Listing Qualifications Department indicating that we no longer met the minimum bid price requirement for continued listing on the Nasdaq Capital Market. As a result, the listing of our common stock on the Nasdaq Capital Market was ended on February 22, 2007. Trading information about our common stock became available on the OTC Bulletin Board beginning on February 26, 2007.
Sales and Marketing
We have sold our products to customers in over 50 countries. We use a direct sales and support staff for sales in the U.S., U.K. and most countries in Western Europe. For the rest of the world, we sell our products through dealers and distributors located in those local markets. We have over 35 dealers and distributors. We also maintain regionally-based technical support staffs and applications scientists to support our sales and marketing activities throughout the U.S. and Europe. The nature of our instruments and bioconsumables business does not generally lend itself to tracking and reporting sales backlog.
Customers
Customers include numerous leading academic and medical institutions in the U.S. and abroad. In addition, our customers also include a number of large, established U.S. and foreign pharmaceutical, biotech and commercial companies. No customer accounts for more than 10% of consolidated net sales.
Research and Development
We maintain an active program of research and development primarily directed toward the improvement of the DNA separation media used in our WAVE System, the refinement of the hardware and software components of the WAVE System, the creation of unique enzymes and WAVE-Optimized enzymes, and the development of assays on the WAVE System. We have also focused on further refinements and process manufacturing improvements for our Surveyor DNA mismatch cutting enzyme. Most importantly, we completed a large cancer mutation scanning study where we employed our SURVEYOR and WAVE System technology to discover a significant number of cancer linked mutations which we believe may have commercial value in the future. We plan to prepare patent submissions on discovered mutations for up to 40 key cancer regulating and signaling genes.
For the years ended December 31, 2006, 2005 and 2004, our research and development expenses were $2.36 million, $2.20 million and $4.50 million, respectively. We will need to continue to invest in research and development activities in order to remain competitive and to take advantage of new business opportunities as they arise. During 2007, we expect research and development expense to be approximately equal to the 2006 levels.
In addition to the amounts reflected above, our discontinued operations incurred no research and development expenses during the years ended December 31, 2006 and 2005 and $2.18 million during the year ended December 31, 2004.
Manufacturing
We manufacture bioconsumable products including our directors, officers,separation columns, liquid reagents, and enzymes. The major components of our WAVE Systems are manufactured for us by a third party. We integrate our own hardware and software with these third party manufactured components. Our manufacturing facilities for our WAVE Systems and bioconsumables are located in Omaha, Nebraska, San Jose, California, and Cramlington, England (through December 31, 2006). As noted earlier, we plan to close the Cramlington, England facility in 2007.
Intellectual Property
To establish and protect our proprietary technologies and products, we rely on a combination of patent, copyright, trademark and trade-secret laws, as well as confidentiality provisions in our contracts. We presently own rights to more than 70 issued patents and 13 pending applications in both the U.S. and abroad. Our WAVE System and related consumables are protected by patents and in-licensed technologies that expire in various periods beginning in 2013 through 2022. We will continue to file patent applications and seek new licenses as warranted to protect and develop new technologies of interest to our customer base in the coming years.
Competition
The markets in which we operate are highly competitive and characterized by rapidly changing technological advances. A number of our competitors possess substantial resources and are able to develop and offer a much greater breadth of products and/or services, coupled with significant marketing and distribution capabilities. We compete principally on the basis of uniquely enabling technical advantages in specific but significant market segments.
Competition for our WAVE Systems arises primarily from DNA sequencing and genotyping technologies. Competitors in these areas include Applied Biosystems, Beckman Coulter, Amersham (now part of GE Healthcare), Affymetrix, Agilent Technologies, Nanogen, Illumina, Sequenom, Pyrosequencing (now part of Biotage AB), Varian, and others. Competition for some of our non-WAVE consumable products comes from numerous well-diversified life sciences reagents providers, including, among others, Invitrogen, Qiagen, Roche, Stratagene, and Promega. Our discovery services face competition from a number of companies offering contract DNA sequencing and other genomic analysis services, including Genaissance Pharmaceuticals, GeneLogic, Agencourt, SeqWright, Gentris, and Perlagen. In addition, several clinical diagnostics service providers, such as Labcorp, Quest, and Specialty Laboratories, also offer related laboratory services in support of clinical trials. Finally, additional competition arises from academic core laboratory facilities.
Employees
As of December 31, 2006, 2005 and 2004, we had employees focused in the following areas of our operation:
| December 31, | ||||||
| 2006 | 2005 | 2004 | ||||
Manufacturing | 47 | 56 | 52 | |||
Sales, Marketing and Administration | 65 | 73 | 75 | |||
Research and Development | 16 | 10 | 19 | |||
| 128 | 139 | 146 | ||||
Personnel associated with discontinued operations | — | 17 | 32 | |||
| 128 | 156 | 178 | ||||
Our employees were employed in the following geographical locations:
| December 31, | ||||||
| 2006 | 2005 | 2004 | ||||
United States | 84 | 94 | 106 | |||
Europe (other than the United Kingdom) | 23 | 23 | 22 | |||
United Kingdom | 21 | 39 | 50 | |||
| 128 | 156 | 178 | ||||
We supplement our workforce through the use of independent contractors and compliesconsultants. At December 31, 2006, 2005 and 2004, we have engaged independent contractors or consultants who provide services to us approximately equivalent to one, one and five full-time employees, respectively.
General Information
We were incorporated in Delaware on March 6, 1997. Our principal office is located at 12325 Emmet Street, Omaha, Nebraska 68164 (telephone: 402-452-5400). We maintain manufacturing facilities in Omaha, Nebraska, San Jose, California, and Cramlington, England. We maintain research and development offices in Gaithersburg, Maryland and Omaha, Nebraska. As noted earlier, we plan to close the Cramlington, England facility in 2007.
We make reports filed by us with the listing standards adoptedSEC available free of charge on our website as soon as reasonably practicable after these reports are filed. The address of our website iswww.transgenomic.com. Information on our website, including any SEC report, is not part of this Annual Report on Form 10-K.
Risk Factors |
We may not have adequate financial resources to execute our business plan.
We have historically operated at a loss and have not generated sufficient cash from operating activities to cover our operating and other cash expenses. While we have been able to historically finance our operating losses through borrowings or from the issuance of additional equity, we currently have no plans to borrow additional funds or to issue additional equity securities for this purpose. At March 30, 2007 and December 31, 2006, we had cash and cash equivalents of$7.91 million and $5.87 million, respectively. While we believe that existing sources of liquidity are sufficient to meet expected cash needs through 2007, we will need to increase our revenues or further reduce our operating expenses in order to be assured of meeting our liquidity needs on a long-term basis. However, we cannot assure you that we will be able to increase our revenues or further reduce our expenses and, accordingly, we may not have sufficient sources of liquidity to continue the operations of the Company indefinitely.
We have a history of operating losses and may incur losses in the future.
We have experienced annual losses from continuing operations since inception of our operations. Our losses from continuing operations for the years ended December 31, 2006, 2005 and 2004 were $2.96 million, $4.98 million, and $13.75 million, respectively. These losses have been due principally to the high levels of research and development expenses and sales and marketing expenses that we have incurred in order to develop and market our products, the fixed nature of our manufacturing costs, restructuring charges and impairment charges. In addition, markets for our products and services have developed more slowly than expected in many cases and may continue to do so. As a result, we may incur operating losses in the future.
Markets for our products and services may continue to develop slowly.
There are many factors that affect the market demand for our products and services that we cannot control. Demand for our WAVE System is affected by the Nasdaq Stock Market.needs and budgetary resources of research institutions, universities, hospitals and others who use the WAVE System for genetic-variation research. The Business Ethics PolicyWAVE System represents a significant expenditure by these types of customers and often requires a long sales cycle. If revenues from the sales of our products and services continue at current levels, we may need to take steps to further reduce operating expenses or raise additional working capital. We cannot assure you that sales will increase or that we will be able to reduce operating expenses or raise additional working capital. Similarly, the sales cycle for the OEM products that we sell can also be a long sales cycle.
Sales of our Discovery Services have been variable.
Sales of discovery services have varied significantly due in large part to the fact that approximately 82% and 90% of discovery services sales in 2004 and 2005, respectively, were realized from orders from a single large pharmaceutical company. Sales to this customer were governed by a non-binding master services agreement dated August 22, 2002. Accordingly, the amount of sales to this customer is subject to change. In 2006, we did not sell any discovery services to this customer.
The sale of our products and business operations in international markets subjects us to additional risks.
During the past several years, international sales have represented more than half of our total net sales. As a result, a major portion of our revenues and expenses are subject to risks associated with international sales and operations. These risks include:
Ÿ | payment cycles in foreign markets are typically longer than in the U.S., and capital spending budgets for research agencies can vary over time with foreign governments; |
Ÿ | changes in foreign currency exchange rates can make our products more costly and operating expenses higher in local currencies since our foreign sales and operating expenses are typically paid for in U.S. Dollars, British Pounds or the Euro; and |
Ÿ | the potential for changes in U.S. and foreign laws or regulations that result in additional import or export restrictions, higher tariffs or other taxes, more burdensome licensing requirements or similar impediments to our ability to sell products and services profitably in these markets. |
Our WAVE System includes hardware components and instrumentation manufactured by a single supplier and if we are no longer able to obtain these components and instrumentation our ability to manufacture our products could be impaired.
We rely on a single supplier, Hitachi High Technologies America, to provide the basic instrument used in our WAVE Systems. While other suppliers of instrumentation and computer hardware are available, we believe that our arrangement with Hitachi offers strategic advantages. Hitachi is replacing its current instrument line with a new instrument line. While we presently plan to convert our technology and applications to this new instrument line, such conversion may not be successful and, therefore, we may incur additional costs for the custom manufacturing of the current instrument line. If we were required to seek alternative sources of supply, it could be time consuming or expensive or require significant and costly modification of our WAVE System. Also, if we were unable to obtain instruments from Hitachi in sufficient quantities or in a timely manner, our ability to manufacture our products could be impaired, which could limit our future revenues.
We may not have adequate personnel to execute our business plan.
In order to reduce our operating costs, we have reduced the number of employees in all area of the business. In addition, we may lose other key management, scientific, technical, sales and manufacturing personnel from time to time. It may be very difficult to replace personnel if they are needed in the future, and the loss of key personnel could harm our business and operating results. We cannot assure you that our employee reductions will not impair our ability to continue to develop new products and refine existing products in order to remain competitive. In addition, these reductions could prevent us from successfully marketing our products and developing our customer base.
Our markets are very competitive.
Many of our competitors have greater resources than we do and/or may enjoy other competitive advantages. This may allow them to more effectively market their products to our customers or potential customers, to develop products that make our products obsolete or to produce and sell products less expensively than us. As a result of these competitive factors, demand for and pricing of our products and services could be negatively affected.
Our patents may not protect us from others using our technology that could harm our business and competitive position.
Patent law relating to the scope of claims in the technology fields in which we operate is still evolving. The degree of future protection for our proprietary rights is uncertain. Furthermore, we cannot be certain that others will not independently develop similar or alternative products or technology, duplicate any of our products, or, if patents are issued to us, design around the patented products developed by us. Our patents or licenses could be challenged by litigation and, if the outcome of such litigation were adverse to us, our competitors could be free to use our technology. We may not be able to obtain additional patents for our technology, or if we are able to do so, patents may not provide us with substantial protection or be commercially beneficial. In addition, we could incur substantial costs in litigation if we are required to defend ourselves in patent suits brought by third parties or if we initiate such suits.
We cannot be certain that other measures taken to protect our intellectual property will be effective.
We rely upon trade secret protection, copyright and trademark laws, non-disclosure agreements and other contractual provisions for some of our confidential and proprietary information that is not subject matter for which patent protection is being sought. Such measures, however, may not provide adequate protection for our trade secrets or other proprietary information. If such measures do not protect our rights, third parties could use our technology and our ability to compete in the market would be reduced.
We are dependent upon our licensed technologies and may need to obtain additional licenses in the future to offer our products and remain competitive.
We have licensed key components of our technologies from third parties. If these agreements were to terminate prematurely due to our breach of the terms of these licenses or we otherwise fail to maintain our rights to such technology, we may lose the right to manufacture or sell a substantial portion of our products. In addition, we may need to obtain licenses to additional technologies in the future in order to keep our products competitive. If we fail to license or otherwise acquire necessary technologies, we may not be able to develop new products that we need to remain competitive.
The protection of intellectual property in foreign countries is uncertain.
A significant percentage of our sales are to customers located outside the U.S. The patent and other intellectual property laws of some foreign countries may not protect our intellectual property rights to the same extent as U.S. laws. We may need to bring proceedings to defend our patent rights or to determine the validity of our competitors’ foreign patents. These proceedings could result in substantial cost and diversion of our efforts. Finally, some of our patent protection in the U.S. is not available to us in foreign countries due to the laws of those countries.
Our products could infringe on the intellectual property rights of others.
There are a significant number of U.S. and foreign patents and patent applications submitted for technologies in, or related to, our area of business. As a result, any application or exploitation of our technology could infringe patents or proprietary rights of others and any licenses that we might need as a result of such infringement might not be available to us on commercially reasonable terms, if at all. This may lead others to assert patent infringement or other intellectual property claims against us.
Our failure to comply with any applicable government regulations or otherwise respond to claims relating to improper handling, storage or disposal of hazardous chemicals that we use may adversely affect our results of operations.
Our research and development and manufacturing activities involve the controlled use of hazardous materials and chemicals. We are subject to federal, state, local and international laws and regulations governing the use, storage, handling and disposal of hazardous materials and waste products. If we fail to comply with applicable laws or regulations, we could be required to pay penalties or be held liable for any damages that result and this liability could exceed our financial resources. We cannot assure you that accidental contamination or injury will not occur. Any such accident could damage our research and manufacturing facilities and operations, resulting in delays and increased costs.
The price for our common stock is volatile and may drop.
The trading price for our common stock has fluctuated significantly over recent years. The volatility in the price of our stock is attributable to a number of factors, not all of which relate to our operating results and financial position. The delisting of our stock from the NASDAQ may negatively affect the volume of shares traded and the price for our stock. Continued volatility in the market price for our stock should be expected and we cannot assure you that the price of our stock will not decrease in the future. Fluctuations or further declines in the price of our stock may affect our ability to sell shares of our stock and to raise capital through future equity financing.
Our common stock is deemed to be “penny stock”, which may make it more difficult for investors to sell their shares due to suitability requirements.
Our common stock is classified as a “penny stock” under the rules of the SEC. The Securities and Exchange Commission has adopted Rule 3a51-1 which establishes the definition of a “penny stock”, for the purposes relevant to us, as any equity security that has a market price of less than $5.00 per share or with an exercise price of less than $5.00 per share, subject to certain exceptions. For any transaction involving a penny stock, unless exempt, Rule 15g-9 requires:
· | that a broker or dealer approve a person's account for transactions in penny stocks; and |
· | that the broker or dealer receives from the investor a written agreement to the transaction, setting forth the identity and quantity of the penny stock to be purchased. |
In order to approve a person's account for transactions in penny stocks, the broker or dealer must:
· | obtain financial information and investment experience objectives of the person; and |
· | make a reasonable determination that the transactions in penny stocks are suitable for that person and the person has sufficient knowledge and experience in financial matters to be capable of evaluating the risks of transactions in penny stocks. |
The broker or dealer must also deliver, prior to any transaction in a penny stock, a disclosure schedule prescribed by the SEC relating to the penny stock market, which, in highlight form:
· | sets forth the basis on which the broker or dealer made the suitability determination; and |
· | that the broker or dealer received a signed, written agreement from the investor prior to the transaction. |
Generally, brokers may be less willing to execute transactions in securities subject to the "penny stock" rules. This may make it more difficult for investors to dispose of our common stock and cause a decline in the market value of our stock.
Disclosure also has to be made about the risks of investing in penny stocks in both public offerings and in secondary trading and about the commissions payable to both the broker-dealer and the registered representative, current quotations for the securities and the rights and remedies available to an investor in cases of fraud in penny stock transactions. Finally, monthly statements have to be sent disclosing recent price information for the penny stock held in the account and information on the limited market in penny stocks.
We may issue a substantial amount of our common stock to holders of options and warrants and this could reduce the market price for our stock.
At December 31, 2006, we had obligations to issue 13,530,241 shares of common stock including outstanding stock options representing 5,467,664 shares and warrants representing 8,062,577 shares. The issuance of these additional shares of common stock may be dilutive to our current shareholders and could negatively impact the market price of our common stock.
Our common stock is thinly traded and a large percentage of our shares are held by a small group of unrelated, institutional owners.
At March 30, 2007, we had 49,189,672 shares of common stock outstanding. Fewer than ten unrelated, institutional holders own more than 50% of these shares The sale of significant shares into the public market has potential to cause significant downward pressure on the price of our common stock. This is particularly the case if the shares being placed into the market exceed the market’s ability to absorb the stock. Such an event could place further downward pressure on the price of our common stock. This presents an opportunity for short sellers to contribute to the further decline of our stock price. If there are significant short sales of our stock, the price decline that would result from this activity will cause the share price to decline more so, which, in turn, may cause long holders of the stock to sell their shares thereby contributing to sales of stock in the market.
Unresolved Staff Comments |
None.
Properties |
We currently lease and occupy a total of seven facilities throughout the world under non-cancelable leases with various terms. The following table summarizes certain information regarding the leased facilities. Annual rent amounts presented in the table are reflected in thousands.
Location | Function | Square Footage | 2007 Scheduled Rent | Lease Term | ||||
Omaha, Nebraska | WAVE and Consumable Manufacturing | 25,000 | $130 | June 2009 | ||||
San Jose, California | Consumable Manufacturing | 14,360 | $158 | October 2010 | ||||
Cramlington, England | Consumable Manufacturing(2) | 8,500 | $73 | March 2008 | ||||
Glasgow, Scotland | Multi Functional(1) | 5,059 | $31 | March 2012 | ||||
Omaha, Nebraska | Multi Functional(1) | 18,265 | $201 | July 2012 | ||||
Paris, France | Multi Functional(1) | 4,753 | $962 | January 2014 | ||||
Gaithersburg, Maryland | Multi Functional(1) | 6,560 | $46 | May 2007 |
(1) | Multi Functional facilities include functions related to manufacturing, services, sales and marketing, research and development and/or administration. |
(2) | As noted earlier, we plan to close this facility in 2007. Notice has been given to landlord, we will exit facility in March 2008. |
The Company no longer occupies its former facilities in San Diego, California and Cambridge, Massachusetts and leases on these facilities expired in January 2007. The Company expects to be able to renew leases that expire in 2007 on terms substantially similar to the existing lease terms.
Legal Proceedings |
The Company is not a party to any pending legal proceedings which, if decided adversely to the Company, will have a material adverse effect on our financial position, results of operations or cash flows.
Submission of Matters to a Vote of Security Holders. |
We did not submit any matters to our stockholders for a vote or other approval during the fourth quarter of the fiscal year covered by this report.
Market for Registrant’s Common Stock, Related Stockholder Matters and Issuer Purchases of Equity Securities |
Market Information. Share price information for our common stock is available on the OTC Bulletin Board under the symbol TBIO.OB. Prior to February 22, 2007, our website at www.transgenomic.com.
Item 11. Executive Compensation.
common stock was listed for trading on the Nasdaq Capital Market under the symbol TBIO. The following table sets forth the high and low closing prices for our common stock during each of the quarters of 2005 and 2006.
| High | Low | |||||
Year Ended December 31, 2005 | ||||||
First Quarter | $ | 1.11 | $ | 0.53 | ||
Second Quarter | $ | 0.90 | $ | 0.45 | ||
Third Quarter | $ | 1.24 | $ | 0.70 | ||
Fourth Quarter | $ | 1.11 | $ | 0.80 | ||
Year Ended December 31, 2006 | ||||||
First Quarter | $ | 1.03 | $ | 0.62 | ||
Second Quarter | $ | 0.84 | $ | 0.39 | ||
Third Quarter | $ | 0.77 | $ | 0.31 | ||
Fourth Quarter | $ | 0.89 | $ | 0.40 | ||
Holders. At March 30, 2007, there are 49,189,672 shares of our common stock outstanding and approximately 3,310 holders of record.
Dividends. We have never declared or paid any cash dividends on our common stock and we do not anticipate paying any cash dividends on our common stock in the foreseeable future. We expect to retain all earnings, if any, for investment in our business. Dividends on our common stock will be paid only if and when declared by our Board of Directors. The Board’s ability to declare a dividend is subject to limits imposed by Delaware corporate law. In determining whether to declare dividends, the Board may consider our financial condition, results of operations, working capital requirements, future prospects and other relevant factors.
Securities authorized for issuance under equity compensation plans.
The following equity compensation plan information summarizes plans and securities approved and not approved by security holders as of December 31, 2006.
| (a) | (b) | (c) | ||||
PLAN CATEGORY | Number of | Weighted-average option, warrants | Number of securities remaining available for future issuance under equity compensation plans (excluding securities reflected in column (a) | |||
Equity compensation plans approved by security holders(1) | 5,467,664 | $4.08 | 3,778,567 | |||
Equity compensation plans not approved by security holders | — | — | — | |||
Total | 5,467,664 | $4.08 | 3,778,567 | |||
(1) | Consists of our 2006 Equity Compensation Plan |
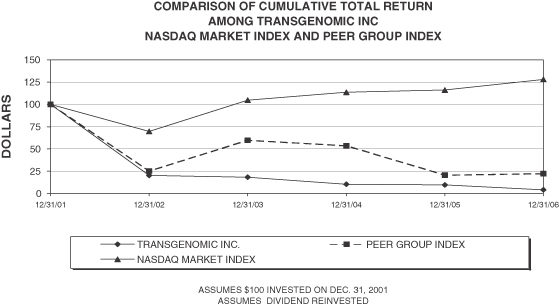
Five Year Performance Comparison: The following graph provides an indicator of cumulative total shareholder returns for the Company as compared to a peer group index comprised of Argonaut Technologies, Caliper Life Sciences, Cepheid, Cipergen Biosystems, Inc,Harvard Bioscience IC, Illumina, Inc., Luminex Corporation, Nuvelo, Inc., Orchid Biosciences, Inc. and Sequenom, Inc and to the Nasdaq Market Index. The graph assumes that the value of the investment in the Company’s common stock, the Nasdaq Market Index and the Peer Group Index, was $100 on December 31, 2001, and that all dividends were reinvested.
Sale of Unregistered Securities. The Company made no sales of its common stock during the years ended December 31, 2006 and 2004 that were not registered under the Securities Act of 1933 (the “Securities Act”). Information regarding sales of equity securities by the annualCompany during the years ended December 31, 2005 that were not registered under the Securities Act of 1933 have been previously reported by the Company on Form 8-Ks filed on March 18, 2005, March 30, 2005 and October 31, 2005.
Issuer Purchase of Equity Securities. The Company made no purchases of its common stock during the quarter ended December 31, 2006. Therefore, tabular disclosure is not presented.
Selected Consolidated Financial Data |
The selected consolidated balance sheet data as of December 31, 2006 and 2005 and the selected consolidated statements of operations data for each year ended December 31, 2006, 2005 and 2004 have been derived from our audited consolidated financial statements that are included elsewhere in this Annual Report on Form 10-K. The selected consolidated balance sheet data as of December 31, 2004, 2003 and 2002 and the selected consolidated statements of operations data for each year ended December 31, 2003 and 2002 have been derived from our audited consolidated financial statements that are not included in this Annual Report on Form 10-K. Dollar amounts, except per share data, are presented in thousands.
| Year Ended December 31, | ||||||||||||||||||||
| 2006 | 2005 | 2004 | 2003 | 2002 | ||||||||||||||||
Statement of Operations Data: | ||||||||||||||||||||
Net sales | $ | 23,415 | $ | 25,828 | $ | 25,243 | $ | 26,044 | $ | 24,235 | ||||||||||
Cost of good sold | 12,046 | 13,497 | 11,997 | 11,374 | 9,935 | |||||||||||||||
Gross profit | 11,369 | 12,331 | 13,246 | 14,670 | 14,300 | |||||||||||||||
Selling, general and administrative | 12,138 | 12,218 | 15,961 | 16,586 | 20,539 | |||||||||||||||
Research and development | 2,362 | 2,199 | 4,501 | 6,834 | 11,173 | |||||||||||||||
Restructuring charges(1) | — | — | 1,267 | 516 | 3,282 | |||||||||||||||
Impairment charges(2) | — | 425 | — | — | — | |||||||||||||||
Operating expenses | 14,500 | 14,842 | 21,729 | 23,936 | 34,994 | |||||||||||||||
Other income (expense)(3) | 198 | (2,447 | ) | (5,263 | ) | (181 | ) | 512 | ||||||||||||
Loss before income taxes | (2,933 | ) | (4,958 | ) | (13,746 | ) | (9,447 | ) | (20,182 | ) | ||||||||||
Income tax expense | 30 | 26 | 4 | 65 | 105 | |||||||||||||||
Loss from continuing operations | (2,963 | ) | (4,984 | ) | (13,750 | ) | (9,512 | ) | (20,287 | ) | ||||||||||
(Loss) income from discontinued operations, net of tax(4) | (468 | ) | (10,009 | ) | (20,622 | ) | (13,446 | ) | (1,078 | ) | ||||||||||
Net loss | $ | (3,431 | ) | $ | (14,993 | ) | $ | (34,372 | ) | $ | (22,958 | ) | $ | (21,365 | ) | |||||
Basic and diluted (loss) income per share:(4) | ||||||||||||||||||||
From continuing operations | $ | (0.06 | ) | $ | (0.14 | ) | $ | (0.47 | ) | $ | (0.39 | ) | $ | (0.86 | ) | |||||
From discontinued operations(4) | (0.01 | ) | (0.28 | ) | (0.72 | ) | (0.55 | ) | (0.05 | ) | ||||||||||
| $ | (0.07 | ) | $ | (0.42 | ) | $ | (1.19 | ) | $ | (0.94 | ) | $ | (0.91 | ) | ||||||
Basic and diluted weighted average shares outstanding | 49,188 | 35,688 | 29,006 | 24,484 | 23,583 | |||||||||||||||
| As of December 31, | ||||||||||||||||||||
| 2006 | 2005 | 2004 | 2003 | 2002 | ||||||||||||||||
Balance Sheet Data: | ||||||||||||||||||||
Total assets | $ | 21,367 | $ | 25,340 | $ | 37,458 | $ | 57,306 | $ | 74,035 | ||||||||||
Borrowings under credit line | — | — | 6,514 | 2,142 | — | |||||||||||||||
Current portion of long-term debt | — | — | 825 | 1,693 | 63 | |||||||||||||||
Long-term debt, less current portion | — | — | 2,199 | — | 1,499 | |||||||||||||||
Total stockholders’ equity | 16,038 | 17,906 | 16,535 | 45,058 | 61,515 | |||||||||||||||
(1) | Restructuring plans were implemented in 2002 and 2004 to reduce and align our expenses with current business prospects. The plans included employee terminations, office closures, termination of collaborations and write-offs of abandoned intellectual property. As a result, restructuring charges were recorded and are included in operating expenses. Refer to Note M to the accompanying consolidated financial statements. |
(2) | Impairment charges in 2005 relate to the impairment of patent pursuits and write-down of inventory to net realizable value. Refer to Notes to the accompanying consolidated financial statements. |
(3) | Other income (expense) for all years presented primarily includes interest expense and interest income, loss on debt extinguishment of $0.5 million in 2005 related to the repayment of long-term debt and $2.9 million resulting from certain modifications to long-term borrowing agreements that were treated as extinguishments for financial reporting purposes. Refer to Note F to the accompanying consolidated financial statements. |
(4) | During 2005, we decided to exit our Nucleic Acids operating segment and, as a result, we recorded impairment and exit charges of $8.8 million consisting of valuation adjustments to reflect the carrying value of related net assets at estimated fair market value. We now reflect the results of this business as discontinued operations for all periods presented. Refer to Note C to the accompanying consolidated financial statements. |
Management’s Discussion and Analysis of Financial Condition and Results of Operations. |
The following discussion should be read in conjunction with the Consolidated Financial Statements and applicable Notes to Consolidated Financial Statements and other information in this report, including Risk Factors set forth in Item 1A and Critical Accounting Policies at the end of this Item 7.
The Company’s continuing operations consist of the manufacture and sale of its WAVE System and related consumable products and discovery services which make use of the Company’s WAVE System to perform genomic research on a contract basis and disease testing services. These functions are categorized as one reportable operating segment. Although revenue is analyzed by type, the Company’s net financial results are analyzed as a single segment due to the integrated nature of the products and services that we sell. The Consolidated Financial Statements also reflect the assets and results of our former Nucleic Acids operating segment, which are shown as discontinued operations in all periods as a result of the implementation of a plan to exit this operating segment in the fourth quarter of 2005.
Executive Summary
2006 Results
Sales of bioinstruments and associated consumables continued to decline in 2006, due to a number of factors including competition from sequencing and other evolving technologies. Sales from our discovery services group during the year were down substantially from 2005 as we completed a significant engagement for a large pharmaceutical company and were not able to replace these sales in 2006. Although we have taken significant steps to reduce our operating expenses in response to declining revenues, we continued to operate at a loss and to generate a negative cash flow during the year. However, our loss and use of cash were reduced significantly over each of the last three years.
We continue to work to respond to changes in the overall business climate for our products and our liquidity position. On December 22, 2005, we decided to sell or close and liquidate the Nucleic Acids operating segment, which consisted primarily of a manufacturing facility in Glasgow, Scotland. This decision was made after an evaluation of, among other things, short and long-term compensation paidsales projections for products sold by this operating segment, including estimates of 2006 sales to the operating segment’s largest customer. While opportunities to sell the operating segment as a going concern were evaluated, we ultimately ended up closing the facility and terminating or redeploying all of the employees of this business segment. In February of 2007, we completed the sale of the facility in Glasgow, Scotland. We now reflect the results of this operating segment as discontinued operations for all periods presented.
As a result of the actions undertaken since the fourth quarter of 2004, including the reclassification of the Nucleic Acids operating segment as a discontinued operation, our losses from
continuing operations have gone from $13.75 million and $4.98 million in 2004 and 2005, respectively, to $2.96 million in 2006. Net cash flows used by operating activities have gone from $12.75 million and $3.63 million in 2004 and 2005, respectively to $1.21 million in 2006.
2007 Outlook
Timing of the demand for our products, particularly our flagship WAVE Systems, has been difficult to predict due largely to ongoing changes in the marketplace and the funding arrangements of our customers. Because our net sales are largely dependent upon sales of a limited number of products, including WAVE Systems and OEM Instruments, and our cost structure is largely fixed, historical results have been somewhat sporadic. For these reasons, it is not our practice to provide prospective financial guidance related specifically to revenues, costs, net income (loss) or cash flows. However, our financial objectives are to generate income from continuing operations and positive cash flows from continuing operations. To accomplish these goals we must generate sequential growth in net sales, leverage manufacturing expenses and continue to better control operating expenses. We will continue to look for opportunities, through consolidation or otherwise, to reduce our operating expenses related to our core business.
Develop sequential growth in net sales.
We will work to continue to leverage on and strengthen our core instrument business. Challenges exist for WAVE System and consumable growth in traditional markets. We believe emerging markets and novel applications will provide for opportunities for our WAVE System. We intend to continue to diversify into new markets, including the personalized medicine market (particularly in oncology), where the sensitivities of our technologies are essential. In the short-term, we believe that the introduction of the newest generation of our flagship product, the WAVE System 4500 will provide upgrade opportunities to our current installed base. In addition, we are also selling refurbished WAVESystems in order to allow an opportunity for customers that may not be able to afford the cost of a new system. In the intermediate to longer-term, we believe that newly developed “targeted” consumable products will increase usability of our installed base and enhance net sales of consumables. Additionally, we have developed credibility and momentum with third-party platforms that will allow us to leverage on our Chief Executive Officer,direct sales force and distribution network.
On the discovery services front, we will seek to leverage past successes with pharmaceutical customers to diversify our customer base. While we have performed discovery services for a number of large pharmaceutical customers, these engagements do not materialize at a constant rate and the lead time to develop major contracts is often lengthy. To mitigate this risk, we believe there is a significant opportunity for us to capitalize on the increasing demand for molecular-based personalized medicine by leveraging our technologies and experience gained from the genomic biomarker analysis that discovery services provides to pharmaceutical and biopharmaceutical companies. During the fourth quarter of 2005, our laboratory in Omaha, Nebraska was certified under the Clinical Laboratory Improvement Amendments, and we received our first patient samples from physicians and third-party laboratories for molecular-based testing for hematology, oncology and certain inherited diseases. This capability also allows us to offer a vertically-integrated suite of services that can support activities ranging from discovery research to clinical trials to diagnostic testing. As the need for drug/diagnostic combination products increases, we believe this suite of service offerings will prove attractive to various customers. We have recently added some new customers in this area of the business.
Continue to control operating expenses.
Operating expenses include selling, general and administrative expenses and research and development expenses. We will need to continue to invest in research and development activities in order to remain competitive and to take advantage of new business opportunities as they arise. During 2007, we expect operating expenses, including research and development expense, to be approximately equal to 2006 levels.
Results of Continuing Operations
Years Ended December 31, 2006 and 2005
Net Sales. Net sales for the years ended December 31, 2006 and 2005 consisted of the following (dollars in thousands):
| Change | ||||||||||||
| 2006 | 2005 | $ | % | |||||||||
Bioinstruments | $ | 13,604 | $ | 14,427 | $ | (823) | (6) | % | ||||
Bioconsumables | 8,719 | 8,981 | (262) | (3) | % | |||||||
Discovery Services | 1,092 | 2,420 | (1,328) | (55) | % | |||||||
Net sales | $ | 23,415 | $ | 25,828 | $ | (2,413) | (9) | % | ||||
Bioinstrument sales consist of sales of our WAVE System and associated equipment that we manufacture or assemble, revenues from service contracts that we enter into with purchasers of our instruments, as well as sales of instruments we distribute for other manufacturers (“OEM equipment”). We also sell refurbished WAVE Systems in order to access customers that may not be able to afford new systems. We sold 68 WAVE Systems during the year ended December 31, 2006 compared to 97 systems during the same period of 2005. This decrease resulted from lower demand in all major geographic markets and among both research and diagnostic users particularly in our largest markets throughout Western Europe. Demand for the WAVE has been affected by significant competitive challenges from traditional (i.e. sequencing) and evolving technologies. The decrease in WAVE System sales was largely offset by OEM instrument sales, increased net sales from product upgrades and service contracts.
Bioconsumable net sales decreased during year ended December 31, 2006 compared to 2005. Despite the increase in installed base of WAVE instruments from 1,290 units at December 31, 2005 to 1,358 units at December 31, 2006, we do not believe that all of these instruments are being fully utilized. In addition, consumable products are available from other manufacturers which can be used in place of many of our consumable products. Some of these competitive products sell at prices below the prices we charge for our products, which have caused us to have some price compression, principally in Europe.
The decrease in discovery services net sales was primarily attributable to the expiration of certain research contracts with a large pharmaceutical company in 2005, of $2,188 that was partially offset by increased net sales from research projects from other pharmaceutical companies and services provided by our CLIA lab, of $384.
Costs of Goods Sold Costs of goods sold include material costs for the products that we sell and substantially all other costs associated with our manufacturing facilities (primarily personnel costs, rent and depreciation) as well as the wholesale price we pay manufacturers of OEM equipment that we distribute. It also includes direct costs (primarily personnel costs, rent, supplies and depreciation) associated with our discovery services operations. Cost of goods sold for the years ended December 31, 2006 and 2005 consisted of the following (dollars in thousands):
| Change | ||||||||||||
| 2006 | 2005 | $ | % | |||||||||
Bioinstruments | $ | 5,745 | $ | 6,442 | $ | (697) | (11) | % | ||||
Bioconsumables | 4,530 | 4,762 | (232) | (5) | % | |||||||
Discovery Services | 1,771 | 2,293 | (522) | (23) | % | |||||||
Cost of goods sold | $ | 12,046 | $ | 13,497 | $ | (1,451) | (11) | % | ||||
Gross profit equaled $11.37 million or 49% of total net sales during the year ended December 31, 2006 compared to $12.33 million and 48% during the same period of 2005. The increase in gross profit as a percent of revenue is largely attributable to changes in the composition of products sold. Sales of our OEM instruments (third party platforms) provided for higher gross profit in 2006, while gross profit on WAVE sales is down, due to the lower number of instruments sold and the fixed base of costs associated with this area. Sales of specialty consumables (SURVEYOR Nuclease, HPLC separation columns, etc.) were up slightly in 2006 and these products generate higher gross profits than base buffers and enzymes. Gross profit from discovery services is significantly less in 2006 due to the decrease in net sales to a large pharmaceutical customer which produced net sales of $2,188 in 2005 and $8 in 2006, coupled with a much smaller decrease in the cost of goods sold due to the fixed base of cost associated with the discovery services group.
Selling, General and Administrative Expenses. Selling, general and administrative expenses primarily include personnel costs, marketing, travel and entertainment costs, professional fees, and facility costs. These costs remained essentially flat in 2006 compared to 2005, but increased as a percentage of net sales from 47% to 52% as a result of reduced sales. Foreign currency transaction adjustments increased operating expenses by approximately $.08 million compared to the year ended December 31, 2005
Research and Development Expenses. Research and development expenses primarily include personnel costs, supplies, and facility costs. These costs totaled $2.36 million during the year ended December 31, 2006 compared to $2.20 million during the same period of 2005, an increase of $0.16 million or 7%. As a percentage of net sales, research and development expenses totaled 10% and 9% of net sales during the year ended December 31, 2006 and 2005 respectively. We expect to continue to invest up to 10% of our net sales in research and development activities. Research and development costs are expensed in the year in which they are incurred.
Impairment Charges. We did not incur any impairment charges during 2006, but incurred $0.43 million of impairment charges during 2005 consisting of a $0.25 million charge associated with certain international patent pursuits that were no longer consistent with our strategic plan and a charge of $0.18 million related to inventory associated with certain OEM instruments.
Other Income (Expense). Other income during the year ended December 31, 2006 of $0.20 million consisted of interest income of $0.22 million which was partially offset by interest expense of
$0.01 million, and other expense of $0.01 million. Other expense during the year ended December 31, 2005 consisted of interest expense of $1.98 million and a loss on debt extinguishment of $0.54 million which was partially offset by interest income of $0.03 and other income of $0.04 million. Interest expense consisted of the following for the years ended December 31, 2006 and 2005 (dollars in thousands):
| 2006 | 2005 | ||||||
Interest paid or accrued on outstanding debt | $ | — | $ | 553 | |||
Amortization of debt premiums | — | (857 | ) | ||||
Amortization of debt discounts – warrants | — | 28 | |||||
Amortization of debt discount – beneficial conversion feature | — | 725 | |||||
Fair value of incremental shares received by Laurus | — | 1,365 | |||||
Other | 11 | 164 | |||||
| $ | 11 | $ | 1,978 | ||||
We had previously entered into a $7,500,000 line of credit (the “Credit Line”) and a $2,750,000 convertible note (the “Term Note,” and collectively with the Credit Line the “Laurus Loans”) from Laurus Master Fund, Ltd. (“Laurus”). On March 18, 2005, Laurus converted $1.87 million of the outstanding principal balance under the Credit Line into 3,600,000 shares of our common stock at $0.52 per share. In addition, on March 24, 2005, Laurus converted $0.65 million of the outstanding principal balance of the Term Note into 1,250,000 shares of our common stock at $0.52 per share. In conjunction with these conversions, we accelerated amortization of $0.41 million of related debt premiums and discounts and recorded a charge to interest expense of $1.37 million related to the fair value of incremental shares received by Laurus. Contemporaneously with the closing of a private offering of common stock in November 2005 (the “2005 Private Placement”), we repaid all outstanding principal and accrued interest on the Laurus Loans. In conjunction with this prepayment, we recorded a loss on debt extinguishment of $0.54 million. This loss consisted of prepayment penalties and fees paid to Laurus to facilitate the 2005 Private Placement of $0.84 million offset by the elimination of associated net debt premiums of $0.30 million.
Income Tax Expense. Income tax expense recorded during the years ended December 31, 2006 and 2005 related to income taxes in states, foreign countries and other local jurisdictions. Due to the our cumulative losses, expected losses in future years and inability to utilize any additional losses as carrybacks, we did not provide for an income tax benefit during the years ended December 31, 2006 or 2005 based on our determination that it was more likely than not that such benefits would not be realized. We will continue to assess the recoverability of deferred tax assets and the related valuation allowance. To the extent we begin to generate taxable income in future periods and determine that such valuation allowance is no longer required, the tax benefit of the remaining deferred tax assets will be recognized at such time. While the Company has significant net operating loss carryforwards, it is likely that Section 382 (Limitation on Net Operating Loss Carryforwards and Certain Built-In Losses following Ownership Change) of the Internal Revenue Code, and the regulations promulgated thereunder, will significantly limit the amount of net operating loss carryforward that the Company could utilize in any tax year. Our federal net operating loss carryforwards from continuing and discontinued operations of $106.23 million will expire at various dates from 2008 through 2026, if not utilized. We also had state income tax loss carryforwards from continuing and discontinued operations of $43.84 million at December 31, 2006. These carryforwards will also expire at various dates beginning in 2007 if not utilized.
Years Ended December 31, 2005 and 2004
Net Sales. Net sales for the years ended December 31, 2005 and 2004 consisted of the following (dollars in thousands):
| Change | ||||||||||||
| 2005 | 2004 | $ | % | |||||||||
Bioinstruments | $ | 14,427 | $ | 14,385 | $ | 42 | 1 | % | ||||
Bioconsumables | 8,981 | 8,838 | 143 | 2 | % | |||||||
Discovery Services | 2,420 | 2,020 | 400 | 20 | % | |||||||
Net sales | $ | 25,828 | $ | 25,243 | $ | 585 | 2 | % | ||||
WAVE Systems sold totaled 97 during the year ended December 31, 2005 compared to 107 during the same period of 2004. We had an installed base of 1,290 units at December 31, 2005 compared to 1,193 units at December 31, 2004. The increase in the installed base of instruments continues to drive increases in sales of bioconsumables used with these instruments. The increase in Discovery Services revenue during 2004 was primarily attributable to the discovery services agreements that we entered into with pharmaceutical companies to support their clinical development of oncology therapeutics.
Costs of Goods Sold. Cost of goods sold for the years ended December 31, 2005 and 2004 consisted of the following (dollars in thousands):
| Change | ||||||||||||
| 2005 | 2004 | $ | % | |||||||||
Bioinstruments | $ | 6,442 | $ | 6,382 | $ | 60 | 1 | % | ||||
Bioconsumables | 4,762 | 4,012 | 750 | 19 | % | |||||||
Discovery Services | 2,293 | 1,603 | 690 | 43 | % | |||||||
Cost of goods sold | $ | 13,497 | $ | 11,997 | $ | 1,500 | 13 | % | ||||
Overall, our cost of goods sold increased despite an overall decline in net sales due to the fixed-cost burden associated with our manufacturing facilities.
Gross profit equaled $12.33 million or 48% of total net sales during the year ended December 31, 2005 compared to $13.25 million and 52% during the same period of 2004. The decrease in gross profit as a percent of revenue is largely attributable to changes in the composition of products sold. Generally, sales of WAVE Systems and ancillary instrumentation generate higher gross profits than sales of third party platforms. Sales of specialty consumables (SURVEYOR Nuclease, HPLC separation columns, etc.) generate higher gross profits than base buffers and enzymes. Gross profits from discovery services have been less than expected due to the continuing build out of capacity and expansion of product offerings.
Selling, General and Administrative Expenses. Selling, general and administrative expenses totaled $12.22 million in 2005 compared to $15.96 million in 2004, a decrease of $3.74 million or 23%. As a percentage of revenue, selling, general and administrative expenses totaled 43% and 63% during the year ended December 31, 2005 and 2004, respectively. This decrease resulted primarily from termination of personnel and the elimination of facilities related costs in conjunction with the
2004 Restructuring Plan. Foreign currency transaction adjustments increased operating expenses by approximately $0.33 million during the years ended December 31, 2005 compared to the same period of 2004 when foreign currency transaction adjustments reduced operating expenses by approximately $0.45 million.
Research and Development Expenses. Research and development expenses primarily include personnel costs, supplies, and facility costs. These costs totaled $2.20 million during the year ended December 31, 2005 compared to $4.50 million during the same period of 2004, a decrease of $2.30 million or 51%. The decrease related primarily to the 2004 Restructuring Plan.
As a percentage of revenue, research and development expenses totaled 8% and 18% of revenue during the year ended December 31, 2005 and 2004, respectively. Research and development costs are expensed in the year in which they are incurred.
Impairment Charges. Impairment charges totaled $0.43 million during the year ended December 31, 2005 and consisted of $0.25 million associated with certain international patent pursuits that were no longer consistent with our strategic plan and $0.18 million related to certain inventory associated with third party platforms.
Restructuring Charges. On November 13, 2004, our Board of Directors approved a restructuring plan designed to refocus and to better align the Company’s cost structure with anticipated revenues. The plan included a workforce reduction and the closure of various facilities and field offices. In order to recognize the various costs associated with workforce reduction and facilities closings, we incurred a charge of $1.23 million during the quarter ending December 31, 2004.
Other Income (Expense). Other expense during the year ended December 31, 2005 of $2.45 million consisted of interest expense of $1.98 million and a loss on debt extinguishment of $0.54 million, which were partially offset by interest income of $0.03 and other net income of $0.04 million. Other expense during the year ended December 31, 2004 consisted of consisted of interest expense of $2.37 million, loss on debt extinguishment of $2.86 million and other net expense of $0.38 million.
Interest expense consisted of the following for the years ended December 31, 2005 and 2004 (dollars in thousands):
| 2005 | 2004 | ||||||
Interest paid or accrued on outstanding debt | $ | 553 | $ | 542 | |||
Amortization of debt premiums | (857 | ) | — | ||||
Amortization of debt discounts – warrants | 28 | — | |||||
Amortization of debt discount – beneficial conversion feature | 725 | 1,641 | |||||
Fair value of incremental shares received by Laurus | 1,365 | — | |||||
Other | 164 | 183 | |||||
| $ | 1,978 | $ | 2,366 | ||||
We had previously entered into a $7,500,000 line of credit (the “Credit Line”) and a $2,750,000 convertible note (the “Term Note,” and collectively with the Credit Line the “Laurus Loans”) from Laurus Master Fund, Ltd. (“Laurus”). On March 18, 2005, Laurus converted $1.87 million of the outstanding principal balance under the Credit Line into 3,600,000 shares of our common stock at $0.52 per share. In addition, on March 24, 2005, Laurus converted $0.65 million of the outstanding principal balance of the Term Note into 1,250,000 shares of our common stock at $0.52 per share. In
conjunction with these conversions, we accelerated amortization of $0.41 million of related debt premiums and discounts and recorded a charge to interest expense of $1.37 million related to the fair value of incremental shares received by Laurus. Contemporaneously with the closing of a private offering of common stock in November 2005 (the “2005 Private Placement”), we repaid all outstanding principal and accrued interest on the Laurus Loans. In conjunction with this prepayment, we recorded a loss on debt extinguishment of $0.54 million. This loss consisted of prepayment penalties and fees paid to Laurus to facilitate the 2005 Private Placement of $0.84 million offset by the elimination of associated net debt premiums of $0.30 million.
Loss on debt extinguishment totaled $2.86 million during the year ended December 31, 2004. As described in the Note F to the accompanying consolidated financial statements, certain August 31, 2004 modifications to our Laurus Loans were treated as extinguishments for financial reporting purposes since the change in present value of expected cash flows between the original and modified agreements was greater than 10%. As such, we recorded a loss on extinguishment of debt of $2.86 million at August 31, 2004 reflecting the difference between (i) the recorded amount of debt, net of related discounts, of $7.43 million and (ii) the fair value of the new debt instrument of $10.29 million plus the fair value of the new warrants of $0.11 million. The difference between the fair value of the new debt of $10.29 million and the face value of the debt of $8.57 million represented a premium, which was reflected as a reduction of interest expense over the life of the new debt.
Income Tax Expense. Income tax expense recorded during the years ended December 31, 2005 and 2004 related to income taxes in states, foreign countries and other local jurisdictions. Due to our cumulative losses, expected losses in future years and inability to utilize any additional losses as carrybacks, we did not provide for an income tax benefit during the years ended December 31, 2005 or 2004 based on our determination that it was more likely than not that such benefits would not be realized. We will continue to assess the recoverability of deferred tax assets and the related valuation allowance. To the extent we begin to generate taxable income in future periods and determine that such valuation allowance is no longer required, the tax benefit of the remaining deferred tax assets will be recognized at such time.
Results of Discontinued Operations
In the fourth quarter of 2005, we implemented a plan to exit our Nucleic Acids operating segment. In conjunction with the decision to exit this operating segment, the Company recorded impairment charges of $0.43 million and $8.02 million in 2006 and 2005, respectively, consisting of valuation adjustments to reflect the carrying value of the related net assets at estimated fair market value. Accordingly, we now reflect the results of this segment as discontinued operations for all periods presented. Expenses that are not directly identified to this operating segment or are considered corporate overhead have not been allocated to this segment in determining the results from discontinued operations. Summary results of operations of the former Nucleic Acids operating segment were as follows (dollars in thousands):
| Years Ended December 31, | |||||||||
| 2006 | 2005 | 2004 | |||||||
NET SALES | $ | 1,142 | $ | 3,881 | $ | 8,546 | |||
COST OF GOODS SOLD | 912 | 4,004 | 12,599 | ||||||
Gross profit (loss) | 230 | (123) | (4,053) | ||||||
OPERATING EXPENSES: | |||||||||
Selling, general and administrative | 264 | 1,054 | 1,538 | ||||||
Research and development | — | — | 2,184 | ||||||
Restructuring charges | — | — | 2,303 | ||||||
Exit and disposal charges | — | 866 | — | ||||||
Impairment charges | 436 | 8,022 | 11,965 | ||||||
Gain on sale of facility | — | — | (1,466) | ||||||
| 700 | 9,942 | 16,524 | |||||||
LOSS FROM OPERATIONS | (470) | (10,065) | (20,577) | ||||||
OTHER INCOME (EXPENSE) | 2 | 56 | (143) | ||||||
LOSS BEFORE INCOME TAXES | (468) | (10,009) | (20,720) | ||||||
INCOME TAX BENEFIT | — | — | (98) | ||||||
LOSS FROM DISCONTINUED OPERATIONS | $ | (468) | $ | (10,009) | $ | (20,622) | |||
On December 22, 2005, the Company’s Directors voted to either sell or close and liquidate the Nucleic Acids operating segment, which consists primarily of a manufacturing facility in Glasgow, Scotland. This decision was made after an evaluation of, among other things, short and long-term sales projections for products sold by this operating segment, including estimates of 2006 sales to the operating segment’s largest customer. In addition, the Company expects to incur additional period costs attributable to closure of the facility that will be recorded in discontinued operations in 2007. In conjunction with the decision to exit this operating segment, the Company recorded an impairment charge of $8,022 in 2005 consisting of valuation adjustments to reflect the carrying value of the related net assets at estimated fair market value.
There was no goodwill associated with the former Nucleic Acids operating segment at December 31, 2005 and 2004. The former Nucleic Acids operating segment recorded charges of $9,865 during 2004, related to the impairment of goodwill. The 2004 charge resulted from an interim period impairment test performed during the second quarter of 2004.
The interim period impairment test became necessary after the Company’s Directors directed management during the second quarter of 2004 to explore strategic alternatives for the former Nucleic Acids operating segment. This process included significant due diligence by management, third-party advisors and prospective independent buyers and other interested parties. Information obtained through this process indicated that it was more likely than not that the assets associated with the Nucleic Acids operating segment were impaired.
The former Nucleic Acids operating segment also recorded a charge of $2,100 during 2004 related to the impairment of property and equipment associated with this operating segment.
On November 13, 2004, the former Nucleic Acids operating segment sold the assets associated with its specialty oligonucleotides manufacturing facility in Boulder, Colorado to a subsidiary of Eyetech Pharmaceuticals, Inc. (“Eyetech”). The sale price was $3,000 in cash plus the assumption of the lease on the Boulder facility and of certain equipment leases with a gross value of $2,377. Substantially all of the 27 employees at the Boulder facility became Eyetech employees. Net proceeds from the sale (after transaction expenses and fees paid to our investment advisors) equaled approximately $2,700. In conjunction with this transaction, the Nucleic Acids operating segment recorded a gain on sale of $1,466 in the fourth quarter of 2004.
The Company implemented restructuring plans in 2004 and 2002 designed to better align its cost structure with anticipated revenues. In conjunction with these plans, the former Nucleic Acids operating segment recorded restructuring charges in 2004 and 2003 of $2,303 and $222, respectively, related primarily to employee severance agreements, office closures, property and equipment and intellectual property. There were accrued expenses associated with these restructuring plans of $191 at December 31, 2005.
The Company accepted common stock from a customer of the former Nucleic Acids operating segment, Geron Corporation (“Geron”) as payment for goods and services. These shares were classified as available-for-sale securities. Net realized gains on these securities during 2005 of $52 and realized losses on these securities of $128 during 2004 were reflected as other expense. Proceeds from the sales of these available for sale securities are reflected within net cash flows from investing activities. During 2005 and 2004, sales to Geron totaled $1,949 and $4,151, respectively, representing 50% and 49%, respectively, of net sales within this operating segment.
Liquidity and Capital Resources
Our working capital positions at December 31, 2006 and 2005 were as follows (in thousands):
| December 31, | |||||||||
| 2006 | 2005 | Change | |||||||
Current assets (including cash and cash equivalents of $5,868 and $6,736, respectively) | $ | 15,605 | $ | 18,118 | $ | (2,513) | |||
Current liabilities | 5,329 | 7,434 | (2,105) | ||||||
Working capital | $ | 10,276 | $ | 10,684 | $ | (408) | |||
We have historically operated at a loss and have not generated sufficient cash from operating activities to cover our operating and other cash expenses. While we have been able to historically finance our operating losses through borrowings or from the issuance of additional equity, we currently have no borrowings and have no plans to issue additional equity securities for this purpose. At March 30, 2007 and December 31, 2006, we had cash and cash equivalents of $7.91 million and $5.87 million, respectively. While we believe that existing sources of liquidity are sufficient to meet expected cash needs through 2007, we will need to increase our revenues or further reduce our operating expenses in order to be assured of meeting our liquidity needs on a long-term basis. On February 20, 2007, we announced a cost reduction plan designed to align our cost structure with anticipated revenues. The plan is expected to yield annualized savings of approximately $1.5 million once all components of the plan are fully implemented. The closing of the Company’s Cramlington, England production facility is the principal component of this plan. We expect to incur aggregate charges estimated at $1.2 to $1.4 million during the first and second quarters of 2007, relating primarily to severance, benefits and facility closure costs. However, we cannot assure you that we will be able to increase our revenues or further reduce our expenses and, accordingly, we may not have sufficient sources of liquidity to continue the operations of the Company indefinitely.
Analysis of Cash Flows
Years Ended December 31, 2006 and 2005
Net Change in Cash and Cash Equivalents. Cash and cash equivalents decreased $0.87 million during the year ended December 31, 2006 as a result of net cash of $1.21 million being used by operating activities and of $0.20 million being used in investing activities, which was partially offset by net cash provided by financing activities of $0.01 million and changes in foreign currency exchange of $0.54 million.
Cash Flows Used In Operating Activities. Cash flows used in operating activities totaled $1.21 million during the year ended December 31, 2006 compared to $3.63 million during the same period of 2005. The use in 2006 resulted primarily from our net loss of $3.43 million offset by non-cash charges of $2.55 million. Non-cash charges consisted primarily of depreciation and amortization, impairment charges and non-cash stock based compensation. Working capital and other adjustments decreased cash flows from operating activities by $0.34 million during 2006.
Cash Flows Used In Investing Activities. Cash flows used in investing activities totaled $0.20 million during the year ended December 31, 2006 compared to $1.65 million of cash flow provided by investing activities during the same period of 2005. The cash used in 2006 was for purchases, offset by
sales, of property and equipment. The principal source of cash flows from investing activities in 2005 was sales of available for sale securities of $2.15 million that were offset by purchases of $0.64 million of property and equipment.
Cash Flows from Financing Activities. Cash flows from financing activities totaled $0.01 million during the year ended December 31, 2006 as a result of the sale of common stock, through the Employee Stock Purchase Plan. This compares with $7.92 million of cash flow from financing activities during 2005 resulting from the receipt of approximately $13.8 million in net proceeds from the 2005 Private Placement offset by repayment of approximately $5.9 million under the Laurus Loans.
Obligations and Commitments
The following identifies material obligations and commitments as of December 31, 2006:
| Payments Due by Period | |||||||||||||||||||||
Contractual Obligations | After | ||||||||||||||||||||
Millions of Dollars | Total | 2007 | 2008 | 2009 | 2010 | 2011 | 2011 | ||||||||||||||
Operating Leases(a) | $ | 3.71 | $ | 0.87 | $ | 0.77 | $ | 0.69 | $ | 0.57 | $ | 0.38 | $ | 0.43 | |||||||
Purchase Obligations(b) | 1.03 | 1.03 | — | — | — | — | — | ||||||||||||||
Total Contractual obligations | $ | 4.74 | $ | 1.90 | $ | 0.77 | $ | 0.69 | $ | 0.57 | $ | 0.38 | $ | 0.43 | |||||||
(a) | Operating leases include facility, automobile and other equipment leases. |
(b) | Purchase obligations include purchase commitments for components used in WAVE Systems and OEM instruments. |
Off Balance Sheet Arrangements
At December 31, 2006 and 2005, we did not have any relationships with unconsolidated entities or financial partnerships, such as entities often referred to as structured finance or special purpose entities, which would have been established for the purpose of facilitating off-balance sheet arrangements or other contractually narrow or limited purposes.
Critical Accounting Policies
Accounting policies used in the preparation of the consolidated financial statements may involve the use of management judgments and estimates. Certain of our accounting policies are considered critical as they are both important to the portrayal of our financial statements and they require significant or complex judgments on the part of management. Our judgments and estimates are based on experience and assumptions that we believe are reasonable under the circumstances. Further, we evaluate our judgments and estimates from time to time as circumstances change. Actual financial results based on judgment or estimates may vary under different assumptions or circumstances. The following are certain critical accounting policies that may involve the use of judgment or estimates.
Allowance for Doubtful Account. Accounts receivable are shown net of an allowance for doubtful accounts. In determining an allowance for doubtful accounts, we consider the following.
Ÿ | The age of the accounts receivable, |
Customer credit history,
Customer financial information,
Reasons for non-payment, and
Our knowledge of the customer.
If our customers’ financial condition were to deteriorate, resulting in a change in their ability to make payment, additional allowances may be required.
Inventories. Inventories are stated at the lower of cost or market. Cost is computed using standard costs for finished goods and average or latest actual cost for raw materials and work in process. We write down slow-moving and obsolete inventory by the difference between the value of the inventory and our estimate of the reduced value based on potential future uses, the likelihood that overstocked inventory will be sold and the expected selling prices of the inventory. If our ability to realize value on slow-moving or obsolete inventory is less favorable than assumed, additional write-downs of the inventory may be required.
Depreciation and Amortization of Long-Lived Assets. Our long-lived assets consist primarily of equipment, patents, intellectual property and capitalized software development costs. We believe the useful lives we assigned to these assets are reasonable. If our assumptions about these assets change as a result of events or circumstances and we believe the assets may have declined in value we may record impairment charges resulting in an increase to operating expenses. Property and equipment are carried at cost. Depreciation and amortization are computed using the straight-line method over the estimated useful lives of the related assets ranging from 3 to 15 years. We capitalize external and in-house legal costs and filing fees associated with obtaining patents on our new discoveries and amortize these costs using the straight-line method over the shorter of the legal life of the patent or its economic life, generally 17 years, beginning on the date the patent is issued. Intellectual property, which is purchased technology, is recorded at cost and is amortized over its estimated useful life.
Impairment of Long-Lived Assets. We evaluate goodwill for impairment on an annual basis. We assess the recoverability of long-lived assets whenever events or changes in circumstances indicate that the carrying amount of an asset may not be recoverable. These computations utilize judgments and assumptions inherent in our estimate of future undiscounted and discounted cash flows to determine recoverability of these assets. If our assumptions about these assets were to change as a result of events or circumstances, we may be required to record an impairment loss.
Revenue Recognition. Revenue on the sales of products is recognized in accordance with the terms of the sales arrangement. Such recognition is based on receipt of an unconditional customer order and transfer of title and risk of ownership to the customer, typically upon shipment of the product. Our sales terms do not provide for the right of return unless the product is damaged or defective. Revenues from certain services associated with our analytical instruments, to be performed subsequent to shipment of the products, is deferred and recognized when the services are provided. Such services, mainly limited to installation and training services that are not essential to the functionality of the instruments, typically are performed in a timely manner subsequent to shipment of the instrument.
Recently Issued Accounting Pronouncements
In July 2006, the FASB issued Interpretation (“FIN”) No. 48, “Uncertainty in Income Taxes.” FIN 48 applies to all tax positions within the scope of Statement 109 and clarifies when and how to recognize tax benefits in the financial statements with a two-step approach of recognition and measurement. FIN 48 will become effective in the first quarter of 2007. Management continues to evaluate the effect that adoption of FIN 48 will have on our consolidated results of operations and financial position.
In September 2006, the SEC issued Staff Accounting Bulletin. 108,Considering the Effects of Prior Year Misstatements when Quantifying Misstatements in Current Year Financial Statements (SAB 108). SAB 108 provides interpretive guidance on how the effects of prior-year uncorrected misstatements should be considered when quantifying misstatements in current year financial statements. SAB 108 requires registrants to quantify misstatements using both an income statement and balance sheet approach and then evaluate whether either approach results in a misstatement that, when all relevant quantitative and qualitative factors are considered, is material. If prior year errors that had been previously considered immaterial are now considered material based on either approach, no restatement is required so long as management properly applied its previous approach and all relevant facts and circumstances were considered. If prior year’s financial statements are not restated, the cumulative effect adjustment is recorded in opening accumulated earnings (deficit) as of the beginning of the fiscal year of adoption. SAB 108 is effective for us at the end of 2006. There was no impact to our Consolidated Financial Statements as a result of adoption of this pronouncement.
In September 2006, the FASB issued Statement No. 157,Fair Value Measurement (FAS 157). While this statement does not require new fair value measurements, it provides guidance on applying fair value and expands required disclosures. FAS 157 is effective for us beginning in the first quarter of 2008. We are currently assessing the impact FAS 157 may have on our Consolidated Financial Statements.
In February 2007, the FASB issued Statement No. 159,The Fair Value Option for Financial Assets and Financial Liabilities (FAS 159). This statement, which is expected to expand fair value measurement, permits entities to choose to measure many financial instruments and certain other items at fair value. FAS 159 is effective for us beginning in the first quarter of 2008. We are currently assessing the impact FAS 159 may have on our Consolidated Financial Statements.
Use of Estimates
The preparation of consolidated financial statements requires management to make estimates and assumptions that affect the reported amounts of assets and liabilities and disclosure of contingent assets and liabilities at the date of the financial statements and the reported amounts of net sales and expenses during the reported period. In addition, estimates and assumptions associated with the determination of the fair value of certain assets and related impairments and the determination of goodwill impairments require considerable judgment by management. Actual results could differ from the estimates and assumptions used in preparing these financial statements.
Impact of Inflation
We do not believe that price inflation had a material adverse effect on our financial condition or results of operations during the periods presented.
Quantitative and Qualitative Disclosure about Market Risk |
Interest Rate Risk. Previously, our principal market risk was interest rate risk on our variable-rate borrowings under the Laurus Loans. During the fourth quarter of 2005, we repaid the entire principal balance of the Laurus Loans with the proceeds from the 2005 Private Placement and have terminated these loans. Accordingly, we no longer have any borrowings which subject us to material interest rate risk.
Foreign Currency Translation Risk. During the last three fiscal years, our international sales have represented more than 50% of our net sales. These sales of products in foreign countries are mainly completed in either British Pounds Sterling or the Euro. Additionally, we have two wholly owned subsidiaries, Transgenomic Limited, and Cruachem Limited, whose operating currency is British Pounds Sterling and the Euro. Results of operations for the Company’s foreign subsidiaries are translated using the average exchange rate during the period. Assets and liabilities are translated at the exchange rate in effect on the balance sheet dates. As a result we are subject to exchange rate risk. The operational expenses of our foreign subsidiaries help to reduce the currency exposure we have based on our sales denominated in foreign currencies by converting foreign currencies directly into goods and services. As such, we feel we do not have a material exposure to foreign currency rate fluctuations at this time.
REPORT OF INDEPENDENT REGISTERED PUBLIC ACCOUNTING FIRM
To the Board of Directors and Stockholders
of Transgenomic, Inc.
Omaha, Nebraska
We have audited the accompanying consolidated balance sheets of Transgenomic, Inc. and subsidiaries (the “Company”) as of December 31, 2006 and 2005, and the related consolidated statements of operations, stockholders’ equity, and cash flows for each of the three years in the period ended December 31, 2006. These financial statements are the responsibility of the Company’s management. Our responsibility is to express an opinion on these financial statements based on our audits.
We conducted our audits in accordance with the standards of the Public Company Accounting Oversight Board (United States). Those standards require that we plan and perform the audit to obtain reasonable assurance about whether the financial statements are free of material misstatement. The Company is not required to have, nor were we engaged to perform, an audit of its internal control over financial reporting. Our audits included consideration of internal control over financial reporting as a basis for designing audit procedures that are appropriate in the circumstances, but not for the purpose of expressing an opinion on the effectiveness of the Company’s internal control over financial reporting. Accordingly, we express no such opinion. An audit also includes examining, on a test basis, evidence supporting the amounts and disclosures in the financial statements, assessing the accounting principles used and significant estimates made by management, as well as evaluating the overall financial statement presentation. We believe that our audits provide a reasonable basis for our opinion.
In our opinion, such consolidated financial statements present fairly, in all material respects, the financial position of Transgenomic, Inc. and subsidiaries at December 31, 2006 and 2005, and the results of their operations and their cash flows for each of the three years in the period ended December 31, 2006, in conformity with accounting principles generally accepted in the United States of America.
As discussed in Note B to the consolidated financial statements, in 2006 the Company adopted Statement of Financial Accounting Standards No. 123(R),Share-Based Payment.
/s/ Deloitte & Touche LLP |
Omaha, Nebraska |
March 30, 2007 |
TRANSGENOMIC, INC. AND SUBSIDIARIES
CONSOLIDATED BALANCE SHEETS
As of December 31, 2006 and 2005
(Dollars in thousands except per share data)
| 2006 | 2005 | |||||||
| ASSETS | ||||||||
CURRENT ASSETS: | ||||||||
Cash and cash equivalents | $ | 5,868 | $ | 6,736 | ||||
Accounts receivable (net of allowances for bad debts of $444 and $615, respectively) | 6,525 | 7,542 | ||||||
Inventories | 2,672 | 2,990 | ||||||
Prepaid expenses and other current assets | 540 | 653 | ||||||
Current assets of discontinued operations | — | 197 | ||||||
Total current assets | 15,605 | 18,118 | ||||||
PROPERTY AND EQUIPMENT: | ||||||||
Equipment | 10,345 | 10,108 | ||||||
Furniture and fixtures | 3,820 | 3,797 | ||||||
| 14,165 | 13,905 | |||||||
Less: accumulated depreciation | 12,667 | 11,328 | ||||||
| 1,498 | 2,577 | |||||||
OTHER ASSETS: | ||||||||
Goodwill | 638 | 638 | ||||||
Other assets | 853 | 1,074 | ||||||
Non-current assets of discontinued operations | 2,773 | 2,933 | ||||||
| $ | 21,367 | $ | 25,340 | |||||
| LIABILITIES AND STOCKHOLDERS’ EQUITY | ||||||||
CURRENT LIABILITIES: | ||||||||
Accounts payable | $ | 1,558 | $ | 1,796 | ||||
Other accrued expenses | 2,898 | 3,114 | ||||||
Accrued compensation | 689 | 602 | ||||||
Current liabilities of discontinued operations | 184 | 1,922 | ||||||
Total current liabilities | 5,329 | 7,434 | ||||||
COMMITMENTS AND CONTINGENCIES (Note G) | ||||||||
STOCKHOLDERS’ EQUITY: | ||||||||
Preferred stock, $.01 par value, 15,000,000 shares authorized, none outstanding | — | — | ||||||
Common stock, $.01 par value, 100,000,000 and 60,000,000 shares authorized, respectively, 49,189,672 and 49,182,121 shares outstanding, respectively | 497 | 497 | ||||||
Additional paid-in capital | 138,966 | 138,800 | ||||||
Accumulated other comprehensive income | 2,100 | 703 | ||||||
Accumulated deficit | (125,525 | ) | (122,094 | ) | ||||
Total stockholders’ equity | 16,038 | 17,906 | ||||||
| $ | 21,367 | $ | 25,340 | |||||
See notes to consolidated financial statements.
TRANSGENOMIC, INC. AND SUBSIDIARIES
CONSOLIDATED STATEMENTS OF OPERATIONS
Years Ended December 31, 2006, 2005 and 2004
(Dollars in thousands except per share data)
| 2006 | 2005 | 2004 | ||||||||||
NET SALES | $ | 23,415 | $ | 25,828 | $ | 25,243 | ||||||
COST OF GOODS SOLD | 12,046 | 13,497 | 11,997 | |||||||||
Gross profit | 11,369 | 12,331 | 13,246 | |||||||||
OPERATING EXPENSES: | ||||||||||||
Selling, general and administrative | 12,138 | 12,218 | 15,961 | |||||||||
Research and development | 2,362 | 2,199 | 4,501 | |||||||||
Restructuring charges | — | — | 1,267 | |||||||||
Impairment charges | — | 425 | — | |||||||||
| 14,500 | 14,842 | 21,729 | ||||||||||
LOSS FROM OPERATIONS | (3,131 | ) | (2,511 | ) | (8,483 | ) | ||||||
OTHER INCOME (EXPENSE): | ||||||||||||
Interest expense | (11 | ) | (1,978 | ) | (2,366 | ) | ||||||
Interest income | 216 | 27 | — | |||||||||
Loss on debt extinguishment | — | (541 | ) | (2,859 | ) | |||||||
Other, net | (7 | ) | 45 | (38 | ) | |||||||
| 198 | (2,447 | ) | (5,263 | ) | ||||||||
LOSS BEFORE INCOME TAXES | (2,933 | ) | (4,958 | ) | (13,746 | ) | ||||||
INCOME TAX EXPENSE | 30 | 26 | 4 | |||||||||
LOSS FROM CONTINUING OPERATIONS | (2,963 | ) | (4,984 | ) | (13,750 | ) | ||||||
DISCONTINUED OPERATIONS: | ||||||||||||
Loss from discontinued operations before income tax | (468 | ) | (10,009 | ) | (20,720 | ) | ||||||
Income tax benefit of discontinued operations | — | — | (98 | ) | ||||||||
LOSS FROM DISCONTINUED OPERATIONS | (468 | ) | (10,009 | ) | (20,622 | ) | ||||||
NET LOSS | $ | (3,431 | ) | $ | (14,993 | ) | $ | (34,372 | ) | |||
BASIC AND DILUTED LOSS PER SHARE: | ||||||||||||
From continuing operations | $ | (0.06 | ) | $ | (0.14 | ) | $ | (0.47 | ) | |||
From discontinued operations | (0.01 | ) | (0.28 | ) | (0.72 | ) | ||||||
| $ | (0.07 | ) | $ | (0.42 | ) | $ | (1.19 | ) | ||||
BASIC AND DILUTED WEIGHTED AVERAGE SHARES OUTSTANDING | 49,188,451 | 35,687,580 | 29,006,241 | |||||||||
See notes to consolidated financial statements.
TRANSGENOMIC, INC. AND SUBSIDIARIES
CONSOLIDATED STATEMENTS OF STOCKHOLDERS’ EQUITY
Years Ended December 31, 2006, 2005 and 2004
(Dollars in thousands except share data)
| Common Stock | Additional Paid in Capital | Accumulated Deficit | Accumulated Other Comprehensive Income (Loss) | Total | ||||||||||||||||
| Outstanding Shares | Par Value | |||||||||||||||||||
Balance, January 1, 2004 | 28,119,122 | $ | 286 | $ | 115,904 | $ (72,729 | ) | $ | 1,597 | $ | 45,058 | |||||||||
Net loss | — | — | — | (34,372 | ) | (34,372 | ) | (34,372 | ) | |||||||||||
Other comprehensive income (loss): | ||||||||||||||||||||
Foreign currency translation adjustment | — | — | — | — | 942 | 942 | ||||||||||||||
Comprehensive loss | (33,430 | ) | ||||||||||||||||||
Issuance of stock options and warrants | — | — | 189 | — | — | 189 | ||||||||||||||
Beneficial conversion premium | — | — | 2,420 | — | — | 2,420 | ||||||||||||||
Conversion of Laurus Loans | 1,134,850 | 12 | 2,198 | — | — | 2,210 | ||||||||||||||
Issuance of shares for employee stock purchase plan | 76,902 | 1 | 87 | — | — | 88 | ||||||||||||||
Balance, December 31, 2004 | 29,330,874 | 299 | 120,798 | (107,101 | ) | 2,539 | 16,535 | |||||||||||||
Net loss | — | — | — | (14,993 | ) | (14,993 | ) | (14,993 | ) | |||||||||||
Other comprehensive income (loss): | ||||||||||||||||||||
Foreign currency translation adjustment | — | — | — | — | (1,836 | ) | (1,836 | ) | ||||||||||||
Comprehensive loss | (16,829 | ) | ||||||||||||||||||
Beneficial conversion premium | — | — | 399 | — | — | 399 | ||||||||||||||
Conversion of Laurus Loans | 4,900,000 | 49 | 2,507 | — | — | 2,556 | ||||||||||||||
Fair value of incremental shares issued | — | — | 1,365 | — | — | 1,365 | ||||||||||||||
Issuance of shares in private placement, net of expenses of $1,213 | 14,925,743 | 149 | 13,713 | — | — | 13,862 | ||||||||||||||
Issuance of shares for employee stock purchase plan | 25,504 | — | 18 | — | — | 18 | ||||||||||||||
Balance, December 31, 2005 | 49,182,121 | 497 | 138,800 | (122,094 | ) | 703 | 17,906 | |||||||||||||
Net loss | — | — | — | (3,431 | ) | (3,431 | ) | (3,431 | ) | |||||||||||
Other comprehensive income (loss): | ||||||||||||||||||||
Foreign currency translation adjustment | — | — | — | — | 1,397 | 1,397 | ||||||||||||||
Comprehensive loss | (2,034 | ) | ||||||||||||||||||
Non-cash stock based compensation | — | — | 161 | — | — | 161 | ||||||||||||||
Issuance of shares for employee stock purchase plan | 7,551 | — | 5 | — | — | 5 | ||||||||||||||
Balance, December 31, 2006 | 49,189,672 | $ | 497 | $ | 138,966 | $ | (125,525 | ) | $ | 2,100 | $ | 16,038 | ||||||||
See notes to consolidated financial statements.
TRANSGENOMIC, INC. AND SUBSIDIARIES
CONSOLIDATED STATEMENTS OF CASH FLOWS
Years Ended December 31, 2006, 2005 and 2004
(Dollars in thousands)
| 2006 | 2005 | 2004 | ||||||||||
CASH FLOWS FROM OPERATING ACTIVITIES: | ||||||||||||
Net loss | $ | (3,431 | ) | $ | (14,993 | ) | $ | (34,372 | ) | |||
Adjustments to reconcile net loss to net cash flows from operating activities: | ||||||||||||
Depreciation and amortization | 1,949 | 4,283 | 4,625 | |||||||||
Non-cash restructuring charges | — | — | 2,027 | |||||||||
Impairment charges | 437 | 8,447 | 11,965 | |||||||||
Gain on sale of facility | — | — | (1,466 | ) | ||||||||
Non-cash financing costs | — | 1,281 | 1,642 | |||||||||
Non-cash debt extinguishment charges | — | (303 | ) | 2,859 | ||||||||
Non-cash stock based compensation | 161 | — | — | |||||||||
(Gain)/loss on sale of securities | — | (50 | ) | 128 | ||||||||
Other | 18 | — | 18 | |||||||||
Changes in operating assets and liabilities: | ||||||||||||
Accounts receivable | 1,634 | 139 | (3,334 | ) | ||||||||
Inventories | 397 | 514 | 2,611 | |||||||||
Prepaid expenses and other current assets | 200 | 574 | (130 | ) | ||||||||
Accounts payable | (731 | ) | (1,129 | ) | (268 | ) | ||||||
Accrued expenses | (1,846 | ) | (2,390 | ) | 941 | |||||||
Net cash flows from operating activities | (1,212 | ) | (3,627 | ) | (12,754 | ) | ||||||
CASH FLOWS FROM INVESTING ACTIVITIES: | ||||||||||||
Proceeds from the maturities and sale of available for sale securities | — | 2,151 | 4,269 | |||||||||
Purchase of property and equipment | (250 | ) | (641 | ) | (1,758 | ) | ||||||
Change in other assets, including cash paid for patents | (64 | ) | (3 | ) | 522 | |||||||
Proceeds from sale of specialty oligonucleotide manufacturing facility | — | — | 3,000 | |||||||||
Proceeds from asset sales | 119 | 139 | — | |||||||||
Net cash flows from investing activities | (195 | ) | 1,646 | 6,033 | ||||||||
CASH FLOWS FROM FINANCING ACTIVITIES: | ||||||||||||
Net change in line of credit | — | (4,069 | ) | 4,956 | ||||||||
Proceeds from long-term debt | — | — | 2,750 | |||||||||
Payments on long-term debt | — | (1,850 | ) | (1,779 | ) | |||||||
Issuance of common stock, net of expenses | 5 | 13,836 | 71 | |||||||||
Net cash flows from financing activities | 5 | 7,917 | 5,998 | |||||||||
EFFECT OF FOREIGN CURRENCY EXCHANGE RATE CHANGES ON CASH | 534 | (202 | ) | 484 | ||||||||
NET CHANGE IN CASH AND CASH EQUIVALENTS | (868 | ) | 5,734 | (239 | ) | |||||||
CASH AND CASH EQUIVALENTS AT BEGINNING OF YEAR | 6,736 | 1,002 | 1,241 | |||||||||
CASH AND CASH EQUIVALENTS AT END OF YEAR | $ | 5,868 | $ | 6,736 | $ | 1,002 | ||||||
SUPPLEMENTAL CASH FLOW INFORMATION | ||||||||||||
Cash paid during the year for: | ||||||||||||
Interest | $ | 11 | $ | 553 | $ | 560 | ||||||
Income taxes, net | 30 | 12 | (94 | ) | ||||||||
Non-cash transactions: | ||||||||||||
Available for sale securities acquired for goods and services | — | 2,099 | 4,397 | |||||||||
Conversions of debt to equity | — | 2,536 | 2,226 | |||||||||
See notes to consolidated financial statements.
TRANSGENOMIC, INC. AND SUBSIDIARIES
NOTES TO CONSOLIDATED FINANCIAL STATEMENTS
Years Ended December 31, 2006, 2005 and 2004
(Dollars in thousands except per share data)
A. BUSINESS DESCRIPTION.
Transgenomic, Inc., a Delaware corporation, and its subsidiaries (the “Company”) provide innovative products for the synthesis, purification and analysis of nucleic acids used in the life sciences industry for research focused on molecular genetics and diagnostics. The Company also provides genetic variation analytical services to the medical research, clinical and pharmaceutical markets. Net sales are categorized as bioinstruments, bioconsumables and discovery services.
· | Bioinstruments. The Company’s principal product is the WAVE System which has broad applicability to genetic variation detection in both molecular genetic research and molecular diagnostics. Bioinstrument sales also include instruments distributed for other manufacturers and service contracts to maintain installed systems are sold by the Company. |
· | Bioconsumables. The Company develops, manufactures and sells consumable products used with the WAVE System and other instruments it sells. |
· | Discovery Services. The Company provides various genetic laboratory services through a contract research lab in Gaithersburg, Maryland and a second laboratory in Omaha, Nebraska. The services provided primarily include (1) genomic biomarker analysis services to pharmaceutical and biopharmaceutical companies to support preclinical and clinical development of targeted therapeutics; and (2) molecular-based testing for hematology, oncology and certain inherited diseases for physicians and third-party laboratories. |
These operations are reported in a single reportable segment due to the integrated nature of the products. Historically, the Company operated a separate business segment (the “Nucleic Acids operating segment”) that developed, manufactured and marketed chemical building blocks for nucleic acid synthesis to biotechnology, pharmaceutical and oligonucleotide synthesis companies and research institutions throughout the world. In the fourth quarter of 2005, the Company implemented a plan to exit this operating segment and substantially completed this plan during 2006. Accordingly, results of this operating segment are reflected as discontinued operations for all periods presented.
The Company has experienced recurring net losses, including $3.4 million in 2006, $15.0 million in 2005 and $34.4 million in 2004, and had an accumulated deficit of $125.5 million at December 31, 2006. Based on the Company’s operating plan and the receipt of $2.7 million from the sale of the Glasgow facility on February 28, 2007, management believes its existing sources of liquidity will be sufficient to meet its cash needs during 2007. While the Company has been able to historically finance its operation losses through borrowings or from the issuance of additional equity, its management does not believe the Company can borrow additional funds or issue additional equity securities for this purpose. Accordingly, the Company will need to increase its revenues or further reduce its operating expenses in order to be assured of meeting its liquidity needs on a long-term basis. However, there can be no assurance that the Company will be able to increase revenues or further reduce expenses and, accordingly, it may not have sufficient sources of liquidity to continue operations indefinitely.
TRANSGENOMIC, INC. AND SUBSIDIARIES
NOTES TO CONSOLIDATED FINANCIAL STATEMENTS - Continued
Years Ended December 31, 2006, 2005 and 2004
(Dollars in thousands except per share data)
B. SUMMARY OF SIGNIFICANT ACCOUNTING POLICIES
Principles of Consolidation.
The consolidated financial statements include the accounts of Transgenomic, Inc. and its wholly-owned subsidiaries. All intercompany balances and transactions have been eliminated in consolidation.
Use of Estimates.
The preparation of consolidated financial statements requires management to make estimates and assumptions that affect the reported amounts of assets and liabilities and disclosure of contingent assets and liabilities at the date of the financial statements and the reported amounts of revenues and expenses during the reporting period. Estimates and assumptions associated with the determination of fair value of certain assets and related impairments, and the determination of goodwill impairments require considerable judgment by management. Actual results could differ from the estimates and assumptions used in preparing these financial statements.
Cash and Cash Equivalents
Cash and cash equivalents include cash and monies invested in overnight funds with our bank.
Accounts Receivable.
Accounts receivable are shown net of allowance for doubtful accounts. The following is a summary of activity for the allowance for doubtful accounts during each of the three years ended December 31, 2006:
| Beginning Balance | Additional Charges to Income | Deductions from Reserve | Ending Balance | |||||||||
Year Ended December 31, 2006 | $ | 615 | $ | 92 | $ | 263 | $ | 444 | ||||
Year Ended December 31, 2005 | $ | 701 | $ | — | $ | 86 | $ | 615 | ||||
Year Ended December 31, 2004 | $ | 359 | $ | 374 | $ | 32 | $ | 701 | ||||
While payment terms are generally 30 days, the Company has also provided extended payment terms of up to 90 days in certain cases.
Inventories.
Inventories are stated at the lower of cost or market. Cost is computed using standard costs for finished goods and average or latest actual cost for raw materials and work in process
TRANSGENOMIC, INC. AND SUBSIDIARIES
NOTES TO CONSOLIDATED FINANCIAL STATEMENTS - Continued
Years Ended December 31, 2006, 2005 and 2004
(Dollars in thousands except per share data)
Equipment, Furniture and Fixtures.
All equipment, furniture and fixtures are carried at cost, less accumulated depreciation. Depreciation is computed by the straight-line method over the estimated useful lives of the related assets as follows:
Leasehold improvements | 3 to 10 years | |
Furniture and fixtures | 5 to 7 years | |
Production equipment | 5 to 7 years | |
Computer equipment | 3 to 5 years | |
Research and development equipment | 3 to 5 years | |
Demonstration equipment | 3 to 5 years |
Depreciation of property and equipment totaled $1,344, $1,786 and $3,330 in 2006, 2005 and 2004, respectively.
Goodwill
Statement of Financial Accounting Standards (“SFAS”) No. 142,Goodwill and Other Intangible Assets,provides that goodwill is not amortized, but is to be tested for impairment annually. Impairment occurs when the carrying value is determined to not be recoverable thereby causing the fair value of the goodwill to exceed the carrying value. If impaired, the assets carrying value is reduced to its fair value.
Other Assets.
Other assets include capitalized software development costs, intellectual property, patents, other executive officersintangible assets, deferred financing costs and two former executive officersother long-term assets.
Capitalized Software Development Costs. The Company capitalized software development costs for services renderedproducts offered for sale in accordance with SFAS No. 86,Accounting for the Costs of Computer Software to be Sold, Leased or Otherwise Marketed. This Standard allows for the capitalization of certain development costs once a software product has reached technological feasibility. The Company capitalized no software development costs during the three years ended December 31, 2004.2006.
Intellectual Property. Initial costs paid to license intellectual property from independent, third parties is capitalized and amortized using the straight line method over the license period. Ongoing royalties related to such licenses are expensed as incurred.
Patents. The Company capitalizes the external and in-house legal costs and filing fees associated with obtaining patents on its new discoveries and amortizes these costs using the straight-line method over the shorter of the legal life of the patent or its economic life, generally 17 years, beginning on the date the patent is issued.
Other intangible assets with indefinite lives will not be amortized, but will be tested for impairment annually. Impairment occurs when the carrying value is not recoverable and the fair value of the asset is less than the carrying value. If impaired, the asset’s carrying value is reduced to its fair
TRANSGENOMIC, INC. AND SUBSIDIARIES
Summary Compensation TableNOTES TO CONSOLIDATED FINANCIAL STATEMENTS - Continued
|
|
|
|
|
|
|
| |||||||||
| 2004 | |||||||||||||||
| ||||||||||||||||
| ||||||||||||||||
| ||||||||||||||||
| ||||||||||||||||
| ||||||||||||||||
Options/SAR Grants(Dollars in Last Fiscal Yearthousands except per share data)
The Compensation Committeevalue. Identifiable intangible assets with definite lives are amortized over their estimated useful lives and tested for impairment as events or changes in circumstances indicate the carrying amount of the asset may grant either qualifiedbe impaired.
Deferred Financing Costs. Certain financing costs are capitalized and amortized to interest expense over the life of the related financing.
Other Long-Term Assets. Other long-term assets consist primarily of demonstration inventory that has been at customer or non-qualifiedprospective customer sites for greater than one year and security deposits on leased facilities. Long-term demonstration inventory is stated at the lower of cost or market.
Stock Based Compensation.
All stock options awarded to the officers and employees of the Company and nonqualified stock options to nonemployee directors and advisors under our stock option plan. The following table shows the options granted during 2004 to those executive officers of the Company whose compensation is reported in the Summary Compensation Table.
| Potential Realized Value at Assumed Annual Rates of Stock Price Appreciation for Option Term(2) | ||||||||||||||||
| (a) | (b) | (c) | (d) | (e) | (f) | (g) | ||||||||||
Name | Number of Securities Underlying Options/SARs Granted (#)(1) | % of Total Options/SARs Granted to Employees in Fiscal Year | Exercise or Base Price ($/Sh) | Expiration Date | 5%($) | 10%($) | ||||||||||
Keith A. Johnson | 25,000 | 6.9 | % | $ | 1.32 | 5/21/2014 | $ | 21,000 | $ | 53,000 | ||||||
Aggregated Option/SAR Exercises in Last Fiscal Year and FY-End Option/SAR Values
The following table sets forth certain information concerning the number of exercised and unexercised options and the value of such options at the end of 2004 held by the executive officers and two former executive officers of the Company whose compensation is reported in the Summary Compensation Table.
|
|
|
|
| ||||
| ||||||||
| ||||||||
| ||||||||
| ||||||||
| ||||||||
|
Compensation of Directors
Directors who are also our officers or affiliates are not separately compensated for serving on the Board of Directors other than reimbursement for out-of-pocket expenses related to attendance at board and committee meetings. Independent directors are paid an
annual retainer of $12,000. In addition, they receive a fee of $1,200 for attending meetings in person, or $600 for participating in a meeting by teleconference, as well as reimbursement for out-of-pocket expenses related to attendance at board and committee meetings. Independent directors serving on any committee of the Board of Directors are paid an additional annual retainer of $2,500, except that, effective January 1, 2004, the additional retainer paid to independent directors serving on the Audit Committee was increased to $5,000.
Our non-employee and non-affiliated directors are issued options to purchase 15,000 shares of common stock under our stock option plan upon initial appointment to the Board. For options granted prior to March 28, 2003, such options vest at the rate of 20% per year of service on the Board. Additional grants were made from time to time so that each non-employee director would hold 15,000 unvested options at any time. Effective March 28, 2003, the options granted to a non-employee and non-affiliated director upon initial appointment to the Board vest at the rate of 33 1/3% per year of service on the Board. Additional grants of options to purchase 5,000 shares of common stock will be made on a date reasonably close to each anniversary of such director’s appointment to the Board to be determined by the Compensation Committee in its sole discretion, with such options vesting on the third anniversary of the grant. All options granted to non-employee directors have exercise prices that representedequal to the market price of our common stock on the date of grant and have ten-year contractual terms. Unvested options as of December 31, 2006 had vesting periods of three years from date of grant. None of the stock options outstanding at December 31, 2006 are subject to performance or exceededmarket-based vesting conditions.
The Company adopted Financial Accounting Standards Board (FASB) Statement No. 123(R),Share-Based Payment (FAS 123(R)), on January 1, 2006. FAS 123(R) requires the Company to measure and recognize compensation expense for all stock-based awards made to employees and directors, including stock options. Compensation expense is based on the calculated fair market value of the awards as measured at the grant date and is expensed ratably over the service period of the awards (generally the vesting period).
During the year ended December 31, 2006, the Company recorded compensation expense of $12 within general and administrative expense related to 340,000 new option grants (the “New Options”) and $149 within general and administrative expense related to the extension of the post-termination exercisable period for 450,000 options of two former employees from 90 days after termination to the remaining contractual term of the original option grants (the “Modified Options”). The fair value of the New Options and the Modified Options were estimated on the grant date or the modification dates, as the case may be, using the Black-Scholes option pricing model. With respect to the New Options, the Black-Scholes model was used with the following assumptions: risk-free interest rates of 4.87% to 4.99%; dividend yields of zero percent; expected lives of 2 to 9 years and volatility of 89.14%. With respect to the Modified Options, the Black Scholes model was used with the following assumptions: risk-free interest rates of 4.71% to 5.07%, based on the US treasury yield in effect at the time of grant; dividend yields of zero percent; expected lives of 2 to 9 years, based on historical exercise activity behavior, and volatility of 89.14%, based on the historical volatility of our stock onover a time period that is consistent with the grant date. Exercise prices on outstandingexpected life of the option. As of December 31, 2006, there was $124 of unrecognized compensation expense related to unvested stock options, grantedwhich is expected to our non-employee directors range from $2.37be recognized over a weighted-average period of nearly 3 years
Prior to $13.00 per share.
Long-Term Incentive Plansthe adoption of FAS 123(R), the Company applied the recognition and Other Matters
We do not maintain a long-term incentive plan or pension plan (as defined in Item 402measurement principles of SEC Regulation S-K)Accounting Principles Board Opinion No. 25,Accounting for its executive officersStock Issued to Employees, and has not repriced any options or SARs for any executive officer during the last fiscal year.
Stock Option and Other Compensation Plans
Stock Option Plan. Our Fourth Amended and Restated 1997 Stock Option Plan allows usrelated interpretations. Accordingly, no stock-based employee compensation expense related to grant options to our employees, directors and advisors, which gives them the right to buy our common stock at a fixed price, even if the market value of our stock goes up. The Compensation Committee of our Board of Directors administers our stock option plan and it has the sole authoritygrants was reflected in net income in years prior to set the number, exercise price, term and vesting provisions of the2006, as all options granted under the plan, except that any award madethose plans had a grant price equal to a director serving on the Compensation Committee must be ratified by a majority of the entire Board of Directors. Under the terms of the plan, the exercise price of an incentive stock option, as defined under the Internal Revenue Code of 1986, as amended, cannot be less than the fair market value of our common stock on the date of grant. The Company elected to use the option is granted. In general,modified prospective transition method to implement FAS 123(R) and,
TRANSGENOMIC, INC. AND SUBSIDIARIES
NOTES TO CONSOLIDATED FINANCIAL STATEMENTS - Continued
Years Ended December 31, 2006, 2005 and 2004
(Dollars in thousands except per share data)
accordingly, did not restate financial results for prior periods. The Company elected to follow the alternative method under FASB Staff Position FAS 123R-3,Transition Election Related to Accounting for the Tax Effects of Share-Based Payment Awards, for purposes of determining the Company’s pool of excess tax benefits available to absorb tax deficiencies. The following table details the effect on net income and earnings per share had compensation expense for all stock-based awards, including stock options, will expire if not exercised within ten years frombeen recorded in the twelve months ended December 31, 2005 and 2004 based on the fair value method under FASB Statement No. 123,Accounting for Stock-Based Compensation:
| 2005 | 2004 | |||||||
Net Loss: | ||||||||
As reported | $ | (14,993 | ) | $ | (34,372 | ) | ||
Total stock-based employee compensation expense determined under fair value based method for all awards, net of tax | 957 | 1,060 | ||||||
Pro forma | $ | (15,950 | ) | $ | (35,432 | ) | ||
Basic and diluted loss per share: | ||||||||
As reported | (0.42 | ) | (1.19 | ) | ||||
Pro forma | (0.45 | ) | (1.22 | ) | ||||
Income Taxes.
Deferred tax assets and liabilities are determined based on the differences between the financial reporting and tax basis of assets and liabilities at each balance sheet date they are granted. The Compensation Committee may also require that an option holder remain employed by us for a specified period of time before an option may be exercised. The committee establishes these “vesting” provisions on an individual basis. The Compensation Committee will also decide whether options will be nonqualified options or structuredusing tax rates expected to be qualified optionsin effect in the year the differences are expected to reverse. Deferred tax assets are reduced by a valuation allowance to the extent that it is more likely than not that they will not be realized.
Revenue Recognition.
Revenue on the sales of products is recognized in accordance with the terms of the sales arrangement. Such recognition is based on receipt of an unconditional customer order and transfer of title and risk of ownership to the customer, typically upon shipment of the product. Our sales terms do not provide for the right of return unless the product is damaged or defective. Revenues from certain services associated with our analytical instruments, to be performed subsequent to shipment of the products, is deferred and recognized when the services are provided. Such services, mainly limited to installation and training services that are not essential to the functionality of the instruments, typically are performed in a timely manner subsequent to shipment of the instrument. The Company also enters into various service contracts that cover installed instruments. These contracts cover specific time periods and revenue associated with these contracts is deferred and recognized over the service period. At December 31, 2006 and 2005, deferred revenue, mainly associated with the Company’s service contracts, included on the Company’s balance sheet in other accrued expenses was approximately $1,591 and $2,124, respectively.
Research and Development.
Research and development costs are charged to expense when incurred.
Translation of Foreign Currency.
Financial statements of subsidiaries outside the U.S. are measured using the local currency as the functional currency. The adjustments to translate those amounts into U.S. dollars are accumulated in a
TRANSGENOMIC, INC. AND SUBSIDIARIES
NOTES TO CONSOLIDATED FINANCIAL STATEMENTS - Continued
Years Ended December 31, 2006, 2005 and 2004
(Dollars in thousands except per share data)
separate account in stockholders’ equity and are included in accumulated other comprehensive income. Foreign currency transaction gains or losses resulting from changes in currency exchange rates are included in the determination of net income. Foreign currency transaction adjustments increased net loss by $79 and $332 during the years ended December 31, 2006 and 2005, respectively, and decreased net loss by $445 during the year ended December 31, 2004.
Comprehensive Income.
Accumulated other comprehensive income tax purposes. Either incentiveat December 31, 2006 and 2005 consisted of foreign currency translation adjustments. For all previous periods presented, accumulated other comprehensive income consists of foreign currency translation adjustments and unrealized gains or nonqualifiedlosses on available for sale investments. The Company deems its foreign investments to be permanent in nature and does not provide for taxes on currency translation adjustments arising from converting its investments in a foreign currency to U.S. dollars.
Earnings Per Share.
Basic earnings per share are calculated based on the weighted-average number of common shares outstanding during each period. Diluted earnings per share include shares issuable upon exercise of outstanding stock options, may be grantedwarrants or conversion rights that have exercise or conversion prices below the market value of our common stock. Options, warrants and conversion rights pertaining to employees, but only nonqualified stock options may be granted to our non-employee directors13,530,241, 13,625,675 and advisors. Options for a maximum of 7,000,000 shares may be granted under the plan. Outstanding options for a total of 5,042,26913,484,072 shares of our common stock have been excluded from the computation of diluted earnings per share at December 31, 2006, 2005 and 2004 because the exercise or conversion price of these instruments exceeded the market price of our common stock on those dates.
Recently Issued Accounting Pronouncements
In July 2006, the FASB issued Interpretation (“FIN”) No. 48, “Uncertainty in Income Taxes.” FIN 48 applies to all tax positions within the scope of Statement 109 and clarifies when and how to recognize tax benefits in the financial statements with a two-step approach of recognition and measurement. FIN 48 will become effective in the first quarter of 2007. Management continues to evaluate the effect that adoption of FIN 48 will have on our consolidated results of operations and financial position.
In September 2006, the SEC issued Staff Accounting Bulletin. 108,Considering the Effects of Prior Year Misstatements when Quantifying Misstatements in Current Year Financial Statements (SAB 108). SAB 108 provides interpretive guidance on how the effects of prior-year uncorrected misstatements should be considered when quantifying misstatements in current year financial statements. SAB 108 requires registrants to quantify misstatements using both an income statement and balance sheet approach and then evaluate whether either approach results in a misstatement that, when all relevant quantitative and qualitative factors are outstanding atconsidered, is material. If prior year errors that had been previously considered immaterial are now considered material based on either approach, no restatement is required so long as management properly applied its previous approach and all relevant
facts and circumstances were considered. If prior year’s financial statements are not restated, the Record Date, of which 4,150,845 may be exercised at this time. Outstanding options have exercise prices ranging from $1.09 to $13.00
TRANSGENOMIC, INC. AND SUBSIDIARIES
NOTES TO CONSOLIDATED FINANCIAL STATEMENTS - Continued
Years Ended December 31, 2006, 2005 and 2004
(Dollars in thousands except per share.share data)
Undercumulative effect adjustment is recorded in opening accumulated earnings (deficit) as of the beginning of the fiscal year of adoption. SAB 108 is effective for us at the end of 2006. There was no impact to our Consolidated Financial Statements as a result of adoption of this pronouncement.
In September 2006, the FASB issued Statement No. 157, Fair Value Measurement (FAS 157). While this statement does not require new fair value measurements, it provides guidance on applying fair value and expands required disclosures. FAS 157 is effective for us beginning in the first quarter of 2008. We are currently assessing the impact FAS 157 may have on our Consolidated Financial Statements.
In February 2007, the FASB issued Statement No. 159, The Fair Value Option for Financial Assets and Financial Liabilities (FAS 159). This statement, which is expected to expand fair value measurement, permits entities to choose to measure many financial instruments and certain other items at fair value. FAS 159 is effective for us beginning to the first quarter of 2008. We are currently assessing the impact FAS 159 may have on our Consolidated Financial Statements.
C. DISCONTINUED OPERATIONS AND DIVESTITURES
In the fourth quarter of 2005, the Company implemented a plan to exit the Nucleic Acids operating segment which was primarily engaged in the manufacture of phosphoramadites and the raw materials to produce phosphoramadites which are used to produce synthetic DNA. Accordingly, the Company now reflects the related assets and results of operations from this segment as discontinued operations for all periods presented. Expenses that are not directly identified to the Nucleic Acids operating segment or are considered corporate overhead have not been allocated to this segment in arriving at results from discontinued operations. Summary results of operations of the former Nucleic Acids operating segment were as follows:
| Years Ended December 31, | |||||||||
| 2006 | 2005 | 2004 | |||||||
NET SALES | $ | 1,142 | $ | 3,881 | $ | 8,546 | |||
COST OF GOODS SOLD | 912 | 4,004 | 12,599 | ||||||
Gross profit (loss) | 230 | (123) | (4,053) | ||||||
OPERATING EXPENSES: | |||||||||
Selling, general and administrative | 264 | 1,054 | 1,538 | ||||||
Research and development | — | — | 2,184 | ||||||
Restructuring charges | — | — | 2,303 | ||||||
Exit and disposal charges | — | 866 | — | ||||||
Impairment charges | 436 | 8,022 | 11,965 | ||||||
Gain on sale of facility | — | — | (1,466) | ||||||
| 700 | 9,942 | 16,524 | |||||||
LOSS FROM OPERATIONS | (470) | (10,065) | (20,577) | ||||||
OTHER INCOME (EXPENSE) | 2 | 56 | (143) | ||||||
LOSS BEFORE INCOME TAXES | (468) | (10,009) | (20,720) | ||||||
INCOME TAX BENEFIT | — | — | (98) | ||||||
LOSS FROM DISCONTINUED OPERATIONS | $ | (468) | $ | (10,009) | $ | (20,622) | |||
TRANSGENOMIC, INC. AND SUBSIDIARIES
NOTES TO CONSOLIDATED FINANCIAL STATEMENTS - Continued
Years Ended December 31, 2006, 2005 and 2004
(Dollars in thousands except per share data)
On December 22, 2005, the Company’s Directors voted to either sell or close and liquidate the Nucleic Acids operating segment, which consists primarily of a manufacturing facility in Glasgow, Scotland. This decision was made after an evaluation of, among other things, short and long-term sales projections for products sold by this operating segment, including estimates of 2006 sales to the operating segment’s largest customer. In addition, the Company expects to incur additional period costs attributable to closure of the facility that will be recorded in discontinued operations in 2007. In conjunction with the decision to exit this operating segment, the Company recorded an impairment charge of $8,022 in 2005 consisting of valuation adjustments to reflect the carrying value of the related net assets at estimated fair market value.
There was no goodwill associated with the former Nucleic Acids operating segment at December 31, 2005 and 2004. The former Nucleic Acids operating segment recorded charges of $9,865 during 2004 related to the impairment of goodwill. The 2004 charge resulted from an interim period impairment test performed during the second quarter of 2004.
The interim period impairment test became necessary after the Company’s Directors directed management during the second quarter of 2004 to explore strategic alternatives for the former Nucleic Acids operating segment. This process included significant due diligence by management, third-party advisors and prospective independent buyers and other interested parties. Information obtained through this process indicated that it was more likely than not that the assets associated with the Nucleic Acids operating segment were impaired.
The former Nucleic Acids operating segment also recorded a charge of $2,100 during the second quarter of 2004 related to the impairment of property and equipment associated with this operating segment.
On November 13, 2004, the former Nucleic Acids operating segment sold the assets associated with its specialty oligonucleotides manufacturing facility in Boulder, Colorado to a subsidiary of Eyetech Pharmaceuticals, Inc. (“Eyetech”). The sale price was $3,000 in cash plus the assumption of the lease on the Boulder facility and of certain equipment leases with a gross value of $2,377. Substantially all of the 27 employees at the Boulder facility became Eyetech employees. Net proceeds from the sale (after transaction expenses and fees paid to our investment advisors) equaled approximately $2,700. In conjunction with this transaction, the Nucleic Acids operating segment recorded a gain on sale of $1,466 in the fourth quarter of 2004.
The Company implemented restructuring plans in 2004 and 2002 designed to better align its cost structure with anticipated revenues. In conjunction with these plans, the former Nucleic Acids operating segment recorded restructuring charges in 2004 of $2,303 related primarily to employee severance agreements, office closures, property and equipment and intellectual property. There were accrued expenses associated with these restructuring plans of $191 at December 31, 2005.
The Company accepted common stock from a customer of the former Nucleic Acids operating segment, Geron Corporation (“Geron”) as payment for goods and services. These shares were
TRANSGENOMIC, INC. AND SUBSIDIARIES
NOTES TO CONSOLIDATED FINANCIAL STATEMENTS - Continued
Years Ended December 31, 2006, 2005 and 2004
(Dollars in thousands except per share data)
classified as available-for-sale securities. Net realized gains on these securities during 2005 of $52 and realized losses on these securities of $128 during 2004 were reflected as other expense. Proceeds from the sales of these available for sale securities are reflected within net cash flows from investing activities. During 2005 and 2004, sales to Geron totaled $1,949 and $4,151, respectively, representing 50% and 49%, respectively, of net sales within this operating segment.
The assets and liabilities of the former Nucleic Acids operating segment were as follows:
| December 31, | ||||||
| 2006 | 2005 | |||||
Accounts receivable (net of allowances for bad debts of $169 and $393, respectively) | $ | — | $ | 51 | ||
Inventories | — | 86 | ||||
Prepaid expenses and other current assets | — | 60 | ||||
Current assets of discontinued operations | $ | — | $ | 197 | ||
Property, plant and equipment, net | $ | 2,773 | $ | 2,933 | ||
Other assets | — | — | ||||
Non-current assets of discontinued operations | $ | 2,773 | $ | 2,933 | ||
Accounts payable | $ | 45 | $ | 434 | ||
Other accrued expenses | 139 | 863 | ||||
Accrued compensation | — | 625 | ||||
Current liabilities of discontinued operations | $ | 184 | $ | 1,922 | ||
D. INVENTORIES
Inventories consisted of the following:
| December 31, | ||||||
| 2006 | 2005 | |||||
Finished goods | $ | 2,146 | $ | 2,062 | ||
Raw materials and work in process | 443 | 653 | ||||
Demonstration inventory | 83 | 275 | ||||
| $ | 2,672 | $ | 2,990 | |||
The Company recorded a charge of $178 during the fourth quarter of 2005 related to the impairment of certain inventory associated with third party platforms. No charges were recorded for the year ended December 31, 2006.
TRANSGENOMIC, INC. AND SUBSIDIARIES
NOTES TO CONSOLIDATED FINANCIAL STATEMENTS - Continued
Years Ended December 31, 2006, 2005 and 2004
(Dollars in thousands except per share data)
E. OTHER ASSETS
Finite lived intangible assets and other assets consisted of the following:
| December 31, | ||||||||||||||||||
| 2006 | 2005 | |||||||||||||||||
| Cost | Accumulated Reserve | Net Book Value | Cost | Accumulated Reserve | Net Book Value | |||||||||||||
Intellectual property | $ | 765 | $ | 677 | $ | 88 | $ | 765 | $ | 534 | $ | 231 | ||||||
Patents | 676 | 155 | 521 | 636 | 135 | 501 | ||||||||||||
Other | 705 | 461 | 244 | 838 | 496 | 342 | ||||||||||||
Total | $ | 2,146 | $ | 1,293 | $ | 853 | $ | 2,239 | $ | 1,165 | $ | 1,074 | ||||||
During the year ended December 31, 2005, management determined that certain international patent pursuits were no longer consistent with the Company’s strategic plan. Accordingly, the Company recorded an impairment charge of $247 in 2005 related to the abandonment of such pursuits. No such charges were recorded during 2006.
Amortization expense for intangible assets was $171, $1,159 and $1,197 during years ended December 31, 2006, 2005 and 2004, respectively. Amortization expense for intangible assets is expected to be approximately $66 for 2007, $53 for 2008, $42 for 2009 and 2010, $38 for 2011 and $32 for 2012.
F. DEBT
The Company had no debt at December 31, 2006 and 2005.
In December 2003, the Company entered into a $7,500 line of credit (the “Credit Line”) with Laurus Master Fund, Ltd. (“Laurus”). The term of the Credit Line was three years carrying an interest rate of 2.0% over the prime rate or a minimum of 6.0% (7.25% at December 31, 2004). Funds available under the Credit Line were determined by a borrowing base equal to 90% of eligible accounts receivable balances plus up to $1,000 related to inventory balances. The Credit Line was secured by most of the Company’s assets. Prior to amendments to the Credit Line discussed below, payment of interest and principal could, under certain circumstances, be made with shares of the Company’s common stock at a fixed conversion price of $2.20 per share. Conversion of this debt to common stock could have been made at the election of Laurus or the Company. The Company could elect to convert only if its shares traded at a price exceeding $2.42 per share for ten consecutive trading days, and such conversion was further subject to trading volume limitations and a limitation on the total beneficial ownership by Laurus of the Company’s common stock. Upon entering into the Credit Line, the Company issued warrants to Laurus to acquire 550,000 shares of the Company’s common stock at an exercise price exceeding the average trading price of the Company’s common stock over the ten trading days prior to the date of the warrant. The amount available under the Credit Line at December 31, 2004 and 2003 was $1,552 and $4,508, respectively.
TRANSGENOMIC, INC. AND SUBSIDIARIES
NOTES TO CONSOLIDATED FINANCIAL STATEMENTS - Continued
Years Ended December 31, 2006, 2005 and 2004
(Dollars in thousands except per share data)
In February 2004, the Company entered into a separate $2,750 convertible note with Laurus (the “Term Note”). The Term Note carried an interest rate of 2.0% over the prime rate or a minimum of 6.0% (7.25% at December 31, 2004) and had a term of 3 years. Prior to amendments to the Term Note discussed below, the principal and interest on the Term Note could be converted into common stock of the Company at a fixed conversion price of $2.61 per share. Upon entering the Term Note, the Company issued warrants to Laurus to acquire 125,000 shares of its common stock. Borrowings under the Term Note were primarily used to retire the mortgage debt on the Company’s Glasgow facility. Remaining borrowings of approximately $750 were used to complete the build-out of the Glasgow facility, complete the consolidation the Company’s Glasgow operations into the new facility and provide funds for operations.
Certain features of the Credit Line and Term Note (collectively, the “Laurus Loans”) required the Company to separately account for the value of certain amounts related to the warrants issued and the conversion feature of the Laurus Loans. Specifically, Emerging Issues Task Force (“EITF”) No. 00-27,Application of Issue No. 98-5 to Certain Convertible Instruments, requires the Company to separately value the warrants issued and the “beneficial conversion premium” related to the Laurus Loans. The values of the warrants and the beneficial conversion premium were recorded on the balance sheet as a debt discount and an increase to additional paid in capital. The debt discount recorded for these items was amortized as expense to the income statement over the terms of ourthe Laurus Loans or as the debt was converted into common stock option plan, any options not vested will become immediately vested ifthereby increasing the option holder dies, becomes permanently disabled or retires. If an option holder voluntarily resigns, any options not vested aseffective interest rate on the Laurus Loans. In January and February 2004, Laurus exercised its conversion rights on the Credit Line and converted $2,000 of amounts outstanding on the Credit Line into approximately 910,000 shares of common stock of the dateCompany. In connection with this conversion, the Company accelerated the amortization of resignationapproximately $480 of the beneficial conversion premium.
In February 2004, Laurus waived the borrowing base limitation on the Credit Line, thereby making the full $7,500 facility available to the Company regardless of the available collateral. On August 31, 2004, Laurus agreed to extend the borrowing base waiver on the Credit Line through March 19, 2005. In addition, Laurus deferred certain payments due under the Term Note and reduced the interest rate on both of the Laurus Loans to 0% for any day the closing sale price of the Company’s common stock was at or above $1.75 per share. In return, the Company lowered the conversion price on each of the Laurus Loans to $1.00 per share and issued a warrant to Laurus covering an additional 400,000 common shares at an exercise price of $1.25 per share. The closing price of the Company’s common stock on August 31, 2004 was $1.20 per share.
The August 31, 2004 Laurus modifications were treated as extinguishments for financial reporting purposes since the change in present value of expected cash flows between the original and modified agreements was greater than 10%. As such, the Company recorded a loss on extinguishment of debt of $2,859 at August 31, 2004 reflecting the difference between (i) the recorded amount of debt, net of related discounts, of $7,427 and (ii) the fair value of the new debt instrument of $10,287 plus the fair value of the new warrants of $111. The difference between the fair value of the new debt of $10,287 and the face value of the debt of $8,572 represented a premium, which was reflected as a reduction of interest expense over the life of the new debt.
TRANSGENOMIC, INC. AND SUBSIDIARIES
NOTES TO CONSOLIDATED FINANCIAL STATEMENTS - Continued
Years Ended December 31, 2006, 2005 and 2004
(Dollars in thousands except per share data)
On March 18, 2005, Laurus agreed to further extend the borrowing base waiver on the Credit Line until March 31, 2006. In connection with this waiver, the Company agreed to allow Laurus to convert $1,872 of the outstanding principal balance under the Credit Line into 3,600,000 shares of its common stock. In addition, on March 24, 2005 the Company agreed to allow Laurus to convert $650 of the outstanding principal balance of the Term Note into 1,250,000 shares of common stock. As a result, the Company increased the amount available under the Credit Line by $1,872 and eliminated substantially all remaining 2005 scheduled principal payments on the Term Loan. The closing market price of the Company’s common stock the day before each of these conversions was $0.58 per share. No other provisions of the Credit Line or Term Note were modified, including the $1.00 conversion price for remaining debt. In conjunction with these conversions the Company accelerated amortization of $0.41 million of related debt premiums and discounts and recorded a charge to interest expense of $1.37 million related to the fair value of incremental shares received by Laurus.
Contemporaneously with the closing of a private placement of the Company’s common stock on October 31, 2005 (the “2005 Private Placement”), the Company repaid all outstanding principal and accrued interest on the Laurus Loans which have been cancelled and are no longer available to the Company. In conjunction with this prepayment, the Company recorded a loss on debt extinguishment of $541. This loss consisted of prepayment penalties and fees paid to Laurus to facilitate the 2005 Private Placement of $844 offset by the elimination of associated net debt premiums of $303.
Interest expense consisted of the following:
| Years Ended December 31, | ||||||||||
| 2006 | 2005 | 2004 | ||||||||
Interest paid or accrued on outstanding debt | $ | — | $ | 553 | $ | 542 | ||||
Amortization of debt premiums | — | (857 | ) | — | ||||||
Amortization of debt discounts – warrants | — | 28 | — | |||||||
Amortization of debt discount – beneficial conversion feature | — | 725 | 1,641 | |||||||
Fair value of incremental shares received by Laurus | — | 1,365 | — | |||||||
Other | 11 | 164 | 183 | |||||||
| $ | 11 | $ | 1,978 | $ | 2,366 | |||||
G. COMMITMENTS AND CONTINGENCIES
The Company is not a party to any pending legal proceedings which, if decided adversely to the Company, will terminatehave a material adverse effect on our financial position, results of operations or cash flows.
The Company leases certain equipment, vehicles and operating facilities under non-cancellable operating leases that expire on various dates through 2014. The future minimum lease payments required under these leases are approximately $875 in 2007, $769 in 2008, $692 in 2009, $574 in 2010, $378 in 2011, $226 in 2012, and $98 thereafter. Rent expense related to all rights will cease, asoperating leases for the
TRANSGENOMIC, INC. AND SUBSIDIARIES
NOTES TO CONSOLIDATED FINANCIAL STATEMENTS - Continued
Years Ended December 31, 2006, 2005 and 2004
(Dollars in thousands except per share data)
years ended December 31, 2006, 2005 and 2004 was approximately $1,038, $1,283 and $2,007, respectively.
At December 31, 2006, firm commitments to vendors to purchase components used in WAVE Systems and OEM instruments totaled $1,028. The Company expects to pay the majority of these purchase commitments during 2007.
H. INCOME TAXES
The Company’s provision for income taxes for the years ended December 31, 2006, 2005 and 2004 relates to income taxes in states, foreign countries and other local jurisdictions, is all current and differs from the amounts determined by applying the Compensation Committeestatutory Federal income tax rate to loss before income taxes for the following reasons:
| 2006 | 2005 | 2004 | |||||||
Benefit at federal rate | $ | (997) | $ | (1,687) | $ | (4,674) | |||
Increase (decrease) resulting from: | |||||||||
State income taxes—net of federal benefit | (210) | (192) | (428) | ||||||
Foreign subsidiary tax rate difference | (135) | (81) | (151) | ||||||
Research and development tax credit | — | — | (76) | ||||||
Other—net | 28 | 191 | 145 | ||||||
Valuation allowance | 1,344 | 1,795 | 5,188 | ||||||
Current income tax expense | $ | 30 | $ | 26 | $ | 4 | |||
The Company’s deferred income tax asset from continuing and documenteddiscontinued operations at December 31, 2006 and 2005 is comprised of the following temporary differences:
| 2006 | 2005 | |||||||
Net operating loss carryforward | $ | 40,377 | $ | 38,730 | ||||
Research and development credit carryforwards | 1,328 | 1,328 | ||||||
Deferred revenue | 249 | 341 | ||||||
Accrued vacation | 69 | 78 | ||||||
Fixed assets | 1,163 | 1,270 | ||||||
Reserves | 1,250 | 814 | ||||||
Other | (238 | ) | — | |||||
| 44,198 | 42,561 | |||||||
Less valuation allowance | (44,198 | ) | (42,561 | ) | ||||
| $ | — | $ | — | |||||
At December 31, 2006, the Company had total unused federal tax net operating loss carryforwards from continuing and discontinued operations of $106,233 of which $1,770 expire in the option grant documents. In the event an option holder’s employment, board membership or status as an advisor is terminated for cause, the option holder’s right to exercise an option, whether or not vested, will immediately terminate2008, $3,698 expire in 2009, $2,970 expire in 2010, $943 expire in 2011, $3,425 expire in 2012, $1,838 expire in 2018, $8,182 expire in 2019, $9,662 expire in 2020, $8,228 expire in 2021, $16,862 expire in 2022, $16,173 expire in 2023, $17,390 expire in 2024, $8,153 expire in 2025, and all rights will cease, unless the Compensation Committee determines otherwise.$6,939 expire in 2026.
TRANSGENOMIC, INC. AND SUBSIDIARIES
NOTES TO CONSOLIDATED FINANCIAL STATEMENTS - Continued
Years Ended December 31, 2006, 2005 and 2004
(Dollars in thousands except per share data)
Employee Savings Plan. We have established an employee savings planWhile the Company has significant net operating loss carryforwards, it is likely that is intended to qualify as a tax-qualified plan under Section 401(k)382 (Limitation on Net Operating Loss Carryforwards and Certain Built-In Losses Following Ownership Change) of the Internal Revenue Code. ThisCode, and the regulations promulgated there under, will significantly limit the amount of net operations loss carryforward that the Company could utilize in any tax year. At December 31, 2006, the Company had unused state tax net operating loss carryforwards from continuing and discontinued operations of approximately $43,836 that expire at various times between 2007 and 2026. At December 31, 2006, the Company had unused research and development credit carryforwards from continuing and discontinued operations of $1,328 that expire at various times between 2008 and 2024. A valuation allowance has been provided for the remaining deferred tax assets, due to the Company’s cumulative losses in recent years, expected losses in future years and an inability to utilize any additional losses as carrybacks. The Company will continue to assess the recoverability of deferred tax assets and the related valuation allowance. To the extent the Company begins to generate income in future years and it is determined that such valuation allowance is no longer required, the tax benefit of the remaining deferred tax assets will be recognized at such time.
I. EMPLOYEE BENEFIT PLAN
The Company maintains an employee 401(k) retirement savings plan that allows for voluntary contributions up to statutory maximumsinto designated investment funds by eligible employees. We match a specific proportionThe Company matches the employees’ contributions at the rate of these contributions, subject to limitations imposed by law. We50% on the first 6% of contributions. The Company may, at the discretion of its Board of Directors, make additional contributions to the savings plan on behalf of our employees if our Board of Directors decides to do so. During each of threethe Plan’s participants. For the years ended December 31, 2006, 2005 and 2004, we contributed approximately $0.5 millionCompany contributions to the savings401(k) plan on behalfwere $164, $172, and $279, respectively.
J. STOCKHOLDERS’ EQUITY
Common Stock.
On October 31, 2005, the Company completed the 2005 Private Placement. The securities issued consisted of: (i) 14,925,743 shares of our employees.the Company’s common stock, plus (ii) five-year, non-callable warrants to purchase another 5,970,297 shares of common stock with an exercise price of $1.20 per share. The aggregate purchase price for the securities sold in the 2005 Private Placement was $1.01 per share of common stock initially being sold (the “Purchase Price”) or $15,075. In conjunction with the 2005 Private Placement, the Company issued a warrant to Oppenheimer & Co., Inc. to purchase 932,859 shares at $1.20 per share as part of their placement fee.
TRANSGENOMIC, INC. AND SUBSIDIARIES
NOTES TO CONSOLIDATED FINANCIAL STATEMENTS - Continued
Years Ended December 31, 2006, 2005 and 2004
(Dollars in thousands except per share data)
Employee Stock Purchase Plan. Our Second AmendedDuring 2005 and Restated2004, the Company issued 4,900,000 and 1,134,850 shares, respectively, of common stock in conjunction with conversions under the Laurus Loans as follows.
Date | Price | Shares Issued | Net Proceeds | Facility | Applied To | |||||||
January 2005 | $ | 1.00 | 50,000 | $ | 50 | Term Note | Principal | |||||
March 2005 | $ | 0.52 | 3,600000 | 1,835 | Credit Note | Principal | ||||||
March 2005 | $ | 0.52 | 1,250,000 | 650 | Term Note | Principal | ||||||
Total 2005 | 4,900,000 | $ | 2,535 | |||||||||
January 2004 | $ | 2.20 | 650,000 | $ | 1,422 | Credit Line | Principal | |||||
February 2004 | $ | 2.20 | 259,091 | 570 | Credit Line | Principal | ||||||
December 2004 | $ | 1.00 | 150,000 | 146 | Term Note | Principal | ||||||
December 2004 | $ | 1.00 | 75,759 | 72 | Term Note | Interest | ||||||
Total 2004 | 1,134,850 | $ | 2,210 | |||||||||
Each of the foregoing stock sales was exempt from registration under the Securities Act of 1933, as amended (the “Securities Act”) as a sale not involving a public offering. These shares have been registered for resale under the Securities Act.
In May 2001, Company shareholders approved the adoption of the Transgenomic, Inc. 2001 Employee Stock Purchase Plan (the “Stock Purchase Plan”) has been structured to qualify as an “employee stock purchase plan” under Section 423that was subsequently implemented in November 2001 and terminated in December 2005. Substantially all of the Internal Revenue CodeCompany’s U.S. employees were eligible to participate in
TRANSGENOMIC, INC. AND SUBSIDIARIES
NOTES TO CONSOLIDATED FINANCIAL STATEMENTS - Continued
Years Ended December 31, 2006, 2005 and 2004
(Dollars in thousands except per share data)
the Plan. Eligible employees authorize payroll deductions to be made for the purchase of 1986, as amended. Additionally, the Stock Purchase Plan authorizes the Compensation Committee of the Board of Directors to adopt sub-plans designed to achieve desired tax and other objectives in locations outside the United States. Up to 500,000 shares of our common stock may be issued during the term of the Stock Purchase Plan that is defined as December 1, 2001 through November 30, 2006. Employees will be able to voluntarily participate in the Stock Purchase Plan through payroll deductions.shares. Such deductions will accumulatewere accumulated during the participation periods,a defined as three month periods. On the first business day of each participation period at the end of which each participant will bewas deemed to have been granted an option to purchase commonshares of stock from the Company at 85% of itsthe fair market value of the Company stock as measured by the closing price of the stock on either the first or last business day of the participation period, whichever iswas lower. The number of shares to be purchased isunder the option was based upon the participant’s elected withholding amount. At the end of eachthe participation period such option iswas automatically exercised. This plan was structured to qualify as an “employee stock purchase plan” under Section 423 of the Internal Revenue Code of 1986, as amended. The Company issued 7,551, 25,504, and 76,902 shares under this plan, during the years ended December 31, 2006, 2005 and 2004, respectively.
Common Stock Warrants.
No common stock warrants were issued during 2006. Warrants covering 6,903,156 shares of common stock were issued during 2005. At December 31, 2006, we had 8,062,577 common stock warrants outstanding.
Warrant Holder | Issue Year | Expiration Year | Underlying Shares | Exercise Price | |||||
Various Institution Holders(1) | 2005 | 2010 | 6,903,156 | $ | 1.20 | ||||
Laurus Master Fund, Ltd.(2) | 2003 | 2010 | 200,000 | $ | 1.92 | ||||
Laurus Master Fund, Ltd.(2) | 2003 | 2010 | 200,000 | $ | 2.07 | ||||
Laurus Master Fund, Ltd.(2) | 2003 | 2010 | 150,000 | $ | 2.35 | ||||
Laurus Master Fund, Ltd.(2) | 2004 | 2011 | 125,000 | $ | 2.57 | ||||
Laurus Master Fund, Ltd.(2) | 2004 | 2011 | 400,000 | $ | 1.18 | ||||
TN Capital Equities, Ltd.(2) | 2003 | 2008 | 45,918 | $ | 2.94 | ||||
TN Capital Equities, Ltd.(2) | 2004 | 2009 | 15,566 | $ | 3.18 | ||||
GE Capital(3) | 2002 | 2007 | 13,762 | $ | 3.27 | ||||
GE Capital(3) | 2003 | 2008 | 9,175 | $ | 3.27 | ||||
Total | 8,062,577 | ||||||||
(1) | These warrants were issued in conjunction with the 2005 Private Placement described earlier in this Note. |
(2) | These warrants were issued in conjunction with the Laurus Loans and subsequent modifications. In conjunction with the 2005 Private Placement, the exercise prices of these warrants were adjusted according to repricing provisions contained in the original warrant agreements. Refer to Note F of the consolidated financial statements. |
(3) | These warrants were issued in conjunction with operating leases with GE Capital. While the leases have since been terminated, the warrants are still outstanding. |
Preferred Stock.
The Company’s Board of Directors is authorized to issue up to 15,000,000 shares of preferred stock in one or more series, from time to time, with such designations, powers, preferences and rights and such qualifications, limitations and restrictions as may be provided in a resolution or resolutions
Employment AgreementsTRANSGENOMIC, INC. AND SUBSIDIARIES
NOTES TO CONSOLIDATED FINANCIAL STATEMENTS - Continued
Years Ended December 31, 2006, 2005 and 2004
(Dollars in thousands except per share data)
Weadopted by the Board of Directors. The authority of the Board of Directors includes, but is not limited to, the determination or fixing of the following with respect to shares of such class or any series thereof: (i) the number of shares; (ii) the dividend rate, whether dividends shall be cumulative and, if so, from which date; (iii) whether shares are to be redeemable and, if so, the terms and amount of any sinking fund providing for the purchase or redemption of such shares; (iv) whether shares shall be convertible and, if so, the terms and provisions thereof; (v) what restrictions are to apply, if any, on the issue or reissue of any additional preferred stock; and (vi) whether shares have entered into employment agreementsvoting rights. The preferred stock may be issued with our Chief Executive Officer, Collin J. D’Silva, our Chief Financial Officer, Michael A. Summersa preference over the common stock as to the payment of dividends. The Company has no current plans to issue any series of preferred stock. Classes of stock such as the preferred stock may be used, in certain circumstances, to create voting impediments on extraordinary corporate transactions or to frustrate persons seeking to effect a merger or otherwise to gain control of the Company. For the foregoing reasons, any preferred stock issued by the Company could have an adverse effect on the rights of the holders of the common stock.
K. EQUITY INCENTIVE PLAN
The Company’s 2006 Equity Incentive Plan (the “Plan”) allows the Company to make awards of various types of equity-based compensation, including stock options, dividend equivalent rights (“DERs”), stock appreciation rights (“SARs”), restricted stock, restricted stock units, performance units, performance shares and our Vice Presidentother awards, to employees and General Counsel, Keith A. Johnson. However, effective May 1, 2005, Mr. Johnson will no longer continue as an executive officerdirectors of the Company. The employment agreements with Messrs. D’Silva and Summers require these executivesPlan was adopted in 2006 as a modification of the Company’s 1997 Stock Option Plan (the “Prior Plan”). In addition to devote their full timeproviding for additional types of equity-based awards, the Plan increases the total number of shares of common stock that the Company may issue from 7,000,000 under the Prior Plan to our business activities,10,000,000 shares under the Plan; provided, that theyno more than 5,000,000 of such shares may serve as directorsbe used for grants of restricted stock, restricted stock units, performance units, performance shares and other awards.
TRANSGENOMIC, INC. AND SUBSIDIARIES
NOTES TO CONSOLIDATED FINANCIAL STATEMENTS - Continued
Years Ended December 31, 2006, 2005 and 2004
(Dollars in thousands except per share data)
The Plan is administered by the Compensation Committee of the Board of Directors (the “Committee”) which has the authority to set the number, exercise price, term and vesting provisions of the awards granted under the Plan, subject to the terms thereof. Either incentive or consultantsnon-qualified stock options may be granted to other companies that do not compete with us and for nonprofit corporations, civic organizations, professional groups and similar entities. These executives are not allowed to compete with us during the term of their employment and for one year after they are no longer our employee. Each agreement contains provisions under which these executive officers have agreed to maintain the confidentiality of information concerning us and which prohibits them from disclosing confidential information about our business to people outsideemployees of the Company, except for proper business purposes.but only nonqualified stock options may be granted to nonemployee directors and advisors. However, in either case, the Plan requires that stock options must be granted at exercise prices not less than the fair market value of the common stock on the date of the grant. Options issued under the plan vest over periods as determined by the Compensation Committee and expire 10 years after the date the option was granted. The Company has elected to record expense on a straight-line basis. If the option holder ceases to be employed by the Company, the Company will have the right to terminate any outstanding but unexercised options. To date, the only awards made under the Plan (and the Prior Plan) have been non-incentive stock options. The following table summarizes activity under the Plan (and the Prior Plan) during the three years ended December 31, 2006:
| Number of Options | Weighted Average Exercise Price | |||||
Balance at January 1, 2006: | 5,570,432 | 4.31 | ||||
Granted | 340,000 | .62 | ||||
Exercised | — | — | ||||
Forfeited or expired | (442,768 | ) | 4.45 | |||
Balance at December 31, 2006: | 5,467,664 | $ | 4.08 | |||
Vested and expected to vest at December 31, 2006 | 5,416,664 | $ | 4.08 | |||
Exercisable at December 31, 2006 | 5,127,664 | $ | 4.30 | |||
| �� | ||||||
During the year ended December 31, 2006, the Company issued 225,000 options at exercise prices of $0.68, 15,000 options at exercise prices of $1.03 and 100,000 options at exercise prices of $0.42. The employment agreement with Mr. D’Silva has a termweighted average grant date fair value per share of 22 months expiringoptions granted during the years ended December 2006. The employment agreement with Mr. Summers has an initial term of three years expiring July 2007. Each of these agreements may be extended unless we or the employee, as the case may be, give notice of an intention not to renew. If one of these officers is terminated for reasons other than an act of serious misconduct, the officer will be entitled to severance pay in an amount equal to his then current base annual salary.31, 2006, 2005 and 2004 was $0.31, $0.63 and $0.40, respectively.
Compensation Committee Interlocks and Insider Participation
There are no Compensation Committee interlocks and no insider participation in compensation decisions that are required to be reported under the rules and regulations of the Securities Exchange Act of 1934.
Item 12. Security Ownership of Certain Beneficial Owners and Management.
This table shows the beneficial ownership of our common stock by our directors, by those of our executive officers who are named in the Summary Compensation Table, by all of our current executive officers and directors as a group, and by each person we believe beneficially owns more than 5% of our outstanding common stock as of MarchOn December 28, 2005, the recordCompany’s Directors approved a plan to accelerate the vesting of all outstanding stock options. Aside from the acceleration of the vesting date, established for our Annual Meetingthe terms and the conditions of Stockholders. Each stockholder namedthe stock option award agreements governing the underlying stock option grants remained unchanged. As a result of this plan, options to purchase approximately 1,081,845 shares became immediately exercisable. All such options were out-of-the money, and accordingly, the accelerated vesting resulted in this table has sole votingno compensation expense since there was no intrinsic value associated with these fixed awards at the date of modification. Accelerating the vesting of these options allows the Company to avoid recognition of compensation expense associated with these options in future periods.
TRANSGENOMIC, INC. AND SUBSIDIARIES
NOTES TO CONSOLIDATED FINANCIAL STATEMENTS - Continued
Years Ended December 31, 2006, 2005 and investment power over the shares he beneficially owns, and all such shares are owned directly by the stockholder unless otherwise indicated. Stock ownership information of persons other than our executive officers and directors is based on Schedules 13D, 13F or 13G filed with the Securities and Exchange Commission.
|
|
| ||||
| ||||||
| ||||||
| ||||||
| ||||||
| ||||||
| ||||||
| ||||||
| ||||||
| ||||||
| ||||||
| ||||||
| ||||||
| ||||||
Equity Compensation Plan Information(Dollars in thousands except per share data)
The following equity compensation plantable summarizes information summarizes plans and securities approved and not approved by security holdersabout options outstanding as of December 31, 2004:2006:
| (a) | (b) | (c) | |||||
PLAN CATEGORY | Number of securities to be issued upon exercise of outstanding options, warrants and rights | Weighted-average exercise price of outstanding options, warrants and rights | Number of securities remaining available for future issuance under equity compensation plans (excluding securities reflected in column (a)) | ||||
Equity compensation plans approved by security holders | 5,088,037 | $ | 5.09 | 867,727 | |||
Equity compensation plans not approved by security holders | — | — | — | ||||
Total | 5,088,037 | $ | 5.09 | 867,727 | |||
| Options Outstanding | Options Exercisable | |||||||||||
Range of Exercise Prices | Number Outstanding | Weighted- Average Remaining Contractual Life | Weighted- Average Exercise Price | Number Exercisable | Weighted- Average Exercise Price | |||||||
| (in years) | ||||||||||||
$ 0.00—$ 1.30 | 1,665,500 | 7.9 | $ | 0.99 | 1,325,500 | $ | 1.08 | |||||
$ 1.31—$ 2.60 | 674,833 | 6.1 | $ | 1.92 | 674.833 | $ | 1.92 | |||||
$ 2.61—$ 3.90 | 10,000 | 5.8 | $ | 2.90 | 10,000 | $ | 2.90 | |||||
$ 3.91—$ 5.20 | 2,025,600 | 1.0 | $ | 5.00 | 2,025,600 | $ | 5.00 | |||||
$ 5.21—$ 6.50 | 591,500 | 3.9 | $ | 6.15 | 591,500 | $ | 6.15 | |||||
$ 6.51—$ 9.10 | 10,000 | 4.4 | $ | 9.00 | 10,000 | $ | 9.00 | |||||
$ 9.11—$10.40 | 280,500 | 3.5 | $ | 9.89 | 280,500 | $ | 9.89 | |||||
$10.41—$13.00 | 209,731 | 3.2 | $ | 12.75 | 209,731 | $ | 12.80 | |||||
| 5,467,664 | 4.3 | $ | 4.07 | 5,127,664 | $ | 4.30 | ||||||
L. OPERATING SEGMENT AND GEOGRAPHIC INFORMATION
| Years Ended December 31, | |||||||||
| 2006 | 2005 | 2004 | |||||||
Bioinstruments | $ | 13,604 | $ | 14,427 | $ | 14,385 | |||
Bioconsumables | 8,719 | 8,981 | 8,838 | ||||||
Discovery Services | 1,092 | 2,420 | 2,020 | ||||||
| $ | 23,415 | $ | 25,828 | $ | 25,243 | ||||
Net sales by geographic region were as follows:
| Years Ended December 31, | |||||||||
| 2006 | 2005 | 2004 | |||||||
United States | $ | 6,780 | $ | 7,069 | $ | 7,036 | |||
Europe | 14,262 | 14,979 | 13,959 | ||||||
Pacific Rim | 1,390 | 2,297 | 2,325 | ||||||
Other | 983 | 1,483 | 1,923 | ||||||
Total | $ | 23,415 | $ | 25,828 | $ | 25,243 | |||
No customer accounted for more than 10% of consolidated net sales for any period presented. However, sales to a large pharmaceutical company totaled $8 and $2,188 and $1,658 during the years ended December 31, 2006, 2005 and 2004, respectively, and represented 0%, 9% and 7% of consolidated net sales. Sales to this customer were governed by a non-binding master services agreement dated August 22, 2002.
Item 13. Certain RelationshipsTRANSGENOMIC, INC. AND SUBSIDIARIES
NOTES TO CONSOLIDATED FINANCIAL STATEMENTS - Continued
Years Ended December 31, 2006, 2005 and Related Transactions2004
(Dollars in thousands except per share data)
None.
Substantially all long-lived assets are within the United States.
Item 14. Principal Accountant Fees and ServicesM. RESTRUCTURING PLANS
The following fees were billed by Deloitte & Touche LLP to us for professional services provided during 2004 and 2003:
Audit Fees. Deloitte & Touche LLP billed us a total of $250,000 and $227,000Company implemented restructuring plans in 2004 and 2003, respectively, for professional services rendered for2002 designed to better align the auditCompany’s cost structure with anticipated revenues. In conjunction with these plans, the Company restructuring charges in 2004 of our annual financial$1,267 related primarily to employee severance agreements, office closures, property and equipment and intellectual property. There were no accrued expenses associated with these restructuring plans at December 31, 2006 and 2005 and $516 at December 31, 2004.
N. QUARTERLY RESULTS (UNAUDITED)
Unaudited quarterly consolidated statements for those fiscal years and to review our interim financial statements included in Quarterly Reports on Form 10-Q filed by us with the SEC during those years.of operations data was as follows:
| Year Ended December 31, 2006 | ||||||||||||||||||||
| 1st Quarter | 2nd Quarter | 3rd Quarter | 4th Quarter | Total | ||||||||||||||||
Net Sales | $ | 6,497 | $ | 6,189 | $ | 4,919 | $ | 5,810 | $ | 23,415 | ||||||||||
Gross Profit | $ | 2,982 | $ | 3,049 | $ | 2,312 | $ | 3,026 | $ | 11,369 | ||||||||||
Loss from continuing operations | $ | (304 | ) | $ | (258 | ) | $ | (1,525 | ) | $ | (876 | ) | $ | (2,963 | ) | |||||
Loss from discontinued operations | (14 | ) | (125 | ) | (164 | ) | (165 | ) | (468 | ) | ||||||||||
Net loss | $ | (318 | ) | $ | (383 | ) | $ | (1,689 | ) | $ | (1,041 | ) | $ | (3,431 | ) | |||||
Basic and diluted earnings (loss) per share: | ||||||||||||||||||||
From continuing operations | $ | (0.01 | ) | $ | (0.01 | ) | $ | (0.03 | ) | $ | (0.02 | ) | $ | (0.06 | ) | |||||
From discontinued operations | — | — | — | — | (0.01 | ) | ||||||||||||||
| $ | (0.01 | ) | $ | (0.01 | ) | $ | (0.03 | ) | $ | (0.02 | ) | $ | (0.07 | ) | ||||||
Basic and Diluted Weighted Average Shares Outstanding (in thousands) | 49,185 | 49,190 | 49,190 | 49,190 | 49,188 | |||||||||||||||
Audit-Related Fees. Deloitte & Touche LLP billed us a total
| Year Ended December 31, 2005 | ||||||||||||||||||||
| 1st Quarter | 2nd Quarter | 3rd Quarter | 4th Quarter | Total | ||||||||||||||||
Net Sales | $ | 6,927 | $ | 6,889 | $ | 6,663 | $ | 5,349 | $ | 25,828 | ||||||||||
Gross Profit | $ | 3,399 | $ | 3,486 | $ | 3,115 | $ | 2,331 | $ | 12,331 | ||||||||||
Loss from continuing operations | $ | (2,162 | ) | $ | (473 | ) | $ | (526 | ) | $ | (1,823 | ) | $ | (4,984 | ) | |||||
Income(loss) from discontinued operations | (730 | ) | (525 | ) | 637 | (9,391 | ) | (10,009 | ) | |||||||||||
Net income(loss) | $ | (2,892 | ) | $ | (998 | ) | $ | 111 | $ | (11,214 | ) | $ | (14,993 | ) | ||||||
Basic and diluted loss per share: | ||||||||||||||||||||
From continuing operations | $ | (0.07 | ) | $ | (0.01 | ) | $ | (0.02 | ) | $ | (0.04 | ) | $ | (0.14 | ) | |||||
From discontinued operations | (0.03 | ) | (0.02 | ) | 0.02 | (0.21 | ) | (0.28 | ) | |||||||||||
| $ | (0.10 | ) | $ | (0.03 | ) | $ | — | $ | (0.25 | ) | $ | (0.42 | ) | |||||||
Basic and Diluted Weighted Average Shares Outstanding (in thousands) | 29,984 | 34,237 | 34,243 | 44,366 | 35,688 | |||||||||||||||
Earnings per share are computed independently for each of $42,000 and $46,000 in 2004 and 2003, respectively, for audit-related services. Audit-related services generally include fees for the auditsquarters presented. Therefore, the sum of our employee benefit plans and fees incurred in connection with services associated with SEC registration statements, periodic reports and other documents filed with the SEC or other documents issued in connection with securities offerings and research consultation on proposed transactions.quarterly per share losses may not equal the annual loss per share.
Changes in and Disagreements with Accountants on Accounting and Financial Disclosure. |
Tax Fees. Deloitte & Touche LLP billed us a total of $44,000 and $33,000 in 2004 and 2003, respectively, for tax services. Tax services consisted primarily of planning, advice and compliance, or return preparation, for U.S. federal, state and local, as well as international jurisdictions.None.
(a) Evaluation of Disclosure Controls and Procedures. A review and evaluation was performed by the Company’s management, including the Company’s Chief Executive Officer (“CEO”) and Chief Financial Officer (“CFO”), of the effectiveness of the design and operation of the Company’s disclosure controls and procedures as of the end of the period covered by this annual report. Based on that review and evaluation, the CEO and CFO concluded that the Company’s current disclosure controls and procedures, as designed and implemented, were effective in providing reasonable assurance that information required to be disclosed is recorded, processed, summarized and reported in the reports the Company submits under the Securities Exchange Act of 1934. (b) Change in Internal Control Over Financial Reporting. There have been no changes in the Company’s internal control over financial reporting during the last fiscal year that have materially affected, or are reasonably likely to materially affect, the Company’s internal control over financial reporting. Other Information None. Directors, Executive Officers and Corporate Governance. Information relating to our Board of Directors, including information regarding Craig Tuttle, our President and Chief Executive Officer who is also a director, required by this item is incorporated by reference to the Proxy Statement for the Company’s 2007 Annual Meeting of Stockholders (the “Proxy Statement”) under the caption “Board of Directors and Committees.” Information regarding our other executive officer who is not a director is set forth below. Debra A Schneider. Ms. Schneider, age 48, joined the Company in December, 2006 and currently serves as Vice President and Chief Financial Officer. She also is the Secretary and Treasurer for the Company. Prior to joining the Company, Ms. Schneider spent seventeen years at First Data Corporation in a number of roles, including finance, planning, accounting and Chief Financial Office roles for various business units. Most recently, she served as Senior Vice President of Finance. Prior to her tenure at First Data Corporation, she worked as Controller at Creative Financing, Inc. and as an accountant with KPMG. Executive Compensation. Information required by this Item is incorporated by reference to the Proxy Statement under the caption “Executive Compensation.”All Other Fees.
Security Ownership of Certain Beneficial Owners and Management and Related Stockholder Matters. |
Information required by this Item is incorporated by reference to the Proxy Statement under the caption “Voting Securities and Beneficial Ownership by Principal Stockholder and our Directors and Officers.”
Certain Relationships and Related Transactions, Director Independence |
Information required by this Item is incorporated by reference to the Proxy Statement under the captions “Certain Relationships and Related Transactions” and “Board of Directors and Committees”.
Principal Accounting Fees and Services |
Information required by this Item is incorporated by reference to the Proxy Statement under the caption “Accounting Fees and Services.”
Exhibits and Financial Statement Schedules. |
(a) | The following documents are filed as part of this report: |
1. | Financial Statements. The following financial statements of the Registrant are included in response to Item 8 of this report: |
Report of Independent Registered Public Accounting Firm.
Consolidated Balance Sheets of the Registrant and Subsidiaries as of December 31, 2006 and 2005.
Consolidated Statements of Operations of the Registrant and Subsidiaries for the years ended December 31, 2006, 2005 and 2004.
Consolidated Statements of Stockholders’ Equity of the Registrant and Subsidiaries for the years ended December 31, 2006, 2005 and 2004.
Consolidated Statements of Cash Flows of the Registrant and Subsidiaries for the years ended December 31, 2006, 2005 and 2004.
Notes to Consolidated Financial Statements of the Registrant and Subsidiaries.
2. | Financial Statement Schedules. |
None
3. | Exhibits. The following exhibits were filed as required by Item 15(a)(3) of this report. Exhibit numbers refer to the paragraph numbers under Item 601 of Regulation S-K: |
2 Asset Purchase Agreement, dated as of November 8, 2004, by and between Registrant and Eyetech Boulder Inc. (incorporated by reference to Exhibit 2.3 to Registrant’s Report on Form 10-K (Registration No. 000-30975) filed on April 15, 2005)
3.1 Third Amended and Restated Certificate of Incorporation of the Registrant (incorporated by reference to Exhibit 3.1 to Registrant’s Report on Form 10-Q (Registration No. 000-30975) filed on November 14, 2005.
3.2 Bylaws of the Registrant (incorporated by reference to Exhibit 3.2 to Registration Statement on Form S-1 (Registration No. 333-32174) filed on March 10, 2000)
4 Form of Certificate of the Registrant’s Common Stock (incorporated by reference to Exhibit 4 to Registration Statement on Form S-1 (Registration No. 333-32174) filed on March 10, 2000)
10.1 2006 Equity Incentive Plan of the Registrant (incorporated by reference to Exhibit 4(b) to Registration on Form S-8 (Registration No. 333-139999) filed on January 16, 2007.
10.2 1999 UK Approved Stock Option Sub Plan of the Registrant (incorporated by reference to Exhibit 10.7 to Registration Statement on Form S-1 (Registration No. 333-32174) filed on March 10, 2000)
10.3 Employee Stock Purchase Plan of the Registrant (incorporated by reference to Exhibit 4(b) to Registration Statement on Form S-8 (Registration No. 333-71866) filed on October 19, 2001)
10.4 Employment Agreement between the Company and Craig J. Tuttle, dated July 12, 2006 (incorporated by reference to Exhibit 10.1 to Registrant’s Report on Form 8-K (Registration No. 000-30975) filed on July 12, 2006.
10.5 Amendment No. 1 to the Employment Agreement between the Company and Craig J. Tuttle, effective July 12, 2006 (incorporated by reference to Exhibit 10.1 to Registrant’s Report on Form 10-Q (Registration No. 000-30975) filed on November 14, 2006.
10.6 Employment Agreement between the Company and Debra A. Schneider, effective December 14, 2006, (incorporated by reference to Exhibit 10.1 to Registrant’s Report on Form 8-K (Registration No. 000-30975) filed on November 15, 2006.
10.7 License Agreement, dated September 1, 1994, between Registrant and Professor Dr. Gunther Bonn, et. al. and Amendment thereto, dated March 14, 1997 (incorporated by reference to Exhibit 10.14 to Registration Statement on Form S-1 (Registration No. 333-32174) filed on March 10, 2000)
10.8 License Agreement, dated August 20, 1997, between the Registrant and Leland Stanford Junior University (incorporated by reference to Exhibit 10.15 to Registration Statement on Form S-1 (Registration No. 333-32174) filed on March 10, 2000)
10.9 License Agreement, dated December 1, 1989, between Cruachem Holdings Limited (a wholly owned subsidiary of the Registrant) and Millipore Corporation (incorporated by reference to Exhibit 10.13 to Registrant’s Annual Report on Form 10-K filed on March 25, 2002)
10.10 Sublicense Agreement, dated October 1, 1991, between Cruachem Holdings Limited (a wholly owned subsidiary of the Registrant) and Applied Biosystems, Inc. (incorporated by reference to Exhibit 10.14 to Registrant’s Annual Report on Form 10-K filed on March 25, 2002)
10.11 Missives, dated May 17, 2002, between Cruachem Limited (a wholly-owned subsidiary of the Registrant) and Robinson Nugent (Scotland) Limited (incorporated by reference to Exhibit 10.1 to Registrant’s Quarterly Report on Form 10-Q filed on August 14, 2002)
10.12 License Amendment Agreement, dated June 2, 2003, by and between Geron Corporation and the Registrant. (incorporated by reference to Exhibit 10.2 to Registrant’s Quarterly Report on Form 10-Q filed on August 12, 2003)
10.13 Supply Agreement, dated January 1, 2000, between the Registrant and Hitachi Instruments (incorporated by reference to Exhibit 10.16 to Registration Statement on Form S-1 (Registration No. 333-32174) filed on March 10, 2000)
10.14 Security Agreement by and between the Registrant and Laurus Master Fund, Ltd., dated December 3, 2003 (incorporated by reference to Exhibit 10.1 to the Registration Statement on Form S-3 of the Registrant (Registration No. 333-111442) filed on December 22, 2003)
10.15 Amendment to Security Agreement and Related Documents by and between the Registrant and Laurus Master Fund, Ltd., dated August 31, 2002 (incorporated by reference to Exhibit 10.2 to the Registration Statement on Form S-3 (Registration No. 333-118970) as filed on September 14, 2004)
10.16 Secured Revolving Note by and between the Registrant and Laurus Master Fund, Ltd., dated December 3, 2003 (incorporated by reference to Exhibit 10.2 to the Registration Statement on Form S-3 of the Registrant (Registration No. 333-111442) filed on December 22, 2003)
10.17 Secured Convertible Minimum Borrowing Note by and between the Registrant and Laurus Master Fund, Ltd., dated December 3, 2003 (incorporated by reference to Exhibit 10.3 to the Registration Statement on Form S-3 of the Registrant (Registration No. 333-111442) filed on December 22, 2003)
10.18 Secured Convertible Minimum Borrowing Note Series B by and between the Registrant and Laurus Master Fund, Ltd., dated December 3, 2003, as amended on April 15, 2004 (incorporated by reference to the Registration Statement of the Registrant (Registration No. 333-114661) filed on April 21, 2004)
10.19 Common Stock Purchase Warrant by and between the Registrant and Laurus Master Fund, Ltd., dated December 3, 2003 (incorporated by reference to Exhibit 10.4 to the Registration Statement on Form S-3 of the Registrant (Registration No. 333-111442) filed on December 22, 2003)
10.20 Registration Rights Agreement by and between the Registrant and Laurus Master Fund, Ltd., dated December 3, 2003 (incorporated by reference to Exhibit 10.5 to the Registration Statement on Form S-3 of the Registrant (Registration No. 333-111442) filed on December 22, 2003)
10.21 Common Stock Purchase Warrant by and between the Registrant and TN Capital Equities, Ltd., dated December 3, 2003 (incorporated by reference to Exhibit 10.6 to the Registration Statement on Form S-3 of the Registrant (Registration No. 333-111442) filed on December 22, 2003)
10.22 Securities Purchase Agreement by and between the Registrant and Laurus Master Fund, Ltd., dated February 19, 2004, as amended on April 15, 2004 (incorporated by reference to Exhibit 10.1 to the Registration Statement on Form S-3 of the Registrant (Registration No. 333-114661) filed on April 21, 2004)
10.23 Amendment to Securities Purchase Agreement and Related Document by and between the Registrant and Laurus Master Fund, Ltd., dated August 31, 2004 (incorporated by reference to Exhibit 10.1 to the Registration Statement on Form S-3 (Registration No. 333-118970) as filed on September 14, 2004)
10.24 Secured Convertible Term Note by and between the Registrant and Laurus Master Fund, Ltd., dated February 19, 2004, as amended on April 15, 2004 (incorporated by reference to Exhibit 10.2 to the Registration Statement on Form S-3 of the Registrant (Registration No. 333-114661) filed on April 21, 2004)
10.25 Common Stock Purchase Warrant by and between the Registrant and Laurus Master Fund, Ltd., dated February 19, 2004, as amended on April 15, 2004 (incorporated by reference to Exhibit 10.3 to the Registration Statement on Form S-3 of the Registrant (Registration No. 333-114661) filed on April 21, 2004)
10.26 Registration Rights Agreement by and between the Registrant and Laurus Master Fund, Ltd., dated February 19, 2004 (incorporated by reference to Exhibit 10.4 to the Registration Statement on Form S-3 of the Registrant (Registration No. 333-114661) filed on April 21, 2004)
10.27 Common Stock Purchase Warrants by and between the Registrant and TN Capital Equities, Ltd., dated March 1, 2004 (incorporated by reference to Exhibit 10.2 to the Registration Statement on Form S-3 of the Registrant (Registration No. 333-114661) filed on April 21, 2004)
10.28 Common Stock Purchase Warrant by and between the Registrant and Laurus Master Fund, Ltd., dated August 31, 2004 (incorporated by reference to Exhibit 10.3 to the Registration Statement on Form S-3 (Registration No. 333-118970) as filed on September 14, 2004)
10.29 Form of Securities Purchase Agreement by and between the Registrant and various counterparties dated September 22, 2005 (incorporated by reference to Exhibit 10.1 to the Registrants Quarterly Report on Form 10-Q filed on November 14, 2005)
10.30 Common Stock Purchase Warrant by and between the Registrant and Oppenheimer & Co., Inc. dated October 27, 2005
10.31 Letter Agreement by and between the Registrant and Laurus Master Fund, Ltd. dated September 22, 2005
10.32 Letter Agreement by and between the Registrant and Laurus Master Fund, Ltd. dated October 31, 2005
21 Subsidiaries of the Registrant
23 Consent of Independent Registered Public Accounting Firm
24 Powers of Attorney
31 Certifications pursuant to Section 302 of the Sarbanes-Oxley Act of 2002
32 Certifications pursuant to Section 906 of the Sarbanes-Oxley Act of 2002
Pursuant to the requirements of Section 13 or 15(d) of the Securities Exchange Act of 1934, the registrant has duly caused this report to be signed on its behalf by the undersigned.undersigned, thereunto duly authorized on this 2nd day of April 2007.
TRANSGENOMIC, INC. | ||
By: | /s/ | |
| ||
Pursuant to the requirements of Section 13 or 15(d) of the Securities Exchange Act of 1934, this report has been signed below by the following persons on behalf of the registrant and in the capacities indicated on this 2nd day of May 2005.April 2007.
Signature | Title | |||
| ||||
/s/
| Director President and Chief Executive Officer | |||
/s/DEBRA A. SCHNEIDER Debra A. Schneider | Chief Financial Officer (Principal Financial Officer and Principal Accounting Officer) | |||
/s/GREGORY J. DUMAN* Gregory J. Duman | Director | |||
/s/
| Director | |||
/s/
| Director | |||
/s/
| ||||
Gregory T. Sloma | Director | |||
| *By | ||||
/s/
Attorney-in-fact for the individuals as indicated. | ||||
62