SECURITIES AND EXCHANGE COMMISSION
________________
x[x] | ANNUAL REPORT PURSUANT TO SECTION 13 OR 15(d) OF THE SECURITIES EXCHANGE ACT OF 1934 |
For the fiscal year ended January 29, 2006
OR
¨ | For the fiscal year ended January 25, 2009 |
OR
| [_] | TRANSITION REPORT PURSUANT TO SECTION 13 OR 15(d) OF THE SECURITIES EXCHANGE ACT OF 1934 |
Commission file number: 0-23985
(Exact name of registrant as specified in its charter)
| Delaware | | 94-3177549 |
Delaware | | 94-3177549 |
(State or Other Jurisdictionother jurisdiction of | (I.R.S. Employer |
| Incorporation or Organization) | | (I.R.S. Employer
Identification No.) |
2701 San Tomas Expressway
Santa Clara, California 95050
(Address, including zip code, and telephone number, including area code, of principal executive offices)
Securities registered pursuant to Section 12(b) of the Act:
| | |
Title of Each Classeach class | | Name of Each Exchangeeach exchange on Which Registeredwhich registered |
Common Stock, $.001$0.001 par value per share | | The NASDAQ StockGlobal Select Market LLC
(NASDAQ Global Market) |
Securities registered pursuant to Section 12(g) of the Act:
Indicate by check mark if the registrant is a well-known seasoned issuer, as defined in Rule 405 of the Securities Act.
Yes xNo o
Indicate by check mark if the registrant is not required to file reports pursuant to Section 13 or Section 15(d) of the Act.
Indicate by check mark whether the registrant (1) has filed all reports required to be filed by Section 13 or 15(d) of the Securities Exchange Act of 1934 during the preceding 12 months (or for such shorter period that the registrant was required to file such reports), and (2) has been subject to such filing requirements for the past 90 days.
Indicate by check mark if disclosure of delinquent filers pursuant to Item 405 of Regulation S-K (§ 229.405 of this chapter) is not contained herein, and will not be contained, to the best of registrant’s knowledge, in definitive proxy or information statements incorporated by reference in Part III of this Form 10-K or any amendment to this Form 10-K.
xIndicate by check mark whether the registrant is a large accelerated filer, an accelerated filer,
a non-accelerated filer, or a
non-accelerated filer.smaller reporting company. See
definitiondefinitions of
“accelerated filer and large“large accelerated filer”
, “accelerated filer” and “smaller reporting company” in Rule 12b-2 of the Exchange Act. (Check one):
xLarge accelerated filer x¨ Accelerated filer o
¨Non-accelerated filero (Do not check if a smaller reporting company) Smaller reporting company o
Indicate by check mark whether the registrant is a shell company (as defined in Rule 12b-2 of the Act).
The aggregate market value of the voting stock held by non-affiliates of the registrant as of July
29, 200527, 2008 was approximately
$4,226,770,945$6.1 billion (based on the closing sales price of the registrant’s common stock
as reported by the NASDAQ Global Select Market, on July
29, 2005)25, 2008).
Shares of common stockThis calculation excludes approximately 26,237,509 shares held by
each currentdirectors and executive
officer and director andofficers of the registrant. This calculation does not exclude shares held by
each person who is known bysuch organizations whose ownership exceeds 5% of the
registrant to own 5% or more of theregistrant’s outstanding common stock
that have
been excluded from this computation inrepresented to the registrant that
such persons may be deemed to be affiliatesthey are registered investment advisers or investment companies registered under section 8 of the
registrant. Share ownership informationInvestment Company Act of
certain persons known by the registrant to own greater than 5% of the outstanding common stock for purposes of the preceding calculation is based solely on information on Schedule 13G filed with the Commission and is as of July 29, 2005. This determination of affiliate status is not a conclusive determination for other purposes.1940.
The number of shares of common stock outstanding as of March
3, 20066, 2009 was
174,485,396.542,453,547.
DOCUMENTS INCORPORATED BY REFERENCE
The Registrant has incorporated by reference portions
Portions of
itsthe registrant’s Proxy Statement for its
20062009 Annual Meeting of Stockholders
which wasto be filed with the Securities and Exchange Commission
on May 12, 2006.
EXPLANATORY NOTE
Weby April 6, 2009 are amending our Annual Report on Form 10-K for the year ended January 29, 2006 as filed on March 16, 2006, or the Original Filing, to restate our consolidated financial statements for the years ended January 29, 2006, January 30, 2005, and January 25, 2004 and the related disclosures. This amended Annual Report on Form 10-K/A, or Form 10-K/A, also includes the restatement of selected consolidated financial data as of and for the years ended January 29, 2006, January 30, 2005, January 25, 2004, January 26, 2003, and January 27, 2002, and the unaudited quarterly financial data for each of the quarters in the years ended January 29, 2006 and January 30, 2005.
The restatement of the Original Filing reflected in this Form 10-K/A includes adjustments arising from the determinations of the Audit Committee of the Board of Directors, or Audit Committee, with the assistance of outside legal counsel, after conducting a review of the Company’s stock option practices covering the time from the Company’s initial public offering in 1999 (fiscal year 2000) through June 2006.
For more information on these matters, including a detailed discussion of the effect of the restatement, please refer to Note 2, “Restatement of Consolidated Financial Statements, Audit Committee and Company Findings” of the Notes to Consolidated Financial Statements.
As a result of the findings of the Audit Committee, we concluded that we need to amend our Original Filing to restate our consolidated financial statements for the years ended January 29, 2006, January 30, 2005, and January 25, 2004 and the related disclosures. This Form 10-K/A also includes the restatement of selected consolidated financial data as of and for the years ended January 29, 2006, January 30, 2005, January 25, 2004, January 26, 2003, and January 27, 2002, and the unaudited quarterly financial data for each of the quarters in the years ended January 29, 2006 and January 30, 2005. We also concluded that we need to amend our Quarterly Report on Form 10-Q for the quarter ended April 30, 2006, originally filed on May 31, 2006, to restate our condensed consolidated financial statements for the quarters ended April 30, 2006 and May 1, 2005 and the related disclosures. We will also restate the July 31, 2005 financial statements to be included in our Quarterly Report on Form 10-Q for the quarter ended July 30, 2006. We will also restate the October 30, 2005 financial statements with the filing of our October 29, 2006 Form 10-Q; however, Exhibit 99.1 to this Form 10-K/A includes information concerning our unaudited consolidated financial data as of and for the three and nine month periods ended October 30, 2005. We have not amended and we do not intend to amend any of our other previously filed annual reports on Form 10-K or quarterly reports on Form 10-Q for the periods affectedincorporated by the restatement or adjustments other than the amended Quarterly Report on Form 10-Q/A for the quarter ended April 30, 2006 and this Form 10-K/A for the year ended January 30, 2006.
All of the information in this Form 10-K/A is as of January 30, 2006 and does not reflect events occurring after the date of the Original Filing, other than the restatement, or to modify or to update disclosures (including the exhibits to the Original Filing, except for the updated Exhibits 31.1, 31.2, 32.1, and 32.2 described below) affected by subsequent events related to the restatement. For the convenience of the reader, this Form 10-K/A sets forth the Original Filing in its entirety, as amended by and to reflect the restatement. The following sections of this Form 10-K/A were adjusted to reflect the findings of the Audit Committee:
Part I — Item 1 — Business as to “Forward-Looking Statements” and “Available Information”;
Part I — Item 1A — Risk Factors;
Part I — Item 3 — Legal Proceedings;
Part II — Item 5 — Market for Registrant’s Common Equity, Related Stockholder Matters and Issuer Purchases of Equity
Securities;
Part II — Item 6 — Selected Consolidated Financial Data;
Part II — Item 7 — Management’s Discussion and Analysis of Financial Condition and Results of Operations;
Part II — Item 8 — Financial Statements and Supplementary Data;
Part II — Item 9A — Controls and Procedures; and
Part IV — Item 15 — Exhibits and Financial Statement Schedules.
This Form 10-K/A should be read in conjunction with our periodic filings made with the Securities and Exchange Commission, or the SEC, subsequent to the date of the Original Filing, including any amendments to those filings, such as the amended Quarterly Report on Form 10-Q/A for the quarter ended April 30, 2006, as well as any Current Reports filed on Form 8-K subsequent to the date of the Original Filing. In addition, in accordance with applicable rules and regulations promulgated by the SEC, this Form 10-K/A includes updated certifications from our Chief Executive Officer and Chief Financial Officer as Exhibits 31.1, 31.2, 32.1 and 32.2.
The SEC may disagree with the manner in which we have accounted for and reported, or not reported, the financial impact of past option grant measurement date errors, and there is a risk that its inquiry could lead to circumstances in which we may have to further restate our prior financial statements, amend prior filings with the SEC, or otherwise take other actions not currently contemplated. In addition, the SEC may issue guidance on disclosure requirements related to the financial impact of past option grant measurement date errors that may require us to amend this filing or prior filings with the SEC to provide additional disclosures pursuant to this guidance. Any such circumstance could also lead to future delays in filing our subsequent SEC reports and delisting of our common stock from the NASDAQ Global Select Market.
reference.
| | | | |
| | | Page |
| | Page
|
| | PART I | | |
| | |
| | | | 14 |
| | |
| | | | 1215 |
| | |
| | | | 2830 |
| | |
| | | | 2830 |
| | |
| | | | 2931 |
| | |
| | | 35 |
| | 30 |
| | |
| | | | |
| | |
| | | | 3136 |
| | |
| | | | 3339 |
| | |
| | | | 3540 |
| | |
| | | | 5661 |
| | |
| | | | 5762 |
| | |
| | | | 5762 |
| | |
| | | | 5762 |
| | |
| | | 62 |
| | 62 |
| | |
| | | |
| | 63 |
| | |
Item 10. | | | | 62 |
| | |
| Item 11. | | | | 63 |
| | |
| | | | 63 |
| | |
| | | | 6364 |
| | |
| | | 64 |
| | 63 |
| | |
| | | | |
| | |
| | | 65 |
| | 64 |
| | |
Signatures | | | | 109112 |
Forward-Looking Statements
When usedThis Annual Report on Form 10-K contains forward-looking statements within the meaning of Section 27A of the Securities Act of 1933, as amended, and Section 21E of the Securities Exchange Act of 1934, as amended, which are subject to the “safe harbor” created by those sections. Forward-looking statements are based on our management’s beliefs and assumptions and on information currently available to our management. In some cases, you can identify forward-looking statements by terms such as “may,” “will,” “should,” “could,” “goal,” “would,” “expect,” “plan,” “anticipate,” “believe,” “estimate,” “project,” “predict,” “potential” and similar expressions intended to identify forward-looking statements. These statements involve known and unknown risks, uncertainties and other factors, which may cause our actual results, performance, time frames or achievements to be materially different from any future results, performance, time frames or achievements expressed or implied by the forward-looking statements. We discuss many of these risks, uncertainties and other factors in this Annual Report on Form 10-K/A,10-K in greater detail under the words “believes,heading “Risk Factors.” “plans,” “estimates,” “anticipates,” “expects,” “intends,” “allows,” “can,” “will”Given these risks, uncertainties and similar expressions are intended to identifyother factors, you should not place undue reliance on these forward-looking statements. These areAlso, these forward-looking statements that relate to future periodsrepresent our estimates and include statements including, but not limited to, statementsassumptions only as to our corporate strategy, our anticipated growth and areas of growth, our fastest growing businesses, factors contributing to growth, international expansion, the features, benefits, capabilities, performance, production and availability of our technology and products, focus on development of cost effective architectures, development of new products, demand for graphics processors in new product areas, product life cycles, average selling prices, the importance of design wins, employees, ability to attract and retain qualified personnel, market share, research and development, backlog, seasonality, gross margin, revenue, sources of revenue and revenue mix, expenditures and expenditure mix, including capital expenditures, areas of increased expenditures, cash flow and cash balances, liquidity, uses of cash, investments of our cash and marketable securities, tax rates, charges we may take, quarterly and annual results of operations, the filings we intend to amend, the periods we are restating, foreign currency risk strategy, critical accounting policies, the impact of recent accounting pronouncements, inventories, our relationship with and the development of a graphics processing unit, or GPU, for Sony Computer Entertainment and the royalties to that GPU, HD and Blu-ray video, use of our products by Apple Computer, Inc., Windows Vista, the importance and benefits of strategic relationships, customer demand, our reliance on a limited number of customers, platform innovations and solutions, stock option grants and our employee stock purchase plan, expensing of stock based compensation, our stock repurchase program, our continued listing on the NASDAQ Global Select Market, our competitors, expectations regarding competition, our competitive position, factors affecting competition, payment of dividends, sufficiency of our facilities, our intellectual property and intellectual property strategy, litigation and settlement of litigation, litigation or regulatory action arising from the Audit Committee’s review or our restatements, Section 409A of the IRC and possible remedial measures, internal control over financial reporting, our disclosure controls and procedures and compliance with environmental laws and regulations. Forward-looking statements are subject to risks and uncertainties that could cause actual results to differ materially from those projected. These risks and uncertainties include, but are not limited to, delays in the development or releasedate of new products, delays in volume production of our products, loss of market share for our GPU Business, changes in customer demands, slower than anticipated adoption of new technology, slower than anticipated growth of new markets, delays in the release of Windows Vista, changes to Windows Vista before its commercial release, our inability to compete in new markets, the write-down or write-off of inventory, reduction in demand for or market acceptance of our products or technologies, manufacturing defects, software bugs, competitive pricing pressure, release of new products by our competitors, disruptions in our strategic relationships such as with our key suppliers, insufficient manufacturing availability, reliance on third parties to manufacture and test our products, fluctuations in general economic conditions, international and political conditions, the loss of an important customer, our ability to safeguard our intellectual property, developments in and expenses related to litigation, the outcome of litigation or regulatory actions, developments in litigation settlements, determination by the NASDAQ Listing Qualifications Panel to delist our stock, and the matters set forth inthis filing. You should read this Annual Report on Form 10-K/A. These10-K completely and with the understanding that our actual future results may be materially different from what we expect. We hereby qualify our forward-looking statements speak only as of the date hereof.by these cautionary statements. Except as required by law, we expressly disclaim anyassume no obligation or undertaking to release publicly any updates or revisions to anyupdate these forward-looking statements contained hereinpublicly, or to reflect any changeupdate the reasons actual results could differ materially from those anticipated in our expectations with regard thereto or any changethese forward-looking statements, even if new information becomes available in events, conditions or circumstances on which any such statement is based.
In the sections of this Report entitled “Item 1. Business”, “Item 1A. Risk Factors”, “Item 5. Market for Registrant’s Common Equity, Related Stockholder Matters and Issuer Purchases of Equity Securities”, “Item 6. Selected Financial Data”, and “Item 7. Management’s Discussion and Analysis of Financial Condition and Results of Operations” allfuture.
All references to “NVIDIA,” “we,” “us,” “our” or the “Company” mean NVIDIA Corporation and its subsidiaries, except where it is made clear that the term means only the parent company. NVIDIA, GeForce, SLI, Hybrid SLI, GoForce, Quadro, NVIDIA Quadro, NVIDIA nForce, TurboCache, PureVideoTesla, Tegra, CUDA, NVIDIA APX, PhysX, Ageia, Mental Images, and the NVIDIA logo are our trademarks and/or registered trademarks in the United States and other countries that are used in this document. We may also refer to trademarks of other corporations and organizations in this document.Overview
Our Company
NVIDIA Corporation is the worldwide leader in programmablevisual computing technologies and the inventor of the graphic processing unit, or the GPU, a high-performance processor which generates realistic, interactive graphics processor technologies.on workstations, personal computers, game consoles, and mobile devices. Our products enhance the end-user experienceare designed to generate realistic, interactive graphics on consumer and professional computing devices. We serve the entertainment and consumer market with our GeForce graphics products, the professional design and visualization market with our Quadro graphics products, the high-performance computing market with our Tesla computing solutions products, and the handheld computing market with our Tegra computer-on-a-chip products. We have four major product-line operating segments: graphics processing units,the GPU business, the professional solutions business, or GPUs,PSB, the media and communications processors,processor, or MCPs, Handheld GPUs,MCP, business, and Consumer Electronics. the consumer products business, or CPB.
Our GPU Businessbusiness is composedcomprised primarily of our GeForce products that support desktop and notebook personal computers, or PCs, notebook PCsplus memory products. Our PSB is comprised of our Quadro professional workstation products and other professional workstations;graphics products, including our NVIDIA Tesla high-performance computing products. Our MCP Businessbusiness is composedcomprised of NVIDIA nForce products that operate as a single-chipcore logic and motherboard GPU, or chipset that can off-load system functions, such as audio processingmGPU products. Our CPB is comprised of our Tegra and network communications,GoForce mobile brands and perform these operations independently from the host central processing unit, or CPU; our Handheld GPU Business is composed of products that support netbooks, personal navigation devices, or PNDs, handheld personal media players, or PMPs, personal digital assistants, or PDAs, cellular phones and other handheld devices;devices. CPB also includes license, royalty, other revenue and our Consumer Electronics Business is concentrated in products that supportassociated costs related to video game consoles and other digital consumer electronics devicesdevices. Original equipment manufacturers, or OEMs, original design manufacturers, or ODMs, add-in-card manufacturers, system builders and is composedconsumer electronics companies worldwide utilize our processors as a core component of our contractual arrangements with Sony Computer Entertainment, or SCE, to jointly develop a custom GPU incorporating our next-generation GeForce GPUtheir entertainment, business and SCE’s system solutions in SCE’s PlayStation3, sales of our Xbox-related products, revenue from our license agreement with Microsoft Corporation, or Microsoft, relating to the successor product to their initial Xbox gaming console, the Xbox360, and related devices, and digital media processor products. professional solutions.
We were incorporated in California in April 1993 and reincorporated in Delaware in April 1998. Our headquarter facilities are in Santa Clara, California. Our Internet address iswww.nvidia.com.
The contents of our website are not a part of this Form 10-K.Original equipment manufacturers,
GPU Business
Our GPU business is comprised primarily of our GeForce products that support desktop and notebook PCs, plus memory products. Our GPU business is focused on Microsoft Windows and Apple PC platforms. GeForce GPUs power PCs made by or distributed by most PC OEMs original design manufacturers, or ODMs, add-in-card manufacturers, system buildersin the world for desktop PCs, notebook PCs, PCs loaded with Windows Media Center and consumer electronics companies worldwide utilize NVIDIA digital media processors as a core component of their entertainment and business solutions. Our award-winning GPUs deliver superior performance and crisp visual quality for PC-based applicationsextenders such as manufacturing, science, e-business, entertainmentthe Apple TV. GPUs enhance the user experience for playing video games, editing photos, viewing and education. Our critically-acclaimed MCPs perform highly demanding multimedia processing for secure broadband connectivity, communicationsediting videos and breakthrough audio functions. Our handheldhigh-definition, or HD, movies. GPUs deliver an advancedalso enable the rich visual experience by accelerating graphicsuser interfaces of the Windows Vista and video applications while implementing design techniques that result in high performance and low power consumption.Our Business
GPU Business
Apple OS X operating systems. The combination of the programmable Unified Shader GPU with Microsoft Corporation’s, or Microsoft’s, DirectX 9.010 high-level shading language is known as DirectX 9.010 GPUs. The flexibilityCombined with the ability to directly access the GPU via the new Windows Vista applications from Microsoft Office to Web 2.0, applications can now incorporate improved quality through 3D effects.
We believe we are in an era where visual computing is becoming increasingly important to consumers and power of DirectX 9 GPUs can enhance high-definition, or HD, digital video, image processing and editing for digital photographs, as well as bring a “cinematic look” to computer graphics. Technology and market leadership in this generation of GPUs continues to be a key elementother end users of our corporate strategy. The successful production launch ofproducts. Our strategy is to promote our GeForce 6800 and 6600 GPU series in fiscal 2005 led to our increase in market share from 21% to 67%brand as one of the Performance DirectX 9.0-compatible graphics controller segment, according to the Mercury Research Fourth Quarter 2003most important processors through technology leadership, increasing programmability, and 2004 PC Graphics Reports, respectively.great content experience. In fiscal 2006,year 2009, our strategy was to extend our architectural and technology advantage by leading the industry with our GeForce GPUs.
The GeForce GTX 280 and 260 GPU products that we launched during fiscal year 2009 represent the second-generation GPU to support DirectX 9 Shader Model 3.0 -of our unified architecture. Based on a comparison between the GeForce 7800GTX 280 and the GeForce 8800 Ultra in a variety of benchmarks and resolutions, the GeForce GTX 280 and 260 GPUs deliver 50 percent more gaming performance over the GeForce 8800 Ultra GPU. By successfully extendingOther significant product launches during fiscal year 2009 included the GeForce 9600 GT, which provides more than double the performance of our leadership positionGeForce 8600 GTS product; the GeForce 9800 GX2, which provides a new dual GPU board featuring Quad Scalable Link Interface, or SLI, technology; and the GeForce 9800 GTX, which is a flexible GPU that supports both two-way and three-way SLI technology.
We also launched the GeForce GTX 295 and GeForce GTX 285 which were designed based on Compute Unified Device Architecture, or CUDA, technology. The GeForce GTX 295 is among the world’s fastest dual GPU solutions featuring the power of two GeForce GTX 200 GPUs on a single card. The GeForce GTX 285 is among the world’s most powerful single GPU solution and works efficiently in complex DirectX 10 environments with extreme HD resolutions. We also shipped notebook products from the GeForce 100M Series, which includes the GeForce G105M and the GeForce G110M to meet the performance demands of today’s visual computing applications. The GeForce G105M is over 55 percent faster than our previous product in the performancemainstream segment, withwhile the production releaseGeForce G110M is 35 percent faster than our previous mainstream GPU.
In fiscal year 2009, we completed our acquisition of Ageia Technologies, Inc., or Ageia, an industry leader in gaming physics technology. Ageia's PhysX software is widely adopted in several PhysX-based games that are shipping or in development on Sony Playstation 3, Microsoft Xbox 360, Nintendo Wii, and gaming PCs. We believe that the combination of the GPU and physics engine brands result in an enhanced visual experience for the gaming world. Subsequent to our acquisition of Ageia, we launched the GeForce 78009800 GTX+, GeForce 9800 GT, and GeForce 9500 GT GPUs, which provide support for our PhysX physics engine and CUDA parallel processing across a wide range of price segments. Electronic Arts, THQ and 2K Games, a publishing label of Take-Two Interactive Software, have licensed PhysX technology as a development platform which will be available for use by each of the companies’ studios worldwide.
Our share of the standalone desktop GPU category decreased from 64% to 63% in June 2005, we grew our marketfiscal year 2009, according to the December 2007 and December 2008 PC Graphics Report from Mercury Research, respectively. Our share of the standalone notebook category decreased from 67%75% to 79%63%, according to the December 2007 and December 2008 PC Graphics Report from Mercury Research, Fourth Quarter 2004respectively.
Professional Solutions Business
Our PSB is comprised of our Quadro professional workstation products and 2005 PC Graphics Reports, respectively. In January 2006, we launched and initiated sales of the GeForce 7300 GPU,other professional graphics products, including our first mainstream version of the GeForce 7 Series. The GeForce 6 and 7 Series desktop and notebook GPUsTesla high-performance computing products. Our Quadro brand products are designed to be compatible with Microsoft’s next generation operating system, Microsoft Windows Vista, or Vista, which is scheduled to be released indeliver the second half of calendar 2006. Vista is expected to mark a dramatic improvement in the way the Windows operating system takes advantage of the PC’s GPU to provide a positive user experience.The NVIDIA Quadro brand has become the benchmarkhighest possible level of performance and compatibility for the professional industry. The Quadro family consists of the Quadro Plex Visual Computing System, or VCS, Quadro FX, Quadro CX and the Quadro Night Vision Systems, or NVS, professional workstation processors. Quadro products are recognized by many as the standard for professional graphics solutions needed to solve many of the world’s most complex visual computing challenges in the manufacturing, entertainment, medical, science, and aerospace industries. NVIDIA Quadro products are fully certified by several software developers for professional workstation applications and are designed to deliver the graphics performance and precision required by professional applications.
We believe that recent years have experienced an increasing level of global adoption for the computer-aided design approach of product creation. We have achieved a leading position in the professional graphics category by providing innovative GPU technology, software, and tools that integrate the capabilities of our GPU with a broad array of visualization products.
During fiscal 2006,year 2009, we launched several new Quadro solutions. These included the growthQuadro FX 3600M Professional, which is among the highest performing notebook GPUs, and the Quadro Plex D Series, a dedicated desk side VCS system that, alternatively, can be configured using two Quadro Plex D systems for a 3U configuration that fits a standard 19” rack environment. At the SIGGRAPH 2008 conference, the Quadro Plex D2 system set a new milestone in computer graphics by demonstrating the world’s first real-time fully-interactive ray tracer. We also launched five new Quadro FX notebook GPUs that spanned from ultra-high performance to ultra mobility, as well as the Quadro CX, the industry’s first accelerator for Adobe’s Creative Suite 4, or Adobe CS4, content creation software. Adobe CS4 software has added optimization to take advantage of GPU technology. The Quadro CX is specifically designed to enhance the performance of the Adobe CS4 product line and to give creative professionals the ultimate performance and productivity.
During fiscal year 2009, we also we launched the Tesla C1060 computing processor and the Tesla S1070 computing system, which is among the first teraflop processors and has a 1U system demonstrating up to four teraflops of performance. Tesla is a new family of GPU computing products that delivers processing capabilities for high-performance computing applications, and marks our entry into the high-performance computing industry. The Tesla family also consists of the C870 GPU computing processor, the D870 Deskside Supercomputer and the S870 1U Computing Server. We believe we are in an era of GPU computing, where our CUDA parallel processing architecture can accelerate compute-intensive applications by significant multiples over that of a central processing unit, or CPU, alone. NVIDIA CUDA is a general purpose parallel computing architecture that leverages the parallel compute engine in our Quadro professional workstation products wasgraphics processing units to solve many complex computational problems in a reflectionfraction of the digital revolution sweeping nearly every industry,time required on a CPU. There are currently over 25,000 developers around the world using CUDA. In order to program using the CUDA architecture, developers can, today, use C, one of the most widely used high-level programming languages, which can then be run at great performance on a CUDA enabled processor. We expect other languages to be supported in the future, including FORTRAN and C++.
With CUDA, we are able to speed up general purpose compute-intensive applications like we do for 3D graphics processing. Developers are able to speed-up algorithms in areas ranging from industrial design,nano molecular dynamics to industrial styling, to film, to HD broadcast, toimage processing, medical imagingimage reconstruction and derivatives modeling for financial risk analysis. Over 100 universities around the world now teach parallel programming with CUDA and many more. InPC OEMs now offer high performance computing solutions with Tesla for use by customers around the future,world, including Motorola, Chevron, GE Health Care and even General Mills, the consumer products company. Researchers use CUDA to accelerate their time-to-discovery, and popular off-the-shelf software packages are now CUDA accelerated.
MCP Business
Our MCP business is comprised of nForce core logic and GeForce mGPU products. Our nForce and GeForce mGPU families of products address the core logic market. Core logic is the computer’s “central nervous system,” controlling and directing high speed data between the central processing unit, or CPU, the GPU, storage, and networks. High quality, long-term reliability, and top performance are key customer demands of core logic suppliers.
During fiscal year 2008, we expectannounced a new technology named Hybrid SLI. This technology combines the growthmulti-GPU technology with a powerful and energy-efficient engine. When GeForce add-in graphics cards are connected to GeForce mGPUs, Hybrid SLI kicks in, combining their processing power to deliver an improved experience. The technology is application aware so, depending on the processing demands of each application running on the host PC, the discrete GPU may be completely shut down in order to save power.
During fiscal year 2009, we shipped Hybrid SLI DX10 mGPUs – the GeForce 8000 GPU series. The GeForce 8000 GPU series includes GeForce Boost Hybrid SLI technology, which is designed to double performance when paired with a GeForce 8 series desktop GPU. We also extended the reach of SLI technology into the performance category with the launch of our professional workstation products to be influenced by the demand for HD content creation, HD video editing and HD broadcast.MCP Business
The NVIDIA nForce family of products represents our MCPs790i Ultra SLI MCP, a highly rated overclockable platform for Advanced Micro Devices, Inc., or AMD, and Intel Corporation, or Intel,-based desktop, notebook, professional workstations and servers. Our strategy for MCPs aligns with what processors.
During fiscal year 2009, we anticipate will drive growth such as multi-core, ever-increasing-speed networking and storage technologies, and integration of complex features such as virtualization, security processing, network processing and more. The In-Stat Trendy Chipset for the x86 Processor Report projects strong growth for PC chipsets through the end of this decade: from $7.6 billion in 2006 to over $10 billion in 2009. In September 2005, we introduced our first integrated graphics core logic solutions in more than two years,launched the GeForce 6100 Series GPU9M series of notebook GPUs that enables improved performance in notebooks with Hybrid SLI technology and NVIDIA nForce 400 Series MCP. We offer the industry’s first and only integrated core logic to feature DirectX 9.0 and Shader Model 3.0PhysX technology. We also offer PureVideo technology, a HD video processor designed to deliver a home theater-quality movie watching experience on PCslaunched SLI for Intel Broomfield CPU platforms. When paired with the nForce 200 SLI MCP, Intel’s Bloomfield CPU and media centers. NVIDIA is now the third largestTylersburg core logic supplierchipset will deliver NVIDIA three-way SLI technology with up to a 2.8 times performance boost over single graphics card platforms. In fiscal year 2009, we launched the GeForce 9400M mGPU along with Apple Inc., or Apple, for their new lineup of Mac notebooks. The GeForce 9400M integrates three complex chips – the northbridge, the input-output network processor, and the GeForce GPU into a single chip and, as a result, significantly improves performance over Intel integrated graphics. Apple’s MacBook and MacBook Air notebook computers come standard with the GeForce 9400M. Apple’s MacBook Pro notebook computer comes standard with the hybrid combination of two GeForce GPUs - a GeForce 9400M for maximum battery life and a GeForce 9600M GT for high performance mode. We also launched the GeForce 9400 and 9300 mGPUs for Intel desktop PCs. These new mGPUs set a new price/performance standard for integrated graphics by combining the power of three different chips into one highly compact and efficient GPU.
Additionally, in the world, accordingfourth quarter of fiscal year 2009, we announced the NVIDIA Ion Platform, which combines the GeForce 9400 GPU with the Intel Atom CPU. The combination enables netbooks, small form factor and all-in-one PCs to play rich media and popular games in high definition.
Our MCP strategy is to bring the benefits of GeForce GPUs to the Mercury Research Fourth Quarter 2005most price sensitive categories while creating exciting platform architectures like SLI, Hybrid SLI, and Enthusiast System Architecture, or ESA. ESA is a standard for system information protocol that links a PC Graphics Report. Wesystem’s various critical components – such as fan, power supply, smart chassis, GPUs, and motherboards. It enables a unified architecture for applications and users to control and optimize the performance of their system. SLI, Hybrid SLI, and ESA are examples of how we create architectures that advance the largest supplier of AMD 64 chipsets with 38% segment share. NVIDIA nForce MCP unit shipments for AMD64-based CPUs increased over 510% year-over year, based on the Mercury Research Fourth Quarter 2005 PC Processor Forecast Report.Handheld GPU Business
Our strategy in our Handheld GPU Business is to lead innovation and capitalize on the emergencecapabilities of the cellular phone as a versatile consumer lifestyle device. The hallmarkPC.
Consumer Products Business
Our CPB is comprised of every device in the NVIDIAour Tegra and GoForce product family is to provide a high-performance, visually rich multimedia experience onmobile brands and products that support netbooks, PMPs, PDAs, cellular phones and other handheld devices. TheseThis business also includes license, royalty, other revenue and associated costs related to video game consoles and other digital consumer electronics devices.
We believe that mobile devices like phones, music players, and portable navigation devices will increasingly become multi-function, multi-tasking, PCs. As such, we anticipate the architecture of these devices will increasingly become more consumer PC-like and be capable of delivering all the entertainment and web experiences that end users currently enjoy on a PC, but in a form-factor that fits nicely in their hands. Our mobile strategy is to create a computer-on-a-chip that enables this experience. NVIDIA Tegra and GoForce mobile products deliver an advanced visual experience by accelerating graphics and video applications, and supporting the most demanded features and capabilities. GoForce handheld GPUs implement innovative design techniques, both inside the chips and at the system level, which result in high performance and long battery life. These technologies enhance visual display capabilities, improve connectivity, and minimize chip and system-level power consumption. NVIDIA Tegra and GoForce products can be found primarily in advanced multimedia cellular phones PDAs, and other handheld devices. Consumer Electronics BusinessOur Consumer Electronics Business is composed of our contractual arrangements with SCE to jointly develop a custom GPU incorporating our next-generation GeForce GPU and SCE’s system solutions in SCE’s PlayStation3, sales of our Xbox-related products, revenue from our license agreement with Microsoft relating to the successor product to their initial Xbox gaming console, the Xbox360, and related devices, and digital media processor products. During the first quarter of fiscal 2006, Microsoft indicated that it would not order any more Xbox-related products from us after our second fiscal quarter. As a result, the second quarter of fiscal 2006 was the last quarter during which we recognized revenue from the sale of our Xbox-related products to Microsoft.
Our Products
We have four major product groups: GPUs, MCPs, Handheld GPUs, and Consumer Electronics. Each of our product lines is designed to provide the advanced processing of a combination of graphics, HD video, audio, communications, network security and storage. Our products are designed to support and deliver the maximum performance for the most current standards as determined by each industry segment, and to provide a comprehensive set of features that enhance the overall operation and compatibility of each platform they support.
GPUs.Our GPU products support desktop PCs, notebook PCs and professional workstations. We have three major families of GPUs: GeForce, Go and NVIDIA Quadro.
GeForce. The GeForce family represents our desktop GPUs and includes the GeForce7, GeForce 6, GeForce FX and GeForce4 families. In March 2005, we introduced two new GeForce 6 GPUs: a 512MB version of the GeForce 6800 Ultra designed for the enthusiast segment, and a new lower-cost AGP version of the GeForce 6200 GPU, designed to bring DirectX 9.0 Shader Model 3.0 technology to the mainstream segment. Our most advanced GPU family is the
GeForce 7 series. In June 2005,year 2009, we launched and shipped our second generation Shader Model 3.0 GPU, the GeForce 7800 GTX, which is designed to address the high-end enthusiast desktop PC segment. In August 2005, we launched and shipped our second GeForce 7 GPU, the GeForce 7800 GT, which is designed to address the high-end performance desktop PC segment. In November 2005, we introduced and shipped the GeForce 7800 GTX 512 GPU, which contains over 302 million transistors and is the industry’s only mainstream GPU to incorporate 64-bit high dynamic range, or HDR. The GeForce 7800 class of GPUs is designed for the enthusiast consumer segment. In November 2005, we introduced the GeForce 6800 GS GPU, which is designed for the mainstream segment. In January 2006, we launched and shipped the GeForce 7300 GS and GeForce 7300 LE GPUs, our first mainstream versions of the GeForce 7 Series. The GeForce 6600 and GeForce 6200, the GeForce FX 5200 and GeForce4 currently deliver a balance of performance and features for the mainstream desktop PC segments.
GeForce Go and NVIDIA Quadro Go. The GeForce Go and NVIDIA Quadro Go families represent our notebook GPUs and include the GeForce 7 Go, GeForce 6 Go, GeForce FX Go, GeForce4 Go, and NVIDIA QuadroFX Go GPUs. These GPUs are designed to deliver desktop graphics performance and features for multiple notebook configurations from desktop replacements, multimedia notebooks and thin-and-lights to notebook workstations. The GeForce Go products are designed to serve the needs of both professional and consumer users.Tegra APX 2500 computer-on-a-chip. The NVIDIA Quadro Go products are designed to serve the needs of workstation professionals in the area of product design and digital content creation. In February 2005, we introduced the GeForce Go 6600 and GeForce Go 6800 Ultra notebook GPUs, both of which are designed specifically to deliver advanced multimedia functionality without sacrificing portability. In September 2005, we launched and shipped the new GeForce Go 7800 GTX, the flagship of the NVIDIA notebook GPU product line. In January 2006, we introducedTegra APX 2500 is a complete family of notebook GPUs - the GeForce Go 7800, GeForce Go 7600 and GeForce Go 7400 - all based on our second generation Shader Model 3.0 architecture and designed to deliver cutting-edge 3D, HD home theatre-quality video and advanced power management to the notebook segment.
NVIDIA Quadro.The NVIDIA Quadro branded products are designed to be robust, high-performance professional workstation solutions that are available for high-end, mid-range, entry-level and multi-display product lines. The NVIDIA Quadro family, which consists of the NVIDIA Quadro FX, NVIDIA Quadro4 and the NVIDIA Quadro NVS professional workstation processors arecomputer-on-a-chip designed to meet the needsgrowing multimedia demands of a number of workstation applications such as industrial product design, digital content creation, non-linear video editing, scientifictoday's mobile phone and medical visualization, general purpose business and financial trading. NVIDIA Quadro products are fully certified by several software developers for professional workstation applications, and are designed to deliver the graphics performance and precision required by professional applications.entertainment user In July 2005,February 2009, we introduced two new NVIDIA Quadro GPUs,announced the NVIDIA Quadro FX 4500Tegra APX 2600 computer-on-a-chip and that we have worked closely with Google, Inc., or Google, and the Open Handset Alliance to unleash Android, an open mobile phone software stack, with the NVIDIA Quadro FX 3450,Tegra series of ‘computer-on-a-chip’ processors. The NVIDIA Tegra APX 2600 and 2500 enable a compelling user interface and high-definition video playback for a low-power, visually rich experience, and we expect that these products will be key to building next-generation Microsoft Windows Mobile, Windows CE, and Android-based devices, including smartphones, PNDs, and PMPs.
Additionally, we also launched the NVIDIA Tegra 600 and 650 products, which are small, advanced, highly-integrated visual computer-on-a-chip products. These products, which represent a single-chip heterogeneous computer architecture designed for low-power mobile computing devices, feature enhanced multimedia functionality—including high definition, or HD, 1080p video and advanced 3D technology—and deliver many times the high-end and mainstream professional segments, respectively. Bothpower efficiency of competing products support our Scalable Link Interface, or SLI, technology. In October 2005,on a broad range of connected devices.
Additionally, in the fourth quarter of fiscal year 2009, we announced that we are the exclusive provider of all graphics cardsalso introduced GeForce 3D Vision, a high-definition 3D stereo solution for the first peripheral component interconnect, or PCI, Express platform from Apple Computer, Inc., or Apple. In addition, the first ever Apple Power Mac will incorporate our Quadro Professional-class GPU.MCPs.Our MCP product family, known as NVIDIA nForce, supports desktop PCs, notebook PCs, professional workstations and servers.
NVIDIA nForce.The NVIDIA nForce family represents our MCPs for AMD and Intel-based desktop PCs, notebook PCs, professional workstations and servers and includes the NVIDIA nForce2, NVIDIA nForce3, NVIDIA nForce4, NVIDIA nForce Professional, GeForce 6100 Series GPUs and NVIDIA nForce 400 Series MCP motherboard solutions. We define an MCP as a single-chip or chipset that can off-load system functions, such as audio processing and network communications, and perform these operations independently from the host CPU. The NVIDIA nForce2 integrates a comprehensive set of multimedia capabilities, such as two-dimensional, or 2D, three-dimensional, orhome. 3D digital video disc, or DVD, HD television, or HDTV, Dolby Digital audio playback and fast broadband and networking communications. The NVIDIA nForce2 familyVision is designed to be compatible with AMD’s Sempron microprocessors. The NVIDIA nForce3 and NVIDIA nForce4 families are single-chip MCPs, designed to be compatible with AMD64 and Opteron 64-bit CPUs. The NVIDIA nForce3 products are designed to complement 64-bit CPUs
and deliver innovative technologies for networking, storage and system performance. NVIDIA nForce4 products are designed to provide a combination of SLI technology and PCI Express support for Intel and AMD64 and Opteron-based platforms. In April 2005, we announced the availability of our NVIDIA nForce4 SLI Intel Edition MCP for Intel-based platforms. This line of core-logic solutions incorporateshigh-tech wireless glasses, a host of new and innovative features that had never before been available on the Intel platform and extended the NVIDIA nForce brand into new segments. In June 2005, we made our SLI technology available to users in the mainstream segment with the release of our GeForce 6600 GPU. In August 2005, we announced that the NVIDIA nForce4 SLI X16 Intel Edition technology featured in the Dell Dimension XPS 600 desktop PC was immediately available. In September 2005, we introduced our first motherboard graphics solutions in more than two years, the GeForce 6100 Series GPU and NVIDIA nForce 400 Series MCP. We offer the industry’s first and only integrated core logic to feature DirectX 9.0 and Shader Model 3.0 technology. In January 2006, we announced two new MCPs for the Intel platform, the NVIDIA nForce4 SLI XE and NVIDIA nForce4 Ultra, both of which provide the system-builder and do-it-yourself communities with two new lower cost discrete motherboard solutions for Intel PC platforms.
Handheld GPUs.Our Handheld GPU product family, known as GoForce, supports handheld personal digital assistants, or PDAs, and multimedia cellular phones.
GoForce.The GoForce family represents our handheld GPUs for a wide range of multimedia cellular phones and handheld devices. The GoForce 2100 and GoForce 2150 GPUs are two of the first handheld GPUs to offer hardware acceleration engines for 2D graphics to manufacturers that support liquid crystal display, or LCD, screen resolutions up to 320 x 240 pixels. The GoForce 3000 and GoForce 4000 offer a host of advanced features for cellular phones and PDAs, including support for up to 3-megapixel image capture, accelerated graphics for gaming, and motion Joint Photographic Experts Group, or JPEG, capture and playback. Our GoForce 4000, GoForce 4500 and GoForce 4800 handheld GPUs are the first to provide programmable 3D shaders, along with high-quality multi-megapixel still image and video processing in a single-chip package. Using dedicated hardware accelerator engines, the GoForce family delivers high performance multimedia applications and drives high-resolution displays, while extending handheld battery life through a variety of unique power management techniques. In the third quarter of fiscal 2006, Motorola Inc. and Sony Ericsson Mobile Communications AB launched Third Generation, or 3G, models of their RAZR and Walkman portable phones, respectively, that are both powered by our GoForce GPUs.
Consumer Electronics.Our Consumer Electronics product group is concentrated in products that support video game consoles and other digital consumer electronics devices.
Playstation3. In April 2005, we finalized our definitive agreement with SCE to jointly develop a custom GPU incorporating our next-generation GeForce GPU and SCE’s system solutions in SCE’s PlayStation3. In addition, we are licensing software development tools for creating shadershigh-power infrared emitter and advanced graphics capabilities to SCE. We have successfully reached many development milestones and we believesoftware that we are on target to achieve the goals set by SCE under this agreement.
Xbox.Our Xbox platform processor supported Microsoft’s initial Xbox video game console.The Xbox platform processor featured dual-processing architecture, which included our GPU designed specifically for the Xbox, or XGPU, and our MCP to power the Xbox’s graphics, audio and networking capabilities. We also have a license agreement with Microsoft relating to the successor product to their initial Xbox gaming console, the Xbox360, and related devices. During the first quartertransforms hundreds of fiscal 2006, Microsoft indicated that it would not order any more Xbox-related products from us after our second fiscal quarter. As a result, the second quarter of fiscal 2006 was the last quarter during which we recognized revenue from the sale of our Xbox-related products to Microsoft.PC games into full stereoscopic 3D.
We design our GPUs, MCPs and handheld GPUsproducts to enable our PC OEMs, ODMs, system builders, motherboard and add-in board manufacturers, and cellular phone and consumer electronics OEMs, to build award-winning products by deliveringthat deliver state-of-the-art features, performance, compatibility and power efficiency while maintaining competitive pricing and profitability. We believe that by developing 3D graphics, HD, video and media communications solutions that provide superior performance and address the key requirements of each of the product segmentscategories we serve, we will accelerate the adoption of HD digital media platforms and devices throughout these segments. We combine scalable architectural technology with mass market economies-of-scale to deliver a complete family of products that spansspan from professional workstations, to consumer PCs, to mulitmedia-richmultimedia-rich cellular phones. Our objective is to be the leading supplier of performance GPUs, MCPs and computer-on-a-chip products that support netbooks, PNDs, PDAs, PMPs, cellular phones and other handheld GPUs.devices. Our current focus is on the desktop PC, professional workstation, notebook PC, servers, mulitmedia-richhigh-performance computing, application processor, multimedia-rich cellular phonesphone and video game console product lines, and we plan to expand into other product lines. Our strategy to achieve this objective includes the following key elements:
Build Award-Winning, Architecturally-Compatible 3D Graphics, HD Video, Media Communications and LowUltra-Low Power Product Families for the PC, Handheld and Digital Entertainment Platforms. Our strategy is to achieve market
sharesegment leadership in these platforms by providing award-winning performance at every price point. By developing 3D graphics, HD video and media communications solutions that provide superior performance and address the key requirements of these platforms, we believe that we will accelerate the adoption of 3D graphics and rich digital media.
Target Leading OEMs, ODMs and System Builders. Our strategy is to enable our leading PC, handheld and consumer electronics OEMs, ODMs and major system builder customers to differentiate their products in a highly competitive marketplace by using our
digital media processors.products. We believe that design wins with these industry leaders provide market validation of our products, increase brand awareness and enhance our ability to penetrate additional leading customer accounts. In addition, we believe that close relationships with OEMs,
ODMs and
ODMsmajor system builders will allow us to better anticipate and address customer needs with future generations of our products.
Sustain Technology and Product Leadership in 3D Graphics and HD Video, and Media Communications and LowUltra-Low Power. We are focused on using our advanced engineering capabilities to accelerate the quality and performance of 3D graphics, HD video, media communications and
lowultra-low power processing in PCs and handheld devices. A fundamental aspect of our strategy is to actively recruit the best 3D graphics and HD video, networking and communications engineers in the industry, and we believe that we have assembled an exceptionally experienced and talented engineering team. Our research and development strategy is to focus on concurrently developing multiple generations of GPUs,
including GPUs for high-performance computing, MCPs and
mobile and consumer products that support netbooks, PNDs, PMPs, PDAs, cellular phones and other handheld
GPUsdevices using independent design teams. As we have in the past, we intend to use this strategy to achieve new levels of graphics, networking and communications features and performance and
lowultra-low power designs, enabling our customers to achieve
award-winningsuperior performance in their products.
Increase Market Share. We believe that substantial market share will be important to achieving success. We intend to achieve a leading share of the market
in areas in which we don't have a leading market share, and maintain a leading share of the market in areas in which we do have the lead, by devoting substantial resources to building
award-winning families of products for a wide range of
applications.applications that offer significant improvement in performance over existing products. Use Our Expertise in Digital Multimedia. We believe the synergy created by the combination of 3D graphics, HD video and the Internet will fundamentally change the way people work, learn, communicate and play. We believe that our expertise in HD graphics and system architecture positions us to help drive this transformation. We are using our expertise in the processing and transmission of high-bandwidth digital media to develop products designed to address the requirements of high-bandwidth concurrent multimedia.
Use our Intellectual Property and Resources to Enter into License and Development Contracts.During fiscal 2006, From time to time, we
enteredexpect to enter into license arrangements that
will require significant customization of our intellectual property
components and we anticipate that we will enter into additional agreements during fiscal 2007.components. For license arrangements that require significant customization of our intellectual property components, we generally recognize this license revenue using the percentage-of-completion method of accounting over the period that services are performed. For example, in
April 2005,fiscal year 2006, we
finalized our definitiveentered into an agreement with
Sony Computer Entertainment, Inc., or SCE, to jointly develop a custom GPU
incorporating our next-generation GeForce GPU and SCE’s system solutions infor SCE’s PlayStation3. Our collaboration with SCE includes license fees and royalties for the PlayStation3 and all derivatives, including next-generation digital consumer electronics devices. In addition, we are licensing software development tools for creating shaders and advanced graphics capabilities to SCE.
Revolutionize computing with CUDA and Tesla. Tesla is a family of GPU computing products that delivers processing capabilities for high-performance computing applications, and marks our entry into the high-performance computing industry. NVIDIA CUDA is a general purpose parallel computing architecture that leverages the parallel compute engine in NVIDIA GPUs to solve many complex computational problems in a fraction of the time required on a CPU. We believe we are in an era of GPU computing, where our CUDA parallel processing architecture can accelerate compute-intensive applications by significant multiples over that of a CPU alone. We are working with developers around the world to adopt and write application programs for the CUDA architecture using C, one of the most widely used high-level programming languages, which can then be run at great execution speeds on a CUDA enabled processor. We expect other languages to be supported in the future, including FORTRAN and C++. With CUDA, we are able to speed up general purpose compute-intensive applications like we do for 3D graphics processing. Developers are able to speed-up algorithms in areas ranging from nano molecular dynamics to image processing, medical image reconstruction and derivatives modeling for financial risk analysis. We are also working with universities around the world who now teach parallel programming with CUDA and we are also working with many PC OEMs who now offer high performance computing solutions with Tesla for use by their customers around the world. Researchers also use CUDA to accelerate their time-to-discovery, and popular off-the-shelf software packages are now CUDA accelerated.
Our worldwide sales and marketing strategy is a key part of our objective to become the leading supplier of performance GPUs, MCPs, and applications processors that support netbooks, PNDs, PMPs, PDAs, cellular phones and other handheld GPUs for PCs, handheld devices and consumer electronics platforms.devices. Our sales and marketing teams work closely with each industry’s respective OEMs, ODMs, system integrators,builders, motherboard manufacturers, add-in board manufacturers and industry trendsetters, collectively referred to as our channel,Channel, to define product features, performance, price and timing of new products. Members of our sales team have a high level of technical expertise and product and industry knowledge to support athe competitive and complex design win process. We also employ a highly skilled team of application engineers to assist the channelour Channel in designing, testing and qualifying system designs that incorporate our products. We believe that the depth and quality of our design support are keykeys to improving the channel’sour Channel’s time-to-market, maintaining a high level of customer satisfaction within the channelour Channel and fostering relationships that encourage customers to use the next generation of our products. In the GPU MCP, and handheld GPUMCP segments we serve, the sales process involves achieving key design wins with leading OEMs and major system integratorsbuilders and supporting the product design into high volume production with key ODMs, motherboard manufacturers and add-in board manufacturers. These design wins in turn influence the retail and system integratorbuilder channel that is serviced by add-in board and motherboard manufacturers. Our distribution strategy is to work with a number of leading independent contract equipment manufacturers, or CEMs, ODMs, motherboard manufacturers, add-in board manufacturers and distributors each of which hashave relationships with a broad range of major OEMs and/or strong brand name recognition in the retail channel. In the handheld GPU segmentsCPB segment we serve, the sales process primarily involves achieving key design wins directly with the leading handheld OEMs and supporting the product design into high-volume production. Currently, we sell a significant portion of our digital media processors directly to distributors, CEMs, ODMs, motherboard manufacturers and add-in board manufacturers, which then sell boards and systems with our products to leading OEMs, retail outlets and to a large number of system integrators.builders.
Although a small number of our customers represent the majority of our revenue, their end customers include a large number of OEMs and system integratorsbuilders throughout the world.As a result of our channelChannel strategy, our sales are focused on a small number of customers. Sales to Edom Technology Co., Ltd., or Edom,our largest customer, Hewlett-Packard Company, accounted for 14% and sales to Asustek Computer Inc., or Asustek, accounted for 12%11% of our total revenue for fiscal 2006. Edom is an independent distributor and Asustek is a CEM.
year 2009.
To encourage software title developers and publishers to develop games optimized for platforms utilizing our products, we seek to establish and maintain strong relationships in the software development community. Engineering and marketing personnel interact with and visit key software developers to promote and discuss our products, as well as to ascertain product requirements and solve technical problems. Our developer program makes certain that our products are available to developers prior to volume availability in order to encourage the development of software titles that are optimized for our products.
Backlog
BacklogOur sales are primarily made pursuant to standard purchase orders. The quantity of products purchased by our customers as well as our shipment schedules are subject to revisions that reflect changes in both the customers’ requirements and in manufacturing availability. The semiconductor industry is characterized by short lead time orders and quick delivery schedules. In light of industry practice and experience, we believe that only a small portion of our backlog is non-cancelable and that the dollar amount associated with the non-cancelable portion is not significant. WeConsequently, we do not believe that a backlog as of any particular date is indicative of future results.
Dependence on PC market
We derive and expect to continue to derive the majority of our revenue from the sale or license of products for use in the desktop PC and notebook PC markets, including professional workstations. A reduction in sales of PCs, or a reduction in the growth rate of PC sales, may reduce demand for our products. Changes in demand for our products could be large and sudden. During fiscal year 2009, sales of our desktop GPU products decreased approximately 29% compared to fiscal year 2008. These decreases were primarily due to the Standalone Desktop and Standalone Notebook GPU market segment decline as reported in the PC Graphics December 2008 Report from Mercury Research. Since PC manufacturers often build inventories during periods of anticipated growth, they may be left with excess inventories if growth slows or if they incorrectly forecast product transitions. In these cases, PC manufacturers may abruptly suspend substantially all purchases of additional inventory from suppliers like us until their excess inventory has been absorbed, which would have a negative impact on our financial results.
Our industry is largely focused on the consumer products market. Due to the seasonality in this market,Historically, we typically expect to seehave seen stronger revenue performance in the second half of our fiscal year than in the calendarfirst half of our fiscal year, relatedprimarily due to the back-to-school and holiday seasons.demand. This seasonal trend did not occur in fiscal year 2009. Revenue in the second half of fiscal year 2009 declined by 33% when compared to revenue from the first half of fiscal year 2009. The current recessionary economic environment has created substantial uncertainty in our business. There can be no assurance that the historical seasonal trend will resume in the future.
Manufacturing
Fabless Manufacturing Strategy We do not directly manufacture semiconductor wafers used for our products. Instead, we utilize what is known as a “fabless”fabless manufacturing strategy for all of our product-line operating segments whereby we employ world-class suppliers for all phases of the manufacturing process, including wafer fabrication, assembly, testing and packaging. This strategy uses the expertise of industry-leading suppliers that are certified by the International Organization for Standardization, or ISO, in such areas as fabrication, assembly, quality control and assurance, reliability and testing. In addition, this strategy allows us to avoid many of the significant costs and risks associated with owning and operating manufacturing operations. Our suppliers are also responsible for procurement of most of the raw materials used in the production of our products. As a result, we can focus our resources on product design, additional quality assurance, marketing and customer support. We utilize industry-leading suppliers, such as Taiwan Semiconductor Manufacturing Corporation, or TSMC, United Microelectronics Corporation, or UMC, Chartered Semiconductor Manufacturing, or Chartered, Semiconductor Manufacturing International Corporation, or SMIC, Taiwan Semiconductor Manufacturing Corporation,and Austria Micro Systems, or TSMC, and United Microelectronics Corporation, or UMC,AMS to produce our semiconductor wafers. We then utilize independent subcontractors, such as Advanced Semiconductor Engineering, or ASE, Amkor Technology, or Amkor, JSI Logistics Ltd., or JSI, King Yuan Electronics Co., LTD,Ltd, or KYEC, Siliconware Precision Industries Company Ltd., or SPIL, and STATS ChipPAC Incorporated, or ChipPAC, to perform assembly, testing and packaging of most of our products. We typically receive semiconductor products from our subcontractors, perform incoming quality assurance and then ship themthe semiconductors to CEMs, distributors, motherboard and add-in board manufacturer customers from our third-party warehouse in Hong Kong. Generally, these manufacturers assemble and test the boards based on our design kit and test specifications, and then ship the products to retailers, system integratorsbuilders or OEMs as motherboard and add-in board solutions. Product Defect
Our products are complex and may contain defects or experience failures due to any number of issues in design, fabrication, packaging, materials and/or use within a system. If any of our products or technologies contains a defect, compatibility issue or other error, we may have to invest additional research and development efforts to find and correct the issue. Such efforts could divert our management’s and engineers’ attention from the development of new products and technologies and could increase our operating costs and reduce our gross margin. In addition, an error or defect in new products or releases or related software drivers after commencement of commercial shipments could result in failure to achieve market acceptance or loss of design wins. Also, we may be required to reimburse customers, including for customers’ costs to repair or replace the products in the field. A product recall or a significant number of product returns could be expensive, damage our reputation and could result in the shifting of business to our competitors. Costs associated with correcting defects, errors, bugs or other issues could be significant and could materially harm our financial results.
For example, in July 2008, we recorded a $196.0 million charge against cost of revenue to cover anticipated customer warranty, repair, return, replacement and other associated costs arising from a weak die/packaging material set in certain versions of our previous generation MCP and GPU products used in notebook systems. All of our newly manufactured products and all of our products that are currently shipping in volume have a different material set that we believe is more robust. The previous generation MCP and GPU products that are impacted were included in a number of notebook products that were shipped and sold in significant quantities. Certain notebook configurations of these MCP and GPU products are failing in the field at higher than normal rates. While we have not been able to determine a root cause for these failures, testing suggests a weak material set of die/package combination, system thermal management designs, and customer use patterns are contributing factors. We have worked with our customers to develop and have made available for download a software driver to cause the system fan to begin operation at the powering up of the system and reduce the thermal stress on these chips. We have also recommended to our customers that they consider changing the thermal management of the MCP and GPU products in their notebook system designs. We intend to fully support our customers in their repair and replacement of these impacted MCP and GPU products that fail, and their other efforts to mitigate the consequences of these failures.
We continue to engage in discussions with our supply chain regarding reimbursement to us for some or all of the costs we have incurred and may incur in the future relating to the weak material set. We also continue to seek to access our insurance coverage, which provided us with $8.0 million in related reimbursement during fiscal year 2009. However, there can be no assurance that we will recover any additional reimbursement. We continue to not see any abnormal failure rates in any systems using NVIDIA products other than certain notebook configurations. However, we are continuing to test and otherwise investigate other products. There can be no assurance that we will not discover defects in other MCP or GPU products.
Inventory and Working Capital
Our management focuses considerable attention on managing our inventories and other working-capital-related items. We manage inventories by communicating with our customers and then using our industry experience to forecast demand on a product-by-product basis. We then place manufacturing orders for our products that are based on this forecasted demand. The quantity of products actually purchased by our customers as well as shipment schedules are subject to revisions that reflect changes in both the customers’ requirements and in manufacturing availability. We generally maintain substantial inventories of our products because the semiconductor industry is characterized by short lead time orders and quick delivery schedules. We believe that our existing cash balances and anticipated cash flows from operations will be sufficient to meet our operating, acquisition and capital requirements for at least the next twelve months. However, there is no assurance that we will not need to raise additional equity or debt financing within this time frame. Additional financing may not be available on favorable terms or at all and may be dilutive to our then-current stockholders. We also may require additional capital for other purposes not presently contemplated. If we are unable to obtain sufficient capital, we could be required to curtail capital equipment purchases or research and development expenditures, which could harm our business.
We believe that the continued introduction of new and enhanced products designed to deliver leading 3D graphics, HD video, audio, lowultra-low power communications, storage, and secure networking performance and features is essential to our future success. Our research and development strategy is to focus on concurrently developing multiple generations of GPUs, MCPs and Handheld GPUsour consumer products that support netbooks, PNDs, PMPs, PDAs, cellular phones or other handheld devices using independent design teams. Our research and development efforts are performed within specialized groups consisting of software engineering, hardware engineering, very large scale integration design engineering, process engineering, architecture and algorithms. These groups act as a pipeline designed to allow the efficient simultaneous development of multiple generations of products. A critical component of our product development effort is our partnerships with leaders in the computer aided design, or CAD, industry. We invest significant resources in the development of relationships with industry leaders, including Cadence Design Systems, Inc., and Synopsys, Inc., often assisting these companies in the product definition of their new products. We believe that forming these relationships and utilizing next-generation development tools to design, simulate and verify our products will help us remain at the forefront of the 3D graphics market and develop products that utilize leading-edge technology on a rapid basis. We believe this approach assists us in meeting the new design schedules of PC OEM and other manufacturers. We have substantially increased our engineering and technical resources fromin fiscal 2005,year 2009, and have 1,654had 3,772 full-time employees engaged in research and development as of January 29, 2006,25, 2009, compared to 1,2313,255 employees as of January 30, 2005.27, 2008 and 2,668 employees as of January 28, 2007. During fiscal 2006, 2005years 2009, 2008 and 2004,2007, we incurred research and development expenditures of $357.1$855.9 million, $348.2$691.6 million and $292.2$553.5 million, respectively.
Competition
CompetitionThe market for GPUs, MCPs, and computer-on-a-chip products that support netbooks, PNDs, PMPs, PDAs, cellular phones or other handheld GPUsdevices is intensely competitive and is characterized by rapid technological change, evolving industry standards and declining average selling prices. We believe that the principal competitive factors in this market are performance, breadth of product offerings, access to customers and distribution channels, backward-forward software support, conformity to industry standard application programming interfaces,Application Programming Interfaces, or APIs, manufacturing capabilities, price of processorsprocessor pricing, and total system costs of add-in boards or motherboards.costs. We believe that our ability to remain competitive will depend on how well we are able to anticipate the features and functions that customers will demand and whether we are able to deliver consistent volumes of our products at acceptable levels of quality.quality and at competitive prices. We expect competition to increase from both from existing competitors and new market entrants with products that may be less costly than ours, or may provide better performance or additional features not provided by our products. In addition, it is possible that new competitors or alliances among competitors could emerge and acquire significant market share.
An additional
A significant source of competition is from companies that provide or intend to provide GPU, MCP, and Handheld GPU solutions.computer-on-a-chip products that support netbooks, PNDs, PMPs, PDAs, cellular phones or other handheld devices. Some of our competitors may have greater marketing, financial, distribution and manufacturing resources than we do and may be more able to adapt to customer or technological changes. Currently, Intel, which has greater resources than we do, is working on a multi-core architecture code-named Larrabee, which may compete with our products in various markets. Intel may also release an enthusiast level discrete GPU based on the Larrabee architecture. Additionally, in fiscal year 2009, Intel also introduced the Intel Atom processor which is designed for lower cost PCs. Intel may also release a second generation of Atom chips by 2010 which is expected to have an improved battery life. The Intel Atom processor may compete with our products that support netbooks, PDAs, cellular phones and other handheld devices.
Our current competitors include the following: suppliers of discrete MCPs that incorporate a combination of networking, audio, communications and input/output, or I/O, functionality as part of their existing solutions, such as ATI Technologies, Inc., or ATI, Broadcom Corporation, or Broadcom, and Intel;
suppliers of GPUs, including MCPs that incorporate 3D graphics functionality as part of their existing solutions, such as ATI, Intel, Matrox Electronics Systems Ltd., Silicon Integrated Systems, Inc., VIA Technologies, Inc., and XGI Technology Inc.;| · | suppliers of discrete MCPs that incorporate a combination of networking, audio, communications and input/output, or I/O, functionality as part of their existing solutions, such as AMD, Broadcom Corporation, or Broadcom, Silicon Integrated Systems, Inc., or SIS, VIA Technologies, Inc., or VIA, and Intel; |
suppliers of GPUs or GPU intellectual property for handheld and embedded devices that incorporate advanced graphics functionality as part of their existing solutions, such as ATI, Bitboys, Broadcom, Fujitsu Limited, Imagination Technologies Ltd., NEC Corporation, Qualcomm Incorporated, Renesas Technology Corp., Seiko-Epson, Texas Instruments Incorporated, and Toshiba America, Inc.| · | suppliers of GPUs, including MCPs that incorporate 3D graphics functionality as part of their existing solutions, such as AMD, Intel, Matrox Electronics Systems Ltd., SIS, and VIA; |
| · | suppliers of computer-on-a-chip products that support netbooks, PNDs, PMPs, PDAs, cellular phones or other handheld devices such as AMD, Broadcom, Fujitsu Limited, Imagination Technologies Ltd., ARM Holdings plc, Marvell Technology Group Ltd, or Marvell, NEC Corporation, Qualcomm Incorporated, Renesas Technology, Samsung, Seiko-Epson, Texas Instruments Incorporated, and Toshiba America, Inc.; and |
| · | suppliers of computer-on-a-chip products for handheld and embedded devices that incorporate multimedia processing as part of their existing solutions such as Broadcom, Texas Instruments Inc., Qualcomm Incorporated, Marvell, Freescale Semiconductor Inc., Renesas Technology, Samsung, and ST Microelectronics. |
We expect substantial competition from both Intel’s publicized focus on moving toand AMD’s strategy of selling platform solutions, dominated by Intel products, such as whenthe success Intel achieved success with its Centrino platform solution. In addition to its current Centrino notebookAMD has also announced a platform initiative, and its announced upcoming desktop initiative branded as VIIV,solution. Additionally, we expect that Intel is now focused on developing and selling platform solutions for allAMD will extend this strategy to other segments, including professional workstationsthe possibility of successfully integrating a central processing unit, or CPU, and servers.a GPU on the same chip, as evidenced by AMD’s announcement of its Fusion processor project. If AMD and Intel continuescontinue to pursue these initiatives,platform solutions, we may not be able to successfully compete in these segments.and our business would be negatively impacted.
If and to the extent we offer products outside of the consumer and enterprise PC, notebook, workstation, PDA, cellular phone, and video game consolein new markets, we may face competition from some of our existing competitors as well as from companies with which we currently do not compete. For example, in the case of our CPB, our Tegra and GoForce products primarily compete in architecture used in multimedia cellular phones and handheld devices. We believe that mobile devices like phones, music players, and portable navigation devices will increasingly become more consumer PC-like and be capable of delivering all the entertainment and web experiences in a handheld device. We cannot accurately predict if we will compete successfully in any of the new markets we may enter. If we are unable to compete in our current and anyor new markets, demand for our products could decrease which could cause our revenue to decline and our financial results willto suffer. Our GPU and MCP products are currently used with both Intel and AMD processors. In February 2009, Intel filed suit against us, related to a patent license agreement that we signed with Intel in 2004. Intel seeks an order from the court declaring that the license does not extend to a new Intel processor architecture and enjoining us from stating that we have licensing rights for this architecture. If Intel successfully obtains such a court order, we could be unable to sell our MCP products for use with these Intel processors and our competitive position would be harmed. In addition, in order to continue to sell MCP products for use with these Intel processors we could be required to negotiate a new license agreement with Intel and we may not be able to do so on reasonable terms, if at all.
Patents and Proprietary Rights
We rely primarily on a combination of patents, trademarks, trade secrets, employee and third-party nondisclosure agreements and licensing arrangements to protect our intellectual property in the United States and internationally. Our issued patents have expiration dates from September 4, 2007April 10, 2009 to September 2, 2024.October 1, 2028. We have numerous patents issued, allowed and pending in the United States and in foreign countries.jurisdictions. Our patents and pending patentapplications primarily relate to our products and the technology used by us in connection with our products, including our digital media processors.products. We also rely on international treaties, and organizations and foreign laws to protect our intellectual property. The laws of certain foreign countries in which our products are or may be manufactured or sold, including various countries in Asia, may not protect our products or intellectual property rights to the same extent as the laws of the United States. This makes the possibility of piracy of our technology and products more likely. We continuously assess whether and where to seek formal protection for particular innovations and technologies based on such factors as: the commercial significance of our operations and our competitors’ operations in particular countries and regions; the location in which our products are manufactured; our strategic technology or product directions in different countries; and the degree to which intellectual property laws exist and are meaningfully enforced in different jurisdictions.
| · | the location in which our products are manufactured; |
| · | our strategic technology or product directions in different countries; and |
| · | the degree to which intellectual property laws exist and are meaningfully enforced in different jurisdictions. |
| · | the commercial significance of our operations and our competitors’ operations in particular countries and regions; |
digital media processors,products and for defensive reasons, and expect to continue to enter into such license agreements for future products.agreements. These licenses may result in royalty payments to third parties, the cross licensing of technology by us or payment of other consideration. If these arrangements are not concluded on commercially reasonable terms, our business could suffer.
Employees
As of January 29, 200625, 2009 we had 2,7375,420 employees, 1,6543,772 of whom were engaged in research and development and 1,0831,648 of whom were engaged in sales, marketing, operations and administrative positions. None of our employees are covered by collective bargaining agreements, and we believe our relationships with our employees are good.
Financial Information by Business Segment and Geographic Data
Our Chief Executive Officer, who is considered to be our chief operating decision maker, or CODM, reviews financial information presented on an operating segment basis for purposes of making operating decisions and assessing financial performance. During the first quarter of fiscal 2006,year 2008, we reorganized our operating segments to bring all major product groups in line with our strategy to position ourselves as the worldwide leader in programmable graphics processor technologies.segments. We now report financial information for four product-line operating segments to our CODM: the GPU Businessbusiness, which is composedcomprised primarily of our GeForce products that support desktop PCs,and notebook PCs, plus memory products; the PSB which is comprised of our NVIDIA Quadro professional workstation products and other professional workstations;graphics products, including our NVIDIA Tesla high-performance computing products; the MCP Businessbusiness which is composedcomprised of NVIDIA nForce products that operate as a single-chip or chipset that can off-load system functions, such as audio processingcore logic and network communications,motherboard GPU products; and perform these operations independently from the host CPU; our Handheld GPU BusinessCPB, which is composedcomprised of our Tegra and GoForce mobile brands and products that support handheld personal digital assistants,netbooks, PNDs, PMPs, PDAs, cellular phones and other handheld devices;devices. CPB also includes license, royalty, other revenue and our Consumer Electronics Business is concentrated in products that supportassociated costs related to video game consoles and other digital consumer electronics devices and is composed of revenue from our contractual arrangements with SCE to jointly develop a custom GPU incorporating our next-generation GeForce GPU and SCE’s system solutions in SCE’s PlayStation3, revenue from sales of our Xbox-related products, revenue from our license agreement with Microsoft relating to the successor product to their initial Xbox gaming console, the Xbox360, and related devices, and digital media processor products.devices. In addition to these operating segments, we have the “All Other” category that includes human resources, legal, finance, general administration and corporate marketing expenses, which total $123.9$346.1 million, $266.2 million and $118.0$239.6 million for fiscal 2006years 2009, 2008 and 2005,2007, respectively, that we do not allocate to our other operating segments.segments as these expenses are not included in the segment operating performance measures evaluated by our CODM. “All Other” also includes the results of operations of other miscellaneous operatingreporting segments that are neither individually reportable, nor aggregated with another operating segment. Revenue in the “All Other” category is primarily derived from sales of memory. Allcomponents. Certain prior period amounts have been restatedrevised to reflectconform to the presentation of our new reporting structure.
current fiscal year.
Our CODM does not review any information regarding total assets on an operating segment basis. Operating segments do not record intersegment revenue, and, accordingly, there is none to be reported. The accounting policies for segment reporting are the same as for NVIDIA as a whole. The information included in Note 16 of the Notes to the Consolidated Financial Statements in Part IV, Item 15 of this Form 10-K, including financial information by business segment and revenue and long-lived assets by geographic region, is hereby incorporated by reference. Executive Officers of the Registrant
The following sets forth certain information regarding our executive officers, their ages and their positions as of
January 29, 2006:February 27, 2009: | | | | |
Name | | Age | | Position |
| Jen-Hsun Huang | | 4245 | | President, Chief Executive Officer and Director |
Marvin D. BurkettDavid L. White* | | 6353 | | Executive Vice President and Chief Financial Officer |
| Ajay K. Puri | | 5154 | | SeniorExecutive Vice President, Worldwide Sales |
Jeffrey D. Fisher | | 47 | | Senior Vice President, GPU Business Unit |
| David M. Shannon | | 5053 | | SeniorExecutive Vice President, General Counsel and Secretary |
Daniel F. VivoliDebora Shoquist | | 4554 | | SeniorExecutive Vice President, MarketingOperations |
* On February 27, 2009, we announced that David L. White was appointed as our Executive Vice President and Chief Financial Officer, succeeding Marvin Burkett, whose decision to retire was disclosed in March 2008.
Jen-Hsun Huangco-founded NVIDIA in April 1993 and has served as its President, Chief Executive Officer and a member of the Board of Directors since its inception. From 1985 to 1993, Mr. Huang was employed at LSI Logic Corporation, a computer chip manufacturer, where he held a variety of positions, most recently as Director of Coreware, the business unit responsible for LSI’s “system-on-a-chip” strategy. From 1983 to 1985, Mr. Huang was a microprocessor designer for Advanced Micro Devices,
Inc., a semiconductor company. Mr. Huang holds a B.S.E.E. degree from Oregon State University and an M.S.E.E. degree from Stanford University.
Marvin D. Burkett David White joined NVIDIA in February 2009 as Executive Vice President and Chief Financial Officer in September 2002.Officer. From August 2004 to February 2000 until joining NVIDIA,2009, Mr. Burkett was a financial consultant andWhite served as the Executive Vice President of Finance and Chief Financial Officer of Arcot Systems,Sanmina-SCI Corporation, a security software company.global provider of customized, integrated electronics manufacturing services to original equipment manufacturers in the communications, enterprise computing and medical industries and various other end markets. From 19982003 to 1999,2004, Mr. BurkettWhite was the ExecutiveSenior Vice President and Chief Financial Officer of Packard Bell NEC.Asyst Technologies, Inc., a provider of integrated hardware and software automation solutions that enhance semiconductor and flat-panel display manufacturing productivity. Mr. Burkett also previously spent 26 years at Advanced Micro Devices, Inc., or AMD, where he held a variety of positions including Chief Financial Officer, Senior ViceWhite served as President and Corporate Controller.Chief Executive Officer of Candescent Technologies Corporation, a developer of field emission display technology for next-generation thin flat-panel displays, and held various other positions, from 1995 to 2002. Mr. BurkettWhite holds a B.S. degree from Brigham Young University and an M.B.A. degrees from the University of Arizona.Washington.Ajay K. Puri joined NVIDIA in December 2005 as Senior Vice President, Worldwide
Sales.Sales and became Executive Vice President, Worldwide Sales in January 2009. Prior to NVIDIA, he held positions in sales, marketing, and general management over a 22-year career at Sun Microsystems, Inc. Mr. Puri previously held marketing, management consulting, and product development positions at Hewlett-Packard
Development Company,
L.P., Booz Allen Hamilton Inc., and Texas Instruments Incorporated. Mr. Puri holds an M.B.A.
degree from Harvard University, an M.S.E.E. degree from
Caltech,the California Institute of Technology and a B.S.E.E. degree from the University of Minnesota.
Jeffrey D. Fisherjoined in July 1994 and served as the Executive Vice President, Worldwide Sales of NVIDIA until December 2005, when he became Senior Vice President of the GPU Business Unit. He has over 20 years of sales and marketing experience in the semiconductor industry. Mr. Fisher holds a B.S.E.E. degree from Purdue University and an M.B.A. degree from Santa Clara University.David M. Shannon joined NVIDIA in August 2002 as Vice President and General Counsel. Mr. Shannon became Secretary of NVIDIA in April 2005, and a Senior Vice President in December 2005.2005 and an Executive Vice President in January 2009. From 1993 to 2002, Mr. Shannon held various counsel positions at Intel, including the most recent position of Vice President and Assistant General Counsel. Mr. Shannon also practiced for eight years in the law firm of Gibson Dunn and Crutcher, focusing on complex commercial and high-technology related litigation. Mr. Shannon holds B.A. and J.D. degrees from Pepperdine University.
Daniel F. Vivolibecame the Debora Shoquist joined NVIDIA in September 2007 as Senior Vice President Marketing in December 2005. Mr. Vivoli served asof Operations and became Executive Vice President of Marketing from December 1997Operations in January 2009. From 2004 to December 2005. From 1988 to December 1997, Mr. Vivoli held management positions, most recently2007, Ms. Shoquist served as Senior Vice President of Product Marketing,Operations at Silicon Graphics,JDS Uniphase Corporation, a provider of communications test and measurement solutions and optical products for the telecommunications industry. From 2002 to 2004, she served as Senior Vice President and General Manager of the Electro-Optics business at Coherent, Inc., a computing technology company. From 1983 to 1988, Mr. Vivoli held various marketing positionsmanufacturer of commercial and scientific laser equipment. Her experience includes her role at Quantum Corporation as the President of the Personal Computer Hard Disk Drive Division. Her experience also includes senior roles at Hewlett-Packard Company. Mr. VivoliCorporation. She holds a B.S.E.E.B.S degree in Electrical Engineering from theKansas State University of Illinois at Champaign-Urbana.and a B.S. degree in Biology from Santa Clara University.
Our Annual Report on Form 10-K, quarterly reports on Form 10-Q, current reports on Form 8-K and, if applicable, amendments to those reports filed or furnished pursuant to Section 13(a) of the Securities Exchange Act of 1934, or the Exchange Act, are available free of charge on or through our Internet website,web site, http://www.nvidia.com, as soon as reasonably practicable after we electronically file such material with, or furnish it to, the Securities and Exchange Commission.Commission, or the SEC. Our websiteweb site and the information contained therein ason it or connected theretoto it is not intended to be incorporated into the Annual Report on Form 10-K/A.As discussed in the Explanatory Note we concluded that we need to amend our Original Filing to restate our consolidated financial statements for the years ended January 29, 2006, January 30, 2005, and January 25, 2004 and the related disclosures. This Form 10-K/A also includes the restatementa part of selected consolidated financial data as of and for the years ended January 29, 2006, January 30, 2005, January 25, 2004, January 26, 2003, and January 27, 2002, and the unaudited quarterly financial data for each of the quarters in the years ended January 29, 2006 and January 30, 2005. We also concluded that we need to amend the Quarterly Report on Form 10-Q for the quarter ended April 30, 2006, originally filed on May 31, 2006, to restate our condensed consolidated financial statements for the quarters ended April 30, 2006 and May 1, 2005 and the related disclosures. We will also restate the July 31, 2005 financial statements included in the Quarterly Report on Form 10-Q for the quarter ended July 30, 2006. We will restate the October 30, 2005 financial statements with the filing of our October 29, 2006 Form 10-Q. However, we have included in Exhibit 99.1 a restated balance sheet as of October 31, 2005, restated statements of income for the three and nine month periods ended October 31, 2005, and a restated statement of cash flows for the nine month period ended October 31, 2005. We have not amended and we do not intend to amend any of our other previously filed annual reports on Form 10-K or quarterly reports on Form 10-Q for the periods affected by the restatement or adjustments other than the amended Quarterly Report on Form 10-Q/A for the quarter ended April 30, 2006 and this Form 10-K/A for the year ended January 30, 2006.
10-K. In evaluating NVIDIA and our business, the following factors should be considered in addition to the other information in this Annual Report on Form 10-K/A. Any10-K. Before you buy our common stock, you should know that making such an investment involves some risks including, but not limited to, the risks described below. Additionally, any one of the following risks could seriously harm our business, financial condition and results of operations, which could cause our stock price to decline. Additional risks and uncertainties not presently known to us or that we currently deem immaterial may also impair our business operations.
Risks Related to Our
OperationsBusiness and Industry
The matters relating to the Audit Committee of the Board of Directors’ review of Global economic conditions have reduced demand for our historical stock option granting practicesproducts, adversely impacted our customers and the restatement ofsuppliers and harmed our consolidated financial statements may result in future litigation, which could harm our financial results.business.On August 10, 2006, NVIDIA announced that the Audit Committee of the Board of Directors, with the assistance of outside legal counsel, was conducting
Our operations and performance depend significantly on worldwide economic conditions. Uncertainty about current global economic conditions poses a review of our stock option practices covering the time from NVIDIA’s initial public offering in 1999 (our fiscal year 2000) through June 2006. As described in Item 7, “Management’s Discussion and Analysis of Financial Condition and Results of Operations” and Note 2continuing risk to our Consolidated Financial Statements,business as consumers and businesses have postponed spending in response to tighter credit, negative financial news and/or declines in income or asset values, which have reduced the Audit Committee has reacheddemand for our products. Other factors that could depress demand for our products in the conclusion that incorrect measurement dates were used for financial accounting purposes for stock option grants madefuture include conditions in certain prior periods. As a result, NVIDIA has recorded additional non-cash stock-based compensation expense,the residential real estate and related tax effects, relatedmortgage markets, labor and healthcare costs, access to stock option grants.The Audit Committee’s review of NVIDIA’s stock option practices identified a number of occasions on which the measurement date used for financial accounting and reporting purposes for stock options granted to some of our employees was different from the actual grant date. To correct these accounting errors, we are amending our Annual Report on Form 10-K for the year ended January 30, 2006 and our Quarterly Report on Form 10-Q for the three months ended April 30, 2006, to restate the consolidated financial statements contained in those reports.
The Audit Committee’s independent review of our historical stock option granting practices has required us to incur substantial expenses for legal, accounting, taxcredit, consumer confidence, and other professional services, has divertedmacroeconomic factors affecting consumer spending behavior. These and other economic factors have reduced demand for our management’s attention from our business,products and could in the futurefurther harm our business, financial condition results of operations and cash flows.
Our historical stock option granting practicesoperating results.
The current financial turmoil affecting the banking system and financial markets and the restatementpossibility that financial institutions may consolidate or go out of our prior financial statementsbusiness have exposed us to greater risks associated with litigation and regulatory proceedings. As describedresulted in Part II, Item 3, “Legal Proceedings”, several derivative complaints have been filed against our directors and certain of our executive officers pertaining to allegations relating to stock option grants. We cannot assure you that these or future similar complaints, or any future litigation or regulatory action will resulta tightening in the same conclusions reached by the Audit Committee. The conductcredit markets, a low level of liquidity in many financial markets, and resolution of these matters or other litigation will be time consuming, expensiveextreme volatility in fixed income, credit, currency and may distract management from the conduct of our business.We voluntarily contacted the SEC regarding the Audit Committee’s review and, as of the date of the filing of this Annual Report on Form 10-K/A, the SEC is continuing the inquiry of our historical stock option grant practices it began in late August 2006. In October 2006, we met with the SEC and provided it with a review of the status of the Audit Committee’s review and in November 2006 we voluntarily provided the SEC with further documents. We plan to continue to cooperate with the SEC in its inquiry.
While we believe that we have made appropriate judgments in concluding the correct measurement dates for option grants, the SEC may disagree with the manner in which we have accounted for and reported, or not reported, the financial impact of past option grant measurement date errors, and there is a risk that its inquiry could lead to circumstances in which we may have to further restate our prior financial statements, amend prior filings with the SEC, or otherwise take other actions not currently contemplated. Any such circumstance could also lead to future delays in filing our subsequent SEC reports and delisting of our common stock from the NASDAQ Global Select Market. Furthermore, if we are subject to adverse findings in any of these matters, weequity markets. There could be required to pay damages or penalties or have other remedies imposed upon us which could harm our business, financial condition, results of operations and cash flows. Please see Note 2, “Restatement of Consolidated Financial Statements, Audit Committee and Company Findings” of the Notes to Consolidated Financial Statements for further information.
Because our gross margin for any period depends on a number of follow-on effects from the credit crisis on our business, including insolvency of key suppliers resulting in product delays; inability of customers, including channel partners, to obtain credit to finance purchases of our products and/or customer, including channel partner, insolvencies; and failure of financial institutions, which may negatively impact our treasury operations. Other income and expense could also vary materially from expectations depending on gains or losses realized on the sale or exchange of financial instruments; impairment charges related to debt securities as well as equity and other investments; interest rates; and cash, cash equivalent and marketable securities balances. For example, during fiscal year 2009, we recorded impairment charges of $5.6 million related to our money market investment in the Reserve International Liquidity Fund, Ltd., or the International Reserve Fund. The current volatility in the financial markets and overall economic uncertainty increases the risk that the actual amounts realized in the future on our financial instruments could differ significantly from the fair values currently assigned to them.
Our business is cyclical in nature and is currently experiencing a severe downturn, which has harmed and may continue to harm our financial results.
Our business is directly affected by market conditions in the highly cyclical semiconductor industry, which is currently experiencing a severe downturn. The semiconductor industry has been adversely affected by many factors, including the current global downturn, ongoing efforts by our failurecustomers to forecast any change in suchreduce their spending, diminished product demand, increased inventory levels, lower average selling prices, uncertainty regarding long-term growth rates and underlying financial health and increased competition. These factors, could, among other things, limit our ability to maintain or increase our sales or recognize revenue and in turn adversely affect our gross margin.We continue to pursue measures in an effort to improvebusiness, operating results and financial condition. If our gross margin. Our gross margin for any period depends on a number of factors, including the mix of our products sold, average selling prices, introduction of new products, sales discounts, unexpected pricing actions by our competitors, the cost of product components, and the yield of wafers produced by the foundries that manufacture our products. If we incorrectly forecast the impact of the aforementioned factors on our business, we may be unable to take action in time to counteract any negative impact on our gross margin. In addition, if we are unable to meet our gross margin target for any period or the target set by analysts, the trading price of our common stock may decline.
Our failure to estimate customer demand properly may result in excess or obsolete inventory or, conversely, may result in inadequate inventory levels, either of which could adversely affect our financial results.
Our inventory purchases are based upon future demand forecasts, which may not accurately predict the quantity or type of our products that our customers will want in the future. In forecasting demand, we must make multiple assumptions any of which may prove to be incorrect. Situations that may result in excess or obsolete inventory, which could result in write-downs of the value of our inventory and/or a forced reduction in average selling prices, and where our gross margin could be adversely affected include:
if there were a sudden and significant decrease in demand for our products;
if there were a higher incidence of inventory obsolescence because of rapidly changing technology and customer requirements;
if we fail to estimate customer demand properly for our older products as our newer products are introduced; or
if our competition were to take unexpected competitive pricing actions.
Conversely, if we underestimate our customers’ demand for either our older or newer products, we may have inadequate manufacturing capability and may not be able to obtain sufficient inventory to fill our customers’ orders on a timely basis, which could affect our revenue results. Even if we are able to increase production levels to meet customer demand, we may not be able to do so in a cost effective manner. Inability to fill our customers' orders on a timely basis could damage our customer relationships, result in lost revenue, cause a loss in market share or damage our reputation.
Because we order materials in advance of anticipated customer demand our ability to reduce our inventory purchase commitments quickly in responseoperating expenses to anysufficiently offset these factors during this downturn are unsuccessful, our operating results will suffer.
Our revenue shortfalls is limited.Substantially allmay fluctuate while our operating expenses are relatively fixed, which makes our results difficult to predict and could cause our results to fall short of our sales are made on the basis of purchase orders rather than long-term agreements. As a result, we may commit resources to the production of products without having received advance purchase commitments from customers. Any inability to sell products to which we have devoted significant resources could harm our business. In addition, cancellation or deferral of product orders could result in our holding excess inventory, which could adversely affect our gross margin and restrict our ability to fund operations. We may build inventories during periods of anticipated growth. Additionally, because we often sell a substantial portion of our products in the last month of each quarter and, therefore, we recognize a substantial portionexpectations.
Demand for many of our revenue in the last month of each quarter, we may not be ablecomponents fluctuate and are difficult to reduce our inventory purchase commitments in a timely manner in response to any revenue shortfalls. We could be subject to excess or obsolete inventories and be required to take corresponding inventory write-downs if growth slows or if we incorrectly forecast product demand, which could negatively impact our gross margin and financial results.We are dependent on key personnel and the loss of these employees could negatively impact our business.
Our performance is substantially dependent on the performance of our executive officers and key employees. None of our executive officers or employees is bound by an employment agreement, meaning our relationships with our executive officers and employees are at will. We do not have “key person” life insurance policies on any of our employees. The loss of the services of any of our executive officers, technical personnel or other key employees, particularly Jen-Hsun Huang, our President and Chief Executive Officer, would harm our business. Our success will depend on our ability to identify, hire, train and retain highly qualified technical and managerial personnel. Our failure to attract and retain the necessary technical and managerial personnel would harm our business. The integration of new executives or personnel could disrupt our ongoing operations.
Failure to achieve expected manufacturing yields for existing and/or new products would reduce our gross margin and could adversely affect our ability to compete effectively.
Semiconductor manufacturing yields are a function both of product design, which is developed largely by us, and process technology, which typically is proprietary to the manufacturer. Since low yields may result from either design or process technology failures, yield problems may not be effectively determined or resolved until an actual product exists that can be analyzed and tested to identify process sensitivities relating to the design rules that are used. As a result, yield problems may not be identified until well into the production process. Resolution of yield problems requires cooperation by and communication between us and the manufacturer.
Because of our potentially limited access to wafer fabrication capacity from our manufacturers, any decrease in manufacturing yields could result in an increase in our per unit costs and force us to allocate our available product supply among our customers. This could potentially harm customer relationships, our reputation, our revenuepredict, and our gross profit. Our wafer manufacturers may be unable to achieve or maintain acceptable manufacturing yields in the future. Our inability to achieve planned yields from our wafer manufacturers would reduce our gross margin. We also face the risk of product recalls or product returns resulting from design or manufacturing defects that are not discovered during the manufacturing and testing process. A significant number of product returns due to a defect or recall could damage our reputation and result in our customers working with our competitors.
To stay competitive, we may have to invest more resources in research and development than anticipated, which could increase our operating expenses and negatively impact our operating results.
If new competitors, technological advances by existing competitors or other competitive factors require us to invest significantly greater resources than anticipated in research and development efforts, our operating expenses would increase. We have substantially increased our engineering and technical resources and have 1,654 full-time employees engaged in research and development as of January 29, 2006, 1,231 employees as of January 30, 2005 and 1,057 employees as of January 25, 2004. Research and development expenditures were $357.1 million, $348.2 million, and $292.2 million for fiscal 2006, 2005 and 2004, respectively. If we are required to invest significantly greater
resources than anticipated in research and development efforts without an increase in revenue, our operating results would decline. In order to remain competitive, we anticipate that we will continue to devote substantial resources to research and development, and we expect these expenses to increase in absolute dollars in the foreseeable future due to the increased complexity and the greater number of products under development as well as hiring additional employees. Research and development expenses are likely to fluctuate from time to time to the extent we make periodic incremental investments in research and development and these investments may be independent of our level of revenue.
Our operating expenses are relatively fixed and we may have limited abilitylargely independent of revenue. Therefore, it is difficult for us to reduce operating expenses quicklyaccurately forecast revenue and profits or losses in response to any revenue shortfalls.
particular period. Our operating expenses, which are comprised of research and development expenses, and sales, general and administrative expenses and restructuring and other charges, represented 24.1%36%, 25% and 27.5%28% of our total revenue duringfor fiscal 2006years 2009, 2008 and 2005,2007, respectively. Operating expenses included litigation settlement costs of $14.2 million in fiscal 2006. Since we often recognize a substantial portion of our revenue in the last month of each quarter, we may not be able to adjust our operating expenses in a timely manner in response to any unanticipated revenue shortfalls.shortfalls in any quarter as was the case in the fourth quarter of fiscal year 2009. Our operating expenses, which are comprised of research and development expenses and sales, general and administrative expenses and restructuring and other charges, represented 66% of our total revenue for the fourth quarter of fiscal year 2009. Further, some of our operating expenses, like stock-based compensation expense can only be adjusted over a longer period of time and cannot be reduced during a quarter. If we are unable to reduce operating expenses quickly in response to any revenue shortfalls, our financial results wouldwill be negatively impacted.
Failure
In September 2008, we announced a workforce reduction to
transition to new manufacturing process technologies could adversely affect our operating results and gross margin.Our strategy is to utilize the most advanced manufacturing process technology appropriateallow for our products and available from commercial third-party foundries. Use of advanced processes may have greater risk of initial yield problems and higher product cost. Manufacturing process technologies are subject to rapid change and require significant expenditures for research and development. We continuously evaluate the benefits of migrating to smaller geometry process technologiescontinued investment in order to improve performance and reduce costs. We currently use 0.15 micron, 0.14 micron, 0.13 micron, 0.11 micron, and 90 nanometer process technologies for our families of GPUs, MCPs and Handheld GPUs.
We have experienced difficulty in migrating to new manufacturing processesstrategic growth areas, which was completed in the past and, consequently, have suffered reduced yields, delays in product deliveries and increased expense levels. We may face similar difficulties, delays and expenses asthird quarter of fiscal year 2009. As a result, we continue to transition our products to smaller geometry processes. Moreover, we are dependent on our relationships with our third-party manufacturers to migrate to smaller geometry processes successfully. The inability by useliminated approximately 360 positions worldwide, or our third-party manufacturers to effectively and efficiently transition to new manufacturing process technologies may adversely affect our operating results and our gross margin.
Our operating results are unpredictable and may fluctuate, and if our operating results are below the expectations of securities analysts or investors, the trading priceabout 6.5% of our stock could decline.
Manyglobal workforce. During fiscal year 2009, expenses associated with the workforce reduction, which were comprised primarily of our revenue components fluctuateseverance and benefits payments to these employees, totaled $8.0 million. We anticipate that the expected decrease in operating expenses from this action will be offset by continued investment in strategic growth areas. In addition, in response to the current economic environment, we have commenced several cost reduction measures which are difficultdesigned to predict, andreduce our operating expenses are largely independent of revenue in any particular period. It is, therefore, difficult for usand will continue to accurately forecast revenue and profits or losses. As a result, it is possible that in some quartersfocus on reducing our operating results could be belowexpenses during fiscal year 2010. Please refer to the expectationsdiscussion in Note 19 to the Notes to the Consolidated Financial Statements in Part IV, Item 15 of securities analysts or investors, which could causethis Form 10-K for the trading pricepotential impact of our common stock to decline, perhaps substantially. We believe that our quarterly and annual resultsthe tender offer on operating expenses during the first quarter of operations may continue to be affected by a variety of factors that could harm our revenue, gross profit and results of operations.
fiscal year 2010.
Any one or more of the factorsrisks discussed in this Annual Report on Form 10-K/A10-K or other factors could prevent us from achieving our expected future revenue or net income. Accordingly, we believe that period-to-period comparisons of our results of operations should not be relied upon as an indication of future performance. In addition,Similarly, the results of any quarterly or full fiscal year period are not necessarily indicative of results to be expected for a subsequent quarter or a full fiscal year.Risks Related As a result, it is possible that in some quarters our operating results could be below the expectations of securities analysts or investors, which could cause the trading price of our common stock to decline. We believe that our quarterly and annual results of operations may continue to be affected by a variety of factors that could harm our revenue, gross profit and results of operations.
Our ProductsIf we are unablefailure to achieve design wins,estimate customer demand properly could adversely affect our financial results.
We manufacture our products based on forecasts of customer demand in order to have shorter shipment lead times and quicker delivery schedules for our customers. As a result, we may build inventories for anticipated periods of growth which do not occur or may build inventory anticipating demand for a product that does not materialize. The current negative worldwide economic conditions and market instability makes it increasingly difficult for us, our customers and our suppliers to accurately forecast future product demand trends. In forecasting demand, we make multiple assumptions any of which may prove to be incorrect. Situations that may result in excess or obsolete inventory include:
| · | if there were a sudden and significant decrease in demand for our products; |
| · | if there were a higher incidence of inventory obsolescence because of rapidly changing technology and customer requirements; |
| · | if we fail to estimate customer demand properly for our older products as our newer products are introduced; or |
| · | if our competition were to take unexpected competitive pricing actions. |
adopted byable to reduce our target marketsinventory purchase commitments in a timely manner in response to customer cancellations or deferrals. We could be subject to excess or obsolete inventories and customers either ofbe required to take corresponding inventory write-downs and/or a reduction in average selling prices if growth slows or does not materialize, or if we incorrectly forecast product demand, which could negatively impact our financial results.The future success of
Conversely, if we underestimate our business depends to a significant extent on our ability to develop new competitive productscustomers’ demand for our target markets and customers. We believe achieving design wins, which entails havingproducts, our existing and future products chosen for hardware components or subassemblies designed by PC OEMs, ODMs, and add-in board and motherboard manufacturers, will aid our future success. Our OEM, ODM, and add-in board and motherboard manufacturers’ customers typically introduce new system configurations as often as twice per year, typically based on spring and fall design cycles. Accordingly, when our customers are making their design decisions, our existing products must have competitive performance levels or we must timely introduce new products in order to be included in new system configurations. This requires that we do the following:anticipate the features and functionality that customers and consumers will demand;
incorporate those features and functionalities into products that meet the exacting design requirements of OEMs, ODMs, and add-in board and motherboard manufacturers;
price our products competitively; and
introduce products to the market within the limited design cycle for OEMs, ODMs, and add-in board and motherboard manufacturers.
If OEMs, ODMs, and add-in board and motherboard manufacturers do not include our products in their systems, they will typically not use our products in their design systems until at least the next design configuration. Therefore, we endeavor to develop close relationships with our OEMs and ODMs in an attempt to allow us to better anticipate and address customer needs in new products so that our products will achieve design wins.
Our ability to achieve design wins also depends in part on our ability to identify and ensure compliance with evolving industry standards. Unanticipated changes in industry standards could render our products incompatible with products developed by major hardware manufacturers and software developers, including AMD, Intel and Microsoft. Such changes would require us to invest significant time and resources to redesign our products to ensure compliance with relevant standards. If our products are not in compliance with prevailing industry standards for a significant period of time, our ability to achieve design wins could suffer. If we are unable to achieve new design wins for existing or new customers, we may lose market share and our operating results would be negatively impacted.
Achievement of design winsthird party manufacturing partners may not result in the success of our products and could result in a loss of market share.
The process of being qualifiedhave adequate lead-time or capacity to increase production for inclusion in an OEM product can be lengthy and could cause us to miss a cycle in the demand of end users for a particular product feature, which also could result in a loss of market share and harm our business. Even if we do have design wins for OEM and ODM products,meaning that we may not be able to successfully develop or introduce new products inobtain sufficient volumes within the appropriate timeinventory to fill our customers’ orders on a timely basis. Even if we are able to increase production levels to meet both the OEM, ODM, add-in board and motherboard manufacturers’ design cycles as well as other market demand. Additionally, even if we achieve a significant number of design wins, there can be no assurance that our OEM and ODM customers will actually take the design to production or that the design will be commercially successful. Furthermore, there may be changes in the timing of product orders due to unexpected delays in the introduction of our customers’ products that could negatively impact the success of our products. Any of these factors could result in a loss of market share and could negatively impact our financial results.
Our business results could be adversely affected if our product development efforts are unsuccessful.
We have in the past experienced delays in the development of some new products. Any delay in the future or failure of our GPUs or other processors to meet or exceed specifications of competitive products could materially harm our business. The success of our new product introductions will depend on many factors, including the following:
proper new product definition;
timely completion and introduction of new product designs;
the ability of third-party manufacturers to effectively manufacture our new products in a timely manner;
dependence on third-party subcontractors for assembly, testing and packaging of our products and in meeting product delivery schedules and maintaining product quality;
the quality of any new products;
differentiation of new products from those of our competitors;
market acceptance of our products and our customers' products; and
availability of adequate quantity and configurations of various types of memory products.
A critical component of our product development effort is our partnerships with leaders in the computer aided design, or CAD, industry. We have invested significant resources to develop relationships with industry leaders, including Cadence Design Systems, Inc. and Synopsys, Inc., often assisting these companies in the product definition of their new products. We believe that forming these relationships and utilizing next-generation development tools to design, simulate and verify our products will help us remain at the forefront of the 3D graphics, communications and networking segments and develop products that utilize leading-edge technology on a rapid basis. We believe this approach assists us in meeting the new design schedules of PC OEMs and other manufacturers. If these relationships are not successful,customer demand, we may not be able to develop new productsdo so in a cost effective or timely manner,manner. Inability to fulfill our customers’ orders on a timely basis, or at all, could damage our customer relationships, result in lost revenue, cause a loss in market share, impact our customer relationships or damage our reputation, any of which could resultadversely impact our business.
Because our gross margin for any period depends on a number of factors, our failure to forecast changes in any of these factors could adversely affect our gross margin.
We are focused on improving our gross margin. Our gross margin for any period depends on a lossnumber of factors, including:
| · | the mix of our products sold; |
| · | average selling prices; |
| · | introduction of new products; |
| · | unexpected pricing actions by our competitors; |
| · | the cost of product components; and |
| · | the yield of wafers produced by the foundries that manufacture our products. |
During the fourth quarter of fiscal year 2009, our gross margin declined to 29.4% as compared to 45.7% during the fourth quarter of fiscal year 2008 and decreased from 41.0% from the third quarter of fiscal year 2009. If we do not correctly forecast the impact of any of the relevant factors on our business, there may not be any actions we can take or we may not be able to take any possible actions in time to counteract any negative impact on our gross margin. Additionally, during fiscal year 2009, the revenue and gross margins from our sale of desktop products decreased primarily due to a decline in the Standalone Desktop market segment as reported in the December 2008 PC Graphics Report from Mercury Research. This decline was driven by a combination of market share, a decreasemigration from desktop PCs towards notebook PCs and an overall market shift in revenuethe mix of products towards lower priced products. If the overall shift in the demand from the consumer continues to shift towards lower priced products, it will have an adverse impact on our gross margin. In addition, if we are unable to meet our gross margin target for any period or the target set by analysts, the trading price of our common stock may decline.
We are dependent on the personal computer market and its rate of growth in the future may have a negative impact on our operating results. Our failure to successfully develop, introduce or achieve market acceptance for new processors would harm our business. Our failure to identify new market or product opportunities or develop new products could harm our business.As our GPUs or other processors develop and competition increases, we anticipate that product life cycles at the high end will remain short and average selling prices will decline. In particular, we expect average selling prices and gross margins for our processors to decline as each product matures and as unit volume increases. As a result, we will need to introduce new products and enhancements to existing products to maintain or improve overall average selling prices and gross margins. In order for our processors to achieve high volumes, leading PC OEMs, ODMs, and add-in board and motherboard manufacturers must select our processor for design into their products, and then successfully complete the designs of their products and sell them. We may be unable to successfully identify new product opportunities or to developderive and bring to market new products in a timely fashion. In addition, we cannot guarantee that new products we develop will be selected for design into PC OEMs’, ODMs’, and add-in board and motherboard manufacturers’ products, that any new designs will be successfully completed or that any new products will be sold.
As the complexity of our products and the manufacturing process for our products increases, there is an increasing risk that we will experience problems with the performance of our products and that there will be delays in the development, introduction or volume shipment of our products. We may experience difficulties related to the production of current or future products or other factors that may delay the introduction or volume sale of new products we develop. In addition, we may be unable to successfully manage the production transition risks with respect to future products. Failure to achieve any of the foregoing with respect to future products or product enhancements could result in rapidly declining average selling prices, reduced margins and reduced demand for products or loss of market share. In addition, technologies developed by others may render our processors non-competitive or obsolete or result in our holding excess inventory, any of which would harm our business.
We could suffer a loss of market share if our products contain significant defects.
Products as complex as those we offer may contain defects or experience failures when introduced or when new versions or enhancements to existing products are released. We have in the past discovered defects and incompatibilities with customers’ hardware in some of our products and may experience delays or loss of revenue to correct any defects or incompatibilities in the future. Errors in new products or releases after commencement of
commercial shipments could result in failure to achieve market acceptance or loss of design wins. Our products typically go through only one verification cycle prior to beginning volume production and distribution. As a result, our products may contain defects or flaws that are undetected prior to volume production and distribution. If these defects or flaws exist and are not detected prior to volume production and distribution, we may be required to reimburse customers for costs to repair or replace the affected products in the field. We may also be required to incur additional research and development costs to find and correct the defect, which could divert the attention of our management and engineers from the development of new products. These costs could be significant and could adversely affect our business and operating results. We may also suffer a loss of reputation and/or a loss in our market share, either of which could materially harm our financial results.
Risks | Related to Our Partners and Customers |
There can be no assurance that the PlayStation3 will achieve long term commercial success.
In April 2005, we finalized our definitive agreement with SCE to jointly develop a custom GPU incorporating our next-generation GeForce GPU and SCE’s system solutions in SCE’s PlayStation3. Our collaboration with SCE includes license fees and royalties for the PlayStation3 and all derivatives, including next-generation digital consumer electronics devices. In addition, we are licensing software development tools for creating shaders and advanced graphics capabilities to SCE. During fiscal 2006, we recognized $49.0 million of revenue from our contractual arrangements with SCE to jointly develop a custom GPU incorporating our next-generation GeForce GPU and SCE’s system solutions in SCE’s PlayStation3. Depending on the ultimate success of this next-generation platform, we expect to generate, starting in fiscal 2007, revenue ranging from $50 millioncontinue to $100 million annually from license fees and royalties over the next five years, with the possibility of additional royalties for several years thereafter. There can be no assurance that the PlayStation3 will achieve long term commercial success, given the intense competition in the game console market. Additionally, we do not have control over the launch date or pricing of the Playstation3. As such, we do not have control over when we will receive royalties. If we do not receive royalties as we anticipate, our revenue and gross margin may be adversely affected.
We may not be able to realize the potential financial or strategic benefits of business acquisitions, which could hurt our ability to grow our business, develop new products or sell our products.
In the past we have acquired and invested in other businesses that offered products, services and technologies that we believed would help expand or enhance our products and services or help expand our distribution channels. We may enter into future acquisitions of, or investments in, businesses, in order to complement or expand our current businesses or enter into a new business market. For example, in February 2006 we completed the acquisition of ULi Electronics, Inc., or ULi, a leading developer of core logic technology, for approximately $53 million paid in cash. If we do consider an acquisition, strategic alliance or joint venture, the negotiations could divert management’s attention as well as other resources. For any previous or future acquisition or investment, including ULi, the following risks could impair our ability to grow our business and develop new products, and ultimately, could impair our ability to sell our products, which could negatively impact our growth or our financial results:
difficulty in combining the technology, products, operations or workforce of the acquired business with our business;
disruption of our ongoing businesses:
difficulty in realizing the potential financial or strategic benefits of the transaction;
diversion of management’s attention from our business;
difficulty in maintaining uniform standards, controls, procedures and policies;
disruption of or delays in ongoing research and development efforts;
diversion of capital and other resources;
assumption of liabilities;
diversion of resources and unanticipated expenses resulting from litigation arising from potential or actual business acquisitions or investments;
difficulties in entering into new markets in which we have limited or no experience and where competitors in such markets have stronger positions; and
impairment of relationships with employees and customers, or the loss of any of our key employees or of our target’s key employees, as a result of the integration of new businesses and management personnel.
In addition, the consideration for any future acquisition could be paid in cash, shares of our common stock, the issuance of convertible debt securities or a combination of cash, convertible debt and common stock. If we pay all or a portion of the purchase price in cash, our cash reserves would be reduced. If the consideration is paid with shares of our common stock, or convertible debentures, the holdings of our existing stockholders would be diluted. We cannot forecast the number, timing or size of future acquisitions, or the effect that any such acquisitions might have on our operations or financial results.
We sell our products to a small number of customers and our business could suffer by the loss of any of these customers.
We have only a limited number of customers and our sales are highly concentrated. Sales to our two largest customers accounted for approximately 26%, 31%, and 36% of our revenue during fiscal 2006, 2005 and 2004, respectively. During the first quarter of fiscal 2006, Microsoft indicated that it would not order any more Xbox-related products from us after our second fiscal quarter. As a result, the second quarter of fiscal 2006 was the last quarter during which we recognized revenue from the sale of our Xbox-related products to Microsoft. Although a small number of our other customers representsderive the majority of our revenue their end customers includefrom the sale or license of products for use in the desktop personal computer, or PC, and notebook PC markets, including professional workstations. A reduction in sales of PCs, or a reduction in the growth rate of PC sales, may reduce demand for our products. These changes in demand could be large numberand sudden. During fiscal year 2009, sales of OEMs and system integrators throughoutour desktop GPU products decreased by approximately 29% compared to fiscal year 2008. These decreases were primarily due to the world who,Standalone Desktop GPU market segment decline as reported in many cases, specify the graphics supplier. Our sales process involves achieving key design winsPC Graphics December 2008 Report from Mercury Research. Since PC manufacturers often build inventories during periods of anticipated growth, they may be left with leading PC OEMs and major system builders and supporting the product design into high volume production with key CEMs, ODMs, motherboard and add-in board manufacturers. These design wins in turn influence the retail and system builder channel that is serviced by CEMs, ODMs, motherboard and add-in board manufacturers. Our distribution strategy is to work with a small number of leading independent CEMs, ODMs, motherboard manufacturers, add-in board manufacturers and distributors, each of which has relationships with a broad range of system builders and leading PC OEMs. If we were to lose sales to our PC OEMs, CEMs, ODMs, motherboard and add-in board manufacturers and were unable to replace the lost sales with sales to different customers,excess inventories if growth slows or if they were to significantly reduce the numberincorrectly forecast product transitions. In these cases, PC manufacturers may abruptly suspend substantially all purchases of products they orderadditional inventory from suppliers like us our revenue may not reach or exceed the expected level in any period,until their excess inventory has been absorbed, which could harmwould have a negative impact on our financial condition and our results of operations.
results.
We depend on foundries and independent contractors to manufacture our products and these third parties may not be able to satisfy our manufacturing requirements, which would harm our business.We do not manufacture the semiconductor wafers used for our products and do not own or operate a wafer fabrication facility. Our products require wafers manufactured with state-of-the-art fabrication equipment and techniques. We utilize industry-leading suppliers, such as Chartered, SMIC, TSMC, and UMC to produce our semiconductor wafers and utilize independent subcontractors to perform assembly, testing and packaging. We depend on these suppliers to allocate to us a portion of their manufacturing capacity sufficient to meet our needs, to produce products of acceptable quality and at acceptable manufacturing yields, and to deliver those products to us on a timely basis at acceptable prices. These manufacturers may be unable to meet our near-term or long-term manufacturing or pricing requirements. We obtain manufacturing services on a purchase order basis. The foundries we use have no obligation to provide us with any specified minimum quantities of product. Suppliers, such as Chartered, SMIC, TSMC, and UMC, fabricate wafers for other companies, including some of our competitors, and could choose to prioritize capacity for other users, reduce or eliminate deliveries to us, or increase the prices that they charge us on short notice. If we are unable to meet customer demand due to reduced or eliminated deliveries, we could lose sales to customers, which would negatively impact our revenue and our reputation. Becausecompete in the lead-time needed to establish a strategic relationship with a new manufacturing partner could be several quarters, there is no readily available alternative source of supply for any specific product. In addition, the time and effort to qualify a new foundry could result in additional expense, diversion of resources or lost sales any of which would negatively impact our financial results. We believe that long-term market acceptancemarkets for our products, will depend on reliable relationships with third-party manufacturers we may use to ensure adequate product supply and competitive pricing so that we are able to respond to customer demand.
We are dependent on third parties located outside of the United States for assembly, testing and packaging of our products, which reduces our control over the delivery and quantity of our products.
Our processors are assembled and tested by independent subcontractors, such as ASE, Amkor Technology Inc., KYEC, SPIL, and STATS ChipPAC Incorporated, all of which are located outside of the United States. We do not have long-term agreements with any of these subcontractors. As a result of our dependence on third-party subcontractors for assembly, testing and packaging of our products, we do not directly control product delivery schedules or product quality. Demand for qualified independent subcontractors to assemble and test products is high. If demand for these subcontractors exceeds the number of qualified subcontractors, we may experience capacity constraints, which could result in product shortages, a decrease in the quality of our products or an increase in product cost. Any of our subcontractors may decide to prioritize the orders of one of our competitors over our orders. Any product shortages, quality assurance problems or political instability outside of the United States could increase the costs of manufacture, assembly or testing of our products, which could cause our gross margin to decline. Due to the amount of time typically required to qualify assemblers and testers, we could experience significant delays in the shipment of our products if we are required to find alternative third parties to assemble or test our products or components. Any such delays could result in a loss of reputation or a decrease in sales to our customers.
We rely on third-party vendors to supply software development tools to us for the development of our new products and we may be unable to obtain the tools necessary to develop these products.
In the design and development of new products and product enhancements, we rely on third-party software development tools. While we currently are not dependent on any one vendor for the supply of these tools, some or all of these tools may not be readily available in the future. For example, we have experienced delays in the introduction of products in the past as a result of the inability of then available software development tools to fully simulate the complex features and functionalities of our products. The design requirements necessary to meet consumer demands for more features and greater functionality from processors in the future may exceed the capabilities of the software development tools that are available to us. If the software development tools we use become unavailable or fail to produce designs that meet consumer demands, our business could suffer.
Difficulties in collecting accounts receivable could result in significant charges against income and the deferral of revenue recognition from sales to affected customers, which could harm our operating results and financial condition.
Our accounts receivable are highly concentrated and make us vulnerable to adverse changes in our customers' businesses and to downturns in the economy and the industry. In addition, difficulties in collecting accounts receivable or the loss of any significant customer could materially and adversely affect our financial condition and results of operations. We continue to work directly with more foreign customers and it maycould be difficult to collect accounts receivable from them. We maintain an allowance for doubtful accounts for estimated losses resulting from the inability of our customers to make required payments. This allowance consists of an amount identified for specific customers and an amount based on overall estimated exposure. In addition, we purchase credit insurance on selected customers’ accounts receivable balances in an effort to further mitigate our exposure for such losses. If the financial condition of our customers were to deteriorate, resulting in an impairment of their ability to make payments, additional allowances may be required, we may be required to defer revenue recognition on sales to affected customers and we may be required to pay higher credit insurance premiums, which could adversely affect our operating results. We may have to record additional reserves or write-offs and/or defer revenue on certain sales transactions in the future, which could negatively impact our financial results.
impacted.
Risks Related to Our CompetitionThe market for GPU, MCP, and Handheld GPUs is highly competitive and we may be unable to compete.
The market for GPUs, MCPs, and Handheld GPUscomputer-on-a-chip products that support netbooks, PNDs, PMPs, PDAs, cellular phones or other handheld devices is intensely competitive and is characterized by rapid technological change, new product introductions, evolving industry standards and declining average selling prices. We believe that the principal competitive factors in this market are performance, breadth of product offerings, access to customers and distribution channels, backward-forward software support, conformity to industry standard Application Programming Interface, or APIs, manufacturing capabilities, price of processors, and total system costs of add-in boards and motherboards.costs. We believe that our ability to remain competitive will depend on how well we are able to anticipate the features and functions that customers will demand and whether we are able to deliver consistent volumes of our products at acceptable levels of quality. We expect competition to increase from both from existing competitors and new market entrants with products that may be less costly than ours, or may provide better performance or additional features not provided by our products, whichproducts. In addition, it is possible that new competitors or alliances among competitors could harmemerge and acquire significant market share. We believe other factors impacting our business.
An additionalability to compete are:
| · | product bundling by competitors with multiple product lines; |
| · | breadth and frequency of product offerings; |
| · | access to customers and distribution channels; |
| · | backward-forward software support; |
| · | conformity to industry standard application programming interfaces; and |
| · | manufacturing capabilities. |
A significant source of competition is from companies that provide or intend to provide GPU, MCP, and Handheld GPU solutions.computer-on-a-chip products that support netbooks, PNDs, PMPs, PDAs, cellular phones or other handheld devices. Some of our competitors may have or be able to obtain greater marketing, financial, distribution and manufacturing resources than we do and may be more able to adapt to customer or technological changes. Currently, Intel Corporation, or Intel, which has greater resources than we do, is working on a multi-core architecture code-named Larrabee, which may compete with our products in various markets. Intel may also release an enthusiast level discrete GPU based on the Larrabee architecture. Additionally, in fiscal year 2009, Intel also introduced the Intel Atom processor which is designed for lower cost PCs. Intel may also release a second generation of Atom chips by 2010 which is expected to have an improved battery life. The Intel Atom processor may compete with our products that support netbooks, PDAs, cellular phones and other handheld devices.
Our current competitors include the following: suppliers of discrete MCPs that incorporate a combination of networking, audio, communications and input/output, or I/O, functionality as part of their existing solutions, such as ATI Technologies, Inc., or ATI, Broadcom Corporation, or Broadcom, and Intel;
suppliers of GPUs, including MCPs that incorporate 3D graphics functionality as part of their existing solutions, such as ATI, Intel, Matrox Electronics Systems Ltd., Silicon Integrated Systems, Inc., VIA Technologies, Inc., and XGI Technology Inc.;| · | suppliers of discrete MCPs that incorporate a combination of networking, audio, communications and input/output, or I/O, functionality as part of their existing solutions, such as AMD, Broadcom Corporation, or Broadcom, Silicon Integrated Systems, Inc., or SIS, VIA Technologies, Inc., or VIA, and Intel; |
suppliers of GPUs or GPU intellectual property for handheld and embedded devices that incorporate advanced graphics functionality as part of their existing solutions, such as ATI, Bitboys, Broadcom, Fujitsu Limited, Imagination Technologies Ltd., NEC Corporation, Qualcomm Incorporated, Renesas Technology Corp., Seiko-Epson, Texas Instruments Incorporated, and Toshiba America, Inc.| · | suppliers of GPUs, including MCPs that incorporate 3D graphics functionality as part of their existing solutions, such as AMD, Intel, Matrox Electronics Systems Ltd., SIS, and VIA; |
| · | suppliers of computer-on-a-chip products that support netbooks, PNDs, PMPs, PDAs, cellular phones or other handheld devices such as AMD, Broadcom, Fujitsu Limited, Imagination Technologies Ltd., ARM Holdings plc, Marvell Technology Group Ltd, or Marvell, NEC Corporation, Qualcomm Incorporated, Renesas Technology, Samsung, Seiko-Epson, Texas Instruments Incorporated, and Toshiba America, Inc.; and |
| · | suppliers of computer-on-a-chip products for handheld and embedded devices that incorporate multimedia processing as part of their existing solutions such as Broadcom, Texas Instruments Inc., Qualcomm Incorporated, Marvell, Freescale Semiconductor Inc., Renesas Technology, Samsung, and ST Microelectronics. |
If and to the extent we offer products outside of the consumer and enterprise PC, notebook, workstation, PDA, cellular phone, and video game consolein new markets, we may face competition from some of our existing competitors as well as from companies with which we currently do not compete. For example, in the case of our CPB, our Tegra and GoForce products primarily compete in architecture used in multimedia cellular phones and handheld devices. We believe that mobile devices like phones, music players, and portable navigation devices will increasingly become more consumer PC-like and be capable of delivering all the entertainment and web experiences in a handheld device. We cannot accurately predict if we will compete successfully in any of the new markets we may enter. If we are unable to compete in our current and anyor new markets, demand for our products could decrease which could cause our revenue to decline and our financial results willto suffer. Our GPU and MCP products are currently used with both Intel and AMD processors. In February 2009, Intel filed suit against us, related to a patent license agreement that we signed with Intel in 2004. Intel seeks an order from the court declaring that the license does not extend to a new Intel processor architecture and enjoining us from stating that we have licensing rights for this architecture. If Intel successfully obtains such a court order, we could be unable to sell our MCP products for use with these Intel processors and our competitive position would be harmed. In addition, in order to continue to sell MCP products for use with these Intel processors we could be required to negotiate a new license agreement with Intel and we may not be able to do so on reasonable terms, if at all.
As Intel continuesand AMD continue to pursue platform solutions, we may not be able to successfully compete.compete and our business would be negatively impacted. We expect substantial competition from both Intel’s publicized focus on moving toand AMD’s strategy of selling platform solutions, dominated by Intel products, such as whenthe success Intel achieved success with its Centrino platform solution. In addition to its current Centrino notebookAMD has also announced a platform initiative, and its announced upcoming desktop initiative branded as VIIV,solution. Additionally, we expect that Intel is now focused on developing and selling platform solutions for allAMD will extend this strategy to other segments, including professional workstationsthe possibility of successfully integrating a central processing unit, or CPU, and servers.a GPU on the same chip, as evidenced by AMD’s announcement of its Fusion processor project. If AMD and Intel continuescontinue to pursue these initiatives,platform solutions, we may not be able to successfully compete and our business would be negatively impacted.
If our products contain significant defects our financial results could be negatively impacted, our reputation could be damaged and we could lose market share.
Our products are complex and may contain defects or experience failures due to any number of issues in these segments.Risks Relateddesign, fabrication, packaging, materials and/or use within a system. If any of our products or technologies contains a defect, compatibility issue or other error, we may have to Market Conditionsinvest additional research and development efforts to find and correct the issue. Such efforts could divert our engineers’ attention from the development of new products and technologies and could increase our operating costs and reduce our gross margin. In addition, an error or defect in new products or releases or related software drivers after commencement of commercial shipments could result in failure to achieve market acceptance or loss of design wins. Also, we may be required to reimburse customers, including our customers’ costs to repair or replace products in the field. A product recall or a significant number of product returns could be expensive, damage our reputation, could result in the shifting of business to our competitors and could result in litigation against us. Costs associated with correcting defects, errors, bugs or other issues could be significant and could materially harm our financial results. For example, in July 2008, we recorded a $196.0 million charge against cost of revenue to cover anticipated customer warranty, repair, return, replacement and other associated costs arising from a weak die/packaging material set in certain versions of our previous generation media and communications processor, or MCP, and GPU products used in notebook systems. In September, October and November 2008, several putative class action lawsuits were filed against us, asserting various claims related to the impacted MCP and GPU products. Please refer to the risk entitled “We are subject to litigation arising from alleged defects in our previous generation MCP and GPU products, which if determined adversely to us, could harm our business”
for the risk associated with this litigation.
We are subject to risks associated with international operations which may harm our business.A significant portion of
We conduct our business worldwide. Our semiconductor wafers are manufactured, assembled, tested and packaged by third-parties located outside of the United States. Additionally, weWe generated 84%87%, 76%89% and 75%86% of our total revenue for fiscal years 2009, 2008 and 2007, respectively, from sales to customers outside of the United States and other Americas for fiscal 2006, 2005 and 2004, respectively.Americas. As of January 25, 2009, we had offices in fifteen countries outside of the United States. The manufacture, assembly, test and packaging of our products outside of the United States, and sales to thesecustomersoperation of offices outside of the United States, and other Americassales to customers internationally subjects us to a number of risks, associated with conducting business outside of the United States and other Americas, including, but not limited to:
including: international economic and political conditions;
unexpected changes in, or impositions of, legislative or regulatory requirements;
labor issues in foreign countries;
cultural differences in the conduct of business;
inadequate local infrastructure;
delays resulting from difficulty in obtaining export licenses for certain technology, tariffs, quotas and other trade barriers and restrictions;
transportation delays;
longer payment cycles;
difficulty in collecting accounts receivable;
fluctuations in currency exchange rates;
imposition of additional taxes and penalties;
different legal standards with respect to protection of intellectual property;
the burdens of complying with a variety of foreign laws; and
| · | •international economic and political conditions, such as political tensions between countries in which we do business; |
| · | ��unexpected changes in, or impositions of, legislative or regulatory requirements; |
| · | complying with a variety of foreign laws; |
| · | differing legal standards with respect to protection of intellectual property and employment practices; |
| · | cultural differences in the conduct of business; |
| · | inadequate local infrastructure that could result in business disruptions; |
| · | exporting or importing issues related to export or import restrictions, tariffs, quotas and other trade barriers and restrictions; |
| · | financial risks such as longer payment cycles, difficulty in collecting accounts receivable and fluctuations in currency exchange rates; |
| · | imposition of additional taxes and penalties; and |
| · | other factors beyond our control includingsuch as terrorism, civil unrest, war and diseases such as severe acute respiratory syndrome and the Avian flu. |
If sales to any of our customers outside of the United States and other Americas are delayed or cancelled because of any of the above factors, our revenue may be negatively impacted.We have offices outside of the United States, including offices
Our international operations in Taiwan, Japan, Korea,Australia, China, Finland, France, Germany, Hong Kong, India, France,Japan, Korea, Russia, GermanySingapore, Sweden, Switzerland, Taiwan, and England. During fiscal 2006, we substantially increased our international employee resources from 242 employees as of January 30, 2005 to 615 full-time employees as of January 29, 2006. On February 20, 2006, we completed the acquisition of ULi, a leading developer of core logic technology, which added approximately 200 employees to our international operations. Our operations in our international locationsUnited Kingdom are subject to many of the risks contained in the above list. We intend to continue to expand our international operations and to open other international offices.listed risks. Difficulties with our international operations, including finding appropriate staffing and office space, may divert management’s attention and other resources any of which could negatively impact our operating results.Currently, all
The economic conditions in our primary overseas markets, particularly in Asia, may negatively impact the demand for our products abroad. All of our arrangements with third-party manufacturers and subcontractors provide for pricing and paymentinternational sales to date have been denominated in United States dollars as are sales to our customers located outside of the United States and other Americas. Increasesdollars. Accordingly, an increase in the value of the United States’States dollar relative to otherforeign currencies wouldcould make our products more expensive, which would negativelyless competitive in international markets or require us to assume the risk of denominating certain sales in foreign currencies. We anticipate that these factors will impact our abilitybusiness to compete. Conversely, decreases in the value of the United States’ dollar relative to other currencies could result ina greater degree as we further expand our suppliers raising their prices in order to continue doinginternational business with us. To date, we have not engaged in any currency hedging activities, although we may do so in the future. Fluctuations in currency exchange rates could harm our business in the future.activities.
We are dependent on the PC market and the rate of its growth has and may in the future have a negative impact on our business.We derive the majority of our revenue from the sale of products for use in the desktop PC and notebook PC markets, including professional workstations. We expect to continue to derive most of our revenue from the sale or license of products for use in the desktop PC and notebook PC markets in the next several years. A reduction in sales of PCs, or a reduction in the growth rate of PC sales, will reduce demand for our products. Moreover, changes in demand could be large and sudden. Since PC manufacturers often build inventories during periods of anticipated growth, they may be left with excess inventories if growth slows or if they incorrectly forecast product transitions. In these cases, PC manufacturers may abruptly suspend substantially all purchases of additional inventory from suppliers like us until the excess inventory has been absorbed, which would have a negative impact on our business.
If our products do not continue to be acceptedadopted by the consumer and enterprisedesktop PC, notebook PC, workstation, high-performance computing, netbook, personal media player, or PMP, personal digital assistant, or PDA, cellular phone,handheld device, and video game console markets or if the demand in these markets for new and innovative products in these markets decreases, our business and operating results would suffer.
Our success depends in part upon continued broad adoption of our processors for 3D graphics and multimedia in consumer and enterprisedesktop PC, notebook PC, workstation, PDA,high-performance computing, netbooks, PMPs, PDAs, cellular phone,handheld devices, and video game console applications. The market for processors has been characterized by unpredictable and sometimes rapid shifts in the popularity of products, often caused by the publication of competitive industry benchmark results, changes in pricing of dynamic random-access memory devices and other changes in the total system cost of add-in boards, as well as by severe price competition and by frequent new technology and product introductions. Only a small number of products have achieved broadBroad market acceptance is difficult to achieve and such market acceptance, if achieved, is difficult to sustain due to intense competition and frequent new technology and product introductions. Since theOur GPU Business isand MCP businesses together comprised approximately 75%, 79% and 77% of our core business,revenue during fiscal years 2009, 2008 and 2007, respectively. As such, our financial results would suffer if for any reason our current or future GPUs or MCPs do not continue to achieve widespread acceptance inadoption by the PC market. If we are unable to complete the timely development of new products or if we were unable to successfully and cost-effectively manufacture and deliver products that meet the requirements of the consumer and enterprisedesktop PC, notebook PC, workstation, high-performance computing, netbook, PMP, PDA, cellular phone, and workstationvideo game console markets, we may experience a decrease in revenue which could negatively impact our operating results.
Additionally, there can be no assurance that the industry will continue to demand new products with improved standards, features or performance. If our customers, OEMs, ODMs, add-in-card and motherboard manufacturers, system builders and consumer electronics companies, do not continue to design products that require more advanced or efficient processors and/or the market dodoes not continue to demand new products with increased performance, features, functionality or standards, sales of our products could decline and the markets for our products could shrink. Decreased sales of our products for these markets could negatively impact our revenue and our financial results.
Our business results could be adversely affected if the identification and development of new products or entry into or development of a new market is delayed or unsuccessful.
In order to maintain or improve our financial results, we will need to continue to identify and develop new products as well as identify and enter new markets. As our GPUs and other processors develop and competition increases, we anticipate that product life cycles at the high end will remain short and average selling prices will decline. In particular, average selling prices and gross margins for our GPUs and other processors could decline as each product matures and as unit volume increases. As a result, we will need to introduce new products and enhancements to existing products to maintain or improve overall average selling prices, our gross margin and our financial results. We believe the success of our new product introductions will depend on many factors outlined elsewhere in these risk factors as well as the following:
| · | market demand for new products and enhancements to existing products; |
| · | timely completion and introduction of new product designs and new opportunities for existing products; |
| · | seamless transitions from an older product to a new product; |
| · | differentiation of our new products from those of our competitors; |
| · | delays in volume shipments of our products; |
| · | market acceptance of our products instead of our customers' products; and |
| · | availability of adequate quantity and configurations of various types of memory products. |
In the past, we have experienced delays in the development and adoption of new products and have been unable to successfully manage product transitions from older to newer products resulting in obsolete inventory.
To be successful, we must also enter new markets or develop new uses for our future or existing products. We cannot accurately predict if our current or existing products or technologies will be successful in the new opportunities or markets that we identify for them or that we will compete successfully in any new markets we may enter. For example, we have developed products and other technology in order for certain general-purpose computing operations to be performed on a GPU rather than a CPU. This general purpose computing, which is often referred to as GP computing, was a new use for the GPU which had been entirely used for graphics rendering. During fiscal year 2008, we introduced our NVIDIA Tesla family of products, which was our entry into the high-performance computing industry, a new market for us. We also offer our CUDA software development solution, which is a C language programming environment for GPUs, that allows parallel computing on the GPU by using standard C language to create programs that process large quantities of data in parallel. Some of our competitors, including Intel, are now developing their own solutions for the discrete graphics and computing markets. Our failure to comply with any applicable environmental regulationssuccessfully develop, introduce or achieve market acceptance for new GPUs, other products or other technologies or to enter into new markets or identify new uses for existing or future products, could result in a range of consequences, including fines, suspension of production, excess inventory, sales limitations, and criminal and civil liabilities.We may be subject to various state, federal and international laws and regulations governing the environment, including restricting the presence of certain substances in electronic products and making producers of those products financially responsiblerapidly declining average selling prices, reduced demand for the collection, treatment, recycling and disposal of those products. For example, the semiconductor industry is moving towards becoming compliant with the Restriction of Hazardous Substances Directive, or RoHS Directive, which will become effective in July 2006. The RoHS Directive is European legislation that restricts the use of a number of substances, including lead. Similarly, the State of California has adopted certain restrictions, which go into effect in 2007, that restrict the use of certain materials in electronic products, that are intended to harmonize with the RoHS directive and other states are contemplating similar legislation. China has promulgated use restrictions on the same substances as the RoHS directive, but has not yet defined either the scope of the affectedour products or an effective dateloss of market share any such restrictions.
Also, weof which could face significant costs and liabilities in connection with the Waste Electrical and Electronic Equipment Directive, or WEEE. The WEEE directs members of the European Union to enact laws, regulations, and administrative provisions to ensure that producers of electric and electronic equipment are financially responsible for the collection, recycling, treatment and environmentally responsible disposal of certain products sold into the market after August 15, 2005 and from products in use prior to that date that are being replaced. We continue to evaluate the impact of specific registration and compliance activities required by WEEE.
It is possible that unanticipated supply shortages, delays or excess non-compliant inventory may occur as a result of such regulations. Failure to comply with any applicable environmental regulations could result in a range of consequences including fines, suspension of production, excess inventory, sales limitations, and criminal and civil liabilities.
Hostilities involving the United States and/or terrorist attacks could harm our business.
The financial, political, economic and other uncertainties following the terrorist attacks on the United States in 2001 led to a weakening of the global economy. Similar terrorist acts and/or the threat of future outbreak or continued escalation of hostilities involving the United States and Iraq or other countries could adversely affect the growth rate ofcause our revenue, gross margin and have an adverse effect on our business,overall financial condition or results of operations. In addition, any escalation in these events or similar future events may disrupt our operations or those of our customers, distributors and suppliers, which could also adversely affect our business, financial condition or results of operations.
to suffer.
Our business is cyclical in nature and an industry downturn could harm our financial results.Our business is directly affected by market conditions in the highly cyclical semiconductor industry, including alternating periods of overcapacity and capacity constraints, variations in manufacturing costs and yields, significant expenditures for capital equipment and product development and rapid technological change. If we are unable to respondachieve design wins, our products may not be adopted by our target markets or customers either of which could negatively impact our financial results.
The success of our business depends to a significant extent on our ability to develop new competitive products for our target markets and customers. We believe achieving design wins, which entails having our existing and future products chosen for hardware components or subassemblies designed by OEMs, ODMs, add-in board and motherboard manufacturers, is an integral part of our future success. Our OEM, ODM, and add-in board and motherboard manufacturers’ customers typically introduce new system configurations as often as twice per year, typically based on spring and fall design cycles or in connection with trade shows. Accordingly, when our customers are making their design decisions, our existing products must have competitive performance levels or we must timely introduce new products in order to be included in our customers’ new system configurations. This requires that we:
| · | anticipate the features and functionality that customers and consumers will demand; |
| · | incorporate those features and functionalities into products that meet the exacting design requirements of our customers; |
| · | price our products competitively; and |
| · | introduce products to the market within our customers’ limited design cycles. |
Our ability to achieve design wins also depends in part on our ability to identify and be compliant with evolving industry standards. Unanticipated changes in industry standards could render our products incompatible with products developed by major hardware manufacturers and software developers like AMD, Intel and Microsoft Corporation, or Microsoft. If our products are not in compliance with prevailing industry standards, we may not be designed into our customers’ product designs. However, to be compliant with changes to industry standards, we may have to invest significant time and resources to redesign our products which cancould negatively impact our gross margin or operating results. If we are unable to achieve new design wins for existing or new customers, we may lose market share and our operating results would be unpredictablenegatively impacted.
We may have to invest more resources in research and rapid,development than anticipated, which could increase our operating expenses and negatively impact our operating results.
If new competitors, technological advances by existing competitors, our entry into new markets, or other competitive factors require us to invest significantly greater resources than anticipated in an efficientour research and timely manner,development efforts, our operating expenses would increase. We had 3,772 full-time employees engaged in research and development as of January 25, 2009, compared to 3,255 employees as of January 27, 2008 and 2,668 employees as of January 28, 2007, respectively. Research and development expenditures were $855.9 million, $691.6 million and $553.5 million, for fiscal years 2009, 2008 and 2007, respectively. Research and development expenses included stock-based compensation expense of $98.0 million, $76.6 million and $70.1 million for fiscal years 2009, 2008 and 2007, respectively. If we are required to invest significantly greater resources than anticipated in research and development efforts without a corresponding increase in revenue, our operating results could suffer. In particular,further decline. Research and development expenses are likely to fluctuate from time to time to the extent we make periodic incremental investments in research and development and these investments may be independent of our level of revenue which could negatively impact our financial results. In order to remain competitive, we anticipate that we will continue to devote substantial resources to research and development.
We are dependent on key employees and the loss of any of these employees could negatively impact our business.
Our future success and ability to compete is substantially dependent on our ability to identify, hire, train and retain highly qualified key personnel. The market for key employees in the semiconductor industry has experienced significant and sometimes prolonged downturns characterized by diminished product demand and accelerated erosion of average selling prices. If we cannot take appropriate actions such as reducing our manufacturing or operating costs to sufficiently offset declines in demand during a downturn, our revenue and earnings will suffer.Political instability in Taiwan and in The People’s Republic of China or elsewhere could harm our business.
Becausecan be competitive. None of our reliance on foundries and independent contractors located in Taiwan andkey employees is bound by an employment agreement, meaning our relationships with all of our key employees are at will. The People’s Republic of China, and because we have offices in these locations, our business may be harmed by political instability in Taiwan, including the worseningloss of the strained relations between The People’s Republicservices of China and Taiwan. Also if relations between the United States and The People’s Republic of China are strained due to foreign relations events. If any of our suppliers experienced a substantial disruptionother key employees without an adequate replacement or our inability to hire new employees as needed could delay our product development efforts, harm our ability to sell our products or otherwise negatively impact our business.
In September 2008, we reduced our global workforce by approximately 6.5% as part of our efforts to allow continued investment in their operations,strategic growth areas. This reduction in our workforce may impair our ability to recruit and retain qualified employees of our workforce as a result of a natural disaster, political unrest, economic instability, actsperceived risk of terrorismfuture workforce reductions. Employees, whether or war, equipment failurenot directly affected by the reduction, may also seek future employment with our business partners, customers or other cause, itcompetitors. In addition, we rely on stock-based awards as one means for recruiting, motivating and retaining highly skilled talent. If the value of such stock awards does not appreciate as measured by the performance of the price of our common stock or if our share-based compensation otherwise ceases to be viewed as a valuable benefit, our ability to attract, retain, and motivate employees could be weakened, which could harm our results of operations. The significant decline in the trading price of our common stock has resulted in the exercise price of a significant portion of our outstanding options to significantly exceed the current trading price of our common stock, thus lessening the effectiveness of these stock-based awards. We may not continue to successfully attract and retain key personnel which would harm our business. We may not be able to realize the potential financial or strategic benefits of business acquisitions or strategic investments, which could hurt our ability to grow our business, develop new products or sell our products.
We have acquired and invested in other businesses that offered products, services and technologies that we believe will help expand or enhance our existing products and business. We may enter into future acquisitions of, or investments in, businesses, in order to complement or expand our current businesses or enter into a new business market. Negotiations associated with an acquisition or strategic investment could divert management’s attention and other company resources. Any of the following risks associated with past or future acquisitions or investments could impair our ability to grow our business, develop new products, our ability to sell our products, and ultimately could have a negative impact on our growth or our financial results:
| · | difficulty in combining the technology, products, operations or workforce of the acquired business with our business; |
| · | difficulty in operating in a new or multiple new locations; |
| · | disruption of our ongoing businesses or the ongoing business of the company we invest in or acquire; |
| · | difficulty in realizing the potential financial or strategic benefits of the transaction; |
| · | difficulty in maintaining uniform standards, controls, procedures and policies; |
| · | disruption of or delays in ongoing research and development efforts; |
| · | diversion of capital and other resources; |
| · | assumption of liabilities; |
| · | diversion of resources and unanticipated expenses resulting from litigation arising from potential or actual business acquisitions or investments; |
| · | difficulties in entering into new markets in which we have limited or no experience and where competitors in such markets have stronger positions; and |
| · | impairment of relationships with employees and customers, or the loss of any of our key employees or customers our target’s key employees or customers, as a result of our acquisition or investment. |
We are exposed to credit risk, fluctuations in the market values of our portfolio investments and in interest rates.We invest in a variety of financial instruments, consisting principally of investments in commercial paper, money market funds and highly liquid debt securities of corporations, municipalities and the United States government and its agencies. These investments are denominated in United States dollars.
We account for our investment instruments in accordance with Statement of Financial Accounting Standards No. 115, or SFAS No. 115.115, Accounting for Certain Investments in Debt and Equity Securities. All of the cash equivalents and marketable securities are treated as “available-for-sale” under SFAS No. 115. Investments in both fixed rate and floating rate interest earning instruments carry a degree of interest rate risk. Fixed rate debt securities may have their market value adversely impacted due to a rise in interest rates, while floating rate securities may produce less income than expected if interest rates fall. Due in part to these factors, our future investment income may fall short of expectations due to changes in interest rates or if the decline in fair value of our publicly traded debt or equity investments is judged to be other-than-temporary. We may suffer losses in principal if we are forced to sell securities that decline in securities market value due to changes in interest rates. Future declines in the market values of our cash, cash equivalents and marketable securities could have a material adverse effect on our financial condition and operating results. However, because ourany debt securities we hold are classified as “available-for-sale,” no gains or losses are recognizedrealized in our Consolidated Statements of Operations due to changes in interest rates unless such securities are sold prior to maturity.maturity or unless declines in value are determined to be other-than-temporary.
At January 25, 2009 and January 27, 2008, we had $1.26 billion and $1.81 billion, respectively, in cash, cash equivalents and marketable securities. Given the global nature of our business, we have invested both domestically and internationally. All of our investments are denominated in United States dollars. We invest in a variety of financial instruments, consisting principally of cash and cash equivalents, asset-backed securities, commercial paper, mortgage-backed securities issued by Government-sponsored enterprises, equity securities, money market funds and debt securities of corporations, municipalities and the United States government and its agencies. As of January 25, 2009, we did not have any investments in auction-rate preferred securities. As of January 25, 2009, our investments in government agencies and government sponsored enterprises represented approximately 71% of our total investment portfolio, while the financial sector accounted for approximately 17% of our total investment portfolio.
The current volatility in the financial markets and overall economic uncertainty increases the risk that the actual amounts realized in the future on our financial instruments could differ significantly from the fair values currently assigned to them. Other income and expense could also vary materially from expectations depending on gains or losses realized on the sale or exchange of financial instruments; impairment charges related to debt securities as well as equity and other investments; interest rates; and cash, cash equivalent and marketable securities balances. For instance, we recorded other than temporary impairment charges of $9.9 million during fiscal year 2009. These charges include $5.6 million related to what we believe is an other than temporary impairment of our investment in the money market funds held by the Reserve International Liquidity Fund, Ltd., or International Reserve Fund; $2.5 million related to a decline in the value of publicly traded equity securities and $1.8 million related to debt securities held by us that were issued by companies that have filed for bankruptcy as of January 25, 2009. Please refer to Note 17 of these Notes to the Consolidated Financial Statements in Part IV, Item 15 of this Form 10-K for further details. Subsequent to year-end, on January 30, 2009, we received $84.4 million from the International Reserve Fund. This was our portion of a payout of approximately 65% of the total assets of the Fund. Each shareholder’s percentage of this distribution was determined by dividing the shareholder’s total unfunded redeemed shares by the aggregate unfunded redeemed shares of the Fund, which was then used to calculate the shareholder’s pro rata portion of this distribution. We expect to receive the proceeds of our remaining investment in the International Reserve Fund, excluding the $5.6 million that we have recorded as an other than temporary impairment, by no later than October 2009, when all of the underlying securities held by the International Reserve Fund are scheduled to have matured. However, redemptions from the International Reserve Fund are currently subject to pending litigation, which could cause further delay in receipt of our funds. In addition, we may determine that further impairment of our investment in the International Reserve Fund may be necessary.
Risks Related to Government Action, Regulatory Action, Intellectual Property,Our Partners and LitigationCustomers
We depend on foundries to manufacture our products and these third parties may not be able to satisfy our manufacturing requirements, which would harm our business. Expensing employee stock options We do not manufacture the silicon wafers used for our products and do not own or operate a wafer fabrication facility. Instead, we are dependent on industry-leading foundries, such as Taiwan Semiconductor Manufacturing Corporation, or TSMC, to manufacture our semiconductor wafers using their state-of-the-art fabrication equipment and techniques. The foundries, which have limited capacity, also manufacture products for other semiconductor companies, including some of our competitors. Since we do not have long-term commitment contracts with any of these foundries, they do not have an obligation to provide us with any minimum quantity of product at any time or at any set price, except as may be provided in future periodsa specific purchase order. Most of our products are only manufactured by one foundry at a time. In times of high demand, the foundries could choose to prioritize their capacity for other companies, reduce or eliminate deliveries to us, or increase the prices that they charge us. If we are unable to meet customer demand due to reduced or eliminated deliveries or have to increase the prices of our products, we could lose sales to customers, which would negatively impact our revenue and our reputation.
Because the lead-time needed to establish a strategic relationship with a new manufacturing partner could be several quarters, we do not have an alternative source of supply for our products. In addition, the time and effort to qualify a new foundry could result in additional expense, diversion of resources, or lost sales, any of which would negatively impact our financial results. We believe that long-term market acceptance for our products will materiallydepend on reliable relationships with the third-party manufacturers we use to ensure adequate product supply and aversely affectcompetitive pricing to respond to customer demand.
Failure to achieve expected manufacturing yields for our reported operatingproducts could negatively impact our financial results and damage our reputation.
Manufacturing yields for our products are a function of product design, which is developed largely by us, and process technology, which typically is proprietary to the manufacturer. Low yields may result from either product design or process technology failure. We do not know a yield problem exists until our design is manufactured. When a yield issue is identified, the product is analyzed and tested to determine the cause. As a result, yield problems may not be identified until well into the production process. Resolution of yield problems requires cooperation by, and communication between, us and the manufacturer. Because of our potentially limited access to wafer foundry capacity, decreases in manufacturing yields could result in an increase in our costs and force us to allocate our available product supply among our customers. Lower than expected yields could potentially harm customer relationships, our reputation and our financial results.
We are dependent on third parties for assembly, testing and packaging of our products, which reduces our control over the delivery schedule, product quantity or product quality.
Our products are assembled, tested and packaged by independent subcontractors, such as Advanced Semiconductor Engineering, Inc., Amkor Technology, JSI Logistics, Ltd., King Yuan Electronics Co., Siliconware Precision Industries Co. Ltd., and ChipPAC. As a result, we do not directly control our product delivery schedules, product quantity, or product quality. All of these subcontractors assemble, test and package products for other companies, including some of our competitors. Since we do not have long-term agreements with our subcontractors, when demand for subcontractors to assemble, test or package products is high, our subcontractors may decide to prioritize the orders of other customers over our orders. Since the time required to qualify a different subcontractor to assemble, test or package our products can be lengthy, if we have to find a replacement subcontractor we could experience significant delays in shipments of our products, product shortages, a decrease in the quality of our products, or an increase in product cost. Any product shortages or quality assurance problems could increase the costs of manufacture, assembly or testing of our products, which could cause our gross margin and revenue to decline.
Failure to transition to new manufacturing process technologies could adversely affect our competitive positionoperating results and gross margin.
We use the most advanced manufacturing process technology appropriate for our products that is available from our third-party foundries. As a result, we continuously evaluate the benefits of migrating our products to smaller geometry process technologies in order to improve performance and reduce costs. We believe this strategy will help us remain competitive. Our current product families are manufactured using 0.15 micron, 0.14 micron, 0.13 micron, 0.11 micron, 90 nanometer, 65 nanometer and 55 nanometer process technologies. Manufacturing process technologies are subject to rapid change and require significant expenditures for research and development, which could negatively impact our operating expenses and gross margin.
We have experienced difficulty in migrating to new manufacturing processes in the past and, consequently, have suffered reduced yields, delays in product deliveries and increased expense levels. We may face similar difficulties, delays and expenses as well.we continue to transition our new products to smaller geometry processes. Moreover, we are dependent on our third-party manufacturers to invest sufficient funds in new manufacturing techniques in order to have ample capacity for all of their customers and to develop the techniques in a timely manner. Our product cycles may also depend on our third-party manufacturers migrating to smaller geometry processes successfully and in time for us to meet our customer demands. Some of our competitors own their manufacturing facilities and may be able to move to a new state of the art manufacturing process more quickly or more successfully than our manufacturing partners. For example, Intel has released a 45 nanometer chip for desktop computers which it is manufacturing in its foundries. In addition, in October 2008, AMD and the Advanced Technology Investment Company, a technology investment company backed by the government of Abu Dhabi, announced the establishment of a U.S. headquartered semiconductor manufacturing company that will manufacture AMD’s advance processors. If our suppliers fall behind our competitors in manufacturing processes, the development and customer demand for our products and the use of our products could be negatively impacted. If we are forced to use larger geometric processes in manufacturing a product than our competition, our gross margin may be reduced. The inability by us or our third-party manufacturers to effectively and efficiently transition to new manufacturing process technologies may adversely affect our operating results and our gross margin. Since inception, We rely on third-party vendors to supply software development tools to us for the development of our new products and we may be unable to obtain the tools necessary to develop or enhance new or existing products.
We rely on third-party software development tools to assist us in the design, simulation and verification of new products or product enhancements. To bring new products or product enhancements to market in a timely manner, or at all, we need software development tools that are sophisticated enough or technologically advanced enough to complete our design, simulations and verifications. In the past, we have used stock optionsexperienced delays in the introduction of products as a result of the inability of then available software development tools to fully simulate the complex features and our employee stock purchase program as fundamental componentsfunctionalities of our compensation packages.products. In the future, the design requirements necessary to meet consumer demands for more features and greater functionality from our products may exceed the capabilities of available software development tools. Unavailability of software development tools may result in our missing design cycles or losing design wins, either of which could result in a loss of market share or negatively impact our operating results.
Because of the importance of software development tools to the development and enhancement of our products, a critical component of our product development efforts is our partnerships with leaders in the computer-aided design industry, including Cadence Design Systems, Inc. and Synopsys, Inc. We have invested significant resources to develop relationships with these industry leaders and have often assisted them in the definition of their new products. We believe that forming these incentives directly motivaterelationships and utilizing next-generation development tools to design, simulate and verify our employees and, throughproducts will help us remain at the use of vesting, encourage our employees to remain with us. As a result of adjustments arising from our restatement described in Note 2, “Restatement of Consolidated Financial Statements, Audit Committee and Company Findings”,forefront of the Notes3D graphics, communications and networking segments and develop products that utilize leading-edge technology on a rapid basis. If these relationships are not successful, we may be unable to develop new products or product enhancements in a timely manner, which could result in a loss of market share, a decrease in revenue or negatively impact our operating results.
We sell our products to a small number of customers and our business could suffer if we lose any of these customers.
We have a limited number of customers and our sales are highly concentrated. For fiscal years 2009, 2008 and 2007, aggregate sales to customers in excess of 10% of our total revenue accounted for approximately 11% of total revenue from one customer and approximately 10% and 12% of our total revenue from another customer, respectively. Although a small number of our other customers represent the majority of our revenue, their end customers include a large number of original equipment manufacturers, or OEMs, and system integrators throughout the world who, in many cases, specify the graphics supplier. Our sales process involves achieving key design wins with leading PC, OEMs and major system builders and supporting the product design into high volume production with key contract equipment manufacturers, or CEMs, original design manufacturers, or ODMs, add-in board and motherboard manufacturers. These design wins in turn influence the retail and system builder channel that is serviced by CEMs, ODMs, add-in board and motherboard manufacturers. Our distribution strategy is to work with a small number of leading independent CEMs, ODMs, add-in board and motherboard manufacturers, and distributors, each of which has relationships with a broad range of system builders and leading PC OEMs. If we were to lose sales to our Consolidated Financial Statements,PC OEMs, CEMs, ODMs, add-in board manufacturers and motherboard manufacturers and were unable to replace the lost sales with sales to different customers, if they were to significantly reduce the number of products they order from us, or if we were unable to collect accounts receivable from them, our revenue may not reach or exceed the expected level in any period, which could harm our financial condition and our results of operations.
Any difficulties in collecting accounts receivable, including from foreign customers, could harm our operating results contain recorded amountsand financial condition.
Our accounts receivable are highly concentrated and make us vulnerable to adverse changes in our customers' businesses, and to downturns in the industry and the worldwide economy. Accounts receivable from significant customers, those representing 10% or more of stock-based compensation expense. Fortotal accounts receivable aggregated approximately 38% of our fiscal years 2000 through 2006, this stock-based compensation expense was calculated using primarily the intrinsic value-based method under Accounting Principles Board Opinion No.accounts receivable balance from three customers at January 25, or APB 25,Accounting for Stock Issued to Employees2009 and related interpretations. In December 2004, the FASB issued SFAS No. 123(R),Share-Based Payment, which requires the measurement and recognitionapproximately 12% of compensation expense for all stock-based compensation payments. In April 2005, the SEC delayed the effective date of SFAS No. 123(R), which is now effective for annual periods that begin after June 15, 2005. SFAS No. 123(R) requires that we record compensation expense for stock options and our employee stock purchase planaccounts receivable balance from one customer at January 27, 2008.using the fair value of those awards. Expensing these incentives
Difficulties in
future periods willcollecting accounts receivable could materially and adversely affect our
reported operatingfinancial condition and results
asof operations. These difficulties are heightened during periods when economic conditions worsen. We continue to work directly with more foreign customers and it may be difficult to collect accounts receivable from them. We maintain an allowance for doubtful accounts for estimated losses resulting from the
stock-based compensation expense wouldinability of our customers to make required payments. This allowance consists of an amount identified for specific customers and an amount based on overall estimated exposure. If the financial condition of our customers were to deteriorate, resulting in an impairment in their ability to make payments, additional allowances may be
charged directly against our reported earnings. We anticipate that our stock-based compensation expense willrequired, we may be
approximately $18required to
$22 million for the first quarter of fiscal 2007defer revenue recognition on sales to affected customers, and we
are unsure how the market will react to this adverse affect on our operating results, which could impact our stock price.To the extent that SFAS No. 123(R) makes it more expensive to grant stock options or to continue to have an employee stock purchase program, we may decide to incur increased cash compensation costs. In addition, actions that we may take to reduce stock-based compensation expense that may be more severe thanrequired to pay higher credit insurance premiums, any actions our competitors may implement may make it difficult to attract, retain and motivate employees,of which could adversely affect our competitive positionoperating results. In the future, we may have to record additional reserves or write-offs and/or defer revenue on certain sales transactions which could negatively impact our financial results.
Risks Related to Regulatory, Legal, Our Common Stock and Other Matters
We are subject to litigation arising from alleged defects in our previous generation MCP and GPU products, which if determined adversely to us, could harm our business.
During the second fiscal quarter of 2009, we recorded a $196.0 million charge against cost of revenue to cover anticipated customer warranty, repair, return, replacement and other associated costs arising from a weak die/packaging material set in certain versions of our previous generation MCP and GPU products used in notebook systems. The previous generation MCP and GPU products that are impacted were included in a number of notebook products that were shipped and sold in significant quantities. Certain notebook configurations of these MCP and GPU products are failing in the field at higher than normal rates. While we have not been able to determine a root cause for these failures, testing suggests a weak material set of die/package combination, system thermal management designs, and customer use patterns are contributing factors. We continue to engage in discussions with our supply chain regarding reimbursement to us for some or all of the costs we have incurred and may incur in the future relating to the weak material set. We also continue to seek to access our insurance coverage, which provided us with $8 million in related reimbursement during fiscal year 2009. However, there can be no assurance that we will recover any additional reimbursement. We continue to not see any abnormal failure rates in any systems using NVIDIA products other than certain notebook configurations. However, we are continuing to test and otherwise investigate other products. There can be no assurance that we will not discover defects in other MCP or GPU products.
In September, October and November 2008, several putative class action lawsuits were filed against us, asserting various claims related to the impacted MCP and GPU products. Such lawsuits could result in the diversion of management’s time and attention away from business operations, which could harm our business. In addition, the costs of defense and any damages resulting from this litigation, a ruling against us, or a settlement of the litigation could adversely affect our cash flow and financial results.
The ongoing civil actions or any new actions relating to the market for GPUs could adversely affect our business.
In November 2006, we received a subpoena from the San Francisco Office of the Antitrust Division of the United States Department of Justice, or DOJ, in connection with the DOJ's investigation into potential antitrust violations related to GPUs and cards. In October 2008, the DOJ formally notified us that the DOJ investigation had been closed. No specific allegations were made against NVIDIA during the investigation.
Several putative civil complaints were filed against us by direct and indirect purchasers of GPUs, asserting federal antitrust claims based on alleged price fixing, market allocation, and other alleged anti-competitive agreements between us and ATI Technologies, ULC., or ATI, and Advanced Micro Devices, Inc., or AMD, as a result of its acquisition of ATI. The indirect purchasers’ consolidated amended complaint also asserts a variety of state law antitrust, unfair competition and consumer protection claims on the same allegations, as well as a common law claim for unjust enrichment.
In September 2008, we executed a settlement agreement, or the Agreement, in connection with the claims of the certified class of direct purchaser plaintiffs. The Agreement is subject to court approval and, if approved, would dispose of all claims and appeals raised by the certified class in the complaints against NVIDIA. In addition, in September 2008, we reached a settlement agreement with the remaining individual indirect purchaser plaintiffs that provides for a dismissal of all claims and appeals related to the complaints raised by the individual indirect purchaser plaintiffs. This settlement is not subject to the approval of the court. While we expect the courts to approve the settlement agreement with the direct purchasers, there can be no assurance that it will approved. If the settlement agreement is not approved we may be required to pay damages or penalties or have other remedies imposed on us that could harm our business. In addition, additional parties may bring claims against us relating to the potential antitrust violations related to GPUs and cards. If additional claims are brought against us, such lawsuits could result in the diversion of management’s time and attention away from business operations, which could harm our business. In addition, the costs of defense and operatingany damages resulting from this litigation, a ruling against us, or a settlement of the litigation could adversely affect our cash flow and financial results. We are currently involved The matters relating to the Board of Director’s review of our historical stock option granting practices and the restatement of our consolidated financial statements have resulted in patent litigation, which if not resolved favorably, could require usharm our financial results.
In August 2006, we announced that the Audit Committee of our Board, with the assistance of outside legal counsel, was conducting a review of our stock option practices covering the time from our initial public offering in 1999, our fiscal year 2000, through June 2006. The Audit Committee reached the conclusion that incorrect measurement dates were used for financial accounting purposes for stock option grants in certain prior periods. As a result, we recorded additional non-cash stock-based compensation expense, and related tax effects, related to pay damages.We are currently involvedstock option grants. Ten derivative complaints were filed in patent litigation. On October 19, 2004, Opti Incorporated, or Opti,state and federal court pertaining to allegations relating to stock option grants. In September 2008, we entered into Memoranda of Understanding regarding the settlement of the stockholder derivative lawsuits. In November 2008, the definitive settlement agreements were concurrently filed a complaint for patent infringement against us in the Chancery Court of Delaware and the United States District Court for the EasternNorthern District of Texas. Opti assertsCalifornia and are subject to approval by both such courts. The settlement agreements do not contain any admission of wrongdoing or fault on the part of NVIDIA, our board of directors or executive officers. While we expect the courts to approve the settlement agreements, there can be no assurance that unspecified NVIDIA chipsetsthey will approved. If the settlement agreements are not approved we may be required to pay damages or penalties or have other remedies imposed on us that could harm our business.
We are a party to other litigation, including patent litigation, which, if determined adversely to us, could adversely affect our cash flow and financial results.
We are a party to other litigation as both a defendant and as a plaintiff. For example, we are engaged in litigation with Intel Corporation, Rambus Corporation and with various parties related to our acquisition of 3dfx in 2001. Please refer to Note 12 of the Notes to the Consolidated Financial Statements in Part IV, Item 15 of this Form 10-K for further detail on these lawsuits. There can be no assurance that any litigation to which we are a party will be resolved in our favor. Any claim that is successfully decided against us may cause us to pay substantial damages, including punitive damages, and other related fees. Regardless of whether lawsuits are resolved in our favor or if we are the plaintiff or the defendant in the litigation, any lawsuits to which we are a party will likely be expensive and time consuming to defend or resolve. Such lawsuits could also harm our relationships with existing customers and result in the diversion of management’s time and attention away from business operations, which could harm our business. Costs of defense and any damages resulting from litigation, a ruling against us, or a settlement of the litigation could adversely affect our cash flow and financial results.
Litigation to defend against alleged infringement of intellectual property rights or to enforce our intellectual property rights and the outcome of such litigation could result in substantial costs to us.
We expect that as the number of issued hardware and software patents increases and as competition intensifies, the volume of intellectual property infringement claims and lawsuits may increase. We may in the future become involved in lawsuits or other legal proceedings alleging patent infringement or other intellectual property rights violations by us or by our customers that we have agreed to indemnify them for certain claims of infringement.
An unfavorable ruling in any such intellectual property related litigation could include significant damages, invalidation of a patent or family of patents, indemnification of customers, payment of lost profits, or, when it has been sought, injunctive relief.
In addition, in the future, we may need to commence litigation or other legal proceedings in order to:
| · | assert claims of infringement of our intellectual property; |
| · | protect our trade secrets or know-how; or |
| · | determine the enforceability, scope and validity of the propriety rights of others. |
If we have to initiate litigation in order to protect our intellectual property, our operating expenses may increase which could negatively impact our operating results. Our failure to effectively protect our intellectual property could harm our business.
If infringement claims are made against us or our products are found to infringe five United States patents held by Opti. Opti seeks unspecified damages for our alleged conduct, attorneys fees and triple damages becausea third parties’ patent or intellectual property, we or one of our alleged willful infringementindemnified customers may have to seek a license to the third parties’ patent or other intellectual property rights. However, we may not be able to obtain licenses at all or on terms acceptable to us particularly from our competitors. If we or one of these patents. NVIDIA filedour indemnified customers is unable to obtain a responselicense from a third party for technology that we use or that is used in one of our products, we could be subject to this complaint in December 2004. After a case management conference in July 2005, discovery begansubstantial liabilities or have to suspend or discontinue the manufacture and a trial date has now been set for July 2006. A court mandated mediation was held in January 2006 and did not resolve the matter. We believe the claims asserted against us are without merit and we will continue to defend ourselves vigorously.In August 2004, a Texas limited partnership named American Video Graphics, LP, or AVG, filed three separate complaints for patent infringement against various corporate defendants, not including NVIDIA, in the United States District Court for the Eastern Districtsale of Texas. AVG initially asserted that each of the approximately thirty defendants sells products that infringe one or more of seven separate patents that AVG claims relate generallyour products. We may also have to graphics processing functionality. In November 2004, NVIDIA sought and was granted permission to intervene in two of the three pending AVG lawsuits. Our complaint in intervention alleged that both of the patents in suit were invalid and that, to the extent AVG’s claims target NVIDIA products, the asserted patents were not infringed.
On December 19, 2005, AVG and substantially all of the named defendants and intervenors, including NVIDIA, settled all of pending claims; the only surviving claims will relate solely to two non-settling defendants. As part of the settlement, the defendants and intervenors paid an undisclosed aggregate amount to AVG. In exchange, all pending claims between the settling parties were dismissed with prejudice, and AVG granted to all settling parties a full release of all claims for past damages and a fullmake royalty or other payments, or cross license for all future sales of accused products under all of AVG’s patents, including the patents in suit. In addition, as part of the settlement, all settling defendants and intervenors fully and finally waived any claims for indemnification they may have had against any other settling party.
Our defenses against Opti may be unsuccessful. If this case goes forward, or if other patent litigation matters involving us arise, we expect that they will result in additional legal and other costs, such as those costs associated with the AVG suit, regardless of the outcome, which could be substantial.
Our industry is characterized by vigorous protection and pursuit of intellectual property rights and positions which could result in significant expense.
The semiconductor industry is characterized by vigorous protection and pursuit of intellectual property rights and positions, which have resulted in protracted and expensive litigation. The graphics processor industry, in particular, has been recently characterized by the aggressive pursuit of intellectual property positions, and we expect our competitors and others will continue to aggressively pursue intellectual property positions. The technology that we use to design and develop our products and that is incorporated into our products may be subject to claims that it infringes the patents or intellectual property rights of others. Our success is dependent on our ability to
develop new products without infringing or misappropriating the intellectual property rights of others or by licensing the intellectual property of third parties. As such, we have licensed technology from third parties for incorporation into our products, and expect to continue to enter into license agreements with third parties for future products. These licenses may result in royalty payments to third parties, the cross licensing of technology by us or payment of other consideration.technology. If these arrangements are not concluded on commercially reasonable terms, or at all, our competitive position and our business could suffer.
be negatively impacted. Furthermore, the indemnification of a customer may increase our operating expenses which could negatively impact our operating results.
Our ability to compete will be harmed if we are unable to adequately protect our intellectual property. We rely primarily on a combination of patents, trademarks, trade secrets, employee and third-party nondisclosure agreements, and licensing arrangements to protect our intellectual property in the United States and internationally. We have numerous patents issued, allowed and pending in the United States and in foreign countries.jurisdictions. Our patents and pending patent applications primarily relate to our products and the technology used by us in connection with our products, including our processors.products. We also rely on international treaties, and organizations and foreign laws to protect our intellectual property. The laws of certain foreign countries in which our products are or may be manufactured or sold, including various countries in Asia, may not protect our products or intellectual property rights to the same extent as by the laws of the United States. This makes the possibility of piracy of our technology and products more likely. We continuously assess whether and where to seek formal protection for particular innovations and technologies based on such factors as the:as: commercial significance of our operations and our competitors’ operations in particular countries and regions;
location in which our products are manufactured;| · | the commercial significance of our operations and our competitors’ operations in particular countries and regions; |
our strategic technology or product directions in different countries; and| · | the location in which our products are manufactured; |
degree to which intellectual property laws exist and are meaningfully enforced in different jurisdictions.| · | our strategic technology or product directions in different countries; and |
| · | the degree to which intellectual property laws exist and are meaningfully enforced in different jurisdictions. |
Our pending patent applications and any future applications may not be approved. In addition, any issued patents may not provide us with competitive advantages or may be challenged by third parties. The enforcement of patents by others may harm our ability to conduct our business. Others may independently develop substantially equivalent intellectual property or otherwise gain access to our trade secrets or intellectual property. Our failure to effectively protect our intellectual property could harm our business. Litigation Government investigations and inquiries from regulatory agencies could lead to defend against alleged infringement of intellectual property rightsenforcement actions, fines or to enforce our intellectual property rightsother penalties and the outcome of such litigation could result in substantiallitigation against us.
In the past, we have been subject to government investigations and inquiries from regulatory agencies such as the DOJ and the SEC. We may be subject to government investigations and receive additional inquiries from regulatory agencies in the future, which may lead to enforcement actions, fines or other penalties.
In addition, litigation has often been brought against a company in connection with the announcement of a government investigation or inquiry from a regulatory agency. For example, following the announcement of the DOJ investigation, several putative civil complaints were filed against us. In addition, following our Audit Committee’s investigation and the SEC’s investigation concerning our historical stock option granting practices, ten derivative complaints were filed in state and federal court pertaining to allegations relating to stock option grants. Please refer to Note 12 of the Notes to Consolidated Financial Statements in Part IV, Item 15 of this Form 10-K for further information regarding these lawsuits. Such lawsuits could result in the diversion of management’s time and attention away from business operations, which could harm our business. In addition, the costs of defense and any damages resulting from litigation, a ruling against us, or a settlement of the litigation could adversely affect our cash flow and financial results.
We are subject to us.the risks of owning real property.From time
In fiscal year 2009, we used approximately $183.8 million of our cash to timepurchase real property in Santa Clara, California that includes approximately 25 acres of land and ten commercial buildings. We also own real property in China and India. We have limited experience in the ownership and management of real property and are subject to the risks of owning real property, including:
| · | the possibility of environmental contamination and the costs associated with fixing any environmental problems; |
| · | adverse changes in the value of these properties, due to interest rate changes, changes in the neighborhood in which the property is located, or other factors; |
| · | the risk of loss if we decide to sell and are not able to recover all capitalized costs; |
| · | increased cash commitments for the possible construction of a campus; |
| · | the possible need for structural improvements in order to comply with zoning, seismic and other legal or regulatory requirements; |
| · | increased operating expenses for the buildings or the property or both; |
| · | possible disputes with third parties, such as neighboring owners or others, related to the buildings or the property or both; and |
| · | the risk of financial loss in excess of amounts covered by insurance, or uninsured risks, such as the loss caused by damage to the buildings as a result of earthquakes, floods and or other natural disasters. |
Expensing employee equity compensation adversely affects our operating results and could also adversely affect our competitive position.
Since inception, we receive noticeshave used equity through our stock option plans and our employee stock purchase program as a fundamental component of our compensation packages. We believe that these programs directly motivate our employees and, through the use of vesting, encourage our employees to remain with us.
In December 2004, the FASB issued Statement of Financial Accounting Standards No. 123(R), or are included in legal actions allegingSFAS No. 123(R), Share-based Payment, which requires the measurement and recognition of compensation expense for all stock-based compensation payments. SFAS No. 123(R) requires that we have infringed patents or other intellectual property rights owned by third parties.record compensation expense for stock options and our employee stock purchase plan using the fair value of those awards. Stock-based compensation expense resulting from our compliance with SFAS No. 123(R), was $162.7 million, $133.4 million and $116.7 million for fiscal years 2009, 2008 and 2007, respectively, which negatively impacted our operating results. Additionally, on February 11, 2009, we announced that our Board of Directors approved a cash tender offer for certain employee stock options. The tender offer commenced on February 11, 2009 and expired at 12:00 midnight (Pacific Time) on March 11, 2009. As of January 25, 2009, there were approximately 33.1 million options eligible to participate in the tender offer. If all these options were tendered and accepted in the offer, the aggregate cash purchase price for these options would be approximately $92.0 million. As a result of the tender offer, we may incur a non-recurring charge of up to approximately $150.0 million if all of the unvested eligible options are tendered. This charge would be reflected in our financial results for the first fiscal quarter of fiscal year 2010 and represents stock-based compensation expense, consisting of the remaining unamortized stock-based compensation expense associated with the unvested portion of the eligible options tendered in the offer, stock-based compensation expense resulting from amounts paid in excess of the fair value of the underlying options, if any, plus associated payroll taxes and professional fees. We expect that, asare currently tallying information on the number of issued hardwareoptions tendered under the offer to determine the actual aggregate cash to be paid in exchange for the cancellation of the eligible options and software patents increases, and as competition inthe non-recurring charge to be incurred pertaining to the unvested eligible options that have been tendered. We believe that SFAS No. 123(R) will continue to negatively impact our product lines intensifies,operating results.
To the volume of intellectual property infringement claimsextent that SFAS No. 123(R) makes it more expensive to grant stock options or to continue to have an employee stock purchase program, we may increase. We may become involved in future lawsuits or other legal proceedings alleging patent infringement or other intellectual property rights violations by us or by our customersdecide to incur increased cash compensation costs. In addition, actions that we have agreedmay take to indemnify them for certain claims of infringement arising out of the sale of our products to these customers. In addition, litigation or other legal proceedingsreduce stock-based compensation expense that may be necessary to:assert claims of infringement;
enforcemore severe than any actions our patents
protectcompetitors may implement and may make it difficult to attract retain and motivate employees, which could adversely affect our trade secrets or know-how; or
determine the enforceability, scopecompetitive position as well as our business and validity of the propriety rights of others.operating results.
If infringement claims are made against us, we may seek licenses under the claimants’ patents or other intellectual property rights. In addition, we or an indemnified customer
We may be required to obtainrecord a licensecharge to a third parties’ patentsearnings if our goodwill or intellectual property. However, licenses may not be offered to us at all or on terms acceptable to us, particularly by competitors. If we fail to obtain a license from a third party for technology that we use or that is used in one of our products used by an indemnified customer, we could be subject to substantial liabilities or have to suspend or discontinue the manufacture and sale of one or more of our products either of which could reduce our revenue and harm our business. Furthermore, the indemnification of a customer may increase our operating expensesamortizable intangible assets become impaired, which could negatively impact our operating results.Alternatively,
Under accounting principles generally accepted in the United States, we review our amortizable intangible assets and goodwill for impairment when events or changes in circumstances indicate the carrying value may initiate claims or litigation against third partiesnot be recoverable. Goodwill is tested for infringementimpairment at least annually. The carrying value of our proprietary rightsgoodwill or amortizable assets may not be recoverable due to establish the validityfactors such as a decline in stock price and market capitalization, reduced estimates of future cash flows and slower growth rates in our industry or in any of our proprietary rights,business units. For example, during the twelve months ended January 25, 2009, our market capitalization declined from approximately $14 billion to approximately $4 billion. Estimates of future cash flows are based on an updated long-term financial outlook of our operations. However, actual performance in the near-term or long-term could be materially different from these forecasts, which could be costly. If we have to initiate a claim, our operating expenses may increase which could negatively impact our operating results. Additionally,future estimates. For example, if one of our patentsbusiness units does not meet its near-term and longer-term forecasts, the goodwill assigned to the business unit could be impaired. We may be required to record a charge to earnings in our financial statements during a period in which an impairment of our goodwill or amortizable intangible assets is invalidated or founddetermined to exist, which may negatively impact our results of operations.
Our stock price continues to be unenforceable,volatile and investors may suffer losses.
Our stock has at times experienced substantial price volatility as a result of variations between our actual and anticipated financial results, announcements by us and our competitors, or uncertainty about current global economic conditions. The stock market as a whole also has experienced extreme price and volume fluctuations that have affected the market price of many technology companies in ways that may have been unrelated to these companies’ operating performance.
In the past, securities class action litigation has often been brought against a company following periods of volatility in the market price of its securities. For example, following our announcement in July 2008 that we would take a charge against cost of revenue to cover anticipated costs and expenses arising from a weak die/packaging material set in certain versions of our previous generation MCP and GPU products and that we were revising financial guidance for our second fiscal quarter of 2009, the trading price of our common stock declined. In September, October and November 2008, several putative class action lawsuits were filed against us relating to this announcement. Please refer to Note 12 of the Notes to Consolidated Financial Statements in Part IV, Item 15 of this Form 10-K for further information regarding these lawsuits. Due to changes in the potential volatility of our stock price, we may be unable to license the patent whichtarget of securities litigation in the future. Such lawsuits could result in the diversion of management’s time and attention away from business operations, which could harm our business. In addition, the costs of defense and any damages resulting from litigation, a loss of revenue.Regardlessruling against us, or a settlement of the outcome, litigation or negotiations involving intellectual property rights can be very costlycould adversely affect our cash flow and can divert management’s attention from other matters. We may be unsuccessful in defending or pursuing these lawsuits or claims. An unfavorable ruling could include significant damages, invalidation of a patent or family of patents, indemnification of customers, payment of lost profits, or, when it has been sought, injunctive relief.
financial results.
Our operating results may be adversely affected if we are subject to unexpected tax liabilities. We are subject to taxation by a number of taxing authorities both in the United States and throughout the world. Tax rates vary among the jurisdictions in which we operate. Significant judgment is required in determining our provision for our income taxes as there are many transactions and calculations where the ultimate tax determination is uncertain. Although we believe our tax estimates are reasonable, any of the below could cause our effective tax rate to be materially different than that which is reflected in historical income tax provisions and accruals: | · | the jurisdictions in which profits are determined to be earned and taxed; |
| · | adjustments to estimated taxes upon finalization of various tax returns; |
| · | changes in available tax credits; |
| · | changes in share-based compensation expense; |
| · | changes in tax laws, the interpretation of tax laws either in the United States or abroad or the issuance of new interpretative accounting guidance related to uncertain transactions and calculations where the tax treatment was previously uncertain; and |
| · | the resolution of issues arising from tax audits with various tax authorities. |
Should additional taxes be assessed as a result of any of the above, our operating results could be adversely affected. In addition, our future effective tax rate could be adversely affected by changes in the mix of earnings in countries with differing statutory tax rates, changes in tax laws or changes in the interpretation of tax laws.
Our failure to comply with any applicable environmental regulations could result in a range of consequences, including fines, suspension of production, excess inventory, sales limitations, and criminal and civil liabilities.
We are subject to various state, federal and international laws and regulations governing the environment, including restricting the presence of certain substances in electronic products and making producers of those products financially responsible for the collection, treatment, recycling and disposal of those products. For example, we are subject to the European Union Directive on Restriction of Hazardous Substances Directive, or RoHS Directive, that restricts the use of a number of substances, including lead, and other hazardous substances in electrical and electronic equipment in the market in the European Union. We could face significant costs and liabilities in connection with the European Union Directive on Waste Electrical and Electronic Equipment, or WEEE. The WEEE directs members of the European Union to enact laws, regulations, and administrative provisions to ensure that producers of electric and electronic equipment are financially responsible for the collection, recycling, treatment and environmentally responsible disposal of certain products sold into the market after August 15, 2005.
It is possible that unanticipated supply shortages, delays or excess non-compliant inventory may occur as a result of the RoHS Directive, WEEE, and other domestic or international environmental regulations. Failure to comply with any applicable environmental regulations could result in a range of consequences including costs, fines, suspension of production, excess inventory, sales limitations, criminal and civil liabilities and could impact our ability to conduct business in the countries or states that have adopted these types of regulations.
While we believe that we currently have adequate internal control over financial reporting, if we are exposed to risks from legislation requiring companies to evaluate those internal controls.or our independent registered public accounting firm determines that we do not, our reputation may be adversely affected and our stock price may decline. Section 404 of the Sarbanes-Oxley Act of 2002 requires our management to report on, and our independent registered public accounting firm to attest to,audit, the effectiveness of our internal control structure and procedures for financial reporting. We have an ongoing program to perform the system and process evaluation and testing necessary to comply with these requirements. This legislation is relatively newHowever, the manner in which companies and neither companies northeir independent public accounting firms have significant experience in complying with its requirements. As a result,apply these requirements and test companies’ internal controls remains subject to some judgment. To date, we have incurred, and we expect to continue to incur, increased expense and to devote additional management resources to Section 404 compliance. Despite our efforts, if we identify a material weakness in our internal controls, there can be no assurance that we will be able to remediate that material weakness in a timely manner, or that we will be able to maintain all of the controls necessary to determine that our internal control over financial reporting is effective. In the event that our chief executive officer, chief financial officer or our independent registered public accounting firm determine that our internal control over financial reporting is not effective as defined under Section 404, investor perceptions of us may be adversely affected and could cause a decline in the market price of our stock. Risks Related to Changes in financial accounting standards or interpretations of existing standards could affect our Common StockOur stock price may continue to experience significant short-term fluctuations.
The trading price of our common stock has fluctuated greatly. These price fluctuations have been rapid and severe. We believe that our quarterly and annualreported results of operations may continue to be affected by a variety of
factors that could harm
. We prepare our revenue, gross profit and results of operations, any of which could impact our stock price. Additionally, the price of our common stock may continue to fluctuate greatlyconsolidated financial statements in the future due to factors that are non-company specific, such as the declineconformity with generally accepted accounting principles in the United States and/or international economies, acts of terror againstStates. These principles are constantly subject to review and interpretation by the United States, war or dueSEC and various bodies formed to a variety of company specific factors, including quarter to quarter variations in our operating results, shortfalls in revenue, gross margin or earnings from levels expected by securities analystsinterpret and the other factors discussedcreate appropriate accounting principles. A change in these risk factors.principles can have a significant effect on our reported results and may even retroactively affect previously reported transactions.
Provisions in our certificate of incorporation, our bylaws and our agreement with Microsoft could delay or prevent a change in control. Our certificate of incorporation and bylaws contain provisions that could make it more difficult for a third party to acquire a majority of our outstanding voting stock. These provisions include the following: the ability of the board of directors to create and issue preferred stock without prior stockholder approval;
the prohibition of stockholder action by written consent;| · | the ability of our Board to create and issue preferred stock without prior stockholder approval; |
a classified board of directors; and| · | the prohibition of stockholder action by written consent; |
advance notice requirements for director nominations and stockholder proposals.| · | a classified Board; and |
| · | advance notice requirements for director nominations and stockholder proposals. |
On March 5, 2000, we entered into an agreement with Microsoft in which we agreed to develop and sell graphics chips and to license certain technology to Microsoft and its licensees for use in the Xbox. Under the agreement, if an individual or corporation makes an offer to purchase shares equal to or greater than 30% of the outstanding shares of our common stock, Microsoft may have first and last rights of refusal to purchase the stock. The Microsoft provision and the other factors listed above could also delay or prevent a change in control of NVIDIA.
ITEM 1B. UNRESOLVED STAFF COMMENTS None.
Our headquarters complex is located on a leased sitein Santa Clara, California. During fiscal year 2009, we purchased property that includes approximately 25 acres of land and ten commercial buildings in Santa Clara, California for approximately $194.8 million of which we occupy four buildings, sublease two buildings, and four are unoccupied. Our original plans for the purchased property included constructing a new campus on the site. We are currently re-evaluating those plans. Additionally, our corporate campus is comprised of five buildings. Additionally, we lease threeseven other leased buildings in Santa Clara with four used primarily as office buildings, one used as warehouse space, and the other two used primarily as lab space. We also entered into a lease for data center space in Santa Clara in fiscal year 2009.
Outside of Santa Clara, we lease space in Marina Del Rey, San Jose and San Francisco, California; Austin and Houston, Texas; Berkeley, California; Beaverton and Portland, Oregon; Bedford, Massachusetts; Bellevue and Bothell, Washington; Chandler, Arizona;Madison, Alabama; Durham, North Carolina; Greenville, South Carolina; Salt Lake City, Utah; St. Louis, Missouri; and Fort Collins Colorado; and Redmond, Washington.Boulder, Colorado. These facilities are used as design centers and/or sales and administrative offices. Outside of the United States, we lease space in Taipei and Hsin Chu City, Taiwan; Tokyo, Japan; Seoul, Korea; Beijing Shanghai, and Shenzhen,Shanghai, China; Wanchai, and Shatin, New Territories, Hong Kong; Bangalore, and Pune,Mumbai, India; Paris, France; Moscow, Russia; Berlin and Munich, Germany; Helsinki, Finland; Theale and Wurselen, Germany;London, United Kingdom; Melbourne, Australia; Singapore; Uppsala, Sweden; and Theale, England.Zurich, Switzerland. These facilities are used primarily to support our customers and operations and as sales and administrative offices. The officeWe also lease spaces in Wurselen, Germany,Germany; Shenzhen, ChinaChina; Neihu, Taiwan; and Bangalore and Pune, India, which are used primarily as design centers. Additionally, we own buildings in Hyderabad, India and Shanghai, China which are being used primarily as research and development centers.
We believe that we currently have sufficient facilities to conduct our operations for the next twelve months, although we expect to lease additional facilities throughout the world as our business requires. For additional information regarding obligations under leases, see Note 12 of the Notes to the Consolidated Financial Statements in Part IV, Item 15 of this Form 10-K under the subheading “Lease Obligations”,Obligations,” which information is hereby incorporated by reference.
ITEM 3. LEGAL PROCEEDINGS On December 15, 2000, NVIDIA Corporation and one of our indirect subsidiaries entered into an agreementAsset Purchase Agreement, or APA, to purchase certain graphics chip assets from 3dfx. The 3dfx asset purchasetransaction closed on April 18, 2001. That acquisition, and 3dfx's October 2002 bankruptcy filing, led to four lawsuits against NVIDIA: two brought by 3dfx's former landlords, one by 3dfx's bankruptcy trustee and the fourth by a committee of 3dfx's equity security holders in the bankruptcy estate.
Landlord Lawsuits
In May 2002, we were served with a California state court complaint filed by the landlord of 3dfx’s San Jose, California commercial real estate lease.lease, Carlyle Fortran Trust, or Carlyle. In December 2002, we were served with a California state court complaint filed by the landlord of 3dfx’s Austin, Texas commercial real estate lease.lease, CarrAmerica Realty Corporation, or CarrAmerica. The landlords’ complaintslandlords both assertasserted claims for, among other things, interference with contract, successor liability and fraudulent transfer and seektransfer. The landlords sought to recover among other things, amounts owed on their leases with 3dfxdamages in the aggregate amount of approximately $10 million. In October 2002,$15 million, representing amounts then owed on the 3dfx filed for Chapter 11 bankruptcy protection in the United States Bankruptcy Court for the Northern District of California.leases. The landlords’ actionscases were subsequentlylater removed to the United States Bankruptcy Court for the Northern District of California when 3dfx filed its bankruptcy petition and consolidated for pretrial purposes with a complaint filedan action brought by the Trustee in the 3dfx bankruptcy case for purposes of discovery. Upon motion by NVIDIA intrustee.
In 2005, the U.S. District Court for the Northern District of California withdrew the reference to the Bankruptcy Court and the landlord actions were removed to the United States District Court for the Northern District of California. Onlandlords’ actions, and on November 10, 2005, the District Court granted NVIDIA'sour motion to dismiss theboth landlords’ respective amended complaints and allowed the landlords to have until February 4, 2006 to amend their complaints. The landlords’ refiled claims against NVIDIAlandlords filed amended complaints in early February 2006, and NVIDIA again requestedfiled motions to dismiss those claims. On September 29, 2006, the District Court dismissed the CarrAmerica action in its entirety and without leave to dismiss all suchamend. On December 15, 2006, the District Court also dismissed the Carlyle action in its entirety. Both landlords filed timely notices of appeal from those orders.
On July 17, 2008, the United States Court of Appeals for the Ninth Circuit held oral argument on the landlords' appeals. On November 25, 2008, the Court of Appeals issued its opinion affirming the dismissal of Carlyle’s complaint in its entirety. The Court of Appeals also affirmed the dismissal of most of CarrAmerica’s complaint, but reversed the District Court’s dismissal of CarrAmerica’s claims madefor interference with contractual relations and fraud. On December 8, 2008, Carlyle filed a Request for Rehearing En Banc, which CarrAmerica joined. That same day, Carlyle also filed a Motion for Clarification of the Court’s Opinion. On January 22, 2009, the Court of Appeals denied the Request for Rehearing En Banc, but clarified its opinion affirming dismissal of the claims by stating that CarrAmerica had standing to pursue claims for interference with contractual relations, fraud, conspiracy and tort of another, and remanding Carlyle’s case with instructions that the landlords. ADistrict Court evaluate whether the Trustee had abandoned any claims, which Carlyle might have standing to pursue.
The District Court held a status conference in the CarrAmerica and Carlyle cases on March 9, 2009. That same day, 3dfx’s bankruptcy Trustee filed in the bankruptcy court a Notice of Trustee’s Intention to Compromise Controversy with Carlyle Fortran Trust. According to that Notice, the Trustee would abandon any claims it has against us for intentional interference with contract, negligent interference with prospective economic advantage, aiding and abetting breach of fiduciary duty, declaratory relief, unfair business practices and tort of another, in exchange for which Carlyle will withdraw irrevocably its Proof of Claim against the 3dfx bankruptcy estate and waive any further right of distribution from the estate. In light of the Trustee’s notice, the District Court ordered the parties to seek a hearing on
NVIDIA’s new motionsthe Notice on or before April 24, 2009, ordered Carlyle and CarrAmerica to
dismiss isfile amended complaints by May 10, 2009, and set
a further Case Management Conference for
hearing on April 17, 2006. Discovery is stayed pending this hearing and no trial date has been set in these actions.May 18, 2009. We
believe the claims asserted against us by the landlords are without merit and we will continue to
defend ourselves vigorously.believe that there is no merit to Carlyle or CarrAmerica’s remaining claims.
Trustee Lawsuit
In March 2003, we were served with a complaint filed by the Trustee appointed by the Bankruptcy Court to represent the interests of the 3dfx3dfx’s bankruptcy estate.estate served his complaint on NVIDIA. The Trustee’s complaint asserts claims for, among other things, successor liability and fraudulent transfer and seeks additional payments from us. The Trustee's fraudulent transfer theory alleged that NVIDIA had failed to pay reasonably equivalent value for 3dfx's assets, and sought recovery of the difference between the $70 million paid and the alleged fair value, which the Trustee estimated to exceed $50 million. The Trustee's successor liability theory alleged NVIDIA was effectively 3dfx's legal successor and was therefore responsible for all of 3dfx's unpaid liabilities. This action was consolidated for pretrial purposes with the landlord cases, as noted above.
On October 13, 2005, the Bankruptcy Court held a hearing onheard the Trustee’s motion for summary adjudication. Onadjudication, and on December 23, 2005, the Court issued its ruling denying the Trustee's Motion for Summary Adjudicationdenied that motion in all material respects and holdingheld that NVIDIA is prevented from disputingmay not dispute that the value of the 3dfx transaction to NVIDIA was less than $108.0$108 million. The Bankruptcy Court expressly denied the Trustee'sTrustee’s request to find that the value of the 3dfx assets conveyed to NVIDIA werewas at least $108.0$108 million.
In early November 2005, after manyseveral months of mediation, NVIDIA and the Official Committee of Unsecured Creditors, or the Creditors’ Committee, reachedagreed to a Plan of Liquidation of 3dfx, which included a conditional settlement of the Trustee’s claims against NVIDIA.us. This conditional settlement presented as the centerpiece of a proposed Plan of Liquidation in the bankruptcy case, iswas subject to a confirmation process through a vote of creditors and the review and approval of the Bankruptcy Court after notice and hearing.Court. The scope and schedule for that confirmation process has yet to be determined, butwe expect that hearing to now occur sometime in the next few months. The Trustee has advised that he intends to object to the settlement. Theconditional settlement with the Creditors’ Committee callscalled for a payment by NVIDIA of approximately $30.6 million to the 3dfx estate. Under the settlement, $5.6 million relatesrelated to various administrative expenses and Trustee fees, and $25.0 million relatesrelated to the satisfaction of debts and liabilities owed to the general unsecured creditors of 3dfx. As such,Accordingly, during the three month period ended October 30, 2005, we recorded $5.6 million as a charge to settlement costs and $25.0 million as additional purchase price for 3dfx. The Trustee advised that he intended to object to the settlement. The conditional settlement never progressed substantially through the confirmation process.The
On December 21, 2006, the Bankruptcy Court over objectionscheduled a trial for one portion of the Trustee’s case against NVIDIA. On January 2, 2007, NVIDIA terminated the settlement agreement on grounds that the Bankruptcy Court had failed to proceed toward confirmation of the Creditors’ CommitteeCommittee’s plan. A non-jury trial began on March 21, 2007 on valuation issues in the Trustee's constructive fraudulent transfer claims against NVIDIA. Specifically, the Bankruptcy Court tried four questions: (1) what did 3dfx transfer to NVIDIA in the APA?; (2) of what was transferred, what qualifies as "property" subject to the Bankruptcy Court's avoidance powers under the Uniform Fraudulent Transfer Act and NVIDIA, has orderedrelevant bankruptcy code provisions?; (3) what is the discovery portionfair market value of the litigation"property" identified in answer to proceed whilequestion (2)?; and (4) was the $70 million that NVIDIA paid "reasonably equivalent" to the fair market value of that property? The parties completed post-trial briefing on May 25, 2007.
On April 30, 2008, the Bankruptcy Court issued its Memorandum Decision After Trial, in which it provided a detailed summary of the trial proceedings and the parties' contentions and evidence and concluded that "the creditors of 3dfx were not injured by the Transaction." This decision did not entirely dispose of the Trustee's action, however, as the Trustee's claims for successor liability and intentional fraudulent conveyance were still pending. On June 19, 2008, NVIDIA filed a motion for summary judgment to convert the Memorandum Decision After Trial to a final judgment. That motion was granted in its entirety and judgment was entered in NVIDIA’s favor on September 11, 2008. The Trustee filed a Notice of Appeal from that judgment on September 22, 2008, and on September 25, 2008, NVIDIA exercised its election to have the appeal heard by the United States District Court, where the appeal is pending.
While the conditional settlement is pending approvalreached in November 2005 never progressed through the confirmation process. However, no trial date has been set in the Trustee's action. In addition, followingprocess, the Trustee’s filingcase still remains pending appeal. As such, we have not reversed the accrual of $30.6 million - $5.6 million as a charge to settlement costs and $25.0 million as additional purchase price for 3dfx – that we recorded during the three months ended October 30, 2005, pending resolution of the appeal of the Trustee’s case. We do not believe the resolution of this matter will have a material impact on our results of operations or financial position.
The Equity Committee Lawsuit
On December 8, 2005, the Trustee filed a Form 8-K on behalf of 3dfx, in which the Trustee discloseddisclosing the terms of the proposedconditional settlement agreement between NVIDIA and the Creditor’s Committee,Committee. Thereafter, certain 3dfx shareholders of 3dfx filed a petition with the Bankruptcy Court to appoint an official committee to represent the claimed interest’sinterests of 3dfx shareholders. ThatThe court granted that petition was granted and appointed an Equity Holder’sSecurities Holders’ Committee, was appointed. Counselor the Equity Committee. The Equity Committee thereafter sought and obtained an order granting it standing to bring suit against NVIDIA, for the benefit of the bankruptcy estate, to compel NVIDIA to pay the stock consideration then unpaid from the APA, and filed its own competing plan of reorganization/liquidation. The Equity Holder’s Committee has announced an intentionCommittee’s plan assumes that 3dfx can raise additional equity capital that would be used to file a competing Planretire all of Reorganization or Liquidation3dfx’s debts, and thus to trigger NVIDIA's obligation to pay six million shares of stock consideration specified in the Trustee’s case.Opti Incorporated
APA. NVIDIA contends, among other things, that such a commitment is not sufficient and that its obligation to pay the stock consideration had long before been extinguished. On October 19, 2004, Opti Incorporated, or Opti,May 1, 2006, the Equity Committee filed its lawsuit for declaratory relief to compel NVIDIA to pay the stock consideration. In addition, the Equity Committee filed a motion seeking Bankruptcy Court approval of investor protections for Harbinger Capital Partners Master Fund I, Ltd., an equity investment fund that conditionally agreed to pay no more than $51.5 million for preferred stock in 3dfx. The hearing on that motion was held on January 18, 2007, and the Bankruptcy Court approved the proposed protections.
After the Bankruptcy Court denied our motion to dismiss on September 6, 2006, the Equity Committee again amended its complaint, and NVIDIA moved to dismiss that amended complaint as well. On December 21, 2006, the Bankruptcy Court granted the motion as to one of the Equity Committee’s claims, and denied it as to the others. However, the Bankruptcy Court also ruled that NVIDIA would only be required to answer the first three causes of action by which the Equity Committee seeks determinations that (1) the APA was not terminated before 3dfx filed for patent infringementbankruptcy protection, (2) the 3dfx bankruptcy estate still holds some rights in the APA, and (3) the APA is capable of being assumed by the bankruptcy estate.
Because of the trial of the Trustee's fraudulent transfer claims against NVIDIA, the Equity Committee's lawsuit did not progress substantially in 2007. On July 31, 2008, the United States District CourtEquity Committee filed a motion for the Eastern Districtsummary judgment on its first three causes of Texas. Opti asserts that unspecified NVIDIA chipsets infringe five U.S. patents held by Opti. Opti seeks unspecified damages for our alleged conduct, attorneys’ fees and triple damages for alleged willful infringement by NVIDIA.action. On September 15, 2008, NVIDIA filed a response to this complaint in December 2004. A case management conference wascross-motion for summary judgment. On October 24, 2008, the Court held in July 2005 where a trial date was set for July 2006. A court mandated mediation was held in January 2006 and did not resolve the matter. Discovery continues, as well as preparation for the Markman hearing on claim construction.the parties’ cross-motions for summary judgment. On January 6, 2009, the Bankruptcy Court issued a Memorandum Decision granting NVIDIA’s motion and denying the Equity Committee’s motion, and entered an Order to that effect on January 30, 2009. On February 27, 2009, the Bankruptcy Court entered judgment in favor of NVIDIA. The Markman hearingEquity Committee has waived its right to appeal by stipulation entered on February 18, 2009, and the judgment is scheduled for April 13, 2006. We believe the claims asserted against us are without meritnow final.
Proceedings, SEC inquiry and we will continue to defend ourselves vigorously. We do not have sufficient information to determine whether a loss is probable. As such, we have not recorded any liability in our consolidated financial statements for such, if any, loss.American Video Graphics
In August 2004, a Texas limited partnership named American Video Graphics, LP, or AVG, filed three separate complaints for patent infringement against various corporate defendants, not including NVIDIA, in the United States District Court for the Eastern District of Texas. AVG initially asserted that each of the approximately thirty defendants sells products that infringe one or more of seven separate patents that AVG claims relate generally to graphics processing functionality. In November 2004, NVIDIA sought and was granted permission to intervene in two of the three pending AVG lawsuits. Our complaint in intervention alleged that both of the patents in suit were invalid and that, to the extent AVG’s claims target NVIDIA products, the asserted patents were not infringed.
On December 19, 2005, AVG and substantially all of the named defendants and intervenors, including NVIDIA, settled all of pending claims; the only surviving claims will relate solely to two non-settling defendants. As part of the settlement, the defendants and intervenors paid an undisclosed aggregate amount to AVG. In exchange, all pending claims between the settling parties were dismissed with prejudice, and AVG granted to all settling parties a full release of all claims for past damages and a full license for all future sales of accused products under all of AVG’s patents, including the patents in suit. In addition, as part of the settlement, all settling defendants and intervenors fully and finally waived any claims for indemnification they may have had against any other settling party.
Lawsuitslawsuits related to our historical stock option granting practices
Since
In June 2006, the Audit Committee of the Board of NVIDIA ("Audit Committee"), began a review of our stock option practices based on the results of an internal review voluntarily undertaken by management. The Audit Committee, with the assistance of outside legal counsel, completed its review on November 13, 2006 when the Audit Committee reported its findings to our full Board. The review covered option grants to all employees, directors and consultants for all grant dates during the period from our initial public offering in January 1999 through June 2006. Based on the findings of the Audit Committee and our internal review, we identified a number of occasions on which we used an incorrect measurement date for financial accounting and reporting purposes.
We voluntarily contacted the SEC regarding the Audit Committee’s review. In late August 2006, the SEC initiated an inquiry related to our historical stock option grant practices. In October 2006, we met with the SEC and provided it with a review of the status of the Audit Committee’s review. In November 2006, we voluntarily provided the SEC with additional documents. We continued to cooperate with the SEC throughout its inquiry. On October 26, 2007, the SEC formally notified us that the SEC's investigation concerning our historical stock option granting practices had been terminated and that no enforcement action was recommended.
Concurrently with our internal review and the SEC’s inquiry, since September 29, 2006, nineten derivative cases have been filed in state and federal courts asserting claims concerning errors related to our historical stock option granting practices and associated accounting for stock-based compensation expense. These complaints have been filed in various courts, including the California Superior Court, Santa Clara County, the United States District Court for the Northern District of California, and the Court of Chancery of the State of Delaware in and for New Castle County. The California Superior Court cases were subsequently consolidated as were the cases pending in the Northern District of California. All of the cases purport to be brought derivatively on behalf of NVIDIA against members of our board of directorsBoard and several of our current and former officers. The cases are not currently consolidated, although allofficers and directors. Plaintiffs in these actions allege in substantially similar fashion claims for, among other things, breach of fiduciary duty, unjust enrichment, insider selling, abuse of control, gross mismanagement, waste, and constructive fraud, andfraud. The Northern District of California action also alleges violations of federal provisions, including Sections 10(b) and 14(a) of the Securities Exchange Act of 1934. The plaintiffs seek to recover for NVIDIA, among other things, damages in an unspecified amount, rescission, punitive damages, treble damages for insider selling, and fees and costs. Plaintiffs also seek an accounting, a constructive trust and other equitable relief.
On August 5, 2007, our Board authorized the formation of a Special Litigation Committee to investigate, evaluate, and make a determination as to how NVIDIA should proceed with respect to the claims and allegations asserted in the underlying derivative cases brought on behalf of NVIDIA. The Special Litigation Committee has made substantial progress in completing its work, but has not yet issued a report.
Between June 2007 and September 2008 the parties to the actions engaged in settlement discussions, including four mediation sessions before the Honorable Edward Infante (Ret.). On September 22, 2008, we disclosed that we had entered into Memoranda of Understanding regarding the settlement of all derivative actions concerning our historical stock option granting practices. On November 10, 2008, the definitive settlement agreements were concurrently filed in the Chancery Court of Delaware and the United States District Court for the Northern District of California and are subject to approval by both such courts. The settlement agreements do not contain any admission of wrongdoing or fault on the part of NVIDIA, our board of directors or executive officers. The terms of the settlement agreements include, among other things, the agreement by the board of directors to continue and to implement certain corporate governance changes; acknowledgement of the prior amendment of certain options through re-pricings and limitations of the relevant exercise periods; an agreement by Jen-Hsun Huang, our president and chief executive officer, to amend additional options to increase the aggregate exercise price of such options by $3.5 million or to cancel options with an intrinsic value of $3.5 million; an $8.0 million cash payment by our insurance carrier to NVIDIA; and an agreement to not object to attorneys’ fees to be paid by NVIDIA to plaintiffs’ counsel of no more than $7.25 million, if approved by the courts. On January 24, 2009, a Notice of Pendency and Settlement of Shareholder Derivative Actions was mailed to shareholders of record and posted on www.nvidia.com. On March 11, 2009, a final settlement hearing was held in the Delaware Chancery Court and, on the same date, the Court entered a Final Order and Judgment, which approved the requested attorneys' fees and dismissed the Delaware action with prejudice. The final approval hearing in the Northern District of California is scheduled for March 17, 2009.
Department of Justice Subpoena and Investigation, and Civil Cases
On November 29, 2006, we received a subpoena from the San Francisco Office of the Antitrust Division of the United States Department of Justice, or DOJ, in connection with the DOJ's investigation into potential antitrust violations related to GPUs and cards. On October 10, 2008, the DOJ formally notified us that the DOJ investigation has been closed. No specific allegations were made against NVIDIA during the investigation.
As of January 25, 2009, over 50 civil complaints have been filed against us. The majority of the complaints were filed in the Northern District of California, several were filed in the Central District of California, and other cases were filed in several other Federal district courts. On April 18, 2007, the Judicial Panel on Multidistrict Litigation transferred the actions currently pending outside of the Northern District of California to the Northern District of California for coordination of pretrial proceedings before the Honorable William H. Alsup. By agreement of the parties, Judge Alsup will retain jurisdiction over the consolidated cases through trial or other resolution.
In the consolidated proceedings, two groups of plaintiffs (one putatively representing all direct purchasers of GPUs and the other putatively representing all indirect purchasers) filed consolidated, amended class-action complaints. These complaints purport to assert federal antitrust claims based on alleged price fixing, market allocation, and other alleged anti-competitive agreements between us and ATI Technologies, ULC., or ATI, and Advanced Micro Devices, Inc., or AMD, as a result of its acquisition of ATI. The indirect purchasers’ consolidated amended complaint also asserts a variety of state law antitrust, unfair competition and consumer protection claims on the same allegations, as well as a common law claim for unjust enrichment.
Plaintiffs filed their first consolidated complaints on June 14, 2007. On July 16, 2007, we moved to dismiss those complaints. The motions to dismiss were heard by Judge Alsup on September 20, 2007. The court subsequently granted and denied the motions in part, and gave the plaintiffs leave to move to amend the complaints. On November 7, 2007, the court granted plaintiffs’ motion to file amended complaints, ordered defendants to answer the complaints, lifted a previously entered stay on discovery, and set a trial date for January 12, 2009. Plaintiffs filed motions for class certification on April 24, 2008. We filed oppositions to the motions on May 20, 2008. On July 18, 2008, the court ruled on Plaintiffs’ class certification motions. The court denied class certification for the proposed class of indirect purchasers. The court granted in part class certification for the direct purchasers but limited the direct purchaser class to individual purchasers that acquired graphics processing cards products directly from NVIDIA or ATI from their websites between December 4, 2002 and November 7, 2007.
On September 16, 2008, we executed a settlement agreement, or the Agreement, in connection with the claims of the certified class of direct purchaser plaintiffs approved by the court. Pursuant to the Agreement, NVIDIA has paid $850,000 into a $1.7 million fund to be made available for payments to the certified class. We are not obligated under the Agreement to pay plaintiffs’ attorneys’ fees, costs, or make any other payments in connection with the settlement other than the payment of $850,000. The Agreement is subject to court approval and, if approved, would dispose of all claims and appeals raised by the certified class in the complaints against NVIDIA. A final settlement approval hearing is scheduled for March 26, 2009. Because the Court certified a class consisting only of a narrow group of direct purchasers, the Agreement does not resolve any claims that other direct purchasers may assert. In addition, on September 9, 2008, we reached a settlement agreement with the remaining individual indirect purchaser plaintiffs pursuant to which NVIDIA paid $112,500 in exchange for a dismissal of all claims and appeals related to the complaints raised by the individual indirect purchaser plaintiffs. This settlement is not subject to the approval of the court. Pursuant to the settlement, the individual indirect purchaser plaintiffs in the complaints have dismissed their claims and withdrawn their appeal of the class certification ruling. Because the Court did not certify a class of indirect purchasers, this settlement agreement resolves only the claims of those indirect purchasers that were named in the various actions.
Rambus Corporation
On July 10, 2008, Rambus Corporation, or Rambus, filed suit against NVIDIA Corporation, asserting patent infringement of 17 patents claimed to be owned by Rambus. Rambus seeks damages, enhanced damages and injunctive relief. The lawsuit was filed in the Northern District of California in San Jose, California. On July 11, 2008, NVIDIA filed suit against Rambus in the Middle District of North Carolina asserting numerous claims, including antitrust and other claims. NVIDIA seeks damages, enhanced damages and injunctive relief. Rambus has since dropped two patents from its lawsuit in the Northern District of California. The two cases have recently been consolidated into a single action in the Northern District of California. A case management conference in the case pending in the Northern District of California is scheduled for March 30, 2009. On November 6, 2008, Rambus filed a complaint alleging a violation of 19 U.S.C. Section 1337 based on a claim of patent infringement against NVIDIA and 14 other respondents with the U.S. International Trade Commission, or ITC. The complaint seeks an exclusion order barring the importation of products that allegedly infringe nine Rambus patents. The ITC has instituted the investigation. NVIDIA intends to pursue its offensive and defensive cases vigorously.
Product Defect Litigation and Securities Cases
In September, October and November 2008, several putative consumer class action lawsuits were filed against us, asserting various claims arising from a weak die/packaging material set in certain versions of our previous generation MCP and GPU products used in notebook systems. Most of the lawsuits were filed in Federal Court in the Northern District of California, but three were filed in state court in California, in Federal Court in New York, and in Federal Court in Texas. Those three actions have since been removed or transferred to the United States District Court for the Northern District of California, San Jose Division, where all of the actions now are currently pending. The various lawsuits are titled Nakash v. NVIDIA Corp., Feinstein v. NVIDIA Corp., Inicom Networks, Inc. v. NVIDIA Corp. and Dell, Inc. and Hewlett Packard, Olivos v. NVIDIA Corp., Dell, Inc. and Hewlett Packard, Sielicki v. NVIDIA Corp. and Dell, Inc., Cormier v. NVIDIA Corp., National Business Officers Association, Inc. v. NVIDIA Corp., and West v. NVIDIA Corp. The First Amended Complaint was filed on October 27, 2008, which no longer asserted claims against Dell, Inc. The various complaints assert claims for, among other things, breach of warranty, violations of the Consumer Legal Remedies Act, Business & Professions Code sections 17200 and 17500 and other consumer protection statutes under the laws of various jurisdictions, unjust enrichment, and strict liability.
The District Court has entered orders deeming all of the above cases related under the relevant local rules. On December 11, 2008, NVIDIA filed a motion to consolidate all of the aforementioned consumer class action cases. The District Court held a case management conference for the above cases on February 23, 2009. On February 26, 2009, the District Court consolidated the cases, as well as two other cases pending against Hewlett-Packard, under the caption “The NVIDIA GPU Litigation” and ordered the plaintiffs to file lead counsel motions by March 2, 2009. On March 2, 2009, several of the parties filed motions for appointment of lead counsel and briefs addressing certain related issues. A hearing on appointment of lead counsel is scheduled for March 23, 2009. The District Court also ordered that a consolidated amended complaint be filed on or before May 6, 2009.
In September 2008, three putative securities class actions, or the Actions, were filed in the United States District Court for the Northern District of California arising out of our announcements on July 2, 2008, that we would take a charge against cost of revenue to cover anticipated costs and expenses arising from a weak die/packaging material set in certain versions of our previous generation MCP and GPU products and that we were revising financial guidance for our second quarter of fiscal year 2009. The Actions purport to be brought on behalf of purchasers of NVIDIA stock and assert claims for violations of Sections 10(b) and 20(a) of the Securities Exchange Act of 1934, as amended. On October 30, 2008, the Actions were consolidated under the caption In re NVIDIA Corporation Securities Litigation, Civil Action No. 08-CV-04260-JW (HRL). Lead Plaintiffs and Lead Plaintiffs' Counsel were appointed on December 23, 2008. On February 6, 2009, co-Lead Plaintiff filed a Writ of Mandamus with the Ninth Circuit Court of Appeals challenging the designation of co-Lead Plaintiffs' Counsel. On February 19, 2009, co-Lead Plaintiff filed with the District Court, a motion to stay the District Court proceedings pending resolution of the Writ of Mandamus by the Ninth Circuit. On February 24, 2009, Judge Ware granted the stay. The Writ is still pending in the Court of Appeals. We intend to take all appropriate action with respect to the above cases.
Intel Corporation
On February 17, 2009, Intel Corporation filed suit against NVIDIA Corporation, seeking declaratory and injunctive relief relating to a licensing agreement that the parties signed in 2004. The lawsuit was filed in Delaware Chancery Court. Intel seeks an order from the Court declaring that the license does not extend to certain future NVIDIA chipset products, and enjoining NVIDIA from stating that it has licensing rights for these products. The lawsuit seeks no damages from NVIDIA. If Intel successfully obtains such a court order, we could be unable to sell our MCP products for use with Intel processors and our competitive position would be harmed. NVIDIA’s response to these complaints.We voluntarily contacted the SEC regardingIntel complaint is currently due on March 23, 2009. NVIDIA disputes Intel’s positions and intends to vigorously defend the Audit Committee’s review and, as of the date of the filing of this Annual Report on Form 10-K/A, the SEC is continuing the inquiry of our historical stock option grant practices it began in late August 2006. In October 2006, we met with the SEC and provided it with a review of the status of the Audit Committee’s review and in November 2006 we voluntarily provided the SEC with further documents. We plan to continue to cooperate with the SEC in its inquiry.
We are subject to other legal proceedings, but we do not believe that the ultimate outcome of any of these proceedings will have a material adverse effect on our financial position or overall trends in results of operations. However, if an unfavorable ruling were to occur in any specific period, there exists the possibility of a material adverse impact on the results of operations of that period.
case. ITEM 4. SUBMISSION OF MATTERS TO A VOTE OF SECURITY HOLDERS No matters were submitted to a vote of our security holders during the fourth quarter of fiscal 2006.year 2009.
ITEM 5. MARKET FOR REGISTRANT’S COMMON EQUITY, RELATED STOCKHOLDER MATTERS AND ISSUER PURCHASES OF EQUITY SECURITIES Our common stock is traded on the Nasdaq NationalNASDAQ Global Select Market under the symbol NVDA. Public trading of our common stock began on January 22, 1999. Prior to that, there was no public market for our common stock. As of March 3, 2006,10, 2009, we had approximately 434 460 registered stockholders, not including those shares held in street or nominee name.On September 11, 2006, NVIDIA filed a Form 12b-25 with the SEC to report that we would not timely file our Quarterly Report on Form 10-Q for the quarter ended July 30, 2006. On September 12, 2006 NVIDIA announced that we would request a hearing before the NASDAQ Listing Qualifications Panel, or the Panel, in response to the receipt of a NASDAQ Staff Determination letter on September 11, 2006 indicating that NVIDIA was not in compliance with the filing requirements for continued listing as set forth in Marketplace Rule 4310(c)(14). As anticipated, the letter was issued in accordance with NASDAQ procedures due to the delayed filing of our Form 10-Q for the quarter ended July 30, 2006. Pending a decision by the Panel, NVIDIA common stock will remain listed on the NASDAQ Global Select Market. On October 19, 2006, we appeared for an oral hearing before the Panel and the Panel confirmed that our appeal had stayed the delisting action pending a final written decision by the Panel. The Panel’s decision is still pending. There can be no assurances that the Panel will grant our request for continued listing; however, by filing all of our required periodic reports with the SEC, we believe that we will have remedied our non-compliance with Marketplace Rule 4310(c)(14).
The following table sets forth for the periods indicated the high and low sales price for our common stock as quoted on the Nasdaq NationalNASDAQ Global Select Market:
| | | | | | |
| | | High | | Low |
Year ended January 28, 2007 | | | | | | |
First Quarter (through March 3, 2006) | | $ | 50.72 | | $ | 42.87 |
| | |
Year ended January 29, 2006 | | | | | | |
Fourth Quarter | | $ | 46.76 | | $ | 32.55 |
Third Quarter | | $ | 35.95 | | $ | 27.04 |
Second Quarter | | $ | 29.39 | | $ | 21.52 |
First Quarter | | $ | 29.60 | | $ | 20.92 |
| | |
Year ended January 30, 2005 | | | | | | |
Fourth Quarter | | $ | 24.96 | | $ | 13.14 |
Third Quarter | | $ | 15.89 | | $ | 9.30 |
Second Quarter | | $ | 24.11 | | $ | 14.40 |
First Quarter | | $ | 27.35 | | $ | 20.63 |
| | | High | | | Low | |
| Fiscal year ending January 31, 2010 | | | | | | |
First Quarter (through March 10, 2009) | | | | | | | | |
| | | | | | | |
| Fiscal year ended January 25, 2009 | | | | | | |
| | | | | | | | |
| | | | | | | | |
| | | | | | | | |
| | | | | | | | |
| | | | | | | | | |
Fiscal year ended January 27, 2008 | | | | | | | | |
| | | | | | | | |
| | | | | | | | |
| | | | | | | | |
| | | | | | | | |
(1) Reflects a three-for-two stock split effective on September 10, 2007.
We have never paid and do not expect to pay cash dividends for the foreseeable future.
Issuer Purchases of Equity Securities
On August 9, 2004
During fiscal year 2005, we announced that our Board of Directors, or the Board, had authorized a stock repurchase program to repurchase shares of our common stock, subject to certain specifications, up to an aggregate maximum amount of $300.0$300 million. During fiscal year 2007, the Board further approved an increase of $400 million to the original stock repurchase program. In fiscal year 2008, we announced a stock repurchase program under which we may purchase up to an additional $1.0 billion of our common stock over a three year period through May 2010. On August 12, 2008, we announced that our Board further authorized an additional increase of $1.0 billion to the stock repurchase program. As a result of these increases, we have an ongoing authorization from the Board, subject to certain specifications, to repurchase shares of our common stock up to an aggregate maximum amount of $2.7 billion through May 2010.
The repurchases will be made from time to time in the open market, in privately negotiated transactions, or in structured stock repurchase programs, and may be made in one or more larger repurchases, in compliance with the Securities Exchange Act of 1934, or the Exchange Act, Rule 10b-18, subject to market conditions, applicable legal requirements, and other factors. The program does not obligate NVIDIA to acquire any particular amount of common stock and the program may be suspended at any time at our discretion. As part of our share repurchase program, we have entered into, and we may continue to enter into, structured share repurchase transactions with financial institutions. These agreements generally require that we make an up-front payment in exchange for the right to receive a fixed number of shares of our common stock upon execution of the agreement, and a potential incremental number of shares of our common stock, within a pre-determined range, at the end of the term of the agreement.
During the fourth quarter of fiscal 2006,three months ended January 25, 2009, we repurchased 1.3 milliondid not enter into any structured share repurchase transactions or otherwise purchase any shares of our common stock for $50.0 million under astock. During fiscal year 2009, we entered into structured share repurchase transaction,transactions to repurchase 29.3 million shares for $423.6 million, which we recorded on the trade date of the transaction.transactions. Through the end of the fourth quarter of fiscal 2006,year 2009, we have repurchased 8.5an aggregate of 90.9 million shares under our stock repurchase program for a total cost of $213.2 million. During the first quarter$1.46 billion. As of fiscal 2007,January 25, 2009, we entered into a structured share repurchase transactionare authorized, subject to certain specifications, to repurchase shares of our common stock for $50.0up to an additional amount of $1.24 billion through May 2010.
Additionally, during fiscal year 2009, we granted approximately 17.9 million that we expectstock options under the 2007 Equity Incentive Plan. Please refer to settle priorNote 2 of the Notes to the end of our first fiscal quarter.On March 6, 2006, we announced that our Board had approved an increaseConsolidated Financial Statements in our existing stock repurchase program. We announced a $400 million increase to the original stock repurchase program we had announced in August 2004. As a resultPart IV, Item 15 of this increase,Form 10-K for further information regarding stock-based compensation and stock options granted under our equity incentive program.
Stock Performance Graphs
The following graph compares the amount ofcumulative total stockholder return for our common stock, the Board of Directors has authorized to be repurchased has now been increased to a total of $700 million.S & P 500 Index and the S & P 500 Semiconductors Index for the five years ended January 25, 2009. The repurchases will be made from time to timegraph assumes that $100 was invested on January 25, 2004 in the open market, in privately negotiated transactions, or in structured stock repurchase transactions, in compliance with the Securities and Exchange Commission Rule 10b-18, subject to market conditions, applicable legal requirements, and other factors. The program does not obligate NVIDIA to acquire any particular amount ofour common stock or on January 31, 2004 in each of the S & P 500 Index and the program may be suspended at any timeS & P Semiconductors Index. Total return assumes reinvestment of dividends in each of the indices indicated. We have never paid cash dividends on our common stock. Our results are calculated on fiscal year-end basis and each of the S & P 500 Index and the S & P Semiconductors Index are calculated on month-end basis. Total return is based on historical results and is not intended to indicate future performance.

| | | 1/25/2004 | | | 1/30/2005 | | | 1/29/2006 | | | 1/28/2007 | | | 1/27/2008 | | | 1/25/2009 | |
| | | | | | | | | | | | | | | | | | | | | | | | |
| | | | | | | | | | | | | | | | | | | | | | | | |
| | | | | | | | | | | | | | | | | | | | | | | | |
*$100 invested on January 25, 2004 in stock or index, including reinvestment of dividends. Indexes calculated on month-end basis.
The following graph compares the cumulative total stockholder return for our common stock, the S & P 500 Index and the S & P 500 Semiconductors Index for the period commencing with our initial public offering through the year ended January 25, 2009. The graph assumes that $100 was invested at our
discretion. | | | | | | | | | | | | | |
Period | | Total Number of
Shares
Purchased | | | Average Price
Paid per Share | | | Total Number of
Shares
Purchased as
Part of Publicly
Announced
Plans or
Programs | | | Approximate Dollar
Value of Shares that
May Yet Be
Purchased Under
the Plans or
Programs (1) |
October 31, 2005 through November 27, 2005 | | — | | | $ | — | | | — | | | $ | 136,846,554 |
November 28, 2005 through December 25, 2005 | | — | | | $ | — | | | — | | | $ | 136,846,554 |
December 26, 2005 through January 29, 2006 | | 1,355,260 | (3) | | $ | 36.89 | | | 1,355,260 | (3) | | $ | 86,846,554 |
| | | | | | | | | | | | | |
Total | | 1,355,260 | | | $ | 36.89 | (2) | | 1,355,260 | | | | |
| | | | | | | | | | | | | |
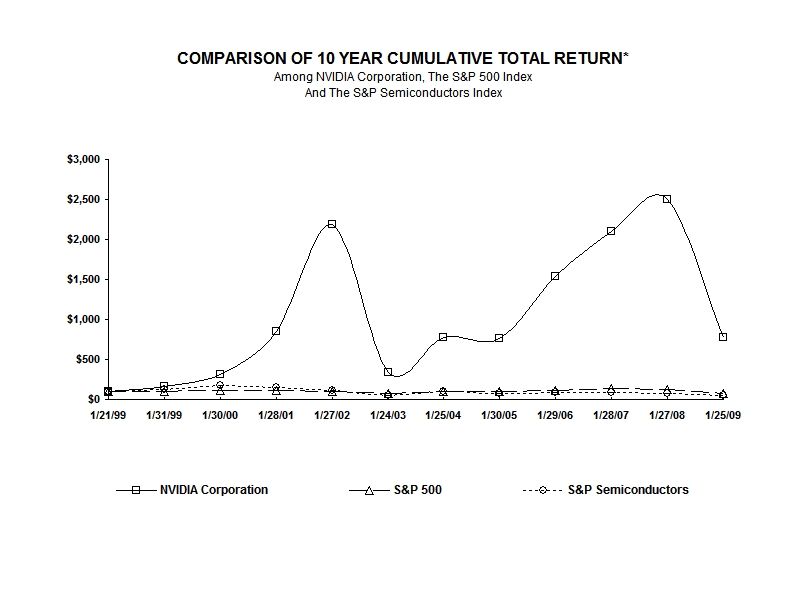
| | | 1/21/1999 | | | 1/31/1999 | | | 1/30/2000 | | | 1/28/2001 | | | 1/27/2002 | | | 1/24/2003 | | | 1/25/2004 | | | 1/30/2005 | | | 1/29/2006 | | | 1/28/2007 | | | 1/27/2008 | | | 1/25/2009 | |
| | | | | | | | | | | | | | | | | | | | | | | | | | | | | | | | | | | | | | | | | | | | | | |
| | | | | | | | | | | | | | | | | | | | | | | | | | | | | | | | | | | | | | | | | | | | | | |
| | | | | | | | | | | | | | | | | | | | | | | | | | | | | | | | | | | | | | | | | | | | | | |
*$100 invested on January 21, 1999 in stock or December 31, 1998, in index, including reinvestment of dividends. Indexes calculated on month-end basis.
38
(1) | We have an ongoing authorization from the Board, subject to certain specifications, to repurchase shares of our common stock up to an aggregate maximum amount of $700.0 million on the open market, in negotiated transactions or through structured stock repurchase agreements through August 2007. |
(2) | Represents weighted average price paid per share during the fourth quarter of fiscal 2006. |
(3) | As part of our share repurchase program, we have entered into and we may continue to enter into structured share repurchase transactions with financial institutions. During the fourth quarter of fiscal 2006, we repurchased 1.3 million shares of our common stock for $50.0 million under a structured share repurchase transaction. This transaction required that we make an up-front payment. |
ITEM 6. SELECTED FINANCIAL DATA The following selected financial data should be read in conjunction with our
consolidated financial statements and the notes thereto, and with Item 7, “Management’s Discussion and Analysis of Financial Condition and Results of Operations.” The consolidated
statementstatements of
incomeoperations data for the years ended January
29, 2006,25, 2009, January
30, 2005,27, 2008 and January
25, 200428, 2007 and the consolidated balance sheet data as of January
29, 200625, 2009 and January
30, 200527, 2008 have been derived from and should be read in conjunction with our audited consolidated financial statements and the notes thereto included elsewhere in this Annual Report on Form
10-K/A.10-K. The consolidated statement of
incomeoperations data
for the years ended January 26, 2003 and January 27, 2002 and the consolidated balance sheet data as of January 25, 2004, January 26, 2003, and January 27, 2002 are derived from unaudited consolidated financial statements which are not included herein and have been restated to reflect the correction of errors described below.As described in “Management’s Discussion and Analysis of Financial Condition and Results of Operations — Restatement of Consolidated Financial Statements, Audit Committee and Company Findings”, and Note 2 of the Notes to Consolidated Financial Statements referred to above, our consolidated financial statements are being restated to correct errors in the recognition of stock-based compensation expense relating to stock options that were granted during the period from our initial public offering in 1999 (our fiscal year 2000) through January 29, 2006. These errors resulted in after-tax charges of $1.4 million, $11.7 million, $25.8 million, $39.9 million and $34.5 million for the years ended January 29, 2006 and January 30, 2005 and the consolidated balance sheet data for the year ended January 25, 2004,28, 2007, January 26, 2003,29, 2006 and January 27, 2002, respectively. Additionally,30, 2005 are derived from audited consolidated financial statements and the cumulative effectnotes thereto which are not included in this Annual Report on Form 10-K.
| | | Year Ended | |
| | | January 25, | | January 27, | | January 28, | | January 29, | | January 30, | |
| | | 2009 (B) | | 2008 (C) | | 2007 (C,D) | | 2006 (E) | | 2005 | |
| | | (In thousands, except per share data) | |
| Consolidated Statement of Operations Data: | | | | | | | | | | | |
| | | | | | | | | | | | | | | | |
Income (loss) from operations | | | | | | | | | | | | | | | | |
| | | | | | | | | | | | | | | | |
Basic net income (loss) per share | | | | ) | | | | | | | | | | | | |
Diluted net income (loss) per share | | | | | | | | | | | | | | | | |
Shares used in basic per share computation (A) | | | | | | | | | | | | | | | | |
Shares used in diluted per share computation (A) | | | | | | | | | | | | | | | | |
| | | January 25, | | January 27, | | January 28, | | January 29, | | January 30, | |
| | | 2009 | | 2008 | | 2007 | | 2006 | | 2005 | |
| | | (In thousands) | |
| Consolidated Balance Sheet Data: | | | | | | | | | | | |
Cash, cash equivalents and marketable securities | | | | | | | | | | | | | | | | |
| | | | | | | | | | | | | | | | |
Capital lease obligations, less current portion | | | | | | | | | | | | | | | | |
Total stockholders’ equity | | | | | | | | | | | | | | | | |
Cash dividends declared per common share | | | | | | | | | | | | | | | | |
(A) Reflects a three-for-two stock-split effective September 10, 2007 and a two-for-one stock-split effective April 6, 2006.
(B) Fiscal year 2009 includes $196.0 million for a warranty charge against cost of revenue arising from a weak die/packaging material set; a benefit of $8.0 million received from an insurance provider as reimbursement for some of the
related after-tax chargesclaims towards the warranty cost arising from a weak die/packaging material set; $18.9 million for
periods prior to January 27, 2002 was $14.0 million. | | | | | | | | | | | | | | | |
| | | Year Ended |
| | | January 29,
2006 (A) | | January 30,
2005 | | January 25,
2004 (B, C) | | January 26,
2003 (D, E) | | January 27,
2002 (F, G) |
| | | (As Restated)(H) | | (As Restated)(H) | | (As Restated)(H) | | (As Restated)(H) | | (As Restated)(H) |
| | | (in thousands, except per share data) |
Consolidated Statement of Income Data: | | | | | | | | | | | | | | | |
Revenue | | $ | 2,375,687 | | $ | 2,010,033 | | $ | 1,822,945 | | $ | 1,909,447 | | $ | 1,369,471 |
Income from operations | | $ | 336,664 | | $ | 95,176 | | $ | 49,788 | | $ | 82,201 | | $ | 188,732 |
Net income | | $ | 301,176 | | $ | 88,615 | | $ | 48,630 | | $ | 50,901 | | $ | 142,401 |
Basic net income per share | | $ | 1.77 | | $ | 0.53 | | $ | 0.30 | | $ | 0.33 | | $ | 1.00 |
Diluted net income per share | | $ | 1.65 | | $ | 0.50 | | $ | 0.28 | | $ | 0.31 | | $ | 0.84 |
Shares used in basic per share computation | | | 169,690 | | | 166,062 | | | 160,924 | | | 153,513 | | | 143,015 |
Shares used in diluted per share computation | | | 182,852 | | | 175,812 | | | 172,054 | | | 165,827 | | | 169,813 |
| | | | | | | | | | | | | | | |
| | | January 29,
2006 | | January 30,
2005 | | January 25,
2004 | | January 26,
2003 | | January 27,
2002 |
| | | (As Restated)(H) | | (As Restated)(H) | | (As Restated)(H) | | (As Restated)(H) | | (As Restated)(H) |
| | | (in thousands) |
Consolidated Balance Sheet Data: | | | | | | | | | | | | | | | |
Cash, cash equivalents and marketable securities | | $ | 950,174 | | $ | 670,045 | | $ | 604,043 | | $ | 1,028,413 | | $ | 791,377 |
Total assets | | $ | 1,954,687 | | $ | 1,663,551 | | $ | 1,452,040 | | $ | 1,658,035 | | $ | 1,526,987 |
Capital lease obligations, less current portion | | $ | — | | $ | — | | $ | 856 | | $ | 4,880 | | $ | 5,861 |
Other long-term debt | | $ | — | | $ | — | | $ | — | | $ | 300,000 | | $ | 300,000 |
Total stockholders’ equity | | $ | 1,495,992 | | $ | 1,221,091 | | $ | 1,089,493 | | $ | 960,933 | | $ | 778,256 |
Cash dividends declared per common share | | $ | — | | $ | — | | $ | — | | $ | — | | $ | — |
(A) | Fiscal 2006 included a non-recurring charge of $14.2 million related to settlement costs associated with two litigation matters, 3dfx and AVG. |
(B) | Fiscal 2004 included a charge of $3.5 million related to the write-off of acquired research and development expense from the purchase of MediaQ, Inc. that had not yet reached technological feasibility and has no alternative future use. |
(C) | Fiscal 2004 included a charge of $13.1 million in connection with our convertible subordinated debenture redemption. |
(D) | Fiscal 2003 included $40.4 million in additional revenue related to our settlement of our arbitration with Microsoft regarding Xbox pricing. |
(E) | Fiscal 2003 included a charge of $61.8 million for stock issued by us at no cost to employees in exchange for their out of money options under an option exchange program completed by us. This change was recorded in cost of revenue (for manufacturing personnel), research and development and sales, general and administrative of $6.2 million, $35.4 million and $20.2 million, respectively. |
(F) | Fiscal 2002 included $10.0 million of acquisition charges attributable to expenses related to our acquisition of assets from 3dfx. |
(G) | Fiscal 2002 included a charge of $3.7 million related to our relocation from our previous headquarters. |
(H) | Comparability of annual data is affected by the following items that resulted from errors we identified in the measurement dates we used for financial accounting and reporting purposes related to stock option grants: |
We recorded stock-based compensation and related payroll tax expenses of $3.4 million, $18.4 million, $40.4 million, $61.8 million and $53.0 million in cost of sales and operating expenses in fiscal years 2006, 2005, 2004, 2003 and 2002, respectively.
In connection with the incremental stock-based compensation and related payroll tax expenses, we recorded an income tax benefit of $2.0 million, $6.7 million, $14.6 million, $21.9 million and $18.5 million in fiscal years 2006, 2005, 2004, 2003 and 2002, respectively.
The decrease in diluted net income per share relating to the stock-based compensation and related payroll tax expenses resulting from the errors we identified in the measurement dates we used for financial accounting and reporting purposestermination of a development contract related to stock option grants, neta new campus construction project we have put on hold and $8.0 million for restructuring charges.
(C) Fiscal years 2008 and 2007 include a charge of related income taxes, was $0.00 per share, $0.07 per share, $0.15 per share, $0.23 per share and $0.19 per share in fiscal years 2006, 2005, 2004, 2003 and 2002, respectively.
Total assets at January 29, 2006, January 30, 2005, January 25, 2004, January 26, 2003 and January 27, 2002 were restated primarily to reflect a deferred tax asset of $39.3 million, $34.7 million, $52.1 million, $40.5$4.0 million and $22.7$13.4 million respectively.
Total stockholders’ equity was restated to reflect the impact of adjustments of $38.2 million, $42.8 million, $38.3 million, $28.2 milliontowards in-process research and $14.4 million at January 29, 2006, January 30, 2005, January 25, 2004, January 26, 2003 and January 27, 2002, respectively,development expense related to the restatement.
See Note 2, “Restatementour purchase of Consolidated Financial Statements, Audit CommitteeMental Images Inc. and Company Findings”PortalPlayer Inc., respectively, that had not yet reached technological feasibility and have no alternative future use.
(D) Fiscal year 2007 included a charge of the Notes$17.5 million associated with a confidential patent licensing arrangement.
(E) Fiscal year 2006 included a charge of $14.2 million related to Consolidated Financial Statements.settlement costs associated with two litigation matters, 3dfx and American Video Graphics, LP, or AVG.
ITEM 7. MANAGEMENT’S DISCUSSION AND ANALYSIS OF FINANCIAL CONDITION AND RESULTS OF OPERATIONS The following discussion and analysis of our financial condition and results of operations should be read in conjunction with “Item 1A. Risk Factors”, “Item 6. Selected Financial Data”, our Consolidated Financial Statements and related Notes thereto, as well as other cautionary statements and risks described elsewhere in this Annual Report on Form 10-K/A,10-K, before deciding to purchase, hold or sell shares of our common stock.Restatement of Consolidated Financial Statements, Audit Committee and Company Findings
In May 2006, following media reports of stock option accounting investigations at other companies, the management of NVIDIA decided to conduct a review of stock option grants made by NVIDIA. Management advised our Board of Directors of the review at a regularly-scheduled meeting of the Board of Directors on May 25, 2006. The Board of Directors directed management to report its findings to the Audit Committee. Management presented its findings to the Audit Committee in late June 2006. Following that presentation, the Audit Committee determined that it should perform its own independent review of stock option grants made by NVIDIA. The Audit Committee, with the assistance of outside legal counsel, began its review on approximately June 29, 2006.
The Audit Committee’s review was completed on November 13, 2006 when the Audit Committee reported its findings to the full Board of Directors. The review covered option grants to all employees, directors and consultants for all grant dates during the period from our initial public offering in January 1999 through June 2006. As part of its review, the Audit Committee determined whether the correct measurement dates had been used under applicable accounting principles for these options. The measurement date means the date on which the option is deemed granted under applicable accounting principles, namely Accounting Principles Board Opinion No. 25, or APB 25,Accounting for Stock Issued to Employees and related interpretations, and is the first date on which all of the following are known: (1) the individual employee who is entitled to receive the option grant, (2) the number of options that an individual employee is entitled to receive, and (3) the option’s exercise price.
Based on the findings of the Audit Committee and our internal review, we identified a number of occasions on which we used an incorrect measurement date for financial accounting and reporting purposes. These errors resulted primarily from our use during our fiscal years 2000, 2001 and 2002, of certain date selection methods as discussed below which resulted in employees receiving options with stated exercise prices lower than the market prices as measured based upon the actual grant dates. We ceased using such practices beginning in our fiscal year 2003. The Audit Committee found that, beginning in our fiscal year 2003, we improved our stock option grant processes and have generally granted and priced our employee stock options in an objective and consistent manner since that time. However, for one Company-wide annual stock option grant we made in fiscal 2004, we did not finalize the number of options allocated to each employee as of the stated grant date in May 2003, which resulted in stock-based compensation charges due to the change in the measurement date to the date the grants were finalized. The Audit Committee’s review did not identify any additional stock-based compensation charges from measurement date issues subsequent to that fiscal 2004 grant.
In accordance with APB 25, with respect to periods through January 29, 2006, we should have recorded stock-based compensation expense to the extent that the fair market value of our common stock on the correct measurement date exceeded the exercise price of each option granted. For periods commencing January 30, 2006 (the beginning of our fiscal year 2007), we record stock-based compensation expense in accordance with Statement of Financial Accounting Standards No. 123(R) (revised), or SFAS No. 123(R),Share-Based Payment.
As a result of the measurement date errors identified from the Audit Committee’s review, through January 29, 2006, we recorded aggregate non-cash stock-based compensation charges of $127.4 million, net of related tax effects. These charges were based primarily on APB 25 (intrinsic value-based) charges and associated payroll taxes of $199.6 million on a pre-tax basis, which are being amortized over the vesting term of the stock options in accordance with Financial Accounting Standards Board Interpretation No. 28, or FIN 28,Accounting for Stock Appreciation Rights and Other Variable Stock Option or Award Plans. We have amortized a substantial portion of these charges to expense during our fiscal years 2000 to 2006. If an option is forfeited prior to vesting, we reverse both the charges amortized to expense in prior periods as well as any remaining unamortized deferred stock-based compensation associated with the forfeited options. Accordingly, our net stock-based compensation charges amortized to our statement of income are lower than the aggregate stock-based compensation charges based on APB 25 (intrinsic-value based). As of January 29, 2006, the remaining APB 25 (intrinsic value-based) unamortized deferred stock-based compensation related to the errors identified during the review was approximately $3.0 million.
The types of errors we identified were as follows:
Improper Measurement Dates forCompany-Wide Annual or Retention Stock Option Grants. We determined that, in connection with certain annual or retention stock option grants that we made to employees during our fiscal years 2000, 2001, 2002, 2003 and 2004, the final number of shares that an individual employee was entitled to receive was not determined and/or the proper approval of the related stock option grant had not been given until after the stated grant date. Therefore, the measurement date for such options for accounting purposes was actually subsequent to the stated grant date, resulting in new measurement dates for the related options.
Improper Measurement Dates for Stock Option Grants during Fiscal Years 2001 and 2002. In connection with stock option grants that we made to newly-hired employees (and, to a much lesser degree, retention grants to existing employees) during fiscal years 2001 and 2002, our practice was to grant stock options with an exercise price based upon the lowest closing price of our common stock in the last few days of the month of hire or the last few days of any subsequent month in the quarter of hire. The selection of the grant date of the related option grants would be made at the end of the fiscal quarter and was based on achieving the lowest exercise price for the affected employees. As a result of these practices, the measurement date for such options for accounting purposes was actually subsequent to the stated grant date, resulting in new measurement dates for the related options.
Improper Measurement Dates for Stock Option Grants during Fiscal Year 2000. In connection with certain stock option grants to newly-hired employees (and, to a much lesser degree, retention grants to existing employees) during a portion of fiscal year 2000, our practice was to delay the selection of the related grant dates until the end of a two-month period in the fiscal quarter during which the employees who received the grants began their employment with NVIDIA. As a result of this practice, the exercise price of the related option grants was not determined until subsequent to the stated grant date. We also determined that, during fiscal year 2000, we generally set the grant date and exercise price of employee option grants for new hires and promotions at the lowest price of the last few business days of the month of their hire or promotion (or of the following month in certain two-month periods that were chosen for an indeterminate reason). As a result of these practices, the measurement date for such options for accounting purposes was actually subsequent to the stated grant date, resulting in new measurement dates for the related options. In addition, we also determined that the exercise price or the number of options to be granted had not been determined, or the proper approval had not been given, for various other miscellaneous option grants during fiscal year 2000 until after the stated grant date - resulting in new measurement dates for accounting purposes for the related options.
Other Issues Identified.We also identified instances where stock option grants did not comply with applicable terms and conditions of the stock plans from which the grants were issued. For example, two grants were made to officers of NVIDIA by the chief executive officer under delegated authority; however, under the terms of the applicable plan, the option grant should have been made by our Board or the Compensation Committee. There were also instances where (1) option grants were made to a small group of employees who joined NVIDIA pursuant to a business combination, and to a few other employees in certain instances, with stated exercise prices below the fair market value of our common stock on the actual measurement date of the related grants; and (2) option grants were made to a few individuals who were contractors rather than employees, without recording the appropriate accounting charges. The accounting impact of these items was cumulatively less than $6.0 million. In addition, the Audit Committee did not find any evidence that these violations were committed for improper purposes.
The Audit Committee carefully considered the involvement of current members of management in the option grant process and concluded that the evidence did not give rise to any concern about the integrity of any current officer or director of NVIDIA. The Audit Committee also found that the accounting errors and improper practices brought to light during their review were not motivated by any intent to mislead investors, improve NVIDIA’s reported financial results, or obtain any personal benefit. Based on its findings, the Audit Committee was unable to reach any conclusion regarding the integrity of former officers and employees.
As a result of the errors we identified, we have restated our historical financial statements from our fiscal year 2000 through our fiscal year 2006 to record $127.4 million of charges related to stock-based compensation and associated payroll tax expense, net of related income tax effects. These errors resulted in after-tax charges of $1.4 million, $11.7 million and $25.8 million for our fiscal years 2006, 2005 and 2004, respectively. Additionally, the cumulative effect of the related after-tax charges for periods prior to our fiscal year ended January 25, 2004 was $88.4 million. These additional stock-based compensation expense charges were non-cash and had no impact on our reported revenue, cash, cash equivalents or marketable securities for each of the restated periods.
For all periods through the end of our fiscal year 2006, we have recorded aggregate non-cash stock-based compensation charges of $190.2 million, associated payroll tax charges of $9.4 million and a related income tax benefit of $72.2 million.
We recorded an income tax benefit of $2.0 million, $6.7 million, and $14.6 million for our fiscal years 2006, 2005 and 2004, respectively. The cumulative income tax benefit for periods prior to our fiscal year 2004 was $48.9 million. The income tax benefit differs from the expected statutory federal tax benefit principally as a result of state income tax benefits and federal and state research and experimental tax credits not previously benefited on stock-based compensation charges. Additionally, in our fiscal year 2004, we released a valuation allowance of $3.2 million recognized in prior periods on the incremental stock-based compensation expense. Prior to our fiscal year 2004, it was not more likely than not that we would realize the benefits of the future deductible amounts related to stock-based compensation expense. In our fiscal year 2004, the realization of these amounts became more likely than not due to settlement of certain tax contingencies related to stock-based compensation expense.
As part of this restatement, we also accrued liabilities and recorded charges to operating costs and expenses for certain payroll tax contingencies related to the incremental stock-based compensation expense in the amount of $18.8 million for all annual periods from our fiscal year 2000 through our fiscal year 2006. We recorded such charges in the amount of $3.1 million, $1.3 million, and $1.6 million for our fiscal years 2006, 2005 and 2004, respectively. Upon expiration of the related statute of limitations, we also recorded benefits from the reversal of previously-recorded payroll tax liabilities of $6.6 million and $2.8 million in our fiscal years 2006 and 2005, respectively. As a result, the net benefit to our statements of income was $3.5 million and $1.5 million for our fiscal years 2006 and 2005, respectively. The cumulative payroll tax expense for periods prior to our fiscal year 2004 was $12.8 million. For those stock option grants that we determined to have incorrect measurement dates for accounting purposes and that we had originally issued as incentive stock options, or ISOs, we recorded a liability for payroll tax contingencies in the event such grants would not be respected as ISOs under the principles of the Internal Revenue Code, or IRC, and the regulations thereunder. These liabilities were recorded with a charge to operating costs and expenses.
We also considered the application of Section 409A of the IRC to certain stock option grants where, under APB 25, intrinsic value existed at the time of grant. In the event such stock options grants are not respected as issued at fair market value at the original grant date under principles of the IRC and the regulations thereunder and are subject to Section 409A, we are considering potential remedial actions that may be available. We do not expect to incur a material charge as a result of any such potential remedial actions.
As a result of the findings of the Audit Committee, we concluded that we needed to amend our Original Filing to restate our consolidated financial statements for the years ended January 29, 2006, January 30, 2005, and January 25, 2004 and the related disclosures.
The following table sets forth the impact of the additional non-cash charges for stock-based compensation expense and related tax effects on our historical financial statements for each of the three years ended January 29, 2006, January 30, 2005, and January 25, 2004.
| | | | | | | | | | | | | | | | | | | | | | | | | | | | | | | | | | | | |
| | | Year Ended | |
| | | January 29, 2006 | | | January 30, 2005 | | | January 25, 2004 | |
| | | As
Previously
Reported | | | Adjustments | | | As Restated | | | As
Previously
Reported | | | Adjustments | | | As Restated | | | As
Previously
Reported | | | Adjustments | | | As Restated | |
| | | (In thousands, except per share data) | |
Revenue | | $ | 2,375,687 | | | $ | — | | | $ | 2,375,687 | | | $ | 2,010,033 | | | $ | — | | | $ | 2,010,033 | | | $ | 1,822,945 | | | $ | — | | | $ | 1,822,945 | |
Cost of revenue | | | 1,464,892 | | | | 762 | | | | 1,465,654 | | | | 1,360,547 | | | | 1,931 | | | | 1,362,478 | | | | 1,294,067 | | | | 3,617 | | | | 1,297,684 | |
| | | | | | | | | | | | | | | | | | | | | | | | | | | | | | | | | | | | |
Gross profit | | | 910,795 | | | | (762 | ) | | | 910,033 | | | | 649,486 | | | | (1,931 | ) | | | 647,555 | | | | 528,878 | | | | (3,617 | ) | | | 525,261 | |
Operating expenses: | | | | | | | | | | | | | | | | | | | | | | | | | | | | | | | | | | | | |
Research and development | | | 352,099 | | | | 5,024 | | | | 357,123 | | | | 335,104 | | | | 13,116 | | | | 348,220 | | | | 269,972 | | | | 22,190 | | | | 292,162 | |
Sales, general and administrative | | | 204,441 | | | | (2,353 | ) | | | 202,088 | | | | 200,789 | | | | 3,370 | | | | 204,159 | | | | 165,249 | | | | 14,562 | | | | 179,811 | |
In-process research and development | | | — | | | | — | | | | — | | | | — | | | | — | | | | — | | | | 3,500 | | | | — | | | | 3,500 | |
Settlement costs | | | 14,158 | | | | — | | | | 14,158 | | | | — | | | | — | | | | — | | | | — | | | | — | | | | — | |
| | | | | | | | | | | | | | | | | | | | | | | | | | | | | | | | | | | | |
Total operating expenses | | | 570,698 | | | | 2,671 | | | | 573,369 | | | | 535,893 | | | | 16,486 | | | | 552,379 | | | | 438,721 | | | | 36,752 | | | | 475,473 | |
| | | | | | | | | | | | | | | | | | | | | | | | | | | | | | | | | | | | |
Income from operations | | | 340,097 | | | | (3,433 | ) | | | 336,664 | | | | 113,593 | | | | (18,417 | ) | | | 95,176 | | | | 90,157 | | | | (40,369 | ) | | | 49,788 | |
| | | | | | | | | |
Interest income | | | 20,698 | | | | — | | | | 20,698 | | | | 11,422 | | | | — | | | | 11,422 | | | | 18,561 | | | | — | | | | 18,561 | |
Interest expense | | | (72 | ) | | | — | | | | (72 | ) | | | (164 | ) | | | — | | | | (164 | ) | | | (12,010 | ) | | | — | | | | (12,010 | ) |
Other income (expense), net | | | (502 | ) | | | — | | | | (502 | ) | | | 594 | | | | — | | | | 594 | | | | 3,033 | | | | — | | | | 3,033 | |
Convertible debenture redemption expense | | | — | | | | — | | | | — | | | | — | | | | — | | | | — | | | | (13,068 | ) | | | — | | | | (13,068 | ) |
| | | | | | | | | | | | | | | | | | | | | | | | | | | | | | | | | | | | |
Income before income tax expense (benefit) | | | 360,221 | | | | (3,433 | ) | | | 356,788 | | | | 125,445 | | | | (18,417 | ) | | | 107,028 | | | | 86,673 | | | | (40,369 | ) | | | 46,304 | |
Income tax expense (benefit) | | | 57,635 | | | | (2,023 | ) | | | 55,612 | | | | 25,089 | | | | (6,676 | ) | | | 18,413 | | | | 12,254 | | | | (14,580 | ) | | | (2,326 | ) |
| | | | | | | | | | | | | | | | | | | | | | | | | | | | | | | | | | | | |
Net income | | $ | 302,586 | | | $ | (1,410 | ) | | $ | 301,176 | | | $ | 100,356 | | | $ | (11,741 | ) | | $ | 88,615 | | | $ | 74,419 | | | $ | (25,789 | ) | | $ | 48,630 | |
| | | | | | | | | | | | | | | | | | | | | | | | | | | | | | | | | | | | |
Basic net income per share | | $ | 1.78 | | | $ | (0.01 | ) | | $ | 1.77 | | | $ | 0.60 | | | $ | (0.07 | ) | | $ | 0.53 | | | $ | 0.46 | | | $ | (0.16 | ) | | $ | 0.30 | |
| | | | | | | | | | | | | | | | | | | | | | | | | | | | | | | | | | | | |
Diluted net income per share | | $ | 1.65 | | | $ | — | | | $ | 1.65 | | | $ | 0.57 | | | $ | (0.07 | ) | | $ | 0.50 | | | $ | 0.43 | | | $ | (0.15 | ) | | $ | 0.28 | |
| | | | | | | | | | | | | | | | | | | | | | | | | | | | | | | | | | | | |
Shares used in basic per share computation | | | 169,690 | | | | — | | | | 169,690 | | | | 166,062 | | | | — | | | | 166,062 | | | | 160,924 | | | | — | | | | 160,924 | |
Shares used in diluted per share computation | | | 182,951 | | | | (99 | ) | | | 182,852 | | | | 176,558 | | | | (746 | ) | | | 175,812 | | | | 172,707 | | | | (653 | ) | | | 172,054 | |
The following table sets forth the impact of the additional non-cash charges for stock-based compensation expense and related tax effects on our consolidated balance sheets as of January 29, 2006 and January 30, 2005.
| | | | | | | | | | | | | | | | | | | | | | | | |
| | | January 29, 2006 | | | January 30, 2005 | |
| | | As
Previously
Reported | | | Adjustments | | | As Restated | | | As
Previously
Reported | | | Adjustments | | | As Restated | |
| | | (In thousands, except share and per share data) | |
| ASSETS | | | | | | | | | | | | | | | | | | | | | | | | |
Current assets: | | | | | | | | | | | | | | | | | | | | | | | | |
Cash and cash equivalents | | $ | 551,756 | | | $ | — | | | $ | 551,756 | | | $ | 208,512 | | | $ | — | | | $ | 208,512 | |
Marketable securities | | | 398,418 | | | | — | | | | 398,418 | | | | 461,533 | | | | — | | | | 461,533 | |
Accounts receivable, less allowances of $10,837 and $13,153 in 2006 and 2005, respectively | | | 318,186 | | | | — | | | | 318,186 | | | | 296,279 | | | | — | | | | 296,279 | |
Inventories | | | 254,792 | | | | 78 | | | | 254,870 | | | | 315,518 | | | | 268 | | | | 315,786 | |
Prepaid expenses and other current assets | | | 24,387 | | | | — | | | | 24,387 | | | | 19,819 | | | | — | | | | 19,819 | |
Deferred income taxes | | | 1,393 | | | | 1,289 | | | | 2,682 | | | �� | 3,265 | | | | 1,712 | | | | 4,977 | |
| | | | | | | | | | | | | | | | | | | | | | | | |
Total current assets | | | 1,548,932 | | | | 1,367 | | | | 1,550,299 | | | | 1,304,926 | | | | 1,980 | | | | 1,306,906 | |
Property and equipment, net | | | 178,152 | | | | — | | | | 178,152 | | | | 178,955 | | | | — | | | | 178,955 | |
Deposits and other assets | | | 27,477 | | | | — | | | | 27,477 | | | | 9,034 | | | | — | | | | 9,034 | |
Goodwill | | | 145,317 | | | | — | | | | 145,317 | | | | 108,107 | | | | — | | | | 108,107 | |
Intangible assets, net | | | 15,421 | | | | — | | | | 15,421 | | | | 27,514 | | | | — | | | | 27,514 | |
Deferred income taxes, non-current | | | — | | | | 38,021 | | | | 38,021 | | | | — | | | | 33,035 | | | | 33,035 | |
| | | | | | | | | | | | | | | | | | | | | | | | |
| | $ | 1,915,299 | | | $ | 39,388 | | | $ | 1,954,687 | | | $ | 1,628,536 | | | $ | 35,015 | | | $ | 1,663,551 | |
| | | | | | | | | | | | | | | | | | | | | | | | |
LIABILITIES AND STOCKHOLDERS’ EQUITY | | | | | | | | | | | | | | | | | | | | | | | | |
Current liabilities: | | | | | | | | | | | | | | | | | | | | | | | | |
Accounts payable | | $ | 179,395 | | | $ | — | | | $ | 179,395 | | | $ | 238,223 | | | $ | — | | | $ | 238,223 | |
Accrued liabilities | | | 259,264 | | | | — | | | | 259,264 | | | | 182,077 | | | | — | | | | 182,077 | |
Current portion of capital lease obligations | | | — | | | | — | | | | — | | | | 856 | | | | — | | | | 856 | |
| | | | | | | | | | | | | | | | | | | | | | | | |
Total current liabilities | | | 438,659 | | | | — | | | | 438,659 | | | | 421,156 | | | | — | | | | 421,156 | |
| | | | | | |
Deferred income tax liabilities | | | 8,260 | | | | (8,260 | ) | | | — | | | | 20,754 | | | | (20,754 | ) | | | — | |
Other long-term liabilities | | | 10,624 | | | | 9,412 | | | | 20,036 | | | | 8,358 | | | | 12,946 | | | | 21,304 | |
Commitments and contingencies - see Note 12 | | | | | | | | | | | | | | | | | | | | | | | | |
Stockholders’ equity: | | | | | | | | | | | | | | | | | | | | | | | | |
Preferred stock, $.001 par value; 2,000,000 shares authorized; none issued | | | — | | | | — | | | | — | | | | — | | | | — | | | | — | |
Common stock, $.001 par value; 1,000,000,000 shares authorized; 179,963,979 shares issued and 171,477,456 outstanding in 2006; and 169,173,898 shares issued and 167,089,545 outstanding in 2005 | | | 180 | | | | — | | | | 180 | | | | 169 | | | | — | | | | 169 | |
Additional paid-in capital | | | 798,251 | | | | 167,533 | | | | 965,784 | | | | 636,618 | | | | 179,433 | | | | 816,051 | |
Deferred compensation | | | (1,676 | ) | | | (1,928 | ) | | | (3,604 | ) | | | (2,926 | ) | | | (10,651 | ) | | | (13,577 | ) |
Treasury stock | | | (212,142 | ) | | | — | | | | (212,142 | ) | | | (24,644 | ) | | | — | | | | (24,644 | ) |
Accumulated other comprehensive loss, net | | | (1,957 | ) | | | — | | | | (1,957 | ) | | | (3,463 | ) | | | — | | | | (3,463 | ) |
Retained earnings | | | 875,100 | | | | (127,369 | ) | | | 747,731 | | | | 572,514 | | | | (125,959 | ) | | | 446,555 | |
| | | | | | | | | | | | | | | | | | | | | | | | |
Total stockholders' equity | | | 1,457,756 | | | | 38,236 | | | | 1,495,992 | | | | 1,178,268 | | | | 42,823 | | | | 1,221,091 | |
| | | | | | | | | | | | | | | | | | | | | | | | |
| | $ | 1,915,299 | | | $ | 39,388 | | | $ | 1,954,687 | | | $ | 1,628,536 | | | $ | 35,015 | | | $ | 1,663,551 | |
| | | | | | | | | | | | | | | | | | | | | | | | |
The additional non-cash charges for stock-based compensation expense and related tax effects had no impact on net cash flows from operations, investing activities, and financing activities reported in our consolidated statements of cash flows. In addition, the consolidated statements of stockholders’ equity have been restated to reflect the impact of the restatement adjustments on the consolidated stockholders’ equity amounts.
NVIDIA Corporation is the worldwide leader in programmablevisual computing technologies and the inventor of the graphic processing unit, or the GPU, a high-performance processor which generates realistic, interactive graphics processor technologies.on workstations, personal computers, game consoles, and mobile devices. Our products enhance the end-user experienceare designed to generate realistic, interactive graphics on consumer and professional computing devices. We serve the entertainment and consumer market with our GeForce graphics products, the professional design and visualization market with our Quadro graphics products, the high-performance computing market with our Tesla computing solutions products, and the handheld computing market with our Tegra computer-on-a-chip products. We have four major product-line operating segments: graphics processing units,the GPU business, the professional solutions business, or GPUs,PSB, the media and communications processors,processor, or MCPs, Handheld GPUs,MCP, business, and Consumer Electronics.the consumer products business, or CPB.
Our GPU Businessbusiness is composedcomprised primarily of our GeForce products that support desktop and notebook personal computers, or PCs, notebook PCsplus memory products. Our PSB is comprised of our NVIDIA Quadro professional workstation products and other professional workstations;graphics products, including our NVIDIA Tesla high-performance computing products. Our MCP Businessbusiness is composedcomprised of NVIDIA nForce products that operate as a single-chipcore logic and motherboard GPU, or chipset that can off-load system functions, such as audio processingmGPU products. Our CPB is comprised of our Tegra and network communications,GoForce mobile brands and perform these operations independently from the host central processing unit, or CPU; our Handheld GPU Business is composed of products that support netbooks, personal navigation devices, or PNDs, handheld personal media players, or PMPs, personal digital assistants, or PDAs, cellular phones and other handheld devices;devices. CPB also includes license, royalty, other revenue and the Consumer Electronics Business is concentrated in products that supportassociated costs related to video game consoles and other digital consumer electronics devicesdevices. Original equipment manufacturers, original design manufacturers, add-in-card manufacturers, system builders and consumer electronics companies worldwide utilize our processors as a core component of their entertainment, business and professional solutions.
We were incorporated in California in April 1993 and reincorporated in Delaware in April 1998. Our headquarter facilities are in Santa Clara, California. Our Internet address is composedwww.nvidia.com. The contents of our contractual arrangements with Sony Computer Entertainment, or SCE, to jointly developwebsite are not a custom GPU incorporating our next-generation GeForce GPU and SCE’s system solutions in SCE’s PlayStation3, salespart of our Xbox-related products, revenue from our license agreement with Microsoft relating to the successor product to their initial Xbox gaming console, the Xbox360, and related devices, and digital media processor products.Fiscal 2006this Form 10-K.
Recent Developments, Future Objectives and Challenges
Our GPU business is comprised primarily of our GeForce products that support desktop and notebook PCs, plus memory products. During fiscal year 2009, we entered fiscal 2006, we hadlaunched several new GPUs in the GeForce family, including the GeForce 9600 GT, the GeForce 9800 GX2, and the GeForce 9800 GTX. We also launched the GeForce 6GTX 280 and 260 GPU products, which represent the second generation of our unified architecture and, based on a variety of benchmarks and resolutions, deliver approximately 50 percent more gaming performance than our GeForce 8800 Ultra GPU. We also launched the GeForce GTX 295 and GeForce GTX 285 which were designed based on Compute Unified Device Architecture, or CUDA, technology. The GeForce GTX 295 is among the world’s fastest dual GPU solutions featuring the power of two GeForce GTX 200 GPUs on a single card. The GeForce GTX 285 is among the world’s most powerful single GPU solution and works efficiently in complex DirectX 10 environments with extreme HD resolutions. We also shipped notebook products from the GeForce 100M Series, nForce 4 MCP,which includes the GeForce G105M and Scalable Link Interface,the GeForce G110M to meet the performance demands of today’s visual computing applications. The GeForce G105M is over 55 percent faster than our previous product in its segment, while the GeForce G110M is 35 percent faster than our previous mainstream GPU.
In fiscal year 2009, we completed our acquisition of Ageia Technologies, Inc., or SLI, technology, with positive market reception.Ageia, an industry leader in gaming physics technology. We believe that the combination of the GPU and physics engine brands results in an enhanced visual experience for the gaming world. Subsequent to our acquisition of Ageia, we launched the GeForce 9800 GTX+, GeForce 9800 GT, and GeForce 9500 GT GPUs, which provide support for our PhysX physics engine and CUDA parallel processing across a wide range of price segments.
Our primary objectiveshare of the standalone desktop GPU category decreased from 64% to 63% in fiscal year 2009, according to the December 2007 and December 2008 PC Graphics Report from Mercury Research, respectively. Our share of the standalone notebook category decreased from 75% to 63%, according to the December 2007 and December 2008 PC Graphics Report from Mercury Research, respectively, due to increased competition in the marketplace. During fiscal year 2009, our revenue from Desktop GPU products declined approximately 29% compared to fiscal year 2008. This decline was driven primarily as a result of a decline of over 20% in the number of units of Desktop GPU products that we sold, while average selling prices of our Desktop GPU products were flat to slightly lower in fiscal year 2009 when compared to fiscal year 2008. We believe that some portion of the decline in our Desktop GPU unit sales reflects a shift in consumer preference towards notebook PCs and away from desktop PCs, and that the overall global economic recessionary climate also contributed to the decline. As such, we noted that unit sales of our Notebook GPU products increased over 10% during fiscal year 2009 when compared to fiscal year 2008. However, the overall global economic recessionary climate contributed to a significant decline in the demand for total graphics during the fourth quarter of fiscal year was2009. If consumer preferences towards notebook PCs, and away from desktop PCs, continue or escalate, we may see further declines in sales of our Desktop GPU products. In addition, if the global economic climate does not recover during fiscal year 2010, or deteriorates further, we may see consumer preferences move towards lower-priced notebook PCs, which may negatively impact sales of our Notebook PC products.
Professional Solutions Business
Our PSB is comprised of our Quadro professional workstation products and other professional graphics products, including our NVIDIA Tesla high-performance computing products. During fiscal year 2009, we launched several new Quadro solutions, including the Quadro FX 3600M Professional, and the Quadro Plex D Series, a dedicated desk side Visual Computing System, or VCS, system that also can be configured (using two Quadro Plex D systems) for a 3U configuration. We also launched five new Quadro FX notebook GPUs that spanned from ultra-high performance to strengthenultra mobility, as well as the Quadro CX accelerator for Adobe’s Creative Suite 4, or Adobe CS4, content creation software.
During fiscal year 2009, we also launched the Tesla C1060 computing processor and the Tesla S1070 computing system. Tesla is a new family of GPU computing products that delivers processing capabilities for high-performance computing applications, and marks our entry into the high-performance computing industry. The Tesla family also consists of the C870 GPU computing processor, the D870 Deskside Supercomputer and the S870 1U Computing Server. We believe we are in an era of GPU computing, where our Compute Unified Device Architecture, or CUDA, parallel processing architecture can accelerate compute-intensive applications by significant multiples over that of a CPU alone. NVIDIA CUDA is a general purpose parallel computing architecture that leverages the parallel compute engine in our graphics processing units to solve many complex computational problems in a fraction of the time required on a CPU. In order to program using the CUDA architecture, developers can, today, use C, one of the most widely used high-level programming languages, which can then be run at great performance on a CUDA enabled processor. We expect other languages to be supported in the future, including FORTRAN and C++. With CUDA, we are able to speed up general purpose compute-intensive applications like we do for 3D graphics processing. Developers are able to speed-up algorithms in areas ranging from nano molecular dynamics to image processing, medical image reconstruction and derivatives modeling for financial risk analysis. Many PC OEMs now offer high performance computing solutions with Tesla for use by customers around the world. Researchers use CUDA to accelerate their time-to-discovery, and popular off-the-shelf software packages are now CUDA accelerated.
We have achieved a leading position in the professional graphics category by providing innovative GPU technology, leadership positionsoftware, and tools that integrate the capabilities of our GPU with a broad array of visualization products.
MCP Business
Our MCP business is comprised of NVIDIA nForce core logic and MCP businesses, extendNVIDIA GeForce mGPU products. Our NVIDIA nForce and GeForce mGPU families of products address the core logic market. During fiscal year 2008, we announced a new technology named Hybrid SLI, which combines a powerful yet energy-efficient engine with our multi-GPU SLI technology. During fiscal year 2009, we shipped Hybrid SLI DirectX 10, or DX10, mGPUs – the GeForce 8000 GPU series. We also extended the reach of SLI technology into the performance category with the launch of our overclockable NVIDIA nForce 790i Ultra SLI MCP for Intel processors.We also launched SLI for Intel Broomfield CPU platforms.
In fiscal year 2009, we also launched the GeForce 9400M mGPU along with Apple, Inc., or Apple, for their new lineup of Mac notebooks. The GeForce 9400M integrates three complex chips – the northbridge, the input-output network processor, and the GeForce GPU into a broad rangesingle chip and, as a result, significantly improves performance over Intel integrated graphics. Apple’s MacBook and MacBook Air notebook computers come standard with the GeForce 9400M. Apple’s MacBook Pro notebook computer comes standard with the hybrid combination of compatibletwo GeForce GPUs - a GeForce 9400M for maximum battery life and a GeForce 9600M GT for high performance mode. We also launched the GeForce 9400 and 9300 mGPUs for Intel desktop PCs. These new mGPUs set a new price/performance standard for integrated graphics by combining the power of three different chips into one highly compact and efficient GPU.
Additionally, in fiscal year 2009, we announced the NVIDIA Ion Platform, which combines the GeForce 9400 GPU with the Intel Atom CPU. The combination enables netbooks, small form factor and all-in-one PCs to play rich media and popular games in high definition.
Consumer Products Business
Our CPB is comprised of our Tegra and GoForce mobile brands and products applicationsthat support netbooks, PMPs, PDAs, cellular phones and other handheld devices. This business also includes license, royalty, other revenue and associated costs related to video game consoles and other digital consumer electronics devices.
During fiscal year 2009, we launched the NVIDIA Tegra APX 2500 computer-on-a-chip. In February 2009, we announced the NVIDIA Tegra APX 2600 computer-on-a-chip and that we have worked closely with Google Inc., or Google, and the Open Handset Alliance to utilize Android, an open mobile phone software stack, with the NVIDIA Tegra series. During fiscal year 2009, we also launched the NVIDIA Tegra 600 and 650 products, which are small, advanced, highly-integrated visual computer-on-a-chip products. These products feature enhanced multimedia functionality and deliver many times the power efficiency of competing products.
We also introduced GeForce 3D Vision, a high-definition 3D stereo solution for the home. 3D Vision is a combination of high-tech wireless glasses, a high-power infrared emitter and advanced software that transforms hundreds of PC games into full stereoscopic 3D.
Restructuring Charges
On September 18, 2008, we announced a workforce reduction to allow for enthusiasts, improve gross margin beyond historical levels,continued investment in strategic growth areas, which was completed in the third quarter of fiscal year 2009. As a result, we eliminated approximately 360 positions worldwide, or about 6.5% of our global workforce. During fiscal year 2009, expenses associated with the workforce reduction, which were comprised primarily of severance and buildbenefits payments to these employees, totaled $8.0 million. We anticipate that the expected decrease in operating expenses from this action will be offset by continued investment in strategic growth areas.
Product Defect
Our products are complex and may contain defects or experience failures due to any number of issues in design, fabrication, packaging, materials and/or use within a system. If any of our products or technologies contains a defect, compatibility issue or other error, we may have to invest additional research and development efforts to find and correct the issue. Such efforts could divert our management’s and engineers’ attention from the development of new products and technologies and could increase our operating costs and reduce our gross margin. In addition, an error or defect in new products or releases or related software drivers after commencement of commercial shipments could result in failure to achieve market initiativesacceptance or loss of design wins. Also, we may be required to reimburse customers, including for customers’ costs to repair or replace the products in the field. A product recall or a significant number of product returns could be expensive, damage our reputation and could result in the shifting of business to our competitors. Costs associated with correcting defects, errors, bugs or other issues could be significant and could materially harm our financial results.
In July 2008, we recorded a $196.0 million charge against cost of revenue to cover anticipated customer warranty, repair, return, replacement and other associated costs arising from a weak die/packaging material set in certain versions of our previous generation MCP and GPU products used in notebook systems. All of our newly manufactured products and all of our products that would beare currently shipping in volume have a different material set that we believe is more robust.
The previous generation MCP and GPU products that are impacted were included in a number of notebook products that were shipped and sold in significant quantities. Certain notebook configurations of these MCP and GPU products are failing in the
platformfield at higher than normal rates. While we have not been able to determine a root cause for
these failures, testing suggests a weak material set of die/package combination, system thermal management designs, and customer use patterns are contributing factors. We have worked with our
continued growth.GPU Business
In February 2005, we announcedcustomers to develop and have made available for download a software driver to cause the GeForce Go 6600, a mobile GPU designed specificallysystem fan to deliver advanced multimedia functionality without sacrificing portability. Also in February 2005, we introducedbegin operation at the GeForce Go 6800 Ultra mobile GPU.
In March 2005, we introduced two new GeForce 6 GPUs: a 512MB versionpowering up of the GeForce 6800 Ultra GPU designed forsystem and reduce the enthusiast segment, and a new lower-cost AGP versionthermal stress on these chips. We have also recommended to our customers that they consider changing the thermal management of the GeForce 6200MCP and GPU designedproducts in their notebook system designs. We intend to bring DirectX 9.0 Shader Model 3.0 technologyfully support our customers in their repair and replacement of these impacted MCP and GPU products that fail, and their other efforts to mitigate the consequences of these failures.
We continue to engage in discussions with our supply chain regarding reimbursement to us for some or all of the costs we have incurred and may incur in the future relating to the mainstream segment.In June 2005, we launched and shippedweak material set. We also continue to seek to access our second generation Shader Model 3.0 GPU, the GeForce 7800 GTX,insurance coverage, which is designed to address the high-end enthusiast desktop PC segment. In August 2005, we launched and shipped our second GeForce 7 GPU, the GeForce 7800 GT, which is designed to address the high-end performance desktop PC segment.
In June 2005, we made our SLI technology available to usersprovided us with $8.0 million in the mainstream segment with the release of our GeForce 6600.
In July 2005, we introduced two new NVIDIA Quadro GPUs, the NVIDIA Quadro FX 4500 and the NVIDIA Quadro FX 3450, which are designed for the high-end and mainstream professional segments, respectively. Both products support our SLI technology.
In September 2005, we launched and shipped the new NVIDIA GeForce Go 7800 GTX, the flagship of the NVIDIA notebook GPU product line.
In October 2005, we announcedrelated reimbursement during fiscal year 2009. However, there can be no assurance that we will recover any additional reimbursement. We continue to not see any abnormal failure rates in any systems using NVIDIA products other than certain notebook configurations. However, we are continuing to test and otherwise investigate other products. There can be no assurance that we will not discover defects in other MCP or GPU products.
In September, October and November 2008, several putative class action lawsuits were filed against us, asserting various claims related to the
exclusive provider of all graphics cards offered on the first peripheral component interconnect, or PCI, express platform from Apple Computer, Inc., or Apple. In addition, the first ever Apple Power Mac will incorporate our NVIDIA Quadro professional-class GPU.In November 2005, we introducedimpacted MCP and shipped the NVIDIA GeForce 7800 GTX 512 GPU which contains over 302 million transistors and is the industry’s only mainstream GPUproducts. Please refer to incorporate 64-bit HDR. We also announced the immediate availabilityNote 12 of the NVIDIA GeForce 6800 GS GPU, which is designed for the mainstream segment.
In January 2006, we shipped the GeForce 7300 GS, our first mainstream version of the GeForce 7 series. We also introduced three new notebook GPUs - the GeForce Go 7800, GeForce Go 7600 and GeForce Go 7400 - all based on our second generation Shader Model 3.0 architecture and designed to deliver cutting-edge 3D, high-definition, or HD, home theatre-quality video and advanced power managementNotes to the notebook market.
Consolidated Financial Statements in Part IV, Item 15 of this Form 10-K for further information regarding this litigation.
Common Stock
At the Annual Meeting of Stockholders held on June 19, 2008, our stockholders approved an increase in our authorized number of shares of common stock to 2,000,000,000. The combinationpar value of our GeForce 7common stock remained unchanged at $0.001 per share.
Dependence on PC market
We derive and
GeForce 6 seriesexpect to continue to derive the majority of
GPUsour revenue from the sale or license of products for use in the desktop PC and
our SLI technology has created a new class of gaming PCs andnotebook PC markets, including professional workstations.
SLI technology takes advantageA reduction in sales of
PCs, or a reduction in the
increased bandwidthgrowth rate of
the PCI Express bus architecture to allow two NVIDIA-based graphics cards to operatePC sales, may reduce demand for our products. Changes in
a single PC or professional workstation. More than 3 million motherboards incorporating SLI technologydemand for our products could be large and
9 million GPUs incorporating SLI technology have shipped to date.In the upcomingsudden. During fiscal year we expect additional growth in our GPU Business. We believe that2009, sales of our desktop GPU products will be increased by share gains from our anticipated positiondecreased approximately 29% compared to fiscal year 2008. These decreases were primarily due to the Standalone Desktop and Standalone Notebook GPU market segment decline as reported in the market, Microsoft Windows Vista,PC Graphics December 2008 Report from Mercury Research. Since PC manufacturers often build inventories during periods of anticipated growth, they may be left with excess inventories if growth slows or Vista,if they incorrectly forecast product transitions. In these cases, PC manufacturers may abruptly suspend substantially all purchases of additional inventory from suppliers like us until their excess inventory has been absorbed, which would have a negative impact on our financial results.
Seasonality
Our industry is largely focused on the
introduction of HD and Blu-ray video. We expect to extend our technology and performance leadership. The GeForce 7 and GeForce 6 series of desktop and notebook GPUs are designed to be compatible with Vista, which is scheduled to be releasedconsumer products market. Historically, we have seen stronger revenue in the second half of
calendar 2006. We believe thatour fiscal year than in the
upcoming year there will be increased demand for HD video, and that Sony PlayStation3 will be a key driver of demand for HD and Blu-ray video. We expect HD and Blu-ray video to promote increased demand for the video processing capabilitiesfirst half of our
next generation GPUs.MCP Business
In April 2005, we announcedfiscal year, primarily due to back-to-school and holiday demand. This seasonal trend did not occur in fiscal year 2009. Revenue in the availability of our NVIDIA nForce4 SLI Intel Corporation, or Intel, Edition MCP for Intel platforms. This line of core-logic solutions incorporates a host of new and innovative features that have never before been available on the Intel platform and extends the NVIDIA nForce brand into new segments. In addition, during the first quartersecond half of fiscal 2006, we shipped the NVIDIA nForce Professional MCP in its first enterprise server platform.
In August 2005, we announced that the NVIDIA nForce4 SLI X16 Intel Edition technology featured in the Dell Dimension XPS 600 desktop PC was immediately available.
In September 2005, we introduced and shipped the NVIDIA nForce 400 MCP and GeForce 6100 integrated GPU family. This represents the first integrated GPU solutionyear 2009 declined by 33% when compared to support DirectX 9.0 Shader Model 3.0 technology. We expect this integrated solution to be an important new growth factor for our GPU and MCP businesses.
In December 2005, we announced our intent to acquire ULi Electronics, Inc., or ULi, one of the PC industry’s most highly regarded core logic developers. On February 20, 2006, we completed the acquisition of ULi. The acquisition represents our ongoing investment in ULi’s platform solution strategy and is expected to strengthen our sales, marketing, and customer engineering presence in Taiwan and China.
In January 2006, we shipped the NVIDIA nForce 4 SLI XE and NVIDIA nForce4 Ultra Intel MCPs. These products represent our first discrete chipsets targeted at mainstream Intel-based motherboards.
Our NVIDIA nForce product line has achieved record revenue for six consecutive quarters. We believe that Advanced Micro Devices’ transition to K8, our extension into new segments, and our entry into the Intel market with our first ever mainstream Intel nForce4 MCPs will make our MCP Business one of our fastest growing businesses. Furthermore, we believe that our ability to simultaneously innovate using our GPU, MCP, and software knowledge base will allow us to make additional platform innovations in the future.
Handheld GPU Business
Our strategy in the Handheld GPU Business is to lead innovation and capitalize on the emergence of the mobile phone as a versatile consumer lifestyle device. Our initial focus was on 3G cellular phones. Throughfrom the first half of fiscal 2006,year 2009. The current recessionary economic environment has created substantial uncertainty in our Handheld GPU Business was heavily concentrated at one original equipment manufacturer, or OEM, and its products did not achievebusiness. There can be no assurance that the anticipated level of commercial success. However, during the third quarter of fiscal 2006, Motorola Inc. and Sony Ericsson Mobile Communications AB launched 3G models of their RAZR and Walkman portable phones, respectively, that are both powered by our GoForce GPUs.
Our GoForce handheld GPUs are now shippinghistorical seasonal trend will resume in the new Motorola 3G RAZR V3X and the new Sony Ericsson Walkman phones. Our strategy is to build a new class of low power GPUs for multimedia rich devices like 3G cell phones, smart phones, and portable media players. We believe that there will be an increase in demand for mobile video products that deliver compelling and tangible improvements to the overall end user experience of these new services, and we believe that we are well positioned to increase our share of the handheld segment in the upcoming year.
Consumer Electronics Business
In April 2005, we finalized our definitive agreement with SCE to jointly develop a custom GPU incorporating our next-generation GeForce GPU and SCE’s system solutions in SCE’s PlayStation3. Our collaboration with SCE includes license fees and royalties for the PlayStation3 and all derivatives, including next-generation digital consumer electronics devices. In addition, we are licensing software development tools for creating shaders and advanced graphics capabilities to SCE. During fiscal 2006, we recognized $49.0 million of revenue from our contractual arrangements with SCE to jointly develop a custom GPU incorporating our next-generation GeForce GPU and SCE’s system solutions in SCE’s PlayStation3. Depending on the ultimate success of this next-generation platform, we expect to generate, starting in fiscal 2007, revenue ranging from $50 million to $100 million annually from license fees and royalties over the next five years with the possibility of additional royalties for several years thereafter. We have successfully reached many development milestones and we believe that we are on target to achieve the goals set by SCE.
During the first quarter of fiscal 2006, Microsoft indicated that it would not order any more Xbox-related products from us after our second fiscal quarter. As a result, the second quarter of fiscal 2006 was the last quarter during which we recognized revenue from the sale of our Xbox-related products to Microsoft.
Gross Margin Improvement
We continue to remain intensely focused on improving our gross margin. Beginning in fiscal 2005, we implemented profit improvement initiatives across our company which were designed to improve business and operational processes. During the fourth quarter of fiscal 2006, our gross margin was 40.2%, which represents an increase of over 600 basis points from our gross margin of 34.1% for the fourth quarter of fiscal 2005. Our gross margin was 38.3% for fiscal 2006, which represents an increase of over 600 basis points from our gross margin of 32.2% for fiscal 2005. We believe that we can continue to improve our gross margin during fiscal 2007.
Share-Based Payment
Since inception, we have used stock options and our employee stock purchase program as fundamental components of our employee compensation packages. We believe that these incentives directly motivate our employees and, through the use of vesting, encourage our employees to remain with us. As a result of adjustments arising from our restatement described in Note 2, “Restatement of Consolidated Financial Statements, Audit Committee and Company Findings”, of the Notes to our Consolidated Financial Statements, our operating results contain recorded amounts of stock-based compensation expense. For our fiscal years 2000 through 2006, this stock-based compensation expense was calculated using primarily the intrinsic value-based method under Accounting Principles Board Opinion No. 25, or APB 25,Accounting for Stock Issued to Employees and related interpretations. In December 2004, the Financial Accounting Standards Board, or FASB, issued Statement of Financial Accounting Standards No. 123(R), or SFAS No. 123(R),Share-Based Payment, which requires the measurement and recognition of compensation expense for all stock-based compensation payments using the fair value of those awards. In April 2005, the SEC delayed the effective date of SFAS No. 123(R), which is now effective for annual periods that begin after June 15, 2005. In March 2005, the SEC issued Staff Accounting Bulletin No. 107, or SAB No. 107, which includes interpretive guidance for the initial implementation of SFAS No. 123(R). SFAS No. 123(R) allows for either prospective recognition of compensation expense or retrospective recognition. We intend to adopt SFAS No. 123(R) using the modified prospective method, which requires the application of the accounting standard as of January 30, 2006, the first day of our fiscal 2007. Expensing these incentives in future periods in accordance with SFAS 123(R) will materially and adversely affect our reported operating results as the stock-based compensation expense would be charged directly against our reported earnings. We anticipate that our stock-based compensation expense will be approximately $18 to $22 million for the first quarter of fiscal 2007 and we are unsure how the market will react to this adverse affect on our operating results, which could impact our stock price.
To the extent that SFAS No. 123(R) makes it more expensive to grant stock options or to continue to have an employee stock purchase program, we may decide to incur increased cash compensation costs. In addition, actions that we may take to reduce stock-based compensation expense that may be more severe than any actions our competitors may implement may make it difficult to attract, retain and motivate employees, which could adversely affect our competitive position as well as our business and operating results.
Repatriation Legislation
The American Jobs Creation Act of 2004, or Act, was signed into law on October 22, 2004. The Act provided a temporary incentive for United States multinational corporations to repatriate accumulated income earned outside the United States at a federal effective tax rate of 5.25%. In the fourth quarter of fiscal 2006, we repatriated $420 million in foreign earnings under the Act. The net tax effect of this distribution was minimal because the current tax cost at a 5.25% tax rate was offset by the benefit attributable to reducing our deferred tax liability for taxes on earnings previously provided at the statutory rate of 35%.
future.
Subsequent EventsEvent
ULI Electronics, Inc.On February 20, 2006,11, 2009, we completed the acquisition of ULi Electronics, Inc., a leading developer of core logic technology, for approximately $53 million paid in cash.Stock Split.On March 6, 2006, we issued a press release announcingannounced that our Board of Directors approved a two-for-onecash tender offer for certain employee stock split of ouroptions. The tender offer commenced on February 11, 2009 and expired at 12:00 midnight (Pacific Time) on March 11, 2009. The tender offer applied to outstanding shares of common stock options held by employees with an exercise price equal to be effected in the form of a 100% stock dividend. The stock split will be effective on or about Thursday, April 6, 2006 for stockholders of record at the close of business on Friday, March 17, 2006 and will entitle each stockholder to receive one additional share for every outstanding share of common stock held. Upon the completiongreater than $17.50 per share. None of the stock split, NVIDIA will have approximately 360 million sharesnon-employee members of common stock outstanding.
Stock Repurchase.On March 6, 2006, we also announced that our Board of Directors approved an increase inor our existing stock repurchase program. We announced a $400 million increase to the original stock repurchase program we had announced in August 2004. As a result of this increase, the amount of common stock the Board of Directors has authorized to be repurchased has now been increased to a total of $700 million. The repurchases will be made from time to time in the open market, in privately negotiated transactions, or in structured stock repurchase transactions, in compliance with the Securities and Exchange Commission Rule 10b-18, subject to market conditions, applicable legal requirements, and other factors. The program does not obligate NVIDIA to acquire any particular amount of common stock and the program may be suspended at any time at our discretion.
Listing on the NASDAQStock Market
On September 11, 2006, NVIDIA filed a Form 12b-25 with the Securities and Exchange Commission to report that we would not timelyofficers who file our Quarterly Report on Form 10-Q for the quarter ended July 30, 2006. On September 12, 2006 NVIDIA announced that we would request a hearing before the NASDAQ Listing Qualifications Panel, or the Panel, in response to the receipt of a NASDAQ Staff Determination letter on September 11, 2006 indicating that NVIDIA was not in compliance with the filing requirements for continued listing as set forth in Marketplace Rule 4310(c)(14). As anticipated, the letter was issued in accordance with NASDAQ procedures due to the delayed filing of NVIDIA’s Form 10-Q for the quarter ended July 30, 2006. Pending a decision by the Panel, NVIDIA shares will remain listed on the NASDAQ Global Select Market. On October 19, 2006, we appeared for an oral hearing before the Panel. The Panel confirmed that our appeal had stayed the delisting action pending a final written decision by the Panel. The Panel’s decision is still pending. There can be no assurances that the Panel will grant our request for continued listing; however, by filing all of our required periodic reports with the SEC, we believe that we will have remedied our non-compliance with Marketplace Rule 4310(c)(14).
Lawsuits related to our historical stock option granting practices
Since September 29, 2006, nine derivative cases have been filed in state and federal courts asserting claims concerning errors related to our historical stock option granting practices and associated accounting for stock-based compensation expense. These complaints have been filed in various courts, including the California Superior Court, Santa Clara County, the United States District Court for the Northern District of California, and the Court of Chancery of the State of Delaware in and for New Castle County. All cases purport to be brought derivatively on behalf of NVIDIA against members of our board of directors and several of our current and former officers. The cases are not currently consolidated, although all allege in substantially similar fashion claims for, among other things, breach of fiduciary duty, unjust enrichment, insider selling, abuse of control, gross mismanagement, waste, constructive fraud, and violations of Sections 10(b) and 14(a)under Section 16(a) of the Securities Exchange Act of 1934. The plaintiffs seek1934, including our former Chief Financial Officer, Marvin D. Burkett, were eligible to recoverparticipate in the Offer. All eligible options with exercise prices less than $28.00 per share, but not less than $17.50 per share were eligible to receive a cash payment of $3.00 per option in exchange for NVIDIA, among other things, damages in an unspecified amount, rescission, punitive damages, treble damages for insider selling, and fees and costs. Plaintiffs also seek an accounting, a constructive trust and other equitable relief. We intend to take all appropriate action in response to these complaints.
We voluntarily contacted the SEC regarding the Audit Committee’s review and, ascancellation of the dateeligible option. All eligible options with exercise prices greater than $28.00 per share were eligible to receive a cash payment of $2.00 per option in exchange for the cancellation of the filing of this Annual Report on Form 10-K/A,eligible option.
We use equity to promote employee retention and provide an incentive vehicle valued by employees that is also aligned to stockholder interest. However, our stock price has declined significantly over the SEC is continuing the inquirypast year, and all of our historicaleligible options are “out-of-the-money” (i.e., have exercise prices above our stock option grant practices it beganprice). Therefore, we provided an incentive to employees with an opportunity to obtain cash payment for their eligible options. Also, the tender offer is expected to increase the number of shares available for issuance under our 2007 Equity Incentive Plan to the extent eligible options were tendered in late August 2006. In October 2006,this tender offer. The tender offer is also expected to reduce the potential dilution to our stockholders that is represented by outstanding stock options, which become additional outstanding shares of our common stock upon exercise.
As of January 25, 2009, there were approximately 33.1 million options eligible to participate in the tender offer. If all these options were tendered and accepted in the offer, the aggregate cash purchase price for these options would be approximately $92.0 million. As a result of the tender offer, we metmay incur a non-recurring charge of up to approximately $150.0 million if all of the unvested eligible options are tendered. This charge would be reflected in our financial results for the first fiscal quarter of fiscal year 2010 and represents stock-based compensation expense, consisting of the remaining unamortized stock-based compensation expense associated with the SEC and provided it with a reviewunvested portion of the statuseligible options tendered in the offer, stock-based compensation expense resulting from amounts paid in excess of the Audit Committee’s reviewfair value of the underlying options, if any, plus associated payroll taxes and professional fees.
We are currently tallying information on the number of options tendered under the offer to determine the actual aggregate cash to be paid in November 2006 we voluntarily providedexchange for the SEC with further documents. We plancancellation of the eligible options and the non-recurring charge to continuebe incurred pertaining to cooperate with the SEC in its inquiry.unvested eligible options that have been tendered.
Critical Accounting Policies and Estimates
Management’s discussion and analysis of financial condition and results of operations are based upon our consolidated financial statements, which have been prepared in accordance with accounting principles generally accepted in the United States. The preparation of these financial statements requires us to make estimates and judgments that affect the reported amounts of assets, liabilities, revenue, cost of revenue, expenses and related disclosure of contingencies. On an on-going basis, we evaluate our estimates, including those related to revenue recognition, cash equivalents and marketable securities, accounts receivable, inventories, income taxes, goodwill, stock-based compensation, warranty liabilities, litigation, investigation and goodwill.settlement costs and other contingencies. We base our estimates on historical experience and on various other assumptions that are believed to be reasonable under the circumstances, the results of which form the basis for making judgments about the carrying values of assets and liabilities. We believe the following critical accounting policies affect our significant judgments and estimates used in the preparation of our consolidated financial statements. Our management has discussed the development and selection of these critical accounting policies and estimates with the audit committeeAudit Committee of our boardBoard of directors and the audit committeeDirectors, or Board. The Audit Committee has reviewed our disclosures relating to our critical accounting policies and estimates in this report.Annual Report on Form 10-K.
We recognize revenue from product sales when persuasive evidence of an arrangement exists, the product has been delivered, the price is fixed and determinable, and collection is reasonably assured. For most sales, we use a binding purchase order and in certain cases we use a contractual agreement as evidence of an arrangement. We consider delivery to occur upon shipment provided title and risk of loss have passed to the
customer.customer based on the shipping terms. At the point of sale, we assess whether the arrangement fee is fixed and determinable and whether collection is reasonably assured. If we determine that collection of a fee is not reasonably assured, we defer the fee and recognize revenue at the time collection becomes reasonably assured, which is generally upon receipt of
cash.payment.
Our policy on sales to
certain distributors,
with rights of return, is to defer recognition of revenue and related cost of revenue until the distributors resell the product.
We record estimated reductions to revenue for customer programs at the time revenue is recognized. Our customer programs primarily involve rebates, which are designed to serve as sales incentives to resellerspurchasers of our products in various target markets.products. We account for rebates in accordance with Emerging Issues Task Force Issue 01-9, or EITF 01-9,01-09, Accounting for Consideration Given by a Vendor to a Customer (Including a Reseller of the Vendor’s Products) and, as such, we accrue for 100% of the potential rebates and do not apply a breakage factor.
Unclaimed rebates, which historically have not been significant, are reversed to revenue upon expiration of the rebate. Rebates typically expire six months from the date of the original
sale.sale, unless we reasonably believe that the customer intends to claim the rebate. Unclaimed rebates are reversed to revenue upon expiration of the rebate. Our customer programs also include marketing development funds, or MDFs. We account for MDFs as either a reduction of revenue or an operating expense in accordance with EITF
01-9.01-09. MDFs represent monies paid to retailers, system builders,
OEMs,original equipment manufacturers, distributors and add-in card partners that are earmarked for market segment development and expansion and typically are designed to support our partners’ activities while also promoting
NVIDIAour products.
IfDepending on market conditions,
decline, we may take actions to increase amounts offered under customer programs, possibly resulting in an incremental reduction of revenue at the time such programs are offered.
We also record a reduction to revenue by establishing a sales return allowance for estimated product returns at the time revenue is recognized, based primarily on historical return rates. However, if product returns for a particular fiscal period exceed historical return rates we may determine that additional sales return allowances are required to properly reflect our estimated exposure for product returns.
License and Development Revenue For license arrangements that require significant customization of our intellectual property components, we generally recognize this license revenue using the percentage-of-completion method of accounting over the period that services are performed. For all license and service arrangements accounted for under the percentage-of-completion method, we determine progress to completion based on actual direct labor hours incurred to date as a percentage of the estimated total direct labor hours required to complete the project. We periodically evaluate the actual status of each project to ensure that the estimates to complete each contract remain accurate. A provision for estimated losses on contracts is made in the period in which the loss becomes probable and can be reasonably estimated.
To date, we have not recorded any such losses. Costs incurred in advance of revenue recognized are recorded as deferred costs on uncompleted contracts. If the amount billed exceeds the amount of revenue recognized, the excess amount is recorded as deferred revenue. Revenue recognized in any period is dependent on our progress toward completion of projects in progress. Significant management judgment and discretion are used to estimate total direct labor hours. Any changes in or deviations from these estimates could have a material effect on the amount of revenue we recognize in any period.
We maintain an allowance for doubtful accounts receivable for estimated losses resulting from the inability of our customers to make required payments. Management determines this allowance, which consists of an amount identified for specific customer issues as well as an amount based on
generaloverall estimated exposure.
Our accounts receivable are highly concentrated and make us vulnerable to adverse changes in our customers' businesses, and to downturns in the industry and the worldwide economy. For example, one customer accounted for approximately 18% of our accounts receivable balance at January 25, 2009, and we continue to work directly with more foreign customers and it may be difficult to collect accounts receivable from them. Our overall estimated exposure excludes significant amounts that are covered by credit insurance and letters of credit. If the financial condition of our customers, the financial institutions providing letters of credit, or our credit insurance carrier were to deteriorate, resulting in an impairment of their ability to make payments, additional allowances may be required that could adversely affect our operating results.
This risk is heightened during periods when economic conditions worsen, such as the current period when the worldwide economy is experiencing a downturn. The current financial turmoil affecting the banking system and financial markets and the possibility that financial institutions may consolidate or go out of business have resulted in a tightening in the credit markets, a low level of liquidity in many financial markets, and extreme volatility in fixed income, credit, currency and equity markets. There could be a number of follow-on effects from the credit crisis on our business, including inability of customers, including channel partners, to obtain credit to finance purchases of our products and/or customer, insolvencies and failure of financial institutions, which may negatively impact our financial results. Furthermore, there can be no assurance that we will be able to obtain credit insurance in the future. Our current credit insurance agreement expires on December 31,
2007.2009.
As of January
29, 2006,25, 2009, our allowance for doubtful accounts receivable was
$0.6$1.1 million and our gross accounts receivable balance was
$330.4$336.8 million. Of the
$330.4$336.8 million,
$76.1$94.5 million was covered by credit insurance and
$36.6$5.3 million was covered by letters of credit. If the financial condition of our customers were to deteriorate, resulting in an impairment of their ability to make payments, additional allowances may be required and we may have to record additional reserves or write-offs on certain sales transactions in the future.
As a percentage of our gross accounts receivable balance, our allowance for doubtful accounts receivable has ranged between 0.2% and 0.8% during fiscal 2005 and 2006. Factors impacting the allowance include the level of gross receivables, the financial condition of our customers and the extent to which balances are covered by credit insurance or letters of credit. As
a percentage of our gross accounts receivable balance, our allowance for doubtful accounts receivable has ranged between 0.1% and 0.3% during fiscal years 2009 and 2008, respectively. As of January
29, 2006,25, 2009, our allowance for doubtful accounts receivable represented
0.2%the high end of this range, at 0.3% of our gross accounts receivable balance.
If our allowance for doubtful accounts receivable would have been recorded at 0.8% of our gross accounts receivable balance, then our allowance for doubtful accounts receivable balance at January 29, 2006 would have been approximately $2.6 million, rather than the actual balance of $0.6 million. Inventories
InventoriesInventory cost is computed on an adjusted standard basis (whichbasis; which approximates actual cost on an average or first-in, first-out basis).basis. We write down our inventory for estimated lower of cost or market, obsolescence or unmarketable inventory equal to the difference between the cost of inventory and the estimated market value based upon assumptions about future demand, future product purchase commitments, estimated manufacturing yield levels and market conditions. If actual market conditions are less favorable than those projected by management, or if our future product purchase commitments to our suppliers exceed our forecasted future demand for such products, additional future inventory write-downs may be required that could adversely affect our operating results. For example, during the fourth quarter of fiscal year 2009, we recorded new inventory write-downs of approximately $50.0 million, which was approximately five to ten times higher than the level of inventory reserves we recorded during the first three quarters of fiscal year 2009, reflecting a significant decline in our forecasted future demand for the related products. This increased level of inventory reserves had a negative impact on our gross margin and our results of operations. If actual market conditions are more favorable, we may have higher gross margins when products are sold. Salessold, however, sales to date of such products have not had a significant impact on our gross margin. Inventory reserves once established are not reversed until the related inventory has been sold or scrapped. As of January 29, 2006,25, 2009, our inventory reserve was $48.3$86.9 million. As a percentage of our gross inventory balance, our inventory reserve has ranged between 10.7%7.8% and 19.0%13.9% during fiscal 2005years 2009 and 2006.2008. As of January 29, 2006,25, 2009, our inventory reserve represented 19.0%the high end of this range at 13.9% of our gross inventory balance. Inventory
Warranty Liabilities
Cost of revenue includes the estimated cost of product warranties that are calculated at the point of revenue recognition. Under limited circumstances, we may offer an extended limited warranty to customers for certain products. Our products are complex and may contain defects or experience failures due to any number of issues in design, fabrication, packaging, materials and/or use within a system. If any of our products or technologies contains a defect, compatibility issue or other error, we may have to invest additional research and development efforts to find and correct the issue. Such efforts could divert our management’s and engineers’ attention from the development of new products and technologies and could increase our operating costs and reduce our gross margin. In addition, an error or defect in new products or releases or related software drivers after commencement of commercial shipments could result in failure to achieve market acceptance or loss of design wins. Also, we may be required to reimburse customers, including our customers’ costs to repair or replace products in the field. A product recall or a significant number of product returns could be expensive, damage our reputation and could result in the shifting of business to our competitors. Costs associated with correcting defects, errors, bugs or other issues could be significant and could materially harm our financial results.
In July 2008, we recorded a $196.0 million charge against cost of revenue to cover anticipated customer warranty, repair, return, replacement and other associated costs arising from a weak die/packaging material set in certain versions of our previous generation MCP and GPU products used in notebook systems. The MCP and GPU products that are impacted were included in a number of notebook products that were shipped and sold in significant quantities. Certain notebook configurations of these MCP and GPU products are failing in the field at higher than normal rates. While we have not been able to determine a root cause for these failures, testing suggests a weak material set of die/package combination, system thermal management designs, and customer use patterns are contributing factors. We intend to fully support our customers in their repair and replacement of these impacted MCP and GPU products that fail, and their other efforts to mitigate the consequences of these failures. We continue to not see any abnormal failure rates in any systems using NVIDIA products other than certain notebook configurations. However, we are continuing to test and otherwise investigate other products. There can be no assurance that we will not discover defects in other MCP or GPU products.
Determining the amount of the $196.0 million charge related to this issue required management to make estimates and judgments based on historical experience, test data and various other assumptions including estimated field failure rates that we believe to be reasonable under the circumstances. The results of these judgments formed the basis for our estimate of the total charge to cover anticipated customer warranty, repair, return and replacement and other associated costs. However, if actual repair, return, replacement and other associated costs and/or actual field failure rates exceed our estimates, we may be required to record additional reserves,
once established are not reversed until the related inventory has been sold or scrapped.which would increase our cost of revenue and materially harm our financial results.
Statement of Financial Accounting Standards No. 109, or SFAS No. 109,Accounting for Income Taxes, establishes financial accounting and reporting standards for the effect of income taxes. In accordance with SFAS No. 109, we recognize federal, state and foreign current tax liabilities or assets based on our estimate of taxes payable or refundable in the current fiscal year by tax jurisdiction. We also recognize federal, state and foreign deferred tax assets or liabilities, as appropriate, for our estimate of future tax effects attributable to temporary differences and carryforwards; and we record a valuation allowance to reduce any deferred tax assets by the amount of any tax benefits that, based on available evidence and judgment, are not expected to be realized.
United States income tax has not been provided on earnings of our non-U.S. subsidiaries to the extent that such earnings are considered to be permanently reinvested.
Our calculation of current and deferred tax assets and liabilities is based on certain estimates and judgments and involves dealing with uncertainties in the application of complex tax laws. Our estimates of current and deferred tax assets and liabilities may change based, in part, on added certainty or finality to an anticipated outcome, changes in accounting standards or tax laws in the United States, or foreign jurisdictions where we operate, or changes in other facts or circumstances. In addition, we recognize liabilities for potential United States and foreign income tax contingencies based on our estimate of whether, and the extent to which, additional taxes may be due. If we determine that payment of these amounts is unnecessary or if the recorded tax liability is less than our current assessment, we may be required to recognize an income tax benefit or additional income tax expense in our financial statements, accordingly. As of January 29, 2006,25, 2009, we had a valuation allowance of $233.0$92.5 million. Of the total valuation allowance, $178.3 million is attributable to certain net operating loss and tax credit carryforwards resulting from the exercise of employee stock options. The tax benefit of these net operating loss and tax credit carryforwards, if and when realized, will be accounted for as a credit to stockholders' equity. Of the remaining valuation allowance at January 29, 2006, $19.5$5.3 million relates to federal and state tax attributes acquired in certain acquisitions for which realization of the related deferred tax assets was determined not likely to be realized due, in part, to potential utilization limitations as a result of stock ownership changes;changes, and $35.2$87.2 million relates to certain state and foreign deferred tax assets that management determined not likely to be realized due, in part, to projections of future taxable income. To the extent realization of the deferred tax assets related to certain acquisitions becomes probable,more-likely-than-not, recognition of these acquired tax benefits would first reduce goodwill to zero, then reduce other non-current intangible assets related to the acquisition to zero with any remaining benefitbe reported as a reduction to income tax expense. Toexpense in accordance with the extentrecent accounting pronouncement, Statement of Financial Accounting Standards No. 141(R), or SFAS No. 141(R), Business Combinations, issued by the FASB in December 2007. We would also recognize an income tax benefit during the period that the realization of the deferred tax assets related to certain state or foreign tax benefits of $87.2 million becomes probable,more-likely-than-not.
In accordance with Statement of Financial Accounting Standards No. 123(R), or SFAS No. 123(R), Share Based Payment, our deferred tax assets do not include the excess tax benefit related to stock-based compensation that are a component of our federal and state net operating loss and research tax credit carryforwards in the amount of $588.7 million as of January 25, 2009. Consistent with prior years, the excess tax benefit reflected in our net operating loss and research tax credit carryforwards will be accounted for as a credit to stockholders’ equity, if and when realized. In determining if and when excess tax benefits have been realized, we have elected to do a with-and-without approach with respect to such excess tax benefits. We have also elected to ignore the indirect tax effects of stock-based compensation deductions for financial and accounting reporting purposes, and specifically to recognize the full effect of the research tax credit in income from continuing operations.
On January 29, 2007, we adopted FASB Interpretation No. 48, or FIN 48, Accounting for Uncertainty in Income Taxes, issued in July 2006. FIN 48 applies to all tax positions related to income taxes subject to SFAS No. 109. Under FIN 48 we recognize the benefit from a tax position only if it is more-likely-than-not that the position would recognize anbe sustained upon audit based solely on the technical merits of the tax position. The cumulative effect of adoption of FIN 48 did not result in a material adjustment to our tax liability for unrecognized income tax benefitbenefits. Our policy to include interest and penalties related to unrecognized tax benefits as a component of income tax expense did not change as a result of implementing the FIN 48. Please refer to Note 13 of these Notes to the Consolidated Financial Statements in the period such asset is more likely than not to be realized.Part IV, Item 15 of this Form 10-K for additional information.
Our impairment review process compares the fair value of the reporting unit in which the goodwill resides to its carrying value. ForWe determined that our reporting units are equivalent to our operating segments or components of an operating segment for the purposes of completing our Statement of Financial Accounting Standards No. 142, or SFAS No. 142,Goodwill and Other Intangible Assets, impairment
test, we performed our analysis on a reporting unit basis.test. We utilize a two-step approach to testing goodwill for impairment. The first step tests for possible impairment by applying a fair value-based test. In computing fair value of our reporting units, we use estimates of future revenues, costs and cash flows from such units. The second step, if necessary, measures the amount of such
an impairment by applying fair value-based tests to individual assets and liabilities.
We electedGoodwill is subject to
perform our annual
goodwill impairment
reviewtest during the fourth quarter of
eachour fiscal
year.year, or earlier if indicators of potential impairment exist, using a fair value-based approach. We completed our most recent annual impairment test during the fourth quarter of fiscal
2006year 2009 and concluded that there was no impairment.
This assessment is based upon a discounted cash flow analysis and analysis of our market capitalization. The estimate of cash flow is based upon, among other things, certain assumptions about expected future operating performance such as revenue growth rates and operating margins used to calculate projected future cash flows, risk-adjusted discount rates, future economic and market conditions, and determination of appropriate market comparables. Our estimates of discounted cash flows may differ from actual cash flows due to, among other things, economic conditions, changes to our business model or changes in operating performance. Additionally, certain estimates of discounted cash flows involve businesses with limited financial history and developing revenue models, which increase the risk of differences between the projected and actual performance. Significant differences between these estimates and actual cash flows could materially affect our future financial results. These factors increase the risk of differences between projected and actual performance that could impact future estimates of fair value of all reporting units. In addition, determining the number of reporting units and the fair value of a reporting unit requires us to make judgments and involves the use of significant estimates and assumptions. We also make judgments and assumptions in allocating assets and liabilities to each of our reporting units. We base our fair value estimates on assumptions we believe to be reasonable but that are unpredictable and inherently uncertain. The long-term financial forecast represents the best estimate that we have at this time and we believe that its underlying assumptions are reasonable. However,
actual performance in the near-term and longer-term could be materially different from these forecasts, which could impact future
events or circumstancesestimates of fair value of our reporting units and may result in a charge to earnings in future periods due to the potential for a write-down of goodwill in connection with such tests.
Cash Equivalents and Marketable Securities
Fair Value
In the current market environment, the assessment of the fair value of debt instruments can be difficult and subjective. The volume of trading activity of certain debt instruments has declined, and the rapid changes occurring in today’s financial markets can lead to changes in the fair value of financial instruments in relatively short periods of time. Statement of Financial Accounting Standards No. 157, or SFAS No. 157, Fair Value Measurements, establishes three levels of inputs that may be used to measure fair value. Please refer to Note 17 of the Notes to the Consolidated Financial Statements in Part IV, Item 15 of this Form 10-K. We measure our cash equivalents and marketable securities at fair value. The fair values of our financial assets and liabilities are determined using quoted market prices of identical assets or quoted market prices of similar assets from active markets. Level 1 valuations are obtained from real-time quotes for transactions in active exchange markets involving identical assets. Level 2 valuations are obtained from quoted market prices in active markets involving similar assets. Level 3 valuations are based on unobservable inputs to the valuation methodology and include our own data about assumptions market participants would use in pricing the asset or liability based on the best information available under the circumstances. Each level of input has different levels of subjectivity and difficulty involved in determining fair value. While most of our cash equivalents and marketable securities are valued based on Level 2 inputs, the valuation of our holdings of the Reserve International Liquidity Fund, Ltd., or International Reserve Fund are classified as a Level 3 input due to the inherent subjectivity and the significant judgment involved in its valuation. Total financial assets at fair value classified within Level 3 were 3.7% of total assets on our Consolidated Balance Sheet as of January 25, 2009.
Other Than Temporary Impairment
We account for our investment instruments in accordance with Statement of Financial Accounting Standards No. 115, or SFAS No. 115, Accounting for Certain Investments in Debt and Equity Securities. All of our cash equivalents and marketable securities are treated as “available-for-sale” under SFAS No. 115. All of our available-for-sale investments are subject to a periodic impairment review. Investments are considered to be impaired when a decline in fair value is judged to be other-than-temporary when the resulting fair value is significantly below cost basis and/or the significant decline has lasted for an extended period of time. The evaluation that we use to determine whether a marketable security is impaired is based on the specific facts and circumstances present at the time of assessment, which include the consideration of general market conditions, the duration and extent to which fair value is below cost, and our intent and ability to hold an investment for a sufficient period of time to allow for recovery in value. We also consider specific adverse conditions related to the financial health of and business outlook for an investee, including industry and sector performance, changes in technology, operational and financing cash flow factors, and changes in an investee’s credit rating. Investments that we identify as having an indicator of impairment are subject to further analysis to determine if the investment is other than temporarily impaired, in which case we write down the investment to its estimated fair value. During fiscal year 2009, we recorded other than temporary impairment charges of $9.9 million. These charges include $5.6 million related to what we believe is an other than temporary impairment of our investment in the money market funds held by the International Reserve Fund; $2.5 million related to a decline in the value of publicly traded equity securities and $1.8 million related to debt securities held by us that were issued by companies that have filed for bankruptcy as of January 25, 2009.
Stock-based Compensation
Effective January 30, 2006, we adopted the provisions of SFAS No. 123(R), which establishes accounting for stock-based awards exchanged for employee services. Accordingly, stock-based compensation cost is measured at grant date, based on the fair value of the awards, and is recognized as expense over the requisite employee service period. Stock-based compensation expense recognized during fiscal years 2009, 2008 and 2007 was $162.7 million, $133.4 million and $116.7 million, respectively, which consisted of stock-based compensation expense related to stock options and our employee stock purchase plan. Please refer to Note 2 of the Notes to the Consolidated Financial Statements in Part IV, Item 15 of this Form 10-K for further information.
We elected to adopt the modified prospective application method as provided by SFAS No. 123(R), beginning January 30, 2006. We recognize stock-based compensation expense using the straight-line attribution method. We estimate the value of employee stock options on the date of grant using a binomial model. The determination of fair value of share-based payment awards on the date of grant using an option-pricing model is affected by our stock price as well as assumptions regarding a number of highly complex and subjective variables. These variables include, but are not limited to, the expected stock price volatility over the term of the awards, actual and projected employee stock option exercise behaviors, vesting schedules, death and disability probabilities, expected volatility and risk-free interest. Our management determined that the use of implied volatility is expected to be more reflective of market conditions and, therefore, could reasonably be expected to be a better indicator of our expected volatility than historical volatility. The risk-free interest rate assumption is based upon observed interest rates appropriate for the term of our employee stock options. The dividend yield assumption is based on the history and expectation of dividend payouts. We began segregating options into groups for employees with relatively homogeneous exercise behavior in order to calculate the best estimate of fair value using the binomial valuation model.
Using the binomial model, the fair value of the stock options granted under our stock option plans have been estimated using the following assumptions during the year ended January 25, 2009:
Weighted average expected life of stock options (in years) | | | | |
| | | | |
| | | | |
| | | | |
For our employee stock purchase plan we continue to use the Black-Scholes model. The fair value of the shares issued under the employee stock purchase plan has been estimated using the following assumptions during year ended January 25, 2009:
Weighted average expected life of stock options (in years) | | | | |
| | | | |
| | | | |
| | | | |
SFAS No. 123(R) also requires forfeitures to be estimated at the time of grant and revised, if necessary, in subsequent periods if actual forfeitures differ from those estimates. Forfeitures were estimated based on historical experience. If factors change and we employ different assumptions in the application of SFAS No. 123(R) in future periods, the compensation expense that we record under SFAS No. 123(R) may differ significantly from what we have recorded in the current period.
Litigation, Investigation and Settlement Costs
From time to time, we are involved in legal actions and/or investigations by regulatory bodies. We are aggressively defending our current litigation matters for which we are responsible. However, there are many uncertainties associated with any litigation or investigations, and we cannot be certain that these actions or other third-party claims against us will be resolved without costly litigation, fines and/or substantial settlement payments. If that occurs, our business, financial condition and results of operations could be materially and adversely affected. If information becomes available that causes us to determine that a loss in any of our pending litigation, investigations or settlements is probable, and we can reasonably estimate the loss associated with such events, we will record the loss in accordance with accounting principles generally accepted in the United States. However, the actual liability in any such litigation or investigations may be materially different from our estimates, which could require us to record additional costs.
The following table sets forth, for the periods indicated, certain items in our consolidated statements of incomeoperations expressed as a percentage of revenue. | | | | | | | | | |
| | | Year Ended | |
| | | January 29,
2006 | | | January 30,
2005 | | | January 25,
2004 | |
| | | (As Restated) | | | (As Restated) | | | (As Restated) | |
Revenue | | 100.0 | % | | 100.0 | % | | 100.0 | % |
Cost of revenue | | 61.7 | | | 67.8 | | | 71.2 | |
| | | | | | | | | |
Gross profit | | 38.3 | | | 32.2 | | | 28.8 | |
Operating expenses: | | | | | | | | | |
Research and development | | 15.0 | | | 17.3 | | | 16.0 | |
Sales, general and administrative | | 8.5 | | | 10.2 | | | 9.9 | |
In-process research and development | | — | | | — | | | 0.2 | |
Settlement costs | | 0.6 | | | — | | | — | |
| | | | | | | | | |
Total operating expenses | | 24.1 | | | 27.5 | | | 26.1 | |
| | | | | | | | | |
Income from operations | | 14.2 | | | 4.7 | | | 2.7 | |
Interest and other income, net | | 0.8 | | | 0.6 | | | (0.2 | ) |
| | | | | | | | | |
Income before income tax expense (benefit) | | 15.0 | | | 5.3 | | | 2.5 | |
Income tax expense (benefit) | | 2.3 | | | 0.9 | | | (0.2 | ) |
| | | | | | | | | |
Net income | | 12.7 | % | | 4.4 | % | | 2.7 | % |
| | | | | | | | | |
| | | Year Ended | |
| | | January 25, 2009 | | January 27, 2008 | | January 28, 2007 | |
| | | | | | | | |
| | | | | | | | |
| | | | | | | | |
| | | | | | | | |
| | | | | | | | |
Sales, general and administrative | | | | | | | | |
Restructuring charges and other | | | | | | | | |
| | | | | | | | |
Income (loss) from operations | | | | | | | | |
Interest and other income, net | | | | | | | | |
Income (loss) before income taxes | | | | | | | | |
Income tax expense (benefit) | | | | | | | | |
| | | | | | | | |
Fiscal Years Ended January
29, 2006,25, 2009, January
30, 2005,27, 2008 and January
25, 2004.28, 2007
Revenue
RevenueDuring the first quarter of fiscal 2006, we reorganized our operating segments to bring all major product groups in line with our strategy to position ourselves as the worldwide leader in programmable graphics processor technologies. We now report financial information for four major product-line operating segments to our Chief Executive Officer, who is considered to be our chief operating decision maker, or CODM, as follows: the GPU Business, thebusiness, PSB, MCP Business, the Handheld GPU Business,business, and the Consumer Electronics Business.CPB. Revenue in the “All Other”"All Other" category is primarily derived from sales of memory.components. Please refer to Note 1516 of theour Notes to the Consolidated Financial Statements in Part IV, Item 15 of this Form 10-K for further information.
Fiscal 2005Year 2009 vs. Fiscal Year 2008
Revenue was $3.42 billion for fiscal year 2009, compared to $4.10 billion for fiscal year 2008, which represents a 53-weekdecrease of 16%. For the first quarter of fiscal 2010, we expect revenue to remain flat or improve slightly when compared to the fourth quarter of fiscal year 2009. A discussion of our revenue results for each of our operating segments is as follows:
GPU Business. GPU business revenue decreased by 24% to $1.91 billion for fiscal year 2009, compared to $2.52 billion for fiscal year 2008. This decrease resulted from decreased sales of our desktop GPU and memory products, offset by increased sales of our notebook GPU products. Sales of our desktop GPU and memory products decreased approximately 29% and 59%, respectively, in fiscal year 2009 when compared to fiscal 2006year 2008. These decreases were primarily due to a decline in the Standalone Desktop market segment as reported in the December 2008 PC Graphics Report from Mercury Research, driven by a combination of market migration from desktop PCs towards notebook PCs and 2004an overall market shift in the mix of products towards lower priced products. This overall market decline translated into a decline of over 20% in the number of units of desktop GPU products that we sold in fiscal year 2009 compared to fiscal year 2008. The decline in desktop GPU revenue also reflects the impact of a slight average sales price regression in our products and a decline in our share position during the middle portion of fiscal year 2009 as a result of increased competition. Memory sales declined as a result of a decline in sales of our high-end desktop GPU products. Sales of our notebook GPU products increased approximately 3% in fiscal year 2009 when compared to fiscal year 2008, due to higher unit sales aided by a market move toward notebook PCs over desktop PCs, offset by a slight decline in average selling prices. Additionally, the overall global economic recessionary climate contributed to a significant decline in the demand for total graphics during the fourth quarter of fiscal year 2009.
PSB. PSB revenue increased by 18% to $693.4 million for fiscal year 2009, compared to $588.4 million for fiscal year 2008. Our NVIDIA professional workstation product sales increased due to an overall unit increase of approximately 15% in shipments of boards and chips as compared to fiscal year 2008, due to strong demand and our transition from previous generations of NVIDIA Quadro professional workstation products to GeForce 8-based and GeForce 9-based products. Sales of NVIDIA Quadro CX for Adobe’s CS4 software, which were 52-week years,we launched in the third quarter of fiscal year 2009, also contributed towards the increase in sales in fiscal year 2009.
MCP Business. MCP business revenue decreased by 8% to $655.6 million for fiscal year 2009, compared to $710.4 million for fiscal year 2008. This decrease was due to a decline of approximately 32% in sales of our AMD-based platform products resulting from increased competition in AMD-based products, offset by an increase of approximately 120% in sales of our Intel-based platform products. The increase in Intel-based product sales was driven by sales of our GeForce 9400M mGPU, which we launched in October 2008 along with Apple Inc., or Apple, for their new lineup of Mac notebooks, and we believe that this extra week may have hadour new GeForce 9400 and 9300 mGPUs for Intel desktop PCs.
CPB. CPB revenue decreased by 46% to $136.3 million for fiscal year 2009, compared to $251.1 million for fiscal year 2008. The decline in CPB revenue is primarily driven by a positive impact oncombination of a decrease in revenue from our cell phone products and a decrease in revenue from Sony Computer Entertainment, or SCE. The decrease in revenue from our cell phone products resulted from our shift from marketing and developing legacy products to achieving design wins and marketing our newer Tegra products. The decrease in our revenue from SCE resulted from a decline in fiscal 2005. However, we are not ablelicense revenue and a decline in royalty revenue that was caused by a lower number of units shipped as well as by a step-down in the per unit royalty rate during the year due to quantify the effectachievement of the slightly longer year ona unit-based milestone in our revenue.agreement with SCE.
Fiscal Year
20062008 vs. Fiscal Year
20052007
Revenue was $2.4$4.10 billion for fiscal 2006,year 2008, compared to $2.0$3.07 billion for fiscal 2005,year 2007, which represents an increase of 18.2%34%. A discussion of our revenue results for each of our operating segments is as follows: GPU Business. GPU Businessbusiness revenue increased by 22.6%47% to $1.7$2.52 billion forin fiscal 2006year 2008, compared to $1.4$1.71 billion forin fiscal 2005. The increaseyear 2007. This improvement was the result ofprimarily due to increased sales of our desktop GPU products and notebook GPU products. Sales of our desktop GPU products increased by approximately 38% compared to fiscal year 2007, primarily due to growth of the Standalone Desktop market as reported in the December 2007 PC Graphics Report from Mercury Research. Our leadership position in the Standalone Desktop market was driven by our GeForce 68-based products. Sales of our notebook GPU products increased by approximately 114% compared to fiscal year 2007. Notebook GPU revenue growth was primarily due to share gains in the Standalone Notebook category as reported in the December 2007 PC Graphics Report from Mercury Research. Our share gains in the Standalone Notebook category were primarily a result of shipments of products used in notebook PC design wins related to Intel’s Santa Rosa platform used in notebooks.
PSB. PSB revenue increased by 29% to $588.4 million in fiscal year 2008, compared to $454.7 million in fiscal year 2007. Our professional workstation product sales increased due to an overall increase in shipments of boards and chips. This increase in shipments was primarily driven by our transition from previous generations of NVIDIA Quadro professional workstation products to GeForce 7 families8-based products.
MCP Business. MCP business revenue increased by 7% to $710.4 million in fiscal year 2008, compared to $661.5 million in fiscal year 2007. The increase resulted from an approximate 225% increase in sales of desktop GPUs that serveour Intel-based platform products as compared to fiscal year 2007. We began ramping up shipments of our Intel-based platform products after the high-end GPU segment,third quarter of fiscal year 2007. This increase was offset by a slight decline in sales of our mainstream GPU products. In addition,AMD-based platform products and sales of products related to our NVIDIA Quadro professional workstation products and notebook products continuedacquisition of ULi Electronics, Inc. in February 2006.
CPB. CPB revenue increased by 8% to improve due to an increased mix of GeForce 6-based and GeForce 7-based products, which resulted$251.1 million in an increase in average selling prices.MCP Business. MCP Business revenue was $352.3 million for fiscal 2006,year 2008, compared to $175.7$233.2 million forin fiscal 2005, which represents an increase of 100.6%.year 2007. The overall increase in MCP BusinessCPB revenue is primarily due to increased sales of NVIDIA nForce4 products, which we began selling during the fourth quarter of fiscal 2005, and an increase in average selling prices. The overall increaseroyalties from Sony Computer Entertainment, or SCE, but was offset by a decreasedecreases in sales of NVIDIA nForce3 and NVIDIA nForce2 products.
Handheld GPU Business. Handheld GPU Business revenue was $58.7 million for fiscal 2006, compared to $45.9 million for fiscal 2005, which represents an increase of 27.9%. The overall increase in Handheld GPU Business revenue is due to an increase in average selling prices of high-end featurefrom our cell phone products and revenue recognized as a resultour contractual development arrangements with SCE.
Concentration of a development contract.Revenue Consumer Electronics Business. Consumer Electronics Business We generated 87%, 89% and 86% of our total revenue was $170.2 million for fiscal 2006, compared to $260.0 million for fiscal 2005, which represents a decrease of 34.5%. The decrease in our Consumer Electronics Business is a result of decreasedyears 2009, 2008 and discontinued sales of our Xbox-related products to Microsoft, partially offset by revenue recognized from our contractual arrangement with SCE. During the first quarter of fiscal 2006, Microsoft indicated that it would not order any more Xbox-related products from us after our second fiscal quarter. As a result, the second quarter of fiscal 2006 was the last quarter during which we recognized revenue from the sale of our Xbox-related products to Microsoft. During fiscal 2006, we recognized $49.0 million of revenue from our contractual arrangements with SCE to jointly develop a custom GPU incorporating our next-generation GeForce GPU and SCE’s system solutions in SCE’s PlayStation3. No such revenue was recognized during our fiscal 2005 as our definitive agreement with SCE was not executed until the first quarter of fiscal 2006.Fiscal Year 2005 vs. Fiscal Year 2004
Revenue was $2.0 billion in fiscal 2005, compared to $1.8 billion in fiscal 2004, which represented an increase of 10.3%. Fiscal 2005 was a 53-week year, compared to fiscal 2004 which was a 52-week year.
GPU Business. GPU Business revenue increased by 7.1% to $1.4 billion for fiscal 2005 compared to $1.3 billion for fiscal 2004. The increase was primarily the result of increased sales of our NVIDIA Quadro professional workstation products in fiscal 2005, which was due to unit sales volume increases, and an increase in average selling prices as a result of increased board sales. Notebook GPU sales increased in fiscal 2005 as a result of sales of our GeForce FX Go notebook GPU products outpacing the decline in our older notebook GPU product lines during the period. Sales of desktop products increased in fiscal 2005 as a result of a significant increase in sales of our high-end desktop products, offset by a slight decrease in mainstream desktop products. High-end desktop sales increased in fiscal 2005 primarily due to unit volume increases primarily related to our GeForce 6800 and 6600 products. The decrease in mainstream desktop sales in fiscal 2005 was mainly due to competitive pricing in the mainstream segment offset by the ramp of product sales of our GeForce 6200 with TurboCache technology during the fourth quarter of fiscal 2005.
MCP Business. MCP Business revenue increased by 8.1% to $175.7 million for fiscal 2005 compared to $162.4 million for fiscal 2004. The increase in MCP Business revenue is due to increased sales of NVIDIA nForce3 and NVIDIA nForce4 products. NVIDIA nForce4 products began selling during the fourth quarter of fiscal 2005. This increase was offset by a decrease in sales of NVIDIA nForce2 products.
Handheld GPU Business. Handheld GPU Business revenue increased by 409.7% to $45.9 million for fiscal 2005 compared to $9.0 million for fiscal 2004. The increase in handheld GPU sales in fiscal 2005 was primarily due to our acquisition of MediaQ, Inc. in the third quarter of fiscal 2004, which represented our initial entry into the handheld segment and to sales of our GoForce 4000 product.
Consumer Electronics Business. Consumer Electronics Business revenue decreased by 7.2% to $260.0 million for fiscal 2005 compared to $280.1 million for fiscal 2004. The decrease in our Consumer Electronics Business is due to unit sales volume increases offset by a lower average sales price. Sales of our Xbox products historically fluctuated based on the timing of orders from Microsoft.
Concentration of Revenue
Revenue2007, respectively, from sales to customers outside of the United States and other Americas accounted for 84%, 76% and 75% of total revenue for fiscal 2006, 2005 and 2004, respectively.Americas. Revenue by geographic region is allocated to individual countries based on the location to which the products are initially billed even if the foreign contract equipment manufacturers, or CEMs’, add-in board and motherboard manufacturers’ revenue is attributable to end customers in a different location. The increase in
Revenue from significant customers, those representing approximately 10% or more of total revenue for the percentage of revenue from sales to customers outside of the United Statesrespective periods, is summarized as follows:
| | | Year Ended | |
| | | January 25, 2009 | | | January 27, 2008 | | | January 28, 2007 | |
| Revenue: | | | | | | | | | |
| | | | | | | | | | |
| | | | | | | | | | |
Gross Profit and other Americas for fiscal 2006 as compared to fiscal 2005 and for fiscal 2005 as compared to fiscal 2004 is primarily due to decreased sales of XGPUs and MCPs used in the Microsoft Xbox product, which were billed to Microsoft in the United States.Sales to our two largest customers accounted for approximately 26%, 31%, and 36% of our revenue during fiscal 2006, 2005 and 2004, respectively.
Gross ProfitMargin
Gross profit consists of total revenue, net of allowances, less cost of revenue. Cost of revenue consists primarily of the cost of semiconductors purchased from subcontractors, including wafer fabrication, assembly, testing and packaging, manufacturing support costs, including labor and overhead associated with such purchases, final test yield fallout, inventory and warranty provisions, and shipping costs. Cost of revenue also includes development costs for license and service arrangements.
Gross margin is the percentage of gross profit to revenue. Our gross margin can vary in any period depending onwas 34.3%, 45.6% and 42.4% for fiscal years 2009, 2008 and 2007, respectively. Our gross margin is significantly impacted by the mix of types of products sold. Ourwe sell. Product mix is often difficult to estimate with accuracy. Therefore, if we experience product transition or competitive challenges, if we achieve significant revenue growth in our lower margin product lines, or if we are unable to earn as much revenue as we expect from higher margin product lines, our gross margin was 38.3%, 32.2%may be negatively impacted.
We will continue to focus on improving our gross margin by delivering cost effective product architectures, enhancing business processes and
28.8% for fiscal 2006, 2005 and 2004.delivering profitable growth. A discussion of our gross margin results for each of our operating segments is as follows:
Fiscal Year 20062009 vs. Fiscal Year 20052008 Our gross margin declined to 34.3% in fiscal year 2009 from 45.6% for fiscal year 2008. The gross margin for fiscal year 2009 includes the impact of a $196.0 million charge against cost of revenue to cover anticipated customer warranty, repair, return, replacement and associated costs arising from a weak die/packaging material set in certain versions of our previous generation MCP and GPU products used in notebook systems offset by allocated insurance claim proceeds of $6.7 million from an insurance provider. This warranty charge had an adverse impact of approximately 6.0% on our gross margin for fiscal year 2009. Additionally, inventory reserves taken during fiscal year 2009 were approximately $50.0 million higher compared to fiscal year 2008, reflecting a significant decline in our forecasted future demand for the related products and having a negative impact on our gross margin.
GPU Business. The gross margin of our GPU
Business increasedbusiness decreased during fiscal
2006year 2009 as compared to fiscal
2005, primarilyyear 2008. This decrease was due to
the salea charge against cost of revenue to cover anticipated customer warranty, repair, return, replacement and associated costs arising from a weak die/packaging material set in certain versions of our
GeForce 7 series GPUsprevious generation GPU products used in notebook systems, the negative impact of inventory reserves taken during the fourth quarter of fiscal year 2009, and
increasedaverage sales
ofprice regression in our GeForce
6 series GPUs, which collectively now account for approximately 78%9-based and previous generations of
our GPU Business revenue. Our GeForce 7desktop products resulting from increased competition. The average sales price regression was also driven by a combination of market migration from desktop PCs towards notebook PCs and
our GeForce 6 series GPUs generally have higher gross margins than our GeForce FX series GPUs which comprised 53%an overall market shift in the mix of
our fiscal 2005 GPU Business revenue. In addition, average selling prices from our notebook GeForce 7 and GeForce 6 series GPU products
increased as a larger percentage of our total notebook revenue during fiscal 2006 as compared to fiscal 2005.towards lower priced products.
MCP Business PSB. The gross margin of our MCP BusinessPSB increased slightly during fiscal 2006year 2009 as compared to fiscal 2005,year 2008. This increase was primarily due to the increase in revenue from sales of our NVIDIA nForce3 and NVIDIA nForce4 products, which to date have experienced higher gross margins than previous generations of NVIDIA nForce products.Handheld GPU Business. The gross margin of our Handheld GPU Business increased during fiscal 2006 as compared to fiscal 2005, primarily due to the inventory write-off of certain handheld products in the third quarter of fiscal 2005.
Consumer Electronics Business. The gross margin of our Consumer Electronics Business increased during fiscal 2006 as compared to fiscal 2005, primarily due to the reduction of die costs for Xbox-related products, and the recognition of revenue from our contractual arrangements with SCE to jointly develop a custom GPU incorporating our next-generation GeForce GPU and SCE’s system solutions in SCE’s PlayStation3.
Fiscal Year 2005 vs. Fiscal Year 2004
GPU Business. The gross margin of our GPU Business increased during fiscal 2005 as compared to fiscal 2004. Our GeForce FX series of GPU products experienced lower gross margins than previous series of GeForce GPU products, such as the GeForce 4 series. Company-wide efforts were made to drive down cost and improve gross margin and, as a result, during fiscal 2005, we were able to improve our gross margin. In addition, in fiscal 2005, we realized increased sales of our performance GeForce FX desktop GPU products and began shipping our GeForce 6 series GPUs, which are among our highest gross margin products. Finally, revenue from our9-based NVIDIA Quadro professional workstation products, which typically providebegan selling in the highest gross marginsfourth quarter of any of our products, increased as a percentage of our total revenue during fiscal 2005. This increase in our mix of revenue toward higher-margin products led to a positive impact on our overall gross margin.
MCP Business. The gross margin of our MCP Business increased during the fiscal 2005 as compared fiscal 2004 primarily due to the increase in revenue from sales of ouryear 2008, and GeForce 8-based NVIDIA nForce3 and NVIDIA nForce4Quadro products, which to dategenerally have experienced higher gross margins than our previous generations of NVIDIA nForceQuadro products.
Handheld GPU MCP Business. The gross margin of our Handheld GPU BusinessMCP business decreased during fiscal 2005year 2009 as compared to fiscal 2004year 2008, due to decline in the margins of our AMD and Intel-based products. During fiscal year 2009, gross margins declined primarily due to a charge against cost of revenue to cover anticipated customer warranty, repair, return, replacement and associated costs arising from a weak die/packaging material set in certain versions of our previous generation MCP products used in notebook systems.
CPB. The gross margin of our CPB increased during fiscal year 2009 as compared to fiscal year 2008. This increase was primarily due to changes in the inventory write-offproduct mix in our CPB product lines. We experienced greater revenue decline in our lower margin cell phone and other handheld devices product lines as compared to higher margin SCE transactions in the current year.
Fiscal Year 2008 vs. Fiscal Year 2007
GPU Business. The gross margin of certain handheld productsour GPU business increased during fiscal year 2008 as compared to fiscal year 2007. This increase was primarily due to increased sales of our GeForce 8-series GPUs, which began selling in the third quarter of fiscal 2004.year 2007. Our GeForce 8-series GPUs generally have higher gross margins than our previous generations of GPUs. Additionally, the more favorable costs of memory purchases during fiscal year 2008, positively impacted our gross margin.
Consumer Electronics Business PSB. The gross margin of our Consumer Electronics Business decreasedPSB increased during fiscal 2005year 2008 as compared to fiscal 2004year 2007. This increase was primarily due to the pricing settlement with Microsoft that we announced on February 6, 2003 that related toincreased sales of our Xbox related processors. In addition,GeForce 8-based NVIDIA Quadro products, which began selling in the fourth quarter of fiscal year 2007 and generally have higher gross margins than our previous generations of NVIDIA Quadro products.
MCP Business. The gross margin of our MCP business increased during fiscal 2005year 2008 as compared to fiscal year 2007. This increase was primarily due to a shift in product mix towards Intel-based platform products, which began to ramp up shipments after the third quarter of fiscal year 2007, and inventory reserves that we realizedrecorded as a lower average sales price on our salescharge to cost of Xbox processors.Consolidated Gross Margin
The improvement in our gross margin reflects our continuing focus on delivering cost effective product architectures, enhancing business processes and delivering profitable growth. We expect gross margin to improve by approximately 0.5% to 1.0%revenue during the first quarter of fiscal year 2007 of approximately $4.1 million related to certain NVIDIA nForce purchase commitments that we believed had exceeded future demand.
CPB. The gross margin of our CPB decreased during fiscal year 2008 as compared to fiscal year 2007. This decrease was primarily due to a drop in gross profit realized from sales of our high-end feature cellular phone and other handheld devices. However, increased royalties from SCE during fiscal year 2008, offset the decreases.
| | | Year Ended | | | Year Ended | |
| | | January 25, 2009 | | January 27, 2008 | | | $ Change | | | % Change | | | January 27, 2008 | | | January 28, 2007 | | | $ Change | | | % Change | |
| | | (In millions) | | | | | | | (In millions) | | | | | |
Research and development expenses | | | | | | | | | | | | | | | | | | | | | | | | | | | | | | | | |
Sales, general and administrative expenses | | | | | | | | | | | | | | | | | | | | | | | | | | | | | | | | |
Restructuring charges and other | | | | | | | | | | | | | | | | | | | | | | | | | | | | | | | | |
| | | | | | | | | | | | | | | | | | | | | | | | | | | | | | | | |
Research and development as a percentage of net revenue | | | | | | | | | | | | | | | | | | | | | | | | | | | | | | | | |
Sales, general and administrative as a percentage of net revenue | | | | | | | | | | | | | | | | | | | | | | | | | | | | | | | | |
Research and Development | | | | | | | | | | | | | | | | | | | | | | | | | | | | | | |
| | | Year Ended | | | $
Change | | | %
Change | | | Year Ended | | | $
Change | | | %
Change | |
| | | Jan. 29, 2006 | | | Jan. 30, 2005 | | | | | Jan. 30, 2005 | | | Jan. 25, 2004 | | | |
| | | (As Restated) | | | (As Restated) | | | | | (As Restated) | | | (As Restated) | | | |
| | | (in millions) | |
| Research and Development: | | | | | | | | | | | | | | | | | | | | | | | | | | | | | | |
Salaries and benefits | | $ | 206.0 | | | $ | 173.6 | | | $ | 32.4 | | | 19 | % | | $ | 173.6 | | | $ | 137.6 | | | $ | 36.0 | | | 26 | % |
Computer software and lab equipment | | | 46.4 | | | | 41.1 | | | | 5.3 | | | 13 | % | | | 41.1 | | | | 36.9 | | | | 4.2 | | | 11 | % |
| | | | | | | | |
New product development | | | 28.6 | | | | 29.0 | | | | (0.4 | ) | | (1 | )% | | | 29.0 | | | | 18.6 | | | | 10.4 | | | 56 | % |
Facility expense | | | 32.0 | | | | 31.4 | | | | 0.6 | | | 2 | % | | | 31.4 | | | | 28.3 | | | | 3.1 | | | 11 | % |
Depreciation and amortization | | | 58.2 | | | | 56.1 | | | | 2.1 | | | 4 | % | | | 56.1 | | | | 44.6 | | | | 11.5 | | | 26 | % |
License and development project costs | | | (28.9 | ) | | | (2.0 | ) | | | (26.9 | ) | | (1,345 | )% | | | (2.0 | ) | | | — | | | | (2.0 | ) | | — | |
Stock-based compensation | | | 5.0 | | | | 13.1 | | | | (8.1 | ) | | (62 | )% | | | 13.1 | | | | 22.2 | | | | (9.1 | ) | | (41 | )% |
Other | | | 9.8 | | | | 5.9 | | | | 3.9 | | | 66 | % | | | 5.9 | | | | 4.0 | | | | 1.9 | | | 48 | % |
| | | | | | | | | | | | | | | | | | | | | | | | | | | | | | |
Total | | $ | 357.1 | | | $ | 348.2 | | | $ | 8.9 | | | 3 | % | | $ | 348.2 | | | $ | 292.2 | | | $ | 56.0 | | | 19 | % |
| | | | | | | | | | | | | | | | | | | | | | | | | | | | | | |
Research and development as a percentage of net revenue | | | 15 | % | | | 17 | % | | | | | | | | | | 17 | % | | | 16 | % | | | | | | | |
Fiscal Year 2009 vs. Fiscal Year 2008
Research and development expenses
increased by $8.9were $855.9 million and $691.6 million during fiscal years 2009 and 2008, respectively, an increase of $164.3 million, or
3%, from fiscal 2005 to fiscal 200624%. The increase was primarily due to
a $32.4 million increase in salaries and benefits
by approximately $64.9 million primarily as a result of the net addition of approximately 500 personnel in departments related to
423 additional personnelresearch and
development functions, offset by lower expenses during fiscal year 2009 related to our variable compensation programs when compared to fiscal year 2008. Stock-based compensation expense increased by $21.4 million primarily because of the impact of new hire and semi-annual stock awards granted subsequent to the third quarter of fiscal year 2008, offset by a
$5.3 million increasereduction in
computer softwareexpense related to older stock awards that were almost fully vested and
equipment primarily due to increased allocationfor which the related expense had been almost fully amortized by the end of
information technology expenses. Otherthe first quarter of fiscal year 2009. Development expenses increased
$3.9by $18.8 million primarily due to
travelincrease in expenses related to engineering services, prototype materials and
other employee related expenses associated with the expansion of our international sites. Depreciation andamortization increased $2.1 million due to increased purchases of hardware and software equipment and facilities increased $0.6 million due to increased facilities expense allocation, both of which were based on the growthinternal board requests. Other increases in headcount. These increases were offset by a decrease in stock-based compensation expense of $8.1 million and an increase of $26.9 million in licenseresearch and development project costs,expenses are primarily related to increased development costs related to our collaboration with SCEthat were driven by personnel growth, including depreciation and other engineering costs related to a different development contract. As a portion of our personnel who usually devote their time to researchamortization, facilities, and development efforts have been focusing their efforts on these development projects, the costs associated with these individuals are not charged to researchcomputer software and development, but were charged to cost of revenue in our consolidated statements of income, or were capitalized on our consolidated balance sheets and will be recognized as cost of revenue, on a percentage of completion basis.
equipment.
Fiscal Year 2008 vs. Fiscal Year 2007
Research and development expenses increased by $56.0were $691.6 million and $553.5 million during fiscal years 2008 and 2007, respectively, an increase of $138.1 million, or 19%, from fiscal 200425%. The increase is primarily related to fiscal 2005 primarily due to a $36.0 millionan increase in salaries and benefits by approximately $95.3 million as a result of personnel growth in departments related to 174research and development functions by approximately 600 additional personnel in fiscal year 2008. Additionally, salaries and a $10.4 millionbenefits expenses also increased due to the increase in new product development costsour variable compensation expense as a result of our financial performance for fiscal year 2008. Facilities expenses and expenses related to an overall increase in the number of product tape-outs and in prototype materials. Depreciation and amortization increased $11.5 million due to emulation hardware and software programs that were purchased during fiscal 2004, resulting in a full year of depreciation in fiscal 2005 compared to a partial year of depreciation in fiscal 2004. Computercomputer software and equipment also increased $4.2 million primarily dueas a result of the personnel growth.
In order to increased allocation of information technology expenses and facilities increased $3.1 million due to increased facilities expense allocation, both of which were based on the growth in headcount. Other expenses increased $1.9 million primarily due to travel and other employee related expenses associated with the expansion of our international sites. These increases were offset by a decrease in stock-based compensation expense of $9.1 million and an increase of $2.0 million in license and development project costs related to our collaboration with SCE that are classified as cost of revenue in our consolidated statements of income, or were capitalized on our consolidated balance sheets and will be recognized on a percentage of completion basis. Our collaboration with SCE was not in effect during fiscal 2004.Weremain competitive, we anticipate that we will continue to devote substantial resources to research and development, and we expect these expenses to increase in absolute dollars in the foreseeable future due to the increased complexity and the greater number of products under development. Research and development expenses are likely to fluctuate from time to time to the extent we make periodic incremental investments in research and development and these investments may be independent of our level of revenue.
Sales, General and Administrative
Fiscal Year 2009 vs. Fiscal Year 2008 | | | | | | | | | | | | | | | | | | | | | | | | | | | | | | |
| | | Year Ended | | | $
Change | | �� | %
Change | | | Year Ended | | | $
Change | | | %
Change | |
| | | Jan. 29, 2006 | | | Jan. 30, 2005 | | | | | Jan. 30, 2005 | | | Jan. 25, 2004 | | | |
| | | (As Restated) | | | (As Restated) | | | | | (As Restated) | | | (As Restated) | | | |
| | | (in millions) | |
| Sales, General and Administrative: | | | | | | | | | | | | | | | | | | | | | | | | | | | | | | |
Salaries and benefits | | $ | 108.5 | | | $ | 94.7 | | | $ | 13.8 | | | 15 | % | | $ | 94.7 | | | $ | 76.3 | | | $ | 18.4 | | | 24 | % |
| | | | | | | | |
Advertising and promotions | | | 49.4 | | | | 66.6 | | | | (17.2 | ) | | (26 | )% | | | 66.6 | | | | 47.2 | | | | 19.4 | | | 41 | % |
Legal and accounting fees | | | 18.7 | | | | 12.6 | | | | 6.1 | | | 48 | % | | | 12.6 | | | | 12.6 | | | | — | | | — | |
Facility expense | | | 12.5 | | | | 9.6 | | | | 2.9 | | | 30 | % | | | 9.6 | | | | 8.3 | | | | 1.3 | | | 16 | % |
| | | | | | | | |
Depreciation and amortization | | | 8.5 | | | | 13.0 | | | | (4.5 | ) | | (35 | )% | | | 13.0 | | | | 14.6 | | | | (1.6 | ) | | (11 | )% |
Stock-based compensation (1) | | | (2.4 | ) | | | 3.4 | | | | (5.8 | ) | | (171 | )% | | | 3.4 | | | | 14.6 | | | | (11.2 | ) | | (77 | )% |
Other | | | 6.9 | | | | 4.3 | | | | 2.6 | | | 60 | % | | | 4.3 | | | | 6.2 | | | | (1.9 | ) | | (31 | )% |
| | | | | | | | | | | | | | | | | | | | | | | | | | | | | | |
Total | | $ | 202.1 | | | $ | 204.2 | | | $ | (2.1 | ) | | (1 | )% | | $ | 204.2 | | | $ | 179.8 | | | $ | 24.4 | | | 14 | % |
| | | | | | | | | | | | | | | | | | | | | | | | | | | | | | |
Sales, general and administrative as a percentage of net revenue | | | 9 | % | | | 10 | % | | | | | | | | | | 10 | % | | | 10 | % | | | | | | | |
(1) | Stock-based compensation includes charges/credits relating to payroll taxes accrued for as part of the restatement. See Note 2 of the Notes to Consolidated Financial statements for further information. |
Sales, general and administrative expenses decreased $2.1were $362.2 million and $341.3 million during fiscal years 2009 and 2008, respectively, an increase of $20.9 million, or 1%, from fiscal 2005 to fiscal 20066%. Outside professional fees increased by $17.5 million primarily due to increased legal fees pertaining to ongoing litigation matters described in Note 12 of the Notes to the Consolidated Financial Statements in Part IV, Item 15 of this Form 10-K. Marketing and advertising expenses increased by $22.3 million, primarily due to increased advertising campaign related activities and trade shows in the current year. Depreciation and amortization expense increased by $15.4 million primarily due to amortization of intangible assets acquired from our acquisitions of Mental Images and Ageia, and from increased capital expenditures. Stock-based compensation expense increased by $6.9 million primarily due to the impact of new hire and semi-annual stock awards granted subsequent to the third quarter of fiscal year 2008, offset by a $13.8reduction in expense related to older stock awards that were almost fully vested and for which the related expense had been almost fully amortized by the end of the first quarter of fiscal year 2009. Headcount related to personnel in departments related to sales, general and administrative functions remained relatively flat year-over-year, but labor and related expenses decreased by $13.9 million due to lower expenses during fiscal year 2009 related to our variable compensation programs when compared to fiscal year 2008.
Fiscal Year 2008 vs. Fiscal Year 2007
Sales, general and administrative expenses were $341.3 million and $293.5 million during fiscal years 2008 and 2007, respectively, an increase of $47.8 million, or 16%. The increase is primarily due to an increase in salaries and benefits
by approximately $31.4 million related to
122the growth in personnel by approximately 180 additional
personnelpersonnel. Additionally, salaries and
benefits expenses also increased due to the increase in our variable compensation expense as a
$6.1result of our financial performance for fiscal year 2008. Advertising and promotion expenses increased by $4.2 million
increasein legal expenses primarily due to certain insurance reimbursements that we received during fiscal 2005 that reduced this expense,costs incurred for sponsorships and increased litigation activityadvertising campaign costs. The increase in personnel during fiscal 2006 related to 3dfx Interactive, Inc., or 3dfx,the year and American Video Graphics, or AVG. In addition there were increases of $2.9 million in facility expense due primarily to the expansion of our international sites and $2.6 millionfacilities worldwide to support additional personnel resulted in other general and administrativeincreases in our facilities expenses, offset by a reduction in bad debt expense. These increases were offset by a $17.2 million decrease in advertising and promotion costs, primarily associated with a reduction in certain marketing programs, tradeshow expenses, new product launches and customer samples, other marketing costs, travel related and employee recruitment expenses. In addition, stock-based compensation expense decreased by $5.8 million and depreciation and amortization decreased by $4.5 million.
Sales, general and administrative expenses increased $24.4 million, or 14%, from fiscal 2004expenses.
In response to
fiscal 2005 primarily duethe current economic environment, we have commenced several cost reduction measures which are designed to
an $18.4 million increase in salaries and benefits related to 88 additional personnel and a $19.4 million increase in advertising and promotion costs for tradeshows and new product launches and other marketing costs, including travel and customer samples. These increases were offset by a decrease of $11.2 million in stock based compensation and $1.9 million in other expenses during the period, including a reduction in bad debt expense.Operating Expenses
We anticipate thatreduce our operating expenses and will increasecontinue to focus on reducing our operating expenses during fiscal year 2010. Please refer to the discussion in Note 19 to the Notes to the Consolidated Financial Statements in Part IV, Item 15 of this Form 10-K for the potential impact of the tender offer on operating expenses during the first quarter of fiscal 2007. In addition to the headcount additions that we plan to make, we will be adding the operating costs related to the acquisition of ULi, which closed on February 20, 2006. We expect that these factors will result in an increase in operating expenses in the first quarter of fiscal 2007, as compared to the fourth quarter of fiscal 2006. In addition, the first quarter of fiscal 2007 will be the first time that we include stock-based employee compensation expense under Statement of Financial Accounting Standards No. 123(R), or SFAS No. 123(R),Share-Based Payment in our results. We anticipate that our stock-based compensation expense will be approximately $18 to $22 million for the first quarter of fiscal 2007.
year 2010.
In-process research and development
In connection with our acquisition of MediaQMental Images in August 2003,November 2007 and PortalPlayer in January 2007, we wrote-off $3.5$4.0 million and $13.4 million during fiscal years 2008 and 2007, respectively, of in-process research and development, expense, or IPR&D, that had not yet reached technological feasibility and had no alternative future use. In accordance with SFAS No. 2,Accounting for Research and Development Costs, as clarified by FIN 4,
Applicability of SFAS No. 2 to Business Combinations Accounted for by the Purchase Method an interpretation of SFAS No. 2, amounts assigned to IPR&D meeting the above-stated criteria must be charged to expense as part of the allocation of the purchase price.
Settlement Costs Restructuring Charges and OtherSettlement costs were $14.2 million
On September 18, 2008, we announced a workforce reduction to allow for continued investment in strategic growth areas, which was completed in the third quarter of fiscal 2006. The settlement costs areyear 2009. As a result, we eliminated approximately 360 positions worldwide, or about 6.5% of our global workforce. During fiscal year 2009, expenses associated with two litigation matters, 3dfxthe workforce reduction, which were comprised primarily of severance and AVG. AVG is settled. The 3dfx matter is not finally settledbenefits payments to these employees, totaled $8.0 million. We anticipate that the expected decrease in operating expenses from this action will be offset by continued investment in strategic growth areas.
Restructuring and
is subjectother expenses also included a non-recurring charge of $18.9 million associated with the termination of a development contract related to
judicial review and the completion of appropriate procedures and documents. However, baseda new campus construction project that has been put on
the potential settlement in this case, we have concluded that a loss is probable and that we can reasonably estimate the amount of loss. Please refer to Note 12 of the Notes to Consolidated Financial Statements for further information.hold.
Interest Income and Interest Expense
Interest income consists of interest earned on cash, cash equivalents and marketable securities. Interest income
increaseddecreased to $42.9 million in fiscal year 2009, from
$11.4$64.3 million
in fiscal year 2008, primarily due to
$20.7 million fromthe result of lower average balances of cash, cash equivalents and marketable securities and lower interest rates in fiscal
2005year 2009 compared to fiscal
2006year 2008. Interest income increased to $64.3 million in fiscal year 2008 from $41.8 million in fiscal year 2007 primarily due to the result of higher average balances of cash, cash equivalents and marketable securities and higher interest rates in fiscal
2006 whenyear 2008 compared to fiscal
2005. Interest income decreased from $18.6 million to $11.4 million from fiscal 2004 to fiscal 2005 primarily due to the result of lower overall balances of cash, cash equivalents and marketable securities and due to lower market interest rates.Interest expense primarily consists of interest incurred as a result of capital lease obligations and, prior to the redemption in October 2003, interest on the convertible subordinated debentures, or the Notes. Interest expense decreased from $12.0 million to $0.2 million from fiscal 2004 to fiscal 2005. The decrease was primarily due to the redemption of the Notes.
year 2007.
Other Income (Expense), net
Other income and expense primarily consists of realized gains and losses on the sale of marketable securities.securities and foreign currency translation. Other income decreased by $1.1(expense) was $(14.7) million fromand $0.8 million in fiscal 2005 to fiscal 2006years 2009 and 2008, respectively, a decrease of $15.5 million. This decrease was primarily due to the liquidationother than temporary impairment charges of marketable securities$9.9 million that we recorded during fiscal 2006year 2009. These charges include $5.6 million related to what we believe is an other than temporary impairment of our investment in orderthe money market funds held by the Reserve International Liquidity Fund, Ltd., or International Reserve Fund; $2.5 million related to obtaina decline in the cash neededvalue of publicly traded equity securities and $1.8 million related to debt securities held by us that were issued by companies that have filed for bankruptcy as of January 25, 2009. Please refer to Note 17 of the repatriationNotes to the Consolidated Financial Statements in Part IV, Item 15 of certain foreign earnings under the American Jobs Creation Act of 2004.this Form 10-K for further discussion. Other income decreased by $2.4(expense) was $0.8 million fromand $(0.8) million for fiscal 2004years 2008 and 2007, respectively, an increase of $1.5 million. The increase in other income during fiscal year 2008 compared to fiscal 2005year 2007 is primarily due to $2.5approximately $2.0 million of realized gains on the sale of marketable securities during fiscal 2004 as a result of our liquidation of a significant portion of our marketable securities portfolio in order to obtain the cash required to redeem the Notes in October 2003. This decrease was offset by a $1.0 million realized gain during fiscal 2005 related to the receipt of cash and marketable securities as part of an investment exchange.offset by an increase in foreign currency transaction losses in fiscal year 2008.
We recognized income tax expense (benefit) of
$55.6$(12.9) million,
$18.4$103.7 million and
$(2.3)$46.4 million
induring fiscal
2006, 2005years 2009, 2008 and
2004,2007, respectively. Income tax expense (benefit) as a percentage of income
(loss) before taxes, or our annual effective tax rate, was
15.6% in fiscal 2006, 17.2% in fiscal 2005, and (5.0)(30.0) % in fiscal
2004. In connection with the restatement described earlieryear 2009, 11.5% in
“Restatement of Consolidated Financial Statements, Audit Committeefiscal year 2008 and
Company Findings,” we recorded an income tax benefit of $2.0 million, $6.7 million, and $14.6 million for our9.4% in fiscal
years 2006, 2005 and 2004, respectively.year 2007.
The difference in the effective tax rates amongst the three years
iswas primarily
attributable toa result of changes in our geographic mix of income subject to
tax.tax, with the additional impact of the federal research tax credit recognized in fiscal year 2009 relative to the loss before taxes in such fiscal year.
Please refer to Note 1413 of the Notes to Consolidated Financial Statements for further information regarding the components of our income tax expense.Convertible Debenture Redemption Expense
On October 24, 2003, we fully redeemed the Notes. The aggregate principal amount of the Notes outstanding was $300.0 million, which included $18.6 million of Notes that we had purchased in the open market during the three months ended October 26, 2003. The redemption price was equal to approximately 102.7% of the outstanding principal amount of the Notes, plus accrued and unpaid interest up to, but excluding, the redemption date. In connection with the redemption of the Notes, we recorded a one-time charge in fiscal 2004 of approximately $13.1 million, which included a $7.6 million redemption premium and $5.5 million of unamortized issuance costs.
Liquidity and Capital Resources
| | January 25, 2009 | | January 27, 2008 | |
| | (In millions) | |
Cash and cash equivalents | | | | | | | | |
| | | | | | | | |
Cash, cash equivalents, and marketable securities | | | | | | | | |
| | Year Ended | |
| | January 25, | | January 27, | | January 28, | |
| | 2009 | | 2008 | | 2007 | |
| | (In millions) | |
Net cash provided by operating activities | | | | | | | | | | | | |
Net cash used in investing activities | | | | | | | | | | | | |
Net cash used in financing activities | | | | | | | | | | | | |
As of January 29, 2006,25, 2009, we had $950.2 million$1.26 billion in cash, cash equivalents and marketable securities, an increasea decrease of $280.1$554.1 million from the end of fiscal 2005. As of January 30, 2005, we had $670.0 million in cash, cash equivalents and marketable securities, an increase of $66.0 million from the end of fiscal 2004.year 2008. Our portfolio of cash equivalents and marketable securities is managed by several financial institutions. Our investment policy requires the purchase of top-tier investment grade securities, the diversification of asset typetypes and includes certain limits on our portfolio duration. Operating activities
Operating activities generated cash of $446.4$249.4 million, $132.2 million,$1.27 billion and $49.7$572.7 million during fiscal 2006, 2005,years 2009, 2008 and 2004,2007, respectively. The cash provided by operating activities decreased in fiscal year 2009 due to a decrease in our net income compared to fiscal year 2008 plus the impact of non-cash charges to earnings and deferred income taxes. During fiscal year 2009, non-cash charges to earnings included stock-based compensation of $162.7 million and depreciation and amortization on our long-term assets of $185.0 million. Additionally, operating cash flows for fiscal year 2009 also declined due to changes in operating assets and liabilities, including the timing of payments to vendors and a decrease in inventory turnover. Additionally, we incurred $21.8 million in net cash outflows in fiscal year 2009 towards a confidential patent licensing agreement that we entered into in fiscal year 2007.
The increase in cash flows from operating activities in fiscal 2006year 2008 when compared to fiscal 2005year 2007 was primarily relateddue to the $212.6 millionan increase in our net income during the comparable periods plus the impact of non-cash charges to earnings. During fiscal year 2008, non-cash charges to earnings included stock-based compensation of $133.4 million and depreciation and amortization on our long-term assets of $133.2 million. Additionally, operating cash flows for fiscal year 2008 also improved due to changes in operating assets and liabilities. On our consolidated balance sheet, accrued liabilities, increased $77.2 million primarily dueincluding the timing of payments to the recording of income taxes payable for fiscal 2006, the increasevendors and an improvement in accruals related to customer programs and the recording of $30.6inventory turnover. These increases were offset by approximately $57.3 million in relation to 3dfx, of which $25.0 million was recorded as an adjustment to goodwill. Accounts payable decreased $58.8 million and inventories decreased $60.9 million primarily asnet cash outflows towards a result of significant reductionsconfidential patent licensing agreement that we entered into in older products, offset by an increase in new products. Accounts receivable increased $21.9 million primarily due to increased sales and improved linearity of sales, and cash collections during the fourth quarter of fiscal 2006 as compared to the fourth quarter of fiscal 2005.year 2007.
The increase in cash flows from operating activities in fiscal
2005year 2007 when compared to fiscal
2004year 2006 was primarily
due to an increase in our net income during the comparable periods plus the impact of non-cash charges to earnings. Additionally, the increase is related to the
$40.0$116.7 million
increaseof stock-based compensation expense recorded upon adoption of SFAS No. 123(R) in
net incomefiscal year 2007 and changes in operating assets and
liabilities. On our consolidated balance sheet, accrued liabilities
increased $37.3 millionprimarily due to an increase in rebates payable, which resulted from increased OEM business. Accounts payable increased $52.9 million primarily due to purchases from subcontract manufacturers for inventory. Offsetting these increases, our accounts receivable increased $99.6 million primarily due to increased sales during the fourth quarter of fiscal 2005 as compared to the fourth quarter of fiscal 2004.
years 2007 and 2006.
Investing activities
Investing activities have consisted primarily of purchases and sales of marketable securities, acquisition of businesses and purchases of property and equipment, which include leasehold improvements for our facilities and intangible assets. Investing activities used cash of $41.8$209.4 million, $761.3 million and $152.0$526.4 million during fiscal 2006years 2009, 2008 and 2005,2007, respectively. NetInvesting activities for fiscal year 2009 provided cash of $226.7 million from the net proceeds from sales of marketable securities and used by investing$27.9 million in connection with our acquisition of Ageia. Investing activities during fiscal 2006 was primarily due to $79.6also included $407.7 million cash used for capital expenditures, primarilyas we built additional facilities to accommodate our growing employee headcount, new research and development equipment, testing equipment to support our increased production requirements, technology licenses, software, intangible assets and leasehold improvements at our facilities in various international locations. Investing activities for capital expenditures in fiscal year 2009 included payment of approximately $183.8 million for purchase of a property in Santa Clara, California, that includes approximately 25 acres of land and ten commercial buildings. Our original plans for the purchased property included constructing a new campus on the site. We are currently re-evaluating those plans.
Investing activities for fiscal year 2008 used cash of $496.4 million towards the net purchases of marketable securities, resulting from the need to invest the additional amounts of cash we received from operating activities, and $75.5 million for our acquisition of Mental Images. Investing activities for fiscal 2008 also included $187.7 million of capital expenditures. Capital expenditures included purchase of property in anticipation of building additional facilities to accommodate our growing employee headcount, new research and development equipment, testing equipment to support our increased production requirements, technology licenses, software, intangible assets and leasehold improvements at our facilities in various international locations.
In fiscal year 2007, net cash used in investing activities included $401.8 million used for our acquisitions of PortalPlayer, ULi and Hybrid Graphics. Additionally, net cash used in investing activities included capital expenditures of $130.8 million attributable to purchases of new research and development equipment, hardware equipment, technology licenses, software, intangible assets and leasehold improvements at our headquarters facility in Santa Clara, California and at our international sites. In addition, we used cash of $12.1 million to acquire certain assets of a private company and $9.7 million related to investments we made during fiscal 2006 in non-affiliated companies. These uses of cash were offset by $59.6 million of net proceeds from sales of marketable securities. Investingvarious facilities.
Financing activities
Financing activities used cash of
$152.0$349.3 million, $326.3 million and
provided cash of $88.0$53.6 million during fiscal
2005years 2009, 2008 and
2004,2007, respectively. Net cash used by
investingfinancing activities
duringin fiscal
2005year 2009 was primarily due to
$84.7$423.6 million
of net purchases of marketable securities. In addition, we used $67.3 million for capital expenditures primarily attributable to purchases of leasehold improvements for our new data center at our headquarters campus, new research and development emulation equipment, technology licenses, software and intangible assets. We expect to spend approximately $80 million to $100 million for capital expenditures during fiscal 2007, primarily for purchases of software licenses, emulation equipment, computers and engineering workstations. In addition, we may continue to use cash in connection with the acquisition of new businesses or assets.Financing activities used cash of $61.4 million during fiscal 2006 compared to cash provided of $13.8 million during fiscal 2005. Cash used in fiscal 2006 primarily resulted from $188.5 million related to our stock repurchase program, offset by $127.5cash proceeds of $73.5 million offrom common stock issued under our employee stock plans. In
Net cash used by financing activities in fiscal 2005, the cash providedyear 2008 was primarily from $42.5due to $552.5 million used in our stock repurchase program, offset by cash proceeds of $226.0 million from common stock issued under our employee stock plans, offsetplans.
During fiscal year 2007, net cash used by $24.6 million related tofinancing activities towards payments under our stock repurchase program. Financingprogram was $275.0 million. These uses of cash in financing activities providedwere offset by cash of $13.8 million during fiscal 2005 compared to cash used of $270.3 million during fiscal 2004. Cash provided in fiscal 2005 primarily resultedproceeds from $42.5 million of common stock issued under our employee stock plans offsetof $221.2 million for fiscal year 2007.
Liquidity
Our primary source of liquidity is cash generated by $24.6our operations. Our investment portfolio consisted of cash and cash equivalents, asset-backed securities, commercial paper, mortgage-backed securities issued by government-sponsored enterprises, equity securities, money market funds and debt securities of corporations, municipalities and the United States government and its agencies. These investments are denominated in United States dollars. As of January 25, 2009, we did not have any investments in auction-rate preferred securities.
We account for our investment instruments in accordance with Statement of Financial Accounting Standards No. 115, or SFAS No. 115, Accounting for Certain Investments in Debt and Equity Securities. All of the cash equivalents and marketable securities are treated as “available-for-sale” under SFAS No. 115. Investments in both fixed rate and floating rate interest earning instruments carry a degree of interest rate risk. Fixed rate debt securities may have their market value adversely impacted due to a rise in interest rates, while floating rate securities may produce less income than expected if interest rates fall. Due in part to these factors, our future investment income may fall short of expectations due to changes in interest rates or if the decline in fair value of our publicly traded debt or equity investments is judged to be other-than-temporary. We may suffer losses in principal if we are forced to sell securities that decline in market value due to changes in interest rates. However, because any debt securities we hold are classified as “available-for-sale,” no gains or losses are realized in our statement of operations due to changes in interest rates unless such securities are sold prior to maturity or unless declines in market values are determined to be other-than-temporary. These securities are reported at fair value with the related unrealized gains and losses included in accumulated other comprehensive income, a component of stockholders’ equity, net of tax.
As of January 25, 2009 and January 27, 2008, we had $1.26 billion and $1.81 billion, respectively, in cash, cash equivalents and marketable securities. Our investment policy requires the purchase of top-tier investment grade securities, the diversification of asset types and includes certain limits on our portfolio duration, as specified in our investment policy guidelines. These guidelines also limit the amount of credit exposure to any one issue, issuer or type of instrument. As of January 25, 2009, we were in compliance with our investment policy. As of January 25, 2009, our investments in government agencies and government sponsored enterprises represented approximately 71% of our total investment portfolio, while the financial sector, which has been negatively impacted by recent market liquidity conditions, accounted for approximately 17% of our total investment portfolio. Substantially all of our investments are with A/A2 or better rated securities with the substantial majority of the securities rated AA-/Aa3 or better.
We performed an impairment review of our investment portfolio as of January 25, 2009. Currently, we have the intent and ability to hold our investments with impairment indicators until maturity. Based on our quarterly impairment review and having considered the guidance in Statement of Financial Accounting Standards Staff Position No. 115-1, or FSP No. 115-1, A Guide to the Implementation of Statement 115 on Accounting for Certain Investments in Debt and Equity Securities, we recorded other than temporary impairment charges of $9.9 million during fiscal year 2009. These charges include $5.6 million related to what we believe is an other than temporary impairment of our stock repurchase program. Ininvestment in the money market funds held by the Reserve International Liquidity Fund, Ltd., or International Reserve Fund; $2.5 million related to a decline in the value of publicly traded equity securities and $1.8 million related to debt securities held by us that were issued by companies that have filed for bankruptcy as of January 25, 2009. Please refer to Note 17 of the Notes to the Consolidated Financial Statements in Part IV, Item 15 of this Form 10-K for further details. We concluded that our investments were appropriately valued and that except for the $9.9 million impairment charges recognized in the year, no other than temporary impairment charges were necessary on our portfolio of available for sale investments as of January 25, 2009.
Net realized gains (losses), excluding any impairment charges, for fiscal 2004,year 2009 was $2.1 million. Net realized gains (losses) for fiscal years 2008 and 2007 were not material. As of January 25, 2009, we had a net unrealized gain of $4.4 million, which was comprised of gross unrealized gains of $7.8 million, offset by $3.4 million of gross unrealized losses. As of January 27, 2008, we had a net unrealized gain of $10.7 million, which was comprised of gross unrealized gains of $11.1 million, offset by $0.4 million of gross unrealized losses.
As of January 25, 2009, our money market investment in the cash usedInternational Reserve Fund, which was primarilyvalued at $124.4 million, net of other than temporary impairment charges, was classified as marketable securities in our Consolidated Balance Sheet due to the $300.0halting of redemption requests in September 2008 by the International Reserve Fund. Subsequent to year-end, on January 30, 2009, we received $84.4 million redemptionfrom the International Reserve Fund. This was our portion of a payout of approximately 65% of the Notes,total assets of the Fund. Each shareholder’s percentage of this distribution was determined by dividing the shareholder’s total unfunded redeemed shares by the aggregate unfunded redeemed shares of the Fund, which included $18.6was then used to calculate the shareholder’s pro rata portion of this distribution. We expect to receive the proceeds of our remaining investment in the International Reserve Fund, excluding the $5.6 million of Notes that we had purchasedhave recorded as an other than temporary impairment, by no later than October 2009, when all of the underlying securities held by the International Reserve Fund are scheduled to have matured. However, redemptions from the International Reserve Fund are currently subject to pending litigation, which could cause further delay in receipt of our funds.
Our accounts receivable are highly concentrated and make us vulnerable to adverse changes in our customers' businesses, and to downturns in the industry and the worldwide economy. One customer accounted for approximately 18% of our accounts receivable balance at January 25, 2009. While we strive to limit our exposure to uncollectible accounts receivable using a combination of credit insurance and letters of credit, difficulties in collecting accounts receivable could materially and adversely affect our financial condition and results of operations. These difficulties are heightened during
periods when economic conditions worsen. We continue to work directly with more foreign customers and it may be difficult to collect accounts receivable from them. We maintain an allowance for doubtful accounts for estimated losses resulting from the
three months ended October 26, 2003.Stock Repurchase Program
inability of our customers to make required payments. This allowance consists of an amount identified for specific customers and an amount based on overall estimated exposure. If the financial condition of our customers were to deteriorate, resulting in an impairment in their ability to make payments, additional allowances may be required, we may be required to defer revenue recognition on sales to affected customers, and we may be required to pay higher credit insurance premiums, any of which could adversely affect our operating results. In the future, we may have to record additional reserves or write-offs and/or defer revenue on certain sales transactions which could negatively impact our financial results.
Cash Tender Offer
On August 9, 2004February 11, 2009, we announced that our Board of Directors approved a cash tender offer for certain employee stock options. The tender offer commenced on February 11, 2009 and expired at 12:00 midnight (Pacific Time) on March 11, 2009. The tender offer applied to outstanding stock options held by employees with an exercise price equal to or greater than $17.50 per share. None of the non-employee members of our Board of Directors or our officers who file reports under Section 16(a) of the Securities Exchange Act of 1934, including our former Chief Financial Officer, Marvin D. Burkett, were eligible to participate in the Offer. All eligible options with exercise prices less than $28.00 per share, but not less than $17.50 per share were eligible to receive a cash payment of $3.00 per option in exchange for the cancellation of the eligible option. All eligible options with exercise prices greater than $28.00 per share were eligible to receive a cash payment of $2.00 per option in exchange for the cancellation of the eligible option. Please refer to Note 19 for further discussion regarding the cash tender offer for certain employee stock options that our Board of Directors approved in February 2009.
Stock Repurchase Program
During fiscal year 2005, we announced that our Board of Directors, or Board, had authorized a stock repurchase program to repurchase shares of our common stock, subject to certain specifications, up to an aggregate maximum amount of $300.0$300 million. During fiscal year 2007, the Board further approved an increase of $400 million to the original stock repurchase program. In fiscal year 2008, we announced a stock repurchase program under which we may purchase up to an additional $1.0 billion of our common stock over a three year period through May 2010. On August 12, 2008, we announced that our Board further authorized an additional increase of $1.0 billion to the stock repurchase program. As a result of these increases, we have an ongoing authorization from the Board, subject to certain specifications, to repurchase shares of our common stock up to an aggregate maximum amount of $2.7 billion through May 2010.
The repurchases will be made from time to time in the open market, in privately negotiated transactions, or in structured stock repurchase programs, and may be made in one or more larger repurchases, in compliance with the Securities Exchange Act of 1934, or the Exchange Act, Rule 10b-18, subject to market conditions, applicable legal requirements, and other factors. The program does not obligate NVIDIA to acquire any particular amount of common stock and the program may be suspended at any time at our discretion. As part of our share repurchase program, we have entered into, and we may continue to enter into, structured share repurchase transactions with financial institutions. These agreements generally require that we make an up-front payment in exchange for the right to receive a fixed number of shares of our common stock upon execution of the agreement, and a potential incremental number of shares of our common stock, within a pre-determined range, at the end of the term of the agreement.
During the
fourth quarter of fiscal 2006,three months ended January 25, 2009, we
repurchased 1.3 milliondid not enter into any structured share repurchase transactions or otherwise purchase any shares of our common
stock for $50.0 million under astock. During fiscal year 2009, we entered into structured share repurchase
transaction,transactions to repurchase 29.3 million shares for $423.6 million, which we recorded on the trade date of the
transaction.transactions. Through
the end of the fourth quarter of fiscal
2006,year 2009, we have repurchased
8.5an aggregate of 90.9 million shares under our stock repurchase program for a total cost of
$213.2 million. During the first quarter$1.46 billion. As of
fiscal 2007,January 25, 2009, we
entered into a structured share repurchase transactionare authorized, subject to certain specifications, to repurchase shares of our common stock
for $50.0 million that we expectup to
settle prior to the end of our first fiscal quarter.On March 6, 2006, we announced that our Board of Directors had approved an increase in our existing stock repurchase program. We announced a $400 million increase to the original stock repurchase program we had announced in August 2004. As a result of this increase, theadditional amount of common stock the Board of Directors has authorized to be repurchased has now been increased to a total of $700 million. The repurchases will be made from time to time in the open market, in privately negotiated transactions, or in structured stock repurchase transactions, in compliance with the Securities and Exchange Commission Rule 10b-18, subject to market conditions, applicable legal requirements, and other factors. The program does not obligate NVIDIA to acquire any particular amount of common stock and the program may be suspended at any time at our discretion.
$1.24 billion through May 2010.
Operating Capital and Capital Expenditure
RequirementsRequirements.
We believe that our existing cash balances and anticipated cash flows from operations will be sufficient to meet our operating, acquisition and capital requirements for at least the next 12twelve months. However, there is no assurance that we will not need to raise additional equity or debt financing within this time frame. Additional financing may not be available on favorable terms or at all and may be dilutive to our then-current stockholders. We also may require additional capital for other purposes not presently contemplated. If we are unable to obtain sufficient capital, we could be required to curtail capital equipment purchases or research and development expenditures, which could harm our business. Factors that could affect our cash used or generated from operations and, as a result, our need to seek additional borrowings or capital include: | · | decreased demand and market acceptance for our products and/or our customers’ products; |
| · | inability to successfully develop and produce in volume production our next-generation products; |
| · | competitive pressures resulting in lower than expected average selling prices; and |
| · | new product announcements or product introductions by our competitors. |
market acceptance for our products and/engineering workstations. In addition, we may continue to use cash in connection with the acquisition of new businesses or our customers’ products;assets.inability to successfully develop and produce in volume production our next-generation products;
competitive pressures resulting in lower than expected average selling prices; and
new product announcements or product introductions by our competitors.
For additional factors see “Item 1A. Risk Factors - Risks Related to Our OperationsBusiness and Industry - Our operating results are unpredictable andrevenue may fluctuate and ifwhile our operating expenses are relatively fixed, which makes our results are below the expectationsdifficult to predict and could cause our results to fall short of securities analysts or investors, our stock price could decline.expectations.”
3dfx Asset Purchase
The 3dfx asset purchase
On December 15, 2000, NVIDIA Corporation and one of our indirect subsidiaries entered into an Asset Purchase Agreement, or APA, which closed on April 18, 2001.2001, to purchase certain graphics chip assets from 3dfx. Under the terms of the Asset Purchase Agreement,APA, the cash consideration due at the closing was $70.0 million, less $15.0 million that was loaned to 3dfx pursuant to a Credit Agreement dated December 15, 2000. The Asset Purchase Agreement also provided, subject to the other provisions thereof, that if 3dfx properly certified that all its debts and other liabilities had been provided for, then we would have been obligated to pay 3dfx twoone million shares, which due to subsequent stock splits now totals six million shares, of NVIDIA common stock. If 3dfx could not make such a certification, but instead properly certified that its debts and liabilities could be satisfied for less than $25.0 million, then 3dfx could have elected to receive a cash payment equal to the amount of such debts and liabilities and a reduced number of shares of our common stock, with such reduction calculated by dividing the cash payment by $25.00 per share. If 3dfx could not certify that all of its debts and liabilities had been provided for, or could not be satisfied, for less than $25.0 million, we would not be obligated under the agreement to pay any additional consideration for the assets.
In October 2002, 3dfx filed for Chapter 11 bankruptcy protection in the United States Bankruptcy Court for the Northern District of California. In March 2003, we were served with a complaint filed by the Trustee appointed by the Bankruptcy Court which sought, among other things, payments from us as additional purchase price related to our purchase of certain assets of 3dfx. In early November 2005, after manyseveral months of mediation, NVIDIA and the Official Committee of Unsecured Creditors, or the Creditors’ Committee, agreed to a Plan of Liquidation of 3dfx, reachedwhich included a conditional settlement of the Trustee’s claims against NVIDIA.us. This conditional settlement which will bewas subject to a confirmation process through a vote of creditors and the review and approval of the Bankruptcy Court, callsCourt. The conditional settlement called for a payment by NVIDIA of approximately $30.6 million to the 3dfx estate. Under the settlement, $5.6 million relatesrelated to various administrative expenses and Trustee fees, and $25.0 million relatesrelated to the satisfaction of debts and liabilities owed to the general unsecured creditors of 3dfx. As such,Accordingly, during the three monthsmonth period ended October 30, 2005, we recorded $5.6 million as a charge to settlement costs and $25.0 million as additional purchase price for 3dfx. The Trustee advised that he intended to object to the settlement. The conditional settlement never progressed substantially through the confirmation process.
On December 21, 2006, the Bankruptcy Court scheduled a trial for one portion of the Trustee’s case against NVIDIA. On January 2, 2007, NVIDIA terminated the settlement agreement on grounds that the Bankruptcy Court had failed to proceed toward confirmation of the Creditors’ Committee’s plan. A non-jury trial began on March 21, 2007 on valuation issues in the Trustee's constructive fraudulent transfer claims against NVIDIA. Specifically, the Bankruptcy Court tried four questions: (1) what did 3dfx transfer to NVIDIA in the APA?; (2) of what was transferred, what qualifies as "property" subject to the Bankruptcy Court's avoidance powers under the Uniform Fraudulent Transfer Act and relevant bankruptcy code provisions?; (3) what is the fair market value of the "property" identified in answer to question (2)?; and (4) was the $70 million that NVIDIA paid "reasonably equivalent" to the fair market value of that property? The parties completed post-trial briefing on May 25, 2007.
On April 30, 2008, the Bankruptcy Court issued its Memorandum Decision After Trial, in which it provided a detailed summary of the trial proceedings and the parties' contentions and evidence and concluded that "the creditors of 3dfx were not injured by the Transaction." This decision did not entirely dispose of the Trustee's action, however, as the Trustee's claims for successor liability and intentional fraudulent conveyance were still pending. On June 19, 2008, NVIDIA filed a motion for summary judgment to convert the Memorandum Decision After Trial to a final judgment. That motion was granted in its entirety and judgment was entered in NVIDIA’s favor on September 11, 2008. The Trustee filed a Notice of Appeal from that judgment on September 22, 2008, and on September 25, 2008, NVIDIA exercised its election to have the appeal heard by the United States District Court, where the appeal is pending.
While the conditional settlement reached in November 2005 never progressed through the confirmation process, the Trustee’s case still remains pending appeal. As such, we have not reversed the accrual of $30.6 million - $5.6 million as a charge to settlement costs and $25.0 million as additional purchase price for 3dfx – that we recorded during the three months ended October 30, 2005, pending resolution of the appeal of the Trustee’s case. We do not believe the resolution of this matter will have a material impact on our results of operations or financial position.
Please refer to Note 12 of the Notes to
the Consolidated Financial Statements
in Part IV, Item 15 of this Form 10-K for further information regarding this litigation.
Product Defect
Our products are complex and may contain defects or experience failures due to any number of issues in design, fabrication, packaging, materials and/or use within a system. If any of our products or technologies contains a defect, compatibility issue or other error, we may have to invest additional research and development efforts to find and correct the issue. Such efforts could divert our management’s and engineers’ attention from the development of new products and technologies and could increase our operating costs and reduce our gross margin. In addition, an error or defect in new products or releases or related software drivers after commencement of commercial shipments could result in failure to achieve market acceptance or loss of design wins. Also, we may be required to reimburse customers, including for customers’ costs to repair or replace the products in the field. A product recall or a significant number of product returns could be expensive, damage our reputation and could result in the shifting of business to our competitors. Costs associated with correcting defects, errors, bugs or other issues could be significant and could materially harm our financial results.
In July 2008, we recorded a $196.0 million charge against cost of revenue to cover anticipated customer warranty, repair, return, replacement and other associated costs arising from a weak die/packaging material set in certain versions of our previous generation MCP and GPU products used in notebook systems. All of our newly manufactured products and all of our products that are currently shipping in volume have a different material set that we believe is more robust.
The previous generation MCP and GPU products that are impacted were included in a number of notebook products that were shipped and sold in significant quantities. Certain notebook configurations of these MCP and GPU products are failing in the field at higher than normal rates. While we have not been able to determine a root cause for these failures, testing suggests a weak material set of die/package combination, system thermal management designs, and customer use patterns are contributing factors. We have worked with our customers to develop and have made available for download a software driver to cause the system fan to begin operation at the powering up of the system and reduce the thermal stress on these chips. We have also recommended to our customers that they consider changing the thermal management of the MCP and GPU products in their notebook system designs. We intend to fully support our customers in their repair and replacement of these impacted MCP and GPU products that fail, and their other efforts to mitigate the consequences of these failures.
We continue to engage in discussions with our supply chain regarding reimbursement to us for some or all of the costs we have incurred and may incur in the future relating to the weak material set. We also continue to seek to access our insurance coverage, which provided us with $8.0 million in related reimbursement during fiscal year 2009. However, there can be no assurance that we will recover any additional reimbursement. We continue to not see any abnormal failure rates in any systems using NVIDIA products other than certain notebook configurations. However, we are continuing to test and otherwise investigate other products. There can be no assurance that we will not discover defects in other MCP or GPU products.
Determining the amount of the $196.0 million charge related to this issue required management to make estimates and judgments based on historical experience, test data and various other assumptions including estimated field failure rates that we believe to be reasonable under the circumstances. The results of these judgments formed the basis for our estimate of the total charge to cover anticipated customer warranty, repair, return and replacement and other associated costs. However, if actual repair, return, replacement and other associated costs and/or actual field failure rates exceed our estimates, we may be required to record additional reserves, which would increase our cost of revenue and materially harm our financial results.
In September, October and November 2008, several putative class action lawsuits were filed against us, asserting various claims related to the impacted MCP and GPU products. Please refer to Note 12 of the Notes to the Consolidated Financial Statements in Part IV, Item 15 of this Form 10-K for further information regarding this litigation.
The following table summarizes our contractual obligations that are not on our balance sheet as of January 29, 200625, 2009:
| Contractual Obligations | | Total | | | Within 1 Year | | | 2-3 Years | | | 4-5 Years | | | After 5 Years | | | All Other | |
| | | (In thousands) | |
| | | | | | | | | | | | | | | | | | | | | | | | |
| | | | | | | | | | | | | | | | | | | | | | | | |
| | | | | | | | | | | | | | | | | | | | | | | | |
FIN 48 liability and interest (2) | | | | | | | | | | | | | | | | | | | | | | | | |
Capital purchase obligations | | | | | | | | | | | | | | | | | | | | | | | | |
Total contractual obligations | | | | | | | | | | | | | | | | | | | | | | | | |
(1) Represents our inventory purchase commitments as of January 25, 2009.
(2) Represents our FIN 48 liability and FIN 48 net interest/penalty payable for $95.3 million and $11.8 million, respectively, as of January 25, 2009. We are unable to reasonably estimate the effect such obligations are expectedtiming of FIN 48 liability and interest/penalty payments in individual years due to have on our liquidity and cash flowuncertainties in future periods: | | | | | | | | | | | | | | | |
Contractual Obligations | | Total | | Within 1 Year | | 2-3 Years | | 4-5 Years | | After 5 Years |
| | | (in thousands) |
Operating leases | | $ | 172,483 | | $ | 29,557 | | $ | 57,717 | | $ | 55,606 | | $ | 29,603 |
Purchase obligations (1) | | | 401,571 | | | 401,571 | | | — | | | — | | | — |
| | | | | | | | | | | | | | | |
Total contractual obligations | | $ | 574,054 | | $ | 431,128 | | $ | 57,717 | | $ | 55,606 | | $ | 29,603 |
| | | | | | | | | | | | | | | |
(1) | Represents our inventory purchase commitments as of January 29, 2006. |
the timing of the effective settlement of tax positions.
Off-Balance Sheet Arrangements
We have
As of January 25, 2009, we had no material off-balance sheet arrangements as defined in Regulation S-K 303(a)(4)(ii).
Adoption of New Accounting Pronouncements
Please see Note 1 of the Notes to the Consolidated Financial Statements in Part IV, Item 15 of this Form 10-K for a discussion of adoption of new accounting pronouncements.
Recently Issued Accounting Pronouncements
In December 2004, the Financial Accounting Standards Board, or FASB, issued Statement of Financial Accounting Standards No. 123(R), or SFAS No. 123(R),Share-Based Payment, which requires the measurement and recognition of compensation expense for all stock-based compensation payments. In April 2005, the SEC delayed the effective date of SFAS No. 123(R), which is now effective for annual periods that begin after June 15, 2005. In March 2005, the SEC issued Staff Accounting Bulletin No. 107, or SAB No. 107, which includes interpretive guidance for the initial implementation of SFAS No. 123(R). SFAS No. 123(R) allows for either prospective recognition of compensation expense or retrospective recognition. We intend to adopt SFAS No. 123(R) using the modified prospective method, which requires the application
Please see Note 1 of the
accounting standard as of January 30, 2006, the first day of our fiscal 2007. Expensing these incentives in future periods will materially and adversely affect our reported operating results as the stock-based compensation expense would be charged directly against our reported earnings. We anticipate that our stock-based compensation expense will be approximately $18 to $22 million for the first quarter of fiscal 2007 and we are unsure how the market will react to this adverse affect on our operating results, which could impact our stock price.During the first quarter of fiscal 2006, we transitioned from a Black-Scholes model to a binomial model for calculating the estimated fair value of new stock-based compensation awards granted under our stock option plans. As a result of recent regulatory guidance, including SAB No. 107, and in anticipation of the impending effective date of SFAS No. 123(R), we reevaluated the assumptions we use to estimate the value of employee stock options and shares issued under our employee stock purchase plan, beginning with stock options granted and shares issued under our employee stock purchase plan in our first quarter of fiscal 2006. We determined that the use of implied volatility is expected to be more reflective of market conditions and, therefore, can reasonably be expected to be a better indicator of expected volatility than historical volatility. Additionally, in the first quarter of fiscal 2006, we began segregating options into groups for employees with relatively homogeneous exercise behavior in order to make full use of the capabilities of the binomial valuation model. As such, the expected term is based on detailed historical data about employees' exercise behavior, vesting schedules, and death and disability probabilities. We believe the resulting binomial calculation provides a more refined estimate of the fair value of our employee stock options. For our employee stock purchase plan, we decided to continue to use the Black-Scholes model to calculate the estimated fair value.
In June 2005, the FASB issued SFAS No. 154, or SFAS No. 154,Accounting Changes and Error Corrections, a replacement of APB Opinion No. 20 and FASB Statement No. 3. SFAS No. 154 applies to all voluntary changes
in accounting principle, and changes the requirements for accounting for and reporting of a change in accounting principle. We will adopt SFAS 154 during the first quarter of fiscal 2007. We do not expect the adoption of SFAS No. 154 to have a material impact on our consolidated financial position, results of operations or cash flows.
In June 2005, the FASB ratified the Emerging Issues Task Force’s, or EITF’s, Issue No. 05-06, or EITF No. 05-06,Determining the Amortization Period for Leasehold Improvements. EITF No. 05-06 provides that the amortization period used for leasehold improvements acquired in a business combination or purchased after the inception of a lease be the shorter of (a) the useful life of the assets or (b) a term that includes required lease periods and renewals that are reasonably assured upon the acquisition or the purchase. The provisions of EITF No. 05-06 are effective on a prospective basis for leasehold improvements purchased or acquired. We adopted EITF No. 05-06 during the second quarter of fiscal 2006 and it did not have a material impact on our consolidated financial position, results of operations or cash flows.
In November 2005, the FASB issued Staff Position, or FSP, FAS115-1/124-1,The Meaning of Other-Than-Temporary Impairment and Its Application to Certain Investments, which addresses the determination as to when an investment is considered impaired, whether that impairment is other than temporary, and the measurement of an impairment loss. This FSP also includes accounting considerations subsequentNotes to the recognition of an other-than-temporary impairment and requires certain disclosures about unrealized losses that have not been recognized as other-than-temporary impairments. The guidanceConsolidated Financial Statements in this FSP amends SFAS No. 115,Accounting for Certain Investments in Debt and Equity Securities, and SFAS No. 124,Accounting for Certain Investments Held by Not-for-Profit Organizations, and APB Opinion No. 18,The Equity Method of Accounting for Investments in Common Stock. We will adopt this FSP during the first quarter of fiscal 2007. We do not believe the adoptionPart IV, Item 15 of this FSP will haveForm 10-K for a material impact on our consolidated financial position, resultsdiscussion of operations or cash flows.
In November 2005, the FASBrecently issued FSP FAS123(R)-3,Transition Election to Accounting for the Tax Effects of Share-Based Payment Awards.This FSP requires an entity to follow either the transition guidance for the additional-paid-in-capital pool as prescribed in SFAS No. 123(R),Share-Based Payment, or the alternative transition method as described in the FSP. An entity that adopts SFAS No. 123(R) using the modified prospective application may make a one-time election to adopt the transition method described in this FSP. An entity may take up to one year from the later of its initial adoption of SFAS No. 123(R) or the effective date of this FSP to evaluate its available transition alternatives and make its one-time election. This FSP became effective in November 2005. We are currently evaluating the impact that the adoption of this FSP could have on our consolidated financial position, results of operations or cash flows.
accounting pronouncements.
ITEM 7A. QUANTITATIVE AND QUALITATIVE DISCLOSURES ABOUT MARKET RISK
Investment and Interest Rate Risk
As of January 25, 2009 and January 27, 2008, we had $1.26 billion and $1.81 billion, respectively, in cash, cash equivalents and marketable securities. We invest in a variety of financial instruments, consisting principally of investments incash and cash equivalents, asset-backed securities, commercial paper, mortgage-backed securities issued by Government-sponsored enterprises, equity securities, money market funds and highly liquid debt securities of corporations, municipalities and the United States government and its agencies. TheseAs of January 25, 2009, we did not have any investments in auction-rate preferred securities. Our investments are denominated in United States dollars. We account for our investment instruments in accordance with Statement of Financial Accounting Standards No. 115, or SFAS No. 115,Accounting for Certain Investments in Debt and Equity Securities. All of the cash equivalents and marketable securities are treated as “available-for-sale” under SFAS No. 115. Investments in both fixed rate and floating rate interest earning instruments carry a degree of interest rate risk. Fixed rate securities may have their market value adversely impacted due to a rise in interest rates, while floating rate securities may produce less income than expected if interest rates fall. Due in part to these factors, our future investment income may fall short of expectations due to changes in interest rates or
weif the decline in fair value of our publicly traded debt or equity investments is judged to be other-than-temporary. We may suffer losses in principal if we are forced to sell securities that decline in
securities market value due to changes in interest rates. However, because
we classify ourany debt securities
we hold are classified as
“available-for-sale”,“available-for-sale,” no gains or losses are
recognizedrealized in our Consolidated Statements of Operations due to changes in interest rates unless such securities are sold prior to maturity or
unless declines in
fair value are determined to be
other than temporary.other-than-temporary. These securities are reported at fair value with the related unrealized gains and losses included in accumulated other comprehensive income
(loss), a component of stockholders’ equity, net of tax.
As of January 29, 2006,25, 2009, we performed a sensitivity analysis on our floating and fixed rate financial investments. According to our analysis, parallel shifts in the yield curve of both +/-plus or minus 0.5% would result in changes in fair market values for these investments of approximately $2.6$4.4 million. The current financial turmoil affecting the banking system and financial markets and the possibility that financial institutions may consolidate or go out of business have resulted in a tightening in the credit markets, a low level of liquidity in many financial markets, and extreme volatility in fixed income, credit, currency and equity markets. There could be a number of follow-on effects from the credit crisis on our business, including insolvency of key suppliers resulting in product delays; inability of customers, including channel partners, to obtain credit to finance purchases of our products and/or customer, including channel partner, insolvencies; and failure of financial institutions, which may negatively impact our treasury operations. Other income and expense could also vary materially from expectations depending on gains or losses realized on the sale or exchange of financial instruments; impairment charges related to debt securities as well as equity and other investments; interest rates; and cash, cash equivalent and marketable securities balances. The current volatility in the financial markets and overall economic uncertainty increases the risk that the actual amounts realized in the future on our financial instruments could differ significantly from the fair values currently assigned to them. For instance, we recorded other than temporary impairment charges of $9.9 million during fiscal year 2009. These charges include $5.6 million related to what we believe is an other than temporary impairment of our investment in the money market funds held by the Reserve International Liquidity Fund, Ltd., or International Reserve Fund; $2.5 million related to a decline in the value of publicly traded equity securities and $1.8 million related to debt securities held by us that were issued by companies that have filed for bankruptcy as of January 25, 2009. Please refer to Note 17 of the Notes to the Consolidated Financial Statements in Part IV, Item 15 of this Form 10-K for further details. As of January 25, 2009, our investments in government agencies and government sponsored enterprises represented approximately 71% of our total investment portfolio, while the financial sector accounted for approximately 17% of our total investment portfolio. Substantially all of our investments are with A/A2 or better rated securities with the substantial majority of the securities rated AA-/Aa3 or better. If the fair value of our investments in these sectors was to decline by 2%-5%, it would result in changes in fair market values for these investments by approximately $25-$63 million.
We consider our direct exposure to foreign exchange rate fluctuations to be minimal. Gains or losses from foreign currency remeasurement are included in “Other income (expense), net” in our Consolidated Financial Statements and to date have not been significant. The impact of foreign currency transaction loss included in determining net income (loss) for fiscal years 2009, 2008 and 2007 was $2.0 million, $1.7 million and $0.5 million, respectively. Currently, sales and arrangements with third-party manufacturers provide for pricing and payment in United States dollars, and, therefore, are not subject to exchange rate fluctuations. Increases in the value of the United States’ dollar relative to other currencies would make our products more expensive, which could negatively impact our ability to compete. Conversely, decreases in the value of the United States’ dollar relative to other currencies could result in our suppliers raising their prices in order to continue doing business with us. To date, we have not engaged in any currency hedging activities, although we may do so in the future. Fluctuations in currency exchange rates could harm our business in the future. We may enter into certain transactions such as forward contracts which are designed to reduce the future potential impact resulting from changes in foreign currency exchange rates. There were no forward exchange contracts outstanding at January 25, 2009.
ITEM 8. CONSOLIDATED FINANCIAL STATEMENTS AND SUPPLEMENTARY DATA The information required by this itemItem is set forth in our Consolidated Financial Statements and Notes thereto included in this Annual Report on Form 10-K/A.10-K.
ITEM 9. CHANGES IN AND DISAGREEMENTS WITH ACCOUNTANTS ON ACCOUNTING AND FINANCIAL DISCLOSURE
Not applicable.
ITEM 9A. CONTROLS AND PROCEDURESAudit Committee Review into Past Option Grants and Practices and Restatement
In May 2006, following media reports of stock option accounting investigations at other companies, the management of NVIDIA decided to conduct a review of stock option grants made by NVIDIA. Management advised the Company’s Board of Directors of the review at a regularly-scheduled meeting of the Board of Directors on May 25, 2006. The Board of Directors directed management to report its findings to the Audit Committee. Management presented its findings to the Audit Committee in late June 2006. Following that presentation, the Audit Committee determined that it should perform its own independent review of stock option grants made by NVIDIA. The Audit Committee, with the assistance of outside legal counsel, began its review on approximately June 29, 2006.
The Audit Committee’s review was completed on November 13, 2006 when the Audit Committee reported its findings to the full Board of Directors. The review covered option grants to all employees, directors and consultants for all grant dates during the period from our initial public offering in January 1999 through June 2006. As part of its review, the Audit Committee determined whether the correct measurement dates had been used under applicable accounting principles for these options. The measurement date means the date on which the option is deemed granted under applicable accounting principles, namely Accounting Principles Board Opinion No. 25, or APB 25,Accounting for Stock Issued to Employees and related interpretations, and is the first date on which all of the following are known: (1) the individual employee who is entitled to receive the option grant, (2) the number of options that an individual employee is entitled to receive, and (3) the option’s exercise price.
Based on the findings of the Audit Committee and our internal review, we identified a number of occasions on which we used an incorrect measurement date for financial accounting and reporting purposes. These errors resulted primarily from our use during our fiscal year 2000, 2001 and 2002, of certain date selection methods discussed below which resulted in employees receiving options with stated exercise prices lower than the market prices as measured based upon the actual grant dates. We ceased using such practices beginning in our fiscal year 2003. The Audit Committee found that, beginning in our fiscal year 2003, we improved our stock option grant processes and have generally granted and priced our employee stock options in an objective and consistent manner since that time. However, for one Company-wide annual stock option grant we made in fiscal 2004, we did not finalize the number of options allocated to each employee as of the stated grant date in May 2003, which resulted in stock-based compensation charges due to the change in the measurement date to the date the grants were finalized. The Audit Committee’s review did not identify any additional stock-based compensation charges from measurement date issues subsequent to that fiscal year 2004 grant.
In accordance with APB 25, with respect to periods through January 29, 2006, we should have recorded stock-based compensation expense to the extent that the fair market value of our common stock on the correct measurement date exceeded the exercise price of each option granted. For periods commencing January 30, 2006 (the beginning of our fiscal year 2007), we record stock-based compensation expense in accordance with Statement of Financial Accounting Standards No. 123(R) (revised), or SFAS No. 123(R),Share-Based Payment.
As a result of the measurement date errors identified from the Audit Committee’s review, through January 29, 2006, we recorded aggregate non-cash stock-based compensation charges of $127.4 million, net of related tax effects. These charges were based primarily on APB 25 (intrinsic value-based) charges and associated payroll taxes of $199.6 million on a pre-tax basis, which are being amortized over the vesting term of the stock options in accordance with Financial Accounting Standards Board Interpretation No. 28, or FIN 28,Accounting for Stock Appreciation Rights and Other Variable Stock Option or Award Plans. We have amortized a substantial portion of these charges to expense during our fiscal years 2000 to 2006. If an option is forfeited prior to vesting, we reverse both the charges amortized to expense in prior periods as well as any remaining unamortized deferred stock-based compensation associated with the forfeited options. Accordingly, our net stock-based compensation charges amortized to our statement of income are lower than the aggregate stock-based compensation charges based on APB 25 (intrinsic-value based). As of January 29, 2006, the remaining APB 25 (intrinsic value-based) unamortized deferred stock-based compensation related to the errors identified during the review was approximately $3.0 million.
The types of errors we identified were as follows:
Improper Measurement Dates forCompany-Wide Annual or Retention Stock Option Grants. We determined that, in connection with certain annual or retention stock option grants that we made to employees during our fiscal years 2000, 2001, 2002, 2003 and 2004, the final number of shares that an individual employee was entitled to receive was not determined and/or the proper approval of the related stock option grant had not been given until after the stated grant date. Therefore, the measurement date for such options for accounting purposes was actually subsequent to the stated grant date, resulting in new measurement dates for the related options.
Improper Measurement Dates for Stock Option Grants during Fiscal Years 2001 and 2002. In connection with stock option grants that we made to newly-hired employees (and, to a much lesser degree, retention grants to existing employees) during fiscal years 2001 and 2002, our practice was to grant stock options with an exercise price based upon the lowest closing price of our common stock in the last few days of the month of hire or the last few days of any subsequent month in the quarter of hire. The selection of the grant date of the related option grants would be made at the end of the fiscal quarter and was based on achieving the lowest exercise price for the affected employees. As a result of these practices, the measurement date for such options for accounting purposes was actually subsequent to the stated grant date, resulting in new measurement dates for the related options.
Improper Measurement Dates for Stock Option Grants during Fiscal Year 2000. In connection with certain stock option grants to newly-hired employees (and, to a much lesser degree, retention grants to existing employees) during a portion of fiscal year 2000, our practice was to delay the selection of the related grant dates until the end of a two-month period in the fiscal quarter during which the employees who received the grants began their employment with NVIDIA. As a result of this practice, the exercise price of the related option grants was not determined until subsequent to the stated grant date. We also determined that, during fiscal year 2000, we generally set the grant date and exercise price of employee option grants for new hires and promotions at the lowest price of the last few business days of the month of their hire or promotion (or of the following month in certain two-month periods that were chosen for an indeterminate reason). As a result of these practices, the measurement date for such options for accounting purposes was actually subsequent to the stated grant date, resulting in new measurement dates for the related options. In addition, we also determined that the exercise price or the number of options to be granted had not been determined, or the proper approval had not been given, for various other miscellaneous option grants during fiscal year 2000 until after the stated grant date - resulting in new measurement dates for accounting purposes for the related options.
Other Issues Identified.We also identified instances where stock option grants did not comply with applicable terms and conditions of the stock plans from which the grants were issued. For example, two grants were made to officers of NVIDIA by the chief executive officer under delegated authority; however, under the terms of the applicable plan, the option grant should have been made by our Board or the Compensation Committee. There were also instances where (1) option grants were made to a small group of employees who joined NVIDIA pursuant to a business combination, and to a few other employees in certain instances, with stated exercise prices below the fair market value of our common stock on the actual measurement date of the related grants; and (2) option grants were made to a few individuals who were contractors rather than employees, without recording the appropriate accounting charges. The accounting impact of these items was cumulatively less than $6.0 million. In addition, the Audit Committee did not find any evidence that these violations were committed for improper purposes.
The Audit Committee carefully considered the involvement of current members of management in the option grant process and concluded that the evidence did not give rise to any concern about the integrity of any current officer or director of NVIDIA. The Audit Committee also found that the accounting errors and improper practices brought to light during their review were not motivated by any intent to mislead investors, improve NVIDIA’s reported financial results, or obtain any personal benefit. Based on its findings, the Audit Committee was unable to reach any conclusion regarding the integrity of former officers and employees.
As a result of the errors we identified, we have restated our historical financial statements from our fiscal year 2000 through our fiscal year 2006 to record $127.4 million of charges related to stock-based compensation and associated payroll tax expense, net of related income tax effects. These errors resulted in after-tax charges of $1.4 million, $11.7 million and $25.8 million for our fiscal years 2006, 2005 and 2004, respectively. Additionally, the cumulative effect of the related after-tax charges for periods prior to our fiscal year ended January 25, 2004 was $88.4 million. These additional stock-based compensation expense charges were non-cash and had no impact on our reported revenue, cash, cash equivalents or marketable securities for each of the restated periods.
For all periods through the end of our fiscal year 2006, we have recorded aggregate non-cash stock-based compensation charges of $190.2 million, associated payroll tax charges of $9.4 million and a related income tax benefit of $72.2 million.
We recorded an income tax benefit of $2.0 million, $6.7 million, and $14.6 million for our fiscal years 2006, 2005 and 2004, respectively. The cumulative income tax benefit for periods prior to our fiscal year 2004 was $48.9 million. The income tax benefit differs from the expected statutory federal tax benefit principally as a result of state income tax benefits and federal and state research and experimental tax credits not previously benefited on stock-based compensation charges. Additionally, in our fiscal year 2004, we released a valuation allowance of $3.2 million recognized in prior periods on the incremental stock-based compensation expense. Prior to our fiscal year 2004, it was not more likely than not that we would realize the benefits of the future deductible amounts related to stock-based compensation expense. In our fiscal year 2004, the realization of these amounts became more likely than not due to settlement of certain tax contingencies related to stock-based compensation expense.
As part of this restatement, we also accrued liabilities and recorded charges to operating costs and expenses for certain payroll tax contingencies related to the incremental stock-based compensation expense in the amount of $18.8 million for all annual periods from our fiscal year 2000 through our fiscal year 2006. We recorded such charges in the amount of $3.1 million, $1.3 million, and $1.6 million for our fiscal years 2006, 2005 and 2004, respectively. Upon expiration of the related statute of limitations, we also recorded benefits from the reversal of previously-recorded payroll tax liabilities of $6.6 million and $2.8 million in our fiscal years 2006 and 2005, respectively. As a result, the net benefit to our statements of income was $3.5 million and $1.5 million for our fiscal years 2006 and 2005, respectively. The cumulative payroll tax expense for periods prior to our fiscal year 2004 was $12.8 million. For those stock option grants that we determined to have incorrect measurement dates for accounting purposes and that we had originally issued as incentive stock options, or ISOs, we recorded a liability for payroll tax contingencies in the event such grants would not be respected as ISOs under the principles of the Internal Revenue Code, or IRC, and the regulations thereunder. These liabilities were recorded with a charge to operating costs and expenses.
We also considered the application of Section 409A of the IRC to certain stock option grants where, under APB 25, intrinsic value existed at the time of grant. In the event such stock options grants are not respected as issued at fair market value at the original grant date under principles of the IRC and the regulations thereunder and are subject to Section 409A, we are considering potential remedial actions that may be available. We do not expect to incur a material charge as a result of any such potential remedial actions.
As a result of the findings of the Audit Committee, we concluded that we needed to amend our Original Filing to restate our consolidated financial statements for the years ended January 29, 2006, January 30, 2005, and January 25, 2004 and the related disclosures.
Management’s Conclusion Regarding the Effectiveness of Internal Control over Stock Option Grant Practices
In assessing whether our disclosure controls and procedures and our internal control over financial reporting were effective as of January 29, 2006, management considered, among other things, the impact of the restatement of the financial statements for fiscal years 2004, 2005, and 2006, the nature of the restatement as disclosed in Note 2 of the Notes to Consolidated Financial Statements, and the effectiveness of internal control in this area as of January 29, 2006.
Management’s Consideration of the Restatement
In coming to the conclusion that our disclosure controls and procedures and our internal control over financial reporting were effective as of January 29, 2006, management considered, among other things, the control deficiencies related to accounting for stock based compensation and the control environment. Management also considered the conclusions of the Audit Committee, following an extensive review of our past and current stock option grants and practices, that: (a) while NVIDIA used incorrect accounting measurement dates for certain stock option grants, as more fully discussed above, those errors were not a result of fraud; and (b) our option grant practices had improved significantly since May 2003. These control deficiencies resulted in the need to restate our previously-issued financial statements as disclosed in Note 2, “Restatement of Consolidated Financial Statements, Audit Committee and Company Findings”, of the Notes to our Consolidated Financial Statements. Management has concluded that the control deficiencies that resulted in the restatement of the previously-issued financial statements did not constitute a material weakness as of January 29, 2006 because management determined that as of January 29, 2006 there were effective controls designed and in place to prevent or detect a material misstatement and, therefore, the likelihood of our financial statements being materially misstated is remote.
Specifically, during our fiscal years 2003 through 2006, NVIDIA implemented new policies and processes to provide greater internal controls over our stock option grant approvals, including:
enhanced processes surrounding Company-wide annual and semi-annual grants, especially pertaining to advanced planning, approval timelines, documentation, and communication;
improved procedures related to the administration of option grants related to newly-hired employees;
hiring of additional qualified personnel in the areas of financial accounting and reporting as well as legal;
documentation and testing of key controls in the area of stock administration, including controls based in processes driven by our human resource department;
review and approval by the Compensation Committee of our stock option grant guidelines and policies;
timely approval of stock option grants by the Compensation Committee;
enhanced focus on the establishment of guidelines in order to achieve a high level of objectivity in the determination of stock option grants made to all employees; and
increased review of our stock option grant plans and approval processes and documentation by our legal counsel
Management has concluded, therefore, that the control deficiencies that resulted in the restatement of the previously issued financial statements did not constitute a material weakness as of January 29, 2006.
Audit Committee’s Recommended Further Measures Regarding Stock Option Grants
The Audit Committee noted that management had significantly improved our stock option grant practices since May 2003. However, the Audit Committee recommended, and the Board of Directors approved, the following best practices, which we intend to adopt, for consideration in light of its review into our past stock option grant processes:
establish pre-determined grant dates for all stock option grants made by NVIDIA;
the Compensation Committee should establish stock option grant budgets and guidelines on no less than an annual basis, to be reviewed on a semi-annual basis;
the Compensation Committee should be provided with enhanced support to ensure that its monitoring of the compliance by the Company with the Compensation Committee’s guidelines, the applicable stock plan terms and conditions, and the related accounting for stock option grants;
our management should report quarterly to the Audit Committee regarding our stock option grant practices, including compliance with internal procedures, proper accounting principles, and applicable disclosure requirements;
we should improve documentation of option grant approvals and approved grants should be promptly entered into our financial records and stock option database; and
our stock administration personnel should continue to receive regular training.
Controls and Procedures
Disclosure Controls and Procedures
Based on their evaluation as of January
29, 2006,25, 2009, our management, including our Chief Executive Officer and Chief Financial Officer,
havehas concluded that our disclosure controls and procedures (as defined in Rule 13a-15(e) under the
Securities Exchange Act of
1934, or the Exchange Act)1934) were
effective to ensure that the material information required to be disclosed by us in this Annual Report on Form 10-K/A was recorded, processed, summarized and reported within the time periods specified in the Securities and Exchange Commission’s rules and instructions for Form 10-K.effective.
Management’s Annual Report on Internal Control Over Financial Reporting
Our management is responsible for establishing and maintaining adequate internal control over financial reporting, as such term is defined in Exchange Act Rule 13a-15(f). Under the supervision and with the participation of our management, including our Chief Executive Officer and Chief Financial Officer, we conducted an evaluation of the effectiveness of our internal control over financial reporting as of January 29, 200625, 2009 based on the criteria set forth inInternal Control - Integrated Frameworkissued by the Committee of Sponsoring Organizations of the Treadway Commission. Based on our evaluation under the criteria set forth in
Internal Control — Integrated Framework, our management concluded that our internal control over financial reporting was effective as of January
29, 2006.25, 2009.Our management’s assessment of the
The effectiveness of our internal control over financial reporting as of January
29, 200625, 2009 has been audited by PricewaterhouseCoopers LLP, an independent registered public accounting firm, as stated in
theirits report which is included herein.
Changes in Internal Control Over Financial Reporting
There were no changes in our internal controls over financial reporting during our last fiscal quarter that have materially affected, or are reasonably likely to materially affect, our internal control over financial reporting.
Inherent Limitations on Effectiveness of Controls
Our management, including our Chief Executive Officer and Chief Financial Officer, does not expect that our disclosure controls and procedures or our internal controls, will prevent all error and all fraud. A control system, no matter how well conceived and operated, can provide only reasonable, not absolute, assurance that the objectives of the control system are met. Further, the design of a control system must reflect the fact that there are resource constraints, and the benefits of controls must be considered relative to their costs. Because of the inherent limitations in all control systems, no evaluation of controls can provide absolute assurance that all control issues and instances of fraud, if any, within NVIDIA have been detected.
None.
PART III
ITEM 10. DIRECTORS, AND EXECUTIVE OFFICERS OF THE REGISTRANTAND CORPORATE GOVERNANCE Identification of Directors
Reference is made to the information regarding directors appearing under the heading “Election“Proposal 1 - Election of Directors” in our 20062009 Proxy Statement, which information is hereby incorporated by reference. Identification of Executive Officers
Reference is made to the information regarding executive officers appearing under the heading “Executive Officers of the Registrant” in Part I of this Annual Report on Form
10-K/A,10-K, which information is hereby incorporated by reference.
Identification of Audit Committee and Financial Expert
Reference is made to the information regarding directors appearing under the heading “Report of the Audit Committee of the Board of Directors”
and “Information about the Board of Directors and Corporate Governance” in our
20062009 Proxy Statement, which information is hereby incorporated by reference.
Material Changes to Procedures for Recommending Directors
Reference is made to the information regarding directors appearing under the heading
“Election“Information about the Board of
Directors”Directors and Corporate Governance” in our
20062009 Proxy Statement, which information is hereby incorporated by reference.
Compliance with Section 16(a) of the Exchange Act
Reference is made to the information appearing under the heading “Section 16(a) Beneficial Ownership Reporting Compliance” in our 20062009 Proxy Statement, which information is hereby incorporated by reference. Reference is made to the information appearing under the heading “Code“Information about the Board of Ethics”Directors and Corporate Governance - Code of Conduct” in our 20062009 Proxy Statement, which information is hereby incorporated by reference. The full text of our “Worldwide Code of Ethics”Conduct” and “Financial Team Code of Ethics”Conduct” are published on ourthe Investor Relations portion of our web site, under Corporate Governance, atwww.nvidia.com. The contents of our website are not a part of this Annual Report on Form 10-K.
ITEM 11. EXECUTIVE COMPENSATIONReference
The information required by this item is made tohereby incorporate by reference from the information appearing under the headingsections entitled “Executive Compensation”, “Compensation Committee Interlocks and Insider Participation”, “Director Compensation” and “Compensation Committee Report” in our 20062009 Proxy Statement, which information is hereby incorporated by reference.Statement.
ITEM 12. SECURITY OWNERSHIP OF CERTAIN BENEFICIAL OWNERS AND MANAGEMENT AND RELATED STOCKHOLDER MATTERS
Ownership of NVIDIA Securities
Reference
The information required by this item is made tohereby incorporated by reference from the information appearing in our 2006 Proxy Statement under the headingsection entitled “Security Ownership of Certain Beneficial Owners and Management”, which information is hereby incorporated by reference. in our 2009 Proxy Statement.
Equity Compensation Plan Information
Information regarding our equity compensation plans, including both stockholder approved plans and non-stockholder approved plans, will be contained in our definitive2009 Proxy Statement with respect to our Annual Meeting of Stockholders under the caption "Compensation-Equity"Equity Compensation Plan Information",Information," and is incorporated by reference into this report.Annual Report on Form 10-K.
ITEM 13. CERTAIN RELATIONSHIPS AND RELATED TRANSACTIONS, AND DIRECTOR INDEPENDENCEReference is made to the
The information appearing in our 2006 Proxy Statement under the heading “Certain Transactions”, which informationrequired by this item is hereby incorporated by reference.reference from the sections entitled “Transactions with Related Persons”, “Review of Transactions with Related Persons” and “Information about the Board of Directors and Corporate Governance - Independence of the Members of the Board of Directors” in our 2009 Proxy Statement.
ITEM 14. PRINCIPAL ACCOUNTING FEES AND SERVICESReference is made to the
The information appearing in our 2006 Proxy Statement, which informationrequired by this item is hereby incorporated by reference.reference from the section entitled “Fees Billed by the Independent Registered Public Accounting Firm” in our 2009 Proxy Statement.
ITEM 15. | | | Page |
| (a) | 1. | Consolidated Financial Statements | |
| | | |
| | | 66 |
| | | |
| | | 67 |
| | | |
| | | 68 |
| | | |
| | | 69 |
| | | |
| | | 70 |
| | | |
| | | 71 |
| | | |
| (a) | 2. | Financial Statement Schedule | |
| | | |
| | | 109 |
| | | |
| (a) | 3. | Exhibits | |
| | | |
| | | 113 |
| | | |
| | | | | | |
| | | | | | | Page |
| (a) | | 1. | | Consolidated Financial Statements | | |
| | | |
| | | | Report of Independent Registered Public Accounting Firm, PricewaterhouseCoopers LLP | | 65 |
| | | |
| | | | Report of Independent Registered Public Accounting Firm, KPMG LLP | | 67 |
| | | |
| | | | Consolidated Balance Sheets as of January 29, 2006, and January 30, 2005, as restated | | 68 |
| | | |
| | | | Consolidated Statements of Income for the years ended January 29, 2006, January 30, 2005, and January 25, 2004, as restated | | 69 |
| | | |
| | | | Consolidated Statements of Stockholders’ Equity and Comprehensive Income for the years ended January 29, 2006, January 30, 2005, and January 25, 2004, as restated | | 70 |
| | | |
| | | | Consolidated Statements of Cash Flows for the years January 29, 2006, January 30, 2005, and January 25, 2004, as restated | | 71 |
| | | |
| | | | Notes to Consolidated Financial Statements | | 73 |
| | | |
| (a) | | 2. | | Financial Statement Schedules | | |
| | | |
| | | | Schedule II Valuation and Qualifying Accounts | | 106 |
| | | |
| (a) | | 3. | | Exhibits | | 107 |
| | | |
| | | | The exhibits listed in the accompanying index to exhibits are filed or incorporated by reference as a part of this Annual Report on Form 10-K/A. | | |
REPORT OF INDEPENDENT REGISTERED PUBLIC ACCOUNTING FIRM
To the Stockholders and Board of DirectorsNVIDIA of Nvidia Corporation:
We have completed integrated audits of NVIDIA Corporation’s fiscal 2006 and 2005 consolidated financial statements and of its internal control over financial reporting as of January 29, 2006 in accordance with the standards of the Public Company Accounting Oversight Board (United States). Our opinions, based on our audits, are presented below.
Consolidated financial statements and financial statement scheduleIn our opinion, the consolidated financial statements listed in the index appearing under Item 15(a)(1) present fairly, in all material respects, the financial position of NVIDIA Corporation and its subsidiaries at January 29, 200625, 2009 and January 30, 200527, 2008, and the results of their operations and their cash flows for each of the twothree years in the period ended January 29, 200625, 2009 in conformity with accounting principles generally accepted in the United States of America. In addition, in our opinion, the financial statement schedule listed in the index appearing under Item 15(a)(2) presents fairly, in all material respects, the information set forth therein as of January 29, 2006 and January 30, 2005 and for each of the two years in the period ended January 29, 2006 when read in conjunction with the related consolidated financial statements. TheseAlso in our opinion, the Company maintained, in all material respects, effective internal control over financial reporting as of January 25, 2009, based on criteria established in Internal Control - Integrated Framework issued by the Committee of Sponsoring Organizations of the Treadway Commission (COSO). The Company's management is responsible for these financial statements and the financial statement schedule, are the responsibilityfor maintaining effective internal control over financial reporting and for its assessment of the Company’s management.effectiveness of internal control over financial reporting, included in Management's Annual Report on Internal Control over Financial Reporting appearing under Item 9A. Our responsibility is to express an opinionopinions on these financial statements, on the financial statement schedule, and on the Company's internal control over financial reporting based on our integrated audits. We conducted our audits of these statements in accordance with the standards of the Public Company Accounting Oversight Board (United States). Those standards require that we plan and perform the auditaudits to obtain reasonable assurance about whether the financial statements are free of material misstatement. An auditmisstatement and whether effective internal control over financial reporting was maintained in all material respects. Our audits of the financial statements includesincluded examining, on a test basis, evidence supporting the amounts and disclosures in the financial statements, assessing the accounting principles used and significant estimates made by management, and evaluating the overall financial statement presentation. Our audit of internal control over financial reporting included obtaining an understanding of internal control over financial reporting, assessing the risk that a material weakness exists, and testing and evaluating the design and operating effectiveness of internal control based on the assessed risk. Our audits also included performing such other procedures as we considered necessary in the circumstances. We believe that our audits provide a reasonable basis for our opinion.
As described in Note 2 to the consolidated financial statements, the Company has restated its fiscal 2006 and fiscal 2005 consolidated financial statements.
Internal control over financial reporting
Also, in our opinion, management’s assessment, included in Management’s Annual Report on Internal Control over Financial Reporting appearing under Item 9A, that the Company maintained effective internal control over financial reporting as of January 29, 2006 based on criteria established inInternal Control - Integrated Framework issued by the Committee of Sponsoring Organizations of the Treadway Commission (COSO), is fairly stated, in all material respects, based on those criteria. Furthermore, in our opinion, the Company maintained, in all material respects, effective internal control over financial reporting as of January 29, 2006, based on criteria established inInternal Control - Integrated Framework issued by the COSO. The Company’s management is responsible for maintaining effective internal control over financial reporting and for its assessment of the effectiveness of internal control over financial reporting. Our responsibility is to express opinions on management’s assessment and on the effectiveness of the Company’s internal control over financial reporting based on our audit. We conducted our audit of internal control over financial reporting in accordance with the standards of the Public Company Accounting Oversight Board (United States). Those standards require that we plan and perform the audit to obtain reasonable assurance about whether effective internal control over financial reporting was maintained in all material respects. An audit of internal control over financial reporting includes obtaining an understanding of internal control over financial reporting, evaluating management’s assessment, testing and evaluating the design and operating effectiveness of internal control, and performing such other procedures as we consider necessary in the circumstances. We believe that our audit provides a reasonable basis for our opinions.
A company’s internal control over financial reporting is a process designed to provide reasonable assurance regarding the reliability of financial reporting and the preparation of financial statements for external purposes in accordance with generally accepted accounting principles. A company’s internal control over financial reporting includes those policies and procedures that (i) pertain to the maintenance of records that, in reasonable detail,
accurately and fairly reflect the transactions and dispositions of the assets of the company; (ii) provide reasonable assurance that transactions are recorded as necessary to permit preparation of financial statements in accordance with generally accepted accounting principles, and that receipts and expenditures of the company are being made only in accordance with authorizations of management and directors of the company; and (iii) provide reasonable assurance regarding prevention or timely detection of unauthorized acquisition, use, or disposition of the company’s assets that could have a material effect on the financial statements.
Because of its inherent limitations, internal control over financial reporting may not prevent or detect misstatements. Also, projections of any evaluation of effectiveness to future periods are subject to the risk that controls may become inadequate because of changes in conditions, or that the degree of compliance with the policies or procedures may deteriorate.
/s/ PricewaterhouseCoopers LLP
March 16, 2006,13, 2009
CONSOLIDATED STATEMENTS OF OPERATIONS
(In thousands, except with respect to our opinionper share data)
| | Year Ended | |
| | | January 25, 2009 | | | January 27, 2008 | | | January 28, 2007 | |
| | | | | | | | | | | | |
| | | | | | | | | | | | |
| | | | | | | | | | | | |
| | | | | | | | | | | | |
| | | | | | | | | | | | |
Sales, general and administrative | | | | | | | | | | | | |
Restructuring charges and other | | | | | | | | | | | | |
| | | | | | | | | | | | |
Income (loss) from operations | | | | | | | | | | | | |
| | | | | | | | | | | | |
| | | | | | | | | | | | |
Other income (expense), net | | | | | | | | | | | | |
Income (loss) before income tax | | | | | | | | | | | | |
Income tax expense (benefit) | | | | | | | | | | | | |
Income (loss) before change in accounting principle | | | | | | | | | | | | |
Cumulative effect of change in accounting principle, net of tax | | | | | | | | | | | | |
| | | | | | | | | | | | |
| | | | | | | | | | | | | |
Basic income (loss) per share: | | | | | | | | | | | | |
Income (loss) before change in accounting principle | | | | | | | | | | | | |
Cumulative effect of change in accounting principle | | | | | | | | | | | | |
Basic net income (loss) per share | | | | | | | | | | | | |
Shares used in basic per share computation (1) | | | | | | | | | | | | |
| | | | | | | | | | | | | |
Diluted income (loss) per share: | | | | | | | | | | | | |
Income (loss) before change in accounting principle | | | | | | | | | | | | |
Cumulative effect of change in accounting principle | | | | | | | | | | | | |
Diluted net income (loss) per share | | | | | | | | | | | | |
Shares used in diluted per share computation (1) | | | | | | | | | | | | |
| | | | | | | | | | | | | |
(1) Reflects a three-for-two stock split effective on the consolidated financial statements insofar as it relates to the restatement discussed in Note 2, as to which the date is November 28,September 10, 2007 and a two-for-one stock split effective on April 6, 2006.REPORT OF INDEPENDENT REGISTERED PUBLIC ACCOUNTING FIRM
The Board of Directors and Stockholders
NVIDIA Corporation:
We have audited the
See accompanying
consolidated statements of income, stockholders’ equity and comprehensive income, and cash flows of NVIDIA Corporation and subsidiaries (the Company) for the year ended January 25, 2004. In connection with our audits of the consolidated financial statements, we have also audited the financial statement schedule for the year ended January 25, 2004 as listed in the index of Item 15. These consolidated financial statements and financial statement schedule are the responsibility of the Company’s management. Our responsibility is to express an opinion on these consolidated financial statements and financial statement schedule based on our audit.We conducted our audit in accordance with the standards of the Public Company Accounting Oversight Board (United States). Those standards require that we plan and perform the audit to obtain reasonable assurance about whether the financial statements are free of material misstatement. An audit includes examining, on a test basis, evidence supporting the amounts and disclosures in the financial statements. An audit also includes assessing the accounting principles used and significant estimates made by management, as well as evaluating the overall financial statement presentation. We believe that our audit provides a reasonable basis for our opinion.
In our opinion, the consolidated financial statements referred to above present fairly, in all material respects, the results of operations and cash flows of NVIDIA Corporation and subsidiaries for the year ended January 25, 2004 in conformity with U.S. generally accepted accounting principles. Also, in our opinion, the related financial statement schedule, when considered in relationnotes to the consolidated financial statements taken as a whole, presents fairly, in all material respects, the information set forth therein.
As described in Note 2 to the accompanying consolidated financial statements, the consolidated statements of income, stockholders’ equity and comprehensive income, and cash flows of NVIDIA Corporation and subsidiaries for the year ended January 25, 2004 have been restated.
/s/ KPMG LLP
Mountain View, California
February 12, 2004, except as to Note 2, which is as of November 28, 2006.
statements.
NVIDIA CORPORATION AND SUBSIDIARIES CONSOLIDATED BALANCE SHEETS
(In thousands, except share and per share data)
| | | | | | | | |
| | | January 29,
2006 | | | January 30,
2005 | |
| | | (As Restated)(1) | | | (As Restated)(1) | |
| ASSETS | | | | | | | | |
Current assets: | | | | | | | | |
Cash and cash equivalents | | $ | 551,756 | | | $ | 208,512 | |
Marketable securities | | | 398,418 | | | | 461,533 | |
Accounts receivable, less allowances of $10,837 and $13,153 in 2006 and 2005, respectively | | | 318,186 | | | | 296,279 | |
Inventories | | | 254,870 | | | | 315,786 | |
Prepaid expenses and other current assets | | | 24,387 | | | | 19,819 | |
Deferred income taxes | | | 2,682 | | | | 4,977 | |
| | | | | | | | |
Total current assets | | | 1,550,299 | | | | 1,306,906 | |
Property and equipment, net | | | 178,152 | | | | 178,955 | |
Deposits and other assets | | | 27,477 | | | | 9,034 | |
Goodwill | | | 145,317 | | | | 108,107 | |
Intangible assets, net | | | 15,421 | | | | 27,514 | |
Deferred income taxes, non-current | | | 38,021 | | | | 33,035 | |
| | | | | | | | |
| | $ | 1,954,687 | | | $ | 1,663,551 | |
| | | | | | | | |
| LIABILITIES AND STOCKHOLDERS’ EQUITY | | | | | | | | |
Current liabilities: | | | | | | | | |
Accounts payable | | $ | 179,395 | | | $ | 238,223 | |
Accrued liabilities | | | 259,264 | | | | 182,077 | |
Current portion of capital lease obligations | | | — | | | | 856 | |
| | | | | | | | |
Total current liabilities | | | 438,659 | | | | 421,156 | |
Other long-term liabilities | | | 20,036 | | | | 21,304 | |
Commitments and contingencies - see Note 12 | | | | | | | | |
Stockholders’ equity: | | | | | | | | |
Preferred stock, $.001 par value; 2,000,000 shares authorized; none issued | | | — | | | | — | |
Common stock, $.001 par value; 1,000,000,000 shares authorized; 179,963,979 shares issued and 171,477,456 outstanding in 2006; and 169,173,898 shares issued and 167,089,545 outstanding in 2005 | | | 180 | | | | 169 | |
Additional paid-in capital | | | 965,784 | | | | 816,051 | |
Deferred compensation | | | (3,604 | ) | | | (13,577 | ) |
Treasury stock | | | (212,142 | ) | | | (24,644 | ) |
Accumulated other comprehensive loss, net | | | (1,957 | ) | | | (3,463 | ) |
Retained earnings | | | 747,731 | | | | 446,555 | |
| | | | | | | | |
Total stockholders' equity | | | 1,495,992 | | | | 1,221,091 | |
| | | | | | | | |
| | $ | 1,954,687 | | | $ | 1,663,551 | |
| | | | | | | | |
(1) | See Note 2, “Restatement of Consolidated Financial Statements, Audit Committee and Company Findings”, of the Notes to Consolidated Financial Statements. |
| | | January 25, 2009 | | | January 27, 2008 | |
| ASSETS | | | | | | |
| | | | | | |
Cash and cash equivalents | | | | | | | | |
| | | | | | | | |
Accounts receivable, less allowances of $18,399 and $19,693 in 2009 and 2008, respectively | | | | | | | | |
| | | | | | | | |
Prepaid expenses and other | | | | | | | | |
| | | | | | | | |
| | | | | | | | |
Property and equipment, net | | | | | | | | |
| | | | | | | | |
| | | | | | | | |
Deposits and other assets | | | | | | | | |
| | | | | | | | |
| | | | | | | | | |
LIABILITIES AND STOCKHOLDERS’ EQUITY | | | | | | | | |
| | | | | | | | |
| | | | | | | | |
Accrued liabilities and other | | | | | | | | |
Total current liabilities | | | | | | | | |
Other long-term liabilities | | | | | | | | |
Capital lease obligations, long term | | | | | | | | |
Commitments and contingencies - see Note 12 | | | | | | | | |
| | | | | | | | |
Preferred stock, $.001 par value; 2,000,000 shares authorized; none issued | | | | | | | | |
Common stock, $.001 par value; 2,000,000,000 shares authorized; 629,386,584 shares issued and 538,460,766 outstanding in 2009; and 618,701,483 shares issued and 557,102,588 outstanding in 2008, respectively | | | | | | | | |
Additional paid-in capital | | | | | | | | |
Treasury stock, at cost (90,925,818 shares in 2009 and 61,598,895 shares in 2008) | | | | | | | | |
Accumulated other comprehensive income | | | | | | | | |
| | | | | | | | |
Total stockholders' equity | | | | | | | | |
Total liabilities and stockholders' equity | | | | | | | | |
| | | | | | | | | |
See accompanying notes to
the consolidated financial statements.
NVIDIA CORPORATION AND SUBSIDIARIESCONSOLIDATED STATEMENTS OF INCOME
(In thousands, except per share data)
| | | | | | | | | | | | |
| | | Year Ended
January 29,
2006 | | | Year Ended
January 30,
2005 | | | Year Ended
January 25,
2004 | |
| | | (As Restated)(1) | | | (As Restated)(1) | | | (As Restated)(1) | |
Revenue | | $ | 2,375,687 | | | $ | 2,010,033 | | | $ | 1,822,945 | |
Cost of revenue | | | 1,465,654 | | | | 1,362,478 | | | | 1,297,684 | |
| | | | | | | | | | | | |
Gross profit | | | 910,033 | | | | 647,555 | | | | 525,261 | |
Operating expenses: | | | | | | | | | | | | |
Research and development | | | 357,123 | | | | 348,220 | | | | 292,162 | |
Sales, general and administrative | | | 202,088 | | | | 204,159 | | | | 179,811 | |
In-process research and development | | | — | | | | — | | | | 3,500 | |
Settlement costs | | | 14,158 | | | | — | | | | — | |
| | | | | | | | | | | | |
Total operating expenses | | | 573,369 | | | | 552,379 | | | | 475,473 | |
| | | | | | | | | | | | |
Income from operations | | | 336,664 | | | | 95,176 | | | | 49,788 | |
| | | |
Interest income | | | 20,698 | | | | 11,422 | | | | 18,561 | |
Interest expense | | | (72 | ) | | | (164 | ) | | | (12,010 | ) |
Other income (expense), net | | | (502 | ) | | | 594 | | | | 3,033 | |
Convertible debenture redemption expense | | | — | | | | — | | | | (13,068 | ) |
| | | | | | | | | | | | |
Income before income tax expense (benefit) | | | 356,788 | | | | 107,028 | | | | 46,304 | |
Income tax expense (benefit) | | | 55,612 | | | | 18,413 | | | | (2,326 | ) |
| | | | | | | | | | | | |
Net income | | $ | 301,176 | | | $ | 88,615 | | | $ | 48,630 | |
| | | | | | | | | | | | |
Basic net income per share | | $ | 1.77 | | | $ | 0.53 | | | $ | 0.30 | |
| | | | | | | | | | | | |
Diluted net income per share | | $ | 1.65 | | | $ | 0.50 | | | $ | 0.28 | |
| | | | | | | | | | | | |
Shares used in basic per share computation | | | 169,690 | | | | 166,062 | | | | 160,924 | |
Shares used in diluted per share computation | | | 182,852 | | | | 175,812 | | | | 172,054 | |
(1) | See Note 2, “Restatement of Consolidated Financial Statements, Audit Committee and Company Findings”, of the Notes to Consolidated Financial Statements. |
See accompanying notes to consolidated financial statements.
NVIDIA CORPORATION AND SUBSIDIARIES
CONSOLIDATED STATEMENTS OF STOCKHOLDERS’ EQUITY
AND COMPREHENSIVE INCOME
(LOSS)
(In thousands, except share data)
| | | | | | | | | | | | | | | | | | | | | | | | | | | | | | | | | | |
| | | Common Stock | | Additional Paid-in Capital (As restated)(1) | | | Deferred Compensation
(As restated)(1) | | | Treasury Stock | | | Accumulated
Other
Comprehensive Income (Loss) | | | Retained Earnings (As restated)(1) | | | Total
Stockholders’ Equity (As restated)(1) | | | Total
Comprehensive Income (As restated)(1) | |
| | | Shares | | | Amount | | | | | | | |
Balances, January 26, 2003 | | 157,790,022 | | | $ | 158 | | $ | 531,186 | | | $ | (156 | ) | | $ | — | | | $ | 3,760 | | | $ | 397,739 | | | $ | 932,687 | | | $ | 94,451 | |
Cumulative effect of restatement (Note 2) | | — | | | | — | | | 134,119 | | | | (17,444 | ) | | | — | | | | — | | | | (88,429 | ) | | | 28,246 | | | | (88,429 | ) |
Issuance of common stock from stock plans | | 6,355,765 | | | | 6 | | | 37,667 | | | | — | | | | — | | | | — | | | | — | | | | 37,673 | | | | | |
Tax benefit from stock plans | | — | | | | — | | | 5,508 | | | | — | | | | — | | | | — | | | | — | | | | 5,508 | | | | | |
Deferred compensation | | — | | | | — | | | 63,339 | | | | (63,183 | ) | | | — | | | | — | | | | — | | | | 156 | | | | | |
Reversal of deferred compensation | | — | | | | — | | | (1,833 | ) | | | 1,833 | | | | — | | | | — | | | | — | | | | — | | | | | |
Amortization of deferred compensation | | — | | | | — | | | 456 | | | | 39,047 | | | | — | | | | — | | | | — | | | | 39,503 | | | | | |
Unrealized loss, net of $1,940 tax effect | | — | | | | — | | | — | | | | — | | | | — | | | | (383 | ) | | | — | | | | (383 | ) | | | (383 | ) |
Reclassification adjustment for net gains included in net income, net of $632 tax effect | | — | | | | — | | | — | | | | — | | | | — | | | | (2,527 | ) | | | — | | | | (2,527 | ) | | | (2,527 | ) |
Net income | | — | | | | — | | | — | | | | — | | | | — | | | | — | | | | 48,630 | | | | 48,630 | | | | 48,630 | |
| | | | | | | | | | | | | | | | | | | | | | | | | | | | | | | | | | |
Balances, January 25, 2004 | | 164,145,787 | | | | 164 | | | 770,442 | | | | (39,903 | ) | | | — | | | | 850 | | | | 357,940 | | | | 1,089,493 | | | | 45,720 | |
Issuance of common stock from stock plans | | 5,028,111 | | | | 5 | | | 42,497 | | | | — | | | | — | | | | — | | | | — | | | | 42,502 | | | | | |
Stock repurchase | | (2,084,353 | ) | | | — | | | — | | | | — | | | | (24,644 | ) | | | — | | | | — | | | | (24,644 | ) | | | | |
Tax benefit from stock plans | | — | | | | — | | | 8,616 | | | | — | | | | — | | | | — | | | | — | | | | 8,616 | | | | | |
Reversal of deferred compensation | | — | | | | — | | | (5,359 | ) | | | 5,359 | | | | — | | | | — | | | | — | | | | — | | | | | |
Amortization of deferred compensation | | — | | | | — | | | (145 | ) | | | 20,967 | | | | — | | | | — | | | | — | | | | 20,822 | | | | | |
Unrealized loss, net of $1,470 tax effect | | — | | | | — | | | — | | | | — | | | | — | | | | (4,468 | ) | | | — | | | | (4,468 | ) | | | (4,468 | ) |
Reclassification adjustment for net losses included in net income, net of ($38) tax effect | | — | | | | — | | | — | | | | — | | | | — | | | | 155 | | | | — | | | | 155 | | | | 155 | |
Net income | | — | | | | — | | | — | | | | — | | | | — | | | | — | | | | 88,615 | | | | 88,615 | | | | 88,615 | |
| | | | | | | | | | | | | | | | | | | | | | | | | | | | | | | | | | |
Balances, January 30, 2005 | | 167,089,545 | | | | 169 | | | 816,051 | | | | (13,577 | ) | | | (24,644 | ) | | | (3,463 | ) | | | 446,555 | | | | 1,221,091 | | | | 84,302 | |
Issuance of common stock from stock plans | | 10,831,746 | | | | 11 | | | 127,486 | | | | — | | | | — | | | | — | | | | — | | | | 127,497 | | | | | |
Stock repurchase | | (6,402,170 | ) | | | — | | | — | | | | — | | | | (188,509 | ) | | | — | | | | — | | | | (188,509 | ) | | | | |
Tax benefit from stock plans | | — | | | | — | | | 24,868 | | | | — | | | | — | | | | — | | | | — | | | | 24,868 | | | | | |
Cancellation of shares | | (41,665 | ) | | | — | | | (520 | ) | | | — | | | | 1,011 | | | | — | | | | — | | | | 491 | | | | | |
Reversal of deferred compensation | | — | | | | — | | | (2,101 | ) | | | 2,101 | | | | — | | | | — | | | | — | | | | — | | | | | |
Amortization of deferred compensation | | — | | | | — | | | — | | | | 7,872 | | | | — | | | | — | | | | — | | | | 7,872 | | | | | |
Unrealized loss, net of $845 tax effect | | — | | | | — | | | — | | | | — | | | | — | | | | (120 | ) | | | — | | | | (120 | ) | | | (120 | ) |
Reclassification adjustment for net losses included in net income, net of ($407) tax effect | | — | | | | — | | | — | | | | — | | | | — | | | | 1,626 | | | | — | | | | 1,626 | | | | 1,626 | |
Net income | | — | | | | — | | | — | | | | — | | | | — | | | | — | | | | 301,176 | | | | 301,176 | | | | 301,176 | |
| | | | | | | | | | | | | | | | | | | | | | | | | | | | | | | | | | |
Balances, January 29, 2006 | | 171,477,456 | | | $ | 180 | | $ | 965,784 | | | $ | (3,604 | ) | | $ | (212,142 | ) | | $ | (1,957 | ) | | $ | 747,731 | | | $ | 1,495,992 | | | $ | 302,682 | |
| | | | | | | | | | | | | | | | | | | | | | | | | | | | | | | | | | |
| | | | Common Stock | | | | | | | | | | | | | | | | | | | | |
| | | | Outstanding Shares (1) | Amount (1) | | | Additional Paid-in Capital (1) | | | Deferred Compensation | | | Treasury Stock | | | Accumulated Other Comprehensive Income(Loss) | | | Retained Earnings | | | Total Stockholders' Equity | | | Total Comprehensive Income | |
| Balances, January 29, 2006 | | | 514,432,368 | | | $ | 540 | | | $ | 965,424 | | | $ | (3,604 | ) | | $ | (212,142 | ) | | $ | (1,957 | ) | | $ | 747,731 | | | $ | 1,495,992 | | | $ | 302,682 | |
| Issuance of common stock from stock plans | | | 42,571,532 | | | | 43 | | | | 221,117 | | | | - | | | | - | | | | - | | | | - | | | | 221,160 | | | | | |
| Stock repurchase | | | (15,506,144 | ) | | | - | | | | - | | | | - | | | | (274,978 | ) | | | - | | | | - | | | | (274,978 | ) | | | | |
| Tax deficit from stock-based compensation | | | - | | | | - | | | | (8,482 | ) | | | - | | | | - | | | | - | | | | - | | | | (8,482 | ) | | | | |
| Reversal of deferred compensation upon adoption of SFAS No. 123(R) | | | - | | | | - | | | | (3,604 | ) | | | 3,604 | | | | - | | | | - | | | | - | | | | - | | | | | |
| Stock-based compensation expense related to acquisitions | | | - | | | | - | | | | 2,914 | | | | - | | | | - | | | | - | | | | - | | | | 2,914 | | | | | |
| Stock-based compensation related to employees | | | - | | | | - | | | | 118,790 | | | | - | | | | - | | | | - | | | | - | | | | 118,790 | | | | | |
| Unrealized gain, net of $1,223 tax effect | | | - | | | | - | | | | - | | | | - | | | | - | | | | 3,509 | | | | - | | | | 3,509 | | | | 3,509 | |
| Reclassification adjustment for net realized gains included in net income, net of $78 tax effect | | | - | | | | - | | | | - | | | | - | | | | - | | | | (116 | ) | | | - | | | | (116 | ) | | | (116 | ) |
| Impact of change in accounting principle, net of ($379) tax effect | | | - | | | | - | | | | (704 | ) | | | - | | | | - | | | | - | | | | - | | | | (704 | ) | | | | |
| Net Income | | | - | | | | - | | | | - | | | | - | | | | - | | | | - | | | | 448,834 | | | | 448,834 | | | | 448,834 | |
| Balances, January 28, 2007 | | | 541,497,756 | | | | 583 | | | | 1,295,455 | | | | - | | | | (487,120 | ) | | | 1,436 | | | | 1,196,565 | | | | 2,006,919 | | | | 452,227 | |
| Issuance of common stock from stock plans | | | 36,238,014 | | | | 36 | | | | 225,933 | | | | - | | | | - | | | | - | | | | - | | | | 225,969 | | | | | |
| Stock repurchase | | | (20,633,182 | ) | | | - | | | | - | | | | - | | | | (552,512 | ) | | | - | | | | - | | | | (552,512 | ) | | | | |
| Tax benefit from stock-based compensation | | | - | | | | - | | | | 220 | | | | - | | | | - | | | | - | | | | - | | | | 220 | | | | | |
| Stock-based compensation related to employees | | | - | | | | - | | | | 133,073 | | | | - | | | | - | | | | - | | | | - | | | | 133,073 | | | | | |
| Unrealized gain, net of $2,860 tax effect | | | - | | | | - | | | | - | | | | - | | | | - | | | | 6,703 | | | | - | | | | 6,703 | | | | 6,703 | |
| Reclassification adjustment for net realized gains included in net income, net of $4 tax effect | | | - | | | | - | | | | - | | | | - | | | | - | | | | (105 | ) | | | - | | | | (105 ) | | | | (105 | ) |
| Net Income | | | - | | | | - | | | | - | | | | - | | | | | | | | - | | | | 797,645 | | | | 797,645 | | | | 797,645 | |
| Balances, January 27, 2008 | | | 557,102,588 | | | | 619 | | | | 1,654,681 | | | | - | | | | (1,039,632 | ) | | | 8,034 | | | | 1,994,210 | | | | 2,617,912 | | | | 804,243 | |
| Issuance of common stock from stock plans | | | 10,685,101 | | | | 10 | | | | 73,537 | | | | - | | | | - | | | | - | | | | - | | | | 73,547 | | | | | |
| Stock repurchase | | | (29,326,923 | ) | | | - | | | | - | | | | - | | | | (423,636 | ) | | | - | | | | - | | | | (423,636 | ) | | | | |
| Tax deficit from stock-based compensation | | | - | | | | - | | | | (2,946 | ) | | | - | | | | - | | | | - | | | | - | | | | (2,946 | ) | | | | |
| Stock-based compensation related to employees | | | - | | | | - | | | | 163,985 | | | | - | | | | - | | | | - | | | | - | | | | 163,985 | | | | | |
| Unrealized loss, net of $2,054 tax effect | | | - | | | | - | | | | - | | | | - | | | | - | | | | (3,920 | ) | | | - | | | | (3,920 | ) | | | (3,920 | ) |
| Reclassification adjustment for net realized gains included in net income, net of $135 tax effect | | | - | | | | - | | | | - | | | | - | | | | - | | | | (249 | ) | | | - | | | | (249 | ) | | | (249 | ) |
| Net Loss | | | - | | | | - | | | | - | | | | - | | | | - | | | | - | | | | (30,041 | ) | | | (30,041 ) | | | | (30,041 | ) |
| Balances, January 25, 2009 | | | 538,460,766 | | | $ | 629 | | | $ | 1,889,257 | | | $ | - | | | $ | (1,463,268 | ) | | $ | 3,865 | | | $ | 1,964,169 | | | $ | 2,394,652 | | | $ | (34,210 | ) |
| (1) | See Note 2, “Restatement of Consolidated Financial Statements, Audit CommitteeReflects a three-for-two stock split effective on September 10, 2007 and Company Findings” of the Notes to Consolidated Financial Statements.a two-for-one stock split effective on April 6, 2006. |
See accompanying notes to
the consolidated financial statements.
NVIDIA CORPORATION AND SUBSIDIARIES CONSOLIDATED STATEMENTS OF CASH FLOWS
(In thousands)
| | | | | | | | | | | | |
| | | Year Ended | |
| | | January 29,
2006 | | | January 30,
2005 | | | January 25,
2004 | |
| | | (As Restated)(1) | | | (As Restated)(1) | | | (As Restated)(1) | |
Cash flows from operating activities: | | | | | | | | | | | | |
Net income | | $ | 301,176 | | | $ | 88,615 | | | $ | 48,630 | |
Adjustments to reconcile net income to net cash provided by operating activities: | | | | | | | | | | | | |
In-process research and development | | | — | | | | — | | | | 3,500 | |
Non-cash realized gain on investment exchange | | | (96 | ) | | | (533 | ) | | | — | |
Depreciation and amortization | | | 97,977 | | | | 102,597 | | | | 81,944 | |
Net loss on retirements of property and equipment | | | 1,005 | | | | 412 | | | | — | |
Write-off of convertible debenture issuance costs | | | — | | | | — | | | | 5,485 | |
Deferred income taxes | | | (2,691 | ) | | | 8,694 | | | | 43,536 | |
Stock-based compensation | | | 7,872 | | | | 20,822 | | | | 39,503 | |
Bad debt expense (benefit) | | | (492 | ) | | | (844 | ) | | | 731 | |
Tax benefit from employee stock plans | | | 24,868 | | | | 8,616 | | | | 5,508 | |
Changes in operating assets and liabilities: | | | | | | | | | | | | |
Accounts receivable | | | (21,415 | ) | | | (110,312 | ) | | | (88,222 | ) |
Inventories | | | 60,916 | | | | (80,906 | ) | | | (85,131 | ) |
Prepaid expenses and other current assets | | | (4,568 | ) | | | (5,569 | ) | | | (2,698 | ) |
Deposits and other assets | | | (8,073 | ) | | | (1,458 | ) | | | (3,482 | ) |
Accounts payable | | | (58,828 | ) | | | 52,941 | | | | 43,506 | |
Accrued liabilities | | | 48,757 | | | | 49,125 | | | | (43,132 | ) |
| | | | | | | | | | | | |
Net cash provided by operating activities | | | 446,408 | | | | 132,200 | | | | 49,678 | |
| | | | | | | | | | | | |
Cash flows from investing activities: | | | | | | | | | | | | |
Purchases of marketable securities | | | (338,058 | ) | | | (313,760 | ) | | | (734,642 | ) |
Sales and maturities of marketable securities | | | 397,686 | | | | 229,068 | | | | 1,021,590 | |
Acquisition of businesses | | | (12,131 | ) | | | — | | | | (71,303 | ) |
Purchases of property and equipment and intangible assets | | | (79,600 | ) | | | (67,261 | ) | | | (127,604 | ) |
Investments in non-affiliates | | | (9,684 | ) | | | — | | | | — | |
| | | | | | | | | | | | |
Net cash provided by (used in) investing activities | | | (41,787 | ) | | | (151,953 | ) | | | 88,041 | |
| | | | | | | | | | | | |
Cash flows from financing activities: | | | | | | | | | | | | |
Redemption of convertible debenture | | | — | | | | — | | | | (300,000 | ) |
Common stock issued under employee stock plans | | | 127,497 | | | | 42,502 | | | | 37,757 | |
Stock repurchase | | | (188,509 | ) | | | (24,644 | ) | | | — | |
Principal payments on capital leases | | | (856 | ) | | | (4,015 | ) | | | (8,048 | ) |
Retirement of common stock | | | 491 | | | | — | | | | — | |
| | | | | | | | | | | | |
Net cash provided by (used in) financing activities | | | (61,377 | ) | | | 13,843 | | | | (270,291 | ) |
| | | | | | | | | | | | |
Change in cash and cash equivalents | | | 343,244 | | | | (5,910 | ) | | | (132,572 | ) |
Cash and cash equivalents at beginning of period | | | 208,512 | | | | 214,422 | | | | 346,994 | |
| | | | | | | | | | | | |
Cash and cash equivalents at end of period | | $ | 551,756 | | | $ | 208,512 | | | $ | 214,422 | |
| | | | | | | | | | | | |
Supplemental disclosures of cash flow information: | | | | | | | | | | | | |
Cash paid for interest | | $ | 12 | | | $ | 163 | | | $ | 15,167 | |
| | | | | | | | | | | | |
Cash paid (refund) for income taxes, net | | $ | 3,368 | | | $ | 763 | | | $ | (211 | ) |
| | | | | | | | | | | | |
NVIDIA CORPORATION AND SUBSIDIARIES
CONSOLIDATED STATEMENTS OF CASH FLOWS - (Continued)
(In thousands)
| | | | | | | | | | | |
| | | Year Ended |
| | | January 29,
2006 | | | January 30,
2005 | | | January 25,
2004 |
| | | (As Restated)(1) | | | (As Restated)(1) | | | (As Restated)(1) |
Other non-cash activities: | | | | | | | | | | | |
Acquisition of business - goodwill adjustment | | $ | 25,765 | | | $ | 1,091 | | | $ | — |
| | | | | | | | | | | |
Assets recorded under capital lease arrangements | | $ | — | | | $ | — | | | $ | 2,528 |
| | | | | | | | | | | |
Application of customer advance to accounts receivable | | $ | — | | | $ | 11,508 | | | $ | 46,866 |
| | | | | | | | | | | |
Marketable security received from investment exchange | | $ | 96 | | | $ | 688 | | | $ | — |
| | | | | | | | | | | |
Asset retirement obligation | | $ | 1,835 | | | $ | 4,483 | | | $ | — |
| | | | | | | | | | | |
Unrealized gains/losses from marketable securities | | $ | 1,068 | | | $ | 5,745 | | | $ | 4,850 |
| | | | | | | | | | | |
Deferred stock-based compensation | | $ | (2,101 | ) | | $ | (5,359 | ) | | $ | 61,506 |
| | | | | | | | | | | |
(1) | See Note 2, “Restatement of Consolidated Financial Statements, Audit Committee and Company Findings”, of the Notes to Consolidated Financial Statements. |
| | | Year ended | |
| | | January 25, 2009 | | | January 27, 2008 | | | January 28, 2007 | |
Cash flows from operating activities: | | | | | | | | | |
| | $ | (30,041 | ) | | $ | 797,645 | | | $ | 448,834 | |
Adjustments to reconcile net income (loss) to net cash provided by operating activities: | | | | | | | | | | | | |
Stock-based compensation expense related to employees | | | 162,706 | | | | 133,365 | | | | 116,735 | |
Depreciation and amortization | | | 185,023 | | | | 133,192 | | | | 107,562 | |
Impairment charge on investments | | | 9,891 | | | | - | | | | - | |
| | | (23,277 | ) | | | 89,516 | | | | 41,766 | |
Payments under patent licensing arrangement | | | (21,797 | ) | | | (57,255 | ) | | | (14,430 | ) |
In-process research and development expenses | | | - | | | | 4,000 | | | | 14,002 | |
Tax benefit (deficit) from stock-based compensation | | | (2,946 | ) | | | 220 | | | | (8,482 | ) |
Cumulative effect of change in accounting principle | | | - | | | | - | | | | (704 | ) |
| | | 3,134 | | | | (436 | ) | | | 268 | |
Changes in operating assets and liabilities, net of effects of acquisitions: | | | | | | | | | | | | |
| | | 348,873 | | | | (146,055 | ) | | | (175,261 | ) |
| | | (177,295 | ) | | | (3,690 | ) | | | (91,395 | ) |
Prepaid expenses and other current assets | | | 21,528 | | | | (6,293 | ) | | | (5,294 | ) |
Deposits and other assets | | | (2,108 | ) | | | (13,914 | ) | | | 7,314 | |
| | | (283,207 | ) | | | 216,875 | | | | 38,613 | |
Accrued liabilities and other long-term liabilities | | | 58,876 | | | | 123,026 | | | | 93,153 | |
Net cash provided by operating activities | | | 249,360 | | | | 1,270,196 | | | | 572,681 | |
Cash flows from investing activities: | | | | | | | | | | | | |
Purchases of marketable securities | | | (999,953 | ) | | | (1,250,248 | ) | | | (220,834 | ) |
Proceeds from sales and maturities of marketable securities | | | 1,226,646 | | | | 753,839 | | | | 227,067 | |
Purchases of property and equipment and intangible assets | | | (407,670 | ) | | | (187,745 | ) | | | (130,826 | ) |
Acquisition of businesses, net of cash and cash equivalents | | | (27,948 | ) | | | (75,542 | ) | | | (401,800 | ) |
| | | (442 | ) | | | (1,622 | ) | | | - | |
Net cash used in investing activities | | | (209,367 | ) | | | (761,318 | ) | | | (526,393 | ) |
Cash flows from financing activities: | | | | | | | | | | | | |
Payments for stock repurchases | | | (423,636 | ) | | | (552,512 | ) | | | (274,978 | ) |
Proceeds from issuance of common stock under employee stock plans | | | 73,547 | | | | 225,969 | | | | 221,160 | |
| | | 815 | | | | 220 | | | | 188 | |
Net cash used in financing activities | | | (349,274 | ) | | | (326,323 | ) | | | (53,630 | ) |
Change in cash and cash equivalents | | | (309,281 | ) | | | 182,555 | | | | (7,342 | ) |
Cash and cash equivalents at beginning of period | | | 726,969 | | | | 544,414 | | | | 551,756 | |
Cash and cash equivalents at end of period | | $ | 417,688 | | | $ | 726,969 | | | $ | 544,414 | |
| | | | | | | | | | | | | |
Supplemental disclosures of cash flow information: | | | | | | | | | | | | |
Cash paid for income taxes, net | | $ | 7,620 | | | $ | 2,328 | | | $ | 26,628 | |
| | | Year Ended | |
| | | January 25, 2009 | | | January 27, 2008 | | | January 28, 2007 | |
| | | | | | | | | |
Change in unrealized gains (losses) from marketable securities | | | | | | | | | | | | |
Assets acquired by assuming related liabilities | | | | | | | | | | | | |
Acquisition of business - goodwill adjustment | | | | | | | | | | | | |
Deferred stock-based compensation | | | | | | | | | | | | |
Acquisition of business - stock option conversion | | | | | | | | | | | | |
See accompanying notes to
the consolidated financial statements.
NVIDIA CORPORATION AND SUBSIDIARIES NOTES TO THE CONSOLIDATED FINANCIAL STATEMENTS
Note 1 - Organization and Summary of Significant Accounting Policies
NVIDIA Corporation is the worldwide leader in programmablevisual computing technologies and the inventor of the graphics processor technologies.processing unit, or GPU. Our products enhance the end-user experienceare designed to generate realistic, interactive graphics on consumer and professional computing devices. We have four major product-line operating segments: the graphics processing units,unit, or GPUs,GPU, business, the professional solutions business, or PSB, the media and communications processors,processor, or MCPs, Handheld GPUs,MCP, business, and Consumer Electronics.the consumer products business, or CPB. Our GPU Businessbusiness is composedcomprised primarily of our GeForce products that support desktop and notebook personal computers, or PCs, notebook PCsplus memory products. Our PSB is comprised of our NVIDIA Quadro professional workstation products and other professional workstations;graphics products, including our NVIDIA Tesla high-performance computing products. Our MCP Businessbusiness is composedcomprised of NVIDIA nForce products that operate as a single-chip or chipset that can off-load system functions, such as audio processingcore logic and network communications,motherboard GPU products. Our CPB is comprised of our Tegra and perform these operations independently from the host central processing unit, or CPU; our Handheld GPU Business is composed ofGoForce mobile brands and products that support handheld personal media players, or PMPs, personal digital assistants, or PDAs, cellular phones and other handheld devices;devices. CPB also includes license, royalty, other revenue and our Consumer Electronics Business is concentrated in products that supportassociated costs related to video game consoles and other digital consumer electronics devices and is composed of our contractual arrangements with Sony Computer Entertainment, or SCE, to jointly develop a custom GPU incorporating our next-generation GeForce GPU and SCE’s system solutions in SCE’s PlayStation3, sales of our Xbox-related products, revenue from our license agreement with Microsoft relating to the successor product to their initial Xbox gaming console, the Xbox360, and related devices, and digital media processor products.devices. We were incorporated in California in April 1993 and reincorporated in Delaware in April 1998. Our headquarter facilities are in Santa Clara, California. Our Internet address is www.nvidia.com. The contents of our website are not a part of these Notes to the consolidated financial statements.
All references to “NVIDIA,” “we,” “us,” “our” or the “Company” mean NVIDIA Corporation and its subsidiaries, except where it is made clear that the term means only the parent company.
We operate on a 52 or 53-week year, ending on the last Sunday nearest January 31.in January. Fiscal 2006years 2009, 2008 and 20042007 were 52-week years, comparedyears.
Stock Splits
In August 2007, our Board of Directors, or the Board, approved a three-for-two stock split of our outstanding shares of common stock on Monday, August 20, 2007 to fiscal 2005 whichbe effected in the form of a stock dividend. The stock split was effective on Monday, September 10, 2007 and entitled each stockholder of record on August 20, 2007 to receive one additional share for every two outstanding shares of common stock held and cash in lieu of fractional shares. All share and per-share numbers contained herein have been retroactively adjusted to reflect this stock split.
In March 2006, our Board approved a
53-week year.two-for-one stock split of our outstanding shares of common stock to be effected in the form of a 100% stock dividend. The stock split was effective on Thursday, April 6, 2006 for stockholders of record at the close of business on Friday, March 17, 2006. All share and per-share numbers contained herein have been retroactively adjusted to reflect this stock split.
Certain prior fiscal year balances
werehave been reclassified to conform to the current fiscal year presentation.
Principles of Consolidation
Our consolidated financial statements include the accounts of NVIDIA Corporation and its
wholly ownedwholly-owned subsidiaries. All material intercompany balances and transactions have been eliminated in consolidation.
The preparation of financial statements in conformity with accounting principles generally accepted in the United States
of America requires management to make estimates and assumptions that affect the reported amounts of assets and liabilities and disclosures of contingent assets and liabilities at the date of the financial statements and the reported amounts of revenue and expenses during the reporting period. Actual results could differ from those estimates. On an on-going basis, we evaluate our estimates, including those related to revenue recognition,
cash equivalents and marketable securities, accounts receivable, inventories, income taxes,
goodwill, stock-based compensation, warranty liabilities, litigation, investigation and
settlement costs and other contingencies. These estimates are based on historical facts and various other assumptions that we believe are reasonable.
NVIDIA CORPORATION AND SUBSIDIARIES
NOTES TO THE CONSOLIDATED FINANCIAL STATEMENTS
(Continued)
Revenue Recognition
Product Revenue
We recognize revenue from product sales when persuasive evidence of an arrangement exists, the product has been delivered, the price is fixed and determinable, and collection is reasonably assured. For most sales, we use a binding purchase order and in certain cases we use a contractual agreement as evidence of an arrangement. We consider delivery to occur upon shipment provided title and risk of loss have passed to the customer based on the shipping terms. At the point of sale, we assess whether the arrangement fee is fixed and determinable and whether collection is reasonably assured. If we determine that collection of a fee is not reasonably assured, we defer the fee and recognize revenue at the time collection becomes reasonably assured, which is generally upon receipt of payment.
Our policy on sales to certain distributors, with rights of return, is to defer recognition of revenue and related cost of revenue until the distributors resell the product.
We record estimated reductions to revenue for customer programs at the time revenue is recognized. Our customer programs primarily involve rebates, which are designed to serve as sales incentives to resellers of our products in various target markets. We account for rebates in accordance with Emerging Issues Task Force Issue 01-9, or EITF 01-09, Accounting for Consideration Given by a Vendor to a Customer (Including a Reseller of the Vendor’s Products) and, as such, we accrue for 100% of the potential rebates and do not apply a breakage factor. Rebates typically expire six months from the date of the original sale, unless we reasonably believe that the customer intends to claim the rebate. Unclaimed rebates are reversed to revenue upon expiration of the rebate.
Our customer programs also include marketing development funds, or MDFs. We account for MDFs as either a reduction of revenue or an operating expense in accordance with EITF 01-09. MDFs represent monies paid to retailers, system builders, original equipment manufacturers, or OEMs, distributors and add-in card partners that are earmarked for market segment development and expansion and typically are designed to support our partners’ activities while also promoting NVIDIA products. Depending on market conditions, we may take actions to increase amounts offered under customer programs, possibly resulting in an incremental reduction of revenue at the time such programs are offered.
We also record a reduction to revenue by establishing a sales return allowance for estimated product returns at the time revenue is recognized, based primarily on historical return rates. However, if product returns for a particular fiscal period exceed historical return rates we may determine that additional sales return allowances are required to properly reflect our estimated exposure for product returns.
License and Development Revenue
For license arrangements that require significant customization of our intellectual property components, we generally recognize this license revenue using the percentage-of-completion method of accounting over the period that services are performed. For all license and service arrangements accounted for under the percentage-of-completion method, we determine progress to completion based on actual direct labor hours incurred to date as a percentage of the estimated total direct labor hours required to complete the project. We periodically evaluate the actual status of each project to ensure that the estimates to complete each contract remain accurate. A provision for estimated losses on contracts is made in the period in which the loss becomes probable and can be reasonably estimated. Costs incurred in advance of revenue recognized are recorded as deferred costs on uncompleted contracts. If the amount billed exceeds the amount of revenue recognized, the excess amount is recorded as deferred revenue. Revenue recognized in any period is dependent on our progress toward completion of projects in progress. Significant management judgment and discretion are used to estimate total direct labor hours. Any changes in or deviations from these estimates could have a material effect on the amount of revenue we recognize in any period.
NVIDIA CORPORATION AND SUBSIDIARIES
NOTES TO THE CONSOLIDATED FINANCIAL STATEMENTS
(Continued)
Advertising Expenses
We expense advertising costs in the period in which they are incurred. Advertising expenses for fiscal years 2009, 2008 and 2007 were $28.5 million, $11.4 million and $14.8 million, respectively.
Rent Expense
We recognize rent expense on a straight-line basis over the lease period and accrue for rent expense incurred, but not paid.
Product Warranties
We generally offer limited warranty to end-users that ranges from one to three years for products in order to repair or replace products for any manufacturing defects or hardware component failures. Cost of revenue includes the estimated cost of product warranties that are calculated at the point of revenue recognition. Under limited circumstances, we may offer an extended limited warranty to customers for certain products. We also accrue for known warranty and indemnification issues if a loss is probable and can be reasonably estimated.
Stock-based Compensation
Effective January 30, 2006, we adopted the provisions of Statement of Financial Accounting Standards No. 123(R), or SFAS No. 123(R), Share-Based Payment. SFAS No. 123(R) establishes accounting for stock-based awards exchanged for employee services. Accordingly, we measure stock-based compensation at grant date, based on the fair value of the awards, and we recognize that compensation as expense using the straight-line attribution method over the requisite employee service period, which is typically the vesting period of each award. We elected to adopt the modified prospective application method provided by SFAS No. 123(R). Our estimates of the fair values of employee stock options are calculated using a binomial model.
Litigation, Investigation and Settlement Costs
From time to time, we are involved in legal actions and/or investigations by regulatory bodies. We are aggressively defending our current litigation matters for which we are responsible. However, there are many uncertainties associated with any litigation or investigation, and we cannot be certain that these actions or other third-party claims against us will be resolved without costly litigation, fines and/or substantial settlement payments. If that occurs, our business, financial condition and results of operations could be materially and adversely affected. If information becomes available that causes us to determine that a loss in any of our pending litigation, investigations or settlements is probable, and we can reasonably estimate the loss associated with such events, we will record the loss in accordance with accounting principles generally accepted in the United States. However, the actual liability in any such litigation or investigations may be materially different from our estimates, which could require us to record additional costs.
Foreign Currency Translation
We use the United States dollar as our functional currency for all of our subsidiaries. Foreign currency monetary assets and liabilities are remeasured into United States dollars at end-of-period exchange rates. Non-monetary assets and liabilities such as property and equipment, and equity, are remeasured at historical exchange rates. Revenue and expenses are remeasured at average exchange rates in effect during each period, except for those expenses related to the previously noted balance sheet amounts, which are remeasured at historical exchange rates. Gains or losses from foreign currency remeasurement are included in “Other income (expense), net” in our Consolidated Financial Statements and to date have not been significant.
The impact of foreign currency transaction loss included in determining net income (loss) for fiscal years 2009, 2008 and 2007 was $2.0 million, $1.7 million and $0.5 million, respectively.
NVIDIA CORPORATION AND SUBSIDIARIES
NOTES TO THE CONSOLIDATED FINANCIAL STATEMENTS
(Continued)
Income Taxes
Statement of Financial Accounting Standards No. 109, or SFAS No. 109, Accounting for Income Taxes, establishes financial accounting and reporting standards for the effect of income taxes. In accordance with SFAS No. 109, we recognize federal, state and foreign current tax liabilities or assets based on our estimate of taxes payable or refundable in the current fiscal year by tax jurisdiction. We also recognize federal, state and foreign deferred tax assets or liabilities, as appropriate, for our estimate of future tax effects attributable to temporary differences and carryforwards; and we record a valuation allowance to reduce any deferred tax assets by the amount of any tax benefits that, based on available evidence and judgment, are not expected to be realized.
United States income tax has not been provided on earnings of our non-United States subsidiaries to the extent that such earnings are considered to be permanently reinvested.
Our calculation of current and deferred tax assets and liabilities is based on certain estimates and judgments and involves dealing with uncertainties in the application of complex tax laws. Our estimates of current and deferred tax assets and liabilities may change based, in part, on added certainty or finality to an anticipated outcome, changes in accounting standards or tax laws in the United States or foreign jurisdictions where we operate, or changes in other facts or circumstances. In addition, we recognize liabilities for potential United States and foreign income tax contingencies based on our estimate of whether, and the extent to which, additional taxes may be due. If we determine that payment of these amounts is unnecessary or if the recorded tax liability is less than our current assessment, we may be required to recognize an income tax benefit or additional income tax expense in our financial statements, accordingly.
On January 29, 2007, we adopted FASB Interpretation No. 48, or FIN 48, Accounting for Uncertainty in Income Taxes, issued in July 2006. FIN 48 applies to all tax positions related to income taxes subject to SFAS No. 109. Under FIN 48 we recognize the benefit from a tax position only if it is more-likely-than-not that the position would be sustained upon audit based solely on the technical merits of the tax position. The cumulative effect of adoption of FIN 48 did not result in a material adjustment to our tax liability for unrecognized income tax benefits. Our policy to include interest and penalties related to unrecognized tax benefits as a component of income tax expense did not change as a result of implementing the FIN 48. Please refer to Note 13 of these Notes to the Consolidated Financial Statements for additional information.
Comprehensive Income (Loss)
Comprehensive income (loss) consists of net income (loss) and other comprehensive income or loss. Other comprehensive income or loss components include unrealized gains or losses on available-for-sale securities, net of tax.
Net Income (Loss) Per Share
Basic net income (loss) per share is computed using the weighted average number of common shares outstanding during the period. Diluted net income (loss) per share is computed using the weighted average number of common and dilutive common equivalent shares outstanding during the period, using the treasury stock method. Under the treasury stock method, the effect of stock options outstanding is not included in the computation of diluted net income (loss) per share for periods when their effect is anti-dilutive.
Cash and Cash Equivalents
We consider all highly liquid investments
purchased withthat are readily convertible into cash and have an original maturity of three months or less at the time of purchase to be cash equivalents. As of January
29, 2006,25, 2009 and January 27, 2008, our cash and cash equivalents were
$551.8$417.7 million and $727.0 million, which includes
$256.6$14.6 million and $218.1 million invested in money market
funds.funds for fiscal year 2009 and fiscal year 2008, respectively.
NVIDIA CORPORATION AND SUBSIDIARIES
NOTES TO THE CONSOLIDATED FINANCIAL STATEMENTS -
We account for our investment instruments in accordance with Statement of Financial Accounting Standards No. 115, or SFAS No. 115,Accounting for Certain Investments in Debt and Equity Securities. All of our cash equivalents and marketable securities are treated as “available-for-sale” under SFAS No. 115. Cash equivalents consist of financial instruments which are readily convertible into cash and have original maturities of three months or less at the time of acquisition. Marketable securities consist primarily of highly liquid investments with a maturity of greater than three months when
purchased and some equity investments.purchased. We classify our marketable securities at the date of acquisition in the available-for-sale category as our intention is to convert them into cash for operations. These securities are reported at fair value with the related unrealized gains and losses included in accumulated other comprehensive income (loss), a component of stockholders’ equity, net of tax.
We followAny unrealized losses which are considered to be other-than-temporary impairments are recorded in the
guidance provided by Emerging Issues Task Force Issue No. 03-01,The Meaningother income (expense) section of Other-Than-Temporary Impairment and Its Application to Certain Investments, in order to assess whether our
investments with unrealized loss positions are other than temporarily impaired.consolidated statements of operations. Realized gains
and losses(losses) on the sale of marketable securities are determined using the specific-identification
method.method and recorded in the other income (expense) section of our consolidated statements of operations.
All of our available-for-sale investments are subject to a periodic impairment review. Investments are considered to be impaired when a decline in fair value is judged to be other-than-temporary when the resulting fair value is significantly below cost basis and/or the significant decline has lasted for an extended period of time. The evaluation that we use to determine whether a marketable security is impaired is based on the specific facts and circumstances present at the time of assessment, which include the consideration of general market conditions, the duration and extent to which fair value is below cost, and our intent and ability to hold an investment for a sufficient period of time to allow for recovery in value. We also consider specific adverse conditions related to the financial health of and business outlook for an investee, including industry and sector performance, changes in technology, operational and financing cash flow factors, and changes in an investee’s credit rating. Investments that we identify as having an indicator of impairment are subject to further analysis to determine if the investment is other than temporarily impaired, in which case we write down the investment to its estimated fair value.
Fair Value of Financial Instruments
The carrying value of cash, cash equivalents, accounts receivable, accounts payable and accrued liabilities approximate their fair values due to their relatively short maturities as of January 25, 2009 and January 27, 2008. Marketable securities are comprised of available-for-sale securities that are reported at fair value with the related unrealized gains and losses included in accumulated other comprehensive income (loss), a component of stockholders’ equity, net of tax. Fair value of the marketable securities is determined based on quoted market prices.
Concentration of Credit Risk
Financial instruments that potentially subject us to concentrations of credit risk consist primarily of cash equivalents, marketable securities and accounts receivable. Our investment policy requires the purchase of top-tier investment grade securities, the diversification of asset type and includes certain limits on our portfolio duration. All marketable securities are held in our name, managed by several investment managers and held by one major financial institution under a custodial arrangement. Accounts receivable from significant customers, those representing 10% or more of total accounts receivable aggregated approximately 38% of our accounts receivable balance from three customers at January 25, 2009 and approximately 12% of our accounts receivable balance from one customer at January 27, 2008. We perform ongoing credit evaluations of our customers’ financial condition and maintain an allowance for potential credit losses. This allowance consists of an amount identified for specific customers and an amount based on overall estimated exposure. Our overall estimated exposure excludes amounts covered by credit insurance and letters of credit.
Accounts Receivable
We maintain an allowance for doubtful accounts receivable for estimated losses resulting from the inability of our customers to make required payments. We determine this allowance, which consists of an amount identified for specific customer issues as well as an amount based on overall estimated exposure. Factors impacting the allowance include the level of gross receivables, the financial condition of our customers and the extent to which balances are covered by credit insurance or letters of credit.
NVIDIA CORPORATION AND SUBSIDIARIES
NOTES TO THE CONSOLIDATED FINANCIAL STATEMENTS
(Continued)
Inventory cost is computed on an adjusted standard basis,
(whichwhich approximates actual cost on an average or first-in, first-out
basis).basis. Inventory costs consist primarily of the cost of semiconductors purchased from subcontractors, including wafer fabrication, assembly, testing and packaging, manufacturing support costs, including labor and overhead associated with such purchases, final test yield fallout, inventory provisions and shipping costs. We write down our inventory for estimated amounts related to lower of cost or market, obsolescence or unmarketable inventory equal to the difference between the cost of inventory and the estimated market value based upon assumptions about future demand, future product purchase commitments, estimated manufacturing yield levels and market conditions. If actual market conditions are less favorable than those projected by management, or if our future product purchase commitments to our suppliers exceed our forecasted future demand for such products, additional future inventory write-downs may be required that could adversely affect our operating results. If actual market conditions are more favorable, we may have higher gross margins when products are sold. Sales to date of such products have not had a significant impact on our gross margin. Inventory reserves once established are not reversed until the related inventory has been sold or scrapped.
Property and equipment are stated at cost. Depreciation
of property and equipment is computed using the straight-line method based on
the estimated useful lives
of the assets, generally three to five
years. The estimated useful lives of our buildings have estimated useful lives of up to twenty-five years. Depreciation expense includes the amortization of assets recorded under capital leases. Leasehold improvements and assets recorded under capital leases are amortized over the shorter of the lease term or the estimated useful life of the asset.
Goodwill
Debt Financing CostsIn connection with the issuance of the convertible subordinated debentures, see Note 11, we incurred certain direct issuance costs from third parties who performed services that assisted in the closing of the transaction. These issuance costs were included in our consolidated balance sheets under “deposits and other assets” and were amortized on a straight line basis over the term of the financing. On October 24, 2003, we fully redeemed the Notes. In connection with the redemption, we recorded a $13.1 million charge in fiscal 2004, which included the write-off of $5.5 million of unamortized issuance costs.
NVIDIA CORPORATION AND SUBSIDIARIES
NOTES TO CONSOLIDATED FINANCIAL STATEMENTS - (Continued)
Advertising Expenses
We expense advertising costs in the period in which they are incurred. Advertising expenses for fiscal 2006, 2005, and 2004 were $9.2 million, $15.2 million, and $11.3 million, respectively.
Revenue Recognition
Product Revenue
We recognize revenue from product sales when persuasive evidence of an arrangement exists, the product has been delivered, the price is fixed and determinable and collection is reasonably assured. For most sales, we use a binding purchase order and in certain cases we use a contractual agreement as evidence of an arrangement. We consider delivery to occur upon shipment provided title and risk of loss have passed to the customer based on the shipping terms. At the point of sale, we assess whether the arrangement fee is fixed and determinable and whether collection is reasonably assured. If we determine that collection of a fee is not reasonably assured, we defer the fee and recognize revenue at the time collection becomes reasonably assured, which is generally upon receipt of cash.
Our policy on sales to distributors is to defer recognition of revenue and related cost of revenue until the distributors resell the product.
We record estimated reductions to revenue for customer programs at the time revenue is recognized. Our customer programs primarily involve rebates, which are designed to serve as sales incentives to resellers of our products in various target markets. We account for rebatesgoodwill in accordance with Emerging Issues Task Force Issue 01-9,Statement of Financial Accounting Standards No. 142, or EITF 01-9,Accounting for Consideration Given bySFAS No. 142, Goodwill and Other Intangible Assets. Goodwill is subject to our annual impairment test during the fourth quarter of our fiscal year, or earlier if indicators of potential impairment exist, using a Vendor to a Customer (Including a Resellerfair value-based approach. Our impairment review process compares the fair value of the Vendor’s Products) and, as such, we accrue for 100% of the potential rebates and do not apply a breakage factor. Unclaimed rebates, which historically have not been significant, are reversed to revenue upon expiration of the rebate. Rebates typically expire six months from the date of the original sale.
Our customer programs also include marketing development funds, or MDFs. We account for MDFs as either a reduction of revenue or an operating expense in accordance with EITF 01-9. MDFs represent monies paid to retailers, system builders, original equipment manufacturers, or OEMs, distributors and add-in card partners that are earmarked for market segment development and expansion and typically are designed to support our partners’ activities while also promoting NVIDIA products. If market conditions decline, we may take actions to increase amounts offered under customer programs, possibly resulting in an incremental reduction of revenue at the time such programs are offered.
We also record a reduction to revenue by establishing a sales return allowance for estimated product returns at the time revenue is recognized, based primarily on historical return rates. However, if product returns for a particular fiscal period exceed historical return rates we may determine that additional sales return allowances are required to properly reflect our estimated exposure for product returns.
License and Development Revenue
For license arrangements that require significant customization of our intellectual property components, we generally recognize this license revenue using the percentage-of-completion method of accounting over the period that services are performed. For all license and service arrangements accounted for under the percentage-of-completion method, we determine progress to completion based on actual direct labor hours incurred to date as a percentage of the estimated total direct labor hours required to complete the project. We periodically evaluate the actual status of each project to ensure that the estimates to complete each contract remain accurate. A provision for estimated losses on contracts is made in the periodreporting unit in which the loss becomes probablegoodwill resides to its carrying value. For the purposes of completing our SFAS No. 142 impairment test, we perform our analysis on a reporting unit basis. We utilize a two-step approach to testing goodwill for impairment. The first step tests for possible impairment by applying a fair value-based test. In computing fair value of our reporting units, we use estimates of future revenues, costs and can be reasonably estimated. To date, we have not recorded anycash flows from such losses. Costs incurred in advance of revenue recognized are
NVIDIA CORPORATION AND SUBSIDIARIES
NOTES TO CONSOLIDATED FINANCIAL STATEMENTS - (Continued)
recorded as deferred costs on uncompleted contracts. If the amount billed exceedsunits. The second step, if necessary, measures the amount of revenue recognized,such impairment by applying fair value-based tests to individual assets and liabilities.
Intangible Assets
Intangible assets primarily represent rights acquired under technology licenses, patents, acquired intellectual property, trademarks and customer relationships. We currently amortize our intangible assets with definitive lives over periods ranging from one to ten years using a method that reflects the
excess amount is recorded as deferred revenue. Revenue recognizedpattern in
any period is dependent on our progress toward completionwhich the economic benefits of
projects in progress. Significant management judgment and discretionthe intangible asset are
consumed or otherwise used
to estimate total direct labor hours. Any changes inup or,
deviations from these estimates could haveif that pattern can not be reliably determined, using a
material effect on the amount of revenue we recognize in any period.Concentration of Credit Risk
Financial instruments that potentially subject us to concentrations of credit risk consist primarily of cash equivalents, marketable securities and trade accounts receivable. Our investment policy requires the purchase of top-tier investment grade securities, the diversification of asset type and certain limits on our portfolio duration. All marketable securities are held in our name, managed by several investment managers and held by one major financial institution under a custodial arrangement. One customer accounted for approximately 11% of our accounts receivable balance at January 29, 2006. We perform ongoing credit evaluations of our customers’ financial condition and maintain an allowance for potential credit losses. This allowance consists of an amount identified for specific customers and an amount based on overall estimated exposure. Our overall estimated exposure excludes amounts covered by credit insurance and letters of credit.
straight-line amortization method.
Impairment of Long-Lived Assets
In accordance with Statement of Financial Accounting Standards No. 144, or SFAS No. 144,Accounting for the Impairment or Disposal of Long-Lived Assets,long-lived assets, such as property and equipment and intangible assets subject to amortization, are reviewed for impairment whenever events or changes in circumstances indicate that the carrying amount of an asset may not be recoverable. Recoverability of assets to be held and used is measured by a comparison of the carrying amount of an asset to estimated undiscounted future cash flows expected to be generated by the asset. If the carrying amount of an asset exceeds its estimated future cash flows, an impairment charge is recognized for the amount by which the carrying amount of the asset exceeds the fair value of the asset. Fair value is determined based on the estimated discounted future cash flows expected to be generated by the asset. Assets and liabilities to be disposed of would be separately presented in the consolidated balance sheet and the assets would be reported at the lower of the carrying amount or fair value less costs to sell, and would no longer be depreciated.
Rent Expense
We recognize rent expense on a straight-line basis over the lease period and have accrued for rent expense incurred, but not paid.
NVIDIA CORPORATION AND SUBSIDIARIES
NOTES TO THE CONSOLIDATED FINANCIAL STATEMENTS
(Continued)
Accounting for Asset Retirement Obligations
In fiscal 2004, we adopted We account for asset retirement obligations in accordance with Statement of Financial Accounting Standards No. 143, or SFAS No. 143,Accounting for Asset Retirement Obligations, which addresses financial accounting and reporting for obligations associated with the retirement of tangible long-lived assets and the associated asset retirement costs. SFAS No. 143 applies to legal obligations associated with the retirement of long-lived assets that result from the acquisition, construction, development and/or normal use of the assets. SFAS No. 143 requires that the fair value of a liability for an asset retirement obligation be recognized in the period in which it is incurred if a reasonable estimate of fair value can be made. The fair value of the liability is added to the carrying amount of the associated asset and this additional carrying amount is depreciated over the life of the asset. During fiscal 2005,years 2009 and 2008, we completedrecorded asset retirement obligations to return the leasehold improvements to their original condition upon lease termination at our headquarters facility in Santa Clara, California and recorded a liability of $4.5 million to return the property to its original condition upon lease termination in fiscal year 2013. During fiscal 2006, we continued the expansion of our international facilities, and completed leasehold improvementscertain laboratories at our international sites.locations. As a result,of January 25, 2009 and January 27, 2008, our net asset retirement obligations were $9.5 million and $6.5 million, respectively.
Adoption of New Accounting Pronouncements
On January 28, 2008, we recorded an additional liability of $2.0 million, of which $0.2 million relates to accretion expense, to return the properties at these sites to their original condition upon lease termination.NVIDIA CORPORATION AND SUBSIDIARIES
NOTES TO CONSOLIDATED FINANCIAL STATEMENTS - (Continued)
Income Taxes
adopted Statement of Financial Accounting Standards No. 109,157, or SFAS No. 109,157, Fair Value Measurements for all financial assets and liabilities. SFAS No. 157 applies to all financial assets and financial liabilities recognized or disclosed at fair value in the financial statements. SFAS No. 157 establishes a framework for measuring fair value and expands disclosures about fair value measurements. The changes to current practice resulting from the application of SFAS No. 157 relate to the definition of fair value, the methods used to measure fair value, and the expanded disclosures about fair value measurements. The adoption of SFAS No. 157 for financial assets and liabilities did not have a significant impact on our consolidated financial statements, and the resulting fair values calculated under SFAS No. 157 after adoption were not significantly different than the fair values that would have been calculated under previous guidance. Please refer to Note 17 of these Notes to the Consolidated Financial Statements for further details on our fair value measurements.
Additionally, in February 2008, the Financial Accounting Standards Board, or FASB, issued FASB Staff Position No. FAS 157-2, or FSP No. 157-2, Effective Date of FASB Statement No. 157, to partially defer FASB Statement No. 157, Fair Value Measurements. FSP No. 157-2 defers the effective date of SFAS No. 157 for Income Taxesnon-financial assets and non-financial liabilities, except those that are recognized or disclosed at fair value in the financial statements on a recurring basis (at least annually), establishesto fiscal years, and interim periods within those fiscal years, beginning after November 15, 2008. We do not believe the adoption of FSP No. 157-2 will have a material impact on our consolidated financial accountingposition, results of operations and reporting standardscash flows.
In October 2008, the FASB issued Staff Position No. FAS 157-3, or FSP No. 157-3, Determining the Fair Value of a Financial Asset When the Market for That Asset Is Not Active. FSP No. 157-3 clarifies the effectapplication of income taxes. InSFAS No. 157 in a market that is not active, and addresses application issues such as the use of internal assumptions when relevant observable data does not exist, the use of observable market information when the market is not active, and the use of market quotes when assessing the relevance of observable and unobservable data. FSP No. 157-3 is effective for all periods presented in accordance with SFAS No. 109, we recognize federal, state and foreign current tax liabilities or assets based157. The adoption of FSP No. 157-3 did not have a significant impact on our estimate of taxes payable or refundable in the current fiscal year by tax jurisdiction. We also recognize federal, state and foreign deferred tax assets or liabilities, as appropriate, for our estimate of future tax effects attributable to temporary differences and carryforwards; and we record a valuation allowance to reduce any deferred tax assets by the amount of any tax benefits that, based on available evidence and judgment, are not expected to be realized.Our calculation of current and deferred tax assets and liabilities is based on certain estimates and judgments and involves dealing with uncertainties in the application of complex tax laws. Our estimates of current and deferred tax assets and liabilities may change based, in part, on added certainty or finality to an anticipated outcome, changes in accounting standards or tax laws in the United States, or foreign jurisdictions where we operate, or changes in other facts or circumstances. In addition, we recognize liabilities for potential United States and foreign income tax contingencies based on our estimate of whether,consolidated financial statements, and the extent to which, additional taxes may be due. Ifresulting fair values calculated under SFAS No. 157 after adoption were not significantly different than the fair values that would have been calculated under previous guidance.
On January 28, 2008, we determine that paymentadopted Statement of these amounts is unnecessaryFinancial Accounting Standards No. 159, or if the recorded tax liability is less than our current assessment, we may be required to recognize an income tax benefit or additional income tax expense in our financial statements, accordingly.SFAS No. 159, The Fair Value ofOption for Financial Instruments
The carrying value of cash, cash equivalents, accounts receivable, accounts payableAssets and accrued liabilities approximate their fair values dueFinancial Liabilities.
SFAS No. 159 permits companies to
their relatively short maturities as of January 29, 2006choose to measure certain financial instruments and
January 30, 2005. Marketable securities are comprised of available-for-sale securities that are reportedcertain other items at fair value
with the relatedusing an instrument-by-instrument election. The standard requires that unrealized gains and losses
includedon items for which the fair value option has been elected be reported in
accumulated other comprehensive income (loss), a component of stockholders’ equity, net of tax. Fairearnings. Under SFAS No. 159, we did not elect the fair value
of the marketable securities is determined based on quoted market prices.Foreign Currency Translation
We use the United States dollar as our functional currencyoption for allany of our subsidiaries. Foreign currency monetary assets and liabilities. The adoption of SFAS No. 159 did not have an impact on our consolidated financial statements.
In June 2007, the FASB ratified Emerging Issues Task Force Issue No. 07-3, or EITF 07-3, Accounting for Nonrefundable Advance Payments for Goods or Services to Be Used in Future Research and Development Activities. EITF 07-3 requires non-refundable advance payments for goods and services to be used in future research and development activities to be recorded as an asset and the payments to be expensed when the research and development activities are performed. We adopted the provisions of EITF 07-3 beginning with our fiscal quarter ended April 27, 2008. The adoption of EITF 07-3 did not have any impact on our consolidated financial position, results of operations and cash flows.
NVIDIA CORPORATION AND SUBSIDIARIES
NOTES TO THE CONSOLIDATED FINANCIAL STATEMENTS
(Continued)
Recently Issued Accounting Pronouncements
In December 2007, the FASB issued Statement of Financial Accounting Standards No. 141 (revised 2007), or SFAS No. 141(R), Business Combinations. Under SFAS No. 141(R), an entity is required to recognize the assets acquired, liabilities are remeasured into United States dollarsassumed, contractual contingencies, and contingent consideration at end-of-period exchange rates. Non-monetary assetstheir fair value on the acquisition date. It further requires that acquisition-related costs be recognized separately from the acquisition and liabilities, including inventories, prepaid expenses and other current assets, property and equipment, deposits and other assets and equity, are remeasured at historical exchange rates. Revenue and expenses are remeasured at average exchange ratesexpensed as incurred, restructuring costs generally be expensed in effect during each period, except for those expenses relatedperiods subsequent to the previously noted balance sheet amounts, whichacquisition date, and changes in accounting for deferred tax asset valuation allowances and acquired income tax uncertainties after the measurement period impact income tax expense. In addition, acquired in-process research and development, or IPR&D, is capitalized as an intangible asset and amortized over its estimated useful life. We are remeasured at historical exchange rates. Gainsrequired to adopt the provisions of SFAS No. 141(R) beginning with our fiscal quarter ending April 26, 2009. The adoption of SFAS No. 141(R) is expected to change our accounting treatment for business combinations on a prospective basis beginning in the period it is adopted.
In April 2008, the FASB issued FASB Staff Position No. FAS No.142-3, or losses from foreign currency remeasurement are includedFSP No. 142-3, Determination of Useful Life of Intangible Assets. FSP No. 142-3 amends the factors that should be considered in “Other income (expense), net” anddeveloping the renewal or extension assumptions used to date have not been significant.Comprehensive Income
Comprehensive income consistsdetermine the useful life of net income and other comprehensive income or loss. Other comprehensive income or loss components include unrealized gains or losses on available-for-sale securities, net of tax.
Goodwill
We account for goodwill in accordance witha recognized intangible asset under Statement of Financial Accounting Standards No. 142, or SFAS No. 142,Goodwill and Other Intangible Assets. As requiredAssets. FSP No. 142-3 also requires expanded disclosure regarding the determination of intangible asset useful lives. FSP No. 142-3 is effective for fiscal years beginning after December 15, 2008. Earlier adoption is not permitted. We are currently evaluating the potential impact the adoption of FSP No. 142-3 will have on our consolidated financial position, results of operations and cash flows.
Note 2 - Stock-Based Compensation
The statement of operations includes stock-based compensation expense and the amortization of amounts capitalized as inventory, as follows:
| | Year Ended | |
| | January 25, | | January 27, | | January 28, | |
| | 2009 | | 2008 | | 2007 | |
| | (In thousands) | |
| | | | | | | | | | | | |
| | | | | | | | | | | | |
Sales, general and administrative | | | | | | | | | | | | |
| | | | | | | | | | | | |
Impact of the adoption of SFAS No. 123(R)
We elected to adopt the modified prospective application method beginning January 30, 2006 as provided by SFAS No. 142,123(R). Accordingly, during fiscal year 2007, we discontinued amortizingrecorded stock-based compensation expense for awards granted prior to, but not yet vested, as of January 29, 2006, equal to the amount that would have been recognized if the fair value method required for pro forma disclosure under SFAS No. 123 had been in effect for expense recognition purposes, adjusted for estimated forfeitures. Previously reported amounts have not been restated.
Our adoption of SFAS No. 123(R) resulted in a cumulative benefit from the accounting change of $0.7 million during fiscal year 2007, which reflects the net cumulative impact of estimating forfeitures in the determination of period expense by reversing the previously recognized cumulative compensation expense related to those forfeitures, rather than recording forfeitures when they occur as previously permitted.
Stock-based compensation expense that would have been recorded under APB No. 25 during the year ended January 28, 2007 was approximately $3.0 million. Upon our adoption of SFAS No. 123(R), at January 30, 2006, we reclassified the unearned stock-based compensation expense balance of approximately $3.6 million that would have been recorded under APB No. 25 to additional paid-in capital in our Consolidated Balance Sheet. The adoption of SFAS No. 123(R) reduced our basic and diluted earnings per share by $0.19 and $0.17, respectively, and reduced our net income by $102.7 million for the year ended January 28, 2007.
Prior to adopting SFAS No. 123(R), we presented all tax benefits resulting from the exercise of stock options as operating cash flows in our Consolidated Statement of Cash Flows. However, as required by our adoption of SFAS No. 123(R), since fiscal year 2007, we began classifying cash flows resulting from gross tax benefits as a part of cash flows from financing activities. Gross tax benefits are realized tax benefits from tax deductions for exercised options in excess of cumulative compensation cost for those instruments recognized in our consolidated financial statements. The effect of this change in classification on our Consolidated Statement of Cash Flows resulted in cash used from operations of $0.9 million and $0.2 million and cash provided by financing activities of $0.9 million and $0.2 million for the years ended January 25, 2009 and January 27, 2008, respectively. During year ended January 28, 2007, cash used from operations and cash provided by financing activities was $0.2 million each.
NVIDIA CORPORATION AND SUBSIDIARIES
NOTES TO THE CONSOLIDATED FINANCIAL STATEMENTS -
(Continued)
remaining balances
Subsequent to the adoption of goodwill asSFAS No. 123(R)
As of January 25, 2009 and January 27, 2008, the beginningaggregate amount of fiscal 2003. All remaining and future acquired goodwill will be subjectunearned stock-based compensation expense related to our annual impairment test during our fourth quarterstock options was $193.8 million and $233.6 million, respectively, adjusted for estimated forfeitures, which we will recognize over an estimated weighted average amortization period of our fiscal year, or earlier if indicators1.82 and 2.08 years, respectively.
Stock-based compensation capitalized in inventories resulted in a benefit of potential impairment exist, using$2.0 million and a fair value-based approach. Our impairment review process compares the fair valuecharge of the reporting unit$0.3 million in which the goodwill resides to its carrying value. For the purposescost of completing our SFAS No. 142 impairment test, we performed our analysis on a reporting unit basis. We utilize a two-step approach to testing goodwill for impairment. The first step tests for possible impairment by applying a fair value-based test. In computing fair value of our reporting units, we use estimates of future revenues, costs and cash flows from such units. The second step, if necessary, measures the amount of such an impairment by applying fair value-based tests to individual assets and liabilities. We elected to perform our annual goodwill impairment reviewrevenue during the fourth quarteryears ended January 25, 2009 and January 27, 2008, respectively.
During fiscal years 2009, 2008 and 2007, we granted approximately 17.9 million, 17.2 million and 17.9 million stock options, respectively, with estimated total grant-date fair values of
each fiscal year. We completed our most recent annual impairment test during$143.6 million, $207.4 million and $138.4 million, respectively, and weighted average grant-date fair values of $8.03, $11.98 and $7.85 per option, respectively. Of these amounts, we estimated that the
fourth quarter of fiscal 2006 and concluded that there was no impairment. However, future events or circumstances may result in a charge to earnings duestock-based compensation expense related to the
potentialawards that are not expected to vest for
a write-down of goodwill in connection with such tests.Stock-Based Compensation
Statement of Financial Accounting Standards No. 148, or SFAS No. 148,Accounting for Stock-Based Compensation - Transitionfiscal years 2009, 2008 and Disclosure, amends the disclosure requirements of Statement of Financial Accounting Standards No. 123, or SFAS No. 123,Accounting for Stock-Based Compensation,to require more prominent disclosures in both annual2007 was $23.8 million, $40.0 million and interim financial statements regarding the method of accounting for stock-based compensation and the effect of the method used on reported results.
$26.7 million, respectively.
Valuation Assumptions
We
use the intrinsic value method, as prescribed by Accounting Principles Board Opinion No. 25, Accounting for Stock Issued to Employees, to account for our stock-based employee compensation plans. As such, compensation expense is recorded if on the date of grant the current fair value per share of the underlying stock exceeds the exercise price per share. We recognize compensation cost for awards in accordance with Financial Accounting Standards Board Interpretation No. 28, “Accounting for Stock Appreciation Rights and Other Variable Stock Option or Award Plans,” which generally accelerates the compensation expense as compared to the straight-line method. Compensation cost for our stock-based compensation plans as determined consistent with Statement of Financial Accounting Standards No. 123,Accounting for Stock-Based Compensation, would have decreased net income in the periods presented to the pro forma amounts indicated below: | | | | | | | | | | | | |
| | | Year Ended | |
| | | January 29,
2006 | | | January 30,
2005 | | | January 25,
2004 | |
| | | (As Restated) | | | (As Restated) | | | (As Restated) | |
| | | (In thousands, except per share data) | |
Net income, as reported | | $ | 301,176 | | | $ | 88,615 | | | $ | 48,630 | |
Add: Stock-based employee compensation expense included in reported net income, net of related tax effects | | | 6,644 | | | | 17,241 | | | | 25,158 | |
Deduct: Stock-based employee compensation expense determined under fair value-based method for all awards, net of related tax effects | | | (90,405 | ) | | | (108,430 | ) | | | (71,419 | ) |
| | | | | | | | | | | | |
Pro forma net income (loss) | | $ | 217,415 | | | $ | (2,574 | ) | | $ | 2,369 | |
| | | | | | | | | | | | |
Basic net income per share - as reported | | $ | 1.77 | | | $ | 0.53 | | | $ | 0.30 | |
Basic net income (loss) per share - pro forma | | $ | 1.28 | | | $ | (0.02 | ) | | $ | 0.01 | |
Diluted net income per share - as reported | | $ | 1.65 | | | $ | 0.50 | | | $ | 0.28 | |
Diluted net income (loss) per share - pro forma | | $ | 1.19 | | | $ | (0.02 | ) | | $ | 0.01 | |
During the first quarter of fiscal 2006, we transitioned from a Black-Scholes model toutilize a binomial model for calculating the estimated fair value of new stock-based compensation awards granted under our stock option plans. As a result of recent regulatory guidance, including SEC Staff Accounting Bulletin No. 107, or SAB No. 107, and in anticipation of the impending effective date of Financial Accounting Standards Board, or FASB, Statement of Financial Accounting Standards No. 123(R), or SFAS No. 123(R),Share-Based Payment, we reevaluated the assumptions we use to estimate the value of employee stock options and shares issued under our employee stock
NVIDIA CORPORATION AND SUBSIDIARIES
NOTES TO CONSOLIDATED FINANCIAL STATEMENTS - (Continued)
purchase plan, beginning with stock options granted and shares issued under our employee stock purchase plan in our first quarter of fiscal 2006. We have determined that the use of implied volatility is expected to be more reflective of market conditions and, therefore, can reasonably be expected to be a betterreasonable indicator of our expected volatility than historical volatility. Additionally, in the first quarter of fiscal 2006, we began segregatingWe also segregate options into groups forof employees with relatively homogeneous exercise behavior in order to make full usecalculate the best estimate of the capabilities offair value using the binomial valuation model. As such, the expected term assumption used in calculating the estimated fair value of our stock-based compensation awards using the binomial model is based on detailed historical data about employees' exercise behavior, vesting schedules, and death and disability probabilities. We believeOur management believes the resulting binomial calculation provides a more refinedreasonable estimate of the fair value of our employee stock options. For our employee stock purchase plan we decided to continue to use the Black-Scholes modelmodel.
SFAS No. 123(R) requires forfeitures to
calculatebe estimated at the
time of grant and revised, if necessary, in subsequent periods if actual forfeitures differ from those estimates. Forfeitures are estimated
fair value.Forbased on historical experience. If factors change and we employ different assumptions in the purposeapplication of SFAS No. 123(R) in future periods, the pro forma calculation,compensation expense that we record under SFAS No. 123(R) may differ significantly from what we have recorded in the current period.
The fair value of stock options granted under our stock option plans and
the fair value of shares issued under our employee stock purchase plan have been estimated
at the date of grant with the following assumptions:
| | | | | | |
| | | Stock Options |
| | | Year Ended |
| | | January 29, 2006 | | January 30, 2005 | | January 25, 2004 |
| | | (Using a binomial
model) | | (Using the Black-Scholes
model) | | (Using the Black-Scholes
model) |
Weighted average expected life of stock options (in years) | | 3.6 - 5.1 | | 4.0 | | 4.0 |
Risk free interest rate | | 4.0% - 4.4% | | 3.0% | | 2.4% |
Volatility | | 34% - 48% | | 75% - 80% | | 80% |
Dividend yield | | — | | — | | — |
| |
| | | Employee Stock Purchase Plan |
| | | Year Ended |
| | | January 29, 2006 | | January 30, 2005 | | January 25, 2004 |
| | | (Using the Black-Scholes
model) | | (Using the Black-Scholes
model) | | (Using the Black-Scholes
model) |
Weighted average expected life of stock options (in years) | | 0.5 - 2.0 | | 0.5 - 2.0 | | 0.5 -1.0 |
Risk free interest rate | | 0.9% - 3.7% | | 1.1% - 2.1% | | 1.6% - 2.4% |
Volatility | | 30% - 45% | | 80% | | 88% |
Dividend yield | | — | | — | | — |
For
| | Year Ended | |
| | January 25, 2009 | | | January 27, 2008 | | | January 28, 2007 | |
| Stock Options | | (Using a binomial model) | |
Weighted average expected life of stock options (in years) | | | | | | | | | | | | |
| | | | | | | | | | | | |
| | | | | | | | | | | | |
| | | | | | | | | | | | |
| | Year Ended | |
| | January 25, 2009 | | | January 27, 2008 | | | January 28, 2007 | |
| Employee Stock Purchase Plan | | (Using the Black-Scholes model) | |
Weighted average expected life of stock options (in years) | | | | | | | | | | | | |
| | | | | | | | | | | | |
| | | | | | | | | | | | |
| | | | | | | | | | | | |
NVIDIA CORPORATION AND SUBSIDIARIES
NOTES TO THE CONSOLIDATED FINANCIAL STATEMENTS
(Continued)
Equity Incentive Program
We consider equity compensation to be long-term compensation and an integral component of our efforts to attract and retain exceptional executives, senior management and world-class employees. We believe that properly structured equity compensation aligns the purposelong-term interests of stockholders and employees by creating a strong, direct link between employee compensation and stock appreciation, as stock options are only valuable to our employees if the value of our common stock increases after the date of grant.
2007 Equity Incentive Plan
At the Annual Meeting of Stockholders held on June 21, 2007, our stockholders approved the NVIDIA Corporation 2007 Equity Incentive Plan, or the 2007 Plan.
The 2007 Plan authorizes the issuance of incentive stock options, nonstatutory stock options, restricted stock, restricted stock unit, stock appreciation rights, performance stock awards, performance cash awards, and other stock-based awards to employees, directors and consultants. Only our employees may receive incentive stock options. The 2007 Plan succeeds our 1998 Equity Incentive Plan, our 1998 Non-Employee Directors’ Stock Option Plan, our 2000 Nonstatutory Equity Incentive Plan, and the PortalPlayer, Inc. 2004 Stock Incentive Plan, or the Prior Plans. All options and stock awards granted under the Prior Plans shall remain subject to the terms of the pro forma calculation,Prior Plans with respect to which they were originally granted. Up to 101,845,177 shares which, due to the weighted averagesubsequent stock split now totals 152,767,766 shares, of our common stock may be issued pursuant to stock awards granted under the 2007 Plan or the Prior Plans. As of January 25, 2009, 29.5 million shares were available for future issuance under the 2007 Plan.
Options granted to new employees generally vest ratably quarterly over a three-year period. Grants to existing employees in recognition of performance generally vest as to 25% of the shares two years and three months after the date of grant and as to the remaining 75% of the shares subject to the option in equal quarterly installments over a nine month period. Options granted under the 2007 Plan generally expire in six years from the date of grant.
Unless terminated sooner, the 2007 Plan is scheduled to terminate on April 23, 2017. Our Board may suspend or terminate the 2007 Plan at any time. No awards may be granted under the 2007 Plan while the 2007 Plan is suspended or after it is terminated. The Board may also amend the 2007 Plan at any time. However, if legal, regulatory or listing requirements require stockholder approval, the amendment will not go into effect until the stockholders have approved the amendment.
PortalPlayer, Inc. 1999 Stock Option Plan
We assumed options issued under the PortalPlayer, Inc. 1999 Stock Option Plan, or the 1999 Plan, when we completed our acquisition of PortalPlayer on January 5, 2007. The 1999 Plan was terminated upon completion of PortalPlayer’s initial public offering of common stock in calendar 2004. No shares of common stock are available for issuance under the 1999 Plan other than to satisfy exercises of stock options granted under the 1999 Plan prior to its termination and any shares that become available for issuance as a result of expiration or cancellation of an option that was issued pursuant to the 1999 Plan. Previously authorized yet unissued shares under the 1999 Plan were cancelled upon completion of PortalPlayer’s initial public offering.
Each option we assumed in connection with our acquisition of PortalPlayer was converted into the right to purchase that number of shares of NVIDIA common stock determined by multiplying the number of shares of PortalPlayer common stock underlying such option by 0.3601 and then rounding down to the nearest whole number of shares. The exercise price per share for each assumed option was similarly adjusted by dividing the exercise price by 0.3601 and then rounding up to the nearest whole cent. Vesting schedules and expiration dates did not change.
Under the 1999 Plan, incentive stock options were granted at a price that was not less than 100% of the fair market value of PortalPlayer’s common stock, as determined by its board of directors, on the date of grant. Non-statutory stock options were granted at a price that was not less than 85% of the fair market value of PortalPlayer’s common stock, as determined by its board of directors, on the date of grant.
NVIDIA CORPORATION AND SUBSIDIARIES
NOTES TO THE CONSOLIDATED FINANCIAL STATEMENTS
(Continued)
Generally, options granted under the 1999 Plan are exercisable for a period of ten years from the date of grant, and shares vest at a rate of 25% on the first anniversary of the grant date of the option, and an additional 1/48th of the shares upon completion of each succeeding full month of continuous employment thereafter.
1998 Employee Stock Purchase Plan
In February 1998, our Board approved the 1998 Employee Stock Purchase Plan, or the Purchase Plan. In June 1999, the Purchase Plan was amended to increase the number of shares reserved for issuance automatically each year at the end of our fiscal year for the next 10 years (commencing at the end of fiscal 2000 and ending 10 years later in 2009) by an amount equal to 2% of the outstanding shares on each such date, including on an as-if-converted basis preferred stock and convertible notes, and outstanding options and warrants, calculated using the treasury stock method; provided that the maximum number of shares of common stock available for issuance from the Purchase Plan could not exceed 52,000,000 shares which, due to subsequent stock-splits, is now 78,000,0000 shares. The number of shares will no longer be increased annually as we reached the maximum permissible number of shares at the end of fiscal year 2006. There are a total of 78,000,000 shares authorized for issuance. At January 25, 2009, 33,395,699 shares had been issued under the Purchase Plan and 44,604,301 shares were available for future issuance.
The Purchase Plan is intended to qualify as an “employee stock purchase plan” under Section 423 of the Internal Revenue Code. Under the Purchase Plan, the Board has authorized participation by eligible employees, including officers, in periodic offerings following the adoption of the Purchase Plan. Under the Purchase Plan, separate offering periods shall be no longer than 27 months. Under the current offering adopted pursuant to the Purchase Plan, each offering period is 24 months, which is divided into four purchase periods of 6 months.
Employees are eligible to participate if they are employed by us or an affiliate of us as designated by the Board. Employees who participate in an offering may have up to 10% of their earnings withheld pursuant to the Purchase Plan up to certain limitations and applied on specified dates determined by the Board to the purchase of shares of common stock. The Board may increase this percentage at its discretion, up to 15%. The price of common stock purchased under the Purchase Plan will be equal to the lower of the fair market value of the common stock on the commencement date of each offering period and the purchase date of each offering period at 85% at the fair market value of the common stock on the relevant purchase date. During fiscal years 2009, 2008 and 2007, employees purchased approximately 3.0 million, 2.1 million and 5.7 million shares with weighted-average prices of $12.79, $14.29 and $4.28 per share, respectively, and grant-date fair values of $5.90, $5.48 and $2.43 per share, respectively. Employees may end their participation in the Purchase Plan at any time during the offering period, and participation ends automatically on termination of employment with us and in each case their contributions are refunded.
The following summarizes the transactions under our equity incentive plans:
| | | Options Available for Grant | | | Options Outstanding | | | Weighted Average Exercise Price Per Share | |
Balances, January 29, 2006 | | | | | | | | | | | | |
| | | | | | | | | | | | |
| | | | | | | | | | | | |
| | | | | | | | | | | | |
| | | | | | | | | | | | |
Balances, January 28, 2007 | | | | | | | | | | | | |
| | | | | | | | | | | | |
| | | | | | | | | | | | |
| | | | | | | | | | | | |
| | | | | | | | | | | | |
Balances, January 27, 2008 | | | | | | | | | | | | |
| | | | | | | | | | | | |
| | | | | | | | | | | | |
| | | | | | | | | | | | |
| | | | | | | | | | | | |
Balances, January 25, 2009 | | | | | | | | | | | | |
NVIDIA CORPORATION AND SUBSIDIARIES
NOTES TO THE CONSOLIDATED FINANCIAL STATEMENTS
(Continued)
The total intrinsic value of options exercised was $84.9 million, $757.5 million and $530.7 million for fiscal years 2009, 2008 and 2007, respectively. The total fair value of options granted duringvested was $117.0 million, $102.8 million and $100.9 million for fiscal 2006, 2005years 2009, 2008 and 20042007, respectively.
The following table summarizes the options outstanding, options vested and expected to vest and options exercisable as of January 25, 2009:
| Weighted Average Remaining Contractual Term | | Aggregate Intrinsic Value (1) |
| | | $ | |
Options vested and expected to vest (2) | | | $ | |
| | | $ | |
(1) The aggregate intrinsic value in the table above represents the total pre-tax intrinsic value for in-the-money options at January 25, 2009, based on the $7.71 closing stock price of our common stock on the NASDAQ Global Select Market, which would have been received by the option holders had all in-the-money option holders exercised their options as of that date. The total number of in-the-money options outstanding and exercisable as of January 25, 2009 was approximately $10.87, $14.10,19.7 million shares and $13.11,19.2 million shares, respectively. For the purpose of the pro forma calculation, the
(2) Options vested and expected to vest include 93.7 million options with a weighted average
fair valueexercise price of
shares purchased under the employee stock purchase plan during fiscal 2006, 2005 and 2004 was approximately $3.44, $5.28, and $3.76, respectively.Net Income Per Share
Basic net income$13.59 per share is computed using the weighted average number of common shares outstanding during the period. Diluted net income per share is computed using the weighted average number of common and dilutive common equivalent shares outstanding during the period, using the treasury stock method. Under the treasury stock method, the effect ofshare.
The following table summarizes information about stock options outstanding isas of January 25, 2009:
| | | | | Options Outstanding | | Options Exercisable | |
| | Range of Exercise Prices | | | Number Outstanding | | Weighted Average Remaining Contractual Life (Years) | | Weighted Average Exercise Price | | Number Exercisable | | Weighted Average Exercise Price | |
| | $ | 0.01 - $5.00 | | | | | | | | | | | | | | | |
| | | 5.01 - 7.50 | | | | | | | | | | | | | | | |
| | | 7.51 - 10.00 | | | | | | | | | | | | | | | |
| | | 10.01 - 15.00 | | | | | | | | | | | | | | | |
| | | 15.01 - 20.00 | | | | | | | | | | | | | | | |
| | | 20.01 - 50.00 | | | | | | | | | | | | | | | |
| | | 50.00 and above | | | | 25,887 | | 6.7 | | $ | 64.05 | | 25,887 | | $ | 67.12 | |
| | | | | | | | | | | | | | | | | | |
We settle employee stock option exercises with newly issued common shares. We do not includedhave any equity instruments outstanding other than the options described above as of January 25, 2009.
Please refer to Note 19 for further discussion regarding the cash tender offer for certain employee stock options that our Board of Directors approved in February 2009.
NVIDIA CORPORATION AND SUBSIDIARIES
NOTES TO THE CONSOLIDATED FINANCIAL STATEMENTS
(Continued)
Note 3 – Restructuring Charges and Other
On September 18, 2008, we announced a workforce reduction to allow for continued investment in strategic growth areas, which was completed in the computationthird quarter of diluted net income per sharefiscal year 2009. As a result, we eliminated approximately 360 positions worldwide, or about 6.5% of our global workforce. During fiscal year 2009, expenses associated with the workforce reduction, which were comprised primarily of severance and benefits payments to these employees, totaled $8.0 million. The remaining accrual of $0.2 million as of January 25, 2009 relates to severance and benefits payments, which are expected to be paid during the first quarter of fiscal year 2010.
The following table provides a summary of the restructuring activities and related liabilities recorded in accrued liabilities in our Consolidated Balance Sheet as of January 25, 2009:
| Accrued Restructuring Charges : | | (In thousands) | |
Balance at January 27, 2008 | | | | |
| | | | |
| | | | |
| | | | |
Balance at January 25, 2009 | | | | |
Restructuring and other expenses for periods when their effect is anti-dilutive.fiscal year 2009 also included a non-recurring charge of $18.9 million associated with the termination of a development contract related to a new campus construction project that has been put on hold.
Note 4 – Net Income (Loss) Per Share
The following is a reconciliation of the numerators and denominators of the basic and diluted net income (loss) per share computations for the periods presented: | | | Year Ended | |
| | | January 25, 2009 | | | January 27, 2008 | | | January 28, 2007 | |
| | | (In thousands, except per share data) | |
| | | | | | | | | |
| | | | | | | | | | | | |
| | | | | | | | | | | | |
Denominator for basic net income (loss) per share, weighted average shares | | | | | | | | | | | | |
Effect of dilutive securities: | | | | | | | | | | | | |
Stock options outstanding | | | | | | | | | | | | |
Denominator for diluted net income (loss) per share, weighted average shares | | | | | | | | | | | | |
| | | | | | | | | | | | | |
Net income (loss) per share: | | | | | | | | | | | | |
Basic net income (loss) per share | | | | | | | | | | | | |
Diluted net income (loss) per share | | | | | | | | | | | | |
NVIDIA CORPORATION AND SUBSIDIARIESNOTES TO CONSOLIDATED FINANCIAL STATEMENTS - (Continued)
| | | | | | | | | |
| | | Year Ended |
| | | January 29,
2006 | | January 30,
2005 | | January 25,
2004 |
| | | (As Restated) | | (As Restated) | | (As Restated) |
| | | (In thousands, except per share data) |
Numerator: | | | | | | | | | |
Net income | | $ | 301,176 | | $ | 88,615 | | $ | 48,630 |
Denominator: | | | | | | | | | |
Denominator for basic net income per share, weighted average shares | | | 169,690 | | | 166,062 | | | 160,924 |
Effect of dilutive securities: | | | | | | | | | |
Stock options outstanding | | | 13,162 | | | 9,750 | | | 11,130 |
| | | | | | | | | |
Denominator for diluted net income per share, weighted average shares | | | 182,852 | | | 175,812 | | | 172,054 |
| | | | | | | | | |
Net income per share: | | | | | | | | | |
Basic net income per share | | $ | 1.77 | | $ | 0.53 | | $ | 0.30 |
Diluted net income per share | | $ | 1.65 | | $ | 0.50 | | $ | 0.28 |
All of our outstanding stock options were anti-dilutive during fiscal year 2009 and excluded from the computation of diluted earnings per share due to the net loss for fiscal year 2009. Diluted net income (loss) per share does not include the effect of the following anti-dilutive common equivalent shares offrom stock options outstanding of 5.8 million, 13.711.9 million and 7.913.4 million for the fiscal 2006, 2005years 2008 and 2004,2007, respectively. The weighted average exercise price of stock options excluded from the computation of diluted earnings per share was $35.58, $27.86,$32.05 and $29.63$20.09 for fiscal 2006, 2005years 2008 and 2004,2007, respectively.
Recently Issued Accounting Pronouncements
In December 2004, the Financial Accounting Standards Board, or FASB, issued Statement of Financial Accounting Standards No. 123(R), or SFAS No. 123(R),Share-Based Payment, which requires the measurement and recognition of compensation expense for all stock-based compensation payments. In April 2005, the SEC delayed the effective date of SFAS No. 123(R), which is now effective for annual periods that begin after June 15, 2005. In March 2005, the SEC issued Staff Accounting Bulletin No. 107, or SAB No. 107, which includes interpretive guidance for the initial implementation of SFAS No. 123(R). SFAS No. 123(R) allows for either prospective recognition of compensation expense or retrospective recognition. We intend to adopt SFAS No. 123(R) using the modified prospective method, which requires the application of the accounting standard as of January 30, 2006, the first day of our fiscal 2007. Expensing these incentives in future periods will materially and adversely affect our reported operating results as the stock-based compensation expense would be charged directly against our reported earnings. We anticipate that our stock-based compensation expense will be approximately $18 to $22 million for the first quarter of fiscal 2007 and we are unsure how the market will react to this adverse affect on our operating results, which could impact our stock price. However, had we adopted SFAS No. 123(R) in prior periods, the magnitude of the impact of that standard would have approximated the impact of Statement of Financial Accounting Standards No. 123,Accounting for Stock-Based Compensation, assuming the application of the Black-Scholes model as described in the disclosure of pro forma net income (loss) and pro forma net income (loss) per share in Note 1 of the Notes to Consolidated Financial Statements under the subheading “Stock-Based Compensation.” SFAS No. 123(R) also requires the benefits of tax deductions in excess of recognized compensation cost to be reported as a financing cash flow, rather than as an operating cash flow as required under current literature.
In June 2005, the FASB issued SFAS No. 154, or SFAS No. 154,Accounting Changes and Error Corrections, a replacement of APB Opinion No. 20 and FASB Statement No. 3. SFAS No. 154 applies to all voluntary changes in accounting principle, and changes the requirements for accounting for and reporting of a change in accounting principle. We will adopt SFAS 154 during the first quarter of fiscal 2007. We do not expect the adoption of SFAS No. 154 to have a material impact on our consolidated financial position, results of operations or cash flows.
NVIDIA CORPORATION AND SUBSIDIARIES
NOTES TO THE CONSOLIDATED FINANCIAL STATEMENTS
(Continued)
Note 5 -
(Continued)In June 2005, the FASB ratified the Emerging Issues Task Force’s, or EITF’s, Issue No. 05-06, or EITF No. 05-06, Determining the Amortization Period for Leasehold Improvements. EITF No. 05-06 provides that the amortization period used for leasehold improvements acquired in a business combination or purchased after the inception of a lease be the shorter of (a) the useful life of the assets or (b) a term that includes required lease periods and renewals that are reasonably assured upon the acquisition or the purchase. The provisions of EITF No. 05-06 are effective on a prospective basis for leasehold improvements purchased or acquired. We adopted EITF No. 05-06 during the second quarter of fiscal 2006 and it did not have a material impact on our consolidated financial position, results of operations or cash flows.
In November 2005, the FASB issued Staff Position, or FSP, FAS115-1/124-1, The Meaning of Other-Than-Temporary Impairment and Its Application to Certain Investments, which addresses the determination as to when an investment is considered impaired, whether that impairment is other than temporary, and the measurement of an impairment loss. This FSP also includes accounting considerations subsequent to the recognition of an other-than-temporary impairment and requires certain disclosures about unrealized losses that have not been recognized as other-than-temporary impairments. The guidance in this FSP amends SFAS No. 115, Accounting for Certain Investments in Debt and Equity Securities, and SFAS No. 124, Accounting for Certain Investments Held by Not-for-Profit Organizations, and APB Opinion No. 18, The Equity Method of Accounting for Investments in Common Stock. This FSP is effective for reporting periods beginning after December 15, 2005. We do not believe the adoption of this FSP will have a material impact on our consolidated financial position, results of operations or cash flows.
In November 2005, the FASB issued FSP FAS123(R)-3, Transition Election to Accounting for the Tax Effects of Share-Based Payment Awards. This FSP requires an entity to follow either the transition guidance for the additional-paid-in-capital pool as prescribed in SFAS No. 123(R), Share-Based Payment, or the alternative transition method as described in the FSP. An entity that adopts SFAS No. 123(R) using the modified prospective application may make a one-time election to adopt the transition method described in this FSP. An entity may take up to one year from the later of its initial adoption of SFAS No. 123(R) or the effective date of this FSP to evaluate its available transition alternatives and make its one-time election. This FSP became effective in November 2005. We continue to evaluate the impact that the adoption of this FSP could have on our consolidated financial position, results of operations or cash flows.
3dfx
Note 2 - Restatement of Consolidated Financial Statements, Audit Committee and Company FindingsIn May 2006, following media reports of stock option accounting investigations at other companies, the management of NVIDIA decided to conduct a review of stock option grants made by NVIDIA. Management advised our Board of Directors of the review at a regularly-scheduled meeting of the Board of Directors on May 25, 2006. The Board of Directors directed management to report its findings to the Audit Committee. Management presented its findings to the Audit Committee in late June 2006. Following that presentation, the Audit Committee determined that it should perform its own independent review of stock option grants made by NVIDIA. The Audit Committee, with the assistance of outside legal counsel, began its review on approximately June 29, 2006.
The Audit Committee’s review was completed on November 13, 2006 when the Audit Committee reported its findings to the full Board of Directors. The review covered option grants to all employees, directors and consultants for all grant dates during the period from our initial public offering in January 1999 through June 2006. As part of its review, the Audit Committee determined whether the correct measurement dates had been used under applicable accounting principles for these options. The measurement date means the date on which the option is deemed granted under applicable accounting principles, namely Accounting Principles Board Opinion No. 25, or APB 25,Accounting for Stock Issued to Employees and related interpretations, and is the first date on which all of the following are known: (1) the individual employee who is entitled to receive the option grant, (2) the number of options that an individual employee is entitled to receive, and (3) the option’s exercise price.
Based on the findings of the Audit Committee and our internal review, we identified a number of occasions on which we used an incorrect measurement date for financial accounting and reporting purposes. These errors resulted primarily from our use during our fiscal years 2000, 2001 and 2002, of certain date selection methods discussed below which resulted in employees receiving options with stated exercise prices lower than the market prices as measured based upon the actual grant dates. We ceased using such practices beginning in our fiscal year 2003. The Audit Committee found that, beginning in our fiscal year 2003, we improved our stock option grant processes and have generally granted and priced our employee stock options in an objective and consistent manner since that time. However, for one Company-wide annual stock option grant we made in fiscal 2004, we did not finalize the number of options allocated to each employee as of the stated grant date in May 2003, which resulted in stock-based compensation charges due to the change in the measurement date to the date the grants were finalized. The Audit Committee’s review did not identify any additional stock-based compensation charges from measurement date issues subsequent to that fiscal 2004 grant.
In accordance with APB 25, with respect to periods through January 29, 2006, we should have recorded stock-based compensation expense to the extent that the fair market value of our common stock on the correct measurement date exceeded the exercise price of each option granted. For periods commencing January 30, 2006 (the beginning of our fiscal year 2007), we record stock-based compensation expense in accordance with Statement of Financial Accounting Standards No. 123(R) (revised), or SFAS No. 123(R),Share-Based Payment.
As a result of the measurement date errors identified from the Audit Committee’s review, through January 29, 2006, we recorded aggregate non-cash stock-based compensation charges of $127.4 million, net of related tax effects. These charges were based primarily on APB 25 (intrinsic value-based) charges and associated payroll taxes of $199.6 million on a pre-tax basis, which are being amortized over the vesting term of the stock options in accordance with Financial Accounting Standards Board Interpretation No. 28, or FIN 28,Accounting for Stock Appreciation Rights and Other Variable Stock Option or Award Plans. We have amortized a substantial portion of these charges to expense during our fiscal years 2000 to 2006. If an option is forfeited prior to vesting, we reverse both the charges amortized to expense in prior periods as well as any remaining unamortized deferred stock-based compensation associated with the forfeited options. Accordingly, our net stock-based compensation charges amortized to our statement of income are lower than the aggregate stock-based compensation charges based on APB 25 (intrinsic-value based). As of January 29, 2006, the remaining APB 25 (intrinsic value-based) unamortized deferred stock-based compensation related to the errors identified during the review was approximately $3.0 million.
NVIDIA CORPORATION AND SUBSIDIARIES
NOTES TO CONSOLIDATED FINANCIAL STATEMENTS—(Continued)
The types of errors we identified were as follows:
Improper Measurement Dates forCompany-Wide Annual or Retention Stock Option Grants. We determined that, in connection with certain annual or retention stock option grants that we made to employees during our fiscal years 2000, 2001, 2002, 2003 and 2004, the final number of shares that an individual employee was entitled to receive was not determined and/or the proper approval of the related stock option grant had not been given until after the stated grant date. Therefore, the measurement date for such options for accounting purposes was actually subsequent to the stated grant date, resulting in new measurement dates for the related options.
Improper Measurement Dates for Stock Option Grants during Fiscal Years 2001 and 2002. In connection with stock option grants that we made to newly-hired employees (and, to a much lesser degree, retention grants to existing employees) during fiscal years 2001 and 2002, our practice was to grant stock options with an exercise price based upon the lowest closing price of our common stock in the last few days of the month of hire or the last few days of any subsequent month in the quarter of hire. The selection of the grant date of the related option grants would be made at the end of the fiscal quarter and was based on achieving the lowest exercise price for the affected employees. As a result of these practices, the measurement date for such options for accounting purposes was actually subsequent to the stated grant date, resulting in new measurement dates for the related options.
Improper Measurement Dates for Stock Option Grants during Fiscal Year 2000. In connection with certain stock option grants to newly-hired employees (and, to a much lesser degree, retention grants to existing employees) during a portion of fiscal year 2000, our practice was to delay the selection of the related grant dates until the end of a two-month period in the fiscal quarter during which the employees who received the grants began their employment with NVIDIA. As a result of this practice, the exercise price of the related option grants was not determined until subsequent to the stated grant date. We also determined that, during fiscal year 2000, we generally set the grant date and exercise price of employee option grants for new hires and promotions at the lowest price of the last few business days of the month of their hire or promotion (or of the following month in certain two-month periods that were chosen for an indeterminate reason). As a result of these practices, the measurement date for such options for accounting purposes was actually subsequent to the stated grant date, resulting in new measurement dates for the related options. In addition, we also determined that the exercise price or the number of options to be granted had not been determined, or the proper approval had not been given, for various other miscellaneous option grants during fiscal year 2000 until after the stated grant date - resulting in new measurement dates for accounting purposes for the related options.
Other Issues Identified.We also identified instances where stock option grants did not comply with applicable terms and conditions of the stock plans from which the grants were issued. For example, two grants were made to officers of NVIDIA by the chief executive officer under delegated authority; however, under the terms of the applicable plan, the option grant should have been made by our Board or the Compensation Committee. There were also instances where (1) option grants were made to a small group of employees who joined NVIDIA pursuant to a business combination, and to a few other employees in certain instances, with stated exercise prices below the fair market value of our common stock on the actual measurement date of the related grants; and (2) option grants were made to a few individuals who were contractors rather than employees, without recording the appropriate accounting charges. The accounting impact of these items was cumulatively less than $6.0 million. In addition, the Audit Committee did not find any evidence that these violations were committed for improper purposes.
The Audit Committee carefully considered the involvement of current members of management in the option grant process and concluded that the evidence did not give rise to any concern about the integrity of any current officer or director of NVIDIA. The Audit Committee also found that the accounting errors and improper practices brought to light during their review were not motivated by any intent to mislead investors, improve NVIDIA’s reported financial results, or obtain any personal benefit. Based on its findings, the Audit Committee was unable to reach any conclusion regarding the integrity of former officers and employees.
As a result of the errors we identified, we have restated our historical financial statements from our fiscal year 2000 through our fiscal year 2006 to record $127.4 million of charges related to stock-based compensation and associated payroll tax expense, net of related income tax effects. These errors resulted in after-tax charges of $1.4 million, $11.7 million and $25.8 million for our fiscal years 2006, 2005 and 2004, respectively. Additionally, the cumulative effect of the related after-tax charges for periods prior to our fiscal year ended January 25, 2004 was $88.4 million. These additional stock-based compensation expense charges were non-cash and had no impact on our reported revenue, cash, cash equivalents or marketable securities for each of the restated periods.
For all periods through the end of our fiscal year 2006, we have recorded aggregate non-cash stock-based compensation charges of $190.2 million, associated payroll tax charges of $9.4 million and a related income tax benefit of $72.2 million.
We recorded an income tax benefit of $2.0 million, $6.7 million, and $14.6 million for our fiscal years 2006, 2005 and 2004, respectively. The cumulative income tax benefit for periods prior to our fiscal year 2004 was $48.9 million. The income tax benefit differs from the expected statutory federal tax benefit principally as a result of state income tax benefits and federal and state research and experimental tax credits not previously benefited on stock-based compensation charges. Additionally, in our fiscal year 2004, we released a valuation allowance of $3.2 million recognized in prior periods on the incremental stock-based compensation expense. Prior to our fiscal year 2004, it was not more likely than not that we would realize the benefits of the future deductible amounts related to stock-based compensation expense. In our fiscal year 2004, the realization of these amounts became more likely than not due to settlement of certain tax contingencies related to stock-based compensation expense.
As part of this restatement, we also accrued liabilities and recorded charges to operating costs and expenses for certain payroll tax contingencies related to the incremental stock-based compensation expense in the amount of $18.8 million for all annual periods from our fiscal year 2000 through our fiscal year 2006. We recorded such charges in the amount of $3.1 million, $1.3 million, and $1.6 million for our fiscal years 2006, 2005 and 2004, respectively. Upon expiration of the related statute of limitations, we also recorded benefits from the reversal of previously-recorded payroll tax liabilities of $6.6 million and $2.8 million in our fiscal years 2006 and 2005, respectively. As a result, the net benefit to our statements of income was $3.5 million and $1.5 million for our fiscal years 2006 and 2005, respectively. The cumulative payroll tax expense for periods prior to our fiscal year 2004 was $12.8 million. For those stock option grants that we determined to have incorrect measurement dates for accounting purposes and that we had originally issued as incentive stock options, or ISOs, we recorded a liability for payroll tax contingencies in the event such grants would not be respected as ISOs under the principles of the Internal Revenue Code, or IRC, and the regulations thereunder. These liabilities were recorded with a charge to operating costs and expenses.
We also considered the application of Section 409A of the IRC to certain stock option grants where, under APB 25, intrinsic value existed at the time of grant. In the event such stock options grants are not respected as issued at fair market value at the original grant date under principles of the IRC and the regulations thereunder and are subject to Section 409A, we are considering potential remedial actions that may be available. We do not expect to incur a material charge as a result of any such potential remedial actions.
As a result of the findings of the Audit Committee, we concluded that we needed to amend our original filing on Form 10-K to restate our consolidated financial statements for the years ended January 29, 2006, January 30, 2005, and January 25, 2004 and the related disclosures.
NVIDIA CORPORATION AND SUBSIDIARIES
NOTES TO CONSOLIDATED FINANCIAL STATEMENTS—(Continued)
The following table sets forth the impact of the additional non-cash charges for stock-based compensation expense and related tax effects on our historical financial statements for each of the three years ended January 29, 2006, January 30, 2005, and January 25, 2004.
| | | | | | | | | | | | | | | | | | | | | | | | | | | | | | | | | | | | |
| | | Year Ended | |
| | | January 29, 2006 | | | January 30, 2005 | | | January 25, 2004 | |
| | | As
Previously
Reported | | | Adjustments | | | As Restated | | | As
Previously
Reported | | | Adjustments | | | As Restated | | | As
Previously
Reported | | | Adjustments | | | As Restated | |
| | | (In thousands, except per share data) | |
Revenue | | $ | 2,375,687 | | | $ | — | | | $ | 2,375,687 | | | $ | 2,010,033 | | | $ | — | | | $ | 2,010,033 | | | $ | 1,822,945 | | | $ | — | | | $ | 1,822,945 | |
Cost of revenue | | | 1,464,892 | | | | 762 | | | | 1,465,654 | | | | 1,360,547 | | | | 1,931 | | | | 1,362,478 | | | | 1,294,067 | | | | 3,617 | | | | 1,297,684 | |
| | | | | | | | | | | | | | | | | | | | | | | | | | | | | | | | | | | | |
Gross profit | | | 910,795 | | | | (762 | ) | | | 910,033 | | | | 649,486 | | | | (1,931 | ) | | | 647,555 | | | | 528,878 | | | | (3,617 | ) | | | 525,261 | |
Operating expenses: | | | | | | | | | | | | | | | | | | | | | | | | | | | | | | | | | | | | |
Research and development | | | 352,099 | | | | 5,024 | | | | 357,123 | | | | 335,104 | | | | 13,116 | | | | 348,220 | | | | 269,972 | | | | 22,190 | | | | 292,162 | |
Sales, general and administrative | | | 204,441 | | | | (2,353 | ) | | | 202,088 | | | | 200,789 | | | | 3,370 | | | | 204,159 | | | | 165,249 | | | | 14,562 | | | | 179,811 | |
In-process research and development | | | — | | | | — | | | | — | | | | — | | | | — | | | | — | | | | 3,500 | | | | — | | | | 3,500 | |
Settlement costs | | | 14,158 | | | | — | | | | 14,158 | | | | — | | | | — | | | | — | | | | — | | | | — | | | | — | |
| | | | | | | | | | | | | | | | | | | | | | | | | | | | | | | | | | | | |
Total operating expenses | | | 570,698 | | | | 2,671 | | | | 573,369 | | | | 535,893 | | | | 16,486 | | | | 552,379 | | | | 438,721 | | | | 36,752 | | | | 475,473 | |
| | | | | | | | | | | | | | | | | | | | | | | | | | | | | | | | | | | | |
Income from operations | | | 340,097 | | | | (3,433 | ) | | | 336,664 | | | | 113,593 | | | | (18,417 | ) | | | 95,176 | | | | 90,157 | | | | (40,369 | ) | | | 49,788 | |
| | | | | | | | | |
Interest income | | | 20,698 | | | | — | | | | 20,698 | | | | 11,422 | | | | — | | | | 11,422 | | | | 18,561 | | | | — | | | | 18,561 | |
Interest expense | | | (72 | ) | | | — | | | | (72 | ) | | | (164 | ) | | | — | | | | (164 | ) | | | (12,010 | ) | | | — | | | | (12,010 | ) |
Other income (expense), net | | | (502 | ) | | | — | | | | (502 | ) | | | 594 | | | | — | | | | 594 | | | | 3,033 | | | | — | | | | 3,033 | |
Convertible debenture redemption expense | | | — | | | | — | | | | — | | | | — | | | | — | | | | — | | | | (13,068 | ) | | | — | | | | (13,068 | ) |
| | | | | | | | | | | | | | | | | | | | | | | | | | | | | | | | | | | | |
Income before income tax expense (benefit) | | | 360,221 | | | | (3,433 | ) | | | 356,788 | | | | 125,445 | | | | (18,417 | ) | | | 107,028 | | | | 86,673 | | | | (40,369 | ) | | | 46,304 | |
Income tax expense (benefit) | | | 57,635 | | | | (2,023 | ) | | | 55,612 | | | | 25,089 | | | | (6,676 | ) | | | 18,413 | | | | 12,254 | | | | (14,580 | ) | | | (2,326 | ) |
| | | | | | | | | | | | | | | | | | | | | | | | | | | | | | | | | | | | |
Net income | | $ | 302,586 | | | $ | (1,410 | ) | | $ | 301,176 | | | $ | 100,356 | | | $ | (11,741 | ) | | $ | 88,615 | | | $ | 74,419 | | | $ | (25,789 | ) | | $ | 48,630 | |
| | | | | | | | | | | | | | | | | | | | | | | | | | | | | | | | | | | | |
Basic net income per share | | $ | 1.78 | | | $ | (0.01 | ) | | $ | 1.77 | | | $ | 0.60 | | | $ | (0.07 | ) | | $ | 0.53 | | | $ | 0.46 | | | $ | (0.16 | ) | | $ | 0.30 | |
| | | | | | | | | | | | | | | | | | | | | | | | | | | | | | | | | | | | |
Diluted net income per share | | $ | 1.65 | | | $ | — | | | $ | 1.65 | | | $ | 0.57 | | | $ | (0.07 | ) | | $ | 0.50 | | | $ | 0.43 | | | $ | (0.15 | ) | | $ | 0.28 | |
| | | | | | | | | | | | | | | | | | | | | | | | | | | | | | | | | | | | |
Shares used in basic per share computation | | | 169,690 | | | | — | | | | 169,690 | | | | 166,062 | | | | — | | | | 166,062 | | | | 160,924 | | | | — | | | | 160,924 | |
Shares used in diluted per share computation | | | 182,951 | | | | (99 | ) | | | 182,852 | | | | 176,558 | | | | (746 | ) | | | 175,812 | | | | 172,707 | | | | (653 | ) | | | 172,054 | |
The following table sets forth the impact of the additional non-cash charges for stock-based compensation expense and related tax effects on our consolidated balance sheets as of January 29, 2006 and January 30, 2005.
| | | | | | | | | | | | | | | | | | | | | | | | |
| | | January 29, 2006 | | | January 30, 2005 | |
| | | As
Previously
Reported | | | Adjustments | | | As Restated | | | As
Previously
Reported | | | Adjustments | | | As Restated | |
| | | (In thousands, except share and per share data) | |
| ASSETS | | | | | | | | | | | | | | | | | | | | | | | | |
Current assets: | | | | | | | | | | | | | | | | | | | | | | | | |
Cash and cash equivalents | | $ | 551,756 | | | $ | — | | | $ | 551,756 | | | $ | 208,512 | | | $ | — | | | $ | 208,512 | |
Marketable securities | | | 398,418 | | | | — | | | | 398,418 | | | | 461,533 | | | | — | | | | 461,533 | |
Accounts receivable, less allowances of $10,837 and $13,153 in 2006 and 2005, respectively | | | 318,186 | | | | — | | | | 318,186 | | | | 296,279 | | | | — | | | | 296,279 | |
Inventories | | | 254,792 | | | | 78 | | | | 254,870 | | | | 315,518 | | | | 268 | | | | 315,786 | |
Prepaid expenses and other current assets | | | 24,387 | | | | — | | | | 24,387 | | | | 19,819 | | | | — | | | | 19,819 | |
Deferred income taxes | | | 1,393 | | | | 1,289 | | | | 2,682 | | | | 3,265 | | | | 1,712 | | | | 4,977 | |
| | | | | | | | | | | | | | | | | | | | | | | | |
Total current assets | | | 1,548,932 | | | | 1,367 | | | | 1,550,299 | | | | 1,304,926 | | | | 1,980 | | | | 1,306,906 | |
Property and equipment, net | | | 178,152 | | | | — | | | | 178,152 | | | | 178,955 | | | | — | | | | 178,955 | |
Deposits and other assets | | | 27,477 | | | | — | | | | 27,477 | | | | 9,034 | | | | — | | | | 9,034 | |
Goodwill | | | 145,317 | | | | — | | | | 145,317 | | | | 108,107 | | | | — | | | | 108,107 | |
Intangible assets, net | | | 15,421 | | | | — | | | | 15,421 | | | | 27,514 | | | | — | | | | 27,514 | |
Deferred income taxes, non-current | | | — | | | | 38,021 | | | | 38,021 | | | | — | | | | 33,035 | | | | 33,035 | |
| | | | | | | | | | | | | | | | | | | | | | | | |
| | $ | 1,915,299 | | | $ | 39,388 | | | $ | 1,954,687 | | | $ | 1,628,536 | | | $ | 35,015 | | | $ | 1,663,551 | |
| | | | | | | | | | | | | | | | | | | | | | | | |
LIABILITIES AND STOCKHOLDERS’ EQUITY | | | | | | | | | | | | | | | | | | | | | | | | |
Current liabilities: | | | | | | | | | | | | | | | | | | | | | | | | |
Accounts payable | | $ | 179,395 | | | $ | — | | | $ | 179,395 | | | $ | 238,223 | | | $ | — | | | $ | 238,223 | |
Accrued liabilities | | | 259,264 | | | | — | | | | 259,264 | | | | 182,077 | | | | — | | | | 182,077 | |
Current portion of capital lease obligations | | | — | | | | — | | | | — | | | | 856 | | | | — | | | | 856 | |
| | | | | | | | | | | | | | | | | | | | | | | | |
Total current liabilities | | | 438,659 | | | | — | | | | 438,659 | | | | 421,156 | | | | — | | | | 421,156 | |
| | | | | | |
Deferred income tax liabilities | | | 8,260 | | | | (8,260 | ) | | | — | | | | 20,754 | | | | (20,754 | ) | | | — | |
Other long-term liabilities | | | 10,624 | | | | 9,412 | | | | 20,036 | | | | 8,358 | | | | 12,946 | | | | 21,304 | |
Commitments and contingencies - see Note 12 | | | | | | | | | | | | | | | | | | | | | | | | |
Stockholders’ equity: | | | | | | | | | | | | | | | | | | | | | | | | |
Preferred stock, $.001 par value; 2,000,000 shares authorized; none issued | | | — | | | | — | | | | — | | | | — | | | | — | | | | — | |
Common stock, $.001 par value; 1,000,000,000 shares authorized; 179,963,979 shares issued and 171,477,456 outstanding in 2006; and 169,173,898 shares issued and 167,089,545 outstanding in 2005 | | | 180 | | | | — | | | | 180 | | | | 169 | | | | — | | | | 169 | |
Additional paid-in capital | | | 798,251 | | | | 167,533 | | | | 965,784 | | | | 636,618 | | | | 179,433 | | | | 816,051 | |
Deferred compensation | | | (1,676 | ) | | | (1,928 | ) | | | (3,604 | ) | | | (2,926 | ) | | | (10,651 | ) | | | (13,577 | ) |
Treasury stock | | | (212,142 | ) | | | — | | | | (212,142 | ) | | | (24,644 | ) | | | — | | | | (24,644 | ) |
Accumulated other comprehensive loss, net | | | (1,957 | ) | | | — | | | | (1,957 | ) | | | (3,463 | ) | | | — | | | | (3,463 | ) |
Retained earnings | | | 875,100 | | | | (127,369 | ) | | | 747,731 | | | | 572,514 | | | | (125,959 | ) | | | 446,555 | |
| | | | | | | | | | | | | | | | | | | | | | | | |
Total stockholders' equity | | | 1,457,756 | | | | 38,236 | | | | 1,495,992 | | | | 1,178,268 | | | | 42,823 | | | | 1,221,091 | |
| | | | | | | | | | | | | | | | | | | | | | | | |
| | $ | 1,915,299 | | | $ | 39,388 | | | $ | 1,954,687 | | | $ | 1,628,536 | | | $ | 35,015 | | | $ | 1,663,551 | |
| | | | | | | | | | | | | | | | | | | | | | | | |
The additional non-cash charges for stock-based compensation expense and related tax effects had no impact on net cash flows from operations, investing activities, and financing activities reported in our consolidated statements of cash flows. In addition, the consolidated statements of stockholders’ equity have been restated to reflect the impact of the restatement adjustments on the consolidated stockholders’ equity amounts.
NVIDIA CORPORATION AND SUBSIDIARIES
NOTES TO CONSOLIDATED FINANCIAL STATEMENTS—(Continued)
Note 3 - Acquisition of MediaQ, Inc.
On August 19, 2003, we completed the acquisition of MediaQ, Inc., or MediaQ, a leading provider of graphics and multimedia technology for wireless mobile devices. Our primary reasons for the acquisition of MediaQ, Inc. were to accelerate our entry into the handheld devices market, use MediaQ’s two-dimensional, or 2D, and low power capabilities, allowing us to continue to focus on three-dimensional, or 3D, and advanced video efforts, use existing MediaQ channel and design wins, and enhance MediaQ’s PDA business through our existing OEM and original design manufacturer channels.
NVIDIA CORPORATION AND SUBSIDIARIES
NOTES TO CONSOLIDATED FINANCIAL STATEMENTS—(Continued)
The aggregate purchase price consisted of cash consideration of approximately $71.3 million, including $1.3 million of direct acquisition costs and $3.5 million of in-process research and development, or IPR&D, The amount of the IPR&D represents the value assigned to research and development projects of MediaQ that had commenced but had not yet reached technological feasibility and had no alternative future use. In accordance with SFAS No. 2,Accounting for Research and Development Costs, as clarified by FIN 4,Applicability of FASB Statement No. 2 to Business Combinations Accounted for by the Purchase Method an interpretation of FASB Statement No. 2, amounts assigned to IPR&D meeting the above-stated criteria were charged to expense as part of the allocation of the purchase price.
The pro forma results of operations have not been presented for the acquisition of MediaQ because the effect of this acquisition was not considered material.
NVIDIA CORPORATION AND SUBSIDIARIES
NOTES TO CONSOLIDATED FINANCIAL STATEMENTS - (Continued)
Note 4 - 3dfx
During fiscal year 2002, we completed the purchase of certain assets from 3dfx Interactive, Inc., or 3dfx, for an aggregate purchase price of approximately $74.2 million. The 3dfx asset purchase was accounted for underOn December 15, 2000, NVIDIA Corporation and one of our indirect subsidiaries entered into an Asset Purchase Agreement, or the purchase method of accounting andAPA, which closed on April 18, 2001.2001, to purchase certain graphics chip assets from 3dfx. Under the terms of the Asset Purchase Agreement,APA, the cash consideration due at the closing was $70.0 million, less $15.0 million that was loaned to 3dfx pursuant to a Credit Agreement dated December 15, 2000. The Asset Purchase AgreementAPA also provided, subject to the other provisions thereof, that if 3dfx properly certified that all its debts and other liabilities had been provided for, then we would have been obligated to pay 3dfx twoone million shares, which due to subsequent stock splits now totals six million shares, of NVIDIA common stock. If 3dfx could not make such a certification, but instead properly certified that its debts and liabilities could be satisfied for less than $25.0 million, then 3dfx could have elected to receive a cash payment equal to the amount of such debts and liabilities and a reduced number of shares of our common stock, with such reduction calculated by dividing the cash payment by $25.00 per share. If 3dfx could not certify that all of its debts and liabilities had been provided for, or could not be satisfied, for less than $25.0 million, we would not be obligated under the agreementAPA to pay any additional consideration for the assets.
In October 2002, 3dfx filed for Chapter 11 bankruptcy protection in the United States Bankruptcy Court for the Northern District of California. In March 2003, we were served with a complaint filed by the Trustee appointed by the Bankruptcy Court which sought,to represent 3dfx’s bankruptcy estate served his complaint on NVIDIA. The Trustee’s complaint asserts claims for, among other things, successor liability and fraudulent transfer and seeks additional payments from us as additional purchase price relatedus. On October 13, 2005, the Bankruptcy Court heard the Trustee’s motion for summary adjudication, and on December 23, 2005, denied that motion in all material respects and held that NVIDIA may not dispute that the value of the 3dfx transaction was less than $108 million. The Bankruptcy Court denied the Trustee’s request to our purchasefind that the value of certainthe 3dfx assets of 3dfx.conveyed to NVIDIA was at least $108 million. In early November 2005, after manyseveral months of mediation, NVIDIA and the Official Committee of Unsecured Creditors, or the Creditors’ Committee, agreed to a Plan of Liquidation of 3dfx, reachedwhich included a conditional settlement of the Trustee’s claims against NVIDIA.us. This conditional settlement which will bewas subject to a confirmation process through a vote of creditors and the review and approval of the Bankruptcy Court, callsCourt. The conditional settlement called for a payment by NVIDIA of approximately $30.6 million to the 3dfx estate. Under the settlement, $5.6 million relatesrelated to various administrative expenses and Trustee fees, and $25.0 million relatesrelated to the satisfaction of debts and liabilities owed to the general unsecured creditors of 3dfx. As such,Accordingly, during the three monthsmonth period ended October 30, 2005, we recorded $5.6 million as a charge to settlement costs and $25.0 million as additional purchase price for 3dfx. Please see Note 12The Trustee advised that he intended to object to the settlement. The conditional settlement never progressed substantially through the confirmation process.
On December 21, 2006, the Bankruptcy Court scheduled a trial for further information regardingone portion of the Trustee’s case against NVIDIA. On January 2, 2007, NVIDIA terminated the settlement agreement on grounds that the Bankruptcy Court had failed to proceed toward confirmation of the Creditors’ Committee’s plan. A non-jury trial began on March 21, 2007 on valuation issues in the Trustee's constructive fraudulent transfer claims against NVIDIA. Specifically, the Bankruptcy Court tried four questions: (1) what did 3dfx transfer to NVIDIA in the APA?; (2) of what was transferred, what qualifies as "property" subject to the Bankruptcy Court's avoidance powers under the Uniform Fraudulent Transfer Act and relevant bankruptcy code provisions?; (3) what is the fair market value of the "property" identified in answer to question (2)?; and (4) was the $70 million that NVIDIA paid "reasonably equivalent" to the fair market value of that property? The parties completed post-trial briefing on May 25, 2007. On April 30, 2008, the Bankruptcy Court issued its Memorandum Decision After Trial, in which it provided a detailed summary of the trial proceedings and the parties' contentions and evidence and concluded that "the creditors of 3dfx were not injured by the Transaction." This decision did not entirely dispose of the Trustee's action, however, as the Trustee's claims for successor liability and intentional fraudulent conveyance were still pending. On June 19, 2008, NVIDIA filed a motion for summary judgment to convert the Memorandum Decision After Trial to a final judgment. That motion was granted in its entirety and judgment was entered in NVIDIA’s favor on September 11, 2008. The Trustee filed a Notice of Appeal from that judgment on September 22, 2008, and on September 25, 2008, NVIDIA exercised its election to have the appeal heard by the United States District Court, where the appeal is pending.
While the conditional settlement reached in November 2005 never progressed through the confirmation process, the Trustee’s case still remains pending appeal. As such, we have not reversed the accrual of $30.6 million - $5.6 million as a charge to settlement costs and $25.0 million as additional purchase price for 3dfx – that we recorded during the three months ended October 30, 2005, pending resolution of the appeal of the Trustee’s case. We do not believe the resolution of this
litigation.matter will have a material impact on our results of operations or financial position.
The 3dfx asset purchase price of $95.0 million and $4.2 million of direct transaction costs were allocated based on fair values presented below.
| | | | | |
| | | Fair Market
Value | | Straight-Line Amortization
Period |
| | | (In thousands) | | (Years) |
Property and equipment | | $ | 2,433 | | 1-2 |
Trademarks | | | 11,310 | | 5 |
Goodwill | | | 85,418 | | — |
| | | | | |
Total | | $ | 99,161 | | |
| | | | | |
The final allocation of the purchase price of the 3dfx assets is contingent upon the amountoutcome of and circumstances surrounding additional consideration, if any, that we may pay relatedall of the 3dfx litigation. Please refer to Note 12 of these Notes to the 3dfx asset purchase.
Consolidated Financial Statements for further information regarding this litigation.
| | | Fair Market Value | | | Straight-Line Amortization Period | |
| | | (In thousands) | | | (Years) | |
| | | | | | | | |
| | | | | | | | |
| | | | | | | | |
| | | | | | | | |
NVIDIA CORPORATION AND SUBSIDIARIES
NOTES TO THE CONSOLIDATED FINANCIAL STATEMENTS
(Continued)
Note 6 – Business Combinations
On February 10, 2008, we acquired Ageia Technologies, Inc., or Ageia, an industry leader in gaming physics technology. The combination of the graphics processing unit, or GPU, and physics engine brands is expected to enhance the visual experience of the gaming world. The aggregate purchase price consisted of total consideration of approximately $29.7 million.
On November 30, 2007, we completed our acquisition of Mental Images, Inc., or Mental Images, an industry leader in photorealistic rendering technology. The aggregate purchase price consisted of total consideration of approximately $88.3 million. The total consideration also includes approximately $7.8 million which reflects an initial investment we made in Mental Images in prior periods and $5.6 million primarily towards guaranteed payments subsequent to completion of our acquisition.
We allocated the purchase price of each of these acquisitions to tangible assets, liabilities and identifiable intangible assets acquired, as well as IPR&D, if identified, based on their estimated fair values. The excess of purchase price over the aggregate fair values was recorded as goodwill. The fair value assigned to identifiable intangible assets acquired was based on estimates and assumptions made by management. Purchased intangibles are amortized on a straight-line basis over their respective useful lives.
As of January 25, 2009, the estimated fair values of the purchase price allocated to assets we acquired and liabilities we assumed on the respective acquisition dates were as follows:
| | | Mental Images | | Ageia | |
| Fair Market Values | | (In thousands) | |
Cash and cash equivalents | | | | | | | |
| | | | | | | |
| | | | | | | |
Prepaid and other current assets | | | | | | | |
| | | | | | | |
In-process research and development | | | | | | | |
| | | | | | | |
| | | | | | | |
| | | | | | | |
| | | | | | | |
| | | | | | | |
| | | | | | | |
| | | | | | | |
| | | | | | | |
Acquisition related costs | | | | | | | |
| | | | | | | |
Total liabilities assumed | | | | | | | |
Purchase price allocation | | | | | | | |
NVIDIA CORPORATION AND SUBSIDIARIES
NOTES TO THE CONSOLIDATED FINANCIAL STATEMENTS
(Continued)
| | | Mental Images | | | Ageia | |
| | (Straight-line depreciation/amortization period) |
| | | | | | | |
| | | | | | | |
| | | | | | | |
| | | | | | | |
| | | | | | | |
| | | | | | | |
The amount of the IPR&D represents the value assigned to research and development projects of Mental Images that had commenced but had not yet reached technological feasibility at the time of the acquisition and for which we had no alternative future use. In accordance with Statement of Financial Accounting Standards No. 2, or SFAS No. 2, Accounting for Research and Development Costs, as clarified by FASB issued Interpretation No. 4, or FIN 4, Applicability of FASB Statement No. 2 to Business Combinations Accounted for by the Purchase Method an interpretation of FASB Statement No. 2, amounts assigned to IPR&D meeting the above-stated criteria were charged to research and development expenses as part of the allocation of the purchase price.
The pro forma results of operations for our acquisitions during fiscal years 2009 and 2008 have not been presented because the effects of the acquisitions, individually or in the aggregate, were not material to our results.
Note 7 -
(Continued)Note 5 - Goodwill
The carrying amount of goodwill is as follows:
| | | | | | | | | |
| | | January 29,
2006 | | January 30,
2005 | | January 25,
2004 |
| | | (In thousands) |
3dfx | | $ | 75,326 | | $ | 50,326 | | $ | 50,326 |
MediaQ | | | 52,913 | | | 52,913 | | | 53,695 |
Other | | | 17,078 | | | 4,868 | | | 4,888 |
| | | | | | | | | |
Total goodwill | | $ | 145,317 | | $ | 108,107 | | $ | 108,909 |
| | | | | | | | | |
| | | January 25, 2009 | | | January 27, 2008 | |
| | | (In thousands) | |
| | | | | | | | |
| | | | | | | | |
| | | | | | | | |
| | | | | | | | |
| | | | | | | | |
| | | | | | | | |
| | | | | | | | |
| | | | | | | | |
| | | | | | | | |
During fiscal year 2009, goodwill increased by $15.8 million, primarily due to $19.2 million of goodwill associated with our acquisition of Ageia on February 10, 2008. This increase in goodwill was offset by a decrease of $3.8 million for Mental Images related to the reassessment of estimates made during the preliminary purchase price allocation.
Goodwill is subject to our annual impairment test during the fourth quarter of our fiscal year, or earlier if indicators of potential impairment exist, using a fair value-based approach. We completed our most recent annual impairment test during the fourth quarter of fiscal
2006, we recorded $12.2 million as goodwill for the acquisition of a small international company. The acquisitionyear 2009 and concluded that there was
accounted for under the purchase method of accounting and closed on December 30, 2005. During the third quarter of fiscal 2006, we recorded $25.0 million as goodwill related to the purchase of certain assets of 3dfx. Please refer to Note 4 of the Notes to Consolidated Financial Statements for further information. In fiscal 2005, the amount allocated to MediaQ goodwill was adjusted to $52,913 as a result of additional information that became available. This information was primarily related to liabilities that were less than originally estimated at the time of acquisition.During fiscal 2005, in conjunction with the reorganization of our business reporting units, we reassigned goodwill to our reporting units using a relative fair value allocation approach.no impairment. In computing fair value of our reporting units, we use estimates of future revenues, costs and cash flows from such units. This assessment is based upon a discounted cash flow analysis and analysis of our market capitalization. The estimate of cash flow is based upon, among other things, certain assumptions about expected future operating performance such as revenue growth rates and operating margins used to calculate projected future cash flows, risk-adjusted discount rates, future economic and market conditions, and determination of appropriate market comparables. Our estimates of discounted cash flows may differ from actual cash flows due to, among other things, economic conditions, changes to our business model or changes in operating performance. Additionally, certain estimates of discounted cash flows involve businesses with limited financial history and developing revenue models, which increase the risk of differences between the projected and actual performance. Significant differences between these estimates and actual cash flows could materially affect our future financial results. These factors increase the risk of differences between projected and actual performance that could impact future estimates of fair value of all reporting units. In addition, determining the number of reporting units and the fair value of a reporting unit requires us to make judgments and involves the use of significant estimates and assumptions. We also make judgments and assumptions in allocating assets and liabilities to each of our reporting units. We base our fair value estimates on assumptions we believe to be reasonable but that are unpredictable and inherently uncertain. The long-term financial forecast represents the best estimate that we have at this time and we believe that its underlying assumptions are reasonable. However, actual performance in the near-term and longer-term could be materially different from these forecasts, which could impact future estimates of fair value of our reporting units and may result in a charge to earnings in future periods due to the potential for a write-down of goodwill in connection with such tests.
NVIDIA CORPORATION AND SUBSIDIARIES
NOTES TO THE CONSOLIDATED FINANCIAL STATEMENTS
(Continued)
The amount of goodwill allocated to our GPU,
PSB, MCP
Handheld GPU, Consumer Electronics, and
All OtherCPB segments as of January
29, 2006,25, 2009, was
$99.3$86.9 million,
$15.1$95.1 million,
$12.7 million, $11.9$46.2 million and
$6.3$141.6 million, respectively. As of January 27, 2008, the amount of goodwill allocated to our GPU, PSB, MCP and CPB segments, was $67.8 million, $99.0 million, $46.3 million and $141.0 million, respectively. Please refer to Note 16 of
thethese Notes to
the Consolidated Financial Statements for further segment information.
Note
68 - - Amortizable Intangible Assets
We are currently amortizing our intangible assets with definitive lives over periods ranging from 1 to 5 years on a straight-line basis.
The components of our amortizable intangible assets are as follows:
| | | | | | | | | | | | | | | | | | | | |
| | | January 29, 2006 | | January 30, 2005 |
| | | Gross
Carrying
Amount | | Accumulated
Amortization | | | Net Carrying
Amount | | Gross
Carrying
Amount | | Accumulated
Amortization | | | Net Carrying
Amount |
| | | (In thousands) |
Technology licenses | | $ | 21,586 | | $ | (13,595 | ) | | $ | 7,991 | | $ | 17,236 | | $ | (9,841 | ) | | $ | 7,395 |
Patents | | | 23,750 | | | (19,911 | ) | | | 3,839 | | | 23,260 | | | (15,400 | ) | | | 7,860 |
Acquired intellectual property | | | 27,086 | | | (24,516 | ) | | | 2,570 | | | 27,086 | | | (18,578 | ) | | | 8,508 |
Trademarks | | | 11,310 | | | (10,807 | ) | | | 503 | | | 11,310 | | | (8,544 | ) | | | 2,766 |
Other | | | 1,494 | | | (976 | ) | | | 518 | | | 1,494 | | | (509 | ) | | | 985 |
| | | | | | | | | | | | | | | | | | | | |
Total intangible assets | | $ | 85,226 | | $ | (69,805 | ) | | $ | 15,421 | | $ | 80,386 | | $ | (52,872 | ) | | $ | 27,514 |
| | | | | | | | | | | | | | | | | | | | |
| | January 25, 2009 | | January 27, 2008 |
| | Gross Carrying Amount | | | Accumulated Amortization | | | Net Carrying Amount | | Weighted Average Useful Life | | Gross Carrying Amount | | Accumulated Amortization | | Net Carrying Amount | | Weighted Average Useful Life |
| | | | | | | | | |
| | | | | | | | | | | | | | | | | | | | | | | |
Acquired intellectual property | | | | | | | | | | | | | | | | | | | | | | | |
| | | | | | | | | | | | | | | | | | | | | | | |
| | | | | | | | | | | | | | | | | | | | | | | |
| | | | | | | | | | | | | | | | | | | | | | | |
The increase in the gross carrying amount of technology licenses as of January 25, 2009 when compared to January 27, 2008 is primarily related to approximately $21.8 million of net cash outflows during fiscal year 2009 under a confidential patent licensing arrangement that we originally entered into during fiscal year 2007 and $25.0 million towards the purchase of a non-exclusive license related to advanced power management and other computing technologies that we entered into during fiscal year 2009. These increases were offset by amortization for fiscal year 2009. Additionally, the increase in the net carrying value of acquired intellectual property is primarily related to the intangible assets that resulted from our acquisition of Ageia during fiscal year 2009, offset by amortization for fiscal year 2009. Please refer to Note 6 of these Notes to the Consolidated Financial Statements for further information. During fiscal year 2009, the increase in the gross carrying amount of the intangible assets was offset by the write-off of fully amortized intangible assets that are no longer in use.
Amortization expense associated with intangible assets for fiscal
2006, 2005years 2009, 2008 and
20042007 was
$16.9$32.6 million,
$19.7$24.5 million and
$16.2$19.8 million, respectively. Future amortization expense for the net carrying amount of intangible assets at January
29, 200625, 2009 is estimated to be,
$10.5$30.9 million in fiscal
2007, $4.3year 2010, $27.2 million in fiscal
2008, and $0.6year 2011, $24.6 million in fiscal
2009year 2012, $18.6 million in fiscal year 2013, $14.1million in fiscal year 2014 and
thereafter.$31.7 million in fiscal years subsequent to fiscal year 2014.
NVIDIA CORPORATION AND SUBSIDIARIES NOTES TO THE CONSOLIDATED FINANCIAL STATEMENTS -
79 - - Marketable SecuritiesWe account for our investment instruments in accordance with Statement of Financial Accounting Standards No. 115, or SFAS No. 115,Accounting for Certain Investments in Debt and Equity Securities. All of our cash equivalents and marketable securities are treated as “available-for-sale” under SFAS No. 115.
Cash equivalents consistOur investment policy requires the purchase of
financial instruments which are readily convertible into cashtop-tier investment grade securities, the diversification of asset type and
have original maturitiescertain limits on our portfolio duration, as specified in our investment policy guidelines. These guidelines also limit the amount of
three monthscredit exposure to any one issue, issuer or
less at the timetype of
acquisition. Marketable securities consist primarily of highly liquid investments with a maturity of greater than three months when purchased and some equity investments. We classify our marketable securities at the date of acquisition in the available-for-sale category as our intention is to convert them into cash for operations. These securities are reported at fair value with the related unrealized gains and losses included in accumulated other comprehensive income (loss), a component of stockholders’ equity, net of tax. Realized gains and losses on the sale of marketable securities are determined using the specific-identification method. Net realized losses for fiscal 2006 and 2005 were $2.8 million and $0.4 million, respectively. Net realized gains for fiscal 2004 were $2.9 million.instrument. The following is a summary of cash equivalents and marketable securities at January 29, 200625, 2009 and January 30, 2005:
| | | | | | | | | | | | | |
| | | January 29, 2006 |
| | | Amortized
Cost | | Unrealized
Gain | | Unrealized
(Loss) | | | Estimated
Fair Value |
| | | (In thousands) |
Asset-backed securities | | $ | 224,649 | | $ | 1 | | $ | (983 | ) | | $ | 223,667 |
Commercial paper | | | 138,091 | | | 13 | | | (7 | ) | | | 138,097 |
Obligations of the United States government & its agencies | | | 72,753 | | | 8 | | | (834 | ) | | | 71,927 |
United States corporate notes, bonds and obligations | | | 179,930 | | | 5 | | | (1,467 | ) | | | 178,468 |
Money market | | | 256,593 | | | — | | | — | | | | 256,593 |
| | | | | | | | | | | | | |
Total | | $ | 872,016 | | $ | 27 | | $ | (3,291 | ) | | $ | 868,752 |
| | | | | | | | | | | | | |
Classified as: | | | | | | | | | | | | | |
Cash equivalents | | | | | | | | | | | | $ | 470,334 |
Marketable securities | | | | | | | | | | | | | 398,418 |
| | | | | | | | | | | | | |
Total | | | | | | | | | | | | $ | 868,752 |
| | | | | | | | | | | | | |
27, 2008:
| | | January 25, 2009 | |
| | | Amortized Cost | | | Unrealized Gain | | | Unrealized Loss | | | Estimated Fair Value | |
| | | (In thousands) | |
Debt securities of United States government agencies | | | | | | | | | | | | | | | | |
Corporate debt securities | | | | | | | | | | | | | | | | |
Mortgage backed securities issued by United States government-sponsored enterprises | | | | | | | | | | | | | | | | |
| | | | | | | | | | | | | | | | |
| | | | | | | | | | | | | | | | |
Debt securities issued by United States Treasury | | | | | | | | | | | | | | | | |
| | | | | | | | | | | | | | | | |
| | | | | | | | | | | | | | | | |
| | | | | | | | | | | | | | | | |
| | | | | | | | | | | | | | | | |
| | | | | | | | | | | | | | | | |
| | | | | | | | | | | | | | | | |
| | January 27, 2008 |
| | Amortized Cost | | | Unrealized Gain | | | Unrealized Loss | | | Estimated Fair Value |
| | (In thousands) |
| | $ | 513,887 | | | $ | 31 | | $ | (2 | ) | | $ | 513,916 | |
Debt securities of United States government agencies | | | 363,434 | | | | 4,365 | | | (69 | ) | | | 367,730 | |
Corporate debt securities | | | 361,452 | | | | 2,844 | | | (281 | ) | | | 364,015 | |
| | | 218,055 | | | | - | | | - | | | | 218,055 | |
| | | 110,287 | | | | 1,232 | | | (11 | ) | | | 111,508 | |
Mortgage backed securities issued by United States government-sponsored enterprises | | | 69,620 | | | | 769 | | | (5 | ) | | | 70,384 | |
Debt securities issued by United States Treasury | | | 29,327 | | | | 256 | | | - | | | | 29,583 | |
| | | 2,491 | | | | 1,613 | | | - | | | | 4,104 | |
| | $ | 1,668,553 | | | $ | 11,110 | | $ | (368 | ) | | $ | 1,679,295 | |
| | | | | | | | | | | | | | | |
| | | | | | | | | | | | | $ | 596,786 | |
| | | | | | | | | | | | | | 1,082,509 | |
| | | | | | | | | | | | | $ | 1,679,295 | |
NVIDIA CORPORATION AND SUBSIDIARIES
NOTES TO THE CONSOLIDATED FINANCIAL STATEMENTS -
(Continued)
| | | | | | | | | | | | | |
| | | January 30, 2005 |
| | | Amortized
Cost | | Unrealized
Gain | | Unrealized
(Loss) | | | Estimated
Fair Value |
| | | (In thousands) |
Publicly traded equity securities | | $ | 687 | | $ | 220 | | $ | — | | | $ | 907 |
Asset-backed securities | | | 177,771 | | | 1 | | | (1,786 | ) | | | 175,986 |
Commercial paper | | | 7,854 | | | — | | | — | | | | 7,854 |
Obligations of the United States government & its agencies | | | 104,768 | | | — | | | (895 | ) | | | 103,873 |
United States corporate notes, bonds and obligations | | | 182,688 | | | 6 | | | (1,874 | ) | | | 180,820 |
Money market | | | 164,377 | | | — | | | — | | | | 164,377 |
| | | | | | | | | | | | | |
Total | | $ | 638,145 | | $ | 227 | | $ | (4,555 | ) | | $ | 633,817 |
| | | | | | | | | | | | | |
Classified as: | | | | | | | | | | | | | |
Cash equivalents | | | | | | | | | | | | $ | 172,284 |
Marketable securities | | | | | | | | | | | | | 461,533 |
| | | | | | | | | | | | | |
Total | | | | | | | | | | | | $ | 633,817 |
| | | | | | | | | | | | | |
The following table provides the breakdown of the investments with unrealized losses at January
29, 2006: | | | | | | | | | | | | | | | | | | | | | |
| | | Less than 12 months | | | 12 months or greater | | | Total | |
| | | Fair Value | | Gross
Unrealized
Losses | | | Fair Value | | Gross
Unrealized
Losses | | | Fair Value | | Gross
Unrealized
Losses | |
| | | (In thousands) | |
Asset-backed securities | | $ | 78,286 | | $ | (334 | ) | | $ | 48,293 | | $ | (649 | ) | | $ | 126,579 | | $ | (983 | ) |
Commercial paper | | | 19,600 | | | (7 | ) | | | — | | | — | | | | 19,600 | | | (7 | ) |
Obligations of the United States government & its agencies | | | 39,032 | | | (434 | ) | | | 22,851 | | | (400 | ) | | | 61,883 | | | (834 | ) |
United States corporate notes, bonds and obligations | | | 139,842 | | | (485 | ) | | | 64,593 | | | (982 | ) | | | 204,435 | | | (1,467 | ) |
Money market | | | — | | | — | | | | — | | | — | | | | — | | | — | |
| | | | | | | | | | | | | | | | | | | | | |
Total | | $ | 276,760 | | $ | (1,260 | ) | | $ | 135,737 | | $ | (2,031 | ) | | $ | 412,497 | | $ | (3,291 | ) |
| | | | | | | | | | | | | | | | | | | | | |
25, 2009:
| | | Less than 12 months | | | 12 months or greater | | | Total | |
| | | Fair Value | | | Gross Unrealized Losses | | | Fair Value | | | Gross Unrealized Losses | | | Fair Value | | | Gross Unrealized Losses | |
| | | (In thousands) | |
Corporate debt securities | | | | | | | | | | | | | | | | | | | | | | | | |
Mortgage backed securities issued by United States government-sponsored enterprises | | | | | | | | | | | | | | | | | | | | | | | | |
Debt securities of United States government agencies | | | | | | | | | | | | | | | | | | | | | | | | |
| | | | | | | | | | | | | | | | | | | | | | | | |
| | | | | | | | | | | | | | | | | | | | | | | | |
We performed an impairment review of our investment portfolio as of January 25, 2009. Factors consider general market conditions, the duration and extent to which fair value is below cost, and our intent and ability to hold an investment for a sufficient period of time to allow for recovery in value. We also consider specific adverse conditions related to the financial health of and business outlook for an investee, including industry and sector performance, changes in technology, operational and financing cash flow factors, and changes in an investee’s credit rating. Investments that we identify as having an indicator of impairment are subject to further analysis to determine if the investment was other than temporarily impaired.
As of January 29, 2006,25, 2009 we had 143fifty seven investments that were in an unrealized loss position with an average unrealized loss duration of less than one year. The gross unrealized losses related to fixed income securities were due to changes in interest rates. We have determined that the gross unrealized losses on investment securities at January 29, 200625, 2009 are temporary in nature. We review our investments to identify and evaluate investments thatCurrently, we have indications of possible impairment. Factors considered in determining whether a loss is temporary include the length of time and extent to which fair value has been less than the cost basis, the financial condition and near-term prospects of the investee, and our intent and ability to hold our investments with impairment indicators until maturity. Based on our quarterly impairment review and having considered the guidance in Statement of Financial Accounting Standards Staff Position No. 115-1, or FSP No. 115-1, A Guide to the Implementation of Statement 115 on Accounting for Certain Investments in Debt and Equity Securities, we recorded other than temporary impairment charges of $9.9 million during the year ended January 25, 2009. These charges include $5.6 million related to what we believe is an other than temporary impairment of our investment in the money market funds held by the Reserve International Liquidity Fund, Ltd., or International Reserve Fund; $2.5 million related to a decline in the value of publicly traded equity securities and $1.8 million related to debt securities held by us that were issued by companies that have filed for a periodbankruptcy as of time sufficientJanuary 25, 2009. Please refer to allowNote 17 of these Notes to the Consolidated Financial Statements for any anticipated recovery in market value. Our investment policy requiresfurther details. We concluded that our investments were appropriately valued and that, except for the purchase of top-tier investment grade securities, the diversification of asset type and certain limits$9.9 million impairment charges recognized during fiscal year 2009, no other than temporary impairment charges were necessary on our portfolio duration.of available for sale investments as of January 25, 2009.
Net realized gains (losses), excluding any impairment charges, for fiscal year 2009 was $2.1 million. Net realized gains (losses) for fiscal years 2008 and 2007 were not material. As of January 25, 2009, we had a net unrealized gain of $4.4 million, which was comprised of gross unrealized gains of $7.8 million, offset by $3.4 million of gross unrealized losses. As of January 27, 2008, we had a net unrealized gain of $10.7 million, which was comprised of gross unrealized gains of $11.1 million, offset by $0.4 million of gross unrealized losses.
NVIDIA CORPORATION AND SUBSIDIARIES
NOTES TO THE CONSOLIDATED FINANCIAL STATEMENTS
(Continued)
The amortized cost and estimated fair value of cash equivalents and marketable securities
which are primarily debt instruments, are classified as available-for-sale at January
29, 200625, 2009 and January
30, 200527, 2008 and are shown below by contractual
maturity are shown below.All of our marketable securities are debt instruments with the exception of $0.9 million of publicly traded equity securities at January 30, 2005.
NVIDIA CORPORATION AND SUBSIDIARIES
NOTES TO CONSOLIDATED FINANCIAL STATEMENTS - (Continued)
| | | | | | | | | | | | |
| | | January 29, 2006 | | January 30, 2005 |
| | | Amortized
Cost | | Estimated
Fair Value | | Amortized
Cost | | Estimated
Fair Value |
| | | (In thousands) |
Less than one year | | $ | 491,259 | | $ | 491,246 | | $ | 198,242 | | $ | 197,844 |
Due in 1 - 5 years | | | 364,065 | | | 361,047 | | | 416,085 | | | 412,141 |
Due in 6-7 years | | | 16,692 | | | 16,459 | | | 23,132 | | | 22,925 |
| | | | | | | | | | | | |
Total | | $ | 872,016 | | $ | 868,752 | | $ | 637,459 | | $ | 632,910 |
| | | | | | | | | | | | |
| | | January 25, 2009 | | | January 27, 2008 | |
| | | Amortized Cost | | | Estimated Fair Value | | | Amortized Cost | | | Estimated Fair Value | |
| | | (In thousands) | |
| | | | | | | | | | | | | | | | |
| | | | | | | | | | | | | | | | |
| | | | | | | | | | | | | | | | |
Mortgage-backed securities issued by government-sponsored enterprises not due at a single maturity date | | | | | | | | | | | | | | | | |
| | | | | | | | | | | | | | | | |
Note
810 - Balance Sheet Components
Certain balance sheet components are as follows:
| | | | | | |
| | | January 29,
2006 | | January 30,
2005 |
| | | (As Restated) | | (As Restated) |
| | | (In thousands) |
Inventories: | | | | | | |
Raw materials | | $ | 25,743 | | $ | 23,225 |
Work in-process | | | 107,847 | | | 130,211 |
Finished goods | | | 121,280 | | | 162,350 |
| | | | | | |
Total inventories | | $ | 254,870 | | $ | 315,786 |
| | | | | | |
| | | January 25, 2009 | | | January 27, 2008 | |
| Inventories: | | (In thousands) | |
| | | | | | | | |
| | | | | | | | |
| | | | | | | | |
| | | | | | | | |
| | | | January 25, 2009 | | | January 27, 2008 | | | Estimated Useful Life |
| | | (In thousands) | | (Years) |
| Property and Equipment: | | | | | | | |
| | | | | | | | | |
| | | | | | | | | |
| | | | | | | | | |
| | | | | | | | | |
| | | | | | | | | |
| | | | | | | | | |
Office furniture and equipment | | | | | | | | | |
| | | | | | | | | |
| | | | | | | | | |
| | | | | | | | | | |
Accumulated depreciation and amortization | | | | | | | | | |
Total property and equipment, net | | | | | | | | | |
The
significant decreaseincrease in
work-in-processproperty and
finished goodsequipment, net, at January 25, 2009 compared to January 27, 2008, includes the purchase of a property that is comprised of approximately 25 acres of land and ten commercial buildings in Santa Clara, California, for approximately $194.8 million. During fiscal year 2009, the increase in the gross carrying amount of the property and equipment was
the result of significant reductions in older products, offset by
an increasethe write-off of fully depreciated assets that were no longer in
new products. | | | | | | |
| | | January 29,
2006 | | January 30,
2005 |
| | | (In thousands) |
Deposits and other assets: | | | | | | |
Investments in non-affiliates | | $ | 11,684 | | $ | 2,000 |
Long-term prepayments | | | 7,504 | | | 2,594 |
Other | | | 8,289 | | | 4,440 |
| | | | | | |
Total deposits and other assets | | $ | 27,477 | | $ | 9,034 |
| | | | | | |
The $9.7 million increaseuse.
(A) Land is a non-depreciable asset.
(B) Leasehold improvements are amortized based on the lesser of either the asset’s estimated useful life or the remaining lease term.
(C) Capital leases are amortized based on the lesser of either the asset’s estimated useful life or the remaining lease term.
(D) Construction in
investmentsprocess represents assets that are not in
non-affiliates is related to cost method investments in two private companies. | | | | | | | | | | |
| | | January 29,
2006 | | | January 30,
2005 | | | Estimated
Useful Life |
| | | (In thousands) | | | (Years) |
Property and Equipment: | | | | | | | | | | |
Software | | $ | 153,618 | | | $ | 125,310 | | | 3 - 5 |
Test equipment | | | 88,468 | | | | 86,883 | | | 3 |
Computer equipment | | | 106,061 | | | | 82,428 | | | 3 |
Leasehold improvements | | | 88,376 | | | | 79,160 | | | (A) |
Construction in process | | | 2,260 | | | | 3,264 | | | (B) |
Office furniture and equipment | | | 21,618 | | | | 18,777 | | | 5 |
| | | | | | | | | | |
| | | 460,401 | | | | 395,822 | | | |
Accumulated depreciation and amortization | | | (282,249 | ) | | | (216,867 | ) | | |
| | | | | | | | | | |
Total property and equipment, net | | $ | 178,152 | | | $ | 178,955 | | | |
| | | | | | | | | | |
| (A) | Leasehold improvements are amortized based on the lesser of either the asset’s estimated useful life or the remaining lease term. |
| (B) | Construction in process represents assets that had not been in service as of the balance sheet date. |
NVIDIA CORPORATION AND SUBSIDIARIES
NOTES TO CONSOLIDATED FINANCIAL STATEMENTS - (Continued)
service as of the balance sheet date.
Depreciation expense for fiscal 2006, 2005,years 2009, 2008 and 20042007 was $76.4$152.4 million, $71.3$111.0 million and $59.3$88.0 million, respectively. Assets recorded under capital leases included
NVIDIA CORPORATION AND SUBSIDIARIES
NOTES TO THE CONSOLIDATED FINANCIAL STATEMENTS
(Continued)
| | | January 25, 2009 | | | January 27, 2008 | |
| Prepaid Expenses and Other | | (In thousands) | |
| | | | | | | | |
| | | | | | | | |
| | | | | | | | |
| | | | | | | | |
| | | | | | | | |
Total prepaid expenses and other | | | | | | | | |
| | | January 25, 2009 | | | January 27, 2008 | |
| Deposits and Other Assets | | (In thousands) | |
Prepaid maintenance, long term | | | | | | | | |
| | | | | | | | |
Investment in non-affiliates | | | | | | | | |
| | | | | | | | |
Total deposits and other assets | | | | | | | | |
| | | January 25, 2009 | | | January 27, 2008 | |
| Accrued Liabilities: | | (In thousands) | |
Accrued customer programs (1) | | | | | | | | |
| | | | | | | | |
Accrued payroll and related expenses | | | | | | | | |
Accrued legal settlement (3) | | | | | | | | |
| | | | | | | | |
| | | | | | | | |
| | | | | | | | |
Total accrued liabilities and other | | | | | | | | |
The decrease in propertyaccrued payroll and equipment were $17.1 million and $19.3 millionrelated expenses as of as of January 29, 200625, 2009 when compared to January 27, 2008 primarily relates to decreases in accrued bonus and January 30, 2005, respectively. Related accumulated amortization was $17.1 millionvariable compensation accruals in fiscal year 2009.
(1) Please refer to Note 1 of these Notes to these Consolidated Financial Statements for discussion regarding the nature of accrued customer programs and
$17.8 million as of January 29, 2006 and January 30, 2005, respectively. Amortization expense for fiscal 2006, 2005, and 2004their accounting treatment related to
capital leases was $1.2 million, $3.8 million,our revenue recognition policies and
$5.4 million, respectively. | | | | | | |
| | | January 29,
2006 | | January 30,
2005 |
| | | (In thousands) |
Accrued Liabilities: | | | | | | |
Accrued customer programs | | $ | 90,056 | | $ | 83,013 |
Deferred revenue | | | 217 | | | 11,500 |
Customer advances | | | 1,556 | | | 1,457 |
Taxes payable | | | 58,355 | | | 28,826 |
Accrued payroll and related expenses | | | 53,080 | | | 37,016 |
Deferred rent | | | 11,879 | | | 10,844 |
Accrued legal settlement | | | 30,600 | | | — |
Other | | | 13,521 | | | 9,421 |
| | | | | | |
Total accrued liabilities | | $ | 259,264 | | $ | 182,077 |
| | | | | | |
| | |
| | | January 29,
2006 | | January 30,
2005 |
| | | (As Restated) | | (As Restated) |
| | | (In thousands) |
Other Long-term Liabilities: | | | | | | |
Asset retirement obligation | | $ | 6,440 | | $ | 4,483 |
Other long-term liabilities | | | 13,596 | | | 16,821 |
| | | | | | |
Total other long-term liabilities | | $ | 20,036 | | $ | 21,304 |
| | | | | | |
estimates.
(2) Please refer to Note 911 of these Notes to these Consolidated Financial Statements for discussion regarding the warranty accrual.
(3) Please refer to Note 12 of these Notes to these Consolidated Financial Statements for discussion regarding the 3dfx litigation.
| | | January 25, 2009 | | | January 27, 2008 | |
| Other Long Term Liabilities: | | (In thousands) | |
Deferred income tax liability | | | | | | | | |
| | | | | | | | |
Asset retirement obligations | | | | | | | | |
| | | | | | | | |
Total other long-term liabilities | | | | | | | | |
NVIDIA CORPORATION AND SUBSIDIARIES
NOTES TO THE CONSOLIDATED FINANCIAL STATEMENTS
(Continued)
FASB Interpretation No. 45, or FIN 45,Guarantor’s Accounting and Disclosure Requirements for Guarantees, Including Indirect Guarantees of Indebtedness of Others, requires that upon issuance of a guarantee, the guarantor must recognize a liability for the fair value of the obligation it assumes under that guarantee. In addition, FIN 45 requires disclosures about the guarantees that an entity has issued, including a tabular reconciliation of the changes of the entity’s product warranty liabilities.
Product Defect
Our products are complex and may contain defects or experience failures due to any number of issues in design, fabrication, packaging, materials and/or use within a system. If any of our products or technologies contains a defect, compatibility issue or other error, we may have to invest additional research and development efforts to find and correct the issue. Such efforts could divert our management’s and engineers’ attention from the development of new products and technologies and could increase our operating costs and reduce our gross margin. In addition, an error or defect in new products or releases or related software drivers after commencement of commercial shipments could result in failure to achieve market acceptance or loss of design wins. Also, we may be required to reimburse customers, including for customers’ costs to repair or replace the products in the field. A product recall or a significant number of product returns could be expensive, damage our reputation and could result in the shifting of business to our competitors. Costs associated with correcting defects, errors, bugs or other issues could be significant and could materially harm our financial results.
In July 2008, we recorded a $196.0 million charge against cost of revenue to cover anticipated customer warranty, repair, return, replacement and other associated costs arising from a weak die/packaging material set in certain versions of our previous generation media and communications processor, or MCP, and GPU products used in notebook systems. All of our newly manufactured products and all of our products that are currently shipping in volume have a different material set that we believe is more robust.
The previous generation MCP and GPU products that are impacted were included in a number of notebook products that were shipped and sold in significant quantities. Certain notebook configurations of these MCP and GPU products are failing in the field at higher than normal rates. While we have not been able to determine a root cause for these failures, testing suggests a weak material set of die/package combination, system thermal management designs, and customer use patterns are contributing factors. We have worked with our customers to develop and have made available for download a software driver to cause the system fan to begin operation at the powering up of the system and reduce the thermal stress on these chips. We have also recommended to our customers that they consider changing the thermal management of the MCP and GPU products in their notebook system designs. We intend to fully support our customers in their repair and replacement of these impacted MCP and GPU products that fail, and their other efforts to mitigate the consequences of these failures.
We continue to engage in discussions with our supply chain regarding reimbursement to us for some or all of the costs we have incurred and may incur in the future relating to the weak material set. We also continue to seek to access our insurance coverage, which provided us with $8.0 million in related reimbursement during fiscal year 2009. However, there can be no assurance that we will recover any additional reimbursement. We continue to not see any abnormal failure rates in any systems using NVIDIA products other than certain notebook configurations. However, we are continuing to test and otherwise investigate other products. There can be no assurance that we will not discover defects in other MCP or GPU products.
In September, October and November 2008, several putative class action lawsuits were filed against us, asserting various claims related to the impacted MCP and GPU products. Please refer to Note 12 of these Notes to these Consolidated Financial Statements for further information regarding this litigation.
NVIDIA CORPORATION AND SUBSIDIARIES
NOTES TO THE CONSOLIDATED FINANCIAL STATEMENTS
(Continued)
Accrual for estimated product returns and product warranty liabilities
We record a reduction to revenue for estimated product returns at the time revenue is recognized primarily based on historical return rates.
The reductionsCost of revenue includes the estimated cost of product warranties that are calculated at the point of revenue recognition. Under limited circumstances, we may offer an extended limited warranty to
revenuecustomers for
certain products. Additionally, we accrue for known warranty and indemnification issues if a loss is probable and can be reasonably estimated. The estimated product returns
and estimated product warranty liabilities for fiscal
2006, 2005years 2009, 2008 and
20042007 are as follows:
| | | January 25, 2009 | | | January 27, 2008 | | | January 28, 2007 | |
| | (In thousands) | |
Balance at beginning of period | | | | | | | | | | | | |
| | | | | | | | | | | | |
| | | | | | | | | | | | |
Balance at end of period (3) | | | | | | | | | | | | |
NVIDIA CORPORATION AND SUBSIDIARIES(1) Includes $27.9 million, $25.5 million and $37.0 million, respectively, for fiscal years 2009, 2008 and 2007, towards allowance for sales returns estimated at the time revenue is recognized primarily based on historical return rates and is charged as a reduction to revenue.
(2) Includes $29.2 million, $21.3 million and $32.8 million, respectively, for fiscal years 2009, 2008 and 2007, written off against allowance for sales returns.
NOTES TO CONSOLIDATED FINANCIAL STATEMENTS - (Continued)(3) Includes $17.3 million, $18.7 million and $14.5 million, respectively, as of January 25, 2009, January 27, 2008 and January 28, 2007 relating to allowance for sales returns. | | | | | | | | | | | | | |
Description | | Balance at
Beginning
of Period | | Additions (1) | | Deductions (2) | | | Balance
at End of
Period |
| | | (In thousands) |
Year ended January 29, 2006 Allowance for sales returns | | $ | 11,687 | | $ | 35,127 | | $ | (36,575 | ) | | $ | 10,239 |
| | | | | | | | | | | | | |
Year ended January 30, 2005 Allowance for sales returns | | $ | 9,421 | | $ | 22,463 | | $ | (20,197 | ) | | $ | 11,687 |
| | | | | | | | | | | | | |
Year ended January 25, 2004 Allowance for sales returns | | $ | 13,228 | | $ | 23,796 | | $ | (27,603 | ) | | $ | 9,421 |
| | | | | | | | | | | | | |
(1) | Allowances for sales returns are charged as a reduction to revenue. |
(2) | Represents amounts written off against the allowance for sales returns. |
(4) Includes $196.0 million for fiscal year 2009 for incremental repair and replacement costs from a weak die/packaging material set, offset by $6.7 million for fiscal year 2009 related to the reimbursement of claims received from an insurance provider that were allocated to cost of revenue.
(5) Includes $43.6 million for fiscal year 2009 in deductions towards warranty accrual associated with incremental repair and replacement costs from a weak die/packaging material set.
In connection with certain agreements that we have executed in the past, we have at times provided indemnities to cover the indemnified party for matters such as tax, product and employee liabilities. We have also on occasion included intellectual property indemnification provisions in our technology related agreements with third parties. Maximum potential future payments cannot be estimated because many of these agreements do not have a maximum stated liability. As such, we have not recorded any liability in our consolidated financial statementsConsolidated Financial Statements for such indemnifications. FASB Interpretation No. 45, or FIN 45, Guarantor’s Accounting and Disclosure Requirements for Guarantees, Including Indirect Guarantees of Indebtedness of Others, requires that upon issuance of a guarantee, the guarantor must recognize a liability for the fair value of the obligation it assumes under that guarantee. In addition, FIN 45 requires disclosures about the guarantees that an entity has issued, including a tabular reconciliation of the changes of the entity’s product warranty liabilities.
Note 10 - Stockholders’ Equity
Stock Repurchase Program
On August 9, 2004 we announced that our Board of Directors, or the Board, had authorized a stock repurchase program to repurchase shares of our common stock, subject to certain specifications, up to an aggregate maximum amount of $300.0 million. As part of our share repurchase program, we have entered into and we may continue to enter into structured share repurchase transactions with financial institutions. These agreements generally require that we make an up-front payment in exchange for the right to receive a fixed number of shares of our common stock upon execution of the agreement, and a potential incremental number of shares of our common stock, within a pre-determined range, at the end of the term of the agreement. During the fourth quarter of fiscal 2006, we repurchased 1.3 million shares of our common stock for $50.0 million under a structured share repurchase transaction, which we recorded on the trade date of the transaction. Through the end of the fourth quarter of fiscal 2006, we have repurchased 8.5 million shares under our stock repurchase program for a total cost of $213.2 million. During the first quarter of fiscal 2007, we entered into a structured share repurchase transaction to repurchase shares of our common stock for $50.0 million that we expect to settle prior to the end of our first fiscal quarter.
On March 6, 2006, we announced that our Board of Directors had approved an increase in our existing stock repurchase program. We announced a $400 million increase to the original stock repurchase program we had announced in August 2004. As a result of this increase, the amount of common stock the Board of Directors has authorized to be repurchased has now been increased to a total of $700 million. The repurchases will be made from time to time in the open market, in privately negotiated transactions, or in structured stock repurchase transactions, in compliance with the Securities and Exchange Commission Rule 10b-18, subject to market conditions, applicable legal requirements, and other factors. The program does not obligate NVIDIA to acquire any particular amount of common stock and the program may be suspended at any time at our discretion.
NVIDIA CORPORATION AND SUBSIDIARIES
NOTES TO CONSOLIDATED FINANCIAL STATEMENTS - (Continued)
Convertible Preferred Stock
As of January 29, 2006, there were no shares of preferred stock outstanding.
2000 Nonstatutory Equity Incentive Plan
On August 1, 2000, our Board of Directors approved the 2000 Nonstatutory Equity Incentive Plan, or the 2000 Plan, to provide for the issuance of our common stock to employees and affiliates who are not directors, officers or 10% stockholders. The 2000 Plan provides for the issuance of nonstatutory stock options, stock bonuses and restricted stock purchase rights. Option grants issued under the 2000 plan generally expire in six to 10 years. The Compensation Committee appointed by the Board of Directors has the authority to amend the 2000 Plan and to determine the option term, exercise price and vesting period of each grant. Initial option grants generally vest ratably over a four-year period, with 25% becoming vested approximately one year from the date of grant and the remaining 75% vesting on a quarterly basis over the next three years. Subsequent option grants generally vest quarterly over a three-year period. There were a total of 21,939,202 shares authorized for issuance and 10,595,890 shares available for future issuance under the 2000 Plan as of January 29, 2006.
1998 Equity Incentive Plan
The Equity Incentive Plan, or the 1998 Plan, was adopted by our Board of Directors on February 17, 1998 and was approved by our stockholders on April 6, 1998 as an amendment and restatement of our then existing Equity Incentive Plan which had been adopted on May 21, 1993. The 1998 Plan provides for the issuance of our common stock to directors, employees and consultants. The 1998 Plan was subsequently amended on March 7, 2006. The 1998 Plan provides for the issuance of stock bonuses, restricted stock purchase rights, incentive stock options or nonstatutory stock options. There were a total of 110,094,385 shares authorized for issuance and 5,059,598 shares available for future issuance under the 1998 Plan as of January 29, 2006.
Pursuant to the 1998 Plan, the exercise price for incentive stock options is at least 100% of the fair market value on the date of grant or for employees owning in excess of 10% of the voting power of all classes of stock, 110% of the fair market value on the date of grant. For nonstatutory stock options, the exercise price is no less than 85% of the fair market value on the date of grant.
Option grants issued under the 1998 Plan generally expire in six to ten years. Vesting periods are determined by the Board of Directors or the Compensation Committee of the Board of Directors. Initial option grants made after February 10, 2004 under the 1998 Plan generally vest ratably each quarter over a three year period. Subsequent option grants are generally granted for performance and generally vest quarterly over a three year period.
1998 Non-Employee Directors’ Stock Option Plan
In February 1998, our Board of Directors adopted the 1998 Non-Employee Directors’ Stock Option Plan, or the Directors Plan, to provide for the automatic grant of non-qualified options to purchase shares of our common stock to our directors who are not employees or consultants of us or of an affiliate of us.
In July 2000, the Board of Directors amended the 1998 Plan to incorporate the automatic grant provisions of the Directors’ Plan into the 1998 Plan. Future automatic grants to non-employee directors will be made according to the terms of the Directors’ Plan, but will be made out of the 1998 Plan until such time as shares may become available for issuance under the amended Directors’ Plan. In May 2002, the Directors’ Plan was amended further to reduce the number of shares granted to our non-employee directors. The altered automatic grant provisions of the Directors’ Plan are also incorporated into the 1998 Plan. The terms of the amended Directors’ Plan are described below.
NVIDIA CORPORATION AND SUBSIDIARIES
NOTES TO CONSOLIDATED FINANCIAL STATEMENTS - (Continued)
Under the amended Directors Plan, each non-employee director who is elected or appointed to our Board of Directors for the first time is automatically granted an option to purchase 75,000 shares, which vests quarterly over a three-year period, or Initial Grant. Previously, such a director was entitled to a grant of 200,000 shares, vesting monthly over a four-year period.
Under the amended Directors Plan, on August 1, 2002, each non-employee director was automatically granted an option to purchase 75,000 shares, which will vest 33% on the first anniversary of the grant date, with the remaining 66% vesting quarterly over the second and third years after the date of grant, provided that the director has attended at least 75% of the meetings during the year following the date of the grant, or 2002 Grants. Previously, such a director was entitled to an annual grant of 80,000 shares, vesting 100% on the first anniversary of the date of the grant.
On August 1, 2003 and on each August 1 thereafter, each non-employee director will be automatically granted an option to purchase 25,000 shares, or Annual Grant. These Annual Grants will begin vesting on the second anniversary of the date of the grant and vest quarterly during the next year. The Annual Grants will be fully vested on the third anniversary of the date of the grant, provided that the director has attended at least 75% of the meetings during the year following the date of the grant.
On August 1, 2002 and each August 1 of each year thereafter, each non-employee director who is a member of a committee of the Board of Directors will automatically be granted an option to purchase 5,000 shares, or Committee Grant. The Committee Grants vest in full on the first anniversary of the date of the grant, provided that the director has attended at least 75% of the meetings during the year following the date of the grant. Previously, such a director was entitled to a grant of 20,000 shares, vesting in full on the first anniversary of the date of the grant. Directors who were members of two committees, Messrs. Cox, Gaither and Jones, waived their grant of an additional 5,000 shares for being a member of a second committee in fiscal 2004, 2005 and 2006.
If a non-employee director fails to attend at least 75% of the regularly scheduled meetings during the year following the grant of an option, rather than vesting as described previously, the 2002 Grants and Committee Grants will vest annually over four years following the date of grant at the rate of 10% per year for the first three years and 70% for the fourth year, and the Annual Grants will vest 30% upon the three-year anniversary of the grant date and 70% for the fourth year, such that in each case the entire option will become fully vested on the four-year anniversary of the date of the grant. For the 2002 Grants, Annual Grants and Committee Grants, if the person has not been serving on the Board of Directors or committee since a prior year’s annual meeting, the number of shares granted will be reduced pro rata for each full quarter prior to the date of grant during which such person did not serve in such capacity.
The Compensation Committee administers the amended Directors Plan. A total of 1,200,000 shares have been authorized and issued under the amended Directors Plan of which none is available for future issuance as of January 29, 2006. As described above, future grants to non-employee directors will be made out of the 1998 Plan.
Employee Stock Purchase Plan
In February 1998, our Board of Directors approved the 1998 Employee Stock Purchase Plan, or the Purchase Plan. In June 1999, the Purchase Plan was amended to increase the number of shares reserved for issuance automatically each year at the end of our fiscal year for the next 10 years (commencing at the end of fiscal 2000 and ending 10 years later in 2009) by an amount equal to 2% of the outstanding shares on each such date, including on an as-if-converted basis preferred stock and convertible notes, and outstanding options and warrants, calculated using the treasury stock method; provided that the maximum number of shares of common stock available for issuance from the Purchase Plan could not exceed 26,000,000 shares. There are a total of 26,000,000 shares authorized for issuance. At January 29, 2006, 7,531,781 shares have been issued under the Purchase Plan and 18,468,219 shares are available for future issuance.
NVIDIA CORPORATION AND SUBSIDIARIES
NOTES TO CONSOLIDATED FINANCIAL STATEMENTS - (Continued)
The Purchase Plan is intended to qualify as an “employee stock purchase plan” under Section 423 of the Internal Revenue Code. Under the Purchase Plan, the Board has authorized participation by eligible employees, including officers, in periodic offerings following the adoption of the Purchase Plan. Under the Purchase Plan, separate offering periods shall be no longer than 27 months. Under the current offering adopted pursuant to the Purchase Plan, each offering period is 24 months, which is divided into four purchase periods of 6 months.
Employees are eligible to participate if they are employed by us or an affiliate of us as designated by the Board. Employees who participate in an offering may have up to 10% of their earnings withheld pursuant to the Purchase Plan up to certain limitations and applied on specified dates determined by the Board to the purchase of shares of common stock. The Board may increase this percentage at its discretion, up to 15%. The price of common stock purchased under the Purchase Plan will be equal to the lower of the fair market value of the common stock on the commencement date of each offering period and the purchase date of each offering period at 85% at the fair market value of the common stock on the relevant purchase date. Employees may end their participation in the Purchase Plan at any time during the offering period, and participation ends automatically on termination of employment with us and in each case their contributions are refunded.
The following summarizes the transactions under the 1998 Plan, 2000 Plan and Directors Plan:
| | | | | | | | | |
| | | Options Available for
Grant | | | Options
Outstanding | | | Weighted
Average Exercise Price Per
Share |
Balances, January 26, 2003 | | 31,985,579 | | | 35,635,704 | | | $ | 12.93 |
Authorized | | 8,796,156 | | | — | | | | — |
Granted | | (12,680,144 | ) | | 12,675,144 | | | | 14.77 |
Exercised | | — | | | (4,688,703 | ) | | | 5.17 |
Cancelled | | 855,440 | | | (855,440 | ) | | | 19.26 |
| | | | | | | | | |
Balances, January 25, 2004 | | 28,957,031 | | | 42,766,705 | | | $ | 14.20 |
Authorized | | — | | | — | | | | — |
Granted | | (8,514,926 | ) | | 8,514,926 | | | | 23.48 |
Exercised | | — | | | (3,051,875 | ) | | | 8.29 |
Cancelled | | 2,069,599 | | | (2,069,599 | ) | | | 18.82 |
| | | | | | | | | |
Balances, January 30, 2005 | | 22,511,704 | | | 46,160,157 | | | $ | 16.10 |
Authorized | | — | | | — | | | | — |
Granted | | (8,208,893 | ) | | 8,208,893 | | | | 27.73 |
Exercised | | — | | | (9,037,133 | ) | | | 11.89 |
Cancelled | | 1,352,677 | | | (1,352,677 | ) | | | 20.57 |
| | | | | | | | | |
Balances, January 29, 2006 | | 15,655,488 | | | 43,979,240 | | | $ | 19.00 |
| | | | | | | | | |
NVIDIA CORPORATION AND SUBSIDIARIES
NOTES TO CONSOLIDATED FINANCIAL STATEMENTS - (Continued)
The following table summarizes information about stock options outstanding as of January 29, 2006:
| | | | | | | | | | | | |
| | | Options Outstanding | | Options Exercisable |
Range of Exercise Prices | | Number
Outstanding | | Weighted
Average
Remaining
Contractual Life | | Weighted
Average
Exercise
Price | | Number
Exercisable | | Weighted
Average
Exercise
Price |
$0.09 - 0.09 | | 2,000 | | 0.9 | | $ | 0.09 | | 2,000 | | $ | 0.09 |
0.33 - 0.33 | | 112,300 | | 1.6 | | $ | 0.33 | | 112,300 | | $ | 0.33 |
0.66 - 0.79 | | 327,710 | | 1.8 | | $ | 0.74 | | 327,710 | | $ | 0.74 |
1.38 - 1.93 | | 3,128,914 | | 2.2 | | $ | 1.75 | | 3,128,914 | | $ | 1.75 |
2.21 - 2.25 | | 170,250 | | 2.6 | | $ | 2.25 | | 170,250 | | $ | 2.25 |
4.09 - 5.88 | | 2,387,233 | | 3.5 | | $ | 4.73 | | 2,385,911 | | $ | 4.73 |
7.65 - 11.07 | | 3,673,508 | | 5.0 | | $ | 9.54 | | 3,251,830 | | $ | 9.62 |
11.51 - 17.18 | | 10,083,542 | | 4.0 | | $ | 14.49 | | 6,076,088 | | $ | 14.67 |
17.53 - 26.25 | | 15,871,324 | | 4.7 | | $ | 23.02 | | 6,350,213 | | $ | 20.85 |
26.38 - 39.54 | | 7,597,959 | | 5.3 | | $ | 32.15 | | 3,625,484 | | $ | 31.93 |
42.98 - 53.61 | | 624,000 | | 5.6 | | $ | 43.35 | | 623,750 | | $ | 43.35 |
65.47 - 65.47 | | 500 | | 6.0 | | $ | 65.47 | | 500 | | $ | 65.47 |
| | | | | | | | | | | | |
$0.09 - $65.47 | | 43,979,240 | | 4.4 | | $ | 19.00 | | 26,054,950 | | $ | 15.86 |
| | | | | | | | | | | | |
Note 11 - Retirement Plan
We have a 401(k) Retirement Plan, or the Plan, covering substantially all of our United States employees. Under the Plan, participating employees may defer up to 100 percent of their pre-tax earnings, subject to the Internal Revenue Service annual contribution limits. We do not make employer contributions to the Plan.
Note 12 - Financial Arrangements, Commitments and Contingencies
Inventory Purchase Obligations
At January
29, 2006,25, 2009 and January 27, 2008, we had outstanding inventory purchase obligations totaling
$401.6 million.Convertible Subordinated Debentures
In October 2000, we sold $300.0 million 4 3/4% convertible subordinated debentures, or the Notes, due October 15, 2007 in a public offering. Proceeds from the offering were approximately $290.8 million after deducting underwriting discounts, commissions and offering expenses. Issuance costs related to the offering totaled $9.2$290.7 million and were amortized to interest expense over the term of the Notes. Interest on the Notes accrued at the rate of 4 3/4% per annum$651.6 million, respectively.
Capital Purchase Obligations
At January 25, 2009 and
was payable semiannually in arrears on April 15 and October 15 of each year, commencing April 15, 2001. Interest expense, excluding the amortization of issuance costs, related to the Notes for fiscal 2004 was $10.4 million. The Notes were redeemable at our option on or after October 20, 2003 and were also convertible at the option of the holder at any time prior to the close of business on the maturity date, unless previously redeemed or repurchased, into shares of common stock at a conversion price of $46.36 per share, subject to adjustment in certain circumstances.On October 24, 2003, we fully redeemed the Notes. The aggregate principal amount of the Notes outstanding was $300.0 million, which included $18.6 million of Notes thatJanuary 27, 2008, we had purchased in the open market during the three months ended October 26, 2003. The redemption price was equal to approximately 102.7% of the outstanding principal amount of the Notes, plus accruedcapital purchase obligations totaling $20.3 million and unpaid interest up to, but excluding, the redemption date. In connection with the redemption of the Notes, we recorded a charge in our consolidated statement of income approximately $13.1$11.8 million, which included a $7.6 million redemption premium and $5.5 million for the write-off of unamortized issuance costs.
respectively.
NVIDIA CORPORATION AND SUBSIDIARIES
NOTES TO THE CONSOLIDATED FINANCIAL STATEMENTS -
Our headquarters complex is located
on a leased site in Santa Clara, California and is comprised of
eleven buildings that are a combination of owned and leased properties. The lease agreements for five
buildings. The related leasesof the seven leased properties expire in
2012fiscal year 2013 and
each includesinclude two seven-year renewals at our
option.option; one leased property expires in fiscal year 2012 with an option to extend for one year; and the remaining leased building expires in fiscal year 2015 with one option to extend for seven years. Future minimum lease payments under these operating leases total
$152.8$92.3 million over the remaining terms of the leases, including predetermined rent escalations, and are included in the future minimum lease payment schedule below.
In addition to the commitment of our headquarters, we have other domestic and international office facilities under operating leases expiring through fiscal
2013.year 2018. Future minimum lease payments under our
noncancelablenon-cancelable operating leases as of January
29, 2006,25, 2009, are as follows:
| | | |
| | | Operating |
| | | (In thousands) |
Year ending January: | | | |
2007 | | $ | 29,557 |
2008 | | | 29,321 |
2009 | | | 28,396 |
2010 | | | 27,794 |
2011 | | | 27,812 |
2012 and thereafter | | | 29,603 |
| | | |
Total | | $ | 172,483 |
| | | |
| | | Future Minimum Lease Obligations | |
| | | (In thousands) | |
| Year ending January: | | | |
| | | | |
| | | | |
| | | | |
| | | | |
| | | | |
| | | | |
| | | | |
Rent expense for the years ended January
29, 2006,25, 2009, January
30, 2005,27, 2008 and January
25, 200428, 2007 was
$29.5$43.0 million,
$28.0$38.2 million and
$26.4$32.6 million, respectively.
The following is an analysis of
In addition to these operating leases, we have a capital lease for a data center located near our headquarters complex in Santa Clara, California. Future minimum lease payments under this capital lease total $48.0 million over the
propertyremaining lease term, including predetermined rent escalations, and
equipment under capital leases by major classes: | | | | | | | | |
| | | January 29,
2006 | | | January 30,
2005 | |
| | | (In thousands) | |
Property and Equipment: | | | | | | | | |
Software and other | | $ | 629 | | | $ | 634 | |
Test equipment | | | 6,895 | | | | 9,125 | |
Computer equipment | | | 4,331 | | | | 4,331 | |
Leasehold improvements | | | 4 | | | | — | |
Office furniture and equipment | | | 5,232 | | | | 5,232 | |
| | | | | | | | |
| | $ | 17,091 | | | $ | 19,322 | |
Accumulated depreciation and amortization | | | (17,091 | ) | | | (17,835 | ) |
| | | | | | | | |
Total property and equipment, net | | $ | — | | | $ | 1,487 | |
| | | | | | | | |
are included in the future minimum lease payment schedule below:
| | | Future Capital Lease Obligations | |
| | | (In thousands) | |
| Year ending January: | | | |
| | | | |
| | | | |
| | | | |
| | | | |
| �� | | | |
| | | | |
| | | | |
Present Value of minimum lease payments | | | | |
| | | | | |
| | | | |
| | | | |
NVIDIA CORPORATION AND SUBSIDIARIES
NOTES TO THE CONSOLIDATED FINANCIAL STATEMENTS
(Continued)
On December 15, 2000, NVIDIA
Corporation and one of our indirect subsidiaries entered into an
agreementAsset Purchase Agreement, or APA, to purchase certain graphics chip assets from 3dfx. The
3dfx asset purchasetransaction closed on April 18, 2001.
That acquisition, and 3dfx's October 2002 bankruptcy filing, led to four lawsuits against NVIDIA: two brought by 3dfx's former landlords, one by 3dfx's bankruptcy trustee and the fourth by a committee of 3dfx's equity security holders in the bankruptcy estate.
Landlord Lawsuits
NVIDIA CORPORATION AND SUBSIDIARIESNOTES TO CONSOLIDATED FINANCIAL STATEMENTS - (Continued)
In May 2002, we were served with a California state court complaint filed by the landlord of 3dfx’s San Jose, California commercial real estate lease.lease, Carlyle Fortran Trust, or Carlyle. In December 2002, we were served with a California state court complaint filed by the landlord of 3dfx’s Austin, Texas commercial real estate lease.lease, CarrAmerica Realty Corporation, or CarrAmerica. The landlords’ complaintslandlords both assertasserted claims for, among other things, interference with contract, successor liability and fraudulent transfer and seektransfer. The landlords sought to recover among other things, amounts owed on their leases with 3dfxdamages in the aggregate amount of approximately $10 million. In October 2002,$15 million, representing amounts then owed on the 3dfx filed for Chapter 11 bankruptcy protection in the United States Bankruptcy Court for the Northern District of California.leases. The landlords’ actionscases were subsequentlylater removed to the United States Bankruptcy Court for the Northern District of California when 3dfx filed its bankruptcy petition and consolidated for pretrial purposes with a complaint filedan action brought by the Trustee in the 3dfx bankruptcy case for purposes of discovery. Upon motion by NVIDIA intrustee.
In 2005, the U.S. District Court for the Northern District of California withdrew the reference to the Bankruptcy Court and the landlord actions were removed to the United States District Court for the Northern District of California. Onlandlords’ actions, and on November 10, 2005, the District Court granted NVIDIA'sour motion to dismiss theboth landlords’ respective amended complaints and allowed the landlords to have until February 4, 2006 to amend their complaints. The landlords’ refiled claims against NVIDIAlandlords filed amended complaints in early February 2006, and NVIDIA again requestedfiled motions to dismiss those claims. On September 29, 2006, the District Court dismissed the CarrAmerica action in its entirety and without leave to dismiss all suchamend. On December 15, 2006, the District Court also dismissed the Carlyle action in its entirety. Both landlords filed timely notices of appeal from those orders.
On July 17, 2008, the United States Court of Appeals for the Ninth Circuit held oral argument on the landlords' appeals. On November 25, 2008, the Court of Appeals issued its opinion affirming the dismissal of Carlyle’s complaint in its entirety. The Court of Appeals also affirmed the dismissal of most of CarrAmerica’s complaint, but reversed the District Court’s dismissal of CarrAmerica’s claims madefor interference with contractual relations and fraud. On December 8, 2008, Carlyle filed a Request for Rehearing En Banc, which CarrAmerica joined. That same day, Carlyle also filed a Motion for Clarification of the Court’s Opinion. On January 22, 2009, the Court of Appeals denied the Request for Rehearing En Banc, but clarified its opinion affirming dismissal of the claims by stating that CarrAmerica had standing to pursue claims for interference with contractual relations, fraud, conspiracy and tort of another, and remanding Carlyle’s case with instructions that the landlords. ADistrict Court evaluate whether the Trustee had abandoned any claims, which Carlyle might have standing to pursue.
The District Court held a status conference in the CarrAmerica and Carlyle cases on March 9, 2009. That same day, 3dfx’s bankruptcy Trustee filed in the bankruptcy court a Notice of Trustee’s Intention to Compromise Controversy with Carlyle Fortran Trust. According to that Notice, the Trustee would abandon any claims it has against us for intentional interference with contract, negligent interference with prospective economic advantage, aiding and abetting breach of fiduciary duty, declaratory relief, unfair business practices and tort of another, in exchange for which Carlyle will withdraw irrevocably its Proof of Claim against the 3dfx bankruptcy estate and waive any further right of distribution from the estate. In light of the Trustee’s notice, the District Court ordered the parties to seek a hearing on NVIDIA’s new motionsthe Notice on or before April 24, 2009, ordered Carlyle and CarrAmerica to dismiss isfile amended complaints by May 10, 2009, and set a further Case Management Conference for hearing on April 17, 2006. Discovery is stayed pending this hearing and no trial date has been set in these actions.May 18, 2009. We believe the claims asserted against us by the landlords are without merit and we will continue to defend ourselves vigorously.believe that there is no merit to Carlyle or CarrAmerica’s remaining claims.
Trustee Lawsuit
In March 2003, we were served with a complaint filed by the Trustee appointed by the Bankruptcy Court to represent the interests of the 3dfx3dfx’s bankruptcy estate.estate served his complaint on NVIDIA. The Trustee’s complaint asserts claims for, among other things, successor liability and fraudulent transfer and seeks additional payments from us. The Trustee's fraudulent transfer theory alleged that NVIDIA had failed to pay reasonably equivalent value for 3dfx's assets, and sought recovery of the difference between the $70 million paid and the alleged fair value, which the Trustee estimated to exceed $50 million. The Trustee's successor liability theory alleged NVIDIA was effectively 3dfx's legal successor and was therefore responsible for all of 3dfx's unpaid liabilities. This action was consolidated for pretrial purposes with the landlord cases, as noted above.
On October 13, 2005, the Bankruptcy Court held a hearing onheard the Trustee’s motion for summary adjudication. Onadjudication, and on December 23, 2005, the Court issued its ruling denying the Trustee's Motion for Summary Adjudicationdenied that motion in all material respects and holdingheld that NVIDIA is prevented from disputingmay not dispute that the value of the 3dfx transaction to NVIDIA was less than $108.0$108 million. The Bankruptcy Court expressly denied the Trustee'sTrustee’s request to find that the value of the 3dfx assets conveyed to NVIDIA werewas at least $108.0$108 million.
NVIDIA CORPORATION AND SUBSIDIARIES
NOTES TO THE CONSOLIDATED FINANCIAL STATEMENTS
(Continued)
In early November 2005, after
manyseveral months of mediation, NVIDIA and the Official Committee of Unsecured Creditors, or the Creditors’ Committee,
reachedagreed to a Plan of Liquidation of 3dfx, which included a conditional settlement of the Trustee’s claims against
NVIDIA.us. This conditional settlement
presented as the centerpiece of a proposed Plan of Liquidation in the bankruptcy case, iswas subject to a confirmation process through a vote of creditors and the review and approval of the Bankruptcy
Court after notice and hearing.Court. The
scope and schedule for that confirmation process has yet to be determined, butwe expect that hearing to now occur sometime in the next few months. The Trustee has advised that he intends to object to the settlement. Theconditional settlement
with the Creditors’ Committee callscalled for a payment
by NVIDIA of approximately $30.6 million to the 3dfx estate. Under the settlement, $5.6 million
relatesrelated to various administrative expenses and Trustee fees, and $25.0 million
relatesrelated to the satisfaction of debts and liabilities owed to the general unsecured creditors of 3dfx.
As such,Accordingly, during the three month period ended October 30, 2005, we recorded $5.6 million as a charge to settlement costs and $25.0 million as additional purchase price for 3dfx.
The Trustee advised that he intended to object to the settlement. The conditional settlement never progressed substantially through the confirmation process.
On December 21, 2006, the Bankruptcy Court over objectionscheduled a trial for one portion of the Trustee’s case against NVIDIA. On January 2, 2007, NVIDIA terminated the settlement agreement on grounds that the Bankruptcy Court had failed to proceed toward confirmation of the Creditors’ CommitteeCommittee’s plan. A non-jury trial began on March 21, 2007 on valuation issues in the Trustee's constructive fraudulent transfer claims against NVIDIA. Specifically, the Bankruptcy Court tried four questions: (1) what did 3dfx transfer to NVIDIA in the APA?; (2) of what was transferred, what qualifies as "property" subject to the Bankruptcy Court's avoidance powers under the Uniform Fraudulent Transfer Act and NVIDIA, has orderedrelevant bankruptcy code provisions?; (3) what is the discovery portionfair market value of the litigation"property" identified in answer to proceed whilequestion (2)?; and (4) was the $70 million that NVIDIA paid "reasonably equivalent" to the fair market value of that property? The parties completed post-trial briefing on May 25, 2007.
On April 30, 2008, the Bankruptcy Court issued its Memorandum Decision After Trial, in which it provided a detailed summary of the trial proceedings and the parties' contentions and evidence and concluded that "the creditors of 3dfx were not injured by the Transaction." This decision did not entirely dispose of the Trustee's action, however, as the Trustee's claims for successor liability and intentional fraudulent conveyance were still pending. On June 19, 2008, NVIDIA filed a motion for summary judgment to convert the Memorandum Decision After Trial to a final judgment. That motion was granted in its entirety and judgment was entered in NVIDIA’s favor on September 11, 2008. The Trustee filed a Notice of Appeal from that judgment on September 22, 2008, and on September 25, 2008, NVIDIA exercised its election to have the appeal heard by the United States District Court, where the appeal is pending.
While the conditional settlement is pending approvalreached in November 2005 never progressed through the confirmation process. However, no trial date has been set in the Trustee's action. In addition, followingprocess, the Trustee’s filingcase still remains pending appeal. As such, we have not reversed the accrual of $30.6 million - $5.6 million as a charge to settlement costs and $25.0 million as additional purchase price for 3dfx – that we recorded during the three months ended October 30, 2005, pending resolution of the appeal of the Trustee’s case. We do not believe the resolution of this matter will have a material impact on our results of operations or financial position.
The Equity Committee Lawsuit
On December 8, 2005, the Trustee filed a Form 8-K on behalf of 3dfx, in which the Trustee discloseddisclosing the terms of the proposedconditional settlement agreement between NVIDIA and the Creditor’s Committee,Committee. Thereafter, certain 3dfx shareholders of 3dfx filed a petition with the Bankruptcy Court to appoint an official committee to represent the claimed interest’sinterests of 3dfx shareholders. ThatThe court granted that petition and appointed an Equity Securities Holders’ Committee, or the Equity Committee. The Equity Committee thereafter sought and obtained an order granting it standing to bring suit against NVIDIA, for the benefit of the bankruptcy estate, to compel NVIDIA to pay the stock consideration then unpaid from the APA, and filed its own competing plan of reorganization/liquidation. The Equity Committee’s plan assumes that 3dfx can raise additional equity capital that would be used to retire all of 3dfx’s debts, and thus to trigger NVIDIA's obligation to pay six million shares of stock consideration specified in the APA. NVIDIA contends, among other things, that such a commitment is not sufficient and that its obligation to pay the stock consideration had long before been extinguished. On May 1, 2006, the Equity Committee filed its lawsuit for declaratory relief to compel NVIDIA to pay the stock consideration. In addition, the Equity Committee filed a motion seeking Bankruptcy Court approval of investor protections for Harbinger Capital Partners Master Fund I, Ltd., an equity investment fund that conditionally agreed to pay no more than $51.5 million for preferred stock in 3dfx. The hearing on that motion was held on January 18, 2007, and the Bankruptcy Court approved the proposed protections.
NVIDIA CORPORATION AND SUBSIDIARIES
NOTES TO THE CONSOLIDATED FINANCIAL STATEMENTS
(Continued)
After the Bankruptcy Court denied our motion to dismiss on September 6, 2006, the Equity Committee again amended its complaint, and NVIDIA moved to dismiss that amended complaint as well. On December 21, 2006, the Bankruptcy Court granted the motion as to one of the Equity Committee’s claims, and denied it as to the others. However, the Bankruptcy Court also ruled that NVIDIA would only be required to answer the first three causes of action by which the Equity Committee seeks determinations that (1) the APA was not terminated before 3dfx filed for bankruptcy protection, (2) the 3dfx bankruptcy estate still holds some rights in the APA, and (3) the APA is capable of being assumed by the bankruptcy estate.
Because of the trial of the Trustee's fraudulent transfer claims against NVIDIA, the Equity Committee's lawsuit did not progress substantially in 2007. On July 31, 2008, the Equity Committee filed a motion for summary judgment on its first three causes of action. On September 15, 2008, NVIDIA filed a cross-motion for summary judgment. On October 24, 2008, the Court held a hearing on the parties’ cross-motions for summary judgment. On January 6, 2009, the Bankruptcy Court issued a Memorandum Decision granting NVIDIA’s motion and denying the Equity Committee’s motion, and entered an Order to that effect on January 30, 2009. On February 27, 2009, the Bankruptcy Court entered judgment in favor of NVIDIA. The Equity Committee has waived its right to appeal by stipulation entered on February 18, 2009, and the judgment is now final.
Proceedings, SEC inquiry and lawsuits related to our historical stock option granting practices
In June 2006, the Audit Committee of the Board of NVIDIA ("Audit Committee"), began a review of our stock option practices based on the results of an internal review voluntarily undertaken by management. The Audit Committee, with the assistance of outside legal counsel, completed its review on November 13, 2006 when the Audit Committee reported its findings to our full Board. The review covered option grants to all employees, directors and consultants for all grant dates during the period from our initial public offering in January 1999 through June 2006. Based on the findings of the Audit Committee and our internal review, we identified a number of occasions on which we used an incorrect measurement date for financial accounting and reporting purposes.
We voluntarily contacted the SEC regarding the Audit Committee’s review. In late August 2006, the SEC initiated an inquiry related to our historical stock option grant practices. In October 2006, we met with the SEC and provided it with a review of the status of the Audit Committee’s review. In November 2006, we voluntarily provided the SEC with additional documents. We continued to cooperate with the SEC throughout its inquiry. On October 26, 2007, the SEC formally notified us that the SEC's investigation concerning our historical stock option granting practices had been terminated and that no enforcement action was recommended.
Concurrently with our internal review and the SEC’s inquiry, since September 29, 2006, ten derivative cases have been filed in state and federal courts asserting claims concerning errors related to our historical stock option granting practices and associated accounting for stock-based compensation expense. These complaints have been filed in various courts, including the California Superior Court, Santa Clara County, the United States District Court for the Northern District of California, and the Court of Chancery of the State of Delaware in and for New Castle County. The California Superior Court cases were subsequently consolidated as were the cases pending in the Northern District of California. All of the cases purport to be brought derivatively on behalf of NVIDIA against members of our Board and several of our current and former officers and directors. Plaintiffs in these actions allege claims for, among other things, breach of fiduciary duty, unjust enrichment, insider selling, abuse of control, gross mismanagement, waste, and constructive fraud. The Northern District of California action also alleges violations of federal provisions, including Sections 10(b) and 14(a) of the Securities Exchange Act of 1934. The plaintiffs seek to recover for NVIDIA, among other things, damages in an unspecified amount, rescission, punitive damages, treble damages for insider selling, and fees and costs. Plaintiffs also seek an accounting, a constructive trust and other equitable relief.
On August 5, 2007, our Board authorized the formation of a Special Litigation Committee to investigate, evaluate, and make a determination as to how NVIDIA should proceed with respect to the claims and allegations asserted in the underlying derivative cases brought on behalf of NVIDIA. The Special Litigation Committee has made substantial progress in completing its work, but has not yet issued a report.
NVIDIA CORPORATION AND SUBSIDIARIES
NOTES TO THE CONSOLIDATED FINANCIAL STATEMENTS
(Continued)
Between June 2007 and September 2008 the parties to the actions engaged in settlement discussions, including four mediation sessions before the Honorable Edward Infante (Ret.). On September 22, 2008, we disclosed that we had entered into Memoranda of Understanding regarding the settlement of all derivative actions concerning our historical stock option granting practices. On November 10, 2008, the definitive settlement agreements were concurrently filed in the Chancery Court of Delaware and the United States District Court for the Northern District of California and are subject to approval by both such courts. The settlement agreements do not contain any admission of wrongdoing or fault on the part of NVIDIA, our board of directors or executive officers. The terms of the settlement agreements include, among other things, the agreement by the board of directors to continue and to implement certain corporate governance changes; acknowledgement of the prior amendment of certain options through re-pricings and limitations of the relevant exercise periods; an agreement by Jen-Hsun Huang, our president and chief executive officer, to amend additional options to increase the aggregate exercise price of such options by $3.5 million or to cancel options with an intrinsic value of $3.5 million; an $8.0 million cash payment by our insurance carrier to NVIDIA; and an agreement to not object to attorneys’ fees to be paid by NVIDIA to plaintiffs’ counsel of no more than $7.25 million, if approved by the courts. On January 24, 2009, a Notice of Pendency and Settlement of Shareholder Derivative Actions was mailed to shareholders of record and posted on www.nvidia.com. On March 11, 2009, a final settlement hearing was held in the Delaware Chancery Court and, on the same date, the Court entered a Final Order and Judgment, which approved the requested attorneys' fees and dismissed the Delaware action with prejudice. The final approval hearing in the Northern District of California is scheduled for March 17, 2009.
Department of Justice Subpoena and Investigation, and Civil Cases
On November 29, 2006, we received a subpoena from the San Francisco Office of the Antitrust Division of the United States Department of Justice, or DOJ, in connection with the DOJ's investigation into potential antitrust violations related to GPUs and cards. On October 10, 2008, the DOJ formally notified us that the DOJ investigation has been closed. No specific allegations were made against NVIDIA during the investigation.
As of January 25, 2009, over 50 civil complaints have been filed against us. The majority of the complaints were filed in the Northern District of California, several were filed in the Central District of California, and other cases were filed in several other Federal district courts. On April 18, 2007, the Judicial Panel on Multidistrict Litigation transferred the actions currently pending outside of the Northern District of California to the Northern District of California for coordination of pretrial proceedings before the Honorable William H. Alsup. By agreement of the parties, Judge Alsup will retain jurisdiction over the consolidated cases through trial or other resolution.
In the consolidated proceedings, two groups of plaintiffs (one putatively representing all direct purchasers of GPUs and the other putatively representing all indirect purchasers) filed consolidated, amended class-action complaints. These complaints purport to assert federal antitrust claims based on alleged price fixing, market allocation, and other alleged anti-competitive agreements between us and ATI Technologies, ULC., or ATI, and Advanced Micro Devices, Inc., or AMD, as a result of its acquisition of ATI. The indirect purchasers’ consolidated amended complaint also asserts a variety of state law antitrust, unfair competition and consumer protection claims on the same allegations, as well as a common law claim for unjust enrichment.
Plaintiffs filed their first consolidated complaints on June 14, 2007. On July 16, 2007, we moved to dismiss those complaints. The motions to dismiss were heard by Judge Alsup on September 20, 2007. The court subsequently granted and an Equity Holder’s Committee was appointed. Counseldenied the motions in part, and gave the plaintiffs leave to move to amend the complaints. On November 7, 2007, the court granted plaintiffs’ motion to file amended complaints, ordered defendants to answer the complaints, lifted a previously entered stay on discovery, and set a trial date for January 12, 2009. Plaintiffs filed motions for class certification on April 24, 2008. We filed oppositions to the motions on May 20, 2008. On July 18, 2008, the court ruled on Plaintiffs’ class certification motions. The court denied class certification for the Equity Holder’s Committeeproposed class of indirect purchasers. The court granted in part class certification for the direct purchasers but limited the direct purchaser class to individual purchasers that acquired graphics processing cards products directly from NVIDIA or ATI from their websites between December 4, 2002 and November 7, 2007.
On September 16, 2008, we executed a settlement agreement, or the Agreement, in connection with the claims of the certified class of direct purchaser plaintiffs approved by the court. Pursuant to the Agreement, NVIDIA has
announced an intentionpaid $850,000 into a $1.7 million fund to
file a competing Planbe made available for payments to the certified class. We are not obligated under the Agreement to pay plaintiffs’ attorneys’ fees, costs, or make any other payments in connection with the settlement other than the payment of
Reorganization or Liquidation$850,000. The Agreement is subject to court approval and, if approved, would dispose of all claims and appeals raised by the certified class in the
Trustee’s case.Opti Incorporated
complaints against NVIDIA. A final settlement approval hearing is scheduled for March 26, 2009. Because the Court certified a class consisting only of a narrow group of direct purchasers, the Agreement does not resolve any claims that other direct purchasers may assert. In addition, on September 9, 2008, we reached a settlement agreement with the remaining individual indirect purchaser plaintiffs pursuant to which NVIDIA paid $112,500 in exchange for a dismissal of all claims and appeals related to the complaints raised by the individual indirect purchaser plaintiffs. This settlement is not subject to the approval of the court. Pursuant to the settlement, the individual indirect purchaser plaintiffs in the complaints have dismissed their claims and withdrawn their appeal of the class certification ruling. Because the Court did not certify a class of indirect purchasers, this settlement agreement resolves only the claims of those indirect purchasers that were named in the various actions.
NVIDIA CORPORATION AND SUBSIDIARIES
NOTES TO THE CONSOLIDATED FINANCIAL STATEMENTS
(Continued)
Rambus Corporation
On October 19, 2004, Opti Incorporated,July 10, 2008, Rambus Corporation, or Opti,Rambus, filed suit against NVIDIA Corporation, asserting patent infringement of 17 patents claimed to be owned by Rambus. Rambus seeks damages, enhanced damages and injunctive relief. The lawsuit was filed in the Northern District of California in San Jose, California. On July 11, 2008, NVIDIA filed suit against Rambus in the Middle District of North Carolina asserting numerous claims, including antitrust and other claims. NVIDIA seeks damages, enhanced damages and injunctive relief. Rambus has since dropped two patents from its lawsuit in the Northern District of California. The two cases have recently been consolidated into a single action in the Northern District of California. A case management conference in the case pending in the Northern District of California is scheduled for March 30, 2009. On November 6, 2008, Rambus filed a complaint foralleging a violation of 19 U.S.C. Section 1337 based on a claim of patent infringement against NVIDIA and 14 other respondents with the U.S. International Trade Commission, or ITC. The complaint seeks an exclusion order barring the importation of products that allegedly infringe nine Rambus patents. The ITC has instituted the investigation. NVIDIA intends to pursue its offensive and defensive cases vigorously.
Product Defect Litigation and Securities Cases
In September, October and November 2008, several putative consumer class action lawsuits were filed against us, asserting various claims arising from a weak die/packaging material set in certain versions of our previous generation MCP and GPU products used in notebook systems. Most of the lawsuits were filed in Federal Court in the Northern District of California, but three were filed in state court in California, in Federal Court in New York, and in Federal Court in Texas. Those three actions have since been removed or transferred to the United States District Court for the Northern District of California, San Jose Division, where all of the actions now are currently pending. The various lawsuits are titled Nakash v. NVIDIA Corp., Feinstein v. NVIDIA Corp., Inicom Networks, Inc. v. NVIDIA Corp. and Dell, Inc. and Hewlett Packard, Olivos v. NVIDIA Corp., Dell, Inc. and Hewlett Packard, Sielicki v. NVIDIA Corp. and Dell, Inc., Cormier v. NVIDIA Corp., National Business Officers Association, Inc. v. NVIDIA Corp., and West v. NVIDIA Corp. The First Amended Complaint was filed on October 27, 2008, which no longer asserted claims against Dell, Inc. The various complaints assert claims for, among other things, breach of warranty, violations of the Consumer Legal Remedies Act, Business & Professions Code sections 17200 and 17500 and other consumer protection statutes under the laws of various jurisdictions, unjust enrichment, and strict liability.
The District Court has entered orders deeming all of the above cases related under the relevant local rules. On December 11, 2008, NVIDIA filed a motion to consolidate all of the aforementioned consumer class action cases. The District Court held a case management conference for the above cases on February 23, 2009. On February 26, 2009, the District Court consolidated the cases, as well as two other cases pending against Hewlett-Packard, under the caption “The NVIDIA GPU Litigation” and ordered the plaintiffs to file lead counsel motions by March 2, 2009. On March 2, 2009, several of the parties filed motions for appointment of lead counsel and briefs addressing certain related issues. A hearing on appointment of lead counsel is scheduled for March 23, 2009. The District Court also ordered that a consolidated amended complaint be filed on or before May 6, 2009.
In September 2008, three putative securities class actions, or the Actions, were filed in the United States District Court for the EasternNorthern District of Texas. Opti assertsCalifornia arising out of our announcements on July 2, 2008, that unspecified NVIDIA chipsets infringe five U.S. patents held by Opti. Opti seeks unspecified damageswe would take a charge against cost of revenue to cover anticipated costs and expenses arising from a weak die/packaging material set in certain versions of our previous generation MCP and GPU products and that we were revising financial guidance for our alleged conduct, attorneys’ feessecond quarter of fiscal year 2009. The Actions purport to be brought on behalf of purchasers of NVIDIA stock and triple damagesassert claims for alleged willful infringement by NVIDIA.violations of Sections 10(b) and 20(a) of the Securities Exchange Act of 1934, as amended. On October 30, 2008, the Actions were consolidated under the caption In re NVIDIA Corporation Securities Litigation, Civil Action No. 08-CV-04260-JW (HRL). Lead Plaintiffs and Lead Plaintiffs' Counsel were appointed on December 23, 2008. On February 6, 2009, co-Lead Plaintiff filed a Writ of Mandamus with the Ninth Circuit Court of Appeals challenging the designation of co-Lead Plaintiffs' Counsel. On February 19, 2009, co-Lead Plaintiff filed with the District Court, a motion to stay the District Court proceedings pending resolution of the Writ of Mandamus by the Ninth Circuit. On February 24, 2009, Judge Ware granted the stay. The Writ is still pending in the Court of Appeals. We intend to take all appropriate action with respect to the above cases.
Intel Corporation
On February 17, 2009, Intel Corporation filed suit against NVIDIA Corporation, seeking declaratory and injunctive relief relating to a licensing agreement that the parties signed in 2004. The lawsuit was filed in Delaware Chancery Court. Intel seeks an order from the Court declaring that the license does not extend to certain future NVIDIA chipset products, and enjoining NVIDIA from stating that it has licensing rights for these products. The lawsuit seeks no damages from NVIDIA. If Intel successfully obtains such a court order, we could be unable to sell our MCP products for use with Intel processors and our competitive position would be harmed. NVIDIA’s response to
thisthe Intel complaint
in December 2004. A case management conference was held in July 2005 where a trial date was set for July 2006. A courtis currently due on March 23, 2009. NVIDIA disputes Intel’s positions and intends to vigorously defend the case.
NVIDIA CORPORATION AND SUBSIDIARIES
NOTES TO CONSOLIDATED FINANCIAL STATEMENTS -
(Continued)
mandated mediation was held in January 2006 and did not resolve the matter. Discovery continues, as well as preparation for the Markman hearing on claim construction. The Markman hearing is scheduled for April 13, 2006. We believe the claims asserted against us are without merit and we will continue to defend ourselves vigorously. We do not have sufficient information to determine whether a loss is probable. As such, we have not recorded any liability in our consolidated financial statements for such, if any, loss.
American Video Graphics
In August 2004, a Texas limited partnership named American Video Graphics, LP, or AVG, filed three separate complaints for patent infringement against various corporate defendants, not including NVIDIA, in the United States District Court for the Eastern District of Texas. AVG initially asserted that each of the approximately thirty defendants sells products that infringe one or more of seven separate patents that AVG claims relate generally to graphics processing functionality. In November 2004, NVIDIA sought and was granted permission to intervene in two of the three pending AVG lawsuits. Our complaint in intervention alleged that both of the patents in suit were invalid and that, to the extent AVG’s claims target NVIDIA products, the asserted patents were not infringed.
On December 19, 2005, AVG and substantially all of the named defendants and intervenors, including NVIDIA, settled all of pending claims; the only surviving claims will relate solely to two non-settling defendants. As part of the settlement, the defendants and intervenors paid an undisclosed aggregate amount to AVG. In exchange, all pending claims between the settling parties were dismissed with prejudice, and AVG granted to all settling parties a full release of all claims for past damages and a full license for all future sales of accused products under all of AVG’s patents, including the patents in suit. In addition, as part of the settlement, all settling defendants and intervenors fully and finally waived any claims for indemnification they may have had against any other settling party.
We are subject to other legal proceedings, but we do not believe that the ultimate outcome of any of these proceedings will have a material adverse effect on our financial position or overall trends in results of operations. However, if an unfavorable ruling were to occur in any specific period, there exists the possibility of a material adverse impact on the results of operations of that period.
Note 13 -
Settlement CostsSettlement costs were $14.2 million for fiscal 2006. The settlement costs are associated with two litigation matters, 3dfx and AVG. AVG is settled. The 3dfx matter is not finally settled and is subject to judicial review and the completion of appropriate procedures and documents. However, based on the potential settlement in this case, we have concluded that a loss is probable and that we can reasonably estimate the amount of loss. Please refer to Note 12 of the Notes to Consolidated Financial Statements for further information.
NVIDIA CORPORATION AND SUBSIDIARIES
NOTES TO CONSOLIDATED FINANCIAL STATEMENTS - (Continued)
Note 14 - Income Taxes
The
provision for (benefit from) income
taxestax expense (benefit) applicable to income before income taxes consists of the following:
| | | | | | | | | | | | |
| | | Year Ended | |
| | | January 29,
2006 | | | January 30,
2005 | | | January 25,
2004 | |
| | | (As restated) | | | (As restated) | | | (As restated) | |
| | | (In thousands) | |
Current: | | | | | | | | | | | | |
Federal | | $ | 22,050 | | | $ | — | | | $ | — | |
State | | | 375 | | | | 355 | | | | 221 | |
Foreign | | | 11,012 | | | | 8,826 | | | | (51,590 | ) |
| | | | | | | | | | | | |
Total current | | | 33,437 | | | | 9,181 | | | | (51,369 | ) |
Deferred: | | | | | | | | | | | | |
Federal | | | (2,692 | ) | | | 1,237 | | | | 3,568 | |
State | | | — | | | | (620 | ) | | | 39,967 | |
Foreign | | | — | | | | — | | | | — | |
| | | | | | | | | | | | |
Total deferred | | | (2,692 | ) | | | 617 | | | | 43,535 | |
Charge in lieu of taxes attributable to employer stock option plans | | | 24,867 | | | | 8,615 | | | | 5,508 | |
| | | | | | | | | | | | |
Provision for/(benefit from) income taxes | | $ | 55,612 | | | $ | 18,413 | | | $ | (2,326 | ) |
| | | | | | | | | | | | |
| | | Year Ended | |
| | | January 25, 2009 | | | January 27, 2008 | | | January 28, 2007 | |
| | | (In thousands) | |
| Current income taxes: | | | | | | | | | |
| | | | ) | | | | | | | | |
| | | | | | | | | | | | |
| | | | | | | | | | | | |
| | | | | | | | | | | | |
| | | | | | | | | | | | |
| | | | ) | | | | | | | | |
| | | — | | | | | | | | | |
| | | | ) | | | | | | | | |
| | | | ) | | | | | | | | |
Charge in lieu of taxes attributable to employer stock option plans | | | | | | | | | | | | |
Income tax expense (benefit) | | | | ) | | | | | | | | |
Income (loss) before income taxes consists of the following: | | | | | | | | | | | |
| | | Year Ended | |
| | | January 29,
2006 | | January 30,
2005 | | | January 25,
2004 | |
| | | (As Restated) | | (As Restated) | | | (As Restated) | |
| | | (In thousands) | |
Domestic | | $ | 52,112 | | $ | (7,537 | ) | | $ | (55,928 | ) |
Foreign | | | 304,675 | | | 114,565 | | | | 102,232 | |
| | | | | | | | | | | |
| | $ | 356,787 | | $ | 107,028 | | | $ | 46,304 | |
| | | | | | | | | | | |
| | | Year Ended | |
| | | January 25, 2009 | | | January 27, 2008 | | | January 28, 2007 | |
| | | (In thousands) | |
| | | | ) | | | | | | | | |
| | | | | | | | | | | | |
| | | | | ) | | | | | | | | |
The
provision for (benefit from) income
taxestax expense (benefit) differs from the amount computed by applying the federal statutory income tax rate of 35% to income
(loss) before income taxes as follows:
| | | | | | | | | | | | |
| | | Year Ended | |
| | | January 29,
2006 | | | January 30,
2005 | | | January 25,
2004 | |
| | | (As Restated) | | | (As Restated) | | | (As Restated) | |
| | | (In thousands) | |
Tax expense computed at Federal Statutory Rate | | $ | 124,876 | | | $ | 37,460 | | | $ | 16,206 | |
State income taxes, net of federal tax effect | | | 847 | | | | 219 | | | | 5,232 | |
Foreign tax rate differential | | | (57,286 | ) | | | (8,462 | ) | | | (14,142 | ) |
Research and experimental credit | | | (13,175 | ) | | | (10,935 | ) | | | (5,426 | ) |
In-process research and development | | | — | | | | — | | | | 1,225 | |
Change in estimates | | | — | | | | — | | | | (36,766 | ) |
Increase in beginning of year valuation allowance | | | — | | | | — | | | | 31,027 | |
Other | | | 350 | | | | 131 | | | | 318 | |
| | | | | | | | | | | | |
Provision for/(benefit from) income taxes | | $ | 55,612 | | | $ | 18,413 | | | $ | (2,326 | ) |
| | | | | | | | | | | | |
| | | Year Ended | |
| | | January 25, 2009 | | | January 27, 2008 | | | January 28, 2007 | |
| | | (In thousands) | |
Tax expense computed at federal statutory rate | | | | ) | | | | | | | | |
State income taxes, net of federal tax effect | | | | | | | | | | | | |
Foreign tax rate differential | | | | | | | | | | | | |
| | | | ) | | | | | | | | |
In-process research and development | | | | | | | | | | | | |
| | | | | | | | | | | | |
| | | | ) | | | | | | | | |
Income tax expense (benefit) | | | | ) | | | | | | | | |
NVIDIA CORPORATION AND SUBSIDIARIES
NOTES TO CONSOLIDATED FINANCIAL STATEMENTS -
The tax effect of temporary differences that gives rise to significant portions of the deferred tax assets and liabilities are presented below: | | | | | | | | |
| | | January 29,
2006 | | | January 30,
2005 | |
| | | (As Restated) | | | (As Restated) | |
| | | (In thousands) | |
Deferred tax assets: | | | | |
Net operating loss carryforwards | | $ | 134,385 | | | $ | 97,464 | |
Accruals and reserves, not currently deductible for tax purposes | | | 16,109 | | | | 18,407 | |
Property, equipment and intangible assets | | | 16,928 | | | | 17,182 | |
Research and other tax credit carryforwards | | | 146,089 | | | | 113,856 | |
Deferred Equity Compensation | | | 45,924 | | | | 53,458 | |
| | | | | | | | |
Gross deferred tax assets | | | 359,435 | | | | 300,367 | |
Less valuation allowance | | | (233,016 | ) | | | (193,987 | ) |
| | | | | | | | |
Deferred tax assets | | | 126,419 | | | | 106,380 | |
| Deferred tax liabilities: | | | | | | | | |
Unremitted earnings of foreign subsidiaries | | | (85,716 | ) | | | (68,368 | ) |
| | | | | | | | |
| Net deferred tax asset | | $ | 40,703 | | | $ | 38,012 | |
| | | | | | | | |
| | | January 25, 2009 | | | January 27, 2008 | |
| | | (In thousands) | |
| Deferred tax assets: | | | |
Net operating loss carryforwards | | | | | | | | |
Accruals and reserves, not currently deductible for tax purposes | | | | | | | | |
Property, equipment and intangible assets | | | | | | | | |
Research and other tax credit carryforwards | | | | | | | | |
| | | | | | | | |
Gross deferred tax assets | | | | | | | | |
Less: valuation allowance | | | | ) | | | | |
Total deferred tax assets | | | | | | | | |
Deferred tax liabilities: | | | | | | | | |
Unremitted earnings of foreign subsidiaries | | | | ) | | | | |
Net deferred tax asset (liability) | | | | ) | | | | |
Income tax expense (benefit) as a percentage of income (loss) before taxes, or our annual effective tax rate, was 15.6% in fiscal 2006, 17.2% in fiscal 2005,(30.0%), 11.5% and (5.0%) in fiscal 2004.9.4% for the years ended January 25, 2009, January 27, 2008 and January 28, 2007, respectively. The changedifference in the rateeffective tax rates amongst the three years was primarily a result of changes in our geographic mix of income subject to tax. tax, with the additional impact of the federal research tax credit recognized in fiscal year 2009 relative to the loss before taxes in such fiscal year.
As of January 29, 2006,25, 2009, we had a valuation allowance of $233.0$92.5 million. Of the total valuation allowance, $178.3 million is attributable to certain net operating loss and tax credit carryforwards resulting from the exercise of employee stock options. The tax benefit of these net operating loss and tax credit carryforwards, if and when realized, would be accounted for as a credit to stockholders' equity. Of the remaining valuation allowance as of January 29, 2006, $19.5$5.3 million relates to federal and state tax attributes acquired in certain acquisitions for which realization of the related deferred tax assets was determined not likely to be realized due, in part, to potential utilization limitations as a result of stock ownership changes, and $35.2$87.2 million relates to certain state and foreign deferred tax assets that management determined not likely to be realized due, in part, to projections of future taxable income. To the extent realization of the deferred tax assets related to certain acquisitions becomes probable,more-likely-than-not, recognition of these acquired tax benefits would first reduce goodwill to zero, then reduce other non-current intangible assets related to the acquisition to zero with any remaining benefitbe reported as a reduction to income tax expense. Toexpense in accordance with the extentrecent accounting pronouncement, Statement of Financial Accounting Standards No. 141(R), or SFAS No. 141(R), Business Combinations, issued by the FASB in December 2007. We would also recognize an income tax benefit during the period that the realization of the deferred tax assets related to certain state or foreign tax benefits of $87.2 million becomes probable, we would recognize an incomemore-likely-than-not.
In accordance with Statement of Financial Accounting Standards No. 123(R), or SFAS No. 123(R), Share Based Payment, our deferred tax assets do not include the excess tax benefit related to stock-based compensation that are a component of our federal and state net operating loss and research tax credit carryforwards in the periodamount of $588.7 million as of January 25, 2009. Consistent with prior years, the excess tax benefit reflected in our net operating loss and research tax credit carryforwards will be accounted for as a credit to stockholders’ equity, if and when realized. In determining if and when excess tax benefits have been realized, we have elected to do a with-and-without approach with respect to such asset is more likely than notexcess tax benefits. We have also elected to be realized.ignore the indirect tax effects of stock-based compensation deductions for financial and accounting reporting purposes, and specifically to recognize the full effect of the research tax credit in income from continuing operations.
As of January 29, 2006,25, 2009, we had a federal net operating loss carryforward of approximately $363.6 million and$1.16 billion, cumulative state net operating loss carryforwards of approximately $170.8$791.6 million, and a foreign net operating loss carryforward of $25.3 million. The federal net operating loss carryforward will expire beginning in fiscal 2012, and the state net operating loss carryforwards will begin to expire in fiscal 2007 according to2010 in accordance with the rules of each particular state.state, and the foreign net operating loss carryforward may be carried forward indefinitely. As of January 29, 2006,25, 2009, we had federal research and experimentation tax credit carryforwards of approximately $92.1$223.0 million that will begin to expire in fiscal 2008.2010. We have other federal tax credit carryforwards of $1.9 million that will begin to expire in fiscal 2011. The research and experimentation tax credit carryforwardcarryforwards attributable to states is approximately $78.2in the amount of $212.3 million, of which approximately $75.3$204.8 million is attributable to the State of California and may be carried over indefinitely, and approximately $2.9$7.5 million is attributable to various other states and will expire beginning in fiscal 20162010 according to the rules of each particular state. We have other California state tax credit carryforwards of approximately $4.9$7.0 million that will begin to expire in fiscal 2007.2010. Utilization of federal and state net operating losses and tax credit carryforwards may be subject to limitations due to ownership changes and other limitations provided by the Internal Revenue Code and similar state provisions. Utilization of the foreign net operating loss may be limited due to a change in business in connection with an ownership change. If any such a limitation applies,limitations apply, the federal, states, or foreign net operating loss and tax credit carryforwards, as applicable, may expire or be denied before full utilization.The American Jobs Creation Act of 2004, or Act, was signed into law on October 22, 2004. The Act provided a temporary incentive for United States multinational corporations to repatriate accumulated income earned outside the United States at a federal effective tax rate of 5.25%. In the fourth quarter of fiscal 2006, we repatriated $420 million in foreign earnings under the Act. The net tax effect of this distribution was minimal because the current tax cost at a 5.25% tax rate was offset by the benefit attributable to reducing our deferred tax liability for taxes on earnings previously provided at the statutory rate of 35%.
NVIDIA CORPORATION AND SUBSIDIARIES
NOTES TO CONSOLIDATED FINANCIAL STATEMENTS -
As of January 25, 2009, United States federal and state income taxes have not been provided on approximately $823.6 million of undistributed earnings of non-United States subsidiaries as such earnings are considered to be permanently reinvested.
The Company has a tax holiday in effect for its business operations in India which will terminate in March 2010. This tax holiday provides for a lower rate of taxation on certain classes of income based on various thresholds of investment and employment in such jurisdiction. For fiscal year 2009, the tax savings of this holiday was approximately $0.9 million with no material per-share impact.
Note 15 - Microsoft AgreementOn March 5, 2000,January 29, 2007, we entered intoadopted FASB Interpretation No. 48, or FIN 48, Accounting for Uncertainty in Income Taxes. The cumulative effect of adoption of FIN 48 did not result in a material adjustment to our tax liability for unrecognized income tax benefits. As of January 25, 2009, we had $95.3 million of unrecognized tax benefits, all of which would affect our effective tax rate if recognized. However, included in the unrecognized tax benefits that would affect our effective tax rate if recognized of $95.3 million is $19.7 million related to state income tax that, if recognized, would be in the form of a carryforward deferred tax asset that would likely attract a full valuation allowance. The $95.3 million of unrecognized tax benefits as of January 25, 2009 consists of $37.4 million recorded in non-current income taxes payable and $57.9 million reflected as a reduction to the related deferred tax assets.
A reconciliation of unrecognized tax benefits is as follows:
| | | January 25, 2009 | | | January 27, 2008 | |
| | (In thousands) | |
Balance at beginning of period | | $ | 77,791 | | | $ | 57,544 | |
Increases in tax positions for prior years | | | 6,297 | | | | 3,900 | |
Decreases in tax positions for prior years | | | (272 | ) | | | (433 | ) |
Increases in tax positions for current year | | | 13,622 | | | | 21,716 | |
| | | (181 | ) | | | (2,445 | ) |
Lapse in statute of limitations | | | (1,938 | ) | | | (2,491 | ) |
| | $ | 95,319 | | | $ | 77,791 | |
We have historically classified certain unrecognized tax benefits as income taxes payable, which was included within the current liabilities section of our Consolidated Balance Sheet. As a result of our adoption of FIN 48, we now classify an agreement with Microsoft Corporation,unrecognized tax benefit as a current liability, or as a reduction of the amount of a net operating loss carryforward or amount refundable, to the extent that we anticipate payment or receipt of cash for income taxes within one year. Likewise, the amount is classified as a long-term liability if we anticipate payment or receipt of cash for income taxes during a period beyond a year.
Our policy to include interest and penalties related to unrecognized tax benefits as a component of income tax expense did not change as a result of implementing FIN 48. As of January 25, 2009 and January 27, 2008, we had accrued $11.8 million and $11.2 million, respectively, for the payment of interest and penalties related to unrecognized tax benefits, which is not included as a component of our unrecognized tax benefits. As of January 25, 2009, non-current income taxes payable of $49.2 million consists of unrecognized tax benefits of $37.4 million and the related interest and penalties of $11.8 million.
While we believe that we have adequately provided for all tax positions, amounts asserted by tax authorities could be greater or less than our accrued position. Accordingly, our provisions on federal, state and foreign tax-related matters to be recorded in the future may change as revised estimates are made or the Microsoft Agreement,underlying matters are settled or otherwise resolved. As of January 25, 2009, we do not believe that our estimates, as otherwise provided for, on such tax positions will significantly increase or decrease within the next twelve months.
We are subject to taxation by a number of taxing authorities both in the United States and throughout the world. As of January 25, 2009, the material tax jurisdictions that are subject to examination include the United States, Hong Kong, Taiwan, China, India, and Germany and include our fiscal years 2003 through 2009. As of January 25, 2009, the material tax jurisdictions for which we agreed,are currently under certain termsexamination include India for fiscal years 2003 through 2007 and conditions, to develop and sell processorsGermany for use in the Xbox video game console. Under the Microsoft Agreement, in the event that an individual or corporation makes an offer to purchase shares equal to or greater than 30% of the outstanding shares of our common stock, Microsoft may have first and last rights of refusal to purchase the stock.fiscal years 2004 through 2006.
NVIDIA CORPORATION AND SUBSIDIARIES
NOTES TO CONSOLIDATED FINANCIAL STATEMENTS
(Continued)
Note 14 - Stockholders’ Equity
Stock Repurchase Program
During fiscal year 2005, we announced that our Board of Directors, or Board, had authorized a stock repurchase program to repurchase shares of our common stock, subject to certain specifications, up to an aggregate maximum amount of $300 million. During fiscal year 2007, the Board further approved an increase of $400 million to the original stock repurchase program. In fiscal year 2008, we announced a stock repurchase program under which we may purchase up to an additional $1.0 billion of our common stock over a three year period through May 2010. On August 12, 2008, we announced that our Board further authorized an additional increase of $1.0 billion to the stock repurchase program. As a result of these increases, we have an ongoing authorization from the Board, subject to certain specifications, to repurchase shares of our common stock up to an aggregate maximum amount of $2.7 billion through May 2010.
The repurchases will be made from time to time in the open market, in privately negotiated transactions, or in structured stock repurchase programs, and may be made in one or more larger repurchases, in compliance with the Securities Exchange Act of 1934, or the Exchange Act, Rule 10b-18, subject to market conditions, applicable legal requirements, and other factors. The program does not obligate NVIDIA to acquire any particular amount of common stock and the program may be suspended at any time at our discretion. As part of our share repurchase program, we have entered into, and we may continue to enter into, structured share repurchase transactions with financial institutions. These agreements generally require that we make an up-front payment in exchange for the right to receive a fixed number of shares of our common stock upon execution of the agreement, and a potential incremental number of shares of our common stock, within a pre-determined range, at the end of the term of the agreement.
During the three months ended January 25, 2009, we did not enter into any structured share repurchase transactions or otherwise purchase any shares of our common stock. During fiscal year 2009, we entered into structured share repurchase transactions to repurchase 29.3 million shares for $423.6 million, which we recorded on the trade date of the transactions. Through fiscal year 2009, we have repurchased an aggregate of 90.9 million shares under our stock repurchase program for a total cost of $1.46 billion. As of January 25, 2009, we are authorized, subject to certain specifications, to repurchase shares of our common stock up to an additional amount of $1.24 billion through May 2010.
Please refer to Note 2 of these Notes to the Consolidated Financial Statements in Part IV, Item 15 of this Form 10-K for further information regarding stock-based compensation and stock options granted under equity incentive programs.
Convertible Preferred Stock
As of January 25, 2009 and January 27, 2008, there were no shares of preferred stock outstanding.
Common Stock
At the Annual Meeting of Stockholders held on June 19, 2008, our stockholders approved an increase in our authorized number of shares of common stock to 2,000,000,000. The par value of our common stock remained unchanged at $0.001 per share.
Please refer to Note 19 for further discussion regarding the cash tender offer for certain employee stock options that our Board of Directors approved in February 2009.
Note 15 - Employee Retirement Plans
We have a 401(k) Retirement Plan, or the 401(k) Plan, covering substantially all of our United States employees. Under the Plan, participating employees may defer up to 100% of their pre-tax earnings, subject to the Internal Revenue Service annual contribution limits. Some of our non-US subsidiaries have defined benefit and defined contributions plans as required by local statutory requirements. Our costs under these plans have not been material.
NVIDIA CORPORATION AND SUBSIDIARIES
NOTES TO THE CONSOLIDATED FINANCIAL STATEMENTS
(Continued)
Note 16 - Segment Information
Our Chief Executive Officer, who is considered to be our chief operating decision maker, or CODM, reviews financial information presented on an operating segment basis for purposes of making operating decisions and assessing financial performance.
During the first quarter of fiscal 2006,year 2008, we reorganized our operating segments to bring all major product groups in line with our strategy to position ourselves as the worldwide leader in programmable graphics processor technologies.segments. We now report financial information for four product-line operating segments to our CODM: the GPU Businessbusiness, which is composedcomprised primarily of our GeForce products that support desktop PCs,and notebook PCs, plus memory products; the PSB which is comprised of our NVIDIA Quadro professional workstation products and other professional workstations;graphics products, including our NVIDIA Tesla high-performance computing products; the MCP Businessbusiness which is composedcomprised of NVIDIA nForce products that operate as a single-chip or chipset that can off-load system functions, such as audio processingcore logic and network communications,motherboard GPU products; and perform these operations independently from the host central processing unit, or CPU; our Handheld GPU BusinessCPB, which is composedcomprised of our CPB is comprised of our Tegra and GoForce mobile brands and products that support netbooks, personal navigation devices, or PNDs, handheld personal media players, or PMPs, personal digital assistants, or PDAs, cellular phones and other handheld devices;devices. CPB also includes license, royalty, other revenue and our Consumer Electronics Business is concentrated in products that supportassociated costs related to video game consoles and other digital consumer electronics devices and is composed of revenue from our contractual arrangements with SCE to jointly develop a custom GPU incorporating our next-generation GeForce GPU and SCE’s system solutions in SCE’s PlayStation3, revenue from sales of our Xbox-related products, revenue from our license agreement with Microsoft relating to the successor product to their initial Xbox gaming console, the Xbox360, and related devices, and digital media processor products. devices.
In addition to these operating segments, we have the “All Other” category that includes human resources, legal, finance, general administration and corporate marketing expenses, which total
$123.9$346.1 million, $266.2 million and
$118.0$239.6 million for fiscal
2006years 2009, 2008 and
2005,2007, respectively, that we do not allocate to our other operating
segments.segments as these expenses are not included in the segment operating performance measures evaluated by our CODM. “All Other” also includes the results of operations of other miscellaneous
operatingreporting segments that are neither individually reportable, nor aggregated with another operating segment. Revenue in the “All Other” category is primarily derived from sales of
memory. Allcomponents. Certain prior period amounts have been
restatedrevised to
reflectconform to the presentation of our
new reporting structure.current fiscal year.
Our CODM does not review any information regarding total assets on an operating segment basis. Operating segments do not record intersegment revenue, and, accordingly, there is none to be reported. The accounting policies for segment reporting are the same as for NVIDIA as a whole.For periods prior to the first quarter of fiscal 2005, product-line operating segment information other than revenue was impracticable to obtain primarily due to changes in our enterprise resource system structure that we implemented during the first quarter of fiscal 2005.
| | | GPU | | | PSB | | | MCP | | | CPB | | | All Other | | | Consolidated | |
| | | (In thousands) | |
| Year Ended January 25, 2009: | | | | | | | | | | | | | | | | | | |
| | | | | | | | | | | | | | | | | | | | | | | | |
Depreciation and amortization expense | | | | | | | | | | | | | | | | | | | | | | | | |
| | | | | | | | | | | | | | | | | | | | | | | | |
| Year Ended January 27, 2008: | | | | | | | | | | | | | | | | | | |
| | | | | | | | | | | | | | | | | | | | | | | | |
Depreciation and amortization expense | | | | | | | | | | | | | | | | | | | | | | | | |
| | | | | | | | | | | | | | | | | | | | | | | | |
Year Ended January 28, 2007: | | | | | | | | | | | | | | | | | | | | | | | | |
| | | | | | | | | | | | | | | | | | | | | | | | |
Depreciation and amortization expense | | | | | | | | | | | | | | | | | | | | | | | | |
| | | | | | | | | | | | | | | | | | | | | | | | |
NVIDIA CORPORATION AND SUBSIDIARIES
NOTES TO THE CONSOLIDATED FINANCIAL STATEMENTS -
(Continued)
| | | | | | | | | | | | | | | | | | | | | |
| | | GPU | | MCP | | | Handheld GPU | | | CE | | All Other | | | Consolidated |
| | | | | | | | | | | | | (As Restated) | | | (As Restated) |
| | | (In thousands) |
| Twelve Months Ended January 29, 2006: | | | | | | | | | | | | | | | | | | | | | |
| | | | | | |
Revenue | | $ | 1,654,397 | | $ | 352,319 | | | $ | 58,745 | | | $ | 170,222 | | $ | 140,004 | | | $ | 2,375,687 |
Depreciation and amortization expense | | $ | 33,080 | | $ | 12,092 | | | $ | 12,480 | | | $ | 1,552 | | $ | 30,817 | | | $ | 90,021 |
Operating income (loss) | | $ | 370,636 | | $ | 32,865 | | | $ | (34,922 | ) | | $ | 83,881 | | $ | (115,796 | )(A) | | $ | 336,664 |
| | | | | | |
| Twelve Months Ended January 30, 2005: | | | | | | | | | | | | | | | | | | | | | |
Revenue | | $ | 1,348,968 | | $ | 175,663 | | | $ | 45,921 | | | $ | 259,968 | | $ | 179,513 | | | $ | 2,010,033 |
Depreciation and amortization expense | | $ | 32,849 | | $ | 12,824 | | | $ | 11,620 | | | $ | 880 | | $ | 32,643 | | | $ | 90,816 |
Operating income (loss) | | $ | 178,597 | | $ | (39,912 | ) | | $ | (37,532 | ) | | $ | 107,901 | | $ | (113,878 | )(A) | | $ | 95,176 |
| | | | | | |
| Twelve Months Ended January 25, 2004: | | | | | | | | | | | | | | | | | | | | | |
Revenue | | $ | 1,259,802 | | $ | 162,435 | | | $ | 9,009 | | | $ | 280,134 | | $ | 111,565 | | | $ | 1,822,945 |
(A) | Operating loss in the “All Other” category for the fiscal years ended January 29, 2006, January 30, 2005 and January 25, 2004 includes $3,433, $18,417, and $40,369, respectively, of restated stock-based compensation and associated payroll tax expense. Please refer to Note 2 of the Notes to Consolidated Financial Statements for further information. |
Revenue by geographic region is allocated to individual countries based on the location to which the products are initially billed even if our customers’ revenue is attributable to end customers that are located in a different location. The following tables summarize information pertaining to our revenue from customers based on invoicing address in different geographic regions:
| | | | | | | | | |
| | | Year Ended
January 29,
2006 | | Year Ended
January 30,
2005 | | Year Ended
January 25,
2004 |
| | | (In thousands) |
Revenue: | | | | | | | | | |
United States | | $ | 340,598 | | $ | 473,721 | | $ | 444,510 |
Other Americas | | | 38,572 | | | 11,045 | | | 6,359 |
China | | | 401,612 | | | 269,306 | | | 280,975 |
Taiwan | | | 1,131,784 | | | 883,346 | | | 834,511 |
Other Asia Pacific | | | 250,844 | | | 169,888 | | | 149,843 |
Europe | | | 212,277 | | | 202,727 | | | 106,747 |
| | | | | | | | | |
Total revenue | | $ | 2,375,687 | | $ | 2,010,033 | | $ | 1,822,945 |
| | | | | | | | | |
| | | | | | |
| | | January 29,
2006 | | January 30,
2005 |
| | | (In thousands) |
Long-lived assets | | | | | | |
United States | | $ | 161,505 | | $ | 169,872 |
Other Americas | | | 609 | | | — |
China | | | 4,443 | | | 1,030 |
Taiwan | | | 1,020 | | | 951 |
Other Asia Pacific | | | 7,670 | | | 3,123 |
Europe | | | 2,905 | | | 3,979 |
| | | | | | |
Total long-lived assets | | $ | 178,152 | | $ | 178,955 |
| | | | | | |
| | | Year Ended | |
| | | January 25, 2009 | | | January 27, 2008 | | | January 28, 2007 | |
| Revenue: | | (In thousands) | |
| | | | | | | | | | | | |
| | | | | | | | | | | | |
| | | | | | | | | | | | |
| | | | | | | | | | | | |
| | | | | | | | | | | | |
| | | | | | | | | | | | |
| | | | | | | | | | | | |
The following table presents summarized information for long-lived assets by geographic region. Long lived assets consist of property and equipment and deposits and other assets and exclude goodwill and intangible assets.
| | | January 25, 2009 | | | January 27, 2008 | |
| Long-lived assets: | | (In thousands) | |
| | | | | | | | |
| | | | | | | | |
| | | | | | | | |
| | | | | | | | |
| | | | | | | | |
| | | | | | | | |
| | | | | | | | |
| | | | | | | | |
Revenue from significant customers, those representing approximately 10% or more of total revenue for the respective dates, is summarized as follows: | | | | | | | | | |
| | | Year Ended
January 29,
2006 | | | Year Ended
January 30,
2005 | | | Year Ended
January 25,
2004 | |
Revenue: | | | | | | | | | |
Customer A | | 8 | % | | 9 | % | | 12 | % |
Customer B | | 5 | % | | 13 | % | | 15 | % |
Customer C | | 6 | % | | 8 | % | | 12 | % |
Customer D | | 14 | % | | 18 | % | | 21 | % |
Customer E | | 12 | % | | 7 | % | | 9 | % |
| | | Year Ended | |
| | | January 25, 2009 | | January 27, 2008 | | January 28, 2007 | |
| Revenue: | | | | | | | |
| | | | | | | | |
| | | | | | | | |
Accounts receivable from significant customers, those representing approximately 10% or more of total accounts receivable for the respective periods, is summarized as follows: | | | | | | |
| | | January 29,
2006 | | | January 30,
2005 | |
Accounts Receivable: | | | | | | |
Customer A | | 8 | % | | 13 | % |
Customer B | | 8 | % | | 14 | % |
Customer C | | 11 | % | | — | % |
| | | January 25, 2009 | | January 27, 2008 | |
| Accounts Receivable: | | | | | |
| | | | | | |
| | | | | | |
| | | | | | |
| | | | | | |
NVIDIA CORPORATION AND SUBSIDIARIES
NOTES TO THE CONSOLIDATED FINANCIAL STATEMENTS -
(Continued)
Note 17 – Fair Value of Cash Equivalents and Marketable Securities
We measure our cash equivalents and marketable securities at fair value. The fair values of our financial assets and liabilities are determined using quoted market prices of identical assets or quoted market prices of similar assets from active markets. Level 1 valuations are obtained from real-time quotes for transactions in active exchange markets involving identical assets. Level 2 valuations are obtained from quoted market prices in active markets involving similar assets. Level 3 valuations are based on unobservable inputs to the valuation methodology and include our own data about assumptions market participants would use in pricing the asset or liability based on the best information available under the circumstances.
Financial assets and liabilities measured at fair value are summarized below:
| | | | Fair value measurement at reporting date using | |
| | | | | | Quoted Prices in Active Markets for Identical Assets | | Significant Other Observable Inputs | | | High Level of Judgment | |
| | | January 25, 2009 | | | (Level 1) | | | (Level 2) | | | (Level 3) | |
| | | | (In thousands) | |
Other debt securities issued by U.S. Government agencies (4) | | | | | | | | | | | | | | |
Corporate debt securities (3) | | | | | | | | | | | | | | |
Mortgage-backed securities issued by Government-sponsored entities (1) | | | | | | | | | | | | | | |
| | | | | | | | | | | | | | |
| | | | | | | | | | | | | | |
Debt securities issued by United States Treasury (1) | | | | | | | | | | | | | | |
Asset-backed securities (1) | | | | | | | | | | | | | | |
| | | | | | | | | | | | | | |
(1) Included in Marketable securities on the Consolidated Balance Sheet.
(2) Included in Cash and cash equivalents on the Consolidated Balance Sheet.
(3) Includes $38,091 in Cash and cash equivalents and $213,083 in Marketable securities on the Consolidated Balance Sheet.
(4) Includes $73,233 in Cash and cash equivalents and $244,888 in Marketable securities on the Consolidated Balance Sheet.
(5) Includes $14,646 in Cash and cash equivalents and $124,400 in Marketable securities on the Consolidated Balance Sheet.
For our money market funds that were held by the International Reserve Fund at January 25, 2009, we assessed the fair value of the money market funds by considering the underlying securities held by the International Reserve Fund. As the International Reserve Fund has halted redemption requests and is currently believed to be holding all of their securities until maturity, we valued the underlying securities held by the International Reserve Fund at their maturity value using an income approach. Certain of the debt securities held by the International Reserve Fund were issued by companies that have filed for bankruptcy as of January 25, 2009 and, as such, our valuation of those securities was zero. The net result was that, as of January 25, 2009, we estimated the fair value of the International Reserve Fund’s investments to be 95.7% of their last-known value prior to January 25, 2009. Based on this assessment, we recorded an other than temporary impairment charge of $5.6 million during fiscal year 2009. Due to the inherent subjectivity and the significant judgment involved in the valuation of our holdings of International Reserve Fund, we have classified these securities under the Level 3 fair value hierarchy.
As of January 25, 2009, our money market investment in the International Reserve Fund, which was valued at $124.4 million, net of other than temporary impairment charges, was classified as marketable securities in our Consolidated Balance Sheet due to the halting of redemption requests in September 2008 by the International Reserve Fund.
NVIDIA CORPORATION AND SUBSIDIARIES
NOTES TO THE CONSOLIDATED FINANCIAL STATEMENTS
(Continued)
Subsequent to year-end, on January 30, 2009, we received $84.4 million from the International Reserve Fund. This was our portion of a payout of approximately 65% of the total assets of the Fund. Each shareholder’s percentage of this distribution was determined by dividing the shareholder’s total unfunded redeemed shares by the aggregate unfunded redeemed shares of the Fund, which was then used to calculate the shareholder’s pro rata portion of this distribution. We expect to receive the proceeds of our remaining investment in the International Reserve Fund, excluding the $5.6 million that we have recorded as an other than temporary impairment, by no later than October 2009, when all of the underlying securities held by the International Reserve Fund are scheduled to have matured. However, redemptions from the International Reserve Fund are currently subject to pending litigation, which could cause further delay in receipt of our funds. Reconciliation of financial assets measured at fair value on a recurring basis using significant unobservable inputs, or Level 3 inputs:
| | | Year ended January 25, 2009 | |
| | | | |
Balance, beginning of period | | | | |
| | | | |
Other than temporary impairment | | | | |
| | | | |
| | | | | |
Total financial assets at fair value classified within Level 3 were 3.7% of total assets on our Consolidated Balance Sheet as of January 25, 2009.
Note 1718 - - Quarterly Summary (Unaudited) The following table sets forth our unaudited consolidated financial, data as restated, for the last eight fiscal quarters ended January 29, 2006. For more information25, 2009.
| | | Fiscal Year 2009 Quarters Ended | |
| | | January 25, 2009 (A,B) | | | October 26, 2008 (C, D) | | | July 27, 2008 (E) | | | April 27, 2008 | |
| | | (In thousands, except per share data) | |
| Statement of Operations Data: | | | | | | | | | | | | |
| | | | | | | | | | | | | | | | |
| | | | | | | | | | | | | | | | |
| | | | | | | | | | | | | | | | |
| | | | | | | | | | | | | | | | |
Basic net income (loss) per share | | | | | | | | | | | | | | | | |
Diluted net income (loss) per share | | | | | | | | | | | | | | | | |
| | | Fiscal Year 2008 Quarters Ended | |
| | | January 27, 2008 (F) | | | October 28, 2007 | | | July 29, 2007 | | | April 29, 2007 | |
| | | (In thousands, except per share data) | |
| Statement of Operations Data: | | | | | | | | | | | | |
| | | | | | | | | | | | | | | | |
| | | | | | | | | | | | | | | | |
| | | | | | | | | | | | | | | | |
| | | | | | | | | | | | | | | | |
Basic net income per share | | | | | | | | | | | | | | | | |
Diluted net income per share | | | | | | | | | | | | | | | | |
(A) Included $18.9 million for a non-recurring charge related to a termination of development contract related to a new campus construction project we have put on these matters, please referhold.
(B) Included $8.0 million benefit from an insurance provider as reimbursement for some claims against us towards the cost arising from a weak die/packaging material set.
(C) Included $4.5 million charge towards non-recurring charge related to Note 2, “Restatementa royalty dispute.
(D) Included $8.3 million towards restructuring charges.
(E) Included $196.0 million warranty charge against cost of Consolidated Financial Statements, Audit Committeerevenue arising from a weak die/packaging material set.
(F) Included a charge of $4.0 million related to the write-off of acquired research and
Company Findings”. | | | | | | | | | | | | | | | | | | | | | | | | | | | | | | | | | | | | | | | | |
| | | Fiscal 2006 Quarters Ended |
| | | Jan. 29, 2006 | | Oct. 30, 2005 | | July 31, 2005 | | May 1, 2005 |
| | | As
Previously
Reported | | Adjustments | | | As
Restated | | As
Previously
Reported | | Adjustments | | | As
Restated | | As
Previously
Reported | | Adjustments | | | As
Restated | | As
Previously
Reported | | Adjustments | | | As
Restated |
| | | (In thousands, except per share data) |
| Statement of Operations Data: | | | | | | | | | | | | | | | | | | | | | | | | | | | | | | | | | | | | | | | | |
Revenue | | $ | 633,614 | | $ | — | | | $ | 633,614 | | $ | 583,415 | | $ | — | | | $ | 583,415 | | $ | 574,812 | | $ | — | | | $ | 574,812 | | $ | 583,846 | | $ | — | | | $ | 583,846 |
Cost of revenue | | $ | 378,674 | | $ | 138 | | | $ | 378,812 | | $ | 355,247 | | $ | 173 | | | $ | 355,420 | | $ | 357,278 | | $ | 159 | | | $ | 357,437 | | $ | 373,693 | | $ | 292 | | | $ | 373,985 |
Gross profit | | $ | 254,940 | | $ | (138 | ) | | $ | 254,802 | | $ | 228,168 | | $ | (173 | ) | | $ | 227,995 | | $ | 217,534 | | $ | (159 | ) | | $ | 217,375 | | $ | 210,153 | | $ | (292 | ) | | $ | 209,861 |
Net income | | $ | 98,052 | | $ | (678 | ) | | $ | 97,374 | | $ | 65,253 | | $ | (806 | ) | | $ | 64,447 | | $ | 74,837 | | $ | (1,004 | ) | | $ | 73,833 | | $ | 64,444 | | $ | 1,078 | | | $ | 65,522 |
Basic net income per share | | $ | 0.57 | | $ | — | | | $ | 0.57 | | $ | 0.38 | | $ | — | | | $ | 0.38 | | $ | 0.44 | | $ | — | | | $ | 0.44 | | $ | 0.38 | | $ | 0.01 | | | $ | 0.39 |
Diluted net income per share | | $ | 0.53 | | $ | (0.01 | ) | | $ | 0.52 | | $ | 0.36 | | $ | (0.01 | ) | | $ | 0.35 | | $ | 0.41 | | $ | — | | | $ | 0.41 | | $ | 0.36 | | $ | — | | | $ | 0.36 |
| | | | | | | | | | | | | | | | | | | | | | | | | | | | | | | | | | | | | | | | |
| | | Fiscal 2005 Quarters Ended |
| | | Jan. 30, 2005 | | Oct. 24, 2004 | | July 25, 2004 | | April 25, 2004 |
| | | As
Previously
Reported | | Adjustments | | | As
Restated | | As
Previously
Reported | | Adjustments | | | As
Restated | | As
Previously
Reported | | Adjustments | | | As
Restated | | As
Previously
Reported | | Adjustments | | | As
Restated |
| | | (In thousands, except per share data) |
| Statement of Operations Data: | | | | | | | | | | | | | | | | | | | | | | | | | | | | | | | | | | | | | | | | |
Revenue | | $ | 566,476 | | $ | — | | | $ | 566,476 | | $ | 515,591 | | $ | — | | | $ | 515,591 | | $ | 456,061 | | $ | — | | | $ | 456,061 | | $ | 471,905 | | $ | — | | | $ | 471,905 |
Cost of revenue | | $ | 372,661 | | $ | 392 | | | $ | 373,053 | | $ | 348,849 | | $ | 182 | | | $ | 349,031 | | $ | 315,968 | | $ | 508 | | | $ | 316,476 | | $ | 323,069 | | $ | 849 | | | $ | 323,918 |
Gross profit | | $ | 193,815 | | $ | (392 | ) | | $ | 193,423 | | $ | 166,742 | | $ | (182 | ) | | $ | 166,560 | | $ | 140,093 | | $ | (508 | ) | | $ | 139,585 | | $ | 148,836 | | $ | (849 | ) | | $ | 147,987 |
Net income | | $ | 48,009 | | $ | (3,117 | ) | | $ | 44,890 | | $ | 25,879 | | $ | (2,378 | ) | | $ | 23,501 | | $ | 5,119 | | $ | (3,449 | ) | | $ | 1,670 | | $ | 21,349 | | $ | (2,795 | ) | | $ | 18,554 |
Basic net income per share | | $ | 0.29 | | $ | (0.02 | ) | | $ | 0.27 | | $ | 0.16 | | $ | (0.02 | ) | | $ | 0.14 | | $ | 0.03 | | $ | (0.02 | ) | | $ | 0.01 | | $ | 0.13 | | $ | (0.02 | ) | | $ | 0.11 |
Diluted net income per share | | $ | 0.27 | | $ | (0.02 | ) | | $ | 0.25 | | $ | 0.15 | | $ | (0.01 | ) | | $ | 0.14 | | $ | 0.03 | | $ | (0.02 | ) | | $ | 0.01 | | $ | 0.12 | | $ | (0.02 | ) | | $ | 0.10 |
development expense from our acquisitions of Mental Images in fiscal year 2008.
NVIDIA CORPORATION AND SUBSIDIARIES
NOTES TO THE CONSOLIDATED FINANCIAL STATEMENTS -
(Continued)
Note
1819 - Subsequent
EventsEvent
Tender Offer
ULI Electronics, Inc.On February 20, 2006,11, 2009, we completed the acquisition of ULi Electronics, Inc., a leading developer of core logic technology, for approximately $53 million paid in cash.Stock Split.On March 6, 2006, we issued a press release announcingannounced that our Board of Directors approved a two-for-onecash tender offer for certain employee stock split of ouroptions. The tender offer commenced on February 11, 2009 and expired at 12:00 midnight (Pacific Time) on March 11, 2009. The tender offer applied to outstanding shares of common stock options held by employees with an exercise price equal to be effected in the form of a 100% stock dividend. The stock split will be effective on or about Thursday, April 6, 2006 for stockholders of record at the close of business on Friday, March 17, 2006 and will entitle each stockholder to receive one additional share for every outstanding share of common stock held. Upon the completiongreater than $17.50 per share. None of the stock split, NVIDIA will have approximately 360 million sharesnon-employee members of common stock outstanding. Had the stock split been given retroactive effect in our consolidated statements of income, the basic net income per share would have been $0.89, $0.30, and $0.23, and the diluted net income per share would have been $0.83, $0.28, and $0.22, for fiscal 2006, 2005, and 2004, respectively, on an unaudited basis.
Stock Repurchase.On March 6, 2006, we also announced that our Board of Directors approved an increase inor our existing stock repurchase program. We announced a $400 million increase to the original stock repurchase program we had announced in August 2004. As a result of this increase, the amount of common stock the Board of Directors has authorized to be repurchased has now been increased to a total of $700 million. The repurchases will be made from time to time in the open market, in privately negotiated transactions, or in structured stock repurchase transactions, in compliance with the Securities and Exchange Commission Rule 10b-18, subject to market conditions, applicable legal requirements, and other factors. The program does not obligate NVIDIA to acquire any particular amount of common stock and the program may be suspended at any time at our discretion.
Note 19 - Subsequent Events Related to the Review of Stock Option Practices (Discussed in Note 2 of the Notes to Consolidated Financial Statements) (Unaudited)
Listing on The NASDAQ Stock Market
On September 11, 2006, NVIDIA filed a Form 12b-25 with the SEC to report that it would not timelyofficers who file its Quarterly Report on Form 10-Q for the quarter ended July 30, 2006. On September 12, 2006 NVIDIA announced that it would request a hearing before the NASDAQ Listing Qualifications Panel, or the Panel, in response to the receipt of a NASDAQ Staff Determination letter on September 11, 2006 indicating that NVIDIA was not in compliance with the filing requirements for continued listing as set forth in Marketplace Rule 4310(c)(14). As anticipated, the letter was issued in accordance with NASDAQ procedures due to the delayed filing of NVIDIA’s Form 10-Q for the quarter ended July 30, 2006. Pending a decision by the Panel, NVIDIA shares will remain listed on the NASDAQ Global Select Stock Market. On October 19, 2006, we appeared for an oral hearing before the Panel. The Panel confirmed that our appeal had stayed the delisting action pending a final written decision by the Panel. The Panel’s decision is still pending. There can be no assurances that the Panel will grant our request for continued listing; however, by filing all of our required periodic reports with the SEC, we believe that we will have remedied our non-compliance with Marketplace Rule 4310(c)(14).
Lawsuits related to our historical stock option granting practices
Since September 29, 2006, nine derivative cases have been filed in state and federal courts asserting claims concerning errors related to our historical stock option granting practices and associated accounting for stock-based compensation expense. These complaints have been filed in various courts, including the California Superior Court, Santa Clara County, the United States District Court for the Northern District of California, and the Court of Chancery of the State of Delaware in and for New Castle County. All cases purport to be brought derivatively on behalf of NVIDIA against members of our board of directors and several of our current and former officers. The cases are not currently consolidated, although all allege in substantially similar fashion claims for, among other things, breach of fiduciary duty, unjust enrichment, insider selling, abuse of control, gross mismanagement, waste, constructive fraud, and violations of Sections 10(b) and 14(a)under Section 16(a) of the Securities Exchange Act of 1934. The plaintiffs seek1934, including our former Chief Financial Officer, Marvin D. Burkett, were eligible to recoverparticipate in the Offer. All eligible options with exercise prices less than $28.00 per share, but not less than $17.50 per share were eligible to receive a cash payment of $3.00 per option in exchange for NVIDIA, among other things, damages in an unspecified amount, rescission, punitive damages, treble damages for insider selling, and fees and costs. Plaintiffs also seek an accounting, a constructive trust and other equitable relief. We intend to take all appropriate action in response to these complaints.
We voluntarily contacted the SEC regarding the Audit Committee’s review and, ascancellation of the dateeligible option. All eligible options with exercise prices greater than $28.00 per share were eligible to receive a cash payment of $2.00 per option in exchange for the cancellation of the filing of this Annual Report on Form 10-K/A,eligible option.
We use equity to promote employee retention and provide an incentive vehicle valued by employees that is also aligned to stockholder interest. However, our stock price has declined significantly over the SEC is continuing the inquirypast year, and all of our historicaleligible options are “out-of-the-money” (i.e., have exercise prices above our stock option grant practices it beganprice). Therefore, we provided an incentive to employees with an opportunity to obtain cash payment for their eligible options. Also, the tender offer is expected to increase the number of shares available for issuance under our 2007 Equity Incentive Plan to the extent eligible options were tendered in late August 2006. In October 2006,this tender offer. The tender offer is also expected to reduce the potential dilution to our stockholders that is represented by outstanding stock options, which become additional outstanding shares of our common stock upon exercise.
As of January 25, 2009, there were approximately 33.1 million options eligible to participate in the tender offer. If all these options were tendered and accepted in the offer, the aggregate cash purchase price for these options would be approximately $92.0 million. As a result of the tender offer, we metmay incur a non-recurring charge of up to approximately $150.0 million if all of the unvested eligible options are tendered. This charge would be reflected in our financial results for the first fiscal quarter of fiscal year 2010 and represents stock-based compensation expense, consisting of the remaining unamortized stock-based compensation expense associated with the SEC and provided it with a reviewunvested portion of the statuseligible options tendered in the offer, stock-based compensation expense resulting from amounts paid in excess of the Audit Committee’s reviewfair value of the underlying options, if any, plus associated payroll taxes and professional fees.
We are currently tallying information on the number of options tendered under the offer to determine the actual aggregate cash to be paid in November 2006 we voluntarily providedexchange for the SEC with further documents. We plancancellation of the eligible options and the non-recurring charge to continuebe incurred pertaining to cooperate with the SEC in its inquiry.unvested eligible options that have been tendered.
NVIDIA CORPORATION AND SUBSIDIARIES SCHEDULE II - VALUATION AND QUALIFYING ACCOUNTS
| | Balance at | | | | | | | |
| | | | |
Year ended January 25, 2009 | | | | | | | | | |
Deferred tax valuation allowance | | | | | | | | | | | | | | | | |
Allowance for doubtful accounts | | | | | | | | | | | | | | | | |
| | | | | | | | | | | | | | | | | |
Year ended January 27, 2008 | | | | | | | | | |
Deferred tax valuation allowance | | | | | | | | | | | | | | | | |
Allowance for doubtful accounts | | | | | | | | | | | | | | | | |
| | | | | | | | | | | | | | | | | |
Year ended January 28, 2007 | | | | | | | | | | | | | | | | |
Deferred tax valuation allowance | | | | | | | | | | | | | | | | |
Allowance for doubtful accounts | | | | | | | | | | | | | | | | |
| | | | | | | | | | | | | | | | | |
(1) | | | | | | | | | | | | | | |
Description | | Balance at
Beginning
of Period | | Additions (3) | | | Deductions | | | Balance
at End of Period |
| | | (In thousands) |
Year ended January 29, 2006 | | | | | | | | | | | | | | |
Allowance for sales returns and allowances | | $ | 11,687 | | $ | 35,127 | | | $ | (36,575 | )(1) | | $ | 10,239 |
| | | | | | | | | | | | | | |
Allowance for doubtful accounts | | $ | 1,466 | | $ | (492 | ) | | $ | (376 | )(2) | | $ | 598 |
| | | | | | | | | | | | | | |
Year ended January 30, 2005 | | | | | | | | | | | | | | |
Allowance for sales returns and allowances | | $ | 9,421 | | $ | 22,463 | | | $ | (20,197 | )(1) | | $ | 11,687 |
| | | | | | | | | | | | | | |
Allowance for doubtful accounts | | $ | 2,310 | | $ | (844 | ) | | $ | — | | | $ | 1,466 |
| | | | | | | | | | | | | | |
Year ended January 25, 2004 | | | | | | | | | | | | | | |
Allowance for sales returns and allowances | | $ | 13,228 | | $ | 23,796 | | | $ | (27,603 | )(1) | | $ | 9,421 |
| | | | | | | | | | | | | | |
Allowance for doubtful accounts | | $ | 4,240 | | $ | 731 | | | $ | (2,661 | )(2) | | $ | 2,310 |
| | | | | | | | | | | | | | |
(2) Represents uncollectible accounts written off against the allowance for doubtful accounts.
(3) Additions to allowance for doubtful accounts includes $0.5 million related to our acquisitions of ULi Electronics, Inc., Hybrid Graphics Ltd. and PortalPlayer, Inc.
(4) Represents change in valuation allowance primarily related to state deferred tax assets that management has determined not likely to be realized due, in part, to projections of future state taxable income.
(5) Represents derecognition of the valuation allowance related to the derecognition of deferred tax assets for the excess tax benefits from stock-based compensation not yet realized as of January 28, 2007.
109
(1) | Represents amounts written off against the allowance for sales returns. |
(2) | Represents uncollectible accounts written off against the allowance for doubtful accounts. |
(3) | Allowances for sales returns are charged as a reduction to revenue. Allowances for doubtful accounts are charged to expenses. |
EXHIBIT INDEX | | | | | | | | | | | | |
Exhibit No. | | Exhibit Description | | Form | | File Number | | Exhibit | | Filing
Date | | Filed Herewith |
| 2.1 | | Asset Purchase Agreement, dated as of December 15, 2000, by and among NVIDIA Corporation, NVIDIA US Investment Company and 3dfx Interactive, Inc. | | 10-K | | 0-23985 | | 2.1 | | 4/27/01 | | |
| | | | | | |
| 3.1 | | Amended and Restated Certificate of Incorporation | | S-8 | | 333-74905 | | 4.1 | | 3/23/99 | | |
| | | | | | |
| 3.2 | | Certificate of Amendment of Amended and Restated Certificate of Incorporation | | 10-Q | | 0-23985 | | 3.4 | | 9/10/02 | | |
| | | | | | |
| 3.3 | | Bylaws of NVIDIA Corporation, Amended and Restated as of March 7, 2006 | | 10-K | | 0-23985 | | 3.3 | | 3/16/06 | | |
| | | | | | |
| 4.1 | | Reference is made to Exhibits 3.1, 3.2 and 3.3 | | | | | | | | | | |
| | | | | | |
| 4.2 | | Specimen Stock Certificate | | S-1 | | 333-47495 | | 4.2 | | 4/24/98 | | |
| | | | | | |
| 4.3 | | Second Amended and Restated Investors’ Rights Agreement, dated August 19, 1997 between the Company and the parties indicated thereto and First Amendment to Second Amended and Restated Investors’ Rights Agreement, dated July 22, 1998 | | S-1 | | 333-47495 | | 4.3 | | 11/20/98 | | |
| | | | | | |
| 4.4 | | Second Amendment to Second Amended and Restated Investors’ Rights Agreement, dated April 12, 1999 | | 10-Q | | 0-23985 | | 4.4 | | 6/15/99 | | |
| | | | | | |
| 10.1 | | Form of Indemnity Agreement between NVIDIA Corporation and each of its directors and officers | | 8-K | | 0-23985 | | | | 3/7/06 | | |
| | | | | | |
| 10.2+ | | 1998 Equity Incentive Plan, as amended | | 8-K | | 0-23985 | | 10.2 | | 3/13/06 | | |
| | | | | | |
| 10.3+ | | 1998 Equity Incentive Plan ISO, as amended | | 10-Q | | 0-23985 | | 10.5 | | 11/22/04 | | |
| | | | | | |
| 10.4+ | | 1998 Equity Incentive Plan NSO, as amended | | 10-Q | | 0-23985 | | 10.6 | | 11/22/04 | | |
| | | | | | |
| 10.5+ | | Certificate of Stock Option Grant | | 10-Q | | 0-23985 | | 10.7 | | 11/22/04 | | |
| | | | | | |
| 10.6+ | | 1998 Employee Stock Purchase Plan, as amended | | S-8 | | 333-51520 | | 99.4 | | 12/8/00 | | |
| | | | | | |
| 10.7+ | | Form of Employee Stock Purchase Plan Offering, as amended | | S-8 | | 333-100010 | | 99.5 | | 9/23/02 | | |
| | | | | | |
| 10.8+ | | Form of Employee Stock Purchase Plan Offering, as amended - International Employees | | S-8 | | 333-100010 | | 99.6 | | 9/23/02 | | |
| | | | | | |
| 10.9+ | | 1998 Non-Employee Directors’ Stock Option Plan, as amended | | 10-Q/A | | 0-23985 | | 10.7 | | 7/03/02 | | |
| | | | | Incorporated by Reference | | |
| Exhibit No. | | Exhibit Description | | Schedule/Form | | | File Number | | | Exhibit | | Filing Date |
| | 2.1 | | Agreement and Plan of Merger by and among NVIDIA Corporation, Partridge Acquisition, Inc. and PortalPlayer, Inc. dated 11/6/06 | | | 8-K | | | | 0-23985 | | | | 2.1 | | 11/9/2006 |
| | 3.1 | | Amended and Restated Certificate of Incorporation | | | S-8 | | | | 333-74905 | | | | 4.1 | | 3/23/1999 |
| | 3.2 | | Certificate of Amendment of Amended and Restated Certificate of Incorporation | | | 10-Q | | | | 0-23985 | | | | 3.1 | | 8/21/2008 |
| | 3.3 | | Bylaws of NVIDIA Corporation, Amended and Restated as of February 12, 2009 | | | 8-K | | | | 0-23985 | | | | 3.1 | | 2/19/2009 |
| | 4.1 | | Reference is made to Exhibits 3.1, 3.2 and 3.3 | | | | | | | | | | | | | |
| | 4.2 | | Specimen Stock Certificate | | | S-1/A | | | | 333-47495 | | | | 4.2 | | 4/24/1998 |
| | 10.1 | | Form of Indemnity Agreement between NVIDIA Corporation and each of its directors and officers | | | 8-K | | | | 0-23985 | | | | 10.1 | | 3/7/2006 |
| | 10.2 | + | 1998 Equity Incentive Plan, as amended | | | 8-K | | | | 0-23985 | | | | 10.2 | | 3/13/2006 |
| | 10.3 | + | 1998 Equity Incentive Plan ISO, as amended | | | 10-Q | | | | 0-23985 | | | | 10.5 | | 11/22/2004 |
| | 10.4 | + | 1998 Equity Incentive Plan NSO, as amended | | | 10-Q | | | | 0-23985 | | | | 10.6 | | 11/22/2004 |
| | 10.5 | + | Certificate of Stock Option Grant | | | 10-Q | | | | 0-23985 | | | | 10.7 | | 11/22/2004 |
| | 10.6 | + | 1998 Non-Employee Directors’ Stock Option Plan, as amended | | | 8-K | | | | 0-23985 | | | | 10.1 | | 4/3/2006 |
| | 10.7 | + | 1998 Non-Employee Directors’ Stock Option Plan (Annual Grant - Board Service), as amended | | | 10-Q | | | | 0-23985 | | | | 10.1 | | 11/22/2004 |
| | 10.8 | + | 1998 Non-Employee Directors’ Stock Option Plan (Committee Grant - Committee Service), as amended | | | 10-Q | | | | 0-23985 | | | | 10.2 | | 11/22/2004 |
| | 10.9 | + | 1998 Non-Employee Directors’ Stock Option Plan (Initial Grant) | | | 10-Q | | | | 0-23985 | | | | 10.3 | | 11/22/2004 |
| | 10.10 | + | 1998 Employee Stock Purchase Plan, as amended and restated | | | 10-Q | | | | 0-23985 | | | | 10.2 | | 5/22/2008 |
| | 10.11 | + | 2000 Nonstatutory Equity Incentive Plan, as amended | | | SC TO-1 | | | | 005-56649 | | | | 99 | (d)(1)(A) | 11/29/2006 |
| | 10.12 | + | 2000 NonStatutory Equity Incentive Plan NSO | | | SC TO-1 | | | | 005-56649 | | | | 99.1 | (d)(1)(B) | 11/29/2006 |
| | 10.13 | + | PortalPlayer, Inc. 1999 Stock Option Plan and Form of Agreements thereunder | | | S-8 | | | | 333-140021 | | | | 99.1 | | 1/16/2007 |
| | 10.14 | + | PortalPlayer, Inc. Amended and Restated 2004 Stock Incentive Plan | | | S-8 | | | | 333-140021 | | | | 99.2 | | 1/16/2007 |
| | 10.15 | + | 2007 Equity Incentive Plan | | | 8-K | | | | 0-23985 | | | | 10.1 | | 6/27/2007 |
| | 10.16 | + | 2007 Equity Incentive Plan - Non Statutory Stock Option (Annual Grant - Board Service) | | | 10-Q | | | | 0-23985 | | | | 10.2 | | 8/22/2007 |
| | 10.17 | + | 2007 Equity Incentive Plan - Non Statutory Stock Option (Annual Grant - Committee Service) | | | 10-Q | | | | 0-23985 | | | | 10.3 | | 8/22/2007 |
| | 10.18 | + | 2007 Equity Incentive Plan - Non Statutory Stock Option (Initial Grant) | | | 10-Q | | | | 0-23985 | | | | 10.4 | | 8/22/2007 |
(Continued)
| | | | | Incorporated by Reference | | |
| Exhibit No. | | Exhibit Description | | Schedule/Form | | | File Number | | | Exhibit | | Filing Date |
| | 10.19 | + | 2007 Equity Incentive Plan - Non Statutory Stock Option | | | 10-Q | | | | 0-23985 | | | | 10.5 | | 8/22/2007 |
| | 10.20 | + | 2007 Equity Incentive Plan - Incentive Stock Option | | | 10-Q | | | | 0-23985 | | | | 10.6 | | 8/22/2007 |
| | 10.21 | + | 2007 Equity Incentive Plan – Restricted Stock Unit Grant Notice and Restricted Stock Unit Purchase Agreement | | | 8-K | | | | 0-23985 | | | | 10.1 | | 2/11/2009 |
| | 10.22 | + | Fiscal Year 2008 Variable Compensation Plan | | | 8-K | | | | 0-23985 | | | | 10.1 | | 4/5/2007 |
| | 10.23 | + | Fiscal Year 2009 Variable Compensation Plan | | | 8-K | | | | 0-23985 | | | | 10.1 | | 4/21/2008 |
| | 10.24 | | Lease dated April 4, 2000 between NVIDIA Corporation and Sobrato Interests III for Building A | | | S-3/A | | | | 333-33560 | | | | 10.1 | | 4/20/2000 |
| | 10.25 | | Lease dated April 4, 2000 between NVIDIA Corporation and Sobrato Interests III for Building B | | | S-3/A | | | | 333-33560 | | | | 10.2 | | 4/20/2000 |
| | 10.26 | | Lease dated April 4, 2000 between NVIDIA Corporation and Sobrato Interests III for Building C | | | S-3/A | | | | 333-33560 | | | | 10.3 | | 4/20/2000 |
| | 10.27 | | Lease dated April 4, 2000 between NVIDIA Corporation and Sobrato Interests III for Building D | | | S-3/A | | | | 333-33560 | | | | 10.4 | | 4/20/2000 |
| | 10.28 | | Amended and Restated Agreement of Purchase and Sale by and between Harvest-Granite San Tomas LLC and Harvest 2400, LLC dated January 31, 2008 | | | 10-Q | | | | 0-23985 | | | | 10.3 | | 5/22/2008 |
| | 10.29 | + | Offer Letter, dated January 28, 2009, with David White | | | 8-K | | | | 0-23985 | | | | 10.1 | | 2/27/2009 |
| | 21.1 | * | List of Registrant’s Subsidiaries | | | | | | | | | | | | | |
| | 23.1 | * | Consent of PricewaterhouseCoopers LLP | | | | | | | | | | | | | |
| | 24.1 | * | Power of Attorney (included in signature page) | | | | | | | | | | | |
| | 31.1 | * | Certification of Chief Executive Officer as required by Rule 13a-14(a) of the Securities Exchange Act of 1934 | | | | | | | | | | | |
| | 31.2 | * | Certification of Chief Financial Officer as required by Rule 13a-14(a) of the Securities Exchange Act of 1934 | | | | | | | | | | | |
| | 32.1# | * | Certification of Chief Executive Officer as required by Rule 13a-14(b) of the Securities Exchange Act of 1934 | | | | | | | | | | | |
| | 32.2# | * | Certification of Chief Financial Officer as required by Rule 13a-14(b) of the Securities Exchange Act of 1934 | | | | | | | | | | | |
* Filed herewith
+ Management contract or compensatory plan or arrangement.
# In accordance with Item 601(b)(32)(ii) of Regulation S-K and SEC Release Nos. 33-8238 and 34-47986, Final Rule: Management’s Reports on Internal Control Over Financial Reporting and Certification of Disclosure in Exchange Act Periodic Reports, the certifications furnished in Exhibits 32.1 and 32.2 hereto are deemed to accompany this Form 10-K and will not be deemed “filed” for purpose of Section 18 of the Exchange Act. Such certifications will not be deemed to be incorporated by reference into any filing under the Securities Act or the Exchange Act, except to the extent that the registrant specifically incorporates it by reference.
(CONTINUED) | | | | | | | | | | | | |
Exhibit No. | | Exhibit Description | | Form | | File Number | | Exhibit | | Filing
Date | | Filed
Herewith |
| 10.10+ | | 1998 Non-Employee Directors’ Stock Option Plan (Annual Grant - Board Service), as amended | | 10-Q | | 0-23985 | | 10.1 | | 11/22/04 | | |
| | | | | | |
| 10.11+ | | 1998 Non-Employee Directors’ Stock Option Plan (Committee Grant - Committee Service), as amended | | 10-Q | | 0-23985 | | 10.2 | | 11/22/04 | | |
| | | | | | |
| 10.12+ | | 1998 Non-Employee Directors’ Stock Option Plan (Initial Grant) | | 10-Q | | 0-23985 | | 10.3 | | 11/22/04 | | |
| | | | | | |
| 10.13+ | | 2000 Nonstatutory Equity Incentive Plan, as amended | | 10-K | | 0-23985 | | 10.11 | | 4/25/03 | | |
| | | | | | |
| 10.14 | | Lease dated April 4, 2000 between NVIDIA Corporation and Sobrato Interests III for Building A | | S-3/A #1 | | 333-33560 | | 10.1 | | 4/20/00 | | |
| | | | | | |
| 10.15 | | Lease dated April 4, 2000 between NVIDIA Corporation and Sobrato Interests III for Building B | | S-3/A #1 | | 333-33560 | | 10.2 | | 4/20/00 | | |
| | | | | | |
| 10.16 | | Lease dated April 4, 2000 between NVIDIA Corporation and Sobrato Interests III for Building C | | S-3/A #1 | | 333-33560 | | 10.3 | | 4/20/00 | | |
| | | | | | |
| 10.17 | | Lease dated April 4, 2000 between NVIDIA Corporation and Sobrato Interests III for Building D | | S-3/A #1 | | 333-33560 | | 10.4 | | 4/20/00 | | |
| | | | | | |
| 10.18+ | | NVIDIA Corporation Fiscal Year 2006 Variable Compensation Plan | | 8-K | | 0-23985 | | 10.1 | | 5/13/06 | | |
| | | | | | |
| 21.1 | | List of Registrant’s Subsidiaries | | 10-K | | 0-23985 | | 21.1 | | 3/16/06 | | |
| | | | | | |
| 23.1 | | Consent of PricewaterhouseCoopers LLP | | | | | | | | | | * |
| | | | | | |
| 23.2 | | Consent of KPMG LLP | | | | | | | | | | * |
| | | | | | |
| 24.1 | | Power of Attorney | | 10-K | | 0-23985 | | | | 3/16/06 | | |
| | | | | | |
| 31.1 | | Rule 13a-14(a) Certification of Chief Executive Office | | | | | | | | | | * |
| | | | | | |
| 31.2 | | Rule 13a-14(a) Certification of the Chief Financial Officer | | | | | | | | | | * |
| | | | | | |
| 32.1# | | Statement of the Chief Executive Officer under Rule 13a - 14(b) (18 U.S.C Section 1350) | | | | | | | | | | * |
| | | | | | |
| 32.2# | | Statement of the Chief Financial Officer under Rule 13a - 14(b) (18 U.S.C Section 1350) | | | | | | | | | | * |
| | | | | | |
| 99.1 | | Selected Consolidated Financial Data | | | | | | | | | | * |
+ | Management contract, compensatory plan or arrangement. |
# | In accordance with Item 601(b)(32)(ii) of Regulation S-K and SEC Release Nos. 33-8238 and 34-47986, Final Rule: Management’s Reports on Internal Control Over Financial Reporting and Certification of Disclosure in Exchange Act Periodic Reports, the certifications furnished in Exhibits 32.1 and 32.2 hereto are deemed to accompany this Form 10-K/A and will not be deemed “filed” for purpose of Section 18 of the Exchange Act. Such certifications will not be deemed to be incorporated by reference into any filing under the Securities Act or the Exchange Act, except to the extent that the registrant specifically incorporates it by reference. |
Copies of above exhibits not contained herein are available to any stockholder upon written request to: Investor Relations: NVIDIA Corporation, 2701 San Tomas Expressway, Santa Clara, CA 95050.
Pursuant to the requirements of Section 13 or 15(d) of the Securities Exchange Act of 1934, the Registrant has duly caused this report to be signed on its behalf by the undersigned, thereunto duly authorized, on
November 29, 2006.March 13, 2009. | | |
| NVIDIA Corporation |
| By: | /s/ Jen-Hsun Huang |
By | | /s/ JEN-HSUN HUANG
|
| | Jen-Hsun Huang |
| | President and Chief Executive Officer |
POWER OF ATTORNEY
KNOW ALL PERSONS BY THESE PRESENTS, that each person whose signature appears below constitutes and appoints Jen-Hsun Huang and David L. White, and each or any one of them, his true and lawful attorney-in-fact and agent, with full power of substitution and resubstitution, for him and in his name, place and stead, in any and all capacities, to sign any and all amendments (including posting effective amendments) to this report, and to file the same, with all exhibits thereto, and other documents in connection therewith, with the Securities and Exchange Commission, granting unto said attorneys-in-facts and agents, and each of them, full power and authority to do and perform each and every act and thing requisite and necessary to be done in connection therewith, as fully to all intents and purposes as he might or could do in person, hereby ratifying and confirming all that said attorneys-in-fact and agents, or any of them, or their or his substitutes or substitutes, may lawfully do or cause to be done by virtue hereof.
Pursuant to the requirements of the Securities Exchange Act of 1934, this report has been signed below by the following persons on behalf of the registrant and in the capacities and on the dates indicated.
| Signature | Title | | | Date |
Signature
| | Title
| | Date
|
/s/ JEN-HSUN HUANG Jen-Hsun Huang
| | President, Chief Executive Officer and Director (Principal (Principal Executive Officer) | March 13, 2009 |
Jen-Hsun Huang | | November 29, 2006 |
| | |
/s/ MARVIN D. BURKETT Marvin D. Burkett
DAVID L. WHITE | | Chief Financial Officer (Principal Financial and Accounting Officer) | March 13, 2009 |
| David L. White | | November 29, 2006 |
| | |
/s/ TENCH COXE* COXE | Director | March 13, 2009 |
Tench Coxe | | |
| /s/ MARK STEVENS | Director | March 13, 2009 |
| Mark Stevens | | November 29, 2006 |
| | |
/s/ STEVEN CHU*
Steven Chu
| | Director | | November 29, 2006 |
| | |
/s/ JAMES C. GAITHER* GAITHER | Director | March 13, 2009 |
| James C. Gaither | | Director | | November 29, 2006 |
| | |
/s/ HARVEY C. JONES* JONES | Director | March 13, 2009 |
Harvey C. Jones | | Director | | November 29, 2006 |
| | |
/s/ MARK L. PERRY* PERRY | Director | March 13, 2009 |
| Mark L. Perry | | Director | | November 29, 2006 |
| | |
/s/ WILLIAM J. MILLER* MILLER | Director | March 13, 2009 |
| William J. Miller | | Director | | November 29, 2006 |
| | |
/s/ A. BROOKE SEAWELL* A. Brooke Seawell
| SEAWELL | Director | | November 29, 2006March 13, 2009 |
| | |
| |
*By: | | /s/ JEN-HSUN HUANG |
| | Jen-Hsun Huang
Attorney-In-Fact
|
EXHIBIT INDEX
| | | | | | | | | | | | |
Exhibit
No. | | Exhibit Description | | Form | | File Number | | Exhibit | | Filing
Date | | Filed Herewith |
| 2.1 | | Asset Purchase Agreement, dated as of December 15, 2000, by and among NVIDIA Corporation, NVIDIA US Investment Company and 3dfx Interactive, Inc. | | 10-K | | 0-23985 | | 2.1 | | 4/27/01 | | |
| | | | | | |
| 3.1 | | Amended and Restated Certificate of Incorporation | | S-8 | | 333-74905 | | 4.1 | | 3/23/99 | | |
| | | | | | |
| 3.2 | | Certificate of Amendment of Amended and Restated Certificate of Incorporation | | 10-Q | | 0-23985 | | 3.4 | | 9/10/02 | | |
| | | | | | |
| 3.3 | | Bylaws of NVIDIA Corporation, Amended and Restated as of March 7, 2006 | | 10-K | | 0-23985 | | 3.3 | | 3/16/06 | | |
| | | | | | |
| 4.1 | | Reference is made to Exhibits 3.1, 3.2 and 3.3 | | | | | | | | | | |
| | | | | | |
| 4.2 | | Specimen Stock Certificate | | S-1 | | 333-47495 | | 4.2 | | 4/24/98 | | |
| | | | | | |
| 4.3 | | Second Amended and Restated Investors’ Rights Agreement, dated August 19, 1997 between the Company and the parties indicated thereto and First Amendment to Second Amended and Restated Investors’ Rights Agreement, dated July 22, 1998 | | S-1 | | 333-47495 | | 4.3 | | 11/20/98 | | |
| | | | | | |
| 4.4 | | Second Amendment to Second Amended and Restated Investors’ Rights Agreement, dated April 12, 1999 | | 10-Q | | 0-23985 | | 4.4 | | 6/15/99 | | |
| | | | | | |
| 10.1 | | Form of Indemnity Agreement between NVIDIA Corporation and each of its directors and officers | | 8-K | | 0-23985 | | | | 3/7/06 | | |
| | | | | | |
| 10.2+ | | 1998 Equity Incentive Plan, as amended | | 8-K | | 0-23985 | | 10.2 | | 3/13/06 | | |
| | | | | | |
| 10.3+ | | 1998 Equity Incentive Plan ISO, as amended | | 10-Q | | 0-23985 | | 10.5 | | 11/22/04 | | |
| | | | | | |
| 10.4+ | | 1998 Equity Incentive Plan NSO, as amended | | 10-Q | | 0-23985 | | 10.6 | | 11/22/04 | | |
| | | | | | |
| 10.5+ | | Certificate of Stock Option Grant | | 10-Q | | 0-23985 | | 10.7 | | 11/22/04 | | |
| | | | | | |
| 10.6+ | | 1998 Employee Stock Purchase Plan, as amended | | S-8 | | 333-51520 | | 99.4 | | 12/8/00 | | |
| | | | | | |
| 10.7+ | | Form of Employee Stock Purchase Plan Offering, as amended | | S-8 | | 333-100010 | | 99.5 | | 9/23/02 | | |
| | | | | | |
| 10.8+ | | Form of Employee Stock Purchase Plan Offering, as amended - International Employees | | S-8 | | 333-100010 | | 99.6 | | 9/23/02 | | |
| | | | | | |
| 10.9+ | | 1998 Non-Employee Directors’ Stock Option Plan, as amended | | 10-Q/A | | 0-23985 | | 10.7 | | 7/03/02 | | |
| | | | Incorporated by Reference | | |
| Exhibit No. | | Exhibit Description | | Schedule/Form | | | File Number | | | Exhibit | | Filing Date |
| | 2.1 | | Agreement and Plan of Merger by and among NVIDIA Corporation, Partridge Acquisition, Inc. and PortalPlayer, Inc. dated 11/6/06 | | | 8-K | | | | 0-23985 | | | | 2.1 | | 11/9/2006 |
| | 3.1 | | Amended and Restated Certificate of Incorporation | | | S-8 | | | | 333-74905 | | | | 4.1 | | 3/23/1999 |
| | 3.2 | | Certificate of Amendment of Amended and Restated Certificate of Incorporation | | | 10-Q | | | | 0-23985 | | | | 3.1 | | 8/21/2008 |
| | 3.3 | | Bylaws of NVIDIA Corporation, Amended and Restated as of February 12, 2009 | | | 8-K | | | | 0-23985 | | | | 3.1 | | 2/19/2009 |
| | 4.1 | | Reference is made to Exhibits 3.1, 3.2 and 3.3 | | | | | | | | | | | | | |
| | 4.2 | | Specimen Stock Certificate | | | S-1/A | | | | 333-47495 | | | | 4.2 | | 4/24/1998 |
| | 10.1 | | Form of Indemnity Agreement between NVIDIA Corporation and each of its directors and officers | | | 8-K | | | | 0-23985 | | | | 10.1 | | 3/7/2006 |
| | 10.2 | + | 1998 Equity Incentive Plan, as amended | | | 8-K | | | | 0-23985 | | | | 10.2 | | 3/13/2006 |
| | 10.3 | + | 1998 Equity Incentive Plan ISO, as amended | | | 10-Q | | | | 0-23985 | | | | 10.5 | | 11/22/2004 |
| | 10.4 | + | 1998 Equity Incentive Plan NSO, as amended | | | 10-Q | | | | 0-23985 | | | | 10.6 | | 11/22/2004 |
| | 10.5 | + | Certificate of Stock Option Grant | | | 10-Q | | | | 0-23985 | | | | 10.7 | | 11/22/2004 |
| | 10.6 | + | 1998 Non-Employee Directors’ Stock Option Plan, as amended | | | 8-K | | | | 0-23985 | | | | 10.1 | | 4/3/2006 |
| | 10.7 | + | 1998 Non-Employee Directors’ Stock Option Plan (Annual Grant - Board Service), as amended | | | 10-Q | | | | 0-23985 | | | | 10.1 | | 11/22/2004 |
| | 10.8 | + | 1998 Non-Employee Directors’ Stock Option Plan (Committee Grant - Committee Service), as amended | | | 10-Q | | | | 0-23985 | | | | 10.2 | | 11/22/2004 |
| | 10.9 | + | 1998 Non-Employee Directors’ Stock Option Plan (Initial Grant) | | | 10-Q | | | | 0-23985 | | | | 10.3 | | 11/22/2004 |
| | 10.10 | + | 1998 Employee Stock Purchase Plan, as amended and restated | | | 10-Q | | | | 0-23985 | | | | 10.2 | | 5/22/2008 |
| | 10.11 | + | 2000 Nonstatutory Equity Incentive Plan, as amended | | | SC TO-1 | | | | 005-56649 | | | | 99 | (d)(1)(A) | 11/29/2006 |
| | 10.12 | + | 2000 NonStatutory Equity Incentive Plan NSO | | | SC TO-1 | | | | 005-56649 | | | | 99.1 | (d)(1)(B) | 11/29/2006 |
| | 10.13 | + | PortalPlayer, Inc. 1999 Stock Option Plan and Form of Agreements thereunder | | | S-8 | | | | 333-140021 | | | | 99.1 | | 1/16/2007 |
| | 10.14 | + | PortalPlayer, Inc. Amended and Restated 2004 Stock Incentive Plan | | | S-8 | | | | 333-140021 | | | | 99.2 | | 1/16/2007 |
| | 10.15 | + | 2007 Equity Incentive Plan | | | 8-K | | | | 0-23985 | | | | 10.1 | | 6/27/2007 |
| | 10.16 | + | 2007 Equity Incentive Plan - Non Statutory Stock Option (Annual Grant - Board Service) | | | 10-Q | | | | 0-23985 | | | | 10.2 | | 8/22/2007 |
| | 10.17 | + | 2007 Equity Incentive Plan - Non Statutory Stock Option (Annual Grant - Committee Service) | | | 10-Q | | | | 0-23985 | | | | 10.3 | | 8/22/2007 |
| | 10.18 | + | 2007 Equity Incentive Plan - Non Statutory Stock Option (Initial Grant) | | | 10-Q | | | | 0-23985 | | | | 10.4 | | 8/22/2007 |
(Continued)
| | | | Incorporated by Reference | | |
| Exhibit No. | | Exhibit Description | | Schedule/Form | | | File Number | | | Exhibit | | Filing Date |
| | 10.19 | + | 2007 Equity Incentive Plan - Non Statutory Stock Option | | | 10-Q | | | | 0-23985 | | | | 10.5 | | 8/22/2007 |
| | 10.20 | + | 2007 Equity Incentive Plan - Incentive Stock Option | | | 10-Q | | | | 0-23985 | | | | 10.6 | | 8/22/2007 |
| | 10.21 | + | 2007 Equity Incentive Plan – Restricted Stock Unit Grant Notice and Restricted Stock Unit Purchase Agreement | | | 8-K | | | | 0-23985 | | | | 10.1 | | 2/11/2009 |
| | 10.22 | + | Fiscal Year 2008 Variable Compensation Plan | | | 8-K | | | | 0-23985 | | | | 10.1 | | 4/5/2007 |
| | 10.23 | + | Fiscal Year 2009 Variable Compensation Plan | | | 8-K | | | | 0-23985 | | | | 10.1 | | 4/21/2008 |
| | 10.24 | | Lease dated April 4, 2000 between NVIDIA Corporation and Sobrato Interests III for Building A | | | S-3/A | | | | 333-33560 | | | | 10.1 | | 4/20/2000 |
| | 10.25 | | Lease dated April 4, 2000 between NVIDIA Corporation and Sobrato Interests III for Building B | | | S-3/A | | | | 333-33560 | | | | 10.2 | | 4/20/2000 |
| | 10.26 | | Lease dated April 4, 2000 between NVIDIA Corporation and Sobrato Interests III for Building C | | | S-3/A | | | | 333-33560 | | | | 10.3 | | 4/20/2000 |
| | 10.27 | | Lease dated April 4, 2000 between NVIDIA Corporation and Sobrato Interests III for Building D | | | S-3/A | | | | 333-33560 | | | | 10.4 | | 4/20/2000 |
| | 10.28 | | Amended and Restated Agreement of Purchase and Sale by and between Harvest-Granite San Tomas LLC and Harvest 2400, LLC dated January 31, 2008 | | | 10-Q | | | | 0-23985 | | | | 10.3 | | 5/22/2008 |
| | 10.29 | + | Offer Letter, dated January 28, 2009, with David White | | | 8-K | | | | 0-23985 | | | | 10.1 | | 2/27/2009 |
| | 21.1 | * | List of Registrant’s Subsidiaries | | | | | | | | | | | | | |
| | 23.1 | * | Consent of PricewaterhouseCoopers LLP | | | | | | | | | | | | | |
| | 24.1 | * | Power of Attorney (included in signature page) | | | | | | | | | | | | | |
| | 31.1 | * | Certification of Chief Executive Officer as required by Rule 13a-14(a) of the Securities Exchange Act of 1934 | | | | | | | | | | | | | |
| | 31.2 | * | Certification of Chief Financial Officer as required by Rule 13a-14(a) of the Securities Exchange Act of 1934 | | | | | | | | | | | | | |
| | 32.1# | * | Certification of Chief Executive Officer as required by Rule 13a-14(b) of the Securities Exchange Act of 1934 | | | | | | | | | | | | | |
| | 32.2# | * | Certification of Chief Financial Officer as required by Rule 13a-14(b) of the Securities Exchange Act of 1934 | | | | | | | | | | | | | |
* Filed herewith
+ Management contract or compensatory plan or arrangement.
# In accordance with Item 601(b)(32)(ii) of Regulation S-K and SEC Release Nos. 33-8238 and 34-47986, Final Rule: Management’s Reports on Internal Control Over Financial Reporting and Certification of Disclosure in Exchange Act Periodic Reports, the certifications furnished in Exhibits 32.1 and 32.2 hereto are deemed to accompany this Form 10-K and will not be deemed “filed” for purpose of Section 18 of the Exchange Act. Such certifications will not be deemed to be incorporated by reference into any filing under the Securities Act or the Exchange Act, except to the extent that the registrant specifically incorporates it by reference.
(CONTINUED) | | | | | | | | | | | | |
Exhibit
No. | | Exhibit Description | | Form | | File Number | | Exhibit | | Filing
Date | | Filed
Herewith |
| 10.10+ | | 1998 Non-Employee Directors’ Stock Option Plan (Annual Grant - Board Service), as amended | | 10-Q | | 0-23985 | | 10.1 | | 11/22/04 | | |
| | | | | | |
| 10.11+ | | 1998 Non-Employee Directors’ Stock Option Plan (Committee Grant - Committee Service), as amended | | 10-Q | | 0-23985 | | 10.2 | | 11/22/04 | | |
| | | | | | |
| 10.12+ | | 1998 Non-Employee Directors’ Stock Option Plan (Initial Grant) | | 10-Q | | 0-23985 | | 10.3 | | 11/22/04 | | |
| | | | | | |
| 10.13+ | | 2000 Nonstatutory Equity Incentive Plan, as amended | | 10-K | | 0-23985 | | 10.11 | | 4/25/03 | | |
| | | | | | |
| 10.14 | | Lease dated April 4, 2000 between NVIDIA Corporation and Sobrato Interests III for Building A | | S-3/A #1 | | 333-33560 | | 10.1 | | 4/20/00 | | |
| | | | | | |
| 10.15 | | Lease dated April 4, 2000 between NVIDIA Corporation and Sobrato Interests III for Building B | | S-3/A #1 | | 333-33560 | | 10.2 | | 4/20/00 | | |
| | | | | | |
| 10.16 | | Lease dated April 4, 2000 between NVIDIA Corporation and Sobrato Interests III for Building C | | S-3/A #1 | | 333-33560 | | 10.3 | | 4/20/00 | | |
| | | | | | |
| 10.17 | | Lease dated April 4, 2000 between NVIDIA Corporation and Sobrato Interests III for Building D | | S-3/A #1 | | 333-33560 | | 10.4 | | 4/20/00 | | |
| | | | | | |
| 10.18+ | | NVIDIA Corporation Fiscal Year 2006 Variable Compensation Plan | | 8-K | | 0-23985 | | 10.1 | | 5/13/06 | | |
| | | | | | |
| 21.1 | | List of Registrant’s Subsidiaries | | 10-K | | 0-23985 | | 21.1 | | 3/16/06 | | |
| | | | | | |
| 23.1 | | Consent of PricewaterhouseCoopers LLP | | 10-K | | 0-23985 | | 23.1 | | | | * |
| | | | | | |
| 23.2 | | Consent of KPMG LLP | | 10-K | | 0-23985 | | 23.2 | | | | * |
| | | | | | |
| 24.1 | | Power of Attorney | | 10-K | | 0-23985 | | | | 3/16/06 | | |
| | | | | | |
| 31.1 | | Rule 13a-14(a) Certification of Chief Executive Officer | | | | | | | | | | * |
| | | | | | |
| 31.2 | | Rule 13a-14(a) Certification of the Chief Financial Officer | | | | | | | | | | * |
| | | | | | |
| 32.1# | | Statement of the Chief Executive Officer under Rule 13a - 14(b) (18 U.S.C Section 1350) | | | | | | | | | | * |
| | | | | | |
| 32.2# | | Statement of the Chief Financial Officer under Rule 13a - 14(b) (18 U.S.C Section 1350) | | | | | | | | | | * |
| | | | | | |
| 99.1 | | Selected Consolidated Financial Data | | | | | | | | | | * |
+ | Management contract, compensatory plan or arrangement. |
# | In accordance with Item 601(b)(32)(ii) of Regulation S-K and SEC Release Nos. 33-8238 and 34-47986, Final Rule: Management’s Reports on Internal Control Over Financial Reporting and Certification of Disclosure in Exchange Act Periodic Reports, the certifications furnished in Exhibits 32.1 and 32.2 hereto are deemed to accompany this Form 10-K/A and will not be deemed “filed” for purpose of Section 18 of the Exchange Act. Such certifications will not be deemed to be incorporated by reference into any filing under the Securities Act or the Exchange Act, except to the extent that the registrant specifically incorporates it by reference. |
Copies of above exhibits not contained herein are available to any stockholder upon written request to: Investor Relations: NVIDIA Corporation, 2701 San Tomas Expressway, Santa Clara, CA 95050.