

UNITED STATES
SECURITIES AND EXCHANGE COMMISSION
Washington, D.C. 20549
FORM 10-K/A
Amendment No. 110-K
(Mark One)
| x | ANNUAL REPORT PURSUANT TO SECTION 13 OR 15(d) OF THE SECURITIES EXCHANGE ACT OF 1934 |
For the fiscal year ended December 31, 20072008
OR
| ¨ | TRANSITION REPORT PURSUANT TO SECTION 13 OR 15(d) OF THE SECURITIES EXCHANGE ACT OF 1934 |
Commission file number: 000-27163
Kana Software, Inc.
(Exact Name of Registrant as Specified in its Charter)
| Delaware | 77-0435679 | |
(State or Other Jurisdiction of Incorporation or Organization) | (I.R.S. Employer Identification No.) | |
181 Constitution Drive Menlo Park, California | 94025 | |
| (Address of Principal Executive Offices) | (Zip Code) | |
(650) 614-8300
(Registrant’s Telephone Number, Including Area Code)
Securities registered pursuant to Section 12(b) of the Act:
None
Securities registered pursuant to Section 12(g) of the Act:
Common Stock, $0.001 par value per share
(Title of Class)class)
Indicate by check mark if the Registrant is a well-known seasoned issuer as defined in Rule 405 of the Securities Act. Yes ¨ No x
Indicate by check mark if the Registrant is not required to file reports pursuant to Section 13 or Section 15(d) of the Act. Yes ¨ No x
Indicate by check mark whether the Registrant (1) has filed all reports required to be filed by Section 13 or 15(d) of the Securities Exchange Act of 1934 during the preceding 12 months (or for such shorter period that the Registrantregistrant was required to file such reports), and (2) has been subject to such filing requirements for the past 90 days. Yes x No ¨
Indicate by check mark whether the registrant has submitted electronically and posted on its corporate Web site, if any, every Interactive Data File required to be submitted and posted pursuant to Rule 405 of Regulation S-T (§ 229.405 of this chapter) during the preceding 12 months (or for such shorter period that the registrant was required to submit and post such files). Yes ¨ No ¨
Indicate by check mark if disclosure of delinquent filers pursuant to Item 405 of Regulation S-K (§229.405)229.405 of this chapter) is not contained herein, and will not be contained, to the best of the Registrant’s knowledge, in definitive proxy or information statements incorporated by reference in Part III of this Form 10-K/A10-K or any amendment to this Form 10-K/A.10-K. ¨
Indicate by check mark whether the Registrant is a large accelerated filer, an accelerated filer, or a non-accelerated filer, or a smaller reporting company. See the definitions of “large accelerated filer”, “accelerated filer” and “smaller reporting company” in Rule 12b-2 of the Exchange Act.
| Large accelerated filer ¨ | Accelerated filer | |||
| Non-accelerated filer | Smaller reporting company ¨ | |||
Indicate by check mark whether the Registrant is a shell company (as defined in Rule 12b-2 of the Exchange Act). Yes ¨ No x
As of June 29, 2007,30, 2008, the last business day of the Registrant’s most recently completed second fiscal quarter, the aggregate market value of the voting stock held by non-affiliates of the Registrant was approximately $93,546,679$43,734,118 based upon the closing sales price of the Registrant’s common stockCommon Stock as reported on the Over the Counter Bulletin Board of $3.10.$1.27.
As of March 31, 2008,At April 30, 2009 the Registrant had outstanding approximately 41,212,57841,214,666 shares of common stock,Common Stock, $0.001 par value per share.
EXPLANATORY NOTEDOCUMENTS INCORPORATED BY REFERENCE
This Amendment No. 1 on Form 10-K/A supplements ourPortions of the Registrant’s Proxy Statement for the 2008 Annual Meeting of Stockholders are incorporated herein by reference in Part III of this Annual Report on Form 10-K forto the year ended December 31, 2007 that we filed on March 17, 2008 with the Securities and Exchange Commission. We are filing this Amendment No. 1 to provide the information required by Items 10, 11, 12, 13 and 14 of Part III and to update the information contained in Item 15 of Part IV. Except as described above, no other amendments are being made to our Annual Report on Form 10-K filed on March 17, 2008.extent stated herein.
Form 10-K/A10-K
For the Fiscal Year Ended December 31, 20072008
TABLE OF CONTENTS
| Page | ||||
Item 1 | 1 | |||
Item 1A | 7 | |||
Item 1B | 22 | |||
Item 2 | 22 | |||
Item 3 | 22 | |||
Item 4 | 23 | |||
| ||||
Item 5 | Market for the Registrant’s Common Equity, Related Stockholder Matters and Issuer Purchases of Equity Securities | 24 | ||
Item 6 | 25 | |||
Item 7 | Management’s Discussion and Analysis of Financial Condition and Results of Operations | 28 | ||
Item 7A | 47 | |||
Item 8 | 48 | |||
Item 9 | Changes in and Disagreements with Accountants on Accounting and Financial Disclosure | 80 | ||
Item 9A(T) | 80 | |||
Item 9B | 82 | |||
Item 10 | ||||
| 83 | ||||
Item | ||||
| 83 | ||||
Item | Security Ownership of Certain Beneficial Owners and Management and Related Stockholder Matters | |||
| 83 | ||||
Item | Certain Relationships and Related Transactions, and Director Independence | |||
Item 14 | 83 | |||
| ||||
Item | ||||
In addition to historical information, this report contains forward-looking statements within the meaning of Section 27A of the Securities Act of 1933 and Section 21E of the Securities Exchange Act of 1934. The forward-looking statements are not historical facts but rather are based on current expectations, estimates and projections about our business and industry, and our beliefs and assumptions. Words such as “anticipate,” “believe,” “estimate,” “expect,” “intend,” “plan,” “will” and variations of these words and similar expressions identify forward-looking statements. These statements are not guarantees of future performance and are subject to risks, uncertainties and other factors, many of which are beyond our control, are difficult to predict and could cause actual results to differ materially from those expressed or forecasted in the forward-looking statements. These risks and uncertainties include, but are not limited to, those described in Item 1A “Risk Factors” and elsewhere in this report. Forward-looking statements that were believed to be true at the time made may ultimately prove to be incorrect or false. We undertake no obligation to revise or publicly release the results of any revision to these forward-looking statements. Given these risks and uncertainties, readers are cautioned not to place undue reliance on such forward-looking statements.
| ITEM 1. | BUSINESS. |
Overview
KANA Software, Inc. (the “Company” or “KANA”) offers an innovative approach to customer service with cost-effective solutions that enhance the quality of multi-channel customer service interactions. Built on open standards for a high degree of adaptability and integration, KANA solutions intelligently automate the processes needed to successfully serve our clients’ customers, so that our clients can deliver higher value service at lower cost, increasing customer retention and loyalty. We provide an integrated solution which enables organizations to deliver consistent, managed service across all channels, including e-mail, chat, call centers and Web self-service, ensuring a consistent service experience across communication channels. We are headquartered in Menlo Park, California with offices throughout the United States, as well as Europe and Japan.
We were incorporated in July 1996 in California and reincorporated in Delaware in September 1999. References in this Annual Report on Form 10-K to “we,” “our” and “us” collectively refer to KANA, our predecessor and our subsidiaries and their predecessors. Our principal executive offices are located at 181 Constitution Drive, Menlo Park, California 94025 and our telephone number is (650) 614-8300. Our Internet website is located at http://www.kana.com.
Our Strategy
Deliver world-class products & solutions to Global 2000 enterprises, and enable these organizations to improve customer loyalty and retention, increase corporate revenue and reduce the cost of service. We believe that a significant percentage of an enterprise’s cost of providing service to its customers resides in efficiently and effectively managing and resolving individual customer questions and problems, or cases. These cases must be received, routed, tracked and resolved by customer service agents. While many enterprises possess technology capable of routing and tracking cases, the actual resolution of customer issues is largely unautomated, and therefore is particularly costly. Our knowledge-powered customer service solutions focus on automating the service experience across multiple channels. The majority of our license revenues are for applications that are used by our customers’ agents (Assisted Service), or directly by their customers (Web Self-Service), empowering them with knowledge and information to resolve their issues.
Partner with the world’s leading systems integrators. Our strategy is to focus our efforts on the sale of software and support and to enter into strategic relationships with leading systems integrators in order to provide our customers with a wide range of implementation, systems integration, and consulting services. Our professional services organization was augmented in 2007 by our acquisition of eVergance Partners LLC
(“eVergance”), a consulting and services firm that provides our systems integrator partners with additional resources and subject matter expertise on our applications. Our customers can benefit from these systems integrators’ deep knowledge of our products, as well as their industry expertise and proven integration success. In addition, these systems integrators employ larger sales forces than we do, and we generally coordinate our sales efforts with them.
Deliver industry-specific applications. Some industries, such as banking, telecommunications, and healthcare, have exceptionally high volumes of customer interactions, and providing consistent and accurate feedback to customers of companies in these industries has become increasingly difficult as the products and offerings of such companies have become increasingly complicated. We continue to expand our portfolio of applications through our professional services and systems integrator relationships.
Products
We provide a suite of customer service software solutions. Around the world, our multi-channel customer service solutions are helping Global 2000 companies provide more intelligent, effective interactions with customers, helping them build loyal and lasting customer relationships while reducing costs in the contact center.
Our suite of multi-channel solutions is built on open standards for a high degree of adaptability and flexibility. Our solutions provide a critical link between call centers and transactional back end systems, allowing organizations to have effective, efficient interactions with customers across points of contact (including Web, telephone and e-mail) and throughout the enterprise. We employ robust reporting tools across our entire product family to allow companies to continually analyze and improve their customer and partner relationships. These features enable Global 2000 companies and other enterprises to reduce the cost of information access for their employees, customers and partners while creating profitable customer relationships.
Our customers can deploy our multi-channel solutions as a complete suite or as separate applications. Our solutions include the following products:
KANA IQ—Bringing together a self-service application for customers and an assisted-service solution for contact center agents, KANA IQ is a sophisticated knowledge management application that guides customers and agents through the process of finding answers, enabling them to quickly and accurately locate the information they need.
KANA Response—KANA Response is a robust e-mail management system which intelligently automates the process of managing high-volume email and Web forms in the contact center.
KANA Response Live—KANA Response Live delivers comprehensive live chat and Web page co-browsing so that Web self-service customers can engage in online “conversations” with agents.
KANA Contact Center—KANA Contact Center is a multi-channel customer service application for contact centers that provides an intelligent agent desktop with one-stop access to relevant customers and service data, multi-channel history, request management, and extranet workflow.
Our applications are designed to easily integrate with other enterprise software and legacy systems. They can be installed on systems running Solaris, AIX, Linux or Windows operating systems, and provide customers with capabilities for personalization, customer profile management, inquiry management, universal business rules, knowledge management, and workflow. They can be linked with customers’ legacy systems allowing customers to design their systems to preserve previous investments. Our service-oriented architecture uses data modeling to make data located in external systems available in our application without requiring the data to be moved or replicated. Our applications are built on a single Web-architected platform, which offers a service-oriented framework that provides our customers with full access to our applications using a standard Web browser and without requiring them to install additional software on their individual computers.
Alliances
We enter into strategic relationships with leading systems integrators that have developed significant expertise with our applications and are able to provide customers with a wide range of consulting, implementation and systems integration services. In addition, many of these systems integrators act as resellers for our products, and we rely on them for assistance in driving our sales efforts. We believe that support for our products by these systems integrators is increasingly important in influencing new customers’ decisions to license our products. In addition to our consulting services and systems integration subsidiary, eVergance, we work with several third-party systems integrators and consulting firms, including IBM Global Business Services (“IBM”). These systems integrators have been integral to our success in selling our products to large-organizations such as ATT, Bank of America, Cummins, DVLA, JetBlue, Metlife, O2, and TD Waterhouse.
Services and Support
Customer Support. Our customer support group uses our own applications to provide multi-channel global support for our customers and partners.
Professional Services. Our worldwide consulting and education services group provides business and technical expertise to support our customers and alliance partners. Our consulting services group works closely with our customers to address the people and process areas common to every enterprise deployment along with systems integrators during implementations to lend technical experience and functional product expertise and to assist the systems integrators in providing our customers with high-quality, successful, enterprise-wide implementations. Education services provide a full set of training programs and materials for our customers and partners, including a comprehensive set of courses for end users, business consultants and developers, which are available through instructor-led, Web-based, and on-site classes.
Sales
Our sales strategy is to focus on Global 2000 companies through our direct sales force. We have commercial sales teams that cover named accounts within geographical territories, as well as a vertical account manager for the federal government. We maintain direct sales personnel across North America and in Europe and Japan. Our Inside Sales Organization focuses on a departmental strategy within the Global 2000 and the high end of the mid-market. We also have a Renewals team that works with our existing customers to renew their maintenance and support agreements.
Customers
Our customers range from Global 2000 companies to growing companies who want to differentiate their businesses through the delivery of superior customer service. The following is a list of customers that we believe are representative of our overall customer base:
Financial Services | Communications | |
| Bank of America | AT&T | |
| Bank Leumi | Brighthouse Networks | |
| Barclays | BSkyB | |
| Capital One | Com Hem | |
| ING Postbank | COX Communications | |
| JP Morgan Chase | Hutchison 3G | |
| Principal Financial Group | O2 | |
| TD Ameritrade | Sprint | |
| TD Waterhouse UK | Telekom Austria | |
| Wells Fargo | Telenor | |
Time Warner Cable | ||
T-Mobile |
Health Care | Government | |
| Abbott Laboratories | City of Amsterdam/Gemeente Amsterdam | |
| Aetna | Defense Information Systems Agency | |
| Allergan | Her Majesty Revenues & Customs (HMRC) | |
| Cigna HealthCare | United States Postal Services | |
| Highmark Inc. | ||
| Kaiser Permanente | ||
| MetLife | ||
| United HealthGroup | ||
| WellPoint | ||
High Technology | Travel/Hospitality | |
| Dell Computer Corp. | American Airlines | |
| DST Systems | Avis Budget Group | |
| Garmin | Best Western International | |
| IBM | Carlson Companies | |
| Palm | Disney | |
| Siemens | Icelandair | |
| Sony | JetBlue Airways | |
| Xerox | Northwest Airlines | |
| Yahoo! | Priceline.com | |
| Starwood Hotels & Resorts | ||
America West Airlines | ||
Retail | ||
| American Girl | ||
| Avon.com | ||
| Barnes & Noble | ||
| Best Buy | ||
| Carphone Warehouse | ||
| eBay, Inc. | ||
| Estee Lauder | ||
| Home Depot | ||
| JC Penney | ||
| Sears | ||
| Staples.com | ||
| Target | ||
| The Gap | ||
| Tiffany & Company | ||
No customer accounted for 10% or more of our total revenues in 2008. A portion of our license and services revenues in any given quarter has been, and we expect will continue to be, generated from a limited number of customers. We consider ourselves to be in a single industry segment—specifically, the licensing and support of our software applications. Revenue classification is based upon customer location. See Note 12 of the Notes to the Consolidated Financial Statements in Item 8 of this Annual Report on Form 10-K for geographic information on revenues for the years ended December 31, 2008, 2007, and 2006 and long-lived assets for the years ended December 31, 2008 and 2007.
Research and Development
We believe that strong product development capabilities are essential to our strategy of enhancing our core technology, developing additional applications incorporating that technology and maintaining the competitiveness of our product and service offerings. We have invested significant time and resources in creating a structured process for undertaking all product development.
Our success significantly depends on our ability to enhance our existing customer service solutions and to develop new services, functionality and technology that address the increasingly sophisticated and varied needs of our existing and prospective customers. The challenges of developing new products and enhancements require us to commit a substantial amount of resources. We might not be able to develop or introduce new products on a timely or cost-effective basis, or at all, which could lead existing and potential customers to choose a competitor’s products.
Our research and development expenses were $13.8 million, $12.7 million and $10.8 million in 2008, 2007 and 2006, respectively.
Competition
The market for our products and services is intensely competitive, evolving and subject to rapid technological change. We currently face competition for our products from software designed by our customers’ in-house development teams and by third parties. We expect these competing software applications to continue to be a major source of competition for the foreseeable future. Our primary competitors for customer relationship management (“CRM”) software platforms are larger, more established companies such as Oracle. We also face competition from companies such as Chordiant Software, Salesforce.com, Consona, eGain, RightNow, InQuira and Pegasystems with respect to several specific applications we offer. We may face increased competition upon introduction of new products or upgrades from competitors.
We believe that the principal competitive factors affecting our industry include having a significant base of customers recommending our products, the breadth and depth of a given solution, product cost, product quality and performance, customer service, product scalability and reliability, product features, ability to implement solutions and perception of financial position. We believe that our products currently compete favorably with respect to many of these factors, and, in particular, that our Web-based architecture provides us with a competitive advantage because it allows for greater product scalability and rapid implementation. However, we may not be able to maintain our competitive position against current and potential competitors, especially those with greater financial, marketing, service, support, technical and other resources, and who may, for example, be able to add features or functionality to their competing products more quickly or decide to sell their competing products to their existing customer bases for other products.
Seasonality
Our business is influenced by seasonal trends, largely due to customer buying patterns. These trends may include higher license revenues in the fourth quarter as many customers complete annual budgetary cycles and lower license revenues in the first quarter and summer months when many of our prospects and customers experience lower sales. Our professional services are negatively impacted in the fourth quarter due to the holiday season, in which fewer billable hours are available for our consultants. In addition, our international operations experience a slowdown in the summer months.
Intellectual Property
We rely upon a combination of patent, copyright, trade secret and trademark laws, and contractual restrictions, such as confidentiality agreements and licenses, to establish and protect our proprietary rights. We currently have five issued U.S. patents, three of which expire in 2018 and two of which expire in 2020, and a number of U.S. patent applications pending. We have also filed international patent applications corresponding to some of our U.S. applications. In addition, we have several trademarks that are registered or pending registration in the U.S. and abroad. Although we rely on patent, copyright, trade secret and trademark laws to protect our technology, we believe that factors such as the technological and creative skills of our personnel, new product development, frequent product enhancements and reliable product maintenance are more essential to establishing and maintaining a technology leadership position.
Despite our efforts to protect our proprietary rights, unauthorized parties may attempt to copy or otherwise obtain and use our products or technology or to develop products with the same functionality as our products. Policing unauthorized use of our products is difficult. Also, the laws of other countries in which we market our products may offer little or no effective protection of our proprietary technology. Furthermore, our competitors could independently develop technologies equivalent to ours, and our intellectual property rights may not be broad enough for us to prevent such competitors from selling products incorporating those technologies. Reverse engineering, unauthorized copying or other misappropriation of our proprietary technology could enable third parties to benefit from our technology without paying us for it, which would significantly harm our business.
Substantial litigation regarding intellectual property rights exists in our industry. We expect that software in our industry may be increasingly subject to third-party infringement claims as the number of competitors grows and the functionality of products in different industry segments overlaps. Some of our competitors in the market for customer communications software may have filed or may intend to file patent applications covering aspects of their technology that they may claim our technology infringes. Such competitors could make a claim of infringement against us with respect to our products and technology. Third parties may currently have, or may eventually be issued, patents upon which our current or future products or technology infringe. Any of these third parties might make a claim of infringement against us. See Item 1A “Risk Factors”—“We may become involved in litigation over proprietary rights, which could be costly and time consuming.”
Backlog
As of December 31, 2008 and 2007, we had $16.4 million and $20.1 million, respectively, in backlog, which relates to firm orders, with $86,000 and $419,000, respectively, not expected to be recognized within one year due to the timing of obligations in the underlying agreements. The majority of these firm orders relate to annual support contracts, and were invoiced and recorded as deferred revenue as of December 31, 2008 and 2007.
Employees
As of December 31, 2008, we had 229 full-time employees, compared to 225 full-time employees as of December 31, 2007. Of the 229 employees as of December 31, 2008, 69 were in our services and support group, 60 were in sales and marketing, 65 were in research and development and 35 were in finance, legal, information technology (“IT”) and administration.
| ITEM 1A. | RISK FACTORS. |
We operate in a dynamic and rapidly changing business environment that involves substantial risks and uncertainty, including but not limited to the specific risks identified below. The risks described below are not the only ones facing our company. Additional risks not presently known to us, or that we currently deem immaterial, may become important factors that impair our business operations. Any of these risks could cause, or contribute to causing, our actual results to differ materially from expectations. Prospective and existing investors are strongly urged to carefully consider the various cautionary statements and risks set forth in this report and our other public filings.
Risks Related to Our Business and Industry
Current uncertainty in global economic conditions makes it particularly difficult to predict demand and other related matters and makes it more likely that our actual results could differ materially from expectations.
Our operations and performance depend on worldwide economic conditions, which have recently deteriorated significantly in the United States and other countries, and may remain depressed for the foreseeable future. These conditions make it difficult for our customers and potential customers to accurately forecast and plan future business activities, and could cause our customers and potential customers to slow or reduce spending on our products and services. Furthermore, during challenging economic times, our customers may face issues gaining timely access to sufficient credit, which could impact their willingness to make purchases or their ability to make timely payments to us. If that were to occur, we may experience decreased sales, be required to increase our allowance for doubtful accounts and our days sales outstanding could be negatively impacted. We cannot predict the timing, strength or duration of any economic slowdown or subsequent economic recovery, worldwide, in the United States, or in our industry. These and other economic factors could have a material adverse effect on demand for our products and services, on our ability to predict future operating results, and on our financial condition and operating results.
In periods of worsening economic conditions, our exposure to credit risk and payment delinquencies on our accounts receivable significantly increases.
A substantial majority of our outstanding accounts receivables are not covered by collateral. In addition, our standard terms and conditions permit payment within a specified number of days following the receipt of our product. While we have procedures to monitor and limit exposure to credit risk on our receivables, there can be no assurance such procedures will effectively limit our credit risk and avoid losses. As economic conditions deteriorate, certain of our customers have faced and may face liquidity concerns and have delayed and may delay or may be unable to satisfy their payment obligations, which would have a material adverse effect on our financial condition and operating results.
We have a history of losses and may not be able to generate sufficient revenues to achieve and maintain profitability.
Since we began operations in 1997, our revenues have not been sufficient to support our operations, and we have incurred substantial operating losses every year. As of December 31, 2008, our accumulated deficit was approximately $4.3 billion, which includes approximately $2.7 billion related to goodwill impairment charges. Our stockholders’ equity at December 31, 2008 was $2.6 million. We continue to commit a substantial investment of resources to sales, product marketing and developing new products and enhancements, and we will need to increase our revenues to achieve profitability and positive cash flows. Our expectations as to when we can achieve positive cash flows, and as to our future cash balances, are subject to a number of assumptions, including assumptions regarding improvements in general economic conditions and customer purchasing and payment patterns, many of which are beyond our control. Our history of losses has previously caused some of our potential customers to question our viability, which has in turn hampered our ability to sell some of our products. Additionally, our revenues have been affected by the current downturn in economic conditions, both
generally and in our market. As a result of these conditions, we have experienced and expect to continue to experience difficulties in attracting new customers, which means that, even if sales of our products and services grow, we may continue to experience losses, which may cause the price of our stock to decline.
Our ability to continue as a going concern is at risk.
Our independent public accounting firm has issued an opinion on our consolidated financial statements that states that the consolidated financial statements were prepared assuming we will continue as a going concern and further states that our recurring losses from operations, negative working capital, negative cash flow from operations and accumulated deficit raise substantial doubt about our ability to continue as a going concern. The global economic downturn created a substantially more difficult business environment in 2008, affecting our liquidity and operating performance. If our revenues do not improve and we are unable to reduce operating expenses sufficiently and we do not obtain additional financing, we may become unable to pay our operating expenses on a timely basis due to a lack of sufficient liquidity. We can give no assurances as to whether we will be able to implement cost reduction initiatives, increase revenues, or obtain debt or equity financing, in order to provide sufficient liquidity for us to continue as a going concern.
The relatively large size of many of our expected license transactions could contribute to our failure to meet expected sales in any given quarter and could materially harm our operating results.
Our revenues and results of operations may fluctuate as a result of a variety of factors. Our revenues are especially subject to fluctuation because they depend on the completion of relatively large orders for our products and related services. The average size of our license transactions is generally large relative to our total revenues in any quarter, particularly as we have focused on larger enterprise customers, on licensing our more comprehensive integrated products, and have involved systems integrators in our sales process. If sales expected from a specific customer in a particular quarter are not realized in that quarter, we are unlikely to be able to generate revenue from alternate sources in time to compensate for the shortfall. Fluctuations in our results of operations may be due to a number of additional factors, including, but not limited to, our ability to retain and increase our customer base, changes in our pricing policies or those of our competitors, the timing and success of new product introductions by us or our competitors, the sales cycle for our products, our fixed expenses, the purchasing and budgeting cycles of our clients, and the decline in general economic, industry and market conditions.
This dependence on large orders makes our revenues and operating results more likely to vary from quarter to quarter, and more difficult to predict, because the loss of any particular large order is significant. In recent periods, we have experienced increases in the length of a typical sales cycle. This trend may add to the uncertainty of our future operating results and reduce our ability to anticipate our future revenues. Moreover, to the extent that significant sales occur earlier than anticipated, revenues for subsequent quarters may be lower than expected. As a result, our operating results could suffer if any large orders are delayed or canceled in any future period. In part as a result of this aspect of our business, our quarterly revenues and operating results may fluctuate in future periods and we may fail to meet the expectations of investors and public market analysts, which could cause the price of our common stock to decline.
We may not be able to forecast our revenues accurately because our products have a long and variable sales cycle and we rely on systems integrators for sales.
The long sales cycle for our products may cause license revenues and operating results to vary significantly from period to period. To date, the sales cycle for most of our product sales has taken anywhere from 6 to 9 months. Our sales cycle typically requires pre-purchase evaluation by a significant number of individuals within our customers’ organizations. Along with third parties that often jointly market our software with us, we invest significant amount of time and resources educating and providing information to prospective customers regarding the use and benefits of our products. Many of our customers evaluate our software slowly and
deliberately, depending on the specific technical capabilities of the customer, the size of the deployment, the complexity of the customer’s network environment, and the quantity of hardware and the degree of hardware configuration necessary to deploy our products.
Furthermore, we rely to a significant extent on systems integrators to identify, influence and manage large transactions with customers, and we expect this trend to continue as our industry consolidates. Selling our products in conjunction with our systems integrators who incorporate our products into their offerings can involve a particularly long and unpredictable sales cycle, as it typically takes more time for the prospective customer to evaluate proposals from multiple vendors. In addition, when systems integrators propose the use of our products to their customers, it is typically part of a larger project, which can require additional levels of customer approvals. We have little or no control over the sales cycle of an integrator-led transaction or our customers’ budgetary constraints and internal decision-making and acceptance processes.
As a result of increasingly long sales cycles, we have faced increased difficulty in predicting our operating results for any given period, and have experienced significant unanticipated fluctuations in our revenues from period to period. Any failure to achieve anticipated revenues for a period could cause our stock price to decline.
If we fail to generate sufficient revenues to support our business and require additional financing, failure to obtain such financing would affect our ability to maintain our operations and to grow our business, and the terms of any financing we obtain may impair the rights of our existing stockholders.
If we fail to generate sufficient revenues to support our business, we may need to seek additional financing to fund our operations or growth. If we raise additional funds through the issuance of equity or convertible debt securities, the percentage ownership of our stockholders would be reduced and the securities we issue might have rights, preferences and privileges senior to those of our current stockholders. Moreover, because of current volatility in the global capital markets and among financial institutions, including a tightening in the capital and credit markets, if we were to seek funding from the capital or credit markets, we may not be able to secure funding on terms acceptable to us or at all.
If adequate funds were not available on acceptable terms, our ability to achieve or sustain positive cash flows, maintain current operations, fund any potential expansion, take advantage of unanticipated opportunities, develop or enhance products or services, or otherwise respond to competitive pressures would be significantly limited. Furthermore, any failure to raise sufficient capital in a timely fashion could prevent us from growing or pursuing our strategies or cause us to limit our operations and cause potential customers to question our financial viability. We had cash and cash equivalents of $7.0 million at December 31, 2008, and as of such date, had contractual commitments of $10.2 million in 2009. It is possible that our cash position could decrease over the next few quarters and some customers could become increasingly concerned about our cash situation and our ongoing ability to update and maintain our products. This could significantly harm our sales efforts.
Our cash and cash equivalents could be adversely affected if the financial institutions in which we hold our cash and cash equivalents fail.
Our cash and cash equivalents are highly liquid investments with original maturities of three months or less at the time of purchase. We maintain the cash and cash equivalents with reputable major financial institutions. Deposits with these banks exceed the Federal Deposit Insurance Corporation (“FDIC”) insurance limits or similar limits in foreign jurisdictions. While we monitor daily the cash balances in the operating accounts and adjust the balances as appropriate, these balances could be impacted if one or more of the financial institutions with which we deposit fails or is subject to other adverse conditions in the financial or credit markets. To date we have experienced no loss or lack of access to our invested cash or cash equivalents; however, we can provide no assurance that access to our invested cash and cash equivalents will not be impacted by adverse conditions in the financial and credit markets.
Our business relies heavily on customer service solutions, and these solutions may not gain market acceptance.
We have made customer service solutions our main focus and, have allocated a significant portion of our research and development and marketing resources to the development and promotion of such products. If these products are not accepted by potential customers, our business would be materially adversely affected. For our current business model to succeed, we believe that we will need to convince new and existing customers of the merits of purchasing our customer service solutions over traditional CRM solutions and competitors’ customer service solutions. Many of these customers have previously invested substantial resources in adopting and implementing their existing CRM products, whether such products are ours or are those of our competitors. We may be unable to convince customers and potential customers of the benefits of purchasing substantial new software packages that provide our specific customer service capabilities. If our strategy of offering customer service solutions fails, we may not be able to sell sufficient quantities of our product offerings to generate significant license revenues, and our business could be harmed.
Our expenses are generally fixed and we will not be able to reduce these expenses quickly if we fail to meet our revenue expectations.
Most of our expenses, such as employee compensation, are relatively fixed in the short term. Other expenses like leases are fixed and are more long term. Moreover, our forecast is based, in part, upon our expectations regarding future revenue levels. As a result, in any particular quarter our total revenues can be below expectation and we could not proportionately reduce operating expenses for that quarter. Accordingly, such a revenue shortfall would have a disproportionate negative effect on our expected operating results for that quarter.
If we fail to grow our customer base or generate repeat business, our operating results could be harmed.
Our business model generally depends on the sale of our products to new customers as well as on expanded use of our products within our customers’ organizations. If we fail to grow our customer base or generate repeat and expanded business from our current and future customers, our business and operating results will be seriously harmed. In some cases, our customers initially make a limited purchase of our products and services for pilot programs. These customers may not purchase additional licenses to expand their use of our products. If these customers do not successfully develop and deploy initial applications based on our products, they may choose not to purchase deployment licenses or additional development licenses. In addition, as we introduce new versions of our products, new product lines or new product features, our current customers might not require the additional functionality we offer and might not ultimately license these products. Furthermore, because the total amount of maintenance and support fees we receive in any period depends in large part on the size and number of licenses that we have previously sold, any downturn in our software license revenues would negatively affect our future services revenue. Also, if customers elect not to renew their support agreements, our services revenue could decline significantly. If customers are unable to pay for their current products or are unwilling to purchase additional products, our revenues would decline. Additionally, a substantial percentage of our sales come from repeat customers. If a significant existing customer or a group of existing customers decide not to repeat business with us, our revenues would decline and our business would be harmed.
We face substantial competition and may not be able to compete effectively.
The market for our products and services is intensely competitive, evolving, and subject to rapid technological change. From time to time, our competitors reduce the prices of their products and services (substantially in certain cases) to obtain new customers. Competitive pressures could make it difficult for us to acquire and retain customers and could require us to reduce the price of our products. Any such changes would likely reduce margins and could adversely affect operating results.
Our customers’ requirements and the technology available to satisfy those requirements are continually changing. Therefore, we must be able to respond to these changes in order to remain competitive. Changes in our
products may also make it more difficult for our sales force to sell effectively. In addition, changes in customers’ demand for the specific products, product features and services of other companies may result in our products becoming uncompetitive. We expect the intensity of competition to increase in the future. Furthermore, we could lose market share if our competitors introduce new competitive products, add new functionality, acquire competitive products, reduce prices or form strategic alliances with other companies. We may not be able to compete successfully against current and future competitors, and competitive pressures may seriously harm our business.
Our competitors vary in size and in the scope and breadth of products and services offered. We currently face competition with our products from systems designed in-house and by our competitors. We expect that these systems will continue to be a major source of competition for the foreseeable future. Our primary competitors for electronic CRM platforms are larger, more established companies such as Oracle. We also face competition from Chordiant Software, Salesforce.com, Consona, eGain, RightNow, Inquira and Pegasystems with respect to specific applications we offer. We may face increased competition upon introduction of new products or upgrades from competitors, or if we expand our product line through acquisition of complementary businesses or otherwise. As we have combined and enhanced our product lines to offer a more comprehensive software solution, we are increasingly competing with large, established providers of customer management and communication solutions as well as other competitors. Our combined product line may not be sufficient to successfully compete with the product offerings available from these companies, which could slow our growth and harm our business.
Many of our competitors have longer operating histories, significantly greater financial, technical, marketing and other resources, significantly greater name recognition and a larger installed base of customers than we have. As a result, our competitors may be able to respond more quickly than we can to new or changing opportunities, technologies, standards or client requirements or devote greater resources to the promotion and sale of their products and services than we can. In addition, many of our competitors have well-established relationships with our current and potential customers and have extensive knowledge of our industry. We may lose potential customers to competitors for various reasons, including the ability or willingness of competitors to offer lower prices and other incentives that we cannot match. It is possible that new competitors or alliances among competitors may emerge and rapidly acquire significant market share. We also expect that competition will increase as a result of recent industry consolidations, as well as anticipated future consolidations.
We rely on marketing, technology and distribution relationships for the sale, installation and support of our products that may generally be terminated at any time, and if our current and future relationships are not successful, our growth might be limited.
We rely on marketing and technology relationships with a variety of companies, including systems integrators and consulting firms that, among other things, generate leads for the sale of our products and provide our customers with implementation and ongoing support. If we cannot maintain successful marketing and technology relationships or if we fail to enter into such additional relationships, we could have difficulty expanding the sales of our products and our growth might be limited.
A portion of our revenues depends on leads generated by systems integrators and their recommendations of our products. If systems integrators do not successfully market our products, our operating results will be materially harmed. In addition, many of our direct sales are to customers that will be relying on systems integrators to implement our products, and if systems integrators are not familiar with our technology or able to successfully implement our products, our operating results will be materially harmed. We expect to continue increasing our leverage of systems integrators as indirect sales channels and, if this strategy is successful, our dependence on the efforts of these third parties for revenue growth and customer service will remain high. Our reliance on third parties for these functions has reduced our control over such activities and reduced our ability to perform such functions internally. If we come to rely primarily on a single systems integrator that subsequently terminates its relationship with us, becomes insolvent or is acquired by another company with which we have no
relationship, or decides not to provide implementation services related to our products, we may not be able to internally generate sufficient revenues or increase the revenues generated by our other systems integrator relationships to offset the resulting lost revenues. Furthermore, systems integrators typically suggest our solution in combination with other products and services, some of which may compete with our solution. Systems integrators are not required to promote any fixed quantities of our products, are not bound to promote our products exclusively and may act as indirect sales channels for our competitors. If systems integrators choose not to promote our products or if they develop, market or recommend software applications that compete with our products, our business will be harmed.
In addition to relying on systems integrators to recommend our products, we also rely on systems integrators and other third-party resellers to install and support our products. If the companies providing these services fail to implement our products successfully for our customers, the customer may be unable to complete implementation on the schedule that it had anticipated and we may have increased customer dissatisfaction or difficulty making future sales as a result. We might not be able to maintain our relationships with systems integrators and other indirect sales channel partners and enter into additional relationships that will provide timely and cost-effective customer support and service. If we cannot maintain successful relationships with our indirect sales channel partners, we might have difficulty expanding the sales of our products and our growth could be limited. In addition, if such third parties do not provide the support our customers need, we may be required to hire subcontractors to provide these professional services. Increased use of subcontractors would harm our margins because it costs us more to hire subcontractors to perform these services than it would to provide the services ourselves.
Because certain customers account for a substantial portion of our revenues, the loss of a significant customer could cause a substantial decline in our revenues.
No customer accounted for 10% or more of our revenues in 2006, 2007 or 2008. However, if we lose a number of major customers, or if contracts are delayed or cancelled or we do not contract with new major customers, our revenues and net loss would be adversely affected. In addition, customers that have accounted for significant revenues in the past may not generate revenues in any future period, and our failure to obtain new significant customers or additional orders from existing customers could materially affect our operating results.
We may not receive significant revenues from our current research and development efforts for several years, if at all.
Developing and localizing software is expensive and the investment in product development often involves a long payback cycle. We have and expect to continue making significant investments in software research and development and related product opportunities. Enhancing our products and pursuing new product developments require high levels of expenditures for research and development that could adversely affect our operating results if not offset by revenue increases. We believe that we must continue to dedicate a significant amount of resources to our research and development efforts to maintain our competitive position. However, we do not expect to receive significant revenues from these investments for several years, if at all.
If our cost reduction and restructuring efforts are ineffective, our revenues and profitability may be hurt.
During the year ended December 31, 2008 we implemented various cost reduction and restructuring activities to reduce operating costs. The expense related to our reduction in work force was approximately $737,000 and expense related to ceasing use of two of our offices was approximately $64,000. We also wrote off approximately $263,000 of capitalized costs related to an internal use software project that was abandoned. Additionally, during the year ended December 31, 2008 we recorded a restructuring recovery of $482,000 as a result of the extension of a sublease on one of the properties in our restructuring accrual. In September 2007, we agreed with the landlord of one of the facilities included in our restructuring accrual to surrender the remaining term of the lease in exchange for a lump sum cash payment. As a result of this agreement, we recorded additional
restructuring expense of approximately $319,000. We also undertook various cost reduction and restructuring activities in July 2007. The expense related to our reduction in work force was approximately $240,000 and expense related to ceasing use of one of our offices was approximately $8,000. These cost reduction and restructuring activities may not produce the full efficiencies and benefits we expect or the efficiencies and benefits might be delayed. There can be no assurance that these efforts, as well as any potential future cost reduction and restructuring activities, will not adversely affect our business, operations or customer perceptions, or result in additional future charges.
We may be unable to hire and retain the skilled personnel necessary to develop and grow our business.
We rely on the continued service of our senior management and other key employees and the hiring of new qualified employees. In the software industry, there is substantial and continuous competition for highly skilled business, product development, technical and other personnel. Given the concern over our long-term financial strength, we may not be successful in recruiting and integrating new personnel and retaining and motivating existing personnel, which could lead to increased turnover and reduce our ability to meet the needs of our current and future customers. Because our stock price declined drastically in recent years, and has not experienced any sustained recovery from the decline, stock-based compensation, including options to purchase our common stock, may have diminished the effectiveness as employee hiring and retention devices. If we are unable to retain qualified personnel, we could face disruptions to operations, loss of key information, expertise or know-how and unanticipated additional recruitment and training costs. If employee turnover increases, our ability to provide customer service and execute our strategy would be negatively affected.
For example, our ability to increase revenues in the future depends considerably upon our success in training and retaining effective direct sales personnel and the success of our direct sales force. We might not be successful in these efforts. Our products and services require sophisticated sales efforts. We have experienced significant turnover in our sales force including domestic senior sales management, and may experience further turnover in future periods. It generally takes a new salesperson nine or more months to become productive, and they may not be able to generate new sales. Our business will be harmed if we fail to retain qualified sales personnel, or if newly hired salespeople fail to develop the necessary sales skills or develop these skills more slowly than anticipated. Additionally, we continue to need to recruit experienced developers as a result of our back-shoring initiative.
If we fail to respond to changing customer preferences in our market, demand for our products and our ability to enhance our revenues will suffer.
If we do not continue to improve our products and develop new products that keep pace with competitive product introductions and technological developments, satisfy diverse and rapidly evolving customer requirements, and achieve market acceptance, we might be unable to attract new customers. Our industry is characterized by rapid and substantial developments in the technologies and products that enjoy widespread acceptance among prospective and existing customers. The development of proprietary technology and necessary service enhancements entails significant technical and business risks and requires substantial expenditures and lead-time. We might not be successful in marketing and supporting our products or developing and marketing other product enhancements and new products that respond to technological advances and market changes, on a timely or cost-effective basis. In addition, even if these products are developed and released, they might not achieve market acceptance. We have experienced delays in releasing new products and product enhancements in the past and could experience similar delays in the future. These delays or problems in the installation or implementation of our new releases could cause us to lose customers.
Our failure to manage multiple technologies and technological change could reduce demand for our products.
Rapidly changing technology and operating systems, changes in customer requirements, and evolving industry standards might impede market acceptance of our products. Our products are designed based upon
currently prevailing technology to work on a variety of hardware and software platforms used by our customers. However, our software may not operate correctly on evolving versions of hardware and software platforms, programming languages, database environments and other systems that our customers use. If new technologies emerge that are incompatible with our products, or if competing products emerge that are based on new technologies or new industry standards and that perform better or cost less than our products, our key products could become obsolete and our existing and potential customers could seek alternatives to our products. We must constantly modify and improve our products to keep pace with changes made to these platforms and to database systems and other back-office applications and Internet-related applications. Furthermore, software adapters are necessary to integrate our products with other systems and data sources used by our customers. We must develop and update these adapters to reflect changes to these systems and data sources in order to maintain the functionality provided by our products. As a result, uncertainties related to the timing and nature of new product announcements, introductions or modifications by vendors of operating systems, databases, CRM software, Web servers and other enterprise and Internet-based applications could delay our product development, increase our product development expense or cause customers to delay evaluation, purchase and deployment of our analytics products. If we fail to modify or improve our products in response to evolving industry standards, our products could rapidly become obsolete.
Our success depends upon our ability to develop new products and enhance our existing products on a timely basis.
The challenges of developing new products and enhancements require us to commit a substantial investment of resources to development, and we might not be able to develop or introduce new products on a timely or cost-effective basis, or at all, which could be exploited by our competitors and lead potential customers to choose alternative products. To be competitive, we must develop and introduce on a timely basis new products and product enhancements for companies with significant e-business customer interactions needs. Our ability to deliver competitive products may be negatively affected by the diversion of resources to development of our suite of products, and responding to changes in competitive products and in the demands of our customers. If we experience product delays in the future, we may face:
customer dissatisfaction;
cancellation of orders and license agreements;
negative publicity;
loss of revenues; and
slower market acceptance.
Furthermore, delays in bringing new products or enhancements to market can result, for example, from loss of institutional knowledge through reductions in force, or the existence of defects in new products or their enhancements.
Failure to license necessary third-party software incorporated in our products could cause delays or reductions in our sales.
We license third-party software that we incorporate into our products. These licenses may not continue to be available on commercially reasonable terms or at all. Some of this technology would be difficult to replace. The loss of any of these licenses could result in delays or reductions of our applications until we identify, license and integrate, or develop equivalent software. If we are required to enter into license agreements with third parties for replacement technology, we could face higher royalty payments and our products may lose certain attributes or features. In the future, we might need to license other software to enhance our products and meet evolving customer needs. If we are unable to do this, we could experience reduced demand for our products.
Defects in third-party products associated with our products could impair our products’ functionality and injure our reputation.
The effective implementation of our products depends upon the successful operation of third-party products in conjunction with our products. Any undetected defects in these third-party products could prevent the implementation or impair the functionality of our products, delay new product introductions or injure our reputation.
Given that our stock price is near its historical low, we may be subject to takeover overtures that will divert the attention of our management and Board, and require us to incur expenses for outside advisors.
Given that our stock price is near its historical low, we may be subject to takeover overtures. Evaluating and addressing these overtures would require the time and attention of our management and Board, divert them from their focus on our business, and require us to incur additional expenses on outside legal, financial and other advisors, all of which could materially and adversely affect our business, financial condition and results of operations.
Our common stock is currently quoted on the OTCBB.
Our common stock was delisted from The NASDAQ Stock Market effective at the opening of business on October 17, 2005. From October 17, 2005 to December 4, 2006, our common stock was quoted on the “Pink Sheets” and as of December 5, 2006, our common stock has been quoted on Over the Counter Bulletin Board (“OTCBB”). The OTCBB is generally considered less efficient than The NASDAQ Stock Market. Quotation of our common stock on the OTCBB may reduce the liquidity of our securities, limit the number of investors who trade in our securities, result in a lower stock price and larger spread in the bid and ask prices for shares of our common stock and could have an adverse effect on us. Additionally, we may become subject to the SEC rules that affect “penny stocks,” which are stocks below $5.00 per share that are not quoted on The NASDAQ Stock Market. These SEC rules would make it more difficult for brokers to find buyers for our securities and could lower the net sales prices that our stockholders are able to obtain. If our price of common stock remains low, we may not be able to raise equity capital.
Our listing on the OTCBB and the declines in our stock price may greatly impair our ability to raise additional necessary capital through equity or debt financing, and significantly increase the dilution to our current stockholders caused by any issuance of equity in financing or other transactions. The price at which we would issue shares in such transactions is generally based on the market price of our common stock and a decline in the stock price could result in our need to issue a greater number of shares to raise a given amount of funding.
In addition, because our common stock is not listed on a principal national exchange, we are subject to Rule 15g-9 under the Exchange Act, which imposes additional sales practice requirements on broker-dealers that sell low-priced securities to persons other than established customers and institutional accredited investors. For transactions covered by this rule, a broker-dealer must make a special suitability determination for the purchaser and have received the purchaser’s written consent to the transaction prior to sale. Consequently, the rule may affect the ability of broker-dealers to sell our common stock and affect the ability of holders to sell their shares of our common stock in the secondary market. Moreover, investors may be less interested in purchasing low-priced securities because the brokerage commissions, as a percentage of the total transaction value, tend to be higher for such securities, and some investment funds will not invest in low-priced securities (other than those which focus on small-capitalization companies or low-priced securities).
Our stock price has been highly volatile and has experienced a significant decline, and may continue to be volatile and decline.
The trading price of our common stock has fluctuated widely in the past and we expect that it will continue to do so in the future, as a result of a number of factors, many of which are outside our control, such as:
price and volume fluctuations in the overall stock market;
the impact of announcements related to the effects of the global economic downturn and programs intended to address it;
variations in our actual and anticipated operating results;
changes in our earnings estimates by analysts;
the volatility inherent in stock prices within the emerging sector within which we conduct business; and
the volume of trading in our common stock, including sales of substantial amounts of common stock issued upon the exercise of outstanding options and warrants.
In addition, stock markets in general have, and particularly The NASDAQ Stock Market and the OTCBB have, experienced extreme price and volume fluctuations that have affected the market prices of many technology and computer software companies, particularly Internet-related companies. Such fluctuations have often been unrelated or disproportionate to the operating performance of these companies. These broad market fluctuations could adversely affect the market price of our common stock. In the past, following periods of volatility in the market price of a particular company’s securities, securities class action litigation has often been brought against that company. Securities class action litigation could result in substantial costs and a diversion of our management’s attention and resources.
Since becoming a publicly traded security listed on The NASDAQ Stock Market in September 1999, our common stock has reached a sales price high of $1,698.10 per share and a sales price low of $0.46 per share. Our common stock is currently quoted on the OTCBB and the last reported sales price of our shares on May 14, 2009 was $0.72 per share.
Our pending patents may never be issued and, even if issued, may provide little protection.
Our success and ability to compete depend upon the protection of our software and other proprietary technology rights. We currently have five issued U.S. patents, three of which expire in 2018 and two of which expire in 2020, and multiple U.S. patent applications pending relating to our software. None of our technology is patented outside of the United States. It is possible that:
our pending patent applications may not result in the issuance of patents;
any issued patents may not be broad enough to protect our proprietary rights;
any issued patents could be successfully challenged by one or more third parties, which could result in our loss of the right to prevent others from exploiting the inventions claimed in those patents;
current and future competitors may independently develop similar technology, duplicate our products or design around any of our patents; and
effective patent protection may not be available in every country in which we do business.
We rely upon trademarks, copyrights and trade secrets to protect our proprietary rights, which may not be sufficient to protect our intellectual property.
In addition to patents, we rely on a combination of laws, such as copyright, trademark and trade secret laws, and contractual restrictions, such as confidentiality agreements and licenses, to establish and protect our proprietary rights. However, despite the precautions that we have taken:
laws and contractual restrictions may not be sufficient to prevent misappropriation of our technology or deter others from developing similar technologies;
current federal laws that prohibit software copying provide only limited protection from software “pirates,” and effective trademark, copyright and trade secret protection may be unavailable or limited in foreign countries;
other companies may claim common law trademark rights based upon state or foreign laws that precede the federal registration of our marks; and
policing unauthorized use of our products and trademarks is difficult, expensive and time-consuming, and we may be unable to determine the extent of this unauthorized use.
Also, the laws of some other countries in which we market our products may offer little or no effective protection of our proprietary technology. Consequently, we may be unable to prevent our proprietary technology from being exploited abroad, which could diminish international sales or require costly efforts to protect our technology. Reverse engineering, unauthorized copying or other misappropriation of our proprietary technology could enable third parties to benefit from our technology without paying us for it, which would significantly harm our business.
We may become involved in litigation over proprietary rights, which could be costly and time consuming.
The software industry is characterized by the existence of a large number of patents, trademarks and copyrights and by frequent litigation based on allegations of infringement or other violations of intellectual property rights, and our technologies may not be able to withstand any third-party claims or rights against their use. Some of our competitors in the market for customer communications software may have filed or may intend to file patent applications covering aspects of their technology that they may claim our technology infringes. Such competitors could make a claim of infringement against us with respect to our products and technology. Additionally, third parties may currently have, or may eventually be issued, patents upon which our current or future products or technology infringe and any of these third parties might make a claim of infringement against us. For example, during 2006 and 2007, we were involved in litigation brought by Polaris IP, LLC against us and certain of our customers that claimed that certain of our products violate patents held by them.
As we grow, the possibility of intellectual property rights claims against us increases. We may not be able to withstand any third-party claims and regardless of the merits of the claim, any intellectual property claims could be inherently uncertain, time-consuming and expensive to litigate or settle. Many of our software license agreements require us to indemnify our customers from any claim or finding of intellectual property infringement. We periodically receive notices from customers regarding patent license inquiries they have received which may or may not implicate our indemnity obligations. Any litigation, brought by others, or us could result in the expenditure of significant financial resources and the diversion of management’s time and efforts. In addition, litigation in which we are accused of infringement might cause product shipment delays, require us to develop alternative technology or require us to enter into royalty or license agreements, which might not be available on acceptable terms, or at all. If an infringement claim is made against us, we may not be able to develop non-infringing technology or license the infringing or similar technology on a timely and cost-effective basis. As a result, our business could be significantly harmed.
We may face liability claims that could result in unexpected costs and damages to our reputation.
Our licenses with customers generally contain provisions designed to limit our exposure to potential product liability claims, such as disclaimers of warranties and limitations on liability for special, consequential and incidental damages. In addition, our license agreements generally limit the amounts recoverable for damages to the amounts paid by the licensee to us for the product or service giving rise to the damages. However, some domestic and international jurisdictions may not enforce these contractual limitations on liability. We may be subject to claims based on errors in our software or mistakes in performing our services including claims relating to damages to our customers’ internal systems. A product liability claim could divert the attention of our management and key personnel, could be expensive to defend and could result in adverse settlements and judgments.
We may face higher costs and lost sales if our software contains errors.
We face the possibility of higher costs as a result of the complexity of our products and the potential for undetected errors. Due to the critical nature of many of our products and services, errors could be particularly problematic. In the past, we have discovered software errors in some of our products after their introduction. We only have a few “beta” customers that test new features and functionality of our software before we make these features and functionalities generally available to our customers. If we are not able to detect and correct errors in our products or releases before commencing commercial shipments, we could face:
loss of or delay in revenues expected from new products and an immediate and significant loss of market share;
loss of existing customers that upgrade to new products and of new customers;
failure to achieve market acceptance;
diversion of development resources;
injury to our reputation;
increased service and warranty costs;
legal actions by customers; and
increased insurance costs.
Any of the foregoing potential results of errors in our software could adversely affect our business, financial condition and results of operations.
Our security could be breached, which could damage our reputation and deter customers from using our services.
We must protect our computer systems and network from physical break-ins, security breaches, and other disruptive problems caused by the Internet or other users. Computer break-ins could jeopardize the security of information stored in and transmitted through our computer systems and network, which could adversely affect our ability to retain or attract customers, damage our reputation, and subject us to litigation. We have been in the past, and could be in the future, subject to denial of service, vandalism, and other attacks on our systems by Internet hackers. Although we intend to continue to implement security technology and establish operational procedures to prevent break-ins, damage and failures, these security measures may fail. Our insurance coverage in certain circumstances may be insufficient to cover losses that may result from such events.
We have significant international sales and are subject to risks associated with operating in international markets.
A substantial proportion of our revenues are generated from sales outside North America, exposing us to additional financial and operational risks. Sales outside North America represented 25%, 25% and 32% of our total revenues for 2008, 2007 and 2006, respectively. We have established offices in the United States, Europe and Japan. Sales outside North America could increase as a percentage of total revenues as we attempt to expand our international operations. In addition to the additional costs and uncertainties of being subject to international laws and regulations, international operations require significant management attention and financial resources, as well as additional support personnel. To the extent our international operations grow, we will also need to, among other things, expand our international sales channel management and support organizations and develop relationships with international service providers and additional distributors and systems integrators. International operations are subject to many inherent risks, including:
political, social and economic instability, including conflicts in the Middle East and elsewhere abroad, terrorist attacks and security concerns in general;
adverse changes in tariffs, duties, price controls and other protectionist laws and business practices that favor local competitors;
fluctuations in currency exchange rates;
longer collection periods and difficulties in collecting receivables from foreign entities;
exposure to different legal standards and burdens of complying with a variety of foreign laws, including employment, tax, privacy and data protection laws and regulations;
reduced protection for our intellectual property in some countries;
increases in tax rates;
greater seasonal fluctuations in business activity;
expenses associated with localizing products for foreign countries, including translation into foreign languages;
difficulty and cost of staffing and managing international operations; and
import and export license requirements and restrictions of the United States and each other country in which we operate.
We believe that international sales will continue to represent a significant portion of our revenue for the foreseeable future. Any of these factors may adversely affect our future international sales and, consequently, affect our business, financial condition and results of operations.
We may suffer foreign exchange rate losses.
Our international revenues and expenses are denominated in local currency. Therefore, a weakening of the U.S. dollar to other currencies could make our products more costly to sell in foreign markets and could negatively affect our operating results and cash flows. The volatility of foreign currencies in certain regions, most notably the Japanese yen, European Union euro and British pound have had, and may in the future have, a harmful effect on our revenue or operating results. To the extent the international component of our revenues grows, our results of operations will become more sensitive to foreign exchange rate fluctuations.
If we acquire companies, products, or technologies, we may face risks associated with those acquisitions.
In June 2007, we acquired all of the membership interests of eVergance. We may not realize the anticipated benefits of the eVergance acquisition or any other acquisition or investment. For example, since our inception, we have recorded $2.7 billion of impairment charges for the cost of goodwill obtained from acquisitions. If we acquire another company, we will likely face risks, uncertainties and disruptions associated with the integration process, including, among other things, difficulties in the integration of the operations, technologies and services of the acquired company, the diversion of our management’s attention from other business concerns, the potential loss of key employees of the acquired businesses, and the failure of the acquired businesses, products or technologies to generate sufficient revenue to offset acquisition costs. If we fail to successfully integrate other companies that we may acquire, our business could be harmed. Also, acquisitions, including the acquisition of eVergance, can expose us to liabilities and risks facing the company we acquire, such as lawsuits or claims against us that are unknown at the time of the acquisition. Furthermore, we may have to incur debt or issue equity securities to pay for any additional future acquisitions or investments, the issuance of which could be dilutive to our existing stockholders. In addition, our operating results may suffer because of acquisition-related costs or amortization expenses or charges relating to acquired goodwill and other intangible assets. These factors could have an adverse effect on our business, results of operations, financial condition or cash flows.
Compliance with regulations governing public company corporate governance and reporting will result in additional costs.
Our continuing preparation for and implementation of various corporate governance reforms and enhanced disclosure laws and regulations adopted in recent years requires us to incur significant additional accounting and legal costs. We are subject to accounting disclosures required by laws and regulations adopted in connection with the Sarbanes-Oxley Act of 2002 (the “Sarbanes-Oxley Act”). In particular, we are required to provide a report on our internal control over financial reporting required by Section 404 of the Sarbanes-Oxley Act. Any unanticipated difficulties in preparing for and implementing these and other corporate governance and reporting reforms could result in material delays in compliance or significantly increase our costs. Any failure to timely prepare for and implement the reforms required by new laws and regulations could significantly harm our business, operating results and financial condition.
We have adopted anti-takeover defenses that could delay or prevent an acquisition of the Company.
Our Board of Directors has the authority to issue up to 5,000,000 shares of preferred stock. Without any further vote or action on the part of the stockholders, the Board of Directors has the authority to determine the price, rights, preferences, privileges, and restrictions of the preferred stock. This preferred stock, if issued, might have preference over and harm the rights of the holders of common stock. Although the ability to issue this preferred stock provides us with flexibility in connection with possible acquisitions and other corporate purposes, it can also be used to make it more difficult for a third party to acquire a majority of our outstanding voting stock. We currently have no plans to issue preferred stock. Similarly, we have established a stockholder rights plan that is intended to protect our ability to utilize our net operating losses and which would also make it difficult for a third party to acquire a significant number of shares of our common stock.
Our certificate of incorporation, bylaws and equity compensation plans include provisions that may deter an unsolicited offer to purchase us. These provisions, coupled with the provisions of the Delaware General Corporation Law, may delay or impede a merger, tender offer or proxy contest. Furthermore, our Board of Directors is divided into three classes, only one of which is elected each year. In addition, directors are only removable by the affirmative vote of at least two-thirds of all classes of voting stock. These factors may further delay or prevent a change of control of us.
Risks Related to Our Industry
Future regulation of the Internet may slow our growth, resulting in decreased demand for our products and services and increased costs of doing business.
State, federal and foreign regulators could adopt laws and regulations that impose additional burdens on companies that conduct business online. These laws and regulations could discourage communication by e-mail or other web-based communications, particularly targeted e-mail of the type facilitated by our products, which could reduce demand for our products and services.
The growth and development of the market for online services may prompt calls for more stringent consumer protection laws or laws that may inhibit the use of Internet-based communications or the information contained in these communications. The adoption of any additional laws or regulations may decrease the expansion of the Internet. A decline in the growth of the Internet, particularly as it relates to online communication, could decrease demand for our products and services and increase our costs of doing business, or otherwise harm our business. Any new legislation or regulations, application of laws and regulations from jurisdictions whose laws do not currently apply to our business, or application of existing laws and regulations to the Internet and other online services could increase our costs and harm our growth.
The imposition of sales and other taxes on products sold by our customers over the Internet could have a negative effect on online commerce and the demand for our products and services.
The imposition of new sales or other taxes could limit the growth of Internet commerce generally and, as a result, the demand for our products and services. Federal legislation that limits the imposition of state and local taxes on Internet-related sales will expire on November 1, 2014. Congress may choose to modify this legislation or to allow it to expire, in which case state and local governments would be free to impose taxes on electronically purchased goods. We believe that most companies that sell products over the Internet do not currently collect sales or other taxes on shipments of their products into states or foreign countries where they are not physically present. However, one or more states or foreign countries may seek to impose sales or other tax collection obligations on out-of-jurisdiction companies that engage in e-commerce within their jurisdiction. A successful assertion by one or more states or foreign countries that companies that engage in e-commerce within their jurisdiction should collect sales or other taxes on the sale of their products over the Internet, even though not physically in the state or country, could indirectly reduce demand for our products.
Privacy concerns relating to the Internet are increasing, which could result in legislation that negatively affects our business in reduced sales of our products.
Businesses using our products capture information regarding their customers when those customers contact them on-line with customer service inquiries. Privacy concerns could cause visitors to resist providing the personal data necessary to allow our customers to use our software products most effectively. More importantly, even the perception of privacy concerns, whether or not valid, may indirectly inhibit market acceptance of our products. In addition, legislative or regulatory requirements may heighten these concerns if businesses must notify website users that the data captured after visiting certain websites may be used by marketing entities to unilaterally direct product promotion and advertising to that user. If consumer privacy concerns are not adequately resolved, our business could be harmed. Government regulation that limits our customers’ use of this information could reduce the demand for our products. A number of jurisdictions have adopted, or are considering adopting, laws that restrict the use of customer information from Internet applications. The European Union has required that its member states adopt legislation that imposes restrictions on the collection and use of personal data, and that limits the transfer of personally identifiable data to countries that do not impose equivalent restrictions. In the United States, the Children’s Online Privacy Protection Act was enacted in October 1998. This legislation directs the Federal Trade Commission to regulate the collection of data from children on commercial websites. In addition, the Federal Trade Commission has investigated the privacy practices of businesses that collect information on the Internet. These and other privacy-related initiatives could reduce demand for some of the Internet applications with which our products operate, and could restrict the use of these products in some e-commerce applications. This could, in turn, reduce demand for these products.
The success of our products depends on the continued growth and acceptance of the Internet as a business and communications tool, and the related expansion of the Internet infrastructure.
The future success of our products depends upon the continued and widespread adoption of the Internet as a primary medium for commerce, communication and business applications. Our business growth would be impeded if the performance or perception of the Internet was harmed by security problems such as “viruses,” “worms” and other malicious programs, reliability issues arising from outages and damage to Internet infrastructure, delays in development or adoption of new standards and protocols to handle increased demands of Internet activity, increased costs, decreased accessibility and quality of service, or increased government regulation and taxation of Internet activity.
The Internet has experienced, and is expected to continue to experience, significant user and traffic growth, which has, at times, caused user frustration with slow access and download times. If Internet activity grows faster than Internet infrastructure or if the Internet infrastructure is otherwise unable to support the demands placed on it, our business growth may be adversely affected.
General economic conditions could adversely affect our customers’ ability or willingness to purchase our products, which could materially and adversely affect our results of operations.
Our customers consist of large and small companies in nearly all industry sectors and geographies. Potential new clients or existing clients could defer purchases of our products because of unfavorable macroeconomic conditions, such as rising interest rates, fluctuations in currency exchange rates, industry or national economic downturns, industry purchasing patterns, and other factors. Our ability to grow revenues may be adversely affected by unfavorable economic conditions.
| ITEM 1B. | UNRESOLVED STAFF COMMENTS. |
Not applicable.
| ITEM 2. | PROPERTIES. |
Our corporate headquarters are located in Menlo Park, California, where we lease approximately 45,000 square feet under a lease that expires in April 2010. In addition, we lease offices in several cities throughout the United States and internationally in the United Kingdom, Ireland and Japan. We believe the facilities we are now using are adequate for our business requirements.
We have a total of approximately 21,000 square feet of excess space available for sublease or renegotiation. The excess space is located in Princeton, New Jersey. Remaining lease commitment terms on this lease expires in January 2011.
| ITEM 3. | LEGAL PROCEEDINGS. |
On January 24, 2007, RightNow Technologies, Inc. (“RightNow”) filed a suit in the Eighteenth Judicial District Court of Gallatin County, Montana against the Company and four former RightNow employees who had joined the Company. The suit alleges violation of certain provisions of employment agreements, misappropriation of trade secrets, as well as other claims, and seeks damages. We believe we have meritorious defenses to these claims and intend to defend against this action vigorously.
The underwriters for the Company’s initial public offering, Goldman Sachs & Co., Lehman Bros., Hambrecht & Quist LLC, Wit Soundview Capital Corp., as well as us and certain of our current and former officers were named as defendants in federal securities class action lawsuits filed in the U.S. District Court for the Southern District of New York (the “District Court”). The cases allege violations of various securities laws by more than 300 issuers of stock, including us, and the underwriters for such issuers, on behalf of a class of plaintiffs who, in our case, purchased our stock between September 21, 1999 and December 6, 2000 in connection with our initial public offering. Specifically, the complaints allege that the underwriter defendants engaged in a scheme concerning sales of our and other issuers’ securities in the initial public offering and in the aftermarket. In July 2003, we decided to join a settlement negotiated by representatives of a coalition of issuers named as defendants in this action and their insurers. In April 2005, the court requested a modification to the original settlement arrangement which was approved by us. Although we believed that the plaintiffs’ claims had no merit, we had decided to accept the settlement proposal to avoid the cost and distraction of continued litigation. We were a party to a global settlement with the plaintiffs that would have disposed of all claims against us with no admission of wrongdoing by us or any of our present or former officers or directors. The settlement agreement had been preliminarily approved by the District Court. However, while the settlement was awaiting final approval by the District Court, in December 2006, the Court of Appeals reversed the District Court’s determination that six focus cases could be certified as class actions. In April 2007, the Court of Appeals denied the plaintiffs’ petition for rehearing, but acknowledged that the District Court might certify a more limited class. At a September 26, 2007 status conference, the District Court approved a stipulation withdrawing the proposed settlement. On August 14, 2007, the plaintiffs filed an amended complaint in the six focus cases to test
the sufficiency of their class allegations. On September 27, 2007, the plaintiffs filed a motion for class certification in the six focus cases, which was withdrawn on October 10, 2008. On November 13, 2007, the defendants filed a motion to dismiss the complaint for failure to state a claim, which the District Court denied on March 8, 2008. Plaintiffs, the issuer defendants (including us) and underwriter defendants and the insurance carriers for the defendants have engaged in mediation and settlement negotiations. The parties have entered into a written settlement agreement. As part of this settlement, our insurance carrier has agreed to assume the our entire payment obligation under the terms of the settlement. The proposed settlement was submitted to the District Court for preliminary approval on April 2, 2009, but there can be no guarantee that it will receive approval from the District Court. We believe that we have meritorious defenses to these claims. If the proposed settlement is not approved and the litigation continues against us, we would continue to defend against this action vigorously.
In October 2007, a lawsuit was filed in the U.S. District Court for the Western District of Washington by Ms. Vanessa Simmonds against certain of the underwriters of our initial public offering. The plaintiff alleges that the underwriters violated Section 16(b) of the Securities Exchange Act of 1934, 15 U.S.C. section 78p(b), by engaging in short-swing trades, and seeks disgorgement of profits from the underwriters in amounts to be proven at trial. On February 25, 2008, Ms. Simmonds filed an amended complaint. The suit names us as a nominal defendant, contains no claims against us, and seeks no relief from us. This lawsuit is one of more than fifty similar actions filed in the same court. On July 25, 2008, the underwriter defendants in the various actions filed a joint motion to dismiss the complaints. In addition, certain issuer defendants filed a joint motion to dismiss the complaints. The parties entered into a stipulation, entered as an order by the Court, that we are not required to answer or otherwise respond to the amended complaint. Accordingly, we did not join in the motions to dismiss. This matter was dismissed with prejudice on March 12, 2009, and plaintiff filed a notice of appeal on March 31, 2009.
Other third parties have from time to time claimed, and others may claim in the future that we have infringed their past, current or future intellectual property rights. We have in the past been forced to litigate such claims. These claims, whether meritorious or not, could be time-consuming, result in costly litigation, require expensive changes in our methods of doing business or could require us to enter into costly royalty or licensing agreements, if available. As a result, these claims could harm our business.
The ultimate outcome of any litigation is uncertain, and either unfavorable or favorable outcomes could have a material negative impact on our results of operations, consolidated balance sheets and cash flows due to defense costs, and divert management resources.
| ITEM 4. | SUBMISSION OF MATTERS TO A VOTE OF SECURITY HOLDERS. |
Not applicable.
| ITEM 5. | MARKET FOR THE REGISTRANT’S COMMON EQUITY, RELATED STOCKHOLDER MATTERS AND ISSUER PURCHASES OF EQUITY SECURITIES. |
Our common stock has been trading on the OTCBB under the symbol “KANA.OB” since December 5, 2006. The table below sets forth the high and low bid information for our common stock as reported on the OTCBB for each full quarterly period within the two most recent fiscal years.
| High | Low | |||||
Fiscal 2007 | ||||||
First Quarter | $ | 3.70 | $ | 2.77 | ||
Second Quarter | 3.77 | 2.75 | ||||
Third Quarter | 3.19 | 2.38 | ||||
Fourth Quarter | 3.64 | 2.35 | ||||
Fiscal 2008 | ||||||
First Quarter | $ | 2.40 | $ | 1.23 | ||
Second Quarter | 1.65 | 1.07 | ||||
Third Quarter | 1.75 | 0.93 | ||||
Fourth Quarter | 1.09 | 0.46 | ||||
Holders of Record
There were approximately 767 stockholders of record of our common stock as of February 27, 2009. The actual number of stockholders is greater than this number of record holders, and includes stockholders who are beneficial owners, but whose shares are held in street name by brokers and other nominees. This number of holders of record also does not include stockholders whose shares may be held in trust by other entities.
Dividend Policy
We have not paid any cash dividends on our capital stock. We currently intend to retain any earnings to fund the development and growth of our business and, therefore, do not anticipate paying any cash dividends in the foreseeable future. In addition, our existing credit facilities prohibit the payment of cash or stock dividends on our capital stock without the lender’s prior written consent.
Unregistered Sales of Equity Securities
See Note 2 of the Notes to the Consolidated Financial Statements in Item 8 of this Annual Report on Form 8-K.
Securities Authorized for Issuance Under Equity Compensation Plans
Information regarding securities authorized for issuance under our equity incentive plans may be found in the section captioned “Equity Compensation Plan Information” appearing in the definitive Proxy Statement to be delivered to stockholders in connection with the 2009 Annual Meeting of Stockholders. This information is incorporated herein by reference.
Stock Performance Graph
The line graph below compares the cumulative total stockholder return on our common stock with the cumulative return of the NASDAQ Composite Index and the Standard & Poor’s Information Technology Index (“S&P Information Technology Index”) for the five years ended December 31, 2008. The graph and table assume that $100.00 was invested on December 31, 2003 in each of our common stock, the NASDAQ Composite Index and the S&P Information Technology Index and that all dividends were reinvested. We have not paid or declared any cash dividends on our common stock. Stockholder returns over the period indicated should not be considered indicative of future stockholder returns.
COMPARISON OF 5 YEAR CUMULATIVE TOTAL RETURN*
Among KANA Software, Inc., The NASDAQ Composite Index
And The S&P Information Technology Index
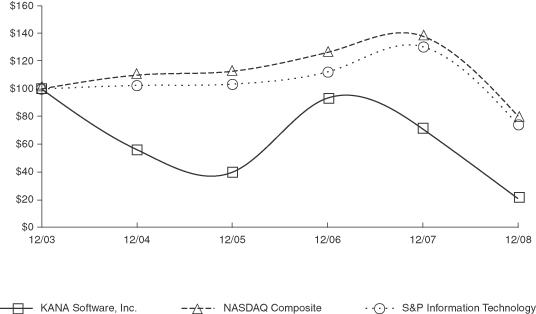
* $100.00 invested on December 31, 2003 in stock or index-including reinvestment of dividends. Fiscal years ending December 31.
| 2003 | 2004 | 2005 | 2006 | 2007 | 2008 | |||||||||||||
Kana Software, Inc. | $ | 100.00 | $ | 56.08 | $ | 39.76 | $ | 93.47 | $ | 71.22 | $ | 20.77 | ||||||
NASDAQ Composite Index | $ | 100.00 | $ | 110.08 | $ | 112.88 | $ | 126.51 | $ | 138.13 | $ | 80.47 | ||||||
S&P Information Technology Index | $ | 100.00 | $ | 102.56 | $ | 103.57 | $ | 112.29 | $ | 130.61 | $ | 74.26 | ||||||
Notwithstanding any statement to the contrary in any of our previous or future filings with the SEC, the foregoing information relating to the price performance of our common stock shall not be deemed to be “filed” with the SEC or to be “soliciting material” under the Exchange Act, and it shall not be deemed to be incorporated by reference into any of our filings under the Securities Act or the Exchange Act, except to the extent we specifically incorporate it by reference into such filing.
| ITEM 6. | SELECTED FINANCIAL DATA |
The selected consolidated financial data set forth below should be read in conjunction with “Management’s Discussion and Analysis of Financial Condition and Results of Operations,” the consolidated financial statements and the related notes included elsewhere in this Annual Report on Form 10-K, and other information we have filed with the SEC.
The consolidated statements of operations data for the years ended December 31, 2008, 2007, 2006, 2005 and 2004 and the consolidated balance sheet data at December 31, 2008, 2007, 2006, 2005 and 2004 are derived from our audited consolidated financial statements. The diluted net loss per share computation excludes shares of common stock issuable upon exercise or conversion of other securities, including outstanding warrants and options to purchase common stock and common stock subject to repurchase rights, because their effect would be antidilutive. See “Net Loss Per Share” in Note 1 of the Notes to the Consolidated Financial Statements included in Item 8 of this Annual Report on Form 10-K for a detailed explanation of the determination of the shares used to compute basic and diluted net loss per share. Historical results are not necessarily indicative of results to be expected for any future period.
| Year Ended December 31, | ||||||||||||||||||||
| 2008 | 2007 | 2006 | 2005 | 2004 | ||||||||||||||||
Revenues: | ||||||||||||||||||||
License fees | $ | 17,745 | $ | 18,071 | $ | 19,116 | $ | 8,094 | $ | 14,169 | ||||||||||
Services | 47,474 | 42,723 | 34,914 | 35,034 | 34,731 | |||||||||||||||
Total revenues | 65,219 | 60,794 | 54,030 | 43,128 | 48,900 | |||||||||||||||
Costs and expenses: | ||||||||||||||||||||
Cost of license fees | 1,012 | 1,239 | 2,460 | 2,995 | 2,449 | |||||||||||||||
Cost of services (1) | 19,675 | 16,004 | 10,439 | 8,746 | 9,834 | |||||||||||||||
Amortization of acquired intangible assets | 500 | 288 | 133 | 133 | 119 | |||||||||||||||
Sales and marketing (1) | 22,299 | 25,261 | 19,616 | 17,682 | 25,745 | |||||||||||||||
Research and development (1) | 13,818 | 12,650 | 10,765 | 13,232 | 19,579 | |||||||||||||||
General and administrative (1) | 10,572 | 11,900 | 10,185 | 11,404 | 8,294 | |||||||||||||||
Impairment of internal use software | — | — | — | 6,326 | 1,062 | |||||||||||||||
Restructuring costs, net of recoveries | 582 | 567 | 703 | 468 | 3,400 | |||||||||||||||
Total costs and expenses | 68,458 | 67,909 | 54,301 | 60,986 | 70,482 | |||||||||||||||
Loss from operations | (3,239 | ) | (7,115 | ) | (271 | ) | (17,858 | ) | (21,582 | ) | ||||||||||
Interest and other income (expense), net | (411 | ) | (739 | ) | (738 | ) | 88 | 128 | ||||||||||||
Registration rights penalty | — | — | (1,198 | ) | — | — | ||||||||||||||
Loss before income tax expense | (3,650 | ) | (7,854 | ) | (2,207 | ) | (17,770 | ) | (21,454 | ) | ||||||||||
Income tax expense | (5 | ) | (167 | ) | (219 | ) | (196 | ) | (314 | ) | ||||||||||
Net loss | $ | (3,655 | ) | $ | (8,021 | ) | $ | (2,426 | ) | $ | (17,966 | ) | $ | (21,768 | ) | |||||
Basic and diluted net loss per share | $ | (0.09 | ) | $ | (0.22 | ) | $ | (0.07 | ) | $ | (0.58 | ) | $ | (0.75 | ) | |||||
Shares used in computing basic and diluted net loss per share | 41,212 | 37,085 | 34,584 | 30,814 | 28,950 | |||||||||||||||
| December 31, | ||||||||||||||||||||
| 2008 | 2007 | 2006 | 2005 | 2004 | ||||||||||||||||
Consolidated Balance Sheet Data: | ||||||||||||||||||||
Cash and cash equivalents | $ | 6,988 | $ | 4,306 | $ | 5,719 | $ | 6,216 | $ | 13,772 | ||||||||||
Marketable securities | — | — | — | — | 6,361 | |||||||||||||||
Working capital (deficit) | (13,841 | ) | (11,621 | ) | (11,044 | ) | (18,439 | ) | (9,657 | ) | ||||||||||
Total assets | 33,817 | 35,400 | 30,335 | 35,706 | 50,361 | |||||||||||||||
Total long-term debt | 13 | 110 | 242 | — | — | |||||||||||||||
Total stockholders’ equity (deficit) | 2,590 | 4,406 | (3,132 | ) | (9,794 | ) | 3,164 | |||||||||||||
| (1) | Stock-based compensation expense, which was allocated as follows: |
| Year Ended December 31, | |||||||||||||||
| 2008 | 2007 | 2006 | 2005 | 2004 | |||||||||||
Cost of services | $ | 325 | $ | 336 | $ | 211 | $ | 2 | $ | 346 | |||||
Sales and marketing | 652 | 869 | 871 | 9 | 646 | ||||||||||
Research and development | 331 | 359 | 400 | 2 | 82 | ||||||||||
General and administrative | 904 | 1,309 | 1,945 | 25 | 157 | ||||||||||
| $ | 2,212 | $ | 2,873 | $ | 3,427 | $ | 38 | $ | 1,231 | ||||||
i
| ITEM 7. | MANAGEMENT’S DISCUSSION AND ANALYSIS OF FINANCIAL CONDITION AND RESULTS OF OPERATIONS |
In addition to historical information, this report contains forward-looking statements within the meaning of Section 27A of the Securities Act of 1933 and Section 21E of the Exchange Act. The forward-looking statements are not historical facts but rather are based on current expectations, estimates and projections about our business and industry, and our beliefs and assumptions. Words such as “anticipate,” “believe,” “estimate,” “expect,” “intend,” “plan,” “will” and variations of these words and similar expressions identify forward-looking statements. These statements are not guarantees of future performance and are subject to risks, uncertainties and other factors, many of which are beyond our control, are difficult to predict and could cause actual results to differ materially from” those expressed or forecasted in the forward-looking statements. These risks and uncertainties include, but are not limited to, those described in Item 1A “Risk Factors” and elsewhere in this report. Forward-looking statements that were believed to be true at the time made may ultimately prove to be incorrect or false. We undertake no obligation to revise or publicly release the results of any revision to these forward-looking statements. Given these risks and uncertainties, readers are cautioned not to place undue reliance on such forward-looking statements.
Overview
We offer an innovative approach to customer service with cost-effective solutions that enhance the quality of multi-channel customer interactions. Built on open standards for a high degree of adaptability and integration, our solutions intelligently automate the processes needed to successfully serve our clients’ customers, so that our clients can deliver higher value service at lower cost, increasing customer retention and loyalty. We provide an integrated solution which enables organizations to deliver consistent, managed service across all channels, including e-mail, chat, call centers and Web self-service, ensuring a consistent service experience across communication channels.
Our revenue is primarily derived from the sale of our software and related maintenance and support of the software. We also derive revenues from consulting, training and other services. Our products are generally installed by our customers using either a systems integrator, such as IBM or Accenture or our professional services group. Our professional services group assists the systems integrators as subject matter experts and in some cases will act as the prime contractor for implementation of our software. In June 2007 we acquired eVergance, a management consulting and systems integration firm, which expanded our professional services group’s capabilities and resources. We also rely on IBM and other systems integrators to recommend and install our software. This provides leverage in the selling phase, and also allows us to realize higher gross margins by selling primarily software licenses and support, which typically have higher margins than consulting and implementation services. In the past, we supplied specialists (who were subject matter experts) to work with IBM and other systems integrators. While we continue this practice, we are increasingly providing consulting and implementation services directly to our customers. These services may be provided to our existing customers who would like us to review their implementations or to new customers who are not quite large enough to gain the interest of a large systems integrator to provide such services. However, in the case of most of the initial installations of our applications that are generally installed by our customers using a systems integrator, these services generally increase the cost of the project substantially by subjecting their purchase to more levels of required approvals and scrutiny of projected cost savings in their customer service and marketing departments. This contributes to the difficulty that we face in predicting the quarter in which sales to expected customers will occur and to the uncertainty of our future operating results. To the extent that significant sales occur earlier or later than anticipated, revenues for subsequent quarters may be lower or higher, respectively, than expected.
We have incurred substantial costs to develop our products and to recruit, train and compensate personnel for our engineering, sales, marketing, client services and administration departments. As a result, we have incurred substantial losses since inception. On December 31, 2008, we had cash and cash equivalents of $7.0 million and $6.0 million outstanding under our line of credit. As of December 31, 2008, we had an accumulated deficit of $4.3 billion and a negative working capital of $13.8 million. $12.9 million of our current liabilities
consists of current deferred revenue, primarily reflecting obligations to provide support services under our software licenses. Losses from operations were $3.2 million and $7.1 million for 2008 and 2007, respectively, and net losses were $3.7 million and $8.0 million for 2008 and 2007, respectively. Net cash used for operating activities was $418,000 and $8.4 million in 2008 and 2007, respectively. These conditions, among others, raise substantial doubt about the Company’s ability to continue as a going concern. The consolidated financial statements do not reflect any adjustments that might be required as a result of this uncertainty.
Our management believes that based on our current plans, we will require additional financing to fund our operations and our working capital and capital expenditure requirements through December 31, 2009. If we are unable to secure additional financing, or if we experience lower than anticipated demand for our products, we will need to further reduce costs, or secure additional debt or equity financing to meet our cash requirements. Any such equity issuances could be dilutive to our stockholders, and any financing transactions may be on unfavorable terms, if at all.
As of December 31, 2008, we had 229 full-time employees, which represents an increase from 225 employees at December 31, 2007 and an increase from 181 employees at December 31, 2006.
Critical Accounting Policies and Estimates
The discussion and analysis of our financial condition and results of operations are based upon our consolidated financial statements, which have been prepared in accordance with accounting principles generally accepted in the United States of America (“GAAP”). The preparation of these consolidated financial statements requires us to make estimates and assumptions about future events that affect the amounts reported in the consolidated financial statements and accompanying notes. We base our estimates on historical experience and on various other assumptions that we believe to be reasonable under the circumstances. This forms the basis of judgments about the carrying values of assets and liabilities that are not readily apparent from other sources. In some cases, changes in the accounting estimates are reasonably likely to occur from period to period. Accordingly, actual results could differ materially from our estimates.
We believe the following discussion addresses our most critical accounting policies. These critical accounting policies require management to make difficult, subjective, and complex judgments, and are most important to the portrayal of our financial condition and results of operations. Please refer to Note 1 of the Notes to the Consolidated Financial Statements in Item 8 of this Annual Report on Form 10-K for further description of our critical accounting policies.
Revenue Recognition
We recognize revenues in accordance with the American Institute of Certified Public Accountants (“AICPA”) Statement of Position (“SOP”) 97-2, “Software Revenue Recognition” (“SOP 97-2”), as amended.
Revenue from software license agreements is recognized when the basic criteria of software revenue recognition have been met (i.e., persuasive evidence of an arrangement exists, delivery of the product has occurred, the fee is fixed or determinable, and collection is probable). We use the residual method described in AICPA SOP 98-9, “Modification of SOP 97-2, Software Revenue Recognition, With Respect to Certain Transactions” (“SOP 98-9”), to recognize revenue when a license agreement includes one or more elements to be delivered at a future date and vendor-specific objective evidence of the fair value of all undelivered elements exists. Under the residual method, the fair value of the undelivered elements is deferred and the remaining portion of the arrangement fee is recognized as license revenue. If evidence of the fair value of one or more undelivered elements does not exist, all revenue is deferred and recognized when delivery of those elements occurs or when fair value can be established.
For all sales we use either a signed license agreement, a signed amendment to an existing license agreement, a signed order form, a binding purchase order where we either have a signed master license agreement or an order form signed by the Company, or a signed statement of work as evidence of an arrangement.
Software delivery is primarily by electronic means. If the software or other deliverable is subject to acceptance for a specified period after the delivery, revenue is deferred until the acceptance period has expired or the acceptance provision has been met.
When licenses are sold together with consulting services, license fees are recognized upon delivery, provided that (1) the basic criteria of software revenue recognition have been met, (2) payment of the license fees is not dependent upon the performance of the consulting services, and (3) the consulting services do not provide significant customization of the software products and are not essential to the functionality of the software that was delivered. We do not provide significant customization of our software products.
Revenue arrangements with extended payment terms are generally considered not to be fixed or determinable, and we generally do not recognize revenue on these arrangements until the customer payments become due and all other revenue recognition criteria have been met.
Probability of collection is based upon assessment of the customer’s financial condition through review of their current financial statements or publicly-available credit reports. For sales to existing customers, prior payment history is also considered in assessing probability of collection. We are required to exercise significant judgment in deciding whether collectibility is reasonably assured, and such judgments may materially affect the timing of our revenue recognition and our results of operations.
Services revenues include revenues for consulting services, customer support and training, and managed services. Consulting services revenues and the related cost of services are generally recognized on a time and materials basis. For consulting services contracts that have a fixed fee, we recognize the license and professional consulting services revenues using either the percentage-of-completion method or the completed contract method as prescribed by AICPA SOP 81-1, “Accounting for Performance of Construction-Type and Certain Product-Type Contracts” (“SOP 81-1”). Our consulting arrangements do not include significant customization of the software. Customer support agreements provide technical support and the right to unspecified future upgrades on an if-and-when available basis. Customer support revenues are recognized ratably over the term of the support period (generally one year). Training services revenues are recognized as the related training services are delivered. The unrecognized portion of amounts billed in advance of delivery for services is recorded as deferred revenue. Managed services revenues are recognized in accordance with the SEC Staff Accounting Bulletin (“SAB”) No. 104, “Revenue Recognition, corrected copy” (“SAB 104”). Revenues from managed services are recognized ratably over the term of the arrangement, while application fees are recognized ratably over the sum of the term of the arrangement and the term of expected renewals.
Vendor-specific objective evidence for consulting and training services are based on the price charged when an element is sold separately or, in the case of an element not yet sold separately, the price established by authorized management, if it is probable that the price, once established, will not change before market introduction. Vendor-specific objective evidence for support services is based on the price charged when an element is sold separately or the stated contractual renewal rates.
Accounting for Internal-Use Software
Internal-use software costs, including fees paid to third parties to implement the software, are capitalized beginning when we have determined various factors are present, such as that technology exists to achieve the performance requirements, we have made a decision as to whether we will purchase the software or develop it internally, and we have authorized funding for the project. Capitalization of software costs ceases when the software implementation is substantially complete and is ready for its intended use, and the capitalized costs are amortized over the software’s estimated useful life (generally five years) using the straight-line method.
When events or circumstances indicate the carrying value of internal-use software might not be recoverable, we assess the recoverability of these assets by determining whether the amortization of the asset balance over its remaining life can be recovered through undiscounted future operating cash flows. The amount of impairment, if any, is recognized to the extent that the carrying value exceeds the projected discounted future operating cash flows and is recognized as a write down of the asset. In addition, if it is no longer probable that the computer software being developed will be placed in service, the asset is adjusted to the lower of its carrying value or fair
value, if any, less direct selling costs. Any such adjustment would result in an expense in the period recorded, which could have a material adverse effect on our consolidated statements of operations. In the quarter ended September 30, 2008, we expensed approximately $263,000 of capitalized costs related to an internal use software project that was abandoned. This amount is included in the restructuring costs, net of recoveries line on the consolidated statement of operations.
Restructuring
In 2001, we recorded significant liabilities in connection with our restructuring program. These reserves included estimates pertaining to contractual obligations related to excess leased facilities in Menlo Park, California; Princeton, New Jersey; Framingham, Massachusetts; and Marlow in the United Kingdom. Remaining lease commitments will terminate in January 2010 and January 2011. We are seeking to sublease or renegotiate the obligations associated with the excess space. We have subleased some of the excess space, but in all cases, the sublease income is less than the rent we pay the landlord. We had $1.2 million in accrued restructuring costs as of December 31, 2008, which was our estimate, as of that date, of the exit costs of these excess facilities. We have worked with real estate brokers in each of the markets where these properties are located to help us estimate the amount of the accrual. This process involves significant judgments regarding these markets. If we determine that any of these real estate markets has deteriorated further, additional adjustments to this accrual may be required, which would result in additional restructuring expenses in the period in which such determination is made. Likewise, if any of these real estate markets strengthen, and we are able to sublease the properties earlier or at more favorable rates than projected, or if we are otherwise able to negotiate early termination of obligations on favorable terms, adjustments to the accrual may be required that would increase income in the period in which such determination is made. In December 2006, we determined that we may not be able to sublease a leased facility in Princeton, New Jersey, and we changed our assumption of subleasing this excess space. We recorded a restructuring charge of $739,000 in the year ended December 31, 2006 mainly related to this change in estimate of sublease assumption that was not subject to any contractual arrangement. In 2006, there was also a restructuring recovery of $36,000 due to the change in estimates of termination of certain employees. Lease obligations for Framingham, Massachusetts and Marlow in the United Kingdom terminated during 2007.
In July 2007, we implemented various cost reduction and restructuring activities to reduce operating costs. The expense related to our reduction in work force was approximately $240,000 and the expense related to ceasing use of one of our offices was approximately $8,000.
In September 2007, we agreed with the landlord of one of the facilities included in our restructuring accrual to surrender the remaining term of the lease in exchange for a lump sum cash payment. As a result of this agreement we recorded an additional restructuring expense of approximately $319,000. The lump sum cash payment was primarily made by a surrender of the existing lease deposit of $2.1 million.
In March 2008, we were notified by the subtenant of one of the facilities included in the restructuring accrual of their intent to lease additional space and extend their sublease through the end of our lease term. As a result of this agreement, we recorded a restructuring recovery of approximately $482,000. The agreement was executed in May 2008.
In July 2008, we implemented various cost reduction and restructuring activities to reduce operating costs. The expense related to this reduction in work force was approximately $737,000 and the expense related to ceasing use of two of our offices was approximately $64,000. Additionally, we expensed approximately $263,000 of capitalized costs related to an internal use software project that was abandoned.
Goodwill and Intangible Assets
We regularly evaluate all potential indicators of impairment of goodwill and intangible assets, but at a minimum, test goodwill and intangible assets for impairment on an annual basis. Our judgments regarding the
existence of impairment indicators are based on market conditions and operational performance. Future events could cause us to conclude that impairment indicators exist and that goodwill and other intangible assets associated with our acquired businesses are impaired.
The remaining amount of goodwill as of December 31, 2008 is $12.4 million. We continue to assess whether any potential indicators of impairment of goodwill have occurred and have determined that no such indicators have arisen since June 30, 2008, the date of our annual goodwill impairment test. Any further impairment loss could have a material adverse impact on our financial condition and results of operations.
Income Taxes
We estimate our income taxes in each of the jurisdictions in which we operate as part of the process of preparing our consolidated financial statements. This process involves us estimating our actual current tax exposure together with assessing temporary differences resulting from differing treatment of items, such as net operating loss carryforwards, and stock-based compensation, for tax and accounting purposes. These differences result in deferred tax assets and liabilities. We then assess the likelihood that our net deferred tax assets will be recovered from future taxable income and to the extent we believe that recovery is not more likely than not, we establish a valuation allowance. We concluded that a full valuation allowance was required for all periods presented. While we have considered future taxable income in assessing the need for the valuation allowance, in the event we were to determine that we would be able to realize our deferred tax assets in the future in excess of its net recorded amount, an adjustment to the deferred tax asset would be made, increasing our income in the period in which such determination was made.
Pursuant to the Internal Revenue Code, the amounts of and benefits from net operating loss carryforwards may be impaired or limited in certain circumstances. Events which cause limitations in the amount of net operating losses that we may utilize include, but are not limited to, a cumulative ownership change of more than 50% of the Company, as defined, over a three-year period. The portion of the net operating loss and tax credit carryforwards subject to potential limitation has not been included in deferred tax assets.
On January 1, 2007, we adopted FASB Interpretation No. 48 “Accounting for Uncertainty in Income Taxes—an interpretation of FASB Statement 109” (“FIN 48”). FIN 48 establishes a single model to address accounting for uncertain tax positions. FIN 48 clarifies the accounting for income taxes by prescribing a minimum recognition threshold a tax position is required to meet before being recognized in the financial statements. FIN 48 also provides guidance on derecognition, measurement, classification, interest and penalties, accounting in interim periods, disclosure and transition. During the implementation, we identified, evaluated, and measured the amount of income tax benefits to be recognized for all material income tax positions. The net deferred income tax assets recognized under FIN 48 did not materially differ from the net deferred tax assets recognized before adoption, and, therefore, we did not record an adjustment related to the adoption of FIN 48. At the adoption date of January 1, 2007, we had $145,000 of unrecognized tax benefits, all of which would affect our effective tax rate if recognized. At December 31, 2008, we had $120,000 of unrecognized tax benefits. These amounts are included in other long-term liabilities on the consolidated balance sheets.
Contingencies and Litigation
We are subject to lawsuits and other claims and proceedings. We assess the likelihood of any adverse judgments or outcomes to these matters as well as ranges of probable losses. A determination of the amount of loss contingency required, if any, for these matters are made after careful analysis of each individual matter. The required loss contingencies may change in the future as the facts and circumstances of each matter changes.
Stock-Based Compensation
We account for stock-based compensation in accordance with Statement of Financial Accounting Standards (“SFAS”) No. 123 (revised 2004), “Share-Based Payment” (“SFAS 123(R)”), which requires the measurement
and recognition of compensation expense for all stock-based awards made to employees and directors including employee stock options based on estimated fair values. SFAS 123(R) supersedes our previous accounting under Accounting Principles Board Opinion No. 25, “Accounting for Stock Issued to Employees” (“APB 25”) for years beginning in fiscal year 2006. We also apply the provisions of SAB No. 107 “Share-Based Payment” (“SAB 107”) in our accounting for stock-based compensation.
SFAS 123(R) requires companies to estimate the fair value of employee stock-based awards on the date of grant using an option pricing model. The value of the portion of the award that is ultimately expected to vest is recognized as expense over the requisite service periods in our consolidated statements of operations. Employee stock-based compensation expense for each of the years ended December 31, 2008, 2007 and 2006 was $2.2 million, $2.8 million and $2.8 million, respectively.
Stock-based compensation expense recognized in the years ended December 31, 2008, 2007 and 2006 included compensation expense for stock-based awards granted prior to, but not yet vested as of, December 31, 2005, based on the fair value on the grant date estimated in accordance with the pro forma provisions of SFAS No. 123 “Accounting for Stock Based Compensation.” Our stock-based compensation expense also includes compensation expense for the share-based payment awards granted subsequent to December 31, 2005 based on the grant date fair value estimated in accordance with the provisions of SFAS 123(R). As stock-based compensation expense recognized in our results of operations for 2008, 2007 and 2006 was based on awards ultimately expected to vest, it was reduced for estimated forfeitures. SFAS 123(R) requires forfeitures to be estimated at the time of grant and revised, if necessary, in subsequent periods if actual forfeitures differ from those estimates.
We utilize the Black-Scholes option pricing model as the most appropriate method for determining the estimated fair value for stock-based awards. The Black-Scholes option pricing model requires the use of highly subjective and complex assumptions which determine the fair value of stock-based awards, including the option’s expected term and the price volatility of the underlying stock.
For stock options granted to non-employees, we recognize compensation expense in accordance with the provisions of SFAS 123 and Emerging Issues Task Force Issue (“EITF”) No. 96-18, “Accounting for Equity Instruments that are Issued to Other than Employees for Acquiring, or in Conjunction with Selling, Goods or Services,” which require such equity instruments to be recorded at their fair value on the measurement date. The measurement of stock-based compensation is subject to periodic fair value adjustments as the underlying equity instruments vest. We amortize compensation expense related to non-employee stock options in accordance with Financial Accounting Standards Board (“FASB”) Interpretation No. 28,“Accounting for Stock Appreciation Rights and Other Variable Stock Option or Award Plans” (“FIN 28”). We extended the vesting period of approximately 1,000,000 stock options held by four terminated employees who had agreements to provide consulting services. In October 2006, we extended the exercise period of approximately 211,000 vested stock options of a former employee as the result of a termination agreement. During the year ended December 31, 2006, we granted a total of 57,500 stock options to four non-employees who had agreements to provide consulting services. As a result of these stock option modifications to former employees and the stock option grants to consultants, we recorded non-employee stock-based compensation expense of $4,000, $31,000 and $632,000 for the years ended December 31, 2008, 2007 and 2006, respectively.
Also see “Stock-based Compensation” in Note 1 of the Notes to the Consolidated Financial Statements in Item 8 of this Annual Report on Form 10-K.
Effect of Recent Accounting Pronouncements
We discuss the potential impact of recent accounting pronouncements in Note 1 of the Notes to the Consolidated Financial Statements in Item 8 of this Annual Report on Form 10-K.
Results of Operations
The following table sets forth selected data for the periods presented. Percentages are expressed as a percentage of total revenues.
| Years Ended December 31, | |||||||||
| 2008 | 2007 | 2006 | |||||||
Revenues: | |||||||||
License fees | 27 | % | 30 | % | 35 | % | |||
Services | 73 | 70 | 65 | ||||||
Total revenues | 100 | % | 100 | % | 100 | % | |||
Costs and expenses: | |||||||||
Cost of license fees | 2 | % | 2 | % | 5 | % | |||
Cost of services (1) | 30 | 26 | 19 | ||||||
Amortization of acquired intangible assets | 1 | 0 | 0 | ||||||
Sales and marketing (1) | 34 | 42 | 36 | ||||||
Research and development (1) | 21 | 21 | 20 | ||||||
General and administrative (1) | 16 | 20 | 19 | ||||||
Restructuring | 1 | 1 | 1 | ||||||
Total costs and expenses | 105 | % | 112 | % | 101 | % | |||
| (1) | Stock-based compensation included in the expense line items: |
Cost of services | * | % | 1 | % | * | % | |||
Sales and marketing | 1 | 1 | 2 | ||||||
Research and development | 1 | 1 | 1 | ||||||
General and administrative | 1 | 2 | 4 | ||||||
| 3 | % | 5 | % | 6 | % | ||||
| * | Less than 1% |
Comparison of the Years Ended December 31, 2008 and 2007
Revenues
Total revenues increased by 7% to $65.2 million for the year ended December 31, 2008 from $60.8 million for the year ended December 31, 2007, primarily as a result of higher services revenues in 2008 compared to 2007.
License revenues include licensing fees only and exclude associated support and consulting revenues. The majority of our licenses to customers are perpetual and associated revenues are recognized upon delivery provided that all revenue recognition criteria are met as discussed in “Revenue Recognition” under “Critical Accounting Policies and Estimates” above. License revenues decreased by 2% to $17.7 million for 2008 from $18.1 million for 2007. This decrease in license revenues was based, in part, on additional levels of approvals inside our customers’ organizations that resulted in longer sales cycles and reduced levels of overall demand brought on as a result of macro economic conditions. While we are focused on increasing license revenues, we are unable to predict such revenues from period to period with any degree of accuracy because, among other things, the market for our products is unpredictable and intensely competitive, and our sales cycle is long and unpredictable.
Services revenues consist of support revenues and professional services revenues and fees. Support revenues relate to providing customer support, product maintenance and updates to our customers. Professional services
revenues relate to providing consulting, training and implementation services to our customers including managed services. Services revenues increased by 11% to $47.5 million for the year ended December 31, 2008 compared to $42.7 million for 2007. Support revenues are the largest component of services revenues, and in 2008, support revenues increased slightly. The other part of services revenues is professional services fees that increased in 2008 from 2007 primarily due to the additional services fees generated by eVergance.
Revenues from international sales were $16.4 million, or 25% of total revenues, in the year ended December 31, 2008 and $15.3 million, or 25% of total revenues, in the year ended December 31, 2007. Our international revenues were derived from sales in Europe and Asia Pacific.
Costs and Expenses
Total cost of revenues increased by 21% to $21.2 million for the year ended December 31, 2008 from $17.5 million for the year ended December 31, 2007.
License Fees. Cost of license fees consists primarily of third party software royalties and costs of product documentation. Cost of license fees as a percentage of license revenue was 6% in 2008 compared to 7% in 2007. The decrease was primarily due to lower third party royalty costs. We expect that our cost of license fees as a percentage of sales will vary based on changes in the mix of products we sell and the timing of upgrades. We are not able to predict when customers will choose to upgrade their software which will then cause us to incur royalty costs. We are continuing to look at cost-effective alternatives for some original equipment manufacturer (“OEM”) products embedded in our products.
Services. Cost of services consists primarily of salaries and related expenses for our customer support, consulting, and training services organization, and allocation of facility costs and system costs incurred in providing customer support and managed services. Cost of services increased to 41% of services revenues, or $19.7 million, for 2008 compared to 37% of services revenues, or $16.0 million, for 2007. Both totals include stock-based compensation of $325,000 and $336,000 for 2008 and 2007, respectively. The decrease in service margins in 2008 compared to 2007 was due to an increase in contractors costs as we built up the service organization, including its expansion through our acquisition of eVergance, to support increased revenues. As of December 31, 2008, we had 69 employees in support and consulting compared to 68 employees as of December 31, 2007.
Cost of services may increase or decrease, depending on the demand for these services. The expenses may also be affected by the amount, type and valuation of stock options granted as well as the amount of stock options cancelled due to employees and consultants leaving the Company.
Amortization of Acquired Intangible Assets.The amortization of acquired intangible assets recorded in 2008 and 2007 was related to $2.5 million of intangible assets recorded in connection with the acquisition of eVergance in June 2007. Amortization totaled $500,000 and $288,000 for the years ended December 31, 2008 and 2007, respectively.
Sales and Marketing. Sales and marketing expenses consist primarily of compensation and related costs for sales and marketing personnel and promotional expenditures, including public relations, advertising, trade shows and marketing materials. Sales and marketing expenses decreased by 12% to $22.3 million for the year ended December 31, 2008 from $25.3 million for the year ended December 31, 2007. Both totals include employee stock-based compensation of $652,000 and $869,000 for 2008 and 2007, respectively. The decrease in expenses was partially attributable to a decrease in average sales personnel of 5% from an average in 2007 of 64 employees to an average of 61 employees during 2008 and a decrease in marketing programs.
Sales and marketing expenses may increase or decrease, depending primarily on the amount of future revenues and our assessment of market opportunities and sales channels. The expenses may also be impacted by
the amount, type and valuation of stock options granted as well as the amount of stock options cancelled due to employees and consultants leaving the Company.
Research and Development. Research and development expenses consist primarily of compensation and related costs for research and development employees and contractors and enhancement of existing products and quality assurance activities. Research and development expenses increased by 9% to $13.8 million for the year ended December 31, 2008 from $12.7 million for the year ended December 31, 2007. Both totals include stock-based compensation of $331,000 and $359,000 for 2008 and 2007, respectively. The increase in expenses was primarily attributable to increased employee headcount partially offset by a reduced number of contractors. As of December 31, 2008, we had 65 employees in research and development compared to 53 employees as of December 31, 2007, a 23% increase.
Research and development expenses including related headcount may increase or decrease, depending primarily on the amount of future revenues, customer needs, and our assessment of market demand. The expenses may also be impacted by the amount, type and valuation of stock options granted as well as the amount of stock options cancelled due to employees and consultants leaving the Company.
General and Administrative. General and administrative expenses consist primarily of compensation and related costs for finance, legal, human resources, and corporate governance. Information technology and facilities costs are allocated among all operating departments. General and administrative expenses decreased by 11% to $10.6 million for the year ended December 31, 2008 from $11.9 million for the year ended December 31, 2007. Both totals include stock-based compensation of $904,000 and $1.3 million for years ended December 31, 2008 and 2007, respectively. The decrease in expenses was primarily due to higher legal fees incurred in 2007 that did not reoccur in 2008 offset by higher audit and consulting fees in 2008 due to Sarbanes-Oxley compliance. As of December 31, 2008, we had 35 employees in general and administrative and information technology compared to 41 employees as of December 31, 2007, a 15% decrease.
General and administrative expenses may increase or decrease, depending primarily on the amount of future revenues and corporate infrastructure requirements including insurance, professional services, taxes, and other administrative costs. The expenses may also be impacted by the amount, type and valuation of stock options granted as well as the amount of stock options cancelled due to employees and consultants leaving the Company.
Restructuring Costs. In July 2007, we implemented various cost reduction and restructuring activities to reduce operating costs. The expense related to our reduction in work force was approximately $240,000 and expense related to ceasing use of one of our offices was approximately $8,000.
In September 2007, we agreed with the landlord of one of the facilities included in our restructuring accrual to surrender the remaining term of the lease in exchange for a lump sum cash payment. As a result of this agreement, we recorded additional restructuring expense of approximately $319,000. The lump sum cash payment was primarily made by surrender of the existing lease deposit of $2.1 million.
In March 2008, we were notified by the subtenant of one of the facilities included in the restructuring accrual of their intent to lease additional space and extend their sublease through the end of our lease term. As a result of this agreement, we recorded a restructuring recovery of approximately $482,000. The agreement was executed in May 2008.
In July 2008, we implemented various cost reduction and restructuring activities to reduce operating costs. The expense related to this reduction in work force was approximately $737,000 and the expense related to ceasing use of two of our offices was approximately $64,000. Additionally, we expensed approximately $263,000 of capitalized costs related to an internal use software project that was abandoned.
The following table summarizes our restructuring activities for the years ended December 31, 2008 and 2007 (in thousands):
| Facilities | Severance and Related | Internal Use Software | Total | |||||||||||||
Restructuring accrual at December 31, 2006 | $ | 6,102 | $ | — | $ | — | $ | 6,102 | ||||||||
Restructuring charge | 327 | 240 | — | 567 | ||||||||||||
Payments made | (5,645 | ) | (240 | ) | — | (5,885 | ) | |||||||||
Sublease payments received | 1,968 | — | — | 1,968 | ||||||||||||
Restructuring accrual at December 31, 2007 | 2,752 | — | — | 2,752 | ||||||||||||
Restructuring charge (recoveries) | (418 | ) | 737 | 263 | 582 | |||||||||||
Payments made | (1,632 | ) | (737 | ) | — | (2,369 | ) | |||||||||
Non-cash adjustment | — | — | (263 | ) | (263 | ) | ||||||||||
Sublease payments received | 478 | — | — | 478 | ||||||||||||
Restructuring accrual at December 31, 2008 | $ | 1,180 | $ | — | $ | — | $ | 1,180 | ||||||||
Interest and Other Income (Expense), Net
Interest and other income (expense), net consists primarily of interest income and interest expense. Interest income consists primarily of interest earned on cash and cash equivalents and was approximately $27,000 and $87,000 for the years ended December 31, 2008 and 2007, respectively. The decrease in interest income related to lower cash and cash equivalents balances in 2008 compared to 2007. Interest expense relates primarily to our line of credit and notes payable and was approximately $369,000 and $858,000 for the years ended December 31, 2008 and 2007, respectively. The decrease in interest expense related to lower average borrowings against the line of credit in 2008 compared to 2007. For the year ended December 31, 2007, interest and other income (expense), net also consists of $383,000 of bank fees related to certain loans.
Income Tax Expense
We have incurred net operating losses on a consolidated basis for all years from inception through December 31, 2008. Accordingly, we have recorded a valuation allowance for the full amount of our gross deferred tax assets, as the future realization of the tax benefit is not currently more likely than not. In 2008 and 2007, certain of our foreign subsidiaries were profitable, based upon application of our intercompany transfer pricing agreements, which resulted in us reporting income tax expense in those foreign jurisdictions totaling approximately $87,000 and $167,000 for the years ended December 31, 2008 and 2007, respectively. During 2008 we also recorded an adjustment to release approximately $25,000 of excess FIN 48 reserve and an adjustment to record a refundable research and development credit of approximately $57,000.
As of December 31, 2008, we had operating loss carryforwards for federal and California income tax purposes of approximately $458 million and $127 million, respectively. The federal and state net operating loss carryforwards, if not offset against future taxable income, will expire by 2029. We also had foreign net operating loss carryforwards of approximately $8 million. The foreign losses expire at various dates and some can be carried forward indefinitely.
Comparison of the Years Ended December 31, 2007 and 2006
Revenues
Total revenues increased by 13% to $60.8 million for the year ended December 31, 2007 from $54.0 million for the year ended December 31, 2006, primarily as a result of higher services revenues in 2007 compared to 2006.
License revenues include licensing fees only and exclude associated support and consulting revenues. The majority of our licenses to customers are perpetual and associated revenues are recognized upon delivery provided that all revenue recognition criteria are met as discussed in “Revenue Recognition” under “Critical Accounting Policies and Estimates” above. License revenues decreased by 5% to $18.1 million for 2007 from $19.1 million for 2006. This decrease in license revenues was based, in part, on additional levels of approvals inside our customers’ organizations that resulted in longer sales cycles brought on as a result of macro economic conditions. While we are focused on increasing license revenues, we are unable to predict such revenues from period to period with any degree of accuracy because, among other things, the market for our products is unpredictable and intensely competitive, and our sales cycle is long and unpredictable.
Services revenues consist of support revenues and professional services revenues and fees. Support revenues relate to providing customer support, product maintenance and updates to our customers. Professional services revenues relate to providing consulting, training and implementation services to our customers including managed services. Services revenues increased by 22% to $42.7 million for the year ended December 31, 2007 compared to $34.9 million for 2006. Support revenues are the largest component of services revenues, and in 2007, support revenues increased because there was greater focus on support renewals by a team dedicated to renewals that was not employed by us in 2006. The other part of services revenues is professional services fees that increased in 2007 from 2006 primarily due to five large long-term consulting projects in 2007 and the additional services fees generated by eVergance.
Revenues from international sales were $15.3 million, or 25% of total revenues, in the year ended December 31, 2007 and $17.1 million, or 32% of total revenues, in the year ended December 31, 2006. Our international revenues were derived from sales in Europe and Asia Pacific.
Costs and Expenses
Total cost of revenues increased by 35% to $17.5 million for the year ended December 31, 2007 from $13.0 million for the year ended December 31, 2006.
License Fees. Cost of license fees consists primarily of third party software royalties and costs of product documentation. Cost of license fees as a percentage of license revenue was 7% in 2007 compared to 13% in 2006. The decrease was primarily due to lower third party royalty costs. We expect that our cost of license fees as a percentage of sales will vary based on changes in the mix of products we sell and the timing of upgrades. We are not able to predict when customers will choose to upgrade their software which will then cause us to incur royalty costs. We are continuing to look at cost-effective alternatives for some original equipment manufacturer (“OEM”) products embedded in our products.
Services. Cost of services consists primarily of salaries and related expenses for our customer support, consulting, and training services organization, and allocation of facility costs and system costs incurred in providing customer support and managed services. Cost of services increased to 37% of services revenues, or $16.0 million, for 2007 compared to 30% of services revenues, or $10.4 million, for 2006. Both totals include stock-based compensation of $336,000 and $211,000 for 2007 and 2006, respectively. The decrease in service margins in 2007 compared to 2006 was due to an increase in consulting costs as we built up the service organization to support increased revenues. As of December 31, 2007, we had 68 employees in support and consulting, 25 of which were a result of the acquisition of eVergance, compared to 48 employees as of December 31, 2006, a 42% increase.
Cost of services may increase or decrease, depending on the demand for these services. The expenses may also be affected by the amount, type and valuation of stock options granted as well as the amount of stock options cancelled due to employees and consultants leaving the Company.
Amortization of Acquired Intangible Assets.The amortization of acquired intangible assets recorded in 2007 was related to $2.5 million of intangible assets recorded in connection with the acquisition of eVergance in June
2007. The amortization of acquired intangible assets recorded in 2006 was related to $400,000 of intangible assets recorded in connection with the acquisition of Hipbone, Inc. in February 2004. Amortization totaled $288,000 and $133,000 for the years ended December 31, 2007 and 2006, respectively.
Sales and Marketing. Sales and marketing expenses consist primarily of compensation and related costs for sales and marketing personnel and promotional expenditures, including public relations, advertising, trade shows and marketing materials. Sales and marketing expenses increased by 29% to $25.3 million for the year ended December 31, 2007 from $19.6 million for the year ended December 31, 2006. Both totals include stock-based compensation of $869,000 and $871,000 for 2007 and 2006, respectively. The increase in expenses was primarily attributable to an increase in average sales personnel of 24% from an average in 2006 of 37 employees to an average of 46 employees during 2007 and an increase in marketing programs.
Sales and marketing expenses may increase or decrease, depending primarily on the amount of future revenues and our assessment of market opportunities and sales channels. The expenses may also be impacted by the amount, type and valuation of stock options granted as well as the amount of stock options cancelled due to employees and consultants leaving the Company.
Research and Development. Research and development expenses consist primarily of compensation and related costs for research and development employees and contractors and enhancement of existing products and quality assurance activities. Research and development expenses increased by 18% to $12.7 million for the year ended December 31, 2007 from $10.8 million for the year ended December 31, 2006. Both totals include stock-based compensation of $359,000 and $400,000 for 2007 and 2006, respectively. The increase in expenses was primarily attributable to increased employee headcount partially offset by a reduced number of contractors. As of December 31, 2007, we had 53 employees in research and development compared to 37 employees as of December 31, 2006, a 43% increase.
Research and development expenses including related headcount may increase or decrease, depending primarily on the amount of future revenues, customer needs, and our assessment of market demand. The expenses may also be impacted by the amount, type and valuation of stock options granted as well as the amount of stock options cancelled due to employees and consultants leaving the Company.
General and Administrative. General and administrative expenses consist primarily of compensation and related costs for finance, legal, human resources, corporate governance, and bad debt expense. Information technology and facilities costs are allocated among all operating departments. General and administrative expenses increased by 17% to $11.9 million for the year ended December 31, 2007 from $10.2 million for the year ended December 31, 2006. Both totals include stock-based compensation of $1.3 million and $1.9 million for years ended December 31, 2007 and 2006, respectively. The increase in expenses was primarily due to an increase in average personnel of 17% from an average in 2006 of 30 employees to an average of 35 employees during 2007. Additionally, we incurred approximately $362,000 of expense related to outside Sarbanes-Oxley consultants. As of December 31, 2007, we had 41 employees in general and administrative and information technology compared to 31 employees as of December 31, 2006, a 32% increase.
General and administrative expenses may increase or decrease, depending primarily on the amount of future revenues and corporate infrastructure requirements including insurance, professional services, taxes, bad debt expense, and other administrative costs. The expenses may also be impacted by the amount, type and valuation of stock options granted as well as the amount of stock options cancelled due to employees and consultants leaving the Company.
Restructuring Costs. In December 2006, we determined that we may not be able to sublease a leased facility in Princeton, New Jersey, and changed our assumption of subleasing this excess space. During the year ended December 31, 2006, we recorded $739,000 of restructuring costs mainly related to this change in estimate of sublease payment that was not subject to any contractual arrangement. In 2006, there was also a restructuring recovery of $36,000 due to the change in estimates of termination of certain employees.
In July 2007, we implemented various cost reduction and restructuring activities to reduce operating costs. The expense related to our reduction in work force was approximately $240,000 and expense related to ceasing use of one of our offices was approximately $8,000.
In September 2007, we agreed with the landlord of one of the facilities included in our restructuring accrual to surrender the remaining term of the lease in exchange for a lump sum cash payment. As a result of this agreement, we recorded additional restructuring expense of approximately $319,000. The lump sum cash payment was primarily made by surrender of the existing lease deposit of $2.1 million.
The following table summarizes our restructuring activities for the years ended December 31, 2007 and 2006 (in thousands):
| Facilities | Severance and Related | Total | ||||||||||
Restructuring accrual at December 31, 2005 | $ | 7,270 | $ | 282 | $ | 7,552 | ||||||
Restructuring charge (recoveries) | 739 | (36 | ) | 703 | ||||||||
Payments made | (3,557 | ) | (246 | ) | (3,803 | ) | ||||||
Sublease payments received | 1,650 | — | 1,650 | |||||||||
Restructuring accrual at December 31, 2006 | 6,102 | — | 6,102 | |||||||||
Restructuring charge (recoveries) | 327 | 240 | 567 | |||||||||
Payments made | (5,645 | ) | (240 | ) | (5,885 | ) | ||||||
Sublease payments received | 1,968 | — | 1,968 | |||||||||
Restructuring accrual at December 31, 2007 | $ | 2,752 | $ | — | $ | 2,752 | ||||||
The remainder of the restructuring payments will be paid relatively evenly from 2009 through 2011.
Interest and Other Income (Expense), Net
Interest and other income (expense), net consists primarily of interest income and interest expense and changes in fair value of warrant liabilities. Interest income consists primarily of interest earned on cash and cash equivalents and was approximately $87,000 and $172,000 for the years ended December 31, 2007 and 2006, respectively. The decrease in interest income related to lower cash and cash equivalents balances in 2007 compared to 2006. Interest expense relates primarily to our line of credit and was approximately $858,000 and $207,000 for the years ended December 31, 2007 and 2006, respectively. The increase in interest expense related to increased borrowings against the line of credit in 2007 compared to 2006. Interest and other income (expense), net also consists of $383,000 of bank fees for the year ended December 31, 2007 and an increase in the fair value of warrant liabilities of approximately $774,000 for the year ended December 31, 2006.
Registration Rights Penalty
In June 2005, we completed a private placement of unregistered securities for the issuance of 1,631,541 shares of common stock and warrants to purchase 815,769 shares of common stock to NightWatch Capital Partners, LP, NightWatch Capital Partners II, LP and RHP Master Fund Ltd. (collectively, the “Investors”) for gross proceeds of approximately $2.4 million.
In September 2005, we completed a private placement of unregistered securities for the issuance of 2,626,912 shares of common stock and warrants to purchase 945,687 shares of common stock to the Investors for gross proceeds of approximately $4.0 million.
In May 2006, we amended the registration agreement related to the June and September 2005 private placements (collectively referred to as “Private Placements”) to extend the registration deadline of the shares of
common stock and underlying shares of common stock of the warrants issued to the Investors to September 30, 2006 from January 27, 2006, in exchange for the issuance of 593,854 shares of common stock to the Investors. $337,000 and $695,000 were recorded as non-operating expenses during the first and second quarter of 2006, respectively. The September 30, 2006 registration deadline was not met and an additional 59,383 shares of common stock was issued to the Investors. The shares were valued at approximately $166,000 based on the fair market value of our common stock on September 30, 2006 less a 10% discount to reflect that unregistered stock was issued. This amount was recorded as a non-operating expense during the third quarter of 2006. On November 9, 2006, we completed the registration of the shares of common stock and shares of common stock underlying the warrants issued to the Investors.
Income Tax Expense
We have incurred net operating losses on a consolidated basis for all years from inception through December 31, 2007. Accordingly, we have recorded a valuation allowance for the full amount of our gross deferred tax assets, as the future realization of the tax benefit is not currently more likely than not. In 2007 and 2006, certain of our foreign subsidiaries were profitable, based upon application of our intercompany transfer pricing agreements, which resulted in us reporting income tax expense in those foreign jurisdictions totaling approximately $167,000 and $219,000 for the years ended December 31, 2007 and 2006, respectively.
Quarterly Results of Operations (in thousands, except per share data)
The following tables set forth a summary of our unaudited quarterly operating results for each of the eight quarters in the period ended December 31, 2008. The information has been derived from our unaudited condensed consolidated financial statements that, in management’s opinion, have been prepared on a basis consistent with the audited consolidated financial statements contained elsewhere in this Annual Report and include all adjustments, consisting only of normal recurring adjustments, necessary for a fair presentation of this information when read in conjunction with our audited consolidated financial statements and notes thereto. The operating results for any quarter are not necessarily indicative of results to be expected for any future period.
| Quarter Ended | ||||||||||||||||||||||||||||||||
| Dec. 31, 2008 | Sept. 30, 2008 | June 30, 2008 | Mar. 31, 2008 | Dec. 31, 2007 | Sept. 30, 2007 | June 30, 2007 | Mar. 31, 2007 | |||||||||||||||||||||||||
Revenues: | ||||||||||||||||||||||||||||||||
License fees | $ | 2,740 | $ | 5,310 | $ | 3,972 | $ | 5,723 | $ | 5,151 | $ | 5,793 | $ | 3,511 | $ | 3,616 | ||||||||||||||||
Services | 10,887 | 11,344 | 12,681 | 12,562 | 12,375 | 11,048 | 9,882 | 9,418 | ||||||||||||||||||||||||
Total revenues | 13,627 | 16,654 | 16,653 | 18,285 | 17,526 | 16,841 | 13,393 | 13,034 | ||||||||||||||||||||||||
Costs and expenses: | ||||||||||||||||||||||||||||||||
Cost of license fees | 222 | 232 | 146 | 412 | 297 | 415 | 240 | 287 | ||||||||||||||||||||||||
Cost of services (1) | 4,241 | 4,676 | 5,340 | 5,418 | 5,015 | 4,253 | 3,668 | 3,068 | ||||||||||||||||||||||||
Amortization of acquired intangible assets | 125 | 125 | 125 | 125 | 124 | 125 | 24 | 15 | ||||||||||||||||||||||||
Sales and marketing (1) | 5,733 | 5,294 | 5,028 | 6,244 | 5,965 | 6,443 | 6,660 | 6,193 | ||||||||||||||||||||||||
Research and development (1) | 3,650 | 3,408 | 3,426 | 3,334 | 2,782 | 3,133 | 3,083 | 3,652 | ||||||||||||||||||||||||
General and administrative (1) | 2,139 | 2,608 | 2,641 | 3,184 | 2,643 | 2,634 | 3,120 | 3,503 | ||||||||||||||||||||||||
Restructuring costs (recoveries) | — | 1,064 | — | (482 | ) | — | 567 | — | — | |||||||||||||||||||||||
Total costs and expenses | 16,110 | 17,407 | 16,706 | 18,235 | 16,826 | 17,570 | 16,795 | 16,718 | ||||||||||||||||||||||||
Income (loss) from operations | (2,483 | ) | (753 | ) | (53 | ) | 50 | 700 | (729 | ) | (3,402 | ) | (3,684 | ) | ||||||||||||||||||
Interest and other income (expense), net | (153 | ) | (91 | ) | (64 | ) | (103 | ) | (127 | ) | (506 | ) | (87 | ) | (19 | ) | ||||||||||||||||
Income (loss) before income tax expense | (2,636 | ) | (844 | ) | (117 | ) | (53 | ) | 573 | (1,235 | ) | (3,489 | ) | (3,703 | ) | |||||||||||||||||
Income tax expense (benefit) | 84 | (43 | ) | (20 | ) | (26 | ) | (34 | ) | (32 | ) | (54 | ) | (47 | ) | |||||||||||||||||
Net income (loss) | $ | (2,552 | ) | $ | (887 | ) | $ | (137 | ) | $ | (79 | ) | $ | 539 | $ | (1,267 | ) | $ | (3,543 | ) | $ | (3,750 | ) | |||||||||
Basic net income (loss) per share | $ | (0.06 | ) | $ | (0.02 | ) | $ | (0.00 | ) | $ | (0.00 | ) | $ | 0.01 | $ | (0.03 | ) | $ | (0.10 | ) | $ | (0.10 | ) | |||||||||
Shares used in computing basic net income (loss) per share | 41,213 | 41,212 | 41,212 | 41,211 | 38,876 | 37,061 | 36,382 | 36,019 | ||||||||||||||||||||||||
Diluted net income (loss) per share | $ | (0.06 | ) | $ | (0.02 | ) | $ | (0.00 | ) | $ | (0.00 | ) | $ | 0.01 | $ | (0.03 | ) | $ | (0.10 | ) | $ | (0.10 | ) | |||||||||
Shares used in computing diluted net income (loss) per share | 41,213 | 41,212 | 41,212 | 41,211 | 39,967 | 37,061 | 36,382 | 36,019 | ||||||||||||||||||||||||
As a Percentage of Total Revenues: | ||||||||||||||||||||||||||||||||
Revenues: | ||||||||||||||||||||||||||||||||
License fees | 20 | % | 32 | % | 24 | % | 31 | % | 29 | % | 34 | % | 26 | % | 28 | % | ||||||||||||||||
Services | 80 | 68 | 76 | 69 | 71 | 66 | 74 | 72 | ||||||||||||||||||||||||
Total revenues | 100 | 100 | 100 | 100 | 100 | 100 | 100 | 100 | ||||||||||||||||||||||||
Costs and expenses: | ||||||||||||||||||||||||||||||||
Cost of license fees | 2 | 1 | 1 | 2 | 2 | 2 | 2 | 2 | ||||||||||||||||||||||||
Cost of services | 31 | 28 | 32 | 30 | 29 | 25 | 27 | 24 | ||||||||||||||||||||||||
Amortization of acquired intangible assets | 1 | 1 | 1 | 1 | 1 | 1 | * | * | ||||||||||||||||||||||||
Sales and marketing | 42 | 32 | 30 | 34 | 34 | 38 | 50 | 48 | ||||||||||||||||||||||||
Research and development | 27 | 20 | 21 | 18 | 16 | 19 | 23 | 28 | ||||||||||||||||||||||||
General and administrative | 16 | 16 | 16 | 17 | 15 | 16 | 23 | 27 | ||||||||||||||||||||||||
Restructuring costs (recoveries) | — | 6 | — | (3 | ) | — | 3 | — | — | |||||||||||||||||||||||
Total costs and expenses | 118 | 104 | 100 | 100 | 96 | 104 | 125 | 128 | ||||||||||||||||||||||||
| * | Less than 1% |
| (1) | Stock-based compensation expense, which was allocated as follows: |
| Quarter Ended | ||||||||||||||||||||||||
| Dec. 31, 2008 | Sept. 30, 2008 | June 30, 2008 | Mar. 31, 2008 | Dec. 31, 2007 | Sept. 30, 2007 | June 30, 2007 | Mar. 31, 2007 | |||||||||||||||||
Cost of services | $ | 69 | $ | 71 | $ | 82 | $ | 103 | $ | 110 | $ | 102 | $ | 56 | $ | 68 | ||||||||
Sales and marketing | 152 | 160 | 176 | 164 | 211 | 194 | 225 | 239 | ||||||||||||||||
Research and development | 71 | 87 | 96 | 77 | 98 | 120 | 72 | 69 | ||||||||||||||||
General and administrative | 237 | 243 | 207 | 217 | 210 | 315 | 290 | 494 | ||||||||||||||||
| $ | 529 | $ | 561 | $ | 561 | $ | 561 | $ | 629 | $ | 731 | $ | 643 | $ | 870 | |||||||||
The amount and timing of our operating expenses generally will vary from quarter to quarter depending on our level of actual and anticipated business activities. Our revenues and operating results are difficult to forecast and will fluctuate, and we believe that period-to-period comparisons of our operating results will not necessarily be meaningful. As a result, you should not rely upon them as an indication of future performance.
LIQUIDITY AND CAPITAL RESOURCES
As of December 31, 2008, we had $7.0 million in cash and cash equivalents, compared to $4.3 million as of December 31, 2007. As of December 31, 2008, we had negative working capital of $13.8 million. $12.9 million of our current liabilities consists of current deferred revenue, primarily reflecting obligations to provide support services under our software licenses.
History and recent trends. We have had negative cash flow from operating activities in each year since inception. To date, we have funded our operations primarily through issuances of common stock and, to a lesser extent, cash acquired in acquisitions. Cash used in operations was $418,000 in 2008, $8.4 million in 2007, and $1.7 million in 2006. The amount of cash used in our operations is significantly affected by our headcount and our sales. During 2008 and 2007, we had a net increase of 4 employees and 44 employees, respectively. Staffing is expected to change from time to time based upon a number of factors, including anticipated demand for our products and the balancing of roles between employees and outsourced staffing. During the years ended December 31, 2008 and 2007, we had a negative cash flow from operations of $418,000 and $8.4 million, respectively, which reflects, among other things, the effect of our net loss during each period. Our cash collections during any quarter are driven primarily by the amount of sales booked in the previous quarter, and we cannot be certain that we will meet our revenue expectations in any given period.
Primary driver of cash flow. Our ability to generate cash in the future depends upon our success in generating sufficient sales transactions, especially new license transactions. We expect our support renewals in 2009 to continue to be relatively flat from 2008. Since our new license transactions are relatively small in number and are difficult to predict, we may not be able to generate new license transactions as anticipated in any particular future period. From time to time, changes in assets and liabilities, such as changes in levels of accounts receivable and accounts payable may also affect our cash flows.
Operating cash flow. We had negative cash flow from operating activities of $418,000 for the year ended December 31, 2008, which included a $3.7 million net loss, a $2.9 million decrease in deferred revenue and a $1.6 million decrease in accrued restructuring, partially offset by non-cash charges of $2.2 million for stock compensation expense, $1.3 million of depreciation, $1.7 million decrease in accounts receivable and a provision for doubtful accounts of $0.8 million. Our operating activities used $8.4 million and $1.7 million of cash and cash equivalents for the years ended December 31, 2007 and 2006, respectively. These expenditures were primarily attributable to net losses experienced during these periods and reductions in accrued restructuring, offset in part by non-cash charges related to stock based compensation.
Investing cash flow. Our investing activities used $1.1 million of cash for the year ended December 31, 2008, primarily for the purchase of property and equipment. Our investing activities used $2.8 million of cash for the year ended December 31, 2007, which consisted of the purchase of property and equipment and the acquisition of eVergance. Our investing activities used $860,000 of cash during 2006, for the purchase of property and equipment.
Financing cash flow. Our financing activities provided $4.6 million of cash for the year ended December 31, 2008, and consisted primarily of $6.9 million of net borrowings under our line of credit and borrowings of $160,000 on notes payable offset in part by the repayments of $2.4 million on notes payable. Our financing activities provided $9.9 million of cash for the year ended December 31, 2007, and consisted primarily of $10.4 million in proceeds from issuances of common stock, $639,000 of net borrowings under our line of credit and borrowings of $361,000 on notes payable offset in part by the repayments of $1.5 million on notes payable. Of the $10.4 million in proceeds from issuances of common stock, approximately $8.9 million was derived from a registered direct offering of 4.0 million shares of our common stock completed in November 2007, after deducting the placement agent’s fees and offering expenses associated with the offering. Our financing activities provided $2.0 million of cash for the year ended December 31, 2006, and consisted primarily of $2.9 million in proceeds from issuances of common stock, a decrease in restricted cash of $5.9 million and borrowings of $819,000 on notes payable offset in part by the repayment of borrowings under our bank line of credit of $7.4 million and the repayments of $250,000 on notes payable.
Contractual obligations. On November 30, 2005, we established a banking relationship with Bridge Bank N.A. (“Bridge”) entering into a Business Financing Agreement and Intellectual Property Security Agreement with Bridge under which we had access to a loan facility of $7.0 million. We have since amended our agreement with Bridge, most recently on March 28, 2008, when we entered into a Second Amended and Restated Loan and Security Agreement with Bridge increasing the loan facility to $10.0 million (“March Loan Facility”). The March Loan Facility is a formula based revolving line of credit that is limited to 80% of eligible receivables subject to a sublimit of $2.5 million that is available for stand-by letters of credit, foreign exchange contracts or cash management products. Existing equipment advances under our line of credit were converted into a term loan as of March 26, 2008 in the amount of $1.6 million which is payable in 33 monthly installments of principal plus interest. An additional $500,000 borrowed under the additional equipment financing provision was converted into a 36 month term loan on September 30, 2008. The total combined borrowing under the March Loan Facility and sublimits cannot exceed $10.0 million. The March Loan Facility is secured by all of our assets and expires February 27, 2010 at which time the entire balance under the formula-based line of credit will be due. Interest for the formula-based revolving line of credit, the existing equipment advances and the additional equipment financing accrues at the Wall Street Journal’s (“WSJ”) Prime Lending Rate plus 1.25%. The March Loan Facility contains certain restrictive covenants including but not limited to certain financial covenants such as maintaining profitability net of stock-based compensation and maintenance of certain key ratios. If we are not in compliance with the covenants of the March Loan Facility, Bridge has the right to declare an event of default and all of the outstanding balances owed under the March Loan Facility would become immediately due and payable. On March 17, 2009, we entered into a Loan and Security Modification Agreement to the March Loan Facility that provided a one-time waiver of certain financial covenants for the quarter ended December 31, 2008. On May 13, 2009, we obtained a non-binding financing proposal from Bridge for a modification of the March Loan Facility that would provide a one-time waiver of certain financial covenants for the quarter ended March 31, 2009 and the month ended April 30, 2009. The proposal sets the total loan facility amount to $6.0 million and extends the maturity date to June 30, 2010. As a requirement of the May 13, 2009 proposal from Bridge, availability under the existing revolving line of credit will be used to prepay all amounts currently outstanding under the existing term loans for equipment. Additionally, modifications would be made to the existing restrictive covenants and certain covenants would be added related to raising additional capital. This proposal is not binding, and is subject to further negotiation, to approval by the lenders’ loan committee, and execution of definitive loan documents. Accordingly, we can give no assurances as to whether we will enter into any such loan documents, or as to their terms.
As of December 31, 2008, we had $1.1 million outstanding under the March Loan Facility equipment loan. This amount is repayable in 25 monthly installments of principal and interest. We had $459,000 outstanding under the additional equipment financing facility. This amount is repayable in 33 monthly installments of principal and interest. These loans are included with other non-bank debt in the consolidated balance sheet under the heading of notes payable. These loans are included in current liabilities based on the terms of the May 13, 2009 proposal. We also have drawn $6.0 million against the formula based revolving line of credit. The available balance of the March Loan Facility was also lowered by $116,000 to secure a letter of credit related to a building lease, leaving an available balance of $2.3 million as of December 31, 2008. Subsequent to December 31, 2008 we repaid $572,000 on January 12, 2009 and $2.7 million on March 2, 2009.
Our future payments due under debt and lease obligations and other contractual commitments as of December 31, 2008 are as follows (in thousands):
| Payments Due By Period | ||||||||||||||||||
| Total | Less than 1 year | 1 - 3 years | 3 - 5 years | More than 5 years | ||||||||||||||
Contractual obligations: | ||||||||||||||||||
Line of credit | $ | 6,000 | $ | 6,000 | $ | — | $ | — | $ | — | ||||||||
Notes payable | 1,834 | 1,821 | 13 | — | — | |||||||||||||
Non-cancelable operating lease obligations (1) | 3,722 | 2,619 | 1,103 | — | — | |||||||||||||
Less: Sublease income (2) | (954 | ) | (448 | ) | (506 | ) | — | — | ||||||||||
Other contractual obligations (3) | 6,726 | 1,023 | 3,173 | 2,530 | — | |||||||||||||
Total | $ | 17,328 | $ | 11,015 | $ | 3,783 | $ | 2,530 | $ | — | ||||||||
| (1) | Includes leases for properties included in the restructuring liability. |
| (2) | Includes only subleases that are under contracts as of December 31, 2008, and excludes future estimated sublease income for agreements not yet signed. |
| (3) | Represents payments on a legal settlement, minimum payments to vendors for future royalty fees and consulting services. |
Off-Balance-Sheet Arrangements.As of December 31, 2008, we did not have any significant off-balance-sheet arrangements, as defined in Item 303(a)(4)(ii) of SEC Regulation S-K.
Employee Equity Incentive Plans.See Note 1 and Note 7 of the Notes to the Consolidated Financial Statements in Item 8 of this Annual Report on Form 10-K for information regarding employee equity incentive plans and stock-based compensation for the years ended December 31, 2008, 2007, and 2006. Information regarding equity incentive plans should be read in conjunction with the information appearing under the heading “Executive Compensation and Related Information” and “Equity Compensation Plan Information” appearing in the definitive Proxy Statement to be delivered to stockholders in connection with the 2009 Annual Meeting of Stockholders which is incorporated herein by reference.
Outlook. We believe that based on our current plans, we will require additional financing to fund our operations through December 31, 2009. In addition, if we do not experience anticipated demand for our products, we will need to further reduce costs, or raise further financing to meet our cash requirements. We can give no assurances as to whether we will be able to implement cost reduction initiatives, increase revenues, or obtain debt or equity financing, in order to provide sufficient liquidity for us to continue as a going concern.
If adequate funds were not available on acceptable terms, our ability to achieve or sustain positive cash flows, maintain current operations, fund any potential expansion, take advantage of unanticipated opportunities, develop or enhance products or services, or otherwise respond to competitive pressures would be significantly limited. Our expectations as to our future cash flows and our future cash balances are subject to a number of assumptions, including anticipated increases in our revenues, improvements in general economic conditions and customer purchasing and payment patterns, many of which are beyond our control.
| ITEM 7A. | QUANTITATIVE AND QUALITATIVE DISCLOSURES ABOUT MARKET RISK. |
We develop products in the United States and sell these products in North America, Europe, and Asia. In the years ended December 31, 2008, 2007 and 2006, revenues from customers outside of the United States approximated 25%, 25% and 32%, respectively, of total revenues. Generally, our sales are made in the local currency of our customers. As a result, our financial results and cash flows could be affected by factors such as changes in foreign currency exchange rates or weak economic conditions in foreign markets. We rarely use derivative instruments to hedge against foreign exchange risk. As such, we are exposed to market risk from fluctuations in foreign currency exchange rates, principally from the exchange rate between the U.S. dollar and the Japanese yen, European Union euro and British pound. We manage exposure to variability in foreign currency exchange rates primarily due to the fact that liabilities and assets, as well as revenues and expenses, are denominated in the local currency. However, different durations in our funding obligations and assets may expose us to the risk of foreign exchange rate fluctuations. We have not entered into any derivative instrument transactions to manage this risk. The volatility of foreign currencies in certain regions, most notably the Japanese yen, European Union euro and British pound have had, and may in the future have, a harmful effect on our revenue or operating results. To the extent the international component of our revenues grows, our results of operations will become more sensitive to foreign exchange rate fluctuations. Based on our overall foreign currency rate exposure at December 31, 2008, we do not believe that a hypothetical 10% change in foreign currency rates would materially adversely affect our financial position or results of operations. Based on our overall debt position at December 31, 2008, we do not believe that changes in interest rates would materially adversely affect our financial position or results of operations. We do not consider our cash equivalents to be subject to interest rate risk due to their short maturities.
| ITEM 8. | FINANCIAL STATEMENTS AND SUPPLEMENTARY DATA |
A summary of our unaudited quarterly operating results for each of the eight quarters in the period ended December 31, 2008 is provided in Item 7 above under the heading “Quarterly Results of Operations.”
KANA SOFTWARE, INC.
INDEX TO CONSOLIDATED FINANCIAL STATEMENTS
Contents
| Page | ||
| 49 | ||
Financial Statements | ||
| 50 | ||
| 51 | ||
| 52 | ||
| 54 | ||
| 55 |
REPORT OF INDEPENDENT REGISTERED PUBLIC ACCOUNTING FIRM
To the Board of Directors and Stockholders of
Kana Software, Inc.:
We have audited the accompanying consolidated balance sheets of Kana Software, Inc. and its subsidiaries (the “Company”) as of December 31, 2008 and 2007, and the related consolidated statements of operations, stockholders’ equity (deficit), and cash flows for each of the three years in the period ended December 31, 2008. Our audits also included the financial statement schedule listed in Item 15(a)(2). These consolidated financial statements and financial statement schedule are the responsibility of the Company’s management. Our responsibility is to express an opinion on these consolidated financial statements and financial statement schedule based on our audits.
We conducted our audits in accordance with the standards of the Public Company Accounting Oversight Board (United States). Those standards require that we plan and perform the audit to obtain reasonable assurance about whether the financial statements are free of material misstatement. The Company is not required to have, nor have we been engaged to perform, an audit of the Companay’s internal control over financial reporting. Our audits included consideration of internal control over financial reporting as a basis for designing audit procedures that are appropriate in the circumstances, but not for the purpose of expressing an opinion on the effectiveness of the Company’s internal control over financial reporting. Accordingly, we express no such opinion. An audit also includes examining, on a test basis, evidence supporting the amounts and disclosures in the financial statements, assessing the accounting principles used and significant estimates made by management, as well as evaluating the overall financial statement presentation. We believe that our audits provide a reasonable basis for our opinion.
In our opinion, the consolidated financial statements referred to above present fairly, in all material respects, the financial position of Kana Software, Inc. and its subsidiaries as of December 31, 2008 and 2007, and the results of their operations and their cash flows for each of the three years in the period ended December 31, 2008, in conformity with accounting principles generally accepted in the United States of America. Also, in our opinion, the related financial statement schedule, when considered in relation to the consolidated financial statements taken as a whole, presents fairly, in all material respects, the information set forth therein.
The accompanying consolidated financial statements have been prepared assuming that the Company will continue as a going concern. As discussed in Note 1 to the consolidated financial statements, the Company’s recurring losses from operations, negative working capital, negative cash flow from operations and accumulated deficit raise substantial doubt about its ability to continue as a going concern. Management’s plans as to these matters are also discussed in Note 1. The consolidated financial statements do not include any adjustments that might arise from the outcome of this uncertainty.
/s/ Burr, Pilger & Mayer LLP
San Jose, California
May 15, 2009
CONSOLIDATED BALANCE SHEETS
(In thousands, except share data)
| December 31, | ||||||||
| 2008 | 2007 | |||||||
ASSETS | ||||||||
Current assets: | ||||||||
Cash and cash equivalents | $ | 6,988 | $ | 4,306 | ||||
Accounts receivable, net of allowance of $217 and $204 at December 31, 2008 and 2007, respectively | 7,556 | 10,247 | ||||||
Prepaid expenses and other current assets | 2,030 | 2,391 | ||||||
Total current assets | 16,574 | 16,944 | ||||||
Restricted cash, long-term | 751 | 771 | ||||||
Property and equipment, net | 1,923 | 2,292 | ||||||
Goodwill | 12,415 | 12,500 | ||||||
Acquired intangible assets, net | 1,726 | 2,226 | ||||||
Other assets | 428 | 667 | ||||||
Total assets | $ | 33,817 | $ | 35,400 | ||||
LIABILITIES AND STOCKHOLDERS’ EQUITY | ||||||||
Current liabilities: | ||||||||
Line of credit | $ | 6,000 | $ | 1,177 | ||||
Notes payable | 1,821 | 1,873 | ||||||
Accounts payable | 3,618 | 2,943 | ||||||
Accrued liabilities | 5,084 | 5,486 | ||||||
Accrued restructuring | 946 | 1,261 | ||||||
Deferred revenue | 12,946 | 15,825 | ||||||
Total current liabilities | 30,415 | 28,565 | ||||||
Deferred revenue, long-term | 86 | 297 | ||||||
Accrued restructuring, long-term | 234 | 1,491 | ||||||
Notes payable, long-term | 13 | 110 | ||||||
Other long-term liabilities | 479 | 531 | ||||||
Total liabilities | 31,227 | 30,994 | ||||||
Commitments and contingencies (Note 6) | ||||||||
Stockholders’ equity: | ||||||||
Preferred stock, $0.001 par value; 5,000,000 shares authorized; no shares issued and outstanding | — | — | ||||||
Common stock, $0.001 par value; 250,000,000 shares authorized; 41,212,791 and 40,910,481 shares issued and outstanding at December 31, 2008 and 2007, respectively | 41 | 41 | ||||||
Common stock subscription | — | 949 | ||||||
Additional paid-in capital | 4,320,743 | 4,317,582 | ||||||
Accumulated other comprehensive loss | (684 | ) | (311 | ) | ||||
Accumulated deficit | (4,317,510 | ) | (4,313,855 | ) | ||||
Total stockholders’ equity | 2,590 | 4,406 | ||||||
Total liabilities and stockholders’ equity | $ | 33,817 | $ | 35,400 | ||||
See accompanying notes to the consolidated financial statements.
CONSOLIDATED STATEMENTS OF OPERATIONS
(In thousands, except per share data)
| Year Ended December 31, | ||||||||||||
| 2008 | 2007 | 2006 | ||||||||||
Revenues: | ||||||||||||
License fees | $ | 17,745 | $ | 18,071 | $ | 19,116 | ||||||
Services | 47,474 | 42,723 | 34,914 | |||||||||
Total revenues | 65,219 | 60,794 | 54,030 | |||||||||
Costs and expenses: | ||||||||||||
Cost of license fees | 1,012 | 1,239 | 2,460 | |||||||||
Cost of services (1) | 19,675 | 16,004 | 10,439 | |||||||||
Amortization of acquired intangible assets | 500 | 288 | 133 | |||||||||
Sales and marketing (1) | 22,299 | 25,261 | 19,616 | |||||||||
Research and development (1) | 13,818 | 12,650 | 10,765 | |||||||||
General and administrative (1) | 10,572 | 11,900 | 10,185 | |||||||||
Restructuring costs, net of recoveries | 582 | 567 | 703 | |||||||||
Total costs and expenses | 68,458 | 67,909 | 54,301 | |||||||||
Loss from operations | (3,239 | ) | (7,115 | ) | (271 | ) | ||||||
Interest and other income (expense), net | (411 | ) | (739 | ) | (738 | ) | ||||||
Registration rights penalty | — | — | (1,198 | ) | ||||||||
Loss before income tax expense | (3,650 | ) | (7,854 | ) | (2,207 | ) | ||||||
Income tax expense | (5 | ) | (167 | ) | (219 | ) | ||||||
Net loss | $ | (3,655 | ) | $ | (8,021 | ) | $ | (2,426 | ) | |||
Basic and diluted net loss per share | $ | (0.09 | ) | $ | (0.22 | ) | $ | (0.07 | ) | |||
Shares used in computing basic and diluted net loss per share | 41,212 | 37,085 | 34,584 | |||||||||
| ||||||||||||
(1) Stock-based compensation included in the expense line items: | ||||||||||||
Cost of services | $ | 325 | $ | 336 | $ | 211 | ||||||
Sales and marketing | 652 | 869 | 871 | |||||||||
Research and development | 331 | 359 | 400 | |||||||||
General and administrative | 904 | 1,309 | 1,945 | |||||||||
See accompanying notes to the consolidated financial statements.
CONSOLIDATED STATEMENTS OF STOCKHOLDERS’ EQUITY (DEFICIT)
(In thousands, except share data)
| Common Stock | Common Stock Subscription | Additional Paid-In Capital | Accumulated Other Comprehensive Income (Loss) | Accumulated Deficit | Total Stockholders’ Equity (Deficit) | ||||||||||||||||||||
| Shares | Amount | Shares | Amount | ||||||||||||||||||||||
Balances at | 33,923,783 | $ | 34 | — | $ | — | $ | 4,293,063 | $ | 517 | $ | (4,303,408 | ) | $ | (9,794 | ) | |||||||||
Issuance of common stock upon exercise of stock options | 1,395,263 | 1 | — | — | 2,944 | — | — | 2,945 | |||||||||||||||||
Registration rights penalty | 653,237 | 1 | — | — | 1,197 | — | — | 1,198 | |||||||||||||||||
Reclassification of warrant liability | — | — | — | — | 1,864 | — | — | 1,864 | |||||||||||||||||
Employee stock-based compensation | — | — | — | — | 2,795 | — | — | 2,795 | |||||||||||||||||
Non-employee stock based compensation | — | — | — | — | 632 | — | — | 632 | |||||||||||||||||
Comprehensive loss: | |||||||||||||||||||||||||
Foreign currency translation adjustment | — | — | — | — | — | (346 | ) | — | (346 | ) | |||||||||||||||
Net loss | — | — | — | — | — | — | (2,426 | ) | (2,426 | ) | |||||||||||||||
Total comprehensive loss | — | — | — | — | — | — | — | (2,772 | ) | ||||||||||||||||
Balances at | 35,972,283 | 36 | — | 4,302,495 | 171 | (4,305,834 | ) | (3,132 | ) | ||||||||||||||||
Issuance of common stock upon exercise of stock options | 638,198 | 1 | — | — | 1,476 | — | — | 1,477 | |||||||||||||||||
Issuance of common stock, net of fees of $261 | 4,000,000 | 4 | — | — | 8,911 | — | — | 8,915 | |||||||||||||||||
Common stock issued and issuable in acquisition of eVergance | 300,000 | 0 | 300,000 | 949 | 950 | — | — | 1,899 | |||||||||||||||||
Stock options issued and issuable in acquisition of eVergance | — | — | — | — | 877 | — | — | 877 | |||||||||||||||||
Employee stock-based compensation | — | — | — | — | 2,842 | — | — | 2,842 | |||||||||||||||||
Non-employee stock based compensation | — | — | — | — | 31 | — | — | 31 | |||||||||||||||||
Comprehensive loss: | |||||||||||||||||||||||||
Foreign currency translation adjustment | — | — | — | — | — | (482 | ) | — | (482 | ) | |||||||||||||||
Net loss | — | — | — | — | — | — | (8,021 | ) | (8,021 | ) | |||||||||||||||
Total comprehensive loss | — | — | — | — | — | — | — | (8,503 | ) | ||||||||||||||||
Balances at | 40,910,481 | 41 | 300,000 | 949 | 4,317,582 | (311 | ) | (4,313,855 | ) | 4,406 | |||||||||||||||
KANA SOFTWARE, INC.
CONSOLIDATED STATEMENTS OF STOCKHOLDERS’ EQUITY (DEFICIT)—(Continued)
(In thousands, except share data)
| Common Stock | Common Stock Subscription | Additional Paid-In Capital | Accumulated Other Comprehensive Income (Loss) | Accumulated Deficit | Total Stockholders’ Equity (Deficit) | ||||||||||||||||||||||
| Shares | Amount | Shares | Amount | ||||||||||||||||||||||||
Issuance of common stock upon exercise of stock options | 2,310 | — | — | — | — | — | — | — | |||||||||||||||||||
Common stock issued and issuable in acquisition of eVergance | 300,000 | — | (300,000 | ) | (949 | ) | 949 | — | — | — | |||||||||||||||||
Employee stock-based compensation | — | — | — | — | 2,208 | — | — | 2,208 | |||||||||||||||||||
Non-employee stock based compensation | — | — | — | — | 4 | — | — | 4 | |||||||||||||||||||
Comprehensive loss: | |||||||||||||||||||||||||||
Foreign currency translation adjustment | — | — | — | — | — | (373 | ) | — | (373 | ) | |||||||||||||||||
Net loss | — | — | — | — | — | — | (3,655 | ) | (3,655 | ) | |||||||||||||||||
Total comprehensive loss | — | — | — | — | — | — | — | (4,028 | ) | ||||||||||||||||||
Balances at | 41,212,791 | $ | 41 | — | $ | — | $ | 4,320,743 | $ | (684 | ) | $ | (4,317,510 | ) | $ | 2,590 | |||||||||||
See accompanying notes to the consolidated financial statements.
CONSOLIDATED STATEMENTS OF CASH FLOWS
(In thousands)
| For the Year Ended December 31, | ||||||||||||
| 2008 | 2007 | 2006 | ||||||||||
Cash flows from operating activities: | ||||||||||||
Net loss | $ | (3,655 | ) | $ | (8,021 | ) | $ | (2,426 | ) | |||
Adjustments to reconcile net loss to net cash used in operating activities: | ||||||||||||
Depreciation and amortization | 1,275 | 1,015 | 1,453 | |||||||||
Loss on disposal of property and equipment | — | 9 | 46 | |||||||||
Amortization of acquired intangible assets | 500 | 288 | 133 | |||||||||
Employee and non-employee stock-based compensation | 2,212 | 2,873 | 3,427 | |||||||||
Provision for doubtful accounts | 814 | 49 | 6 | |||||||||
Restructuring costs | 302 | 327 | 703 | |||||||||
Registration rights penalty | — | — | 1,198 | |||||||||
Other non-cash charges | 118 | 201 | 47 | |||||||||
Change in fair value of warrant liability | — | — | 774 | |||||||||
Changes in operating assets and liabilities, net of effects of acquisitions: | ||||||||||||
Accounts receivable | 1,701 | (479 | ) | (2,350 | ) | |||||||
Prepaid expenses and other assets | 600 | 1,940 | 1,134 | |||||||||
Accounts payable and accrued liabilities | 188 | (2,219 | ) | (4,036 | ) | |||||||
Accrued restructuring | (1,610 | ) | (3,741 | ) | (2,492 | ) | ||||||
Deferred revenue | (2,863 | ) | (675 | ) | 722 | |||||||
Net cash used in operating activities | (418 | ) | (8,433 | ) | (1,661 | ) | ||||||
Cash flows from investing activities: | ||||||||||||
Purchases of property and equipment | (1,169 | ) | (1,951 | ) | (860 | ) | ||||||
Acquisition, net of cash acquired | 85 | (918 | ) | — | ||||||||
Restricted cash | 20 | 74 | — | |||||||||
Net cash used in investing activities | (1,064 | ) | (2,795 | ) | (860 | ) | ||||||
Cash flows from financing activities: | ||||||||||||
Net borrowings (repayments) under line of credit | 6,885 | 639 | (7,400 | ) | ||||||||
Borrowings on notes payable | 160 | 361 | 819 | |||||||||
Repayments on notes payable | (2,425 | ) | (1,454 | ) | (250 | ) | ||||||
Restricted cash | — | — | 5,900 | |||||||||
Net proceeds from issuances of common stock and warrants | — | 10,392 | 2,945 | |||||||||
Net cash provided by financing activities | 4,620 | 9,938 | 2,014 | |||||||||
Effect of exchange rate changes on cash and cash equivalents | (456 | ) | (123 | ) | 10 | |||||||
Net increase (decrease) in cash and cash equivalents | 2,682 | (1,413 | ) | (497 | ) | |||||||
Cash and cash equivalents at beginning of period | 4,306 | 5,719 | 6,216 | |||||||||
Cash and cash equivalents at end of period | $ | 6,988 | $ | 4,306 | $ | 5,719 | ||||||
Supplemental disclosure of cash flow information: | ||||||||||||
Cash paid during the year for interest | $ | 236 | $ | 703 | $ | 376 | ||||||
Cash paid during the year for income taxes | $ | 118 | $ | 236 | $ | 713 | ||||||
Noncash activities: | ||||||||||||
Issuance of common stock and stock options in connection with the acquisition of eVergance | $ | — | $ | 2,776 | $ | — | ||||||
Non-cash issuance of debt in acquisition of eVergance | $ | — | $ | 2,358 | $ | — | ||||||
Debt assumed in acquisition of eVergance | $ | — | $ | 538 | $ | — | ||||||
Reclassification of warrant liability | $ | — | $ | — | $ | 1,864 | ||||||
Conversion of line of credit to notes payable | $ | 2,062 | $ | — | $ | — | ||||||
See accompanying notes to the consolidated financial statements.
NOTES TO THE CONSOLIDATED FINANCIAL STATEMENTS
Note 1. Kana Software, Inc. and Summary of Significant Accounting Policies
Nature of Operations
Kana Software, Inc. and its subsidiaries (“the Company” or “KANA”) were incorporated in July 1996 in California and reincorporated in Delaware in September 1999. KANA develops, markets and supports customer communications software products. The Company sells its products primarily in North America, Europe and Asia, through its direct sales force and third party integrators.
Basis of Presentation
The consolidated financial statements have been prepared on a going concern basis, which contemplates the realization of assets and the satisfaction of liabilities in the normal course of business. As of December 31, 2008, the Company had an accumulated deficit of $4.3 billion and has experienced recurring losses. Historically, the Company has financed its operations through a combination of debt financings, proceeds from common stock offerings, and sale of its products. The Company expects to finance future cash needs primarily through sale of its products and from proceeds from equity or debt financings; however, it cannot be assured that such financings will be available on acceptable terms, or at all. The Company continues to take steps to lower the expenses related to cost of revenues, sales and marketing, research and development, and general and administrative areas of the Company.
Since 1997 the Company has incurred substantial costs to develop its products and to recruit, train and compensate personnel for our engineering, sales, marketing, client services, and administration departments. As a result, the Company has incurred substantial losses since inception. On December 31, 2008, the Company had cash and cash equivalents of $7.0 million and borrowings outstanding under a line of credit of $6.0 million due in February 2010 and borrowings outstanding under notes payable of $1.8 million due in 2009. As of December 31, 2008, the Company had an accumulated deficit of $4.3 billion, negative working capital of $13.8 million and stockholders’ equity of $2.6 million. Losses from operations were $3.2 million and $7.1 million for 2008 and 2007, respectively. Net cash used for operating activities was $418,000 and $8.4 million in 2008 and 2007, respectively. These conditions, among others, raise substantial doubt about the Company’s ability to continue as a going concern. The consolidated financial statements do not reflect any adjustments that might be required as a result of this uncertainty.
During the third quarter of 2008, the Company reduced headcount by 14 employees to reduce expenses. Additionally, during the second quarter of 2009, the Company reduced headcount by 25 employees to better align its cost structure with its revenues. The Company is continuing to find ways to lower costs without materially changing support for their customers. The Company’s management believes that based on its current plans, the Company will require additional financing to fund the Company’s working capital and capital expenditure requirements through December 31, 2009. However, if the Company experiences lower than anticipated demand for its products, it will need to further reduce costs, issue equity securities or borrow money to meet its cash requirements. Any such equity issuances could be dilutive to the Company’s stockholders, and any financing transactions may be on unfavorable terms.
Principles of Consolidation
The consolidated financial statements include the accounts of KANA and its wholly-owned subsidiaries. All significant intercompany balances and transactions have been eliminated.
Use of Estimates
The preparation of the consolidated financial statements in accordance with accounting principles generally accepted in the United States requires management to make estimates and assumptions that affect the amounts reported in the financial statements and the accompanying notes. On an ongoing basis, the Company evaluates estimates, including those related to revenue recognition, stock-based compensation, provision for doubtful accounts, fair value of acquired intangible assets and goodwill, useful lives of property and equipment, income
taxes, restructuring costs, and contingencies and litigation, among others. The Company bases estimates on historical experience and on various other assumptions that are believed to be reasonable under the circumstances, the results of which form the basis for making judgments about the carrying values of assets and liabilities that are not readily apparent from other sources. Actual results could differ materially from those estimates under different assumptions or conditions.
Reclassification
Certain reclassifications have been made to the 2007 presentation to conform to the 2008 presentation, none of which had an effect on net loss, total assets, or total stockholders’ equity. Also, the consolidated statement of operations footnote for stock-based compensation includes both employee and non-employee stock-based compensation for all years presented. The consolidated statement of operations footnote had previously disclosed only employee stock-based compensation.
Revenue Recognition
The Company recognizes revenues in accordance with the American Institute of Certified Public Accountants (“AICPA”) Statement of Position (“SOP”) 97-2, “Software Revenue Recognition” (“SOP 97-2”), as amended.
Revenue from software license agreements is recognized when the basic criteria of software revenue recognition have been met (i.e. persuasive evidence of an agreement exists, delivery of the product has occurred, the fee is fixed or determinable, and collection is probable). The Company uses the residual method described in AICPA SOP No. 98-9, “Modification of SOP 97-2, Software Revenue Recognition, With Respect to Certain Transactions” (“SOP 98-9”), to recognize revenue when a license agreement includes one or more elements to be delivered at a future date and vendor-specific objective evidence of the fair value of all undelivered elements exists. Under the residual method, the fair value of the undelivered elements is deferred and the remaining portion of the arrangement fee is recognized as license revenue. If evidence of the fair value of one or more undelivered elements does not exist, all revenue is deferred and recognized when delivery of those elements occurs or when fair value can be established.
For all sales the Company uses either a signed license agreement, a signed amendment to an existing license agreement, a signed order form, a binding purchase order where the Company either has a signed master license agreement or an order form signed by the Company, or a signed statement of work as evidence of an arrangement.
Software delivery is primarily by electronic means. If the software or other deliverable is subject to acceptance for a specified period after the delivery, revenue is deferred until the acceptance period has expired or the acceptance provision has been met.
When licenses are sold together with consulting services, license fees are recognized upon delivery, provided that (1) the basic criteria of software revenue recognition have been met, (2) payment of the license fees is not dependent upon the performance of the consulting services, and (3) the consulting services do not provide significant customization of the software products and are not essential to the functionality of the software that was delivered. The Company does not provide significant customization of its software products.
Revenue arrangements with extended payment terms are generally considered not to be fixed or determinable and, the Company generally does not recognize revenue on these arrangements until the customer payments become due and all other revenue recognition criteria have been met.
Probability of collection is based upon assessment of the customer’s financial condition through review of their current financial statements or publicly-available credit reports. For sales to existing customers, prior
payment history is also considered in assessing probability of collection. The Company is required to exercise significant judgment in deciding whether collectibility is reasonably assured, and such judgments may materially affect the timing of our revenue recognition and our results of operations.
Services revenues include revenues for consulting services, customer support and training, and managed services. Consulting services revenues and the related cost of services are generally recognized on a time and materials basis. For consulting services contracts that have a fixed fee, the Company recognizes the license and professional consulting services revenues using either the percentage-of-completion method or the completed contract method as prescribed by AICPA SOP No. 81-1, “Accounting for Performance of Construction-Type and Certain Product-Type Contracts” (“SOP 81-1”). The Company’s consulting arrangements do not include significant customization of the software. Customer support agreements provide technical support and the right to unspecified future upgrades on an if-and-when available basis. Customer support revenues are recognized ratably over the term of the support period (generally one year). Training services revenues are recognized as the related training services are delivered. The unrecognized portion of amounts billed in advance of delivery for services is recorded as deferred revenue. Managed services revenue is recognized in accordance with the Securities and Exchange Commission (“SEC”) Staff Accounting Bulletin (“SAB”) No. 104, “Revenue Recognition, corrected copy” (“SAB 104”). Revenues from managed services are recognized ratably over the term of the arrangement, while application fees are recognized ratably over the sum of the term of the arrangement and the term of expected renewals.
Vendor-specific objective evidence for consulting and training services are based on the price charged when an element is sold separately or, in the case of an element not yet sold separately, the price established by authorized management, if it is probable that the price, once established, will not change before market introduction. Vendor-specific objective evidence for support services is based on the price charged when an element is sold separately or the stated contractual renewal rates.
Accounts Receivable and the Allowance for Doubtful Accounts
Accounts receivable are stated at cost, net of allowances for doubtful accounts. The Company makes judgments as to its ability to collect outstanding receivables and records allowances when collection becomes doubtful. Allowance charges are recorded as operating expenses. These estimates are based on assessing the credit worthiness of our customers based on multiple sources of information and analysis of such factors as our historical collection experience and industry and geographic concentrations of credit risk.
The accounts receivable aging is reviewed on a regular basis and write-offs are recorded on a case by case basis net of any amounts that may be collected.
Cash Equivalents and Marketable Securities
The Company considers all highly liquid investments with an original maturity date of three months or less at the date of purchase to be cash equivalents. The Company classifies its marketable securities as “available for sale.” These items are carried at fair value, based on the quoted market prices, with unrealized gains and losses reported as a separate component of accumulated other comprehensive income (loss) in stockholders’ equity (deficit). To date, unrealized and realized gains or losses have not been material. The cost of securities sold is based on the specific identification method. There were no marketable securities at December 31, 2008 and 2007.
Fair Value of Financial Instruments
The carrying values of the Company’s financial instruments, including cash and cash equivalents, accounts receivable, accounts payable and accrued liabilities approximate their fair values due to their relatively short
maturities or payment terms. Based on borrowing rates currently available to the Company for lines of credit and notes payable with similar terms, the carrying value of the Company’s line of credit and note payable obligations approximate fair value.
Certain Risks and Concentrations
Financial instruments subjecting the Company to concentrations of credit risk consist primarily of cash and cash equivalents, and trade accounts receivable. Cash and cash equivalents are deposited with financial institutions that management believes are creditworthy. Deposits in these institutions are generally in excess of federally insured amounts or similar amounts in foreign jurisdictions.
The Company’s customers are primarily concentrated in the United States and Europe. To reduce credit risk, the Company performs ongoing credit evaluations on its customers’ financial condition, and generally requires no collateral to support its accounts receivable. The Company establishes an allowance for doubtful accounts based upon factors surrounding the credit risk of customers, historical trends and other information and, to date, such losses have been within management’s expectations. As of December 31, 2008, one customer represented 12% of accounts receivable. As of December 31, 2007, one customer represented 15% of accounts receivable.
During the years ended December 31, 2008, 2007 and 2006, no customer represented more than 10% of total revenues.
Restricted Cash
The Company maintained $751,000 and $771,000 in long-term restricted cash as of December 31, 2008 and 2007, respectively, primarily for the Company’s leased facilities.
Impairment of Long-Lived Assets
The Company periodically assesses potential impairment of its long-lived assets with estimable useful lives which include property and equipment and acquired intangible assets, in accordance with the provisions of Statement of Financial Accounting Standards (“SFAS”) No. 144 “Accounting for the Impairment and Disposal of Long-Lived Assets” (“SFAS 144”). An impairment review is performed whenever events or changes in circumstances indicate that the carrying value may not be recoverable. Factors the Company considers important which could trigger an impairment review include, but are not limited to, significant under-performance relative to historical or projected future operating results, significant changes in the manner of use of the acquired assets or the strategy for the Company’s overall business, and significant industry or economic trends. When the Company determines that the carrying value of the long-lived assets may not be recoverable based upon the existence of one or more of the above indicators, the Company determines the recoverability by comparing the carrying amount of the asset to net future undiscounted cash flows that the asset is expected to generate. The impairment recognized is the amount by which the carrying amount exceeds the fair market value of the asset. The Company recognized impairment charges for certain internal-use software in 2008 as detailed below under Capitalized Software Development Costs—Internal-Use. The Company did not recognize any impairment charges in 2007.
Goodwill
Goodwill represents the excess of the purchase price over the fair value of net tangible and identified intangible assets acquired in business combinations. Goodwill is not amortized but is evaluated at least annually for impairment or when a change in facts and circumstances indicate that the fair value of the goodwill may be below its carrying value.
The Company tests goodwill for impairment at the “reporting unit level” (“Reporting Unit”) at least annually and more frequently if events merit. The Company performs this test in accordance with SFAS No. 142,
“Goodwill and Other Intangible Assets” (“SFAS 142”). The Company has determined that it has only one reporting segment and one Reporting Unit. Accordingly, goodwill is tested for impairment in a two-step process. First, the Company determines if the carrying amount of the Reporting Unit exceeds the “fair value” of the Reporting Unit, which may initially indicate that goodwill could be impaired. If the Company determines that such impairment could have occurred, it would compare the “implied fair value” of the goodwill as defined by SFAS 142 to its carrying amount to determine the impairment loss, if any. No impairment of goodwill was identified in 2008, 2007 or 2006.
Property and Equipment
Property and equipment are stated at cost less accumulated depreciation and amortization. Depreciation is computed using the straight-line method over the estimated useful lives of the assets, which are three years for computer equipment, software and furniture and fixtures, the shorter of ten years or the life of the lease for leasehold improvements, and five years for internal-use software. Upon retirement or sale, the cost and related accumulated depreciation are removed from the accounts and any related gain or loss is reflected in operations. Improvements that extend the life of a specific asset are capitalized, while normal maintenance and repairs are charged to operations as incurred.
Capitalized Software Development Costs—Internal-Use
Software development costs for internal-use software are capitalized pursuant to the provisions of SOP 98-1, “Accounting for Software Development Costs”. Such costs include internal costs as well as costs incurred to purchase third party software, and are capitalized beginning when the Company has determined certain factors are present, including among others, that technology exists to achieve the performance requirements, buy versus internal development decisions have been made and the Company’s management has authorized the funding of the project. Capitalization of software costs ceases when the software is substantially complete and is ready for its intended use. The resulting asset is amortized over its five-year estimated useful life using the straight-line method.
When events or circumstances indicate the carrying value of internal-use software might not be recoverable, the Company will assess the recoverability of these assets by determining whether the amortization of the asset balance over its remaining life can be recovered through undiscounted future operating cash flows. The amount of impairment, if any, is recognized to the extent that the carrying value exceeds the projected discounted future operating cash flows and is recognized as a write-down of the asset. In addition, when it is no longer probable that the software being developed will be placed in service, the asset will be recorded at the lower of its carrying value or fair value, if any, less direct selling costs.
In the quarter ended September 30, 2008, the Company expensed approximately $263,000 of capitalized costs related to an internal use software project that was abandoned. The Company has recorded this expense in restructuring costs in the accompanying statement of operations (see Note 9). Additionally, in the quarter ended December 31, 2008, the Company ceased using $561,000 of other internal use software that had been fully amortized prior to 2008.
Accounting for the Costs of Computer Software to Be Sold, Leased, or Otherwise Marketed
Software development costs are expensed as incurred until technological feasibility of the underlying software product is achieved. After technological feasibility is established, software development costs are capitalized until general availability of the product. Capitalized costs are then amortized on the greater of straight line basis over the estimated product life, or the ratio of current revenue to total projected product revenue. To date, technological feasibility and general availability of such software have occurred simultaneously and software development costs qualifying for capitalization have been insignificant. Accordingly, the Company has not capitalized any software development costs.
Restructuring Activities
During 2001, the Company had recorded a facilities consolidation charge for its estimated future lease commitments on excess facilities, net of estimated future sublease income. The estimates used in calculating the charge are reviewed on a quarterly basis and are revised if estimated future vacancy rates and sublease rates vary from the Company’s original estimates. To the extent that new estimates vary adversely from the original estimates, the Company may incur additional losses that are not included in the accrued balance at December 31, 2008. Conversely, unanticipated improvements in vacancy rates or sublease rates, or termination settlements for less than the Company’s accrued amounts, may result in a reversal of a portion of the accrued balance and a benefit on the Company’s statement of operations in a future period.
The restructuring accrual was recorded pursuant to provisions of Emerging Issues Task Force Issue (“EITF”) Issue No. 94-3, “Liability Recognition for Certain Employee Termination Benefits and Other Costs to Exit an Activity (including Certain Costs Incurred in a Restructuring)” (“EITF 94-3”), and continues to be evaluated pursuant to the requirements thereof. For facilities vacated and employees terminated after December 2002, the corresponding restructuring charge was recorded pursuant to the provisions of SFAS No. 146, “Accounting for Costs Associated with Exit or Disposal Activities” (“SFAS 146”).
Stock-based Compensation
The Company accounts for stock-based compensation in accordance with SFAS No. 123 (revised 2004), “Share-Based Payment” (“SFAS 123(R)”), which requires the measurement and recognition of compensation expense in the statement of operations for all share-based payment awards made to employees and directors, including employee stock options, based on estimated fair values.
Employee stock-based compensation expense recognized under SFAS 123(R) in the consolidated statements of operations was $2.2 million, $2.8 million and $2.8 million of the years ended December 31, 2008, 2007 and 2006. The estimated fair value of the Company’s stock-based awards, less expected forfeitures, is amortized over the awards’ vesting period on a straight-line basis.
SFAS 123(R) requires companies to estimate the fair value of share-based payment awards on the date of grant using an option-pricing model. The value of the portion of the award that is ultimately expected to vest is recognized as expense over the requisite service periods in the Company’s statements of operations. Employee stock-based compensation expense recognized in the Company’s consolidated statements of operations for the years ended December 31, 2008, 2007 and 2006 included compensation expense for share-based payment awards granted prior to, but not yet vested as of December 31, 2005, based on the grant date fair value estimated in accordance with the pro forma provisions of SFAS No 123, “Accounting for Stock Based Compensation (“SFAS 123”).” The Company’s stock-based compensation expense also includes compensation expense for the share-based payment awards granted subsequent to December 31, 2005 based on the grant date fair value estimated in accordance with the provisions of SFAS 123(R). Since stock-based compensation expense recognized in the consolidated statements of operations for the years ended December 31, 2008, 2007 and 2006 is based on awards ultimately expected to vest, it has been reduced for estimated forfeitures. SFAS 123(R) requires forfeitures to be estimated at the time of grant and revised, if necessary, in subsequent periods if actual forfeitures differ from those estimates.
For stock options granted to non-employees the Company recognizes compensation expense in accordance with the provisions of SFAS 123 and EITF Issue No. 96-18, “Accounting for Equity Instruments that are Issued to Other than Employees for Acquiring, or in Conjunction with Selling, Goods or Services”, which require such equity instruments to be recorded at their fair value on the measurement date. The measurement of stock-based compensation is subject to periodic fair value adjustments as the underlying equity instruments vest. The Company amortizes compensation expense related to non-employee stock options in accordance with Financial Accounting Standards Board (“FASB”) Interpretation No. 28,“Accounting for Stock Appreciation Rights and Other Variable Stock Option or Award Plans” (“FIN 28”).
In 2005 and 2006, the Company extended the vesting period of approximately 1,000,000 stock options held by four terminated employees who had agreements to provide consulting services. In October 2006, the Company extended the exercise period of approximately 211,000 vested stock options of a former employee as the result of a termination agreement. During the year ended December 31, 2006, the Company granted 57,500 stock options to four non-employees who had agreements to provide consulting services. As a result of these stock option modifications to former employees and the stock option grants to consultants, the Company recorded non-employee stock-based compensation expenses of $4,000, $31,000 and $632,000 for the years ended December 31, 2008, 2007 and 2006, respectively, allocated as follows (in thousands):
| Year Ended December 31, | |||||||||
| 2008 | 2007 | 2006 | |||||||
Sales and marketing expense | $ | — | $ | 15 | $ | 119 | |||
Research and development expense | — | — | 44 | ||||||
General and administrative expense | 4 | 16 | 469 | ||||||
| $ | 4 | $ | 31 | $ | 632 | ||||
The 2006 stock option grants to consultants were valued using the Black-Scholes option pricing model with assumptions similar to those utilized for employee options as discussed in Note 7.
See Note 7, “Stockholders’ Equity (Deficit),” for additional information on stock options.
Foreign Currency
Generally, the functional currency of our international subsidiaries is the local currency. The financial statements of these subsidiaries are translated to U.S. dollars using month-end exchange rates for assets and liabilities, and average exchange rates for revenues, costs and expenses. Translation gains and losses are recorded in accumulated other comprehensive income (loss) as a component of stockholders’ equity (deficit).
Transaction gains and losses that arise from exchange rate changes denominated in other than the local currency are included in general and administrative expenses in the statements of operations and are not considered material for all periods presented.
Advertising Costs
The Company expenses advertising costs as incurred. Advertising expense was $379,000, $369,000, and $275,000 for the years ended December 31, 2008, 2007 and 2006, respectively.
Research and Development Costs
Research and development expenses consist primarily of compensation and related costs for personnel responsible for the research and development of new products and services, as well as significant improvements to existing products and services. The Company expenses research and development costs as they are incurred.
Income Taxes
Deferred tax assets and liabilities are recognized for the estimated future tax consequences attributable to differences between the financial statement carrying amounts of existing assets and liabilities and their respective tax bases. A valuation allowance is recorded to reduce deferred tax assets to an amount where realization is more likely than not.
In June 2006, the FASB issued Interpretation No. 48 “Accounting for Uncertainty in Income Taxes—an interpretation of FASB Statement 109” (“FIN 48”). FIN 48 clarifies the accounting for uncertainty in income
taxes recognized in an enterprise’s financial statements in accordance with SFAS No. 109 “Accounting for Income Taxes”. It prescribes a recognition threshold and measurement attribute for the financial statement recognition and measurement of a tax position taken or expected to be taken in a tax return. FIN 48 also provides guidance on derecognition, measurement, classification, interest and penalties, accounting in interim periods, disclosure, and transition. See Note 11 for additional information on FIN 48.
Net Loss per Share
Basic net loss per share is computed using the weighted average number of outstanding shares of common stock. Diluted net loss per share is computed using the weighted-average number of outstanding shares of common stock and, when dilutive, shares of common stock issuable upon exercise of options and warrants deemed outstanding using the treasury stock method. Outstanding warrants and stock options of approximately 10,341,000, 12,402,000, and 11,347,000 at December 31, 2008, 2007, and 2006, respectively, have been excluded from the calculation of diluted net loss per share as all such securities were anti-dilutive for all periods presented.
Comprehensive Income (Loss)
The Company reports comprehensive income (loss) in accordance with the provisions of SFAS No. 130, “Reporting Comprehensive Income”, which establishes standards for reporting comprehensive income (loss) and its components in the financial statements. The components of other comprehensive income (loss) consists of net income (loss) and foreign currency translation adjustments. Comprehensive income (loss) and the components of accumulated other comprehensive income (loss) are presented in the accompanying consolidated statements of stockholders’ equity (deficit).
Recent Accounting Pronouncements
In October 2008, the Financial Accounting Standards Board (“FASB”) issued FASB Staff Position (“FSP”) FAS 157-3 (“FSP FAS 157-3”), “Determining the Fair Value of a Financial Asset in a Market That is Not Active.” FSP FAS 157-3 clarifies the application of SFAS No. 157 “Fair Value Measurements” (“SFAS No. 157”) in a market that is not active. FSP FAS 157-3 addresses how management should consider measuring fair value when relevant observable data does not exist. FSP FAS 157-3 also provides guidance on how observable market information in a market that is not active should be considered when measuring fair value, as well as how the use of market quotes should be considered when assessing the relevance of observable and unobservable data available to measure fair value. FSP FAS 157-3 is effective upon issuance for companies that have adopted SFAS No. 157 “Fair Value Measurements.” The adoption of FSP FAS 157-3 did not have a material impact on the Company’s results of operations, financial position or cash flows.
In June 2008, the FASB ratified Emerging Issue Task Force (“EITF”) Issue No. 07-5, “Determining whether an Instrument (or Embedded Feature) is indexed to an Entity’s Own Stock” (“EITF 07-5”). EITF 07-5 is effective for financial statements issued for fiscal years beginning after December 15, 2008, and interim periods within those fiscal years. Early application is not permitted. EITF 07-5 provides a new two-step model to be applied in determining whether a financial instrument or an embedded feature is indexed to an issuer’s own stock and thus able to qualify for the SFAS No. 133 paragraph 11(a) scope exception. The Company is currently evaluating the impact that the adoption of EITF 07-5 will have on its consolidated financial statements.
In February 2008, the FASB issued FSP No. FAS 157-2, “Effective Date of FASB Statement No. 157” (“FSP FAS 157-2”), to partially defer SFAS No. 157. FSP FAS 157-2 defers the effective date of SFAS 157 for nonfinancial assets and nonfinancial liabilities, except those that are recognized or disclosed at fair value in the financial statements on a recurring basis (at least annually), to fiscal years, and interim periods within those fiscal years, beginning after November 15, 2008. The Company is currently evaluating the impact that the adoption of FSP FAS 157-2 will have on its consolidated financial statements.
In December 2007, the FASB issued SFAS No. 141 (revised 2007), “Business Combinations” (“SFAS 141R”). SFAS 141R establishes principles and requirements for how an acquirer recognizes and measures in its financial statements the identifiable assets acquired, the liabilities assumed, any non-controlling interest in the acquiree and the goodwill acquired. SFAS 141R also establishes disclosure requirements to enable the evaluation of the nature and financial effects of the business combination. SFAS 141R is effective as of the beginning of an entity’s first fiscal year beginning after December 15, 2008, and will be adopted by the Company in the first quarter of fiscal year 2009. SFAS 141R is to be applied prospectively to business combinations for which the acquisition date is on or after January 1, 2009. The Company expects SFAS 141R will have an impact on its accounting for future business combinations once adopted but the effect is dependent upon the acquisitions that are made in the future.
Note 2. Business Combinations
On May 4, 2007, the Company executed a definitive agreement with the members of eVergance Partners LLC (“eVergance”) to acquire all of their membership interests. On June 14, 2007 (the “Closing Date”), the Company agreed to issue to the former members of eVergance an aggregate of 600,000 shares of its common stock (the “Stock”) and an aggregate of 400,000 non-equity plan options to purchase shares of its common stock (the “Options”). Twenty-five percent of the Stock was issued as of the Closing Date and an additional twenty-five percent was issued on each of three, seven and nine months after the Closing Date. The fair value of Stock was determined using a value of $3.17, which was the average closing price of the Company’s common stock two days before and after the announcement date of May 7, 2007, less a 10% discount to reflect that unregistered stock was issued and issuable. The unissued stock was accounted for as common stock subscription in the consolidated balance sheet. Twenty-five percent of the Options were exercisable as of the Closing Date and it was agreed that an additional twenty-five percent would be exercisable three, six and nine months after the Closing Date. The Options have an exercise price per share equal to the closing sale price of the Company’s common stock on June 13, 2007, which was $3.07 as quoted on the Over the Counter Bulletin Board (“OTCBB”). The fair value of the options was determined using the Black-Scholes option pricing model, using assumptions of a risk-free interest rate of 4.76%, expected volatility of 53%, the ten year contractual term, and no expected dividends. The fair value of the common stock underlying the options was discounted as discussed above. The options granted have been excluded from the summaries of options outstanding in Note 7 and had a fair value of $2.19 per share upon grant. In addition, the Company paid cash of $762,000 and issued promissory notes having a total principal amount of $2.5 million to the eVergance members. The aggregate consideration for the transaction was as follows (in thousands):
Cash consideration | $ | 762 | |
Present value of notes payable to members of eVergance | 2,358 | ||
Fair value of common stock issued and issuable | 1,899 | ||
Fair value of options issued and issuable | 877 | ||
Direct acquisition costs | 156 | ||
Total consideration | $ | 6,052 | |
The Company relied on an exemption from registration provided by Section 4(2) of the Securities Act of 1933, as amended (the “Securities Act”), and Rule 506 promulgated thereunder. The former members of eVergance represented to KANA that they were “accredited investors” as defined in Rule 501(a) promulgated in the Securities Act and that they were purchasing the Stock for their own account and not with a present view towards the public sale or distribution thereof.
eVergance is a management consulting and systems integration firm offering end-to-end consulting services for customer relationship management optimization, knowledge management, and web self-service deployments. Through this acquisition, the Company will significantly expand its professional services portfolio to meet growing demand for consulting and implementation services. Under the terms of the definitive agreement related to the acquisition, the purchase consideration consisted of cash, stock and options issued.
This transaction was accounted for using the purchase method of accounting. The Company allocated the purchase price to the assets acquired and liabilities assumed based on their estimated fair values on the acquisition date giving consideration to an independent appraisal. To the extent that the purchase price exceeded the fair value of the assets and liabilities assumed, goodwill was recorded. The intangible assets acquired in connection with the acquisition are being amortized over a five-year period.
The following is a summary of the initial allocation of the purchase price (in thousands):
Tangible assets: | ||||
Current assets | $ | 865 | ||
Property and equipment | 134 | |||
Other assets | 19 | |||
Total tangible assets acquired | 1,018 | |||
Liabilities: | ||||
Current liabilities | (1,268 | ) | ||
Long-term liabilities | (75 | ) | ||
Total liabilities assumed | (1,343 | ) | ||
Fair value of net tangible liabilities acquired | (325 | ) | ||
Intangible assets consisting of: | ||||
Customer relationships | 2,500 | |||
Total intangible assets acquired | 2,500 | |||
Goodwill | 3,877 | |||
Total consideration | $ | 6,052 | ||
Subsequent to the initial allocation of the purchase price above, in the quarter ended June 30, 2008, goodwill was reduced by $85,000 due to the collection of an account receivable that was written off prior to the acquisition of eVergance.
The consolidated financial statements include the operating results of eVergance from the date of acquisition. Pro forma results of operations for the eVergance acquisition have not been presented because the effect of the acquisition was not material to the Company’s financial results.
Note 3. Financial Statement Detail
Cash and cash equivalents are carried at cost, which approximates fair value and consisted of the following (in thousands):
| December 31, | ||||||
| 2008 | 2007 | |||||
Cash | $ | 2,899 | $ | 3,304 | ||
Money market funds | 4,089 | 1,002 | ||||
| $ | 6,988 | $ | 4,306 | |||
Prepaid expenses and other current assets consisted of the following (in thousands):
| December 31, | ||||||||
| 2008 | 2007 | |||||||
Prepaid royalties | $ | 469 | $ | 510 | ||||
Other prepaid expenses | 1,561 | 1,881 | ||||||
| $ | 2,030 | $ | 2,391 | |||||
Property and equipment, net consisted of the following (in thousands): |
| |||||||
| December 31, | ||||||||
| 2008 | 2007 | |||||||
Computer equipment and software | $ | 9,726 | $ | 12,660 | ||||
Furniture and fixtures | 669 | 843 | ||||||
Leasehold improvements | 3,147 | 3,420 | ||||||
Internal-use software | — | 824 | ||||||
| 13,542 | 17,747 | |||||||
Less accumulated depreciation and amortization | (11,619 | ) | (15,455 | ) | ||||
| $ | 1,923 | $ | 2,292 | |||||
Amortization of internal-use software was $0, $37,000, and $112,000 for the years ended December 31, 2008, 2007, and 2006, respectively. |
| |||||||
Other assets consisted of the following (in thousands): |
| |||||||
| December 31, | ||||||||
| 2008 | 2007 | |||||||
Deposits | $ | 293 | $ | 233 | ||||
Prepaid royalties | 135 | 434 | ||||||
| $ | 428 | $ | 667 | |||||
Accrued liabilities consisted of the following (in thousands): |
| |||||||
| December 31, | ||||||||
| 2008 | 2007 | |||||||
Accrued payroll and related expenses | $ | 2,460 | $ | 2,667 | ||||
Accrued royalties | 958 | 1,034 | ||||||
Other accrued liabilities | 1,666 | 1,785 | ||||||
| $ | 5,084 | $ | 5,486 | |||||
Interest and other income (expense), net consisted of the following (in thousands):
| Year Ended December 31, | ||||||||||||
| 2008 | 2007 | 2006 | ||||||||||
Interest income | $ | 27 | $ | 87 | $ | 172 | ||||||
Interest expense | (369 | ) | (858 | ) | (207 | ) | ||||||
Change in warrant liability | — | — | (774 | ) | ||||||||
Other | (69 | ) | 32 | 71 | ||||||||
| $ | (411 | ) | $ | (739 | ) | $ | (738 | ) | ||||
Note 4. Goodwill and Intangible Assets
Consideration paid in connection with acquisitions is required to be allocated to the acquired assets, including identifiable intangible assets, and liabilities acquired. Acquired assets and liabilities are recorded based on the Company’s estimate of fair value, which requires significant judgment with respect to future cash flows and discount rates. For intangible assets other than goodwill, the Company is required to estimate the useful life of the asset and recognize its cost as an expense over the useful life. The Company uses the straight-line method to expense long-lived assets (including identifiable intangibles). Amortization of goodwill ceased as of January 1, 2002 upon the Company’s adoption of SFAS 142. Instead, the Company is now required to test goodwill for impairment under certain circumstances and write down goodwill when it is deemed to be impaired.
The Company regularly evaluates its business for potential indicators of impairment of goodwill and intangible assets. The Company’s judgments regarding the existence of impairment indicators are based on market conditions, operational performance of the business and considerations of any events that are likely to cause impairment. Future events could cause the Company to conclude that impairment indicators exist and that goodwill and other intangible assets associated with the Company’s acquired businesses are impaired. The Company currently operates in one reportable segment, which is also the only reporting unit for the purposes of SFAS 142.
The Company performs its annual impairment test on June 30 and concluded that goodwill was not impaired as the fair value of the Company exceeded its carrying value, including goodwill. No events have occurred since June 30, 2008 that would require an interim impairment analysis of goodwill. The Company’s identifiable intangible assets are reviewed for impairment whenever events or changes in circumstance indicate that the carrying amount of an intangible may not be recoverable. At December 31, 2008, the Company determined that goodwill was not impaired.
Purchased intangible assets are carried at cost less accumulated amortization. Amortization is computed over the estimated useful lives of the assets, which is five years. The Company reported amortization expense on purchased intangible assets of $500,000, $288,000, and $133,000 for the years ended December 31, 2008, 2007, and 2006, respectively. Expected amortization expense is $500,000 in 2009, $500,000 in 2010, $500,000 in 2011, and $226,000 in 2012.
The components of goodwill and other intangibles are as follows (in thousands):
| December, 31 | ||||||||
| 2008 | 2007 | |||||||
Goodwill | $ | 12,415 | $ | 12,500 | ||||
Intangibles: | ||||||||
Customer relationships | $ | 2,650 | $ | 2,650 | ||||
Purchased technology | 14,650 | 14,650 | ||||||
Less: accumulated amortization | (15,574 | ) | (15,074 | ) | ||||
Intangibles, net | $ | 1,726 | $ | 2,226 | ||||
Note 5. Line of Credit and Notes Payable
(a) Line of Credit
On November 30, 2005, the Company established a banking relationship with Bridge Bank N.A. (“Bridge”) entering into a Business Financing Agreement and Intellectual Property Security Agreement with Bridge under which the Company had access to a loan facility of $7.0 million. The Company has since amended the agreement with Bridge, most recently on March 28, 2008, when the Company entered into a Second Amended and Restated Loan and Security Agreement with Bridge under which the Company has access to a loan facility of $10.0 million (“March Loan Facility”). The March Loan Facility is a formula-based revolving line of credit based on
80% of eligible receivables subject to a sublimit of $2.5 million is available for stand-by letters of credit, foreign exchange contracts or cash management products. Existing equipment advances under the line of credit were converted into a term loan as of March 26, 2008 in the amount of $1.6 million, which is payable in 33 monthly installments of principal plus interest. An additional $500,000 borrowed under the additional equipment financing provision was converted into a 36 month term loan on September 30, 2008. The total combined borrowing under the March Loan Facility and sublimits cannot exceed $10.0 million. The March Loan Facility is collateralized by all of the Company’s assets and expires February 27, 2010 at which time the entire balance under the formula-based line of credit will be due. Interest for the formula based revolving line of credit, the existing equipment advances and the additional equipment financing accrues at the Wall Street Journal’s (“WSJ”) Prime Lending Rate plus 1.25%, which was 4.50% as of December 31, 2008. The March Loan Facility contains certain restrictive covenants including, but not limited to, certain financial covenants such as maintaining profitability net of stock-based compensation and maintenance of certain key ratios. If the Company is not in compliance with the covenants of the March Loan Facility, Bridge has the right to declare an event of default and all of the outstanding balances owed under the March Loan Facility would become immediately due and payable. On March 17, 2009, the Company entered into a Loan and Security Modification Agreement to the March Loan Facility that provided a one-time waiver of these financial covenants for the quarter ended December 31, 2008. On May 13, 2009, the Company obtained a non-binding financing proposal from Bridge for a modification of the March Loan Facility that would provide a one-time waiver of these financial covenants for the quarter ended March 31, 2009 and the month ended April 30, 2009. The proposal sets the total loan facility amount to $6.0 million and extends the maturity date to June 30, 2010. As a requirement of the May 13, 2009 proposal from Bridge, availability under the existing revolving line of credit will be used to prepay all amounts currently outstanding under the existing term loans for equipment. Additionally, modifications would be made to the existing restrictive covenants and added certain covenants related to raising additional capital. This proposal is not binding, and is subject to further negotiation, to approval by the lenders’ loan committee, and execution of definitive loan documents. Accordingly, the Company can give no assurances as to whether it will enter into any such loan documents, or as to their terms. In addition, the Company’s existing credit facilities prohibit the payment of cash or stock dividends on its capital stock without the lender’s prior written consent.
As of December 31, 2008, the Company had $1.1 million outstanding under the March Loan Facility equipment loan. This amount is repayable in 25 remaining monthly installments of principal and interest. The Company had $459,000 outstanding under the additional equipment financing facility. This amount is repayable in 33 remaining monthly installments of principal and interest. These loans are included with other non-bank debt under the heading of notes payable in the consolidated balance sheet. These loans are included in current liabilities based on the terms of the May 13, 2009 proposal that waived out of compliance conditions of certain covenants and requires the Company to prepay the term loans from availability under the existing line of credit. The Company has also drawn $6.0 million against the formula based revolving line of credit. The available balance of the March Loan Facility was also lowered by $116,000 to secure a letter of credit related to a building lease, leaving an available balance of $2.3 million as of December 31, 2008.
(b) Notes Payable
As of December 31, 2008, there was $1.8 million classified as current portion of notes payable and $13,000 classified as long-term. The notes payable consist of four obligations: (1) An equipment loan from Bridge with interest at prime plus 1.25% (as discussed above); (2) A promissory note for the financing of software license and support purchased and has a fixed interest rate of 3.15%, payable in five remaining monthly installments of principal and interest; (3) A capital lease obligation, assumed from eVergance, for office furniture and equipment, which had a 5 year term, of which 18 months were remaining as of December 31, 2008, and an annual interest rate of 8.58%; (4) A short-term financing of Directors and Officers insurance and has a fixed interest rate of 9.87%, payable in 9 remaining monthly installments of principal and interest.
Note - financing of equipment Note - financing of software Note - financing of eVergance equipment Note - financing of insurance Total Payments Due By Period (in
thousands)Note Description Interest Rate Total Due Due in 2009 Due in 2010 Prime plus 1.25 % $ 1,595 $ 1,595 $ — 3.15 % 72 72 — 8.58 % 38 25 13 9.87 % 129 129 — $ 1,834 $ 1,821 $ 13
Note 6. Commitments and Contingencies
(a) Lease Obligations
The Company leases its facilities under non-cancelable operating leases with various expiration dates through January 2011. In connection with its existing leases, the Company entered into letters of credit totaling $864,000 expiring in 2010 and 2011. The Company’s letters of credit can be supported by either restricted cash or the Company’s line of credit.
Future minimum lease payments under non-cancelable operating leases are as follows (in thousands):
| Year Ending December 31, | Non-cancelable Operating Leases(1) | Less Sublease Income(2) | Net | ||||||
2009 | $ | 2,619 | $ | 448 | $ | 2,171 | |||
2010 | 1,050 | 467 | 583 | ||||||
2011 | 53 | 39 | 14 | ||||||
| $ | 3,722 | $ | 954 | $ | 2,768 | ||||
| (1) | Includes leases for properties included in the restructuring liability. |
| (2) | Includes subleases that are under contracts as of December 31, 2008. |
Rent expense for properties in use, net of sublease payments, was approximately $1.7 million, $1.6 million, and $1.7 million for the years ended December 31, 2008, 2007 and 2006, respectively.
(b) Other Contractual Obligations
At December 31, 2008, the Company had other future contractual obligations requiring payments of $1.0 million, $1.6 million, $1.6 million, $1.7 million and $0.9 million for the years ended December 31, 2009, 2010, 2011, 2012 and 2013 respectively, with no required payments thereafter. These contractual obligations represent payments on a legal settlement, minimum payments to vendors for future royalty fees and consulting services.
(c) Litigation
On January 24, 2007, RightNow Technologies, Inc. (“RightNow”) filed a suit in the Eighteenth Judicial District Court of Gallatin County, Montana against the Company and four former RightNow employees who had joined the Company. The suit alleges violation of certain provisions of employment agreements, misappropriation of trade secrets, as well as other claims, and seeks damages. The Company believes it has meritorious defenses to these claims and intend to defend against this action vigorously.
The underwriters for the Company’s initial public offering, Goldman Sachs & Co., Lehman Bros., Hambrecht & Quist LLC, Wit Soundview Capital Corp., as well as the Company and certain current and former officers of the Company were named as defendants in federal securities class action lawsuits filed in the U.S. District Court for the Southern District of New York (the “District Court”). The cases allege violations of various
securities laws by more than 300 issuers of stock, including the Company, and the underwriters for such issuers, on behalf of a class of plaintiffs who, in the case of the Company, purchased the Company’s stock between September 21, 1999 and December 6, 2000 in connection with the Company’s initial public offering. Specifically, the complaints allege that the underwriter defendants engaged in a scheme concerning sales of the Company’s and other issuers’ securities in the initial public offering and in the aftermarket. In July 2003, the Company decided to join a settlement negotiated by representatives of a coalition of issuers named as defendants in this action and their insurers. In April 2005, the court requested a modification to the original settlement arrangement which was approved by the Company. Although the Company believed that the plaintiffs’ claims had no merit, the Company had decided to accept the settlement proposal to avoid the cost and distraction of continued litigation. The Company was a party to a global settlement with the plaintiffs that would have disposed of all claims against it with no admission of wrongdoing by the Company or any of its present or former officers or directors. The settlement agreement had been preliminarily approved by the District Court. However, while the settlement was awaiting final approval by the District Court, in December 2006, the Court of Appeals reversed the District Court’s determination that six focus cases could be certified as class actions. In April 2007, the Court of Appeals denied the plaintiffs’ petition for rehearing, but acknowledged that the District Court might certify a more limited class. At a September 26, 2007 status conference, the District Court approved a stipulation withdrawing the proposed settlement. On August 14, 2007, the plaintiffs filed an amended complaint in the six focus cases to test the sufficiency of their class allegations. On September 27, 2007, the plaintiffs filed a motion for class certification in the six focus cases, which was withdrawn on October 10, 2008. On November 13, 2007, the defendants filed a motion to dismiss the complaint for failure to state a claim, which the District Court denied on March 8, 2008. Plaintiffs, the issuer defendants (including the Company) and underwriter defendants and the insurance carriers for the defendants have engaged in mediation and settlement negotiations. The parties have entered into a settlement agreement. As part of this settlement, the Company’s insurance carrier has agreed to assume the Company’s entire payment obligation under the terms of the settlement. The proposed settlement was submitted to the District Court for preliminary approval on April 2, 2009, but there can be no guarantee that it will be finalized or receive approval from the District Court. The Company believes that it has meritorious defenses to these claims. If the proposed settlement is not approved and the litigation continues against the Company, the Company would continue to defend against this action vigorously.
In October 2007, a lawsuit was filed in the U.S. District Court for the Western District of Washington by Ms. Vanessa Simmonds against certain of the underwriters of the Company’s initial public offering. The plaintiff alleges that the underwriters violated Section 16(b) of the Securities Exchange Act of 1934, 15 U.S.C. section 78p(b), by engaging in short-swing trades, and seeks disgorgement of profits from the underwriters in amounts to be proven at trial. The suit names the Company as a nominal defendant, contains no claims against the Company, and seeks no relief from the Company. This matter was dismissed with prejudice on March 12, 2009, and plaintiff filed a notice of appeal on March 31, 2009.
On March 16, 2006, Polaris IP, LLC filed a suit against the Company, Sirius Satellite Radio, Inc., Priceline.com, Capital One, Continental Airlines, Inc. and E*Trade Financial in the U.S. District Court for the Eastern District of Texas alleging infringement of U.S. Patent Nos. 6,411,947 and 6,278,996 and seeking injunctive relief, damages and attorneys’ fees. On March 23, 2007, the parties entered into a settlement agreement and this matter was dismissed with prejudice on April 26, 2007.
Other third parties have from time to time claimed, and others may claim in the future that the Company has infringed their past, current or future intellectual property rights. The Company has in the past been forced to litigate such claims. These claims, whether meritorious or not, could be time-consuming, result in costly litigation, require expensive changes in the Company’s methods of doing business or could require the Company to enter into costly royalty or licensing agreements, if available. As a result, these claims could harm the Company’s business.
The ultimate outcome of any litigation is uncertain, and either unfavorable or favorable outcomes could have a material negative impact on the Company’s results of operations, consolidated balance sheets and cash flows due to defense costs, and divert management resources.
(d) Indemnification
Many of the Company’s software license agreements require the Company to indemnify its customers from any claim or finding of intellectual property infringement. The Company periodically receives notices from customers regarding patent license inquiries they have received which may or may not implicate the Company’s indemnity obligations. Any litigation, brought by others, or the Company could result in the expenditure of significant financial resources and the diversion of management’s time and efforts. In addition, litigation in which the Company is accused of infringement might cause product shipment delays, require the Company to develop alternative technology or require the Company to enter into royalty or license agreements, which might not be available on acceptable terms, or at all. If a successful claim of infringement was made against the Company and the Company could not develop non-infringing technology or license the infringed or similar technology on a timely and cost-effective basis, its business could be significantly harmed. Such indemnification provisions are accounted for in accordance with SFAS No. 5 “Accounting for Contingencies” (“SFAS 5”). In prior periods, the Company has incurred minimal costs related to such claims under such indemnifications provisions; accordingly, the amount of such obligations cannot be reasonably estimated. The Company did however record a settlement charge resulting from a settlement of an infringement claim on the Company’s consolidated statement of operations for the year ended December 31, 2006, which was not considered material. There were no outstanding claims at December 31, 2008.
As permitted by Delaware law, the Company has agreements whereby it indemnifies its officers and directors for certain events or occurrences while the officer is, or was, serving at the Company’s request in such capacity. The term of the indemnification period is for the officer’s or director’s lifetime. The maximum potential amount of future payments the Company could be required to make under these indemnification agreements is unlimited; however, the Company has a director and officer insurance policy that limits its exposure and enables the Company to recover a portion of any such amounts. As a result of the Company’s insurance policy coverage, the Company believes the estimated fair value of these indemnification agreements is insignificant. Accordingly, the Company has no liabilities recorded for these agreements as of December 31, 2008.
(e) Warranties
The Company generally provides a warranty for its software products and services to its customers. The Company’s products are generally warranted to perform substantially as described in the associated product documentation for a period of 90 days. The Company’s services are generally warranted to be performed consistent with industry standards for a period of 90 days from delivery. In the event there is a failure of such warranties, the Company generally is obligated to correct the product or service to conform to the warranty provision or, if the Company is unable to do so, the customer is entitled to seek a refund of the purchase price of the product or service. Such warranties are accounted for in accordance with SFAS 5. The Company has not provided for a warranty accrual as of December 31, 2008 or 2007 because, to date, the Company’s product warranty expense has not been significant. The Company assesses the need for a warranty reserve on a quarterly basis and there can be no guarantee that a warranty reserve will not become necessary in the future.
Note 7. Stockholders’ Equity (Deficit)
(a) Issuance of Common Stock and Warrants
On November 21, 2007, the Company completed a direct offering of 4,000,000 shares of registered common stock, par value $0.001, at an initial price of $2.45 per share for gross proceeds of $9.8 million. The Company received approximately $8.9 million in net proceeds after deducting the placement agent’s fees and offering expenses. The Company used a portion of the net proceeds from this financing to repay $6.8 million of borrowings under its loan agreement with Bridge and used the remaining portion for general corporate purposes. All of the shares of common stock were offered and sold by the Company pursuant to an effective registration statement on Form S-3 (File No. 333-145742) filed with the SEC in November 2007.
On June 14, 2007 (the “Closing Date”), the Company agreed to issue to the former members of eVergance an aggregate of 600,000 shares of its common stock (the “Stock”) and an aggregate of 400,000 non-equity plan
options to purchase shares of our common stock (the “Options”). Twenty-five percent of the Stock was issued as of the Closing Date and it was agreed that an additional twenty-five percent would be issued three, seven and nine months after the Closing Date. The fair value of the Stock was determined using a value of $3.17, which was the average closing price of the Company’s common stock two days before and after the announcement date of May 7, 2007, less a 10% discount to reflect that unregistered stock was issued and issuable. The unissued stock was accounted for as common stock subscription in the consolidated balance sheet. Twenty-five percent of the Options were exercisable as of the Closing Date and it was agreed that an additional twenty-five percent would be exercisable three, six and nine months after the Closing Date. The Options have an exercise price per share equal to the closing sale price of the Company’s common stock on June 13, 2007, which was $3.07 as quoted on the Over the Counter Bulletin Board (OTCBB). The fair value of the options was determined using the Black-Scholes option pricing model, using assumptions of a risk-free interest rate of 4.76%, expected volatility of 53%, the ten year contractual term, and no expected dividends. The fair value of the common stock underlying the Options was discounted as discussed above. See Note 2 for more information on this acquisition.
In December 2007, the Company registered the Stock and shares of common stock underlying the Options issued in connection with the acquisition of all membership interests of eVergance on a Form S-3 Registration Statement filed with the SEC.
In June and September 2005, the Company completed a private placement of unregistered securities for the issuance of common stock and warrants. In May 2006, the Company amended the Registration Agreement related to the June and September 2005 private placements (collectively referred to as the “Private Placements”) to extend the registration deadline of the shares of common stock and underlying shares of common stock of the warrants issued to the investors to September 30, 2006 from January 27, 2006 and change the penalty for failure to register the underlying shares of common stock from a cash penalty to a share-based payment, in exchange for the issuance of 593,854 shares of common stock to the investors. The shares were valued at approximately $1.0 million based on the fair market value of the Company’s common stock on the date of the amendment less a 10% discount to reflect that unregistered stock was issued. Registration rights penalties of $337,000 and $695,000 were recorded as non-operating expenses during the first and second quarters of 2006, respectively. The September 30, 2006 registration deadline was not met and an additional 59,383 shares of common stock was issued to the investors. The shares were valued at approximately $166,000 based on the fair market value of the Company’s common stock on September 30, 2006 less a 10% discount to reflect that unregistered stock was issued. This amount was recorded as a non-operating expense during the third quarter of 2006.
On November 9, 2006, the Company completed the registration of the shares of common stock and shares of common stock underlying the warrants issued to the investors.
In December 2003, the Company issued to a customer a warrant to purchase 230,000 shares of common stock at $5.00 per share. The warrant was fully exercisable upon issuance and expired in December 2008.
As of December 31, 2008, the Company had the following warrants outstanding and exercisable:
| Number of warrants | Warrant exercise price | ||||
June 2005 warrants expiring in September 2010 | 815,769 | $ | 2.45 | ||
September 2005 warrants expiring in September 2010 | 945,687 | $ | 1.97 | ||
October 2005 warrants expiring in October 2010 | 153,130 | $ | 1.97 | ||
| 1,914,586 | |||||
(b) Stock Compensation Plans
The Company’s 1999 Stock Incentive Plan (the “1999 Stock Incentive Plan”), as successor to the 1997 Stock Option Plan (the “1997 Stock Option Plan”), provides for shares of the Company’s common stock to be
granted to employees, independent contractors, officers, and directors. Options are granted at an exercise price equivalent to the closing fair market value on the date of grant. All options are granted at the discretion of the Company’s Board of Directors and have a term not greater than 10 years from the date of grant. Options are immediately exercisable when vested and generally vest monthly over four years.
The following table summarizes activities under the equity incentive plans for the indicated periods:
| Options Outstanding | |||||||||||
| Number of Shares | Weighted Average Exercise Price | Weighted Average Remaining Contractual Term (in years) | Aggregate Intrinsic Value | ||||||||
Balances, December 31, 2005 | 8,673,108 | $ | 8.03 | ||||||||
Options cancelled and retired | (2,212,863 | ) | 10.30 | ||||||||
Options exercised | (1,395,263 | ) | 2.11 | $ | 1,472,165 | ||||||
Options granted | 4,136,939 | 2.99 | |||||||||
Balances, December 31, 2006 | 9,201,921 | 6.12 | |||||||||
Options cancelled and retired | (1,750,437 | ) | 4.18 | ||||||||
Options exercised | (638,198 | ) | 2.31 | $ | 531,343 | ||||||
Options granted | 3,044,500 | 3.12 | |||||||||
Balances, December 31, 2007 | 9,857,786 | 5.78 | |||||||||
Options cancelled and retired | (2,863,315 | ) | 6.52 | ||||||||
Options exercised | (2,310 | ) | 0.10 | $ | 2,779 | ||||||
Options granted | 1,034,000 | 1.40 | |||||||||
Balances, December 31, 2008 | 8,026,161 | $ | 4.96 | 6.8 | $ | 4,894 | |||||
Options vested and exerciseable and expected to be vested and exerciseable at December 31, 2008 | 6,911,560 | $ | 5.19 | 6.6 | $ | 4,672 | |||||
Options vested and exerciseable at December 31, 2008 | 5,398,403 | $ | 5.18 | 6.1 | $ | 4,199 | |||||
At December 31, 2008, the Company had 15,906,352 options available for grant under its option plans.
At December 31, 2008, the Company had $2.6 million of total unrecognized stock-based compensation expense, net of estimated forfeitures, related to stock options that will be recognized over the weighted average remaining period of 2.2 years. This amount excludes unrecognized stock-based compensation expense that relates to non-employee stock options.
The following table summarizes significant ranges of outstanding and exercisable options as of December 31, 2008:
| Options Outstanding | Options Vested and Exercisable | |||||||||||
Range of Exercise Prices | Number Outstanding | Weighted Average Remaining Contractual Life (in Years) | Weighted Average Exercise Price Per Share | Number Exercisable | Weighted Average Exercise Price Per Share | |||||||
$0.10 – 1.59 | 1,238,839 | 7.6 | $ | 1.39 | 583,147 | $ | 1.49 | |||||
1.63 – 2.81 | 1,000,461 | 4.9 | 1.94 | 801,056 | 1.88 | |||||||
2.95 – 2.95 | 3,070,772 | 7.3 | 2.95 | 2,374,850 | 2.95 | |||||||
3.00 – 3.13 | 1,314,063 | 8.0 | 3.09 | 579,701 | 3.10 | |||||||
3.22 – 12.4 | 1,161,711 | 5.9 | 4.41 | 854,019 | 4.80 | |||||||
14.41 – 566.25 | 239,315 | 1.9 | 71.63 | 204,630 | 58.34 | |||||||
735.00 – 735.00 | 1,000 | 0.9 | 735.00 | 1,000 | 735.00 | |||||||
Total | 8,026,161 | 6.8 | $ | 4.96 | 5,398,403 | $ | 5.18 | |||||
Employee stock-based compensation recognized in 2008, 2007 and 2006 uses the Black-Scholes option pricing model for estimating the fair value of options granted under the Company’s equity incentive plans. The weighted average assumptions that were used to calculate the grant date fair value of the Company’s employee stock option grants for the years ended December 31, 2008, 2007 and 2006 were as follows:
| Stock Options | |||||||||
| 2008 | 2007 | 2006 | |||||||
Risk-free interest rate | 2.68 | % | 4.66 | % | 4.71 | % | |||
Expected volatility | 53 | % | 51 | % | 59 | % | |||
Expected life (in years) | 5 | 5 | 5 | ||||||
Dividend yield | 0 | % | 0 | % | 0 | % | |||
Risk-free interest rates for the options were taken from the Daily Federal Yield Curve Rates on the grant dates for the expected life of the options as published by the Federal Reserve.
The expected volatility was based upon historical data and other relevant factors such as the Company’s changes in historical volatility and its capital structure in addition to mean reversion.
The forfeiture rate of employee stock options for 2008, 2007 and 2006 was calculated using the Company’s historical terminations data.
In the analysis of expected life the Company used an approach that determines the time from grant to exercise for options that have been exercised and adjusts this number for the expected time to exercise for options that have not yet been exercised. The expected time to exercise for options that have not yet been exercised is calculated from grant to the midpoint of contractual termination of the option and the later of measurement date or vesting date. All times are weighted by number of option shares in developing the expected life assumption.
The weighted-average fair value of options granted in 2008, 2007 and 2006 was $0.64, $1.51 and $1.62 per share, respectively.
No options were granted with an exercise price below the fair market value during fiscal years 2008, 2007 and 2006.
Note 8. Warrant Liability
The warrants issued to the investors in June, September and October 2005 (collectively referred to as the “Warrants”) had cash penalties for the failure to register the underlying shares of common stock. Pursuant to EITF Issue No. 00-19, “Accounting for Derivative Financial Instruments Indexed to, and Potentially Settled in, a Company’s Own Stock” (“EITF 00-19”), the Company recorded the Warrants as liabilities at their fair value using the Black-Scholes option pricing model with changes in value reported to other income or expense each period. For the years ended December 31, 2008 and 2007, there was no income or expense recorded, and for the year ended December 31, 2006 there was $774,000 recorded to other expense for the change in fair value of the Warrants.
The Warrants required physical settlement but allowed for net-share settlement if the underlying shares of common stock were not registered. A maximum of 1,914,586 shares of common stock could be issued to settle the Warrants under a net-share settlement.
As noted above in Note 7, in May 2006, the Company amended the Registration Agreement related to the Private Placements to extend the registration deadline of the shares of common stock and underlying shares of
common stock of the warrants issued to the investors. The Company amended the penalty for failure to register the underlying shares of common stock from cash to share-based payments, with a maximum limit of 59,383 penalty shares issued. Pursuant to EITF 00-19, with the elimination of these cash penalties and a maximum limit on penalty shares, the fair value of the Warrants on the date of this amendment was reclassified to equity from liability, and gains or losses recorded to account for the contract at fair value during the period that the contract was classified as a liability were not reversed.
Note 9. Restructuring Costs
As of December 31, 2008, the Company has $1.2 million in recorded restructuring liabilities related to excess leased facilities exited in 2001. The restructuring reserve was recorded pursuant to the provisions of EITF 94-3 and continues to be evaluated pursuant to the requirements thereof.
In December 2006, the Company determined that it may not be able to sublease a leased facility in Princeton, New Jersey, and changed its assumption of subleasing this excess space. The Company recorded a restructuring charge of $739,000 in the year ended December 31, 2006 mainly related to this change in estimate of sublease assumption that was not subject to any contractual arrangement. In 2006, there was also a restructuring recovery of $36,000 due to the change in estimates of termination of certain employees.
In July 2007, the Company implemented various cost reduction and restructuring activities to reduce operating costs. The expense related to the reduction in work force was approximately $240,000 and expense related to ceasing use of one of our offices was approximately $8,000.
In September 2007, the Company agreed with the landlord of one of the facilities included in the restructuring accrual to surrender the remaining term of the lease in exchange for a lump sum cash payment. As a result of this agreement, the Company recorded additional restructuring expense of approximately $319,000. The lump sum cash payment was primarily made by surrender of the existing lease deposit of approximately $2.1 million.
In March 2008, the Company was notified by the subtenant of one of the facilities included in the restructuring accrual of their intent to lease additional space and extend their sublease through the end of our lease term. As a result of this agreement, the Company recorded a restructuring recovery of approximately $482,000. The agreement was executed in May 2008.
In July 2008, the Company implemented various cost reduction and restructuring activities to reduce operating costs. The expense related to this reduction in work force was approximately $737,000 and the expense related to ceasing use of two of our offices was approximately $64,000. Additionally, the Company expensed approximately $263,000 of capitalized costs related to an internal use software project that was abandoned.
Should facilities operating lease rental rates continue to decrease in these markets or should it take longer than expected to find a suitable tenant to sublease these facilities, the actual loss could exceed this estimate. Future cash outlays are anticipated through January 2011 unless the Company negotiates to exit the leases at an earlier date. Sublease payments received were approximately $478,000, $2.0 million and $1.7 million in the years ended December 31, 2008, 2007 and 2006, respectively.
A summary of restructuring expenses, payments, and liabilities for the years ended December 31, 2006, 2007 and 2008 is as follows (in thousands):
| Facilities | Severance and Related | Internal Use Software | Total | |||||||||||||
Restructuring accrual at December 31, 2005 | $ | 7,270 | $ | 282 | $ | — | $ | 7,552 | ||||||||
Restructuring charge (recoveries) | 739 | (36 | ) | — | 703 | |||||||||||
Payments made | (3,557 | ) | (246 | ) | — | (3,803 | ) | |||||||||
Sublease payments received | 1,650 | — | — | 1,650 | ||||||||||||
Restructuring accrual at December 31, 2006 | 6,102 | — | — | 6,102 | ||||||||||||
Restructuring charge (recoveries) | 327 | 240 | — | 567 | ||||||||||||
Payments made | (5,645 | ) | (240 | ) | — | (5,885 | ) | |||||||||
Sublease payments received | 1,968 | — | — | 1,968 | ||||||||||||
Restructuring accrual at December 31, 2007 | 2,752 | — | — | 2,752 | ||||||||||||
Restructuring charge (recoveries) | (418 | ) | 737 | 263 | 582 | |||||||||||
Payments made | (1,632 | ) | (737 | ) | — | (2,369 | ) | |||||||||
Non-cash adjustment | — | — | (263 | ) | (263 | ) | ||||||||||
Sublease payments received | 478 | — | — | 478 | ||||||||||||
Restructuring accrual at December 31, 2008 | $ | 1,180 | $ | — | $ | — | $ | 1,180 | ||||||||
Note 10. Retirement Plan
The Company has a 401(k) retirement plan, which covers substantially all employees. Eligible employees may make salary deferral (before tax) contributions up to a specified amount. The Company, at its discretion, may make additional matching contributions on behalf of the participants of the retirement plan. The Company made no contributions for the years ended December 31, 2008, 2007 and 2006.
eVergance has a 401(k) retirement plan whereby the Company may voluntarily match employee contributions at 100% up to 4% of eligible salary. Since the acquisition date of June 14, 2007, the Company made contributions in the amount of $119,000 in 2008 and $52,000 in 2007.
Note 11. Income Taxes
In June 2006, the FASB issued FIN 48. FIN 48 establishes a single model to address accounting for uncertain tax positions. FIN 48 clarifies the accounting for income taxes by prescribing a minimum recognition threshold a tax position is required to meet before being recognized in the financial statements. FIN 48 also provides guidance on derecognition, measurement classification, interest and penalties, accounting in interim periods, disclosure and transition. The Company adopted FIN 48 on January 1, 2007. As a result of the implementation of FIN 48, the Company did not recognize any increase or decrease in the liability for unrecognized tax benefits. A reconciliation of the beginning and ending amount of unrecognized tax benefits, which is included in other long-term liabilities on the consolidated balance sheets, is as follows (in thousands):
Balance at January 1, 2007 | $ | 145 | ||
Additions based on tax positions related to the current year | 32 | |||
Additions for positions of prior years | — | |||
Reductions for tax positions of prior years | (32 | ) | ||
Settlements | — | |||
Balance at December 31, 2007 | $ | 145 | ||
Balance at January 1, 2008 Additions based on tax positions related to the current year Additions for positions of prior years Reductions for tax positions of prior years Settlements Balance at December 31, 2008 $ 145 26 — (51 ) — $ 120
The Company recognizes interest accrued related to unrecognized tax benefits as a component of income tax expense. During the years ended December 31, 2008, 2007, and 2006, the Company recognized approximately $(300), $16,000, and ($5,000) in interest and penalties, respectively. The Company accrued approximately $13,000 and $44,000 for the payment of interest and penalties accrued at December 31, 2008 and 2007, respectively.
The Company is subject to taxation in the United States, and various state and foreign jurisdictions. The Company is currently open to audit under the statute of limitations by the Internal Revenue Service for the years ended December 31, 1994 through December 31, 2008 and California tax authorities for the years ended December 31, 2000 through December 31, 2008 due to carryforward of unutilized net operating losses. The tax years 2004-2008 remain open to examination by most foreign taxing jurisdiction to which the Company is subject. The Company does not anticipate significant changes to its uncertain tax positions through December 31, 2009.
The components of loss before income taxes are as follows (in thousands):
| December 31, | ||||||||||||
| 2008 | 2007 | 2006 | ||||||||||
United States | $ | (4,023 | ) | $ | (7,862 | ) | $ | (2,609 | ) | |||
International | 373 | 8 | 402 | |||||||||
Total | $ | (3,650 | ) | $ | (7,854 | ) | $ | (2,207 | ) | |||
The income tax expense differs from the amount computed by applying the statutory federal rate as follows (in thousands):
| Year Ended December 31, | ||||||||||||
| 2008 | 2007 | 2006 | ||||||||||
Federal tax benefit at statutory rate | $ | (1,241 | ) | $ | (2,670 | ) | $ | (750 | ) | |||
Current year net operating losses and temporary differences, no tax benefit recognized | 569 | 2,136 | (200 | ) | ||||||||
Stock-based compensation | 463 | 493 | 253 | |||||||||
Nondeductible warrant expense | — | — | 670 | |||||||||
Other permanent differences | 209 | 41 | 27 | |||||||||
Foreign taxes | 87 | 167 | 219 | |||||||||
U.S. taxes | (82 | ) | — | — | ||||||||
Total income tax expense | $ | 5 | $ | 167 | $ | 219 | ||||||
In 2008, 2007 and 2006, certain foreign subsidiaries were profitable, based upon application of the Company’s intercompany transfer pricing agreements, which resulted in income tax expense totaling approximately $87,000, $167,000, and $219,000, respectively, in those foreign jurisdictions.
Deferred tax assets consist of the following (in thousands):
| Year Ended December 31, | ||||||||
| 2008 | 2007 | |||||||
Deferred tax assets: | ||||||||
Accruals and reserves | $ | 1,305 | $ | 1,582 | ||||
Property and equipment | 7,226 | 6,995 | ||||||
Credit carryforward | 3,481 | 2,296 | ||||||
Stock based compensation | 26,754 | 25,977 | ||||||
Other | 678 | 613 | ||||||
Net operating loss | 169,745 | 174,170 | ||||||
Gross deferred tax assets | 209,189 | 211,633 | ||||||
Valuation allowance | (209,189 | ) | (211,633 | ) | ||||
Net deferred tax assets | $ | — | $ | — | ||||
The net change in the valuation allowance for the year ended December 31, 2008 was a decrease of approximately $2.4 million mostly due to the expiration of prior net operating losses. The net change in the valuation allowance for the year ended December 31, 2007 was an increase of approximately $2.4 million due to current year losses net of the effect of the expiration of tax carryforwards and other assets. Management believes that sufficient uncertainty exists as to whether the deferred tax assets will be realized, and accordingly, a valuation allowance is required.
A portion of deferred tax assets relating to net operating losses pertain to acquired net operating loss carryforwards of approximately $8.6 million. When recognized, the tax benefit of these loss carryforwards will be accounted for as a credit to reduce goodwill or acquired intangibles, if remaining, rather than a reduction of income tax expense.
As of December 31, 2008, the Company had net operating loss carryforwards for federal and California income tax purposes of approximately $458 million and $127 million, respectively. The federal and state net operating loss carryforwards, if not offset against future taxable income, will expire by 2029. The Company also had foreign net operating loss carryforwards of approximately $8 million. The foreign losses expire at various dates and some can be carried forward indefinitely. The Company also had federal and state research credit carryforwards of approximately $2.2 million and $1.94 million, respectively. The federal credits will expire by 2029 and the state credits have no expiration.
Pursuant to the Internal Revenue Code, the amounts of and benefits from net operating loss carryforwards may be impaired or limited in certain circumstances. Events which cause limitations in the amount of net operating losses that the Company may utilize in any one year include, but are not limited to, a cumulative ownership change of more than 50% of the Company, as defined, over a three-year period. The portion of the net operating loss and tax credit carryforwards subject to potential limitation has not been included in deferred tax assets.
A portion of deferred tax assets relating to net operating losses, pertains to net operating loss carryforwards resulting from tax deductions upon the exercise of employee stock options of approximately $6.3 million. When recognized, the tax benefit of these loss carryforwards will be accounted for as a credit to additional paid-in capital rather than a reduction of the income tax expense.
The Company has deferred calculating U.S. income tax on certain foreign earnings that are deemed to be permanently reinvested overseas. Determination of the unrecognized deferred tax liability is not currently practicable and the amount is not expected to be material.
On September 30, 2008, California enacted Assembly Bill 1452 which among other provisions, suspends net operating loss deductions for 2008 and 2009 and extends the carryforward period of any net operating losses not utilized due to the suspension; adopts the federal 20-year net operating loss carryforward period; phases-in the federal two-year net operating loss carryback periods beginning in 2011 and limits the utilization of tax credits to 50% of taxpayer’s taxable income.
In addition, the Housing and Economic Recovery Act of 2008 (“Act”), signed into law in July 2008, allows taxpayers to claim refundable AMT or research and development credit carryovers if they forgo bonus depreciation on certain qualified fixed assets placed in service from the period between April and December 2008. The Company computed and recognized the credit based on fixed assets placed into service through the nine months ended December 31, 2008. The Company recorded a net tax benefit of $56,586 for a U.S. federal refundable credit as provided by the Act.
Note 12. Information About Geographic Areas
The Company considers itself to be in a single industry segment: specifically the licensing and support of its software applications. Revenue classification is based upon customer location. Geographic information on revenues for the years ended December 31, 2008, 2007, and 2006 is as follows (in thousands):
| Year Ended December 31, | |||||||||
| 2008 | 2007 | 2006 | |||||||
North America | $ | 48,785 | $ | 45,449 | $ | 36,894 | |||
Europe | 15,451 | 14,511 | 16,203 | ||||||
Asia Pacific | 983 | 834 | 933 | ||||||
Total | $ | 65,219 | $ | 60,794 | $ | 54,030 | |||
Geographic information on the Company’s long-lived assets (Property and Equipment, net, and Other Assets), based on physical location, are as follows (in thousands):
| December, 31 | ||||||
| 2008 | 2007 | |||||
United States | $ | 2,306 | $ | 2,854 | ||
International | 45 | 105 | ||||
Total | $ | 2,351 | $ | 2,959 | ||
Note 13. Fair Value Measurement—Cash and Cash Equivalents
On January 1, 2008, the Company adopted SFAS 157 which defines fair value, establishes a framework for using fair value to measure assets and liabilities, and expands disclosures about fair value measurements. SFAS 157 applies whenever other statements require or permit assets or liabilities to be measured at fair value. SFAS 157 is effective for fiscal years beginning after November 15, 2007, except for nonfinancial assets and liabilities that are recognized or disclosed at fair value in the financial statements on a nonrecurring basis, for which application has been deferred for one year by the issuance of FSP FAS 157-2.
SFAS 157 includes a fair value hierarchy that is intended to increase the consistency and comparability in fair value measurements and related disclosures. The fair value hierarchy is based on inputs to valuation techniques that are used to measure fair value that are either observable or unobservable. Observable inputs reflect assumptions market participants would use in pricing an asset or liability based on market data obtained from independent sources while unobservable inputs reflect a reporting entity’s pricing based upon their own market assumptions. The fair value hierarchy consists of the following three levels:
Level 1—instrument valuations are obtained from real-time quotes for transactions in active exchange markets involving identical assets.
Level 2—instrument valuations are obtained from readily-available pricing sources for comparable instruments.
Level 3—instrument valuations are obtained without observable market values and require a high level of judgment to determine the fair value.
The following table summarizes the Company’s financial assets and liabilities measured at fair value on a recurring basis in accordance with SFAS 157 as of December 31, 2008 (in thousands):
| Balance as of December 31, 2008 | Quoted Prices Active Markets of Identical Assets (Level 1) | |||||
Assets: | ||||||
Money market funds | $ | 4,089 | $ | 4,089 | ||
Liabilities: | $ | — | $ | — | ||
As of December 31, 2008, the Company did not have any Level 2 or Level 3 assets or liabilities.
In February 2007, the FASB issued SFAS No. 159, “The Fair Value Option for Financial Assets and Financial Liabilities” (“SFAS No. 159”), which provides companies an option to report selected financial assets and liabilities at fair value. SFAS No. 159 requires companies to provide information helping financial statement users to understand the effect of a company’s choice to use fair value on its earnings, as well as to display the fair value of the assets and liabilities a company has chosen to use fair value for on the face of the balance sheet. SFAS No. 159 was effective for fiscal years beginning after November 15, 2007. The Company adopted SFAS No. 159 in the first quarter of fiscal 2008 and did not elect the fair value option for any of its financial assets or liabilities.
Note 14. Related Party Transactions
On October 30, 2006, the Company entered into a consulting agreement (“the Consulting Agreement”) with William T. Clifford, a member of the Company’s Board of Directors. Mr. Clifford provided consulting services to the Company’s management as an independent contractor on matters pertaining to strategic planning and business (in addition to his role as a member of the Board of Directors) for a period of twelve months that commenced on January 24, 2006. During the year ended December 31, 2006, the Company recognized $59,900 of expense relating to this agreement. As of December 31, 2007, the Company had an accrued liability of $59,900 in consideration for his consulting services pursuant to the terms of the Consulting Agreement. This amount was paid during the year ended December 31, 2008.
Note 15. Subsequent Event
On May 13, 2009, the Company obtained a non-binding financing proposal from Bridge for a modification of the March Loan Facility that would provide a one-time waiver of certain financial covenants for the quarter ended March 31, 2009 and the month ended April 30, 2009. The proposal set the total loan facility amount to $6.0 million and extends the maturity date to June 30, 2010. As a requirement of the May 13, 2009 proposal from Bridge, availability under the existing revolving line of credit will be used to prepay all amounts currently outstanding under the existing term loans for equipment. Additionally, modifications would be made to the existing restrictive covenants and certain covenants related to raising additional capital would be added. This proposal is not binding, and is subject to further negotiation, to approval by the lenders’ loan committee, and execution of definitive loan documents.
| ITEM 9. | CHANGES IN AND DISAGREEMENTS WITH ACCOUNTANTS ON ACCOUNTING AND FINANCIAL DISCLOSURE |
None.
ITEM 9A(T). CONTROLS AND PROCEDURES.
Evaluation of Disclosure Controls and Procedures
Disclosure controls and procedures (as defined in Rules 13a-15(e) and 15d-15(e) under the Exchange Act) are designed to ensure that information required to be disclosed in reports filed or submitted under the Exchange Act is recorded, processed, summarized, and reported within the time periods specified in SEC rules and forms and that such information is accumulated and communicated to management, including the Chief Executive Officer and the Chief Financial Officer, to allow timely decisions regarding required disclosures.
In connection with the preparation of this report, our management, under the supervision and with the participation of the Chief Executive Officer and Chief Financial Officer, conducted an evaluation of the effectiveness of the design and operation of our disclosure controls and procedures as of the end of the period covered by this report. Based on that evaluation, our Chief Executive Officer and Chief Financial Officer have concluded that our disclosure controls and procedures were effective as of the end of the period covered by this report.
However, subsequent to December 31, 2008, we experienced a material weakness in our disclosure controls and procedures, as a result of delays in the completion of our financial statements for the year ended December 31, 2008 and the quarter ended March 31, 2009, and the preparation and filing of our Annual Report on Form 10-K for the year ended December 31, 2008 and our Quarterly Report on Form 10-Q for the quarter ended March 31, 2009.
Management’s Report on Internal Control over Financial Reporting
Our management, under the supervision of the Chief Executive Officer and the Chief Financial Officer, is responsible for establishing and maintaining adequate internal control over financial reporting. Internal control over financial reporting (as defined in Rules 13a-15(f) and 15d(f) under the Exchange Act) is a process designed to provide reasonable assurance regarding the reliability of financial reporting and the preparation of financial statements for external purposes in accordance with generally accepted accounting principles (“GAAP”). Internal control over financial reporting includes those policies and procedures which (a) pertain to the maintenance of records that, in reasonable detail, accurately and fairly reflect the transactions and dispositions of assets, (b) provide reasonable assurance that transactions are recorded as necessary to permit preparation of financial statements in accordance with GAAP, (c) provide reasonable assurance that receipts and expenditures are being made only in accordance with appropriate authorization of management and the board of directors, and (d) provide reasonable assurance regarding prevention or timely detection of unauthorized acquisition, use or disposition of assets that could have a material effect on the financial statements.
In connection with the preparation of this report, our management, under the supervision and with the participation of the Chief Executive Officer and Chief Financial Officer, conducted an evaluation of the effectiveness of our internal control over financial reporting as of the end of the period covered by this report based on the criteria established inInternal Control—Integrated Frameworkissued by the Committee of Sponsoring Organizations of the Treadway Commission (“COSO”). As a result of that evaluation, management concluded that as of December 31, 2008 our internal control over financial reporting was effective based on the criteria set forth in the COSO framework.
This Annual Report on Form 10-K does not include an attestation report of our independent registered public accounting firm regarding internal control over financial reporting. Management’s report was not subject to attestation by the Company’s registered public accounting firm pursuant to temporary rules of the Securities and Exchange Commission that permit the Company to provide only management’s report in this annual report.
Inherent Limitations over Internal Controls
Our system of controls is designed to provide reasonable, not absolute, assurance regarding the reliability and integrity of accounting and financial reporting. Our management does not expect that our disclosure controls and procedures or our internal control over financial reporting will prevent or detect all errors and fraud. A control system, no matter how well designed and operated, can provide only reasonable, not absolute, assurance that the objectives of the control system will be met. These inherent limitations include the following:
Judgments in decision-making can be faulty, and control and process breakdowns can occur because of simple errors or mistakes;
Controls can be circumvented by individuals, acting alone or in collusion with each other, or by management override;
The design of any system of controls is based in part on certain assumptions about the likelihood of future events, and there can be no assurance that any design will succeed in achieving its stated goals under all potential future conditions;
Over time, controls may become inadequate because of changes in conditions or deterioration in the degree of compliance with associated policies or procedures; and
The design of a control system must reflect the fact that resources are constrained, and the benefits of controls must be considered relative to their costs.
Because of the inherent limitations in all control systems, no evaluation of controls can provide absolute assurance that all control issues and instances of fraud, if any, have been detected.
Changes in Internal Control over Financial Reporting
As disclosed in our Annual Report on Form 10-K for the year ended December 31, 2007, during the 2007 year-end close we identified and reported a material weakness in our internal control over our period-end financial reporting. This material weakness related to our ability to maintain effective controls over the period-end reporting process, including controls with respect to the review, supervision, and monitoring of accounting operations for both domestic and international operations.
During the year ended December 31, 2008 we completed the implementation of corrective actions that we felt were necessary to remediate the internal control deficiencies identified in the prior fiscal year. These actions included (a) certain personnel actions; (b) the implementation of more rigorous period-end financial reporting policies and processes involving journal-entry approval, supporting documentation, account reconciliations, accrual review; (c) implementation of system generated controls to eliminate manual controls; and (d) increased oversight of international reporting. Based on the testing of the effectiveness of such activities, we believe that we have corrected the material weakness noted during the 2007 audit relating to the period-end financial reporting process as of December 31, 2008. However, as stated above we determined that we had a material weakness in our disclosure controls and procedures relating to the timeliness of filing our 2008 Annual Report on Form 10-K.
Except for the changes described above, there have been no changes during the Company’s fiscal quarter ended December 31, 2008 in our internal control over financial reporting that have materially affected, or are reasonably likely to materially affect, our internal control over financial reporting.
| ITEM 9B. | OTHER INFORMATION. |
Not applicable.
| ITEM 10. | DIRECTORS, EXECUTIVE OFFICERS AND CORPORATE GOVERNANCE. |
Board of Directors
Our Board of Directors currently consists of five (5) directors and is divided into three classesInformation with staggered three-year terms. The names of our directors and certain biographical information about each, including their ages, as of March 31, 2008, are set forth below:
|
| |||
| ||||
| ||||
| ||||
| ||||
| ||||
Michael S. Fields. Mr. Fields joined our Board of Directors in June 2005 and since July 2005, has been serving as our Chairman of the Board of Directors. From July 2005respect to August 2005, Mr. Fields served as our acting President. In August 2005, Mr. Fields was appointed as our Chief Executive Officer. Mr. Fields was Chairman and Chief Executive Officer of The Fields Group, a venture capital and management consulting firm, from May 1997 to December 2005. In June 1992, Mr. Fields founded OpenVision Technologies, Inc., a supplier of computer systems management applications for open client/server computing environments, and served as its Chief Executive Officer from July 1992 to July 1995 and Chairman of its Board of Directors from July 1992 to April 1997. Prior to these positions, Mr. Fields served as President at Oracle U.S.A., Inc., and managed sales organizations at Applied Data Research and Burroughs Corporation. Mr. Fields also serves on the Board of Directors of Imation Corporation and two privately-held companies, ViaNovus, Inc. and Crucian Global Services, Inc. Mr. Fields is a Class III Director whose current term expires at this year’s annual meeting of stockholders.
Jerry R. Batt. Mr. Batt joined our Board of Directors in August 2003. Mr. Batt has served as Vice President and Chief Information Officer of Pulte Homes, Inc., a national home building and construction company, since September 2003. From July 2001 to February 2003, Mr. Batt was Chief Information Officer and Vice President of Sprint PCS, a communications company. From April 2000 to July 2001, Mr. Batt co-founded and was Chief Executive Officer of Foxfire Consulting, an IT consulting and systems integration firm specializingitem may be found in the telecommunications industry. From 1973 to January 2000, Mr. Batt held various positions at AT&T, a communications company, where he was responsible for consumer long distance account management and billing and customer service platforms. Mr. Batt holds B.S. degrees in Industrial Engineering and Operations Research from Virginia Tech University. Mr. Batt is a Class II Director whose current term expires at the annual meetingsections captioned “Executive Officers,” “Proposal One—Election of stockholders to be held in 2010.
William T. Clifford. Mr. Clifford joined our Board of Directors in December 2005. Since August 2005, Mr. Clifford has served as Chairman of the Board of Directors and Chief Executive Officer of Aperture Technologies, Inc., a data center management software solutions company. He served on the Board of Directors of Aperture Technologies, Inc. from 2003 until his appointment as Chairman of the Board of Directors and Chief Executive Officer in August 2005. From 2001 to 2003, Mr. Clifford served as a General Partner of The Fields Group. From 1993 to 2000, Mr. Clifford served as President and Chief Executive Officer of Gartner Group, Inc., an information technology research and market company. Prior to these positions, Mr. Clifford was President of the Central and National Account divisions and Corporate Vice President, Information Systems Development at Automatic Data Processing, Inc., a transaction processing and data communication services company. Mr. Clifford holds a B.A. degree in Economics from the University of Connecticut. Mr. Clifford also serves on the Board of Directors of two privately-held companies, ViaNovus, Inc. and GridApp, Inc. Mr. Clifford is a Class II Director whose current term expires at the annual meeting of stockholders to be held in 2010.
John F. Nemelka. Mr. Nemelka joined our Board of Directors in October 2005. Mr. Nemelka founded NightWatch Capital Group, LLC, an investment management business, and has served as its Managing Principal since its incorporation in July 2001. From 1997 to 2000, Mr. Nemelka was a Principal at Graham Partners, a private investment firm and affiliate of the privately-held Graham
Group. From 2000 to 2001, Mr. Nemelka was a Consultant to the Graham Group. Mr. Nemelka holds a B.S. degree in Business Administration from Brigham Young University and an M.B.A. degree from the Wharton School at the University of Pennsylvania. Mr. Nemelka also serves on the Board of Directors of a privately-held company, SanuWave, Inc. Mr. Nemelka is a Class III Director whose current term expires at this year’s annual meeting of stockholders.
Stephanie Vinella. Ms. Vinella joined our Board of Directors in November 2004. Since November 2007, Ms. Vinella has served as Chief Financial Officer of Panasas, Inc., a computer hardware company. From January 2005 to September 2007, Ms. Vinella served as Chief Financial Officer of Nextance Inc., a provider of enterprise contract management solutions. From November 1999 to August 2004, Ms. Vinella served as Chief Financial Officer of AlphaBlox Corporation, a business analytic software company. From 1990 to 1999, Ms. Vinella served as Chief Financial Officer of Edify Corporation, a software company. Ms. Vinella holds a B.S. degree in Accounting from the University of San Francisco and an M.B.A. degree from Stanford University. Ms. Vinella is a Class I Director whose current term expires at the annual meetingDirectors,” “Code of stockholders to be held in 2009.
Executive Officers
The names of our current executive officersEthics and certain biographical information about each, including their ages, as of March 31, 2008, are set forth below:
|
| |||
| ||||
| ||||
| ||||
| ||||
| ||||
| ||||
| ||||
| ||||
| ||||
| ||||
Michael S. Fields.Mr. Fields’ biographical information appears above, under “Board of Directors.”
Michael J. Shannahan.Since March 2008, Mr. Shannahan has served as our Executive Vice PresidentConduct” and Chief Financial Officer. Mr. Shannahan was a member of our Board of Directors from June 2005 to March 2008. From February 2005 to February 2008, Mr. Shannahan served as Chief Financial Officer of Medsphere Systems Corporation, a software company in the healthcare industry. Mr. Shannahan also has served as Chief Financial Officer of Chordiant Software, Inc., a management software company, from October 2003 to September 2004; Sanctum Inc., a web applications security company, from October 2001 to November 2002; Broadband Office, Inc., a communication services company, from January 2001 to September 2001; and mySimon, Inc., an e-commerce company from August 1999 to January 2001. Prior to these positions, Mr. Shannahan spent 18 years with KPMG Peat Marwick, an accounting firm, as a Partner in the Information, Communication and Entertainment practice. Mr. Shannahan holds a B.S. degree in Business Administration with a concentration in Accounting and a B.A. degree from Rockhurst College. Mr. Shannahan also serves on the Board of Directors of Critical Path, Inc.
Mark A. Angel. Since May 2007, Mr. Angel has served as our Senior Vice President of Corporate Development and Strategy. Prior to joining KANA, from January 1998 to March 2007, he served as Chief Technology Officer of KNOVA Software Inc., a service resolution management software company that is now a division of Consona Corporation. Prior to KNOVA, Mr. Angel founded and served as Chief Executive Officer of Papyrus Technology, which was acquired by Ernst & Young, in 1997 and Kanisa Inc., which was acquired by ServiceWare Technologies, Inc. in 2005. Mr. Angel has served on the Board of Directors of Avidence, Inc., a private company, since May 2006.
William A. Bose. Mr. Bose has served as our Vice President and General Counsel since August 2006. Mr. Bose served in a number of legal positions at KANA from September 1999 to August 2006. Mr. Bose holds a B.A. degree from the University of California at Santa Barbara and a J.D. degree from Santa Clara University School of Law. Mr. Bose is a member of the California Bar.
Marchai B. Bruchey. Since September 2005, Ms. Bruchey has served as our Senior Vice President and Chief Marketing Officer with responsibility for global marketing and strategic alliances. Ms. Bruchey joined KANA in January 1998 as our Senior Vice President of Strategic Alliances and served in this role until September 2005. Prior to joining KANA, Ms. Bruchey spent 18 years with Digital Equipment Corporation, a computer manufacturing company, where she held positions in sales, sales management, alliances and alliances management. Ms. Bruchey holds a B.S. degree in Finance and Marketing from Queens College.
Sham Chotai. Since June 2007, Mr. Chotai has served as our Senior Vice President of Engineering. From April 2006 to March 2007, Mr. Chotai served as Vice President of Engineering at KNOVA Software, Inc. Mr. Chotai co-founded DecisionView Software, Inc., an analytics technology company, in October 2002, and served as Chief Technology Officer of DecisionView Software, Inc. from October 2002 until October 2005. Mr. Chotai holds a B.A.Sc. degree in Electrical Engineering from the University of Toronto, with a specialty in adaptive/intelligent control systems.
Charles H. Isaacs. Since August 2004, Mr. Isaacs has served as our Chief Technology Officer. From December 1999 to August 2004, Mr. Isaacs served as the Chief Technology Officer of Primus Knowledge Solutions, an enterprise software company, where he was responsible for technology oversight. Mr. Isaacs holds a B.S. degree in Electrical Engineering from the University of California at Santa Barbara and an M.B.A. degree from California Lutheran University.
Jay A. Jones. Since September 2006, Mr. Jones has served as our Senior Vice President and Chief Administrative Officer. Mr. Jones served as Senior Vice President, Chief Information Officer of VERITAS Software Corporation, an enterprise storage and performance company, from September 2004 to December 2005. From January 1999 to September 2004, Mr. Jones served as Chief Administrative Officer of VERITAS Software Corporation, and from March 1993 to January 1999, he served as Vice President, General Counsel and Secretary of VERITAS Software Corporation and OpenVision Technologies, Inc., which was acquired by VERITAS Software Corporation. Prior to OpenVision Technologies, Inc., Mr. Jones was senior corporate counsel for Oracle Corporation. Mr. Jones holds a B.S. degree in architecture from Howard University, an M.S. degree in City Planning from the University of California at Berkeley and a J.D. degree from the University of California at Berkeley. Mr. Jones is a member of the California Bar.
Daniel A. Turano. Since July 2007, Mr. Turano has served as our Senior Vice President, Worldwide Field Operations. Mr. Turano joined KANA in August 2006 as our Vice President, Global Financial Services Solutions and served in that position until his promotion to Senior Vice President, Worldwide Field Operations in July 2007. From March 2005 to August 2006, Mr. Turano served as the Vice President of Sales, East of ClairMail, Inc., a software and wireless communications company. From September 2003 to March 2005, Mr. Turano served as Senior Vice President, Commercial Account Collections of Intellerisk Management Systems, a collections agency. Mr. Turano previously served as the Executive Vice President, Sales and Field Operations of Dynamic Mobile Data, a software and wireless communications company from September 2002 to September 2003. Mr. Turano has also served on the Board of Directors of The Advisory Council, a private company, since January 2003. Mr. Turano holds a B.S. degree in Business Management from Saint Peter’s College and an M.B.A. degree in Marketing from Fairleigh Dickenson University.
Chad A. Wolf. Since June 2007, Mr. Wolf has served as our Corporate Vice President and President of eVergance Partners LLC, a management consulting and systems integration company acquired by KANA in June 2007. From August 2002 to June 2007 Mr. Wolf served as President of eVergance Partners LLC. Mr. Wolf holds an M.S. degree in Industrial Engineering and Operations Management from Kansas State University and a B.S. degree in Industrial Engineering.
Section“Section 16(a) Beneficial Ownership Reporting Compliance
The members of our Board of Directors, our executive officers and persons who hold more than 10% of our outstanding common stock are subjectCompliance” appearing in the definitive Proxy Statement to the reporting requirements of Section 16(a) of the Securities Exchange Act of 1934, as amended (the “Exchange Act”), which requires thembe delivered to file reports with respect to their ownership of our common stock and their transactionsstockholders in such common stock. Based solely on our review of reporting forms filed by our directors, executive officers and persons who hold more than 10% of our outstanding common stock, we believe that during 2007 such persons filed the reports required under Section 16(a) of the Exchange Act on a timely basis,connection with the exception2009 Annual Meeting of a late Form 4 filed for Daniel A. Turano on September 18, 2007 to report the grant to Mr. Turano of an option to purchase 90,000 shares of our common stock on September 13, 2007.
Code of EthicsStockholders. This information is incorporated herein by reference.
Our Board of Directors has adopted a Code of Ethics and Conduct applicable to all of our directors, officers and employees, as required by applicable securities laws and the rules of the United States Securities and Exchange Commission (the “SEC”)SEC and listing standards of The NASDAQ Stock Market. A copy of theour Code of Ethics and Conduct is posted in the Corporate Governance section of our Internet website at www.kana.com under “InvestorInvestor Relations.”
Procedures by Which Security Holders May Recommend Nominees to the Board of Directors
There has been no material change by which the Governance and Nominating Committee will consider stockholder recommendations for director candidates. The Governance and Nominating Committee has established the following procedure for stockholders to submit such recommendations: the stockholder should send the name of the individual and related personal and professional information, including a list of references, to our Governance and Nominating Committee, in care of the Corporate Secretary at our principal executive office, sufficiently in advance of the annual meeting to allow the Governance and Nominating Committee appropriate time to consider the recommendation.
Audit Committee
We have a separately-designated standing Audit Committee of the Board of Directors established in accordance with Rule 10A-3 promulgated under the Exchange Act, which is currently comprised of Ms. Vinella and Mr. Clifford, each of whom meets the independence and other requirements to serve on our Audit Committee under applicable securities laws and the rules of the SEC and listing standards of The NASDAQ Stock Market. Our Board of Directors has determined that Ms. Vinella is an “audit committee financial expert” as defined in the rules of the SEC.
| ITEM 11. | EXECUTIVE COMPENSATION. |
COMPENSATION DISCUSSIONAND ANALYSIS
Compensation Philosophy and Objectives
Our executive compensation philosophy reflects our belief in a “pay for performance” model that is intendedInformation with respect to closely align our executive officers’ compensation with our performance on both a near- and long-term basis, which we believe can lead to increased stockholder value. Our executive compensation program aims to create value for our stockholders through the attraction, retention and motivation of a superior leadership team. We believe that the skills, experience and dedication of our executive officers are critical factors that contribute directly to our operating results. As a result, our executive compensation program is designed to attract individuals who have the skills to achieve our strategic goals, to reward those individuals fairly over time, to retain those individuals who continue to perform at or above the levels that we expect, and to encourage those individuals’ innovation and promote accountability for our performance.
Our executive compensation program currently has four primary elements: (i) base salary, (ii) cash incentives awarded over the near term under a performance-based, non-equity incentive plan, (iii) equity-based long-term incentives awarded under our equity incentive plans, and (iv) other benefits, which include benefits that are available generally to all salaried employees. We have not adopted any formal or informal policies or guidelines for allocating compensation between near- and long-term compensation and between cash and equity compensation. We seek to offer total compensation that is competitive with the compensation offered by companies with which we compete for executive talent in order to recruit and retain our executive officers. In addition, we believe that a mix of both cash and equity incentives is appropriate, as competitive cash incentives reward executive officers in the near term for achieving strategic goals and equity incentives motivate executive officers to achieve strategic goals over the longer term through the imposition of vesting conditions, which also promotes retention over a multi-year period.
The executive officers listed in the Summary Compensation Table, whose compensation is discussed in this Compensation Discussion and Analysis, are referred to as our “named executive officers.” For fiscal year 2007, our named executive officers are our Chief Executive Officer, Michael S. Fields, our former Chief Financial Officer, John M. Thompson, who retired from this position in February 2008, the three most highly compensated executive officers for 2007, Marchai B. Bruchey, Jay A. Jones and Daniel A. Turano, and our former Senior Vice President, Global Sales and Service, William A. Rowe, for whom disclosure would have been provided as one of the three most highly compensated executive officers for 2007 but for the fact that he was not serving as an executive officer on December 31, 2007.
On February 28, 2008, we entered into an employment offer letter with Michael J. Shannahan, who began serving as our Chief Financial Officer as of March 2008. Our compensation arrangement with Mr. Shannahan is describeditem may be found in the section “Material Terms of Employment Agreements” below that follows the Grants of Plan-Based Awards table.
How Executivecaptioned “Executive Compensation Is Set
Our Board of Directors has delegated to the Compensation Committee primary authority to develop our executive compensation philosophy and to administer the executive compensation program that implements our philosophy. The Compensation Committee is composed of three non-employee members of our Board of Directors, all of whom are independent under the standards established by the NASDAQ Stock Market.
Each year, the Compensation Committee reviews, recommends, and approves the mix of compensation elements and compensation levels for each of our executive officers. To evaluate whether the balance between the different elements of compensation and overall compensation levels for our executive officers are competitive enough to further our goals of attracting, retaining and incentivizing a superior leadership team, the Compensation Committee reviews and analyzes the compensation practices of comparable companies with which we generally compete for hiring executives. For 2007, the Compensation Committee engaged Compensia, Inc. (“Compensia”), an outside compensation consulting firm that focuses primarily on technology companies, to assist with its review and analysis of comparable company compensation practices. Compensia collected market survey data on the compensation practices of comparable companies, performed an analysis of those compensation practices and provided recommendations to the Compensation Committee regarding our executive compensation program and suggested compensation level adjustments.
Our Compensation Committee uses the data provided by Compensia as one of several factors in its decisions regarding executive officer compensation. The Compensation Committee gives weight to many other factors, including, but not limited to:
the scope of the executive officers’ responsibilities;
the executive officer’s performance measured against strategic goals established for that individual;
our past and current business performance and future expectations;
our long-term goals and strategies;
for each executive officer, other than our Chief Executive Officer, the evaluation and recommendation of our Chief Executive Officer;
relative pay levels among the executive officers;
the amount of base salaryRelated Information” appearing in the context of the executive officer’s total compensation and other benefits;
the balance between performance-based cash incentives and the other elements of the executive officer’s total compensation;
the balance between equity-based incentives and the other elements of the executive officer’s total compensation.
The performance-based, cash incentive compensation plan approved by our Compensation Committee in 2007 and described in the section “The Executive Compensation Plan” below, reflects input from certain executive officers, including our Chief Executive Officer, former Executive Vice President and Chief Financial Officer, current Senior Vice President and Chief Administrative Officer and Vice President and General Counsel.
The Elements of Executive Compensation
For 2007, the elements of compensation for our named executive officers were:
base salary;
cash incentives;
equity-based long-term incentives; and
other benefits.
Our Compensation Committee reviews each of the above compensation elements, as well as the overall compensation for each named executive officer.
Base Salary
We seek to provide our executive officers with a base salary that is appropriate for their roles and responsibilities and that provides them with a level of income stability. We utilize salary as the base amount necessary to retain executive talent and fix base compensation at a level we believe enables us to hire and retain individuals in our environment and to reward satisfactory individual performance and a satisfactory level of contribution to our overall business goals.
The Compensation Committee reviews base salaries annually and adjusts them from time to time in light of our financial performance, market conditions, a desire to achieve internal pay equity and individual factors including responsibilities, qualitative performance, experience, and salary history. The Compensation Committee also utilizes executive compensation salary benchmark data for the Bay Area originally compiled by Radford Surveys + Consulting, and provided to us by Compensia, when adjusting the base salary of our named executive officers to ensure that they remain competitive with market practices.
In 2007, the Compensation Committee approved base salary increases for Messrs. Thompson, Rowe and Jones of $15,000, $75,000, and $15,000, respectively. The base salary increases were intended to align the named executive officers’ base salaries more closely with competitive practices and, in the case of Mr. Rowe, as a result of his increased worldwide responsibilities in 2007. In addition, our Compensation Committee approved a base salary increase for Mr. Turano of $70,000 in conjunction with his promotion to the position of Senior Vice President, Worldwide Field Operations in July 2007 when he replaced Mr. Rowe. At that time, Mr. Rowe’s salary returned to its pre-increase level. The salaries earned by our named executive officers in 2007 are listed below in the Summary Compensation Table.
Cash Incentives
The Executive Compensation Plan
In 2006 we created, and our Compensation Committee approved, a performance-based, non-equity incentive compensation plan to encourage our executive officers to reach our goals of increasing profit and operating at sustainable profit and cash levels (the “Executive Compensation Plan”). These objectives are designed to advance our strategic business goals, enhance profitability and increase stockholder value. The 2007 Executive Compensation Plan, which was discussed by the Compensation Committee in April and June 2007 and later approved in October 2007, awarded cash incentives to our executive officers based on:
our achievement of annual and quarterly profit targets;
our achievement of annual and quarterly revenue targets;
our achievement of quarterly positive cash from operations targets; and
their quarterly achievement of individualized personal objectives.
Recognizing the continued importance of expanding our cash reserves, the 2007 Executive Compensation Plan also awarded our executive officers with a special cash bonus if we achieved non-GAAP net profits that were 10% or more above the quarterly and annual targets.
The corporate financial performance targets in the 2007 Executive Compensation Plan were defined (i) for profit, as the quarterly and annual non-GAAP net profit targets in our 2007 budget, as approved by our Board of Directors, which excludes certain non-cash expenses such as stock-based compensation expense and warrant liability expense; (ii) for revenue, as the quarterly and annual total revenue targets in our 2007 budget; and (iii) for positive cash from operations, as the growth in quarter-ending net cash (gross cash and cash equivalents less any draw down on the bank line of credit for operating uses) from the preceding quarter. The Compensation Committee believed that the 2007 corporate financial performance targets were sufficiently challenging to achieve because they represented a significant profit, revenue growth and cash increases compared to our performance in 2006. The Compensation Committee also acknowledged that the performance targets addressed the areas of improvement that we needed to focus on and were allocated according to importance by business area.
Mr. Rowe did not participate in the 2007 Executive Compensation Plan because he stepped down from his position prior to the Compensation Committee’s approval of the plan in October 2007. Therefore, solely for purposes of the discussion of our 2007 Executive Compensation Plan below, Mr. Rowe is not one of the “named executive officers” being discussed. In addition, although Mr. Turano participated in our 2007 Executive Compensation Plan, his cash incentive compensation plan is not based on our achievement of positive cash from operations targets or individualized personal objectives. His cash incentive compensation plan is described in the section “Commission Plan” below.
The individualized personal objectives or management by objectives (“MBO”) component of our 2007 Executive Compensation Plan established quarterly operational objectives for our each of our named executive officers, except for Mr. Turano, who does not have an MBO component as part of his compensation plan. The individualized objectives were set on a quarterly basis by Mr. Fields and approved by our Compensation Committee. Typically, each named executive officer has three to five MBO targets in any quarterly period that are tailored to suit the executive officer’s specific position and responsibilities and designed to further our operational goals. In 2007, the MBO targets for Mr. Fields included setting the quarterly MBO targets for our other executive officers, completing our acquisition of eVergance Partners LLC and analyzing and improving our business plan for 2007. The MBO targets for Mr. Thompson included management of his area of responsibility and the completion of a registered direct offering of 4.0 million shares of our common stock during 2007. The MBO targets for Ms. Bruchey included operational objectives within her area of responsibility including lead generation and other contributions to sales efforts and the development of our marketing plan. The MBO targets for Mr. Jones included the implementation of an internal business management system and new hire recruiting program, and managing the integration of various departments of eVergance Partners LLC after the completion of the acquisition.
Under the 2007 Executive Compensation Plan, if we had achieved 100% of the quarterly and annual profit and revenue targets and quarterly positive cash from operations targets, and each named executive officer that had an MBO component had achieved his or her quarterly MBO targets, then our named executive officers would have received a fixed, minimum cash incentive award that was equal to a certain percentage of his or her individual annual base salary (the “Base Bonus Amount”). The percentage of each named executive officer’s annual base salary that constituted the Base Bonus Amount was based on the named executive officer’s experience, position and responsibilities and our annual financial and strategic goals. The Base Bonus Amount for each of our named executive officers and the percentage that the Base Bonus Amount reflected of the named executive officer’s base salary is set forth in the table below.
For 2007, the Compensation Committee approved a Base Bonus Amount for Mr. Fields that equaled his 2006 Base Bonus Amount and approved increases to the Base Bonus Amounts for Mr. Thompson, Mr. Jones, and Ms. Bruchey in the amounts of $8,000, $20,000, and $50,000, respectively. These increases were intended to align their cash incentive levels more closely with competitive practices. In addition, the Compensation Committee reviewed and approved a Base Bonus Amount for Mr. Turano in conjunction with his promotion to the position. His eligibility for the Base Bonus Amount commenced on July 1, 2007 at the beginning of our third fiscal quarter.
Name Position Michael S. Fields John M. Thompson Marchai B. Bruchey Jay A. Jones Daniel A. Turano William A. Rowe Base Bonus
Amount As a
Percentage
of Salary Chief Executive Officer $ 234,000 65% Former Executive Vice President and Chief Financial Officer $ 125,000 50% Senior Vice President and Chief Marketing Officer $ 200,000 100% Senior Vice President and Chief Administrative Officer $ 125,000 56% Senior Vice President, Worldwide Field Operations $ 225,000 100% Former Senior Vice President, Global Sales and Service n/a n/a
The allocation of the 2007 Executive Compensation Plan’s performance targets within each of our named executive officer’s Base Bonus Amounts differed according to the named executive officer’s experience, position and responsibilities. The table below sets forth the respective allocations for each of our named executive officers.
| Base Bonus Amount | ||||||||||||
Name | Position | Profit Target | Revenue Target | Positive Cash from Operations Target | MBO Target | Total | ||||||
Michael S. Fields | Chief Executive Officer | 50% | 25% | 10% | 15% | 100% | ||||||
John M. Thompson | Former Executive Vice President and Chief Financial Officer | 50% | 25% | 10% | 15% | 100% | ||||||
Marchai B. Bruchey | Senior Vice President and Chief Marketing Officer | 25% | 50% | 10% | 15% | 100% | ||||||
Jay A. Jones | Senior Vice President and Chief Administrative Officer | 50% | 25% | 10% | 15% | 100% | ||||||
Daniel A. Turano (1) | Senior Vice President, Worldwide Field Operations | 25% | 75% | n/a | n/a | 100% | ||||||
William A. Rowe (2) | Former Senior Vice President, Global Sales and Service | n/a | n/a | n/a | n/a | n/a | ||||||
Once the Base Bonus Amount was allocated among the four performance targets under our 2007 Executive Compensation Plan, the performance targets were allocated quarterly and annually, as applicable. The table below provides the quarterly and annual allocations for each of the performance targets, with the exception of the revenue targets for Mr. Turano, which are described in the section “Commission Plan” below. If we had achieved 100% of the quarterly and annual profit and revenue targets and quarterly positive cash from operations targets, and each named executive had achieved his or her MBO targets, then each named executive officer would have been entitled received the percentage of his or her Base Bonus Amount that was allocated to the achievement of the particular performance target. For example, if we had achieved 100% of our profit target for the first quarter of 2007, then Mr. Fields would have been entitled to receive 12.5% of the 50% of his Base Bonus Amount that was allocated to achievement of the profit target, or $14,625.
Performance Targets Profit Revenue Positive Cash from Operations MBO Quarterly and Annual Allocations for Each Performance Target Q1 Q2 Q3 Q4 Annual Total 12.5% 12.5% 12.5% 12.5% 50% 100% 15% 15% 15% 15% 40% 100% 25% 25% 25% 25% n/a 100% 25% 25% 25% 25% n/a 100%
In addition, if we had achieved more than 10% of our quarterly and annual profit targets, the 2007 Executive Compensation Plan provided for an additional cash bonusdefinitive Proxy Statement to be paiddelivered to each of our named executive officers that was not included within their Base Bonus Amounts. An additional 5% of the portion of each named executive officer’s Base Bonus Amount that was allocated to achievement of profit targets could have been paid at the end of each quarter for each increment of 10% by which our quarterly profit exceeded the 2007 Executive Compensation Plan’s quarterly profit target. For example, if we had exceeded our quarterly profit target by 20% in the first quarter, the additional cash bonus awarded to Mr. Fields in the first quarter would have been equal to 10% of $117,000, which was the portion of Mr. Fields’ Base Bonus Amount that was allocated to the achievement of our profit target, or $11,700. The 5% multiplier was capped at 15% per quarter for each named executive officer. An additional 10% of the portion of each named executive officer’s Base Bonus Amount that was allocated to achievement of profit targets could have been paid at the end of the year for each increment of 10% by which our annual profit exceeded the 2007 Executive Compensation Plan’s annual profit target. The 10% multiplier was capped at 60% for the year for each named executive officer. Mr. Turano was not eligible for this additional cash bonus award.
In order for our named executive officers to have received cash incentive awards under the 2007 Executive Compensation Plan, our performance must have met or exceeded the quarterly and annual profit and revenue targets and quarterly cash from operations targets. In certain rare cases, our named executive officers may receive a portion of their MBO bonus award even though they do not meet their MBO targets. In 2007, we did not achieve our profit, revenue or cash from operations targets in any quarter or at year-end. Therefore, none of our named executive officers were awarded that portion of their Base Bonus Amounts that was attributable to our achievement of financial performance targets. All of the named executive officers with quarterly MBO targets met those targets during each quarter of 2007 and was awarded 100% of the portion of each of their Base Bonus Amounts that was allocated to achievement of MBO targets. Mr. Fields earned $35,100 with payment of $8,775 occurring in 2008, Mr. Thompson earned $18,750 with payment of $4,688 occurring in 2008, Mr. Jones earned $18,750 with payment of $4,688 occurring in 2008, and Ms. Bruchey earned $30,000 with payment of $7,500 occurring in 2008.
Commission Plan
Unlike our other named executive officers, Mr. Turano earns up to 75% of his Base Bonus Amount as commissions on revenue based on our achievement of annual revenue targets within three of our operating units: (i) license and OnDemand, (ii) maintenance, and (iii) professional services. The annual revenue targets for these operating units under the 2007 Executive Compensation Plan were the same as the annual operating unit revenue targets contained in our 2007 budget, as approved by our Board of Directors. For achievement of 100% of the annual license and OnDemand, maintenance and service revenue targets, Mr. Turano would receive a cash commission equal to 65%, 15% and 20%, respectively, of that portion of his Base Bonus Award that is allocated to achievement of annual revenue targets. The remaining 25% of his Base Bonus Amount is based on our achievement of quarterly and annual profit targets and is subject to the quarterly and annual allocations set forth in the table above. In addition, Mr. Turano could have earned one and a half times his commissions-based earnings if our annual license revenue had exceeded the revenue target by 100% and twice his commissions-based earnings if our annual license revenue had exceeded the revenue target by 150%. Mr. Turano did not receive that portion of his Base Bonus Amount that was allocated to our achievement of the profit target because we did not reach that target in 2007, nor did Mr. Turano earn a multiple on his commissions-based earnings in 2007.
2007 Merit Review and Compensation Plan
During 2007 and continuing into 2008, the Compensation Committee and Mr. Jones reviewed and refined a merit-based compensation program (the “Merit Plan”) and compensation leveling for the Merit Plan (with input from Compensia as well as research from Radford Compensation Surveys). The Merit Plan will be a performance-based, incentive plan that includes a component for an increase in compensation of up to a maximum of 4% based on performance. The Merit Plan could also include equity awards based on performance. We anticipate compensating our executive officers under the Merit Plan in 2008.
Equity-Based Long-Term Incentives
We grant equity incentives to our executive officers in several forms, including stock options, performance-based stock options and restricted stock to assist in their retention, to motivate them to assist us with the achievement of certain corporate financial and operational goals and to align their interests with those of our stockholders by providing them with an equity stake in our company. Because our executive officers are awarded stock options with an exercise price equal to at least 100% of the fair market value of our common stock on the date of grant, options will have value to our executive officers only if the market price of our common stock increases after the date of grant.
We maintain the KANA 1997 Stock Option Plan, the KANA 1999 Stock Incentive Plan, the KANA 1999 Special Stock Option Plan and equity compensation plans assumed pursuant to acquisitions of certain companies. We may grant several different forms of equity awards under the KANA 1999 Stock Incentive Plan. In 2007, we only granted stock options to our named executive officers and granted them from the KANA 1999 Stock Incentive Plan. Stock options are typically granted to executive officers when they first join us or in connection with a significant change in responsibilities. We may also grant refresh stock options annually based on merit and performance. The Compensation Committee is responsible for approving equity grants to our executive officers, including option grants for new hires and refresh option grants. New hire stock option grants typically provide for vesting over a four-year period with a six-month cliff, generally expire ten years from the date of grant and vary in amount based on the discretion of the Compensation Committee. When granting stock options to our executive officers, the Compensation Committee considers factors such as the executive officer’s position with, past performance, anticipated future contributions and prior stock option grants. The Compensation Committee also consults with Compensia and looks to option grant levels for comparable positions at other companies with which we compete for executive talent when determining the appropriate amount of stock options to grant our executive officers.
We have implemented a standardized program for the grant date of stock options. If there are stock option grants to consider, then on Monday of the second full week of each month, William A. Bose, our Vice President and General Counsel, provides Michael Shannahan, our Chief Financial Officer, with an initial option grant list for his review and approval. Upon approval by Mr. Shannahan, the option grant list is provided to the Compensation Committee for their review and approval. The Compensation Committee then reviews the proposed stock option grants and renders a recommendation and approval, generally on the Thursday of such week, with the exercise price of the stock options being the closing price of our common stock on the date of grant. Grants to newly-hired employees are made as of their employment start date and grants made in connection with promotions of current employees are made as of the date that the promotion is approved. We do not time our stock option grants in coordination with the release of material non-public information.
In 2007, the Compensation Committee approved of a stock option award to Mr. Turano to purchase 90,000 shares of our common stock and a stock option award to Mr. Rowe to purchase 100,000 shares of our common stock in connection with each of their promotions, increased worldwide responsibilities in 2007 and the performance of our sales and service organizations during 2006. Messrs. Thompson and Jones and Ms. Bruchey were each granted an option to purchase 30,000 shares of our common stock in connection with the strength of our operating results during fiscal year 2006 and our annual merit-based performance reviews.
Other Benefits
401(k) Retirement Plan
We have a 401(k) retirement plan, which covers substantially all employees. Eligible employees may make salary deferral (before tax) contributions up to a specified amount. We may, in our discretion, make additional matching contributions on behalf of the participants of the retirement plan, but have not, thus far, elected to make any matching contributions.
Benefit Programs
We offer the named executive officers a range of benefits including life, medical, dental, vision and disability programs in the geographical location where they are based. In providing these benefit programs, we aim to provide an attractive set of benefits, while managing business costs.
Perquisites
We do not typically offer cash or non-cash perquisites to our named executive officers that are not available to other employees. On June 18, 2007, we entered into a corporate housing arrangement with Mr. Fields. We agreed to pay the security deposit and monthly rent payments on his behalf in connection with corporate housing in Northern California. Mr. Fields is responsible for all lease payments upon a voluntarily termination of employment with us and also is responsible for reimbursing us for any amounts that are billed for property damage caused during his tenancy. The security deposit for the corporate housing was $6,000 and the monthly payments, which began in July 2007, were approximately $5,500 per month. During 2007, we paid a total of $25,687 for Mr. Fields’ corporate housing. These payments were made in lieu of any base salary increase for Mr. Fields in 2007. Other than this commitment, during 2007, we did not provide any special benefits or perquisites to any named executive officer that exceeded $10,000; however, in the future, there may be times when a specific situation requires additional compensation to be given to a named executive officer that exceeds $10,000.
Ownership Guidelines
To date, we have not adopted stock ownership guidelines. However, we, in conjunction with our Compensation Committee and Compensia, continue to develop and consider the implementation of stock ownership guidelines. The Compensation Committee believes that stock ownership guidelines would further align the interests of our executive officers with those of our stockholders by requiring certain executive officers to maintain a minimum ownership interest in our company.
Severance and Change in Control
The severance and change in control arrangements that we have in place with our executive officers are designed to attract and retain executive officers in a marketplace where such protections are commonly offered. The severance arrangements are designed to ease an executive officer’s transition due to an unexpected termination of employment for on-going changes in our employment needs, while the change in control arrangements promote the ability of our executive officers to act in the best
interest of our stockholders without regard to their job position in the event of a potential change in control. A description of the specific severance and change in control arrangements that we have in place with our named executive officers is described below in the sections “Material Terms of Employment Offer Letters” and “Potential Payments Upon Termination or Change in Control.”
During 2007, the Compensation Committee, with Compensia’s assistance, reviewed, analyzed and approved of a proposal to adopt a standard set of terms for the severance and change in control agreements to be entered into with newly hired executive officers of our company. The Compensation Committee considered our current severance and change in control arrangements and their cost, the severance and change in control practices at companies with which we compete for executive talent and recommendations from Compensia when making its decision. Subject to the Compensation Committee’s review and approval, the severance and change in control agreements will provide our executive officers with a severance payment equal to six months base salary, six months of COBRA coverage and full acceleration of any then-outstanding and unvested equity awards upon an executive officer’s termination without cause or voluntary termination for good reason. If the executive officer’s termination without cause or voluntary termination for good reason occurs within the three months prior to or twelve months following a change in control, then the executive officer will be entitled to receive a severance payment equal to nine months base salary, nine months of COBRA coverage and full acceleration of all current and future equity awards. In addition, each agreement would contain a “best choice” 280G provision, that would allow the executive officer to be paid benefits in an amount that would result in the best after-tax result for the executive officer after giving effect to any “parachute taxes” under Section 280G of the Internal Revenue Code. We have not yet finalized, nor has the Compensation Committee approved, a form of severance and change in control agreement. Therefore, to date, we have not yet entered into any such agreements with our executive officers.
Tax and Accounting Implications
As part of its role, the Compensation Committee reviews and considers the deductibility of executive compensation under Section 162(m) of the Internal Revenue Code, which provides that we may not deduct compensation of more than $1.0 million that is paid to our principal executive officer and our next three most highly compensated executive officers other than our principal financial officer in a taxable year. We believe that compensation paid under our executive compensation programs is generally fully deductible for federal income tax purposes. However, deductibility is not the sole factor used by the Compensation Committee in ascertaining appropriate levels or manner of compensation and corporate objectives may not align with the requirements for full deductibility under Section 162(m). Accordingly, in certain situations, the Compensation Committee may approve and we may enter into compensation arrangements that will not meet these requirements in order to ensure competitive levels of total compensation for its executive officers.
Our stock option grant policies have been affected by the implementation of Statement of Financial Accounting Standards No. 123 (revised 2004),Share Based Payment, (“SFAS No. 123(R)”) which we adopted in the first quarter of fiscal year 2006 using the modified prospective method as permitted by the pronouncement. Under this transition method, we are required to value all stock-based compensation awards granted prior to but not yet vested as of December 31, 2005 based on the grant date fair value estimated in accordance with the original provisions of SFAS No. 123(R), as adjusted for estimated forfeitures.
Compensation Committee Interlocks and Insider Participation
The current members of our Compensation Committee are Messrs. Batt, Clifford and Nemelka. No member of our Compensation Committee was at any time during 2007 an officer or employee of KANA. No member of our Compensation Committee was formerly an officer of KANA. No executive officer of KANA serves as a member of the Board of Directors or Compensation Committee of any entity that has one or more of our executive officers serving as a member of our Board or Compensation Committee.
Compensation Committee Report
Our Compensation Committee has reviewed and discussed the Compensation Discussion and Analysis required by Item 402(b) of Regulation S-K with management and, based on such review and discussions, the Compensation Committee recommended to the Board of Directors that the Compensation Discussion and Analysis be included in our Annual Report on Form 10-K for fiscal year ended December 31, 2007 and the definitive proxy statement for our 20082009 Annual Meeting of Stockholders.
2007 SUMMARY COMPENSATION TABLE
The table below summarizes the total compensation earned This information is incorporated herein by each of the named executive officers for the fiscal years ended December 31, 2006 and 2007.reference.
Name and Principal Position | Year | Base Salary | Option Awards (1) | Non-Equity Incentive Plan Compensation (2) | All Other Compensation (3) | Total | |||||||||||||
Michael S. Fields (4) | 2007 | $ | 360,000 | $ | 588,876 | $ | 35,100 | $ | 25,687 | $ | 1,009,663 | ||||||||
| 2006 | $ | 360,000 | $ | 1,022,237 | $ | 455,715 | (5) | $ | — | $ | 1,837,952 | ||||||||
John M. Thompson (6) | 2007 | $ | 250,000 | $ | 110,173 | $ | 18,750 | $ | — | $ | 378,923 | ||||||||
| 2006 | $ | 235,000 | $ | 146,050 | $ | 227,858 | (5) | $ | — | $ | 608,908 | ||||||||
Marchai B. Bruchey (7) | 2007 | $ | 200,000 | $ | 86,220 | $ | 30,000 | $ | — | $ | 316,220 | ||||||||
Jay A. Jones | 2007 | $ | 225,000 | $ | 93,330 | $ | 18,750 | $ | — | $ | 337,080 | ||||||||
| 2006 | $ | 68,519 | (8) | $ | 26,154 | $ | 43,313 | (5) | $ | — | $ | 137,986 | |||||||
Daniel A. Turano (7) | 2007 | $ | 202,500 | (9) | $ | 82,067 | $ | 129,236 | (10) | $ | — | $ | 413,803 | ||||||
William A. Rowe | 2007 | $ | 217,917 | (11) | $ | 141,229 | $ | 124,382 | (12) | $ | — | $ | 483,528 | ||||||
| 2006 | $ | 167,708 | $ | 65,870 | $ | 302,593 | (13) | $ | — | $ | 536,171 | ||||||||
2007 GRANTSOF PLAN-BASED AWARDS
Name | Grant Date | Estimated Possible Payouts Under Non-Equity Incentive Plan Awards | All Other Option Awards: Number of Securities Underlying Options (1) | Exercise or Base Price of Option Awards | Grant Date Fair Value of Stock and Option Awards (2) | ||||||||||||||
| Threshold | Target | Max | |||||||||||||||||
Michael S. Fields | $ | 0 | $ | 234,000 | $ | 374,400 | |||||||||||||
John M. Thompson | $ | 0 | $ | 125,000 | $ | 200,000 | |||||||||||||
| 2/1/2007 | 30,000 | $ | 3.10 | $ | 46,113 | ||||||||||||||
Marchai B. Bruchey | $ | 0 | $ | 200,000 | $ | 260,000 | |||||||||||||
| 2/1/2007 | 30,000 | $ | 3.10 | $ | 46,113 | ||||||||||||||
Jay A. Jones | $ | 0 | $ | 125,000 | $ | 200,000 | |||||||||||||
| 2/1/2007 | 30,000 | $ | 3.10 | $ | 46,113 | ||||||||||||||
Daniel A. Turano | $ | 0 | $ | 225,000 | $ | 450,000 | |||||||||||||
| 9/13/2007 | 90,000 | $ | 3.00 | $ | 122,688 | ||||||||||||||
William A. Rowe (3) | $ | 0 | $ | 0 | $ | 0 | |||||||||||||
| 2/1/2007 | 100,000 | $ | 3.10 | $ | 153,710 | ||||||||||||||
Material Terms of Employment Offer Letters
Michael S.Fields. In November 2005, we formally entered into an employment offer letter with Mr. Fields for the position of Chief Executive Officer and Chairman of the Board of Directors, effective as of August 26, 2005. Pursuant to the terms of the employment offer letter, if Mr. Fields is terminated for any reason other than cause, then we will pay him an amount equal to six months of his annual base salary, as in effect at the time of termination. In addition, if a change in control of 50% or more of our outstanding stock occurs, and if, following the change in control, Mr. Fields is not offered a position at the combined entity similar to the one he held prior to the change in control, then 100% of the unvested shares underlying the initial options granted to Mr. Fields in connection with his appointment as our Chief Executive Officer shall immediately vest. We were unable to award Mr. Fields with an initial stock option grant until September 2006, as a result of a delay in the filing of our periodic and annual reports with the SEC. In September 2006, our Compensation Committee granted Mr. Fields options to purchase an aggregate of 1,389,939 shares of our common stock. Of the 1,389,939 shares of common stock underlying the options, 384,000 shares became fully-vested on August 26, 2007 and 1,005,939 shares vested as to 12.5% on February 26, 2006 with the remainder of the 1,005,939 shares vesting in 42 equal monthly installments until fully vested on August 26, 2009.
John M. Thompson. In October 2004, we entered into an employment offer letter with Mr. Thompson, pursuant to which, Mr. Thompson was granted an option to purchase 350,000 shares of our common stock subject to full acceleration of vesting if a change in control of 50% or more of our outstanding stock occurs, and if, following the change in control, Mr. Thompson is not offered a position at the combined entity similar to the one he held prior to the change in control. The option to purchase 350,000 shares of our common stock vested as to 12.5% of the shares on April 18, 2005, with the remainder of the shares vesting in 42 equal monthly installments until fully vested on October 18, 2008.
Michael J. Shannahan. In February 2008, we entered into an employment offer letter with Mr. Shannahan in connection with his appointment as our Executive Vice President and Chief Financial Officer. Pursuant to the terms of the employment offer letter, we agreed to pay Mr. Shannahan an annual base salary of $275,000 and a one time, non-refundable sign-on bonus of $11,458.33. In addition, Mr. Shannahan is eligible for annual cash incentive award of up to $137,500, prorated to the length of Mr. Shannahan’s service in 2008, and based upon his achievement of individual objectives and our achievement of financial performance targets in 2008, to be set forth in an incentive bonus plan that is subject to the Compensation Committee’s approval. In connection with his employment with us, the Compensation Committee granted Mr. Shannahan an option to purchase 350,000 shares of our common stock on March 13, 2008, at an exercise price equal to the fair market value of our common stock on the date of grant. 25% of the shares underlying the option will vest on August 29, 2008, with the remainder of the shares vesting in 42 equal monthly installments until fully vested on February 29, 2012, subject to Mr. Shannahan’s continuous employment with us.
In addition, if a Change in Control Event occurs (as defined below), then the initial option grant to Mr. Shannahan will fully vest and Mr. Shannahan will receive a lump-sum separation payment equal to six months annual base salary. If Mr. Shannahan is terminated without Cause (as defined below) in the absence of a Change in Control Event then he will be entitled to a lump-sum separation payment of six months annual base salary with no acceleration of vesting of the initial option grant. Mr. Shannahan is not entitled to severance or change in control benefits if his employment is terminated for Cause.
For purposes of Mr. Shannahan’s offer letter and Ms. Bruchey’s offer letter described below, a “Change in Control Event” occurs if, following a change in control of 50% or more of our outstanding stock, Mr. Shannahan or Ms. Bruchey is not offered the same or a similar position with the combined entity as the one s/he held prior to the change in control, or if s/he is terminated without Cause within six months of the change in control.
For purposes of Messrs. Shannahan’s and Rowe’s and Ms. Bruchey’s offer letters, termination for “Cause” exists if one or more of the following events occurs: (i) gross negligence or willful misconduct in the performance of, or failure or refusal to perform their duties with KANA, as determined in good faith by our Board of Directors; (ii) unprofessional, unethical or fraudulent conduct or conduct that discredits us or is detrimental to our reputation, character or standing; (iii) dishonest conduct or a deliberate attempt to injure KANA; (iv) breach of their Invention Assignment and Confidentiality Agreements, and/or duty of confidentiality to us, including, without limitation the theft, misappropriation and/or misuse of our proprietary information; (v) failure or refusal to comply in any material respect with the reasonable policies, standards or regulations of KANA; (vi) any unlawful or criminal act which would reflect badly on us in our reasonable judgment; (vii) absence from work without an approved leave; or (viii) death.
Marchai B. Bruchey. In February 2008, we entered into a letter agreement to amend Ms. Bruchey’s offer letter dated December 15, 2000 (the “amendment agreement”) to provide Ms. Bruchey with severance and change in control benefits. Pursuant to the terms of the amendment agreement, if a Change in Control Event occurs, or Ms. Bruchey is terminated without Cause, then Ms. Bruchey shall receive a lump-sum separation payment of six months annual base salary. The amendment agreement also provides that any unvested shares underlying the initial options granted to Ms. Bruchey pursuant to her offer letter shall fully vest upon a Change in Control Event. As of December 31, 2007, Ms. Bruchey’s initial option grants were fully vested.
Jay A. Jones. In August 2006, we entered into an employment offer letter with Mr. Jones. Pursuant to the terms of Mr. Jones’ offer letter, the Compensation Committee granted Mr. Jones an option to purchase 200,000 shares of our common stock. In addition, we agreed to enter into a Change in Control Agreement with Mr. Jones, which, to date, has not been entered into yet. The Change in Control Agreement will provide Mr. Jones with six months accelerated vesting of any unvested shares subject to Mr. Jones’ initial option grant to purchase 200,000 shares of our common stock and separation pay equal to six months of Mr. Jones’ annual base salary to be paid over a six-month period upon the occurrence of a Change in Control Event.
A “Change in Control Event,” as defined in Messrs. Jones’, Turano’s and Rowe’s offer letters, means a change in control of 50% or more of our outstanding stock and, following which, they are not offered the same or a similar position at the combined entity as the position that they held prior to the change in control.
Daniel A. Turano. In July 2006, we entered into an employment offer letter with Mr. Turano. Pursuant to the terms of Mr. Turano’s offer letter, the Compensation Committee granted Mr. Turano an option to purchase 100,000 shares of our common stock. In addition, we agreed to enter into a Change in Control Agreement with Mr. Turano, which, to date, has not been entered into yet. The Change in Control Agreement will provide Mr. Turano with six months accelerated vesting of any unvested shares subject to Mr. Turano’s initial option grant to purchase 100,000 shares of our common stock and separation pay equal to six months of Mr. Turano’s annual base salary to be paid over a six-month period upon the occurrence of a Change in Control Event.
The “Potential Payments Upon Termination or Change in Control” table below reflects the amounts that Mr. Jones and Mr. Turano would receive upon the occurrence of a Change in Control Event based on the terms promised to them in their offer letters.
William A. Rowe. In January 2006, we entered into an employment offer letter with Mr. Rowe. Pursuant to the terms of Mr. Rowe’s offer letter, the Compensation Committee granted Mr. Rowe an option to purchase 100,000 shares of our common stock. Upon the occurrence of a Change in Control Event, Mr. Rowe’s initial option grant is subject to full acceleration of any unvested shares and Mr. Rowe is entitled to separation pay of four months annual base salary. In the event Mr. Rowe is terminated without Cause then Mr. Rowe’s initial option grant is subject to four months acceleration of any unvested shares and Mr. Rowe is entitled to separation pay of four months of annual base salary to be paid over a period of four months.
OUTSTANDING EQUITY AWARDSAT FISCAL YEAR ENDED DECEMBER 31, 2007
Name | Number of Securities Underlying Unexercised Options (#) Exercisable | Number of Securities Underlying Unexercised Options (#) Unexercisable | Option Exercise Price ($) | Option Expiration Date | ||||||||
Michael S. Fields | 384,000 | * | — | $ | 2.95 | 9/7/2016 | ||||||
| 586,798 | 419,141 | (1) | 2.95 | 9/7/2016 | ||||||||
John M. Thompson | 237,084 | 72,916 | (2) | 1.73 | 10/17/2014 | |||||||
| 12,031 | 5,469 | (3) | 1.591 | 3/1/2015 | ||||||||
| 15,600 | * | — | 1.87 | (4) | 3/23/2015 | |||||||
| 29,167 | 40,833 | (5) | 2.95 | 9/7/2016 | ||||||||
| 6,875 | 23,125 | (6) | 3.10 | 1/31/2017 | ||||||||
Marchai B. Bruchey | 2,322 | * | — | 6.67 | 12/18/2009 | |||||||
| 3,744 | * | — | 8.76 | 4/10/2011 | ||||||||
| 5,250 | * | — | 18.76 | 6/27/2011 | ||||||||
| 1,875 | * | — | 0.10 | 10/11/2011 | ||||||||
| 25,000 | * | — | 14.41 | 12/12/2011 | ||||||||
| 3,000 | * | — | 9.48 | 4/29/2012 | ||||||||
| 750 | * | — | 1.63 | 7/30/2012 | ||||||||
| 10,000 | * | — | 3.32 | 1/19/2013 | ||||||||
| 45,833 | 4,167 | (7) | 3.38 | 4/26/2014 | ||||||||
| 68,750 | 31,250 | (3) | 1.591 | 3/1/2015 | ||||||||
| 24,600 | * | — | 1.87 | (4) | 3/23/2015 | |||||||
| 41,667 | 58,333 | (5) | 2.95 | 9/6/2016 | ||||||||
| 6,875 | 23,125 | (6) | 3.10 | 1/31/2017 | ||||||||
Jay A. Jones | 62,500 | 137,500 | (8) | 2.95 | 9/7/2016 | |||||||
| 6,875 | 23,125 | (6) | 3.10 | 1/31/2017 | ||||||||
Daniel A. Turano | 56,250 | 123,750 | (9) | 2.95 | 9/7/2016 | |||||||
| 5,625 | 84,375 | (10) | 3.00 | 9/12/2017 | ||||||||
William A. Rowe | 31,250 | 68,750 | (11) | 2.95 | 9/7/2016 | |||||||
| 20,833 | 29,167 | (5) | 2.95 | 9/7/2016 | ||||||||
| 47,917 | 52,083 | (12) | 2.95 | 9/7/2016 | ||||||||
| 22,917 | 77,083 | (6) | 3.10 | 1/31/2017 | ||||||||
|
|
|
|
|
|
|
|
|
|
|
|
|
|
|
|
|
|
|
|
|
|
2007 OPTIONS EXERCISESAND STOCK VESTED
The following table shows the number of shares acquired pursuant to the exercise of options by each named executive officer during our fiscal year ended December 31, 2007 and the aggregate dollar amount realized by the named executive officer upon exercise of the option:
| Option Awards | |||||
Name | Number��of Shares Acquired on Exercise (#) | Value Realized on Exercise($) | |||
Michael S. Fields | — | — | |||
John M. Thompson | 40,000 | $ | 30,800 | ||
Marchai Bruchey | — | — | |||
Jay A. Jones | — | — | |||
Daniel A. Turano | — | — | |||
William A. Rowe | — | — | |||
Potential Payments Upon Termination or Change in Control
Pursuant to the terms of our named executive officers’ employment offer letters, as described in more detail above, in the section “Material Terms of Employment Offer Letters,” certain of the stock options held by certain of our named executive officers provide for acceleration of vesting and exercisability with respect to unvested shares upon a change in control and if that named executive officer is not offered a similar or same position in the combined entity. The following table summarizes the potential payments and benefits payable to each of our named executive officers upon termination of employment or a change in control under each situation listed below, assuming, in each situation, that our named executive officers were terminated on December 31, 2007 and the price per share of our common stock was $2.40, the closing price of our common stock on December 29, 2007, which was the last trading day for our common stock in 2007. The amounts shown do not include the value of payments or benefits that would have been earned, or any amounts associated with equity awards that would have vested absent the triggering event.
None of our named executive officers would be entitled to the separation benefits listed in the event of a voluntary termination or termination for cause, death or disability.
| No Change in Control | Following Change in Control | |||||
Executive Benefits and Payments Upon Termination | Termination Other Than for Cause | Termination Other Than for Cause | ||||
Michael S. Fields | ||||||
Base Salary | $ | 180,000 | $ | 180,000 | ||
Bonus | — | — | ||||
Medical continuation | — | — | ||||
Value of Accelerated Stock Options | — | — | ||||
John M. Thompson | ||||||
Base Salary | $ | — | $ | — | ||
Bonus | — | — | ||||
Medical continuation | — | — | ||||
Value of Accelerated Stock Options | — | 48,854 | ||||
Marchai B. Bruchey | ||||||
Base Salary | $ | 100,000 | $ | 100,000 | ||
Bonus | — | — | ||||
Medical continuation | — | — | ||||
Value of Accelerated Stock Options | — | — | ||||
Jay A. Jones | ||||||
Base Salary | $ | — | $ | 112,500 | ||
Bonus | — | — | ||||
Medical continuation | — | — | ||||
Value of Accelerated Stock Options | — | — | ||||
Daniel A. Turano | ||||||
Base Salary | $ | — | $ | 101,250 | ||
Bonus | — | — | ||||
Medical continuation | — | — | ||||
Value of Accelerated Stock Options | — | — | ||||
William A. Rowe | ||||||
Base Salary | $ | 83,334 | $ | 83,334 | ||
Bonus | — | — | ||||
Medical continuation | — | — | ||||
Value of Accelerated Stock Options | — | — | ||||
Compensation for Directors
In 2007, we paid each of our non-employee directors (i) an annual fee of $10,000 and (ii) an additional $2,500 for each of the four regularly scheduled Board of Directors meetings that such director attended. We paid the chairperson of the Audit Committee an additional $15,000 and the chairpersons of the Compensation Committee and the Governance and Nominating Committee an additional $5,000.
Our non-employee directors are eligible to receive discretionary stock option grants and stock issuances pursuant to the KANA 1999 Stock Incentive Plan, as amended. When a non-employee director is first elected or appointed as a member of the Board of Directors, he or she is automatically granted a stock option grant to purchase 40,000 shares of common stock. On the date of each annual stockholders meeting, each continuing non-employee director will automatically be granted a stock option grant to purchase 10,000 shares of common stock, provided that such director has served as a non-employee director for at least six months. The non-employee directors are also eligible to receive other types of awards under the KANA 1999 Stock Incentive Plan, as amended, that are discretionary and not automatic. All options granted to non-employee directors will have an exercise price equal to the current fair market value of our common stock on the date of the grant, and will be nonqualified stock options. In the event of a merger or sale of substantially all of our assets in connection with the liquidation or dissolution of our company, all of the shares subject to the automatic initial and annual stock option grants will accelerate and become exercisable in full.
We reimburse our directors for reasonable travel and other expenses incurred in connection with attending the meetings of the Board of Directors.
DIRECTOR COMPENSATIONFOR 2007
The table below summarizes the compensation that we paid our non–employee directors for the ended December 31, 2007:
Name (1) | Fees Earned or Paid in Cash | Option Awards (2) | Total | ||||||
Jerry R. Batt | $ | 25,000 | $ | 44,572 | $ | 69,572 | |||
William T. Clifford | $ | 25,000 | $ | 57,756 | $ | 82,756 | |||
Dixie L. Mills (3) | $ | 25,000 | $ | 26,959 | $ | 51,959 | |||
John F. Nemelka | $ | 20,000 | $ | 45,637 | $ | 65,637 | |||
Michael J. Shannahan (4) | $ | 35,000 | $ | 57,424 | $ | 92,424 | |||
Stephanie Vinella | $ | 20,000 | $ | 54,918 | $ | 74,918 | |||
The aggregate number of option awards outstanding for each of our non-employee directors as of December 31, 2007 is provided in the table below:
| ||
| ||
| ||
| ||
| ||
|
| ITEM 12. | SECURITY OWNERSHIP OF CERTAIN BENEFICIAL OWNERS AND MANAGEMENT AND RELATED STOCKHOLDER MATTERS. |
The table below sets forth information regarding the beneficial ownership of our common stock as of March 31, 2008, by the following individuals or groups:
each person or entity who is known by us to own beneficially more than five percent of our outstanding stock;
each of our named executive officers;
each of our directors; and
all current directors and executive officers as a group.
Beneficial ownership is determined under the rules of the SEC and generally includes voting or investment powerInformation with respect to securities. Applicable percentage ownershipthis item may be found in the following table is based on 41,212,578 sharessections captioned “Security Ownership of common stock outstanding as of March 31, 2008, as adjusted to include optionsCertain Beneficial Owners and warrants exercisable within 60 days of March 31, 2008 held by the indicated stockholder or stockholders.
Unless otherwise indicated, the principal address of each of the stockholders below is c/o Kana Software, Inc., 181 Constitution Drive, Menlo Park, CA 94025. Except as otherwise indicated,Management,” “Executive Compensation and subject to applicable community property laws, the persons namedRelated Information” and “Equity Compensation Plan Information” appearing in the table below have sole voting and investment power with respectdefinitive Proxy Statement to all shares of common stock held by them. To determine the number of shares beneficially owned by persons other than our directors, executive officers and their affiliates, we have relied on beneficial ownership reports filed by such personsbe delivered to stockholders in connection with the SEC.2009 Annual Meeting of Stockholders. This information is incorporated herein by reference.
Name and Address of Beneficial Owner | Number of Shares Beneficially Owned | Percentage of Shares Beneficially Owned (%) | |||
Executive Officers and Directors: | |||||
Michael S. Fields (1) | 1,075,583 | 2.5 | % | ||
Michael J. Shannahan | — | * | |||
Daniel A. Turano (2) | 90,000 | * | |||
Marchai B. Bruchey (3) | 267,791 | * | |||
Jay A. Jones (4) | 93,125 | * | |||
Jerry R. Batt (5) | 150,000 | * | |||
William T. Clifford (6) | 60,000 | * | |||
John F. Nemelka (7) | 7,957,725 | 19.3 | % | ||
Stephanie Vinella (8) | 122,762 | * | |||
All 14 current directors and executive officers as a group (9) | 10,229,235 | 23.5 | % | ||
5% Stockholders: | |||||
NightWatch Capital Management, LLC (10) | 7,912,725 | 19.2 | % | ||
Empire Capital Partners, L.P. (11) | 2,784,441 | 6.8 | % | ||
Equity Compensation Plan Information
We maintain the KANA 1999 Stock Incentive Plan, as amended (the “1999 Stock Incentive Plan”), which has been approved by our stockholders, and the KANA 1997 Stock Option Plan (the “1997 Stock Option Plan”), the KANA 1999 Special Stock Option Plan (the “1999 Special Stock Option Plan”) and equity compensation plans assumed by us pursuant to acquisitions of certain companies described further below, which have not been approved by our stockholders.
Securities Authorized for Issuance Under Equity Compensation Plans
The following table summarizes our equity compensation plans as of December 31, 2007:
| Plan category | Number of securities to be issued upon exercise of outstanding options, warrants and rights | Weighted- average exercise price of outstanding options, warrants and rights | Number of securities remaining available for future issuance under equity compensation plans (excluding securities reflected in column (a)) | ||||
| (a) | (b) | (c) | |||||
Equity compensation plans approved by security holders (1) (3) | 7,020,401 | $ | 4.40 | 822,386 | |||
Equity compensation plans not approved by security holders (2) (3) | 50,373 | $ | 150.45 | — | |||
Total | 7,070,774 | $ | 5.44 | 822,386 | |||
Equity Compensation Plans Not Approved By Stockholders
KANA 1997 Stock Option Plan. Our 1997 Stock Option Plan provides for stock options to be granted to employees, independent contractors, officers and directors. Options are generally granted at an exercise price equivalent to the estimated fair market value per share at the date of grant, as determined by our Board of Directors. All options are granted at the discretion of our Board of Directors and have a term not greater than 10 years from the date of grant. Options are immediately exercisable and generally vest over four years, 25% one year after the grant date and the remainder at a rate of 1/36 per month thereafter. All outstanding options under our 1997 Stock Option Plan were transferred to the 1999 Stock Incentive Plan, and no further option grants will be made or were made under the 1997 Stock Option Plan after such transfer. The transferred options will continue to be governed by their existing terms, unless the Compensation Committee decides to extend one or more features of the 1999 Stock Incentive Plan to those options.
KANA 1999 Special Stock Option Plan. In December 1999, our Board of Directors approved the 1999 Special Stock Option Plan and 1,000,000 shares of common stock were reserved for issuance under this plan. The 1999 Special Stock Option Plan has similar terms as those of the 1997 Stock Option Plan, except that options may be granted with an exercise price less than, equal to or greater than the fair market value of the option shares on the grant date.
| ITEM 13. | CERTAIN RELATIONSHIPS AND RELATED TRANSACTIONS, AND DIRECTOR INDEPENDENCE. |
CertainInformation with respect to this item may be found in the section captioned “Certain Relationships and Related Person Transactions
Our Audit Committee is responsible for the review, approval or ratification of “related-person transactions” between KANA or its subsidiaries and related persons. Other than the compensation arrangements that are described above in “Material Terms of Employment Agreements” and “Potential Payments Upon Termination or Change in Control,” since January 1, 2007, there have not been, and there are not currently proposed, any transactions or series of similar transactions in which we were or will be a participant in which the amount involved exceeded or will exceed $120,000 and in which any director, executive officer, holder of 5% or more of any class of our capital stock or any member of the immediate family of any of the foregoing persons had or will have a direct or indirect material interest.
In 2007, the daughter of Mr. Fields, our Chief Executive Officer, provided corporate paralegal services to KANA as an independent contractor and received total compensation of $152,562 for her services during the year, calculatedDirector Independence” appearing in the same manner asdefinitive Proxy Statement to be delivered to stockholders in connection with the compensation reported for our named executive officers in the Summary Compensation Table. The $152, 562 consisted2009 Annual Meeting of $130,000 in annual base salary, $15,000 earned as variable compensation upon achievement of personal objectives during each quarter of 2007, and $7,562 in stock-based compensation expense, excluding estimated forfeitures for service-based vesting, that was recognized for financial reporting purposes in accordance with SFAS No. 123(R).
Independence of the Board of Directors
Our Board of Directors has determined, after considering all the relevant facts and circumstances, that each of Messrs. Batt, Clifford and Nemelka and Ms. Vinella are independent directors, as “independence”Stockholders. This information is defined in the marketplace rules of The NASDAQ Stock Market.incorporated herein by reference.
| ITEM 14. | PRINCIPAL ACCOUNTANT FEES AND SERVICES. |
Fiscal 2007Information with respect to this item may be found in the section captioned “Principal Accountant Fees and 2006 Audit Firm Fee Summary
Burr, Pilger & Mayer LLP (“BPM”) has served as our current independent registered public accounting firm and audited our consolidated financial statements forServices” appearing in the years ended December 31, 2006 and 2007. Set forth below are the aggregated fees (in thousands) billed for the services of BPM from January 1, 2006 through December 31, 2007.
| Year Ended December 31, | ||||||
| 2007 | 2006 | |||||
Audit fees (1) | $ | 972 | $ | 479 | ||
Audit-related fees (2) | 22 | — | ||||
Tax fees | — | — | ||||
All other fees: | ||||||
Total fees | $ | 994 | $ | 479 | ||
Our Audit Committee considers at least annually whether the provision of non-audit services by our independent registered public accounting firm is compatible with maintaining auditor independence. This process includes:
Obtaining and reviewing, on at least an annual basis, a letter from the independent registered public accounting firm describing all relationships between the independent registered public accounting firm and the Company requireddefinitive Proxy Statement to be disclosed by Independence Standards Board Standard No. 1, reviewing the nature and scope of such relationships, discussing these relationshipsdelivered to stockholders in connection with the independent registered public accounting firm and discontinuing any relationships that the Audit Committee believes could compromise the independence2009 Annual Meeting of the registered public accounting firm.
Obtaining reports of all non-audit services proposed to be performedStockholders. This information is incorporated herein by the independent registered public accounting firm before such services are performed, reviewing and approving or prohibiting, as appropriate, any non-audit services not permitted by applicable law. The Audit Committee may delegate authority to review and approve or prohibit non-audit services to one or more members of the Audit Committee, and direct that any approval so granted be reported to the Audit Committee at a following meeting of the Audit Committee.
All services provided by the Company’s independent registered public accounting firm in fiscal years 2006 and 2007 were approved in advance by the Audit Committee.
Audit Committee Pre-Approval Policies and Procedures
All audit and permitted non-audit services to be performed for the Company by its independent registered public accounting firm must be pre-approved by the Audit Committee to assure that the provision of such services do not impair the firm’s independence. The Audit Committee does not delegate its responsibility to pre-approve services performed by the independent auditors to management.
The annual audit services engagement terms and fees are subject to the specific pre-approval of the Audit Committee. The Audit Committee will approve, if necessary, any changes in terms, conditions and fees resulting from changes in audit scope or other matters. All other audit services not otherwise included in the annual audit services engagement must be specifically pre-approved by the Audit Committee.reference.
| ITEM 15. | EXHIBITS AND FINANCIAL STATEMENT SCHEDULES. |
(a) The following documents are filed as part of this Report:
1. Financial Statements:
2. Financial Statement Schedules:
Schedule | Title | Page | ||
| II | Valuation and Qualifying Accounts | 89 |
Schedules not listed above have been omitted because they are not applicable, not required, or the information required to be set forth therein is included in the consolidated financial statements or notes thereto.
3. Exhibits:
| Incorporated by Reference | ||||||||||||
Exhibit Number | Exhibit Description | Form | File No. | Exhibit | Filing Date | Filed Herewith | ||||||
3.01 | Second Amended and Restated Certificate of Incorporation, as amended by the Certificate of Amendment dated April 18, 2000. | 8-K | 000-27163 | 3.1 | 5/4/00 | |||||||
3.02 | Certificate of Amendment to the Second Amended and Restated Certificate of Incorporation dated April 18, 2001. | S-8 | 333-64552 | 4.02 | 7/3/01 | |||||||
3.03 | Certificate of Amendment to the Second Amended and Restated Certificate of Incorporation filed on December 11, 2001. | S-3 | 333-77068 | 4.03 | 1/18/02 | |||||||
3.04 | Certificate of Amendment to the Second Amended and Restated Certificate of Incorporation dated November 21, 2005. | 8-A | 000-27163 | 3.04 | 1/31/06 | |||||||
3.05 | Amended and Restated Bylaws, as amended October 12, 2001. | 10-K | 000-27163 | 3.05 | 3/28/03 | |||||||
3.06 | Certificate of Designation of Series A Junior Participating Preferred Stock, as filed with the Secretary of State of Delaware on January 27, 2006. | 8-K | 000-27163 | 3.01 | 1/31/06 | |||||||
4.01 | Form of Specimen Common Stock Certificate. | S-1/A | 333-82587 | 4.01 | 9/21/99 | |||||||
4.02 | Form of Rights Certificate. | 8-K | 000-27163 | 4.01 | 1/31/06 | |||||||
4.03 | Rights Agreement, dated as of January 26, 2006, by and between Kana Software, Inc. and U.S. Stock Transfer Corporation. | 8-K | 000-27163 | 4.02 | 1/31/06 | |||||||
10.01 | Kana Software, Inc. 1999 Stock Incentive Plan, as amended.** | 10-Q | 000-27163 | 10.01 | 11/14/06 | |||||||
10.02 | Kana Software, Inc. 1999 Employee Stock Purchase Plan, as amended.** | S-4/A | 333-59754 | 10.23 | 5/18/01 | |||||||
10.03 | Kana Software, Inc. 1999 Special Stock Option Plan.** | S-8 | 333-32460 | 99.01 | 3/14/00 | |||||||
10.04 | Kana Software, Inc. 1999 Special Stock Option Plan—Form of Nonstatutory Stock Option Agreement—4-year vesting.** | S-8 | 333-32460 | 99.02 | 3/14/00 | |||||||
10.05 | Kana Software, Inc. 1999 Special Stock Option Plan—Form of Nonstatutory Stock Option Agreement—30-month vesting.** | S-8 | 333-32460 | 99.03 | 3/14/00 | |||||||
10.06 | Broadbase Software, Inc. 2000 Stock Incentive Plan, as amended.**± | 10-Q | 000-27163 | 10.02 | 11/14/06 | |||||||
10.07 | Broadbase Software, Inc. 2000 Stock Incentive Plan, as amended, related forms of agreements.**± | S-8 | 333-38480 | 4.09 | 6/02/00 | |||||||
10.08 | Broadbase Software, Inc. 1999 Equity Incentive Plan, as amended November 2, 2000.**± | S-4/A | 333-4896 | 4.09 | 11/09/00 | |||||||
10.09 | Kana Software, Inc. 1997 Stock Option Plan.** | S-1 | 333-82587 | 10.1 | 7/09/97 | |||||||
10.10 | Lease Agreement, dated December 23, 1999, between Broadbase Software, Inc. and Bohannon Trusts Partnership II.± | 10-Q | 000-27163 | 10.03 | 5/11/00 | |||||||
10.11 | Lease Agreement, dated August 11, 2000, between Broadbase Software, Inc. and J. Robert S. Wheatley and Roger A. Fields, d.b.a. R & R Properties.± | 10-Q | 000-27163 | 10.4 | 11/13/00 | |||||||
10.12 | Assignment Agreement and First Amendment of Lease dated November 11, 2002 between the Registrant and J. Robert S. Wheatley and Roger A. Fields, d.b.a. R & R Properties. | 8-K | 000-27163 | 99.1 | 11/21/02 | |||||||
| Incorporated by Reference | ||||||||||||
Exhibit Number | Exhibit Description | Form | File No. | Exhibit | Filing Date | Filed Herewith | ||||||
| 3.01 | Second Amended and Restated Certificate of Incorporation, as amended by the Certificate of Amendment dated April 18, 2000. | 8-K | 000-27163 | 3.1 | 5/4/00 | |||||||
| 3.02 | Certificate of Amendment to the Second Amended and Restated Certificate of Incorporation dated April 18, 2001. | S-8 | 333-64552 | 4.02 | 7/3/01 | |||||||
| 3.03 | Certificate of Amendment to the Second Amended and Restated Certificate of Incorporation filed on December 11, 2001. | S-3 | 333-77068 | 4.03 | 1/18/02 | |||||||
| 3.04 | Certificate of Amendment to the Second Amended and Restated Certificate of Incorporation dated November 21, 2005. | 8-A | 000-27163 | 3.04 | 1/31/06 | |||||||
| 3.05 | Amended and Restated Bylaws, as amended October 12, 2001. | 10-K | 000-27163 | 3.05 | 3/28/03 | |||||||
| 3.06 | Certificate of Designation of Series A Junior Participating Preferred Stock, as filed with the Secretary of State of Delaware on January 27, 2006. | 8-K | 000-27163 | 3.01 | 1/31/06 | |||||||
| 4.01 | Form of Specimen Common Stock Certificate. | S-1/A | 333-82587 | 4.01 | 9/21/99 | |||||||
| 4.02 | Form of Rights Certificate. | 8-K | 000-27163 | 4.01 | 1/31/06 | |||||||
Exhibit Number Exhibit Description 10.13 Share Purchase Agreement by and among Kana Software, Inc., TCV IV, L.P., and TCV IV Strategic Partners, L.P., dated as of November 28, 2001. 10.14 10.15 10.16 Registration Rights Agreement, dated as of June 25, 2005, by and among Kana Software, Inc. and Nightwatch Capital Partners, LP, NightWatch Capital Partners II, LP and RHP Master Fund, Ltd. 10.17 10.18 10.19 10.20 10.21 10.22 10.23 10.24 10.25 10.26 10.27 Exhibit Number Exhibit Description Incorporated by Reference Form File No. Exhibit Filing
Date Filed
Herewith 8-K/A 000-27163 99.01 12/13/01 Warrant to Purchase Common Stock, dated December 10, 2003, between Kana Software, Inc. and IBM. 10-K 000-27163 10.20 3/19/04 Common Stock and Warrant Purchase Agreement, dated as of June 25, 2005, by and among Kana Software, Inc., Nightwatch Capital Partners, LP, NightWatch Capital Partners II, LP and RHP Master Fund, Ltd. 8-K 000-27163 10.01 6/30/05 8-K 000-27163 10.02 6/30/05 Form of Stock Purchase Warrant issued by Kana Software, Inc. to NightWatch Capital Partners, LP, NightWatch Capital Partners II, LP and RHP Master Fund, Ltd. in connection with the Common Stock and Warrant Purchase Agreement, dated as of June 25, 2005. 8-K 000-27163 10.03 6/30/05 Common Stock and Warrant Purchase Agreement, dated as of September 29, 2005, by and among Kana Software, Inc., Nightwatch Capital Partners, LP, NightWatch Capital Partners II, LP and RHP Master Fund, Ltd. 8-K 000-27163 10.01 10/03/05 Registration Rights Agreement, dated as of September 29, 2005, between Kana Software, Inc., Nightwatch Capital Partners, LP, NightWatch Capital Partners II, LP and RHP Master Fund, Ltd. 8-K 000-27163 10.02 10/03/05 Form of Stock Purchase Warrant issued by Kana Software, Inc. to Nightwatch Capital Partners, LP and NightWatch Capital Partners II, LP in connection with the Common Stock and Warrant Purchase Agreement, dated as of September 29, 2005. 8-K 000-27163 10.03 10/03/05 Stock Purchase Warrant issued by Kana Software, Inc. to RHP Master Fund, Ltd., in connection with the Common Stock and Warrant Purchase Agreement, dated as of September 29, 2005. 8-K 000-27163 10.04 10/03/05 Amendment to Registration Rights Agreement, dated September 29, 2005. 8-K 000-27163 10.05 10/03/05 Form of Amended and Restated Stock Purchase Warrant issued by Kana Software, Inc. to Nightwatch Capital Partners, LP and NightWatch, dated September 29, 2005. 8-K 000-27163 10.06 10/03/05 Amended and Restated Stock Purchase Warrant issued by Kana Software, Inc. to RHP Master Fund, Ltd., dated September 29, 2005. 8-K 000-27163 10.07 10/03/05 Stock Purchase Warrant issued by Kana Software, Inc. to NightWatch Capital Partners, LP, dated October 25, 2005, in connection with the Common Stock and Warrant Purchase Agreement, dated as of September 29, 2005. 8-K 000-27163 10.01 10/31/05 Stock Purchase Warrant issued by Kana Software, Inc. to NightWatch Capital Partners II, LP, dated October 25, 2005, in connection with the Common Stock and Warrant Purchase Agreement, dated as of September 29, 2005. 8-K 000-27163 10.02 10/31/05 Stock Purchase Warrant issued by Kana Software, Inc. to RHP Master Fund, Ltd., dated October 25, 2005, in connection with the Common Stock and Warrant Purchase Agreement, dated as of September 29, 2005. 8-K 000-27163 10.03 10/31/05 Incorporated by Reference Form File No. Exhibit Filing
Date Filed
Herewith 4.03 Rights Agreement, dated as of January 26, 2006, by and between Kana Software, Inc. and U.S. Stock Transfer Corporation. 8-K 000-27163 4.02 1/31/06 10.01 Kana Software, Inc. 1999 Stock Incentive Plan, as amended.** 10-Q 000-27163 10.01 11/14/06 10.02 Kana Software, Inc. 1999 Special Stock Option Plan.** S-8 333-32460 99.01 3/14/00 10.03 Kana Software, Inc. 1999 Special Stock Option Plan—Form of Nonstatutory Stock Option Agreement—4-year vesting.** S-8 333-32460 99.02 3/14/00 10.04 Kana Software, Inc. 1999 Special Stock Option Plan—Form of Nonstatutory Stock Option Agreement—30-month vesting.** S-8 333-32460 99.03 3/14/00 10.05 Broadbase Software, Inc. 2000 Stock Incentive Plan, as amended.** 10-Q 000-27163 10.02 11/14/06 10.06 Broadbase Software, Inc. 2000 Stock Incentive Plan, as amended, related forms of agreements.**± S-8 333-38480 4.09 6/02/00 10.07 Broadbase Software, Inc. 1999 Equity Incentive Plan, as amended November 2, 2000.**± S-4/A 333-4896 4.09 11/09/00 10.08 Kana Software, Inc. 1997 Stock Option Plan.** S-1 333-82587 10.1 7/09/97 10.09 Lease Agreement, dated December 23, 1999, between Broadbase Software, Inc. and Bohannon Trusts Partnership II.± 10-Q 000-27163 10.03 5/11/00 10.10 Amendment to Lease, dated February 9, 2007, between Bohannon Trusts Partnership II and Kana Software, Inc. X 10.11 Lease Agreement, dated August 11, 2000, between Broadbase Software, Inc. and J. Robert S. Wheatley and Roger A. Fields, d.b.a. R & R Properties.± 10-Q 000-27163 10.4 11/13/00 10.12 Assignment Agreement and First Amendment of Lease dated November 11, 2002 between the Registrant and J. Robert S. Wheatley and Roger A. Fields, d.b.a. R & R Properties. 8-K 000-27163 99.1 11/21/02 10.13 Share Purchase Agreement by and among Kana Software, Inc., TCV IV, L.P., and TCV IV Strategic Partners, L.P., dated as of November 28, 2001. 8-K/A 000-27163 99.01 12/13/01 10.14 Warrant to Purchase Common Stock, dated December 10, 2003, between Kana Software, Inc. and IBM. 10-K 000-27163 10.20 3/19/04
Exhibit Number Exhibit Description 10.28 10.29 10.30 10.31 10.32 10.33 10.34 10.35 10.36 10.37 10.38 10.39 10.40 10.41 10.42 10.43 10.44 10.45 10.46 10.47 10.48 10.49 Exhibit Number Exhibit Description Incorporated by Reference Form File No. Exhibit Filing
Date Filed
Herewith Second Amendment to Registration Rights Agreement, dated May 8, 2006, by and among Kana Software, Inc., NightWatch Capital Partners, LP, NightWatch Capital Partners II, LP and RHP Master Fund, Ltd. 8-K 000-27163 10.01 5/11/06 First Amendment to Registration Rights Agreement, dated May 8, 2006, by and among Kana Software, Inc., NightWatch Capital Partners, LP, NightWatch Capital Partners II, LP and RHP Master Fund, Ltd. 8-K 000-27163 10.02 5/11/06 Letter Agreement, dated as of September 29, 2005, by and among Kana Software, Inc., NightWatch Capital Partners, LP, NightWatch Capital Partners II LP and RHP Master Fund Ltd. 10-Q 000-27163 10.08 7/06/06 Offer letter to John M. Thompson dated October 8, 2004.** 10-Q 000-27163 10.2 11/15/04 Employment Offer Letter, between Kana Software, Inc. and Michael S. Fields, dated as of September 9, 2005.** 8-K/A 000-27163 10.01 11/23/05 Consulting Agreement, between Kana Software, Inc. and Michael S. Fields, dated as of July 25, 2005.** 8-K/A 000-27163 10.02 11/23/05 Consulting Agreement, between Kana Software, Inc. and William T. Clifford, dated October 30, 2006.** 8-K 000-27163 10.01 11/03/06 Offer Letter to Jay A. Jones, dated as of August 14, 2006.** 10-Q 000-27163 10.03 11/14/06 Employment Agreement, dated May 4, 2007, between Kana Software, Inc. and Mark A. Angel.** 10-Q 000-27163 10.02 8/14/07 Offer Letter to Michael J. Shannahan, dated as of February 28, 2008.** 10-K 000-27163 10.37 3/17/08 Description of Director Cash Compensation Arrangements, adopted April 20, 2006.** 8-K 000-27163 10.01 4/25/06 Description of Executive Compensation Plan for Fiscal Year 2007.** 8-K 000-27163 99.01 10/29/07 Business Financing Agreement, dated as of November 30, 2005, between Bridge Bank, National Association and Kana Software, Inc. 8-K 000-27163 10.01 12/07/05 Business Financing Agreement, dated as of December 29, 2005, between Bridge Bank, National Association and Kana Software, Inc. 10-K 000-27163 10.41 7/06/06 Business Financing Modification Agreement, dated as of December 29, 2005, between Kana Software, Inc. and Bridge Bank, National Association. 10-K 000-27163 10.42 7/06/06 Business Financing Modification Agreement, dated as of March 30, 2006, between Kana Software, Inc. and Bridge Bank, National Association. 10-K 000-27163 10.43 7/06/06 Business Financing Modification Agreement, dated as of March 30, 2006, between Kana Software, Inc. and Bridge Bank, National Association. 10-K 000-27163 10.44 7/06/06 Amended and Restated Loan and Security Agreement, dated February 27, 2007, between Kana Software, Inc. and Bridge Bank, N.A., as modified by Loan and Security Agreement, dated February 28, 2007 and as amended on May 7, 2007 10-Q 000-27163 10.01 5/14/07 Employment Termination, Release and Consulting Agreement, between Kana Software, Inc. and Brian Kelly, dated May 31, 2006.** 8-K 000-27163 10.01 6/13/06 Offer Letter from Broadbase Software, Inc. to Marchai B. Bruchey, dated December 15, 2000, as amended by the Letter Agreement with Kana Software, Inc. dated February 22, 2008.** X Offer Letter to Daniel A. Turano, dated July 18, 2006.** X Offer Letter to William A. Rowe, dated January 4, 2006.** X Incorporated by Reference Form File No. Exhibit Filing
Date Filed
Herewith10.15 Common Stock and Warrant Purchase Agreement, dated as of June 25, 2005, by and among Kana Software, Inc., Nightwatch Capital Partners, LP, NightWatch Capital Partners II, LP and RHP Master Fund, Ltd. 8-K 000-27163 10.01 6/30/05 10.16 Registration Rights Agreement, dated as of June 25, 2005, by and among Kana Software, Inc. and Nightwatch Capital Partners, LP, NightWatch Capital Partners II, LP and RHP Master Fund, Ltd. 8-K 000-27163 10.02 6/30/05 10.17 Form of Stock Purchase Warrant issued by Kana Software, Inc. to NightWatch Capital Partners, LP, NightWatch Capital Partners II, LP and RHP Master Fund, Ltd. in connection with the Common Stock and Warrant Purchase Agreement, dated as of June 25, 2005. 8-K 000-27163 10.03 6/30/05 10.18 Common Stock and Warrant Purchase Agreement, dated as of September 29, 2005, by and among Kana Software, Inc., Nightwatch Capital Partners, LP, NightWatch Capital Partners II, LP and RHP Master Fund, Ltd. 8-K 000-27163 10.01 10/03/05 10.19 Registration Rights Agreement, dated as of September 29, 2005, between Kana Software, Inc., Nightwatch Capital Partners, LP, NightWatch Capital Partners II, LP and RHP Master Fund, Ltd. 8-K 000-27163 10.02 10/03/05 10.20 Form of Stock Purchase Warrant issued by Kana Software, Inc. to Nightwatch Capital Partners, LP and NightWatch Capital Partners II, LP in connection with the Common Stock and Warrant Purchase Agreement, dated as of September 29, 2005. 8-K 000-27163 10.03 10/03/05 10.21 Stock Purchase Warrant issued by Kana Software, Inc. to RHP Master Fund, Ltd., in connection with the Common Stock and Warrant Purchase Agreement, dated as of September 29, 2005. 8-K 000-27163 10.04 10/03/05 10.22 Amendment to Registration Rights Agreement, dated September 29, 2005. 8-K 000-27163 10.05 10/03/05 10.23 Form of Amended and Restated Stock Purchase Warrant issued by Kana Software, Inc. to Nightwatch Capital Partners, LP and NightWatch, dated September 29, 2005. 8-K 000-27163 10.06 10/03/05 10.24 Amended and Restated Stock Purchase Warrant issued by Kana Software, Inc. to RHP Master Fund, Ltd., dated September 29, 2005. 8-K 000-27163 10.07 10/03/05
Exhibit Number Exhibit Description 21.01 23.01 24.01 31.01 31.02 32.01 32.02 Exhibit Number Exhibit Description Incorporated by Reference Form File No. Exhibit Filing
Date Filed
Herewith List of subsidiaries of Registrant. 10-K 000-27163 21.01 3/17/08 Consent of Independent Registered Public Accounting Firm. 10-K 000-27163 23.01 3/17/08 Power of Attorney (included on page 97 of the Annual Report on Form 10-K). 10-K 000-27163 24.01 3/17/08 Certification of Chief Executive Officer pursuant to Section 302 of the Sarbanes-Oxley Act of 2002. X Certification of Chief Financial Officer pursuant to Section 302 of the Sarbanes-Oxley Act of 2002. X Certification of Chief Executive Officer pursuant to 18 U.S.C. Section 1350, adopted pursuant to Section 906 of the Sarbanes-Oxley Act of 2002.* X Certification of Chief Financial Officer pursuant to 18 U.S.C. Section 1350, adopted pursuant to Section 906 of the Sarbanes-Oxley Act of 2002.* X Incorporated by Reference Form File No. Exhibit Filing
Date Filed
Herewith10.25 Stock Purchase Warrant issued by Kana Software, Inc. to NightWatch Capital Partners, LP, dated October 25, 2005, in connection with the Common Stock and Warrant Purchase Agreement, dated as of September 29, 2005. 8-K 000-27163 10.01 10/31/05 10.26 Stock Purchase Warrant issued by Kana Software, Inc. to NightWatch Capital Partners II, LP, dated October 25, 2005, in connection with the Common Stock and Warrant Purchase Agreement, dated as of September 29, 2005. 8-K 000-27163 10.02 10/31/05 10.27 Stock Purchase Warrant issued by Kana Software, Inc. to RHP Master Fund, Ltd., dated October 25, 2005, in connection with the Common Stock and Warrant Purchase Agreement, dated as of September 29, 2005. 8-K 000-27163 10.03 10/31/05 10.28 Second Amendment to Registration Rights Agreement, dated May 8, 2006, by and among Kana Software, Inc., NightWatch Capital Partners, LP, NightWatch Capital Partners II, LP and RHP Master Fund, Ltd. 8-K 000-27163 10.01 5/11/06 10.29 First Amendment to Registration Rights Agreement, dated May 8, 2006, by and among Kana Software, Inc., NightWatch Capital Partners, LP, NightWatch Capital Partners II, LP and RHP Master Fund, Ltd. 8-K 000-27163 10.02 5/11/06 10.30 Letter Agreement, dated as of September 29, 2005, by and among Kana Software, Inc., NightWatch Capital Partners, LP, NightWatch Capital Partners II LP and RHP Master Fund Ltd. 10-Q 000-27163 10.08 7/06/06 10.31 Employment Offer Letter, between Kana Software, Inc. and Michael S. Fields, dated as of September 9, 2005.** 8-K/A 000-27163 10.01 11/23/05 10.32 Offer Letter to Jay A. Jones, dated as of August 14, 2006.** 10-Q 000-27163 10.03 11/14/06 10.33 Employment Agreement, dated May 4, 2007, between Kana Software, Inc. and Mark A. Angel.** 10-Q 000-27163 10.02 8/14/07
Exhibit Number Exhibit Description 10.34 21.01 23.01 24.01 31.01 31.02 32.01 32.02 Incorporated by Reference Form File No. Exhibit Filing
Date Filed
Herewith Offer Letter to Michael J. Shannahan, dated as of February 28, 2008.** 10-K 000-27163 10.37 3/17/08 10.35 Offer Letter to Daniel A. Turano, dated July 18, 2006.** 10-K/A 000-27163 10.48 4/29/08 10.36 Description of Director Cash Compensation Arrangements, adopted April 20, 2006.** 8-K 000-27163 10.01 4/25/06 10.37 Second Amended and Restated Loan and Security Agreement, dated March 28, 2008, between Kana Software, Inc. and Bridge Bank, N.A. X 10.38 Patent License and Settlement Agreement, dated March 23, 2007, between Kana Software, Inc. and Polaris IP, LLC.† 10-Q 000-27163 10.02 5/14/07 10.39 Second Amended and Restated Loan and Security Modification Agreement, dated July 14, 2008. X 10.40 Loan and Security Modification Agreement, dated March 17, 2009. X List of subsidiaries of Registrant. X Consent of Independent Registered Public Accounting Firm. X Power of Attorney (included on page 90 of this Annual Report on Form 10-K). X Certification of Chief Executive Officer pursuant to Section 302 of the Sarbanes-Oxley Act of 2002. X Certification of Chief Financial Officer pursuant to Section 302 of the Sarbanes-Oxley Act of 2002. X Certification of Chief Executive Officer pursuant to 18 U.S.C. Section 1350, adopted pursuant to Section 906 of the Sarbanes-Oxley Act of 2002.* X Certification of Chief Financial Officer pursuant to 18 U.S.C. Section 1350, adopted pursuant to Section 906 of the Sarbanes-Oxley Act of 2002.* X
| * | These certifications accompany KANA’s Annual Report on Form 10-K; they are not deemed “filed” with the Securities and Exchange Commission and are not to be incorporated by reference in any filing of KANA under the Securities Act of 1933, or the Exchange Act, whether made before or after the date hereof and irrespective of any general incorporation language in any filings. |
| ** | Indicates management contract or compensatory plan or arrangement. |
| ± | Filed by Broadbase Software, Inc. |
| † | Confidential treatment has been requested with regard to portions of the exhibit. Such portions were filed separately with the Securities and Exchange Commission. |
SCHEDULE II—VALUATION AND QUALIFYING ACCOUNTS
KANA SOFTWARE, INC.
| Balance at Beginning of Year | Amounts recorded in Expenses | Deductions | Balance at End of Year | ||||||||||
Allowance for Doubtful Accounts: | |||||||||||||
Year ended December 31, 2008 | $ | 204 | $ | 814 | $ | (801 | ) | $ | 217 | ||||
Year ended December 31, 2007 | $ | 155 | $ | 160 | $ | (111 | ) | $ | 204 | ||||
Year ended December 31, 2006 | $ | 149 | $ | 90 | $ | (84 | ) | $ | 155 | ||||
Pursuant to the requirements of Section 13 or 15(d) of the Securities Exchange Act of 1934, the Registrant has duly caused this report to be signed on its behalf by the undersigned, thereunto duly authorized, in the city of Menlo Park, state of California, on April 29, 2008.May 15, 2009.
Kana Software, Inc. |
/s/ MICHAEL S. FIELDS |
Michael S. Fields |
Chief Executive Officer and Chairman of the Board |
(Principal Executive Officer) |
POWER OF ATTORNEY
KNOW ALL PERSONS BY THESE PRESENTS that each individual whose signature appears below constitutes and appoints Michael S. Fields and Michael J. Shannahan, and each of them, his or her true lawful attorneys-in-fact and agents, with full power of substitution, for him or her and in his or her name, place and stead, in any and all capacities, to sign any and all amendments to this Annual Report on Form 10-K and to file the same, with all exhibits thereto and all documents in connection therewith, with the Securities and Exchange Commission, granted unto said attorneys-in-fact and agents, and each of them, full power and authority to do and perform each an every act and thing requisite and necessary to be done in and about the premises, as fully to all intents and purposes as he or she might or could do in person, hereby ratifying and confirming all that said attorneys-in-fact and agents or any of them, or his or their substitute or substitutes, may lawfully do or cause to be done by virtue hereof.
Pursuant to the requirements of the Securities Exchange Act of 1934, this report has been signed below by the following persons on behalf of the Registrantregistrant and in the capacities and on the dates indicated.
Date: | By | /s/ MICHAEL S. FIELDS | ||
| Michael S. Fields | ||||
| Chief Executive Officer and Chairman of the Board | ||||
| (Principal Executive Officer) | ||||
Date: | By | /s/ MICHAEL J. SHANNAHAN | ||
| Michael J. Shannahan | ||||
| Executive Vice President and Chief Financial Officer | ||||
| (Principal Financial and Accounting Officer) | ||||
Date: | By |
| ||
| Jerry R. Batt | ||||
| Director | ||||
Date: | By |
| ||
| Stephanie Vinella | ||||
| Director | ||||
Date: | By |
| ||
| William T. Clifford | ||||
| Director | ||||
Date: | By |
| ||
| John F. Nemelka | ||||
| Director | ||||
| ||||
| Incorporated by Reference | ||||||||||||
Exhibit Number | Exhibit Description | Form | File No. | Exhibit | Filing Date | Filed Herewith | ||||||
3.01 | Second Amended and Restated Certificate of Incorporation, as amended by the Certificate of Amendment dated April 18, 2000. | 8-K | 000-27163 | 3.1 | 5/4/00 | |||||||
3.02 | Certificate of Amendment to the Second Amended and Restated Certificate of Incorporation dated April 18, 2001. | S-8 | 333-64552 | 4.02 | 7/3/01 | |||||||
3.03 | Certificate of Amendment to the Second Amended and Restated Certificate of Incorporation filed on December 11, 2001. | S-3 | 333-77068 | 4.03 | 1/18/02 | |||||||
3.04 | Certificate of Amendment to the Second Amended and Restated Certificate of Incorporation dated November 21, 2005. | 8-A | 000-27163 | 3.04 | 1/31/06 | |||||||
3.05 | Amended and Restated Bylaws, as amended October 12, 2001. | 10-K | 000-27163 | 3.05 | 3/28/03 | |||||||
3.06 | Certificate of Designation of Series A Junior Participating Preferred Stock, as filed with the Secretary of State of Delaware on January 27, 2006. | 8-K | 000-27163 | 3.01 | 1/31/06 | |||||||
4.01 | Form of Specimen Common Stock Certificate. | S-1/A | 333-82587 | 4.01 | 9/21/99 | |||||||
4.02 | Form of Rights Certificate. | 8-K | 000-27163 | 4.01 | 1/31/06 | |||||||
4.03 | Rights Agreement, dated as of January 26, 2006, by and between Kana Software, Inc. and U.S. Stock Transfer Corporation. | 8-K | 000-27163 | 4.02 | 1/31/06 | |||||||
10.01 | Kana Software, Inc. 1999 Stock Incentive Plan, as amended.** | 10-Q | 000-27163 | 10.01 | 11/14/06 | |||||||
10.02 | Kana Software, Inc. 1999 Employee Stock Purchase Plan, as amended.** | S-4/A | 333-59754 | 10.23 | 5/18/01 | |||||||
10.03 | Kana Software, Inc. 1999 Special Stock Option Plan.** | S-8 | 333-32460 | 99.01 | 3/14/00 | |||||||
10.04 | Kana Software, Inc. 1999 Special Stock Option Plan—Form of Nonstatutory Stock Option Agreement—4-year vesting.** | S-8 | 333-32460 | 99.02 | 3/14/00 | |||||||
10.05 | Kana Software, Inc. 1999 Special Stock Option Plan—Form of Nonstatutory Stock Option Agreement—30-month vesting.** | S-8 | 333-32460 | 99.03 | 3/14/00 | |||||||
10.06 | Broadbase Software, Inc. 2000 Stock Incentive Plan, as amended.**± | 10-Q | 000-27163 | 10.02 | 11/14/06 | |||||||
10.07 | Broadbase Software, Inc. 2000 Stock Incentive Plan, as amended, related forms of agreements.**± | S-8 | 333-38480 | 4.09 | 6/02/00 | |||||||
10.08 | Broadbase Software, Inc. 1999 Equity Incentive Plan, as amended November 2, 2000.**± | S-4/A | 333-4896 | 4.09 | 11/09/00 | |||||||
10.09 | Kana Software, Inc. 1997 Stock Option Plan.** | S-1 | 333-82587 | 10.1 | 7/09/97 | |||||||
10.10 | Lease Agreement, dated December 23, 1999, between Broadbase Software, Inc. and Bohannon Trusts Partnership II.± | 10-Q | 000-27163 | 10.03 | 5/11/00 | |||||||
10.11 | Lease Agreement, dated August 11, 2000, between Broadbase Software, Inc. and J. Robert S. Wheatley and Roger A. Fields, d.b.a. R & R Properties.± | 10-Q | 000-27163 | 10.4 | 11/13/00 | |||||||
10.12 | Assignment Agreement and First Amendment of Lease dated November 11, 2002 between the Registrant and J. Robert S. Wheatley and Roger A. Fields, d.b.a. R & R Properties. | 8-K | 000-27163 | 99.1 | 11/21/02 | |||||||
10.13 | Share Purchase Agreement by and among Kana Software, Inc., TCV IV, L.P., and TCV IV Strategic Partners, L.P., dated as of November 28, 2001. | 8-K/A | 000-27163 | 99.01 | 12/13/01 | |||||||
| Incorporated by Reference | ||||||||||||
Exhibit Number | Exhibit Description | Form | File No. | Exhibit | Filing Date | Filed Herewith | ||||||
| 3.01 | Second Amended and Restated Certificate of Incorporation, as amended by the Certificate of Amendment dated April 18, 2000. | 8-K | 000-27163 | 3.1 | 5/4/00 | |||||||
| 3.02 | Certificate of Amendment to the Second Amended and Restated Certificate of Incorporation dated April 18, 2001. | S-8 | 333-64552 | 4.02 | 7/3/01 | |||||||
| 3.03 | Certificate of Amendment to the Second Amended and Restated Certificate of Incorporation filed on December 11, 2001. | S-3 | 333-77068 | 4.03 | 1/18/02 | |||||||
| 3.04 | Certificate of Amendment to the Second Amended and Restated Certificate of Incorporation dated November 21, 2005. | 8-A | 000-27163 | 3.04 | 1/31/06 | |||||||
| 3.05 | Amended and Restated Bylaws, as amended October 12, 2001. | 10-K | 000-27163 | 3.05 | 3/28/03 | |||||||
| 3.06 | Certificate of Designation of Series A Junior Participating Preferred Stock, as filed with the Secretary of State of Delaware on January 27, 2006. | 8-K | 000-27163 | 3.01 | 1/31/06 | |||||||
| 4.01 | Form of Specimen Common Stock Certificate. | S-1/A | 333-82587 | 4.01 | 9/21/99 | |||||||
| 4.02 | Form of Rights Certificate. | 8-K | 000-27163 | 4.01 | 1/31/06 | |||||||
| 4.03 | Rights Agreement, dated as of January 26, 2006, by and between Kana Software, Inc. and U.S. Stock Transfer Corporation. | 8-K | 000-27163 | 4.02 | 1/31/06 | |||||||
| 10.01 | Kana Software, Inc. 1999 Stock Incentive Plan, as amended.** | 10-Q | 000-27163 | 10.01 | 11/14/06 | |||||||
10.02 | Kana Software, Inc. 1999 Special Stock Option Plan.** | S-8 | 333-32460 | 99.01 | 3/14/00 | |||||||
10.03 | Kana Software, Inc. 1999 Special Stock Option Plan—Form of Nonstatutory Stock Option Agreement—4-year vesting.** | S-8 | 333-32460 | 99.02 | 3/14/00 | |||||||
10.04 | Kana Software, Inc. 1999 Special Stock Option Plan—Form of Nonstatutory Stock Option Agreement—30-month vesting.** | S-8 | 333-32460 | 99.03 | 3/14/00 | |||||||
10.05 | Broadbase Software, Inc. 2000 Stock Incentive Plan, as amended.** | 10-Q | 000-27163 | 10.02 | 11/14/06 | |||||||
10.06 | Broadbase Software, Inc. 2000 Stock Incentive Plan, as amended, related forms of agreements.**± | S-8 | 333-38480 | 4.09 | 6/02/00 | |||||||
Exhibit Number Exhibit Description 10.14 10.15 10.16 Registration Rights Agreement, dated as of June 25, 2005, by and among Kana Software, Inc. and Nightwatch Capital Partners, LP, NightWatch Capital Partners II, LP and RHP Master Fund, Ltd. 10.17 10.18 10.19 10.20 10.21 10.22 10.23 10.24 10.25 10.26 10.27 10.28 Exhibit Number Exhibit Description Incorporated by Reference Form File No. Exhibit Filing
Date Filed
Herewith Warrant to Purchase Common Stock, dated December 10, 2003, between Kana Software, Inc. and IBM. 10-K 000-27163 10.20 3/19/04 Common Stock and Warrant Purchase Agreement, dated as of June 25, 2005, by and among Kana Software, Inc., Nightwatch Capital Partners, LP, NightWatch Capital Partners II, LP and RHP Master Fund, Ltd. 8-K 000-27163 10.01 6/30/05 8-K 000-27163 10.02 6/30/05 Form of Stock Purchase Warrant issued by Kana Software, Inc. to NightWatch Capital Partners, LP, NightWatch Capital Partners II, LP and RHP Master Fund, Ltd. in connection with the Common Stock and Warrant Purchase Agreement, dated as of June 25, 2005. 8-K 000-27163 10.03 6/30/05 Common Stock and Warrant Purchase Agreement, dated as of September 29, 2005, by and among Kana Software, Inc., Nightwatch Capital Partners, LP, NightWatch Capital Partners II, LP and RHP Master Fund, Ltd. 8-K 000-27163 10.01 10/03/05 Registration Rights Agreement, dated as of September 29, 2005, between Kana Software, Inc., Nightwatch Capital Partners, LP, NightWatch Capital Partners II, LP and RHP Master Fund, Ltd. 8-K 000-27163 10.02 10/03/05 Form of Stock Purchase Warrant issued by Kana Software, Inc. to Nightwatch Capital Partners, LP and NightWatch Capital Partners II, LP in connection with the Common Stock and Warrant Purchase Agreement, dated as of September 29, 2005. 8-K 000-27163 10.03 10/03/05 Stock Purchase Warrant issued by Kana Software, Inc. to RHP Master Fund, Ltd., in connection with the Common Stock and Warrant Purchase Agreement, dated as of September 29, 2005. 8-K 000-27163 10.04 10/03/05 Amendment to Registration Rights Agreement, dated September 29, 2005. 8-K 000-27163 10.05 10/03/05 Form of Amended and Restated Stock Purchase Warrant issued by Kana Software, Inc. to Nightwatch Capital Partners, LP and NightWatch, dated September 29, 2005. 8-K 000-27163 10.06 10/03/05 Amended and Restated Stock Purchase Warrant issued by Kana Software, Inc. to RHP Master Fund, Ltd., dated September 29, 2005. 8-K 000-27163 10.07 10/03/05 Stock Purchase Warrant issued by Kana Software, Inc. to NightWatch Capital Partners, LP, dated October 25, 2005, in connection with the Common Stock and Warrant Purchase Agreement, dated as of September 29, 2005. 8-K 000-27163 10.01 10/31/05 Stock Purchase Warrant issued by Kana Software, Inc. to NightWatch Capital Partners II, LP, dated October 25, 2005, in connection with the Common Stock and Warrant Purchase Agreement, dated as of September 29, 2005. 8-K 000-27163 10.02 10/31/05 Stock Purchase Warrant issued by Kana Software, Inc. to RHP Master Fund, Ltd., dated October 25, 2005, in connection with the Common Stock and Warrant Purchase Agreement, dated as of September 29, 2005. 8-K 000-27163 10.03 10/31/05 Second Amendment to Registration Rights Agreement, dated May 8, 2006, by and among Kana Software, Inc., NightWatch Capital Partners, LP, NightWatch Capital Partners II, LP and RHP Master Fund, Ltd. 8-K 000-27163 10.01 5/11/06 Incorporated by Reference Form File No. Exhibit Filing
Date Filed
Herewith10.07 Broadbase Software, Inc. 1999 Equity Incentive Plan, as amended November 2, 2000.**± S-4/A 333-4896 4.09 11/09/00 10.08 Kana Software, Inc. 1997 Stock Option Plan.** S-1 333-82587 10.1 7/09/97 10.09 Lease Agreement, dated December 23, 1999, between Broadbase Software, Inc. and Bohannon Trusts Partnership II.± 10-Q 000-27163 10.03 5/11/00 10.10 Amendment to Lease, dated February 9, 2007, between Bohannon Trusts Partnership II and Kana Software, Inc. X 10.11 Lease Agreement, dated August 11, 2000, between Broadbase Software, Inc. and J. Robert S. Wheatley and Roger A. Fields, d.b.a. R & R Properties.± 10-Q 000-27163 10.4 11/13/00 10.12 Assignment Agreement and First Amendment of Lease dated November 11, 2002 between the Registrant and J. Robert S. Wheatley and Roger A. Fields, d.b.a. R & R Properties. 8-K 000-27163 99.1 11/21/02 10.13 Share Purchase Agreement by and among Kana Software, Inc., TCV IV, L.P., and TCV IV Strategic Partners, L.P., dated as of November 28, 2001. 8-K/A 000-27163 99.01 12/13/01 10.14 Warrant to Purchase Common Stock, dated December 10, 2003, between Kana Software, Inc. and IBM. 10-K 000-27163 10.20 3/19/04 10.15 Common Stock and Warrant Purchase Agreement, dated as of June 25, 2005, by and among Kana Software, Inc., Nightwatch Capital Partners, LP, NightWatch Capital Partners II, LP and RHP Master Fund, Ltd. 8-K 000-27163 10.01 6/30/05 10.16 Registration Rights Agreement, dated as of June 25, 2005, by and among Kana Software, Inc. and Nightwatch Capital Partners, LP, NightWatch Capital Partners II, LP and RHP Master Fund, Ltd. 8-K 000-27163 10.02 6/30/05 10.17 Form of Stock Purchase Warrant issued by Kana Software, Inc. to NightWatch Capital Partners, LP, NightWatch Capital Partners II, LP and RHP Master Fund, Ltd. in connection with the Common Stock and Warrant Purchase Agreement, dated as of June 25, 2005. 8-K 000-27163 10.03 6/30/05 10.18 Common Stock and Warrant Purchase Agreement, dated as of September 29, 2005, by and among Kana Software, Inc., Nightwatch Capital Partners, LP, NightWatch Capital Partners II, LP and RHP Master Fund, Ltd. 8-K 000-27163 10.01 10/03/05
Exhibit Number Exhibit Description 10.29 10.30 10.31 10.32 10.33 10.34 10.35 10.36 10.37 10.38 10.39 10.40 10.41 10.42 10.43 10.44 10.45 10.46 10.47 10.48 10.49 21.01 23.01 Exhibit Number Exhibit Description Incorporated by Reference Form File No. Exhibit Filing
Date Filed
Herewith First Amendment to Registration Rights Agreement, dated May 8, 2006, by and among Kana Software, Inc., NightWatch Capital Partners, LP, NightWatch Capital Partners II, LP and RHP Master Fund, Ltd. 8-K 000-27163 10.02 5/11/06 Letter Agreement, dated as of September 29, 2005, by and among Kana Software, Inc., NightWatch Capital Partners, LP, NightWatch Capital Partners II LP and RHP Master Fund Ltd. 10-Q 000-27163 10.08 7/06/06 Offer letter to John M. Thompson dated October 8, 2004.** 10-Q 000-27163 10.2 11/15/04 Employment Offer Letter, between Kana Software, Inc. and Michael S. Fields, dated as of September 9, 2005.** 8-K/A 000-27163 10.01 11/23/05 Consulting Agreement, between Kana Software, Inc. and Michael S. Fields, dated as of July 25, 2005.** 8-K/A 000-27163 10.02 11/23/05 Consulting Agreement, between Kana Software, Inc. and William T. Clifford, dated October 30, 2006.** 8-K 000-27163 10.01 11/03/06 Offer Letter to Jay A. Jones, dated as of August 14, 2006.** 10-Q 000-27163 10.03 11/14/06 Employment Agreement, dated May 4, 2007, between Kana Software, Inc. and Mark A. Angel.** 10-Q 000-27163 10.02 8/14/07 Offer Letter to Michael J. Shannahan, dated as of February 28, 2008.** 10-K 000-27163 10.37 3/17/08 Description of Director Cash Compensation Arrangements, adopted April 20, 2006.** 8-K 000-27163 10.01 4/25/06 Description of Executive Compensation Plan for Fiscal Year 2007.** 8-K 000-27163 99.01 10/29/07 Business Financing Agreement, dated as of November 30, 2005, between Bridge Bank, National Association and Kana Software, Inc. 8-K 000-27163 10.01 12/07/05 Business Financing Agreement, dated as of December 29, 2005, between Bridge Bank, National Association and Kana Software, Inc. 10-K 000-27163 10.41 7/06/06 Business Financing Modification Agreement, dated as of December 29, 2005, between Kana Software, Inc. and Bridge Bank, National Association. 10-K 000-27163 10.42 7/06/06 Business Financing Modification Agreement, dated as of March 30, 2006, between Kana Software, Inc. and Bridge Bank, National Association. 10-K 000-27163 10.43 7/06/06 Business Financing Modification Agreement, dated as of March 30, 2006, between Kana Software, Inc. and Bridge Bank, National Association. 10-K 000-27163 10.44 7/06/06 Amended and Restated Loan and Security Agreement, dated February 27, 2007, between Kana Software, Inc. and Bridge Bank, N.A., as modified by Loan and Security Agreement, dated February 28, 2007 and as amended on May 7, 2007 10-Q 000-27163 10.01 5/14/07 Employment Termination, Release and Consulting Agreement, between Kana Software, Inc. and Brian Kelly, dated May 31, 2006.** 8-K 000-27163 10.01 6/13/06 Offer Letter from Broadbase Software, Inc. to Marchai B. Bruchey, dated December 15, 2000, as amended by the Letter Agreement with Kana Software, Inc. dated February 22, 2008.** X Offer Letter to Daniel A. Turano, dated July 18, 2006.** X Offer Letter to William A. Rowe, dated January 4, 2006.** X List of subsidiaries of Registrant. 10-K 000-27163 21.01 3/17/08 Consent of Independent Registered Public Accounting Firm. 10-K 000-27163 23.01 3/17/08 Incorporated by Reference Form File No. Exhibit Filing
Date Filed
Herewith10.19 Registration Rights Agreement, dated as of September 29, 2005, between Kana Software, Inc., Nightwatch Capital Partners, LP, NightWatch Capital Partners II, LP and RHP Master Fund, Ltd. 8-K 000-27163 10.02 10/03/05 10.20 Form of Stock Purchase Warrant issued by Kana Software, Inc. to Nightwatch Capital Partners, LP and NightWatch Capital Partners II, LP in connection with the Common Stock and Warrant Purchase Agreement, dated as of September 29, 2005. 8-K 000-27163 10.03 10/03/05 10.21 Stock Purchase Warrant issued by Kana Software, Inc. to RHP Master Fund, Ltd., in connection with the Common Stock and Warrant Purchase Agreement, dated as of September 29, 2005. 8-K 000-27163 10.04 10/03/05 10.22 Amendment to Registration Rights Agreement, dated September 29, 2005. 8-K 000-27163 10.05 10/03/05 10.23 Form of Amended and Restated Stock Purchase Warrant issued by Kana Software, Inc. to Nightwatch Capital Partners, LP and NightWatch, dated September 29, 2005. 8-K 000-27163 10.06 10/03/05 10.24 Amended and Restated Stock Purchase Warrant issued by Kana Software, Inc. to RHP Master Fund, Ltd., dated September 29, 2005. 8-K 000-27163 10.07 10/03/05 10.25 Stock Purchase Warrant issued by Kana Software, Inc. to NightWatch Capital Partners, LP, dated October 25, 2005, in connection with the Common Stock and Warrant Purchase Agreement, dated as of September 29, 2005. 8-K 000-27163 10.01 10/31/05 10.26 Stock Purchase Warrant issued by Kana Software, Inc. to NightWatch Capital Partners II, LP, dated October 25, 2005, in connection with the Common Stock and Warrant Purchase Agreement, dated as of September 29, 2005. 8-K 000-27163 10.02 10/31/05 10.27 Stock Purchase Warrant issued by Kana Software, Inc. to RHP Master Fund, Ltd., dated October 25, 2005, in connection with the Common Stock and Warrant Purchase Agreement, dated as of September 29, 2005. 8-K 000-27163 10.03 10/31/05 10.28 Second Amendment to Registration Rights Agreement, dated May 8, 2006, by and among Kana Software, Inc., NightWatch Capital Partners, LP, NightWatch Capital Partners II, LP and RHP Master Fund, Ltd. 8-K 000-27163 10.01 5/11/06
Exhibit Number Exhibit Description 24.01 31.01 31.02 32.01 32.02 Exhibit Number Exhibit Description 10.34 21.01 23.01 Incorporated by Reference Form File No. Exhibit Filing
Date Filed
Herewith Power of Attorney (included on page 97 of the Annual Report on Form 10-K). 10-K 000-27163 24.01 3/17/08 Certification of Chief Executive Officer pursuant to Section 302 of the Sarbanes-Oxley Act of 2002. X Certification of Chief Financial Officer pursuant to Section 302 of the Sarbanes-Oxley Act of 2002. X Certification of Chief Executive Officer pursuant to 18 U.S.C. Section 1350, adopted pursuant to Section 906 of the Sarbanes-Oxley Act of 2002.* X Certification of Chief Financial Officer pursuant to 18 U.S.C. Section 1350, adopted pursuant to Section 906 of the Sarbanes-Oxley Act of 2002.* X Incorporated by Reference Form File No. Exhibit Filing
Date Filed
Herewith10.29 First Amendment to Registration Rights Agreement, dated May 8, 2006, by and among Kana Software, Inc., NightWatch Capital Partners, LP, NightWatch Capital Partners II, LP and RHP Master Fund, Ltd. 8-K 000-27163 10.02 5/11/06 10.30 Letter Agreement, dated as of September 29, 2005, by and among Kana Software, Inc., NightWatch Capital Partners, LP, NightWatch Capital Partners II LP and RHP Master Fund Ltd. 10-Q 000-27163 10.08 7/06/06 10.31 Employment Offer Letter, between Kana Software, Inc. and Michael S. Fields, dated as of September 9, 2005.** 8-K/A 000-27163 10.01 11/23/05 10.32 Offer Letter to Jay A. Jones, dated as of August 14, 2006.** 10-Q 000-27163 10.03 11/14/06 10.33 Employment Agreement, dated May 4, 2007, between Kana Software, Inc. and Mark A. Angel.** 10-Q 000-27163 10.02 8/14/07 Offer Letter to Michael J. Shannahan, dated as of February 28, 2008.** 10-K 000-27163 10.37 3/17/08 10.35 Offer Letter to Daniel A. Turano, dated July 18, 2006.** 10-K/A 000-27163 10.48 4/29/08 10.36 Description of Director Cash Compensation Arrangements, adopted April 20, 2006.** 8-K 000-27163 10.01 4/25/06 10.37 Second Amended and Restated Loan and Security Agreement, dated March 28, 2008, between Kana Software, Inc. and Bridge Bank, N.A. X 10.38 Patent License and Settlement Agreement, dated March 23, 2007, between Kana Software, Inc. and Polaris IP, LLC.† 10-Q 000-27163 10.02 5/14/07 10.39 Second Amended and Restated Loan and Security Modification Agreement, dated July 14, 2008. X 10.40 Loan and Security Modification Agreement, dated March 17, 2009. X List of subsidiaries of Registrant. X Consent of Independent Registered Public Accounting Firm. X
| Incorporated by Reference | ||||||||||||
Exhibit Number | Exhibit Description | Form | File No. | Exhibit | Filing Date | Filed Herewith | ||||||
24.01 | Power of Attorney (included on page 90 of this Annual Report on Form 10-K). | X | ||||||||||
31.01 | Certification of Chief Executive Officer pursuant to Section 302 of the Sarbanes-Oxley Act of 2002. | X | ||||||||||
31.02 | Certification of Chief Financial Officer pursuant to Section 302 of the Sarbanes-Oxley Act of 2002. | X | ||||||||||
32.01 | Certification of Chief Executive Officer pursuant to 18 U.S.C. Section 1350, adopted pursuant to Section 906 of the Sarbanes-Oxley Act of 2002.* | X | ||||||||||
32.02 | Certification of Chief Financial Officer pursuant to 18 U.S.C. Section 1350, adopted pursuant to Section 906 of the Sarbanes-Oxley Act of 2002.* | X | ||||||||||
| * | These certifications accompany KANA’s Annual Report on Form 10-K; they are not deemed “filed” with the Securities and Exchange Commission and are not to be incorporated by reference in any filing of KANA under the Securities Act of 1933, or the Exchange Act, whether made before or after the date hereof and irrespective of any general incorporation language in any filings. |
| ** | Indicates management contract or compensatory plan or arrangement. |
| ± | Filed by Broadbase Software, Inc. |
| † | Confidential treatment has been requested with regard to portions of the exhibit. Such portions were filed separately with the Securities and Exchange Commission. |
3196