SECURITIES AND EXCHANGE COMMISSION
FORM
10-K/AAmendment No. 2
10-Kx |
| |
| ý | ANNUAL REPORT PURSUANT TO SECTION 13 OR 15(d) OF THE SECURITIES EXCHANGE ACT OF 1934 |
or
|
| For the fiscal year ended December 31, 2009
|
or
| ¨ | TRANSITION REPORT PURSUANT TO SECTION 13 OR 15(d) OF THE SECURITIES EXCHANGE ACT OF 1934 |
| For the transition period from to
|
For the transition period from to
Commission file numberFile Number 1-13270 (Exact name of registrant as specified in its charter)
|
| | |
| Delaware | | 90-0023731 |
(State or other jurisdiction of incorporation or organization)
| | Identification No.)
|
| |
293010603 W. Sam Houston Parkway N. #300 Houston, TX
| | 7704377064 |
| (Address of principal executive offices) | | (Zip Code) |
(713) 849-9911
(Registrant’s telephone number, including area
code (713) 849-9911code)
Securities registered pursuant to Section 12(b) of the Act:
|
| | |
| |
| Title of each class | | Name of each exchange on which registered |
| Common Stock, $0.0001 par value | | New York Stock Exchange, Inc. |
| |
5.25% Convertible Senior Notes Due 2028 and guarantees | | New York Stock Exchange, Inc. |
Due 2028 and guarantees | | |
Securities registered pursuant to Section 12(g) of the Act:
Indicate by check markmark:
• if the registrant is a well-known seasoned issuer, as defined in Rule 405 of the Securities Act. Yes ¨ No xý Indicate by check mark• if the registrant is not required to file reports pursuant to Section 13 or Section 15(d) of the Act. Yes ¨ No xýIndicate by check mark• whether the registrant (1) has filed all reports required to be filed by Section 13 or 15(d) of the Securities Exchange Act of 1934 during the preceding 12 months (or for such shorter period that the registrant was required to file such reports), and (2) has been subject to such filing requirements for the past 90 days. Yes xý No ¨Indicate by checkmark• whether the registrant has submitted electronically and posted on its corporate Website, if any, every Interactive Data File required to be submitted and posted pursuant to Rule 405 of Regulation S-T (§232.405 of this chapter) during the preceding 12 months (or for such shorter period that the registrant was required to submit and post such files). Yes ý No ¨ No
¨Indicate by check mark• if disclosure of delinquent filers pursuant to Item 405 of Regulation S-K (§229.405 of this chapter) is not contained herein, and will not be contained, to the best of registrant’s knowledge, in definitive proxy or information statements incorporated by reference in Part III of this Form 10-K or any amendment to this Form 10-K. ¨
Indicate by check mark
• whether the registrant is a large accelerated filer, an accelerated filer, a non-accelerated filer, or a smaller reporting company. See the definitions of “large accelerated filer,” “accelerated filer” and “smaller reporting company” in Rule 12b-2 of the Exchange Act.
Large accelerated filer¨ Accelerated filer¨ýNon-accelerated filer x¨ (Do not check if a smaller reporting company) Smaller reporting company¨
Indicate by check mark• whether the registrant is a shell company (as defined in Rule 12b-2 of the Exchange Act). Yes ¨ No xýThe aggregate market value of voting stock held by non-affiliates of the registrant as of June 30,
20092012 (based on the closing market price on the
NYSE Composite Tape on June 30,
2009)2012) was approximately
$45,224,000 (determined by subtracting the number of shares held by affiliates of Flotek Industries, Inc. on that date from the total number of shares outstanding on that date).$460,882,000. At
May 12, 2010,March 4, 2013, there were
30,091,15147,330,653 outstanding shares of
Flotek Industries, Inc.the registrant’s common stock, $0.0001 par value.
DOCUMENTS INCORPORATED BY REFERENCE
None
EXPLANATORY NOTE
Flotek Industries, Inc. (the “Company”) is filing this amendment to its
The information required in Part III of the Annual Report on Form 10-K is incorporated by reference to the registrant’s definitive proxy statement to be filed pursuant to Regulation 14A for the fiscal year ended December 31, 2009, which was originally filed with the Securities and Exchange Commission on March 31, 2010 (the “Original Filing”), and amended by theregistrant’s 2013 Annual Report on Form 10-K/A (Amendment No. 1) filed on April 30, 2010, to include restated financial statements as described in Note 1 to the consolidated financial statements. The financial statements are being restated due to adoptionMeeting of FASB ASC 815-40-15-5 (“ASC 815-40”, formerly EITF 07-5), “Determining Whether an Instrument (Or Embedded Feature) Is Indexed to an Entity’s Own Stock,” which became effective asStockholders.
Table of January 1, 2009 and indicates that the anti-dilution price protection features in the Company’s outstanding warrants require accounting for the fair value of the warrants as a liability. The restated financial statements account for the reclassification of the Company’s warrants from stockholders’ equity to a warrant liability, and for changes in the fair value of the warrant liability in the statement of operations.The Company’s Original Filing reflected warrants to purchase 10,480,000 shares of the Company’s common stock as stockholders’ equity as of December 31, 2009. In this amendment, such warrants have been reclassified as liabilities in accordance with ASC 815-40. The resulting impact of this accounting change as of and for the year ended December 31, 2009 is a decrease in the Company’s net loss of $0.5 million, a decrease in the Company’s additional paid-in capital of $5.2 million, a decrease in the Company’s accumulated deficit of $0.5 million, and an increase in warrant liability of $4.7 million.
The revisions relate to non-operating and non-cash items as of and for the fiscal year ended December 31, 2009. ASC 815-40 did not impact the Company’s financial statements for periods ending June 30, 2009 or earlier. The restatement does not result in a change in the Company’s previously reported revenues or total cash and cash equivalents shown in its financial statements for the fiscal year ended December 31, 2009.
The items of the Original Filing which are amended and restated by this Annual Report on Form 10-K/A
(Amendment No. 2) as a result of the foregoing are:
Contents
Part II—Item 6—Selected Financial Data
Part II—Item 7—Management’s Discussion and Analysis of Financial Condition and Results of Operations
Part II—Item 8—Financial Statements and Supplementary Data
Part IV—Item 15—Exhibits and Financial Statement Schedules
For the convenience of the reader, this Annual Report on Form 10-K/A (Amendment No. 2) sets forth the Original Filing in its entirety. Other than as described above, none of the other disclosures in the Original Filing have been amended or updated. Among other things, forward-looking statements made in the Original Filing have not been revised to reflect events that occurred or facts that became known to the Company after the filing of the Original Filing, and such forward-looking statements should be read in their historical context. Accordingly, this Annual Report on Form 10-K/A (Amendment No. 2) should be read in conjunction with the Company’s filings with the Securities and Exchange Commission subsequent to the Original Filing.
TABLE OF CONTENTS
| | | | |
PART I
| | 1 |
| | |
Item 1.
| |
| | |
| Item 1. | | |
| | 1 |
| Item 1A. | | |
Item 1A.
| | Risk Factors
| | 6 |
| | |
Item 1B. | | | |
| | 19 |
| Item 2. | | |
Item 2.
| | |
| Item 3. | | |
| | 20 |
| Item 4. | | |
Item 3.
| |
| |
| | Legal Proceedings
| | 21 |
| | |
Item 4.
| | Reserved
| | 21 |
| |
PART II
| | 22 |
| | |
Item 5. | | | |
| | 22 |
| | |
Item 6. | | | |
| | 25 |
| | |
Item 7. | | | |
| | 26 |
| | |
Item 7A. | | | |
| | 46 |
| | |
Item 8. | | | |
| | 47 |
| | |
Item 9. | | | |
| | 81 |
| Item 9A. | | |
Item 9A(T).
| | | |
| | 81 |
| Item 9B. | | |
Item 9B.
| |
| |
| | |
| Item 10. | | |
| | 83 |
| Item 11. | | |
| | |
| Item 12. | | |
| | |
| Item 13. | | |
| | |
| Item 14. | | |
| |
| |
| | 84 |
| | |
Item 15. | | | |
| | 84 |
| |
| | 87 |
i
FORWARD-LOOKING STATEMENTS
We have included in this
This Annual Report on Form 10-K (the “Annual Report”), and from time to time our management may make, statements that may constitutein particular, Part II, Item 7 - “Management’s Discussion and Analysis of Financial Condition and Results of Operations,” contains “forward-looking statements” within the meaning of the safe harbor provisions, 15 U.S.C. § 78u-5, of the Private Securities Litigation Reform Act of 1995.1995 (“the Reform Act”). Forward-looking statements are not historical facts but instead represent only ourthe Company’s current beliefassumptions and beliefs regarding future events, many of which, by their nature, are inherently uncertain and outside ourthe Company’s control. The forward-looking statements contained in this Annual Report are based on information available as of the date of this Annual Report. Many of theseThe forward looking statements relate to future industry trends actions, futureand economic conditions, forecast performance or results of current and anticipatedfuture initiatives and the outcome of contingencies and other uncertainties that may have a significant impact on ourthe Company’s business, future operating results and liquidity. We try, whenever possible, to identify theseThese forward-looking statements generally are identified by using words such as “anticipate,” “believe,” “estimate,” “continue,” “intend,” “expect,” “plan,” “forecast,” “project” and similar expressions, foror future-tense or conditional constructions (“will,such as “will,” “may,” “should,” “could,” etc.). We caution you The Company cautions that these statements are onlymerely predictions and are not to be considered guarantees of future performance. These forward-lookingForward-looking statements are based upon current expectations and our actual results, developments and businessassumptions that are subject to certainrisks and uncertainties that can cause actual results to differ materially from those projected, anticipated or implied. A detailed discussion of potential risks and uncertainties that could cause actual results and events to differ materially from those anticipated by these statements. By identifying theseforward-looking statements for youis included in Part I, Item 1A – “Risk Factors” in this manner, we are alerting you toAnnual Report and periodically in future reports filed with the possibility that our actual results may differ, possibly materially, from the anticipated results indicated in these forward-looking statements. We assumeSecurities and Exchange Commission (the “SEC”).
The Company has no obligation to publicly update or revise any forward-looking statements, whether as a result of new information or future events, except as required by law. Important factors that could cause actual results to differ from those in the forward-looking statements include, among others, those discussed under “Item 1A. Risk Factors,” “Item 7. Management’s Discussion and Analysis
Item 1. Business.
Flotek Industries, Inc. (“Flotek” or the “Company”) is a diversified global supplier of drilling and production related products and servicesservices. The Company’s strategic focus, and that of all wholly owned subsidiaries (collectively referred to as the oil and gas industry. Our core focus is“Company”), includes oilfield specialty chemicals and logistics, downhole drilling tools and downhole production tools. Ontools used in the energy and mining industries. In December 27, 2007, ourthe Company’s common stock began trading on the New York Stock Exchange (“NYSE”) under the stock ticker symbol “FTK.” Our website is located athttp://www.flotekind.com. We make available free of charge on or through our internet website our Annual Reportsreports on Form 10-K, quarterly reports on Form 10-Q, current reports on Form 8-K, and amendments to those reports filed or furnished pursuant to Section 13(a) or 15(d) of the Securities Exchange Act of 1934, as amended (the “Exchange Act”) are posted to the Company’s website, www.flotekind.com, as soon as reasonably practicable aftersubsequent to electronically filing such material with, or furnishing it to the Securities and Exchange Commission (“SEC”).SEC. Information contained in ourthe Company’s website or links contained on our website areis not to be considered as part of thisany regulatory filing. As used herein, “Flotek,” the “Company,” “we,” “our” and “us” may referrefers to Flotek Industries, Inc. and/or itsthe Company’s wholly owned subsidiaries. The use of these terms is not intended to connote any particular corporate status or relationships.relationship. Historical Developments
Flotek
The Company was originally incorporated
under the laws ofin the Province of British Columbia on May 17, 1985.
OnIn October
23, 2001,
we approved a change in ourthe Company moved the corporate domicile to
the state of Delaware and
effected a
120 to 1 reverse stock split
by way of
120 to 1. On October 31, 2001, we completed a reverse merger with CESI Chemical, Inc. (“CESI”). Since
that date, we havethen, the Company has grown through a series of
acquisitions.For information relating to our acquisitions during 2008 and 2007, refer to Part II, “Item 7. Management’s Discussion and Analysis of Financial Condition and Results of Operations” and Note 3 to the consolidated financial statements included in Part II, “Item 8. Financial Statements and Supplementary Data.”
organic growth.
Description of Operations
Our business is organized into
The Company has three strategic business
units or segments: Chemicals and Logistics
(“Chemicals”), Drilling Products
(“Drilling”) and Artificial Lift. Each segment offers
variouscompetitive products and services
derived from patented technological advances that are reactive to industry demands in both domestic and
requires different technology and marketing strategies. All three segments market products domestically and internationally.For financialinternational markets.
Financial information regarding
each segmentoperational segments and geographic
areas in which we operate, see Note 17 to the consolidated financial statements included inconcentration is provided within this Annual Report. See Part II,
“Item 8. FinancialItem 8 – “Financial Statements and Supplementary
Data.Data,”
Note 16 – Segment Information; in the Notes to Consolidated Financial Statements for additional information.
Chemicals
The Chemicals
business provides oil and
LogisticsThe chemical business offers a full spectrum of oil field andnatural gas field specialty chemicals used for use in drilling, cementing, stimulation and production activities designed to maximize recovery fromwithin both new and mature fields. OurThese specialty chemicals are key to the success of this business segment. Our specialty chemicals havepossess enhanced performance characteristics and are manufactured to withstand a widebroad range of downhole pressures, temperatures and other well-specific conditions. We operateconditions to be compliant with customer specifications. The Company has two laboratories,operational laboratories: 1) a technical services laboratory and 2) a research and development laboratory, which focuslaboratory. Each focuses on design improvements, development and viability testing of new chemical formulations, andas well as continued enhancement of existing products, often in cooperation with our customers.
Our CESIproducts. Chemicals branded micro-emulsionscomplex nano-fluid™ technologies (“CnF”) are patented (US & foreign)both domestically and internationally and are therefore unique in theproven strategically cost-effective performance additives within both oil and natural gas market. Micro-emulsionsmarkets. The CnF® mixtures are environmentally friendly stable mixtures of oil, water and surface active agents forming a complex nano-fluid in which theorganize molecules are organized (or assembled) into nanostructures. The combinationcombined advantage of solvent,
solvents, surface active agent(s) and structure provide betterdrilling structures result in improved well treatment results thanas compared to the independent use of solventsolvents and surface active agent(s) alone. CESI’s micro-emulsions are. CnF® is composed of renewable, plant derived, cleaning ingredients and oils andthat are certified as biodegradable. Some of the micro-emulsionsCertain CnF® products have received approvalbeen approved for use in the North Sea, meetingwhich has some of the most stringent oil field environmental standards in the world. CESI’s micro-emulsions have documentedThe CnF® has resulted in improved operational and financial benefitresults for our customers in both low permeability sand and shale reservoirs.
Our logistics
The Logistics business designs,
projectoperates and manages
and operates automated bulk material handling and loading
facilities for oilfield service companies. Thesefacilities. The bulk facilities handle oilfield products, including sand and other materials for well-fracturing operations, dry cement and additives for oil and
natural gas well cementing, and
supplies andsupply materials used in oilfield
operations, which we blend to customer specification.operations.
The Company is a leading provider of downhole drilling tools usedfor use in the oilfield, mining, water-well and industrial drilling sectors. We manufacture, sell, rentactivities. Further, the Company manufactures, sells, rents and inspectinspects specialized equipment for useused in drilling, completion, production and workover activities. Through internal growth initiatives, operational best practices and acquisitions, we havethe Company has realized increased the size and breadth of our rental tool inventoryactivity and has broadened the geographic market scope of operations so that we now conductoperations. Established tool rental operations are strategically located throughout the United States (the “U.S.”) and in selectan increasing number of international markets. Our rentalRental tools include stabilizers, drill collars, reamers, wipers, jars, shock subs, wireless survey, and measurement while drilling (“MWD”) tools and mud-motors, while equipmentmud-motors. Equipment sold primarily includes mining equipment, centralizers and drill bits. We focus ourThe Company remains focused
on product marketing
efforts primarily in the Southeast, Northeast, Mid-Continent and Rocky Mountain regions of the
United States, withU.S., as well as in select international
sales currently conductedmarkets through
third party agentsboth direct and
employees.agent-based sales.
Artificial Lift
We provide
The Company provides pumping system components,
including electric submersible pumps
or ESPs,(“ESPs”), gas separators, production valves and
complementary services.
OurArtificial Lift products
addresssatisfy the
needsrequirements of coal bed methane and traditional oil and
natural gas production
to efficiently moveand assist natural gas, oil and other fluids
movement from the producing horizon to the surface.
Several of our Artificial Lift products employ
uniqueproprietary technologies
instrumental to
improveimproved well performance.
Our patentedPatented products within the Company’s Petrovalve product
optimizesline optimize pumping efficiency in horizontal
well completions
as well as in heavy oil
wells and wells with high liquid to gas ratios.
This unique valve can bePetrovalve products placed horizontally
results in increasedincrease flow per stroke and
eliminateseliminate gas locking
by replacing theof traditional ball and seat
valvevalves that
requirestraditionally require more maintenance.
Furthermore, ourThe patented gas separation technology is particularly
applicable foreffective in coal bed methane production,
as it efficiently
separatesseparating gas and water downhole
as well as ensuring solution gas is not lost in water production.
Because gas isGas separated downhole
it reducescontributes to a reduction in the environmental impact of escaped gas at the surface. The majority of
our products for Artificial Lift
products are manufactured in China, assembled domestically and distributed globally.
Seasonality
On an overall basis, our segment
Overall, operations are not
generally affected by seasonality.
CertainWhile certain working capital components
may build and recede
duringthroughout the year
reflectingin conjunction with established selling cycles
and business cyclesthat can impact
our operations and financial position,
when compared to other periods, but we dothe Company does not consider
our operations to be highly seasonal.
However, theThe performance of
certain services
in allwithin each of the Company’s segments,
may be temporarily affected byhowever, is susceptible to both weather and
natural phenomena. Examples of how suchnaturally occurring phenomena,
can impact our business include:including: the severity and duration of the winter temperatures in North America, can have a significant impact onwhich impacts natural gas storage levels, and drilling activity for natural gas;
and commodity prices;the timing and duration of the Canadian spring thaw in Canada directly affectsand resulting restrictions that impact activity levels due to road restrictions;levels;
the timing and
impact of hurricanes can disruptupon coastal and offshore operations.
operations; and
In addition,
certain Federal land drilling restrictions during identified breeding seasons of protected bird species in key Rocky Mountain coal bed methane producing regions. These restrictions generally have a negative impact on Artificial Lift operations in the
results of operationsfirst or second quarters of the
Chemical and Logistics segment are historically stronger in the fourth quarter of the year due to higher spending near the end of the year by our customers. Also, the results of operations of our Artificial Lift segment are historically weaker in the second quarter due to restrictions on drilling on federal lands because of the breeding season of certain bird species.year.
Product Demand and Marketing
The demand
Demand for
ourthe Company’s products and services is
generally correlated to the leveldependent on levels of natural gas
storage and
to a lesser extentproduction, conventional and non-conventional oil
and natural gas well drilling
activity,and corresponding work-over activity,
and gas production levels, both
in the United Statesdomestically and internationally.
We market our products primarilyProducts are marketed directly to customers through
Flotek's direct sales
to our customers throughforce and certain contractual agency arrangements and sales
employees with the assistance of operations employees and Company management. We have establishedemployees. Established customer relationships
which provide
for repeat sales
inopportunities within all
of our segments.
The majority of our marketingMarketing is currently
conductedconcentrated within the
United States.U.S. Internationally,
we operatethe Company primarily
markets products and services through
the use of third party agents
as well as direct sales in Canada, Mexico, Central
andAmerica, South America, the Middle East, and Asia.
Customers
CustomersThe Company’s customers for our products and services include major integrated oil and natural gas companies, independent oil and natural gas companies, pressure pumping service companies and state-owned national oil companies. One of ourFor the year ended December 31, 2012, the Company had three customers Halliburton Company and its affiliated companies,that accounted for 17%16%, 20%10% and 21%9% of consolidated revenue, respectively. For the years ended December 31, 2011 and 2010, the Company had a single customer that accounted for 13% and 11% of our consolidated revenuesrevenue, respectively. In aggregate, the Company’s top three customers collectively accounted for 35%, 28% and 18% of consolidated revenue for the years ended December 31, 2009, 20082012, 2011 and 2007,2010, respectively. Our top three customers accounted for 22%, 26% and 25% of consolidated revenues for the years ended December 31, 2009, 2008 and 2007, respectively.
Research and Development
We are
The Company is engaged in research and development activities directed primarily towardfocused on the improvement of existing products and services, the design of specialized “customer need” products to meet customer needs and the development of new products, processes and services. We incurred $2.1 million, $1.9 million and $0.8 million in research and development expenses forFor the years ended December 31, 2009, 20082012, 2011 and 2007, respectively. In 2009, our2010 the Company incurred $3.2 million, $2.3 million and $1.4 million, respectively of research and development spendingexpenses. In 2012, research and development expense was approximately 1.9%1.0% of consolidated revenues. We intendrevenue. The Company expects to maintain our near-term2013 research and development investment at levels consistent with 20092012 expenditures. Due to the nature of our businessthe Company’s contractual customer relationships and contracts with our customers, we dooperational management, the Company has historically not experience anyhad significant amountbacklog order activity.
Intellectual Property
We have followed a
The Company’s policy
of seekingis to ensure patent protection, both within and outside
of the
United StatesU.S., for
all products and methods
that appeardeemed to have commercial significance and
to qualify for patent protection. The decision to
seekpursue patent protection
depends onis dependent upon whether
suchpatent protection can be obtained,
on a cost-effective basiscost-effectiveness and
is likely to be effective in protecting ouralignment with operational and commercial interests.
We believe ourThe Company believes patents and trademarks,
togethercombined with
our trade secrets,
and proprietary
design,designs, manufacturing and operational expertise are
reasonably adequateappropriate to protect
our intellectual property and
provide for theensure continued
operation of our business. We maintainstrategic business operations. The Company currently has patents
pending on
our production valve design, casing centralizer design, ProSeries
tools,tool design and trade
secrets, and havesecrets. Existing patents
pending on certain specialty chemicals. Patents expire at various dates during
2021 and 2022.2022 through 2023.
The ability to compete in the oilfield services
marketindustry is dependent
on ourupon the Company’s ability to differentiate
our products and services, provide superior quality and service, and maintain a competitive cost structure. Activity levels in
our threeall segments are
driven primarilyimpacted by current and expected commodity prices,
vertical and horizontal drilling rig count,
other oil and
natural gas
drilling activity, production levels and customer capital spending allocated for drilling and production. Theproduction designated capital spending. Domestic and international regions in which we operateFlotek operates are highly competitive. The competitive environment has intensified as recentcontinues to intensify due to mergers among oil and gas companies have reducedand the reduction in the number of available customers, reducing the number of current and prospective customers. Additionally,The 2012 global energy environment and global economy was exposed to volatile energy prices, domestic and global natural disasters, continued financial instability of European countries, and political turmoil and unrest throughout the recent downturn inMiddle East petroleum producing countries. The unpredictability of the economyenergy industry and commodity prices have causedprice fluctuations creates both increased risk and opportunity for the market for our services of both the Company and that of our competitors, which may vary significantly by geographical region, to contract. Many otherits competitors.
Certain oil and
natural gas service companies
competing with Flotek are larger
than we are and have
greater resources than we have. Theseaccess to more resources. Such competitors
maycould be better
ablesituated to withstand industry downturns, compete on the basis of price, and acquire
and develop new equipment and
technologies,technologies; all of which could affect
ourthe Company’s revenue and profitability.
These competitorsOil and natural gas service companies also compete
with us both for customers and
for acquisitions of other businesses. Thisstrategic business opportunities. Thus, competition
may cause our business to suffer. We believecould have a detrimental impact upon the Company’s business. The Company expects that competition for contracts and margins will
continue to beremain intense in the
foreseeable future.future but considers that improvements in existing and developmental products and services will enable the Company to realize incremental gains in market share in 2013.
Raw Materials
We believe that materials
Materials and components used in ourthe Company’s servicing and manufacturing operations, andas well as those purchased for sale, are generally available on the open market and from multiple sources, although collectionsources. Collection and transportation of these raw materials to ourCompany facilities canhowever could be adversely affected by extreme weather conditions. However,Additionally, certain raw materials used by our Chemical and Logistics segment in the manufacture of our patented micro-emulsion chemicalsChemicals segments are available from limited sources, and disruptionssources. Disruptions to our suppliers could materially impact our sales. The prices we paypaid for raw materials may be affected by, among other things,are contingent on energy, steel and other commodity prices;price fluctuations, tariffs, and duties on imported materials;materials, foreign currency exchange rates; the generalrates, business cycle position and global demand. During 2009,2012, the pricesprice of manycertain raw materials declined; however, we expect to see prices increaseincreased over 2011 levels and additional increases are anticipated in 2010.2013. Higher prices andcombined with lower availability of chemicals, steel and other raw materials used in our business maycould adversely impact future period sales and margins. Our contract fulfillments. The Company is diligent in identification of alternate suppliers and contingency planning efforts in the event of supply shortages and proactive with efforts to realize purchase price efficiencies through competitive bidding practices.
Drilling
Products and Artificial Lift segments purchase
the principal raw
materialmaterials and steel on the open
market. Except for a few chemical additives,market from numerous suppliers. When able, the
raw materials are available in most cases from several suppliers at market prices. Where we can, we useCompany uses multiple suppliers, both domestically and internationally, for
our keyall raw materials purchases.
We also maintain
Drilling maintains a three to six month supply of
key mud-motor inventory parts
that are primarily sourced from
Chinainternational and domestic suppliers as well as an equivalent amount of
stock of parts
necessary to meet forecast demand within
our Artificial Lift
segment. Thisoperations. The Company’s inventory
stock position approximates the lead time required to secure
these parts
in order to avoid disruption of service to
our customers.
Government Regulations
We are
The Company is subject to federal, state and local environmental,
and occupational safety and health laws and regulations
inwithin the
United StatesU.S. and other countries in which
we dothe Company does business.
We are subjectThe Company strives to
numerous environmental, legal, andensure full compliance with all regulatory requirements
related to our operations worldwide. We strive to comply fully with these requirements and
are not awareis unaware of any material instances of noncompliance. In the
United States, theseU.S., compliance laws and regulations include, among others:
the Comprehensive Environmental Response, Compensation and Liability Act;
the Resource Conservation and Recovery Act;
the Federal Water Pollution Control Act; and
the Toxic Substances Control Act.
In addition to
theU.S. federal laws and regulations,
states andthe Company does business in other countries
where we do business may have numerouswith extensive environmental, legal, and regulatory requirements by which
wethe Company must abide.
We evaluateLaws and
addressregulations strictly govern the manufacture, storage, handling, transportation, use and sale of chemical products. The Company evaluates the environmental impact of
our operations by assessingall Company actions and
remediatingattempts to quantify the price of contaminated
propertiesproperty in order to
identify and avoid
future liabilities and complypotential liability, as well as maintain compliance with
environmental, legal, and regulatory requirements.
ManySeveral of
theChemicals products
within our Chemicals and Logistics segment are considered hazardous or flammable. IfIn the event of a leak or spill occurs in connectionassociation with ourCompany operations, we could incurthe Company is exposed to risk of material costs,cost, net of insurance proceeds, to remediate any resulting contamination. On occasion, we are
The Company is occasionally involved in
specific environmental litigation and claims, including
the remediation of properties
we ownowned or
have operated,operated. No environmental litigation or claims are being litigated as
well as efforts to meet or correct compliance-related matters. We doof the date of this Annual Report filing. The Company does not expect costs related to
theseknown or unknown remediation requirements to have a material adverse effect on
ourthe Company’s consolidated financial position or
our results of operations.
At December 31, 2012, the Company had 405 employees, exclusive of
March 16, 2010, we had approximately 320 employees worldwide.existing worldwide agency relationships. None of
ourthe company’s employees are covered by
a collective bargaining
agreementsagreement and
our labor relations are generally
good. In certainpositive. Certain international
locations,location changes in staffing or work arrangements
may need approval ofare contingent upon local
workswork councils or other
bodies.regulatory approval.
Available Information
The Company’s website is accessible at We maintain a web site atwww.flotekind.com. We make available, free of charge, on the “Investor Relations” section of our web site, our Annual Reportsreports on Form 10-K, quarterly reports on Form 10-Q, current reports on Form 8-K and amendments to those reports filed or furnished pursuant to Section 13(a) or 15(d) of the Exchange Act are available (see “Investor Relations” section of the Company’s website), as soon as reasonably practicable after wesubsequent to the Company electronically filefiling or furnish such materialsotherwise providing reports to the SEC. Additionally, our corporateCorporate governance materials, including governance guidelines; the charters of the Audit, Compensation,guidelines, charter and Governance and Nominating Committees; and the code of conduct mayare also be found underavailable on the “Investor Relations” section of our web site atwww.flotekind.com.website. A copy of the foregoing corporate governance materials is available upon written request.request to the Company.
You may read and copy any materials we fileAll material filed with the SEC at the SEC’s Public“Public Reference RoomRoom” at 100 F Street NE, Washington, DC 20549. You may obtain information20549 is available to be read or copied. Information regarding the Public“Public Reference RoomRoom” can be obtained by callingcontacting the SEC at 1-800-SEC-0330. In addition,Further, the SEC maintains an internetthe www.sec.gov website, atwww.sec.gov thatwhich contains reports and other registrant information regarding registrants that filefiled electronically with the SEC, including us.SEC.We
The 2012 Annual Chief Executive Officer Certification required by the NYSE was submitted
our 2009 annual CEO certification with the New York Stock Exchange (“NYSE”) on
July 9, 2009.June 5 2012. The certification was not qualified in any respect. Additionally,
wethe Company has filed with this
Form 10-K theAnnual Report all principal executive officer and
principal financial officer certifications
as required under Sections 302 and 906 of the Sarbanes-Oxley Act of 2002.
Information with respect to ourthe Company’s executive officers and directors is incorporated herein by reference to information to be included in the Proxy Statementproxy statement for our 2010the Company’s 2013 Annual Meeting of Stockholders.
We have
The Company has disclosed and
intend towill continue to disclose any changes or amendments to
ourthe Company’s code of ethics
oras well as waivers
from ourto the code of ethics applicable to
our chief executive
officer and chief financial officer by controllermanagement by posting such changes or waivers
to ouron the Company’s website.
This document, our other filings with
Item 1A. Risk Factors.
The Company’s business, financial condition, results of operations and cash flows are subject to various risks and uncertainties, including those described below. These risks and uncertainties could cause actual results to vary materially from current or forecast results. The risks below are not all-inclusive of risks that could impact the SEC, and other materials releasedCompany. Additional risks not currently known to the public containCompany or that the Company presently considers immaterial could impact the Company’s business operations.
This Annual Report contains “forward-looking statements,” as defined in the Private Securities Litigation Reform Act of 1995.1995, that involve risks and uncertainties. Forward-looking statements discuss Company prospects, expected revenue, expenses and profits, strategic operational initiatives and other activity. Forward-looking statements also contain suppositions regarding future oil and natural gas industry conditions within both domestic and international market economies. The Company’s results could differ materially from those anticipated in the forward-looking statements as a result of a variety of factors, including risks described below and elsewhere. See “Forward-Looking Statements” at the beginning of this Annual Report on Form 10-K. These forward-looking statementsReport.
Risks Related to the Company’s Business
The Company had profitable operations during 2012 but may discuss our prospects, expected revenue, expensesnot be able to sustain profitable operations in 2013.
The Company’s net income attributable to common stockholders for the years ended December 31, 2012 and profits, strategies for our operations2011 was $49.8 million and other subjects, including conditions$26.5 million, respectively, while the Company experienced a net loss attributable to common stockholders of $50.0 million in 2010. There is no assurance that the oilfield serviceCompany’s 2013 Plan of Operations will be executed successfully or, that the Company will maintain profitability in 2013.
The Company’s business is dependent upon domestic and international oil and natural gas industriesindustry spending. Spending could be adversely affected by industry conditions or by new or increased governmental regulations beyond the Company’s control.
The Company is dependent upon customers’ willingness to make operating and
capital expenditures for exploration, development and production of oil and natural gas in both the North American and global markets. Customers’ expectations of a decline in future oil and natural gas market prices could curtail spending thereby reducing demand for the Company’s products and services. Industry conditions in the
United StatesU.S. are influenced by numerous factors over which the Company has no control, including the supply of and demand for oil and natural gas, domestic and international
economyeconomic conditions, political instability in
general.Our forward-looking statements are basedoil and natural gas producing countries and merger and divestiture activity among oil and natural gas producers. The volatility of oil and natural gas prices and the consequential effect on assumptions that we believeexploration and production activity could adversely impact the Company’s customers' activity levels. One indicator of drilling and production spending is fluctuation in rig count which the Company actively monitors to be reasonable, but that may not prove to be accurate. All of our forward-looking information is, therefore, subject to risksgauge market conditions and uncertainties thatforecast product and service demand. A reduction in drilling activity could cause actual results to differ materially froma decline in the results expected. Although it is not possible to identify all factors, these risks and uncertainties includedemand for, or negatively affect the risk factors discussed below.
Risks Related to Our Business
We have not had profitable operations during 2009 and may not be profitable in 2010.
We have experienced net losses during the last two fiscal years, including a loss in eachprice of, some of the four quartersCompany’s products and services. Domestic demand for oil and natural gas could also be uniquely affected by public attitude regarding drilling in environmentally sensitive areas, vehicle emissions and other environmental standards, alternative fuels, taxation of 2009. There can be no assurance that we will be able to successfully execute our planoil and gas, perception of operations for 2010,“excess profits” of oil and that even if we are successfulgas companies, and anticipated changes in execution of our plan, that we will be profitable in 2010.
governmental regulation and policy.
Demand for
the majoritya significant number of
our servicesCompany products and service is
substantially dependent on the
levelslevel of expenditures
bywithin the oil and
natural gas industry.
Current global economic conditions continue to result in low oil and gas prices. If current global economic conditions and the availability of credit worsen or
continueoil and natural gas prices weaken for an extended period
this could reduce our customers’of time, reductions in levels of
customers’ expenditures
andcould have a significant adverse effect on
our revenue, margins and overall operating results.
The
current global credit and economic environment
has reducedcould impact worldwide demand for
energy and resulted in depressed crudeenergy. Crude oil and natural gas
prices.prices continue to be volatile. A substantial or extended decline in oil
andor natural gas prices
can reduce ourcould impact customers’
activitiesspending for products and
their spending on our services and products.services. Demand for
a significant number of the
majority of ourCompany’s products and services
substantially depends onis dependent upon the level of expenditures
bywithin the oil and gas industry for
the exploration, development and production of crude oil and natural gas reserves.
These expendituresExpenditures are sensitive to oil and natural gas prices,
and generally dependent onas well as the industry’s
view ofoutlook regarding future oil and
natural gas prices.
During the current worldwide deterioration in the financial and credit markets, demand for oil and gas has reduced dramatically and oil and gas prices have fallen, causing some of our customers to reduce or delay their oil and gas exploration and production spending. This has reduced the demand for our services and exertedIncreased competition could also exert downward pressure on
prices charged for Company products and services.. Limited price increases were available to the
prices that we charge. IfCompany in 2012. Volatile economic conditions
do not improve, it could
result in further reductions ofweaken customer exploration and production expenditures,
by our customers, causing
further declines in thereduced demand for
ourCompany products and services and
products. This could result in a significant adverse effect on
ourthe Company’s operating results.
Furthermore, itIt is difficult to predict
how long the
economic downturnpace of any industry growth, whether the economy will
continue, to what extent it might worsen, and to what extent this
will continue tocould affect
us.The reduction inthe Company.
Reduced cash flows being experienced by our customers resulting from declines in commodity prices, together with the reducedflow and capital availability of credit and increased costs of borrowing due to the tightening of the credit markets, could have significant adverse effects onadversely impact the financial condition of some of our customers. Thisthe Company’s customers, which could result in customer project modifications, delays or cancellations, general business disruptions, and delay in, or nonpayment of, amounts that are owed to us, whichthe Company. This could havecause a significant adverse effectnegative impact on ourthe Company’s results of operations and cash flows. Additionally, our suppliers could be negatively impacted by current global economic conditions.
If certain of
ourthe Company’s suppliers were to experience significant cash flow
issuesconstraints or become insolvent as a result of such conditions,
it could result in a reduction or interruption in supplies or a significant increase in the price of supplies
could occur, and adversely impact
ourthe Company’s results of operations and cash flows.
The
pricesprice for oil and natural gas
areis subject to a variety of
additional factors, including:
demand for energy which is affected byreactive to worldwide population growth, economic development and general economic and business conditions;
the ability of the Organization of Petroleum Exporting Countries (“OPEC”) to set and maintain production levels for oil;
levels;production of oil and gas production by non-OPEC countries;
availability and quantity of natural gas storage;
LNG import volume and pricing;
pricing of Liquefied Natural Gas;pipeline capacity to keycritical markets;
political and economic uncertainty and socio-political unrest;
the level of worldwide oil exploration and production activity;
the cost of exploring for, producingexploration, production and deliveringtransport of oil and natural gas;
technological advances affectingimpacting energy consumption; and
OurThe Company’s revolving credit facility has variable interest rates that could increase.
At December 31, 2012, the Company had a $50 million revolving credit facility commitment that remains undrawn. Any borrowings would be at a variable rate of 4.75% at December 31, 2012. The current credit facility remains in effect until December 26, 2017. There can be no assurance that the revolving credit facility will not experience significant interest rate increases.
The Company’s implementation of a new enterprise resource planning (“ERP”) system may adversely affect the Company’s business depends primarilyand results of operations or the effectiveness of internal control over financial reporting.
During the second quarter of 2011, the Company began implementing a new generation of work processes and information systems. The majority of the core functionality of the Company's new ERP system was placed into operational service on
domestic spending byJuly 1, 2012. ERP implementations are complex and time-consuming projects that involve substantial expenditures on system software and implementation activities, and also require transformation of business and financial processes in order to fully exploit the
oil and gas industry, and this spending and our businessbenefits of the ERP system. Subsequent to the "in-service date" of the ERP system, the Company may be
adversely affected by industry conditionsrequired to continue to expend material amounts of resources in order to maintain the new ERP system and train existing personnel or
by new or increased government regulations that are beyond our control.We depend primarily on our customers’ willingness to make operatinghire experienced personnel, capable of using and capital expenditures to explore for, develop and produce oil and gas inmaintaining the United States. Customers’ expectations of market prices for oil and gas may curtail spending thereby reducing demand for our products and services. Industry conditions inERP system. If the United States are influenced by numerous factors over which we have no control, suchERP system does not operate as the supply of and demand for oil and gas, domestic and international economic conditions, political instability in oil and gas producing countries and merger and divestiture activity among oil and gas producers. The volatility of the oil and gas industry and the consequent effect on exploration and production activityintended, it could adversely affect the levelfinancial reporting systems, the Company’s ability to produce financial reports, and/or the effectiveness of drilling and production activity by some of our customers. One indication of drilling and production activity and spending is rig count, which the company monitors to gauge market conditions. A reduction in drilling may cause a decline in the demand for, or adversely affect the price of, our products and services. Reduced discovery rates of new oil and gas reserves in our market areas could also have a negative long-term impact on our business, even in an environment of stronger oil and gas prices. In addition, domestic demand for oil and gas may be uniquely affected by public attitudes regarding drilling in environmentally sensitive areas, vehicle emissions and other environmental standards, alternative fuels, taxation of oil and gas and “excess profits” of oil and gas companies,internal control over financial reporting, and the costs to remediate these deficiencies could be material.
If the Company does not manage the potential difficulties associated with expansion successfully, the Company’s operating results could be adversely affected.
The Company has grown over the last several years through internal growth, strategic alliances, and to a lesser extent, strategic business/asset acquisitions. The Company believes future success will depend, in part, on the Company’s ability to adapt to market opportunities and changes and to successfully integrate the operations of any businesses acquired. The following factors could result in governmental regulationstrategic business difficulties:
lack of experienced management personnel;
increased administrative burdens;
lack of customer retention;
technological obsolescence; and policy
infrastructure, technological, communication and logistical problems associated with large, expansive operations.
If the Company fails to manage potential difficulties successfully, including increased costs associated with growth, the Company’s operating results could be adversely impacted.
The Company’s ability to grow and compete could be adversely affected if adequate capital is not available.
The ability of the Company to grow and compete is reliant on the availability of adequate capital. Access to capital is dependent, in large part, on the Company’s cash flows from operations and the availability of equity and debt financing. The Company cannot guarantee cash flows from operations will be sufficient, or that maythe Company will continue to be able to obtain equity or debt
financing on acceptable terms, or at all, in order to realize growth strategies. As a result,
from such public attitudes.Wethe Company may not be able to generate sufficient cash flows,finance strategic growth plans, to meet our debt service obligationstake advantage of business opportunities or other liquidity needs, and we may not be able to successfully negotiate waivers or a new credit agreement to cure any covenant violations under our current credit agreements.
On several occasions we have failed to meet, or have projected that we would in the future fail to meet, the financial covenant requirements in our bank credit facility. We have been required on these occasions to seek waivers of such covenant violations and amendments to our bank credit facility to modify these covenants. Most recently, we were not in compliance with certain of the financial covenants in our bank credit agreement as of December 31, 2009.
Our ability to generate sufficient cash flows from operations to make scheduled payments or mandatory prepayments on our current debt obligations and other future debt obligations we may incur will depend on our future financial performance, which may be affected by a range of economic, competitive, regulatory and
industry factors, many of which are beyond our control. If as a result of our financial performance or other events we violate the financial covenants in our debt agreements or are unable to generate sufficient cash flows or otherwise obtain the funds required to make principal and interest payments on our indebtedness, we may have to seek waivers of these covenants from our lenders or undertake alternative financing plans, such as refinancing or restructuring our debt, selling assets, reducing or delaying capital expenditures or seeking to raise additional capital through the issuance of debt securities or other securities. We cannot assure you that we will be able to obtain any required waivers from our lenders or that we will be able to accomplish any necessary refinancing, sale of assets or issuance of securities on terms that are acceptable. Our inability to obtain any required waivers, to generate sufficient cash flows to satisfy such obligations, or to refinance our obligations on commercially reasonable terms, would have an adverse effect on our business, financial condition and results of operations.
The tightening of the credit markets or a downgrade in our credit ratings could increase our borrowing costs and make it more difficult for us to access funds, to refinance our existing indebtedness, to enter into agreements for new indebtedness or to obtain funding through the issuance of securities. If such conditions were to persist, we would seek alternative sources of liquidity, but may not be able to meet our obligations as they become due.
Our debt agreements also contain representations, warranties, fees, affirmative and negative covenants, and default provisions. A breach of any of these covenants could result in a default under these agreements. Upon the occurrence of an event of default under our debt agreements, the lenders could elect to declare all amounts outstanding to be immediately due and payable and terminate all commitments to extend further credit. If the lenders accelerate the repayment of borrowings, we may not have sufficient assets to repay our indebtedness. Also, should there be an event of default, or should we need to obtain waivers following an event of default, we may be subject to higher borrowing costs and/or more restrictive covenants in future periods. Acceleration of any obligation under any of our material debt instruments will permit the holders of our other material debt to accelerate their obligations.
On March 31, 2010, we entered into an Amended and Restated Credit Agreement with new lenders which refinanced our existing bank credit facility. The new credit agreement restricts the payment of dividends and does not contain a revolving line of credit facility, however, it does not contain quarterly or annual covenants. See “Item 8. Financial Statements and Supplementary Data,” Note 19 of our consolidated financial statements for a description of our new senior credit facility.
Our new senior credit facility contains certain covenants that could limit our flexibility and prevent us from taking certain actions, which could adversely affect our ability to execute our business strategy.
Our new senior credit facility, as amended includes a number of significant restrictive covenants. These covenants could adversely affect us by limiting our ability to plan for or react to market conditions, meet our capital needs and execute our business strategy. The new senior credit facility contains covenants that, among other things, limit our ability, without the consent of the lender, to:
incur certain types and amounts of additional debt;
consolidate, merge or sell our assets or materially change the nature of our business;
pay dividends on capital stock and make restricted payments;
make voluntary prepayments, or materially amend the terms, of subordinated debt;
enter into certain types of transactions with affiliates;
make certain investments;
level of capital expenditures;
make certain capital expenditures; and
These covenants may restrict our operating and financial flexibility and limit our ability to respond to changes in our business or competitive activities. If we fail to comply with these covenants, we could be in default, and our new senior credit facility lender could elect to declare all the amounts borrowed and due to them, together with
accrued and unpaid interest, to be due and payable. In addition, we or one or more of our subsidiaries could be forced into liquidation or bankruptcy. Any of the foregoing consequences could restrict our ability to execute our business strategy. In addition, such default and acceleration of our new senior credit facility could lead to a default under our convertible senior notes.
Ourpressures.
The Company’s future success and profitability may be adversely affected if
wethe Company or
ourthe Company’s suppliers fail to develop
andand/or introduce new and innovative products and
services that appeal to our customers.services.
The oil and natural gas drilling industry is characterized by continual technological developmentsadvancements that have historically resulted in, and will likely will continue to result in, substantial improvements in the scope and quality of oilfield chemicals, drilling and artificial lift products and services and product function and performance. As a result, ourConsequently, the Company’s future success depends,is dependent, in part, upon ourthe Company’s and ourthe Company’s suppliers’ continued ability to timely develop and introduce new and innovative products and services beyond our patented micro-emulsion surfactant lineservices. Increasingly sophisticated customer needs and the ability to address the increasingly sophisticated needs of our customers andtimely anticipate and respond to technological and industryoperational advances in the oil and natural gas drilling industry in a timely manner.is critical. If wethe Company or ourthe Company’s suppliers fail to successfully develop and introduce new and innovative products and services that appeal to our customers, or if new market entrants or our competitors offer suchdevelop superior products and services, ourthe Company’s revenue and profitability could suffer.
The Company may
suffer.We intend to pursue strategic acquisitions, which could have an adverse impact on ourthe Company’s business.
Our business strategy includes growing our business
The Company remains committed to growth through strategic acquisitions ofand alliances with complementary businesses as our capital structure permits. Acquisitions that we have made or that we may make in the future may entail a number ofbusinesses. The Company’s historical and potential acquisitions involve risks that could adversely affect ourthe Company’s business climate and results of operations. The processNegotiations of negotiating potential acquisitions or integratingintegration of newly acquired businesses into our business could divert our management’s attention from other business concerns and couldas well as be expensivecost prohibitive and time consuming. Acquisitions could also expose our businessthe Company to unforeseen liabilities or risks associated with entering new markets or businesses. Consequently, we might not be successful in integrating ourUnforeseen operational difficulties related to acquisitions into our existing operations, which maycould result in unforeseen operational difficulties or diminished financial performance or require a disproportionate amount of ourthe Company’s management’s attention and resources. Even if we are successful in integrating ourAdditional acquisitions into our existing operations, we may not derive the benefits, such as operational or administrative synergies, that we expect from such acquisitions, which maycould result in the commitment of capital resources without the realization of anticipated returns onreturns.
Unforeseen developments in contingencies such
capital. In addition, we may not be able to continue to identify attractive acquisition opportunities or successfully acquire identified targets. Competition for acquisition opportunities may escalate, increasing our cost of making further acquisitions or causing us to refrain from making additional acquisitions. We also must meet certain financial covenants in order to borrow money under our new senior credit facility to fund future acquisitions and to borrow for other purposes which, if not met, could prevent us from making future acquisitions.If we do not manage the potential difficulties associated with expansion successfully, our operating results could be adversely affected.
We have grown over the last several years through internal growth and strategic acquisitions of other businesses and assets. We believe our future success depends, in part, on our ability to adapt to market opportunities and changes and to successfully integrate the operations of the businesses we acquire. The following factors could present difficulties to our business going forward:
lack of sufficient experienced management personnel;
increased administrative burdens;
technology obsolescence and
increased infrastructure, technological, communication and logistical problems common to large, expansive operations.
If we do not manage these potential difficulties successfully, our operating results could be adversely affected. In addition, we may have difficulties managing the increased costs associated with growth, whichas litigation could adversely affect our operating margins.
Our abilitythe Company’s financial condition.
The Company is, and from time to
growtime may become, a party to legal proceedings incidental to the Company’s business involving alleged injuries arising from the use of Company products, exposure to hazardous substances, patent infringement, employment matters and
compete incommercial disputes. The defense of these lawsuits may require significant expenses, divert management’s attention, and may require the
future willCompany to pay damages that could adversely affect the Company’s financial condition. In addition, any insurance or indemnification rights that the Company may have may be
adversely affected if adequate capital is not available.insufficient or unavailable to protect against potential loss exposures.
The
ability of our business to grow and compete depends on the availability of adequate capital, which in turn depends in large part on our cash flow from operations and the availability of equity and debt financing. We cannot assure you that our cash flow from operations will be sufficient or that we will be able to obtain equity or debt financing on acceptable terms or at all to implement our growth strategy. For example, our new senior credit facility restricts our ability to incur additional indebtedness, including borrowings to fund future acquisitions, a key component of our growth strategy. As a result, we cannot assure you that adequate capital will be available to finance our current growth plans, take advantage of business opportunities or respond to competitive pressures, any of which could harm our business.OurCompany’s current insurance policies may not be adequate toadequately protect ourthe Company’s business from all potential risks.
Our
The Company’s operations are subject to
hazardsrisks inherent in the oil and
natural gas industry, such as, but not limited to, accidents, blowouts, explosions, fires, severe weather, oil and chemical spills and other hazards. These conditions can
causeresult in personal injury or loss of life, damage to property, equipment and
the environment,
andas well as suspension of
customer’s oil and gas
operations of our customers.operations. Litigation arising from
aany catastrophic occurrence
at a location where
ourthe Company’s equipment, products or services are being used
maycould result in
ourthe Company being named as a defendant in lawsuits asserting large claims.
We maintainThe Company maintains insurance coverage
that we believebelieved adequate and customary to
be customary in the
oil and natural gas industry
againstto mitigate liabilities associated with these
potential hazards.
However, we doThe Company does not have insurance against all foreseeable risks, either because insurance is not available or
because of high premium costs. In addition, weis cost prohibitive. Further, the Company may not
be ablehave the financial wherewithal to maintain adequate insurance
coverage in the
future at rates we consider reasonable. As a result,future. Consequently, losses and liabilities arising from uninsured or underinsured events could have a material adverse effect on
ourthe Company’s business, financial condition and results of operations.
We are
The Company is subject to complex foreign, federal, state and local environmental, health and safety laws and regulations, which expose
usthe Company to
costs and liabilities that could have a material adverse effect on
ourthe Company’s business, financial condition and results of operations.
Our
The Company’s operations are subject to foreign, federal, state and local laws and regulations relatingrelated to, among other things, the protection of natural resources, and the environment,injury, health and safety considerations, waste management and transportation of waste and other hazardous materials. Our operations, including ourThe Chemicals and Logistics segment which involves chemical manufacturing, packaging, handling and delivery operations, poseexposes the company to risks of environmental liability that could result in fines, and penalties, expenditures for remediation, and liability for property damage and personal injuries.injury liability. In order to conduct our operations in complianceremain compliant with these laws and regulations, we must obtain and maintainthe Company maintains permits, approvalsauthorizations and certificates as required from various foreign, federal, state and local governmentalregulatory authorities. Sanctions for noncompliance with such laws and regulations maycould include assessment of administrative, civil and criminal penalties, revocation of permits and issuance of corrective action orders. We may
The Company could incur substantial costs in order to maintainensure compliance with these existing and future laws and regulations. Laws protecting the environment have generally have become more stringent over time and are expected to continue to do so, whichevolve and become more complex and
restrictive into the future. Failure to comply with applicable laws and regulations could
lead toresult in material
increases in costs forexpense associated with future environmental compliance and
remediation. In addition, ourremediation expense. The Company’s costs of compliance
maycould also increase if existing laws and regulations are amended or reinterpreted. Such amendments or reinterpretations of existing laws or regulations or the adoption of new laws or regulations could curtail exploratory or developmental drilling for and production of oil and
natural gas which, in turn, could limit demand for
ourthe Company’s products and services. Some environmental laws and regulations
maycould also impose joint and strict liability
which meansmeaning that in
somecertain situations
wethe Company could be exposed to
liabilityincreased liabilities as a result of
ourthe Company’s conduct that was lawful at the time it occurred or conduct of, or conditions caused by, prior operators or other third parties.
Clean-up costsRemediation expense and other damages arising as a result of such laws and regulations could be substantial and have a material adverse effect on
ourthe Company’s financial condition and results of operations.
Material levels of
ourthe Company’s revenue are derived from customers
that engageengaged in hydraulic fracturing services, a process that creates fractures extending from the well bore through the rock formation to enable natural gas or oil to
moveflow more easily through the rock pores to a production well. Bills pending in the
United StatesU.S. House and Senate
as well as proposals before state legislatures and federal and state regulatory authorities have asserted that chemicals used in the fracturing process
could adversely affect drinking water supplies. The proposed legislation
wouldcould require the reporting and public disclosure of
chemicals used in thecurrent proprietary fracturing
process. This legislation,chemical formulas. Legislation, if adopted, could establish
an additional
levellevels of
regulation at the federal
leveland/or state regulation that could
lead toresult in operational delays and increased operating costs.
Some states have adopted regulations which require operators to publicly disclose certain non-proprietary information. The adoption of any future federal or state laws or
implementinglocal requirements or the implementation of regulations imposing reporting obligations on, or otherwise limiting, the hydraulic fracturing process could
make it more difficult to completeincrease the difficulty of oil and natural gas
and oil wellswell production activity and could have an adverse
impacteffect on
our futurethe Company’s 2013 forecast results of operations, liquidity and financial condition.
Regulation of greenhouse gases
andand/or climate change could have a negative impact on
ourthe Company’s business.
Some
Certain scientific studies have suggested that emissions of certain gases, commonly referred to as
greenhouse gases and including“greenhouse gases”, which include carbon dioxide and methane, may be
contributingcontributory to
the warming
effect of the Earth’s atmosphere and other climatic changes. In response to such studies, the issue of climate change and the effect of greenhouse gas emissions, in particular emissions from fossil fuels, is attracting increasing
attention worldwide.worldwide attention. Legislative and regulatory measures to address
concerns thatgreenhouse gas emissions
have not yet been finalized as of
greenhouse gases are contributing to climate change are in various phasesthe date of
discussions or implementation at thethis Annual Report but remain impactive across international, national, regional and state levels.
In 2005, the Kyoto Protocol to the 1992 United Nations Framework Convention on Climate Change, which establishes a binding set of emission targets for greenhouse gases, became binding on the countries that had ratified it. In the United States, federal legislation imposing restrictions on greenhouse gases is under consideration. Proposed legislation has been introduced that would establish an economy-wide cap on emissions of greenhouse gases and would require most sources of greenhouse gas emissions to obtain greenhouse gas emission “allowances” corresponding to their annual emissions. In addition, the Environmental Protection Agency (the “EPA”) is taking steps that would result in the regulation of greenhouse gases as pollutants under the Clean Air Act. To date, the EPA has issued (i) a “Mandatory Reporting of Greenhouse Gases” final rule, effective December 29, 2009, which establishes a new comprehensive scheme requiring operators of stationary sources in the United States emitting more than established annual thresholds of carbon dioxide-equivalent greenhouse gases to inventory and report their greenhouse gas emissions annually; and (ii) an “Endangerment Finding” final rule, effective January 14, 2010, which states that current and projected concentrations of six key greenhouse gases in the atmosphere, as well as emissions from new motor vehicles and new motor vehicle engines, threaten public health and welfare, allowing the EPA to finalize motor vehicle greenhouse gas standards (the effect of which could reduce demand for motor fuels refined from crude oil). Finally, according to the EPA, the final motor vehicle greenhouse gas standards will trigger construction and operating permit requirements for stationary sources. As a result, the EPA has proposed to tailor these programs such that only large stationary sources will be required to have air permits that authorize greenhouse gas emissions.
Existing or future laws, regulations, treaties or international agreements related to greenhouse gases and climate change, including
incentives to conserve energy
conservation or
use alternative energy
sources,incentives, could have a negative impact on
ourthe Company’s operations if
such laws, regulations
treaties or international agreements reduce theresulted in a reduction in worldwide demand for oil and natural gas or
otherwise result in reducedglobal economic
activity generally. In addition, such laws, regulations, treaties or international agreementsactivity. Other results could
result inbe increased compliance costs
orand additional operating restrictions,
each of which
maywould have a negative impact on
ourthe Company’s operations.
In addition to potential impacts on ourLastly, the Company’s operations
directly or indirectly resulting from climate-change legislation or regulations, our operations also could be negatively
affectedimpacted by
climate-change related physical changes or changes in weather patterns.
Changes in regulatory compliance obligations of critical suppliers may adversely impact our operations.
The Dodd-Frank Wall Street Reform and Consumer Protection Act, (“Dodd-Frank Act”), signed into law on July 21, 2010, includes Section 1502, which requires the Securities and Exchange Commission to adopt additional disclosure requirements related to certain minerals sourced from the Democratic Republic of Congo and surrounding countries, or conflict minerals, for which such conflict minerals are necessary to the functionality of a product manufactured, or contracted to be manufactured, by an SEC reporting company. The metals covered by these rules, which were adopted on August 22, 2012, include tin, tantalum, tungsten and gold. The Company and Company suppliers may use these materials in the production processes. These rules are currently being challenged in court. In order to be able to accurately report the Company's compliance with Section 1502, the Company will have to perform supply chain due diligence, third-party verification and possibly private sector audits on the sources of these metals all the way down to the mine of origin. Global supply chains are complicated, with multiple layers and suppliers between the mine and the final product. Accordingly, the Company will likely incur significant cost related to the compliance process. While the impact of Section 1502 on the Company's business is uncertain at this time, difficulty could potentially occur in procuring needed materials from conflict-free sources and in satisfying the associated disclosure requirements.
If
we arethe Company is unable to adequately protect
our intellectual property rights or
areis found to infringe
upon the intellectual property rights of others,
ourthe Company’s business is likely to be adversely affected.
We rely
The Company relies on a combination of patents, trademarks, non-disclosure agreements and other security measures to establish and protect
ourthe Company’s intellectual property rights. Although
we believethe Company believes that
thoseexisting measures are reasonably adequate to protect
our intellectual property
and provide for the continued operation of our business,rights, there
can beis no assurance that the measures we have taken or may take in the future, will prevent misappropriation of our proprietary information or provide us with a competitive advantage, or thatdissuade others will not independently developfrom independent development of similar products or services, design around our proprietary or patented technology or duplicate our products or services. Moreover, there can beis no assurance that these protectionsthe Company will be available in all cases or will be adequateable to prevent our competitors from copying, reverse engineering or otherwise obtaining andand/or using ourthe Company’s technology and proprietary rights orfor products. We haveAs of the date of this Annual Report, the Company has not
sought foreign protection corresponding to
all of our USexisting intellectual property rights. Consequently,
wethe Company may not be able to enforce
all of our intellectual property rights outside of the
United States.U.S. Furthermore, the laws of certain countries in which
ourthe Company’s products
and services are manufactured or marketed may not protect
ourthe Company’s proprietary rights to the same extent as the laws of the
United States. ThirdU.S. Finally, parties may
seek to challenge, invalidate or circumvent
ourthe Company’s patents, trademarks, copyrights and trade secrets. In each case,
ourthe Company’s ability to compete could be significantly impaired.
In addition, some
A portion of
ourthe Company’s products are
not protected by issued patents.without patent protection. The issuance of a patent does not guarantee
that it is validvalidity or
enforceable, so even if we obtainenforceability, Company patents
they may not be valid or enforceable against third parties. The issuance of a patent does not guarantee that
we havethe Company has the right to
practiceuse the patented invention. Third parties may have blocking patents that could be used to prevent
usthe Company from marketing
ourthe Company’s own patented
productproducts and
practicing our ownutilizing the patented technology.
We have from time
The Company is exposed to
time received, and may in the future receive, communications alleging possible infringementallegations of
patentspatent and other intellectual property
rights of others.infringement. Furthermore,
we have in the
past, and may in the future,Company could become involved in costly litigation or proceedings
brought against us regarding patents or other intellectual property rights. If any such claims are asserted against
us, we maythe Company, the Company could seek to obtain a license under the third party’s intellectual property
rights. We cannot assure you that we will be ablerights in order to
obtain all of the necessary licenses on satisfactory terms, if at all.mitigate exposure. In the event
that wethe Company cannot obtain a license,
theseaffected parties
maycould file lawsuits against
usthe Company seeking damages
(potentially including(including treble damages) or an injunction against the sale of
our products that incorporate allegedly infringed intellectual property or against the
operation of our business as presently conducted, whichCompany’s products. These could result in
ourthe Company having to
stopdiscontinue the sale of
some of ourcertain products, increase the
costscost of selling
some of our products, or
causeresult in damage to
ourthe Company’s reputation. The award of damages, including material royalty payments, or the entry of an injunction
order against the manufacture and sale of
some or allany of
ourthe Company’s products, could have a material adverse effect on
ourthe Company’s results of operations and ability to compete.
We
The Company and
ourthe Company’s customers are subject to risks associated with doing business outside of the
United States which may expose us toU.S., including political risk, foreign exchange risk and other uncertainties.
Revenue from the sale of products to customers outside the United States exceeds 5%U.S. was approximately 12.7% of our totalthe Company’s 2012 annual revenue. WeThe Company and ourits customers are subject to certain risks inherent in doing business outside of the United States,U.S., including: governmental instability;
war and other international conflicts,;
conflicts;civil and labor disturbances;
requirements of local ownership;
partial or total expropriation or nationalization;
currency devaluation; and
foreign exchange control and foreign laws and policies, each of which maycan limit the movement of assets or funds or result in the deprivation of contractcontractual rights or the takingappropriation of property without fair compensation.
Collections and recovery of rental tools from international customers and agents
maycould also prove
more difficult due to
theinherent uncertainties
ofin foreign law and judicial
procedure. We may thereforeprocedures. The Company could experience significant difficulty
resulting fromwith collections or recovery due to the political or judicial climate in
foreign countries
in which we operatewhere Company operations occur or in which
ourthe Company’s products are used.
Our
The Company’s international operations must
also complybe compliant with the Foreign Corrupt Practices Act
(the “FCPA”) and other applicable
United States laws, and weU.S. laws. The Company could
bebecome liable under these laws for actions taken by
our employees or agents.
In addition, from time to time, the United States has passedCompliance with international laws and
imposedregulations could become more complex and expensive thereby creating increased risk as the Company’s international business portfolio grows. Further, the U.S. periodically enacts laws and imposes regulations prohibiting or restricting trade with certain
nations, and the United Statesnations. The U.S. government could
also change these laws or enact new laws that could restrict or prohibit
usthe Company from doing business in
certainidentified foreign countries.
Although most of ourthe Company’s international revenue is derived from transactions denominated in United StatesU.S. dollars, we havethe Company has conducted, and most likely will continue to conduct, some business in currencies other than the United StatesU.S. dollar. WeThe Company currently dodoes not hedge against foreign currency fluctuations. Accordingly, ourthe Company’s profitability could be affected by fluctuations in foreign exchange rates. We have
The Company has no
assurancecontrol over and can provide no assurances that future laws and regulations will not materially
adversely affect ourimpact the Company’s ability to conduct international business.
The loss of
certain key customers could have a material adverse
effectimpact on
ourthe Company’s results of operations and could result in a decline in
ourthe Company’s revenue.
We
The Company has critical customer relationships which are dependent on severalupon production and development activity related to a handful of customers. Revenue derived from key customers. During eachcustomers as a percentage of consolidated revenue for the three previous years ended December 31, 2009, over 20% of our consolidated revenues came from three of our customers. Our2012, 2011 and 2010, totaled 35%, 28% and 18%, respectively. Chemicals’ customer relationships are typicallyhistorically governed
by purchase orders or other short-term
contracts rather thancontractual obligations as opposed to long-term contracts. The loss of one or more
of our key customers could have a material adverse effect on
ourthe Company’s results of operations and could result in a decline in
ourthe Company’s revenue.
The loss
Loss of
certain key suppliers,
ourthe inability to secure raw materials on a timely basis, or
ourthe Company’s inability to pass commodity price increases on to
our customers could have a material adverse effect on
ourthe Company’s ability to service
our customer’s needs and could result in a loss of customers.
We believe that materials and components
Materials used in
our servicing and manufacturing operations
andas well as those purchased for sale are generally available on the open market
and from multiple sources. Acquisition
costs and transportation of
these raw materials to
ourChemical’s facilities
can be adversely affectedhave historically been impacted by extreme weather conditions.
However, certainCertain raw materials used by the
Chemical and LogisticsChemicals segment
in the manufacture of our patented micro-emulsion chemical sales are available
only from limited
sources andsources; accordingly, any disruptions to
our supplierscritical suppliers’ operations could
materiallyadversely impact
our sales. The prices we paythe Company’s operations. Prices paid for
our raw materials
maycould be affected by
among other things, energy, steel and other commodity prices; tariffs and duties on imported materials; foreign currency exchange rates;
phases of the general business cycle and global demand. The Drilling
Products and Artificial Lift segments purchase
their principalcritical raw materials
and steel on the open market and, where
we can, we useable, from multiple suppliers, both
domesticdomestically and
international, for our key raw materials purchases.We also keepinternationally.
The Company maintains a
three-three to
six-monthsix month supply of
keycritical mud-motor inventory parts that
we sourcethe Company sources from China. This inventory stock position approximates the lead time required to secure these parts
thus potentially avoidingin order to avoid disruption of service to
ourthe Company’s customers.
OurThe Company’s inability to secure
these key componentsreasonably priced critical inventory parts in a timely manner
at reasonable prices couldwould adversely affect
ourthe Company’s ability to
provide service
ourto potential customers.
We sourceThe Company sources the vast majority of
our motor parts from a
singlenational supplier. As part of
ourthe 2013 business plan,
we are diligently working to developthe Company is actively managing and developing relationships with
backupback-up parts
and service suppliers. If
we are unsuccessful in
developing these relationships, we mayidentifying and engaging back-up suppliers, the Company could be exposed to
a disruption of key
suppliessuppliers that could result in a loss of
revenues orrevenue and margins related to key customers. Additionally, if
ourthe customers were to seek or develop
alternative approachesalternatives for the products or services
we offer, wethe Company offers, the Company could suffer a decline in revenue and loss of key customers.
We
The Company currently
dodoes not hedge
our commodity prices.
WeThe Company forecast may
not be
ableunable to pass along price increases to
ourits customers, which could result in a decline in revenue or operating
profit.Ourprofits.
The Company’s inability to develop new products or differentiate
ourexisting products could have a material adverse effect on
ourthe ability to
service ourbe responsive to customer’s needs and could result in a loss of customers.
Our
The Company’s ability to compete
inwithin the oilfield services
marketbusiness is dependent
on ourupon the ability to differentiate
our products and services, provide superior quality and service, and maintain a competitive cost structure. Activity levels in
our three segmentsthe Company’s operations are driven
primarily by current and
expectedforecast commodity prices, drilling rig count, oil and
natural gas production levels, and customer capital spending
allocated for drilling and production. The regions in which
we operatethe Company operates are highly competitive.
Additionally, the continued depressed economy has resulted in the market for our services and that of our competitors to remain contracted. ManyThe Company is also smaller than many other oil and
natural gas service companies
areand has fewer resources as compared to these competitors. The larger
than we are and have greater resources than we have. These competitors are better
ablepositioned to withstand industry downturns, compete on the basis of price and acquire new equipment and technologies, all of which could affect
ourthe Company’s revenue and profitability.
These competitors compete with usThe Company competes for both
for customers and
for acquisitions of other businesses. This competition may result in pressureacquisition opportunities. Competition could adversely affect on
ourthe Company’s operating profit.
We believeThe Company believes that competition for
our products and services will continue to be intense in the foreseeable future.
If
we losethe Company loses the services of key members of
our management,
wethe Company may not be able to manage
our operations and implement
our growth
strategy effectively.We dependstrategies.
The Company depends on the continued service of
our Interimthe Chief and Executive Officer and President,
ourthe Chief Financial Officer, the Executive Vice President,
FinanceOperations, and
Strategic Planning, and our Executive Vice President, Business Development and
Special Projects,Marketing, who possess significant expertise and knowledge of
ourthe Company’s business and industry.
We doFurther, the Chief Executive Officer and President serves as Chairman of the Board of Directors. The Company has entered into employment agreements with most of these key members, however, at December 31, 2012 the Company did not carry key man life insurance on
any of these executives.
Additionally, we have in place employment agreements with our Interim President and our Executive Vice President, Finance and Strategic Planning. Any loss or interruption of the services of
these or other key members of
ourthe Company’s management could significantly reduce
ourthe Company’s ability to manage
our operations effectively and implement
ourstrategic business
plan and strategy, and we cannot assure youinitiatives. The Company can provide no assurance that
we would be able to find appropriate replacements for key positions
could be found should the need arise.
Failure to maintain effective disclosure controls and procedures and internal controls over financial reporting could have an adverse effect on
ourthe Company’s operations and the trading price of
ourthe Company’s common stock.
Effective internal controls are necessary for usthe Company to provide reliable financial reports, effectively prevent fraud and operate successfully as a public company. If wethe Company cannot provide reliable financial reports or effectively prevent fraud, ourthe Company’s reputation and operating results could be harmed. If we arethe Company is unable to maintain effective disclosure controls and procedures and internal controls over financial reporting, wethe Company may not be able to provide reliable financial reports, or prevent fraud, which, in turn could harm ouraffect the operating results or cause usthe Company to fail to meet ourits reporting obligations. Ineffective
internal controls could also cause investors to lose confidence in
our reported financial information, which could
have a negative effect onnegatively affect the trading price of
ourthe Company’s common stock, limit
ourthe ability to access
the capital markets in the future and require
us to incur additional costs to improve
our internal control systems and procedures.
At
The Company’s management evaluated the effectiveness of the design and operation of the Company’s disclosure controls and procedures as of December 31, 2009, we reported2012, and concluded that we identifiedthe Company’s disclosure controls and procedures were not effective. Management also evaluated the effectiveness of the Company’s internal control deficiencies that constituted a material weakness in connection with preparationover financial reporting as of ourDecember 31, 2012, and concluded they were ineffective. The Company’s independent registered public accounting firm audited the Company’s internal control over financial statements. We didreporting as of December 31, 2012, and concluded the Company has not maintain anmaintained effective internal control environment during 2009. We haveover financial reporting.
The Company has implemented remediation
effortsand internal control improvement initiatives to
addressremediate the
identified material
weaknessweaknesses and to enhance
ourthe overall financial control environment.
We cannot assure youThe Company's management continues to be actively committed to and engaged in the implementation and execution of remediation efforts. The executive management team is committed to achieving and maintaining a strong control environment, high ethical standards, and financial reporting integrity. There can, however, be no assurance that
ourthe Company's remediation efforts will be successful.
We did not file our Quarterly Reports on Form 10-Q for the quarters ended June 30 and September 30, 2009 in a timely manner. We filed requests for an extension of time to file these reports and subsequently filed our Form 10-Qs within the extension period. A failure to file our reports timely with the SEC will result in our inability to file registration statements using any registration form other than Form S-1, which is more time consuming and costly to prepare, for a period of time. This limitation, if realized, may hamper our ability to raise capital in the financial markets. Additionally, the late filing of reports with the SEC would result in a technical default of our various debt obligations.
Risks Related to
Ourthe Company’s Industry
The extension of
Uncertainty regarding the
worldwideirregular recovery from the recent recession could
continue tostill have an adverse effect on exploration and production activity and result in lower demand for
our servicesthe Company’s products and
products.The currentservices.
Continued worldwide financial and credit crisis has reduceduncertainty can reduce the availability of liquidity and credit markets to fund the continuation and expansion of industrial business operations worldwide. The shortage of liquidity and credit combined with continued losses and/or depressed conditions in thepressure on worldwide equity markets could continue to extendimpact the worldwide economic recession. Sluggish economic activity caused byclimate. Unrest in the current sustained recession continues to maintain worldwideMiddle East may also impact demand for energy at depressed levels resulting in low oilthe Company’s products and natural gas prices. Forecasted crude oil prices for 2010 have not improved significantly. services both domestically and internationally.
Demand for
ourthe Company’s products and services
and products dependsis dependent on oil and natural gas industry activity and expenditure levels that are directly affected by trends in oil and natural gas prices. Demand for
ourthe Company’s products and services
and products is particularly sensitive to
the levellevels of exploration, development, and production activity of, and the corresponding capital spending by, oil and natural gas companies, including national oil companies. One indication of drilling and production activity and spending is rig count, which
we monitorthe Company monitors to gauge market conditions. Any prolonged reduction in oil and natural gas prices or drop in rig count
willcould depress
the immediatecurrent levels of exploration, development, and production activity. Perceptions of longer-term lower oil and natural gas prices by oil and
natural gas companies
cancould similarly reduce or defer major expenditures given the long-term nature of many large-scale development projects. Lower levels of activity
could result in a corresponding decline in the demand for
ourthe Company’s oil and natural gas well
servicesproducts and
products,services, which could have a material adverse effect on
ourthe Company’s revenue and profitability.
Continuation of the global credit crisis could have an adverse impact on
ourthe Company’s customers and on
ourthe Company’s dealings with lenders, insurers and financial institutions.
Events in
the global credit markets
over the past several years have significantly impacted the availability of credit and
associated financing costs for many of
ourthe Company’s customers.
ManyA significant portion of
ourthe Company’s customers finance
their drilling and production programs through third-party lenders.
The reduced availability andLack of available credit or increased costs of borrowing could cause
our customers to reduce
their spending on drilling programs, thereby reducing demand and potentially resulting in lower prices for
ourthe Company’s products and services. Also, the
current credit and economic environment could significantly impact the financial condition of some customers over a
prolonged period,
of time, leading to business disruptions and
restricting theirrestricted ability to pay
us for
services performed, which could negatively impact our results of operationsthe Company’s products and
cash flows. In addition, an increasing number of financial institutions and insurance companies have reported significant deterioration in their financial condition. Ourservices. The Company’s forward-looking statements assume that
ourthe Company’s lenders, insurers and other financial institutions will be able to fulfill their obligations under
our various credit agreements, insurance policies and contracts. If any of
ourthe Company’s significant
financial institutions werelenders, insurers and others are unable to perform under such agreements, and if
we werethe Company was unable to find suitable replacements at a reasonable cost,
ourthe Company’s results of operations, liquidity and cash flows could be adversely impacted.
A
prolonged period of
prolonged depressed oil and natural gas prices
maycould result in reduced demand for
ourthe Company’s products and services
which mayand adversely affect
ourthe Company’s business, financial condition and results of operations.
The markets for oil and natural gas have historically been extremely volatile. Such volatility in oil and natural gas prices, or the perception by ourthe Company’s customers of unpredictability in oil and natural gas prices, could adversely affects theaffect spending patterns in our industry. In some circumstances this volatility may continue to prolong depressed oil and gas prices. We anticipatewithin targeted industries. The Company anticipates that our current markets will continue to be volatile in the future and may continue to prolong depressed oil and gas prices.future. The demand for ourthe Company’s products and services is, in large part, driven by current and anticipated oil and natural gas prices and the related general levels of production spending and drilling activity. In particular, volatile fluctuation in oil prices and continued depressed oil andnatural gas prices maycould cause a decline in exploration and drilling activities. This, in turn, could result in lower demand for ourthe
Company’s products and services and
may causecould result in lower prices for
ourthe Company’s products and services.
As a result, aA prolonged decline in oil or natural gas prices
maycould adversely affect
ourthe Company’s business, financial condition and results of operations.
Competition from new
New and existing competitors within
ourthe Company’s industry could have an adverse effect on
our results of operations.
The oil and
natural gas industry is highly competitive and fragmented.
OurThe Company’s principal competitors include numerous small companies capable of competing effectively in
ourthe Company’s markets on a local basis, as well as a number of large companies that possess substantially greater financial and other resources than
we do. Our largerdoes the Company. Larger competitors may be able to devote greater resources to developing, promoting and selling
their products and services.
WeThe Company may also face increased competition due to the entry of new competitors including current suppliers that decide to sell their products and services directly to
ourthe Company’s customers. As a result of this competition,
we maythe Company could experience lower sales or greater operating costs, which
maycould have an adverse effect on
ourthe Company’s margins and results of operations.
Our
The Company’s industry has
experienced a high rate of employee turnover.
Any difficulty we experienceDifficulty attracting or retaining personnel or agents could adversely affect
ourthe Company’s business.
We operate
The Company operates in an industry that has historically been highly competitive in securing qualified personnel with the required technical skills and experience.
OurThe Company’s services require skilled personnel
who canable to perform physically demanding work. Due to industry volatility and the demanding nature of the work, workers
maycould choose to pursue employment
in fieldsopportunities that offer a more desirable work environment at wages
that are competitive with
ours.the Company’s. As a result,
wethe Company may not be able to find
enoughqualified labor,
to meet our needs, which could limit
our growth.the Company’s growth ability. In addition, the cost of attracting and retaining qualified personnel has increased over the past several years due to
competition, and we expect itcompetitive pressures. The Company expects labor costs will continue to increase in the
foreseeable future. In order to attract and retain qualified personnel,
wethe Company may be required to offer increased wages and benefits. If
we are not ablethe Company is unable to increase the prices of
our products and services to compensate for increases in compensation, or
if we areis unable to attract and retain qualified personnel,
our operating results could be adversely affected.
Severe weather could have a material adverse impact on
ourthe Company’s business.
Our
The Company’s business could be materially and adversely affected by severe
weather.weather conditions. Hurricanes, tropical storms, blizzards,
and cold weather and other
severe weather
hazards may cause theconditions could result in curtailment of services,
damagesdamage to
our equipment and facilities,
interruptionsinterruption in
the transportation of
our products and materials
in accordance with contract schedules and loss of productivity. If
ourthe Company’s customers are unable to operate or are required to reduce
their operations due to severe weather
conditions, and as a result curtail
the purchases of
ourthe Company’s products and services,
ourthe Company’s business could be materially adversely affected.
A terrorist attack or armed conflict could harm
ourthe Company’s business.
Terrorist activities, anti-terrorist efforts and other armed
conflictconflicts involving the
United States mayU.S. could adversely affect the
United StatesU.S. and global economies and could prevent
usthe Company from meeting
our financial and other obligations.
We mayThe Company could experience loss of business, delays or defaults in payments from
payers,payors, or disruptions of fuel supplies and markets if pipelines, production facilities, processing plants
andor refineries are direct targets or indirect casualties of an act of terror or war.
In addition, suchSuch activities could reduce the overall demand for oil and natural gas which, in turn, could
also reduce the demand for
ourthe Company’s products and services.
We haveThe Company has implemented certain security measures in response to the threat of terrorist activities. Terrorist activities and the threat of potential terrorist activities and any resulting economic downturn could adversely affect
ourthe Company’s results of operations, impair
ourthe ability to raise capital or otherwise adversely impact
ourthe Company’s ability to
execute ourrealize certain business
strategy.strategies.
Risks Related to
Ourthe Company’s Securities
The market price of
ourthe Company’s common stock has been and may continue to be volatile.
The market price of
ourthe Company’s common stock has historically been subject to significant fluctuations. The following factors, among others, could cause the price of
ourthe Company’s common stock
in the public market to fluctuate significantly:
variations in ourthe Company’s quarterly results of operations;
changes in market valuations of companies in ourthe Company’s industry;
fluctuationfluctuations in stock market prices and volume;
fluctuationfluctuations in oil and natural gas prices;
issuanceissuances of common stock or other securities in the future;
the additionadditions or departuredepartures of key personnel; and
announcements by usthe Company or ourthe Company’s competitors of new business, acquisitions or joint ventures.
The stock market has experienced
extremeunusual price and volume fluctuations in recent years that have significantly affected the
pricesprice of
the common stock of many companies
including companies in ourwithin the oil and natural gas industry.
TheFurther changes can occur without regard to specific operating performance. The price of
ourthe Company’s common stock could continue to fluctuate based upon factors that have little to do with
our company,the Company’s operational performance, and these fluctuations could materially reduce
ourthe Company’s stock price. Class action lawsuits have
frequentlyhistorically been brought against companies following periods of
volatility in thecommon stock market price
of their common stock. Currently, we have beenvolatility. The Company could be named in a legal case of this type, which could be expensive and divert management’s attention and
companyCompany resources,
andas well as have a material adverse effect on
ourthe Company’s business, financial condition and results of operations.
An active market for
ourthe Company’s common stock may not continue to exist or may not continue to exist at current trading levels.
Trading volume for
ourthe Company’s common stock
historically has
historically been
lowvery volatile when compared to companies with larger market capitalizations.
WeThe Company cannot
assure youpresume that an active trading market for
ourthe Company’s common stock will
developcontinue or be sustained. Sales of significant amounts of shares of
ourthe Company’s common stock in the public market could lower the market price of
ourthe Company’s stock.
If we do not meet the New York Stock exchange continued listing requirements, our common stock may be delisted, which could have an adverse impact on the liquidity and market price of our common stock.
Our common stock is currently listed on the New York Stock Exchange (“NYSE”). Under the NYSE’s continued listing standards, a company is considered to be below compliance standards if, among other things, (i) both its average global market capitalization is less than $50 million over a 30 trading-day period and its stockholders’ equity is less than $50 million; (ii) its average global market capitalization is less than $15 million over a 30 trading-day period, which will result in immediate initiation of suspension procedures; or (iii) the average closing price of a listed security is less than $1.00 over a consecutive 30 trading-day period. We have received notification from the NYSE that we are not in compliance with the NYSE’s continued listing requirements because both our 30 trading-day average global market capitalization and our last reported stockholders’ equity were below the respective $50 million requirements. When a listed company’s stock falls below the market capitalization and stockholders’ equity standard, a company is considered “below criteria,” and the company is permitted to submit a business plan demonstrating its ability to return to compliance with these continued listing standards within 18 months of receipt of the NYSE notification. We have submitted a plan of action to the NYSE which we believe will allow us to once again achieve compliance with the minimum listing requirements of the NYSE no later than June 28, 2011. During the plan implementation process, our common stock will continue to be listed on the NYSE, subject to our compliance with other NYSE continued listing requirements. On March 29, 2010, the NYSE agreed to accept our plan of action.
If our shares of common stock are delisted from the NYSE and we are unable to list our shares of common stock on another U.S. national or regional securities exchange or have our shares of common stock quoted on an established over-the-counter trading market in the United States within 30 days, we will be required to make an offer to repurchase all of our outstanding convertible notes at a price of 100% of the principal amount thereof plus accrued and unpaid interest. We may not have sufficient funds to pay the purchase price for any convertible notes that are tendered to us if we are required to make this offer to repurchase.
A delisting of our common stock could also negatively impact us by: (i) reducing the liquidity and market price of our common stock; (ii) reducing the number of investors willing to hold or acquire our common stock, which could negatively impact our ability to raise equity financing; and (iii) decreasing the amount of news and analyst coverage for us. In addition, we may experience other adverse effects, including, without limitation, the loss of confidence in us by current and prospective suppliers, customers, employees and others with whom we have or may seek to initiate business relationships, and our ability to attract and retain personnel by means of equity compensation could be impaired.
We have
The Company has no plans to pay dividends on
ourthe Company’s common stock, and, therefore, investors will have to look to stock appreciation for return on
their investments.
We do
The Company does not anticipate paying any cash dividends on
ourthe Company’s common stock in the foreseeable future.
WeThe Company currently
intendintends to retain all future earnings to fund the development and growth of
our business.the Company’s business and to meet current debt obligations. Any payment of future dividends will be at the discretion of
ourthe Company’s board of directors and will depend on, among other things,
ourthe Company’s earnings, financial condition, capital requirements, level of indebtedness, statutory and contractual restrictions applying to the payment of dividends and other considerations
thatdeemed relevant by the board of
directors deems relevant. Certaindirectors. Additionally, should the Company seek future financing or refinancing of indebtedness, covenants
of our new senior credit facilitycould restrict the payment of dividends without the prior written consent of
the lender.lenders. Investors must rely on sales of
their common stock
held after price appreciation, which may never occur, in order to realize a return on their investment.
Certain anti-takeover provisions of
ourthe Company’s charter documents and
underapplicable Delaware law could discourage or prevent others from acquiring
our company,the Company, which may adversely affect the market price of
ourthe Company’s common stock.
Our
The Company’s certificate of incorporation and bylaws contain provisions that:
permit usthe Company to issue, without stockholder approval, up to 100,000 shares of preferred stock, in one or more series and, with respect to each series, to fix the designation, powers, preferences and rights of the shares of the series;
prohibit stockholders from calling special meetings;
limit the ability of shareholdersstockholders to act by written consent;
prohibit cumulative voting; and
require advance notice for stockholder proposals and nominations for election to the board of directors to be acted upon at meetings of stockholders.
In addition, Section 203 of the Delaware General Corporation Law limits business combinations with owners of more than 15% of
ourthe Company’s stock
that have not been approved bywithout the approval of the board of directors.
TheseAforementioned provisions and other similar provisions make it more difficult for a third party to acquire
us withoutthe Company exclusive of negotiation.
OurThe Company’s board of directors could choose not to negotiate with an acquirer
that it diddeemed not
feel was in ourbeneficial to or synergistic with the Company’s strategic
interest.outlook. If
thean acquirer were discouraged from offering to acquire
usthe Company or prevented from successfully completing a hostile acquisition by
thereferenced anti-takeover measures,
youstockholders could lose the opportunity to sell
yourowned shares at a favorable price.
Future issuance of additional shares of
our common stock could cause dilution of ownership interests and adversely affect
ourthe Company’s stock price.
We
The Company may, in the future, issue our previously authorized and unissued shares of common stock, resultingwhich would result in the dilution of thecurrent stockholders ownership interests of our current stockholders. We areinterests. The Company is currently authorized to issue 80,000,000 shares of common stock, of which 24,168,29253,123,978 were issued as of December 31, 2009.2012. Additional shares are subject to future issuance through the exercise of options previously granted under ourvarious equity compensation plans or through the exercise of options that are still available for future grant.equity grants. The potentialissuance of such additional shares of common stock, whether directly or pursuant to any conversion right of our
convertible senior notes or otherassociated with any convertible securities including our convertible preferred stock, we may issue inof the future,Company, or through exercise of outstanding warrants may create downward pressure on the trading price of ourthe Company’s common stock. WeThe Company may also issue additional shares of our common stock or other securities that are convertible into or exercisable for common stock for raisingin order to raise capital or effectuate other business
purposes. Future sales of substantial amounts of common stock, or the perception that sales could occur, could have a material adverse effect on the price of
ourthe Company’s common stock.
On March
All outstanding warrants are exercisable as of December 31,
2010, in connection with the Amended and Restated Credit Agreement related to our new senior credit facility, we issued 3,431,133 shares of common stock to pay a portion of the commitment fee due at closing. On March 31, 2010, in connection with the Exchange Agreement involving our senior convertible notes, we expect to issue up to 1,568,867 shares of common stock to satisfy the common stock component of the exchange.We2012.
The Company may issue
additional shares of preferred stock or debt securities with greater rights than
ourthe Company’s common stock.
In August 2009, we sold convertible preferred stock with warrants to purchase additional shares of our common stock. Holders of the convertible preferred stock may convert their preferred shares into shares of our common stock at any time, and we may automatically convert the preferred shares into our common shares if certain conditions relating to the closing price of our common stock are met after February 12, 2010. All warrants are exercisable as of December 31, 2009. The convertible preferred stock and warrants have the right to acquire a total of 17,436,512 shares of our common stock.
Subject to the rules of the
New York Stock Exchange, ourNYSE, the Company’s certificate of incorporation authorizes
ourthe board of directors to issue one or more additional series of preferred stock and
to set the terms of the
preferred stockissuance without seeking
any further approval from holders of
our common stock. Currently, there are 100,000 preferred shares authorized, with
16,000no shares
issued.outstanding at March 4, 2013. Any preferred stock that is issued may rank senior to
our common stock in terms of dividends, priority and liquidation premiums, and may have greater voting rights than holders of
our common stock.
Also, holders
The Company’s ability to use net operating loss carryforwards and tax attribute carryforwards to offset future taxable income may be limited as a result of our convertible senior notes are preferred in righttransactions involving the Company’s common stock.
Under section 382 of
paymentthe Internal Revenue Code of 1986, as amended, a corporation that undergoes an “ownership change” is subject to
limitations on the
holders of our preferredCompany’s ability to utilize pre-change net operating losses (“NOLs”), and
common stock.On March 31, 2010, in connection with the Exchange Agreement, we expectcertain other tax attributes to exchange $40 million of convertible senior notes foroffset future taxable income. In general, an ownership change occurs if the aggregate considerationstock ownership of $36 millioncertain stockholders increases by more than 50 percentage points over such stockholders’ lowest percentage ownership during the testing period (generally three years). An ownership change could limit the Company’s ability to utilize existing NOLs and tax attribute carryforwards for taxable years including or following an identified “ownership change.” Transactions involving the Company’s common stock, even those outside the Company’s control, such as purchases or sales by investors, within the testing period, could result in new convertible senior secured notesan “ownership change”. Limitations imposed on the ability to use NOLs and $2 milliontax credits to offset future taxable income could require the Company to pay U.S. federal income taxes in sharesexcess of our common stock.
that which would otherwise be required if such limitations were not in effect. net operating losses and tax attributes could expire unused, in each instance reducing or eliminating the benefit of the NOLs and tax attributes. Similar rules and limitations may apply for state income tax purposes.
Disclaimer of Obligation to Update
Except as required by applicable law or regulation,
we assumethe Company assumes no obligation (and specifically
disclaimdisclaims any such obligation) to update these
Risk Factorsrisk factors or any other forward-looking
statementsstatement contained in this Annual Report to reflect actual results, changes in assumptions or other factors affecting such forward-looking statements.
Item 1B. | Unresolved Staff Comments. |
Item 1B. Unresolved Staff Comments.
Item 2. Properties.
As of February 28,
2010, we2013, the Company operated
3930 manufacturing and warehouse facilities in
nineeight U.S. states.
We own 13The Company owns 12 of these facilities with the remainder being leased with
initial lease terms that expire
at various yearsfrom 2013 through
2032.2031. In addition, our corporate office is a leased facility located in Houston, Texas. The following table sets forth
the locations of these facilities:facility locations: | | | |
| | |
| Segment | Owned/Leased | Location |
| Chemicals | Owned | Marlow, Oklahoma |
| | Segment
Owned | Carthage, Texas |
| | Owned/Leased
Owned | | Location
Wheeler, Texas |
| | Chemicals and Logistics
| | Leased
Owned
Owned
| | Raceland, Louisiana
Norman, Oklahoma
Marlow, Oklahoma
|
| | | | Owned
Owned
Leased
Leased
Leased
Leased
| | Carthage, Texas
Wheeler, Texas
Raceland, Louisiana
Pocola, Oklahoma
Wilburton, Oklahoma
The Woodlands, Texas
|
| | | |
| | Drilling Products
| | Owned
Owned
Owned
Owned
Owned
Owned
| | Chickasha, Oklahoma
Oklahoma City, Oklahoma
Houston, Texas
Mason, Texas
Midland, Texas
Robstown, Texas
|
| | | | Owned
Owned
Leased
Leased
Leased
Leased
Leased
Leased
Leased
Leased
Leased
Leased
Leased
Leased
Leased
Leased
Leased
| | Vernal, Utah
Evanston, Wyoming
Grand Junction, Colorado
Bossier City, Louisiana
Lafayette, Louisiana (2 locations)
Shreveport, Louisiana
Farmington, New Mexico
Tioga, North Dakota
Corpus Christi, Texas
Granbury, Texas
Grand Prairie, Texas
Houston, Texas
Midland, Texas (3 locations)
Odessa, Texas
Pittsburgh, Pennsylvania
Towanda, Pennsylvania
Casper, Wyoming
|
| | | |
| | Artificial Lift
| | Owned
Leased
Leased
| | Gillette, Wyoming
Farmington, New Mexico
Houston, Texas
|
| | | |
| | General Corporate
| | Leased | Raceland, Louisiana |
| Leased | The Woodlands, Texas |
| Drilling | Owned | Chickasha, Oklahoma |
| Owned | Oklahoma City, Oklahoma |
| Owned | Houston, Texas |
| Owned | Midland, Texas |
| Owned | Robstown, Texas |
| Owned | Vernal, Utah |
| Owned | Evanston, Wyoming |
| Leased | Bossier City, Louisiana |
| Leased | New Iberia, Louisiana |
| Leased | Shreveport, Louisiana |
| Leased | Farmington, New Mexico |
| Leased | Corpus Christi, Texas |
| Leased | Pocola, Oklahoma |
| Leased | Grand Prairie, Texas |
| Leased | Houston, Texas |
| Leased | Midland, Texas |
| Leased | Odessa, Texas |
| Leased | Pittsburg, Pennsylvania |
| Leased | Wysox, Pennsylvania |
| Leased | Woodward, Oklahoma |
| Leased | Casper, Wyoming |
| Artificial Lift | Owned | Gillette, Wyoming |
| Owned | Dickinson, North Dakota |
| Leased | Farmington, New Mexico |
| Leased | Gillette, Wyoming |
We consider our
The Company considers owned and leased facilities to be in good condition and suitable for the conduct of
our business.
Item 3. | Legal Proceedings. |
Class Action Litigation
On August 7, 2009, a class action suit was commenced in the United States District Court for the Southern District of Texas on behalf of purchasers of our common stock between May 8, 2007 and January 23, 2008, inclusive, seeking to pursue remedies under the Securities Exchange Act of 1934.
Item 3. Legal Proceedings.
The
complaint alleges that, throughout the time period indicated, we failed to disclose material adverse facts about our true financial condition, business and prospects. Specifically, the complaint alleges that as a result of the failure to disclose the adverse facts, our positive statements concerning guidance and prospects were lacking in a reasonable basis at all relevant times. The plaintiffs filed an amended complaint on February 4, 2010 alleging misleading statements and material omissions in connection with our earnings guidance for 2007 and the fourth quarter of 2007. The amended complaint does not quantify the alleged actual damages.Since August 7, 2009, several other class action suits have been commenced by others concerning the foregoing matters.
We intend to mount a vigorous defense to these claims. Discovery has not yet commenced. At this time, we are unable to reasonably estimate the outcome of this litigation.
Other Litigation
We areCompany is subject to routine litigation and other claims that arise in the normal course of business. We areManagement is not aware of any pending or threatened lawsuits or proceedings which wouldthat are expected to have a material effect on ourthe Company’s financial position, results of operations or liquidity.
Item 4. Mine Safety Disclosures.
Not applicable.
Item 5. | Market for Registrant’s Common Equity, Related Stockholder Matters and Issuer Purchases of Equity Securities. |
Our
Item 5. Market for Registrant’s Common Equity, Related Stockholder Matters and Issuer Purchases of Equity Securities.
The Company’s common stock
is listedbegan trading on the
New York Stock Exchange (“NYSE”)NYSE on December 27, 2007 under the
stock ticker symbol “FTK.” As of the close of business on March
16, 2010,4, 2013, there were
24,215,28347,330,653 shares of common stock outstanding held by approximately
10,00012,850 holders of record. The
last reportedCompany's closing sale price of the common stock on the NYSE on March
16, 20104, 2013 was
$1.43.As of December 27, 2007, our$13.67. The Company has never declared or paid cash dividends on common stock. While the Company regularly assesses the dividend policy, the Company has no current plans to declare dividends on common stock, began tradingand intends to continue to use earnings and other cash in the maintenance and expansion of the business. Further, the Company’s Credit Facility contains provisions that limit its ability to pay cash dividends on the NYSE under the stock ticker symbol “FTK.” its common stock.
The following table sets forth, on a per share basis for the periods indicated, the high and low closing sales prices of our common stock as reported by the NYSE. These prices do not include retail mark-ups, mark-downs or commissions. | | | | | | |
Fiscal 2009 | | High | | Low |
4th Quarter | | $ | 2.41 | | $ | 0.96 |
3rd Quarter | | $ | 2.59 | | $ | 1.38 |
2nd Quarter | | $ | 3.30 | | $ | 1.23 |
1st Quarter | | $ | 5.00 | | $ | 1.21 |
| | | | | | |
Fiscal 2008 | | High | | Low |
4th Quarter | | $ | 10.68 | | $ | 1.88 |
3rd Quarter | | $ | 20.95 | | $ | 10.36 |
2nd Quarter | | $ | 22.82 | | $ | 15.30 |
1st Quarter | | $ | 36.07 | | $ | 14.52 |
We have never declared or paid cash dividends on our common stock. While we regularly assess our dividend policy, we have no current plans to declare a dividend and we intend to continue to use our earnings and other cash in the maintenance and expansion of our business. In addition, our new senior credit facility contains provisions that limit our ability to pay cash dividends on our common stock.
|
| | | | | | | | |
| Fiscal quarter ended: | | 2012 | | 2011 |
| High | | Low | | High | | Low |
| March 31, | | $13.03 | | $10.28 | | $8.57 | | $5.12 |
| June 30, | | $14.20 | | $8.68 | | $9.58 | | $7.55 |
| September 30, | | $12.99 | | $9.01 | | $10.55 | | $4.40 |
| December 31, | | $13.15 | | $10.01 | | $10.41 | | $4.16 |
The performance graph below illustrates a five year comparison of cumulative total returns based on an initial investment of $100 in
ourthe Company’s common stock, as compared with the Russell 2000 Index and the Philadelphia Oil Services Index for the period
20052007 through
2009.2012. The performance graph assumes $100 invested on December 31,
20042007 in each of
ourthe Company’s common stock, the Russell 2000 Index and the Philadelphia Oil Service Index, and that all dividends were reinvested.
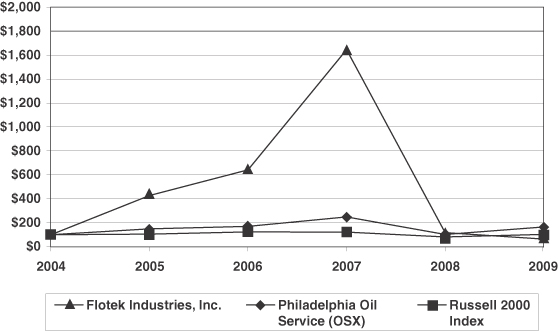
| | | | | | | | | | | | | | | | | | |
| | | Years Ended December 31, |
| | | 2004 | | 2005 | | 2006 | | 2007 | | 2008 | | 2009 |
Flotek Industries, Inc. | | $ | 100 | | $ | 434 | | $ | 652 | | $ | 1,676 | | $ | 117 | | $ | 62 |
Russell 2000 Index | | $ | 100 | | $ | 105 | | $ | 124 | | $ | 122 | | $ | 81 | | $ | 103 |
Philadelphia Oil Service Index (OSX) | | $ | 100 | | $ | 150 | | $ | 171 | | $ | 251 | | $ | 102 | | $ | 166 |
The
foregoingsucceeding graph
shallshould not be deemed to be filed as part of this
Form 10-K andAnnual Report, does not constitute soliciting material and should not be deemed filed or incorporated by reference into any other filing of the Company under the Securities Act of 1933, as amended, or the Exchange Act, as amended, except to the extent
that wethe Company specifically
incorporateincorporates the graph by reference.
|
| | | | | | | | | | | | | | | | | | | | | | | | |
| | December 31, |
| | 2007 | | 2008 | | 2009 | | 2010 | | 2011 | | 2012 |
| Flotek Industries, Inc. | | $ | 100 |
| | $ | 7 |
| | $ | 4 |
| | $ | 15 |
| | $ | 28 |
| | $ | 34 |
|
| Russell 2000 Index | | $ | 100 |
| | $ | 66 |
| | $ | 84 |
| | $ | 107 |
| | $ | 102 |
| | $ | 119 |
|
| Philadelphia Oil Service Index (OSX) | | $ | 100 |
| | $ | 41 |
| | $ | 66 |
| | $ | 83 |
| | $ | 75 |
| | $ | 77 |
|
Securities Authorized for Issuance Under Equity Compensation Plans
The following table summarizes
equity compensation plan information regarding
our equity securities
that are authorized for issuance under individual stock option compensation agreements:
Equity Compensation Plan Information
| | | | | | | |
Plan category | | Number of Securities to be
Issued Upon Exercise of
Outstanding Options,
Warrants and Rights | | Weighted-Average
Exercise Price of
Outstanding
Options, Warrants
and Rights | | Number of Securities
Remaining Available
for Future Issuance Under
Equity Compensation
Plans (Excluding
Securities Reflected in the
Column (a)) |
| | | (a) | | (b) | | (c) |
Equity compensation plans approved by security holders | | 1,605,398 | | $ | 5.13 | | 304,022 |
Equity compensation plans not approved by security holders | | — | | | — | | — |
| | | | | | | |
Total | | 1,605,398 | | $ | 5.13 | | 304,022 |
| | | | | | | |
|
| | | | | | | | | | |
| Plan category | | Number of Securities to be Issued Upon Exercise of Outstanding Options, Warrants and Rights | | Weighted-Average Exercise Price of Outstanding Options, Warrants and Rights | | Number of Securities Remaining Available for Future Issuance Under Equity Compensation Plans (Excluding Securities Reflected in the Column(a)) |
| | (a) | | (b) | | (c) |
| Equity compensation plans approved by security holders | | 2,457,586 |
| | $ | 5.65 |
| | 1,486,927 |
|
| Equity compensation plans not approved by security holders | | — |
| | — |
| | — |
|
| Total | | 2,457,586 |
| | $ | 5.65 |
| | 1,486,927 |
|
Issuer Purchases of Equity Securities
During
In November 2012, the fourth quarterCompany's Board of 2009, we purchased 22,491 sharesDirectors authorized the repurchase of ourup to $25 million of the Company's common stock. Repurchases may be made in open market or privately negotiated transactions. Through December 31, 2012, the Company has not repurchased any of its common stock attributableand $25 million may yet be used to withholding to satisfy the paymentpurchase shares.
|
| | | | | | | | | | | | | | |
| | | Total Number Of Shares Purchased | | Average Price Paid Per Share | | Total Number of Shares Purchased as Part of Publicly Announced Plans or Programs | | Maximum Dollar Value of Shares that May Yet be Purchased Under the Plans or Programs |
| October 1 to October 31, 2012 | | — |
| | $ | — |
| | — |
| | $ | 25,000,000 |
|
| November 1 to November 30, 2012 | | — |
| | $ | — |
| | — |
| | $ | 25,000,000 |
|
| December 1 to December 31, 2012 | | — |
| | $ | — |
| | — |
| | $ | 25,000,000 |
|
| Total | | — |
| | $ | — |
| | — |
| | $ | 25,000,000 |
|
| | | | | | | | | |
Item 6. | Selected Financial Data. |
Item 6. Selected Financial Data.
The following table sets forth certain selected historical financial data and should be read in conjunction with “ItemPart II, Item 7. Management’s“Management’s Discussion and Analysis of Financial Condition and Results of Operations” and “ItemPart II, Item 8. Financial“Financial Statements and Supplementary Data,” which are included elsewhere herein.within this Annual Report. The selected operating and financial position data as of and for each of the five years ended December 31, 2009presented have been derived from our audited consolidated Company financial statements, some of which appear elsewhere in this Annual Report on Form 10-K.Report. During the annual periods 2005 throughperiod 2008, we effectedthe Company affected a number of business combinations and other transactions that materially affectcombination resultant in a material impact on the comparability of the information set forth below.
The Company has incurred significant non-recurring charges during the annual periods 2012 through 2008. During the annual periods 2012 and 2011, the Company incurred losses on the extinguishment of debt of $7.3 million and $3.2 million, respectively. During the annual period 2010, the Company recorded fixed asset and other intangible impairment charges totaling $9.3 million. Additionally, during the annual period 2010 the Company incurred losses on the extinguishment of debt of approximately $1.0 million and other financing charges of $0.8 million. During the annual periods 2009 and 2008, wethe Company recorded impairment charges for goodwill and other intangible assets of $18.5 million and $67.7 million, respectively. Additionally, on July 11, 2007, the Company effected a two-for-one stock split in the form of a 100% stock dividend to the stockholders of record on July 3, 2007. All share and per share information has been retroactively adjusted to reflect the stock split. | | | | | | | | | | | | | | | | | |
| | | As of and for the Years Ended December 31, |
| | | 2009 | | | 2008 | | | 2007 | | 2006 | | 2005 |
| | | (Restated) | | | | | | | | | | |
| | | (in thousands, except per share data) |
Operating Data | | | | | | | | | | | | | | | | | |
Revenue | | $ | 112,550 | | | $ | 226,063 | | | $ | 158,008 | | $ | 100,642 | | $ | 52,869 |
Income (loss) from operations | | | (33,103 | ) | | | (30,751 | ) | | | 29,686 | | | 18,853 | | | 10,114 |
Net income (loss) | | | (50,240 | ) | | | (34,161 | ) | | | 16,727 | | | 11,350 | | | 7,720 |
Earnings (loss) per share – Basic | | | (2.68 | ) | | | (1.78 | ) | | | 0.91 | | | 0.66 | | | 0.53 |
Earnings (loss) per share – Diluted | | | (2.68 | ) | | | (1.78 | ) | | | 0.88 | | | 0.61 | | | 0.47 |
| | | | | |
Financial Position Data | | | | | | | | | | | | | | | | | |
Total assets | | | 178,610 | | | | 234,575 | | | | 160,793 | | | 82,890 | | | 52,158 |
Convertible senior notes and long-term debt, less discount and current portion | | | 119,190 | | | | 120,281 | | | | 52,377 | | | 8,185 | | | 7,277 |
Stockholders’ equity | | | 26,905 | | | | 65,721 | | | | 77,461 | | | 53,509 | | | 35,205 |
The 2009 amounts have been restated for a change in accounting for the fair value of the detachable warrants.
|
| | | | | | | | | | | | | | | | | | | |
| | As of and for the Year ended December 31, |
| | 2012 | | 2011 | | 2010 | | 2009 | | 2008 |
| | (in thousands, except per share data) |
| Operating Data | | | | | | | | | |
| Revenue | $ | 312,828 |
| | $ | 258,785 |
| | $ | 146,982 |
| | $ | 112,550 |
| | $ | 226,063 |
|
| Income (loss) from operations | 58,621 |
| | 48,888 |
| | (6,267 | ) | | (33,103 | ) | | (30,751 | ) |
| Net income (loss) | 49,791 |
| | 31,408 |
| | (43,465 | ) | | (50,333 | ) | | (34,242 | ) |
| Earnings (loss) per share – Basic | $ | 1.03 |
| | $ | 0.60 |
| | $ | (1.94 | ) | | $ | (2.68 | ) | | $ | (1.79 | ) |
| Earnings (loss) per share – Diluted | $ | 0.97 |
| | $ | 0.56 |
| | $ | (1.94 | ) | | $ | (2.68 | ) | | $ | (1.79 | ) |
| Financial Position Data | | | | | | | | | |
| Total assets | $ | 219,867 |
| | $ | 232,012 |
| | $ | 184,807 |
| | $ | 178,901 |
| | $ | 234,959 |
|
| Convertible senior notes, long-term | | | | | | | | | |
| debt and capital lease obligations, | | | | | | | | | |
| less discount and current portion | 22,455 |
| | 100,613 |
| | 126,682 |
| | 119,190 |
| | 120,281 |
|
| Stockholders’ equity (deficit) | 154,730 |
| | 78,298 |
| | (3,453 | ) | | 27,196 |
| | 66,105 |
|
The table above reflects the results of the following acquisitionsacquisition of companies or their assetsTeledrift, Inc. in 2008 from their respective datesthe acquisition date.
Table of acquisitions in the following years:2008 –
Teledrift, Inc.;
2007 –
Triumph Drilling Tools, Inc., CAVO Drilling Motors Ltd Co., and Sooner Energy Service, Inc.;
2006 –
Can-Ok Oil Field Services, Inc., Total Well Solutions, LLC, LifTech, LLC; and
2005 –
Phoenix E&P Technology, LLC, Spidle Sales and Services, Inc., Harmon’s Machine Works, Inc. and Precision-LOR, Ltd.
Contents
Item 7. | Management’s Discussion and Analysis of Financial Condition and Results of Operations. |
Item 7. Management’s Discussion and Analysis of Financial Condition and Results of Operations.
The following discussion and analysis should be read in conjunction with
our consolidated financial statementsthe Consolidated Financial Statements and the related
notesNotes to the Consolidated Financial Statements included elsewhere in this Annual Report on Form
10-K.10-K (“Annual Report”). The following information contains forward-looking statements, which are subject to risks and uncertainties. Should one or more of these risks or uncertainties materialize,
our actual results
maycould differ from those expressed or implied by the forward-looking statements. See “Forward-Looking Statements” at the beginning of this Annual
Report on Form 10-K.Report.
Executive Summary
We are a global technology-driven growth company serving
Flotek Industries, Inc. and its consolidated subsidiaries (“Flotek,” the “Company,” “we,” “us,” or the possessives of such terms) develop and supply oilfield products, services and equipment for use in the oil, gas and mining industries by providing oilfieldindustries. The Company's strategic focus includes specialty chemicals and logistics, downhole drilling and production tools, and automated bulk material handling, loading and blending. The Company's products and services help customers to more efficiently drill wells, increase production in existing wells, and equipment. We operatedecrease well operating costs. The Company operates in selectboth domestic and international markets, including the Gulf Coast, the Southwest, and the Rocky Mountains,Mountain, Northeastern and Mid-Continental regions of the United States (“U.S.”) as well as Canada, Mexico, Central America, South America, Europe, Africa and Asia. We market ourThrough operations and agency relationships the Company markets products domestically and internationallyservices in over 20 countries. The customers for our products and servicescountries worldwide. Customers include the major integrated oil and natural gas companies, independent oil and natural gas companies, pressure pumpingpressure-pumping service companies, contract drilling providers, national and state-owned national oil companies and international supply chain management companies. Our
The Company's business is comprised of three reportable segments. While each segment's technical expertise is unique, all segments are committed to provide customers with quality, competitively priced products and services. A detailed description of each segment's business operations and services is as follows:
Specialty Chemicals (“Chemicals”) designs, develops, manufactures, packages and markets specialty chemicals used in oil and natural gas well cementing, stimulation, acidizing, drilling and production activities. The Chemicals segment also contains our Logistics division, which manages automated bulk material handling, loading facilities, and blending services for oilfield services companies.
Drilling Products (“Drilling”) manufactures, rents, inspects, and markets downhole drilling equipment required for use in energy, mining, water well and industrial drilling activities.
Artificial Lift assembles and markets artificial lift equipment, notably our Petrovalve® product line of rod pump components, electric submersible pumps, gas separators, valves, and services that support coal bed methane (“CBM”) drilling activities.
The Company’s results of operations are heavily dependent upon the sustainability of prices charged to customers, which is significantly impacted by drilling activity levels, availability of equipment and other resources and competitive pricing pressures. Customers’ exploration and production budgets, in many instances, depend upon the revenue generated from the sale of oil and natural gas. Lower oil and natural gas prices usually translate into lower exploration and production budgets. The opposite is true for higher oil and natural gas prices.
The Company’s ability to compete in the oilfield services market is dependent on ourupon the ability to differentiate ourand provide superior products and services provide superior quality and service, and maintainwhile maintaining a competitive cost structure. OurDomestic operations are driven primarily byreactive to fluctuations in natural gas and to a lesser extent oil well drilling activity, thewell depth and drilling conditions, of such wells, the number of well completions and the level of work-overworkover activity in North America. DrillingNorth American drilling activity in turn, is largely dependent onaligned with and responsive to the pricevolatility of natural gas and crude oil and the volatility andcommodity prices as well as market expectations of future natural gasprices.
Historical North American drilling activity and
oil prices. Our results of operations also depend heavily on the pricing we receive from our customers, which depends on activity levels, availability of equipment and other resources, and competitive pressures. These market factors often lead to volatility in our revenue and profitability. Historical market conditionscommodity prices are reflected in the table below:
| | | | | | | | | | | | | | | |
| | | 2009 | | 2008 | | 2007 | | 2009 vs.
2008 | | | 2008 vs.
2007 | |
Average Active Drilling Rigs | | | | | | | | | | | | | | | |
United States | | | 1,089 | | | 1,879 | | | 1,768 | | (42.0 | )% | | 6.3 | % |
Canada | | | 221 | | | 381 | | | 344 | | (42.0 | )% | | 10.8 | % |
| | | | | | | | | | | | | | | |
Total North America | | | 1,310 | | | 2,260 | | | 2,112 | | (42.0 | )% | | 7.0 | % |
| | | | | | | | | | | | | | | |
Vertical rigs (U.S.) | | | 433 | | | 954 | | | 999 | | (54.6 | )% | | (4.5 | )% |
Horizontal rigs (U.S.) | | | 455 | | | 553 | | | 393 | | (17.7 | )% | | 40.7 | % |
Directional rigs (U.S.) | | | 201 | | | 372 | | | 376 | | (46.0 | )% | | (1.1 | )% |
| | | | | | | | | | | | | | | |
Total drilling type (U.S.) | | | 1,089 | | | 1,879 | | | 1,768 | | | | | | |
| | | | | | | | | | | | | | | |
Oil vs. Natural Gas Drilling Rigs | | | | | | | | | | | | | | | |
Oil | | | 382 | | | 543 | | | 426 | | (29.7 | )% | | 27.5 | % |
Natural Gas | | | 928 | | | 1,717 | | | 1,686 | | (46.0 | )% | | 1.8 | % |
| | | | | | | | | | | | | | | |
Total North America | | | 1,310 | | | 2,260 | | | 2,112 | | | | | | |
| | | | | | | | | | | | | | | |
Average Commodity Prices | | | | | | | | | | | | | | | |
West Texas Intermediate Crude Prices (per barrel) | | $ | 61.65 | | $ | 99.57 | | $ | 72.32 | | (38.1 | )% | | 37.7 | % |
Natural Gas Prices ($/mmbtu) | | $ | 3.71 | | $ | 8.07 | | $ | 6.38 | | (54.0 | )% | | 26.5 | % |
|
| | | | | | | | | | | | | | | | | | |
| | | 2012 | | 2011 | | 2010 | | 2012 vs. 2011 % Change | | 2011 vs. 2010 % Change |
| Average North American Active Drilling Rigs | | | | | | | | | | |
| United States | | 1,919 |
| | 1,879 |
| | 1,549 |
| | 2.1 | % | | 21.3 | % |
| Canada | | 364 |
| | 418 |
| | 349 |
| | (12.9 | )% | | 19.8 | % |
| Total | | 2,283 |
| | 2,297 |
| | 1,898 |
| | (0.6 | )% | | 21.0 | % |
| Average U.S. Active Drilling Rigs by Type | | | | | | | | | | |
| Vertical | | 552 |
| | 574 |
| | 502 |
| | (3.8 | )% | | 14.3 | % |
| Horizontal | | 1,151 |
| | 1,074 |
| | 825 |
| | 7.2 | % | | 30.2 | % |
| Directional | | 216 |
| | 231 |
| | 222 |
| | (6.5 | )% | | 4.1 | % |
| Total | | 1,919 |
| | 1,879 |
| | 1,549 |
| | 2.1 | % | | 21.3 | % |
| Oil vs. Natural Gas North American Drilling Rigs | | | | | | | | | | |
| Oil | | 1,621 |
| | 1,263 |
| | 795 |
| | 28.3 | % | | 58.9 | % |
| Natural Gas | | 662 |
| | 1,034 |
| | 1,103 |
| | (36.0 | )% | | (6.3 | )% |
| Total North America | | 2,283 |
| | 2,297 |
| | 1,898 |
| | (0.6 | )% | | 21.0 | % |
| Average Commodity Prices | | | | | | | | | | |
| West Texas Intermediate Crude Oil ($/bbl) | | $ | 94.13 |
| | $ | 94.87 |
| | $ | 79.40 |
| | (0.8 | )% | | 19.5 | % |
| Henry Hub Natural Gas ($/mmBtu) | | $ | 2.75 |
| | $ | 3.94 |
| | $ | 4.25 |
| | (30.2 | )% | | (7.3 | )% |
Source: Rig count: Baker Hughes, Inc. (www.bakerhughes.com)(www.bakerhughes.com); West Texas Intermediate CrudeOil and Natural Gas Prices: Department of Energy, Energy Information Administration (www.eia.doe.gov)(www.eia.doe.gov).Demand for our services Rig counts are the annual average of the reported weekly rig count activity. Oil and gas prices are the annual average of the monthly average natural gas price.
During the annual period 2012, North American drilling activity remained consistent with annual 2011 levels as reflected in the United Statestable above. Additionally, the 2012 period continued drilling patterns and Canada is driven primarily by natural gascommodity shifts similar of the annual 2011 period of increased average North American active drilling, further shifts in horizontal drilling and to a lesser extentpreferred growth in crude oil activity, predominantly from “tight” formations in onshore basins such as the Williston and Permian Basins in the U.S. and also the oil sands formations in Canada. Also, the increased usage of horizontal drilling activity, which tends to be extremely volatile, depending onand multi-stage hydraulic fracturing has increased the currenteconomic viability of tight oil production in North America, and anticipated pricesthe increased complexity of cruderecovering oil and natural gas. During the last ten years, the lowest average annual U.S. rig count was 830 in 2002gas from these types of formations.
As spending by oil and
the highest average annual U.S. rig count was 1,879 in 2008. With the decline and volatility of natural gas and oil prices in 2009, tightening and uncertainty in the credit markets and the global economic slowdown, drilling rig activity in North America declined significantly. The average active North American rig count declined 42.0% in 2009 as compared to 2008.
The weakening economic conditions that began to significantly weigh upon the energy markets in early October 2008 continued throughout 2009. The slowdown in the economy, particularly the industrial sector, coupled with the successful production results in the unconventional shale and tight sands plays in the U.S. led to a natural gas oversupply situation, which negatively impacted natural gas price forecasts. This in turn reduced the return potential of drilling projects causing less drilling activity as exploration and production (“E&P”) companies slashed their 2009 capital budgets. Oil prices showed some resilience toward the end of 2009; however our business is more dependent on the North American gas markets than oil markets. Therefore, the recovery of oil prices toward the end of 2009 did little to support a significant improvement in our business performance. In total, this translated into lower demand and weaker prices for oilfield services throughout North America. Late in the fourth quarter of 2008, we began to take actions to scale our business to cope with these factors by implementing various cost containment actions such as deferring employee salaries, reducing travel levels, suspending the 401(k) match, and eliminating any non-essential discretionary expenditures. Early in 2009, we took actions to size the workforce to our expected near-term work load, resulting in headcount reductions, including contract employees and full and part time employees. In conjunction with the market downturn, we decreased inventory levels and took advantage of declining raw material prices to meet our customers demand for competitive pricing. Our Drilling Products segment is tied closely to rig count, especially vertical rigs, and the significant reductions in rig count had an adverse effect on our business. Despite these pressures we were able to maintain our market share through service quality, product innovation, and competitive bundling of product offerings.
The sharp drop in natural gas and oil prices in the latter part of 2008 resulted in lower drilling activity, higher inventories, and further market erosion in 2009 as a result of a worldwide economic slowdown which led to a rapid and substantial reduction in exploration and production expenditures. In addition, margins were under significant pressure as customers sought lower prices for oilfield services and we, in turn sought price reductions from our suppliers.
Forecasting the depth and length of the current cycle is challenging, as it is different from past cycles due to the overlay of the worldwide financial crisis in combination with broad demand weakness. During the fourth quarter of 2009, U.S. drilling rig count averaged 1,108, as compared to 970 in the third quarter, an increase of 14.2%. While we expect to see continued increases in U.S. drilling activity in 2010, the timing and magnitude of the increase remains uncertain. The acceleration of drilling activity isheavily influenced by a numberexpectations of factors including commodity prices, globalfuture supply and forecast demand for oil and natural gas supplyproducts, as well as forecast costs to find, develop and depletion rates ofproduce reserves, the continued shift in oil and natural gas reserves,exploration and production spending sustained record demand for the Company’s products and services in r 2012 and 2011, as well as broader variables such as government monetarycompared to 2010. As the Company continuously strives to maintain a dynamic focus on customers demands for products and fiscal policy.
Theservices, strategically the Company has aligned itself with oil field services sector seems to have experienced its low point earlydrilling activity, but, remains vigilantly watchful for further shifts in market and customer demands.
As reflected above, during the third quarter of 2009. Our business stabilized and the cost containment measures that we implemented in late 2008 and early 2009 began to take effect. Rig activity in North America began to improve toward the latter part of 2009 as gas price forecasts improved as the supply overages began to shrinkannual 2012 period, crude oil prices remained high as a result of some improvementgeopolitical tensions in the Middle East, uncertainty about the European economy, and colderquestions about the length and sustainability of the economic recovery in the U.S., resulting in continued volatility and demand for oil commodity products. West Texas Intermediate spot prices spent most of the first and second quarters of 2012 above $100 per barrel, but fell to a 2012 low of less than normal temperature forecasts. We expect$80 per barrel in early July. The remainder of 2012 saw crude oil prices partially recovered, but not exceeding $100 per barrel through the remainder of the year. The average North American oil-directed rig count increased by 358 rigs, or 28.3%, during 2012 compared to 2011, driven by increased horizontal drilling activity in tight formations, partially offset by declines in conventional vertical drilling. North American drilling rig count generally increased throughout the year in 2011, but generally decreased throughout 2012, with the fourth quarter of 2012 exhibiting the lowest drilling rig count for the year.
This continued shift from natural gas to oil and liquids-rich shale basins continues to support an increase in the Company's product and service demands as well as support the continued demand for the Company's patented CnF® chemistry and other technological reliance designed to promote efficiency within complex reservoirs. As this trend continued throughout 2012, horizontal oil-directed drilling activity was the fastest growing segment of the market. Given the current alignment of the Company's products and operations, this activity generally increases the demand for the Company's products and services. During the annual period 2012, these trends continued to provide for demand across certain of the Company’s products lines and services offerings. Increased economic activity, particularly within North American markets, combined with emerging Middle Eastern and Asian market predictions for continued economic growth, support a continued demand for oil products.
Natural gas prices continued their decline during the annual period 2012, with average spot prices for Henry Hub declining 30.2% during 2012, reaching a low of less than $2/mmBtu during the second quarter of the 2012 annual period. Excluding Alaska and Hawaii, the natural gas working inventories of the lower 48 states averaged 3.2 Tcf during 2012, compared to 2.7 Tcf during 2011, due to increased natural gas production from North American shale formations and warmer than average winter temperatures during 2012. The increase in working inventories and decline in natural gas prices was reflected in the decline in overall North American gas-directed drilling activity, with a decrease in the average number of working rigs of 372 rigs, or 36.0%, during 2012 compared to 2011.
Despite the continued shift from natural gas to liquids rich natural gas and oil drilling during 2012, spending on natural gas-directed projects is supported by (1) hedges on prior period production transacted when futures prices were higher, (2) the need to drill and produce natural gas wells to hold leases acquired in earlier periods, (3) the influx of equity from companies interested in penetration and development of shale resource plays, and (4) associated production of natural gas liquids in certain basins. E&P companies continue to strive to improve discovery and production techniques to the point that, these improveddespite current relatively depressed natural gas prices, drilling for natural gas continues to be economically viable for the Company's customers.
Notwithstanding the continued shift in drilling activity and ever present geopolitical uncertainties, the Company believes over the long-term, any major macroeconomic disruptions will ultimately correct themselves as the underlying trends of significant demand growth within developing countries, smaller and more complex reservoir activity, high depletion rates, and the need for continual reserve replacement support the Company’s on-going strategic expansion initiatives with patented CnF® chemistries along with initiatives to increase domestic and international market penetration.
Outlook for 2013
The Company anticipates current economic conditions will continue throughout 2010. As E&P companies’ outlooks improve with these higher expectedthrough 2013 under current market conditions and trends. The Company, however, remains cognizant that if further unfavorable economic conditions occur, the Company could be unfavorably impacted by additional drilling activity uncertainty. Going forward the Company believes sustained current activity will ensure margin sustainability, but anticipates that growing cost pressures could stall forecast margin improvements in 2013.
Despite the continued pressure on natural gas prices
we expect thisand continued volatility in crude oil prices, the Company believes the current outlook for our industry is cautiously favorable. The near-term outlook for oil and gas prices as published by the U.S. Energy Information Administration (“EIA”) anticipates that average crude oil prices will
leadremain largely comparable to
increased capital budgets2012 price levels and average 2013 prices for
drilling and completion activities. Oil prices have currently stabilized and this should continuenatural gas will improve due to
add rig countcloser to average winter temperatures in 2013 as well as the continued shift to higher levels of usage of natural gas for power generation in the
oil basins which should help improve our Drilling Products revenue and lead to margin relief on pricing.We expectU.S. Additionally, the EIA anticipates North American gas marketdrilling activity will continueincrease in 2013 relative to see increases in2012, with the majority of the increase coming from tight, unconventional playsoil formations. The Company believes such asmarket conditions would favorably impact the Barnett, Haynesville, Marcellusdemand for the Company's products and other basins where our drilling tools are utilized. Our chemical additives enhance performance when added to fracturing fluids utilized in this type drilling. Our Chemicalsservices and Logistics segment is also tied to rig counts, especially horizontal drilling rigs. We also expect to see additional international opportunities in 2010, particularly in our Chemical and MWD business units.
Our business is comprisedprovide an increased potential of three reportable segments: Chemicals and Logistics, Drilling Products and Artificial Lift. We focus on serving the drilling-related needsexploitation of these types of reservoirs.
As future recovery of oil and gas companies primarily through our Chemicalsreserves continues to shift to more complex reservoirs, the Company believes products and Logisticsservices offered will continue to be in demand. In addition, the Company believes growing recognition and Drilling Products segments,demand for lower environmental impact and the production-related needs ofproducts which increase oil and gas companies throughrecovery efficiencies will make the Company's environmentally friendly “green” stimulation fluid additives and EOR products more attractive to existing and new customers. Accordingly, the Company remains committed to a robust Research and Development (“R&D”) program in order to remain responsive to the needs of our Artificial Liftcustomers. During 2012 the Company spent $3.2 million on R&D activities, up from $2.3 million in 2011, and anticipates 2013 expenditures will be similar to 2012.
Capital expenditures for 2012 totaled $20.7 million, up from $10.0 million in 2011. Increased capital expenditures during 2012 consisted primarily of rental tools, equipment, facilities to meet customer demand and our new Enterprise Resource Planning (“ERP”) system. The Company expects capital expenditures, excluding possible acquisitions, to remain consistent compared to 2012 levels with increased expenditures within the Chemicals and LogisticsDrilling segments. We believe thatCapital expenditures in the specialty Chemicals business totaled $3.6 million in 2012 compared to $2.2 million in 2011, or 1.9% and 1.6%, respectively as a percentage of revenue. Capital expenditures in the Drilling business totaled $11.9 million in 2012 compared to $6.0 million in 2011, or 10.2% and 6.9%, respectively as a percentage of revenue. The company expects the annual 2013 Chemicals and Drilling capital expenditures to be $7.6 million and $9.5 million, respectively, but could fluctuate in response to changes in market demand, realized results of operations, and strategic initiatives taken by the Company should certain expansion opportunities arise. Given the completion of the implementation of the ERP system in 2012 as well as the new Corporate office build out, Corporate capital expenditures are expected to decrease in 2013 as compared to levels in 2012.
Results of Operations (in thousands):
|
| | | | | | | | | | | | |
| | | Year ended December 31, |
| | | 2012 | | 2011 | | 2010 |
| Revenue | | $ | 312,828 |
| | $ | 258,785 |
| | $ | 146,982 |
|
| Cost of revenue | | 181,209 |
| | 152,965 |
| | 94,012 |
|
| Gross margin | | 131,619 |
| | 105,820 |
| | 52,970 |
|
| Selling, general and administrative costs | | 66,415 |
| | 50,612 |
| | 41,861 |
|
| Depreciation and amortization | | 4,410 |
| | 3,983 |
| | 4,543 |
|
| Research and development costs | | 3,182 |
| | 2,337 |
| | 1,441 |
|
| Impairment of long-lived assets | | — |
| | — |
| | 8,898 |
|
| (Gain) loss on disposal of long-lived assets | | (1,009 | ) | | — |
| | 2,104 |
|
| Impairment of goodwill or other intangible assets | | — |
| | — |
| | 390 |
|
| Income (loss) from operations | | 58,621 |
| | 48,888 |
| | (6,267 | ) |
| Change in fair value of warrant liability | | 2,649 |
| | 9,571 |
| | (21,464 | ) |
| Interest and other expense, net | | (15,812 | ) | | (19,189 | ) | | (21,279 | ) |
| Income (loss) before income taxes | | 45,458 |
| | 39,270 |
| | (49,010 | ) |
| Income tax (expense) benefit | | 4,333 |
| | (7,862 | ) | | 5,545 |
|
| Net income (loss) | | $ | 49,791 |
| | $ | 31,408 |
| | $ | (43,465 | ) |
Results for 2012 compared to 2011—Consolidated
Revenue for the year ended December 31, 2012 totaled $312.8 million, an increase of $54.0 million, or 20.9%, compared to $258.8 million for the year ended December 31, 2011. The increase in revenue for 2012 was driven primarily by increased sales to new and existing customers of patented CnF® technologies increased sales volumes of stimulation additives, and increased market share of centralizer products and float equipment. A key driver in the increase of sales has been an increase in customer demand resulting for the Company's oil tools resulting from the continued shift away from gas-directed drilling in North America to oil-directed drilling. In reaction to the continued shift in drilling activity and oil prices, customer product demands increased for Company products adapted for the current oil-directed drilling activity and environments. Additionally, increased product demand and resulting increased sales can be attributed within the Chemicals segment due to the Company's adaptation of CnF® products which serve as effective oil mobility enhancement contributors and within the Drilling segment to the Company's Teledrift®, Pro Series®, and Prodrift® tools utilized in oil and liquids based drilling activity. As a result the Company has benefited from the addition of several new strategic customers, expansion of our product offerings and geographical presence throughout these three business segments provides us with diverse sources of cash flow. Each segment has its own technical expertise and a common commitmentexisting customers, increased capacity by shifts in customer demand to provide its customers with competitively priced quality equipment and services.The Chemicals and Logistics segment develops, manufactures and markets specialty chemicals used in oil and gas well cementing, stimulation, acidizing, drilling and production treatment. Additionally,higher margin products. Partially offsetting the segment provides well cementing, bulk blending and transload services and transload facility management services.
The Drilling Products segment rents, inspects, manufactures and markets downhole drilling equipmentincreased sales for the energy, mining, water well and industrial drilling sectors.
Theannual 2012 period are decreased sales of $3.4 million within the Company's Artificial Lift segment assemblesdue to the decline in installs and markets artificial lift equipment which includesworkovers as a result of decreased customer activity impacted by the Petrovalve line of rod pump components, electric submersible pumps, and gas separators, valves and services to support coal bed methane production.
Over the past three years, we have grown both organically and through strategic acquisitions and other investmentsdecline in complementary or competing businesses in an effort to expand our product offering and geographic presence in key markets. We strive to mitigate cyclical risk in the oilfield service sector by balancing our operations between drilling versus production; rental tools versus service; domestic versus international; and natural gas versus crude oil.
The acquisitions we completed in the preceding three years include:
Teledrift, Inc. (“Teledrift”), which designs and manufactures wireless survey and measurement while drilling tools in February 2008;
Sooner Energy Services, Inc. (“Sooner”), which develops, produces and distributes specialty chemical products and services for drilling and production of natural gas in August 2007;
A 50% partnership interest in CAVO Drilling Motors, Ltd, Co., (“CAVO”), which specializes in the rental, service and sale of high performance mud motors in January 2007,prices during 2012 and the remaining 50% partnership interestcorresponding decline in November 2007;
natural gas-directed drilling activity.TriumphConsolidated gross margin as a percentage of sales increased 1.2% to 42.1% for the year ended December 31, 2012 compared to 40.9% for the year ended December 31, 2011. The increase in gross margin is primarily due to a shift to a more favorable product mix during 2012 along with reductions in materials and operating costs. As a result of the continued shift in drilling activity and type the Company's customers have shifted to higher margin products offered by the Company. Additionally, the Company has recognized cost savings as a result of negotiated raw material price concessions with existing vendors in addition to exploration of raw material sourcing alternatives, as well as efficiencies gained from new plant and equipment additions and improved manufacturing processes. Increasing industry recognition of proven production efficiencies and environmental benefits derived from use of Flotek’s new and existing products also increased demand in both the Chemicals and Drilling Tools, Inc.segments.
Operating income for the annual 2012 period was $58.6 million, an increase of $9.7 million, or 18.7%, compared to $48.9 million, or 18.9% for the annual period 2011. The increase in operating income is primarily due to increased margins and sales volume and product activity as noted above. Tempering the increase in operating income, as exemplified by a percentage of revenue decrease of 0.2%, is the Company's implementation of the a new ERP system and the addition of the Company's new corporate offices. The Company expects the benefits from the increased operational and management reporting efficiencies will more than offset the costs of the new ERP system and likewise expects the benefits from its new location and facilities to provide the much needed support of the increased growth and operations by the Company's operating business segments.
Selling, general and administrative costs (“Triumph”SG&A”) are not directly attributable to products sold or services rendered. SG&A as a percentage of revenue for the year ended December 31, 2012 increased by 1.6% to 21.2% from 19.6% compared to the same period in 2011. SG&A costs totaled $66.4 million for the year ended December 31, 2012, an increase of $15.8 million, or 31.2%, compared to $50.6 million in 2011. The comparative period over period increase was due primarily to increased salaries and wages, cash and equity incentive compensation and professional fees of $4.7 million, $7.3 million and $1.8 million, respectively. Salary and wage expense increased as a drilling tool salesresult of a 6.9% increase in headcount and rental providermedical and insurance costs due to additional employees and higher claims in Texas, New Mexico, Louisiana, Oklahoma2012. Cash and Arkansas,equity incentive compensation increased in January 2007;2012 ($2.9 million and $4.4 million, respectively) due to improved period over period performance. The increase in professional fees is primarily due to the use of third party consultants during the implementation of the new ERP system in 2012.
Non-Cash ImpairmentDepreciation and amortization expense not captured in gross margin totaled We test goodwill$4.4 million for impairment at the reporting unit levelyear ended December 31, 2012, an increase of $0.4 million, or 10.7%, from 2011 is primarily due to an increase in leased vehicles within Drilling of approximately 25 vehicles and an increase of shop and maintenance equipment within Chemical.
R&D expenses totaled $3.2 million for the fourth quarteryear ended December 31, 2012, an increase of every$0.8 million, or 36.2%, from expenses of $2.3 million for the year ended December 31, 2011. An increase in Drilling of $0.2 million and on an interim basis if events occur or circumstances change that would more likely than not reduce$0.6 million in Chemical is attributable to increased research activity related to new product development. R&D is charged to expense as incurred.
During the year ended December 31, 2012, non-cash net gains of $2.6 million were recognized related to changes in the fair value of the reporting unit below its carrying amount. Impairment exists when the carrying amount of goodwill exceeds its implied fair value. Testing of goodwill requires an assessment of the current business environment, future economic market indicators, expectations surrounding our future performance, the cost of working capital, projected revenue and operating margins, assessment of market and industry risk rates, and recognition of changes in these variables which may indicate the potential existence of goodwill impairment losses to be recognized, if any.During the quarter ended June 30, 2009, we identified certain triggering events resulting from the continued downturn in the then current business environment. This assessment impacted and lowered forecasted earning potential of our reporting units from that previously estimated at December 31, 2008. Accordingly, we recorded a goodwill pre-tax impairment charge of $18.5 million relating to our Teledrift reporting unit during the six-months ended June 30, 2009.
As our current economic climate continues to be weak, we incorporated into our 2009 annual impairment assessment, and our 2010 full year forecast, a measure of the recessionary environment of the second half of 2009. We anticipate a continued challenging environment for the first half of 2010, followed by a slight recovery in the latter half of 2010. We anticipate benefits from a re-leveraging of sales in the second half of 2010 and early 2011. The continued unfavorable business environment, volatile economic downturn continuing during the latter half of 2009, low rig count projections, and uncertainty as to the recovery of the global economy, have contributed to conservative projected cash flows and higher risk-adjusted discount rates used in our current annual 2009 assessment asCompany's warrant liability, compared to those useda
$9.6 million net gain during 2011. The change was driven by the change in our interim 2009 and annual 2008 assessments.We believe cost containment actions taken in late 2008 and throughout 2009 were successful. These included closing certain operating locations, curtailing capital expenditures, reducing costs through reductions in personnel levels, discontinuing our 401(k) matching, and focusing on our cost margin management. We emphasized collection of customer receivables and inventory management. This helped ensure preservation of the economic value of our businesses. Through our analyses, we determined that the fair value of reporting units exceeded the goodwill carrying value. Accordingly, we determined no further impairment charges were necessary as part of our 2009 annual goodwill impairment assessment.
We utilize a combination of a market approach and a present value discounted cash flow valuation technique to measure the fair value of the goodwillexercisable and contingent warrants outstanding resulting primarily from a decrease in the Company's common share price to $9.53 at June 14, 2012 from $9.96 at December 31, 2011.
Interest and other net expenses for the year ended December 31, 2012 totaled $15.8 million, a decrease of our reporting units.$3.4 million, or 17.6%, from $19.2 million for the year ended December 31, 2011. The decrease is attributable to a reduction of $4.1 million in interest expense, in the amortization of issuance costs and debt discounts ($2.2 million and $1.6 million, respectively) period over period associated with the early repayment of the Company's term loan in June 2011 and the convertible notes in January 2012 with an increase of $4.0 million attributable to the loss on extinguishment of debt.
Income tax benefit for the year ended December 31, 2012 was $4.3 million, an increase of $12.2 million, or 155.1%, from income tax expense of $7.9 million for the year ended December 31, 2011. The Company's effective tax rate for the year ended December 31, 2012 was (9.5)%, compared to 20.0% for the year ended December 31, 2011. The change in the Company's effective tax rate is primarily due to the tax effect of a $2.6 million increase of non-cash fluctuations in the fair value of the Company's warrant liability, a reporting unit refers to the price that would be received from selling the unit as a whole in an orderly transaction between market participants at the measurement date. Quoted market prices in active markets are the best evidence of fair value and are used as the basis$3.9 million permanent deduction for the measurement, if available. The market approach is dependent upon market dataDomestic Production Activities Deduction and a $18.6 million decrease in valuation allowance against the deferred tax asset of comparable public entities with operations and metrics similar to thoseone of our operating segments. If quoted market prices or market indicators are not available, we include a fair value estimate in our assessment which incorporates valuation techniques based on a weighted average cost of capital and multiple of after-tax cash flows attributed to the reporting unit. The cash flows are discounted to a present value using risk adjusted discount rates over a period of expected future returns. This income approach valuation technique is consistent with the objective of fair value measurements and is consistent with the methodology applied in our previous assessments. The income approach is dependent on our weighted average cost of capital and our forecasted operating results and future cash flows. Therefore, we consider available and relevant market multiple measures along with the estimated and expected future cash flows of our reporting units to determine fair value.Results of Operations (in thousands):filing jurisdictions.
| | | | | | | | | | | | |
| | | Years Ended December 31, | |
| | | 2009 | | | 2008 | | | 2007 | |
| | | (Restated) | | | | | | | |
Revenue | | $ | 112,550 | | | $ | 226,063 | | | $ | 158,008 | |
Cost of revenue | | | 83,166 | | | | 135,307 | | | | 94,561 | |
| | | | | | | | | | | | |
Gross margin | | | 29,384 | | | | 90,756 | | | | 63,447 | |
Selling, general and administrative costs | | | 36,943 | | | | 46,311 | | | | 30,639 | |
Depreciation and amortization | | | 4,926 | | | | 5,570 | | | | 2,273 | |
Research and development costs | | | 2,118 | | | | 1,931 | | | | 849 | |
Impairment of goodwill and other intangible assets | | | 18,500 | | | | 67,695 | | | | — | |
| | | | | | | | | | | | |
Income (loss) from operations | | | (33,103 | ) | | | (30,751 | ) | | | 29,686 | |
Interest and other expense, net | | | (15,121 | ) | | | (13,909 | ) | | | (2,545 | ) |
| | | | | | | | | | | | |
Income (loss) before income taxes | | | (48,224 | ) | | | (44,660 | ) | | | 27,141 | |
(Provision) benefit for income taxes | | | (2,016 | ) | | | 10,499 | | | | (10,414 | ) |
| | | | | | | | | | | | |
Net income (loss) | | $ | (50,240 | ) | | $ | (34,161 | ) | | $ | 16,727 | |
| | | | | | | | | | | | |
Results for
20092011 compared to
2008—2010—Consolidated
Revenue for the year ended December 31,
2009 was $112.62011 totaled $258.8 million,
a decreasean increase of
$113.5$111.8 million, or
50.2%76.1%, compared to
$226.1$147.0 million for the same period in
2008. Revenue decreased2010. The increase in
revenue in 2011 was across all
three of ourCompany segments
as decreases in petroleum and
natural gaswas due to positive market fluctuations combined with strategic initiatives undertaken by the Company. Increased oil prices,
drove down rig counts and related drilling activity,
negatively affecting volumecustomer demand and shifts to higher margin product mix contributed to the period over period increase. Company expansion into new and within existing markets with strategic product adaptation, product customization and new product development as well as cross marketing of products, revitalization of sales force, and price increases in
all segments. In addition, pricing pressures drove down revenues as customers movedcertain product lines also contributed to
less expensive products where possible.Consolidatedincreased revenue in 2011.
The consolidated gross
margin decreased $61.4 million. Gross margin as a percentage of sales
decreasedincreased by 4.9% to
26.1%40.9% for the year ended December 31,
20092011 from
40.1%36.0% in
20082010 due
primarily to
strategic price increases, shift in customer demand to higher margin
compression in the Drilling Products segmentproducts, continued cost containment, sales force revitalization, product cross marketing initiatives and
segment direct expenses, that while reduced $5.9 million, decreased at a lower rate than revenue.increased market penetration. Gross margin is calculated as revenue less
the correspondingassociated cost of revenue,
which includesinclusive of personnel, occupancy, depreciation and other expenses directly associated with the generation of revenue.
Selling, general and administrative
SG&A as a percentage of revenue for the year ended December 31, 2011 decreased by 8.9% to 19.6% from 28.5% for the same comparable period of 2010. SG&A costs
are not directly attributable to products sold or services rendered. Selling, general and administrative costs were $36.9totaled $50.6 million for the year ended December 31,
2009, a decrease2011, an increase of
20.2%$8.7 million, or 20.8%, compared to
$46.3$41.9 million in
2008.2010. The
decreasecomparative period over period increase was
due primarily
to increased salaries and wages and cash and equity incentive compensation. Salary and wage expense increased as a result of a 21.5% increase in headcount, overtime expense related to increased segment activity ($3.8 million), and sales commission expense primarily related to increased sales activity within Drilling ($0.7 million). Cash and equity incentive compensation increased in 2011 ($1.7 million and $2.8 million, respectively) due to
a $9.3 million reduction in indirect personnel and personnel related costs and professional fees due to cost containment efforts.improved period over period operational performance.
Depreciation and amortization costs were $4.9expense totaled $4.0 million for the year ended December 31, 2009,2011, a decrease of approximately 11.6%$0.5 million, or 12.5%, compared to 2010 primarily due an impairment and correspondent reduction in the same perioddepreciable basis of fixed assets in 2008.December 2010. No comparable activity occurred in 2011.
R&D expenses totaled $2.3 million during 2011, an increase of $0.9 million, or 64.3%, compared to $1.4 million in 2010. The increase in R&D expense is attributable to increased research activity related to new product development.
During the year ended December 31, 2011, the warrant liability decreased by $9.6 million to $16.6 million. The decrease was recognized in the statement of operations as noncash income. The decrease is primarily
duerelated to
a reductionthe exercise of
amortizable intangible assets as a result of the asset impairment recorded in 2008.Researchapproximately 4.0 million warrants during 2011.
Interest and
development (R&D) costs were $2.1other expense totaled $19.2 million for the year ended December 31,
2009, an increase2011, a decrease of
9.7%,$2.1 million, or 9.8% compared
with $21.3 million in 2010. The decrease was attributable to
a $3.5 million period over period reduction in interest expense associated with early repayment of the Company’s term loan in June 2011, partially offset by accelerated recognition of $1.7 million unamortized term loan debt issuance costs and $1.9 million
during the same period in 2008. R&D costs in the Chemicals and Logistics segment were 65% and 89% of total R&D expense in 2009 and 2008, respectively. We anticipate 2010 R&D spending levels to remain consistent with 2009 expenditures. R&D expenditures are charged to expense as incurred.In the second quarter of 2009, we recorded goodwill impairment of approximately $18.5 million related to the Teledrift reporting unit. No additional impairment was recorded as part of management’s 2009 annual assessment of goodwill.
Management believes its cost structure is appropriate for its forecast level of activity and does not foresee significant adjustments; however, changes in market demands or forecast may cause management to further reduce headcount or carry out additional cost containment efforts.
Interest expense was $15.4 million for the year ended December 31, 2009 versus $13.8 million in 2008. The increase was primarily related to accretion of theunamortized debt discount, recorded effective January 1, 2009 associated with adoptionresulting in $5.2 million of a new accounting principle.
An incomelosses from the early extinguishment of debt during 2011.
Income tax
provisionexpense of
$2.0$7.9 million was recorded for the year ended December 31,
2009,2011, reflecting an effective tax rate of
(4.2)%20.0%, compared to a tax benefit of
$10.5$5.5 million for the year ended December 31,
2008,2010, reflecting an effective tax rate of
23.5%(11.3%). The change in
ourthe Company’s effective tax rate is primarily due to
an $18.8$9.6 million
increase of non-cash fluctuations in the fair value of the Company’s warrant liability and decrease in valuation allowance
recordedof $3.5 million in
20092011 against the deferred tax
assetsasset of one of
ourthe filing jurisdictions.
In addition, the 2008 impairment had a $19.3 million impact on our 2008 tax provision and there was no similar impact in 2009. Results by Segment
|
| | | | | | | | | | | | |
| | | Year ended December 31, |
| Chemicals (dollars in thousands) | | 2012 | | 2011 | | 2010 |
| Revenue | | $ | 183,986 |
| | $ | 140,836 |
| | $ | 66,121 |
|
| Gross margin | | $ | 81,438 |
| | $ | 56,115 |
| | $ | 29,249 |
|
| Gross margin % | | 44.3 | % | | 39.8 | % | | 44.2 | % |
| Income from operations | | $ | 65,440 |
| | $ | 43,549 |
| | $ | 19,833 |
|
| Income from operations % | | 35.6 | % | | 30.9 | % | | 30.0 | % |
Results for 20082012 compared to 2007—Consolidated2011—Chemicals
Revenue for the Chemicals segment was $184.0 million for the year ended December 31, 2012, an increase of $43.2 million, or 30.6%, from revenue of $140.8 million for the year ended December 31, 2011. The primary increase in revenue was driven by a $27.5 million, or 63.7% increased sales of patented CnF® products to existing and new customers and approximately a $15.7 million, 36.3% increase in revenues attributable to increased sales volumes of stimulation liquids. Given the continued shift away from gas-directed drilling in North America to oil-directed drilling, the Company's adaptation of CnF® products to serve as effective oil mobility enhancers resulted in increased sales. Oil molecules are larger and more difficult to mobilize through low permeability formation than gas molecules and thus oil reservoirs benefit even more from the use of additives such as Flotek's CnF® products. In general, revenue growth was the result of the Company’s development, strategic adaptation and customization of proprietary natural gas effective CnF® additives to oil effective CnF® additives for new and existing customers, increased market demand and incremental domestic and international market penetration. Increasing industry recognition of proven production efficiencies and environmental benefits derived from use of Flotek’s new and existing products increased demand for CnF® products in both domestic and international markets.
The Company experienced significant expansion in the Rocky Mountain regions, primarily the Niobrara formation. During 2012 the Company continued to experience increased success of CnF® products with the addition major new customers in oily shale basins where the Company's CnF® products are employed. Also contributing to the support of sales expansion is the Company's partnerships with major service companies and the continuous support of operational efforts to educate the end users of CnF® products as to the benefits of the CnF® products. Additionally, the Company has seen growth and expansion in both North Dakota, South Texas, and the Permian Basin region, primarily in the Bakken, Wolfcamp, and Eagle Ford formations, respectively.
Gross margin for the year ended December 31, 2012 was $81.4 million, or 44.3% of revenue, compared to $56.1 million, or 39.8% of revenue for the year ended December 31, 2011. The increase in gross margin and gross margin percentage was due primarily to a shift to a more favorable product mix during 2012 along with reductions in materials costs due to negotiated raw material price concessions with existing vendors, as well as efficiencies gained from new plant and equipment additions and improved
manufacturing processes. Cost containment also remained a focus for the Company in 2012, with direct operating costs as a percentage of revenue declining 2.7% due to the continued oversight and management control of operational costs. As revenues increased 30.6%, cost of goods sold increased by only 22.1% with direct product costs, in particular increasing by only 2.8%, when compared to the same annual period in 2011. Additionally, cost containment was facilitated by operating efficiencies realized from the expansion of Chemicals’ manufacturing facility and on-going best practice process improvement initiatives aimed at reducing labor and overhead costs.
Operating income for the year ended December 31, 2012 totaled $65.4 million, or 35.6% of revenue, an increase of $21.9 million, or 50.3%, compared to operating income of $43.5 million, or 30.9% of revenue, for the year ended December 31, 2011. As a result of cost management efforts, indirect expense as a percentage of revenue decreased by 0.1% when compared to the same annual period of 2011 partially offset by a $0.6 million increase in R&D activity in connection with increased activity. The remainder of favorable variance was due to aforementioned improvement in period over period gross margin.
Results for 2011 compared to 2010—Chemicals
Chemicals’ 2011 revenue totaled $140.8 million, an increase of $74.7 million, or 113.0%, compared to $66.1 million in 2010 due to increased oil-directed and liquid-rich natural gas drilling activity driven by increased global crude oil prices and stabilized liquid-rich natural gas prices. Increased product sales volumes contributed to the period over period increase in revenue. Increased sales volumes of stimulation liquids contributed to $70.4 million of the 2011 increase. Strategic adaptation of proprietary natural gas effective CnF® micro-emulsifiers to oil effective CnF® micro-emulsifiers in conjunction with new and increased existing customer demand, domestic and international market penetration and industry growth, particularly within the Bakken and Niobrara shale plays, contributed to the period over period increase in revenue. Increased cross-marketing sales efforts resulted in increased industry recognition of proven production efficiencies and environmental benefits derived from use of both new and existing products and increased demand for microemulsion product in both domestic and international markets. Strategic sales marketing efforts during 2011 further enhanced customer awareness and demand of a broader range of products and services available within the Company’s overall portfolio. Additionally, a $4.3 million contribution to incremental year over year revenue resulted from existing project completions and newly contracted construction project activity.
Chemicals’ 2011 gross margin increased $26.9 million, or 91.5%; yet declined 4.4% as a percentage of revenue as compared to 2010. The period over period increased gross margin is primarily attributable to increased pricing instituted in June of 2011 combined with increased domestic and international market product penetration. The year over year decline in the gross margin as a percentage of revenue is attributable to increased raw material costs due to supply shortages in 2011, customer demand shift to lower margin products, increased transportation expense and increased international storage facility fees.
The Company’s decision to expand the breadth of the suite of chemical offerings, combined with newly developed products in 2011 tailored to customer specifications, resulted in lower margins due to increased raw material costs and competitive pricing constraints. Although customer tailored product gross margins as a percentage of revenue are in general lower than traditional product margins, the favorable increase in product sales volumes and customer demand were contributory to the Company’s bottom line. Identification of synergistic market opportunities, growth of domestic and international market share, and cost containment efforts remained a Company priority throughout 2011. Cost management initiatives and vendor pricing negotiations are expected to result in raw material price reductions and purchasing efficiencies in 2012. Direct operating costs as a percentage of revenue decreased 2.0% in 2011 to 3.3% versus 5.3% realized in 2010 and were indicative of the Company’s continued oversight and management of operational costs.
Income from operations increased $23.7 million, or 119.6%, in 2011 compared to 2010 due to increased product sales and service volumes of 4.8 million gallons, average enacted price increases of approximately 7.0%, and a 18.5% increase in North American drilling activity realized in 2011 as compared to 2010.
R&D activity increased $0.9 million, or 62.1%, in 2011 as compared to 2010 due to new product development and preservation of intellectual property rights.
|
| | | | | | | | | | | | |
| | | Year ended December 31, |
| Drilling Products (dollars in thousands) | | 2012 | | 2011 | | 2010 |
| Revenue | | $ | 116,736 |
| | $ | 102,470 |
| | $ | 65,782 |
|
| Gross margin | | $ | 45,709 |
| | $ | 43,607 |
| | $ | 18,991 |
|
| Gross margin % | | 39.2 | % | | 42.6 | % | | 28.9 | % |
| Income (loss) from operations | | $ | 22,282 |
| | $ | 23,035 |
| | $ | (9,738 | ) |
| Income (loss) from operations % | | 19.1 | % | | 22.5 | % | | (14.8 | )% |
Results for 2012 compared to 2011—Drilling
Drilling revenue for the year ended December 31, 2012 totaled $116.7 million, an increase of $14.3 million, or 13.9%, compared to $102.5 million for the year ended December 31, 2011. The increase in revenue is attributable to increased domestic and international market share from existing and new customers, favorable shifts in customer demand to higher-margin products, and increased customer demand as a result of sustained oil focused drilling activity.
Product Revenue: 2012 product revenue increased $6.4 million as compared to same annual period of 2011. Increased market share of centralizer products and float equipment; especially in the South Texas and Mid Continent regions; lead to an increase of $3.7 million. In addition, product revenue increased $2.7 million in revenue, period over period, from the sales of raised drill pipe and drill steel equipment; especially to the international mining industry. The continued increase of gold and platinum metal prices in 2012 of approximately $140/oz. and $180/oz, respectively have driven an increased in the demand for Flotek mining products.
Rental Revenue: 2012 revenue from rentals increased by $4.3 million in 2012 as compared to the same annual period of 2011. Demand for Teledrift® and Pro Series® MWD tools accounted for $3.9 million of the increase domestically in the Permian Basin and the Granite Wash/Mississipian Lime regions as well as internationally in Argentina. A product demand shift from Teledrift® tools to the higher revenue Prodrift® tools has continued to occur in 2012 with tool rentals up 5% in total this year compared to the same annual period of 2011. Motor, jar, and shock rentals also increased by $0.4 million in the South Texas and Mid Continent regions where product demand and market share have also contributed to the increase in rental revenue.
Service Revenue: 2012 service revenue increased by $3.6 million and was directly related to increased activity in the segment for drilling, increased prices of services and installations, and increased inspection services.
Gross margins for Drilling totaled $45.7 million, or 39.2% of revenue, for the year ended December 31, 2012. This represented an increase of $2.1 million, or 4.8%, over 2011 gross margins of $43.6 million, or 42.6% of revenue. The increase in gross margin was driven by increased product, rental and service pricing in 2012 and more favorable margins on the product mix in centralizer and drill pipe sales, but tempered by increased repair and equipment costs for motor rentals.
Operating income for the year ended December 31, 2012 was $22.3 million, or 19.1% of revenue, a decrease of $0.8 million, or 3.3% from operating income of $23.0 million, or 22.5% of revenue, for the year ended December 31, 2011. Operating income and operating income margins declined during 2012 due to rising employee-related expenses during 2012 related to increased activity, partially offset by gains recognized on the disposal of operating assets.
Results for 2011 compared to 2010—Drilling
Drilling revenue for the year ended December 31,
2008 was $226.12011 totaled $102.5 million, an increase of
43.1%,$36.7 million, or 55.8% compared to
$158.0 million for the same period in 2007. Revenue increased in all three of our segments as we experiencedorganic growth greater than 20% when compared to the previous year with the remainder of the growth coming from our acquisition of Teledrift. The organic revenue growth is primarily a result of an increase in overall sales volume, particularly of our patented micro-emulsion chemicals, tool rentals, service inspections and expansion of our mud motor fleet. Sales of our patented micro-emulsion chemicals grew 37.2%, to $77.4$65.8 million for the year ended December 31, 2008.
Gross margin2010. The favorable variance resulted from domestic and international market share growth with both new and existing customers, change in customers’ product mix demands, increased rig count, increased lost in hole revenue, favorable crude oil commodity prices, new product development, specialized customer demand for the year ended December 31, 2008 was $90.8existing product adaptation, continued cross segment sales marketing efforts, sales force revitalization, and competitive pricing relief.
• Product revenue: 2011 product revenue increased $11.6 million an increase of 43.0%,as compared to $63.42010. Increased market share penetration of motor and centralizer products in new and existing markets combined with increased oil and horizontal rig drilling activity, cross segment sales marketing efforts and increased crude commodity prices resulted in $8.0 million forof period over period incremental revenue. Raised drill pipe, collar and reamer equipment sales increased $3.6 million period over period from increased customer demand within gold and silver mining industries due to increased gold and silver commodity prices period over period. Gold and silver prices increased by approximately $312/oz. and $8.50/oz., respectively, driving increased demand of both domestic and international customers.
• Rental revenue: 2011 rental revenue increased $21.4 million as compared to 2010. Increased market share penetration within new and existing domestic and international markets, product mix demand shift to Pro-Tools from legacy tools, and associated increased oil and horizontal rig drilling activity resulted in $8.7 million of incremental period over period revenue. Tool rentals increased by 26.2% from 3,118 rentals in 2010 to 3,934 rentals in 2011 and contributed to $7.6 million of the same period over period increase. Increased rental prices and lost in 2007.hole revenue during 2011 contributed $4.9 million and $1.4 million, respectively. Increased lost in hole revenue was attributable to the overall increase in activity in 2011 as compared to 2010.
•Service revenue: Incremental 2011 service revenue of $3.6 million as compared to 2010 was directly related to increased oil and horizontal rig drilling activity, increased prices of services, and increased international motor service.
Drilling’s 2011 gross margin increased $24.0 million, or 129.6%, relative to 2010 driven by increased product, rental and service prices, product mix shift to higher margin products and continued cost containment. Efforts to market higher margin motors within
targeted market growth areas also contributed to the period over period increase. Gross marginmargins as a percentage of revenue remained flat between both periods at approximately, 40.2%increased 13.7%, from 28.9%, to 42.6%, in 2011 versus 2010, respectively. 2011 Drilling revenue increased 55.8% compared to 2010 with only a 20.5%, increase in associated cost of revenues. We actively managed our gross margin through targeted price increases andrevenue due to continued cost containment measures to offset increasing raw material prices throughout the year. We continued to experience greater volumes within our higher margin Chemicalsefforts and Logistics segment and volumes relatedfocus on operational efficiencies.
Income from operations totaled $23.0 million in 2011, a recovery of $32.8 million, or 336.5%, as compared to the
Teledrift acquisition. Sales of our patented micro-emulsion chemicals, which sell at higher margins, made up 34.2% of consolidated revenues for the year ended December 31, 2008, compared to 35.7% for the year ended December 31, 2007.Selling, general and administrative costs were $46.3 million for the year ended December 31, 2008, an increase of 51.2%, compared to $30.6 million for the same period in 2007. Excluding the Teledrift acquisition, the increase was primarily due to a $10.6 million increase in indirect personnel, office and occupancy costs in all divisions as we shifted into the more people-intensive rental and service business, expanded geographically and expanded our sales and corporate support staff. The acquisition of Teledrift accounted for $2.1 million of the total increase, and professional fees increased $2.1 million due to higher administration and management costs, which were incurred to strengthen back office functions and internal controls.
Depreciation and amortization costs were $5.6 million for the year ended December 31, 2008, an increase of 145%, compared to $2.3 million during the same period in 2007. The increase is due to higher depreciation associated with acquired assets and expanded capital expenditures.
Research and development costs were $1.9 million for the year ended December 31, 2008, an increase of 127%, compared to $0.8 million during the same period in 2007. In 2008 we expanded our R&D investments in the Chemicals and Logistics segment by approximately 125%. R&D expenditures are charged to expense as incurred.
We impaired the carrying value of goodwill and other intangible assets based on management’s evaluation of the Company’s sustained low stock price and reduced market capitalization, macroeconomic factors impacting industry conditions, actual recent results and forecasted operating performance, as well as other factors. The Company determined that the carrying value of goodwill and other intangible assets exceeded the estimated fair value of certain reporting units and intangible assets, and, as a result, recorded an impairment of $67.7 million at December 31, 2008. (Loss) from operations was ($30.8) million for the year in 2008 compared to incomeloss from operations of $29.7$9.8 million for the year in 2007.
Interest expense was $13.8 million for the year ended December 31, 2008 versus $3.5 million for the same period in 2007. The increase was a result2010. Improved performance is attributable to an amalgamation of the increase in our overall debt level associated with the issuance of the convertible senior notes in the amount of $115 million used to finance the Teledrift acquisition, non-cash interest expense related to the application of ASC 470-20, “Debt with Conversion and Other Options,” and pay down amounts previously outstanding under our senior credit facility. Additionally, we amortized debt fees related to our financing agreements throughout 2008 that amounted to approximately $1.0 million.
An income tax benefit of $10.5 million was recorded for the year ended December 31, 2008. The effective tax rate for 2008 was 23.5% for the year ended December 31, 2008 versus 38.4% for 2007. The decrease in our effective tax rate is primarily due to impairment charges and a shift in income by jurisdiction. The impairment had a $19.3 million impact on our tax provision.
Results by Segment
| | | | | | | | | | | | |
Chemicals and Logistics (dollars in thousands) | | | |
| | | Years Ended December 31, | |
| | | 2009 | | | 2008 | | | 2007 | |
Revenue | | $ | 49,296 | | | $ | 109,356 | | | $ | 86,271 | |
| | | |
Gross margin | | $ | 21,667 | | | $ | 49,119 | | | $ | 40,474 | |
| | | |
Gross margin % | | | 44.0 | % | | | 44.9 | % | | | 46.9 | % |
| | | |
Income from operations | | $ | 12,964 | | | $ | 37,433 | | | $ | 32,389 | |
| | | |
Income from operations % | | | 26.3 | % | | | 34.2 | % | | | 37.5 | % |
| | | | | | | | | | | | | |
afore referenced.
|
| | | | | | | | | | | | |
| | | Year ended December 31, |
| Artificial Lift (dollars in thousands) | | 2012 | | 2011 | | 2010 |
| Revenue | | $ | 12,106 |
| | $ | 15,479 |
| | $ | 15,079 |
|
| Gross margin | | $ | 4,472 |
| | $ | 6,098 |
| | $ | 4,730 |
|
| Gross margin % | | 36.9 | % | | 39.4 | % | | 31.4 | % |
| Income from operations | | $ | 3,395 |
| | $ | 4,296 |
| | $ | 3,070 |
|
| Income from operations % | | 28.0 | % | | 27.8 | % | | 20.4 | % |
Results for 20092012 compared to 2008—Chemicals and LogisticsChemicals and Logistics revenue for the year ended December 31, 2009 was $49.3 million, a decrease of $60.1 million, or 54.9%, compared to $109.4 million for the year ended December 31, 2008. The decrease in Chemicals and Logistics revenue was primarily due to a 46% reduction in volume as a result of lower crude and natural gas prices driving a steep drop in rig activity and well fracturing activities. In addition, pricing pressures drove customers to lower priced products resulting in a 24% decrease in average sales dollars per unit sold. Sales of our patented micro-emulsion chemicals declined 59% to $31.6 million. Demand for micro-emulsion chemicals is driven by various market forces including the fact that micro-emulsion chemicals have a higher per-unit cost.
Gross margin decreased $27.5 million due primarily to reductions in revenue and a slight reduction in gross margin as a percentage of revenue from 44.9% to 44.0%. Product margins as a percentage of product revenue remained flat. Field direct expenses as a percentage of segment revenue increased to 8.1% from 5.5% as revenue decreased at a higher rate than reductions made due to cost containment efforts. Chemical product costs can fluctuate significantly with the price of petroleum and we generally do not lead the market in pricing, therefore, product margins are subject to market and cost fluctuations. We cannot be assured of passing on timely price increases; however, we believe our margins will fluctuate consistent with other market participants.
Income from operations was $13.0 million for the year ended December 31, 2009, a decrease of approximately 65.4% compared to the same period in 2008. Income from operations as a percentage of revenue decreased to 26.3% for the year ended December 31, 2009. Field indirect costs decreased by $3.2 million or 26.8% due primarily to cost containment efforts; however, reductions did not keep pace with revenue decreases and field indirect costs increased as a percentage of revenue to 17.7% from 10.9%.
Results for 2008 compared to 2007—Chemicals and Logistics2011
Chemicals and Logistics revenue for the year ended December 31, 2008 was $109.4 million, an increase of 26.8%, compared to $86.3 million for the year ended December 31, 2007. The increase in—Artificial Lift
Artificial Lift revenue is primarily a result of a $21.0 million increase in sales of our patented micro-emulsion chemicals, an increase of $4.4 million due to the Sooner Energy Services, Inc. acquisition, and a $2.2 million increase in services revenue. The increases were offset by a $4.2 million decrease in sales of the remainder of our chemical business as those products became commoditized due to increased competition. We also instituted a price increase in the first quarter of 2008 that we maintained for most of the year. However, in the second half of the year our margins declined as a result of rising raw material costs. Sales of micro-emulsion chemicals grew 37.2%, to $77.4 million for the year ended December 31, 2008, from $56.4 million for the same period in 2007 as a result of increased fracturing activities and wider acceptance of our micro-emulsion products by independent pressure pumping companies as well as the majors.Income from operations was $37.4 million for the year ended December 31, 2008, approximately 16% higher than the same period in 2007. Income from operations as a percentage of revenue decreased to 34.2% for the year ended December 31, 2008. The rising cost of raw materials (petroleum-based feedstock) reduced our operating profit. We partially offset this cost increase through targeted price increases for certain products. We also made investments related to a new research and development facility and for our international initiative.
As a result of the declining market conditions experienced in the fourth quarter of 2008, we began to institute measures to size the organization to the current marketplace. We relocated one production chemical manufacturing facility. As a technology driven company, we remained active in our research and development efforts by maintaining these costs at current levels as a percentage of revenues. We anticipated increased price pressures from our customers within the marketplace and focused our attention on margin protection through management of both raw materials and fixed costs, in addition to technology innovations.
| | | | | | | | | | | | |
Drilling Products (dollars in thousands) | | | |
| | | Years Ended December 31, | |
| | | 2009 | | | 2008 | | | 2007 | |
Revenue | | $ | 50,774 | | | $ | 98,262 | | | $ | 56,836 | |
| | | |
Gross margin | | $ | 4,781 | | | $ | 36,897 | | | $ | 19,132 | |
| | | |
Gross margin % | | | 9.4 | % | | | 37.5 | % | | | 33.7 | % |
| | | |
Income (loss) from operations | | $ | (32,084 | ) | | $ | (43,840 | ) | | $ | 5,632 | |
| | | |
Income (loss) from operations % | | | (63.2 | %) | | | (44.6 | %) | | | 9.9 | % |
| | | | | | | | | | | | | |
Results for 2009 compared to 2008—Drilling Products
Drilling Products revenue for the year ended December 31, 2009 was $50.8 million, a decrease of $47.5 million, or 48.3%, compared to $98.3 million for the year ended December 31, 2008. The decrease in revenue as compared to 2008 was primarily due to decreased demand for our products and services commensurate with the reduction in rig count in North America. Reductions in volume were experienced in all product lines and nearly all products. In addition, an oversupply of tools available for rent or sale by the Company and in the market due to the economic slowdown created pricing pressures reducing revenue on a per rental basis.
Gross margin decreased $32.1 million due to reductions in revenue and margins. Product and rental gross margins as a percentage of related revenue decreased to 55.6% in 2009 from 66.0% in 2008, accounting for a $4.6 million relative decrease in gross margin, primarily due to market pricing pressures. Field direct costs decreased by $3.6 million or 16% due primarily to cost containment efforts; however, due to lower revenues, those costs increased as a percentage of segment revenue to 37% from 23%. In addition, inventory adjustments, which related primarily to increased inventory reserves, increased $1.9 million as compared to 2008.
Loss from operations was $32.1 million in 2009, a decrease of $11.8 million or 26.8% as compared to 2008. The smaller loss is primarily due to a decrease in impairment to $18.5 million in 2009 from $59.1 million in 2008, offset by the decrease in gross margin. For further discussion of goodwill impairment, see Note 7 in the Notes to Consolidated Financial Statements, included in “Item 8. Financial Statements and Supplementary Data.” Field indirect costs decreased by $3.2 million or 15.0% due primarily to cost containment efforts; however, due to the lower revenues, those costs increased as a percentage of segment revenue to 36.2% from 22.0%.
We anticipate modest rig count growth in 2010 continuing the trend of late 2009, and while market conditions should improve slightly as a result, we expect that pricing will remain competitive throughout 2010. We intend to continue the initiative of adding drilling jars and shock subs to our fleet and reducing our sub-rental usage. We
also intend to continue to pursue international market opportunities with the Teledrift line of MWD products during 2010. While our efforts to introduce the Telepulse MWD for horizontal drilling were slowed by market conditions in 2009, we anticipate moving forward in 2010 with this initiative.
Capital expenditures in the Drilling Products segment were $6.2 million in 2009 compared to $19.8 million in 2008. After building tool and rental inventory in 2008, capital expenditures were significantly curtailed in 2009 in response to decreased demand. Management has forecast Drilling Products capital expenditures of $3.5 million in 2010; however, this amount may fluctuate dependent upon market demand and our results of operations.
Results for 2008 compared to 2007—Drilling Products
Drilling Products revenue for the year ended December 31, 2008 was $98.3 million, an increase of 72.9%, compared to $56.8 million for the year ended December 31, 2007. The acquisition of Teledrift, Inc. contributed 63% of the growth in Drilling Products revenues in 2008. Organic growth related to tool rentals, services and inspection and the expansion of our mud motor fleet contributed the balance of the segments revenue increase. Tool rental and mud motor revenues increased $14.7 million due to further integration of the Flotek product family and higher market penetration. Our operational integration efforts related to Teledrift have provided the domestic and international oil and gas industry with inexpensive, measurement while drilling (MWD) tools designed and optimized for vertical and horizontal well drilling, increasing Teledrift’s post acquisition contribution to revenues beyond our initial estimates.
Loss from operations was $43.8 million in 2008. Excluding the segment impairment of $59.1 million relating to goodwill and other intangible assets of $55.6 million and $3.5 million, respectively, income from operations before impairment was $15.3 million for the year ended December 31, 2008, approximately 170% higher than in 2007. Income from operations before impairment in 2008 as a percentage of revenues was 15.6% compared to income from operations as a percentage of revenues in 2007 of 9.9% The increase in income from operations before impairment was primarily driven by the acquisition of Teledrift and our expansion into higher margin tools, motors and services. We made strategic investments in new North American sales facilities and opened two new repair facilities.
The Drilling Products segment requires higher levels of capital expenditures than our other segments. Capital expenditures in 2008 were approximately $19.8 million for the drilling segment compared to $8.5 million in 2007.
| | | | | | | | | | | | |
Artificial Lift (dollars in thousands) | | | | | | | | | |
| | | Years Ended December 31, | |
| | | 2009 | | | 2008 | | | 2007 | |
Revenue | | $ | 12,480 | | | $ | 18,445 | | | $ | 14,901 | |
| | | |
Gross margin | | $ | 2,936 | | | $ | 4,740 | | | $ | 3,841 | |
| | | |
Gross margin % | | | 23.5 | % | | | 25.7 | % | | | 25.8 | % |
| | | |
Income (loss) from operations | | $ | 1,161 | | | $ | (6,709 | ) | | $ | 1,381 | |
| | | |
Income (loss) from operations % | | | 9.3 | % | | | (36.4 | %) | | | 9.3 | % |
| | | | | | | | | | | | | |
Results for 2009 compared to 2008—Artificial Lift
Artificial Lift revenues for the year ended December 31, 2009 were $12.5 million, a decrease of $6.0 million, or 32.3%, compared to $18.4 million for the year ended December 31, 2008. The vast majority of Artificial Lift revenues are derived from coalbedcoal bed methane (CBM) drilling. CBM(“CBM”) drilling activity, and is highly correlated to the price of natural gas and as the price of natural gas decreased throughout most of 2009, drill activity slowed considerably, resulting in a reduction in the volume of units sold.
Gross margin decreased $1.8 million primarily due to reductions in revenue. Product margins increased slightly to 69% from 68% accounting for a $0.1 million relative increase in gross margin. Field direct costs decreased by $0.3 million or 24% due primarily to cost containment efforts.
Income (loss) from operations increased $7.9 million to $1.2 million in 2009 from a loss from operations of $6.7 million in 2008. The majority of the improvement in income (loss) from operations is due to a decrease in goodwill impairment to zero in 2009 from $8.6 million in 2008. In addition, field indirect costs decreased $1.1 million due primarily to cost containment efforts.
Results for 2008 compared to 2007—Artificial Lift
gas. Artificial Lift revenuesrevenue for the year ended
December 31, 2008 were $18.42012 was $12.1 million an increase, a decrease of 23.8%$3.4 million, or 21.8%, from the year ended December 31, 2011. The largest decline can be attributed to a 85% decrease year over year in new gas well installs and a 50% decrease year over year for workovers for pump products. There was also a 20% decrease in international valve sales. Customer activity and demand decreased as a result of the decline in natural gas prices during 2012 and the corresponding decline in natural gas-directed drilling activity. The annual monthly average natural gas prices decreased by $1.19/mmBtu or 30.2% to $2.75/mmBtu compared to $14.9 million$3.94/mmBtu in the comparable period of 2011. Total North America annual average monthly natural gas drilling rig count decreased by 372 rigs or 36.0%, totaling 662 rigs as compared to 1,034 rigs for the same period in 2011. Gross margin for the year ended December 31, 2007. The increase in2012 was $4.5 million, a decrease of $1.6 million, or 26.7%, from the year ended December 31, 2011. Gross margin as a percentage of revenue is primarily a result of very active coal bed methane drilling in Wyoming, an increase in rod pump sales and a price increase implemented in August in response to an increase in our raw material costs. We opened two new repair facilities in North America to take advantage of market opportunities. We designed these facilities to be scalable to local market conditions.Loss from operations was $6.7 million
36.9% for the year ended December 31, 2008, primarily as2012, down from 39.4% for the year ended December 31, 2011. The decline in gross margin and gross margin percentage was attributable to lower sales of pumps and pump products and downward pricing pressure for products used in gas-directed drilling activities. Operating income was $3.4 million for the year ended December 31, 2012, a resultdecrease of impairment charges of $8.6$0.9 million relating to goodwill ($5.9 million) and other intangible assets ($2.7 million), or 21.0%, from 2011. Income from operations before impairment in 2008Operating income as a percentage of revenuesrevenue was 10.0%28.0% for the year ended December 31, 2012 compared to 27.8% for the year ended December 31, 2011. The decline in operating income is primarily attributable to the decline in revenue and gross margin discussed above, partially offset by gains recognized in connection with the disposal of operational assets. The slight improvement in operating income margins during 2012 compared to 2011 is due to indirect cost controls put into place in response to the decline in revenue.
Results for 2011 compared to 2010—Artificial Lift
Artificial Lift revenue increased $0.4 million to $15.5 million in 2011 from operations$15.1 million in 2010 primarily due to $3.1 million of incremental year over year international revenue tempered with softened unit installation activity due to lower than expected 2011 natural gas prices, as compared to 2010.
Artificial Lift’s gross margin increased $1.4 million, or 28.9% to $6.1 million in 2011 from $4.7 million in 2010 due to greater than average margins realized on international product sales which were partially offset by increased replacement inventory costs and the inability to pass incremental price increases on to certain customers due to industry pricing constraints. Cost of revenues decreased $1.3 million or 13.6% as a percentage of revenues in 2007 of 9.3%. revenue primarily due to higher margins realized on international product sales.
Income from operations
before impairment in 2008 was $1.8improved $1.2 million or
approximately 33.5% higher than income from operations of $1.439.9% to $4.3 million in
2007. We made strategic investments2011 from $3.1 million in
this segment by adding two new pump repair facilities2010 due to international product sales activity coupled with tempered sales and unit installation activity due to depressed natural gas prices and increased
our field sales presence.Consistent with our strategy within our other two segments, we reduced our operating cost structure to align with market conditions while maintaining flexibility to capitalize on a return to a more normalized market. In the first quarterreplacement inventory costs.
Capital Resources and Liquidity
Ongoing capital requirements arise primarilyresult from the Company’s need to service our debt, to acquire and maintain equipment, toand fund our working capital requirements and to complete acquisitions. We haverequirements. During 2012, the Company funded our capital requirements primarily with operating cash flows, and in part by, the issuance and refinancing of debt borrowings,proceeds and by issuingconversion of shares of preferredexercisable and common stock.contingent warrants.
The Company's primary source of debt financing is its credit facility with PNC Bank. This credit facility contains provisions for revolving debt of up to $50 million, based on receivables borrowing base, and term loan of $25 million. As of December 31, 2012, and as of February 28, 2013, the Company had no outstanding borrowings under the revolving debt portion of the credit facility. As of December 31, 2012 the Company had $25 million of outstanding term borrowings under its credit facility, which borrowings were used to refinance the Company's convertible notes. At December 31,
2009, we have not identified any acquisition candidates, nor are we actively looking for acquisition candidates.The challenging economic conditions facing2012, the oil and gas industry, which began just before the end of 2008, have adversely affected our financial performance and liquidity in 2009. As discussed earlier, as oil and natural gas prices, the number of well completions and rig count declined during 2009, we experienced lower demand for our products and services across all of our segments.
At December 31, 2009, we were not in complianceCompany remained compliant with certain financial and other covenants in the existing credit agreement for our bank seniordebt covenant under its credit facility. The lenders had also limited our access under the revolving line of credit to the amount of borrowings outstanding at December 31, 2009. We were in discussions with the current senior credit facility lenders to obtain waiversSignificant terms of the covenant violations, and at the same time were discussing replacement financing and financing arrangements with other lenders. On March 31, 2010, we executed an Amended and Restated Credit Agreement with Whitebox Advisors, LLC for a $40 million term loan. This new senior credit facility replaced our existing senior credit facility. The new senior credit facility will increase our borrowing costs, but will reduce our scheduled principal amortization requirements during 2010. We
received net proceeds of $6.1 million from the new senior credit facility. The significant terms of our new seniorCompany’s credit facility are discussed under “Item 8. Financial Statements and Supplementary Data” inwithin Note 199 of the Notes to our consolidated financial statements.
Also, atthe Company’s Consolidated Financial Statements.
At December 31,
2009, we were not in compliance2012, the Company remained compliant with the continued listing standards of the
New York Stock Exchange (NYSE). The noncompliance arose because both our global market capitalization and our stockholders’ equity fell below $50 million. In March 2010, we submitted a plan of action to the NYSE which outlined our plan to achieve compliance with the continued listing standards during the 18-month cure period, which ends in June 2011. During implementation and execution of our plan, our common stock will continue to be listed on the NYSE, subject to compliance with other NYSE continued listing requirements. On March 29, 2010, the NYSE agreed to accept our plan of action.We had cashNYSE.
Cash and cash equivalents oftotaled approximately $6.5$2.7 million at December 31, 2009. In March 2010, we2012. During 2012, the Company generated $49.5 million of cash inflows from operations (net of $10.0 million expended in working capital), received netgross proceeds of $6.1$25.0 million from ourthe issuance of new debt, received proceeds of $0.4 million from the exercise of Exercisable and Contingent Warrants, and received $5.5 million in proceeds related to lost-in-hole and asset sales activity. Partially offsetting cash inflows , the Company paid down $101.3 million of principal on Convertible debt, $2.0 million of common stock repurchases associated with vesting of equity grants and corresponding tax payments settled in equity and $1.1 million in capital lease payments. The Company also used $20.7 million in cash for capital expenditures.
During February 2013 the Company repaid $5.2 million to settle in full all outstanding obligations of the 5.25% convertible senior credit facility. Our capital budget for 2010 reduces capital expenditures to $3.4 million until we achieve improved operating cash flows.We believe that we have sufficient cash reserves to meet our anticipated operatingunsecured notes. Additional details of the repayment are discussed under “Item 8. Financial Statements and capital expenditure requirements during 2010. However, we continue to seek additional debt and equity funding.
Supplementary Data, Note 18—Subsequent Events."
Plan of Operations for
2010Since the 2008 cyclical peak,2013
The sustained oil prices, liquid-rich natural gas prices, continued shift in oil and horizontal rig drilling activity have declined precipitously,and increased domestic and international market penetration initiatives during 2012 directly impactingimpacted the demand for ourFlotek’s products and services. We experienced operating losses during each ofAlbeit, the four quarters in 2009. Forecasting the depth and length of the decline in the current cycle is challenging due to the overlay of the worldwide financial crisis in combination with broad demand weakness in each of our business segments. During the fourth quarter of 2009, the2012 annual average U.S.North American drilling rig count increased 14.2%decreased by14 rigs, or 0.6%, comparedto 2,283 rigs from the 2011 annual average North American drilling rig count of 2,297, drilling activity combined with market share growth primarily contributed to the average in the third quarter. During this quarter, we experienced modestperiod over period revenue growth of 3.1%20.9% and an increase in ourincreased gross margin percentage of 1.0%,1.2% compared to the third quarter.Our plan2011.
The Company’s 2013 Plan of
operations for 2010Operations anticipates
a continuing, gradual improvement insustained industry economic conditions
during the year. We are executing a business plan for 2010 thatand includes the
following:following initiatives: Working to replace our existing senior credit facility. We were successful in closing on a new senior credit facility on March 31, 2010. This provided us with net proceeds of $6.1 million.• The new senior credit facility will increase our borrowing costs, but will reduce our scheduled principal amortization requirements during 2010.
Seeking additional equity funding. In August 2009, we raised $16 million through an offering of convertible preferred stock and stock warrants. The warrants, if all were exercised, would provide us with an additional $14 million of capital (after re-pricing of the outstanding stock warrants for their anti-dilution price protection upon execution of the new senior credit facility). We continue to discuss funding opportunities with our advisors. The likelihood of obtaining additional equity funding should increase if the economy continues to improve and if the oil and gas industry experiences growth.
Managing capital expenditures until cash flows improve. Our capital expenditure budget for 2010 is2013 totals approximately $3.4$19.3 million, a decrease of $1.4 million, or 6.7% decrease, from the $7.0$20.7 million we spent in 2009. We have identified an additional $4.1 million of capital items, primarily for downhole tools, that may be acquired as our cash flows improve.
2012.Integrating oversight and actions of the new senior management team we have assembled. We have created an “Office of the President,” which is striving to increase collaboration throughout our organization.
Investigating and determining whether expansion in• Expansion into identified/opportunistic foreign markets can providein order to realize strategic benefits for our existing business segments. We will seek outContinue to actively explore opportunities with existing and potential business partners that offer a broaderto broaden geographic reach, market penetration and/or use of new and unique ways to use our existing products and services.
Identifying• Strategic identification and sellingsale of non-core assets and underperforming product lines. We are undertaking a comprehensive review within eachContinue identification of our business segments to identify assets that may no longer meet ouraligned with strategic objectives.objectives and identify/quantify divestiture alternatives. In addition to providing liquidity, the sale of non-strategic assets should allow uswould continue to concentrate our efforts and resources on improvingimprovements and expanding the reachexpansion of ourmarketable products.
Continuing to monitor actions we took during 2009, which included closing certain operating locations and reducing personnel levels. Further adjustments may be required in 2010. An expanded emphasis• Emphasis on certaindevelopment of product lines that could improve our margins. We continuebe contributory to emphasize the reviewgross margin improvement.
Continue assessment of both outsourcing and insourcing opportunities to improve our operations. We are also identifying areas where reductions can be made in selling, general and administrative expenses. If economic conditions continue to improve, we may need to begin hiring additional personnel.support operational improvements.
Managing our assets and ongoing operations. Efforts begun in 2009 to actively manage our accounts receivable and inventories will be continued. We have been successful in increasing• Manage operating cash flow throughflows with receivables, payables and inventory management. We are poised to realize increasedIncreased cash flowsflow from inventory management will continue as demand for our products increases. OverallContinue management of working capital is being stressed. In addition, we have made a decisionand revisit pricing strategies/adjust prices to conserve capital spending,obtain the most favorable market positions that conditions and have identified certain capital expenditures that will be made only after we see improvement in ourenvironments allow.
• Manage asset utilization to enhance and increase operational and market sale synergies across all business and liquidity.product lines to remain responsive to market demand or products and services.
Enhancing the technology used in each
28
• Emphasize technological advancement and differentiation across all business segments. We believe thatMaintain current and ongoing R&D activities supporting Chemicals’ CnF® technology innovations are importantand chemical additive solutions and Drilling’s product design differentiation to our future. A longer-term goal isremain responsive and proactive to specifically identified opportunities and customer product and service within expanding our researchgeographic markets.
• Continue to simplify existing tax structure, while taking advantage of existing NOLs and development activities. It is likely, however, that cash flow constraints will limit expansion of researchautomating intercompany and development activities during 2010.consolidation processes.
Cash flow metrics from
ourthe consolidated statements of cash flows are as follows (in thousands):
| | | | | | | | | | | | |
| | | Year Ended December 31, | |
| | | 2009 | | | 2008 | | | 2007 | |
Net cash provided by operating activities | | $ | 2,186 | | | $ | 24,874 | | | $ | 22,613 | |
Net cash used in investing activities | | | (3,699 | ) | | | (117,178 | ) | | | (70,532 | ) |
Net cash provided by financing activities | | | 7,812 | | | | 91,215 | | | | 48,685 | |
Effect of exchange rate changes | | | (7 | ) | | | — | | | | 6 | |
| | | | | | | | | | | | |
Net increase (decrease) in cash and cash equivalents | | $ | 6,292 | | | $ | (1,089 | ) | | $ | 772 | |
| | | | | | | | | | | | |
|
| | | | | | | | | | | | |
| | Year ended December 31, |
| | 2012 | | 2011 | | 2010 |
| Net cash provided by operating activities | | $ | 49,515 |
| | $ | 32,423 |
| | $ | 12,099 |
|
| Net cash used in investing activities | | (15,200 | ) | | (4,942 | ) | | (600 | ) |
| Net cash (used in) provided by financing activities | | (78,301 | ) | | (521 | ) | | 1,900 |
|
| Effect of changes in exchange rates on cash and cash equivalents | | 4 |
| | (141 | ) | | (21 | ) |
| Net (decrease) increase in cash and cash equivalents | | $ | (43,982 | ) | | $ | 26,819 |
| | $ | 13,378 |
|
During 2009, 20082012, 2011 and 2007, we generated2010, cash from operating activities totaling $2.2totaled $49.5 million $24.9, $32.4 million and $22.6$12.1 million, respectively. TheConsolidated net lossearnings for 2009 was $50.72012 totaled $49.8 million, compared to consolidated net income of $31.4 million for 2011 and a consolidated net loss of $34.2$43.5 million for 2008 and net income of $16.72010.
Noncash items recognized in 2012 totaled $9.7 million for 2007.Noncash additions to net income in 2009 were $49.8 million,
, consisting primarily of an impairment charge for our intangible assets ($18.5 million)depreciation and amortization expense ($11.6 million), amortization of deferred financing costs and accretion of debt discount ($4.7 million), share-based compensation expense ($13.4 million) and non-cash losses on the early extinguishment of debt ($4.8 million), partially offset by deferred income taxes ($18.7 million) net gains on asset disposals ($4.8 million) and changes in the fair value of the warrant liability ($2.6 million). Noncash items recognized in 2011 totaled $17.5 million, which consisted of asset depreciation and amortization ($14.210.1 million), amortization of deferred financing costs and accretion of debt discount ($6.38.4 million), stock compensation expense ($1.77.4 million), loss on the extinguishment of debt ($3.2 million) and deferred income tax provision ($10.51.2 million), offset by a reduction in the fair market value of the warrant liability ($9.6 million), net gain on the sale of assets of ($1.43.4 million) and an increase in the tax benefit related to share-based awards ($0.6 million).
Noncash
additions to net incomeitems in
2008 were $62.42010 totaled $55.9 million,
consisting primarilyconsisted of an
impairment charge for our goodwillincrease in the fair market value of warrant liability ($
67.721.5 million),
asset depreciation and amortization ($
12.813.8 million), impairment of long-lived assets and other intangibles ($9.3 million), amortization of deferred financing costs and accretion of debt discount ($
4.68.9 million),
and stock compensation expense ($
2.54.7 million),
reduction in the tax benefit of share-based awards ($1.7 million) and a loss on the extinguishment of debt ($1.0 million) offset by a
net gain on the sale of assets
($2.9 million)of $1.3 million and a deferred income tax benefit ($
20.93.6 million).
We experienced a noncash impairment charge of $67.7 million in 2008 and an increase in noncash depreciation and amortization of $6.3 million, offset by an increase in our deferred income tax benefit of $19.8 million.
During 2009, changes in working capital provided $3.1 million in cash. As our business declined during 2009, we collected accounts receivable and paid accounts payable and accrued liabilities that existed at December 31, 2008. We decreased our inventories by $10.8 million or 28.4%. During 2008,2012 changes in working capital used $3.4$10.0 million in cash, principally to financecash. Changes in working capital during 2012 reflected our increaseincreased activity levels, with the use being driven primarily by increased inventories ($8.7 million), increased other current assets ($2.1 million) accrued expenses ($1.9 million) and accrued interest ($2.0 million), partially offset by decreased accounts receivable ($1.8 million) and increased accounts payable ($2.5 million), and a decrease in sales. income taxes payable ($0.4 million).
During 2007,2011 changes in working capital provided $2.0used $16.5 million of cash. The change in working capital was primarily due to working capital utilization to meet increased demands of the improved global economic environment. Use of working capital was evidenced by increased accounts receivable ($17.9 million), increased inventory ($10.0 million) and increased other current asset ($0.9 million) offset by reductions in working capital obligations within accounts payable ($5.0 million) and federal income tax payable ($7.6 million).
During 2010 changes in working capital used $0.4 million in cash.
The change in working capital is primarily due to working capital utilization to meet increased economic demands offset by efforts to match customer collection activity with vendor payments. Use of working capital is evidenced by increased accounts receivable and inventory balances ($12.7 million and $0.6 million, respectively) offset by reductions in working capital obligations in accounts payable ($5.5 million), accrued liabilities ($4.6 million) and income tax receivables ($3.6 million).
During 2009, 20082012, 2011 and 2007, our2010, capital expenditures were $6.6$20.7 million $23.7, $10.0 million and $15.7$6.1 million, respectively. Capital expenditures decreased during 2009 as our business declined,for 2012 increased over 2011 due to increased investment in equipment and as we closely monitored our available cash.facilities in order to meet increased customer demand, and investment in anew ERP system. Capital expenditures for 2011 increased from 2010 due to the investment in 2008capital infrastructure required to meet increased customer products and service demands, as well as increased drilling and market activity. Cash flows used in investing activities during 2012, 2011 and 2010 were made to expand our rental tool fleet (primarily mud motors, MWD tools, shock subsprimarily offset with proceeds from the sale of assets of $5.5 million, $5.3 million, and drilling jars)$5.5 million, construct a new, larger facility for our Teledrift operations (which we occupied in February 2009) and purchase additional plant and machinery, primarily machines to repair motors and for use in our research and development activities.During 2008, we used $98.0 million for our acquisition of Teledrift, and during 2007, we used $53.0 million for our acquisitions of Triumph Drilling, CAVO Drilling Motors and Sooner Energy Services. There were no acquisitions in 2009, and currently, we are not looking for acquisition candidates.
respectively.
During 2009, 20082012 and 2007, our2011, financing activities used net cash of $78.3 million and $0.5 million, respectively. During 2010, financing activities provided net cash of $7.8$1.9 million $91.2.
The primary uses of cash for financing activities during 2012 were the payments on capital lease obligations and the retirement of convertible notes ($102.4 million) and $48.7purchases of treasury stock for tax withholding purposes ($2.0 million respectively.We
). Cash outflows for financing activities were partially offset by proceeds from the issuance of our 2012 Term Loan ($25.0 million). During 2011, the Company repaid $32.6 million outstanding Term Loan principal and made $0.7 million of capital lease payments. Additional cash used during 2011 consisted of $1.0 million of commitment fees related to the Term Loan, $0.4 million of Revolving Credit Facility origination fees, and $0.8 million of common stock repurchases associated with vesting of equity grants and corresponding tax payments during 2009, 2008settled in equity. Offsetting cash used were $29.4 million of proceeds from the sale of 3.6 million shares of the Company’s common stock on May 11, 2011, $4.8 million in proceeds from warrant exercises, $0.6 million of increased excess tax benefits related to stock-based compensation and 2007 on our bank$0.1 million of proceeds from the exercise of stock options.
During 2010, the Company entered into a new term loan
facility totaling $12.8 million, $4.1 million($40.0 million) and
$1.2 million, respectively, and net repayments (advances) under our bank revolving line of credit facility totaling ($7.6 million), $27.6 million and $12.5 million, respectively.In August 2009, we sold convertible preferred stock and stock warrants which generated proceeds of $14.8 million, net of transaction costs of $1.2 million. We used the net proceeds to reduce borrowings under our senior bank credit facility, thereby providing additional availability of credit, and for general corporate purposes.
The 16,000 shares of preferred stock have a total liquidation preference of $16 million. Dividends on the convertible preferred stock accrue at the rate of 15% of the liquidation preference per year and accumulate if not paid quarterly. Each share of convertible preferred stock has a liquidation preference of $1,000 and may, at the holder’s option, be converted into shares of our common stock (at a conversion price of approximately $2.30 per common share). We can automatically convert the preferred stock into shares of our common stock under certain conditions, and may redeem the preferred shares forreceived cash beginning in August 2012.
There are approximately 8.0 million warrants to purchase our common shares at $2.45 per share at December 31, 2009. They are currently exercisable and expire in August 2014. There are also approximately 2.5 million warrants to purchase our common shares at $2.31 per share at December 31, 2009. These warrants are currently exercisable and expire in November 2014. On March 31, 2010, as a result of anti-dilution provisions in the warrants, the exercise price of all 10.5 millioncontingent and exercisable stock warrants was decreased to $1.27 per share as a result($4.5 million). Repayments of common stock issued in connection with our new senior secured credit facility.
In February 2008, we issued $115 million of 5.25% convertible senior notes due 2028, at par, which generated proceeds of $111.8 million, net of transaction costs of $3.2 million. We used the net proceeds from issuanceindebtedness included settlement of the notes to finance the acquisition of Teledrift and for general corporate purposes.
The notes, which mature in February 2028, bear interest at 5.25% per annum. We may redeem all or a portion of the notes for cash beginning in February 2013. Holders of the notes may require us to purchase all or a portion of their notes for cash in February 2013, February 2018 and February 2023. Any redemption or repurchase of the notes will be for cash at a price equal to 100% of the principal amount of the notes.
The notes are convertible, at the holder’s option, into shares of our common stock (at a conversion price of approximately $22.75 per common share). Upon conversion, we may deliver, at our option, shares of common stock or a combination of cash and shares of common stock.
In March 2008, we entered into a newCompany’s existing senior credit agreementfacility with Wells Fargo Bank, N.A., as administrative agent for a syndicate of lenders. This credit agreement provides for a($32.0 million) and required principal payments under the Whitebox financing term loan facility andof ($6.4 million). The Company used proceeds received as payment for associated debt issuance costs ($2.0 million). The Company also recognized a revolving credit facility. Initial borrowing under this senior credit facility refinanced substantially all of our borrowing under a similar credit agreement with Wells Fargo. Outstanding balances under these loans were to mature and come due on March 31, 2011.
The term loan facility was limited to the initial advance, and amounts repaid may not be re-borrowed. At December 31, 2009, the outstanding term loan balance was $21.2 million. The amount of credit available under the revolving credit facility was equal to the lesser of a maximum set by the lender or the amount determined through a borrowing base calculation using eligible accounts receivable and eligible inventory. At December 31, 2009, the outstanding balance under the revolving credit facility was $10.0 million.
We were obligated to make quarterly principal payments of $2 million on the term loan facility. In addition, mandatory prepayments were required under certain circumstances.
Interest accrued on amounts outstanding under the senior credit facility at variable rates based on, at our election, the prime rate or LIBOR, plus an applicable margin. At December 31, 2009, we had elected to apply the prime rate, plus the applicable margin, to certain portions of the outstanding balance and to apply LIBOR, plus the applicable margin, to other portions of the outstanding balance. The weighted average interest rate on borrowings outstanding under the senior credit facility at December 31, 2009 and 2008 was 8.46% and 5.14%, respectively.
Borrowings under the senior credit facility were subject to certain covenants and a material adverse change subjective acceleration clause. The credit agreement contains certain financial and other covenants, including a minimum net worth covenant, a maximum leverage ratio covenant, a minimum fixed charge coverage ratio covenant, a maximum senior leverage ratio covenant, a covenant restricting capital expenditures, a covenant limiting the incurrence of additional indebtedness, and a covenant restricting acquisitions.
During 2009, we amended the credit agreement on four occasions, to provide, among other things, a decreasereduction in the aggregate revolving credit commitment, an increase in the interest rate margin applicable to borrowings, and changes in financial covenantsexcess tax benefits related to minimum net worth, the leverage ratio, the fixed charge coverage ratio, and maximum annual capital expenditures. At December 31, 2009, certain specific financial requirements and ratios were as follows:
| | |
Aggregate revolving credit limit
| | $15 million, but limited to $14.5 million (subject to change) |
| |
Interest rate margin
| | 6.5% (above the prime rate or LIBOR) |
| |
Minimum net worth, as defined
| | $42.8 million |
| |
Leverage ratio, beginning June 30, 2010
| | 4.75 to 1.0, declining quarterly to 3.75 to 1.0 at December 31, 2010 |
| |
Senior leverage ratio
| | Maximum of 2.0 to 1.0 |
| |
Maximum annual capital expenditures
| | $11 million for 2010 |
Our contractually required and actual covenant ratios as of December 31, 2009 were as follows:
| | | | |
Covenant
| | Required $/Ratio
| | Actual $/Ratio |
Minimum net worth
| | Minimum $42.8 million | | $14.3 million |
Leverage ratio(1)
| | Waived | | 122.64 to 1.00 |
Fixed charge coverage
| | Minimum 0.75 to 1.00 | | 0.02 to 1.00 |
Senior leverage
| | Maximum 2.00 to 1.00 | | 27.05 to 1.00 |
(1) | Maximum leverage ratio has been waived until June 30, 2010.
|
At December 31, 2009, we were not in compliance with the minimum net worth, fixed charge coverage ratio, and senior leverage ratio covenants of the credit agreement.
On March 31, 2010, we entered into an Amended and Restated Credit Agreement with new lenders. The Amended and Restated Credit Agreement provided us with new cash proceeds of $6.1 million. Scheduled cash principal paymentsshare-based awards ($1.7 million).
Off-Balance Sheet Arrangements
There have been reduced for 2010 and 2011. We have the option to pay a portion of the interest by adding it to the principal balance, and if certain conditions are met, to make certain payments by issuing our common stock. The Amended and Restated Credit Agreement does not contain a revolving line of credit facility or quarterly and annual covenants. Also on March 31, 2010, we entered into our Exchange Agreement in which we expect to exchange $40 million of our convertible senior notes for the aggregate consideration of $36 million in new convertible senior secured notes and $2 million in shares of our common stock.We are working to lower our working capital needs and have focused on cash collections of our accounts receivable balances and reduction of inventory. In the event that capital required is greater than the amount we have available at the time, we will reduce the expected level of capital expenditures, sell assets and/or seek additional capital. Cash generated by future asset sales may depend on the overall economic conditions of the industries served by these assets, the condition and location of the assets, and the number of interested buyers. Our ability to raise funds in the capital markets through the issuance of additional indebtedness is limited by covenants in our credit facilities.
Off-Balance Sheet Arrangements
As part of our ongoing business, we have not participated inno transactions that generate relationships with unconsolidated entities or financial partnerships, such as entities often referred to as structured finance“structured finance” or special“special purpose entitiesentities” (“SPEs”), which would have been established for the purpose of facilitating off-balance sheet arrangements or other contractually narrow or limited purposes. As of
December 31, 2009, we are2012, the Company was not involved in any unconsolidated SPEs.We have
The Company has not made
any guarantees to
any of our customers or
vendors. We do notvendors nor does the Company have any off-balance sheet arrangements or commitments,
other than operating leases which are discussed below, that have, or are reasonably likely to have, a current or future effect on
ourthe Company’s financial condition,
changeschange in financial condition,
revenues orrevenue, expenses, results of operations, liquidity, capital expenditures or capital resources that is material to investors.
Contractual Obligations
Our cash
Cash flows from operations are dependent on a
numbervariety of factors, including fluctuations in
our operating results, accounts receivable collections, inventory management, and the timing of payments for goods and services.
As a result,Correspondingly, the impact of contractual obligations on
ourthe Company’s liquidity and capital resources in future periods
should beis analyzed in conjunction with such factors.
Our material
Material contractual obligations
are composedconsist of repayment of amounts borrowed through
our convertible senior notes and long-termthe 2008 Notes, Senior Credit Facility debt,
obligations under capital and operating lease
obligations and construction commitments in our chemicals and logistics segment.obligations. Contractual obligations at December 31,
20092012 are as follows (in thousands):
| | | | | | | | | | | | | | | |
| | | Payments Due by Period |
| | | Total | | Less than
1 year | | 1-3 years | | 3-5 years | | More than
5 years |
Convertible senior notes | | $ | 115,000 | | $ | — | | $ | — | | $ | 115,000 | | $ | — |
Long-term debt | | | 31,880 | | | 8,717 | | | 23,163 | | | — | | | — |
Capital lease obligations | | | 658 | | | 232 | | | 359 | | | 67 | | | — |
Operating lease obligations | | | 6,450 | | | 1,763 | | | 2,711 | | | 546 | | | 1,430 |
| | | | | | | | | | | | | | | |
Total | | $ | 153,988 | | $ | 10,712 | | $ | 26,233 | | $ | 115,613 | | $ | 1,430 |
| | | | | | | | | | | | | | | |
|
| | | | | | | | | | | | | | | | | | | | |
| | | Payments Due by Period |
| | | Total | | 1 year | | 2 - 3 years | | 4 -5 years | | More than 5 years |
| Term loan (2012 Term Loan) | | 25,000 |
| | 3,274 |
| | 7,143 |
| | 14,583 |
| | — |
|
| Interest expense on term loan (1) | | 3,505 |
| | 942 |
| | 1,577 |
| | 986 |
| | — |
|
| Unsecured senior convertible notes | | 5,188 |
| | 5,188 |
| | — |
| | — |
| | — |
|
| Interest expense on convertible notes (2) | | 27 |
| | 27 |
| | — |
| | — |
| | — |
|
| Capital lease obligations | | 1,784 |
| | 1,055 |
| | 729 |
| | — |
| | — |
|
| Operating lease obligations | | 9,938 |
| | 1,596 |
| | 2,328 |
| | 1,867 |
| | 4,147 |
|
| Total | | $ | 45,442 |
| | $ | 12,082 |
| | $ | 11,777 |
| | $ | 17,436 |
| | $ | 4,147 |
|
| |
| (1) | For the purpose of this calculation amounts assume interest rates on variable rate obligations remain unchanged from December 31, 2012. |
| |
| (2) | Interest at 5.25%, payable semi-annually on February 15 and August 15, with principal repayment on February 15, 2013, the date of the holder’s first put option. |
Critical Accounting Policies and Estimates
Our
The Company’s consolidated financial statements have been prepared in accordance with accounting principles generally accepted in the United States of
America.America (“GAAP”). Preparation of these statements requires management to make judgments,
estimates and
estimates. Someassumptions that affect the amounts of assets and liabilities in the financial statements and revenue and expenses during the reported periods. Significant accounting policies
have a significant impact on amounts reported in these financial statements. A summary of significant accounting policies can be foundare described in Note 2
“Summary of Significant Accounting Policies” in the Notes to Consolidated Financial Statements.
We have also identified certainThe Company believes the following accounting policies
that we considerare critical
due to
understanding our businessthe significant, subjective and
our results of operations and we have provided below additional information on those policies. The accounting policies we believe to be the most critical to understanding our business and preparing our consolidated financial statements and that require management’s most difficult, subjective or complex judgments and estimates
are described below.Inventory Reserves
Inventories consist of raw materials, finished goodsrequired when preparing the consolidated financial statements. The Company regularly reviews the judgments, assumptions and work-in-process. Finished goods inventories include raw materials, direct labor and production overhead. Inventories are carried at the lower of cost or market using the weighted average cost method. Our inventory reserve represents the excess of the carrying value over the amount we expect to realize from the ultimate sale or other disposal of the inventory.
We regularly review inventory quantities on hand and record provisions for excess or obsolete inventory based primarily on our estimated forecast of product demand, historical usage of inventory on hand, market conditions, production or procurement requirements and technological developments. Significant or unanticipated changes in market conditions or our forecast could impact the amount and timing of provisions for excess or obsolete inventory.
We have not made any material changes in the accounting methodology we use to establish our slow-moving and obsolete reserves during the past three fiscal years. Specific assumptions discussed above are updated at the date of each test to consider current industry and Company-specific risk factors. The current business environment is subject to evolving market conditions and requires significant management judgment to interpret the potential impactestimates related to the Company’s assumptions. To the extent that changes in the current business environment result in adjusted management projections, impairment losses may occur in future periods. The potential change in the inventory reserve resulting from a hypothetical 10% adverse change in the annual demand forecast for products would have increased the reserve by $590,000 at December 31, 2009.
critical accounting policies.
Revenue for product sales and services
areis recognized when all of the following criteria have been met:
(i)(a) persuasive evidence of an arrangement exists,
(ii)(b) products are shipped or services rendered to the customer and all significant risks and rewards of ownership have passed to the customer,
(iii)(c) the price to the customer is
fixed and determinable, and (iv) collectibility(d) collectability is reasonably assured. OurThe Company’s products and services are sold withbased on a purchase order and/or contract and have fixed or determinable prices and do not includeprices. There is typically no right of return or other similar provisions or otherany significant post delivery obligations. AccountsProbability of collection is assessed on a customer-by-customer basis.
Revenue and associated accounts receivable
in the Chemicals, Drilling and Artificial Lift segments are recorded at
that time netthe agreed price when the aforementioned conditions are met. Generally a signed proof of
any discounts.obligation is obtained from the customer (delivery ticket or field bill for usage). Deposits and other funds received in advance of delivery are deferred until the transfer of ownership is complete.
Our logistics
The Logistics division
of chemicals recognizes revenue
of itsrelated to design and construction oversight contracts
underusing the percentage-of-completion method of accounting, measured by the percentage of costs incurred to date
proportionate to the total estimated costs of completion. This
calculated percentage is applied to the total estimated revenue at completion to calculate revenue earned to date. Contract costs include all direct labor and material costs,
and thoseas well as indirect costs related to manufacturing and construction operations. General and administrative costs are charged to expense as incurred. Changes in job performance
metrics and estimated profitability, including those arising from contract bonus
orand penalty provisions and final contract settlements, may
periodically result in revisions to
costsrevenue and
incomeexpenses and are recognized in the period in which such revisions
appearbecome probable.
All knownKnown or anticipated losses on contracts are recognized
in full when such amounts become
apparent. At December 31, 2009probable and
2008, claims and unapproved change orders were insignificant in value.estimable.
Within the Drilling Products segment, payments from customers for the cost of oilfield rental equipment that is damaged or lost-in-hole are reflectedis billed to customers at the contractually negotiated replacement value of the rental equipment. The billed amount is recognized as revenue withand the carrying value of the related equipment is charged to cost of sales. This
Revenue for equipment sold by the Artificial Lift segment is recorded net of any credit issued for return of an item for refurbishment under the equipment exchange program.
Sales tax collected from customers is not included in revenue but rather is accrued as a liability for future remittance to the respective taxing authorities.
Allowance for Doubtful Accounts
The Company performs ongoing credit evaluations of customers and grants credit based upon historical payment history, financial condition and industry expectations as available. Determination of the collectability of amounts due from customers requires the Company to use estimates and make judgments regarding future events and trends, including monitoring customers’ payment history and current credit worthiness in order to determine that collectability is reasonably assured. The Company also considers the overall business climate in which its customers operate.
These uncertainties require the Company to make frequent judgments and estimates regarding a customers’ ability to pay amounts due in order to assess and quantify an appropriate allowance for doubtful accounts. The primary factors used to quantify the allowance are customer delinquency, bankruptcy, and the Company’s estimate of its ability to collect outstanding receivables based on the number of days a receivable has been outstanding.
Substantially all of the Company’s customers operate in the energy industry. The cyclical nature of the industry may affect customers’ operating performance and cash flows, which could impact the Company’s ability to collect on these obligations. Additionally, some customers are located in international areas that are inherently subject to risks of economic, political and civil instability.
During 2011, the Company strengthened its process of assessment of customer credit worthiness. The Company continued to monitor the economic climate in which its customers operate and the aging of its accounts receivable. The allowance for doubtful accounts is based on the aging of accounts and an individual assessment of each invoice. At December 31, 2012, the allowance was 1.7% of accounts receivable, compared to an allowance of 1.3% a year earlier. While credit losses have historically been within expectations and the provisions established, should actual write-offs differ from estimates, revisions to the allowance would be required.
Inventory Reserves
Inventories consist of raw materials, work-in-process and finished goods and are stated at the lower of cost or market, using the weighted-average cost method. Finished goods inventories include raw materials, direct labor and production overhead. The Company’s inventory reserve represents the excess of the inventory carrying value over the amount totaled $2.9, $4.4expected to be realized from the ultimate sale or other disposal of the inventory.
The Company regularly reviews inventory quantities on hand and $2.1records provisions for excess or obsolete inventory based on the Company’s forecast of product demand, historical usage of inventory on hand, market conditions, production and procurement requirements and technological developments. Significant or unanticipated changes in market conditions or Company forecasts could affect the amount and timing of provisions for excess and obsolete inventory.
Significant changes have not been made in the methodology used to estimate the reserve for excess and obsolete inventory during the past three years. Specific assumptions are updated at the date of each evaluation to consider Company experience and current industry trends. Significant judgment is required to predict the potential impact which the current business climate and evolving market conditions could have on the Company’s assumptions. Changes which may occur in the energy industry are hard to predict and they may occur rapidly. To the extent that changes in market conditions result in adjustments to management assumptions, impairment losses could be realized in future periods.
During 2012, the Company enhanced the usage of its item age composition report to specifically identify slow moving and potentially obsolete items. The enhanced methodology follows the basic premises previously used and applies the analysis to specific inventory items. At December 31, 2012, the reserve for excess and obsolete inventory was $2.8 million or 5.7% of inventory. A year earlier the reserve was $2.7 million or 6.6% of inventory. Additionally, the provision for excess and obsolete inventory has decreased to $0.2 million and was $1.0 million for the years ended December 31, 2009, 2008,annual periods 2012 and 2007, respectively.Goodwill
We evaluate the carrying value2011. Inventory turns, however, have decreased to 4.4 times in 2012 compared to 2011 inventory turns of goodwill in4.7 times.
Goodwill
Goodwill is not subject to amortization, but is tested for impairment annually during the fourth quarter,
of each year and onor more frequently if an
interim basis if events occurevent occurs or circumstances change that would
more likely than not reduce the fair value of the reporting unit below its carrying amount. Suchindicate a potential impairment. These circumstances
couldmay include, but are not limited to, a significant adverse change in the business climate, unanticipated competition, or a change in
the assessment of futureprojected operations
or results of a reporting unit.
Due to continuing macro-economic conditions affecting the oil and gas industry and the financial performance of all of our Goodwill is tested for impairment at a reporting unit level. At December 31, 2012, only two reporting units, management testedChemicals and Logistics and Teledrift, have a goodwill balance.
During annual goodwill impairment testing in 2012 and 2011, the Company first assessed qualitative factors to determine whether it was necessary to perform the two-step goodwill impairment test that the Company has historically used. Based on its qualitative assessment, the Company concluded that there was no indication of the need for evidencean impairment of goodwill impairment as of the second and the third quarters of 2009. Based on these evaluations, we recorded a goodwill impairment charge of approximately $18.5 million related the Teledrift reporting unit in the second quarter of 2009. No additional impairment was recorded as a result of management’s 2009 annual test of goodwill. In the fourth quarter of 2008, as2012 or 2011, and therefore no further testing was required.
Impairment testing in 2010 consisted of a
resulttwo-step process. The first step is to compare the estimated fair value of
our annualeach reporting unit which has goodwill to its carrying amount, including goodwill. To determine fair value estimates, the Company uses the income approach based on discounted cash flow analyses, combined with a market-based approach. The market-based approach considers valuation comparisons of recent public sale transactions of similar businesses and earnings multiples of publicly traded businesses operating in industries consistent with the reporting unit. If the fair value of a reporting unit is less than its carrying value, the second step of the impairment test
weis performed to determine the amount of impairment, if any. The second step compares the implied fair value of the reporting unit goodwill with the carrying amount of the goodwill. If the carrying amount of the reporting unit’s goodwill exceeds its implied value, an impairment loss is recognized
$61.5 million of goodwill impairment.We determinein an amount equal to that excess.
The Company determines fair value using widely accepted valuation techniques, including discounted cash flows and market
multiplemultiples analyses, and through use of
an independent fixed asset valuation
firm,firms, as appropriate. These types of analyses contain uncertainties
becauseas they require management to make assumptions and to apply
judgment to estimatejudgments regarding industry economic factors and the profitability of future business strategies.
ItThe Company’s policy is
our policy to conduct impairment testing based on
our current business
strategy in light of presentstrategies, taking into consideration current industry and economic conditions, as well as
ourthe Company’s future expectations. Key assumptions used in the discounted cash flow valuation model include, among others, discount rates, growth rates, cash flow projections and terminal value rates. Discount rates and cash flow projections are the most sensitive and susceptible to change as they require significant management judgment. Discount rates are determined
by using a weighted average cost of capital (“WACC”). The WACC considers market and industry data, as well as Company-specific risk factors for each reporting unit in determining the appropriate discount rate to be used. The discount rate utilized for each reporting unit is indicative of the return an investor would expect to receive for investing in
such a
similar business.
Operational management, consideringManagement uses industry
considerations and Company-specific historical and projected
data, developsresults to develop cash flow projections for each reporting unit. Additionally, as part of the market
multiplemultiples approach,
we utilizethe Company utilizes market data from publicly traded entities whose businesses operate in industries
consistent with ourcomparable to the Company’s reporting units, adjusted for certain factors that increase comparability.
Specific assumptions discussed above are updated at
During the
date of each test to consider current industry and Company-specific risk factors from the perspective of a market participant. The current business environment is subject to evolving market conditions and requires significant management judgment to interpret the potential impact to the Company’s assumptions. To the extent that changes in the current business environment result in adjusted management projections, impairment losses may occur in future periods.Our 20092010 annual impairment assessment oftesting, the estimated fair value of our Chemicalthe Chemicals and Logistics reporting unit indicated that it exceeded its total asset bookcarrying value by more than $100approximately $81.3 million. The estimated fair value of ourthe Teledrift reporting unit was less than the total asset book value by approximately $10 million, triggering a Step 2 evaluation; however, based on the estimated fair value of the reporting unit’s assets, we determined that the implied goodwill exceeded its total carrying value by approximately $4$21.3 million. As a result, the second step of the evaluation process was not required. To evaluate the sensitivity of the fair value calculations of ourthe reporting units, wethe Company applied a hypothetical 10% unfavorable change in ourthe weighted average cost of capital, which would have reduced the estimated fair value of the ChemicalChemicals and Logistics and Teledrift reporting units by approximately $6$2.8 million and $2$2.2 million, respectively. We also evaluatedIn addition, the sensitivity of the fair value calculations by applyingCompany applied a hypothetical 10% reduction in ourto the Company’s market multiples, key financial measures and estimated future cash flows whichutilized in the Company’s impairment analyses. This would have reduced the estimated fair value of the ChemicalChemicals and Logistics and Teledrift reporting units by approximately $14$20.0 million and $4$11.0 million, respectively. NoneNeither of these sensitivity analyses would have resulted inindicated impairment.
The Company cannot predict the occurrence of
certain events or circumstances that could adversely affect the fair value of goodwill. Such events may include, but are not limited to, deterioration of the economic environment, particularly
as pertaining toin the oil and gas industry, increases in
ourthe Company’s weighted average cost of capital, material negative
changechanges in relationships with significant customers, reductions in valuations of other public companies in
ourthe Company’s industry, or strategic decisions made in response to economic and competitive conditions. If actual results are not consistent with
ourthe Company’s current estimates and assumptions, impairment of goodwill could be required.
Long-Lived Assets Other than Goodwill
Long-lived assets other than goodwill consist of property and equipment and
definite-lived intangible
assets. Property and equipment are stated at cost. We makeassets that have determinable lives. The Company makes judgments and estimates
in conjunction withregarding the carrying value of these assets, including amounts to be capitalized, depreciation and amortization methods
to be applied, estimated useful lives and
the valuation of acquired definite-lived intangiblesLong-livedpossible impairments. The Company has no intangible assets other than goodwillwith indefinite lives. Property and equipment and intangible assets with determinable lives are tested for impairment whenever events or changes in circumstances indicate that itsthe carrying amountvalue of the asset may not be recoverable.
For property and equipment, events or circumstances indicating possible impairment may include a significant decrease in market value or a significant change in the business climate. An impairment loss
shall beis recognized
only ifwhen the carrying amount of
a long-livedan asset
is not recoverable and exceeds its fair value. The carrying amount of a long-lived asset is not recoverable if it exceeds the
sum of theestimated undiscounted
future cash flows expected to result from the use
and eventual disposition of the
asset. That assessment is based on the carryingasset and its eventual disposition. The amount of the
asset atimpairment loss is the
date itexcess of the asset’s carrying value over its fair value. Fair value is
tested for recoverability. We complete our impairment evaluationgenerally determined using an appraisal by
performing internal valuation analyses, considering other publicly available market information and using an independent valuation firm
as appropriate.Due to continuing macro-economic conditions affectingor by using a discounted cash flow analysis.
For intangible assets with definite lives, events or circumstances indicating possible impairment may include an adverse change in the oil and gas industry andextent or manner in which the financial performanceasset is being used or a change in the assessment of all of our reporting units, management tested for evidence of long-lived asset impairment asfuture operations. The Company assesses the recoverability of the secondcarrying amount by preparing estimates of future revenue, margins and cash flows. If the third quarterssum of 2009. expected future cash flows (undiscounted and without interest charges) is less than the carrying amount, an impairment loss is recognized.
The
assessment for impairment
focused mainly onloss recognized is the
Teledrift and Chemical and Logistics reporting units. No impairment was recorded asamount by which the carrying amount exceeds the fair value. Fair value of these assets may be determined by a
resultvariety of
this assessment. Management again tested for long-lived asset impairment as of the fourth quarter of 2009 and no impairment was recorded.Due to the significantly changing business conditions late in the fourth quarter of 2008, we determined that a test of our long-lived assets for potential impairment was appropriate. An analysis was performed in conjunction with our annual goodwill impairment test and we recognized a $6.2 million impairment of definite-lived intangible assets, primarily customer lists and patents.
methodologies, including discounted cash flows.
The development of future net undiscounted cash flow projections requires management projections
related toof future sales and profitability trends and the
estimation of remaining useful
lifelives of
the assets. These projections are consistent with
those projections
we usethe Company uses to
internally manage
our operations internally.operations. When
potential impairment is
indicated,identified, a discounted cash flow
valuation model similar to that used to value goodwill at the reporting unit level, incorporating discount rates commensurate with risks associated with each asset, is used to determine the fair value of the asset in order to measure potential impairment. Discount rates are determined by using a weighted average cost of capital (“WACC”).WACC. Estimated revenue and WACC assumptions are the assumptions most sensitive and susceptible to change in ourthe long-lived asset analysis as they require significant management judgment. We believeThe Company believes the assumptions used are reflective of what a market participant would have used in calculating fair value.
Valuation methodologies utilized to evaluate long-lived assets other than goodwill for impairment were consistent with prior periods. Specific assumptions discussed above are updated at the date of each test date to consider current industry and Company-specific risk factors from the perspective of a market participant. The current business environmentclimate is subject to evolving market conditions and requires significant management judgment to interpret the potential impact to the Company’s assumptions. To the extent that changes in the current business environmentclimate result in adjustedadjustments to management projections, impairment losses may occurbe recognized in future periods. To evaluate
No impairment was recorded for property and equipment and intangible assets with determinable lives during 2012 and 2011. In 2010, the
sensitivity of the fair value calculations of our reporting units, we applied a hypothetical 10% increase in our weighted average cost of capital; this hypothetical change did not result in impairment to any long-lived asset at December 31, 2009. We also evaluated the sensitivity of the fair value calculations by applying a hypothetical 10% reduction in our estimated future cash flows; this hypothetical change would have triggeredCompany recognized an impairment
loss of
certain$0.4 million of other intangible assets,
totaling approximately $16 million at December 31, 2009.Allowance for Doubtful Accounts
The Company performs ongoing credit evaluations of customers and grants credit based upon past payment history, financial condition and anticipated industry conditions. The determination of the collectibility of amounts due from our customers requires us to use estimates and make judgments regarding future events and trends, and includes monitoring our customers’ payment history and current credit worthiness in order to determine that collectibility is reasonably assured, as well as consideringimpairment loss of $8.9 million related to certain rental fixed assets within the overall business climateDrilling segment due to shifts in which our customers operate. These uncertainties require us to make frequent judgments and estimates regarding our customers’ ability to pay amounts due us in order to determine the amount of the allowance for doubtful accounts. industry demand.
Warrant Liability
The
main factors utilized in determining the allowance are customer bankruptcies, delinquency, and management’s estimate of ability to collect outstanding receivables based on the number of days outstanding. Substantially all of our customers are engaged in the energy industry. The cyclical nature of our industry may affect our customers’ operating performance and cash flows, which could impact our ability to collect on these obligations. Additionally, some of our customers are located in certain international areas that are inherently subject to risks of economic, political and civil instabilities, which may impact our ability to collect these receivables.While credit losses have historically been within our expectations and the provisions established, we cannot give any assurances that we will continue to experience the same credit loss rates that we have in the past.
Warrant Liabilities
We evaluate financial instruments for freestanding and embedded derivatives. Warrant liabilities dowarrant liability does not have a readily determinable fair values, and therefore require significant management judgment and estimation. We usevalue. Each reporting period, the Company uses the Black-Scholes option-pricing model to estimate the fair value of its warrant liabilities at the end of each reporting period.liability. Changes in the fair value of the warrant liabilities during each reporting periodliability are includedrecognized in the statement of operations.
On June 14, 2012, provisions in the Company’s outstanding warrants were amended to eliminate anti-dilution price adjustment provisions as well as cash settlement provisions of a change of control event. Upon amendment the warrants met the requirements for classification as equity. All fluctuations in the fair value of the warrant liability prior to June 2012 were recognized as non-cash income or expense items within the Statement of Operations. Historical non-cash fair value accounting methodology for the warrant liability is no longer required due to the contractual amendment.
Fair Value Measurements
Fair value is defined as the amount that would be received for the sale of an asset or paid for the transfer of a liability in an orderly transaction between unrelated third party market participants at the measurement date. In determination of fair value measurements for assets and liabilities the Company considers the principal, or most advantageous market, and assumptions that market participants would use when pricing the asset or liability. The Company categorizes financial assets and liabilities using a three-tiered fair value hierarchy, based upon the nature of the inputs used in the determination of fair value. Inputs refer broadly to the assumptions that market participants would use in pricing an asset or liability and may be observable or unobservable. Significant judgments and estimates are required, particularly when inputs are based on pricing for similar assets or liabilities, pricing in non-active markets or when unobservable inputs are required.
The Company’s tax provision is subject to judgments and estimates necessitated by the complexity of existing regulatory tax statutes and the effect of these upon the Company due to operations in multiple tax jurisdictions. Income tax expense is based on
ourtaxable income, statutory tax rates and tax planning opportunities available
to us in the various jurisdictions in which
we operate. We provide for income taxes based on the
tax laws and rates in effect in the countries in which operations are conducted and income is earned. OurCompany operates. The Company’s income tax expense
is expected towill fluctuate from year to year as
our operations are conducted in different taxing jurisdictions and the amount of
pre-taxpretax income fluctuates.
The determination and evaluation of our annual income tax provision involves the interpretation of tax laws in various jurisdictions in which we operate and requires significant judgment and the use of estimates and assumptions regarding significant future events such as the amount, timing and character of income, deductions and tax credits. Changes in tax laws, regulations and our level of operations orthe Company’s profitability in each jurisdictionwithin and across the jurisdictions may impact ourthe Company’s tax liability in any given year.liability. While ourthe annual tax provision is based on the best information available to usthe Company at the time a number of preparation, several years may elapse before the ultimate tax liabilities in certain tax jurisdictions are determined.
Current
The Company uses the liability method in accounting for income tax expense reflects an estimate of our income tax liability for the current year, withholding taxes, changes in tax rates and changes in prior year tax estimates as returns are filed.taxes. Deferred tax assets and liabilities are recognized for temporary differences between financial statement carrying amounts and the tax bases of assets and liabilities, and are measured using the tax rates expected to be in effect when the differences reverse. Deferred tax assets and liabilities are recognized related to the anticipated future tax effects of temporary differences between the financial statement basis and the tax basis of ourthe Company’s assets and liabilities using the enactedstatutory tax rates in effect at the applicable year end. Deferred tax assets are also recognized for operating loss and tax credit carry forwards. The effect on deferred tax assets and liabilities of a change in tax rates is recognized in the results of operations in the period that includes the enactment date. A valuation allowance foris used to reduce deferred tax assets when uncertainty exists regarding their realization.
A valuation allowance is recorded to reduce previously recorded tax assets when it isbecomes more-likely-than-not that the benefit from the deferred tax assetsuch assets will not be realized. We provideThe Company evaluates, at least annually, net operating loss carry forwards and other net deferred tax assets and considers all available evidence, both positive and negative, to determine whether, a valuation allowance is necessary relative to net operating loss carry forwards and other net deferred tax assets. In making this determination, the Company considers cumulative losses in recent years as significant negative evidence. The Company considers recent years to mean the current year plus the two preceding years. The Company considers the recent cumulative income or loss position of its filings groups as objectively verifiable evidence for the projection of future income, which consists primarily of determining the average of the pre-tax income of the current and prior two years after adjusting for certain items not indicative of future performance. Based on this analysis, the Company determines whether a valuation allowance is necessary.
The Company periodically identifies and evaluates uncertain tax positions. This process considers the amounts and probability of various outcomes that could be realized upon final settlement. Liabilities for uncertain tax positions
pursuant to ASC Topic 740, “Income Taxes”Ourare based on a two-step process. The actual benefits ultimately realized may differ from the Company’s estimates. Changes in facts, circumstances, and new information may require a change in recognition and measurement estimates for certain individual tax positions. Any changes in estimates are recorded in results of operations in the period in which the change occurs. At December 31, 2012, the Company performed an evaluation of its various tax positions and concluded that it did not have significant uncertain tax positions requiring disclosure. The Company's policy is that we recognizeto record interest and penalties accrued on any unrecognized tax benefits as a component ofrelated to income tax matters as income tax expense.
Share-Based Compensation
We have a
The Company has stock-based incentive
planplans which
includesare authorized to issue stock options, restricted stock and other incentive awards.
See Note 13, Capital Stock, to the consolidated financial statements included in “Item 8. Financial Statements and Supplementary Data” for a complete discussion of our stock-based compensation program.Our stock-basedStock-based compensation expense for stock options is determined based upon estimated at the grant date based on the award’sgrant-date fair value. This fair value asis calculated byusing the Black-Scholes-Merton (BSM)Black-Scholes option-pricing model and is recognized as expense over the requisite service period. The BSMoption-pricing model requires various judgmentalthe input of highly subjective assumptions, including expected stock price volatility and expected option life. If any of the assumptions used in the BSM model change significantly, stock-based compensation expense may differ materially in the future from that recorded in the current period. In addition, we are required to estimate the Company estimates an expected forfeiture rate and recognizes expense only recognize expense for those shares expected to vest. We estimate theThe estimated forfeiture rate is based on historical experience. To the extent our actual forfeiture rate is differentrates differ from ourthe estimate, stock-based compensation expense is adjusted accordingly.
Loss Contingencies
The Company is subject to a variety of loss contingencies that could arise during the Company’s conduct of business. Management considers the likelihood of a loss or the impairment of an asset or the incurrence of a liability, as well as the Company’s ability to reasonably estimate the amount of loss in determining potential loss contingencies. An estimated loss contingency is accrued when it is probable that a liability has been incurred or an asset has been impaired and the amount of loss can be reasonably estimated. Accruals for loss contingencies have not been recorded during the past three years. The Company regularly evaluates current information available to determine whether such accruals should be made or adjusted.
Due to
higherincreased customer spending
near theat calendar year end,
of the year by customers theChemicals’ results of operations
of the Chemical and Logistics segment are
generally strongerhistorically highest in the fourth quarter of the
calendar year
than atand lowest during the
beginning of the year.first quarter. The results of operations of
ourthe Artificial Lift
segment areoperating results of operations generally
weaker intrend lowest during the second quarter
of the calendar year due to
federal land drilling restrictions
on drilling on federal lands due to the
migratory/breeding season of certain
protected bird species.
Recent Accounting Pronouncements
See “Item 8.
Recent accounting pronouncements which may impact the Company are described in Part II, Item 8—“Financial Statements and Supplementary Data,
” Note
2, 2—Summary of Significant Accounting
Policies, Recent Accounting Pronouncements”Policies; in the Notes to
the audited consolidated financial statements, which information is incorporated herein by reference.Consolidated Financial Statements.
Item 7A. | Quantitative and Qualitative Disclosures About Market Risk. |
We are
Item 7A. Quantitative and Qualitative Disclosures About Market Risk.
The Company is exposed to market risk from changes in interest rates, and, to a limited extent, commodity prices and foreign currency exchange rates. Market risk is measured as the potential negative impact on earnings, cash flows or fair values resulting from a hypothetical change in interest rates or foreign currency exchange rates over the next year.
We manage theThe Company manages exposure to market risks at the corporate level. The portfolio of interest-sensitive assets and liabilities is monitored and adjusted to provide liquidity necessary to satisfy anticipated short-term needs.
OurThe Company’s risk management policies allow the use of specified financial instruments for hedging purposes only; speculation on interest rates or foreign currency rates is not permitted.
We doThe Company does not consider any of these risk management activities to be material.
We areThe Company is exposed to the impact of interest rate changes on theany outstanding indebtedness under our seniorthe revolving credit facility agreement which has a variable interest rates. As required by the seniorrate. The revolving credit facility we have entered into an interest rate swap agreement on 50%advances varies based on the level of borrowing. Rates range (a) between PNC Bank's base lending rate plus 1.0% to 1.5% or (b) between the London Interbank Lending Rate (LIBOR) plus 2.0% to 2.5%. PNC Bank's base lending rate was 3.25% at December 31, 2012 and would have permitted borrowing at rates ranging between 4.25% and 4.75%. The Company is required to pay a monthly facility fee of 0.25% on any unused amount under the commitment based on daily averages. At December 31, 2012, no amounts had been borrowed under the revolving credit facility, nor had any letters of credit been issued under the sublimit.
The Company borrowed $25 million under the term loan on December 28, 2012. Monthly principal payments of $0.3 million are required beginning in February 2013. The unpaid balance of the term loan facility to partially reduce our exposure tois due on December 26, 2017. The interest rate risk. The impact on the averageterm loan varies based on the level of borrowing under the revolving credit facility. Rates range (a) between PNC Bank's base lending rate plus 1.5% to 2.0% or (b) between the London Interbank Lending Rate (LIBOR) plus 2.5% to 3.0%. At December 31, 2012, the interest rate on the term loan was 4.75%.
Warrant Liability
The Company is required to account for investor warrants as derivative liabilities at the end of each reporting period. On June 14, 2012, provisions in the Company’s outstanding warrants were amended to eliminate anti-dilution price adjustment provisions as well as cash settlement provisions of a change of control event. Upon amendment the warrants met the requirements for classification as equity. At the date of the amendments, the Company revalued the warrant’s liability and realized an income impact based upon the market value of the Company’s common stock price on the effective date of the amendment and the change in the fair value on the date of the amendment relative to last the valuation calculated. The revalued warrant liability, as of the date of the amendment, totaling $14.0 million was reclassified out of the Level 3 hierarchy to additional paid-in-capital. All fluctuations in the fair value of the warrant liability prior to June 2012 were recognized as non-cash income or expense items within the Statement of Operations. Historical non-cash fair value accounting methodology for the warrant liability is no longer required due to the contractual amendment.
Warrant liability is presented as a long-term liability on the balance sheet and totaled $16.6 million and $26.2 million as of our variable rate indebtedness during 2009 from a hypothetical 200 basis point increaseDecember 31, 2011 and 2010, respectively. No warrant liability existed as of December 31, 2012, as noted above. The periodic change in the value of the warrant liability is recorded as either non-cash income (when the value of the warrants decreases) or as non-cash expense (when the value of the warrants increases). Although the value of the warrants were affected by interest rates, netthe remaining contractual conversion period and stock volatility, the primary cause of interest rate swap positions, would bethe change in the warrants’ value was the price of the Company’s common stock. With an increase in interest expensecommon share price, the value of approximately $0.2the derivatives would generally increase, conversely, a decrease in the common share price would generally result in a decrease in the value of the derivatives, holding all other factors constant. The Company’s stock has historically been volatile; as a result, periodic non-cash gain or loss from change in fair value of derivative liabilities had been material.
The change in fair-value of derivatives is disclosed in the Consolidated Statements of Operations within the Other Income (expenses) and is discussed above and in Part II, Item 8—“Financial Statements and Supplementary Data,” Note 10—Fair Value Measurements and Note 13—Convertible Preferred Stock and Stock Warrants in the Notes to Consolidated Financial Statements. The non-cash gain from the change in the fair value of warrants was $2.6 million. or 5.3% and $9.6 million or 36.1% of net income for the years ended December 31, 2012 and 2011, respectively. A non-cash loss from the change in fair value of warrants totaled $21.5 million or 42.9% of net loss for the year ended December 31, 2010.
Item 8. | Financial Statements and Supplementary Data. |
Item 8. Financial Statements and Supplementary Data.
REPORT OF INDEPENDENT REGISTERED PUBLIC ACCOUNTING FIRM
To the Board of Directors and Stockholders
Flotek Industries, Inc.
We have audited Flotek Industries, Inc.’s (the “Company”) internal control over financial reporting as of December 31, 2012, based on criteria established in
Internal Control—Integrated Framework issued by the Committee of Sponsoring Organizations of the Treadway Commission. The Company’s management is responsible for maintaining effective internal control over financial reporting and for its assessment of the effectiveness of internal control over financial reporting included in the accompanying Management’s Report on Internal Control Over Financial Reporting. Our responsibility is to express an opinion on the Company’s internal control over financial reporting based on our audit. We conducted our audit in accordance with the standards of the Public Company Accounting Oversight Board (United States). Those standards require that we plan and perform the audit to obtain reasonable assurance about whether effective internal control over financial reporting was maintained in all material respects. Our audit included obtaining an understanding of internal control over financial reporting, assessing the risk that a material weakness exists, and testing and evaluating the design and operating effectiveness of internal control based on the assessed risk. Our audit also included performing such other procedures as we considered necessary in the circumstances. We believe that our audit provides a reasonable basis for our opinion.
A company’s internal control over financial reporting is a process designed to provide reasonable assurance regarding the reliability of financial reporting and the preparation of financial statements for external purposes in accordance with generally accepted accounting principles. A company’s internal control over financial reporting includes those policies and procedures that (a) pertain to the maintenance of records that, in reasonable detail, accurately and fairly reflect the transactions and dispositions of the assets of the company; (b) provide reasonable assurance that transactions are recorded as necessary to permit preparation of financial statements in accordance with generally accepted accounting principles, and that receipts and expenditures of the company are being made only in accordance with authorizations of management and directors of the company; and (c) provide reasonable assurance regarding prevention or timely detection of unauthorized acquisition, use, or disposition of the company’s assets that could have a material effect on the financial statements.
Because of its inherent limitations, internal control over financial reporting may not prevent or detect misstatements. Also, projections of any evaluation of effectiveness to future periods are subject to the risk that controls may become inadequate because of changes in conditions, or that the degree of compliance with the policies or procedures may deteriorate.
A material weakness is a deficiency or a combination of deficiencies in internal control over financial reporting, such that there is a reasonable possibility that a material misstatement of the Company's annual or interim financial statements will not be prevented or detected on a timely basis. The following material weaknesses have been identified and included in management's assessment. There were deficiencies regarding (a) segregation of duties relating to the new ERP system and development of system reports required to carry out the financial close process efficiently and effectively and (b) preparation of account reconciliations and analysis of variances from historical and expected results in connection with the monthly close process. These material weaknesses were considered in determining the nature, timing, and extent of audit tests applied in our audit of the 2012 financial statements, and this report does not affect our report dated March 13, 2013 on those financial statements.
In our opinion, because of the effect of the material weaknesses described above on the achievement of the objectives of the control criteria, Flotek Industries, Inc. has not maintained effective internal control over financial reporting as of December 31, 2012, based on criteria established in Internal Control—Integrated Framework issued by the Committee of Sponsoring Organizations of the Treadway Commission.
We have also audited, in accordance with the standards of the Public Company Accounting Oversight Board (United States), the consolidated balance sheets of Flotek Industries, Inc. and
Subsidiaries:subsidiaries as of December 31, 2012 and 2011, and the related consolidated statements of operations, comprehensive income, stockholders’ equity and cash flows for each of the three years in the period ended December 31, 2012, and our report dated March 13, 2013 expressed an unqualified opinion.
/s/ HEIN & ASSOCIATES LLP
Houston, Texas
March 13, 2013
REPORT OF INDEPENDENT REGISTERED PUBLIC ACCOUNTING FIRM
To the Board of Directors and Stockholders
Flotek Industries, Inc.
We have audited the accompanying
Consolidated Balance Sheetsconsolidated balance sheets of Flotek Industries, Inc. and
Subsidiariessubsidiaries (the “Company”) as of December 31,
20092012 and
2008,2011, and the related
Consolidated Statementsconsolidated statements of
Operations, Stockholders’ Equityoperations, comprehensive income, stockholders’ equity and
Cash Flowscash flows for each of the
three years in the
three-year period ended December 31,
2009.2012. These
consolidated financial statements are the responsibility of the Company’s management. Our responsibility is to express an opinion on these
consolidated financial statements based on our audits.
We conducted our audits in accordance with the standards of the Public Company Accounting Oversight Board (United States). Those standards require that we plan and perform the
auditsaudit to obtain reasonable assurance about whether the
consolidated financial statements are free of material misstatement.
The Company is not required to have, nor were we engaged to perform, an audit of its internal control over financial reporting. Our audit included consideration of internal control over financial reporting as a basis for designing audit procedures that are appropriate in the circumstances, but not for the purpose of expressing an opinion on the effectiveness of the Company’s internal control over financial reporting. Accordingly, we express no opinion. An audit includes examining, on a test basis, evidence supporting the amounts and disclosures in the financial statements. An audit also includes assessing the accounting principles used and significant estimates made by management, as well as evaluating the overall financial statement presentation. We believe that our audits provide a reasonable basis for our opinion.
In our opinion, the consolidated financial statements referred to above present fairly, in all material respects, the consolidated financial position of Flotek Industries, Inc. and Subsidiariessubsidiaries as of December 31, 20092012 and 2008,2011, and the consolidated results of their operations and their cash flows for each of the three years in the three-year period ended December 31, 2009,2012, in conformity with accounting principlesU.S. generally accepted accounting principles.
We also have audited, in accordance with the United Statesstandards of America.As discussed in Note 1 to the consolidatedPublic Company Accounting Oversight Board (United States), Flotek Industries, Inc. and subsidiaries’ internal control over financial statements, the Company has restated its previously issued consolidated financial statementsreporting as of and for the year ended December 31, 2009 to account for certain warrants pursuant to authoritative guidance2012, based on criteria established in FASB ASC 815-40-15-5 (formerly EITF 07-5), “Determining Whether
Internal Control—Integrated Framework issued by the Committee of Sponsoring Organizations of the Treadway Commission. Our report dated March 13, 2013 expressed an Instrument (Or Embedded Feature) is Indexed to an Entity’s Own Stock”.opinion that Flotek Industries, Inc. had not maintained effective internal control over financial reporting as of December 31, 2012, based on criteria established in
Internal Control-Integrated Framework issued by the Committee of Sponsoring Organizations of the Treadway Commission. /s/
UHYHEIN & ASSOCIATES LLP
March
31, 2010, except for changes as described in Notes 1, 11, and 14as to which the date is May 21, 2010
13, 2013
FLOTEK INDUSTRIES, INC.
AND SUBSIDIARIESCONSOLIDATED BALANCE SHEETS
| | | | | | | | |
| | | December 31, | |
| | | 2009 | | | 2008 | |
| | | (Restated) | | | | |
| | | (in thousands, except share data) | |
| ASSETS | | | | | | | | |
Current assets: | | | | | | | | |
Cash and cash equivalents | | $ | 6,485 | | | $ | 193 | |
Restricted cash | | | 10 | | | | 9 | |
Accounts receivable, net of allowance for doubtful accounts of $948 and $1,465 at December 31, 2009 and 2008, respectively | | | 14,612 | | | | 37,205 | |
Inventories | | | 27,232 | | | | 38,027 | |
Deferred tax assets, current | | | 762 | | | | 917 | |
Income tax receivable | | | 6,607 | | | | — | |
Other current assets | | | 871 | | | | 1,291 | |
| | | | | | | | |
Total current assets | | | 56,579 | | | | 77,642 | |
| | |
Property and equipment, net | | | 60,251 | | | | 66,835 | |
Goodwill | | | 26,943 | | | | 45,443 | |
Other intangible assets, net | | | 34,837 | | | | 38,015 | |
Deferred tax assets, less current portion | | | — | | | | 6,640 | |
| | | | | | | | |
Total assets | | $ | 178,610 | | | $ | 234,575 | |
| | | | | | | | |
| LIABILITIES AND STOCKHOLDERS’ EQUITY | | | | | | | | |
Current liabilities: | | | | | | | | |
Accounts payable | | $ | 8,021 | | | $ | 22,666 | |
Accrued liabilities | | | 4,941 | | | | 13,509 | |
Interest payable | | | 2,672 | | | | 2,402 | |
Income taxes payable | | | — | | | | 979 | |
Current portion of long-term debt | | | 8,949 | | | | 9,017 | |
| | | | | | | | |
Total current liabilities | | | 24,583 | | | | 48,573 | |
| | |
Convertible senior notes, net of discount | | | 95,601 | | | | 90,803 | |
Long-term debt, less current portion | | | 23,589 | | | | 29,478 | |
Warrant liability | | | 4,729 | | | | — | |
Deferred tax liabilities | | | 3,203 | | | | — | |
| | | | | | | | |
Total liabilities | | | 151,705 | | | | 168,854 | |
| | | | | | | | |
| | |
Commitments and contingencies | | | | | | | | |
Stockholders’ equity: | | | | | | | | |
Cumulative convertible preferred stock at accreted value, $0.0001 par value, 100,000 shares authorized, 16,000 issued and outstanding at December 31, 2009 | | | 6,943 | | | | — | |
Common stock, $0.0001 par value, 80,000,000 shares authorized; shares issued and outstanding: 24,168,292 and 23,362,907, respectively, at December 31, 2009; 23,174,286 and 22,782,091, respectively, at December 31, 2008 | | | 2 | | | | 2 | |
Additional paid-in capital | | | 83,555 | | | | 76,788 | |
Accumulated other comprehensive income | | | 118 | | | | 125 | |
Accumulated deficit | | | (63,168 | ) | | | (10,697 | ) |
Treasury stock at cost, 346,270 and 158,697 shares at December 31, 2009 and 2008, respectively | | | (545 | ) | | | (497 | ) |
| | | | | | | | |
Total stockholders’ equity | | | 26,905 | | | | 65,721 | |
| | | | | | | | |
Total liabilities and stockholders’ equity | | $ | 178,610 | | | $ | 234,575 | |
| | | | | | | | |
(in thousands, except share data)
|
| | | | | | | |
| | December 31, |
| | 2012 | | 2011 |
| ASSETS | | | |
| Current assets: | | | |
| Cash and cash equivalents | $ | 2,700 |
| | $ | 46,682 |
|
| Restricted cash | 150 |
| | 150 |
|
| Accounts receivable, net of allowance for doubtful accounts of $714 and $571 at December 31, 2012 and 2011, respectively | 42,259 |
| | 44,567 |
|
| Inventories, net | 45,177 |
| | 37,888 |
|
| Deferred tax assets, net | 1,274 |
| | 841 |
|
| Other current assets | 4,654 |
| | 1,933 |
|
| Total current assets | 96,214 |
| | 132,061 |
|
| Property and equipment, net | 56,499 |
| | 43,914 |
|
| Goodwill | 26,943 |
| | 26,943 |
|
| Deferred tax assets, net | 16,045 |
| | — |
|
| Other intangible assets, net | 24,166 |
| | 29,094 |
|
| TOTAL ASSETS | $ | 219,867 |
| | $ | 232,012 |
|
| LIABILITIES AND STOCKHOLDERS’ EQUITY | | | |
| Current liabilities: | | | |
| Accounts payable | $ | 22,373 |
| | $ | 18,562 |
|
| Accrued liabilities | 6,503 |
| | 8,397 |
|
| Income taxes payable | 3,479 |
| | 3,876 |
|
| Interest payable | 114 |
| | 2,097 |
|
| Convertible senior notes, net of discount | 5,133 |
| | — |
|
| Current portion of long-term debt | 4,329 |
| | 767 |
|
| Total current liabilities | 41,931 |
| | 33,699 |
|
| Convertible senior notes, net of discount | — |
| | 99,738 |
|
| Long-term debt, less current portion | 22,455 |
| | 875 |
|
| Warrant liability | — |
| | 16,622 |
|
| Deferred tax liabilities, net | 751 |
| | 2,780 |
|
| Total liabilities | 65,137 |
| | 153,714 |
|
| Commitments and contingencies |
| |
|
| Stockholders’ equity: | | | |
| Cumulative convertible preferred stock, $0.0001 par value, 100,000 shares authorized; no shares issued and outstanding | — |
| | — |
|
| Common stock, $0.0001 par value, 80,000,000 shares authorized; 53,123,978 shares issued and 49,601,495 shares outstanding at December 31, 2012; 51,957,652 shares issued and 49,153,495 shares outstanding at December 31, 2011 | 5 |
| | 5 |
|
| Additional paid-in capital | 195,485 |
| | 166,814 |
|
| Accumulated other comprehensive income (loss) | (40 | ) | | (44 | ) |
| Accumulated deficit | (37,019 | ) | | (86,810 | ) |
| Treasury stock, at cost; 2,198,193 and 1,358,299 shares at December 31, 2012 and 2011, respectively | (3,701 | ) | | (1,667 | ) |
| Total stockholders’ equity | 154,730 |
| | 78,298 |
|
| TOTAL LIABILITIES AND STOCKHOLDERS’ EQUITY | $ | 219,867 |
| | $ | 232,012 |
|
See accompanying
notesNotes to
consolidated financial statements.Consolidated Financial Statements.
FLOTEK INDUSTRIES, INC.
AND SUBSIDIARIESCONSOLIDATED STATEMENTS OF OPERATIONS
| | | | | | | | | | | | |
| | | Years Ended December 31, | |
| | | 2009 | | | 2008 | | | 2007 | |
| | | (Restated) | | | | | | | |
| | | (in thousands, except share and per share data) | |
Revenue | | $ | 112,550 | | | $ | 226,063 | | | $ | 158,008 | |
| | | |
Cost of revenue | | | 83,166 | | | | 135,307 | | | | 94,561 | |
| | | | | | | | | | | | |
Gross margin | | | 29,384 | | | | 90,756 | | | | 63,447 | |
| | | | | | | | | | | | |
Expenses: | | | | | | | | | | | | |
Selling, general and administrative | | | 36,943 | | | | 46,311 | | | | 30,639 | |
Depreciation and amortization | | | 4,926 | | | | 5,570 | | | | 2,273 | |
Research and development | | | 2,118 | | | | 1,931 | | | | 849 | |
Impairment of goodwill and intangible assets | | | 18,500 | | | | 67,695 | | | | — | |
| | | | | | | | | | | | |
Total expenses | | | 62,487 | | | | 121,507 | | | | 33,761 | |
| | | | | | | | | | | | |
Income (loss) from operations | | | (33,103 | ) | | | (30,751 | ) | | | 29,686 | |
| | | |
Other income (expense): | | | | | | | | | | | | |
Interest expense | | | (15,431 | ) | | | (13,813 | ) | | | (3,501 | ) |
Change in fair value of warrant liability | | | 465 | | | | — | | | | — | |
Other income (expense), net | | | (155 | ) | | | (96 | ) | | | 956 | |
| | | | | | | | | | | | |
Total other income (expense) | | | (15,121 | ) | | | (13,909 | ) | | | (2,545 | ) |
Income (loss) before income taxes | | | (48,224 | ) | | | (44,660 | ) | | | 27,141 | |
(Provision) benefit for income taxes | | | (2,016 | ) | | | 10,499 | | | | (10,414 | ) |
| | | | | | | | | | | | |
Net income (loss) | | | (50,240 | ) | | | (34,161 | ) | | | 16,727 | |
Accrued dividends and accretion of discount on preferred stock | | | (2,231 | ) | | | — | | | | — | |
| | | | | | | | | | | | |
Net income (loss) attributable to common stockholders | | $ | (52,471 | ) | | $ | (34,161 | ) | | $ | 16,727 | |
| | | | | | | | | | | | |
Basic and diluted earnings (loss) per common share: | | | | | | | | | | | | |
Basic earnings (loss) per common share | | $ | (2.68 | ) | | $ | (1.78 | ) | | $ | 0.91 | |
Diluted earnings (loss) per common share | | $ | (2.68 | ) | | $ | (1.78 | ) | | $ | 0.88 | |
| | | | | | | | | | | | |
Weighted average common shares used in computing basic earnings (loss) per common share | | | 19,595,000 | | | | 19,157,000 | | | | 18,338,000 | |
Weighted average common and common equivalent shares used in computing diluted earnings (loss) per common share | | | 19,595,000 | | | | 19,157,000 | | | | 18,958,000 | |
| | | | | | | | | | | | |
(in thousands, except per share data)
|
| | | | | | | | | | | |
| | Year ended December 31, |
| | 2012 | | 2011 | | 2010 |
| Revenue | $ | 312,828 |
| | $ | 258,785 |
| | $ | 146,982 |
|
| Cost of revenue | 181,209 |
| | 152,965 |
| | 94,012 |
|
| Gross margin | 131,619 |
| | 105,820 |
| | 52,970 |
|
| Expenses: | | | | | |
| Selling, general and administrative | 66,415 |
| | 50,612 |
| | 41,861 |
|
| Depreciation and amortization | 4,410 |
| | 3,983 |
| | 4,543 |
|
| Research and development | 3,182 |
| | 2,337 |
| | 1,441 |
|
| Impairment of long-lived assets | — |
| | — |
| | 8,898 |
|
| (Gain) loss on disposal of long-lived assets | (1,009 | ) | | — |
| | 2,104 |
|
| Impairment of other intangible assets | — |
| | — |
| | 390 |
|
| Total expenses | 72,998 |
| | 56,932 |
| | 59,237 |
|
| Income (loss) from operations | 58,621 |
| | 48,888 |
| | (6,267 | ) |
| Other income (expense): | | | | | |
| Loss on extinguishment of debt | (7,257 | ) | | (3,225 | ) | | (995 | ) |
| Change in fair value of warrant liability | 2,649 |
| | 9,571 |
| | (21,464 | ) |
| Interest expense | (8,103 | ) | | (15,960 | ) | | (19,399 | ) |
| Other financing costs | — |
| | — |
| | (816 | ) |
| Other expense, net | (452 | ) | | (4 | ) | | (69 | ) |
| Total other income (expense) | (13,163 | ) | | (9,618 | ) | | (42,743 | ) |
| Income (loss) before income taxes | 45,458 |
| | 39,270 |
| | (49,010 | ) |
| Income tax benefit (expense) | 4,333 |
| | (7,862 | ) | | 5,545 |
|
| Net income (loss) | 49,791 |
| | 31,408 |
| | (43,465 | ) |
| Accrued dividends and accretion of discount on preferred stock | — |
| | (4,868 | ) | | (6,543 | ) |
| Net income (loss) attributable to common stockholders | $ | 49,791 |
| | $ | 26,540 |
| | $ | (50,008 | ) |
| Earnings (loss) per common share: | | | | | |
| Basic earnings (loss) per common share | $ | 1.03 |
| | $ | 0.60 |
| | $ | (1.94 | ) |
| Diluted earnings (loss) per common share | $ | 0.97 |
| | $ | 0.56 |
| | $ | (1.94 | ) |
| Weighted average common shares: | | | | | |
| Weighted average common shares used in computing basic earnings (loss) per common share | 48,185 |
| | 44,229 |
| | 25,731 |
|
| Weighted average common shares used in computing diluted earnings (loss) per common share | 53,554 |
| | 47,638 |
| | 25,731 |
|
See accompanying
notesNotes to
consolidated financial statements.Consolidated Financial Statements.
FLOTEK INDUSTRIES, INC.
AND SUBSIDIARIESCONSOLIDATED STATEMENTS OF STOCKHOLDERS’COMPREHENSIVE INCOME
(in thousands)
|
| | | | | | | | | | | |
| | Year Ended December 31, |
| | 2012 | | 2011 | | 2010 |
| Net income (loss) | $ | 49,791 |
| | $ | 31,408 |
| | $ | (43,465 | ) |
| Other comprehensive income (loss): | | | | | |
| Foreign currency translation adjustment | 4 |
| | (141 | ) | | (21 | ) |
| Comprehensive income (loss) | $ | 49,795 |
| | $ | 31,267 |
| | $ | (43,486 | ) |
See accompanying Notes to Consolidated Financial Statements.
FLOTEK INDUSTRIES, INC.
CONSOLIDATED STATEMENTS OF STOCKHOLDERS' EQUITY
(in thousands) | | | | | | | | | | | | | | | | | | | | | | | | | | | | | | | | | |
| | | Common Stock | | Preferred Stock | | | Treasury Stock | | | Additional
Paid-in
Capital | | | Accumulated
Other
Comprehensive
Income (Loss) | | | Retained
Earnings
(Accumulated
Deficit) | | | Total | |
| | | Shares | | Value | | Shares | | Value | | | Shares | | Cost | | | | | |
Balance December 31, 2006 | | 17,694 | | $ | 1 | | — | | $ | — | | | — | | $ | — | | | $ | 46,661 | | | $ | 37 | | | $ | 6,810 | | | $ | 53,509 | |
Net income | | — | | | — | | — | | | — | | | — | | | — | | | | — | | | | — | | | | 16,727 | | | | 16,727 | |
Foreign currency translation adjustment | | — | | | — | | — | | | — | | | — | | | — | | | | — | | | | 8 | | | | — | | | | 8 | |
| | | | | | | | | | | | | | | | | | | | | | | | | | | | | | | | | |
Comprehensive income | | | | | | | | | | | | | | | | | | | | | | | | | | | | | | | | 16,735 | |
Common stock issued for acquisition | | 143 | | | — | | — | | | — | | | — | | | — | | | | 1,855 | | | | — | | | | — | | | | 1,855 | |
Treasury stock purchased | | — | | | — | | — | | | — | | | 70 | | | (190 | ) | | | — | | | | — | | | | — | | | | (190 | ) |
Restricted stock forfeited | | 2 | | | — | | — | | | — | | | 2 | | | — | | | | — | | | | — | | | | — | | | | — | |
Stock options and warrants exercised | | 627 | | | — | | — | | | — | | | — | | | — | | | | 1,502 | | | | — | | | | — | | | | 1,502 | |
Restricted stock granted | | 337 | | | — | | — | | | — | | | — | | | — | | | | — | | | | — | | | | — | | | | — | |
Tax benefit of share-based awards | | — | | | — | | — | | | — | | | — | | | — | | | | 2,473 | | | | — | | | | — | | | | 2,473 | |
Stock compensation expense | | — | | | — | | — | | | — | | | — | | | — | | | | 1,650 | | | | — | | | | — | | | | 1,650 | |
Adoption of FIN 48 | | — | | | — | | — | | | — | | | — | | | — | | | | — | | | | — | | | | (73 | ) | | | (73 | ) |
| | | | | | | | | | | | | | | | | | | | | | | | | | | | | | | | | |
Balance December 31, 2007 | | 18,803 | | | 1 | | — | | | — | | | 72 | | | (190 | ) | | | 54,141 | | | | 45 | | | | 23,464 | | | | 77,461 | |
Net loss | | — | | | — | | — | | | — | | | — | | | — | | | | — | | | | — | | | | (34,161 | ) | | | (34,161 | ) |
Foreign currency translation adjustment | | — | | | — | | — | | | — | | | — | | | — | | | | — | | | | 80 | | | | — | | | | 80 | |
| | | | | | | | | | | | | | | | | | | | | | | | | | | | | | | | | |
Comprehensive loss | | | | | | | | | | | | | | | | | | | | | | | | | | | | | | | | (34,081 | ) |
Common stock issued under share lending agreement | | 3,800 | | | 1 | | — | | | — | | | — | | | — | | | | — | | | | — | | | | — | | | | 1 | |
Treasury stock purchased | | — | | | — | | — | | | — | | | 17 | | | (307 | ) | | | — | | | | — | | | | — | | | | (307 | ) |
Restricted stock forfeited | | — | | | — | | — | | | — | | | 70 | | | — | | | | — | | | | — | | | | — | | | | — | |
Stock options exercised | | 519 | | | — | | — | | | — | | | — | | | — | | | | 905 | | | | — | | | | — | | | | 905 | |
Restricted stock granted | | 52 | | | — | | — | | | — | | | — | | | — | | | | — | | | | — | | | | — | | | | — | |
Tax benefit of share-based awards | | — | | | — | | — | | | — | | | — | | | — | | | | 2,020 | | | | — | | | | — | | | | 2,020 | |
Stock compensation expense | | — | | | — | | — | | | — | | | — | | | — | | | | 2,500 | | | | — | | | | — | | | | 2,500 | |
Convertible debt bifurcation related to change in accounting principle, net of tax | | — | | | — | | — | | | — | | | — | | | — | | | | 17,222 | | | | — | | | | — | | | | 17,222 | |
| | | | | | | | | | | | | | | | | | | | | | | | | | | | | | | | | |
Balance December 31, 2008 | | 23,174 | | | 2 | | — | | | — | | | 159 | | | (497 | ) | | | 76,788 | | | | 125 | | | | (10,697 | ) | | | 65,721 | |
Net loss | | — | | | — | | — | | | — | | | — | | | — | | | | — | | | | — | | | | (50,240 | ) | | | (50,240 | ) |
Foreign currency translation adjustment | | — | | | — | | — | | | — | | | — | | | — | | | | — | | | | (7 | ) | | | — | | | | (7 | ) |
| | | | | | | | | | | | | | | | | | | | | | | | | | | | | | | | | |
Comprehensive loss | | | | | | | | | | | | | | | | | | | | | | | | | | | | | | | | (50,247 | ) |
Sale of preferred stock, net of fair value of detachable warrants | | — | | | — | | 16 | | | 10,806 | | | — | | | — | | | | — | | | | — | | | | — | | | | 10,806 | |
Issuance costs of preferred stock and detachable warrants | | — | | | — | | — | | | — | | | — | | | — | | | | (1,199 | ) | | | — | | | | — | | | | (1,199 | ) |
Accretion of discount on preferred stock | | — | | | — | | — | | | 1,331 | | | — | | | — | | | | — | | | | — | | | | (1,331 | ) | | | — | |
Preferred stock dividends | | — | | | — | | — | | | — | | | — | | | — | | | | — | | | | — | | | | (900 | ) | | | (900 | ) |
Beneficial conversion discount on preferredstock | | — | | | — | | — | | | (5,194 | ) | | — | | | — | | | | 5,194 | | | | — | | | | — | | | | — | |
Restricted stock forfeited | | — | | | — | | — | | | — | | | 152 | | | — | | | | — | | | | — | | | | — | | | | — | |
Stock options exercised | | 100 | | | — | | — | | | — | | | — | | | — | | | | 30 | | | | — | | | | — | | | | 30 | |
Restricted shares issued and treasury stock purchased in payment of 2008 bonuses | | 471 | | | — | | — | | | — | | | 35 | | | (48 | ) | | | 481 | | | | — | | | | — | | | | 433 | |
Restricted stock granted | | 423 | | | — | | — | | | — | | | — | | | — | | | | — | | | | — | | | | — | | | | — | |
Reduction in tax benefit of share-based awards | | — | | | — | | — | | | — | | | — | | | — | | | | (195 | ) | | | — | | | | — | | | | (195 | ) |
Stock compensation expense | | — | | | — | | — | | | — | | | — | | | — | | | | 1,731 | | | | — | | | | — | | | | 1,731 | |
Tax benefit related to convertible debt bifurcation | | — | | | — | | — | | | — | | | — | | | — | | | | 725 | | | | — | | | | — | | | | 725 | |
| | | | | | | | | | | | | | | | | | | | | | | | | | | | | | | | | |
Balance December 31, 2009(Restated) | | 24,168 | | $ | 2 | | 16 | | $ | 6,943 | | | 346 | | $ | (545 | ) | | $ | 83,555 | | | $ | 118 | | | $ | (63,168 | ) | | $ | 26,905 | |
| | | | | | | | | | | | | | | | | | | | | | | | | | | | | | | | | |
|
| | | | | | | | | | | | | | | | | | | | | | | | | | | | | | | | | | | | |
| | Common Stock | | Preferred Stock | | Treasury Stock | | Additional Paid-in Capital | | Accumulated Other Comprehensive Income (Loss) | | Retained Earnings (Accumulated Deficit) | | Total |
| | Shares Issued | | Par Value | | Shares Issued | | Value | | Shares Issued | | Cost | |
| Balance, December 31, 2009 | 24,168 |
| | $ | 2 |
| | 16 |
| | $ | 6,943 |
| | 346 |
| | $ | (545 | ) | | $ | 84,020 |
| | $ | 118 |
| | $ | (63,342 | ) | | $ | 27,196 |
|
| Net loss | — |
| | — |
| | — |
| | — |
| | — |
| | — |
| | — |
| | — |
| | (43,465 | ) | | (43,465 | ) |
| Foreign currency translation adjustment | — |
| | — |
| | — |
| | — |
| | — |
| | — |
| | — |
| | (21 | ) | | — |
| | (21 | ) |
| Common stock issued in payment of debt issuance costs | 4,042 |
| | 1 |
| | — |
| | — |
| | — |
| | — |
| | 5,095 |
| | — |
| | — |
| | 5,096 |
|
| Common stock issued in exchange of convertible notes | 1,569 |
| | — |
| | — |
| | — |
| | — |
| | — |
| | 1,992 |
| | — |
| | — |
| | 1,992 |
|
| Accretion of discount on preferred stock | — |
| | — |
| | — |
| | 5,132 |
| | — |
| | — |
| | — |
| | — |
| | (5,132 | ) | | — |
|
| Preferred stock dividends, net of forfeitures | — |
| | — |
| | — |
| | — |
| | — |
| | — |
| | — |
| | — |
| | (1,411 | ) | | (1,411 | ) |
| Stock warrants exercised | 3,923 |
| | 1 |
| | — |
| | — |
| | — |
| | — |
| | 4,452 |
| | — |
| | — |
| | 4,453 |
|
| Stock options exercised | 140 |
| | — |
| | — |
| | — |
| | — |
| | — |
| | 114 |
| | — |
| | — |
| | 114 |
|
| Restricted stock granted | 827 |
| | — |
| | — |
| | — |
| | — |
| | — |
| | — |
| | — |
| | — |
| | — |
|
| Restricted stock forfeited | — |
| | — |
| | — |
| | — |
| | 23 |
| | — |
| | — |
| | — |
| | — |
| | — |
|
| Treasury stock purchased | — |
| | — |
| | — |
| | — |
| | 196 |
| | (347 | ) | | — |
| | — |
| | — |
| | (347 | ) |
| Reduction in tax benefit related to share-based awards | — |
| | — |
| | — |
| | — |
| | — |
| | — |
| | (1,744 | ) | | — |
| | — |
| | (1,744 | ) |
| Stock compensation expense | — |
| | — |
| | — |
| | — |
| | — |
| | — |
| | 4,684 |
| | — |
| | — |
| | 4,684 |
|
| Conversion of preferred stock into common stock | 2,085 |
| | — |
| | (5 | ) | | (4,795 | ) | | — |
| | — |
| | 4,795 |
| | — |
| | — |
| | — |
|
| Balance, December 31, 2010 | 36,754 |
| | $ | 4 |
| | 11 |
| | $ | 7,280 |
| | 565 |
| | $ | (892 | ) | | $ | 103,408 |
| | $ | 97 |
| | $ | (113,350 | ) | | $ | (3,453 | ) |
| Net income | — |
| | — |
| | — |
| | — |
| | — |
| | — |
| | — |
| | — |
| | 31,408 |
| | 31,408 |
|
| Foreign currency translation adjustment | — |
| | — |
| | — |
| | — |
| | — |
| | — |
| | — |
| | (141 | ) | | — |
| | (141 | ) |
| Sale of common stock, net of issuance cost | 3,665 |
| | — |
| | — |
| | — |
| | — |
| | — |
| | 29,438 |
| | — |
| | — |
| | 29,438 |
|
| Common stock issued in payment of term loan debt | 171 |
| | — |
| | — |
| | — |
| | — |
| | — |
| | 1,398 |
| | — |
| | — |
| | 1,398 |
|
| Common stock issued in payment of convertible notes | 559 |
| | — |
| | — |
| | — |
| | — |
| | — |
| | 5,165 |
| | — |
| | — |
| | 5,165 |
|
| Accretion of discount on preferred stock | — |
| | — |
| | — |
| | 3,925 |
| | — |
| | — |
| | — |
| | — |
| | (3,925 | ) | | — |
|
| Common stock issued in payment of preferred stock dividends | 624 |
| | — |
| | — |
| | — |
| | — |
| | — |
| | 3,254 |
| | — |
| | — |
| | 3,254 |
|
| Preferred stock dividends, net of forfeitures | — |
| | — |
| | — |
| | — |
| | — |
| | — |
| | — |
| | — |
| | (943 | ) | | (943 | ) |
| Stock warrants exercised | 3,961 |
| | — |
| | — |
| | — |
| | — |
| | — |
| | 4,793 |
| | — |
| | — |
| | 4,793 |
|
| Stock options exercised | 64 |
| | — |
| | — |
| | — |
| | — |
| | — |
| | 147 |
| | — |
| | — |
| | 147 |
|
| Restricted stock granted | 1,288 |
| | — |
| | — |
| | — |
| | — |
| | — |
| | — |
| | — |
| | — |
| | — |
|
| Restricted stock forfeited | — |
| | — |
| | — |
| | — |
| | 11 |
| | — |
| | — |
| | — |
| | — |
| | — |
|
| Treasury stock purchased | — |
| | — |
| | — |
| | — |
| | 81 |
| | (775 | ) | | — |
| | — |
| | — |
| | (775 | ) |
| Excess tax benefit related to share-based awards | — |
| | — |
| | — |
| | — |
| | — |
| | — |
| | 570 |
| | — |
| | — |
| | 570 |
|
| Stock compensation expense | — |
| | — |
| | — |
| | — |
| | — |
| | — |
| | 7,437 |
| | — |
| | — |
| | 7,437 |
|
| Conversion of preferred stock into common stock | 4,872 |
| | 1 |
| | (11 | ) | | (11,205 | ) | | — |
| | — |
| | 11,204 |
| | — |
| | — |
| | — |
|
| Return of borrowed shares under share lending agreement | — |
| | — |
| | — |
| | — |
| | 701 |
| | — |
| | — |
| | — |
| | — |
| | — |
|
| Balance, December 31, 2011 | 51,958 |
| | $ | 5 |
| | — |
| | $ | — |
| | 1,358 |
| | $ | (1,667 | ) | | $ | 166,814 |
| | $ | (44 | ) | | $ | (86,810 | ) | | $ | 78,298 |
|
| Net income | — |
| | — |
| | — |
| | — |
| | — |
| | — |
| | — |
| | — |
| | 49,791 |
| | 49,791 |
|
| Foreign currency translation adjustment | — |
| | — |
| | — |
| | — |
| | — |
| | — |
| | — |
| | 4 |
| | — |
| | 4 |
|
| Stock warrants exercised | 348 |
| | — |
| | — |
| | — |
| | — |
| | — |
| | 421 |
| | — |
| | — |
| | 421 |
|
| Fair value of warrant liability reclassified to additional paid-in capital | — |
| | — |
| | — |
| | — |
| | — |
| | — |
| | 13,973 |
| | — |
| | — |
| | 13,973 |
|
| Stock options exercised | 68 |
| | — |
| | — |
| | — |
| | — |
| | — |
| | 167 |
| | — |
| | — |
| | 167 |
|
| Treasury stock purchased | — |
| | — |
| | — |
| | — |
| | 166 |
| | (2,034 | ) | | — |
| | — |
| | — |
| | (2,034 | ) |
| Restricted stock granted | 750 |
| | — |
| | — |
| | — |
| | — |
| | — |
| | — |
| | — |
| | — |
| | — |
|
| Restricted stock forfeited | — |
| | — |
| | — |
| | — |
| | 30 |
| | — |
| | — |
| | — |
| | — |
| | — |
|
| Excess tax benefit related to share-based awards | — |
| | — |
| | — |
| | — |
| | — |
| | — |
| | 528 |
| | — |
| | — |
| | 528 |
|
| Employee stock purchase plan | — |
| | — |
| | — |
| | — |
| | (15 | ) | | — |
| | 161 |
| | — |
| | — |
| | 161 |
|
| Stock compensation expense | — |
| | — |
| | — |
| | — |
| | — |
| | — |
| | 13,421 |
| | — |
| | — |
| | 13,421 |
|
| Return of borrowed shares under share lending agreement | — |
| | — |
| | — |
| | — |
| | 659 |
| | — |
| | — |
| | — |
| | — |
| | — |
|
| Balance, December 31, 2012 | 53,124 |
| | $ | 5 |
| | — |
| | $ | — |
| | 2,198 |
| | $ | (3,701 | ) | | $ | 195,485 |
| | $ | (40 | ) | | $ | (37,019 | ) | | $ | 154,730 |
|
See accompanying
notesNotes to
consolidated financial statements.Consolidated Financial Statements.
FLOTEK INDUSTRIES, INC.
AND SUBSIDIARIESCONSOLIDATED STATEMENTS OF CASH FLOWS
| | | | | | | | | | | | |
| | | Years Ended December 31, | |
| | | 2009 | | | 2008 | | | 2007 | |
| | | (Restated) | | | | | | | |
| | | (in thousands) | |
Cash flows from operating activities: | | | | | | | | | | | | |
Net income (loss) | | $ | (50,240 | ) | | $ | (34,161 | ) | | $ | 16,727 | |
Adjustments to reconcile net income (loss) to net cash provided by operating activities: | | | | | | | | | | | | |
Depreciation and amortization | | | 14,186 | | | | 12,844 | | | | 6,537 | |
Amortization of deferred financing costs | | | 1,459 | | | | 1,030 | | | | — | |
Accretion of debt discount | | | 4,798 | | | | 3,580 | | | | — | |
Change in fair value of warrant liability | | | (465 | ) | | | — | | | | — | |
Equity income from affiliate | | | — | | | | — | | | | (509 | ) |
Gain on sale of assets | | | (1,365 | ) | | | (2,881 | ) | | | (204 | ) |
Impairment of goodwill and intangible assets | | | 18,500 | | | | 67,695 | | | | — | |
Stock compensation expense | | | 1,731 | | | | 2,500 | | | | 1,650 | |
Reduction in (excess) tax benefit of share-based awards | | | 195 | | | | (2,020 | ) | | | (2,473 | ) |
Deferred income tax provision (benefit) | | | 10,500 | | | | (20,881 | ) | | | (1,101 | ) |
Unrealized (gain) loss on interest rate swap | | | (199 | ) | | | 533 | | | | — | |
Change in current assets and liabilities: | | | | | | | | | | | | |
Restricted cash | | | (1 | ) | | | (1 | ) | | | (9 | ) |
Accounts receivable | | | 22,593 | | | | (8,543 | ) | | | (44 | ) |
Inventories | | | 10,795 | | | | (14,522 | ) | | | 671 | |
Other current assets | | | (6,158 | ) | | | (233 | ) | | | (49 | ) |
Accounts payable | | | (14,645 | ) | | | 12,415 | | | | (2,378 | ) |
Accrued liabilities | | | (9,768 | ) | | | 5,124 | | | | 3,834 | |
Interest payable | | | 270 | | | | 2,395 | | | | (39 | ) |
| | | | | | | | | | | | |
Net cash provided by operating activities | | | 2,186 | | | | 24,874 | | | | 22,613 | |
| | | | | | | | | | | | |
Cash flows from investing activities: | | | | | | | | | | | | |
Proceeds from sale of assets | | | 2,858 | | | | 4,554 | | | | 1,274 | |
Acquisitions, net of cash acquired | | | — | | | | (97,973 | ) | | | (53,028 | ) |
Purchase of patents | | | (2 | ) | | | (48 | ) | | | (2,521 | ) |
Other assets | | | — | | | | — | | | | (585 | ) |
Capital expenditures | | | (6,555 | ) | | | (23,711 | ) | | | (15,672 | ) |
| | | | | | | | | | | | |
Net cash used in investing activities | | | (3,699 | ) | | | (117,178 | ) | | | (70,532 | ) |
| | | | | | | | | | | | |
Cash flows from financing activities: | | | | | | | | | | | | |
Proceeds from exercise of stock options | | | 30 | | | | 905 | | | | 1,502 | |
Purchase of treasury stock | | | (48 | ) | | | (307 | ) | | | (190 | ) |
Proceeds from borrowings | | | 21,807 | | | | 6,729 | | | | 119,057 | |
Proceeds from convertible debt offering | | | — | | | | 115,000 | | | | — | |
Debt issuance costs | | | (819 | ) | | | (5,485 | ) | | | — | |
Excess (reduction in) tax benefit of share-based awards | | | (195 | ) | | | 2,020 | | | | 2,473 | |
Repayments of indebtedness | | | (27,764 | ) | | | (27,647 | ) | | | (74,157 | ) |
Proceeds from preferred stock offering | | | 16,000 | | | | — | | | | — | |
Issuance costs of preferred stock and detachable warrants | | | (1,199 | ) | | | — | | | | — | |
| | | | | | | | | | | | |
Net cash provided by financing activities | | | 7,812 | | | | 91,215 | | | | 48,685 | |
| | | | | | | | | | | | |
Effect of exchange rate changes on cash and cash equivalents | | | (7 | ) | | | — | | | | 6 | |
| | | | | | | | | | | | |
Net increase (decrease) in cash and cash equivalents | | | 6,292 | | | | (1,089 | ) | | | 772 | |
Cash and cash equivalents at the beginning of year | | | 193 | | | | 1,282 | | | | 510 | |
| | | | | | | | | | | | |
Cash and cash equivalents at the end of year | | $ | 6,485 | | | $ | 193 | | | $ | 1,282 | |
| | | | | | | | | | | | |
(in thousands)
|
| | | | | | | | | | | |
| | Year ended December 31, |
| | 2012 | | 2011 | | 2010 |
| Cash flows from operating activities: | | | | | |
| Net income (loss) | $ | 49,791 |
| | $ | 31,408 |
| | $ | (43,465 | ) |
| Adjustments to reconcile net income (loss) to net cash provided by operating activities: | | | | | |
| Change in fair value of warrant liability | (2,649 | ) | | (9,571 | ) | | 21,464 |
|
| Depreciation and amortization | 11,583 |
| | 10,105 |
| | 13,768 |
|
| Amortization of deferred financing costs | 946 |
| | 3,126 |
| | 3,914 |
|
| Accretion of debt discount | 3,710 |
| | 5,295 |
| | 4,946 |
|
| Provision for doubtful accounts | 512 |
| | 661 |
| | 94 |
|
| Provision for inventory reserves and market adjustments | 1,417 |
| | 1,011 |
| | 771 |
|
| Gain on sale of assets | (4,819 | ) | | (3,378 | ) | | (1,261 | ) |
| Impairment of goodwill, intangible assets or fixed assets | — |
| | — |
| | 9,288 |
|
| Stock compensation expense | 13,421 |
| | 7,437 |
| | 4,684 |
|
| Deferred income tax (benefit) provision | (18,746 | ) | | 1,218 |
| | (3,611 | ) |
| (Excess) reduction in tax benefit related to share-based awards | (528 | ) | | (570 | ) | | 1,744 |
|
| Non-cash loss on extinguishment of debt | 4,841 |
| | 3,225 |
| | 995 |
|
| Changes in current assets and liabilities: | | | | | |
| Restricted cash | — |
| | — |
| | (140 | ) |
| Accounts receivable | 1,796 |
| | (17,918 | ) | | (12,792 | ) |
| Inventories | (8,706 | ) | | (11,054 | ) | | (1,384 | ) |
| Other current assets | (2,073 | ) | | (892 | ) | | (170 | ) |
| Accounts payable | 2,527 |
| | 5,041 |
| | 5,499 |
|
| Accrued liabilities | (1,894 | ) | | (255 | ) | | 4,608 |
|
| Income taxes payable | 369 |
| | 7,563 |
| | 3,634 |
|
| Interest payable | (1,983 | ) | | (29 | ) | | (487 | ) |
| Net cash provided by operating activities | 49,515 |
| | 32,423 |
| | 12,099 |
|
| Cash flows from investing activities: | | | | | |
| Capital expenditures | (20,701 | ) | | (9,984 | ) | | (6,060 | ) |
| Proceeds from sale of assets | 5,521 |
| | 5,286 |
| | 5,460 |
|
| Purchase of patents and other intangible assets | (20 | ) | | (244 | ) | | — |
|
| Net cash used in investing activities | (15,200 | ) | | (4,942 | ) | | (600 | ) |
| Cash flows from financing activities: | | | | | |
| Repayments of indebtedness | (102,438 | ) | | (33,273 | ) | | (38,572 | ) |
| Excess (reduction in) tax benefit related to share-based awards | 528 |
| | 570 |
| | (1,744 | ) |
| Purchase of treasury stock | (2,034 | ) | | (775 | ) | | (236 | ) |
| Proceeds from sale of common stock | 161 |
| | 29,438 |
| | — |
|
| Proceeds from exercise of stock options | 167 |
| | 147 |
| | 3 |
|
| Proceeds from exercise of warrants | 421 |
| | 4,793 |
| | 4,453 |
|
| Debt issuance costs | (106 | ) | | (1,421 | ) | | (2,004 | ) |
| Proceeds from borrowings | 25,000 |
| | — |
| | 40,000 |
|
| Net cash (used in) provided by financing activities | (78,301 | ) | | (521 | ) | | 1,900 |
|
| Effect of changes in exchange rates on cash and cash equivalents | 4 |
| | (141 | ) | | (21 | ) |
| Net (decrease) increase in cash and cash equivalents | (43,982 | ) | | 26,819 |
| | 13,378 |
|
| Cash and cash equivalents at beginning of year | 46,682 |
| | 19,863 |
| | 6,485 |
|
| Cash and cash equivalents at end of year | $ | 2,700 |
| | $ | 46,682 |
| | $ | 19,863 |
|
See accompanying
notesNotes to
consolidated financial statements.Consolidated Financial Statements.
FLOTEK INDUSTRIES, INC.
AND SUBSIDIARIESNOTES TO
THE CONSOLIDATED FINANCIAL STATEMENTS
Note
1—1 — Organization and Nature of Operations
Flotek Industries, Inc. (“Flotek” or the “Company”) is a technology driven global technology-driven developer and supplier of drilling and production related products and services to the energyservices. Flotek’s strategic focus, and mining industries. The core focusthat of Flotek and its diversified wholly-owned subsidiaries (collectively referred to as the “Company”) is, includes oilfield specialty chemicals and logistics, downhole drilling tools and downhole production tools. Ittools used in the energy and mining industries. The Company’s strategic focus also manages automated bulkincludes material handling automation as well as loading facility logistics and blending facilities. The Company’sfunctionality for a variety of bulk materials. Flotek’s products and services helpenable customers to drill wells more efficiently increaseto realize increased production from existing wells and to decrease future and existing well operating costs. Major customers include leading oilfield service providers, major andas well as independent oil and gas exploration and production companies, and onshore and offshore drilling contractors.
The Company’s headquarters are locatedCompany is headquartered in Houston, Texas, and it has operationswith operating locations in Texas, Oklahoma, Colorado,Louisiana, New Mexico, Louisiana,North Dakota, Oklahoma, Pennsylvania, Texas, Utah, Wyoming and The Netherlands. ProductsFlotek’s products are marketed both domestically and internationallyinternationally; with international presence and/or initiatives in over 20 countries. Flotek was
originallyinitially incorporated under the laws of the Province of British Columbia on May 17, 1985. On October 23, 2001, Flotek changed its corporate domicile to the state of Delaware.
Restatement
The Company sold convertible preferred stock with detachable warrants to purchase shares of the Company’s common stock on August 12, 2009. At the date of the transaction, the Company allocated the gross proceeds to the preferred stock and the warrants based on their relative fair values. Approximately $5.2 million was allocated to the detachable warrants and was originally recorded as additional paid-in capital. Due to anti-dilution price adjustment provisions in the warrant agreements, the warrants are not considered indexed to the Company’s common stock, and therefore, the warrants cannot be classified in stockholders’ equity. Accordingly, the fair value of the warrants should have been recorded as a warrant liability when issued and adjusted to estimated fair value through the statement of operations at the end of each reporting period over the life of the warrants.
The Company has restated certain amounts included in these financial statements as follows (in thousands, except per share data):
| | | | | | | | | | | | |
| | | December 31, 2009 | |
| | | As
Reported | | | Adjustment | | | As
Restated | |
Balance Sheet Information | | | | | | | | | | | | |
Warrant liability | | $ | — | | | $ | 4,729 | | | $ | 4,729 | |
| | | |
Additional paid-in capital | | | 88,749 | | | | (5,194 | ) | | | 83,555 | |
Accumulated deficit | | | (63,633 | ) | | | 465 | | | | (63,168 | ) |
Total stockholders’ equity | | | 31,634 | | | | (4,729 | ) | | | 26,905 | |
| |
| | | Year Ended December 31, 2009 | |
| | | As
Reported | | | Adjustment | | | As
Restated | |
Statement of Operations Information | | | | | | | | | | | | |
Change in fair value of warrant liability | | $ | — | | | $ | 465 | | | $ | 465 | |
Net income (loss) | | | (50,705 | ) | | | 465 | | | | (50,240 | ) |
| | | |
Basic and diluted earnings (loss) per common share | | $ | (2.70 | ) | | $ | 0.02 | | | $ | (2.68 | ) |
Note 2—Summary of Significant Accounting Policies
Basis
Accounting Principles
The Company’s consolidated financial statements have been prepared in accordance with the accounting principles generally accepted in the United States of Presentation:America ("GAAP”).
Principles of Consolidation
The consolidated financial statements include the accounts of Flotek Industries, Inc. and
itsall wholly-owned subsidiary corporations. All significant intercompany accounts and transactions have been eliminated in consolidation. The Company does not have investments in any unconsolidated subsidiaries.
Cash and
Cash Equivalents:
Cash equivalents consist of highly liquid investments with
an original maturitymaturities of three months or
less.FLOTEK INDUSTRIES, INC. AND SUBSIDIARIES
NOTES TO CONSOLIDATED FINANCIAL STATEMENTS
less at the date of purchase.
Accounts Receivable and Allowance for Doubtful Accounts:Trade accountsAccounts
Accounts receivable
arise from product sales, product rentals and services and are
recordedstated at
the invoiced amounts and do not bear interest. The Company performs ongoing credit evaluations of customers and grants credit based upon past payment history, financial condition and anticipated industry conditions. The determination of the collectibility of amounts due from customers requires management to use estimates and make judgments regarding future events and trends, and includes monitoring customers’ payment history and current credit worthiness in order to determine that collectibility is reasonably assured, as well as considering the overall business climate in which they customers operate. These uncertainties requires the Company to make frequent judgments and estimates regarding a customer’s ability to pay amounts due us in order to determine the amount of theestimated net realizable value. This value incorporates an allowance for doubtful
accounts.accounts to reflect any loss anticipated on accounts receivable balances. The Company regularly evaluates its accounts receivable to estimate amounts that will not be collected and records the appropriate provision for doubtful accounts as a charge to operating expenses. The allowance for doubtful accounts is based on a combination of the age of the receivables, individual customer circumstances, credit conditions and historical write-offs and collections. The Company writes off specific accounts receivable when they are determined to be uncollectible.
Substantially all of the Company’s customers are engaged in the energy industry. The cyclical nature of the energy industry
maycan affect customers’ operating performance and cash flows, which
coulddirectly impact the Company’s ability to collect on
theseoutstanding obligations. Additionally,
somecertain customers are located in
certain international areas that are inherently subject to risks of economic, political and civil
instabilities,instability, which
maycan impact
collectibilitythe collectability of
these receivables.
Changes in the allowance for doubtful accounts are as follows (in thousands): | | | | | | | | | | | | | | | | |
| | | Beginning
Balance | | Additions | | Write-offs | | | Ending
Balance |
| | | | Charged to
Costs and
Expense | | Charged to
Other
Accounts (a) | | |
Years Ended December 31, | | | | | | | | | | | |
2007 | | $ | 562 | | $ | 460 | | $ | 478 | | $ | (146 | ) | | $ | 1,354 |
2008 | | | 1,354 | | | 195 | | | 20 | | | (104 | ) | | | 1,465 |
2009 | | | 1,465 | | | 45 | | | — | | | (562 | ) | | | 948 |
(a) | Amounts represent amounts obtained from acquisitions.
|
|
| | | | | | | | | | | |
| | Year ended December 31, |
| | 2012 | | 2011 | | 2010 |
| Balance, beginning of year | $ | 571 |
| | $ | 262 |
| | $ | 948 |
|
| Charged to provision for doubtful accounts | 512 |
| | 661 |
| | 94 |
|
| Write-offs | (369 | ) | | (352 | ) | | (780 | ) |
| Balance, end of year | $ | 714 |
| | $ | 571 |
| | $ | 262 |
|
FLOTEK INDUSTRIES, INC.
NOTES TO THE CONSOLIDATED FINANCIAL STATEMENTS
Inventories:
Inventories consist of raw materials, work-in-process and finished
goods.goods and are stated at the lower of cost, determined using the weighted-average cost method, or market. Finished goods inventories include raw materials, direct labor and production overhead. The Company
determines the value of acquired work-in-processregularly reviews inventories
by estimating the selling prices of finished goods or replacement cost less the sum of (a) cost to complete, (b) costs of disposal,on hand and
(c)records a
reasonable profit allowanceprovision for
the completing and selling effort of the Company based on profit for similar finished goods. Inventories are carried at the lower of cost or market using the weighted-average cost method. The Company maintains a reserve for slow-movingexcess and obsolete
inventories, which is reviewed for adequacyinventory based primarily on
a periodic basis.forecasts of product demand, historical trends, market conditions, production or procurement requirements and technological developments and advancements.
Property and Equipment:
Property and equipment are stated at cost. The cost of ordinary maintenance and repairsrepair is charged to operations,operating expense, while replacementsreplacement of critical components and major improvements are capitalized. Depreciation or amortization is provided onof property and equipment, including assets held under capital leases, is calculated using the straight-line method over the followingasset’s estimated useful lives:life: |
| |
Buildings and leasehold improvements | |
3-39improvements | 2-30 years |
Machinery, equipment and rental tools | |
| tools | 7-10 years |
| Furniture and fixtures | 3 years |
| Transportation equipment | 2-5 years |
| Computer equipment and software | 3-7 years |
Furniture and fixtures
| | 3-7 years |
Transportation equipment
| | 3-5 years |
Computer equipment
| | 3-5 years |
The Company reviews long-lived assets
Property and equipment are reviewed for impairment whenever events or changes in circumstances indicate
that the carrying
amountvalue of an asset
or asset group may not be recoverable.
Recoverability of assets to be heldIndicative events or circumstances include a significant decline in market value and
useda significant change in business climate. An impairment loss is
FLOTEK INDUSTRIES, INC. AND SUBSIDIARIES
NOTES TO CONSOLIDATED FINANCIAL STATEMENTS
measured by a comparison of recognized when the carrying amountvalue of an asset toexceeds the estimated undiscounted future net cash flows expected to be generated byfrom the asset. If such assets are considered to be impaired,use of the asset and its eventual disposition. The amount of impairment loss recognized is measured by the amount by which the carrying amountexcess of the assets exceeds either theasset’s carrying value over its fair value or the estimated discounted cash flows of the assets, whichever is more readily measurable.value. Assets to be disposed of are reported at the lower of the carrying amountvalue or the fair value less costscost to sell.
Upon sale or other disposition of an asset, the Company recognizes a gain or loss on disposal measured as the difference between the net carrying value of the asset and the net proceeds received.
Internal Use Computer Software Costs
Direct costs incurred to purchase and develop computer software for internal use are capitalized during the application development and implementation stages. These software costs have been for enterprise-level business and finance software that is customized to meet the Company’s specific operational needs. Capitalized costs are included in property and equipment and are amortized on a straight-line basis over the estimated useful life of the software beginning when the software project is substantially complete and placed in service. Costs incurred during the preliminary project stage and costs for training, data conversion and maintenance are expensed as incurred.
Goodwill:The Company amortizes software costs using the straight-line method over the expected life of the software, generally 3 to 7 years. The unamortized amount of capitalized software was $4.6 million at December 31, 2012.
Goodwill
Goodwill representsis the excess of the purchase price and related costscost of an acquired entity over the fair value of net tangible andamounts assigned to identifiable intangible assets acquired and liabilities assumed in a business combinations.combination. Goodwill is not subject to amortization, but is tested for impairment on an annual basis,annually during the fourth quarter, or more frequently if an event occurs or circumstances change that would indicate a potential impairment. These circumstances may include an adverse change in the business climate or a change in the assessment of future operations of a reporting unit.
The Company assesses whether a goodwill impairment exists using both qualitative and quantitative assessments. The qualitative assessment involves determining whether events or circumstances exist that indicate it is more likely than not that the fair value of a reporting unit is less than its carrying amount, including goodwill. If, based on this qualitative assessment, it is determined that it is not more likely than not that the fair value of a reporting unit is less than its carrying amount, the Company does not perform a quantitative assessment.
If the qualitative assessment indicates that it is more likely than not that the fair value of a reporting unit is less than its carrying amount or if the Company elects not to perform a qualitative assessment, a quantitative assessment or two-step impairment test is performed to determine whether a goodwill impairment exists at the reporting unit.
FLOTEK INDUSTRIES, INC.
NOTES TO THE CONSOLIDATED FINANCIAL STATEMENTS
Goodwill is tested for impairment at a reporting unit level.
This requiresImpairment testing for goodwill consists of a
comparison oftwo-step process. The first step is to compare the
estimated fair value of each reporting unit
that haswith goodwill
associated with its operations withto its carrying amount, including goodwill.
If this comparison reflects impairment, then the loss would be measured as the excess of recorded goodwill over its implied fair value. Implied fair value is the excess of the fair value of the reporting unit over the fair value of all recognized and unrecognized assets and liabilities. The Company performs the required annual goodwill impairment evaluation in the fourth quarter.The evaluation of goodwill for possible impairment includes estimating the fair value of each of the reporting units which have goodwill associated with their operations. To determine its fair value estimates, the Company uses the income approach based on discounted cash flow analyses, combined with market-related valuation models, including earnings multiples of publicly traded entity businesses that operate in industries consistent with the Company’s reporting units, anda market-based approach. The market-based approach considers valuation comparisons of recent public sale transactions of similar businesses. Althoughbusinesses and earnings multiples of publicly traded businesses operating in industries consistent with the Company believes that the estimates and assumptions used were reasonable, actual results could differ from those estimates and assumptions.reporting unit. If it is determined that the fair value of a reporting unit is less than its carrying amount, the second step of the impairment test is performed to determine the amount of impairment loss, if any. The second step compares the implied fair value of the reporting unit goodwill with the carrying amount of that goodwill. If the carrying amount of the reporting unit’s goodwill exceeds its implied fair value, an impairment loss is recognized in an amount equal to the extent that the fair value of the goodwill within the reporting unit is less than the carrying value of its goodwill.
The Company has four reporting units, of which only two, Chemicals and Logistics and Teledrift, have an unamortized goodwill balance at December 31, 2009.
excess.
Other Intangible Assets:Assets
The Company’s other intangible assets have determinable lives and primarily consist of customer relationships, but also include purchased patents and a purchased brand name and a purchased contract with favorable terms. The Company has no acquired intangible assets with indefinite lives.name. The cost of intangible assets with determinable lives is amortized on ausing the straight-line basismethod over the estimated period of economic benefit. No residual value is estimated for these intangible assets. Amortizablebenefit, ranging from 2 to 20 years. Asset lives are adjusted whenever there is a change in the estimated period of economic benefit. No residual value has been assigned to these intangible assets. The Company has no intangible assets with indefinite lives. Intangible assets with definite lives are tested for impairment whenever events or changes in circumstances indicate
that the carrying value may not be recoverable. These conditions may include
an economic downturn, an adversea change in the extent or manner in which the asset is being used
a decline in stock value for a sustained period of time, or a change in
the assessment of future operations.
An impairment loss is recognized if the carrying amount of the long-lived intangible asset is not recoverable and exceeds its fair value.When facts and circumstances indicate that the carrying value of an intangible asset may not be recoverable, theThe Company assesses the recoverability of the carrying valueamount by preparing estimates of future revenue, margins and cash flows. If the sum of expected future cash flows (undiscounted and without interest charges) is less than the carrying amount, an impairment loss is recognized. The impairment loss recognized is the amount by which the carrying amount exceeds the fair value.
FLOTEK INDUSTRIES, INC. AND SUBSIDIARIES
NOTES TO CONSOLIDATED FINANCIAL STATEMENTS
Fair value of these assets may be determined by a variety of methodologies, including discounted cash flow models.
Warrant Liabilities:Warrant liabilities doLiability
The warrant liability does not have
a readily determinable fair
values. Thevalue. Each reporting period, the Company uses the Black-Scholes option-pricing model to estimate the
fair value of its warrant liability. Changes in the fair value of the warrant
liabilities at the end of each reporting period. Changes in warrant liabilities during each reporting periodliability are
includedrecognized in the statement of operations.
On June 14, 2012, provisions in the Company’s outstanding warrants were amended to eliminate anti-dilution price adjustment provisions and remove cash settlement provisions in the event of a change of control. Upon amendment, the warrants met the requirements for classification as equity. All fluctuations in the fair value of the warrant liability prior to June 2012 were recognized as non-cash income or expense items within the statement of operations. The fair value accounting methodology for the warrant liability is no longer required.
Fair Value Measurements:Measurements
The Company
accounts for itscategorizes financial assets and liabilities
in accordance with ASC Topic 820, “Fair Value Measurements and Disclosures,” which definesusing a
three-tier fair value hierarchy,
that prioritizesbased on the nature of the inputs
inused to determine fair
value. Inputs refer broadly to assumptions market participants would use to value
measurementsan asset or liability and
requires certain related disclosures.may be observable or unobservable. The hierarchy
prioritizesgives the
highest priority to quoted prices in active markets for identical assets or liabilities (level 1) and the lowest priority to unobservable inputs
of fair value measurements into one of three levels.(level 3). “Level 1” measurements are measurements using quoted prices in active markets for identical assets
orand liabilities. “Level 2” measurements
use significant other observable inputs.are measurements using quoted prices in markets that are not active or that are based on quoted prices for similar assets or liabilities. “Level 3” measurements are measurements
usingthat use significant unobservable inputs which require a company to develop its own assumptions.
In recordingWhen determining the fair value of assets and liabilities,
companies must usethe Company uses the most reliable measurement available.
Revenue Recognition:Recognition
Revenue for product sales and services areis recognized when all of the following criteria have been met: (i) persuasive evidence of an arrangement exists, (ii) products are shipped or services rendered to the customer and all significant risks and rewards of ownership have passed to the customer, (iii) the price to the customer is fixed and determinable and (iv) collectibilitycollectability is reasonably assured. Products and services are sold with fixed or determinable prices and do not include right of return or other similar provisions or other significant post delivery obligations. Deposits and other funds received in advance of delivery are deferred until the transfer of ownership is complete. Shipping and handling costs are reflected in cost of revenue. Taxes collected are not included in revenue, andrather taxes are accrued for future remittance to governmental authorities.
FLOTEK INDUSTRIES, INC.
NOTES TO THE CONSOLIDATED FINANCIAL STATEMENTS
The Logistics groupdivision recognizes revenue from its design and construction oversight contracts under the percentage-of-completion method of accounting, measured by the percentage of costs“costs incurred to datedate” to the total“total estimated costs of completion.” This percentage is applied to the total“total estimated revenue at completioncompletion” to calculate proportionate revenue earned to date. Contract costs include allContracts for services are inclusive of direct labor and material costs, and thoseas well as, indirect costs related to manufacturing and constructionof operations. General and administrative costs are charged to expense as incurred. Changes in job performance metrics and estimated profitability, including those arising from contract bonus or penalty provisions and final contract settlements, may result in revisions to costs and income and are recognized in the period in which such revisions appear probable. All knownKnown or anticipated losses on contracts are recognized in full when such amounts become apparent.are probable and estimable. Bulk material transloadloading revenue is recognized as services are performed forperformed.
Drilling revenue is recognized upon receipt of a signed and dated field billing ticket from the customer.Within the Drilling Products segment Customers are charged contractually agreed amounts billed to customers for the cost of oilfield rental equipment that is damaged or lost-in-hole (“LIH”). LIH proceeds are reflectedrecognized as revenue withand the associated carrying value of the related equipmentis charged to cost of sales. This amountLIH revenue totaled $2.9
$4.2 million $4.4, $4.5 million and $2.1$3.1 million for the years ended December 31, 2009, 20082012, 2011 and 2007,2010, respectively. The Company
generally is
generally not contractually obligated to accept returns, except for defective products.
If a product isTypically products determined to be defective
are replaced or the
Company will replace the product or issuecustomer is issued a credit memo. Based on historical return rates, no provision is made for returns at the time of sale. All costs associated with product returns are expensed as incurred.
Foreign Currency:The functional currenciesCurrency Translation
Financial statements of
the Company’s foreign subsidiaries are
prepared using the
respective local
currencies.currency as the functional currency. Assets and liabilities of foreign subsidiaries are translated into U.S. dollars at exchange rates in effect as of the end of
theidentified reporting
period.periods. Revenue and expense
itemstransactions are translated
atusing the average monthly exchange
ratesrate for the reporting period.
The resultingResultant translation adjustments are
recordedrecognized as
a component of accumulated other comprehensive income (loss) within stockholders’ equity.
Comprehensive Income (Loss)
Comprehensive income (loss) encompasses all changes in stockholders’ equity except those arising from investments from, and distributions to stockholders. The Company’s comprehensive income (loss) includes net income (loss) and foreign currency translation adjustments.
Research and Development Costs:Costs
Expenditures for research activities relating to product development and improvement are charged to expense as incurred.
FLOTEK INDUSTRIES, INC. AND SUBSIDIARIES
NOTES TO CONSOLIDATED FINANCIAL STATEMENTS
Income Taxes:The Company’s income tax expense is based on income, statutory tax rates and tax planning opportunities available to it in the various jurisdictions in which it operates. Taxes
The Company provideshas two U.S. tax filing groups which file separate U.S. Federal tax returns. Taxable income of one return cannot be offset by tax attributes, including net operating losses, of the other return.
The Company uses the liability method in accounting for income
taxes based on the tax laws and rates in effect in the countries in which operations are conducted and income is earned. The Company’s income tax expense is expected to fluctuate from year to year as operations are conducted in different taxing jurisdictions and the amount of pre-tax income fluctuates.The determination and evaluation of the Company’s annual income tax provision involves the interpretation of tax laws in various jurisdictions in which it operates and requires significant judgment and the use of estimates and assumptions regarding significant future events such as the amount, timing and character of income, deductions and tax credits. Changes in tax laws, regulations and the Company’s level of operations or profitability in each jurisdiction may impact its tax liability in any given year. While the Company’s annual tax provision is based on the information available to it at the time, a number of years may elapse before the ultimate tax liabilities in certain tax jurisdictions are determined.
The Company’s current income tax expense reflects an estimate of its income tax liability for the current year, withholding taxes, changes in tax rates and changes in prior year tax estimates as returns are filed.taxes. Deferred tax assets and liabilities are recognized for temporary differences between financial statement carrying amounts and the tax bases of assets and liabilities, and are measured using the tax rates expected to be in effect when the differences reverse. Deferred tax assets and liabilities are recognized related to the anticipated future tax effects of temporary differences between the financial statement basis and the tax basis of the Company’s assets and liabilities using the enactedstatutory tax rates in effect at the applicable year end. Deferred tax assets are also recognized for operating loss and tax credit carry forwards. The effect on deferred tax assets and liabilities of a change in tax rates is recognized in the results of operations in the period that includes the enactment date. A valuation allowance foris used to reduce deferred tax assets when uncertainty exists regarding their realization.
A valuation allowance is recorded
to reduce previously recorded tax assets when it
isbecomes more-likely-than-not that
the benefit from the deferred tax assetsuch assets will not be realized. The Company
provides for uncertainevaluates, at least annually, net operating loss carry forwards and other net deferred tax
positions pursuantassets and considers all available evidence, both positive and negative, to
determine whether a valuation allowance is necessary relative to net operating loss carry forwards and other net deferred tax assets. In making this determination, the
provisions of ASC 740. The Company’s policy recognizes interest and penalties accrued on any unrecognized tax benefitsCompany considers cumulative losses in recent years as
a component of income tax expense.significant negative evidence. The Company
andconsiders recent years to mean the current year plus the two preceding years. The Company considers the recent cumulative income or loss position of its
subsidiaries’ state income tax returns are open to audit under the statute of limitationsfilings groups as objectively verifiable evidence for the
projection of future income, which consists primarily of determining the average of the pre-tax income of the current and prior two years
ending December 31, 2006 through 2009.Itafter adjusting for certain items not indicative of future performance. Based on this analysis, the Company determines whether a valuation allowance is necessary.
U.S. Federal income taxes are not provided on unremitted earnings of subsidiaries operating outside the U.S. because it is the Company’s intention to permanently reinvest undistributed earnings in the subsidiary. These earnings would become subject to
FLOTEK INDUSTRIES, INC.
NOTES TO THE CONSOLIDATED FINANCIAL STATEMENTS
income tax if they were remitted as dividends or loaned to a U.S.
deferred taxes on the undistributed earnings of non-U.S. subsidiaries. If a distribution is made to us from the undistributed earnings of these subsidiaries, the Company could be required to record additional taxes. Because the Company cannot predict when, if at all, it will make a distribution of these undistributed earnings, it is unable to make a determinationaffiliate. Determination of the amount of unrecognized deferred
U.S. income tax
liability.liability on these unremitted earnings is not practicable.
The Company has performed an evaluation and concluded that there are no significant uncertain tax positions requiring recognition in the Company’s financial statements.
The Company’s policy is to record interest and penalties related to income tax matters as income tax expense.
Earnings (Loss) Per Share:Share
Basic earnings (loss) per common share is
computedcalculated by dividing net income (loss) available to common stockholders by the weighted average number of common shares outstanding for the period. Diluted earnings (loss) per share is
computedcalculated by dividing net income (loss) attributable to common stockholders,
adjusted for the effect of assumed conversions of convertible notes and preferred stock, by the weighted average number of common shares
outstanding andoutstanding; inclusive of potentially dilutive common
equivalent shares outstanding,share equivalents, if the effect is dilutive.
PotentialPotentially dilutive common shares
equivalents consist of incremental shares of common stock issuable upon
the exercise of
the stock options and warrants and
upon conversion of
the convertible senior notes and convertible preferred stock.
Debt Issuance Costs: The costsCosts
Costs related to thedebt issuance of debt are capitalized and amortized toas interest expense over the term of the related debt using the straight-line method, which approximates the effective interest method,method. Upon the repayment of debt, the Company accelerates the recognition of an appropriate amount of the costs as interest expense.
Capitalization of Interest
Interest costs are capitalized for qualifying in-process software development projects. Capitalization of interest commences when activities to prepare the asset are in progress, and expenditures and borrowing costs are being incurred. Interest costs are capitalized until the assets are ready for their intended use. Capitalized interest is added to the cost of the underlying assets and amortized over the maturity periodsestimated useful lives of the related debt.assets. During each of the years ended December 31, 2012 and 2011, $0.1 million of interest was capitalized.
Stock-Based Compensation:The Company accountsCompensation
Stock-based compensation expense for
its stock compensation in accordance with ASC Topic 718, “Compensation-Stock Compensation” for equity-based payments to employees. The guidance incorporated by ASC Topic 718 covers share-based payments,
related to
employees, including grants of employee stock
optionsoption and restricted stock awards,
to beis recognized
in the financial statements based on their grant-date fair values.
The Company recognizes compensation expense, net of estimated forfeitures, on a straight-line basis over the requisite service period of the award. Estimated forfeitures are based on historical experience.
Use of Estimates:Estimates
The preparation of financial statements in conformity with
accounting principles generally accepted in the United States of AmericaGAAP requires management to make estimates and
certain assumptions that
FLOTEK INDUSTRIES, INC. AND SUBSIDIARIES
NOTES TO CONSOLIDATED FINANCIAL STATEMENTS
affect the reported amounts of assets and liabilities, and disclosure of contingent assets and liabilities at the date of the financial statements and the reported amounts of revenue and expenses during the reporting period.expenses. Actual results could differ from these estimates. Significant items subject to such estimates and assumptions include the application of the percentage-of-completion method of revenue recognition, the carrying amount and estimated useful lives of property and equipment and intangible assets, determination of share-based compensation expense, the valuation allowanceallowances for accounts receivable, and inventories, and certain assumptionsdeferred tax assets, and impairment assessments.
Reclassifications
Certain prior year amounts have been reclassified to conform to the current year presentation. The reclassifications did not impact net income.
New Accounting Pronouncements
Application of New Accounting Standards
Effective January 1, 2012, the Company adopted the accounting guidance in Accounting Standards Update (“ASU”) No. 2011-04, “Amendments to Achieve Common Fair Value Measurement and Disclosure Requirements in U.S. GAAP and IFRSs” and has provided additional disclosures regarding unobservable inputs used for Level 3 measurements as well as transfers between Level 1 and Level 2 of the fair value hierarchy. Implementation of this guidance required additional disclosures related to fair value measurements beginning for interim periods in impairment analyses. While management believes current estimates are reasonable2012.
Effective January 1, 2012, the Company adopted the accounting guidance in ASU No. 2011-5, “Presentation of Comprehensive Income” and appropriate, actual results could differ from these estimates.elected to present components of net income and comprehensive income in two separate, but consecutive statements. Implementation of this guidance did not change any of the components of net income or other comprehensive income. The primary
Table of ContentsSupplemental Cash Flow Information (in thousands):
| | | | | | | | | | |
| | | Years Ended December 31, | |
| | | 2009 | | 2008 | | 2007 | |
| | | (Restated) | | | | | |
Supplemental non-cash investing and financing activities: | | | | | | | |
Acquisitions, net of cash acquired: | | | | | | | | | | |
Fair value of net assets acquired | | $ | — | | $ | 97,973 | | $ | 58,233 | |
Less cash acquired | | | — | | | — | | | (605 | ) |
Less debt issued | | | — | | | — | | | (1,544 | ) |
Less equity issued | | | — | | | — | | | (1,855 | ) |
Less equity in earnings prior to acquisition and other | | | — | | | — | | | (1,201 | ) |
| | | | | | | | | | |
Acquisitions, net of cash acquired | | $ | — | | $ | 97,973 | | $ | 53,028 | |
| | | | | | | | | | |
Property and equipment acquired through capital leases | | $ | 211 | | $ | 599 | | $ | 206 | |
Shares issued in payment of accrued bonus | | $ | 481 | | $ | — | | $ | — | |
Warrant liability recognized upon issuance of warrants | | $ | 5,194 | | $ | — | | $ | — | |
| | | | | | | | | | |
Supplemental cash flow information: | | | | | | | | | | |
Interest paid | | $ | 9,063 | | $ | 6,434 | | $ | 2,852 | |
Income taxes paid | | $ | 3,685 | | $ | 8,244 | | $ | 8,061 | |
Recent
FLOTEK INDUSTRIES, INC.
NOTES TO THE CONSOLIDATED FINANCIAL STATEMENTS
result of the adoption of the aforementioned was merely a change in the Company’s financial statement presentation. The new guidance required retrospective application for all periods presented.
New Accounting
Pronouncements:Requirements and Disclosures
In January 2010,July 2012, the Financial Accounting Standards Board (“FASB”("FASB") issued Accounting Standards Update (“ASU”) 2010-06,ASU No. 2012-02, “Improving Disclosures about Fair Value MeasurementsTesting Indefinite-Lived Intangible Assets for Impairment,” which amends Accounting Standards Codification (“ASC” or “Codification”) Topic 820-10permits a company to require new disclosures related to the movements in and out of Levels 1, 2, and 3 and clarifies existing disclosuresperform qualitative assessments regarding the classificationlikelihood that an indefinite-lived intangible asset is impaired and valuation techniques usedsubsequently assess the need to measure fair value.perform a quantitative impairment test. This guidance is effective for interim and annual reporting periods beginning after December 15, 2009, except for the disclosures about certain Level 3 fair value measurements, which are effectiveimpairment tests performed for fiscal years beginning after December 31, 2010.September 15, 2012, with early adoption permitted. The Company is currently evaluating the impact of the additional requirements, but does not anticipate any financial impact as the requirements primarily provide for additional disclosure.In October 2009, the FASB issued ASU No. 2009-15,“Accounting for Own-Share Lending Arrangements in Contemplation of Convertible Debt Issuance or Other Financing” which amends or added certain paragraphs to the related ASC Topic 470,“Debt.” This standard addresses the accounting for an entity’s own-share lending arrangement initiated in conjunction with convertible debt or another financing offeringthis guidance and the effect a share-lending arrangement has on earnings per share. Additionally, the guidance addresses the accounting and earnings per share implications for defaults by the share borrower, both when a default becomes probable of occurring and when a default actually occurs. This guidance is effective for interim or annual periods beginning after June 15, 2009 for new share-lending arrangements. For existing share-lending arrangements, the guidance is applied retrospectively for fiscal years beginning after December 15, 2009. Early adoption is prohibited. The Company is
FLOTEK INDUSTRIES, INC. AND SUBSIDIARIES
NOTES TO CONSOLIDATED FINANCIAL STATEMENTS
currently evaluating the effect of the accounting principle, but does not expect that its adoption will have a material effect on itsthe consolidated financial statements. The Company will make the required disclosures and present the retrospective effect following adoption of this guidance effective January 1, 2010.
In August 2009,February 2013, the FASB issued ASU 2009-05, “Measuring Liabilities at Fair ValueNo. 2013-02, "Comprehensive Income: Reporting of Amounts Reclassified Out of Accumulated Other Comprehensive Income,”" which amends ASC Topic 820-10, “Fair Value Measurements and Disclosures – Overall,” forprovides accounting guidance on the fair value measurementreporting of liabilities. This update specifies valuation techniques allowed for measurementreclassifications out of accumulated other comprehensive income. The guidance requires an entity to present, either on the face of the fair valuestatement where net income is presented or in the notes, significant amounts reclassified out of liabilities and clarifies whenaccumulated other comprehensive income by the quoted price for an identical liability traded as an assetrespective line items of net income if the amount is reclassified to net income in an active market canits entirety in the same reporting period. For other amounts not required to be recognized asreclassified in their entirety to net income in the same reporting period, a Level 1 fair value measurement.cross reference to other disclosures that provide additional detail about the reclassification amounts is required. This guidance is effective for the first reporting period, including interim periods, beginning after its issuance.January 1, 2013. The Company adoptedis currently evaluating this guidance effective October 1, 2009. Adoption of this standard had no impactand does not expect that adoption will have a material effect on the Company’s consolidated financial statements.In June 2009, the FASB issued ASU 2009-01, Topic 105, “Generally Accepted Accounting Principles,” which released the Accounting Standards Codification. The Codification serves as a single source of authoritative GAAP to be used in the preparation of financial statements of nongovernmental entities that are presented in conformity with GAAP in the United States, except for the rules and interpretive releases of the SEC, which are sources of authoritative GAAP for registrants. Authoritative standards included in the Codification are designated by their ASC topical reference, with new standards designated as ASU’s, with a year and assigned sequence number. The guidance is effective for interim and annual periods beginning after September 15, 2009. Adoption of this standard did not change GAAP and had no financial impact on the Company’s consolidated financial statements.
In May 2009, the FASB issued accounting guidance related to subsequent events found within ASC Topic 855,“Subsequent Events.” This guidance sets standards for the disclosure of events that occur after the balance sheet date, but before financial statements are issued or are available to be issued. Additionally, the guidance sets forth the period after the balance sheet date during which management of a reporting entity should evaluate events or transactions that may occur for potential recognition or disclosure in the financial statements, the circumstances under which an entity should recognize events or transactions occurring after the balance sheet date in its financial statements, and the disclosures that an entity should make about events or transactions that occurred after the balance sheet date. The Company adopted this guidance effective June 30, 2009. The implementation of this standard did not have a material impact on the Company’s consolidated financial statements.
In April 2009, the FASB issued accounting guidance related to interim disclosures about fair value of financial instruments found within ASC Topic 825, “Financial Instruments.” This guidance requires fair value disclosures in both interim as well as annual financial statements in order to provide more timely information about the effects of current market conditions on financial instruments. The Company adopted this guidance effective June 30, 2009. The implementation of this standard did not have a material impact on the Company’s consolidated financial statements.
Note
3—AcquisitionsOn February 14, 2008, Teledrift Acquisition, Inc, a wholly-owned subsidiary of the Company, acquired substantially all of the assets of Teledrift, Inc. (“Teledrift”) for the aggregate3 — Supplemental Cash Flow Information
Supplemental cash
purchase price of approximately $98.0 million, which includes a purchase price adjustment of $1.8 million recorded in the third quarter of 2008. The acquisition resulted in goodwill of $46.4 million and intangible assets other than goodwill of $31.6 million, which were recorded in the Drilling Products business segment. Teledrift designs and manufactures wireless survey and measurement while drilling, or MWD, tools.On January 4, 2007, the Company acquired substantially all the assets of Triumph Drilling Tools, Inc. (“Triumph”) for $31.1 million in cash. The acquisition resulted in goodwill of $19.9 million and intangible assets
FLOTEK INDUSTRIES, INC. AND SUBSIDIARIES
NOTES TO CONSOLIDATED FINANCIAL STATEMENTS
other than goodwill of $1.9 million, which were recorded in the Drilling Products business segment. Triumph is a leading regional provider of down-hole rental equipment to the oil and gas industry. Results of operations for Triumph are included in the Company’s consolidated condensed statements of income as of January 1, 2007.
In January 2007, the Company acquired a 50% partnership interest in CAVO Drilling Motors Ltd Co. (“CAVO”) for approximately $2.6 million in cash, 143,434 shares of the Company’s common stock valued at $1.9 million and a $1.5 million promissory note to the seller. CAVO is a complete downhole motor solutions provider specializing in the rental, servicing and sale of high-performance mud motors for a variety of drilling applications. CAVO serves both the domestic and international drilling markets with a customer base extending throughout North America, South America, Russia and West Africa. For the first ten months of 2007 the Company reported the partnership interest in CAVO using the equity method of accounting as the Company did not own a controlling interest. The equity in earnings and other adjustments affecting the Company’s investment in CAVO during 2007 were approximately $1.2 million.
On November 15, 2007, the Company completed its acquisition of the remaining 50% partnership interest in CAVO. The Company paid aggregate consideration of $12.5 million in cash and assumed $0.2 million in long-term debt. From November 1, 2007 through the end of the year CAVO was accounted for as a fully owned subsidiary.
On August 31, 2007, the Company acquired Sooner Energy Services, Inc. (“Sooner”) for $7.2 million in cash. Sooner develops, produces and distributes specialty chemical products and services for drilling and production of natural gas. Sooner serves natural gas producers, oilfield supply stores, drilling mud and other service companies in North America. Results of operations for Sooner are included in the Company’s consolidated condensed statement of income as of September 1, 2007.
Note 4—Product Revenue
The Company generates revenue through three main sales channels: Products, Rentals and Services. In most instances, revenue is generated through these channels on an integrated basis. Sales channelflow information is as follows (in thousands):
| | | | | | | | | |
| | | Years Ended December 31, |
| | | 2009 | | 2008 | | 2007 |
Revenue: | | | | | | | | | |
Product | | $ | 72,282 | | $ | 145,074 | | $ | 118,443 |
Rental | | | 28,620 | | | 60,343 | | | 24,349 |
Service | | | 11,648 | | | 20,646 | | | 15,216 |
| | | | | | | | | |
| | | 112,550 | | | 226,063 | | | 158,008 |
| | | | | | | | | |
Cost of Revenue: | | | | | | | | | |
Product | | | 48,728 | | | 88,384 | | | 71,190 |
Rental | | | 17,769 | | | 28,093 | | | 11,086 |
Service | | | 7,409 | | | 11,556 | | | 8,021 |
Depreciation | | | 9,260 | | | 7,274 | | | 4,264 |
| | | | | | | | | |
| | $ | 83,166 | | $ | 135,307 | | $ | 94,561 |
| | | | | | | | | |
|
| | | | | | | | | | | |
| | Year ended December 31, |
| | 2012 | | 2011 | | 2010 |
| Supplemental non-cash investing and financing activities: | | | | | |
| Fair value of warrant liability reclassified to additional paid-in capital | $ | 13,973 |
| | $ | — |
| | $ | — |
|
| Value exchanged in conversion of preferred stock to common stock | — |
| | 11,205 |
| | 4,795 |
|
| Value of common stock issued in payment of convertible notes | — |
| | 5,165 |
| | — |
|
| Value of common stock issued in payment of preferred stock dividends | — |
| | 3,254 |
| | — |
|
| Value of common stock issued in payment of term loan debt | — |
| | 1,398 |
| | — |
|
| Equipment acquired through capital leases | 1,263 |
| | 1,334 |
| | 615 |
|
Value of common stock issued in payment of debt issuance costs
| — |
| | — |
| | 5,096 |
|
| Reduction in convertible debt upon note exchange | — |
| | — |
| | 1,996 |
|
| Value of common stock issued in exchange for convertible notes | — |
| | — |
| | 1,992 |
|
| Debt related commitment fees included in accrued liabilities | — |
| | — |
| | 1,000 |
|
| Exercise of stock options by common stock surrender | — |
| | — |
| | 111 |
|
| | | | | | |
| Supplemental cash payment information: | | | | | |
| Interest paid | $ | 5,521 |
| | $ | 7,627 |
| | $ | 10,901 |
|
| Income taxes paid (refunded) | 14,049 |
| | (904 | ) | | (6,186 | ) |
FLOTEK INDUSTRIES, INC.
AND SUBSIDIARIESNOTES TO
THE CONSOLIDATED FINANCIAL STATEMENTS
Note
5—Inventories4 — Revenue
The
componentsCompany differentiates revenue and cost of
inventoriesrevenue based on whether the source of revenue is attributable to products, rentals or services. Revenue and cost of revenue by source are as follows (in thousands):
| | | | | | | | |
| | | December 31, | |
| | | 2009 | | | 2008 | |
Raw materials | | $ | 9,653 | | | $ | 16,258 | |
Work-in-process | | | — | | | | 1,890 | |
Finished goods (includes in-transit) | | | 20,659 | | | | 22,286 | |
| | | | | | | | |
Gross inventories | | | 30,312 | | | | 40,434 | |
Less: slow-moving and obsolescence reserve | | | (3,080 | ) | | | (2,407 | ) |
| | | | | | | | |
Inventories, net | | $ | 27,232 | | | $ | 38,027 | |
| | | | | | | | |
The Company regularly reviews inventory quantities on hand
|
| | | | | | | | | | | |
| | Year ended December 31, |
| | 2012 | | 2011 | | 2010 |
| Revenue: | | | | | |
| Products | $ | 224,777 |
| | $ | 181,417 |
| | $ | 95,021 |
|
| Rentals | 67,938 |
| | 63,610 |
| | 42,169 |
|
| Services | 20,113 |
| | 13,758 |
| | 9,792 |
|
| | $ | 312,828 |
| | $ | 258,785 |
| | $ | 146,982 |
|
| Cost of Revenue: | | | | | |
| Products | $ | 135,367 |
| | $ | 115,875 |
| | $ | 60,919 |
|
| Rentals | 30,618 |
| | 25,971 |
| | 20,355 |
|
| Services | 8,051 |
| | 4,997 |
| | 3,517 |
|
| Depreciation | 7,173 |
| | 6,122 |
| | 9,221 |
|
| | $ | 181,209 |
| | $ | 152,965 |
| | $ | 94,012 |
|
Note 5 — Inventories
Inventories are as follows (in thousands):
|
| | | | | | | |
| | December 31, |
| | 2012 | | 2011 |
| Raw materials | $ | 12,883 |
| | $ | 12,490 |
|
| Work-in-process | 342 |
| | 160 |
|
| Finished goods | 34,704 |
| | 27,917 |
|
| Inventories | 47,929 |
| | 40,567 |
|
| Less reserve for excess and obsolete inventory | (2,752 | ) | | (2,679 | ) |
| Inventories, net | $ | 45,177 |
| | $ | 37,888 |
|
Changes in the reserve for excess and
records provisions for slow-moving or obsolete inventory
based primarily on forecasts of product demand, historical trends, market conditions, production or procurement requirements and technological developments.The following summarizes the changes in inventory reserve for the years endedare as follows (in thousands):
|
| | | | | | | | | | | |
| | Year ended December 31, |
| | 2012 | | 2011 | | 2010 |
| Balance, beginning of year | $ | 2,679 |
| | $ | 2,633 |
| | $ | 3,080 |
|
| Charged to costs and expenses | 220 |
| | 1,011 |
| | 771 |
|
| Deductions | (147 | ) | | (965 | ) | | (1,218 | ) |
| Balance, end of the year | $ | 2,752 |
| | $ | 2,679 |
| | $ | 2,633 |
|
At December 31, 2009, 2008 and 2007 (in thousands): | | | | | | | | | | | | | | | | |
| | | | | Additions | | | | | |
| | | Beginning
Balance | | Charged to
Costs and
Expense | | Charged to
Other
Accounts (a) | | Deductions | | | Ending
Balance |
Years Ended December 31, | | | | | | | | | | | |
2007 | | $ | 862 | | $ | 1,261 | | $ | 553 | | $ | (282 | ) | | $ | 2,394 |
2008 | | | 2,394 | | | 3,567 | | | — | | | (3,554 | ) | | | 2,407 |
2009 | | | 2,407 | | | 6,340 | | | — | | | (5,667 | ) | | | 3,080 |
(a) | Amounts represent amounts obtained from acquisitions.
|
2012, the Company recorded a
$1.2 million write-down for inventory with a current market value less than its cost.
FLOTEK INDUSTRIES, INC.
NOTES TO THE CONSOLIDATED FINANCIAL STATEMENTS
Note
6—6 — Property and Equipment
Property and equipment are as follows (in thousands):
| | | | | | | | |
| | | December 31, | |
| | | 2009 | | | 2008 | |
Land | | $ | 1,338 | | | $ | 1,381 | |
Buildings and leasehold improvements | | | 19,143 | | | | 16,354 | |
Machinery, equipment and rental tools | | | 62,369 | | | | 55,866 | |
Equipment in progress | | | 133 | | | | 5,472 | |
Furniture and fixtures | | | 1,306 | | | | 1,172 | |
Transportation equipment | | | 4,252 | | | | 4,927 | |
Computer equipment | | | 1,750 | | | | 1,255 | |
| | | | | | | | |
Gross property and equipment | | | 90,291 | | | | 86,427 | |
Less: accumulated depreciation | | | (30,040 | ) | | | (19,592 | ) |
| | | | | | | | |
Property and equipment, net | | $ | 60,251 | | | $ | 66,835 | |
| | | | | | | | |
|
| | | | | | | |
| | December 31 |
| | 2012 | | 2011 |
| Land | $ | 1,442 |
| | $ | 1,220 |
|
| Buildings and leasehold improvements | 18,520 |
| | 18,401 |
|
| Machinery, equipment and rental tools | 54,279 |
| | 44,364 |
|
| Equipment in progress | 9,382 |
| | 4,048 |
|
| Furniture and fixtures | 1,358 |
| | 1,288 |
|
| Transportation equipment | 5,136 |
| | 4,853 |
|
| Computer equipment and software | 6,743 |
| | 1,900 |
|
| Property and equipment | 96,860 |
| | 76,074 |
|
| Less accumulated depreciation | (40,361 | ) | | (32,160 | ) |
| Property and equipment, net | $ | 56,499 |
| | $ | 43,914 |
|
FLOTEK INDUSTRIES, INC. AND SUBSIDIARIESNOTES TO CONSOLIDATED FINANCIAL STATEMENTS
Depreciation expense, including expense recorded in cost of revenue, totaled $9.5 million, $8.0 million, and $11.3 million for the years ended December 31, 2009, 20082012, 2011 and 20072010, respectively.
Potential impairment of certain rental fixed assets within Drilling was $11.7identified in 2010 due to shifts in market demand. Drilling activity had become more concentrated in horizontal and directional drilling from the previously dominant vertical drilling. The estimated fair value of identified asset groups was calculated based on probability weighted future cash flows. Expected cash flows of each identified asset group took into consideration direct material cost margins and service costs, historic and expected utilization, and remaining useful life. In addition, the Company used a present value WACC technique to analyze the recoverability of the identified asset groups. The Company recognized impairment charges of $8.9 million $9.4 million and $5.4 million, respectively. Depreciation expense that directly relates to activities that generate revenue amounted to $9.3 million, $7.3 million and $4.3 million for during the yearsyear ended December 31, 2009, 20082010 and 2007, respectively,a net loss on disposal of assets of $2.1 million.
During 2012 and is recorded within cost of revenues.2011, no impairment was recognized related to property and equipment.
Note 7—Goodwill
The Company tests goodwill
Goodwill is tested for impairment on an annual basis,annually in the fourth quarter, or more frequently if circumstances indicate a potential impairment. Annual goodwill impairment evaluations are performed in the fourth quarter. The Company has identified four reporting units, of which only two, Chemicals and Logistics and Teledrift, have an unamortizeda goodwill balance at December 31, 2009.2012.
During
the Company’s annual
testing for goodwill impairment
duringtesting in 2012 and 2011, the Company first assessed qualitative factors to determine whether it was necessary to perform the two-step goodwill impairment test that the Company has historically used. The Company concluded that it was not more-likely-than-not that goodwill was impaired as of the fourth quarter of
2008, impairments totaling $61.5 million were identified within three of the four reporting units.2012 or 2011, and therefore, further testing was not required. The
impairment charge was recorded as an operating expense during the year ended December 31, 2008. The Company again tested forCompany’s 2010 annual goodwill impairment
during the second and third quarters of 2009 as a result of the continuing deterioration of the general economic and oil and gas industry conditions, and the declining financial performance of all of its reporting units. Antesting did not identify impairment
totaling $18.5 million was identified and recorded as an operating expense during the six months ended June 30, 2009. No further impairments of goodwill
were recognized during the Company’s interim or annual testing for goodwill impairment during the third and fourth quarters of 2009.in any reporting unit.
In estimating the fair value of the Company’s reporting units
when performing the two step goodwill impairment test, management makes estimates and judgments
aboutregarding future cash flows and market valuations using a combination of income and market
approaches, respectively, defined as Level 3 inputs under the fair value measurement hierarchy.approaches. The income approach, specifically a discounted cash flow analysis,
includedincludes assumptions for
among others, discount rates, cash flow projections, growth rates and terminal value
rates, all of which require significant judgment. Specific assumptions discussed above arerates. Each assumption is reevaluated and updated at
theeach testing date
of each test to
consider current industry andtake into consideration Company-specific risk factors from the perspective of a market participant.
The changes
FLOTEK INDUSTRIES, INC.
NOTES TO THE CONSOLIDATED FINANCIAL STATEMENTS
Changes in the carrying
amountvalue of goodwill for each reporting unit
for the years ended December 31, 2009, 2008 and 2007 wereare as follows (in thousands):
| | | | | | | | | | | | | | | | | | | |
| | | Chemicals
and
Logistics | | Downhole
Tool | | | Teledrift | | | Artificial
Lift | | | Total | |
Balance at January 1, 2007 | | $ | 7,620 | | $ | 9,689 | | | $ | — | | | $ | 6,876 | | | $ | 24,185 | |
Goodwill acquired: | | | | | | | | | | | | | | | | | | | |
Triumph | | | — | | | 19,872 | | | | — | | | | — | | | | 19,872 | |
CAVO | | | — | | | 13,487 | | | | — | | | | — | | | | 13,487 | |
Sooner | | | 3,990 | | | — | | | | — | | | | — | | | | 3,990 | |
Purchase price adjustments and reclassifications to intangible assets | | | — | | | (39 | ) | | | — | | | | (1,015 | ) | | | (1,054 | ) |
| | | | | | | | | | | | | | | | | | | |
Balance at December 31, 2007 | | | 11,610 | | | 43,009 | | | | — | | | | 5,861 | | | | 60,480 | |
Goodwill acquired: Teledrift | | | — | | | — | | | | 46,396 | | | | — | | | | 46,396 | |
Impairment | | | — | | | (43,009 | ) | | | (12,563 | ) | | | (5,861 | ) | | | (61,433 | ) |
| | | | | | | | | | | | | | | | | | | |
Balance at December 31, 2008 | | | 11,610 | | | — | | | | 33,833 | | | | — | | | | 45,443 | |
Impairment | | | — | | | — | | | | (18,500 | ) | | | — | | | | (18,500 | ) |
| | | | | | | | | | | | | | | | | | | |
Balance at December 31, 2009 | | $ | 11,610 | | $ | — | | | $ | 15,333 | | | $ | — | | | $ | 26,943 | |
| | | | | | | | | | | | | | | | | | | |
FLOTEK INDUSTRIES, INC. AND SUBSIDIARIES
NOTES TO CONSOLIDATED FINANCIAL STATEMENTS
|
| | | | | | | | | | | | | | | | | | | |
| | Chemicals and Logistics | | Downhole Tools | | Teledrift | | Artificial Lift | | Total |
| Balance at December 31, 2010: | | | | | | | | | |
| Goodwill | $ | 11,610 |
| | $ | 43,009 |
| | $ | 46,396 |
| | $ | 5,861 |
| | $ | 106,876 |
|
| Accumulated impairment losses | — |
| | (43,009 | ) | | (31,063 | ) | | (5,861 | ) | | (79,933 | ) |
| Goodwill balance, net | 11,610 |
| | — |
| | 15,333 |
| | — |
| | 26,943 |
|
| Activity during the year 2011: | | | | | | | | | |
| Goodwill impairment recognized | — |
| | — |
| | — |
| | — |
| | — |
|
| Balance at December 31, 2011: | | | | | | | | | |
| Goodwill | 11,610 |
| | 43,009 |
| | 46,396 |
| | 5,861 |
| | 106,876 |
|
| Accumulated impairment losses | — |
| | (43,009 | ) | | (31,063 | ) | | (5,861 | ) | | (79,933 | ) |
| Goodwill balance, net | 11,610 |
| | — |
| | 15,333 |
| | — |
| | 26,943 |
|
| Activity during the year 2012: | | | | | | | | | |
| Goodwill impairment recognized | — |
| | — |
| | — |
| | — |
| | — |
|
| Balance at December 31, 2012: | | | | | | | | | |
| Goodwill | 11,610 |
| | 43,009 |
| | 46,396 |
| | 5,861 |
| | 106,876 |
|
| Accumulated impairment losses | — |
| | (43,009 | ) | | (31,063 | ) | | (5,861 | ) | | (79,933 | ) |
| Goodwill balance, net | $ | 11,610 |
| | $ | — |
| | $ | 15,333 |
| | $ | — |
| | $ | 26,943 |
|
Note
8—8 — Other Intangible Assets
Other intangible assets are as follows (in thousands):
| | | | | | | | | | | | |
| | | December 31, 2009 | | December 31, 2008 |
Other intangible assets: | | Carrying
Value | | Accumulated
Amortization | | Carrying
Value | | Accumulated
Amortization |
Patents | | $ | 6,282 | | $ | 2,618 | | $ | 6,280 | | $ | 2,302 |
Customer lists | | | 28,543 | | | 7,843 | | | 28,543 | | | 6,493 |
Non-compete agreements | | | 1,715 | | | 1,500 | | | 1,715 | | | 1,420 |
Brand name | | | 6,199 | | | 638 | | | 6,199 | | | 330 |
Supply contract | | | 1,700 | | | 921 | | | 1,700 | | | 606 |
Other | | | 428 | | | 405 | | | 501 | | | 308 |
| | | | | | | | | | | | |
Other acquired intangible assets total | | | 44,867 | | | 13,925 | | | 44,938 | | | 11,459 |
| | | | | | | | | | | | |
Deferred financing costs | | | 6,468 | | | 2,573 | | | 5,650 | | | 1,114 |
| | | | | | | | | | | | |
Total other intangible assets | | $ | 51,335 | | $ | 16,498 | | $ | 50,588 | | $ | 12,573 |
| | | | | | | | | | | | |
Other intangible assets, net | | $ | 34,837 | | | | | $ | 38,015 | | | |
| | | | | | | | | | | | |
Other intangible
|
| | | | | | | | | | | | | | | |
| | December 31, |
| | 2012 | | 2011 |
| | Cost | | Accumulated Amortization | | Cost | | Accumulated Amortization |
| Patents | $ | 4,314 |
| | $ | 1,654 |
| | $ | 4,532 |
| | $ | 1,425 |
|
| Customer lists | 23,337 |
| | 6,688 |
| | 23,337 |
| | 5,336 |
|
| Non-compete agreements | 402 |
| | 402 |
| | 402 |
| | 348 |
|
| Brand names | 6,151 |
| | 1,513 |
| | 6,151 |
| | 1,205 |
|
| Other | 915 |
| | 801 |
| | 922 |
| | 733 |
|
| Total intangible assets acquired | 35,119 |
| | 11,058 |
| | 35,344 |
| | 9,047 |
|
| Deferred financing costs | 1,290 |
| | 1,185 |
| | 8,790 |
| | 5,993 |
|
| Total other intangible assets | $ | 36,409 |
| | $ | 12,243 |
| | $ | 44,134 |
| | $ | 15,040 |
|
| Carrying value: | | | | | | | |
| Other intangible assets, net | $ | 24,166 |
| | | | $ | 29,094 |
| | |
Intangible assets acquired are being amortized on a straight-line basis ranging from over two to 20 years. TheAmortization of intangible assets acquired totaled $2.1 million, $2.1 million, and $2.5 million for the years end ended December 31, 2012, 2011 and 2010, respectively. During 2012, the Company recorded other intangible asset amortization expensesold certain patent rights resulting in a reduction in capitalized costs of $2.5$0.3 million and $3.4a gain of $0.8 million
Amortization of deferred financing costs totaled $0.9 million, $3.1 million, and $4.0 million for the years ended December 31, 20092012, 2011 and 2008,2010, respectively. The following table summarizes estimated aggregateDuring 2012, the carrying value of deferred financing costs was reduced by $1.8 million upon repayments of the Company’s convertible senior notes.
FLOTEK INDUSTRIES, INC.
NOTES TO THE CONSOLIDATED FINANCIAL STATEMENTS
Estimated future amortization expense for intangible assets, including deferred financing costs, at December 31, 2012 is as follows (in thousands):
|
| | | |
| Year ending December 31, | |
| 2013 | $ | 2,148 |
|
| 2014 | 1,992 |
|
| 2015 | 1,956 |
|
| 2016 | 1,956 |
|
| 2017 | 1,917 |
|
| Thereafter | 14,197 |
|
| Other intangible assets, net | $ | 24,166 |
|
During 2012 and 2011, no impairment was recognized related to other intangible assets for each of the five succeeding fiscal years (in thousands): | | | |
Year ending December 31, | | |
2010 | | $ | 4,082 |
2011 | | | 3,765 |
2012 | | | 2,861 |
2013 | | | 2,050 |
2014 | | | 1,955 |
In December 2008, testing of the Company’s intangible assets due to the deteriorating macro-economic environment and business conditions affecting the oil and gas industry indicated impairment of several intangible assets. As a result,During 2010, the Company became aware of a vendor’s noncompliance with an exclusivity and preferential pricing arrangement recorded as an intangible asset with remaining unamortized residual value of
$0.4 million. Consequently, the Company, recognized an impairment chargeloss of $6.2$0.4 million during the year ended December 31, 2008, primarily related to customer lists and patents in the Artificial Lift and Drilling Products segments. Due to the continuing deterioration of the general economic and oil and gas industry conditions, and the declining financial performance of all of its reporting units, the Company tested for potential impairment of its intangible assets in the second, third and fourth quarters of 2009. The Company utilized an income approach (Level 3) consistent with that described in . Note
7, Goodwill. No impairment was recorded as a result of these tests during the year ended December 31, 2009.FLOTEK INDUSTRIES, INC. AND SUBSIDIARIES
NOTES TO CONSOLIDATED FINANCIAL STATEMENTS
Note 9—9 — Convertible Senior Notes, and Long-Term Debt
and Credit Facility
Convertible
Senior Notesnotes and long-term debt are as follows (in thousands):
| | | | | | | | |
| | | December 31, | |
| | | 2009 | | | 2008 | |
Convertible Senior Notes | | $ | 115,000 | | | $ | 115,000 | |
Less discount on notes | | | (19,399 | ) | | | (24,197 | ) |
| | | | | | | | |
Convertible Senior Notes, net of discount | | $ | 95,601 | | | $ | 90,803 | |
| | | | | | | | |
Long-term debt: | | | | | | | | |
Senior Credit Facility | | | | | | | | |
Equipment term loans | | $ | 21,210 | | | $ | 34,000 | |
Revolving line of credit | | | 9,953 | | | | 2,311 | |
Real estate term loans | | | 717 | | | | 787 | |
Other | | | — | | | | 515 | |
Capital lease obligations | | | 658 | | | | 882 | |
| | | | | | | | |
Total | | | 32,538 | | | | 38,495 | |
Less current portion | | | (8,949 | ) | | | (9,017 | ) |
| | | | | | | | |
Long-term debt, less current portion | | $ | 23,589 | | | $ | 29,478 | |
| | | | | | | | |
|
| | | | | | | |
| | December 31, |
| | 2012 | | 2011 |
| Convertible notes: | | | |
| Convertible senior unsecured notes (2008 Notes) | $ | 5,188 |
| | $ | 70,500 |
|
| Convertible senior secured notes (2010 Notes) | — |
| | 36,004 |
|
| Less discount on notes | (55 | ) | | (6,766 | ) |
| Convertible senior notes, net of discount | 5,133 |
| | 99,738 |
|
| Less amount reported as current | (5,133 | ) | | — |
|
| Convertible senior notes reported as long-term | $ | — |
| | $ | 99,738 |
|
| | | | |
| Long-term debt: | | | |
| Term loan | $ | 25,000 |
| | $ | — |
|
| Capital lease obligations | 1,784 |
| | 1,642 |
|
| Total long-term debt | 26,784 |
| | 1,642 |
|
| Less current portion of long-term debt | (4,329 | ) | | (767 | ) |
| Long-term debt, less current portion | $ | 22,455 |
| | $ | 875 |
|
Credit Facility
On September 23, 2011, the Company and certain of its subsidiaries (the “Borrowers”) entered into a Revolving Credit and Security Agreement (the “Credit Facility”) with PNC Bank, National Association (“PNC Bank”). The Company may borrow under the Credit Facility for working capital, permitted acquisitions, capital expenditures and other corporate purposes. Under terms of the Credit Facility, as amended on December 27, 2012, the Company (a) may borrow up to $50 million under a revolving credit facility and (b) has borrowed $25 million under a term loan.
The Credit Facility is secured by substantially all of the Company's domestic personal property, including accounts receivable, inventory, equipment and other intangible assets. The Credit Facility contains customary representations, warranties, and both affirmative and negative covenants, including a financial covenant to maintain consolidated earnings before interest, taxes, depreciation and amortization (“EBITDA”) to debt ratio of 1.10 to 1.00 and an annual limit on capital expenditures of approximately $24 million. The Credit Facility restricts the payment of cash dividends on common stock. In the event of default, PNC Bank may accelerate the maturity date of any outstanding amounts borrowed under the Credit Facility.
Each of the Company’s domestic subsidiaries is fully obligated for Credit Facility indebtedness as a Borrower or as a guarantor pursuant to a guaranty dated September 23, 2011.
FLOTEK INDUSTRIES, INC.
NOTES TO THE CONSOLIDATED FINANCIAL STATEMENTS
(a) Revolving Credit Facility
Under the revolving credit facility, the Company may borrow up to $50 million. This includes a sublimit of $10 million which may be used for letters of credit. The revolving credit facility is secured by substantially all the Company's domestic accounts receivable and inventory.
The interest rate on advances under the revolving credit facility varies based on the level of borrowing. Rates range (a) between PNC Bank's base lending rate plus 1.0% to 1.5% or (b) between the London Interbank Lending Rate (LIBOR) plus 2.0% to 2.5%. PNC Bank's base lending rate was 3.25% at December 31, 2012 and would have permitted borrowing at rates ranging between 4.25% and 4.75%. The Company is required to pay a monthly facility fee of 0.25% on any unused amount under the commitment based on daily averages. At December 31, 2012, no amounts had been borrowed under the revolving credit facility, nor had any letters of credit been issued under the sublimit.
At December 31, 2012, eligible accounts receivable and inventory securing the revolving credit facility provided availability of approximately $47.2 million under the revolving credit facility.
(b) Term Loan
The Company borrowed $25 million under the term loan on December 28, 2012. Monthly principal payments of $0.3 million are required beginning in February 2013. The unpaid balance of the term loan is due on December 26, 2017. Prepayments are permitted, and may be required in certain circumstances. Amounts repaid under the term loan may not be reborrowed. The term loan is secured by substantially all of the Company's domestic equipment and other intangible assets.
The interest rate on the term loan varies based on the level of borrowing under the revolving credit facility. Rates range (a) between PNC Bank's base lending rate plus 1.5% to 2.0% or (b) between the London Interbank Lending Rate (LIBOR) plus 2.5% to 3.0%. At December 31, 2012, the interest rate on the term loan was 4.75%.
Convertible Notes
The Company’s convertible notes have consisted of Convertible Senior
Unsecured Notes
(“2008 Notes”) and Convertible Senior Secured Notes (“2010 Notes”). On January 5, 2012, the Company repurchased all of its outstanding 2010 Notes. At December 31, 2012, only 2008 Notes remain outstanding.
On February 14, 2008, the Company issued 5.25% Convertible Seniorthe 2008 Notes due 2028 (the “Notes”), at par, in thean aggregate principal amount of $115 million. Net proceeds received from issuance$115.0 million. The 2008 Notes bear interest at 5.25% and mature on February 15, 2028.
The 2008 Notes may be settled in cash upon conversion. The Company accounted for both the liability and equity components of the 2008 Notes using the Company’s nonconvertible debt borrowing rate of 11.5%. The Company is using a five-year expected term for accretion of the associated debt discount which represents the period from inception until contractual call/put options contained in the 2008 Notes become exercisable on February 15, 2013. The Company assumed an effective tax rate of 38.0%. At the date of issuance, the discount on the 2008 Notes was $27.8 million, with an associated deferred tax liability of $10.6 million. On March 31, 2010, the Company executed an exchange agreement (the “Exchange Agreement”) with Whitebox Advisors, LLC, the administrative agent for a syndicate of lenders, to refinance the Company’s then existing term loan. The Exchange Agreement permitted each lender to exchange 2008 Notes, in proportion to the lender’s principal amount of participation in the refinanced term loan, for 2010 Notes and shares of the Company’s common stock. In accordance with the terms of the Exchange Agreement, on March 31, 2010, investors received, for each $1,000 principal amount of 2008 Notes exchanged, (a) $900 principal amount of 2010 Notes and (b) $50 worth of shares of the Company’s common stock based on 95% of the volume-weighted average price of the common stock for the preceding ten trading days.
The Company exchanged $40.0 million of 2008 Notes for aggregate consideration of $36.0 million of 2010 Notes and $2.0 million worth of shares of the Company’s common stock. On March 31, 2010, the Company issued 1,568,867 shares of common stock to satisfy the common stock component of the Exchange Agreement. The transaction was accounted for as an exchange of debt. Accordingly, no gain or loss was recognized and the difference between the debt exchanged, and the net carrying value of the debt was recorded as a reduction of previously recognized debt discount. The remaining debt discount continued to be accreted over the same period, at an assumed rate of 9.9%, using the effective interest method. The Company capitalized commitment fees related to the Exchange Agreement that were amortized using the effective interest method over the period the convertible debt was expected to remain outstanding. Third-party transaction costs of $0.8 million incurred in conjunction with the Exchange Agreement were expensed as incurred.
The 2010 Notes carried the same maturity date, interest rate, conversion rights, conversion rate, redemption rights and guarantees as the 2008 Notes. The only difference in terms was that the 2010 Notes were $111.8 million.secured by a second priority lien on substantially all of the Company’s assets, while the 2008 Notes remained unsecured.
FLOTEK INDUSTRIES, INC.
NOTES TO THE CONSOLIDATED FINANCIAL STATEMENTS
Interest on the convertible notes accrues at 5.25% per annum and is payable semiannually in arrears on February 15 and August 15. The Company used the net proceeds from issuanceis obligated to pay contingent interest to holders of the convertible notes during any six-month period from an interest payment date, commencing with the six-month period beginning on February 15, 2013, if the trading price of a note for each of the five trading days preceding the first day of the relevant six-month period equals 120% or more of the principal amount of the Note. Contingent interest payable per note, with respect to any such period, will be equal to 0.5% per annum of the average trading price of the applicable note for the five trading days referenced above.
The 2008 Notes to finance the acquisition of Teledrift (see Note 3) and for general corporate purposes.Becausemature on
February 15, 2028. On or after February 15, 2013, the Company may redeem, for cash, all or a portion of the convertible notes at a price equal to 100% of the outstanding principal amount, plus any associated accrued and unpaid interest, including any contingent interest. Holders of the 2008 Notes can require the Company to purchase all, or a portion, of the holder’s outstanding notes on each of February 15, 2013, February 15, 2018, and February 15, 2023. If the Company engages in certain types of corporate transactions, note holders can require the Company to purchase all or a portion of the note holder’s outstanding notes. Any repurchase of the convertible notes pursuant to the aforementioned provisions must be for a cash price equal to 100% of the outstanding principal amount of the notes to be purchased, plus any associated accrued and unpaid interest, including any contingent interest.
The convertible notes are convertible into shares of the Company’s common stock at the option of the note holders, subject to certain contractual conditions. The conversion rate is equal to 43.9560 shares per $1,000 principal note amount (a conversion price of approximately $22.75 per share), subject to adjustment, as contractually defined. Upon conversion, the Company may deliver, at the Company’s option, either cash or shares of common stock or a combination of cash and shares of common stock.
In May 2011, note holders exchanged $4.5 million of the 2008 Notes for 559,007 shares of the Company’s common stock. Upon exchange, the Company recognized a loss on the extinguishment of debt of $1.1 million representing the difference between the reacquisition price of the debt over its net carrying amount including write-off of proportionate unaccreted discount and unamortized deferred financing costs.
On January 5, 2012, the Company repurchased all $36.0 million of the outstanding 2010 Notes for cash equal to 104.95% of the original principal amount of the notes, plus accrued and unpaid interest. As a result of this transaction, the Company recognized a loss on extinguishment of debt of $5.4 million, consisting of a cash premium of $1.8 million and write-off of unaccreted discount and unamortized deferred financing costs. Upon repurchase, the 2010 Notes were canceled and the second priority liens on the Company’s assets were released.
On June 25, 2012, the Company repurchased $15.0 million of outstanding 2008 Notes for cash equal to 102.0% of the original principal amount, plus accrued and unpaid interest. As a result of this transaction, the Company recognized a loss on extinguishment of debt of $1.0 million, consisting of the cash premium of $0.3 million and the write-off of unaccreted discount and unamortized deferred financing costs.
On December 31, 2012, the Company repurchased $50.3 million of outstanding 2008 Notes for cash equal to the original principal amount and a total premium of $0.3 million, plus accrued and unpaid interest. As a result of this transaction, the Company recognized a loss on extinguishment of debt of $0.9 million, consisting of the cash premium and the write-off of unaccreted discount and unamortized debt financing costs.
Guarantees of the Convertible Notes
The convertible notes are guaranteed by substantially all of the Company’s wholly owned subsidiaries. Flotek Industries, Inc., the parent company, is a holding company with no independent assets or
operations, the Notes are guaranteedoperations. The guarantees provided by the
Company and each of its wholly-owned subsidiaries. The guaranteesCompany’s subsidiaries are full and unconditional, and joint and
several, on a senior, unsecured basis.several. Any subsidiaries of the Company that are not guarantors are deemed to be “minor” subsidiaries in accordance with SEC Regulation S-X, Rule 3-10, “Financial Statements of Guarantors and Issuers of Guaranteed Securities Registered or Being Registered.” The agreements governing the Company’s long-term indebtedness do not contain any significant restrictions on the ability of the Company, or any guarantor, to obtain funds from
its subsidiaries by dividend or loan.
Interest on
Share Lending Agreement
Concurrent with the Notes accrues at 5.25% per annum, and is payable semiannually in arrears on February 15 and August 15 of each year. The Company is also required to pay contingent interest to holdersoffering of the 2008 Notes, during any six-month period fromthe Company entered into a share lending agreement (the “Share Lending Agreement”) with Bear, Stearns International Limited (the “Borrower”). The Borrower was subsequently acquired and became an interest payment date to, but excluding, the following interest payment date, commencingindirect, wholly owned subsidiary of JPMorgan Chase & Company. In accordance with the six-monthShare Lending Agreement, the Company loaned 3.8 million shares of common stock (the “Borrowed Shares”) to the Borrower for a period beginning oncommencing February 15, 2013, if the trading price of a Note for each of the five trading days11, 2008 and ending on the third trading day immediately preceding the first day of the relevant six-month period equals 120% or more of the principal amount of the Note. The amount of contingent interest payable per Note with respect to any such period will be equal to 0.50% per annum of the average trading price of such Note for the five trading days referred to above.The Notes mature on February 15, 2028. OnThe Company may terminate the Share Lending Agreement earlier, upon written notice to the Borrower, if the principal balance of the 2008 Notes has been paid or upon agreement with the Borrower. The
FLOTEK INDUSTRIES, INC.
NOTES TO THE CONSOLIDATED FINANCIAL STATEMENTS
Borrower is permitted to use the Borrowed Shares only for the purpose of directly or indirectly facilitating the sale of the 2008 Notes and for the establishment of hedge positions by holders of the 2008 Notes. The Company did not require collateral to mitigate any inherent or associated risk of the Share Lending Agreement.
Borrowed Shares are subject to adjustments for stock dividends, stock splits or reverse stock splits. The Company did not receive any proceeds for the Borrowed Shares, but did receive a nominal loan fee of $0.0001 for each share loaned. The Borrower retains all proceeds from sales of Borrowed Shares pursuant to the Share Lending Agreement. Upon conversion of the 2008 Notes, the number of Borrowed Shares proportionate to the conversion rate for the notes must be returned to the Company. Any borrowed shares returned to the Company cannot be re-borrowed.
The Borrowed Shares are issued and outstanding for corporate law purposes. Accordingly, holders of Borrowed Shares possess all of the rights of a holder of the Company’s outstanding shares, including the right to vote the shares on all matters submitted to a vote of stockholders and the right to receive any dividends or other distributions declared or paid on outstanding shares of common stock. Under the Share Lending Agreement, the Borrower has agreed to pay to the Company, within one business day after a payment date, an amount equal to any cash dividends that the Company paid on the Borrowed Shares, and to pay or deliver to the Company, upon termination of the loan of Borrowed Shares, any other distribution, in liquidation or otherwise, that the Company made on the Borrowed Shares.
To the extent the Borrowed Shares loaned under the Share Lending Agreement are not sold or returned to the Company, the Borrower has agreed to not vote any borrowed shares of which the Borrower is the owner of record. The Borrower has also agreed, under the Share Lending Agreement, to not transfer or dispose of any borrowed shares, other than to Borrower’s affiliates, unless such transfer or disposition is pursuant to a registration statement that is effective under the Securities Act. Investors that purchase shares from the Borrower, and all subsequent transferees of such purchasers, will be entitled to the same voting rights, with respect to owned shares, as any other holder of common stock.
During June 2012 and November 2011, the Borrower returned 659,340 shares and 701,102 shares, respectively, of the Company’s borrowed common stock. At December 31, 2012, 2,439,558 Borrowed Shares remain outstanding.
The Company valued the share lending arrangement at $0.5 million at the date of issuance. The corresponding fair value was recognized as a debt issuance cost and is being amortized to interest expense through the earliest put date of the related debt, February 15, 2013,2013. The Company estimates the Company may redeem for cash all or a portionunamortized value of the Notes at a redemption price of 100%share lending agreement approximates the fair value of the principal amountloaned shares outstanding at December 31, 2012. The fair value of similar common shares not subject to the Notes to be redeemed plus accrued and unpaid interest (including any contingent interest) to, but not including,share lending arrangement, based on the redemption date. Holders may require the Company to purchase all or a portion of their Notes on each of February 15, 2013, February 15, 2018, and February 15, 2023. In addition, if the Company experiences specific types of corporate transactions, holders may require the Company to purchase all or a portion of their Notes. Any repurchase of Notes pursuant to these provisions will be for cash at aclosing price equal to 100% of the principal amount of the Notes to be purchased plus accrued and unpaid interest (including any contingent interest) to, but not including, the purchase date.FLOTEK INDUSTRIES, INC. AND SUBSIDIARIES
NOTES TO CONSOLIDATED FINANCIAL STATEMENTS
The Notes are convertible into shares of the Company’s common stock at the option of the holder, subject to specified conditions. The conversion rate is 43.9560 shares per $1,000 principal amount of Notes (equal to a conversion price of approximately $22.75 per share), subject to adjustment. Upon conversion, the Company will deliver, at its option, either shares of common stock, or a combination of cash and shares of common stock.
Because the Notes may be settled in cash upon conversion, the Company has accounted for the liability and equity components of the Notes in a manner that reflects the Company’s nonconvertible debt borrowing rate. The Company assumed an 11.5% nonconvertible debt interest rate and an expected term of the debt of five years to determine the debt discount. The expected term of five years is based upon the time until a call/put option can be exercised on the Notes in February 2013. The effective tax rate assumed was 38.0%. At the date of issuance, the discount on the Notes was $27.8 million, with a related deferred tax liability of $10.6 million. The resulting discount on the Notes is being accreted over the period the convertible debt is expected to be outstanding as additional noncash interest expense. During the years ended
December 31, 2009 and 2008, noncash interest expense related to accretion of the discount2012, was $4.8$29.8 million and $3.6 million, respectively.. Repaid Term Loan
On March 31, 2010, the Company executed an exchange agreement with Whitebox Advisors, LLCAmended and a syndicate of lenders under the Company’s new senior secured credit facility. This will permit the exchange of up to $40 million of the Company’s Notes for the aggregate consideration of $36 million in new convertible senior secured notes and $2 million in shares of the Company’s common stock (see Note 19).SeniorRestated Credit Facility
On March 31, 2008, the Company entered into a credit agreement (the “Credit Agreement”) with Wells Fargo Bank, N.A. (“Wells Fargo”), as administrative agentAgreement for a syndicate of lenders, for a $65
$40.0 million senior credit facility term loan (the “Senior Credit Facility” or “Term Loan”). The facility includes a term loan facility of $40 million (the “Term Loan Facility”) and a revolving credit facility with a maximum availability of $25 million (the “Revolving Credit Facility”). Initial borrowing under this Credit Agreement refinanced substantially all borrowing under a similar credit agreement with Wells Fargo.The Term Loan Facility is limited to the initial advance,indebtedness had a maturity date of
November 1, 2012 and amounts repaid may not be re-borrowed. The maximum amountscheduled quarterly principal payments of credit available under the Revolving Credit Facility is equal to the lesser$1.0 million, with interest due quarterly based on an annualized interest rate of $25 million or the amount determined through a borrowing base calculation using eligible accounts receivable and eligible inventory, as12.5%, which decreased upon specified in the Credit Agreement.Borrowings under theprincipal balance reductions.
The Senior Credit Facility are guaranteed by theprovided for a commitment fee of $7.3 million. The Company and its domestic subsidiaries and are secured by substantially all present and future assetsallocated one-half of the Company and its subsidiaries. Outstanding balances undercommitment fee to the Term Loan Facility and one-half to the Revolving Credit Facility matureExchange Agreement described above. Commitment fees capitalized as deferred financing costs were amortized as additional interest expense over the periods the term loan and are due on March 31, 2011.Principal payments of $2 million are due quarterly under theconvertible debt were expected to remain outstanding.
The Term Loan Facility. In addition, mandatory prepayments are required annually beginning April 15, 2009, equal to 50%was repaid in June 2011. Upon repayment, the Company recognized a loss on extinguishment of debt of $2.1 million resulting from the write-off of unamortized deferred financing costs and unaccreted discount associated with the beneficial conversion option of the Company’s excess cash flow for the previous calendar year. The Company is further required to make certain mandatory prepayments under the Term Loan Facility upon the receipt of proceeds from any debt or equity issuances and upon certain asset sales. In addition, if the outstanding balance under the Term Loan Facility exceeds 75% of the appraised orderly liquidation value of the Company’s fixed assets at any time, the Company must reduce the Term Loan Facility by such excess amount.Interest accrues on amounts outstanding under the Senior Credit Facility at variable rates based on, at the Company’s election, the prime rate or LIBOR, plus an applicable margin specified in the Credit Agreement. At December 31, 2009, the Company had elected to apply the prime rate, plus the applicable margin, to certain portions of the outstanding balance and to apply LIBOR, plus the applicable margin, to other portions of the
FLOTEK INDUSTRIES, INC. AND SUBSIDIARIESdebt.
NOTES TO CONSOLIDATED FINANCIAL STATEMENTS
outstanding balance. The weighted average interest rate on borrowings outstanding under the Senior Credit Facility at December 31, 2009 and 2008 was 8.46% and 5.14%, respectively. In accordance with terms of the Credit Agreement, the Company is required to enter into an interest rate swap to fix the interest rate on a minimum of 50% of borrowings under the Term Loan Facility (see Note 10).
Borrowings under the Senior Credit Facility are subject to certain covenants and a material adverse change subjective acceleration clause. Affirmative covenants include compliance with laws, various reporting requirements, visitation rights, maintenance of insurance, maintenance of properties, keeping of records and books of account, preservation of assets, notification of adverse events, ERISA compliance, agreements with new subsidiaries, borrowing base audits and use of treasury management services. Negative covenants include limitations associated with liens, indebtedness, change in nature of business, transactions with affiliates, investments, dividends and distributions, subordinate debt, leverage ratio, fixed charge coverage ratio, consolidated net income, asset sales and capital expenditures.
The Credit Agreement contains certain financial and other covenants, including a minimum net worth covenant, a maximum leverage ratio covenant, a minimum fixed charge coverage ratio covenant, a maximum senior leverage ratio covenant, a covenant restricting capital expenditures, a covenant limiting the incurrence of additional indebtedness, and a covenant restricting acquisitions.
During 2009, the Company amended the Credit Agreement on four occasions, to provide, among other things, a decrease in the aggregate revolving commitment, an increase in the interest margin applicable to borrowings, and changes in financial covenants related to minimum net worth, the leverage ratio, the fixed charge coverage ratio, and maximum annual capital expenditures. At December 31, 2009, certain specific financial requirements and ratios are as follows:
| | |
Aggregate revolving credit limit
| | $15 million, but limited to $14.5 million (subject to change) |
| |
Interest rate margin
| | 6.5% (above the prime rate or LIBOR) |
| |
Minimum net worth, as defined
| | $42.8 million |
| |
Leverage ratio, beginning June 30, 2010
| | 4.75 to 1.0, declining quarterly to 3.75 to 1.0 at December 31, 2010 |
| |
Fixed charge coverage ratio
| | 1.10 to 1.0, increasing to 1.25 to 1.0 at September 30, 2010 |
| |
Senior leverage ratio
| | Maximum of 2.0 to 1.0 |
| |
Maximum annual capital expenditures
| | $11 million for 2010 |
At December 31, 2009, the Company was not in compliance with the minimum net worth, fixed charge coverage ratio, and senior leverage ratio covenants of the Credit Agreement.
On March 31, 2010, the Company executed an amended and restated credit agreement with Whitebox Advisors, LLC for a $40 million term loan. Pursuant to this new agreement the Company’s existing Senior Credit Facility was renewed and extended, and the Company received cash proceeds of $6.1 million (see Note 19).
Other
In conjunction with the acquisition of a 50% interest in CAVO in January 2007, the Company issued a $1.5 million note payable to the seller. The note bore interest at 6% and was paid in full in December 2009.
FLOTEK INDUSTRIES, INC. AND SUBSIDIARIES
NOTES TO CONSOLIDATED FINANCIAL STATEMENTS
Capital Lease Obligations
The Company leases certain equipment and vehicles under capital leases. At December 31, 2009,2012, the Company had approximately $0.7$1.8 million in capitalized of capital lease obligations.
FLOTEK INDUSTRIES, INC.
NOTES TO THE CONSOLIDATED FINANCIAL STATEMENTS
Debt Maturities
Maturities of convertible notes and long-term debt obligations at December 31, 20092012 are as follows (in thousands): | | | | | | | | | | | | |
| | | Long-Term
Debt | | Capital
Leases | | Total Long-
Term Debt
and Capital
Leases | | Convertible
Senior Notes |
Year Ending December 31, | | | | | | | | |
2010 | | $ | 8,717 | | $ | 232 | | $ | 8,949 | | $ | — |
2011 | | | 23,163 | | | 205 | | | 23,368 | | | — |
2012 | | | — | | | 154 | | | 154 | | | — |
2013 | | | — | | | 64 | | | 64 | | | 115,000 |
2014 | | | — | | | 3 | | | 3 | | | — |
Thereafter | | | — | | | — | | | — | | | — |
| | | | | | | | | | | | |
Total | | $ | 31,880 | | $ | 658 | | $ | 32,538 | | $ | 115,000 |
| | | | | | | | | | | | |
|
| | | | | | | | | | | | | | | |
| Year ending December 31, | Term Loan | | Convertible Senior Notes | | Capital Leases | | Total Convertible Notes and Long-Term Debt |
| 2013 | $ | 3,274 |
| | $ | 5,188 |
| | $ | 1,055 |
| | $ | 9,517 |
|
| 2014 | 3,572 |
| | — |
| | 678 |
| | 4,250 |
|
| 2015 | 3,571 |
| | — |
| | 51 |
| | 3,622 |
|
| 2016 | 3,571 |
| | — |
| | — |
| | 3,571 |
|
| 2017 | 11,012 |
| | — |
| | — |
| | 11,012 |
|
| Total | $ | 25,000 |
| | $ | 5,188 |
| | $ | 1,784 |
| | $ | 31,972 |
|
Note
10—Interest Rate SwapAs required by its senior credit facility,10 — Fair Value Measurements
Fair value is defined as the Company has entered intoamount that would be received for selling an interest rate swap agreement onasset or paid to transfer a minimum of 50% ofliability in an orderly transaction between market participants at the term loan facility (see Note 9) to reduce its exposure to interest rate risk. At December 31, 2009, the interest rate swap had a notional amount of $21.0 million, swap rate of 2.79% and a fair value of $334,000.measurement date. The Company recordscategorizes financial assets and liabilities into the three levels of the fair value hierarchy. The hierarchy prioritizes the inputs to valuation techniques used to measure fair value and bases categorization within the hierarchy on the lowest level of input that is available and significant to the fair value measurement.
Level 1 — Quoted prices in active markets for identical assets or liabilities;
Level 2 — Observable inputs other than Level 1, such as quoted prices for similar assets or liabilities, quoted prices in markets that are not active, or other inputs that are observable or can be corroborated by observable market data for substantially the full term of the swap in accrued liabilitiesassets or liabilities; and the unrealized gain (loss) in other income (expense). For the years ended December 31, 2009 and 2008, the Company recognized a gain of $199,000 and a loss of $533,000, respectively,
Level 3 — Significant unobservable inputs that are supported by little or no market activity or that are based on the
interest rate swap. In March 2010,reporting entity’s assumptions about the
Company terminated the interest rate swap.Note 11—inputs.
Liabilities Measured at Fair Value
of Financial InstrumentsThe following table presents fair value information regarding the Company’s liabilitieson a Recurring Basis
Liabilities required to be measured at fair value on a recurring basis,
asincluding identification of
December 31, 2009. The table also identifies the fair value hierarchy of the valuation techniques used by the Company to determine these fair values,
are as follows (in thousands):
| | | | | | | | | | | | |
| | | Fair Value Measurements as of December 31, 2009 Using |
| | | Quoted Prices
in Active
Markets for
Identical
Assets
(Level 1) | | Significant
Other
Observable
Inputs
(Level 2) | | Significant
Unobservable
Inputs
(Level 3) | | Total |
Interest rate swap(1) | | $ | — | | $ | 334 | | $ | — | | $ | 334 |
Common stock warrants(2) | | | — | | | — | | | 4,729 | | | 4,729 |
| | | | | | | | | | | | |
| | $ | — | | $ | 334 | | $ | 4,729 | | $ | 5,063 |
| | | | | | | | | | | | |
FLOTEK INDUSTRIES, INC. AND SUBSIDIARIES
NOTES TO CONSOLIDATED FINANCIAL STATEMENTS
| | | | | | | | | | | | |
| | | Fair Value Measurements as of December 31, 2008 Using |
| | | Quoted
Prices in
Active
Markets
for
Identical
Assets
(Level 1) | | Significant
Other
Observable
Inputs
(Level 2) | | Significant
Unobservable
Inputs (Level 3) | | Total |
Interest rate swap(1) | | $ | — | | $ | 533 | | $ | — | | $ | 533 |
|
| | | | | | | | | | | | | | | |
| | Fair Value Measurements Using |
| | Level 1 | | Level 2 | | Level 3 | | Total |
| At December 31, 2012: | | | | | | | |
| None | $ | — |
| | $ | — |
| | $ | — |
| | $ | — |
|
| At December 31, 2011: | | | | | | | |
| Common stock warrants (1) | $ | — |
| | $ | — |
| | $ | 16,622 |
| | $ | 16,622 |
|
| |
| (1) | See Note 10 for discussion of the interest rate swap. The swap valuation is obtained from a bank estimate using pricing models with market-based inputs.
|
(2) | See Note 14 for discussion of the warrants. The fair value of the common stock warrants iswas estimated using a Black-Scholes option pricing model.
See Note 13 for additional information regarding warrants. |
There were no significant transfers in or out of either Level 1 or Level 2 fair value measurements during the years ended December 31, 2012 and 2011. During the year ended December 31, 2012, $2.6 million of non-cash gains were recognized as fair value adjustments within Level 3 of the fair value measurement hierarchy. The change was driven by the change in the fair value of the exercisable and contingent warrants outstanding resulting primarily from a decrease in the Company's common share price to $9.53 at June 14, 2012 from $9.96 at December 31, 2011.
On June 14, 2012, provisions in the Company’s Exercisable and Contingent Warrant Certificates were amended to eliminate anti-dilution price adjustment provisions and remove cash settlement provisions of a change of control event. Upon amendment, the warrants met the requirements for classification as equity. All fluctuations in the fair value of the warrant liability prior to June 2012 were recognized as non-cash income or expense items within the statement of operations. The fair value accounting methodology for the warrant liability is no longer required following table presents the changescontractual amendment.
FLOTEK INDUSTRIES, INC.
NOTES TO THE CONSOLIDATED FINANCIAL STATEMENTS
During the years ended December 31, 2012 and 2011, there were no transfers in or out of the Level 3 hierarchy. Changes in Level 3 liabilities are as follows (in thousands):
|
| | | | | | | |
| | December 31, |
| | 2012 | | 2011 |
| Balance, beginning of year | $ | 16,622 |
| | $ | 26,193 |
|
| Fair value adjustments, net | (2,649 | ) | | (9,571 | ) |
| Reclassification to additional paid-in capital | (13,973 | ) | | — |
|
| Net transfers in/(out) | — |
| | — |
|
| Balance, end of year | $ | — |
| | $ | 16,622 |
|
Assets Measured at Fair Value on a Nonrecurring Basis
The Company’s non-financial assets, including property and equipment, goodwill and other intangible assets are measured at fair value on a recurringnon-recurring basis and are subject to fair value adjustment in certain circumstances. See Notes 6, 7 and 8 for discussion of non-financial assets and assessment of impairment.
During the years ended December 31, 2012 and 2011, the Company recorded no impairments. During the year ended December 31, 2009 (in thousands): | | | | |
| | | Warrant
Liability | |
Beginning balance at January 1, 2009 | | $ | — | |
Fair value of warrants upon issuance | | | 5,194 | |
Fair value adjustments | | | (465 | ) |
Net transfers in/(out) | | | — | |
| | | | |
Ending balance at December 31, 2009 | | $ | 4,729 | |
| | | | |
2010
, the Company recorded an impairment of $8.9 million relating to property and equipment held and used and $0.4 million relating to other intangible assets. Loss on impairment is reported in operating expenses. The fair value of impaired assets was measured using both Level 2 and Level 3 inputs. Fair Value of Other Financial Instruments
The carrying amounts of certain financial instruments, including cash and cash equivalents, accounts receivable, accounts payable and accrued expenses, approximate fair value due to the short-term nature of these accounts. The Company had no cash equivalents at December 31, 2012 or 2011.
The carrying value and estimated fair
value and carrying value of the Company’s
other financial instrumentsconvertible notes and long-term debt are as follows (in thousands):
| | | | | | | | | | | | |
| | | December 31, 2009 | | December 31, 2008 |
| | | Carrying Value | | Fair Value | | Carrying Value | | Fair Value |
Convertible Senior Notes(1) | | $ | 95,601 | | $ | 60,375 | | $ | 90,803 | | $ | 28,750 |
Senior Credit Facility | | | 31,880 | | | 31,880 | | | 37,098 | | | 37,098 |
Capital lease obligations | | | 658 | | | 628 | | | 882 | | | 845 |
Other | | | — | | | — | | | 515 | | | 515 |
|
| | | | | | | | | | | | | | | |
| | December 31, |
| | 2012 | | 2011 |
| Carrying Value | | Fair Value | | Carrying Value | | Fair Value |
2008 Notes (1) | $ | 5,133 |
| | $ | 5,163 |
| | $ | 65,604 |
| | $ | 69,880 |
|
2010 Notes (1) | — |
| | — |
| | 34,134 |
| | 37,561 |
|
| 2012 Term Loan | 25,000 |
| | 25,000 |
| | — |
| | — |
|
| Capital lease obligations | 1,784 |
| | 1,736 |
| | 1,642 |
| | 1,611 |
|
| |
| (1) | The Convertible Senior Note carrying value of the 2008 and 2010 Notes represents the bifurcateddiscounted debt component only, while the fair value of the Notes is based on quotedthe market prices forvalue of the convertible note, which includes therespective notes, including convertible equity features. |
In 2009, the Company determined the
The estimated fair value of the
Convertible Senior2008 Notes
is based
on theupon quoted market
price of the notes. In 2008, the Company determined theprices. The estimated fair value of the
Convertible Senior2010 Notes
by usingwas based upon rates available
market information and commonly accepted valuation methodologies. The carrying value of the Senior Credit Facility approximates fair value because interest rates are variable, and accordingly, the carrying value approximates current market value for instruments with similar risks and maturities.
FairThe carrying value of the
2012 Term Loan approximates its fair value because the interest rate is variable. The fair value of capital
leases was determinedlease obligations is based on recent lease rates adjusted for a risk premium.
At December 31, 2008, theThe estimated fair value of the
other note approximated carrying value due its short-term maturity. At December 31, 2009 and 2008, the fair value of all other receivables and liabilities approximated their carrying values due to the short-term nature of these instruments. The Company had no cash equivalents at December 31, 2009 and 2008.The Company’s non-financial assets, including goodwill, other intangible assets and property and equipment are2010 Notes is measured at fair value on a nonrecurring basis and are subject to fair value adjustments in certain circumstances (e.g., when there is evidence of impairment). Fair value measurements and adjustments to goodwill and other intangible assets are discussed in using Level 2 inputs.
Note
7 and Note 8, respectively.FLOTEK INDUSTRIES, INC. AND SUBSIDIARIES
NOTES TO CONSOLIDATED FINANCIAL STATEMENTS
Note 12—11 — Earnings (Loss) Per Share
Basic earnings (loss) per common share is
computedcalculated by dividing net income (loss) attributable to common stockholders by the weighted average number of common shares outstanding for the period. Diluted earnings (loss) per common share is
computedcalculated by dividing net income (loss) attributable to common stockholders,
adjusted for the effect of assumed conversions of convertible notes and preferred stock, by the weighted average number of common shares outstanding
and potentiallycombined with dilutive common
equivalent sharesshare equivalents outstanding, if the effect is dilutive.
Because of theAs net
losslosses were realized during the
yearsyear ended December 31,
2009 and 2008,2010, potentially dilutive securities were excluded from the
calculation of diluted earnings per share
since including themcalculation as inclusion would have an anti-dilutive effect on net loss per share.
FLOTEK INDUSTRIES, INC.
NOTES TO THE CONSOLIDATED FINANCIAL STATEMENTS
In connection with the sale of the 5.25% convertible senior notes in February 2008 Notes, the Company entered into a share lending agreementShare Lending Agreement for 3,800,0003.8 million shares of itsthe Company’s common stock (see Note 15)9 – Share Lending Agreement). Contractual undertakings of the borrowerBorrower have the effect of substantially eliminating the economic dilution that otherwise would result from the issuance of the borrowed shares,Borrowed Shares, and all shares outstanding under the share lending agreementShare Lending Agreement are requiredcontractually obligated to be returned to the Company in the future.Company. As a result, the 3,800,000 shares of the Company’s stock lentloaned under the share lending agreementShare Lending Agreement are not considered to be outstanding for the purpose of computing and reporting earnings or loss per share.The computational components
Securities convertible into shares of basiccommon stock that were not considered in calculating earnings (loss) per common share, as inclusion would be anti-dilutive, are as follows (in thousands):
|
| | | | | | | | |
| | December 31, |
| | 2012 | | 2011 | | 2010 |
| Stock options under long-term incentive plans | — |
| | — |
| | 1,605 |
|
| Stock warrants related to sale of preferred stock | — |
| | — |
| | 5,853 |
|
| Convertible senior notes (if converted) | — |
| | 4,681 |
| | 4,879 |
|
| Convertible preferred stock (if converted) | — |
| | — |
| | 4,872 |
|
| | — |
| | 4,681 |
| | 17,209 |
|
At December 31, 2012 and 2011, approximately 0.1 million stock options and 1.1 million stock options, respectively, with an exercise price in excess of the average market price of the Company’s common stock were also excluded from the calculation of diluted earnings per share.
Basic and diluted earnings (loss) per common share are as follows (in
thousands)thousands, except per share data):
| | | | | | |
| | | Years Ended December 31, |
| | | 2009 | | 2008 | | 2007 |
Weighted average common shares used in computing basic earnings (loss) per common share | | 19,595 | | 19,157 | | 18,338 |
Incremental common shares from stock options and warrants | | — | | — | | 620 |
| | | | | | |
Weighted average common shares used in computing diluted earnings (loss) per common share | | 19,595 | | 19,157 | | 18,958 |
| | | | | | |
Securities convertible into shares
|
| | | | | | | | | | | |
| | Year ended December 31, |
| | 2012 | | 2011 | | 2010 |
| Net income (loss) attributable to common stockholders - Basic | $ | 49,791 |
| | $ | 26,540 |
| | $ | (50,008 | ) |
| Impact of assumed conversions: | | | | | |
| Interest on convertible notes | 1,959 |
| | — |
| | — |
|
| Dividends on preferred stock | — |
| | 141 |
| | — |
|
| Net income (loss) attributable to common stockholders - Diluted | $ | 51,750 |
| | $ | 26,681 |
| | $ | (50,008 | ) |
| | | | | | |
| Weighted average common shares outstanding - Basic | 48,185 |
| | 44,229 |
| | 25,731 |
|
| Assumed conversions: | | | | | |
| Incremental common shares from warrants | 1,560 |
| | 2,222 |
| | — |
|
| Incremental common shares from stock options | 992 |
| | 747 |
| | — |
|
| Incremental common shares from convertible preferred stock before conversion | — |
| | 440 |
| | — |
|
| Incremental common shares from restricted stock units | 116 |
| | — |
| | — |
|
| Incremental common shares from convertible senior notes | 2,701 |
| | — |
| | — |
|
| Weighted average common shares outstanding - Diluted | 53,554 |
| | 47,638 |
| | 25,731 |
|
| | | | | | |
| Basic earnings (loss) per common share | $ | 1.03 |
| | $ | 0.60 |
| | $ | (1.94 | ) |
| Diluted earnings (loss) per common share | $ | 0.97 |
| | $ | 0.56 |
| | $ | (1.94 | ) |
FLOTEK INDUSTRIES, INC.
NOTES TO THE CONSOLIDATED FINANCIAL STATEMENTS
Note 12 — Income Taxes
Components of the
effect would be anti-dilutive for 2009 and 2008,income tax (benefit) expense are as follows (in thousands):
| | | | |
| | | 2009 | | 2008 |
Stock options under long-term incentive plans | | 1,605 | | 857 |
Stock warrants | | 10,480 | | — |
Convertible senior notes (if-converted) | | 5,055 | | 5,055 |
Convertible preferred stock (if-converted) | | 6,957 | | — |
| | | | |
| | 24,097 | | 5,912 |
| | | | |
Note 13—Income Taxes
Significant components of the provision (benefit) for income taxes are as follows (in thousands):
| | | | | | | | | | |
| | | Years Ended December 31, |
| | | 2009 | | | 2008 | | 2007 |
Current: | | | | | | | | | | |
Federal | | $ | (9,196 | ) | | $ | 8,681 | | $ | 9,718 |
State | | | 273 | | | | 1,254 | | | 1,525 |
Foreign | | | 439 | | | | 447 | | | 272 |
| | | | | | | | | | |
Total current | | | (8,484 | ) | | | 10,382 | | | 11,515 |
| | | | | | | | | | |
FLOTEK INDUSTRIES, INC. AND SUBSIDIARIES
NOTES TO CONSOLIDATED FINANCIAL STATEMENTS
| | | | | | | | | | | |
| | | Years Ended December 31, | |
| | | 2009 | | 2008 | | | 2007 | |
Deferred: | | | | | | | | | | | |
Federal | | | 10,474 | | | (20,287 | ) | | | (1,091 | ) |
State | | | 26 | | | (594 | ) | | | (10 | ) |
| | | | | | | | | | | |
Total deferred | | | 10,500 | | | (20,881 | ) | | | (1,101 | ) |
| | | | | | | | | | | |
Provision (benefit) for income taxes | | $ | 2,016 | | $ | (10,499 | ) | | $ | 10,414 | |
| | | | | | | | | | | |
|
| | | | | | | | | | | |
| | Year ended December 31, |
| | 2012 | | 2011 | | 2010 |
| Current: | | | | | |
| Federal | $ | 12,072 |
| | $ | 4,550 |
| | $ | (2,729 | ) |
| State | 1,450 |
| | 1,211 |
| | 137 |
|
| Foreign | 891 |
| | 883 |
| | 658 |
|
| Total current | 14,413 |
| | 6,644 |
| | (1,934 | ) |
| Deferred: | | | | | |
| Federal | (18,836 | ) | | 1,107 |
| | (3,499 | ) |
| State | 90 |
| | 111 |
| | (112 | ) |
| Total deferred | (18,746 | ) | | 1,218 |
| | (3,611 | ) |
| Income tax (benefit) expense | $ | (4,333 | ) | | $ | 7,862 |
| | $ | (5,545 | ) |
A reconciliation of the
actualeffective tax rate to the
U.S. federal statutory
U.S. tax rate is as
follows (in thousands): | | | | | | | | | |
| | | Years Ended December 31, | |
| | | 2009 | | | 2008 | | | 2007 | |
Federal statutory rate | | 35.0 | % | | 35.0 | % | | 35.0 | % |
State income taxes, net of federal benefit | | 0.9 | | | (0.8 | ) | | 3.2 | |
Change in valuation allowance | | (38.6 | ) | | — | | | — | |
Goodwill impairment | | — | | | (11.6 | ) | | — | |
Other | | (1.5 | ) | | 0.9 | | | 0.2 | |
| | | | | | | | | |
Effective income tax rate | | (4.2 | )% | | 23.5 | % | | 38.4 | % |
| | | | | | | | | |
follows:
|
| | | | | | | | |
| | Year ended December 31, |
| | 2012 | | 2011 | | 2010 |
| Federal statutory tax rate | 35.0 | % | | 35.0 | % | | 35.0 | % |
| State income taxes, net of federal benefit | 2.3 |
| | 2.3 |
| | 0.1 |
|
| Change in valuation allowance | (41.0 | ) | | (8.5 | ) | | (8.4 | ) |
| Warrant liability fair value adjustment | (2.0 | ) | | (8.5 | ) | | (15.3 | ) |
| Other | (3.8 | ) | | (0.3 | ) | | (0.1 | ) |
| Effective income tax rate | (9.5 | )% | | 20.0 | % | | 11.3 | % |
FLOTEK INDUSTRIES, INC.
NOTES TO THE CONSOLIDATED FINANCIAL STATEMENTS
Deferred income taxes reflect the
net tax
effectseffect of temporary differences between the carrying
amountsvalue of assets and liabilities for financial reporting purposes and the
amountsvalue reported for income tax purposes, at the enacted tax rates
expected to be in effect when the differences reverse. The components of deferred tax assets and liabilities are as follows (in thousands):
| | | | | | | | |
| | | December 31, | |
| | | 2009 | | | 2008 | |
Deferred tax assets: | | | | | | | | |
Net operating loss carryforwards | | $ | 11,994 | | | $ | 6,783 | |
Allowance for doubtful accounts | | | 213 | | | | 533 | |
Inventory | | | 578 | | | | 707 | |
Equity compensation | | | 881 | | | | 170 | |
Goodwill and other intangible assets | | | 19,820 | | | | 15,055 | |
Other | | | 404 | | | | 331 | |
| | | | | | | | |
Total gross deferred tax assets | | | 33,890 | | | | 23,579 | |
Valuation allowance | | | (18,784 | ) | | | — | |
| | | | | | | | |
Total deferred tax assets, net | | | 15,106 | | | | 23,579 | |
| | | | | | | | |
Deferred tax liabilities: | | | | | | | | |
Property and equipment | | | (7,420 | ) | | | (6,696 | ) |
Convertible debt, net of discount | | | (10,021 | ) | | | (9,195 | ) |
Prepaid insurance and other | | | (106 | ) | | | (131 | ) |
| | | | | | | | |
Total gross deferred tax liabilities | | | (17,547 | ) | | | (16,022 | ) |
| | | | | | | | |
Net deferred tax assets (liabilities) | | $ | (2,441 | ) | | $ | 7,557 | |
| | | | | | | | |
|
| | | | | | | |
| | December 31, |
| | 2012 | | 2011 |
| Deferred tax assets: | | | |
| Net operating loss carryforwards | $ | 12,285 |
| | $ | 12,218 |
|
| Allowance for doubtful accounts | 262 |
| | 212 |
|
| Inventory valuation reserves | 1,109 |
| | 1,185 |
|
| Equity compensation | 4,216 |
| | 1,769 |
|
| Intangible assets and goodwill | 13,061 |
| | 15,228 |
|
| Foreign tax credit carryforwards | — |
| | 841 |
|
| Other | 2 |
| | 32 |
|
| Total gross deferred tax assets | 30,935 |
| | 31,485 |
|
| Valuation allowance | (835 | ) | | (19,460 | ) |
| Total deferred tax assets, net | 30,100 |
| | 12,025 |
|
| Deferred tax liabilities: | | | |
| Property and equipment | (8,227 | ) | | (5,327 | ) |
| Convertible debt | (4,785 | ) | | (8,559 | ) |
| Prepaid insurance and other | (520 | ) | | (78 | ) |
| Total gross deferred tax liabilities | (13,532 | ) | | (13,964 | ) |
| Net deferred tax assets (liabilities) | $ | 16,568 |
| | $ | (1,939 | ) |
Deferred taxes are presented in the balance sheets as follows (in thousands): |
| | | | | | | |
| | December 31, |
| | 2012 | | 2011 |
| Current deferred tax assets | $ | 1,274 |
| | $ | 841 |
|
| Non-current deferred tax assets | 16,045 |
| | — |
|
| Non-current deferred tax liabilities | (751 | ) | | (2,780 | ) |
| Net deferred tax assets (liabilities) | $ | 16,568 |
| | $ | (1,939 | ) |
As of December 31, 2009,2012, the Company had estimated U.S. net operating loss carryforwards of approximately $32.5$32.3 million, expiring in various amounts in 20212029 through 2029.2031. The ability to utilize net operating losses and other tax attributes could be subject to a significant limitation if the Company were to undergo an “ownership change” for purposes of Section 382 of the tax code.Tax Code.
FLOTEK INDUSTRIES, INC. AND SUBSIDIARIESNOTES TO CONSOLIDATED FINANCIAL STATEMENTS
The Company’s current corporate organizational structure requires it to file the filing of two separate consolidated U.S. Federal income tax returns. As a result, taxableTaxable income of one group ("Group A") cannot be offset by tax attributes, including net operating losses of the other group. As of December 31, 2009, one of the groups has a net operating loss carryforward and other net deferred tax assets of approximately $18.8 million.group ("Group B"). The Company consideredconsiders all available evidence, both positive and negative, to determine whether based on the weight of that evidence, a valuation allowance is necessary. The Company considers cumulative losses in recent years as significant negative evidence. The Company considers recent years to mean the current year plus the two preceding years.
Prior to December 31, 2012, the Company has not had sufficient positive evidence to overcome the existence of a cumulative loss in Group B and thus has, prior to December 31, 2012, maintained a full valuation allowance against deferred tax assets of that group. As of December 31, 2012, Group B was needed.no longer in a cumulative loss position. Accordingly, the Company considered the objectively verifiable positive evidence for projecting future income, which included primarily determining the average of the pre-tax income of the current and prior two years after adjusting for certain items not indicative of future performance. Based on this analysis, the Company determined a valuation allowance was no longer necessary for the group's U.S. federal deferred tax assets. Accordingly, the Company decreased its valuation allowance by $16.5 million at December 31, 2012 and recognized a reduction of deferred federal income tax expense. As Group B continues to be in a cumulative loss position as of December 31, 2012 for certain state jurisdictions, the Company has recordeddetermined that a valuation allowance of $18.8$0.8 million as management believes it is more likely than not that therequired for certain state deferred tax assets will not be realized. The other group incurred a net operating lossassets.
FLOTEK INDUSTRIES, INC.
NOTES TO THE CONSOLIDATED FINANCIAL STATEMENTS
The Company has not provided for withholding andcalculated U.S. taxes for theon unremitted earnings of certain non-U.S. subsidiaries because it intendsdue to permanentlythe Company’s intent to reinvest a portion of the unremitted earnings of itsthe non-U.S. subsidiaries in their foreign operations.subsidiaries. At December 31, 2009,2012, the Company had approximately $2.7$2.8 million in unremitted earnings outside the United States forU.S. which withholding and U.S. taxes were not provided. Incomeincluded for U.S. tax expensepurposes. U.S. income tax liability would be incurred if these funds were remitted to the United States.U.S. It is not practicable to estimate the amount of the deferred tax liability on such unremitted earnings. The Company has performed an evaluation and concluded that there are no significant uncertain tax positions requiring recognition in the Company’s financial statements. The evaluation was performed for the tax years which remain subject to examination by major tax jurisdictions as of December 31, 2009,2012 which are the years ended December 31, 20042007 through December 31, 2009. 2012 for U.S. federal taxes and the years ended December 31, 2008 through December 31, 2012 for state tax jurisdictions.
The Company’s policy is to record
interestpenalties and
penaltiesinterest related to income tax matters as income tax expense.
Accrued interest and penalties and the related expense were not material to the consolidated financial statements.Note
14—13 — Convertible Preferred Stock and Stock Warrants
On August 12, 2009, the Company sold 16,000 units (the “Units”), consisting of Series A cumulative convertible preferred stock and warrants for $1,000$1,000 per Unit, yielding aggregate gross proceeds of $16.0 million. Net proceeds from issuance of the Units were $14.8 million. The Company used the net proceeds from the sale of Units to reduce borrowings under the Company’s bank credit facility, thereby providing additional availability of credit, and for general corporate purposes.Unit. Each Unit was comprisedconsisted of one share of Series A cumulative convertible preferred stock (“Convertible Preferred Stock”), detachable warrants to purchase up to
155 shares of the Company’sCompany's common stock at an exercise price of $2.31$2.31 per share (“Exercisable Warrants”) and detachable contingent warrants to purchase up to 500 shares of the Company’sCompany's common stock at an exercise price of $2.45$2.45 per share (“Contingent Warrants”).Each share of Convertible Preferred Stock is convertible at the holder’s option, at any time, into 434.782 shares of the Company’s common stock. This conversion rate represents an equivalent conversion price of approximately $2.30 per share of common stock. The conversion rate is subject to adjustment in the event of stock splits, stock dividends and distributions, reorganizations and similar events affecting the common stock.
Each share of Convertible Preferred Stock has a liquidation preference of $1,000. Dividends accrue at the rate of 15% of the liquidation preference per year and accumulate if not paid quarterly. The Company may pay dividends, at its option, in cash, common stock (based on the market value of the common stock) or a combination thereof. At December 31, 2009, the Company had accrued and unpaid dividends on its preferred stock of $0.9 million.
FLOTEK INDUSTRIES, INC. AND SUBSIDIARIESNOTES TO CONSOLIDATED FINANCIAL STATEMENTS
The Company may, at its option after February 11, 2010, automatically convert the preferred shares into common shares if the closing price of the common stock is equal to or greater than 150% of the then current conversion price for any 15 trading days during any 30 consecutive trading day period. If the Convertible Preferred Stock automatically converts and the Company has not previously paid holders amounts equal to at least eight quarterly dividends on the Convertible Preferred Stock, the Company will also pay to the holders, in connection with any automatic conversion, an amount, in cash or shares of common stock, equal to eight quarterly dividends less any dividends previously paid to holders of the Convertible Preferred Stock.
The Company may redeem any of the Convertible Preferred Stock beginning on August 12, 2012. The initial redemption price will be 105% of the liquidation preference, declining to 102.5% on August 12, 2013, and to 100% on or after August 12, 2014, in each case plus accrued and unpaid dividends to the redemption date.
The Exercisable Warrants are immediately exercisable and will expire if not exercised by August 12, 2014. The Contingent Warrants became exercisable on November 9, 2009 and will expire if not exercised by November 9, 2014. Both the Exercisable Warrants and Contingent Warrants contain anti-dilution price protection in the event the Company issues shares of common stock or securities exercisable for or convertible into common stock at a price per share less than their exercise price. Due to the anti-dilution price adjustment provision in the warrant agreements, the warrants were not considered equity and were recorded at fair value as warrant liabilities when issued and will be adjusted to fair value through the statement of operations at the end of each reporting period over the life of the warrants. The Company uses the Black-Scholes option-pricing model to estimate the value of the warrant liabilities at the end of each reporting period.
The gross proceeds from the issuance of the Units were allocated, at the date of the transaction, based on the relative fair values ofupon the preferred stock and the warrants. In order to calculate thewarrants relative fair values, thevalues. The Company obtained third-party valuations to assist it in establishingquantifying the relative fair value of the Unit’s debt and equity components of the Units.components. The fair value of the warrants was determined usingwith the Black-Scholes option-pricing model usingassuming a five-yearfive-year term, a volatility rate of 54%, a risk-free rate of return of 2.7%, and an assumed dividend rate of zero.zero. The fair value of the preferred stock component was determined via separate valuationsbased upon a valuation of the beneficial conversion rightsright and the host contract. The fair value of the beneficial conversion rights were determinedright was estimated based onupon a Monte Carlo simulation of the Company’s possible future stock prices, which generated potential conversion outcomes.price to assess the likelihood of conversion. Due to a lack of comparable transactions by companies with similar credit ratings, the value of the host contract was determined by applying a risk-adjusted rate of return to the annual dividend. As ofAt the date of the transaction, the Company recorded approximately 68% of the proceeds or $10.8$10.8 million (net of the discount resulting fromrecognized upon the allocation of the proceeds to the detachable warrants) as preferred stock in stockholders’ equity andequity. The fair value of the detachable warrants with a fair value of $5.2was assessed at $5.2 million were and recorded as a warrant liability.
The Company determined that the embedded conversion option embedded within the preferred stock washad intrinsic value beneficial (had intrinsic value) to the holders of the preferred stock. The intrinsic value of the conversion option was determined to be $5.2$5.2 million and was recognizedrecorded as a beneficial conversion discount with an offset to additional paid-in capital at the date of the transaction.
The preferred stock conversion period for the preferred stock was estimated to be 36 months based onupon an evaluation of the conversion options. The accretion
Preferred Stock
Each share of Convertible Preferred Stock was convertible at any time, at the holder’s option, into 434.782 shares of the discountCompany’s common stock. This conversion rate represents an equivalent conversion price of approximately $2.30 per share of common stock.
Each share of Convertible Preferred Stock had a liquidation preference of $1,000. Dividends accrued at a rate of 15% of the liquidation preference per year and accumulated, if not paid quarterly. Subsequent to February 11, 2010, the Company had the ability to convert the preferred shares into common shares if the closing price of the common stock met certain price criteria. In the event any Convertible Preferred Stock was converted, the Company was obligated to pay an amount, in cash or common stock, equal to eight quarterly dividend payments less any dividends previously paid.
On January 6, 2011, the Company paid all accumulated and unpaid dividends on the outstanding shares of Convertible Preferred Stock in shares of the Company’s common stock. The payment, at an annual rate of 15% of the liquidation preference, covered the period from issuance, August 12, 2009, through December 31, 2010. Dividends per share of $208.33 were paid in shares of common stock valued at $4.81, based upon the prior ten business day volume-weighted average price per share. Fractional shares were paid in cash.
On February 4, 2011, the Company exercised its contractual right to mandatorily convert all outstanding shares of Convertible Preferred Stock into shares of common stock at the prevailing conversion rate of 434.782 shares of common stock for each share of preferred stock. The Company issued 4,871,719 shares of common stock for preferred share conversations during 2011, including those mandatorily converted. Holders of preferred shares subject to mandatory conversion were entitled to eight quarterly dividend payments. On February 4, 2011, dividends per share of $91.67 were paid in shares of common stock valued at $6.63, based upon the prior ten business day volume-weighted average price per share. Fractional shares were paid in cash.
FLOTEK INDUSTRIES, INC.
NOTES TO THE CONSOLIDATED FINANCIAL STATEMENTS
Stock Warrants
Exercisable Warrants were exercisable upon issuance and expire August 12, 2014, if not exercised. Contingent Warrants became exercisable on November 9, 2009, and expire November 9, 2014, if not exercised. Prior to June 14, 2012, the warrants contained anti-dilution price protection in the event the Company issued shares of common stock or securities exercisable for, or convertible into, common stock at a price per share less than the warrants' exercise price. In accordance with these contractual anti-dilution price adjustment provisions, the warrants were re-priced as a result of a payment of a portion of the initial and deferred commitment fees related to the Company's term loan with common stock on March 31, 2010 and September 30, 2010.
Due to the anti-dilution price adjustment provisions established at the issuance date, the warrants were deemed to be a liability and were recorded at fair value at the date of issuance. The warrant liability was adjusted to fair value at the end of each reporting period through the statement of operations during the year endedperiod the anti-dilution price adjustment provisions were in effect. On June 14, 2012, contractual provisions within the Company's Exercisable and Contingent Warrant agreements were modified to eliminate the anti-dilution price adjustment provisions of the warrants and remove the cash settlement provisions in the event of a change of control. The amended warrants now qualify to be classified as equity. Accordingly, the Company revalued the warrants as of June 14, 2012, the date of contractual amendment. The change in fair value of the warrant liability compared to the fair value on December 31, 20092011, $2.6 million, was $1.3 million.recognized in income during
2012. The change inrevalued warrant liability of $14.0 million was reclassified to additional-paid-in-capital on June 14, 2012. There will no longer be fair value adjustment as long as the warrants continue to meet the criteria for equity classification. The Company used the Black-Scholes option-pricing model to estimate the fair value of the warrants from issuance through December 31, 2009 has been recorded bywarrant liability for each reporting period. On June 14, 2012, the Company in its statement of operations. The fair value ofdate the warrants has been calculated at each period end using the Black-Scholes option-pricing model. At December 31, 2009,were amended, inputs forinto the fair value calculation included the actual remaining term of the warrants, a volatility rate of 55.8%58.1%, a risk-free rate of 2.7%return of 0.36%, and an assumed dividend rate of zero.zero. During March, 2010, holders of 2,780the years ended December 31, 2012 and 2011, warrants were exercised to purchase 348,350 shares of preferred stock elected conversion into 1,208,692and 3,960,747 shares, respectively, of the Company’s common stock (see for which the Company received cash proceeds of $0.4 million and $4.8 million, respectively. At December 31, 2012, Exercisable and Contingent Warrants to purchase up to 1,544,250 shares of common stock at $1.21 per share remain outstanding.
Note
19).14 — Common Stock
FLOTEK INDUSTRIES, INC. AND SUBSIDIARIESNOTES TO CONSOLIDATED FINANCIAL STATEMENTS
On March 31, 2010, the stock warrants were repriced because of their anti-dilution price protection as a result of share issuances in connection with the Company’s amended and restated credit agreement (see Note 19).
Note 15—Capital Stock
The Company’s Certificate of Incorporation, as amended November 9, 2009, authorizes the Company to issue up to 80,000,00080.0 million shares of common stock, par value $0.0001$0.0001 per share, and 100,000 shares of one or more series of preferred stock, par value $0.0001$0.0001 per share.
On July 11, 2007,
A reconciliation of the Company effected a two-for-onechanges in common stock split in the formshares issued is as follows:
|
| | | | | |
| | Year ended December 31, |
| | 2012 | | 2011 |
| Shares issued at the beginning of the year | 51,957,652 |
| | 36,753,891 |
|
| Issued in sale of common stock | — |
| | 3,665,000 |
|
| Issued upon conversion of preferred stock | — |
| | 4,871,719 |
|
| Issued in payment of term loan principal | — |
| | 171,154 |
|
| Issued in exchange of convertible notes | — |
| | 559,007 |
|
| Issued upon exercise of warrants | 348,350 |
| | 3,960,747 |
|
| Issued as dividend payments on preferred stock | — |
| | 624,171 |
|
| Issued as restricted stock award grants | 750,476 |
| | 1,287,731 |
|
| Issued upon exercise of stock options | 67,500 |
| | 64,232 |
|
| Shares issued at the end of the year | 53,123,978 |
| | 51,957,652 |
|
FLOTEK INDUSTRIES, INC.
NOTES TO THE CONSOLIDATED FINANCIAL STATEMENTS
Stock-Based Incentive Plans
Stockholders approved Long Term Incentive Planslong term incentive plans in 2010, 2007, 2005 and 2003 (the “2010” Plan, the “2007 Plan,” the “2005 Plan” and the “2003 Plan,” respectively) under which the Company may grant equity awards to officers, key employees, and non-employee directors in the form of stock options, restricted stock and certain other incentive awards. TheAt December 31, 2012, the maximum number of shares that may be issued under the 2010 Plan, 2007 Plan, 2005 Plan and 2003 Plan are 2,200,000, 1,900,0006.0 million, 2.2 million, 1.9 million and 1,400,000,1.4 million, respectively. At December 31, 2009, theThe Company had 182,7901.2 million shares remaining to be granted under the 20072010 Plan and 121,2320.1 million shares remaining to be granted under both the 2007 and 2005 Plan. At Plans at December 31, 2009, options to purchase a total of 1,605,398 shares were outstanding under the Company’s Long Term Incentive Plans.2012
. All stock options have beenare granted with an exercise price equal to the market value of the Company’s common stock on the date of grant. Options currently expire no later than ten years from the date of grant date and generally vest overwithin four years or less. Proceeds received from exercises of stock optionsoption exercises are credited to common stock and additional paid-in capital.capital, as appropriate. The Company uses historical data to estimate pre-vesting option forfeitures and these estimatesforfeitures. Estimates are adjusted when actual forfeitures differ from the estimate. Stock-based compensation expense is recorded only for thoseall equity awards that are expected to vest. The fair value of
stock-based awards onstock options at the date of grant is
computedcalculated using the Black-Scholes option pricing model. The risk free interest rate is based on the implied yield of U.S. Treasury zero-coupon securities that correspond to the expected life of the option. Volatility
wasis estimated based on
the historical and implied volatilities of the Company’s stock and
a group of
identified companies considered
peers.to be representative peers of the Company. The expected life of awards granted represents the period of time
that theythe options are expected to
beremain outstanding. The Company uses the “simplified” method which is
allowedpermitted for
those companies that cannot reasonably estimate
the expected life of options based on
its historical share option exercise experience. The Company does not expect to pay dividends on
its common stock.
No options were granted to employees during 2012. Assumptions used in the Black-Scholes
option pricing model for stock options granted
werein 2011 and 2010 are as follows:
| | | | | | |
| | | Years Ended December 31, |
| | | 2009 | | 2008 | | 2007 |
Risk-free interest rate | | 1.29% - 2.32% | | 2.30% | | 4.06% - 4.82% |
Expected volatility of common stock | | 68.8% - 71.7% | | 47.0% | | 39.7% - 42.0% |
Expected life of options in years | | 3.5* and 4.25 | | 4.25 | | 3.5 and 5.0 |
Dividend yield | | 0.0% | | 0.0% | | 0.0% |
Vesting period in years | | 0.4 - 4.0 | | 4.0 | | 1.0 - 4.0 |
* | In 2009, a grant was made to an optionee for whom the Company was able to reasonably estimate the expected life of the award.
|
FLOTEK INDUSTRIES, INC. AND SUBSIDIARIES
NOTES TO CONSOLIDATED FINANCIAL STATEMENTS
|
| | | | | | |
| | Year ended December 31, |
| | | 2011 | | 2010 |
| Risk-free interest rate | | .94%-1.825% |
| | .55%-2.275% |
|
| Expected volatility of common stock | | 67.7%-70.3% |
| | 61.4%-69.3% |
|
| Expected life of options in years | | 3.50*-4.00 |
| | 3.34*-6.25 |
|
| Dividend yield | | — | % | | — | % |
| Vesting period in years | | 3.5-4.0 |
| | 3.4-6.3 |
|
*Grants were made to an optionee for whom the Company was able to reasonably estimate the expected life of the award.
The Black-Scholes option valuation model was developed
for estimatingto estimate the fair value of traded options that have no vesting restrictions and are fully-transferable. Because option valuation models require the use of subjective assumptions, changes in these assumptions can materially affect the fair value
of the options.calculation. The Company’s options
doare not
have the characteristicscharacteristic of traded
options, andoptions; therefore, the option valuation models do not necessarily provide a reliable measure of the fair value of options.
FLOTEK INDUSTRIES, INC.
NOTES TO THE CONSOLIDATED FINANCIAL STATEMENTS
A summary of stock option activity for the year ended December 31, 20092012 is as follows: | | | | | | | | | | | |
Options | | Shares | | | Weighted-
Average
Exercise
Price | | Weighted-Average
Remaining
Contractual Term
(in years) | | Aggregate
Intrinsic
Value |
Outstanding as of January 1, 2009 | | 857,251 | | | $ | 9.57 | | | | | |
Granted | | 1,240,132 | | | | 1.99 | | | | | |
Exercised | | (100,000 | ) | | | 0.30 | | | | | |
Forfeited and expired | | (391,985 | ) | | | 6.12 | | | | | |
| | | | | | | | | | | |
Outstanding as of December 31, 2009 | | 1,605,398 | | | $ | 5.13 | | 7.61 | | $ | 171,367 |
| | | | | | | | | | | |
Vested or expected to vest at December 31, 2009 | | 1,532,958 | | | $ | 5.19 | | 7.55 | | $ | 168,842 |
| | | | | | | | | | | |
Options exercisable as of December 31, 2009 | | 481,411 | | | $ | 8.36 | | 4.54 | | $ | 71,367 |
| | | | | | | | | | | |
|
| | | | | | | | | | | | | |
| Options | | Shares | | Weighted-Average Exercise Price | | Weighted-Average Remaining Contractual Term (in years) | | Aggregate Intrinsic Value |
| Outstanding as of January 1, 2012 | | 2,529,690 |
| | $ | 5.32 |
| | | | |
| Exercised | | (67,500 | ) | | 2.50 |
| | | | |
| Expired | | (4,604 | ) | | 13.81 |
| | | | |
| Outstanding as of | |
| | | | | | |
| December 31, 2012 | | 2,457,586 |
| | $ | 5.65 |
| | 7.14 | | $ | 16,673,502 |
|
| Vested or expected to vest at | | | | | | | | |
| December 31, 2012 | | 2,437,864 |
| | $ | 5.64 |
| | 7.14 | | $ | 16,571,402 |
|
| Options exercisable as of | | | | | | | | |
| December 31, 2012 | | 1,318,436 |
| | $ | 3.56 |
| | 6.58 | | $ | 11,728,379 |
|
The weighted-average grant-date fair value of stock options granted during the years ended December 31, 2009, 20082011 and 20072010 was $1.07, $4.37$8.47 and $7.21$2.06 per share, respectively. The total intrinsic value of stock options exercised during the years ended December 31, 2009, 20082012, 2011 and 20072010 was $0.1$0.6 million $9.0, $0.2 million and $12.3$0.1 million, respectively. The total fair value of stock options vestedvesting during the years ended December 31, 2009, 20082012, 2011 and 20072010 was $0.4$0.5 million $1.0, $0.5 million and $0.0$0.8 million, respectively. At December 31, 2009, there was $1.32012, the Company had $1.0 million of total measured but unrecognized compensation expense related to non-vested stock options. TheThis cost is expected to be recognized over a weighted-average period of 2.3 years. The tax benefit realized from stock options exercised during the year ended December 31, 2009 was not material.0.4 years. The Company grants employees either time-vesting restricted shares or performance-based restricted shares under itsin accordance with applicable terms underlying the Restricted Stock Agreements (“RSAs”). Time-vesting restricted shares vest after a stipulated period of time afterhas elapsed subsequent the date of grant, date, generally fourthree to fivefour years. Certain time-vested shares have also been issued with a portion of the grantshares granted vesting immediately at the date of grant.immediately. Performance-based restricted shares are issued with annual performance criteria defined over four-yeara designated performance periodsperiod and vest only when, and if, certain annual segment or Companythe outlined performance criteria areis met. Grantees of restricted shares retain voting rights for the granted shares. During the year ended December 31, 2009,2012, the Company awarded 894,006 RSAs750,476 restricted stock awards to certain employees under the 20072010 Plan. AllApproximately 74% of these RSAsawards were time-vesting. time-vesting and the remainder were performance-based.
A summary of restricted stock activity for the year ended December 31, 20092012 is as follows: | | | | | | |
Restricted Stock | | Shares | | | Weighted-Average
Grant-Date Fair
Value |
Non-vested at January 1, 2009 | | 233,498 | | | $ | 24.51 |
Granted | | 894,006 | | | | 1.18 |
Vested | | (515,701 | ) | | | 2.32 |
Forfeited | | (152,688 | ) | | | 5.72 |
| | | | | | |
Non-vested at December 31, 2009 | | 459,115 | | | $ | 10.26 |
| | | | | | |
|
| | | | | | | |
| Restricted Stock | | Shares | | Weighted- Average Fair Value - Date of Grant |
| Non-vested at January 1, 2012 | | 1,445,858 |
| | $ | 6.64 |
|
| Granted | | 750,476 |
| | 11.03 |
|
| Vested | | (842,730 | ) | | 6.51 |
|
| Forfeited | | (29,314 | ) | | 10.84 |
|
| Non-vested at December 31, 2012 | | 1,324,290 |
| | $ | 9.15 |
|
FLOTEK INDUSTRIES, INC. AND SUBSIDIARIESNOTES TO CONSOLIDATED FINANCIAL STATEMENTS
During the year ended December 31, 2009, the Company paid certain accrued bonuses through the issuance of 471,000 shares of restricted stock which were immediately vested.
The weighted-average grant-date fair value of shares of restricted stock granted during the years ended December 31, 2009, 20082012, 2011 and 20072010 was $1.18, $15.13$11.03, $8.79 and $26.22,$1.88 per share, respectively. The total fair value of restricted stock that vested during the years ended December 31, 2009, 20082012, 2011 and 20072010 was $1.2$5.4 million $2.2, $7.2 million, and zero,$4.2 million, respectively.
At December 31, 2009,2012, there was $4.0$7.5 million of unrecognized compensation expense related to non-vested restricted stock. The costunrecognized compensation expense is expected to be recognized over a weighted-average period of 2.5 years.1.8 years.
FLOTEK INDUSTRIES, INC.
NOTES TO THE CONSOLIDATED FINANCIAL STATEMENTS
Restricted Stock Units
During 2012, the Company granted performance-based restricted stock units that will be converted into 390,124 shares of restricted stock. The restricted stock vests in 2013 and 2014. At December 31, 2012, there was $1.2 million of unrecognized compensation expense related to non-vested restricted stock units. The unrecognized compensation expense is expected to be recognized over a weighted-average period of 1.0 years.
Employee Stock Purchase Plan
The Company's Employee Stock Purchase Plan (ESPP) was approved by stockholders on May 18, 2012. The Company registered 500,000 shares of its common stock, currently held as treasury shares, for issuance under the ESPP. The purpose of the ESPP is to provide employees with an opportunity to purchase shares of the Company's common stock through accumulated payroll deductions. The ESPP allows participants to purchase common stock at a purchase price equal to 85% of the fair market value of the common stock on the last business day of a three-month offering period which coincides with calendar quarters. The first quarterly offering period began on October 1, 2012. Payroll deductions may not exceed 10% of an employee's compensation and participants may not purchase more than 1,000 shares in any one offering period. The fair value of the discount associated with shares purchased under the plan is recognized as share-based compensation expense and was less than $0.1 million in 2012. The total fair value of the shares purchased under the plan during 2012 was $0.2 million. The employee cost associated with participation in the plan was satisfied through payroll deductions.
Share-Based Compensation Expense
Non-cash share-based compensation expense related to stock options, restricted stock and restricted stock unit grants was $1.7$13.4 million $2.5, $7.4 million and $1.7$4.7 million during the years ended December 31, 2009, 20082012, 2011 and 2007,2010, respectively.
Treasury Stock
During the year ended December 31, 2009, the Company purchased 34,890 shares of its common stock in payment of income tax withholding owed by employees upon vesting of restricted shares. Additionally, shares previously issued as restricted stock awards to employees were forfeited during 2009 and accounted for as treasury stock.
The Company accounts for treasury stock using the cost method and includes treasury stock as a component of stockholders’ equity.The During the years ended
December 31, 2012 and 2011, the Company currently does not have or intend to initiate a share repurchase program.purchased
Share Lending Agreement166,334Concurrent with the offering shares and 57,303 shares, respectively, of the 5.25% convertible senior notes in February 2008, the Company entered into a share lending agreement (the “Share Lending Agreement”) with Bear, Stearns International Limited (the “Borrower”). Under the Share Lending Agreement, the Company agreed to loan 3,800,000 shares ofCompany’s common stock (the “Borrowed Shares”)at market value as payment of income tax withholding owed by employees upon the vesting of restricted shares. Shares issued as restricted stock awards to employees that were forfeited have also been accounted for as treasury stock.
During the Borrower during a period beginning February 11, 2008years ended December 31, 2012 and ending on February 15, 2028. The Company may terminate the Share Lending Agreement earlier, upon written notice to the Borrower that the entire principal balance2011, JP Morgan Chase & Co. returned 659,340 shares and 701,102 shares, respectively, of the convertible notes ceases to be outstanding or upon agreement with the Borrower. The Borrower is permitted to use the Borrowed Shares only for the purpose of directly or indirectly facilitating the sale of the convertible senior notes and the establishment of hedge positions by holders of the convertible senior notes. The Company did not require collateral in support of the Share Lending Agreement.In February 2008, the BorrowerCompany’s common stock that had been borrowed all 3,800,000 shares available under the Share Lending Agreement. The number
In November 2012, the Company's Board of shares is subjectDirectors authorized the repurchase of up to certain adjustments for stock dividends, stock splits$25 million of the Company's common stock. Repurchases may be made in open market or reverse stock splits which change the number of shares of common stock outstanding. The Company did not receive any proceeds for the Borrowed Shares, butprivately negotiated transactions. Through December 31, 2012, the Company did receive a nominal loan feehas not repurchased any of $0.0001 for each share loaned to the Borrower. The Borrower received all proceeds from any sale of Borrowed Shares pursuant to the Share Lending Agreement. Upon conversion of the convertible senior notes, a number of Borrowed Shares proportional to the conversion rate for such notes must be returned to the Company. Any borrowed shares returned to the Company cannot be re-borrowed.The Borrowed Shares are issued and outstanding for corporate law purposes, and accordingly, the holders of the Borrowed Shares have all of the rights of a holder of the Company’s outstanding shares, including the right to vote the shares on all matters submitted to a vote of shareholders and the right to receive any dividends or other distributions that the Company may pay or make on its outstanding shares of common stock. However, under the Share Lending Agreement, the Borrower has agreed to pay to the Company, within one business day after the
FLOTEK INDUSTRIES, INC. AND SUBSIDIARIES
NOTES TO CONSOLIDATED FINANCIAL STATEMENTS
relevant payment date, an amount equal to any cash dividends that the Company pays on the Borrowed Shares, and to pay or deliver to the Company, upon termination of the loan of Borrowed Shares, any other distribution, in liquidation or otherwise, that the Company makes on the Borrowed Shares.
To the extent the Borrowed Shares lent under the Share Lending Agreement have not been sold or returned to the Company, the Borrower has agreed that it will not vote any such borrowed shares of which it is the record owner. The Borrower has also agreed under the Share Lending Agreement that it will not transfer or dispose of any borrowed shares, other than to its affiliates, unless such transfer or disposition is pursuant to a registration statement that is effective under the Securities Act. However, investors that purchase the shares from the Borrower (and any subsequent transferees of such purchasers) will be entitled to the same voting rights with respect to those shares as any other holder of common stock.
In May 2008, JP Morgan Chase & Co. completed its acquisition of The Bear Stearns Companies Inc., at which time the Borrower became an indirect, wholly-owned subsidiary of JPMorgan Chase & Company.
Contractual undertakings of the borrower have the effect of substantially eliminating the economic dilution that otherwise would result from the issuance of the borrowed shares, and all shares outstanding under the Share Lending Agreement are required to be returned to the Company in the future. As a result, the shares of the Company’s stock lent under the Share Lending Agreement are not considered to be outstanding for the purpose of computing and reporting earnings per share.
Note
16—15 — Commitments and Contingencies
Class Action
Litigation
On August 7, 2009, a class action suit was commenced in the United States District Court for the Southern District of Texas on behalf of purchasers of the common stock of the Company between May 8, 2007 and January 23, 2008, inclusive, seeking to pursue remedies under the Securities Exchange Act of 1934. The complaint alleges that, throughout the time period indicated, the Company failed to disclose material adverse facts about its true financial condition, business and prospects. Specifically, the complaint alleges that as a result of the failure to disclose the adverse facts, the Company’s positive statements concerning guidance and prospects were lacking in a reasonable basis at all relevant times. The plaintiffs filed an amended complaint on February 4, 2010 alleging misleading statements and material omissions in connection with the Company’s earnings guidance for 2007 and the fourth quarter of 2007. The amended complaint does not quantify the alleged actual damages.
Since August 7, 2009, several other class action suits have been commenced by others concerning the foregoing matters.
The Company intends to mount a vigorous defense to these claims. Discovery has not yet commenced. At this time, the Company is unable to reasonably estimate the outcome of this litigation.
Other Litigation
The Company is subject to routine litigation and other claims that arise in the normal course of business. Management is not aware of any pending or threatened lawsuits or proceedings
which wouldthat are expected to have a material effect on the Company’s financial position, results of operations or liquidity.
Representation Agreements
In February 2011, the Company entered into two separate representation agreements with Basin Supply Corporation (“Basin Supply”), a multinational, energy industry-focused supply chain management company, to market certain of the Company’s specialty chemicals and downhole drilling products and services within various international markets, including the Middle East, Africa, Latin America and the former Soviet Union. Both agreements are effective through December 31, 2015 and each provided for a non-refundable retainer of $100,000 which was paid to Basin Supply in 2011 to assist with start-up and overhead costs. Under each agreement, Basin Supply is also eligible to receive warrants to purchase Flotek common stock upon exceeding contractually defined annual base and “stretch” sales targets. The number of warrants that could be issued under the terms of each of the agreements is 100,000 per year during 2013 and 2014.
FLOTEK INDUSTRIES, INC.
AND SUBSIDIARIESNOTES TO
THE CONSOLIDATED FINANCIAL STATEMENTS
Common Stock Listing on the New York Stock Exchange
The Company’s common stock is listed on the New York Stock Exchange (NYSE). Under the NYSE’s continued listing standards, a company is considered to be below compliance standards if, among other things, both its average global market capitalization is less than $50 million over a 30 trading-day period and its stockholders’ equity is less than $50 million. The Company failed to meet this compliance standard during the fourth quarter of 2009, and it was notified by the NYSE on December 28, 2009 that it had fallen below one of the continued listing standards.
In March 2010, the Company submitted a plan of action to the NYSE that outlines its plan to achieve compliance with the NYSE continued listing standards within the 18-month cure period which ends in June 2011. During implementation and execution of the plan of action, the Company’s common stock will continue to be listed on the NYSE, subject to the Company’s compliance with other NYSE continued listing requirements.
Operating Lease Commitments
The Company has entered into operating leases for office space, vehicles and equipment. Future minimum lease payments under operating leases at December 31, 20092012 are as follows (in thousands): | | | |
Year Ending December 31, | | |
2010 | | $ | 1,763 |
2011 | | | 1,487 |
2012 | | | 1,224 |
2013 | | | 452 |
2014 | | | 94 |
Thereafter | | | 1,430 |
| | | |
Total | | $ | 6,450 |
| | | |
Total rent
|
| | | |
| Year ending December 31, | Minimum Lease Payments |
| 2013 | $ | 1,596 |
|
| 2014 | 1,221 |
|
| 2015 | 1,107 |
|
| 2016 | 1,010 |
|
| 2017 | 857 |
|
| Thereafter | 4,147 |
|
| Total | $ | 9,938 |
|
| | |
Rent expense under operating leases totaled approximately $2.3$2.5 million $1.7, $2.2 million and $1.5$2.0 million during the years ended December 31, 2009, 20082012, 2011 and 2007,2010, respectively.
The Company maintains a 401(k) retirement plan for the benefit of eligible employees in the United States.U.S. All employees are eligible forto participate in the plan upon date of employment. As of January 1, 2008, the Company increased its match to 100% of each employee’s 401(k) contribution up to 4% of qualified compensation. In April 2009, the Company discontinued matching employee’s 401(k) contributions. The consolidated financial statements for the years ended December 31, 2009, 20082012 and 20072011 include compensation expense of approximately $322,000, $940,000$0.3 million and $89,000,$0.4 million, respectively, related to the Company’s 401(k) match.matching. During 2010, the Company had discontinued matching employee contributions to the 401(k) Plan. On January 1, 2011, the Company reinstated a Company match of
50% on employee 401(k) contributions of up to 4% of qualified compensation. Concentrations and Credit Risk
Financial instruments that potentially subject
The majority of the
Company to significant concentrations of credit risk consist of trade accounts receivable and cash. The Company does not generally require collateral in support of its trade receivables. Cash and cash equivalents are maintained at one major financial institution and the balances often exceed insurable amounts.FLOTEK INDUSTRIES, INC. AND SUBSIDIARIES
NOTES TO CONSOLIDATED FINANCIAL STATEMENTS
Essentially allCompany’s revenue is derived from the oil and gas industry. This concentration of customers in one industry increases credit and business risk, particularly given the volatility of activity levels in the industry. Customers include major integrated oil and natural gas companies, independent oil and natural gas companies, pressure pumping service companies and state-owned national oil companies. The Company’s top threeThis concentration of customers accounted for 22%, 26%in one industry increases credit and 25% of consolidated revenues for the years ended December 31, 2009, 2008 and 2007, respectively.
business risks.
Certain raw materials used by the
Chemical and LogisticsChemicals segment
in theto manufacture
of micro-emulsion chemical salesproprietary complex nanofluids™ (“CnF”) products are
availableobtainable from limited sources. Certain mud-motor inventory parts in the Drilling
Products segment and stock parts in the Artificial Lift segment are primarily sourced from China.
The Company is subject to significant concentrations of credit risk within trade accounts receivable as the Company does not generally require collateral as support for trade receivables. In addition, the majority of the Company’s cash is maintained at one major financial institution and balances often exceed insurable amounts.
Note 17—16 —Segment Information
Operating segments are defined as components of an enterprise aboutfor which separate financial information is available that is regularly evaluated regularly by the chief operating decision-makerdecision-makers in deciding how to allocate resources and in assessingassess performance.The operations of the Company has determined that there are categorized into
three reportable segments:The Chemicals and Logistics segment(“Chemicals”), Drilling Products (“Drilling”) and Artificial Lift.
Chemicals is made upcomprised of two business units. The specialty chemical business unitdivisions: Specialty Chemicals and Logistics. Specialty Chemicals designs, develops, manufactures, packages and sellsmarkets specialty chemicals used by oilfield service companies in oil and gas well drilling, cementing, stimulation, acidizing, drilling and production. The logistics business unitLogistics manages automated bulk material handling, loading facilities and blending capabilities for oilfield serviceservices companies.
The Drilling Products segment rents, inspects, manufactures and markets downhole drilling equipment for theused in energy, mining, water well and industrial drilling sectors.
activities.
FLOTEK INDUSTRIES, INC.
NOTES TO THE CONSOLIDATED FINANCIAL STATEMENTS
Artificial Lift segment manufacturesassembles and markets artificial lift equipment, which includesincluding the Petrovalve product line of beamrod pump components, electric submersible pumps, gas separators, valves and services tothat support natural gas, oil and coal bed methane production.production activities.
The Company evaluates performance based
on several factors,upon a variety of
which thecriteria. The primary financial measure is
business segment
income before taxes. Certainoperating income. Various functions, including certain sales and marketing activities and
corporate general and administrative
expenses,activities, are provided centrally
fromby the corporate office.
The costs of theseCosts associated with corporate office functions,
together with other
corporate income and expense
items, and income tax
provision (benefit)provisions (benefits), are not allocated to
thesereportable segments.
The accounting policies of the business segments are the same as those described in “Note 2—Summary of Significant Accounting Policies.” Inter-segment sales are accounted for at fair value as if sales were to third parties. Intersegment revenues are not material.FLOTEK INDUSTRIES, INC. AND SUBSIDIARIES
NOTES TO CONSOLIDATED FINANCIAL STATEMENTS
Summarized financial information
concerningof the
reportable segments
is as
of and for the years ended December 31, 2009, 2008 and 2007 is shown in the following tablefollows (in thousands):
| | | | | | | | | | | | | | | | | | | |
| | | Chemicals
and
Logistics | | Drilling
Products | | | Artificial
Lift | | | Corporate
and
Other | | | Total | |
2009 | | | | | | | | | | | | | | | | | | | |
Net revenues from external customers | | $ | 49,296 | | $ | 50,774 | | | $ | 12,480 | | | $ | — | | | $ | 112,550 | |
Gross margin | | | 21,667 | | | 4,781 | | | | 2,936 | | | | — | | | | 29,384 | |
Income (loss) from operations | | | 12,964 | | | (32,084 | ) | | | 1,161 | | | | (15,144 | ) | | | (33,103 | ) |
Depreciation and amortization | | | 1,844 | | | 11,826 | | | | 292 | | | | 224 | | | | 14,186 | |
Total assets | | | 33,053 | | | 119,960 | | | | 7,084 | | | | 18,513 | | | | 178,610 | |
Capital expenditures | | | 291 | | | 6,189 | | | | 42 | | | | 33 | | | | 6,555 | |
| | | | | |
2008 | | | | | | | | | | | | | | | | | | | |
Net revenues from external customers | | $ | 109,356 | | $ | 98,262 | | | $ | 18,445 | | | $ | — | | | $ | 226,063 | |
Gross margin | | | 49,119 | | | 36,897 | | | | 4,740 | | | | — | | | | 90,756 | |
Income (loss) from operations | | | 37,433 | | | (43,840 | ) | | | (6,709 | ) | | | (17,635 | ) | | | (30,751 | ) |
Depreciation and amortization | | | 1,782 | | | 10,121 | | | | 633 | | | | 308 | | | | 12,844 | |
Total assets | | | 44,060 | | | 176,287 | | | | 16,104 | | | | (1,876 | ) | | | 234,575 | |
Capital expenditures | | | 2,464 | | | 19,840 | | | | 293 | | | | 1,114 | | | | 23,711 | |
| | | | | |
2007 | | | | | | | | | | | | | | | | | | | |
Net revenues from external customers | | $ | 86,271 | | $ | 56,836 | | | $ | 14,901 | | | $ | — | | | $ | 158,008 | |
Gross margin | | | 40,474 | | | 19,132 | | | | 3,841 | | | | — | | | | 63,447 | |
Income (loss) from operations | | | 32,389 | | | 5,632 | | | | 1,381 | | | | (9,716 | ) | | | 29,686 | |
Depreciation and amortization | | | 960 | | | 4,909 | | | | 557 | | | | 111 | | | | 6,537 | |
Total assets | | | 42,849 | | | 97,730 | | | | 17,827 | | | | 2,387 | | | | 160,793 | |
Capital expenditures | | | 6,313 | | | 8,532 | | | | 653 | | | | 174 | | | | 15,672 | |
One customer and its affiliates accounted for $18.7 million, $44.6 million and $32.8 million of consolidated revenue for the years ended December 31, 2009, 2008 and 2007, respectively. Over 90% of this revenue related to sales by the Chemicals and Logistics segment.
|
| | | | | | | | | | | | | | | | | | | |
| As of and for the Year ended December 31, | Chemicals and Logistics | | Drilling Products | | Artificial Lift | | Corporate and Other | | Total |
| | | | | | | | | | |
| 2012 | | | | | | | | | |
| Net revenue from external customers | $ | 183,986 |
| | $ | 116,736 |
| | $ | 12,106 |
| | $ | — |
| | $ | 312,828 |
|
| Gross margin | 81,438 |
| | 45,709 |
| | 4,472 |
| | — |
| | 131,619 |
|
| Income (loss) from operations | 65,440 |
| | 22,282 |
| | 3,395 |
| | (32,496 | ) | | 58,621 |
|
| Depreciation and amortization | 1,765 |
| | 9,115 |
| | 206 |
| | 497 |
| | 11,583 |
|
| Total assets | 59,195 |
| | 118,771 |
| | 11,189 |
| | 30,712 |
| | 219,867 |
|
| Capital expenditures | 3,553 |
| | 12,264 |
| | 77 |
| | 4,807 |
| | 20,701 |
|
| | | | | | | | | | |
| 2011 | | | | | | | | | |
| Net revenue from external customers | $ | 140,836 |
| | $ | 102,470 |
| | $ | 15,479 |
| | $ | — |
| | $ | 258,785 |
|
| Gross margin | 56,115 |
| | 43,607 |
| | 6,098 |
| | — |
| | 105,820 |
|
| Income (loss) from operations | 43,549 |
| | 23,035 |
| | 4,296 |
| | (21,992 | ) | | 48,888 |
|
| Depreciation and amortization | 1,594 |
| | 8,061 |
| | 196 |
| | 254 |
| | 10,105 |
|
| Total assets | 54,958 |
| | 113,130 |
| | 10,815 |
| | 53,109 |
| | 232,012 |
|
| Capital expenditures | 2,231 |
| | 6,025 |
| | 182 |
| | 1,546 |
| | 9,984 |
|
| | | | | | | | | | |
| 2010 | | | | | | | | | |
| Net revenue from external customers | $ | 66,121 |
| | $ | 65,782 |
| | $ | 15,079 |
| | $ | — |
| | $ | 146,982 |
|
| Gross margin | 29,249 |
| | 18,991 |
| | 4,730 |
| | — |
| | 52,970 |
|
| Income (loss) from operations | 19,833 |
| | (9,738 | ) | | 3,070 |
| | (19,432 | ) | | (6,267 | ) |
| Depreciation and amortization | 1,671 |
| | 11,445 |
| | 219 |
| | 433 |
| | 13,768 |
|
| Total assets | 44,102 |
| | 102,949 |
| | 9,062 |
| | 28,694 |
| | 184,807 |
|
| Capital expenditures | 1,227 |
| | 4,679 |
| | 32 |
| | 122 |
| | 6,060 |
|
Geographic Information
Revenue by country is
determined based on the location
ofwhere services
are provided and products
are sold.
No individual country other than the United States ("U.S.") accounted for more than 10% of revenue. Revenue by geographic location is as follows (in thousands):
| | | | | | | | | |
| | | Years Ended December 31, |
| | | 2009 | | 2008 | | 2007 |
United States | | $ | 97,737 | | $ | 208,228 | | $ | 150,433 |
Other countries | | | 14,813 | | | 17,835 | | | 7,575 |
| | | | | | | | | |
Total | | $ | 112,550 | | $ | 226,063 | | $ | 158,008 |
| | | | | | | | | |
|
| | | | | | | | | | | |
| | Year ended December 31, |
| | 2012 | | 2011 | | 2010 |
| U.S. | $ | 272,945 |
| | $ | 222,304 |
| | $ | 127,285 |
|
| Other countries | 39,883 |
| | 36,481 |
| | 19,697 |
|
| Total | $ | 312,828 |
| | $ | 258,785 |
| | $ | 146,982 |
|
Long-lived assets held in countries other than the U.S. are not
material.considered material to the consolidated financial statements.
FLOTEK INDUSTRIES, INC.
AND SUBSIDIARIESNOTES TO THE CONSOLIDATED FINANCIAL STATEMENTS
Major Customers
Revenue from major customers, as a percentage of consolidated revenue, is as follows:
|
| | | | | | | | |
| | Year ended December 31, |
| | 2012 |
| | 2011 |
| | 2010 |
|
| Customer A | 15.6 | % | | 13.1 | % | | 11.5 | % |
| Customer B | 10.0 | % | | * | | * |
| Customer C | * | | 10.8 | % | | * |
*These customers did not account for more than 10% of revenue.
Over 95% of the revenue from major customers noted above was for sales within the Chemicals segment.
Note
18—17—Quarterly Financial Data (Unaudited)
| | | | | | | | | | | | | | | | |
| | | First
Quarter | | | Second
Quarter | | | Third
Quarter | | | Fourth
Quarter | |
| | | | | | | | | (Restated) | | | (Restated) | |
| | | (in thousands, except per share data) | |
2009 | | | | | | | | | | | | | | | | |
Revenue | | $ | 40,676 | | | $ | 23,503 | | | $ | 23,818 | | | $ | 24,553 | |
Gross margin | | | 12,491 | | | | 3,647 | | | | 6,404 | | | | 6,842 | |
Net loss | | | (1,980 | ) | | | (19,793 | ) | | | (23,152 | ) | | | (5,315 | ) |
Loss per share: | | | | | | | | | | | | | | | | |
Basic | | | (0.10 | ) | | | (1.01 | ) | | | (1.22 | ) | | | (0.35 | ) |
Diluted | | | (0.10 | ) | | | (1.01 | ) | | | (1.22 | ) | | | (0.35 | ) |
2008 | | | | | | | | | | | | | | | | |
Revenue | | $ | 46,471 | | | $ | 56,809 | | | $ | 62,787 | | | $ | 59,996 | |
Gross margin | | | 18,821 | | | | 24,698 | | | | 26,675 | | | | 20,562 | |
Net income (loss) | | | 3,209 | | | | 4,439 | | | | 5,173 | | | | (46,982 | ) |
Earnings (loss) per share: | | | | | | | | | | | | | | | | |
Basic | | | 0.17 | | | | 0.23 | | | | 0.27 | | | | (2.45 | ) |
Diluted | | | 0.17 | | | | 0.23 | | | | 0.27 | | | | (2.45 | ) |
Note 19—Subsequent Events
New Credit Agreement with Whitebox Advisors, LLC
On March 31, 2010,
|
| | | | | | | | | | | | | | | | | | | |
| | First Quarter | | Second Quarter | | Third Quarter | | Fourth Quarter | | Total |
| | (in thousands, except per share data) |
| 2012 | | | | | | | | | |
| Revenue | $ | 79,195 |
| | $ | 78,303 |
| | $ | 78,628 |
| | $ | 76,702 |
| | $ | 312,828 |
|
| Gross margin | 33,451 |
| | 33,025 |
| | 33,843 |
| | 31,300 |
| | 131,619 |
|
| Net income | 3,606 |
| | 13,178 |
| | 9,806 |
| | 23,201 |
| | 49,791 |
|
| Earnings per share (1): | | | | | | | | | |
| Basic | $ | 0.08 |
| | $ | 0.27 |
| | $ | 0.20 |
| | $ | 0.48 |
| | $ | 1.03 |
|
| Diluted | $ | 0.07 |
| | $ | 0.25 |
| | $ | 0.19 |
| | $ | 0.44 |
| | $ | 0.97 |
|
| 2011 | | | | | | | | | |
| Revenue | $ | 52,905 |
| | $ | 55,918 |
| | $ | 75,058 |
| | $ | 74,904 |
| | $ | 258,785 |
|
| Gross margin | 21,145 |
| | 22,244 |
| | 30,717 |
| | 31,714 |
| | 105,820 |
|
| Net income | 10,374 |
| | 2,126 |
| | 17,917 |
| | 991 |
| | 31,408 |
|
| Earnings per share (1): | | | | | | | | | |
| Basic | $ | 0.15 |
| | $ | 0.05 |
| | $ | 0.38 |
| | $ | 0.02 |
| | $ | 0.60 |
|
| Diluted | $ | 0.13 |
| | $ | 0.04 |
| | $ | 0.35 |
| | $ | 0.02 |
| | $ | 0.56 |
|
(1) The sum of the
Company executed an Amendedquarterly earnings per share applicable to common stockholders (basic and
Restated Credit Agreement with Whitebox Advisors, LLC, as administrative agent for a syndicate of lenders, for a $40 million term loan. This new senior credit facility refinanced the Company’s existing senior credit facility at Wells Fargo Bank and provided net proceeds of $6.1 milliondiluted) may not agree to the
Company.The indebtedness underearnings per share for the new senior credit facility matures November 1, 2012 and has scheduled cash principal payments of $750,000 in 2010, $3,750,000 in 2011, $3,000,000 in 2012 with and the remaining unpaid principal balanceyear due at maturity. Interest is payable quarterly. The Company has the option to either pay the total amount of interest due in cash or to pay a portion of the interest in cash and capitalize the balance of the interest, thereby increasing the principal amount of the new senior credit facility. The annualized cash interest rate is 12.5% when the principal balance exceeds $30 million, 11.5% when the principal balance is $20 million or more but not in excess of $30 million, and 10.5% when the principal balance is less than $20 million. If the Company elects to capitalize a portion of the interest, the annualized cash interest rate is 8% and additional interest is capitalized and added to the principal amount of the new senior credit facility at a annualized rate of 6% when the principal balance exceeds $30 million, 4.5% when the principal balance is $20 million or more but not in excess of $30 million, and 3.5% when the principal balance is less than $20 million.
The Amended and Restated Credit Agreement requires additional mandatory principal payments of (a) 50% of EBITDA (earnings before interest, taxes depreciation and amortization) in excess of $4.5 million in any fiscal quarter, (b) 50% of cash proceeds in excess of $5 million and up to $15 million from certain asset disposals, plus 75% of cash proceeds in excess of $15 million from certain asset disposals, (c) 75% of any Federal income tax refunds, and (d) $1 million of principal on quarterly payment dates, when the Company’s stock price is equal to or greater than $1.27 per share, payable by issuing common stock (based on 95% of the volume-weighted average price of the common stock for the preceding ten trading days).
The Amended and Restated Credit Agreement provides for a commitment fee of $7,300,000, payable as follows: (a) $925,975 in cash at closing, (b) $4,374,025 through the issuance of 3,431,133 sharestiming of common stock at closing (based on 95%issuances.
Note 18—Subsequent Events
Termination of Share Lending Agreement
On January 22, 2013, the remaining 2,439,558 shares of the volume-weighted average price of theCompany's common stock held by J.P. Morgan Markets Limited under the Share Lending Agreement were returned to the Company. No consideration was paid by the Company. The Share Lending Agreement has been terminated.
Shares that had been loaned under the Share Lending Agreement were not considered outstanding for the
preceding ten tradingpurpose of computing and reporting earnings or loss per share.
Repurchase of Convertible Senior Notes
FLOTEK INDUSTRIES, INC. AND SUBSIDIARIESOn February 15, 2013, the Company repurchased the remaining NOTES TO CONSOLIDATED FINANCIAL STATEMENTS$5.2 million
days), (c) $1,000,000 payable in September 2010 in of outstanding 2008 Notes for cash equal to the original principal amount, plus accrued and unpaid interest. These 2008 notes were either tendered by the holder pursuant to the Company's tender offer or common stock (based on 90% of the greater of the volume-weighted average price of the common stock for the preceding ten trading days or $1.27 per share), and (d) $1,000,000 payable in March 2011 in cash or common stock (based on 85% of the greater of the volume-weighted average price of the common stock for the preceding ten trading days or $1.27 per share). The election as to whether the commitment fee for (c) and (d) is payable in cash or common stock is madewere redeemed by the Company if the volume-weighted average pricepursuant to provisions of the common stock is $1.00 or more per share and byindenture for the lenders if such average is less than $1.00 per share at the payment date.
The Amended and Restated Credit Agreement does not contain a revolving line of credit facility or quarterly and annual financial covenants. The credit agreement restricts the payment of dividends on the Company’s common stock without the prior written consent of the lenders.
Exchange Agreement for Convertible Senior Notes
On March 31, 2010,2008 Notes. Following this repurchase, the Company executed an Exchange Agreement with Whitebox Advisors, LLC and the syndicate of lenders under the Amended and Restated Credit Agreement related to the Company’s new senior credit facility. The Exchange Agreement permits each lender to exchange the Company’sno longer has any outstanding convertible senior notes (See Note 9) which they hold, up to the principal amountnotes.
Table of its participation in the new $40 million term loan, for new convertible senior secured notes and shares of the Company’s common stock.The current 5.25% convertible senior notes due 2028 were issued in February 2008 (the “2008 Notes”). Upon closing of the exchange, investors will receive, for each $1,000 principal amount of the 2008 Notes exchanged, (a) new 5.25% convertible senior secured notes due 2028 in a principal amount of $900 (the “2010 Notes”) and (b) $50 in shares of the Company’s common stock (based on the greater of 95% of the volume-weighted average price of the common stock for the preceding ten trading days or the closing price of the common stock on the day before the closing. The 2010 Notes have the same interest rate, conversion rights, conversion rate, Company redemption rights and guarantees as the 2008 Notes, except that in addition they are also secured by a second priority lien on substantially all of the Company’s assets.
The Company expects to exchange $40 million of convertible senior notes for the aggregate consideration of $36 million in new convertible senior secured notes and $2 million in shares of the Company’s common stock. The Company expects to issue up to 1,568,867 shares of common stock to satisfy the common stock component of the exchange.
Re-pricing of Stock Warrants
In connection with the Amended and Restated Credit Agreement related to the Company’s new senior credit facility, the stock warrants issued in August 2009 in connection with the issuance of Series A cumulative convertible preferred stock (see Note 14) have been re-priced, effective March 31, 2010. The exercisable warrants and the contingent warrants both contained anti-dilution price protection. As a result of this new pricing, the Company now has outstanding warrants to purchase up to 10,480,000 shares of the Company’s common stock at an exercise price of $1.27 per share.
Conversion of Preferred Stock
Each share of the Company’s cumulative convertible preferred stock is convertible at the holder’s option, at any time, into 434.782 shares of the Company’s common stock (see Note 14). In March 2010, holders of 2,780 shares of preferred stock elected conversion into 1,208,692 shares of the Company’s common stock. The conversions did not change the Company’s total stockholders’ equity, and the Company did not receive any proceeds from the conversions.
NYSE Continued Listing Requirements
On March 29, 2010, the NYSE agreed to accept the Company’s plan of action to the NYSE which the Company believes will allow it to achieve compliance with the minimum listing requirements of the NYSE no later than June 28, 2011.
Contents
Item 9. | Changes in and Disagreements With Accountants on Accounting and Financial Disclosure. |
None.
Item 9A(T). | Controls and Procedures. |
Conclusion Regarding the EffectivenessItem 9. Changes in and Disagreements With Accountants on Accounting and Financial Disclosure.
Not applicable.
Item 9A. Controls and Procedures.
Evaluation of Disclosure Controls and Procedures
We maintain
The Company's disclosure controls and procedures
that are designed to ensure that information required to be disclosed by the Company in reports filed or submitted under the Securities Exchange Act of 1934, as amended (the “Exchange Act”), is recorded, processed, summarized and reported within the time periods specified in the
SEC’sSEC's rules and forms.
OurThe Company's disclosure controls and procedures
include controls and proceduresare also designed to ensure
thatsuch information
required to be disclosed in the reports we file or submit under the Exchange Act is accumulated and communicated to management, including
ourthe principal executive and principal financial
officer,officers, as appropriate to allow timely decisions regarding required disclosures. There are inherent limitations to the effectiveness of any system of disclosure controls and procedures, including the possibility of human error and the circumvention or overriding of controls and procedures. Accordingly, even effective disclosure controls and procedures can only provide reasonable assurance
of achieving theirthat control
objectives. Ourobjectives are attained. The Company's disclosure controls and procedures are designed to provide such reasonable assurance.
Our
The Company's management, with the participation of
ourthe principal executive and principal financial
officer,officers, evaluated the effectiveness of the design and operation of
ourthe Company's disclosure controls and procedures as of December 31,
2009,2012, as required by Rule
13a-1513a-15(e) of the Exchange Act. Based
onupon that evaluation,
ourthe principal executive and principal financial
officerofficers have concluded that
ourthe Company's disclosure controls and procedures were not effective as of December 31,
2009 due to the2012, and have identified significant deficiencies described below that constitute material
weaknesses in internal control relating to the Company’s preparation of its financial statements.weaknesses.
Management’s
Annual Report on Internal Control
Overover Financial Reporting
Our
The Company's management is responsible for establishing and maintaining adequate internal control over financial reporting, as defined in
RulesRule 13a-15(f)
and 15d-15(f) underof the Exchange Act.
Our internal control over financial reporting is a process designed to provide reasonable assurance regarding the reliability of financial reporting and the preparation of our financial statements for external reporting purposes in accordance with generally accepted accounting principles. It should be noted, however, that because of inherent limitations, any system of internal controls, however well-designed and operated, can provide only reasonable, but not absolute, assurance that financial reporting objectives will be met. In addition, projections of any evaluation of effectiveness to future periods are subject to the risk that controls may become inadequate because of changes in conditions or that the degree of compliance with the policies or procedures may deteriorate.OurThe Company's management, including ourthe principal executive officer and principal financial officer,officers, assessed the effectiveness of internal control over financial reporting as of December 31, 2009,2012, based on criteria established in Internal Control—Integrated Framework issued by the Committee of Sponsoring Organizations of the Treadway Commission (COSO). As a result of that entitled “Internal Control-Integrated Framework.” Upon evaluation, our principal executive and principal financial officerthe Company's management identified the following control deficiencies that constituted material weaknessesregarding (a) segregation of duties relating to the new ERP system and development of system reports required to carry out the financial close process efficiently and effectively and (b) preparation of account reconciliations and analysis of variances from historical and expected results in connection with the preparation of our financial statementsmonthly close process. The deficiencies identified constitute material weaknesses in internal control as of December 31, 2009.
Control environment – We did not maintain an effective control environment. The control environment, which is the responsibility of senior management, sets the tone of the organization, influences the control consciousness of its people, and is the foundation for all other components of internal control over financial reporting. We did not maintain an effective control environment because of the following:
| a) | We did not maintain an appropriate level of senior management and Board level oversight related to financial reporting and internal controls due to turnover in these positions during the year.
|
| b) | We did not maintain a sufficient complement of personnel with an appropriate level of accounting knowledge, experience, and training in the application of GAAP consistent with our financial reporting requirements.
|
| c) | We did not maintain sufficient controls related to the monthly financial close process. These control deficiencies included:
|
inadequate analyses of variances in our statement of operations from expected and historical results;
the absence of an adequate journal entry review process by supervisory accounting personnel; and
excessive user access permissions within our accounting system.
Because of the material weaknesses described above,2012. Accordingly, management has concluded that ourthe Company's internal control over financial reporting was not effective in connection with the preparation of ourthe consolidated financial statements during the year endedas of December 31, 2009.
Remediation Plan
Our2012.
Since identifying the deficiencies related to the implementation of the ERP system, the Company has modified employee security roles to limit access within the system and has continued development and refinement of system reports.
The Company's management
under new leadership described below, has beenis actively
committed to and engaged in
planning for,the implementation and
implementationexecution of remediation efforts to
addressresolve the
material weaknesses, as well as other identified areas of risk. These remediation efforts, outlined below, are intended to address the identified material weaknesses and to
enhance our overall financial control environment.During the fourth quarterproactively manage any other areas of 2009, the Company restructured itsrisk that may be identified. The Company's executive management team in order to provide a better reporting and control environment. Responsibilities were reassigned and an emphasis was placed on maintaining a tone and control consciousness that consistently emphasizes adherence to accurate financial reporting and enforcement of policies and procedures.
The Company also appointed two new board members and appointed an existing board member to the audit committee, which successfully filled the vacancies left by previous board member resignations.
In December 2009, the Company hired a national executive services firm to perform an assessment of the Company’s finance and accounting structure. Based upon this assessment, a team of independent consultants was assembled to address the immediate needs identified. Their responsibilities include: (a) overseeing the preparation and filing of selected SEC documents, (b) reinforcing the tactical accounting needs of the Company, (c) identifying and researching reporting issues, (d) assisting with the preparation and modeling of future cash flow and financial forecasts, (e) advising senior management on any financial and accounting issues related to strategic projects, (f) performing an analysis of the month-end close process along with an assessment of the current skill sets of the accounting staff, and (g) recommending changes to the current accounting and finance organizational structure of the Company.
The Company is actively searching for permanent qualified employees to maintain the new accounting and finance functions established by the Company.
We are currently reviewing and implementing remediation steps surrounding the monthly variance analyses in our statement of operations and the journal entry review processes. We have also identified and remediated the system access rights issues by restricting each employee’s access rights and aligning them with current job responsibilities.
Our new executive management team, together with our Board of Directors isare committed to achieving and maintaining a strong control environment, high ethical standards, and financial reporting integrity.
The effectiveness of the Company's internal control over financial reporting as of December 31, 2012 has been audited by Hein & Associates LLP, an independent registered public accounting firm, as stated in their report which is included herein. Their report describes the material weaknesses identified and included in management's assessment.
Changes in Internal Control Over Financial Reporting
During the
fourth quarterthree months ended December 31, 2012, the Company identified the significant deficiencies related to the monthly financial close process described above. In addition, the Company continued execution of
2009, we began implementing someremediation efforts for the deficiencies related to the implementation of the
remedial measures described above, including the appointment of our new executive management team and members of the Board of Directors. We have also performed an assessment of our financial business processes and our accounting and finance department and have begun implementing the recommendations derived from this assessment.Auditor Attestation Report
This annual report does not include an attestation report of our independent registered public accounting firm regarding internal control over financial reporting. Management’s report was not subject to attestation by our independent registered public accounting firm pursuant to temporary rules of the SEC that permit us to provide only management’s report on internal control in this annual report.
ERP system.Item 9B. | Other Information. |
Item 9B. Other Information.
PART III
Item 10. Directors, Executive Officers and Corporate Governance.
Information under the caption “Directors, Executive Officers and Corporate Governance,” will be contained in the Company’s Definitive Proxy Statement for the 2013 Annual Meeting of Stockholders to be filed within 120 days of year end, is incorporated herein by reference.
Item 11. Executive Compensation.
Information under the caption “Executive Compensation,” will be contained in the Company’s Definitive Proxy Statement for the 2013 Annual Meeting of Stockholders to be filed within 120 days of year end, is incorporated herein by reference.
Item 12. Security Ownership of Certain Beneficial Owners and Management and Related Stockholder Matters.
Information under the caption “Security Ownership of Certain Beneficial Owners and Management and Related Stockholder Matters,” will be contained in the Company’s Definitive Proxy Statement for the 2013 Annual Meeting of Stockholders to be filed within 120 days of year end, is incorporated herein by reference.
Item 13. Certain Relationships and Related Transactions, and Director Independence.
Information under the caption “Certain Relationships and Related Transactions, and Director Independence,” will be contained in the Company’s Definitive Proxy Statement for the 2013 Annual Meeting of Stockholders to be filed within 120 days of year end, is incorporated herein by reference.
Item 14. Principal Accountant Fees and Services.
Information under the caption “Principal Accountant Fees and Services,” will be contained in the Company’s Definitive Proxy Statement for the 2013 Annual Meeting of Stockholders to be filed within 120 days of year end, is incorporated herein by reference.
Item 15. | Exhibits and Financial Statement Schedules. |
Item 15. Exhibits and Financial Statement Schedules.
|
| | |
Exhibit
Number
| | Exhibit Title |
| 3.1 | | Amended and Restated Certificate of Incorporation (incorporated by reference to Exhibit 3.1 to the Company’s Form 10-Q for the quarter ended September 30, 2007). |
| |
| 3.2 | | Certificate of Designations for Series A Cumulative Convertible Preferred Stock dated August 11, 2009 (incorporated by reference to Exhibit 3.1 to the Company’s Form 8-K filed on August 17, 2009). |
| |
| 3.3 | | Certificate of Amendment to the Amended and Restated Certificate of Incorporation (incorporated by reference to Exhibit 3.1 to the Company’s Form 10-Q for the quarter ended September 30, 2009). |
| |
| 3.4 | | Bylaws (incorporated by reference to Appendix F to the Company’s Definitive Proxy Statement filed on September 27, 2001). |
| |
| 4.1 | | Form of Certificate of Common Stock (incorporated by reference to Appendix E to the Company’s Definitive Proxy Statement filed on September 27, 2001). |
| |
| 4.2 | | Form of Certificate of Series A Cumulative Convertible Preferred Stock (incorporated by reference to Exhibit A to the Certificate of Designations for Series A Cumulative Convertible Preferred Stock filed as Exhibit 3.1 to the Company’s Form 8-K filed on August 17, 2009). |
| |
| 4.3 | | Form of Warrant to Purchase Common Stock of the Company, dated August 31, 2000 (incorporated by reference to Exhibit 4.3 to the Company’s Registration Statement on Form SB-2 (file(File no. 333-129308) filed on October 28, 2005). |
| |
| 4.4 | | Base Indenture, dated February 14, 2008, by and among the Company, the subsidiary guarantors named therein and American Stock Transfer & Trust Company (incorporated by reference to Exhibit 4.1 to the Company’s Form 8-K filed on February 14, 2008). |
| |
| 4.5 | | First Supplemental Indenture, dated February 14, 2008, by and among the Company, the subsidiary guarantors named therein and American Stock Transfer & Trust Company (incorporated by reference to Exhibit 4.2 to the Company’s Form 8-K filed on February 14, 2008). |
| |
| 4.6 | | Form of Global Security (incorporated by reference to Exhibit A to the First Supplemental Indenture filed as Exhibit 4.2 to the Company’s Form 8-K filed on February 14, 2008). |
| |
| 4.7 | | Form of Exercisable Warrant, dated August 11, 2009 (incorporated by reference to Exhibit 4.1 to the Company’s Form 8-K filed on August 17, 2009). |
| |
| 4.8 | | Form of Contingent Warrant, dated August 11, 2009 (incorporated by reference to Exhibit 4.2 to the Company’s Form 8-K filed on August 17, 2009). |
| |
10.14.9 | | AmendedAmendment to Warrant to Purchase Common Stock, dated June 14, 2012, by and Restated Credit Agreement betweenamong the Company and Wells Fargo Bank, National Association, dated August 31, 2007each of the holders party thereto (incorporated by reference to Exhibit 10.1 to the Company’s Form 10-Q for the quarter ended September 30, 2009).
|
| |
10.2 | | Amendment to Amended and Restated Credit Agreement between the Company and Wells Fargo Bank, N.A., dated November 15, 2007 (incorporated by reference to Exhibit 10.2 to the Company’s Form 10-K for the year ended December 31, 2007).
|
| |
10.3 | | Second Amendment to Amended and Restated Credit Agreement between the Company and Wells Fargo Bank, N.A., dated February 4, 2008 (incorporated by reference to Exhibit 10.1 to the Company’sCompany's Form 8-K filed on February 7, 2008)June 18, 2012).
|
| | |
Exhibit
Number
10.1 | | Exhibit Title
|
10.4 | | Fourth Amendment to Amended and Restated Credit Agreement between the Company and Wells Fargo Bank, National Association, dated May 12, 2009 (incorporated by reference to Exhibit 10.1 to the Company’s Form 8-K filed on May 15, 2009).
|
| |
10.5 | | 2003 Long Term Incentive Plan (incorporated by reference to Exhibit 10.1 to the Company’s Registration Statement on Form S-8 filed on October 27, 2005). |
| |
10.610.2 | | 2005 Long Term Incentive Plan (incorporated by reference to Exhibit 10.2 to the Company’s Registration Statement on Form S-8 filed on October 27, 2005). |
| |
10.710.3 | | 2007 Long Term Incentive Plan (incorporated by reference to Exhibit 10.6 to the Company’s Form 10-K for the year ended December 31, 2007). |
| |
10.810.4 | | Asset Purchase Agreement, dated April 3, 2006, among Total Energy Technologies, LLC, USA Petrovalve, Inc. and Total Well Solutions, LLC (incorporated by reference to Exhibit 10.1 to the Company’s Form 10-QSB for the quarter ended June 30, 2006).
|
| |
10.9 | | Exclusive License Agreement, dated April 3, 2006, among the Company, USA Petrovalve, Inc. and Total Well Solutions, LLC (incorporated by reference to Exhibit 10.2 to the Company’s Form 10-QSB for the quarter ended June 30, 2006). |
| |
10.1010.5 | | Asset Purchase Agreement, dated June 6, 2006, among LifTech, LLC, its owners and USA Petrovalve, Inc. (incorporated by reference to Exhibit 10.3 to the Company’s Form 10-QSB for the quarter ended June 30, 2006).
|
| |
10.11 | | Membership Interest Purchase Agreement, dated October 5, 2006, between Turbeco, Inc. and the owner of a 50% interest in CAVO Drilling Motors, Ltd Co. (incorporated by reference to Exhibit 10.1 to the Company’s Form 10-QSB for the quarter ended September 30, 2006).
|
| |
10.12 | | Asset Purchase Agreement, dated November 17, 2006, among Teal Supply Co., dba Triumph Drilling Tools, Inc., Turbeco Inc. and Michael E. Jensen (incorporated by reference to Exhibit 10.21 to the Company’s Form 10-K for the year ended December 31, 2006).
|
| |
10.13 | | Stock Purchase Agreement, dated August 31, 2007, among the Company, SES Holdings, Inc. and the stockholders thereof (incorporated by reference to Exhibit 10.1 to the Company’s Form 10-Q for the quarter ended September 30, 2007).
|
| |
10.14 | | Assignment of Membership Interest, dated November 15, 2007, between Turbeco, Inc. and the owner of the remaining 50% interest in CAVO Drilling Motors, Ltd Co. (incorporated by reference to Exhibit 10.13 to the Company’s Form 10-K for the year ended December 31, 2007).
|
| |
10.15 | | Asset Purchase Agreement, dated February 4, 2008, by and among Teledrift Acquisition, Inc., the Company, Teledrift, Inc. and the stockholders named therein (incorporated by reference to Exhibit 10.2 to the Company’s Form 8-K filed on February 7, 2008).
|
| |
10.16 | | Share Lending Agreement among the Company, Bear Stearns & Co. Inc. and Bear Stearns International Limited (incorporated by reference to Exhibit 10.1 to the Company’s Form 8-K filed on February 13, 2008). |
| |
10.1710.6 | | Credit Agreement, dated March 31, 2008, among the Company, Wells Fargo Bank, National Association and the Lenders named therein (incorporated by reference to Exhibit 10.2 to the Company’s Form 10-Q for the quarter ended September 30, 2009).
|
| |
10.18 | | Pledge and Security Agreement, dated March 31, 2008, among the Company and the subsidiaries named therein, in favor of Wells Fargo Bank, N.A. (incorporated by reference to Exhibit 10.5 to the Company’s Form 10-Q for the quarter ended March 31, 2008).
|
| | |
Exhibit
Number
| | Exhibit Title
|
10.19 | | Guaranty Agreement, dated March 31, 2008, among the guarantors named therein, Wells Fargo Bank, N.A., the Lenders named therein, the Issuing Lender named therein and the Swap Counterparties named therein (incorporated by reference to Exhibit 10.6 to the Company’s Form 10-Q for the quarter ended March 31, 2008).
|
| |
10.20 | | First Amendment and Temporary Waiver, dated February 25, 2009, among the Company, Wells Fargo Bank, National Association and the Lenders named therein (incorporated by reference to Exhibit 10.1 to the Company’s Form 8-K filed on March 3, 2009).
|
| |
10.21 | | Second Amendment to Credit Agreement, dated March 13, 2009, among the Company, Wells Fargo Bank, N.A. and the Lenders named therein (incorporated by reference to Exhibit 10.3 to the Company’s Form 10-Q for the quarter ended September 30, 2009).
|
| |
10.22 | | Third Amendment and Waiver to Credit Agreement, dated August 6, 2009, among the Company, Wells Fargo Bank, N.A. and the Lenders named therein (incorporated by reference to Exhibit 10.2 to the Company’s Form 8-K filed on August 12, 2009).
|
| |
10.23 | | Waiver Agreement and Fourth Amendment to Credit Agreement, dated November 16, 2009, among the Company, Wells Fargo Bank, N.A. and the Lenders named therein (incorporated by reference to Exhibit 10.4 to the Company’s Form 10-Q for the quarter ended September 30, 2009).
|
| |
10.24 | | Separation and Release Agreement, dated August 5, 2008, between Lisa Meier and the Company (incorporated by reference to Exhibit 10.1 to the Company’s Form 8-K filed on August 6, 2008).
|
| |
10.25 | | Form of Unit Purchase Agreement, dated August 11, 2009 (incorporated by reference to Exhibit 10.1 to the Company’s Form 8-K filed on August 12, 2009). |
| |
10.2610.7 | | Retirement Agreement, dated August 11, 2009, between Jerry D. Dumas, Sr. and the Company (incorporated by reference to Exhibit 10.3 to the Company’s Form 8-K filed on August 12, 2009).
|
| |
10.27 | | Employment Agreement, dated August 11, 2009, between the Company and Jesse Neyman (incorporated by reference to Exhibit 10.4 to the Company’s Form 8-K filed on August 12, 2009). |
|
| | |
10.28Exhibit Number | | ServiceExhibit Title
|
| 10.8 | | Indenture, dated as of March 31, 2010, among the Company, the subsidiary guarantors named therein and U.S. Bank National Association (incorporated by reference to Exhibit 4.1 to the Company’s Form 8-K filed on April 6, 2010). |
| 10.9 | | First Supplemental Indenture, dated as of March 31, 2010, among the Company, the subsidiary guarantors named therein and U.S. Bank National Association (incorporated by reference to Exhibit 4.2 to the Company’s Form 8-K filed on April 6, 2010). |
| 10.10 | | Form of 5.25% Convertible Senior Secured Notes due 2028 (incorporated by reference to Exhibit A to the First Supplemental Indenture filed as Exhibit 4.2 to the Company’s Form 8-K filed on April 6, 2010). |
| 10.11 | | Exchange Agreement, dated August 11, 2009,as of March 31, 2010, among Chisholm Management, Inc., Protechnics II, Inc.the Company, the subsidiary guarantors named therein and the investors named therein (incorporated by reference to Exhibit 10.1 to the Company’s Form 8-K filed on April 6, 2010). |
| 10.12 | | Lien Subordination and Intercreditor Agreement, dated as of March 31, 2010, among the Company, the subsidiaries named therein, Whitebox Advisors LLC and U.S. Bank National Association (incorporated by reference to Exhibit 10.2 to the Company’s Form 8-K filed on April 6, 2010). |
| 10.13 | | Junior Lien Pledge and Security Agreement, dated as of March 31, 2010, by the Company and the subsidiaries named therein in favor of U.S. Bank National Association (incorporated by reference to Exhibit 10.3 to the Company’s Form 8-K filed on April 6, 2010). |
| 10.14 | | Junior Lien Patent and Trademark Security Agreement, dated as of March 31, 2010, by the Company and the subsidiaries named therein in favor of U.S. Bank National Association (incorporated by reference to Exhibit 10.4 to the Company’s Form 8-K filed on April 6, 2010). |
| 10.15 | | Registration Rights Agreement (5.25% Convertible Senior Secured Notes due 2028), dated March 31, 2010, among the Company and the investors named therein (incorporated by reference to Exhibit 10.5 to the Company’s Form 8-K filed on August 12, 2009)April 6, 2010). |
| 10.16 | | Amended and Restated Patent and Trademark Security Agreement, dated as of March 31, 2010, by the Company and the subsidiaries named therein, in favor of the secured parties named therein (incorporated by reference to Exhibit 10.9 to the Company’s Form 8-K filed on April 6, 2010). |
| 10.17 | | Registration Rights Agreement (Amended and Restated Credit Agreement), dated as of March 31, 2010, among the Company and the investors named therein (incorporated by reference to Exhibit 10.10 to the Company’s Form 8-K filed on April 6, 2010). |
| 10.18 | | Employment Agreement, dated as of February 28, 2011, between the Company and Johnna Kokenge (incorporated by reference to Exhibit 10.1 to the Company’s Form 8-K filed on March 2, 2011). |
| 10.19 | | 2010 Long-Term Incentive Plan (incorporated by reference to Appendix A to the Company’s Definitive Proxy Statement filed on July 13, 2010). |
| 10.20 | | Form of Subscription Agreement (incorporated by reference to Exhibit 4.7 to the Company’s Registration Statement on Form S-3 (File No. 333-174199) filed on May 13, 2011). |
| 10.21 | | Amendment to Employment Agreement, dated May 19, 2011, between the Company and Johnna Kokenge (incorporated by reference to Exhibit 10.1 to the Company’s Form 10-Q for the quarter ended June 30, 2011). |
| 10.22 | | Amendment to Employment Agreement, dated May 19, 2011, between the Company and Jesse E. Neyman (incorporated by reference to Exhibit 10.2 to the Company’s Form 10-Q for the quarter ended June 30, 2011). |
| 10.23 | | Non-Qualified Stock Option Agreement, dated April 8, 2011, between the Company and Steve Reeves (incorporated by reference to Exhibit 10.5 to the Company’s Form 10-Q for the quarter ended June 30, 2011). |
| 10.24 | | Non-Qualified Stock Option Agreement, dated April 8, 2011, between the Company and Jesse E. Neyman (incorporated by reference to Exhibit 10.6 to the Company’s Form 10-Q for the quarter ended June 30, 2011). |
| 10.25 | | Non-Qualified Stock Option Agreement, dated April 8, 2011, between the Company and John W. Chisholm (incorporated by reference to Exhibit 10.7 to the Company’s Form 10-Q for the quarter ended June 30, 2011). |
|
| | |
Exhibit Number | | Exhibit Title |
| 10.26 | | Non-Qualified Stock Option Agreement, dated April 8, 2011, between the Company and Johnna Kokenge (incorporated by reference to Exhibit 10.8 to the Company’s Form 10-Q for the quarter ended June 30, 2011). |
| 10.27 | | Restricted Stock Agreement, dated April 8, 2011, between the Company and Steve Reeves (incorporated by reference to Exhibit 10.9 to the Company’s Form 10-Q for the quarter ended June 30, 2011). |
| 10.28 | | Restricted Stock Agreement, dated April 8, 2011, between the Company and John W. Chisholm (incorporated by reference to Exhibit 10.10 to the Company’s Form 10-Q for the quarter ended June 30, 2011). |
| 10.29 | | EmploymentRestricted Stock Agreement, dated September 1, 2009,April 8, 2011, between the Company and Scott StantonJohnna Kokenge (incorporated by reference to Exhibit 10.11 to the Company’s Form 10-Q for the quarter ended June 30, 2011).
|
| 10.30 | | Restricted Stock Agreement, dated June 3, 2011, between the Company and Steve Reeves (incorporated by reference to Exhibit 10.12 to the Company’s Form 10-Q for the quarter ended June 30, 2011). |
| 10.31 | | Restricted Stock Agreement, dated June 3, 2011, between the Company and Jesse E. Neyman (incorporated by reference to Exhibit 10.13 to the Company’s Form 10-Q for the quarter ended June 30, 2011). |
| 10.32 | | Restricted Stock Agreement, dated June 3, 2011, between the Company and John W. Chisholm (incorporated by reference to Exhibit 10.14 to the Company’s Form 10-Q for the quarter ended June 30, 2011). |
| 10.33 | | Restricted Stock Agreement, dated June 3, 2011, between the Company and Johnna Kokenge (incorporated by reference to Exhibit 10.15 to the Company’s Form 10-Q for the quarter ended June 30, 2011). |
| 10.34 | | Form of Exchange Agreement related to the exchange of outstanding debt securities (incorporated by reference to Exhibit 10.16 to the Company’s Form 10-Q for the quarter ended June 30, 2011). |
| 10.35 | | Revolving Credit and Security Agreement dated as of September 23, 2011 (incorporated by reference to Exhibit 10.1 to the Company’s Form 8-K filed on September 17, 2009)26, 2011). |
| |
12*10.36 | | Computation of Ratio of EarningsGuaranty dated September 23, 2011 (incorporated by reference to Fixed Charges and Preferred Stock Dividends.
Exhibit 10.2 to the Company’s Form 8-K filed on September 26, 2011). |
| |
21**10.37 | | List of Subsidiaries.
Security Agreement dated September 23, 2011 (incorporated by reference to Exhibit 10.3 to the Company’s Form 8-K filed on September 26, 2011). |
| |
23*10.38 | | Consent of UHY LLP.
Intellectual Property Security Agreement dated September 23, 2011 (incorporated by reference to Exhibit 10.4 to the Company’s Form 8-K filed on September 26, 2011). |
| |
31.1*10.39 | | Rule 13a-14(a) CertificationLien Subordination and Intercreditor Agreement dated as of Principal Executive Officer.
September 23, 2011 (incorporated by reference to Exhibit 10.5 to the Company’s Form 8-K filed on September 26, 2011). |
| |
31.2*10.40 | | Rule 13a-14(a) Certification of Principal Financial Officer.
|
| |
32.1* | | Section 1350 Certification of Principal Executive Officer.
|
| |
32.2* | | Section 1350 Certification of Principal Financial Officer.
|
** | Filed with our Annual Report onEmployment Agreement, dated November 30, 2011, between the Company and Kevin Fisher (incorporated by reference to Exhibit 10.69 to the Company's Form 10-K for the year ended December 31, 2009,2011).
|
| 10.41 | | Restricted Stock Agreement, dated November 30, 2011, between the Company and Kevin Fisher (incorporated by reference to Exhibit 10.70 to the Company's Form 10-K for the year ended December 31, 2011). |
| 10.42 | | Note Repurchase Agreement, dated December 27, 2011, between the Company and Gates Capital Management, Inc. (incorporated by reference to Exhibit 10.1 to the Company’s Form 8-K filed on December 28, 2011). |
| 10.43 | | Note Repurchase Agreement, dated December 27, 2011, between the Company and Whitebox Advisors, LLC (incorporated by reference to Exhibit 10.2 to the Company’s Form 8-K filed on December 28, 2011). |
| 10.44 | | Third Amended and Restated Service Agreement, dated as originallyof March 5, 2012, by and among the Company, Protechnics II, Inc. and Chisholm Management, Inc. (incorporated by reference to Exhibit 10.1 to the Company's Form 8-K filed on March 31, 2010.12, 2012). |
| 10.45 | | Employment Agreement, dated June 1, 2012, between the Company and Steve Reeves (incorporated by reference to Exhibit 10.1 to the Company's Form 8-K filed on May 21, 2012). |
| 10.46 | | Retirement Agreement, dated September 12, 2012, by and between Jesse E. Neyman and the Company (incorporated by reference to Exhibit 10.1 to the Company's Form 8-K filed on September 18, 2012). |
| 10.47 | | Second Amendment to Revolving Credit and Security Agreement dated as of November 12, 2012 (incorporated by reference to Exhibit 10.1 to the Company's Form 8-K filed on November 14, 2012). |
| 10.48 | | Third Amendment to Revolving Credit and Security Agreement dated as of December 14, 2012 (incorporated by reference to Exhibit 10.1 to the Company's Form 8-K filed on December 17, 2012). |
| 10.49 | | Fourth Amendment to Revolving Credit Security Agreement dated as of December 27, 2012 (incorporated by reference to Exhibit 10.1 to the Company's Form 8-K filed on December 28, 2012). |
|
| | |
Exhibit Number | | Exhibit Title |
| 12* | | Computation of Ratio of Earnings to Combined Fixed Charges and Preferred Stock Dividends. |
| 21* | | List of Subsidiaries. |
| 23.1* | | Consent of Hein & Associates LLP. |
| 31.1* | | Rule 13a-14(a) Certification of Principal Executive Officer. |
| 31.2* | | Rule 13a-14(a) Certification of Principal Financial Officer. |
| 32.1* | | Section 1350 Certification of Principal Executive Officer. |
| 32.2* | | Section 1350 Certification of Principal Financial Officer. |
| 101.INS** | | XBRL Instance Document. |
| 101.SCH** | | XBRL Schema Document. |
| 101.CAL** | | XBRL Calculation Linkbase Document. |
| 101.LAB** | | XBRL Label Linkbase Document. |
| 101.PRE** | | XBRL Presentation Linkbase Document. |
| 101.DEF** | | XBRL Definition Linkbase Document. |
* Filed herewith.
** Furnished with this Form 10-K, not filed.
Pursuant to the requirements of Section 13 or 15(d) of the Securities Exchange Act of 1934, the registrant has duly caused this report to be signed on its behalf by the undersigned, thereunto duly authorized.
|
| | |
| | |
| FLOTEK INDUSTRIES, INC. |
| |
| By: | | /s/ /s/ JOHN W. CHISHOLM
|
| | John W. Chisholm |
| | Interim President, Chief Executive Officer and Chairman of the Board |
Date: May 21, 2010March 13, 2013
Pursuant to the requirements of the Securities Exchange Act of 1934, this report has been signed below by the following persons on behalf of the registrant and in the capacities and on the dates indicated.
|
| | | | |
Signature
| | Title
| | Date
|
| Signature | | Title | | Date |
| | | | |
| /s/ JOHN W. CHISHOLM | | President, Chief Executive Officer and Chairman of the Board | | March 13, 2013 |
| John W. Chisholm | | Interim President (Principal(Principal Executive Officer)
| | May 21, 2010 |
| | |
/s/ JESSE E. NEYMAN Jesse E. Neyman
H. RICHARD WALTON | | Executive Vice President, Finance and Strategic PlanningChief Financial Officer
| | March 13, 2013 |
| H. Richard Walton | | (Principal Financial Officer and Principal Accounting Officer) | | May 21, 2010 |
| | |
/s/ JERRY D. DUMAS, SR. Jerry D. Dumas, Sr.
L.V. "BUD" MCGUIRE | | Chairman
Director | | May 21, 2010March 13, 2013 |
| L.V. “Bud” McGuire | | | | |
/s/ KENNETH T. HERN | | Director | | March 13, 2013 |
| Kenneth T. Hern | | Director
| | May 21, 2010 |
| | |
/s/ JOHN S. REILAND John Reiland
| | Director | | May 21, 2010March 13, 2013 |
| John S. Reiland | | | | |
/s/ L. MELVIN COOPER | | Director | | March 13, 2013 |
| L. Melvin Cooper | | | | |
| /s/ RICHARD O. WILSON | | Director | | March 13, 2013 |
| Richard O. Wilson | | Director
| | May 21, 2010 |
87