SECURITIES AND EXCHANGE COMMISSION
Amendment No. 1
(Mark One)
| (Mark One) | ||
| þ | ANNUAL REPORT PURSUANT TO SECTION 13 OR 15(d) OF THE SECURITIES EXCHANGE ACT OF 1934 | |
For the fiscal year ended December 31, 2012
or
| or | ||
| o | TRANSITION REPORT PURSUANT TO SECTION 13 OR 15(d) OF THE SECURITIES EXCHANGE ACT OF 1934 | |
Ireland | ||
(Jurisdiction of incorporation or organization) | 98-0352587 (I.R.S. Employer Identification No.) | |
Title of each Class Ordinary Shares, nominal value $0.000115 per share | Name of each exchange on which registered | |
New York Stock Exchange | ||
Large accelerated filer þ | Accelerated filer o | Non-accelerated filero | Smaller reporting company o | ||||||
| ‘We’, ‘Us’, ‘Company’, ‘Group’, ‘Willis’, or ‘Our’ | Willis Group Holdings and its subsidiaries. | |
| ‘Willis Group Holdings’ or ‘Willis Group Holdings plc’ | Willis Group Holdings Public Limited Company, a company organized under the laws of Ireland. | |
| ‘shares’ | The ordinary shares of Willis Group Holdings Public Limited Company, nominal value $0.000115 per share. | |
| ‘HRH’ | Hilb Rogal & Hobbs Company, a 100 percent owned subsidiary acquired in 2008. | |
| ||||||
| ||||||
| ||||||
| ||||||
| ||||||
| ||||||
This Amendmentthe Public Reference Room. The SEC maintains a website that contains annual, quarterly and current reports, proxy statements and other information that issuers (including Willis Group Holdings) file electronically with the SEC. The SEC’s website is being filed solely to include the information required in Part III (Items 10, 11, 12, 13 and 14)www.sec.gov.
Except as expressly set forth herein, this Amendment does not reflect events that occurred after the date of the Original Form 10-K and does not modify or update any of the other disclosures contained therein in any way. This Amendment No. 1 should be read in conjunction with the Original Form 10-K and the
i
Item 10—Directors, Executive Officers and Corporate Governance
Directors
The following table sets forth, as of April 24, 2013, the name, age and summary background of each of our current directors and director nominees. Directors are elected by our shareholders at our Annual General Meeting of Shareholders and serve until the next Annual General Meeting of Shareholders or until his or her earlier resignation or removal. The Nominating Guidelines, Audit Committee Charter, Risk Committee Charter, Compensation Committee Charter and Corporate Governance and Nominating Committee (the “Governance Committee”) has reviewedCharter are available on our website, www.willis.com, in the needsInvestor Relations-Corporate Governance section, or upon request. Requests for copies of these documents should be directed in writing to the Board and the qualities, experience and performanceCompany Secretary c/o Office of each director.
At the Governance Committee’s recommendation, the Board has renominated all current directors except Joseph J. Plumeri, our former CEO ofGeneral Counsel, Willis Group Holdings plc, who is retiringPublic Limited Company, One World Financial Center, 200 Liberty Street, New York, NY 10281.
| Director and Director Nominees | Age | Director Since | Summary Background | |||
Joseph A. Califano, Jr. | 81 | 2004 | Former U.S. Secretary of Health, Education and Welfare | |||
Dominic Casserley | 55 | 2013 | CEO of Willis Group Holdings plc | |||
Anna C. Catalano | 53 | 2006 | Former Group Vice President, Marketing for BP plc | |||
Sir Roy Gardner | 67 | 2006 | Chairman of Compass Group, PLC | |||
The Rt. Hon. Sir Jeremy Hanley, KCMG | 67 | 2006 | Former Member of Parliament for Richmond and Barnes | |||
Robyn S. Kravit | 61 | 2008 | Chief Executive Officer of Tethys Research, LLC | |||
Jeffrey B. Lane | 70 | 2008 | Former Chairman and CEO of Bear Stearns Asset Management | |||
Wendy E. Lane | 61 | 2004 | Chairman of Lane Holdings, Inc. | |||
James F. McCann | 61 | 2004 | Chairman and CEO of 1-800-Flowers | |||
Joseph J. Plumeri | 69 | 2001 | Former CEO of Willis Group Limited plc | |||
Douglas B. Roberts | 65 | 2003 | Professor and the Director for Institute of Public Policy and Social Research - Michigan State University | |||
Dr. Michael J. Somers | 70 | 2010 | Former CEO of Irish National Treasury Management Agency | |||
Jeffrey W. Ubben | 51 | Nominee | Founder and CEO of ValueAct Capital Management | |||
Nomineesprovision of practical on-site risk control services (such as health and safety or property loss control consulting) as well as analytical and advisory services (such as hazard modeling and reinsurance optimization studies). We assist clients in planning how to manage incidents or crises when they occur. These services include contingency planning, security audits and product tampering plans. We are not an insurance company and therefore we do not underwrite insurable risks for Election
The Company isour own account.
Directors
| ◦ | Geography - we will re-balance our business mix towards faster growing geographies, with both developed and developing markets |
| ◦ | Client Segmentation - we will segment our client offering to provide distinct offerings to different types of client, focusing on the value we provide to our clients |
| ◦ | Sector - we will build business lines around our industry and sector strength e.g. Human Capital and Employee Benefits. |
| ◦ | Connection - leading to more cross-selling |
| ◦ | Innovation - competing on analytics and innovation |
| ◦ | Investment - focusing on earnings accretion, competitive position and fit |
US Dollars | Pounds Sterling | Euros | Other currencies | ||||
| Revenues | 60% | 8% | 13% | 19% | |||
| Expenses | 49% | 25% | 9% | 17% | |||
Qualifications
When recommendingonly in limited circumstances. Accordingly, holders of Willis Group Holdings securities may have more difficulty protecting their interests than would holders of securities of a personcorporation incorporated in a jurisdiction of the United States.
| Item 5 — | Market for Registrant’s Common Equity, Related Stockholder Matters and Issuer Purchases of Equity Securities |
Price Range of Shares | |||||||
| High | Low | ||||||
| 2012: | |||||||
| First Quarter | $ | 39.85 | $ | 33.81 | |||
| Second Quarter | $ | 37.38 | $ | 34.24 | |||
| Third Quarter | $ | 37.94 | $ | 34.11 | |||
| Fourth Quarter | $ | 37.62 | $ | 31.98 | |||
| 2013: | |||||||
| First Quarter | $ | 39.50 | $ | 33.89 | |||
| Second Quarter | $ | 43.02 | $ | 37.86 | |||
| Third Quarter | $ | 45.45 | $ | 40.10 | |||
| Fourth Quarter | $ | 47.22 | $ | 42.15 | |||
| 2014: | |||||||
| Through February 14, 2014 | $ | 45.38 | $ | 41.30 | |||
| Payment Date | $ Per Share | ||
| January 13, 2012 | $ | 0.260 | |
| April 13, 2012 | $ | 0.270 | |
| July 13, 2012 | $ | 0.270 | |
| October 15, 2012 | $ | 0.270 | |
| January 15, 2013 | $ | 0.270 | |
| April 15, 2013 | $ | 0.280 | |
| July 15, 2013 | $ | 0.280 | |
| October 15, 2013 | $ | 0.280 | |
| January 15, 2014 | $ | 0.280 | |
| Item 6 — | Selected Financial Data |
The Governance Committee believes that including directors having currentwhich have been prepared in accordance with accounting principles generally accepted in the United States of America (‘US GAAP’).
| Year ended December 31, | |||||||||||||||||||
| 2013 | 2012 | 2011 | 2010 | 2009 | |||||||||||||||
| (millions, except per share data) | |||||||||||||||||||
| Statement of Operations Data | |||||||||||||||||||
| Total revenues | $ | 3,655 | $ | 3,480 | $ | 3,447 | $ | 3,332 | $ | 3,253 | |||||||||
| Goodwill impairment charge | — | (492 | ) | — | — | — | |||||||||||||
| Operating income (loss) | 685 | (209 | ) | 566 | 753 | 690 | |||||||||||||
| Income (loss) from continuing operations before income taxes and interest in earnings of associates | 499 | (337 | ) | 239 | 587 | 516 | |||||||||||||
| Income (loss) from continuing operations | 377 | (433 | ) | 219 | 470 | 455 | |||||||||||||
| Discontinued operations, net of tax | — | — | 1 | — | 4 | ||||||||||||||
| Net income (loss) attributable to Willis Group Holdings | $ | 365 | $ | (446 | ) | $ | 204 | $ | 455 | $ | 438 | ||||||||
| Earnings per share on continuing operations — basic | 2.07 | (2.58 | ) | 1.17 | 2.68 | 2.58 | |||||||||||||
| Earnings per share on continuing operations — diluted | 2.04 | (2.58 | ) | 1.15 | 2.66 | 2.57 | |||||||||||||
| Average number of shares outstanding | |||||||||||||||||||
| — basic | 176 | 173 | 173 | 170 | 168 | ||||||||||||||
| — diluted | 179 | 173 | 176 | 171 | 169 | ||||||||||||||
| Balance Sheet Data (as of year end) | |||||||||||||||||||
| Goodwill | $ | 2,838 | $ | 2,827 | $ | 3,295 | $ | 3,294 | $ | 3,277 | |||||||||
| Other intangible assets, net | 353 | 385 | 420 | 492 | 572 | ||||||||||||||
Total assets (i) | 14,800 | 15,112 | 15,728 | 15,850 | 15,625 | ||||||||||||||
| Total equity | 2,243 | 1,725 | 2,517 | 2,608 | 2,229 | ||||||||||||||
| Long-term debt | 2,311 | 2,338 | 2,354 | 2,157 | 2,165 | ||||||||||||||
| Shares and additional paid-in capital | 1,316 | 1,125 | 1,073 | 985 | 918 | ||||||||||||||
| Total Willis Group Holdings stockholders’ equity | 2,215 | 1,699 | 2,486 | 2,577 | 2,180 | ||||||||||||||
| Other Financial Data | |||||||||||||||||||
| Capital expenditures (excluding capital leases) | $ | 105 | $ | 133 | $ | 111 | $ | 83 | $ | 96 | |||||||||
| Cash dividends declared per share | 1.12 | 1.08 | 1.04 | 1.04 | 1.04 | ||||||||||||||
(i) | The Company collects premiums from insureds and, after deducting its commissions, remits the premiums to the respective insurers; the Company also collects claims or refunds from insurers which it then remits to insureds. Uncollected premiums from insureds and uncollected claims or refunds from insurers (‘fiduciary receivables’) are recorded as fiduciary assets on the Company’s consolidated balance sheet. Unremitted insurance premiums, claims or refunds (‘fiduciary funds’) are also recorded within fiduciary assets. |
| Item 7 — | Management’s Discussion and Analysis of Financial Condition and Results of Operations |
| (i) | the additional incentive accrual recognized following the replacement of annual cash retention awards with annual cash bonuses which will not feature a repayment requirement; |
| (ii) | write-off of unamortized cash retention awards following the decision to eliminate the repayment requirement on past awards; |
| (iii) | goodwill impairment charge; |
| (iv) | valuation allowance against deferred tax assets; |
| (v) | write-off of uncollectible accounts receivable balance and associated legal fees arising in Chicago due to fraudulent overstatement of commissions and fees; |
| (vi) | costs associated with the 2011 Operational Review; |
| (vii) | significant legal and regulatory settlements which are managed centrally; |
| (viii) | gains and losses on the disposal of operations; |
| (ix) | insurance recoveries; |
| (x) | make-whole amounts on repurchase and redemption of senior notes and write-off of unamortized debt issuance costs; |
| (xi) | loss and fees related to the extinguishment of debt; and |
| (xii) | costs associated with the Expense Reduction Initiative. |
| Year Ended December 31, | |||||||||||
| 2013 | 2012 | 2011 | |||||||||
| Operating income (loss), GAAP basis | $ | 685 | $ | (209 | ) | $ | 566 | ||||
| Excluding: | |||||||||||
Additional incentive accrual for change in remuneration policy (a) | — | 252 | — | ||||||||
Write-off of unamortized cash retention awards (b) | — | 200 | — | ||||||||
Goodwill impairment charge (c) | — | 492 | — | ||||||||
India JV settlement (d) | — | 11 | — | ||||||||
Insurance recovery (e) | — | (10 | ) | — | |||||||
Write-off of uncollectible accounts receivable balance (f) | — | 13 | 22 | ||||||||
| Net (gain) loss on disposal of operations | (2 | ) | 3 | (4 | ) | ||||||
2011 Operational Review (g) | — | — | 180 | ||||||||
FSA regulatory settlement (h) | — | — | 11 | ||||||||
Expense Reduction Initiative (i) | 46 | — | — | ||||||||
| Fees related to the extinguishment of debt | 1 | — | — | ||||||||
| Adjusted operating income | $ | 730 | $ | 752 | $ | 775 | |||||
| Operating margin, GAAP basis, or operating income (loss) as a percentage of total revenues | 18.7 | % | (6.0 | )% | 16.4 | % | |||||
| Adjusted operating margin, or adjusted operating income as a percentage of total revenues | 20.0 | % | 21.6 | % | 22.5 | % | |||||
(a) | Additional incentive accrual recognized following the replacement of annual cash retention awards with annual cash bonuses which will not feature a repayment requirement. |
(b) | Write-off of unamortized cash retention awards following the decision to eliminate the repayment requirement on past awards. |
(c) | Non-cash charge recognized related to the impairment of the carrying value of the North America reporting unit's goodwill. |
(d) | $11 million settlement with former partners related to the termination of a joint venture arrangement in India. In addition, a $1 million loss on disposal of operations was recorded related to the termination. |
(e) | Insurance recovery related to the previously disclosed fraudulent activity in Chicago. See 'Correction of Commissions and Fees Overstatement Relating to 2011 and Prior Periods', below. |
(f) | Write-off of uncollectible accounts receivable balance relating to periods prior to January 1, 2011, see 'Correction of Commissions and Fees Overstatement Relating to 2011 and Prior Periods', below. |
(g) | Charge relating to the 2011 Operational Review, including $98 million of severance costs related to the elimination of approximately 1,200 positions for the full year 2011. |
(h) | Regulatory settlement with the UK Financial Services Authority (FSA), now the Financial Conduct Authority (FCA). |
(i) | Charge related to the assessment of the Company's organizational design. See 'Expense Reduction Initiative' section below. |
Year Ended December 31, | Per diluted share Year Ended December 31, | ||||||||||||||||||||||
| 2013 | 2012 | 2011 | 2013 | 2012 | 2011 | ||||||||||||||||||
| Net income (loss) from continuing operations, GAAP basis | $ | 365 | $ | (446 | ) | $ | 203 | $ | 2.04 | $ | (2.58 | ) | $ | 1.15 | |||||||||
| Excluding: | |||||||||||||||||||||||
Additional incentive accrual for change in remuneration policy, net of tax ($nil, $77, $nil) (a) | — | 175 | — | — | 0.99 | — | |||||||||||||||||
Write-off of unamortized cash retention awards, net of tax ($nil, $62, $nil) (b) | — | 138 | — | — | 0.78 | — | |||||||||||||||||
Goodwill impairment charge, net of tax ($nil, $34, $nil) (c) | — | 458 | — | — | 2.60 | — | |||||||||||||||||
India JV settlement, net of tax ($nil, $nil, $nil) (d) | — | 11 | — | — | 0.06 | — | |||||||||||||||||
Insurance recovery, net of tax ($nil, $4, $nil) (e) | — | (6 | ) | — | — | (0.03 | ) | — | |||||||||||||||
Write-off of uncollectible accounts receivable balance, net of tax ($nil, $5, $9) (f) | — | 8 | 13 | — | 0.05 | 0.08 | |||||||||||||||||
| Net (gain) loss on disposal of operations, net of tax ($1, $nil, $nil) | (1 | ) | 3 | (4 | ) | (0.01 | ) | 0.02 | (0.02 | ) | |||||||||||||
2011 Operational Review, net of tax ($nil, $nil, $52) (g) | — | — | 128 | — | — | 0.73 | |||||||||||||||||
FSA regulatory settlement, net of tax ($nil, $nil, $nil) (h) | — | — | 11 | — | — | 0.06 | |||||||||||||||||
| Make-whole amounts on repurchase and redemption of Senior Notes and write-off of unamortized debt issuance costs, net of tax ($nil, $nil, $50) | — | — | 131 | — | — | 0.74 | |||||||||||||||||
Expense Reduction Initiative, net of tax ($8, $nil, $nil) (i) | 38 | — | — | 0.21 | — | — | |||||||||||||||||
| Fees related to the extinguishment of debt, net of tax ($nil, $nil, $nil) | 1 | — | — | 0.01 | — | — | |||||||||||||||||
| Loss on extinguishment of debt, net of tax ($nil, $nil, $nil) | 60 | — | — | 0.34 | — | — | |||||||||||||||||
| Impact of US valuation allowance | 9 | 113 | — | 0.05 | 0.64 | — | |||||||||||||||||
Dilutive impact of potentially issuable shares (j) | — | — | — | — | 0.05 | — | |||||||||||||||||
| Adjusted net income from continuing operations | $ | 472 | $ | 454 | $ | 482 | $ | 2.64 | $ | 2.58 | $ | 2.74 | |||||||||||
Average diluted shares outstanding, GAAP basis (j) | 179 | 173 | 176 | ||||||||||||||||||||
(a) | Additional incentive accrual recognized following the replacement of annual cash retention awards with annual cash bonuses which will not feature a repayment requirement. |
(b) | Write-off of unamortized cash retention awards debtor following the decision to eliminate the repayment requirement on past awards. |
(c) | Non-cash charge recognized related to the impairment of the carrying value of the North America reporting unit's goodwill. |
(d) | $11 million settlement with former partners related to the termination of a joint venture arrangement in India. In addition, a $1 million loss on disposal of operations was recorded related to the termination. |
(e) | Insurance recovery related to the previously disclosed fraudulent activity in Chicago. See 'Correction of Commissions and Fees Overstatement Relating to 2011 and Prior Periods', below. |
(f) | Write-off of uncollectible accounts receivable balance relating to periods prior to January 1, 2011, see 'Correction of Commissions and Fees Overstatement Relating to 2011 and Prior Periods', below. |
(g) | Charge relating to the 2011 Operational Review, including $98 million pre-tax of severance costs related to the elimination of approximately 1,200 positions for the full year 2011. |
(h) | Regulatory settlement with the UK Financial Services Authority (FSA), now the Financial Conduct Authority (FCA). |
(i) | Charge related to the assessment of the Company's organizational design. See 'Expense Reduction Initiative' section below. |
(j) | Potentially issuable shares were not included in the calculation of diluted earnings per share, GAAP basis, because the Company's net loss from continuing operations rendered their impact anti-dilutive. |
| Years ended December 31, | ||||||||||||
| 2013 | 2012 | 2011 | ||||||||||
| (millions) | ||||||||||||
| Cash retention awards made | $ | 12 | $ | 221 | $ | 210 | ||||||
| Amortization of cash retention awards included in salaries and benefits | 6 | 216 | 185 | |||||||||
| ◦ | Geography - we will re-balance our business mix towards faster growing geographies, with both developed and developing markets |
| ◦ | Client Segmentation - we will segment our client offering to provide distinct offerings to different types of client, focusing on the value we provide to our clients |
| ◦ | Sector - we will build business lines around our industry and sector strength e.g. Human Capital and Employee Benefits. |
| ◦ | Connection - leading to more cross-selling |
| ◦ | Innovation - competing on analytics and innovation |
| ◦ | Investment - focusing on earnings accretion, competitive position and fit |
| Year Ended December 31, | |||||||||||
| 2013 | 2012 | 2011 | |||||||||
| REVENUES | |||||||||||
| Commissions and fees | $ | 3,633 | $ | 3,458 | $ | 3,414 | |||||
| Investment income | 15 | 18 | 31 | ||||||||
| Other income | 7 | 4 | 2 | ||||||||
| Total revenues | 3,655 | 3,480 | 3,447 | ||||||||
| EXPENSES | |||||||||||
| Salaries and benefits | (2,207 | ) | (2,475 | ) | (2,087 | ) | |||||
| Other operating expenses | (616 | ) | (581 | ) | (656 | ) | |||||
| Depreciation expense | (94 | ) | (79 | ) | (74 | ) | |||||
| Amortization of intangible assets | (55 | ) | (59 | ) | (68 | ) | |||||
| Goodwill impairment charge | — | (492 | ) | — | |||||||
| Net gain (loss) on disposal of operations | 2 | (3 | ) | 4 | |||||||
| Total expenses | (2,970 | ) | (3,689 | ) | (2,881 | ) | |||||
| OPERATING INCOME (LOSS) | 685 | (209 | ) | 566 | |||||||
| Make-whole on repurchase and redemption of senior notes and write-off of unamortized debt issuance costs | — | — | (171 | ) | |||||||
| Loss on extinguishment of debt | (60 | ) | — | — | |||||||
| Interest expense | (126 | ) | (128 | ) | (156 | ) | |||||
| INCOME (LOSS) FROM CONTINUING OPERATIONS BEFORE INCOME TAXES AND INTEREST IN EARNINGS OF ASSOCIATES | 499 | (337 | ) | 239 | |||||||
| Income taxes | (122 | ) | (101 | ) | (32 | ) | |||||
| INCOME (LOSS) FROM CONTINUING OPERATIONS BEFORE INTEREST IN EARNINGS OF ASSOCIATES | 377 | (438 | ) | 207 | |||||||
| Interest in earnings of associates, net of tax | — | 5 | 12 | ||||||||
| INCOME (LOSS) FROM CONTINUING OPERATIONS | 377 | (433 | ) | 219 | |||||||
| Discontinued operations, net of tax | — | — | 1 | ||||||||
| NET INCOME (LOSS) | 377 | (433 | ) | 220 | |||||||
| Less: net income attributable to noncontrolling interests | (12 | ) | (13 | ) | (16 | ) | |||||
| NET INCOME (LOSS) ATTRIBUTABLE TO WILLIS GROUP HOLDINGS | $ | 365 | $ | (446 | ) | $ | 204 | ||||
| Salaries and benefits as a percentage of total revenues | 60.4 | % | 71.1 | % | 60.5 | % | |||||
| Other operating expenses as a percentage of total revenues | 16.9 | % | 16.7 | % | 19.0 | % | |||||
| Operating margin (operating income (loss) as a percentage of total revenues) | 18.7 | % | (6.0 | )% | 16.4 | % | |||||
| Diluted earnings per share from continuing operations | $ | 2.04 | $ | (2.58 | ) | $ | 1.15 | ||||
| Average diluted number of shares outstanding | 179 | 173 | 176 | ||||||||
| Change attributable to: | |||||||||||||||||||
| Year ended December 31, | 2013 | 2012 | % Change | Foreign currency translation | Acquisitions and disposals | Organic commissions and fees growth(a) | |||||||||||||
| Global | $ | 1,188 | $ | 1,124 | 5.7 | % | (0.9 | )% | 1.0 | % | 5.6 | % | |||||||
North America(b) | 1,377 | 1,306 | 5.4 | % | (0.1 | )% | 0.6 | % | 4.9 | % | |||||||||
International(c) | 1,068 | 1,028 | 3.9 | % | (0.2 | )% | — | % | 4.1 | % | |||||||||
| Commissions and fees | $ | 3,633 | $ | 3,458 | 5.1 | % | (0.3 | )% | 0.5 | % | 4.9 | % | |||||||
| Investment income | 15 | 18 | (16.7 | )% | |||||||||||||||
| Other income | 7 | 4 | 75.0 | % | |||||||||||||||
| Total revenues | $ | 3,655 | $ | 3,480 | 5.0 | % | |||||||||||||
(a) | Organic commissions and fees growth excludes: (i) the impact of foreign currency translation; (ii) the first twelve months of net commission and fee revenues generated from acquisitions; and (iii) the net commission and fee revenues related to operations disposed of in each period presented. |
(b) | North America commissions and fees in 2013 included the positive impact of a $5 million adjustment to align the recognition of revenue in the North America Personal Lines business with the rest of the Group. |
(c) | International commissions and fees in 2013 included the negative impact of a $15 million adjustment to align the recognition of revenue in China with the rest of the Group. |
Diversity
The Company is committedUS costs of $61 million associated with the extinguishment of debt;
| Change attributable to: | |||||||||||||||||||
| Year ended December 31, | 2012 | 2011 | % Change | Foreign currency translation | Acquisitions and disposals | Organic commissions and fees growth(a) | |||||||||||||
| Global | $ | 1,124 | $ | 1,073 | 4.8 | % | (1.3 | )% | — | % | 6.1 | % | |||||||
| North America | 1,306 | 1,314 | (0.6 | )% | — | % | — | % | (0.6 | )% | |||||||||
| International | 1,028 | 1,027 | 0.1 | % | (4.8 | )% | — | % | 4.9 | % | |||||||||
| Commissions and fees | $ | 3,458 | $ | 3,414 | 1.3 | % | (1.8 | )% | — | % | 3.1 | % | |||||||
| Investment income | 18 | 31 | (41.9 | )% | |||||||||||||||
| Other income | 4 | 2 | 100.0 | % | |||||||||||||||
| Total revenues | $ | 3,480 | $ | 3,447 | 1.0 | % | |||||||||||||
(a) | Organic commissions and fees growth excludes: (i) the impact of foreign currency translation; (ii) the first twelve months of net commission and fee revenues generated from acquisitions; and (iii) the net commission and fee revenues related to operations disposed of in each period presented. |
| December 31, 2013 | December 31, 2012 | ||||||
| Long-term debt | $ | 2,311 | $ | 2,338 | |||
| Short-term debt and current portion of long-term debt | $ | 15 | $ | 15 | |||
| Total debt | $ | 2,326 | $ | 2,353 | |||
| Stockholders' equity | $ | 2,215 | $ | 1,699 | |||
| Capitalization ratio | 51.2 | % | 58.1 | % | |||
| Year Ended December 31, | |||||||||||
| 2013 | 2012 | 2011 | |||||||||
| Cash provided by operating activities | |||||||||||
| Net cash provided by continuing operating activities | $ | 561 | $ | 525 | $ | 441 | |||||
| Net cash used in discontinued operations | — | — | (2 | ) | |||||||
| Total net cash provided by operating activities | 561 | 525 | 439 | ||||||||
| Cash flows from investing activities | |||||||||||
| Total net cash used in continuing investing activities | (120 | ) | (172 | ) | (101 | ) | |||||
| Cash flows from financing activities | |||||||||||
| Total net cash used in continuing financing activities | (137 | ) | (291 | ) | (214 | ) | |||||
| Increase in cash and cash equivalents | 304 | 62 | 124 | ||||||||
| Effect of exchange rate changes on cash and cash equivalents | (8 | ) | 2 | (4 | ) | ||||||
| Cash and cash equivalents, beginning of year | 500 | 436 | 316 | ||||||||
| Cash and cash equivalents, end of year | $ | 796 | $ | 500 | $ | 436 | |||||
Biographical Information
Set forth below is each current director’sconsulting services to clients worldwide for risks arising from specific industries and each director nominee’s biographical information. Below such informationactivities. North America and International comprise our retail operations and provide services to small, medium and major corporations.
| 2013 | 2012 | 2011 | ||||||||||||||||||||||||||||||
| Revenues | Operating Income | Operating Margin | Revenues | Operating Income (Loss) | Operating Margin | Revenues | Operating Income | Operating Margin | ||||||||||||||||||||||||
| Global | $ | 1,191 | $ | 334 | 28.0 | % | $ | 1,129 | $ | 372 | 32.9 | % | $ | 1,082 | $ | 352 | 32.5 | % | ||||||||||||||
| North America | 1,386 | 269 | 19.4 | % | 1,313 | 240 | 18.3 | % | 1,323 | 271 | 20.5 | % | ||||||||||||||||||||
| International | 1,078 | 181 | 16.8 | % | 1,038 | 183 | 17.6 | % | 1,042 | 221 | 21.2 | % | ||||||||||||||||||||
| Total Retail | 2,464 | 450 | 18.3 | % | 2,351 | 423 | 18.0 | % | 2,365 | 492 | 20.8 | % | ||||||||||||||||||||
| Corporate & Other | — | (99 | ) | n/a | — | (1,004 | ) | n/a | — | (278 | ) | n/a | ||||||||||||||||||||
| Total Consolidated | $ | 3,655 | $ | 685 | 18.7 | % | $ | 3,480 | $ | (209 | ) | (6.0 | )% | $ | 3,447 | $ | 566 | 16.4 | % | |||||||||||||
| 2013 | 2012 | 2011 | |||||||||
| Commissions and fees | $ | 1,188 | $ | 1,124 | $ | 1,073 | |||||
| Investment income | 3 | 5 | 9 | ||||||||
| Total revenues | $ | 1,191 | $ | 1,129 | $ | 1,082 | |||||
| Operating income | $ | 334 | $ | 372 | $ | 352 | |||||
| Revenue growth | 5.5 | % | 4.3 | % | 8.6 | % | |||||
Organic commissions and fees growth (a) | 5.6 | % | 6.1 | % | 6.6 | % | |||||
| Operating margin | 28.0 | % | 32.9 | % | 32.5 | % | |||||
(a) | Organic commissions and fees growth excludes: (i) the impact of foreign currency translation; (ii) the first twelve months of net commission and fee revenues generated from acquisitions; and (iii) the net commission and fee revenues related to operations disposed of in each period presented. |
| 2013 | 2012 | 2011 | |||||||||
Commissions and fees (a) | $ | 1,377 | $ | 1,306 | $ | 1,314 | |||||
| Investment income | 2 | 3 | 7 | ||||||||
Other income (b) | 7 | 4 | 2 | ||||||||
| Total revenues | $ | 1,386 | $ | 1,313 | $ | 1,323 | |||||
| Operating income | $ | 269 | $ | 240 | $ | 271 | |||||
| Revenue growth | 5.6 | % | (0.8 | )% | (4.5 | )% | |||||
Organic commissions and fees growth (c) | 4.9 | % | (0.6 | )% | (3.5 | )% | |||||
| Operating margin | 19.4 | % | 18.3 | % | 20.5 | % | |||||
(a) | Commissions and fees included a positive $5 million adjustment to align the recognition of revenue in the North America Personal Lines business with the rest of the Group. |
(b) | Other income comprises gains on disposal of intangible assets, which primarily arise from settlements through enforcing non-compete agreements in the event of losing accounts through producer defection or the disposal of books of business. |
(c) | Organic commissions and fees growth excludes: (i) the impact of foreign currency translation; (ii) the first twelve months of net commission and fee revenues generated from acquisitions; and (iii) the net commission and fee revenues related to operations disposed of in each period presented. |
| 2013 | 2012 | 2011 | |||||||||
Commissions and fees (a) | $ | 1,068 | $ | 1,028 | $ | 1,027 | |||||
| Investment income | 10 | 10 | 15 | ||||||||
| Total revenues | $ | 1,078 | $ | 1,038 | $ | 1,042 | |||||
| Operating income | 181 | 183 | 221 | ||||||||
| Revenue growth | 3.9 | % | (0.4 | )% | 9.6 | % | |||||
Organic commissions and fees growth (b) | 4.1 | % | 4.9 | % | 4.8 | % | |||||
| Operating margin | 16.8 | % | 17.6 | % | 21.2 | % | |||||
(a) | Commissions and fees in 2013 included a negative $15 million adjustment to align the recognition of revenue in China with the rest of the Group. |
(b) | Organic commissions and fees growth excludes: (i) the impact of foreign currency translation; (ii) the first twelve months of net commission and fee revenues generated from acquisitions; and (iii) the net commission and fee revenues related to operations disposed of in each period presented. |
| 2013 | 2012 | 2011 | |||||||||
| Amortization of intangible assets | $ | (55 | ) | $ | (59 | ) | $ | (68 | ) | ||
Additional incentive accrual for change in remuneration policy (a) | — | (252 | ) | — | |||||||
Write-off of unamortized cash retention awards (b) | — | (200 | ) | — | |||||||
Goodwill impairment charge (c) | — | (492 | ) | — | |||||||
India joint venture settlement (d) | — | (11 | ) | — | |||||||
Insurance recovery (e) | — | 10 | — | ||||||||
Write-off of uncollectible accounts receivable balance in Chicago (f) | — | (13 | ) | (22 | ) | ||||||
Net gain (loss) on disposal of operations (d) | 2 | (3 | ) | 4 | |||||||
| Foreign exchange hedging | 3 | 8 | 5 | ||||||||
| Foreign exchange gain (loss) on the UK pension plan asset | 8 | (1 | ) | — | |||||||
| 2011 Operational Review | — | — | (180 | ) | |||||||
| FSA Regulatory settlement | — | — | (11 | ) | |||||||
| Expense Reduction Initiative | (46 | ) | — | — | |||||||
| Fees related to the extinguishment of debt | (1 | ) | — | — | |||||||
Other (g) | (10 | ) | 9 | (6 | ) | ||||||
| Total Corporate and other | $ | (99 | ) | $ | (1,004 | ) | $ | (278 | ) | ||
(a) | Additional incentive accrual recognized following the replacement of annual cash retention awards with annual cash bonuses which do not feature a repayment requirement. |
(b) | Write-off of unamortized cash retention awards following the decision to eliminate the repayment requirement on past awards. |
(c) | Non-cash charge recognized related to the impairment of the carrying value of the North America reporting unit's goodwill. |
(d) | $11 million settlement with former partners related to the termination of a joint venture arrangement in India. In addition, a $1 million loss on disposal of operations was recorded related to the termination. |
(e) | Insurance recovery, recorded in Other operating expenses, related to a previously disclosed fraudulent activity in Chicago. See 'Correction of Commissions and Fees Overstatement Relating to 2011 and Prior Periods' discussed above. |
(f) | Write-off of uncollectible accounts receivable balance relating to periods prior to January 1, 2011, see 'Correction of Commissions and Fees Overstatement Relating to 2011 and Prior Periods' discussed above. |
(g) | Other includes $7 million in 2013 (2012: $7 million, 2011: $12 million) from the release of funds and reserves related to potential legal liabilities. |
As disclosed using December 31, 2013 assumptions(a) | Impact of a 0.50 percentage point increase in the expected rate of return on assets(b) | Impact of a 0.50 percentage point increase in the discount rate(b) | One year increase in mortality assumption(c) | ||||||||||||
| (millions) | |||||||||||||||
| Estimated 2014 (income) / expense | $ | (12 | ) | $ | (15 | ) | $ | (24 | ) | $ | 8 | ||||
| Projected benefit obligation at December 31, 2013 | 2,785 | n/a | (254 | ) | 56 | ||||||||||
(a) | Except for the expected rate of return updated to 7%. |
(b) | With all other assumptions held constant. |
(c) | Assumes all plan participants are one year younger. |
Expected return on plan assets | Actual return on plan assets | ||||||
| (millions) | |||||||
| 2013 | $ | 191 | $ | 255 | |||
| 2012 | 181 | 226 | |||||
| 2011 | 161 | 269 | |||||
As disclosed using December 31, 2013 assumptions | Impact of a 0.50 percentage point increase in the expected rate of return on assets(a) | Impact of a 0.50 percentage point increase in the discount rate(a) | One year increase in mortality assumption(b) | ||||||||||||
| (millions) | |||||||||||||||
| Estimated 2014 (income) / expense | $ | (8 | ) | $ | (4 | ) | $ | — | $ | 2 | |||||
| Projected benefit obligation at December 31, 2013 | 864 | n/a | (51 | ) | 22 | ||||||||||
(a) | With all other assumptions held constant. |
(b) | Assumes all plan participants are one year younger. |
Expected return on plan assets | Actual return on plan assets | ||||||
| (millions) | |||||||
| 2013 | $ | 51 | $ | 60 | |||
| 2012 | 46 | 80 | |||||
| 2011 | 44 | 34 | |||||
| Payments due by | |||||||||||||||||||
Obligations (c) | Total | 2014 | 2015-2016 | 2017-2018 | After 2018 | ||||||||||||||
| (millions) | |||||||||||||||||||
| 7-year term loan facility expires 2018 | $ | 274 | $ | 15 | $ | 39 | $ | 220 | $ | — | |||||||||
| Interest on term loan | 19 | 5 | 9 | 5 | — | ||||||||||||||
| Revolving $500 million credit facility commitment fees | 9 | 2 | 4 | 3 | — | ||||||||||||||
| 5.625% senior notes due 2015 | 148 | — | 148 | — | — | ||||||||||||||
| Fair value adjustments on 5.625% senior notes due 2015 | 4 | — | 4 | — | — | ||||||||||||||
| 4.125% senior notes due 2016 | 300 | — | 300 | — | — | ||||||||||||||
| 6.200% senior notes due 2017 | 394 | — | — | 394 | — | ||||||||||||||
| 7.000% senior notes due 2019 | 187 | — | — | — | 187 | ||||||||||||||
| 5.750% senior notes due 2021 | 500 | — | — | — | 500 | ||||||||||||||
| 4.625% senior notes due 2023 | 250 | — | — | — | 250 | ||||||||||||||
| 6.125% senior notes due 2043 | 275 | — | — | — | 275 | ||||||||||||||
| Interest on senior notes | 1,011 | 115 | 209 | 146 | 541 | ||||||||||||||
| Total debt and related interest | 3,371 | 137 | 713 | 768 | 1,753 | ||||||||||||||
Operating leases (a) | 1,235 | 131 | 213 | 167 | 724 | ||||||||||||||
| Pensions | 566 | 122 | 244 | 161 | 39 | ||||||||||||||
Other contractual obligations (b) | 91 | 24 | 16 | 12 | 39 | ||||||||||||||
| Total contractual obligations | $ | 5,263 | $ | 414 | $ | 1,186 | $ | 1,108 | $ | 2,555 | |||||||||
(a) | Presented gross of sublease income. |
(b) | Other contractual obligations include capital lease commitments, put option obligations and investment fund capital call obligations, the timing of which are included at the earliest point they may fall due. |
(c) | The above excludes $41 million for liabilities for unrecognized tax benefits as we are unable to reasonably predict the timing of settlement of these liabilities. |
previously existing revolving credit facilities.
Gross rental commitments | Rentals from subleases | Net rental commitments | |||||||||
| (millions) | |||||||||||
| 2014 | $ | 131 | $ | (15 | ) | $ | 116 | ||||
| 2015 | 114 | (14 | ) | 100 | |||||||
| 2016 | 99 | (13 | ) | 86 | |||||||
| 2017 | 88 | (12 | ) | 76 | |||||||
| 2018 | 79 | (8 | ) | 71 | |||||||
| Thereafter | 724 | (16 | ) | 708 | |||||||
| Total | $ | 1,235 | $ | (78 | ) | $ | 1,157 | ||||
| Item 7A — | Quantitative and Qualitative Disclosures about Market Risk |
US Dollars | Pounds Sterling | Euros | Other currencies | ||||||||
| Revenues | 60 | % | 8 | % | 13 | % | 19 | % | |||
| Expenses | 49 | % | 25 | % | 9 | % | 17 | % | |||
| Settlement date before December 31, | |||||||||||||||||
| 2014 | 2015 | 2016 | |||||||||||||||
| December 31, 2013 | Contract amount | Average contractual exchange rate | Contract amount | Average contractual exchange rate | Contract amount | Average contractual exchange rate | |||||||||||
| (millions) | (millions) | (millions) | |||||||||||||||
| Foreign currency sold | |||||||||||||||||
| US dollars sold for sterling | $ | 212 | $1.57 = £1 | $ | 91 | $1.53 = £1 | $ | — | — | ||||||||
| Euro sold for US dollars | 60 | €1 = $1.33 | 37 | €1 = $1.36 | — | — | |||||||||||
| Japanese yen sold for US dollars | 23 | ¥ 88.08=$1 | 12 | ¥ 97.98 = $1 | — | — | |||||||||||
| Total | $ | 295 | $ | 140 | $ | — | |||||||||||
Fair Value (i) | $ | 13 | $ | 8 | $ | — | |||||||||||
| Settlement date before December 31, | |||||||||||||||||
| 2013 | 2014 | 2015 | |||||||||||||||
| December 31, 2012 | Contract amount | Average contractual exchange rate | Contract amount | Average contractual exchange rate | Contract amount | Average contractual exchange rate | |||||||||||
| (millions) | (millions) | (millions) | |||||||||||||||
| Foreign currency sold | |||||||||||||||||
| US dollars sold for sterling | $ | 167 | $1.59 = £1 | $ | 88 | $1.60 = £1 | $ | — | — | ||||||||
| Euro sold for US dollars | 55 | €1 = $1.36 | �� | — | — | — | |||||||||||
| Japanese yen sold for US dollars | 22 | ¥ 81.72=$1 | 10 | ¥ 79.02=$1 | — | — | |||||||||||
| Total | $ | 244 | $ | 98 | $ | — | |||||||||||
Fair Value (i) | $ | 7 | $ | 2 | $ | — | |||||||||||
(i) | Represents the difference between the contract amount and the cash flow in US dollars which would have been receivable had the foreign currency forward exchange contracts been entered into on December 31, 2013 or 2012 at the forward exchange rates prevailing at that date. |
| Expected to mature before December 31, | ||||||||||||||||||||||||
| December 31, 2013 | 2014 | 2015 | 2016 | 2017 | 2018 | Thereafter | Total | Fair Value(i) | ||||||||||||||||
| ($ millions, except percentages) | ||||||||||||||||||||||||
| Fixed rate debt | ||||||||||||||||||||||||
| Principal ($) | 148 | 300 | 394 | 1,212 | 2,054 | 2,185 | ||||||||||||||||||
| Fixed rate payable | 5.625% | 4.125 | % | 6.200 | % | 5.796 | % | 5.617 | % | |||||||||||||||
| Floating rate debt | ||||||||||||||||||||||||
| Principal ($) | 15 | 17 | 23 | 23 | 196 | 274 | 274 | |||||||||||||||||
| Variable rate payable | 1.84 | % | 2.45 | % | 3.51 | % | 4.36 | % | 4.73 | % | 4.52 | % | ||||||||||||
| Expected to mature before December 31, | ||||||||||||||||||||||||
| December 31, 2012 | 2013 | 2014 | 2015 | 2016 | 2017 | Thereafter | Total | Fair Value (i) | ||||||||||||||||
| ($ millions, except percentages) | ||||||||||||||||||||||||
| Fixed rate debt | ||||||||||||||||||||||||
| Principal ($) | 350 | 300 | 600 | 800 | 2,050 | 2,302 | ||||||||||||||||||
| Fixed rate payable | 5.625% | 4.125 | % | 6.200 | % | 6.219 | % | 5.805 | % | |||||||||||||||
| Floating rate debt | ||||||||||||||||||||||||
| Principal ($) | 15 | 15 | 17 | 242 | 289 | 289 | ||||||||||||||||||
| Variable rate payable | 1.89 | % | 2.05 | % | 2.34 | % | 3.00 | % | 2.93 | % | ||||||||||||||
| Interest rate swaps | ||||||||||||||||||||||||
| Fixed to Variable | ||||||||||||||||||||||||
| Principal ($) | 350 | 350 | 22 | |||||||||||||||||||||
| Fixed rate receivable | 2.71 | % | 2.71 | % | ||||||||||||||||||||
| Variable rate payable | 0.75 | % | 0.75 | % | ||||||||||||||||||||
(i) | Represents the net present value of the expected cash flows discounted at current market rates of interest or quoted market rates as appropriate. |
| Item 8 — | Financial Statements and Supplementary Data |
| Page | ||
Dominic Casserley — Mr. Casserley, age 55, joined the Company, as our new CEO and as a director on January 7, 2013 and currently serves as a memberresponsibility of the Company’s Executive Committee. Before joiningmanagement. Our responsibility is to express an opinion on these consolidated financial statements based on our audits.
|
|
Anna C. Catalano — Ms. Catalano, age 53, joined the Board on July 21, 2006 and currently serves as a member of the Company’s Governance Committee and Risk Committee. She was Group Vice President, Marketing for BP plc from 2001 to 2003. Prior to that she held various executive positions at BP and Amoco, including Group Vice President, Emerging Markets at BP; Senior Vice President, Sales and Operations at Amoco; and President of Amoco Orient Oil Company. She
currently serves on the Board and Compensation Committee and Governance Committee of Mead Johnson Nutrition and on the Boards and Compensation Committees of Chemtura Corporation and Kraton Performance Polymers. She serves on the Executive Committee of the Houston Chapter of the Alzheimer’s Association and serves as a director on the National Board of the Alzheimer’s Association. Ms. Catalano formerly served on the boards of SSL International plc, Hercules Incorporated, Aviva plc and U.S. Dataworks and as an advisory board member of BT Global Services. Ms. Catalano holds a BS degree in Business Administration from the University of Illinois, Champaign-Urbana.
|
|
|
Sir Roy Gardner — Sir Roy Gardner, age 67, joined the Board on April 26, 2006 and currently serves as the Chairman of the Company’s Risk Committee and a member of the Executive Committee. He is a Chartered Certified Accountant and will serve as Chairman of Compass Group PLC, a food and support services company, until his retirement from the position in February 2014. He also serves as Chairman of the Nominating Committee of Compass Group PLC. He is a Senior Advisor to Credit Suisse and also a Director and Chairman of the Nominating Committee of Mainstream Renewable Power Limited, Chairman of the Advisory Board of the Energy Futures Lab of Imperial College London, President of Carers UK, Chairman of the Apprenticeship Ambassadors Network and Chairman and member of several board committees of Enserve Group Ltd. In addition, he was Chairman of Connaught plc between May and September 2010. He previously held positions as a former Chief Executive of Centrica plc, Chairman of Manchester United plc, Finance Director of British Gas plc, Managing Director of GEC-Marconi Ltd, Director of GEC plc and Director of Laporte plc.
|
|
|
The Rt. Hon. Sir Jeremy Hanley, KCMG — Sir Jeremy Hanley, age 66, joined the Board on April 26, 2006 and currently serves as a member of the Company’s Audit Committee. He is a Chartered Accountant and a director of Willis Limited, a subsidiary of the Company, and a director and member of the Audit and Remuneration Committees of Langbar International Limited and of London Asia Capital plc. He also serves on the International Advisory Committee for Lottomatica S.p.A. Sir Jeremy was a Member of Parliament for Richmond and Barnes from 1983 to 1997 and held a number of ministerial position in the U.K. government, including Under Secretary of State for Northern Ireland, Minister of State for the Armed Forces, Cabinet Minister without Portfolio at the same time as being Chairman of the Conservative Party and Minister of State for Foreign & Commonwealth Affairs. He retired from politics in 1998. He also served on the Boards of Lottomatica S.p.A., Onslow Suffolk Limited, Mountfield Group Limited, Nymex London Limited and ITE Group plc. and the Audit Committee of the Joint Arab British Chamber of Commerce.
|
|
|
Robyn S. Kravit — Ms. Kravit, age 61, joined the Board on April 23, 2008 and currently serves as a member of the Company’s Audit Committee. She is an international business executive with almost 30 years of experience in establishing and directing significant China-based operations engaged in the international trading of industrial raw materials. Ms. Kravit co-founded Tethys Research LLC, a biotechnology company, and has acted as its Chief Executive Officer since 2000. From 2001 through 2010, Ms. Kravit was a Director of FONZ, the organization which manages commercial and educational activities for Smithsonian’s National Zoological Park, serving two terms as President and later chairing its Audit Committee. On January 1, 2012, she was appointed to a two-year term on the Standing Advisory Groupstandards of the Public Company Accounting Oversight Board (PCAOB)(United States). Those standards require that we plan and perform the audit to obtain reasonable assurance about whether the financial statements are free of material misstatement. An audit includes examining, on a test basis, evidence supporting the amounts and disclosures in the financial statements. An audit also includes assessing the accounting principles used and significant estimates made by management, as well as evaluating the overall financial statement presentation. We believe that our audits provide a reasonable basis for our opinion.
| Years ended December 31, | ||||||||||||||
| Note | 2013 | 2012 | 2011 | |||||||||||
| (millions, except per share data) | ||||||||||||||
| REVENUES | ||||||||||||||
| Commissions and fees | $ | 3,633 | $ | 3,458 | $ | 3,414 | ||||||||
| Investment income | 15 | 18 | 31 | |||||||||||
| Other income | 7 | 4 | 2 | |||||||||||
| Total revenues | 3,655 | 3,480 | 3,447 | |||||||||||
| EXPENSES | ||||||||||||||
| Salaries and benefits | 3 | (2,207 | ) | (2,475 | ) | (2,087 | ) | |||||||
| Other operating expenses | (616 | ) | (581 | ) | (656 | ) | ||||||||
| Depreciation expense | 12 | (94 | ) | (79 | ) | (74 | ) | |||||||
| Amortization of intangible assets | 14 | (55 | ) | (59 | ) | (68 | ) | |||||||
| Goodwill impairment charge | 13 | — | (492 | ) | — | |||||||||
| Net gain (loss) on disposal of operations | 6 | 2 | (3 | ) | 4 | |||||||||
| Total expenses | (2,970 | ) | (3,689 | ) | (2,881 | ) | ||||||||
| OPERATING INCOME (LOSS) | 685 | (209 | ) | 566 | ||||||||||
| Make-whole on repurchase and redemption of senior notes and write-off of unamortized debt issuance costs | — | — | (171 | ) | ||||||||||
| Loss on extinguishment of debt | 20 | (60 | ) | — | — | |||||||||
| Interest expense | 20 | (126 | ) | (128 | ) | (156 | ) | |||||||
| INCOME (LOSS) FROM CONTINUING OPERATIONS BEFORE INCOME TAXES AND INTEREST IN EARNINGS OF ASSOCIATES | 499 | (337 | ) | 239 | ||||||||||
| Income taxes | 7 | (122 | ) | (101 | ) | (32 | ) | |||||||
| INCOME (LOSS) FROM CONTINUING OPERATIONS BEFORE INTEREST IN EARNINGS OF ASSOCIATES | 377 | (438 | ) | 207 | ||||||||||
| Interest in earnings of associates, net of tax | 15 | — | 5 | 12 | ||||||||||
| INCOME (LOSS) FROM CONTINUING OPERATIONS | 377 | (433 | ) | 219 | ||||||||||
| Discontinued operations, net of tax | 8 | — | — | 1 | ||||||||||
| NET INCOME (LOSS) | 377 | (433 | ) | 220 | ||||||||||
| Less: net income attributable to noncontrolling interests | (12 | ) | (13 | ) | (16 | ) | ||||||||
| NET INCOME (LOSS) ATTRIBUTABLE TO WILLIS GROUP HOLDINGS | $ | 365 | $ | (446 | ) | $ | 204 | |||||||
| AMOUNTS ATTRIBUTABLE TO WILLIS GROUP HOLDINGS SHAREHOLDERS | ||||||||||||||
| Income (loss) from continuing operations, net of tax | $ | 365 | $ | (446 | ) | $ | 203 | |||||||
| Income from discontinued operations, net of tax | — | — | 1 | |||||||||||
| NET INCOME (LOSS) ATTRIBUTABLE TO WILLIS GROUP HOLDINGS | $ | 365 | $ | (446 | ) | $ | 204 | |||||||
| BASIC EARNINGS PER SHARE | 9 | |||||||||||||
| — Continuing operations | $ | 2.07 | $ | (2.58 | ) | $ | 1.17 | |||||||
| DILUTED EARNINGS PER SHARE | 9 | |||||||||||||
| — Continuing operations | $ | 2.04 | $ | (2.58 | ) | $ | 1.15 | |||||||
| CASH DIVIDENDS DECLARED PER SHARE | $ | 1.12 | $ | 1.08 | $ | 1.04 | ||||||||
| Years ended December 31, | ||||||||||||||
| Note | 2013 | 2012 | 2011 | |||||||||||
| (millions) | ||||||||||||||
| Net income (loss) | $ | 377 | $ | (433 | ) | $ | 220 | |||||||
| Other comprehensive income (loss), net of tax: | ||||||||||||||
| Foreign currency translation adjustments | 20 | 46 | (29 | ) | ||||||||||
| Pension funding adjustment: | ||||||||||||||
| Foreign currency translation on pension funding adjustment | (10 | ) | (22 | ) | 8 | |||||||||
| Net actuarial gain (loss) | 85 | (167 | ) | (208 | ) | |||||||||
| Prior service gain | — | — | 7 | |||||||||||
| Amortization of unrecognized actuarial loss | 46 | 38 | 25 | |||||||||||
| Amortization of unrecognized prior service gain | (4 | ) | (5 | ) | (4 | ) | ||||||||
| 117 | (156 | ) | (172 | ) | ||||||||||
| Derivative instruments: | ||||||||||||||
| Gain on interest rate swaps (effective element) | — | 2 | 10 | |||||||||||
| Interest rate swap reclassification adjustment | (4 | ) | (4 | ) | (10 | ) | ||||||||
| Gain on forward exchange contracts (effective element) | 8 | 9 | 2 | |||||||||||
| Forward exchange contracts reclassification adjustment | 1 | (3 | ) | (5 | ) | |||||||||
| Gain on treasury lock (effective element) | 15 | — | — | |||||||||||
| 20 | 4 | (3 | ) | |||||||||||
| Other comprehensive income (loss), net of tax | 23 | 157 | (106 | ) | (204 | ) | ||||||||
| Comprehensive income (loss) | 534 | (539 | ) | 16 | ||||||||||
| Less: Comprehensive income attributable to noncontrolling interests | (12 | ) | (13 | ) | (15 | ) | ||||||||
| Comprehensive income (loss) attributable to Willis Group Holdings | $ | 522 | $ | (552 | ) | $ | 1 | |||||||
| December 31, | ||||||||||
| Note | 2013 | 2012 | ||||||||
| (millions, except share data) | ||||||||||
| ASSETS | ||||||||||
| CURRENT ASSETS | ||||||||||
| Cash and cash equivalents | $ | 796 | $ | 500 | ||||||
| Accounts receivable, net | 1,041 | 933 | ||||||||
| Fiduciary assets | 11 | 8,412 | 9,271 | |||||||
| Deferred tax assets | 7 | 15 | 13 | |||||||
| Other current assets | 16 | 197 | 181 | |||||||
| Total current assets | 10,461 | 10,898 | ||||||||
| NON-CURRENT ASSETS | ||||||||||
| Fixed assets, net | 12 | 481 | 468 | |||||||
| Goodwill | 13 | 2,838 | 2,827 | |||||||
| Other intangible assets, net | 14 | 353 | 385 | |||||||
| Investments in associates | 15 | 176 | 174 | |||||||
| Deferred tax assets | 7 | 7 | 18 | |||||||
| Pension benefits asset | 19 | 278 | 136 | |||||||
| Other non-current assets | 16 | 206 | 206 | |||||||
| Total non-current assets | 4,339 | 4,214 | ||||||||
| TOTAL ASSETS | $ | 14,800 | $ | 15,112 | ||||||
| LIABILITIES AND STOCKHOLDERS’ EQUITY | ||||||||||
| CURRENT LIABILITIES | ||||||||||
| Fiduciary liabilities | $ | 8,412 | $ | 9,271 | ||||||
| Deferred revenue and accrued expenses | 586 | 541 | ||||||||
| Income taxes payable | 21 | 19 | ||||||||
| Short-term debt and current portion of long-term debt | 20 | 15 | 15 | |||||||
| Deferred tax liabilities | 7 | 25 | 21 | |||||||
| Other current liabilities | 17 | 415 | 327 | |||||||
| Total current liabilities | 9,474 | 10,194 | ||||||||
| NON-CURRENT LIABILITIES | ||||||||||
| Long-term debt | 20 | 2,311 | 2,338 | |||||||
| Liability for pension benefits | 19 | 136 | 282 | |||||||
| Deferred tax liabilities | 7 | 56 | 18 | |||||||
| Provisions for liabilities | 21 | 206 | 180 | |||||||
| Other non-current liabilities | 17 | 374 | 375 | |||||||
| Total non-current liabilities | 3,083 | 3,193 | ||||||||
| Total liabilities | 12,557 | 13,387 | ||||||||
| December 31, | ||||||||||
| Note | 2013 | 2012 | ||||||||
| (millions, except share data) | ||||||||||
| COMMITMENTS AND CONTINGENCIES | 22 | |||||||||
| EQUITY | ||||||||||
| Ordinary shares, $0.000115 nominal value; Authorized: 4,000,000,000; Issued 178,861,250 shares in 2013 and 173,178,733 shares in 2012 | — | — | ||||||||
| Ordinary shares, €1 nominal value; Authorized: 40,000; Issued 40,000 shares in 2013 and 2012 | — | — | ||||||||
| Preference shares, $0.000115 nominal value; Authorized: 1,000,000,000; Issued nil shares in 2013 and 2012 | — | — | ||||||||
| Additional paid-in capital | 1,316 | 1,125 | ||||||||
| Retained earnings | 1,595 | 1,427 | ||||||||
| Accumulated other comprehensive loss, net of tax | 23 | (693 | ) | (850 | ) | |||||
| Treasury shares, at cost, 46,408 shares in 2013 and 2012, and 40,000 shares, €1 nominal value, in 2013 and 2012 | (3 | ) | (3 | ) | ||||||
| Total Willis Group Holdings stockholders’ equity | 2,215 | 1,699 | ||||||||
| Noncontrolling interests | 24 | 28 | 26 | |||||||
| Total equity | 2,243 | 1,725 | ||||||||
| TOTAL LIABILITIES AND EQUITY | $ | 14,800 | $ | 15,112 | ||||||
| Years ended December 31, | ||||||||||||||
| Note | 2013 | 2012 | 2011 | |||||||||||
| (millions) | ||||||||||||||
| CASH FLOWS FROM OPERATING ACTIVITIES | ||||||||||||||
| Net income (loss) | $ | 377 | $ | (433 | ) | $ | 220 | |||||||
| Adjustments to reconcile net income to total net cash provided by operating activities: | ||||||||||||||
| Income from discontinued operations | — | — | (1 | ) | ||||||||||
| Goodwill impairment | — | 492 | — | |||||||||||
| Net gain on disposal of operations, fixed and intangible assets | (7 | ) | — | (6 | ) | |||||||||
| Depreciation expense | 12 | 94 | 79 | 74 | ||||||||||
| Amortization of intangible assets | 14 | 55 | 59 | 68 | ||||||||||
| Amortization and write-off of cash retention awards | 3 | 6 | 416 | 185 | ||||||||||
| Net periodic cost of defined benefit pension plans | 19 | (4 | ) | 2 | 11 | |||||||||
| Provision for doubtful accounts | 18 | 3 | 16 | 4 | ||||||||||
| Provision for deferred income taxes | 39 | 54 | 17 | |||||||||||
| Gain on derivative instruments | 18 | 11 | 3 | |||||||||||
| Excess tax benefits from share-based payment arrangements | (2 | ) | (2 | ) | (5 | ) | ||||||||
| Share-based compensation | 4 | 42 | 32 | 41 | ||||||||||
| Tender premium included in loss on extinguishment of debt | 20 | 65 | — | — | ||||||||||
| Make-whole on repurchase and redemption of senior notes and write-off of unamortized debt issuance costs | — | — | 171 | |||||||||||
| Undistributed earnings of associates | 8 | (2 | ) | (5 | ) | |||||||||
| Effect of exchange rate changes on net income | (4 | ) | (14 | ) | 14 | |||||||||
| Changes in operating assets and liabilities, net of effects from purchase of subsidiaries: | ||||||||||||||
| Accounts receivable | (116 | ) | (17 | ) | (92 | ) | ||||||||
| Fiduciary assets | 804 | 111 | 162 | |||||||||||
| Fiduciary liabilities | (804 | ) | (111 | ) | (162 | ) | ||||||||
| Cash incentives paid | (346 | ) | (323 | ) | (310 | ) | ||||||||
| Funding of defined benefit pension plans | 19 | (150 | ) | (143 | ) | (135 | ) | |||||||
| Other assets | 14 | (1 | ) | 70 | ||||||||||
| Other liabilities | 445 | 319 | 101 | |||||||||||
| Movement on provisions | 24 | (20 | ) | 16 | ||||||||||
| Net cash provided by continuing operating activities | 561 | 525 | 441 | |||||||||||
| Net cash used in discontinued operating activities | — | — | (2 | ) | ||||||||||
| Total net cash provided by operating activities | 561 | 525 | 439 | |||||||||||
| Years ended December 31, | |||||||||||||
| Note | 2013 | 2012 | 2011 | ||||||||||
| (millions) | |||||||||||||
| CASH FLOWS FROM INVESTING ACTIVITIES | |||||||||||||
| Proceeds on disposal of fixed and intangible assets | 12 | 5 | 13 | ||||||||||
| Additions to fixed assets | (112 | ) | (135 | ) | (111 | ) | |||||||
| Additions to intangible assets | (7 | ) | (2 | ) | — | ||||||||
| Acquisitions of subsidiaries, net of cash acquired | (30 | ) | (33 | ) | (10 | ) | |||||||
| Acquisition of investments in associates | — | — | (2 | ) | |||||||||
| Payments to acquire other investments | (7 | ) | (7 | ) | (5 | ) | |||||||
| Proceeds from sale of associates | 4 | — | — | ||||||||||
| Proceeds from sale of operations, net of cash disposed | 20 | — | 14 | ||||||||||
| Net cash used in continuing investing activities | (120 | ) | (172 | ) | (101 | ) | |||||||
| CASH FLOWS FROM FINANCING ACTIVITIES | |||||||||||||
| Repayment of revolving credit facility | — | — | (90 | ) | |||||||||
| Senior notes issued | 20 | 522 | — | 794 | |||||||||
| Debt issuance costs | (8 | ) | — | (12 | ) | ||||||||
| Repayments of debt | 20 | (536 | ) | (15 | ) | (911 | ) | ||||||
| Tender premium on extinguishment of senior notes | 20 | (65 | ) | — | — | ||||||||
| Proceeds from issue of term loan | — | — | 300 | ||||||||||
| Proceeds from issue of other debt | — | 1 | — | ||||||||||
| Make-whole on repurchase and redemption of senior notes | — | — | (158 | ) | |||||||||
| Repurchase of shares | — | (100 | ) | — | |||||||||
| Proceeds from issue of shares | 155 | 53 | 60 | ||||||||||
| Excess tax benefits from share-based payment arrangements | 2 | 2 | 5 | ||||||||||
| Dividends paid | (193 | ) | (185 | ) | (180 | ) | |||||||
| Proceeds from sale of noncontrolling interests | — | 3 | — | ||||||||||
| Acquisition of noncontrolling interests | (4 | ) | (39 | ) | (9 | ) | |||||||
| Dividends paid to noncontrolling interests | (10 | ) | (11 | ) | (13 | ) | |||||||
| Net cash used in continuing financing activities | (137 | ) | (291 | ) | (214 | ) | |||||||
| INCREASE IN CASH AND CASH EQUIVALENTS | 304 | 62 | 124 | ||||||||||
| Effect of exchange rate changes on cash and cash equivalents | (8 | ) | 2 | (4 | ) | ||||||||
| CASH AND CASH EQUIVALENTS, BEGINNING OF YEAR | 500 | 436 | 316 | ||||||||||
| CASH AND CASH EQUIVALENTS, END OF YEAR | $ | 796 | $ | 500 | $ | 436 | |||||||
| December 31, | |||||||||||||
| Note | 2013 | 2012 | 2011 | ||||||||||
| (millions, except share data) | |||||||||||||
| SHARES OUTSTANDING (thousands) | |||||||||||||
| Balance, beginning of year | 173,179 | 173,830 | 170,884 | ||||||||||
| Shares issued | — | 24 | — | ||||||||||
| Shares repurchased | — | (2,797 | ) | — | |||||||||
| Exercise of stock options and release of non-vested shares | 5,682 | 2,122 | 2,946 | ||||||||||
| Balance, end of year | 178,861 | 173,179 | 173,830 | ||||||||||
| ADDITIONAL PAID-IN CAPITAL | |||||||||||||
| Balance, beginning of year | $ | 1,125 | $ | 1,073 | $ | 985 | |||||||
| Issue of shares under employee stock compensation plans and related tax benefits | 153 | 50 | 49 | ||||||||||
| Issue of shares for acquisitions | — | 1 | — | ||||||||||
| Share-based compensation | 42 | 32 | 39 | ||||||||||
| Acquisition of noncontrolling interests | (4 | ) | (31 | ) | — | ||||||||
| Disposal of noncontrolling interests | — | 2 | — | ||||||||||
| Foreign currency translation | — | (2 | ) | — | |||||||||
| Balance, end of year | 1,316 | 1,125 | 1,073 | ||||||||||
| RETAINED EARNINGS | |||||||||||||
| Balance, beginning of year | 1,427 | 2,160 | 2,136 | ||||||||||
| Net income (loss) attributable to Willis Group Holdings | 365 | (446 | ) | 204 | |||||||||
| Dividends | (197 | ) | (187 | ) | (180 | ) | |||||||
| Repurchase of shares | — | (100 | ) | — | |||||||||
| Balance, end of year | 1,595 | 1,427 | 2,160 | ||||||||||
| ACCUMULATED OTHER COMPREHENSIVE LOSS, NET OF TAX | |||||||||||||
| Balance, beginning of year | (850 | ) | (744 | ) | (541 | ) | |||||||
| Other comprehensive income (loss) | 23 | 157 | (106 | ) | (203 | ) | |||||||
| Balance, end of year | (693 | ) | (850 | ) | (744 | ) | |||||||
| TREASURY SHARES | |||||||||||||
| Balance, beginning of year | (3 | ) | (3 | ) | (3 | ) | |||||||
| Balance, end of year | (3 | ) | (3 | ) | (3 | ) | |||||||
| TOTAL WILLIS GROUP HOLDINGS SHAREHOLDERS’ EQUITY | $ | 2,215 | $ | 1,699 | $ | 2,486 | |||||||
| (Continued on next page) | |||||||||||||
| December 31, | |||||||||||||
| Note | 2013 | 2012 | 2011 | ||||||||||
| (millions, except share data) | |||||||||||||
| NONCONTROLLING INTERESTS | |||||||||||||
| Balance, beginning of year | $ | 26 | $ | 31 | $ | 31 | |||||||
| Net income | 12 | 13 | 16 | ||||||||||
| Dividends | (10 | ) | (11 | ) | (15 | ) | |||||||
| Purchase of subsidiary shares from noncontrolling interests, net | — | (8 | ) | — | |||||||||
| Additional noncontrolling interests | — | 1 | — | ||||||||||
| Foreign currency translation | — | — | (1 | ) | |||||||||
| Balance, end of year | 28 | 26 | 31 | ||||||||||
| TOTAL EQUITY | $ | 2,243 | $ | 1,725 | $ | 2,517 | |||||||
| 1. | NATURE OF OPERATIONS |
| 2. | BASIS OF PRESENTATION AND SIGNIFICANT ACCOUNTING POLICIES |
| Expected | ||
| Amortization basis | life (years) | |
| Acquired other intangible assets | Straight line | 10 |
| Acquired client relationships | In line with underlying cashflows | 10 to 20 |
| Acquired non-compete agreements | Straight line | 5 |
| Acquired trade names | Straight line | 3 to 4 |
|
|
|
Jeffrey B. Lane — Mr. Lane, age 70, joined
| 3. | EMPLOYEES |
| Years ended December 31, | ||||||||
| 2013 | 2012 | 2011 | ||||||
| Global | 4,545 | 4,304 | 4,042 | |||||
| North America | 6,334 | 6,323 | 6,479 | |||||
| International | 7,072 | 6,843 | 6,634 | |||||
| Total Retail | 13,406 | 13,166 | 13,113 | |||||
| Total average number of employees for the year | 17,951 | 17,470 | 17,155 | |||||
| Years ended December 31, | |||||||||||
| 2013 | 2012 | 2011 | |||||||||
| (millions) | |||||||||||
| Salaries and other compensation awards including amortization and write-off of cash retention awards of $6 million, $416 million and $185 million (see below) | $ | 1,953 | $ | 2,258 | $ | 1,776 | |||||
| Share-based compensation | 42 | 32 | 41 | ||||||||
| Severance costs | 32 | 6 | 89 | ||||||||
| Social security costs | 135 | 133 | 130 | ||||||||
| Retirement benefits — defined benefit plan (income) expense | (4 | ) | 2 | 11 | |||||||
| Retirement benefits — defined contribution plan expense | 49 | 44 | 40 | ||||||||
| Total salaries and benefits expense | $ | 2,207 | $ | 2,475 | $ | 2,087 | |||||
| Years ended December 31, | |||||||||||
| 2013 | 2012 | 2011 | |||||||||
| (millions) | |||||||||||
| Cash retention awards made | $ | 12 | $ | 221 | $ | 210 | |||||
| Amortization of cash retention awards included in salaries and benefits | 6 | 216 | 185 | ||||||||
| 4. | SHARE-BASED COMPENSATION |
Wendy E. Lane — Ms. Lane, age 61, joineduses the Boardassumptions noted in the following table. Expected volatility is based on April 21, 2004 and currently serves as the Chairmanhistorical volatility of the Company’s Compensation Committee and memberstock. The Company uses the simplified method set out in Accounting Standard Codification (‘ASC’) 718-10-S99 to derive the expected term of options granted as it does not have sufficient historical exercise data to provide a reasonable basis upon which to estimate expected term. The risk-free rate for periods within the expected life of the Audit Committeeoption is based on the US Treasury yield curve in effect at the time of grant.
| Years ended December 31, | ||||||||
| 2013 | 2012 | 2011 | ||||||
| Expected volatility | 24.7 | % | 32.1 | % | 31.4 | % | ||
| Expected dividends | 2.6 | % | 3.2 | % | 2.5 | % | ||
| Expected life (years) | 4 | 5 | 6 | |||||
| Risk-free interest rate | 1.5 | % | 0.9 | % | 2.2 | % | ||
Weighted Average Exercise | Weighted Average Remaining Contractual | Aggregate Intrinsic | ||||||||||
| (Options in thousands) | Options | Price(i) | Term | Value | ||||||||
| (millions) | ||||||||||||
| Time-based stock options | ||||||||||||
| Balance, beginning of year | 10,152 | $ | 33.44 | |||||||||
| Granted | 1,612 | $ | 42.77 | |||||||||
| Exercised | (3,697 | ) | $ | 32.10 | ||||||||
| Forfeited | (47 | ) | $ | 38.42 | ||||||||
| Expired | (37 | ) | $ | 26.68 | ||||||||
| Balance, end of year | 7,983 | $ | 35.95 | 4 years | $ | 71 | ||||||
| Options vested or expected to vest at December 31, 2013 | 7,308 | $ | 35.99 | 4 years | $ | 64 | ||||||
| Options exercisable at December 31, 2013 | 3,976 | $ | 35.38 | 1 year | $ | 37 | ||||||
| Performance-based stock options | ||||||||||||
| Balance, beginning of year | 6,517 | $ | 32.19 | |||||||||
| Exercised | (1,111 | ) | $ | 29.27 | ||||||||
| Forfeited | (146 | ) | $ | 32.40 | ||||||||
| Balance, end of year | 5,260 | $ | 32.80 | 4 years | $ | 63 | ||||||
| Options vested or expected to vest at December 31, 2013 | 4,675 | $ | 32.61 | 4 years | $ | 57 | ||||||
| Options exercisable at December 31, 2013 | 2,716 | $ | 31.48 | 3 years | $ | 36 | ||||||
(i) | Certain options are exercisable in pounds sterling and are converted to dollars using the exchange rate at December 31, 2013. |
2 years.
| Weighted Average Grant Date | ||||||
| (Units awarded in thousands) | Shares | Fair Value | ||||
| Nonvested shares (restricted stock units) | ||||||
| Balance, beginning of year | 2,525 | $ | 33.80 | |||
| Granted | 1,377 | $ | 44.33 | |||
| Vested | (874 | ) | $ | 34.02 | ||
| Forfeited | (99 | ) | $ | 33.09 | ||
| Balance, end of year | 2,929 | $ | 38.71 | |||
| 5. | AUDITORS’ REMUNERATION |
| Years ended December 31, | |||||||||||
| 2013 | 2012 | 2011 | |||||||||
| (millions) | |||||||||||
| Audit of group consolidated financial statements | $ | 4 | $ | 4 | $ | 4 | |||||
| Other assurance services | 3 | 3 | 3 | ||||||||
| Other non-audit services | 1 | 1 | 1 | ||||||||
| Total auditors’ remuneration | $ | 8 | $ | 8 | $ | 8 | |||||
| 6. | NET GAIN (LOSS) ON DISPOSAL OF OPERATIONS |
|
|
|
|
James F. McCann — Mr. McCann, age 61, joined the Board on April 21, 2004 and currently serves asconsolidated statements of operations for the Board’s Presiding Independent Director, the Chairmanyear ended December 31, 2011 following conclusion of the Company’s Governance Committee,accounting for the Gras Savoye December 2009 leveraged transaction — see Note 15 — 'Investments in Associates'.
| 7. | INCOME TAXES |
| Years ended December 31, | |||||||||||
| 2013 | 2012 | 2011 | |||||||||
| (millions) | |||||||||||
| Ireland | $ | (52 | ) | $ | (47 | ) | $ | (39 | ) | ||
| US | (11 | ) | (615 | ) | (25 | ) | |||||
| UK | 282 | 25 | (58 | ) | |||||||
| Other jurisdictions | 280 | 300 | 361 | ||||||||
| Income (loss) from continuing operations before income taxes and interest in earnings of associates | $ | 499 | $ | (337 | ) | $ | 239 | ||||
| Years ended December 31, | |||||||||||
| 2013 | 2012 | 2011 | |||||||||
| (millions) | |||||||||||
| Current income taxes: | |||||||||||
| US federal tax | $ | 7 | $ | 3 | $ | 5 | |||||
| US state and local taxes | 3 | 1 | 1 | ||||||||
| UK corporation tax | 28 | 2 | (37 | ) | |||||||
| Other jurisdictions | 45 | 41 | 46 | ||||||||
| Total current taxes | 83 | 47 | 15 | ||||||||
| Deferred taxes: | |||||||||||
| US federal tax | 10 | (44 | ) | (6 | ) | ||||||
| US state and local taxes | 1 | (41 | ) | 1 | |||||||
| Effect of additional US valuation allowance | 2 | 113 | — | ||||||||
| UK corporation tax | 17 | 27 | 20 | ||||||||
| Other jurisdictions | 9 | (1 | ) | 2 | |||||||
| Total deferred taxes | 39 | 54 | 17 | ||||||||
| Total income taxes | $ | 122 | $ | 101 | $ | 32 | |||||
follows:
| |||||||||||||||||||||||||||||||||||||||||||||||||||||||||||||||||||||||||||||||||||||||||||||||||||||||||||||||||||||||||||||||||||||||||||||||||||||||||||||||||||||||||||||||||||||||||||||||||||||||||||||||||||||||||||||||||||||||||||||||||||||||||||||||||||||||||||
|
|
Joseph J. Plumeri —Mr. Plumeri, age 69, joined the Board on February 8, 2001 and currently serves as non-Executive Chairman and will serve until his retirement on July 7, 2013. Mr. Plumeri served as CEO of Willis Group Holdings plc is a non-trading holding company tax resident in Ireland where it is taxed at the statutory rate of 25%. The provision for income tax on continuing operations has been reconciled above to the US federal statutory tax rate of 35% to be consistent with prior periods.
| December 31, | |||||||
| 2013 | 2012 | ||||||
| (millions) | |||||||
| Deferred tax assets: | |||||||
| Accrued expenses not currently deductible | $ | 153 | $ | 120 | |||
| US state net operating losses | 70 | 64 | |||||
| US federal net operating losses | — | 28 | |||||
| UK net operating losses | 3 | — | |||||
| Other net operating losses | 5 | 8 | |||||
| UK capital losses | 43 | 42 | |||||
| Accrued retirement benefits | 47 | 101 | |||||
| Deferred compensation | 37 | 48 | |||||
| Stock options | 25 | 40 | |||||
| Gross deferred tax assets | 383 | 451 | |||||
| Less: valuation allowance | (196 | ) | (221 | ) | |||
| Net deferred tax assets | $ | 187 | $ | 230 | |||
| Deferred tax liabilities: | |||||||
| Cost of intangible assets, net of related amortization | $ | 120 | $ | 118 | |||
| Cost of tangible assets, net of related amortization | 44 | 51 | |||||
| Prepaid retirement benefits | 56 | 35 | |||||
| Accrued revenue not currently taxable | 23 | 29 | |||||
| Cash retention award | — | 2 | |||||
| Tax-leasing transactions | — | 1 | |||||
| Financial derivative transactions | 3 | 2 | |||||
| Deferred tax liabilities | 246 | 238 | |||||
| Net deferred tax (liability) asset | $ | (59 | ) | $ | (8 | ) | |
| December 31, | |||||||
| 2013 | 2012 | ||||||
| (millions) | |||||||
| Balance sheet classifications: | |||||||
| Current: | |||||||
| Deferred tax assets | $ | 15 | $ | 13 | |||
| Deferred tax liabilities | (25 | ) | (21 | ) | |||
| Net current deferred tax liabilities | (10 | ) | (8 | ) | |||
| Non-current: | |||||||
| Deferred tax assets | 7 | 18 | |||||
| Deferred tax liabilities | (56 | ) | (18 | ) | |||
| Net non-current deferred tax liabilities | (49 | ) | — | ||||
| Net deferred tax liabilities | $ | (59 | ) | $ | (8 | ) | |
Balance at beginning of year | Additions/ (releases) charged to costs and expenses | Other movements | Foreign exchange differences | Balance at end of year | |||||||||||||||
| Description | |||||||||||||||||||
| (millions) | |||||||||||||||||||
| Year Ended December 31, 2013 | |||||||||||||||||||
| Deferred tax valuation allowance | $ | 221 | $ | 15 | $ | (40 | ) | $ | — | $ | 196 | ||||||||
| Year Ended December 31, 2012 | |||||||||||||||||||
| Deferred tax valuation allowance | 102 | 110 | 12 | (3 | ) | 221 | |||||||||||||
| Year Ended December 31, 2011 | |||||||||||||||||||
| Deferred tax valuation allowance | 87 | — | 15 | — | 102 | ||||||||||||||
| 2013 | 2012 | 2011 | |||||||||
| (millions) | |||||||||||
| Balance at January 1 | $ | 37 | $ | 16 | $ | 13 | |||||
| Reductions due to a lapse of the applicable statute of limitation | (5 | ) | (3 | ) | — | ||||||
| Increases for positions taken in current period | 9 | 8 | — | ||||||||
| Increases for positions taken in prior periods | — | 16 | — | ||||||||
| Other movements | — | — | 3 | ||||||||
| Balance at December 31 | $ | 41 | $ | 37 | $ | 16 | |||||
| 8. | DISCONTINUED OPERATIONS |
| 9. | EARNINGS PER SHARE |
| Years ended December 31, | |||||||||||
| 2013 | 2012 | 2011 | |||||||||
| (millions, except per share data) | |||||||||||
| Net income (loss) attributable to Willis Group Holdings | $ | 365 | $ | (446 | ) | $ | 204 | ||||
| Basic average number of shares outstanding | 176 | 173 | 173 | ||||||||
| Dilutive effect of potentially issuable shares | 3 | — | 3 | ||||||||
| Diluted average number of shares outstanding | 179 | 173 | 176 | ||||||||
| Basic earnings per share: | |||||||||||
| Continuing operations | $ | 2.07 | $ | (2.58 | ) | $ | 1.17 | ||||
| Discontinued operations | — | — | 0.01 | ||||||||
| Net income (loss) attributable to Willis Group Holdings shareholders | $ | 2.07 | $ | (2.58 | ) | $ | 1.18 | ||||
| Dilutive effect of potentially issuable shares | (0.03 | ) | — | (0.02 | ) | ||||||
| Diluted earnings per share: | |||||||||||
| Continuing operations | $ | 2.04 | $ | (2.58 | ) | $ | 1.15 | ||||
| Discontinued operations | — | — | 0.01 | ||||||||
| Net income (loss) attributable to Willis Group Holdings shareholders | $ | 2.04 | $ | (2.58 | ) | $ | 1.16 | ||||
| 10. | ACQUISITIONS |
| 11. | FIDUCIARY ASSETS |
| 12. | FIXED ASSETS, NET |
Land and buildings (i) | Leasehold improvements | Furniture and equipment | Total | ||||||||||||
| (millions) | |||||||||||||||
| Cost: at January 1, 2012 | $ | 73 | $ | 210 | $ | 509 | $ | 792 | |||||||
| Additions | 3 | 16 | 116 | 135 | |||||||||||
| Disposals | — | (4 | ) | (59 | ) | (63 | ) | ||||||||
| Foreign exchange | 2 | 5 | 10 | 17 | |||||||||||
| Cost: at December 31, 2012 | 78 | 227 | 576 | 881 | |||||||||||
| Additions | 10 | 22 | 80 | 112 | |||||||||||
| Disposals | — | (7 | ) | (43 | ) | (50 | ) | ||||||||
| Foreign exchange | 1 | — | 5 | 6 | |||||||||||
| Cost: at December 31, 2013 | $ | 89 | $ | 242 | $ | 618 | $ | 949 | |||||||
| Depreciation: at January 1, 2012 | $ | (28 | ) | $ | (61 | ) | $ | (297 | ) | $ | (386 | ) | |||
| Depreciation expense provided | (3 | ) | (17 | ) | (59 | ) | (79 | ) | |||||||
| Disposals | — | 4 | 56 | 60 | |||||||||||
| Foreign exchange | (1 | ) | (1 | ) | (6 | ) | (8 | ) | |||||||
| Depreciation: at December 31, 2012 | (32 | ) | (75 | ) | (306 | ) | (413 | ) | |||||||
| Depreciation expense provided | (3 | ) | (18 | ) | (73 | ) | (94 | ) | |||||||
| Disposals | — | 6 | 36 | 42 | |||||||||||
| Foreign exchange | (1 | ) | — | (2 | ) | (3 | ) | ||||||||
| Depreciation: at December 31, 2013 | $ | (36 | ) | $ | (87 | ) | $ | (345 | ) | $ | (468 | ) | |||
| Net book value: | |||||||||||||||
| At December 31, 2012 | $ | 46 | $ | 152 | $ | 270 | $ | 468 | |||||||
| At December 31, 2013 | $ | 53 | $ | 155 | $ | 273 | $ | 481 | |||||||
(i) | Included within land and buildings are assets held under capital leases: At December 31, 2013, cost and accumulated depreciation were $31 million and $6 million respectively (2012: $25 million and $4 million, respectively; 2011: $23 million and $2 million respectively). Depreciation in the year ended December 31, 2013 was $2 million (2012: $1 million; 2011: $1 million). |
| 13. | GOODWILL |
| Global | North America | International | Total | ||||||||||||
| (millions) | |||||||||||||||
| Balance at January 1, 2012 | |||||||||||||||
| Goodwill, gross | $ | 1,122 | $ | 1,782 | $ | 391 | $ | 3,295 | |||||||
| Accumulated impairment losses | — | — | — | — | |||||||||||
| Goodwill, net | 1,122 | 1,782 | 391 | 3,295 | |||||||||||
| Purchase price allocation adjustments | — | — | 2 | 2 | |||||||||||
| Goodwill acquired during the year | — | 10 | 2 | 12 | |||||||||||
| Goodwill disposed of during the year | — | — | (1 | ) | (1 | ) | |||||||||
| Goodwill impairment charge | — | (492 | ) | — | (492 | ) | |||||||||
| Foreign exchange | 5 | — | 6 | 11 | |||||||||||
| Balance at December 31, 2012 | |||||||||||||||
| Goodwill, gross | 1,127 | 1,792 | 400 | 3,319 | |||||||||||
| Accumulated impairment losses | — | (492 | ) | — | (492 | ) | |||||||||
| Goodwill, net | $ | 1,127 | $ | 1,300 | $ | 400 | $ | 2,827 | |||||||
| Purchase price allocation adjustments | — | (1 | ) | — | (1 | ) | |||||||||
| Goodwill acquired during the year | 15 | — | 1 | 16 | |||||||||||
| Goodwill disposed of during the year | — | (14 | ) | — | (14 | ) | |||||||||
Other movements (i) | — | (1 | ) | — | (1 | ) | |||||||||
| Foreign exchange | 3 | — | 8 | 11 | |||||||||||
| Balance at December 31, 2013 | |||||||||||||||
| Goodwill, gross | 1,145 | 1,776 | 409 | 3,330 | |||||||||||
| Accumulated impairment losses | — | (492 | ) | — | (492 | ) | |||||||||
| Goodwill, net | $ | 1,145 | $ | 1,284 | $ | 409 | $ | 2,838 | |||||||
(i) | North America — $1 million (2012: $nil) tax benefit arising on the exercise of fully vested HRH stock options which were issued as part of the acquisition of HRH in 2008. |
| 14. | OTHER INTANGIBLE ASSETS, NET |
| December 31, 2013 | December 31, 2012 | ||||||||||||||||||||||
Gross carrying amount | Accumulated amortization | Net carrying amount | Gross carrying amount | Accumulated amortization | Net carrying amount | ||||||||||||||||||
| (millions) | |||||||||||||||||||||||
| Customer and Marketing Related: | |||||||||||||||||||||||
| Client Relationships | $ | 671 | $ | (326 | ) | $ | 345 | $ | 717 | $ | (340 | ) | $ | 377 | |||||||||
| Client Lists | 3 | (1 | ) | 2 | 3 | (1 | ) | 2 | |||||||||||||||
| Non-compete Agreements | 4 | (1 | ) | 3 | 3 | — | 3 | ||||||||||||||||
| Trade Names | 2 | (1 | ) | 1 | 11 | (10 | ) | 1 | |||||||||||||||
| Total Customer and Marketing Related | 680 | (329 | ) | 351 | 734 | (351 | ) | 383 | |||||||||||||||
| Contract based, Technology and Other | 5 | (3 | ) | 2 | 4 | (2 | ) | 2 | |||||||||||||||
| Total amortizable intangible assets | $ | 685 | $ | (332 | ) | $ | 353 | $ | 738 | $ | (353 | ) | $ | 385 | |||||||||
predecessor of Citigroup’s Salomon Smith Barney unit after overseeing the merger of Smith Barney and Shearson and servingnext five years ended December 31 is as the President and Managing Partner of Shearson since 1990. He is also a board member offollows:
| (millions) | |||
| 2014 | $ | 50 | |
| 2015 | 43 | ||
| 2016 | 38 | ||
| 2017 | 33 | ||
| 2018 | 29 | ||
| Thereafter | 160 | ||
| Total | $ | 353 | |
| 15. | INVESTMENTS IN ASSOCIATES |
| December 31, | |||||||
| Country | 2013 | 2012 | |||||
| Al-Futtaim Willis Co. L.L.C. | Dubai | 49 | % | 49 | % | ||
| GS & Cie Groupe | France | 30 | % | 30 | % | ||
| 2013 | 2012 | 2011 | |||||||||
| (millions) | |||||||||||
Condensed statements of operations data (i): | |||||||||||
| Total revenues | $ | 502 | $ | 497 | $ | 527 | |||||
| (Loss) income before income taxes | (48 | ) | (17 | ) | 5 | ||||||
| Net loss | (36 | ) | (14 | ) | (2 | ) | |||||
Condensed balance sheets data (i): | |||||||||||
| Total assets | 1,685 | 1,670 | 1,882 | ||||||||
| Total liabilities | 1,611 | 1,559 | 1,736 | ||||||||
| Stockholders’ equity | 74 | 111 | 146 | ||||||||
(i) | Disclosure is based on the Company’s best estimate of the results of its associates and is subject to change upon receipt of their financial statements for 2013. |
| 16. | OTHER ASSETS |
| December 31, | |||||||
| 2013 | 2012 | ||||||
| (millions) | |||||||
| Other current assets | |||||||
| Prepayments and accrued income | $ | 73 | $ | 61 | |||
| Income taxes receivable | 32 | 50 | |||||
| Deferred compensation plan assets | 26 | 12 | |||||
| Other receivables | 66 | 58 | |||||
| Total other current assets | $ | 197 | $ | 181 | |||
| Other non-current assets | |||||||
| Prepayments and accrued income | 16 | 24 | |||||
| Deferred compensation plan assets | 88 | 97 | |||||
| Income taxes receivable | 21 | 12 | |||||
| Accounts receivable, net | 28 | 25 | |||||
| Other investments | 19 | 12 | |||||
| Other receivables | 34 | 36 | |||||
| Total other non-current assets | $ | 206 | $ | 206 | |||
| Total other assets | $ | 403 | $ | 387 | |||
| 17. | OTHER LIABILITIES |
| December 31, | |||||||
| 2013 | 2012 | ||||||
| (millions) | |||||||
| Other current liabilities | |||||||
| Accounts payable | $ | 123 | $ | 88 | |||
| Accrued dividends payable | 51 | 47 | |||||
| Other taxes payable | 51 | 44 | |||||
| Deferred compensation plan liability | 26 | 12 | |||||
| Incentives from lessors | 12 | 9 | |||||
| Other payables | 152 | 127 | |||||
| Total other current liabilities | $ | 415 | $ | 327 | |||
| Other non-current liabilities | |||||||
| Incentives from lessors | $ | 183 | $ | 173 | |||
| Deferred compensation plan liability | 89 | 101 | |||||
| Income taxes payable | 40 | 33 | |||||
| Other payables | 62 | 68 | |||||
| Total other non-current liabilities | $ | 374 | $ | 375 | |||
| Total other liabilities | $ | 789 | $ | 702 | |||
| 18. | ALLOWANCE FOR DOUBTFUL ACCOUNTS |
Balance at beginning of year | Additions/ (releases) charged to costs and expenses | Deductions / Other movements | Foreign exchange differences | Balance at end of year | |||||||||||||||
| Description | |||||||||||||||||||
| (millions) | |||||||||||||||||||
| Year Ended December 31, 2013 | |||||||||||||||||||
| Allowance for doubtful accounts | $ | 14 | $ | 3 | $ | (4 | ) | $ | — | $ | 13 | ||||||||
| Year Ended December 31, 2012 | |||||||||||||||||||
| Allowance for doubtful accounts | $ | 13 | $ | 16 | $ | (15 | ) | $ | — | $ | 14 | ||||||||
| Year Ended December 31, 2011 | |||||||||||||||||||
| Allowance for doubtful accounts | $ | 12 | $ | 4 | $ | (3 | ) | $ | — | $ | 13 | ||||||||
| 19. | PENSION PLANS |
| UK Pension Benefits | US Pension Benefits | ||||||||||||||
| 2013 | 2012 | 2013 | 2012 | ||||||||||||
| (millions) | |||||||||||||||
| Change in benefit obligation: | |||||||||||||||
| Benefit obligation, beginning of year | $ | 2,582 | $ | 2,217 | $ | 958 | $ | 895 | |||||||
| Service cost | 37 | 35 | — | — | |||||||||||
| Interest cost | 109 | 108 | 38 | 41 | |||||||||||
| Employee contributions | 2 | 2 | — | — | |||||||||||
| Actuarial loss (gain) | 79 | 186 | (81 | ) | 71 | ||||||||||
| Benefits paid | (78 | ) | (77 | ) | (51 | ) | (49 | ) | |||||||
| Foreign currency changes | 54 | 111 | — | — | |||||||||||
| Benefit obligations, end of year | 2,785 | 2,582 | 864 | 958 | |||||||||||
| Change in plan assets: | |||||||||||||||
| Fair value of plan assets, beginning of year | 2,716 | 2,353 | 708 | 637 | |||||||||||
| Actual return on plan assets | 255 | 226 | 60 | 80 | |||||||||||
| Employee contributions | 2 | 2 | — | — | |||||||||||
| Employer contributions | 100 | 92 | 40 | 40 | |||||||||||
| Benefits paid | (78 | ) | (77 | ) | (51 | ) | (49 | ) | |||||||
| Foreign currency changes | 66 | 120 | — | — | |||||||||||
| Fair value of plan assets, end of year | 3,061 | 2,716 | 757 | 708 | |||||||||||
| Funded status at end of year | $ | 276 | $ | 134 | $ | (107 | ) | $ | (250 | ) | |||||
| Components on the Consolidated Balance Sheets: | |||||||||||||||
| Pension benefits asset | $ | 276 | $ | 134 | $ | — | $ | — | |||||||
| Liability for pension benefits | — | — | (107 | ) | (250 | ) | |||||||||
| UK Pension Benefits | US Pension Benefits | ||||||||||||||
| 2013 | 2012 | 2013 | 2012 | ||||||||||||
| (millions) | |||||||||||||||
| Net actuarial loss | $ | 815 | $ | 831 | $ | 233 | $ | 332 | |||||||
| Prior service gain | (24 | ) | (29 | ) | — | — | |||||||||
| Years ended December 31, | |||||||||||||||||||||||
| UK Pension Benefits | US Pension Benefits | ||||||||||||||||||||||
| 2013 | 2012 | 2011 | 2013 | 2012 | 2011 | ||||||||||||||||||
| (millions) | |||||||||||||||||||||||
| Components of net periodic benefit (income) cost: | |||||||||||||||||||||||
| Service cost | $ | 37 | $ | 35 | $ | 36 | $ | — | $ | — | $ | — | |||||||||||
| Interest cost | 109 | 108 | 106 | 38 | 41 | 41 | |||||||||||||||||
| Expected return on plan assets | (191 | ) | (181 | ) | (161 | ) | (51 | ) | (46 | ) | (44 | ) | |||||||||||
| Amortization of unrecognized prior service gain | (5 | ) | (6 | ) | (5 | ) | — | — | — | ||||||||||||||
| Amortization of unrecognized actuarial loss | 45 | 39 | 30 | 9 | 8 | 3 | |||||||||||||||||
| Net periodic benefit (income) cost | $ | (5 | ) | $ | (5 | ) | $ | 6 | $ | (4 | ) | $ | 3 | $ | — | ||||||||
| Other changes in plan assets and benefit obligations recognized in other comprehensive income (loss): | |||||||||||||||||||||||
| Net actuarial loss (gain) | $ | 15 | $ | 141 | $ | 164 | $ | (90 | ) | $ | 37 | $ | 137 | ||||||||||
| Amortization of unrecognized actuarial loss | (45 | ) | (39 | ) | (30 | ) | (9 | ) | (8 | ) | (3 | ) | |||||||||||
| Prior service gain | — | — | (10 | ) | — | — | — | ||||||||||||||||
| Amortization of unrecognized prior service gain | 5 | 6 | 5 | — | — | — | |||||||||||||||||
| Total recognized in other comprehensive income (loss) | $ | (25 | ) | $ | 108 | $ | 129 | $ | (99 | ) | $ | 29 | $ | 134 | |||||||||
| Total recognized in net periodic benefit cost and other comprehensive income | $ | (30 | ) | $ | 103 | $ | 135 | $ | (103 | ) | $ | 32 | $ | 134 | |||||||||
UK Pension Benefits | US Pension Benefits | ||||||
| (millions) | |||||||
| Estimated net loss | $ | 42 | $ | 6 | |||
| Prior service gain | (3 | ) | — | ||||
| Years ended December 31, | |||||||||||
| UK Pension Benefits | US Pension Benefits | ||||||||||
| 2013 | 2012 | 2013 | 2012 | ||||||||
| Weighted-average assumptions to determine benefit obligations: | |||||||||||
| Discount rate | 4.4 | % | 4.4 | % | 4.8 | % | 4.1 | % | |||
| Rate of compensation increase | 3.2 | % | 2.3 | % | N/A | N/A | |||||
| Weighted-average assumptions to determine net periodic benefit cost: | |||||||||||
| Discount rate | 4.4 | % | 4.8 | % | 4.1 | % | 4.6 | % | |||
| Expected return on plan assets | 7.3 | % | 7.5 | % | 7.3 | % | 7.3 | % | |||
| Rate of compensation increase | 2.3 | % | 2.1 | % | N/A | N/A | |||||
| Years ended December 31, | ||||||||||||
| UK Pension Benefits | US Pension Benefits | |||||||||||
| Asset Category | 2013 | 2012 | 2013 | 2012 | ||||||||
| Equity securities | 36 | % | 41 | % | 52 | % | 49 | % | ||||
| Debt securities | 38 | % | 37 | % | 46 | % | 50 | % | ||||
| Hedge funds | 17 | % | 17 | % | — | % | — | % | ||||
| Real estate | 3 | % | 3 | % | — | % | — | % | ||||
| Cash | 6 | % | 2 | % | — | % | — | % | ||||
| Other | — | % | — | % | 2 | % | 1 | % | ||||
| Total | 100 | % | 100 | % | 100 | % | 100 | % | ||||
| UK Pension Plan | ||||||||||||||||
| December 31, 2013 | Level 1 | Level 2 | Level 3 | Total | ||||||||||||
| (millions) | ||||||||||||||||
| Equity securities: | ||||||||||||||||
| US equities | $ | 659 | $ | 81 | $ | — | $ | 740 | ||||||||
| UK equities | 239 | 17 | — | 256 | ||||||||||||
| Other equities | 40 | 63 | — | 103 | ||||||||||||
| Fixed income securities: | ||||||||||||||||
| US Government bonds | 31 | — | — | 31 | ||||||||||||
| UK Government bonds | 656 | — | — | 656 | ||||||||||||
| Other Government bonds | 7 | — | 100 | 107 | ||||||||||||
| UK corporate bonds | 75 | — | — | 75 | ||||||||||||
| Other corporate bonds | 151 | — | — | 151 | ||||||||||||
| Derivatives | — | 154 | — | 154 | ||||||||||||
| Real estate | — | — | 92 | 92 | ||||||||||||
| Cash | 163 | — | — | 163 | ||||||||||||
| Other investments: | ||||||||||||||||
| Hedge funds | — | 28 | 477 | 505 | ||||||||||||
| Other | — | 28 | — | 28 | ||||||||||||
| Total | $ | 2,021 | $ | 371 | $ | 669 | $ | 3,061 | ||||||||
| UK Pension Plan | ||||||||||||||||
| December 31, 2012 | Level 1 | Level 2 | Level 3 | Total | ||||||||||||
| (millions) | ||||||||||||||||
| Equity securities: | ||||||||||||||||
| US equities | $ | 492 | $ | 108 | $ | — | $ | 600 | ||||||||
| UK equities | 317 | 59 | — | 376 | ||||||||||||
| Other equities | 28 | 97 | — | 125 | ||||||||||||
| Fixed income securities: | ||||||||||||||||
| US Government bonds | 11 | — | — | 11 | ||||||||||||
| UK Government bonds | 625 | — | — | 625 | ||||||||||||
| Other Government bonds | 13 | — | — | 13 | ||||||||||||
| UK corporate bonds | 112 | — | — | 112 | ||||||||||||
| Other corporate bonds | 29 | — | — | 29 | ||||||||||||
| Derivatives | — | 217 | — | 217 | ||||||||||||
| Real estate | — | — | 76 | 76 | ||||||||||||
| Cash | 53 | — | — | 53 | ||||||||||||
| Other investments: | ||||||||||||||||
| Hedge funds | — | 27 | 431 | 458 | ||||||||||||
| Other | 8 | 13 | — | 21 | ||||||||||||
| Total | $ | 1,688 | $ | 521 | $ | 507 | $ | 2,716 | ||||||||
| US Pension Plan | ||||||||||||||||
| December 31, 2013 | Level 1 | Level 2 | Level 3 | Total | ||||||||||||
| (millions) | ||||||||||||||||
| Equity securities: | ||||||||||||||||
| US equities | $ | 120 | $ | 125 | $ | — | $ | 245 | ||||||||
| Non US equities | 116 | 33 | — | 149 | ||||||||||||
| Fixed income securities: | ||||||||||||||||
| US Government bonds | — | 55 | — | 55 | ||||||||||||
| US corporate bonds | — | 151 | — | 151 | ||||||||||||
| International fixed income securities | 58 | 42 | — | 100 | ||||||||||||
| Municipal & Non US government bonds | — | 30 | — | 30 | ||||||||||||
| Other investments: | ||||||||||||||||
| Mortgage backed securities | — | 12 | — | 12 | ||||||||||||
| Other | 9 | 6 | — | 15 | ||||||||||||
| Total | $ | 303 | $ | 454 | $ | — | $ | 757 | ||||||||
| US Pension Plan | ||||||||||||||||
| December 31, 2012 | Level 1 | Level 2 | Level 3 | Total | ||||||||||||
| (millions) | ||||||||||||||||
| Equity securities: | ||||||||||||||||
| US equities | $ | 144 | $ | 78 | $ | — | $ | 222 | ||||||||
| Non US equities | 98 | 27 | — | 125 | ||||||||||||
| Fixed income securities: | ||||||||||||||||
| US Government bonds | — | 69 | — | 69 | ||||||||||||
| US corporate bonds | — | 144 | — | 144 | ||||||||||||
| International fixed income securities | 52 | 39 | — | 91 | ||||||||||||
| Municipal & Non US government bonds | — | 35 | — | 35 | ||||||||||||
| Other investments: | ||||||||||||||||
| Mortgage backed securities | — | 13 | — | 13 | ||||||||||||
| Other | 3 | 6 | — | 9 | ||||||||||||
| Total | $ | 297 | $ | 411 | $ | — | $ | 708 | ||||||||
| UK Pension | |||
| Plan | |||
| Level 3 | |||
| (millions) | |||
| Balance at January 1, 2012 | $ | 476 | |
| Purchases, sales, issuances and settlements, net | (2 | ) | |
| Unrealized and realized gains relating to instruments still held at end of year | 17 | ||
| Foreign exchange | 16 | ||
| Balance at December 31, 2012 | $ | 507 | |
| Purchases, sales, issuances and settlements, net | 121 | ||
| Unrealized and realized gains relating to instruments still held at end of year | 29 | ||
| Foreign exchange | 12 | ||
| Balance at December 31, 2013 | $ | 669 | |
| Expected future benefit payments | UK Pension Benefits | US Pension Benefits | ||||
| (millions) | ||||||
| 2014 | 84 | 38 | ||||
| 2015 | 88 | 42 | ||||
| 2016 | 89 | 44 | ||||
| 2017 | 93 | 46 | ||||
| 2018 | 94 | 49 | ||||
| 2019-2023 | 518 | 271 | ||||
| Other defined benefit plans | |||||||
| 2013 | 2012 | ||||||
| (millions) | |||||||
| Change in benefit obligation: | |||||||
| Benefit obligation, beginning of year | $ | 180 | $ | 131 | |||
| Service cost | 3 | 3 | |||||
| Interest cost | 7 | 7 | |||||
| Actuarial (gain) loss | (5 | ) | 30 | ||||
| Benefits paid | (6 | ) | (6 | ) | |||
| Employee contributions | — | 1 | |||||
Reclassification from other non-current liabilities (i) | 10 | 9 | |||||
| Foreign currency changes | 6 | 5 | |||||
| Benefit obligations, end of year | 195 | 180 | |||||
| Change in plan assets: | |||||||
| Fair value of plan assets, beginning of year | 150 | 128 | |||||
| Actual return on plan assets | 9 | 11 | |||||
| Employer contributions | 10 | 11 | |||||
| Employee contributions | — | 1 | |||||
| Benefits paid | (6 | ) | (6 | ) | |||
| Foreign currency changes | 5 | 5 | |||||
| Fair value of plan assets, end of year | 168 | 150 | |||||
| Funded status at end of year | $ | (27 | ) | $ | (30 | ) | |
| Components on the Consolidated Balance Sheets: | |||||||
| Pension benefits asset | $ | 2 | $ | 2 | |||
| Liability for pension benefits | $ | (29 | ) | $ | (32 | ) | |
(i) | Transfer in of benefit obligation for UK unfunded and US non-qualified plans from non-current other liabilities. |
| Other defined benefit plans | |||||||||||
| 2013 | 2012 | 2011 | |||||||||
| (millions) | |||||||||||
| Components of net periodic benefit cost: | |||||||||||
| Service cost | $ | 3 | $ | 3 | $ | 4 | |||||
| Interest cost | 7 | 7 | 7 | ||||||||
| Expected return on plan assets | (6 | ) | (6 | ) | (6 | ) | |||||
| Amortization of unrecognized actuarial loss | 1 | — | 1 | ||||||||
| Curtailment gain | — | — | (1 | ) | |||||||
| Net periodic benefit cost | $ | 5 | $ | 4 | $ | 5 | |||||
| Other changes in plan assets and benefit obligations recognized in other comprehensive income (loss): | |||||||||||
| Amortization of unrecognized actuarial loss | $ | (1 | ) | $ | — | $ | (1 | ) | |||
| Net actuarial (gain) loss | (8 | ) | 25 | 2 | |||||||
| Total recognized in other comprehensive (income) loss | (9 | ) | 25 | 1 | |||||||
| Total recognized in net periodic benefit cost and other comprehensive (income) loss | $ | (4 | ) | $ | 29 | $ | 6 | ||||
| Other defined benefit plans | |||
| 2013 | 2012 | ||
| Weighted-average assumptions to determine benefit obligations: | |||
| Discount rate | 3.30% - 4.40% | 2.50% - 3.75% | |
| Rate of compensation increase | 2.00% - 2.50% | 2.00% | |
| Weighted-average assumptions to determine net periodic benefit cost: | |||
| Discount rate | 2.50% - 4.40% | 3.30% - 5.30% | |
| Expected return on plan assets | 2.00% - 4.66% | 2.00% - 5.73% | |
| Rate of compensation increase | 2.00% - 2.50% | 2.50% - 3.00% | |
| Other defined benefit plans | ||||||
| Asset Category | 2013 | 2012 | ||||
| Equity securities | 35 | % | 35 | % | ||
| Debt securities | 39 | % | 39 | % | ||
| Real estate | 3 | % | 3 | % | ||
| Derivatives | 14 | % | 16 | % | ||
| Other | 9 | % | 7 | % | ||
| Total | 100 | % | 100 | % | ||
| Other defined benefit plans | ||||||||||||||||
| December 31, 2013 | Level 1 | Level 2 | Level 3 | Total | ||||||||||||
| (millions) | ||||||||||||||||
| Equity securities: | ||||||||||||||||
| US equities | $ | 29 | $ | — | $ | — | $ | 29 | ||||||||
| UK equities | 5 | — | — | 5 | ||||||||||||
| Overseas equities | 26 | — | — | 26 | ||||||||||||
| Fixed income securities: | ||||||||||||||||
| Other Government bonds | 61 | — | — | 61 | ||||||||||||
| Corporate bonds | 4 | — | — | 4 | ||||||||||||
| Derivative instruments | — | 23 | — | 23 | ||||||||||||
| Real estate | — | — | 5 | 5 | ||||||||||||
| Cash | 8 | — | — | 8 | ||||||||||||
| Other investments: | ||||||||||||||||
| Other investments | — | — | 7 | 7 | ||||||||||||
| Total | $ | 133 | $ | 23 | $ | 12 | $ | 168 | ||||||||
| Other defined benefit plans | ||||||||||||||||
| December 31, 2012 | Level 1 | Level 2 | Level 3 | Total | ||||||||||||
| (millions) | ||||||||||||||||
| Equity securities: | ||||||||||||||||
| US equities | $ | 24 | $ | — | $ | — | $ | 24 | ||||||||
| UK equities | 5 | — | — | 5 | ||||||||||||
| Overseas equities | 22 | — | 1 | 23 | ||||||||||||
| Fixed income securities: | ||||||||||||||||
| Other Government bonds | 49 | — | — | 49 | ||||||||||||
| Corporate bonds | — | 9 | — | 9 | ||||||||||||
| Derivative instruments | — | 24 | — | 24 | ||||||||||||
| Real estate | — | — | 5 | 5 | ||||||||||||
| Cash | 5 | — | — | 5 | ||||||||||||
| Other investments: | ||||||||||||||||
| Other investments | — | 1 | 5 | 6 | ||||||||||||
| Total | $ | 105 | $ | 34 | $ | 11 | $ | 150 | ||||||||
| Other defined benefit plans | ||||
| Pension | ||||
| Expected future benefit payments | Benefits | |||
| (millions) | ||||
| 2014 | $ | 6 | ||
| 2015 | 6 | |||
| 2016 | 6 | |||
| 2017 | 6 | |||
| 2018 | 7 | |||
| 2019-2023 | 35 | |||
| 20. | DEBT |
| December 31, | |||||||
| 2013 | 2012 | ||||||
| (millions) | |||||||
| Current portion of 7-year term loan facility expires 2018 | $ | 15 | $ | 15 | |||
| December 31, | |||||||
| 2013 | 2012 | ||||||
| (millions) | |||||||
| 7-year term loan facility expires 2018 | $ | 259 | $ | 274 | |||
| 5.625% senior notes due 2015 | 148 | 350 | |||||
| Fair value adjustment on 5.625% senior notes due 2015 | 4 | 18 | |||||
| 4.125% senior notes due 2016 | 299 | 299 | |||||
| 6.200% senior notes due 2017 | 394 | 600 | |||||
| 7.000% senior notes due 2019 | 187 | 300 | |||||
| 5.750% senior notes due 2021 | 496 | 496 | |||||
| 4.625% senior notes due 2023 | 249 | — | |||||
| 6.125% senior notes due 2043 | 274 | — | |||||
| 3-year term loan facility expires 2015 | 1 | 1 | |||||
| $ | 2,311 | $ | 2,338 | ||||
Douglas B. Roberts — Mr. Roberts, age 65, joinedreduction of the Boardfair value adjustment on February 13, 20035.625% senior notes due 2015 of $7 million.
| Year ended December 31, | |||||||||||
| 2013 | 2012 | 2011 | |||||||||
| (millions) | |||||||||||
| 5.625% senior notes due 2015 | $ | 12 | $ | 12 | $ | 12 | |||||
| 12.875% senior notes due 2016 | — | — | 15 | ||||||||
| 4.125% senior notes due 2016 | 13 | 13 | 10 | ||||||||
| 6.200% senior notes due 2017 | 33 | 38 | 38 | ||||||||
| 7.000% senior notes due 2019 | 18 | 21 | 21 | ||||||||
| 5.750% senior notes due 2021 | 29 | 29 | 23 | ||||||||
| 4.625% senior notes due 2023 | 4 | — | — | ||||||||
| 6.125% senior notes due 2043 | 6 | — | — | ||||||||
| 7-year term loan facility expires 2018 | 6 | 6 | — | ||||||||
| 5-year term loan facility repaid 2011 | — | — | 14 | ||||||||
| Revolving $800 million credit facility | 2 | 1 | — | ||||||||
| Revolving $300 million credit facility | — | — | 4 | ||||||||
Other(i) | 3 | 8 | 19 | ||||||||
| Total interest expense | $ | 126 | $ | 128 | $ | 156 | |||||
(i) | In 2013, Other includes $nil (2012: $nil; 2011:$10 million ) relating to the write-off of unamortized debt issuance fees. |
| 21. | PROVISIONS FOR LIABILITIES |
Claims, lawsuits and other proceedings(i) | Other provisions(ii) | Total | |||||||||
| (millions) | |||||||||||
| Balance at January 1, 2012 | $ | 158 | $ | 38 | $ | 196 | |||||
| Net provisions made during the year | 23 | (2 | ) | 21 | |||||||
| Utilized in the year | (31 | ) | (10 | ) | (41 | ) | |||||
| Foreign currency translation adjustment | 2 | 2 | 4 | ||||||||
| Balance at December 31, 2012 | $ | 152 | $ | 28 | $ | 180 | |||||
| Net provisions made during the year | 28 | 6 | 34 | ||||||||
Balances transferred in during the year (iii) | — | 13 | 13 | ||||||||
| Utilized in the year | (17 | ) | (6 | ) | (23 | ) | |||||
| Foreign currency translation adjustment | 1 | 1 | 2 | ||||||||
| Balance at December 31, 2013 | $ | 164 | $ | 42 | $ | 206 | |||||
(i) | The claims, lawsuits and other proceedings provision includes E&O cases which represents management’s assessment of liabilities that may arise from asserted and unasserted claims for alleged errors and omissions that arise in the ordinary course of the Group’s business. Where some of the potential liability is recoverable under the Group’s external insurance arrangements, the full assessment of the liability is included in the provision with the associated insurance recovery shown separately as an asset. Insurance recoveries recognized at December 31, 2013 amounted to $nil (2012: $6 million). |
(ii) | The ‘Other’ category includes amounts relating to vacant property provisions of $10 million (2012: $13 million). |
(iii) | Provisions held in the UK for ongoing post placement services, long term disability provisions and legal claim provisions all previously recognized within Deferred Revenue and Accrued Expenses were transferred to Provisions for Liabilities during 2013. |
| 22. | COMMITMENTS AND CONTINGENCIES |
| Payments due by | |||||||||||||||||||
Obligations (iii) | Total | 2014 | 2015-2016 | 2017-2018 | After 2018 | ||||||||||||||
| (millions) | |||||||||||||||||||
| 7-year term loan facility expires 2018 | $ | 274 | $ | 15 | $ | 39 | $ | 220 | $ | — | |||||||||
| Interest on term loan | 19 | 5 | 9 | 5 | — | ||||||||||||||
| Revolving $800 million credit facility commitment fees | 9 | 2 | 4 | 3 | — | ||||||||||||||
| 5.625% senior notes due 2015 | 148 | — | 148 | — | — | ||||||||||||||
| Fair value adjustments on 5.625% senior notes due 2015 | 4 | — | 4 | — | — | ||||||||||||||
| 4.125% senior notes due 2016 | 300 | — | 300 | — | — | ||||||||||||||
| 6.200% senior notes due 2017 | 394 | — | — | 394 | — | ||||||||||||||
| 7.000% senior notes due 2019 | 187 | — | — | — | 187 | ||||||||||||||
| 5.750% senior notes due 2021 | 500 | — | — | — | 500 | ||||||||||||||
| 4.625% senior notes due 2023 | 250 | — | — | — | 250 | ||||||||||||||
| 6.125% senior notes due 2043 | 275 | — | — | — | 275 | ||||||||||||||
| Interest on senior notes | 1,011 | 115 | 209 | 146 | 541 | ||||||||||||||
| Total debt and related interest | 3,371 | 137 | 713 | 768 | 1,753 | ||||||||||||||
Operating leases(i) | 1,235 | 131 | 213 | 167 | 724 | ||||||||||||||
| Pensions | 566 | 122 | 244 | 161 | 39 | ||||||||||||||
Other contractual obligations(ii) | 91 | 24 | 16 | 12 | 39 | ||||||||||||||
| Total contractual obligations | $ | 5,263 | $ | 414 | $ | 1,186 | $ | 1,108 | $ | 2,555 | |||||||||
(i) | Presented gross of sublease income. |
(ii) | Other contractual obligations include capital lease commitments, put option obligations and investment fund capital call obligations, the timing of which are included at the earliest point they may fall due. |
(iii) | The above excludes $41 million of liabilities for unrecognized tax benefits as the Company is unable to reasonably predict the timing of settlement of these liabilities. |
Gross rental commitments | Rentals from subleases | Net rental commitments | |||||||||
| (millions) | |||||||||||
| 2014 | $ | 131 | $ | (15 | ) | $ | 116 | ||||
| 2015 | 114 | (14 | ) | 100 | |||||||
| 2016 | 99 | (13 | ) | 86 | |||||||
| 2017 | 88 | (12 | ) | 76 | |||||||
| 2018 | 79 | (8 | ) | 71 | |||||||
| Thereafter | 724 | (16 | ) | 708 | |||||||
| Total | $ | 1,235 | $ | (78 | ) | $ | 1,157 | ||||
| 23. | ACCUMULATED OTHER COMPREHENSIVE LOSS, NET OF TAX |
| December 31, 2013 | December 31, 2012 | December 31, 2011 | |||||||||||||||||||||||||||||||||
| Before tax amount | Tax | Net of tax amount | Before tax amount | Tax | Net of tax amount | Before tax amount | Tax | Net of tax amount | |||||||||||||||||||||||||||
| (millions) | |||||||||||||||||||||||||||||||||||
| Other comprehensive income: | |||||||||||||||||||||||||||||||||||
| Foreign currency translation adjustments | $ | 20 | $ | — | $ | 20 | $ | 46 | $ | — | $ | 46 | $ | (29 | ) | $ | — | $ | (29 | ) | |||||||||||||||
| Pension funding adjustments: | |||||||||||||||||||||||||||||||||||
| Foreign currency translation on pension funding adjustments | (15 | ) | 5 | (10 | ) | (31 | ) | 9 | (22 | ) | 8 | — | 8 | ||||||||||||||||||||||
| Net actuarial gain (loss) | 83 | 2 | 85 | (203 | ) | 36 | (167 | ) | (303 | ) | 95 | (208 | ) | ||||||||||||||||||||||
| Prior service gain | — | — | — | — | — | — | 10 | (3 | ) | 7 | |||||||||||||||||||||||||
| Amortization of unrecognized actuarial loss | 55 | (9 | ) | 46 | 47 | (9 | ) | 38 | 34 | (9 | ) | 25 | |||||||||||||||||||||||
| Amortization of unrecognized prior service gain | (5 | ) | 1 | (4 | ) | (6 | ) | 1 | (5 | ) | (5 | ) | 1 | (4 | ) | ||||||||||||||||||||
| 118 | (1 | ) | 117 | (193 | ) | 37 | (156 | ) | (256 | ) | 84 | (172 | ) | ||||||||||||||||||||||
| Derivative instruments: | |||||||||||||||||||||||||||||||||||
| Gain on interest rate swaps (effective element) | — | — | — | 3 | (1 | ) | 2 | 13 | (3 | ) | 10 | ||||||||||||||||||||||||
| Interest rate reclassification adjustment | (5 | ) | 1 | (4 | ) | (5 | ) | 1 | (4 | ) | (14 | ) | 4 | (10 | ) | ||||||||||||||||||||
| Gain on forward exchange contracts (effective element) | 10 | (2 | ) | 8 | 11 | (2 | ) | 9 | 3 | (1 | ) | 2 | |||||||||||||||||||||||
| Forward exchange contract reclassification adjustment | 1 | — | 1 | (4 | ) | 1 | (3 | ) | (7 | ) | 2 | (5 | ) | ||||||||||||||||||||||
| Gain on treasury lock (effective element) | 19 | (4 | ) | 15 | — | — | — | — | — | — | |||||||||||||||||||||||||
| 25 | (5 | ) | 20 | 5 | (1 | ) | 4 | (5 | ) | 2 | (3 | ) | |||||||||||||||||||||||
| Other comprehensive income (loss) | 163 | (6 | ) | 157 | (142 | ) | 36 | (106 | ) | (290 | ) | 86 | (204 | ) | |||||||||||||||||||||
| Less: Other comprehensive income attributable to noncontrolling interests | — | — | — | — | — | — | 1 | — | 1 | ||||||||||||||||||||||||||
| Other comprehensive income (loss) attributable to Willis Group Holdings | $ | 163 | $ | (6 | ) | $ | 157 | $ | (142 | ) | $ | 36 | $ | (106 | ) | $ | (289 | ) | $ | 86 | $ | (203 | ) | ||||||||||||
| Net foreign currency translation adjustment | Pension funding adjustment | Net unrealized gain on derivative instruments | Total | ||||||||||||
| (millions) | |||||||||||||||
| Balance, December 31, 2010 | $ | (52 | ) | $ | (503 | ) | $ | 14 | $ | (541 | ) | ||||
| Other comprehensive (loss) income before reclassifications | (28 | ) | (193 | ) | 12 | (209 | ) | ||||||||
| Amounts reclassified from accumulated other comprehensive income | — | 21 | (15 | ) | 6 | ||||||||||
| Net current year other comprehensive income (loss), net of tax and noncontrolling interests | (28 | ) | (172 | ) | (3 | ) | (203 | ) | |||||||
| Balance, December 31, 2011 | $ | (80 | ) | $ | (675 | ) | $ | 11 | $ | (744 | ) | ||||
| Other comprehensive income (loss) before reclassifications | 46 | (189 | ) | 11 | (132 | ) | |||||||||
| Amounts reclassified from accumulated other comprehensive income | — | 33 | (7 | ) | 26 | ||||||||||
| Net current year other comprehensive income (loss), net of tax and noncontrolling interests | 46 | (156 | ) | 4 | (106 | ) | |||||||||
| Balance, December 31, 2012 | $ | (34 | ) | $ | (831 | ) | $ | 15 | $ | (850 | ) | ||||
| Other comprehensive income (loss) before reclassifications | 20 | 75 | 23 | 118 | |||||||||||
| Amounts reclassified from accumulated other comprehensive income | — | 42 | (3 | ) | 39 | ||||||||||
| Net current year other comprehensive income (loss), net of tax and noncontrolling interests | 20 | 117 | 20 | 157 | |||||||||||
| Balance, December 31, 2013 | $ | (14 | ) | $ | (714 | ) | $ | 35 | $ | (693 | ) | ||||
| Details about accumulated other comprehensive income components | Amount reclassified from accumulated other comprehensive income | Affected line item in the statement of operations | ||||||||||||
| Years ended December 31, | ||||||||||||||
| 2013 | 2012 | 2011 | ||||||||||||
| (millions) | ||||||||||||||
| Gains and losses on cash flow hedges (Note 26) | ||||||||||||||
| Interest rate swaps | $ | (5 | ) | $ | (5 | ) | $ | (14 | ) | Investment income | ||||
| Foreign exchange contracts | 1 | (4 | ) | (7 | ) | Other operating expenses | ||||||||
| (4 | ) | (9 | ) | (21 | ) | Total before tax | ||||||||
| Tax | 1 | 2 | 6 | |||||||||||
| $ | (3 | ) | $ | (7 | ) | $ | (15 | ) | Net of tax | |||||
| Amortization of defined benefit pension items (Note 19) | ||||||||||||||
| Prior service gain | $ | (5 | ) | $ | (6 | ) | $ | (5 | ) | Salaries and benefits | ||||
| Net actuarial loss | 55 | 47 | 34 | Salaries and benefits | ||||||||||
| 50 | 41 | 29 | Total before tax | |||||||||||
| Tax | (8 | ) | (8 | ) | (8 | ) | ||||||||
| $ | 42 | $ | 33 | $ | 21 | Net of tax | ||||||||
| Total reclassifications for the period | $ | 39 | $ | 26 | $ | 6 | ||||||||
| 24. | EQUITY AND NONCONTROLLING INTEREST |
| December 31, 2013 | December 31, 2012 | December 31, 2011 | |||||||||||||||||||||||||||||||||
Willis Group Holdings’ stockholders | Noncontrolling interests | Total equity | Willis Group Holdings’ stockholders | Noncontrolling interests | Total equity | Willis Group Holdings’ stockholders | Noncontrolling interests | Total equity | |||||||||||||||||||||||||||
| (millions) | |||||||||||||||||||||||||||||||||||
| Balance at January 1, | $ | 1,699 | $ | 26 | $ | 1,725 | $ | 2,486 | $ | 31 | $ | 2,517 | $ | 2,577 | $ | 31 | $ | 2,608 | |||||||||||||||||
| Comprehensive income: | |||||||||||||||||||||||||||||||||||
| Net income (loss) | 365 | 12 | 377 | (446 | ) | 13 | (433 | ) | 204 | 16 | 220 | ||||||||||||||||||||||||
| Other comprehensive income (loss), net of tax | 157 | — | 157 | (106 | ) | — | (106 | ) | (203 | ) | (1 | ) | (204 | ) | |||||||||||||||||||||
| Comprehensive income (loss) | 522 | 12 | 534 | (552 | ) | 13 | (539 | ) | 1 | 15 | 16 | ||||||||||||||||||||||||
| Dividends | (197 | ) | (10 | ) | (207 | ) | (187 | ) | (11 | ) | (198 | ) | (180 | ) | (15 | ) | (195 | ) | |||||||||||||||||
| Additional paid-in capital | 195 | — | 195 | 81 | — | 81 | 88 | — | 88 | ||||||||||||||||||||||||||
Repurchase of shares (i) | — | — | — | (100 | ) | — | (100 | ) | — | — | — | ||||||||||||||||||||||||
| Purchase of subsidiary shares from noncontrolling interests | (4 | ) | — | (4 | ) | (31 | ) | (8 | ) | (39 | ) | — | — | — | |||||||||||||||||||||
| Additional noncontrolling interests | — | — | — | 2 | 1 | 3 | — | — | — | ||||||||||||||||||||||||||
| Balance at December 31, | $ | 2,215 | $ | 28 | $ | 2,243 | $ | 1,699 | $ | 26 | $ | 1,725 | $ | 2,486 | $ | 31 | $ | 2,517 | |||||||||||||||||
(i) |
| Years ended December 31, | |||||||||||
| 2013 | 2012 | 2011 | |||||||||
| (millions) | |||||||||||
| Net income (loss) attributable to Willis Group Holdings | $ | 365 | $ | (446 | ) | $ | 204 | ||||
| Transfers from noncontrolling interest: | |||||||||||
| Decrease in Willis Group Holdings’ paid-in capital for purchase of noncontrolling interest | (4 | ) | (31 | ) | — | ||||||
| Increase in Willis Group Holdings’ paid-in capital for sale of noncontrolling interest | — | 2 | — | ||||||||
| Net transfers from noncontrolling interest | (4 | ) | (29 | ) | — | ||||||
| Change from net income (loss) attributable to Willis Group Holdings and transfers from noncontrolling interests | $ | 361 | $ | (475 | ) | $ | 204 | ||||
| 25. |
| |
Dr. Michael J. Somers
| Years Ended December 31, | |||||||||||
| 2013 | 2012 | 2011 | |||||||||
| (millions) | |||||||||||
| Supplemental disclosures of cash flow information: | |||||||||||
| Cash payments for income taxes, net | $ | 61 | $ | 63 | $ | 15 | |||||
| Cash payments for interest | 117 | 118 | 128 | ||||||||
| Supplemental disclosures of non-cash investing and financing activities: | |||||||||||
| Write-off of unamortized debt issuance costs | $ | (2 | ) | $ | — | $ | (23 | ) | |||
| Write-back of fair value adjustment on 5.625% senior notes due 2015 | 7 | — | — | ||||||||
| Assets acquired under capital leases | 7 | 2 | — | ||||||||
| Deferred payments on acquisitions of subsidiaries | 2 | 4 | 6 | ||||||||
| Acquisitions: | |||||||||||
| Fair value of assets acquired | $ | 47 | $ | 23 | $ | 6 | |||||
| Less: | |||||||||||
| Liabilities assumed | 30 | 3 | 3 | ||||||||
| Cash acquired | 1 | — | 3 | ||||||||
| Net assets acquired, net of cash acquired | $ | 16 | $ | 20 | $ | — | |||||
| 26. | DERIVATIVE FINANCIAL INSTRUMENTS AND HEDGING ACTIVITIES |
| December 31, | |||||||
Sell 2013(i) | Sell 2012 | ||||||
| (millions) | |||||||
| US dollar | $ | 303 | $ | 255 | |||
| Euro | 97 | 55 | |||||
| Japanese yen | 35 | 32 | |||||
|
(i) |
|
|
|
|
On April 25,year ended December 31, 2013, the Company entered into a Nomination Agreementnumber of foreign currency transactions in order to hedge certain intercompany loans. These derivatives were not designated as hedging instruments and were for a total notional amount of $228 million (December 31, 2012: $63 million). In respect of these transactions, an immaterial amount has been recognized as an asset within other current assets and a nominal gain has been recognized in income within other operating expenses for the period.
| Fair value | |||||||||
| Balance sheet | December 31, | December 31, | |||||||
| Derivative financial instruments designated as hedging instruments: | classification | 2013 | 2012 | ||||||
| (millions) | |||||||||
| Assets: | |||||||||
| Interest rate swaps (fair value hedges) | Other assets | — | 22 | ||||||
| Forward exchange contracts | Other assets | 23 | 9 | ||||||
| Total derivatives designated as hedging instruments | $ | 23 | $ | 31 | |||||
| Liabilities: | |||||||||
| Forward exchange contracts | Other liabilities | 2 | — | ||||||
| Total derivatives designated as hedging instruments | $ | 2 | $ | — | |||||
| Derivatives in cash flow hedging relationships | Amount of gain (loss) recognized in OCI(i)on derivative (effective element) | Location of gain (loss) reclassified from accumulated OCI(i) into income (effective element) | Amount of gain (loss) reclassified from accumulated OCI(i) into income(effective element) | Location of gain (loss) recognized in income on derivative (ineffective hedges and ineffective element of effective hedges) | Amount of gain (loss) recognized in income on derivative (ineffective hedges and ineffective element of effective hedges) | ||||||||||
| (millions) | (millions) | (millions) | |||||||||||||
| Year Ended December 31, 2013 | |||||||||||||||
| Interest rate swaps | $ | — | Investment income | $ | (5 | ) | Other operating expenses | $ | — | ||||||
| Treasury locks | 19 | Interest expense | — | Interest expense | 2 | ||||||||||
| Forward exchange contracts | 10 | Other operating expenses | 1 | Interest expense | 1 | ||||||||||
| Total | $ | 29 | $ | (4 | ) | $ | 3 | ||||||||
| Year Ended December 31, 2012 | |||||||||||||||
| Interest rate swaps | $ | 3 | Investment income | $ | (5 | ) | Other operating expenses | $ | — | ||||||
| Forward exchange contracts | 11 | Other operating expenses | (4 | ) | Interest expense | 1 | |||||||||
| Total | $ | 14 | $ | (9 | ) | $ | 1 | ||||||||
| Year Ended December 31, 2011 | |||||||||||||||
| Interest rate swaps | $ | 13 | Investment income | $ | (14 | ) | Other operating expenses | $ | — | ||||||
| Forward exchange contracts | 3 | Other operating expenses | (7 | ) | Interest expense | (2 | ) | ||||||||
| Total | $ | 16 | $ | (21 | ) | $ | (2 | ) | |||||||
(i) | OCI means other comprehensive income. |
| Derivatives in fair value hedging relationships | Hedged item in fair value hedging relationship | (Loss) gain recognized for derivative | Gain (loss) recognized for hedged item | Ineffectiveness recognized in interest expense | |||||||||
| (millions) | |||||||||||||
| Year Ended December 31, 2013 | |||||||||||||
| Interest rate swaps | 5.625% senior notes due 2015 | $ | — | $ | — | $ | — | ||||||
| Year Ended December 31, 2012 | |||||||||||||
| Interest rate swaps | 5.625% senior notes due 2015 | $ | (3 | ) | $ | 2 | $ | 1 | |||||
| Year Ended December 31, 2011 | |||||||||||||
| Interest rate swaps | 5.625% senior notes due 2015 | $ | 7 | $ | (8 | ) | $ | 1 | |||||
| Derivatives no longer in fair value hedging relationships | Hedged item in fair value hedging relationship | Loss recognized for derivative | Amortization or prior loss recognized on hedged item | Net gain recognized (i) | |||||||||
| (millions) | |||||||||||||
| Year Ended December 31, 2013 | |||||||||||||
| Interest rate swaps | 5.625% senior notes due 2015 | $ | (5 | ) | $ | 14 | $ | 9 | |||||
| Year Ended December 31, 2012 | |||||||||||||
| Interest rate swaps | 5.625% senior notes due 2015 | $ | — | $ | — | $ | — | ||||||
| Year Ended December 31, 2011 | |||||||||||||
| Interest rate swaps | 5.625% senior notes due 2015 | $ | — | $ | — | $ | — | ||||||
| 27. | FAIR VALUE MEASUREMENTS |
Executive Officers
fair value of interest rate swaps and forward foreign exchange contracts based on estimated amounts the Company would receive or have to pay to terminate the agreements, taking into account the current interest rate environment or current foreign currency forward rates.
| December 31, 2013 | |||||||||||||||
Quoted prices in active markets for identical assets | Significant other observable inputs | Significant other unobservable inputs | |||||||||||||
| Level 1 | Level 2 | Level 3 | Total | ||||||||||||
| (millions) | |||||||||||||||
| Assets at fair value: | |||||||||||||||
| Cash and cash equivalents | $ | 796 | $ | — | $ | — | $ | 796 | |||||||
| Fiduciary funds (included within Fiduciary assets) | 1,662 | — | — | 1,662 | |||||||||||
| Derivative financial instruments | — | 23 | — | 23 | |||||||||||
| Total assets | $ | 2,458 | $ | 23 | $ | — | $ | 2,481 | |||||||
| Liabilities at fair value: | |||||||||||||||
| Derivative financial instruments | $ | — | $ | 2 | $ | — | $ | 2 | |||||||
| Total liabilities | $ | — | $ | 2 | $ | — | $ | 2 | |||||||
| December 31, 2012 | |||||||||||||||
Quoted prices in active markets for identical assets | Significant other observable inputs | Significant other unobservable inputs | |||||||||||||
| Level 1 | Level 2 | Level 3 | Total | ||||||||||||
| (millions) | |||||||||||||||
| Assets at fair value: | |||||||||||||||
| Cash and cash equivalents | $ | 500 | $ | — | $ | — | $ | 500 | |||||||
| Fiduciary funds (included within Fiduciary assets) | 1,796 | — | — | 1,796 | |||||||||||
| Derivative financial instruments | — | 31 | — | 31 | |||||||||||
| Total assets | $ | 2,296 | $ | 31 | $ | — | $ | 2,327 | |||||||
| Liabilities at fair value: | |||||||||||||||
Changes in fair value of hedged debt(i) | — | 18 | — | 18 | |||||||||||
| Total liabilities | $ | — | $ | 18 | $ | — | $ | 18 | |||||||
(i) | Changes in the fair value of the underlying hedged debt instrument since inception of the hedging relationship are included in long-term debt. |
| December 31, | |||||||||||||||
| 2013 | 2012 | ||||||||||||||
Carrying amount | Fair value | Carrying amount | Fair value | ||||||||||||
| (millions) | |||||||||||||||
| Assets: | |||||||||||||||
| Derivative financial instruments | $ | 23 | $ | 23 | $ | 31 | $ | 31 | |||||||
| Liabilities: | |||||||||||||||
| Short-term debt | $ | 15 | $ | 15 | $ | 15 | $ | 15 | |||||||
| Long-term debt | 2,311 | 2,444 | 2,338 | 2,576 | |||||||||||
| Derivative financial instruments | 2 | 2 | — | — | |||||||||||
| 28. | SEGMENT INFORMATION |
| (i) | foreign exchange hedging activities, foreign exchange movements on the UK pension plan asset, foreign exchange gains and losses from currency purchases and sales, and foreign exchange movements on internal exposures; |
| (ii) | amortization of intangible assets; |
| (iii) | gains and losses on the disposal of operations; |
| (iv) | significant legal and regulatory settlements which are managed centrally; |
| (v) | costs associated with the 2011 Operational Review; |
| (vi) | write-off of uncollectible accounts receivable balance and associated legal fees and insurance recoveries arising in Chicago due to fraudulent overstatement of commissions and fees; |
| (vii) | the additional incentive accrual recognized following the replacement of annual cash retention awards with annual cash bonuses which will not feature a repayment requirement; |
| (viii) | write-off of unamortized cash retention awards following the decision to eliminate repayment requirement on past awards; |
| (ix) | goodwill impairment charge; |
| (x) | fees related to the extinguishment of debt; and |
| (xi) | costs associated with the Expense Reduction Initiative. |
Commissions and fees | Investment income | Other income | Total revenues | Depreciation and amortization | Operating income (loss) | Interest in earnings of associates, net of tax | |||||||||||||||||||||
| (millions) | |||||||||||||||||||||||||||
| Year Ended December 31, 2013 | |||||||||||||||||||||||||||
| Global | $ | 1,188 | $ | 3 | $ | — | $ | 1,191 | $ | 31 | $ | 334 | $ | — | |||||||||||||
| North America | 1,377 | 2 | 7 | 1,386 | 37 | 269 | — | ||||||||||||||||||||
| International | 1,068 | 10 | — | 1,078 | 21 | 181 | — | ||||||||||||||||||||
| Total Retail | 2,445 | 12 | 7 | 2,464 | 58 | 450 | — | ||||||||||||||||||||
| Total Operating Segments | 3,633 | 15 | 7 | 3,655 | 89 | 784 | — | ||||||||||||||||||||
Corporate and Other(i) | — | — | — | — | 60 | (99 | ) | — | |||||||||||||||||||
| Total Consolidated | $ | 3,633 | $ | 15 | $ | 7 | $ | 3,655 | $ | 149 | $ | 685 | $ | — | |||||||||||||
| Year Ended December 31, 2012 | |||||||||||||||||||||||||||
| Global | $ | 1,124 | $ | 5 | $ | — | $ | 1,129 | $ | 27 | $ | 372 | $ | — | |||||||||||||
| North America | 1,306 | 3 | 4 | 1,313 | 31 | 240 | — | ||||||||||||||||||||
| International | 1,028 | 10 | — | 1,038 | 21 | 183 | 5 | ||||||||||||||||||||
| Total Retail | 2,334 | 13 | 4 | 2,351 | 52 | 423 | 5 | ||||||||||||||||||||
| Total Operating Segments | 3,458 | 18 | 4 | 3,480 | 79 | 795 | 5 | ||||||||||||||||||||
Corporate and Other(i) | — | — | — | — | 59 | (1,004 | ) | — | |||||||||||||||||||
| Total Consolidated | $ | 3,458 | $ | 18 | $ | 4 | $ | 3,480 | $ | 138 | $ | (209 | ) | $ | 5 | ||||||||||||
| Year Ended December 31, 2011 | |||||||||||||||||||||||||||
| Global | $ | 1,073 | $ | 9 | $ | — | $ | 1,082 | $ | 23 | $ | 352 | $ | — | |||||||||||||
| North America | 1,314 | 7 | 2 | 1,323 | 28 | 271 | — | ||||||||||||||||||||
| International | 1,027 | 15 | — | 1,042 | 18 | 221 | 12 | ||||||||||||||||||||
| Total Retail | 2,341 | 22 | 2 | 2,365 | 46 | 492 | 12 | ||||||||||||||||||||
| Total Operating Segments | 3,414 | 31 | 2 | 3,447 | 69 | 844 | 12 | ||||||||||||||||||||
Corporate and Other(i) | — | — | — | — | 73 | (278 | ) | — | |||||||||||||||||||
| Total Consolidated | $ | 3,414 | $ | 31 | $ | 2 | $ | 3,447 | $ | 142 | $ | 566 | $ | 12 | |||||||||||||
(i) | See the following table for an analysis of the ‘Corporate and other’ line. |
| Years ended December 31, | |||||||||||
| 2013 | 2012 | 2011 | |||||||||
| (millions) | |||||||||||
| Amortization of intangible assets | $ | (55 | ) | $ | (59 | ) | $ | (68 | ) | ||
Additional incentive accrual for change in remuneration policy (a) | — | (252 | ) | — | |||||||
Write-off of unamortized cash retention awards debtor (b) | — | (200 | ) | — | |||||||
Goodwill impairment charge (c) | — | (492 | ) | — | |||||||
India joint venture settlement (d) | — | (11 | ) | — | |||||||
Insurance recovery (e) | — | 10 | — | ||||||||
Write-off of uncollectible accounts receivable balance in Chicago (f) | — | (13 | ) | (22 | ) | ||||||
Net gain (loss) on disposal of operations (d) | 2 | (3 | ) | 4 | |||||||
| Foreign exchange hedging | 3 | 8 | 5 | ||||||||
| Foreign exchange gain (loss) on the UK pension plan asset | 8 | (1 | ) | — | |||||||
| 2011 Operational Review | — | — | (180 | ) | |||||||
| FSA regulatory settlement | — | — | (11 | ) | |||||||
| Expense Reduction Initiative | (46 | ) | — | — | |||||||
Fees related to the extinguishment of debt (h) | (1 | ) | — | — | |||||||
Other(g) | (10 | ) | 9 | (6 | ) | ||||||
| Total Corporate and Other | $ | (99 | ) | $ | (1,004 | ) | $ | (278 | ) | ||
(a) | Additional incentive accrual recognized following the replacement of annual incentive awards with annual cash bonuses which will not feature a repayment requirement. |
(b) | Write-off of unamortized cash retention award debtor following the decision to eliminate the repayment requirement on past awards. |
(c) | Non-cash charge recognized related to the impairment of the carrying value of the North America reporting unit's goodwill. |
(d) | $11 million settlement with former partners related to the termination of a joint venture arrangement in India. In addition, a $1 million loss on disposal of operations was recorded related to the termination. |
(e) | Insurance recovery, recorded in Other operating expenses, related to a previously disclosed fraudulent activity in Chicago, discussed above. |
(f) | In early 2012 the Company identified an uncollectible accounts receivable balance of approximately $28 million in Chicago due to fraudulent overstatements of Commissions and fees. For the year ended December 31, 2011, the Company recorded an estimate of the misstatement of Commissions and fees from prior periods by recognizing in the fourth quarter of 2011 a $22 million charge to Other operating expenses to write off the uncollectible receivable at January 1, 2011. |
(g) | Other includes $7 million (2012: $7 million, 2011: $12 million) from the release of funds and reserves related to potential legal liabilities. |
(h) | $1 million of fees associated with the extinguishment of debt completed on August 15, 2013. |
| Years ended December 31, | |||||||||||
| 2013 | 2012 | 2011 | |||||||||
| (millions) | |||||||||||
| Total consolidated operating income | $ | 685 | $ | (209 | ) | $ | 566 | ||||
| Make-whole on repurchase and redemption of senior notes and write-off of unamortized debt issuance costs | — | — | (171 | ) | |||||||
| Loss on extinguishment of debt | (60 | ) | — | — | |||||||
| Interest expense | (126 | ) | (128 | ) | (156 | ) | |||||
| Income (loss) from continuing operations before income taxes and interest in earnings of associates | $ | 499 | $ | (337 | ) | $ | 239 | ||||
| Years ended December 31, | |||||||||||||||||||||||||||||||||||||||||||||||
| 2013 | 2012 | 2011 | 2013 | 2012 | 2011 | 2013 | 2012 | 2011 | 2013 | 2012 | 2011 | ||||||||||||||||||||||||||||||||||||
| Global | North America | International | Total | ||||||||||||||||||||||||||||||||||||||||||||
| (millions) | |||||||||||||||||||||||||||||||||||||||||||||||
| Commissions and fees: | |||||||||||||||||||||||||||||||||||||||||||||||
| Retail insurance services | $ | — | $ | — | $ | — | $ | 1,377 | $ | 1,306 | $ | 1,314 | $ | 1,068 | $ | 1,028 | $ | 1,027 | $ | 2,445 | $ | 2,334 | $ | 2,341 | |||||||||||||||||||||||
| Specialty insurance services | 1,188 | 1,124 | 1,073 | — | — | — | — | — | — | 1,188 | 1,124 | 1,073 | |||||||||||||||||||||||||||||||||||
| Total commissions and fees | 1,188 | 1,124 | 1,073 | 1,377 | 1,306 | 1,314 | 1,068 | 1,028 | 1,027 | 3,633 | 3,458 | 3,414 | |||||||||||||||||||||||||||||||||||
| Investment income | 3 | 5 | 9 | 2 | 3 | 7 | 10 | 10 | 15 | 15 | 18 | 31 | |||||||||||||||||||||||||||||||||||
| Other income | — | — | — | 7 | 4 | 2 | — | — | — | 7 | 4 | 2 | |||||||||||||||||||||||||||||||||||
| Total Revenues | $ | 1,191 | $ | 1,129 | $ | 1,082 | $ | 1,386 | $ | 1,313 | $ | 1,323 | $ | 1,078 | $ | 1,038 | $ | 1,042 | $ | 3,655 | $ | 3,480 | $ | 3,447 | |||||||||||||||||||||||
| Years Ended December 31, | |||||||||||
| 2013 | 2012 | 2011 | |||||||||
| (millions) | |||||||||||
Commissions and fees(i) | |||||||||||
| UK | $ | 1,026 | $ | 980 | $ | 963 | |||||
| US | 1,549 | 1,484 | 1,461 | ||||||||
Other(ii) | 1,058 | 994 | 990 | ||||||||
| Total | $ | 3,633 | $ | 3,458 | $ | 3,414 | |||||
| December 31, | |||||||
| 2013 | 2012 | ||||||
| (millions) | |||||||
| Fixed assets | |||||||
| UK | $ | 233 | $ | 218 | |||
| US | 203 | 207 | |||||
Other(ii) | 45 | 43 | |||||
| Total | $ | 481 | $ | 468 | |||
(i) | Commissions and fees are attributed to countries based upon the location of the subsidiary generating the revenue. |
(ii) | Other than in the United Kingdom and the United States, the Company does not conduct business in any country in which its commissions and fees and or fixed assets exceed 10 percent of consolidated commissions and fees and or fixed assets, respectively. |
| 29. | SUBSIDIARY UNDERTAKINGS |
| Country of registration | Class of share | Percentage ownership | ||
| Holding companies | ||||
| England and Wales | Ordinary shares | 100 | % |
| Trinity Acquisition plc | England and Wales | Ordinary shares | 100 | % |
| Willis Faber Limited | England and Wales | Ordinary shares | 100 | % |
| Willis Group Limited | England and Wales | Ordinary shares | 100 | % |
| Willis Investment UK Holdings Limited | England and Wales | Ordinary shares | 100 | % |
| Willis Netherlands Holdings B.V. | Netherlands | Ordinary shares | 100 | % |
| Willis Europe B.V. | England and Wales | Ordinary shares | 100 | % |
| Insurance broking companies | ||||
| Willis | USA | Common shares | 100 | % |
| Willis Limited | England and Wales | Ordinary shares | 100 | % |
| Willis North America, Inc. | USA | Common shares | 100 | % |
| Willis Re, Inc. | USA | Common shares | 100 | % |
| 30. | FINANCIAL INFORMATION FOR PARENT GUARANTOR, OTHER GUARANTOR SUBSIDIARIES AND NON-GUARANTOR SUBSIDIARIES |
|
| (ii) | the Other Guarantors, which are all 100 percent directly or indirectly owned subsidiaries of the parent and are all direct or indirect parents of the issuer; |
| (iii) | the Issuer, Willis North America; |
| (iv) | Other, which are the non-guarantor subsidiaries, on a combined basis; |
| (v) | Consolidating adjustments; and |
| (vi) | the Consolidated Company. |
| As previously reported | Reclassifications | As Reclassified | |||||||||
| (millions) | |||||||||||
| Condensed consolidating statement of operations for the year ended 31 December 2012 | |||||||||||
| Willis Group Holdings | |||||||||||
| Operating loss | $ | (6 | ) | $ | — | $ | (6 | ) | |||
| Net loss attributable to Willis Group Holdings | (446 | ) | — | (446 | ) | ||||||
| The Other Guarantors | |||||||||||
| Operating loss | $ | (72 | ) | $ | (11 | ) | $ | (83 | ) | ||
| Net loss attributable to Willis Group Holdings | (389 | ) | (8 | ) | (397 | ) | |||||
| The Issuer | |||||||||||
| Operating loss | $ | (189 | ) | $ | — | $ | (189 | ) | |||
| Net loss attributable to Willis Group Holdings | (228 | ) | — | (228 | ) | ||||||
| Other | |||||||||||
| Operating income (loss) | $ | 122 | $ | (53 | ) | $ | 69 | ||||
| Net loss attributable to Willis Group Holdings | (118 | ) | (306 | ) | (424 | ) | |||||
| Consolidating adjustments | |||||||||||
| Operating (loss) income | $ | (64 | ) | $ | 64 | $ | — | ||||
| Net income attributable to Willis Group Holdings | 735 | 314 | 1,049 | ||||||||
| As previously reported | Reclassifications | As Reclassified | |||||||||
| (millions) | |||||||||||
| Condensed consolidating statement of operations for the year ended 31 December 2011 | |||||||||||
| Willis Group Holdings | |||||||||||
| Operating loss | $ | (20 | ) | $ | — | $ | (20 | ) | |||
| Net income attributable to Willis Group Holdings | 204 | — | 204 | ||||||||
| The Other Guarantors | |||||||||||
| Operating income (loss) | $ | 43 | $ | (11 | ) | $ | 32 | ||||
| Net income attributable to Willis Group Holdings | 174 | 72 | 246 | ||||||||
| The Issuer | |||||||||||
| Operating loss | $ | (179 | ) | $ | — | $ | (179 | ) | |||
| Net loss attributable to Willis Group Holdings | (36 | ) | (31 | ) | (67 | ) | |||||
| Other | |||||||||||
| Operating income (loss) | $ | 754 | $ | (21 | ) | $ | 733 | ||||
| Net income attributable to Willis Group Holdings | 137 | 164 | 301 | ||||||||
| Consolidating adjustments | |||||||||||
| Operating (loss) income | $ | (32 | ) | $ | 32 | $ | — | ||||
| Net loss attributable to Willis Group Holdings | (275 | ) | (205 | ) | (480 | ) | |||||
| As previously reported | Reclassifications | As Reclassified | |||||||||
| (millions) | |||||||||||
| Condensed consolidating statement of comprehensive income for the year ended 31 December 2012 | |||||||||||
| Willis Group Holdings | |||||||||||
| Comprehensive loss attributable to Willis Group Holdings | $ | (552 | ) | $ | — | $ | (552 | ) | |||
| The Other Guarantors | |||||||||||
| Comprehensive loss attributable to Willis Group Holdings | $ | (486 | ) | $ | (8 | ) | $ | (494 | ) | ||
| The Issuer | |||||||||||
| Comprehensive loss attributable to Willis Group Holdings | $ | (263 | ) | $ | — | $ | (263 | ) | |||
| Other | |||||||||||
| Comprehensive loss attributable to Willis Group Holdings | $ | (226 | ) | $ | (306 | ) | $ | (532 | ) | ||
| Consolidating adjustments | |||||||||||
| Comprehensive income attributable to Willis Group Holdings | $ | 975 | $ | 314 | $ | 1,289 | |||||
| As previously reported | Reclassifications | As Reclassified | |||||||||
| (millions) | |||||||||||
| Condensed consolidating statement of comprehensive income for the year ended 31 December 2011 | |||||||||||
| Willis Group Holdings | |||||||||||
| Comprehensive income attributable to Willis Group Holdings | $ | 1 | $ | — | $ | 1 | |||||
| The Other Guarantors | |||||||||||
| Comprehensive (loss) income attributable to Willis Group Holdings | $ | (24 | ) | $ | 72 | $ | 48 | ||||
| The Issuer | |||||||||||
| Comprehensive loss attributable to Willis Group Holdings | $ | (117 | ) | $ | (31 | ) | $ | (148 | ) | ||
| Other | |||||||||||
| Comprehensive (loss) income attributable to Willis Group Holdings | $ | (65 | ) | $ | 164 | $ | 99 | ||||
| Consolidating adjustments | |||||||||||
| Comprehensive income (loss) attributable to Willis Group Holdings | $ | 206 | $ | (205 | ) | $ | 1 | ||||
| As previously reported | Reclassifications | As Reclassified | |||||||||
| (millions) | |||||||||||
| Condensed consolidating balance sheet at 31 December 2012 | |||||||||||
| Willis Group Holdings | |||||||||||
| Total assets | $ | 2,557 | $ | 1,541 | $ | 4,098 | |||||
| Total liabilities | 858 | 1,541 | 2,399 | ||||||||
| Total equity | 1,699 | — | 1,699 | ||||||||
| The Other Guarantors | |||||||||||
| Total assets | $ | (1,256 | ) | $ | 4,844 | $ | 3,588 | ||||
| Total liabilities | 319 | 4,930 | 5,249 | ||||||||
| Total equity | (1,575 | ) | (86 | ) | (1,661 | ) | |||||
| The Issuer | |||||||||||
| Total assets | $ | 1,382 | $ | 1,246 | $ | 2,628 | |||||
| Total liabilities | 1,348 | 1,246 | 2,594 | ||||||||
| Total equity | 34 | — | 34 | ||||||||
| Other | |||||||||||
| Total assets | $ | 17,125 | $ | (1,483 | ) | $ | 15,642 | ||||
| Total liabilities | 11,851 | 720 | 12,571 | ||||||||
| Total equity | 5,274 | (2,203 | ) | 3,071 | |||||||
| Consolidating adjustments | |||||||||||
| Total assets | $ | (4,696 | ) | $ | (6,148 | ) | $ | (10,844 | ) | ||
| Total liabilities | (989 | ) | (8,437 | ) | (9,426 | ) | |||||
| Total equity | (3,707 | ) | 2,289 | (1,418 | ) | ||||||
| As previously reported | Reclassifications | As Reclassified | |||||||||
| (millions) | |||||||||||
| Condensed consolidating statement of cash flows for the year ended 31 December 2012 | |||||||||||
| Willis Group Holdings | |||||||||||
| Net cash (used in) provided by operating activities | $ | (42 | ) | $ | 19 | $ | (23 | ) | |||
| Net cash provided by investing activities | — | 256 | 256 | ||||||||
| Net cash provided by (used in) financing activities | 43 | (275 | ) | (232 | ) | ||||||
| The Other Guarantors | |||||||||||
| Net cash provided by operating activities | $ | 780 | $ | 724 | $ | 1,504 | |||||
| Net cash used in investing activities | (7 | ) | (102 | ) | (109 | ) | |||||
| Net cash used in financing activities | (773 | ) | (622 | ) | (1,395 | ) | |||||
| The Issuer | |||||||||||
| Net cash provided by (used in) operating activities | $ | 69 | $ | (113 | ) | $ | (44 | ) | |||
| Net cash (used in) provided by investing activities | (19 | ) | 34 | 15 | |||||||
| Net cash (used in) provided by financing activities | (213 | ) | 79 | (134 | ) | ||||||
| Other | |||||||||||
| Net cash provided by (used in) operating activities | $ | 431 | $ | (528 | ) | $ | (97 | ) | |||
| Net cash (used in) provided by investing activities | (146 | ) | 1,149 | 1,003 | |||||||
| Net cash used in financing activities | (61 | ) | (621 | ) | (682 | ) | |||||
| Consolidating adjustments | |||||||||||
| Net cash used in operating activities | $ | (713 | ) | $ | (102 | ) | $ | (815 | ) | ||
| Net cash used in investing activities | — | (1,337 | ) | (1,337 | ) | ||||||
| Net cash provided by financing activities | 713 | 1,439 | 2,152 | ||||||||
| As previously reported | Reclassifications | As Reclassified | |||||||||
| (millions) | |||||||||||
| Condensed consolidating statement of cash flows for the year ended 31 December 2011 | |||||||||||
| Willis Group Holdings | |||||||||||
| Net cash (used in) provided by operating activities | $ | (41 | ) | $ | 85 | $ | 44 | ||||
| Net cash used in investing activities | — | (711 | ) | (711 | ) | ||||||
| Net cash provided by financing activities | 41 | 626 | 667 | ||||||||
| The Other Guarantors | |||||||||||
| Net cash provided by operating activities | $ | 184 | $ | 132 | $ | 316 | |||||
| Net cash used in investing activities | (4 | ) | (430 | ) | (434 | ) | |||||
| Net cash (used in) provided by financing activities | (180 | ) | 298 | 118 | |||||||
| The Issuer | |||||||||||
| Net cash provided by operating activities | $ | 88 | $ | 46 | $ | 134 | |||||
| Net cash (used in) provided by investing activities | (21 | ) | 128 | 107 | |||||||
| Net cash provided by (used in) financing activities | 20 | (174 | ) | (154 | ) | ||||||
| Other | |||||||||||
| Net cash provided by (used in) operating activities | $ | 1,269 | $ | (1,138 | ) | $ | 131 | ||||
| Net cash (used in) provided by investing activities | (76 | ) | 123 | 47 | |||||||
| Net cash (used in) provided by financing activities | (1,156 | ) | 1,015 | (141 | ) | ||||||
| Consolidating adjustments | |||||||||||
| Net cash (used in) provided by operating activities | $ | (1,061 | ) | $ | 875 | $ | (186 | ) | |||
| Net cash provided by investing activities | — | 890 | 890 | ||||||||
| Net cash provided by (used in) financing activities | 1,061 | (1,765 | ) | (704 | ) | ||||||
| Year Ended December 31, 2013 | |||||||||||||||||||||||
Willis Group Holdings | The Other Guarantors | The Issuer | Other | Consolidating adjustments | Consolidated | ||||||||||||||||||
| (millions) | |||||||||||||||||||||||
| REVENUES | |||||||||||||||||||||||
| Commissions and fees | $ | — | $ | — | $ | 8 | $ | 3,625 | $ | — | $ | 3,633 | |||||||||||
| Investment income | — | — | — | 15 | — | 15 | |||||||||||||||||
| Other income | — | — | — | 7 | — | 7 | |||||||||||||||||
| Total revenues | — | — | 8 | 3,647 | — | 3,655 | |||||||||||||||||
| EXPENSES | |||||||||||||||||||||||
| Salaries and benefits | (1 | ) | — | (103 | ) | (2,103 | ) | — | (2,207 | ) | |||||||||||||
| Other operating expenses | — | (73 | ) | (163 | ) | (380 | ) | — | (616 | ) | |||||||||||||
| Depreciation expense | — | (3 | ) | (20 | ) | (71 | ) | — | (94 | ) | |||||||||||||
| Amortization of intangible assets | — | — | — | (55 | ) | — | (55 | ) | |||||||||||||||
| Net gain on disposal of operations | — | — | — | 12 | (10 | ) | 2 | ||||||||||||||||
| Total expenses | (1 | ) | (76 | ) | (286 | ) | (2,597 | ) | (10 | ) | (2,970 | ) | |||||||||||
| OPERATING (LOSS) INCOME | (1 | ) | (76 | ) | (278 | ) | 1,050 | (10 | ) | 685 | |||||||||||||
| Income from Group undertakings | — | 191 | 364 | 86 | (641 | ) | — | ||||||||||||||||
| Expenses due to Group undertakings | (10 | ) | (34 | ) | (141 | ) | (456 | ) | 641 | — | |||||||||||||
| Loss on extinguishment of debt | — | — | (60 | ) | — | — | (60 | ) | |||||||||||||||
| Interest expense | (42 | ) | (16 | ) | (63 | ) | (5 | ) | — | (126 | ) | ||||||||||||
| (LOSS) INCOME FROM CONTINUING OPERATIONS BEFORE INCOME TAXES AND INTEREST IN EARNINGS OF ASSOCIATES | (53 | ) | 65 | (178 | ) | 675 | (10 | ) | 499 | ||||||||||||||
| Income taxes | — | 23 | — | (145 | ) | — | (122 | ) | |||||||||||||||
| (LOSS) INCOME FROM CONTINUING OPERATIONS BEFORE INTEREST IN EARNINGS OF ASSOCIATES | (53 | ) | 88 | (178 | ) | 530 | (10 | ) | 377 | ||||||||||||||
| Interest in earnings of associates, net of tax | — | 9 | — | (9 | ) | — | — | ||||||||||||||||
| Equity account for subsidiaries | 418 | 320 | 150 | — | (888 | ) | — | ||||||||||||||||
| INCOME (LOSS) FROM CONTINUING OPERATIONS | 365 | 417 | (28 | ) | 521 | (898 | ) | 377 | |||||||||||||||
| Discontinued operations, net of tax | — | — | — | — | — | — | |||||||||||||||||
| NET INCOME (LOSS) | 365 | 417 | (28 | ) | 521 | (898 | ) | 377 | |||||||||||||||
| Less: Net loss attributable to noncontrolling interests | — | — | — | (12 | ) | — | (12 | ) | |||||||||||||||
| NET INCOME (LOSS) ATTRIBUTABLE TO WILLIS GROUP HOLDINGS | $ | 365 | $ | 417 | $ | (28 | ) | $ | 509 | $ | (898 | ) | $ | 365 | |||||||||
| Year Ended December 31, 2013 | |||||||||||||||||||||||
Willis Group Holdings | The Other Guarantors | The Issuer | Other | Consolidating adjustments | Consolidated | ||||||||||||||||||
| (millions) | |||||||||||||||||||||||
| Comprehensive income | $ | 522 | $ | 565 | $ | 74 | $ | 636 | $ | (1,263 | ) | $ | 534 | ||||||||||
| Less: Comprehensive income attributable to noncontrolling interests | — | — | — | (12 | ) | — | (12 | ) | |||||||||||||||
| Comprehensive income attributable to Willis Group Holdings | $ | 522 | $ | 565 | $ | 74 | $ | 624 | $ | (1,263 | ) | $ | 522 | ||||||||||
| Year Ended December 31, 2012 | |||||||||||||||||||||||
Willis Group Holdings | The Other Guarantors | The Issuer | Other | Consolidating adjustments | Consolidated | ||||||||||||||||||
| (millions) | |||||||||||||||||||||||
| REVENUES | |||||||||||||||||||||||
| Commissions and fees | $ | — | $ | — | $ | — | $ | 3,458 | $ | — | $ | 3,458 | |||||||||||
| Investment income | — | — | 1 | 17 | — | 18 | |||||||||||||||||
| Other income | — | — | — | 4 | — | 4 | |||||||||||||||||
| Total revenues | — | — | 1 | 3,479 | — | 3,480 | |||||||||||||||||
| EXPENSES | |||||||||||||||||||||||
| Salaries and benefits | (2 | ) | — | (96 | ) | (2,377 | ) | — | (2,475 | ) | |||||||||||||
| Other operating expenses | (4 | ) | (82 | ) | (79 | ) | (416 | ) | — | (581 | ) | ||||||||||||
| Depreciation expense | — | (1 | ) | (15 | ) | (63 | ) | — | (79 | ) | |||||||||||||
| Amortization of intangible assets | — | — | — | (59 | ) | — | (59 | ) | |||||||||||||||
| Goodwill impairment charge | — | — | — | (492 | ) | — | (492 | ) | |||||||||||||||
| Net loss on disposal of operations | — | — | — | (3 | ) | — | (3 | ) | |||||||||||||||
| Total expenses | (6 | ) | (83 | ) | (190 | ) | (3,410 | ) | — | (3,689 | ) | ||||||||||||
| OPERATING (LOSS) INCOME | (6 | ) | (83 | ) | (189 | ) | 69 | — | (209 | ) | |||||||||||||
| Income from Group undertakings | — | 201 | 316 | 111 | (628 | ) | — | ||||||||||||||||
| Expenses due to Group undertakings | — | (67 | ) | (147 | ) | (414 | ) | 628 | — | ||||||||||||||
| Interest expense | (43 | ) | (7 | ) | (70 | ) | (8 | ) | — | (128 | ) | ||||||||||||
| (LOSS) INCOME FROM CONTINUING OPERATIONS BEFORE INCOME TAXES AND INTEREST IN EARNINGS OF ASSOCIATES | (49 | ) | 44 | (90 | ) | (242 | ) | — | (337 | ) | |||||||||||||
| Income taxes | — | 31 | 34 | (166 | ) | — | (101 | ) | |||||||||||||||
| (LOSS) INCOME FROM CONTINUING OPERATIONS BEFORE INTEREST IN EARNINGS OF ASSOCIATES | (49 | ) | 75 | (56 | ) | (408 | ) | — | (438 | ) | |||||||||||||
| Interest in earnings of associates, net of tax | — | 8 | — | (3 | ) | — | 5 | ||||||||||||||||
| Equity account for subsidiaries | (397 | ) | (480 | ) | (172 | ) | — | 1,049 | — | ||||||||||||||
| (LOSS) INCOME FROM CONTINUING OPERATIONS | (446 | ) | (397 | ) | (228 | ) | (411 | ) | 1,049 | (433 | ) | ||||||||||||
| Discontinued operations, net of tax | — | — | — | — | — | — | |||||||||||||||||
| NET (LOSS) INCOME | (446 | ) | (397 | ) | (228 | ) | (411 | ) | 1,049 | (433 | ) | ||||||||||||
| Less: Net income attributable to noncontrolling interests | — | — | — | (13 | ) | — | (13 | ) | |||||||||||||||
| NET (LOSS) INCOME ATTRIBUTABLE TO WILLIS GROUP HOLDINGS | $ | (446 | ) | $ | (397 | ) | $ | (228 | ) | $ | (424 | ) | $ | 1,049 | $ | (446 | ) | ||||||
| Year Ended December 31, 2012 | |||||||||||||||||||||||
Willis Group Holdings | The Other Guarantors | The Issuer | Other | Consolidating adjustments | Consolidated | ||||||||||||||||||
| (millions) | |||||||||||||||||||||||
| Comprehensive loss | $ | (552 | ) | $ | (494 | ) | $ | (263 | ) | $ | (519 | ) | $ | 1,289 | $ | (539 | ) | ||||||
| Less: Comprehensive income attributable to noncontrolling interests | — | — | — | (13 | ) | — | (13 | ) | |||||||||||||||
| Comprehensive loss attributable to Willis Group Holdings | $ | (552 | ) | $ | (494 | ) | $ | (263 | ) | $ | (532 | ) | $ | 1,289 | $ | (552 | ) | ||||||
| Year Ended December 31, 2011 | |||||||||||||||||||||||
Willis Group Holdings | The Other Guarantors | The Issuer | Other | Consolidating adjustments | Consolidated | ||||||||||||||||||
| (millions) | |||||||||||||||||||||||
| REVENUES | |||||||||||||||||||||||
| Commissions and fees | $ | — | $ | — | $ | — | $ | 3,414 | $ | — | $ | 3,414 | |||||||||||
| Investment income | — | — | 2 | 29 | — | 31 | |||||||||||||||||
| Other income | — | — | — | 2 | — | 2 | |||||||||||||||||
| Total revenues | — | — | 2 | 3,445 | — | 3,447 | |||||||||||||||||
| EXPENSES | |||||||||||||||||||||||
| Salaries and benefits | (3 | ) | — | (69 | ) | (2,015 | ) | — | (2,087 | ) | |||||||||||||
| Other operating expenses | (17 | ) | 32 | (98 | ) | (573 | ) | — | (656 | ) | |||||||||||||
| Depreciation expense | — | — | (14 | ) | (60 | ) | — | (74 | ) | ||||||||||||||
| Amortization of intangible assets | — | — | — | (68 | ) | — | (68 | ) | |||||||||||||||
| Net gain on disposal of operations | — | — | — | 4 | — | 4 | |||||||||||||||||
| Total expenses | (20 | ) | 32 | (181 | ) | (2,712 | ) | — | (2,881 | ) | |||||||||||||
| OPERATING (LOSS) INCOME | (20 | ) | 32 | (179 | ) | 733 | — | 566 | |||||||||||||||
| Income from Group undertakings | — | 186 | 324 | 119 | (629 | ) | — | ||||||||||||||||
| Expenses due to Group undertakings | — | (80 | ) | (134 | ) | (415 | ) | 629 | — | ||||||||||||||
| Make-whole on repurchase and redemption of senior notes and write-off of unamortized debt issuance costs | — | (171 | ) | — | — | — | (171 | ) | |||||||||||||||
| Interest expense | (34 | ) | (17 | ) | (97 | ) | (8 | ) | — | (156 | ) | ||||||||||||
| (LOSS) INCOME FROM CONTINUING OPERATIONS BEFORE INCOME TAXES AND INTEREST IN EARNINGS OF ASSOCIATES | (54 | ) | (50 | ) | (86 | ) | 429 | — | 239 | ||||||||||||||
| Income taxes | — | 59 | 27 | (117 | ) | (1 | ) | (32 | ) | ||||||||||||||
| (LOSS) INCOME FROM CONTINUING OPERATIONS BEFORE INTEREST IN EARNINGS OF ASSOCIATES | (54 | ) | 9 | (59 | ) | 312 | (1 | ) | 207 | ||||||||||||||
| Interest in earnings of associates, net of tax | — | 8 | — | 4 | — | 12 | |||||||||||||||||
| Equity account for subsidiaries | 258 | 229 | (8 | ) | — | (479 | ) | — | |||||||||||||||
| INCOME (LOSS) FROM CONTINUING OPERATIONS | 204 | 246 | (67 | ) | 316 | (480 | ) | 219 | |||||||||||||||
| Discontinued operations, net of tax | — | — | — | 1 | — | 1 | |||||||||||||||||
| NET INCOME (LOSS) | 204 | 246 | (67 | ) | 317 | (480 | ) | 220 | |||||||||||||||
| Less: Net income attributable to noncontrolling interests | — | — | — | (16 | ) | — | (16 | ) | |||||||||||||||
| NET INCOME (LOSS) ATTRIBUTABLE TO WILLIS GROUP HOLDINGS | $ | 204 | $ | 246 | $ | (67 | ) | $ | 301 | $ | (480 | ) | $ | 204 | |||||||||
| Year Ended December 31, 2011 | |||||||||||||||||||||||
Willis Group Holdings | The Other Guarantors | The Issuer | Other | Consolidating adjustments | Consolidated | ||||||||||||||||||
| (millions) | |||||||||||||||||||||||
| Comprehensive income (loss) | $ | 1 | $ | 48 | $ | (148 | ) | $ | 114 | $ | 1 | $ | 16 | ||||||||||
| Less: Comprehensive income attributable to noncontrolling interests | — | — | — | (15 | ) | — | (15 | ) | |||||||||||||||
| Comprehensive income (loss) attributable to Willis Group Holdings | $ | 1 | $ | 48 | $ | (148 | ) | $ | 99 | $ | 1 | $ | 1 | ||||||||||
| As at December 31, 2013 | |||||||||||||||||||||||
Willis Group Holdings | The Other Guarantors | The Issuer | Other | Consolidating adjustments | Consolidated | ||||||||||||||||||
| (millions) | |||||||||||||||||||||||
| ASSETS | |||||||||||||||||||||||
| CURRENT ASSETS | |||||||||||||||||||||||
| Cash and cash equivalents | $ | 3 | $ | 3 | $ | — | $ | 790 | $ | — | $ | 796 | |||||||||||
| Accounts receivable, net | — | — | 4 | 1,037 | — | 1,041 | |||||||||||||||||
| Fiduciary assets | — | — | — | 8,412 | — | 8,412 | |||||||||||||||||
| Deferred tax assets | — | — | — | 16 | (1 | ) | 15 | ||||||||||||||||
| Other current assets | 1 | 21 | 10 | 186 | (21 | ) | 197 | ||||||||||||||||
| Amounts due from Group undertakings | 4,051 | 903 | 1,317 | 1,484 | (7,755 | ) | — | ||||||||||||||||
| Total current assets | 4,055 | 927 | 1,331 | 11,925 | (7,777 | ) | 10,461 | ||||||||||||||||
| NON-CURRENT ASSETS | |||||||||||||||||||||||
| Investments in subsidiaries | — | 2,838 | 1,021 | — | (3,859 | ) | — | ||||||||||||||||
| Fixed assets, net | — | 15 | 51 | 415 | — | 481 | |||||||||||||||||
| Goodwill | — | — | — | 2,838 | — | 2,838 | |||||||||||||||||
| Other intangible assets, net | — | — | — | 353 | — | 353 | |||||||||||||||||
| Investments in associates | — | 156 | — | 20 | — | 176 | |||||||||||||||||
| Deferred tax assets | — | — | — | 7 | — | 7 | |||||||||||||||||
| Pension benefits asset | — | — | — | 278 | — | 278 | |||||||||||||||||
| Other non-current assets | 4 | 9 | 5 | 188 | — | 206 | |||||||||||||||||
| Non-current amounts due from Group undertakings | — | 518 | 690 | — | (1,208 | ) | — | ||||||||||||||||
| Total non-current assets | 4 | 3,536 | 1,767 | 4,099 | (5,067 | ) | 4,339 | ||||||||||||||||
| TOTAL ASSETS | $ | 4,059 | $ | 4,463 | $ | 3,098 | $ | 16,024 | $ | (12,844 | ) | $ | 14,800 | ||||||||||
| LIABILITIES AND STOCKHOLDERS’ EQUITY | |||||||||||||||||||||||
| CURRENT LIABILITIES | |||||||||||||||||||||||
| Fiduciary liabilities | $ | — | $ | — | $ | — | $ | 8,412 | $ | — | $ | 8,412 | |||||||||||
| Deferred revenue and accrued expenses | 2 | 1 | 28 | 555 | — | 586 | |||||||||||||||||
| Income taxes payable | — | 3 | — | 39 | (21 | ) | 21 | ||||||||||||||||
| Short-term debt and current portion of long-term debt | — | 15 | — | — | — | 15 | |||||||||||||||||
| Deferred tax liabilities | — | — | — | 25 | — | 25 | |||||||||||||||||
| Other current liabilities | 62 | 15 | 38 | 300 | — | 415 | |||||||||||||||||
| Amounts due to Group undertakings | — | 4,760 | 1,662 | 1,333 | (7,755 | ) | — | ||||||||||||||||
| Total current liabilities | 64 | 4,794 | 1,728 | 10,664 | (7,776 | ) | 9,474 | ||||||||||||||||
| NON-CURRENT LIABILITIES | |||||||||||||||||||||||
| Investments in subsidiaries | 985 | — | — | — | (985 | ) | — | ||||||||||||||||
| Long-term debt | 795 | 782 | 733 | 1 | — | 2,311 | |||||||||||||||||
| Liabilities for pension benefits | — | — | — | 136 | — | 136 | |||||||||||||||||
| Deferred tax liabilities | — | 1 | — | 55 | — | 56 | |||||||||||||||||
| Provisions for liabilities | — | — | — | 206 | — | 206 | |||||||||||||||||
| Other non-current liabilities | — | — | 48 | 326 | — | 374 | |||||||||||||||||
| Non-current amounts due to Group undertakings | — | — | 518 | 690 | (1,208 | ) | — | ||||||||||||||||
| Total non-current liabilities | 1,780 | 783 | 1,299 | 1,414 | (2,193 | ) | 3,083 | ||||||||||||||||
| TOTAL LIABILITIES | $ | 1,844 | $ | 5,577 | $ | 3,027 | $ | 12,078 | $ | (9,969 | ) | $ | 12,557 | ||||||||||
| As at December 31, 2013 | |||||||||||||||||||||||
| Willis Group Holdings | The Other Guarantors | The Issuer | Other | Consolidating adjustments | Consolidated | ||||||||||||||||||
| (millions) | |||||||||||||||||||||||
| EQUITY | |||||||||||||||||||||||
| Total Willis Group Holdings stockholders’ equity | 2,215 | (1,114 | ) | 71 | 3,918 | (2,875 | ) | 2,215 | |||||||||||||||
| Noncontrolling interests | — | — | — | 28 | — | 28 | |||||||||||||||||
| Total equity | 2,215 | (1,114 | ) | 71 | 3,946 | (2,875 | ) | 2,243 | |||||||||||||||
| TOTAL LIABILITIES AND EQUITY | $ | 4,059 | $ | 4,463 | $ | 3,098 | $ | 16,024 | $ | (12,844 | ) | $ | 14,800 | ||||||||||
| As at December 31, 2012 | |||||||||||||||||||||||
Willis Group Holdings | The Other Guarantors | The Issuer | Other | Consolidating adjustments | Consolidated | ||||||||||||||||||
| (millions) | |||||||||||||||||||||||
| ASSETS | |||||||||||||||||||||||
| CURRENT ASSETS | |||||||||||||||||||||||
| Cash and cash equivalents | $ | 1 | $ | — | $ | — | $ | 499 | $ | — | $ | 500 | |||||||||||
| Accounts receivable, net | — | — | — | 933 | — | 933 | |||||||||||||||||
| Fiduciary assets | — | — | — | 9,271 | — | 9,271 | |||||||||||||||||
| Deferred tax assets | — | — | — | 13 | — | 13 | |||||||||||||||||
| Other current assets | 1 | 31 | 38 | 114 | (3 | ) | 181 | ||||||||||||||||
| Amounts due by group undertakings | 4,091 | 993 | 1,292 | 864 | (7,240 | ) | — | ||||||||||||||||
| Total current assets | 4,093 | 1,024 | 1,330 | 11,694 | (7,243 | ) | 10,898 | ||||||||||||||||
| NON-CURRENT ASSETS | |||||||||||||||||||||||
| Investments in subsidiaries | — | 2,407 | 553 | — | (2,960 | ) | — | ||||||||||||||||
| Fixed assets, net | — | 11 | 63 | 394 | — | 468 | |||||||||||||||||
| Goodwill | — | — | — | 2,827 | — | 2,827 | |||||||||||||||||
| Other intangible assets, net | — | — | — | 385 | — | 385 | |||||||||||||||||
| Investments in associates | — | 143 | — | 31 | — | 174 | |||||||||||||||||
| Deferred tax assets | — | — | — | 18 | — | 18 | |||||||||||||||||
| Pension benefits asset | — | — | — | 136 | — | 136 | |||||||||||||||||
| Other non-current assets | 5 | 3 | 41 | 157 | — | 206 | |||||||||||||||||
| Non-current amounts due by group undertakings | — | — | 641 | — | (641 | ) | — | ||||||||||||||||
| Total non-current assets | 5 | 2,564 | 1,298 | 3,948 | (3,601 | ) | 4,214 | ||||||||||||||||
| TOTAL ASSETS | $ | 4,098 | $ | 3,588 | $ | 2,628 | $ | 15,642 | $ | (10,844 | ) | $ | 15,112 | ||||||||||
| LIABILITIES AND STOCKHOLDERS’ EQUITY | |||||||||||||||||||||||
| CURRENT LIABILITIES | |||||||||||||||||||||||
| Fiduciary liabilities | $ | — | $ | — | $ | — | $ | 9,271 | $ | — | $ | 9,271 | |||||||||||
| Deferred revenue and accrued expenses | 2 | — | — | 539 | — | 541 | |||||||||||||||||
| Income taxes payable | — | 4 | — | 18 | (3 | ) | 19 | ||||||||||||||||
| Short-term debt and current portion of long-term debt | — | 15 | — | — | — | 15 | |||||||||||||||||
| Deferred tax liabilities | — | — | — | 21 | — | 21 | |||||||||||||||||
| Other current liabilities | 60 | — | 73 | 194 | — | 327 | |||||||||||||||||
| Amounts due to group undertakings | — | 4,951 | 1,246 | 1,043 | (7,240 | ) | — | ||||||||||||||||
| Total current liabilities | 62 | 4,970 | 1,319 | 11,086 | (7,243 | ) | 10,194 | ||||||||||||||||
| NON-CURRENT LIABILITIES | |||||||||||||||||||||||
| Investments in subsidiaries | 1,542 | — | — | — | (1,542 | ) | — | ||||||||||||||||
| Long-term debt | 795 | 274 | 1,268 | 1 | — | 2,338 | |||||||||||||||||
| Liabilities for pension benefits | — | — | — | 282 | — | 282 | |||||||||||||||||
| Deferred tax liabilities | — | — | — | 18 | — | 18 | |||||||||||||||||
| Provisions for liabilities | — | — | — | 180 | — | 180 | |||||||||||||||||
| Other non-current liabilities | — | 5 | 7 | 363 | — | 375 | |||||||||||||||||
| Non-current amounts due to group undertakings | — | — | — | 641 | (641 | ) | — | ||||||||||||||||
| Total non-current liabilities | 2,337 | 279 | 1,275 | 1,485 | (2,183 | ) | 3,193 | ||||||||||||||||
| TOTAL LIABILITIES | $ | 2,399 | $ | 5,249 | $ | 2,594 | $ | 12,571 | $ | (9,426 | ) | $ | 13,387 | ||||||||||
| As at December 31, 2012 | |||||||||||||||||||||||
| Willis Group Holdings | The Other Guarantors | The Issuer | Other | Consolidating adjustments | Consolidated | ||||||||||||||||||
| (millions) | |||||||||||||||||||||||
| EQUITY | |||||||||||||||||||||||
| Total Willis Group Holdings stockholders’ equity | 1,699 | (1,661 | ) | 34 | 3,045 | (1,418 | ) | 1,699 | |||||||||||||||
| Noncontrolling interests | — | — | — | 26 | — | 26 | |||||||||||||||||
| Total equity | 1,699 | (1,661 | ) | 34 | 3,071 | (1,418 | ) | 1,725 | |||||||||||||||
| TOTAL LIABILITIES AND EQUITY | $ | 4,098 | $ | 3,588 | $ | 2,628 | $ | 15,642 | $ | (10,844 | ) | $ | 15,112 | ||||||||||
| Year Ended December 31, 2013 | |||||||||||||||||||||||
Willis Group Holdings | The Other Guarantors | The Issuer | Other | Consolidating adjustments | Consolidated | ||||||||||||||||||
| (millions) | |||||||||||||||||||||||
| NET CASH (USED IN) PROVIDED BY OPERATING ACTIVITIES | $ | 4 | $ | 125 | $ | 7 | $ | 662 | $ | (237 | ) | $ | 561 | ||||||||||
| CASH FLOWS FROM INVESTING ACTIVITIES | |||||||||||||||||||||||
| Proceeds on disposal of fixed and intangible assets | — | — | 3 | 9 | — | 12 | |||||||||||||||||
| Additions to fixed assets | — | (7 | ) | (11 | ) | (94 | ) | — | (112 | ) | |||||||||||||
| Additions to intangibles assets | — | — | — | (7 | ) | — | (7 | ) | |||||||||||||||
| Acquisitions of subsidiaries, net of cash acquired | — | (237 | ) | (230 | ) | (30 | ) | 467 | (30 | ) | |||||||||||||
| Payments to acquire other investments | — | — | — | (7 | ) | — | (7 | ) | |||||||||||||||
| Proceeds from sale of associates | — | — | — | 4 | — | 4 | |||||||||||||||||
| Proceeds from sale of operations, net of cash disposed | — | — | 230 | 257 | (467 | ) | 20 | ||||||||||||||||
| Proceeds from intercompany investing activities | 383 | 211 | 36 | 60 | (690 | ) | — | ||||||||||||||||
| Repayments of intercompany investing activities | (347 | ) | (442 | ) | (120 | ) | (780 | ) | 1,689 | — | |||||||||||||
| Net cash provided by (used in) investing activities | 36 | (475 | ) | (92 | ) | (588 | ) | 999 | (120 | ) | |||||||||||||
| CASH FLOWS FROM FINANCING ACTIVITIES | |||||||||||||||||||||||
| Senior notes issued | — | 522 | — | — | — | 522 | |||||||||||||||||
| Debt issuance costs | — | (8 | ) | — | — | — | (8 | ) | |||||||||||||||
| Repayments of debt | — | (15 | ) | (521 | ) | — | — | (536 | ) | ||||||||||||||
| Tender premium on extinguishment of senior notes | — | — | (65 | ) | — | — | (65 | ) | |||||||||||||||
| Proceeds from issue of shares | 155 | — | — | — | — | 155 | |||||||||||||||||
| Excess tax benefits from share-based payment arrangements | — | — | — | 2 | — | 2 | |||||||||||||||||
| Dividends paid | (193 | ) | — | (230 | ) | (7 | ) | 237 | (193 | ) | |||||||||||||
| Acquisition of noncontrolling interests | — | — | — | (4 | ) | — | (4 | ) | |||||||||||||||
| Dividends paid to noncontrolling interests | — | — | — | (10 | ) | — | (10 | ) | |||||||||||||||
| Proceeds from intercompany financing activities | — | 321 | 901 | 467 | (1,689 | ) | — | ||||||||||||||||
| Repayments of intercompany financing activities | — | (467 | ) | — | (223 | ) | 690 | — | |||||||||||||||
| Net cash (used in) provided by financing activities | (38 | ) | 353 | 85 | 225 | (762 | ) | (137 | ) | ||||||||||||||
| INCREASE IN CASH AND CASH EQUIVALENTS | 2 | 3 | — | 299 | — | 304 | |||||||||||||||||
| Effect of exchange rate changes on cash and cash equivalents | — | — | — | (8 | ) | — | (8 | ) | |||||||||||||||
| CASH AND CASH EQUIVALENTS, BEGINNING OF YEAR | 1 | — | — | 499 | — | 500 | |||||||||||||||||
| CASH AND CASH EQUIVALENTS, END OF YEAR | $ | 3 | $ | 3 | $ | — | $ | 790 | $ | — | $ | 796 | |||||||||||
| Year Ended December 31, 2012 | |||||||||||||||||||||||
Willis Group Holdings | The Other Guarantors | The Issuer | Other | Consolidating adjustments | Consolidated | ||||||||||||||||||
| (millions) | |||||||||||||||||||||||
| NET CASH (USED IN) PROVIDED BY OPERATING ACTIVITIES | $ | (23 | ) | $ | 1,504 | $ | (44 | ) | $ | (97 | ) | $ | (815 | ) | $ | 525 | |||||||
| CASH FLOWS FROM INVESTING ACTIVITIES | |||||||||||||||||||||||
| Proceeds on disposal of fixed and intangible assets | — | — | — | 5 | — | 5 | |||||||||||||||||
| Additions to fixed assets | — | (7 | ) | (19 | ) | (109 | ) | — | (135 | ) | |||||||||||||
| Additions to intangible assets | — | — | — | (2 | ) | — | (2 | ) | |||||||||||||||
| Acquisitions of subsidiaries, net of cash acquired | — | — | — | (33 | ) | — | (33 | ) | |||||||||||||||
| Payments to acquire other investments | — | — | — | (7 | ) | — | (7 | ) | |||||||||||||||
| Proceeds from sale of operations, net of cash disposed | — | — | — | — | — | — | |||||||||||||||||
| Proceeds from intercompany investing activities | 256 | 216 | 44 | 1,230 | (1,746 | ) | — | ||||||||||||||||
| Repayments of intercompany investing activities | — | (318 | ) | (10 | ) | (81 | ) | 409 | — | ||||||||||||||
| Net cash provided by (used in) investing activities | 256 | (109 | ) | 15 | 1,003 | (1,337 | ) | (172 | ) | ||||||||||||||
| CASH FLOWS FROM FINANCING ACTIVITIES | |||||||||||||||||||||||
| Repayments of debt | — | (15 | ) | — | — | — | (15 | ) | |||||||||||||||
| Proceeds from issue of other debt | — | 1 | — | — | — | 1 | |||||||||||||||||
| Repurchase of shares | (100 | ) | — | — | — | — | (100 | ) | |||||||||||||||
| Proceeds from issue of shares | 53 | — | — | — | — | 53 | |||||||||||||||||
| Excess tax benefits from share-based payment arrangements | — | — | — | 2 | — | 2 | |||||||||||||||||
| Dividends paid | (185 | ) | — | — | (815 | ) | 815 | (185 | ) | ||||||||||||||
| Proceeds from sale of noncontrolling interest | — | — | — | 3 | — | 3 | |||||||||||||||||
| Acquisition of noncontrolling interests | — | — | — | (39 | ) | — | (39 | ) | |||||||||||||||
| Dividends paid to noncontrolling interests | — | — | — | (11 | ) | — | (11 | ) | |||||||||||||||
| Proceeds from intercompany financing activities | — | 81 | — | 328 | (409 | ) | — | ||||||||||||||||
| Repayments of intercompany financing activities | — | (1,462 | ) | (134 | ) | (150 | ) | 1,746 | — | ||||||||||||||
| Net cash (used in) provided by financing activities | (232 | ) | (1,395 | ) | (134 | ) | (682 | ) | 2,152 | (291 | ) | ||||||||||||
| INCREASE (DECREASE) IN CASH AND CASH EQUIVALENTS | 1 | — | (163 | ) | 224 | — | 62 | ||||||||||||||||
| Effect of exchange rate changes on cash and cash equivalents | — | — | — | 2 | — | 2 | |||||||||||||||||
| CASH AND CASH EQUIVALENTS, BEGINNING OF YEAR | — | — | 163 | 273 | — | 436 | |||||||||||||||||
| CASH AND CASH EQUIVALENTS, END OF YEAR | $ | 1 | $ | — | $ | — | $ | 499 | $ | — | $ | 500 | |||||||||||
| Year Ended December 31, 2011 | |||||||||||||||||||||||
Willis Group Holdings | The Other Guarantors | The Issuer | Other | Consolidating adjustments | Consolidated | ||||||||||||||||||
| (millions) | |||||||||||||||||||||||
| NET CASH PROVIDED BY (USED IN) OPERATING ACTIVITIES | $ | 44 | $ | 316 | $ | 134 | $ | 131 | $ | (186 | ) | $ | 439 | ||||||||||
| CASH FLOWS FROM INVESTING ACTIVITIES | |||||||||||||||||||||||
| Proceeds on disposal of fixed and intangible assets | — | — | — | 13 | — | 13 | |||||||||||||||||
| Additions to fixed assets | — | (4 | ) | (21 | ) | (86 | ) | — | (111 | ) | |||||||||||||
| Acquisitions of subsidiaries, net of cash acquired | — | — | — | (10 | ) | — | (10 | ) | |||||||||||||||
| Acquisitions of investments in associates | — | — | — | (2 | ) | — | (2 | ) | |||||||||||||||
| Payments to acquire other investments | — | — | — | (5 | ) | — | (5 | ) | |||||||||||||||
| Proceeds from sale of operations, net of cash disposed | — | — | — | 14 | — | 14 | |||||||||||||||||
| Proceeds from intercompany investing activities | — | — | 128 | 224 | (352 | ) | — | ||||||||||||||||
| Repayments of intercompany investing activities | (711 | ) | (430 | ) | — | (101 | ) | 1,242 | — | ||||||||||||||
| Net cash (used in) provided by investing activities | (711 | ) | (434 | ) | 107 | 47 | 890 | (101 | ) | ||||||||||||||
| CASH FLOWS FROM FINANCING ACTIVITIES | |||||||||||||||||||||||
| Repayments of revolving credit facility | — | — | (90 | ) | — | — | (90 | ) | |||||||||||||||
| Senior notes issued | 794 | — | — | — | — | 794 | |||||||||||||||||
| Debt issuance costs | (7 | ) | (5 | ) | — | — | — | (12 | ) | ||||||||||||||
| Repayments of debt | — | (500 | ) | (411 | ) | — | — | (911 | ) | ||||||||||||||
| Proceeds from issue of term loan | — | 300 | — | — | — | 300 | |||||||||||||||||
| Make-whole on repurchase and redemption of senior notes | — | (158 | ) | — | — | — | (158 | ) | |||||||||||||||
| Proceeds from issue of shares | 60 | — | — | — | — | 60 | |||||||||||||||||
| Excess tax benefits from share-based payment arrangements | — | — | — | 5 | — | 5 | |||||||||||||||||
| Dividends paid | (180 | ) | — | — | (186 | ) | 186 | (180 | ) | ||||||||||||||
| Acquisition of noncontrolling interests | — | (4 | ) | — | (5 | ) | — | (9 | ) | ||||||||||||||
| Dividends paid to noncontrolling interests | — | — | — | (13 | ) | — | (13 | ) | |||||||||||||||
| Cash received on intercompany financing activities | — | 741 | 347 | 154 | (1,242 | ) | — | ||||||||||||||||
| Cash paid on intercompany financing activities | — | (256 | ) | — | (96 | ) | 352 | — | |||||||||||||||
| Net cash provided by (used in) financing activities | 667 | 118 | (154 | ) | (141 | ) | (704 | ) | (214 | ) | |||||||||||||
| (DECREASE) INCREASE IN CASH AND CASH EQUIVALENTS | — | — | 87 | 37 | — | 124 | |||||||||||||||||
| Effect of exchange rate changes on cash and cash equivalents | — | — | — | (4 | ) | — | (4 | ) | |||||||||||||||
| CASH AND CASH EQUIVALENTS, BEGINNING OF YEAR | — | — | 76 | 240 | — | 316 | |||||||||||||||||
| CASH AND CASH EQUIVALENTS, END OF YEAR | $ | — | $ | — | $ | 163 | $ | 273 | $ | — | $ | 436 | |||||||||||
| 31. | FINANCIAL INFORMATION FOR PARENT ISSUER, GUARANTOR SUBSIDIARIES AND NON-GUARANTOR SUBSIDIARIES |
| Willis Group Holdings, which is the Parent Issuer; |
| (ii) | the Guarantors, which are all 100 percent directly or indirectly owned subsidiaries of the parent; |
| (iii) | Other, which are the non-guarantor subsidiaries, on a combined basis; |
| (iv) | Consolidating adjustments; and |
| (v) | the Consolidated Company. |
| As previously reported | Reclassifications | As Reclassified | |||||||||
| (millions) | |||||||||||
| Condensed consolidating statement of operations for the year ended 31 December 2012 | |||||||||||
| Willis Group Holdings - the Parent Issuer | |||||||||||
| Operating loss | $ | (6 | ) | $ | — | $ | (6 | ) | |||
| Net loss attributable to Willis Group Holdings | (446 | ) | — | (446 | ) | ||||||
| The Guarantors | |||||||||||
| Operating loss | $ | (261 | ) | $ | (11 | ) | $ | (272 | ) | ||
| Net loss attributable to Willis Group Holdings | (389 | ) | (8 | ) | (397 | ) | |||||
| Other | |||||||||||
| Operating income (loss) | $ | 122 | $ | (53 | ) | $ | 69 | ||||
| Net loss attributable to Willis Group Holdings | (118 | ) | (306 | ) | (424 | ) | |||||
| Consolidating adjustments | |||||||||||
| Operating (loss) income | $ | (64 | ) | $ | 64 | $ | — | ||||
| Net income attributable to Willis Group Holdings | 507 | 314 | 821 | ||||||||
| As previously reported | Reclassifications | As Reclassified | |||||||||
| (millions) | |||||||||||
| Condensed consolidating statement of operations for the year ended 31 December 2011 | |||||||||||
| Willis Group Holdings - the Parent Issuer | |||||||||||
| Operating loss | $ | (20 | ) | $ | — | $ | (20 | ) | |||
| Net income attributable to Willis Group Holdings | 204 | — | 204 | ||||||||
| The Guarantors | |||||||||||
| Operating loss | $ | (136 | ) | $ | (11 | ) | $ | (147 | ) | ||
| Net income attributable to Willis Group Holdings | 174 | 72 | 246 | ||||||||
| Other | |||||||||||
| Operating income (loss) | $ | 754 | $ | (21 | ) | $ | 733 | ||||
| Net income attributable to Willis Group Holdings | 137 | 164 | 301 | ||||||||
| Consolidating adjustments | |||||||||||
| Operating (loss) income | $ | (32 | ) | $ | 32 | $ | — | ||||
| Net loss attributable to Willis Group Holdings | (311 | ) | (236 | ) | (547 | ) | |||||
| As previously reported | Reclassifications | As Reclassified | |||||||||
| (millions) | |||||||||||
| Condensed consolidating statement of comprehensive income for the year ended 31 December 2012 | |||||||||||
| Willis Group Holdings - the Parent Issuer | |||||||||||
| Comprehensive loss attributable to Willis Group Holdings | $ | (552 | ) | $ | — | $ | (552 | ) | |||
| The Guarantors | |||||||||||
| Comprehensive loss attributable to Willis Group Holdings | $ | (486 | ) | $ | (8 | ) | $ | (494 | ) | ||
| Other | |||||||||||
| Comprehensive loss attributable to Willis Group Holdings | $ | (226 | ) | $ | (306 | ) | $ | (532 | ) | ||
| Consolidating adjustments | |||||||||||
| Comprehensive income attributable to Willis Group Holdings | $ | 712 | $ | 314 | $ | 1,026 | |||||
| As previously reported | Reclassifications | As Reclassified | |||||||||
| (millions) | |||||||||||
| Condensed consolidating statement of comprehensive income for the year ended 31 December 2011 | |||||||||||
| Willis Group Holdings - the Parent Issuer | |||||||||||
| Comprehensive income attributable to Willis Group Holdings | $ | 1 | $ | — | �� | $ | 1 | ||||
| The Guarantors | |||||||||||
| Comprehensive (loss) income attributable to Willis Group Holdings | $ | (24 | ) | $ | 72 | $ | 48 | ||||
| Other | |||||||||||
| Comprehensive (loss) income attributable to Willis Group Holdings | $ | (65 | ) | $ | 164 | $ | 99 | ||||
| Consolidating adjustments | |||||||||||
| Comprehensive income (loss) attributable to Willis Group Holdings | $ | 89 | $ | (236 | ) | $ | (147 | ) | |||
| As previously reported | Reclassifications | As Reclassified | |||||||||
| (millions) | |||||||||||
| Condensed consolidating balance sheet at 31 December 2012 | |||||||||||
| Willis Group Holdings - the Parent Issuer | |||||||||||
| Total assets | $ | 2,557 | $ | 1,541 | $ | 4,098 | |||||
| Total liabilities | 858 | 1,541 | 2,399 | ||||||||
| Total equity | 1,699 | — | 1,699 | ||||||||
| The Guarantors | |||||||||||
| Total assets | $ | 92 | $ | 4,832 | $ | 4,924 | |||||
| Total liabilities | 1,667 | 4,918 | 6,585 | ||||||||
| Total equity | (1,575 | ) | (86 | ) | (1,661 | ) | |||||
| Other | |||||||||||
| Total assets | $ | 17,125 | $ | (1,483 | ) | $ | 15,642 | ||||
| Total liabilities | 11,851 | 720 | 12,571 | ||||||||
| Total equity | 5,274 | (2,203 | ) | 3,071 | |||||||
| Consolidating adjustments | |||||||||||
| Total assets | $ | (4,662 | ) | $ | (4,890 | ) | $ | (9,552 | ) | ||
| Total liabilities | (989 | ) | (7,179 | ) | (8,168 | ) | |||||
| Total equity | (3,673 | ) | 2,289 | (1,384 | ) | ||||||
| As previously reported | Reclassifications | As Reclassified | |||||||||
| (millions) | |||||||||||
| Condensed consolidating statement of cash flows for the year ended 31 December 2012 | |||||||||||
| Willis Group Holdings - the Parent Issuer | |||||||||||
| Net cash (used in) provided by operating activities | $ | (42 | ) | $ | 19 | $ | (23 | ) | |||
| Net cash provided by investing activities | — | 256 | 256 | ||||||||
| Net cash provided by (used in) financing activities | 43 | (275 | ) | (232 | ) | ||||||
| The Guarantors | |||||||||||
| Net cash provided by operating activities | $ | 849 | $ | 611 | $ | 1,460 | |||||
| Net cash used in investing activities | (26 | ) | (178 | ) | (204 | ) | |||||
| Net cash used in financing activities | (986 | ) | (433 | ) | (1,419 | ) | |||||
| Other | |||||||||||
| Net cash provided by (used in) operating activities | $ | 431 | $ | (528 | ) | $ | (97 | ) | |||
| Net cash (used in) provided by investing activities | (146 | ) | 1,149 | 1,003 | |||||||
| Net cash used in financing activities | (61 | ) | (621 | ) | (682 | ) | |||||
| Consolidating adjustments | |||||||||||
| Net cash used in operating activities | $ | (713 | ) | $ | (102 | ) | $ | (815 | ) | ||
| Net cash used in investing activities | — | (1,227 | ) | (1,227 | ) | ||||||
| Net cash provided by financing activities | 713 | 1,329 | 2,042 | ||||||||
| As previously reported | Reclassifications | As Reclassified | |||||||||
| (millions) | |||||||||||
| Condensed consolidating statement of cash flows for the year ended 31 December 2011 | |||||||||||
| Willis Group Holdings - the Parent Issuer | |||||||||||
| Net cash (used in) provided by operating activities | $ | (41 | ) | $ | 85 | $ | 44 | ||||
| Net cash used in investing activities | — | (711 | ) | (711 | ) | ||||||
| Net cash provided by financing activities | 41 | 626 | 667 | ||||||||
| The Guarantors | |||||||||||
| Net cash provided by operating activities | $ | 272 | $ | 178 | $ | 450 | |||||
| Net cash used in investing activities | (25 | ) | (42 | ) | (67 | ) | |||||
| Net cash used in financing activities | (160 | ) | (136 | ) | (296 | ) | |||||
| Other | |||||||||||
| Net cash provided by (used in) operating activities | $ | 1,269 | $ | (1,138 | ) | $ | 131 | ||||
| Net cash (used in) provided by investing activities | (76 | ) | 123 | 47 | |||||||
| Net cash (used in) provided by financing activities | (1,156 | ) | 1,015 | (141 | ) | ||||||
| Consolidating adjustments | |||||||||||
| Net cash (used in) provided by operating activities | $ | (1,061 | ) | $ | 875 | $ | (186 | ) | |||
| Net cash provided by investing activities | — | 630 | 630 | ||||||||
| Net cash provided by (used in) financing activities | 1,061 | (1,505 | ) | (444 | ) | ||||||
| Year Ended December 31, 2013 | |||||||||||||||||||
Willis Group Holdings — the Parent Issuer | The Guarantors | Other | Consolidating adjustments | Consolidated | |||||||||||||||
| (millions) | |||||||||||||||||||
| REVENUES | |||||||||||||||||||
| Commissions and fees | $ | — | $ | 8 | $ | 3,625 | $ | — | $ | 3,633 | |||||||||
| Investment income | — | — | 15 | — | 15 | ||||||||||||||
| Other income | — | — | 7 | — | 7 | ||||||||||||||
| Total revenues | — | 8 | 3,647 | — | 3,655 | ||||||||||||||
| EXPENSES | |||||||||||||||||||
| Salaries and benefits | (1 | ) | (103 | ) | (2,103 | ) | — | (2,207 | ) | ||||||||||
| Other operating expenses | — | (236 | ) | (380 | ) | — | (616 | ) | |||||||||||
| Depreciation expense | — | (23 | ) | (71 | ) | — | (94 | ) | |||||||||||
| Amortization of intangible assets | — | — | (55 | ) | — | (55 | ) | ||||||||||||
| Net gain on disposal of operations | — | — | 12 | (10 | ) | 2 | |||||||||||||
| Total expenses | (1 | ) | (362 | ) | (2,597 | ) | (10 | ) | (2,970 | ) | |||||||||
| OPERATING (LOSS) INCOME | (1 | ) | (354 | ) | 1,050 | (10 | ) | 685 | |||||||||||
| Income from Group undertakings | — | 466 | 86 | (552 | ) | — | |||||||||||||
| Expenses due to Group undertakings | (10 | ) | (86 | ) | (456 | ) | 552 | — | |||||||||||
| Loss on extinguishment of debt | — | (60 | ) | — | — | (60 | ) | ||||||||||||
| Interest expense | (42 | ) | (79 | ) | (5 | ) | — | (126 | ) | ||||||||||
| (LOSS) INCOME FROM CONTINUING OPERATIONS BEFORE INCOME TAXES AND INTEREST IN EARNINGS OF ASSOCIATES | (53 | ) | (113 | ) | 675 | (10 | ) | 499 | |||||||||||
| Income taxes | — | 23 | (145 | ) | — | (122 | ) | ||||||||||||
| (LOSS) INCOME FROM CONTINUING OPERATIONS BEFORE INTEREST IN EARNINGS OF ASSOCIATES | (53 | ) | (90 | ) | 530 | (10 | ) | 377 | |||||||||||
| Interest in earnings of associates, net of tax | — | 9 | (9 | ) | — | — | |||||||||||||
| Equity account for subsidiaries | 418 | 498 | — | (916 | ) | — | |||||||||||||
| INCOME FROM CONTINUING OPERATIONS | 365 | 417 | 521 | (926 | ) | 377 | |||||||||||||
| Discontinued operations, net of tax | — | — | — | — | — | ||||||||||||||
| NET INCOME | 365 | 417 | 521 | (926 | ) | 377 | |||||||||||||
| Less: Net income attributable to noncontrolling interests | — | — | (12 | ) | — | (12 | ) | ||||||||||||
| NET INCOME ATTRIBUTABLE TO WILLIS GROUP HOLDINGS | $ | 365 | $ | 417 | $ | 509 | $ | (926 | ) | $ | 365 | ||||||||
| Year Ended December 31, 2013 | |||||||||||||||||||
Willis Group Holdings—the Parent Issuer | The Guarantors | Other | Consolidating adjustments | Consolidated | |||||||||||||||
| (millions) | |||||||||||||||||||
| Comprehensive income | $ | 522 | $ | 565 | $ | 636 | $ | (1,189 | ) | $ | 534 | ||||||||
| Less: Comprehensive income attributable to noncontrolling interests | — | — | (12 | ) | — | (12 | ) | ||||||||||||
| Comprehensive income attributable to Willis Group Holdings | $ | 522 | $ | 565 | $ | 624 | $ | (1,189 | ) | $ | 522 | ||||||||
| Year Ended December 31, 2012 | |||||||||||||||||||
Willis Group Holdings — the Parent Issuer | The Guarantors | Other | Consolidating adjustments | Consolidated | |||||||||||||||
| (millions) | |||||||||||||||||||
| REVENUES | |||||||||||||||||||
| Commissions and fees | $ | — | $ | — | $ | 3,458 | $ | — | $ | 3,458 | |||||||||
| Investment income | — | 1 | 17 | — | 18 | ||||||||||||||
| Other income | — | — | 4 | — | 4 | ||||||||||||||
| Total revenues | — | 1 | 3,479 | — | 3,480 | ||||||||||||||
| EXPENSES | |||||||||||||||||||
| Salaries and benefits | (2 | ) | (96 | ) | (2,377 | ) | — | (2,475 | ) | ||||||||||
| Other operating expenses | (4 | ) | (161 | ) | (416 | ) | — | (581 | ) | ||||||||||
| Depreciation expense | — | (16 | ) | (63 | ) | — | (79 | ) | |||||||||||
| Amortization of intangible assets | — | — | (59 | ) | — | (59 | ) | ||||||||||||
| Goodwill impairment charge | — | — | (492 | ) | — | (492 | ) | ||||||||||||
| Net loss on disposal of operations | — | — | (3 | ) | — | (3 | ) | ||||||||||||
| Total expenses | (6 | ) | (273 | ) | (3,410 | ) | — | (3,689 | ) | ||||||||||
| OPERATING (LOSS) INCOME | (6 | ) | (272 | ) | 69 | — | (209 | ) | |||||||||||
| Income from Group undertakings | — | 409 | 111 | (520 | ) | — | |||||||||||||
| Expenses due to Group undertakings | — | (106 | ) | (414 | ) | 520 | — | ||||||||||||
| Interest expense | (43 | ) | (77 | ) | (8 | ) | — | (128 | ) | ||||||||||
| LOSS FROM CONTINUING OPERATIONS BEFORE INCOME TAXES AND INTEREST IN EARNINGS OF ASSOCIATES | (49 | ) | (46 | ) | (242 | ) | — | (337 | ) | ||||||||||
| Income taxes | — | 65 | (166 | ) | — | (101 | ) | ||||||||||||
| (LOSS) INCOME FROM CONTINUING OPERATIONS BEFORE INTEREST IN EARNINGS OF ASSOCIATES | (49 | ) | 19 | (408 | ) | — | (438 | ) | |||||||||||
| Interest in earnings of associates, net of tax | — | 8 | (3 | ) | — | 5 | |||||||||||||
| Equity account for subsidiaries | (397 | ) | (424 | ) | — | 821 | — | ||||||||||||
| LOSS FROM CONTINUING OPERATIONS | (446 | ) | (397 | ) | (411 | ) | 821 | (433 | ) | ||||||||||
| Discontinued operations, net of tax | — | — | — | — | — | ||||||||||||||
| NET LOSS | (446 | ) | (397 | ) | (411 | ) | 821 | (433 | ) | ||||||||||
| Less: Net income attributable to noncontrolling interests | — | — | (13 | ) | — | (13 | ) | ||||||||||||
| NET LOSS ATTRIBUTABLE TO WILLIS GROUP HOLDINGS | $ | (446 | ) | $ | (397 | ) | $ | (424 | ) | $ | 821 | $ | (446 | ) | |||||
| Year Ended December 31, 2012 | |||||||||||||||||||
Willis Group Holdings—the Parent Issuer | The Guarantors | Other | Consolidating adjustments | Consolidated | |||||||||||||||
| (millions) | |||||||||||||||||||
| Comprehensive loss | $ | (552 | ) | $ | (494 | ) | $ | (519 | ) | $ | 1,026 | $ | (539 | ) | |||||
| Less: Comprehensive income attributable to noncontrolling interests | — | — | (13 | ) | — | (13 | ) | ||||||||||||
| Comprehensive loss attributable to Willis Group Holdings | $ | (552 | ) | $ | (494 | ) | $ | (532 | ) | $ | 1,026 | $ | (552 | ) | |||||
| Year Ended December 31, 2011 | |||||||||||||||||||
Willis Group Holdings — the Parent Issuer | The Guarantors | Other | Consolidating adjustments | Consolidated | |||||||||||||||
| (millions) | |||||||||||||||||||
| REVENUES | |||||||||||||||||||
| Commissions and fees | $ | — | $ | — | $ | 3,414 | $ | — | $ | 3,414 | |||||||||
| Investment income | — | 2 | 29 | — | 31 | ||||||||||||||
| Other income | — | — | 2 | — | 2 | ||||||||||||||
| Total revenues | — | 2 | 3,445 | — | 3,447 | ||||||||||||||
| EXPENSES | |||||||||||||||||||
| Salaries and benefits | (3 | ) | (69 | ) | (2,015 | ) | — | (2,087 | ) | ||||||||||
| Other operating expenses | (17 | ) | (66 | ) | (573 | ) | — | (656 | ) | ||||||||||
| Depreciation expense | — | (14 | ) | (60 | ) | — | (74 | ) | |||||||||||
| Amortization of intangible assets | — | — | (68 | ) | — | (68 | ) | ||||||||||||
| Net gain on disposal of operations | — | — | 4 | — | 4 | ||||||||||||||
| Total expenses | (20 | ) | (149 | ) | (2,712 | ) | — | (2,881 | ) | ||||||||||
| OPERATING (LOSS) INCOME | (20 | ) | (147 | ) | 733 | — | 566 | ||||||||||||
| Income from Group undertakings | — | 412 | 119 | (531 | ) | — | |||||||||||||
| Expenses due to Group undertakings | — | (116 | ) | (415 | ) | 531 | — | ||||||||||||
| Make-whole on repurchase and redemption of senior notes and write-off of unamortized debt issuance costs | — | (171 | ) | — | — | (171 | ) | ||||||||||||
| Interest expense | (34 | ) | (114 | ) | (8 | ) | — | (156 | ) | ||||||||||
| (LOSS) INCOME FROM CONTINUING OPERATIONS BEFORE INCOME TAXES AND INTEREST IN EARNINGS OF ASSOCIATES | (54 | ) | (136 | ) | 429 | — | 239 | ||||||||||||
| Income taxes | — | 86 | (117 | ) | (1 | ) | (32 | ) | |||||||||||
| (LOSS) INCOME FROM CONTINUING OPERATIONS BEFORE INTEREST IN EARNINGS OF ASSOCIATES | (54 | ) | (50 | ) | 312 | (1 | ) | 207 | |||||||||||
| Interest in earnings of associates, net of tax | — | 8 | 4 | — | 12 | ||||||||||||||
| Equity account for subsidiaries | 258 | 288 | — | (546 | ) | — | |||||||||||||
| INCOME FROM CONTINUING OPERATIONS | 204 | 246 | 316 | (547 | ) | 219 | |||||||||||||
| Discontinued operations, net of tax | — | — | 1 | — | 1 | ||||||||||||||
| NET INCOME | 204 | 246 | 317 | (547 | ) | 220 | |||||||||||||
| Less: Net income attributable to noncontrolling interests | — | — | (16 | ) | — | (16 | ) | ||||||||||||
| NET INCOME ATTRIBUTABLE TO WILLIS GROUP HOLDINGS | $ | 204 | $ | 246 | $ | 301 | $ | (547 | ) | $ | 204 | ||||||||
| Year Ended December 31, 2011 | |||||||||||||||||||
Willis Group Holdings—the Parent Issuer | The Guarantors | Other | Consolidating adjustments | Consolidated | |||||||||||||||
| (millions) | |||||||||||||||||||
| Comprehensive income | $ | 1 | $ | 48 | $ | 114 | $ | (147 | ) | $ | 16 | ||||||||
| Less: Comprehensive income attributable to noncontrolling interests | — | — | (15 | ) | — | (15 | ) | ||||||||||||
| Comprehensive income attributable to Willis Group Holdings | $ | 1 | $ | 48 | $ | 99 | $ | (147 | ) | $ | 1 | ||||||||
| As at December 31, 2013 | |||||||||||||||||||
Willis Group Holdings — the Parent Issuer | The Guarantors | Other | Consolidating adjustments | Consolidated | |||||||||||||||
| (millions) | |||||||||||||||||||
| ASSETS | |||||||||||||||||||
| CURRENT ASSETS | |||||||||||||||||||
| Cash and cash equivalents | $ | 3 | $ | 3 | $ | 790 | $ | — | $ | 796 | |||||||||
| Accounts receivable, net | — | 4 | 1,037 | — | 1,041 | ||||||||||||||
| Fiduciary assets | — | — | 8,412 | — | 8,412 | ||||||||||||||
| Deferred tax assets | — | — | 16 | (1 | ) | 15 | |||||||||||||
| Other current assets | 1 | 31 | 186 | (21 | ) | 197 | |||||||||||||
| Amounts due from group undertakings | 4,051 | 975 | 1,484 | (6,510 | ) | — | |||||||||||||
| Total current assets | 4,055 | 1,013 | 11,925 | (6,532 | ) | 10,461 | |||||||||||||
| NON-CURRENT ASSETS | |||||||||||||||||||
| Investments in subsidiaries | — | 3,788 | — | (3,788 | ) | — | |||||||||||||
| Fixed assets, net | — | 66 | 415 | — | 481 | ||||||||||||||
| Goodwill | — | — | 2,838 | — | 2,838 | ||||||||||||||
| Other intangible assets, net | — | — | 353 | — | 353 | ||||||||||||||
| Investments in associates | — | 156 | 20 | — | 176 | ||||||||||||||
| Deferred tax assets | — | — | 7 | — | 7 | ||||||||||||||
| Pension benefits asset | — | — | 278 | — | 278 | ||||||||||||||
| Other non-current assets | 4 | 14 | 188 | — | 206 | ||||||||||||||
| Non-current amounts due from group undertakings | — | 690 | — | (690 | ) | — | |||||||||||||
| Total non-current assets | 4 | 4,714 | 4,099 | (4,478 | ) | 4,339 | |||||||||||||
| TOTAL ASSETS | $ | 4,059 | $ | 5,727 | $ | 16,024 | $ | (11,010 | ) | $ | 14,800 | ||||||||
| LIABILITIES AND STOCKHOLDERS’ EQUITY | |||||||||||||||||||
| CURRENT LIABILITIES | |||||||||||||||||||
| Fiduciary liabilities | $ | — | $ | — | $ | 8,412 | $ | — | $ | 8,412 | |||||||||
| Deferred revenue and accrued expenses | 2 | 29 | 555 | — | 586 | ||||||||||||||
| Income taxes payable | — | 3 | 39 | (21 | ) | 21 | |||||||||||||
| Short-term debt and current portion on long-term debt | — | 15 | — | — | 15 | ||||||||||||||
| Deferred tax liabilities | — | — | 25 | — | 25 | ||||||||||||||
| Other current liabilities | 62 | 53 | 300 | — | 415 | ||||||||||||||
| Amounts due to group undertakings | — | 5,177 | 1,333 | (6,510 | ) | — | |||||||||||||
| Total current liabilities | 64 | 5,277 | 10,664 | (6,531 | ) | 9,474 | |||||||||||||
| NON-CURRENT LIABILITIES | |||||||||||||||||||
| Investments in subsidiaries | 985 | — | — | (985 | ) | — | |||||||||||||
| Long-term debt | 795 | 1,515 | 1 | — | 2,311 | ||||||||||||||
| Liabilities for pension benefits | — | — | 136 | — | 136 | ||||||||||||||
| Deferred tax liabilities | — | 1 | 55 | — | 56 | ||||||||||||||
| Provisions for liabilities | — | — | 206 | — | 206 | ||||||||||||||
| Other non-current liabilities | — | 48 | 326 | — | 374 | ||||||||||||||
| Non-current amounts due to group undertakings | — | — | 690 | (690 | ) | — | |||||||||||||
| Total non-current liabilities | 1,780 | 1,564 | 1,414 | (1,675 | ) | 3,083 | |||||||||||||
| TOTAL LIABILITIES | $ | 1,844 | $ | 6,841 | $ | 12,078 | $ | (8,206 | ) | $ | 12,557 | ||||||||
| As at December 31, 2013 | |||||||||||||||||||
| Willis Group Holdings — the Parent Issuer | The Guarantors | Other | Consolidating adjustments | Consolidated | |||||||||||||||
| (millions) | |||||||||||||||||||
| EQUITY | |||||||||||||||||||
| Total Willis Group Holdings stockholders’ equity | 2,215 | (1,114 | ) | 3,918 | (2,804 | ) | 2,215 | ||||||||||||
| Noncontrolling interests | — | — | 28 | — | 28 | ||||||||||||||
| Total equity | 2,215 | (1,114 | ) | 3,946 | (2,804 | ) | 2,243 | ||||||||||||
| TOTAL LIABILITIES AND EQUITY | $ | 4,059 | $ | 5,727 | $ | 16,024 | $ | (11,010 | ) | $ | 14,800 | ||||||||
| As at December 31, 2012 | |||||||||||||||||||
Willis Group Holdings — the Parent Issuer | The Guarantors | Other | Consolidating adjustments | Consolidated | |||||||||||||||
| (millions) | |||||||||||||||||||
| ASSETS | |||||||||||||||||||
| CURRENT ASSETS | |||||||||||||||||||
| Cash and cash equivalents | $ | 1 | $ | — | $ | 499 | $ | — | $ | 500 | |||||||||
| Accounts receivable, net | — | — | 933 | — | 933 | ||||||||||||||
| Fiduciary assets | — | — | 9,271 | — | 9,271 | ||||||||||||||
| Deferred tax assets | — | — | 13 | — | 13 | ||||||||||||||
| Other current assets | 1 | 69 | 114 | (3 | ) | 181 | |||||||||||||
| Amounts due from group undertakings | 4,091 | 1,027 | 864 | (5,982 | ) | — | |||||||||||||
| Total current assets | 4,093 | 1,096 | 11,694 | (5,985 | ) | 10,898 | |||||||||||||
| NON-CURRENT ASSETS | |||||||||||||||||||
| Investments in subsidiaries | — | 2,926 | — | (2,926 | ) | — | |||||||||||||
| Fixed assets, net | — | 74 | 394 | — | 468 | ||||||||||||||
| Goodwill | — | — | 2,827 | — | 2,827 | ||||||||||||||
| Other intangible assets, net | — | — | 385 | — | 385 | ||||||||||||||
| Investments in associates | — | 143 | 31 | — | 174 | ||||||||||||||
| Deferred tax assets | — | — | 18 | — | 18 | ||||||||||||||
| Pension benefits asset | — | — | 136 | — | 136 | ||||||||||||||
| Other non-current assets | 5 | 44 | 157 | — | 206 | ||||||||||||||
| Non-current amounts due from group undertakings | — | 641 | — | (641 | ) | — | |||||||||||||
| Total non-current assets | 5 | 3,828 | 3,948 | (3,567 | ) | 4,214 | |||||||||||||
| TOTAL ASSETS | $ | 4,098 | $ | 4,924 | $ | 15,642 | $ | (9,552 | ) | $ | 15,112 | ||||||||
| LIABILITIES AND STOCKHOLDERS’ EQUITY | |||||||||||||||||||
| CURRENT LIABILITIES | |||||||||||||||||||
| Fiduciary liabilities | $ | — | $ | — | $ | 9,271 | $ | — | $ | 9,271 | |||||||||
| Deferred revenue and accrued expenses | 2 | — | 539 | — | 541 | ||||||||||||||
| Income taxes payable | — | 4 | 18 | (3 | ) | 19 | |||||||||||||
| Short-term debt and current portion of long-term debt | — | 15 | — | — | 15 | ||||||||||||||
| Deferred tax liabilities | — | — | 21 | — | 21 | ||||||||||||||
| Other current liabilities | 60 | 73 | 194 | — | 327 | ||||||||||||||
| Amounts due to group undertakings | — | 4,939 | 1,043 | (5,982 | ) | — | |||||||||||||
| Total current liabilities | 62 | 5,031 | 11,086 | (5,985 | ) | 10,194 | |||||||||||||
| NON-CURRENT LIABILITIES | |||||||||||||||||||
| Investments in subsidiaries | 1,542 | — | — | (1,542 | ) | — | |||||||||||||
| Long-term debt | 795 | 1,542 | 1 | — | 2,338 | ||||||||||||||
| Liabilities for pension benefits | — | — | 282 | — | 282 | ||||||||||||||
| Deferred tax liabilities | — | — | 18 | — | 18 | ||||||||||||||
| Provisions for liabilities | — | — | 180 | — | 180 | ||||||||||||||
| Other non-current liabilities | — | 12 | 363 | — | 375 | ||||||||||||||
| Non-current amounts due to group undertakings | — | — | 641 | (641 | ) | — | |||||||||||||
| Total non-current liabilities | 2,337 | 1,554 | 1,485 | (2,183 | ) | 3,193 | |||||||||||||
| TOTAL LIABILITIES | $ | 2,399 | $ | 6,585 | $ | 12,571 | $ | (8,168 | ) | $ | 13,387 | ||||||||
| As at December 31, 2012 | |||||||||||||||||||
| Willis Group Holdings — the Parent Issuer | The Guarantors | Other | Consolidating adjustments | Consolidated | |||||||||||||||
| (millions) | |||||||||||||||||||
| EQUITY | |||||||||||||||||||
| Total Willis Group Holdings stockholders’ equity | 1,699 | (1,661 | ) | 3,045 | (1,384 | ) | 1,699 | ||||||||||||
| Noncontrolling interests | — | — | 26 | — | 26 | ||||||||||||||
| Total equity | 1,699 | (1,661 | ) | 3,071 | (1,384 | ) | 1,725 | ||||||||||||
| TOTAL LIABILITIES AND EQUITY | $ | 4,098 | $ | 4,924 | $ | 15,642 | $ | (9,552 | ) | $ | 15,112 | ||||||||
| Year Ended December 31, 2013 | |||||||||||||||||||
Willis Group Holdings — the Parent Issuer | The Guarantors | Other | Consolidating adjustments | Consolidated | |||||||||||||||
| (millions) | |||||||||||||||||||
| NET CASH PROVIDED BY (USED IN) OPERATING ACTIVITIES | $ | 4 | $ | (98 | ) | $ | 662 | $ | (7 | ) | $ | 561 | |||||||
| CASH FLOWS FROM INVESTING ACTIVITIES | |||||||||||||||||||
| Proceeds on disposal of fixed and intangible assets | — | 3 | 9 | — | 12 | ||||||||||||||
| Additions to fixed assets | — | (18 | ) | (94 | ) | — | (112 | ) | |||||||||||
| Additions to intangibles assets | — | — | (7 | ) | — | (7 | ) | ||||||||||||
| Acquisitions of subsidiaries, net of cash acquired | — | (237 | ) | (30 | ) | 237 | (30 | ) | |||||||||||
| Payments to acquire other investments | — | — | (7 | ) | — | (7 | ) | ||||||||||||
| Proceeds from sale of associates | — | — | 4 | — | 4 | ||||||||||||||
| Proceeds from disposal of operations, net of cash disposed | — | — | 257 | (237 | ) | 20 | |||||||||||||
| Proceeds from intercompany investing activities | 383 | 223 | 60 | (666 | ) | — | |||||||||||||
| Repayments of intercompany investing activities | (347 | ) | (120 | ) | (780 | ) | 1,247 | — | |||||||||||
| Net cash provided by (used in) investing activities | 36 | (149 | ) | (588 | ) | 581 | (120 | ) | |||||||||||
| CASH FLOWS FROM FINANCING ACTIVITIES | |||||||||||||||||||
| Senior notes issued | — | 522 | — | — | 522 | ||||||||||||||
| Debt issuance costs | — | (8 | ) | — | — | (8 | ) | ||||||||||||
| Repayments of debt | — | (536 | ) | — | — | (536 | ) | ||||||||||||
| Tender premium on extinguishment of senior notes | — | (65 | ) | — | — | (65 | ) | ||||||||||||
| Proceeds from the issue of shares | 155 | — | — | — | 155 | ||||||||||||||
| Excess tax benefits from share-based payment arrangements | — | — | 2 | — | 2 | ||||||||||||||
| Dividends paid | (193 | ) | — | (7 | ) | 7 | (193 | ) | |||||||||||
| Acquisition of noncontrolling interests | — | — | (4 | ) | — | (4 | ) | ||||||||||||
| Dividends paid to noncontrolling interests | — | — | (10 | ) | — | (10 | ) | ||||||||||||
| Proceeds from intercompany financing activities | — | 780 | 467 | (1,247 | ) | — | |||||||||||||
| Repayments of intercompany financing activities | — | (443 | ) | (223 | ) | 666 | — | ||||||||||||
| Net cash (used in) provided by financing activities | (38 | ) | 250 | 225 | (574 | ) | (137 | ) | |||||||||||
| INCREASE (DECREASE) IN CASH AND CASH EQUIVALENTS | 2 | 3 | 299 | — | 304 | ||||||||||||||
| Effect of exchange rate changes on cash and cash equivalents | — | — | (8 | ) | — | (8 | ) | ||||||||||||
| CASH AND CASH EQUIVALENTS, BEGINNING OF YEAR | 1 | — | 499 | — | 500 | ||||||||||||||
| CASH AND CASH EQUIVALENTS, END OF YEAR | $ | 3 | $ | 3 | $ | 790 | $ | — | $ | 796 | |||||||||
| Year Ended December 31, 2012 | |||||||||||||||||||
Willis Group Holdings — the Parent Issuer | The Guarantors | Other | Consolidating adjustments | Consolidated | |||||||||||||||
| (millions) | |||||||||||||||||||
| NET CASH (USED IN) PROVIDED BY OPERATING ACTIVITIES | $ | (23 | ) | $ | 1,460 | $ | (97 | ) | $ | (815 | ) | $ | 525 | ||||||
| CASH FLOWS FROM INVESTING ACTIVITIES | |||||||||||||||||||
| Proceeds on disposal of fixed and intangible assets | — | — | 5 | — | 5 | ||||||||||||||
| Additions to fixed assets | — | (26 | ) | (109 | ) | — | (135 | ) | |||||||||||
| Additions to intangible assets | — | — | (2 | ) | — | (2 | ) | ||||||||||||
| Acquisitions of subsidiaries, net of cash acquired | — | — | (33 | ) | — | (33 | ) | ||||||||||||
| Payments to acquire other investments | — | — | (7 | ) | — | (7 | ) | ||||||||||||
| Proceeds from intercompany investing activities | 256 | 150 | 1,230 | (1,636 | ) | — | |||||||||||||
| Repayments of intercompany investing activities | — | (328 | ) | (81 | ) | 409 | — | ||||||||||||
| Net cash provided by (used in) investing activities | 256 | (204 | ) | 1,003 | (1,227 | ) | (172 | ) | |||||||||||
| CASH FLOWS FROM FINANCING ACTIVITIES | |||||||||||||||||||
| Repayments of debt | — | (15 | ) | — | — | (15 | ) | ||||||||||||
| Proceeds from issue of other debt | — | 1 | — | — | 1 | ||||||||||||||
| Repurchase of shares | (100 | ) | — | — | — | (100 | ) | ||||||||||||
| Proceeds from the issue of shares | 53 | — | — | — | 53 | ||||||||||||||
| Excess tax benefits from share-based payment arrangements | — | — | 2 | — | 2 | ||||||||||||||
| Dividends paid | (185 | ) | — | (815 | ) | 815 | (185 | ) | |||||||||||
| Proceeds from sale of noncontrolling interest | — | — | 3 | — | 3 | ||||||||||||||
| Acquisition of noncontrolling interests | — | — | (39 | ) | — | (39 | ) | ||||||||||||
| Dividends paid to noncontrolling interests | — | — | (11 | ) | — | (11 | ) | ||||||||||||
| Proceeds from intercompany financing activities | — | 81 | 328 | (409 | ) | — | |||||||||||||
| Repayments of intercompany financing activities | — | (1,486 | ) | (150 | ) | 1,636 | — | ||||||||||||
| Net cash used in financing activities | (232 | ) | (1,419 | ) | (682 | ) | 2,042 | (291 | ) | ||||||||||
| INCREASE (DECREASE) IN CASH AND CASH EQUIVALENTS | 1 | (163 | ) | 224 | — | 62 | |||||||||||||
| Effect of exchange rate changes on cash and cash equivalents | — | — | 2 | — | 2 | ||||||||||||||
| CASH AND CASH EQUIVALENTS, BEGINNING OF YEAR | — | 163 | 273 | — | 436 | ||||||||||||||
| CASH AND CASH EQUIVALENTS, END OF YEAR | $ | 1 | $ | — | $ | 499 | $ | — | $ | 500 | |||||||||
| Year Ended December 31, 2011 | |||||||||||||||||||
Willis Group Holdings — the Parent Issuer | The Guarantors | Other | Consolidating adjustments | Consolidated | |||||||||||||||
| (millions) | |||||||||||||||||||
NET CASH PROVIDED BY OPERATING ACTIVITIES | $ | 44 | $ | 450 | $ | 131 | $ | (186 | ) | $ | 439 | ||||||||
| CASH FLOWS FROM INVESTING ACTIVITIES | |||||||||||||||||||
| Proceeds on disposal of fixed and intangible assets | — | — | 13 | — | 13 | ||||||||||||||
| Additions to fixed assets | — | (25 | ) | (86 | ) | — | (111 | ) | |||||||||||
| Acquisitions of subsidiaries, net of cash acquired | — | — | (10 | ) | — | (10 | ) | ||||||||||||
| Acquisitions of investments in associates | — | — | (2 | ) | — | (2 | ) | ||||||||||||
| Payments to acquire other investments | — | — | (5 | ) | — | (5 | ) | ||||||||||||
| Proceeds from sale of operations, net of cash disposed | — | — | 14 | — | 14 | ||||||||||||||
| Proceeds from intercompany investing activities | — | 96 | 224 | (320 | ) | — | |||||||||||||
| Repayments of intercompany investing activities | (711 | ) | (138 | ) | (101 | ) | 950 | — | |||||||||||
| Net cash used in investing activities | (711 | ) | (67 | ) | 47 | 630 | (101 | ) | |||||||||||
| CASH FLOWS FROM FINANCING ACTIVITIES | |||||||||||||||||||
| Repayments of revolving credit facility | — | (90 | ) | — | — | (90 | ) | ||||||||||||
| Senior notes issued | 794 | — | — | — | 794 | ||||||||||||||
| Debt issuance costs | (7 | ) | (5 | ) | — | — | (12 | ) | |||||||||||
| Repayments of debt | — | (911 | ) | — | — | (911 | ) | ||||||||||||
| Proceeds from the issue of term loan | — | 300 | — | — | 300 | ||||||||||||||
| Make-whole on repurchase and redemption of senior notes | — | (158 | ) | — | — | (158 | ) | ||||||||||||
| Proceeds from issue of shares | 60 | — | — | — | 60 | ||||||||||||||
| Excess tax benefits from share-based payment arrangements | — | — | 5 | — | 5 | ||||||||||||||
| Dividends paid | (180 | ) | — | (186 | ) | 186 | (180 | ) | |||||||||||
| Acquisition of noncontrolling interests | — | (4 | ) | (5 | ) | — | (9 | ) | |||||||||||
| Dividends paid to noncontrolling interests | — | — | (13 | ) | — | (13 | ) | ||||||||||||
| Proceeds from intercompany financing activities | — | 796 | 154 | (950 | ) | — | |||||||||||||
| Repayments of intercompany financing activities | — | (224 | ) | (96 | ) | 320 | — | ||||||||||||
| Net cash provided by (used in) financing activities | 667 | (296 | ) | (141 | ) | (444 | ) | (214 | ) | ||||||||||
| INCREASE IN CASH AND CASH EQUIVALENTS | — | 87 | 37 | — | 124 | ||||||||||||||
| Effect of exchange rate changes on cash and cash equivalents | — | — | (4 | ) | — | (4 | ) | ||||||||||||
| CASH AND CASH EQUIVALENTS, BEGINNING OF YEAR | — | 76 | 240 | — | 316 | ||||||||||||||
| CASH AND CASH EQUIVALENTS, END OF YEAR | $ | — | $ | 163 | $ | 273 | $ | — | $ | 436 | |||||||||
| 32. | FINANCIAL INFORMATION FOR ISSUER, PARENT GUARANTOR, OTHER GUARANTOR SUBSIDIARIES AND NON-GUARANTOR SUBSIDIARIES |
| Willis Group Holdings, which is a guarantor, on a parent company only basis; |
| (ii) |
| (iii) | Trinity Acquisition plc, which is the issuer and is a 100 percent indirectly owned subsidiary of the parent; |
| (iv) | Other, which are the non-guarantor subsidiaries, on a combined basis; |
| (v) | Consolidating adjustments; and |
| (vi) | the Consolidated Company. |
| As previously reported | Reclassifications | As Reclassified | |||||||||
| (millions) | |||||||||||
| Condensed consolidating statement of operations for the year ended 31 December 2012 | |||||||||||
| Willis Group Holdings | |||||||||||
| Operating loss | $ | (6 | ) | $ | — | $ | (6 | ) | |||
| Net loss attributable to Willis Group Holdings | (446 | ) | — | (446 | ) | ||||||
| The Other Guarantors | |||||||||||
| Operating loss | $ | (262 | ) | $ | (11 | ) | $ | (273 | ) | ||
| Net loss attributable to Willis Group Holdings | (389 | ) | (8 | ) | (397 | ) | |||||
| The Issuer | |||||||||||
| Operating income | $ | 1 | $ | — | $ | 1 | |||||
| Net loss attributable to Willis Group Holdings | (427 | ) | — | (427 | ) | ||||||
| Other | |||||||||||
| Operating income (loss) | $ | 122 | $ | (53 | ) | $ | 69 | ||||
| Net loss attributable to Willis Group Holdings | (118 | ) | (306 | ) | (424 | ) | |||||
| Consolidating adjustments | |||||||||||
| Operating (loss) income | $ | (64 | ) | $ | 64 | $ | — | ||||
| Net income attributable to Willis Group Holdings | 934 | 314 | 1,248 | ||||||||
| As previously reported | Reclassifications | As Reclassified | |||||||||
| (millions) | |||||||||||
| Condensed consolidating statement of operations for the year ended 31 December 2011 | |||||||||||
| Willis Group Holdings | |||||||||||
| Operating loss | $ | (20 | ) | $ | — | $ | (20 | ) | |||
| Net income attributable to Willis Group Holdings | 204 | — | 204 | ||||||||
| The Other Guarantors | |||||||||||
| Operating loss | $ | (140 | ) | $ | (11 | ) | $ | (151 | ) | ||
| Net income attributable to Willis Group Holdings | 174 | 72 | 246 | ||||||||
| The Issuer | |||||||||||
| Operating income | $ | 4 | $ | — | $ | 4 | |||||
| Net income (loss) attributable to Willis Group Holdings | 218 | (1 | ) | 217 | |||||||
| Other | |||||||||||
| Operating income (loss) | $ | 754 | $ | (21 | ) | $ | 733 | ||||
| Net income attributable to Willis Group Holdings | 137 | 164 | 301 | ||||||||
| Consolidating adjustments | |||||||||||
| Operating (loss) income | $ | (32 | ) | $ | 32 | $ | — | ||||
| Net loss attributable to Willis Group Holdings | (529 | ) | (235 | ) | (764 | ) | |||||
| As previously reported | Reclassifications | As Reclassified | |||||||||
| (millions) | |||||||||||
| Condensed consolidating statement of comprehensive income for the year ended 31 December 2012 | |||||||||||
| Willis Group Holdings | |||||||||||
| Comprehensive loss attributable to Willis Group Holdings | $ | (552 | ) | $ | — | $ | (552 | ) | |||
| The Other Guarantors | |||||||||||
| Comprehensive loss attributable to Willis Group Holdings | $ | (486 | ) | $ | (8 | ) | $ | (494 | ) | ||
| The Issuer | |||||||||||
| Comprehensive (loss) income attributable to Willis Group Holdings | $ | (528 | ) | $ | — | $ | (528 | ) | |||
| Other | |||||||||||
| Comprehensive loss attributable to Willis Group Holdings | $ | (226 | ) | $ | (306 | ) | $ | (532 | ) | ||
| Consolidating adjustments | |||||||||||
| Comprehensive income attributable to Willis Group Holdings | $ | 1,240 | $ | 314 | $ | 1,554 | |||||
| As previously reported | Reclassifications | As Reclassified | |||||||||
| (millions) | |||||||||||
| Condensed consolidating statement of comprehensive income for the year ended 31 December 2011 | |||||||||||
| Willis Group Holdings | |||||||||||
| Comprehensive income attributable to Willis Group Holdings | $ | 1 | $ | — | $ | 1 | |||||
| The Other Guarantors | |||||||||||
| Comprehensive (loss) income attributable to Willis Group Holdings | $ | (24 | ) | $ | 72 | $ | 48 | ||||
| The Issuer | |||||||||||
| Comprehensive income attributable to Willis Group Holdings | $ | 21 | $ | (1 | ) | $ | 20 | ||||
| Other | |||||||||||
| Comprehensive (loss) income attributable to Willis Group Holdings | $ | (65 | ) | $ | 164 | $ | 99 | ||||
| Consolidating adjustments | |||||||||||
| Comprehensive income (loss) attributable to Willis Group Holdings | $ | 68 | $ | (235 | ) | $ | (167 | ) | |||
| As previously reported | Reclassifications | As Reclassified | |||||||||
| (millions) | |||||||||||
| Condensed consolidating balance sheet at 31 December 2012 | |||||||||||
| Willis Group Holdings | |||||||||||
| Total assets | $ | 2,557 | $ | 1,541 | $ | 4,098 | |||||
| Total liabilities | 858 | 1,541 | 2,399 | ||||||||
| Total equity | 1,699 | — | 1,699 | ||||||||
| The Other Guarantors | |||||||||||
| Total assets | $ | (208 | ) | $ | 5,618 | $ | 5,410 | ||||
| Total liabilities | 1,367 | 5,704 | 7,071 | ||||||||
| Total equity | (1,575 | ) | (86 | ) | (1,661 | ) | |||||
| The Issuer | |||||||||||
| Total assets | $ | 2,861 | $ | 408 | $ | 3,269 | |||||
| Total liabilities | 300 | 492 | 792 | ||||||||
| Total equity | 2,561 | (84 | ) | 2,477 | |||||||
| Other | |||||||||||
| Total assets | $ | 17,125 | $ | (1,483 | ) | $ | 15,642 | ||||
| Total liabilities | 11,851 | 720 | 12,571 | ||||||||
| Total equity | 5,274 | (2,203 | ) | 3,071 | |||||||
| Consolidating adjustments | |||||||||||
| Total assets | $ | (7,223 | ) | $ | (6,084 | ) | $ | (13,307 | ) | ||
| Total liabilities | (989 | ) | (8,457 | ) | (9,446 | ) | |||||
| Total equity | (6,234 | ) | 2,373 | (3,861 | ) | ||||||
| As previously reported | Reclassifications | As Reclassified | |||||||||
| (millions) | |||||||||||
| Condensed consolidating statement of cash flows for the year ended 31 December 2012 | |||||||||||
| Willis Group Holdings | |||||||||||
| Net cash (used in) provided by operating activities | $ | (42 | ) | $ | 19 | $ | (23 | ) | |||
| Net cash provided by investing activities | — | 256 | 256 | ||||||||
| Net cash provided by (used in) financing activities | 43 | (275 | ) | (232 | ) | ||||||
| The Other Guarantors | |||||||||||
| Net cash provided by operating activities | $ | 1,869 | $ | 524 | $ | 2,393 | |||||
| Net cash used in investing activities | (26 | ) | (21 | ) | (47 | ) | |||||
| Net cash used in financing activities | (2,006 | ) | (503 | ) | (2,509 | ) | |||||
| The Issuer | |||||||||||
| Net cash provided by operating activities | $ | 1,269 | $ | 87 | $ | 1,356 | |||||
| Net cash used in investing activities | — | (53 | ) | (53 | ) | ||||||
| Net cash (used in) provided by financing activities | (1,269 | ) | (34 | ) | (1,303 | ) | |||||
| Other | |||||||||||
| Net cash provided by (used in) operating activities | $ | 431 | $ | (528 | ) | $ | (97 | ) | |||
| Net cash (used in) provided by investing activities | (146 | ) | 1,149 | 1,003 | |||||||
| Net cash used in financing activities | (61 | ) | (621 | ) | (682 | ) | |||||
| Consolidating adjustments | |||||||||||
| Net cash used in operating activities | $ | (3,002 | ) | $ | (102 | ) | $ | (3,104 | ) | ||
| Net cash used in investing activities | — | (1,331 | ) | (1,331 | ) | ||||||
| Net cash provided by financing activities | 3,002 | 1,433 | 4,435 | ||||||||
| As previously reported | Reclassifications | As Reclassified | |||||||||
| (millions) | |||||||||||
| Condensed consolidating statement of cash flows for the year ended 31 December 2011 | |||||||||||
| Willis Group Holdings | |||||||||||
| Net cash (used in) provided by operating activities | $ | (41 | ) | $ | 85 | $ | 44 | ||||
| Net cash used in investing activities | — | (711 | ) | (711 | ) | ||||||
| Net cash provided by financing activities | 41 | 626 | 667 | ||||||||
| The Other Guarantors | |||||||||||
| Net cash provided by (used in) operating activities | $ | 209 | $ | (568 | ) | $ | (359 | ) | |||
| Net cash used in investing activities | (25 | ) | (33 | ) | (58 | ) | |||||
| Net cash (used in) provided by financing activities | (97 | ) | 601 | 504 | |||||||
| The Issuer | |||||||||||
| Net cash provided by operating activities | $ | 110 | $ | 746 | $ | 856 | |||||
| Net cash used in investing activities | — | (292 | ) | (292 | ) | ||||||
| Net cash used in financing activities | (110 | ) | (454 | ) | (564 | ) | |||||
| Other | |||||||||||
| Net cash provided by (used in) operating activities | $ | 1,269 | $ | (1,138 | ) | $ | 131 | ||||
| Net cash (used in) provided by investing activities | (76 | ) | 123 | 47 | |||||||
| Net cash (used in) provided by financing activities | (1,156 | ) | 1,015 | (141 | ) | ||||||
| Consolidating adjustments | |||||||||||
| Net cash (used in) provided by operating activities | $ | (1,108 | ) | $ | 875 | $ | (233 | ) | |||
| Net cash provided by investing activities | — | 913 | 913 | ||||||||
| Net cash provided by (used in) financing activities | 1,108 | (1,788 | ) | (680 | ) | ||||||
| Year Ended December 31, 2013 | |||||||||||||||||||||||
Willis Group Holdings | The Other Guarantors | The Issuer | Other | Consolidating adjustments | Consolidated | ||||||||||||||||||
| (millions) | |||||||||||||||||||||||
| REVENUES | |||||||||||||||||||||||
| Commissions and fees | $ | — | $ | 8 | $ | — | $ | 3,625 | $ | — | $ | 3,633 | |||||||||||
| Investment income | — | — | — | 15 | — | 15 | |||||||||||||||||
| Other income | — | — | — | 7 | — | 7 | |||||||||||||||||
| Total revenues | — | 8 | — | 3,647 | — | 3,655 | |||||||||||||||||
| EXPENSES | |||||||||||||||||||||||
| Salaries and benefits | (1 | ) | (103 | ) | — | (2,103 | ) | — | (2,207 | ) | |||||||||||||
| Other operating expenses | — | (235 | ) | (1 | ) | (380 | ) | — | (616 | ) | |||||||||||||
| Depreciation expense | — | (23 | ) | — | (71 | ) | — | (94 | ) | ||||||||||||||
| Amortization of intangible assets | — | — | — | (55 | ) | — | (55 | ) | |||||||||||||||
| Net gain on disposal of operations | — | — | — | 12 | (10 | ) | 2 | ||||||||||||||||
| Total expenses | (1 | ) | (361 | ) | (1 | ) | (2,597 | ) | (10 | ) | (2,970 | ) | |||||||||||
| OPERATING (LOSS) INCOME | (1 | ) | (353 | ) | (1 | ) | 1,050 | (10 | ) | 685 | |||||||||||||
| Income from Group undertakings | — | 491 | 68 | 86 | (645 | ) | — | ||||||||||||||||
| Expenses due to Group undertakings | (10 | ) | (153 | ) | (26 | ) | (456 | ) | 645 | — | |||||||||||||
| Loss from extinguishment of debt | — | (60 | ) | — | — | — | (60 | ) | |||||||||||||||
| Interest expense | (42 | ) | (61 | ) | (18 | ) | (5 | ) | — | (126 | ) | ||||||||||||
| (LOSS) INCOME FROM CONTINUING OPERATIONS BEFORE INCOME TAXES AND INTEREST IN EARNINGS OF ASSOCIATES | (53 | ) | (136 | ) | 23 | 675 | (10 | ) | 499 | ||||||||||||||
| Income taxes | — | 29 | (6 | ) | (145 | ) | — | (122 | ) | ||||||||||||||
| (LOSS) INCOME FROM CONTINUING OPERATIONS BEFORE INTEREST IN EARNINGS OF ASSOCIATES | (53 | ) | (107 | ) | 17 | 530 | (10 | ) | 377 | ||||||||||||||
| Interest in earnings of associates, net of tax | — | 9 | — | (9 | ) | — | — | ||||||||||||||||
| Equity account for subsidiaries | 418 | 515 | 344 | — | (1,277 | ) | — | ||||||||||||||||
| INCOME FROM CONTINUING OPERATIONS | 365 | 417 | 361 | 521 | (1,287 | ) | 377 | ||||||||||||||||
| Discontinued operations, net of tax | — | — | — | — | — | — | |||||||||||||||||
| NET INCOME | 365 | 417 | 361 | 521 | (1,287 | ) | 377 | ||||||||||||||||
| Less: Net income attributable to noncontrolling interests | — | — | — | (12 | ) | — | (12 | ) | |||||||||||||||
| NET INCOME ATTRIBUTABLE TO WILLIS GROUP HOLDINGS | $ | 365 | $ | 417 | $ | 361 | $ | 509 | $ | (1,287 | ) | $ | 365 | ||||||||||
| Year Ended December 31, 2013 | |||||||||||||||||||||||
Willis Group Holdings | The Other Guarantors | The Issuer | Other | Consolidating adjustments | Consolidated | ||||||||||||||||||
| (millions) | |||||||||||||||||||||||
| Comprehensive income | $ | 522 | $ | 565 | $ | 504 | $ | 636 | $ | (1,693 | ) | $ | 534 | ||||||||||
| Less: Comprehensive income attributable to noncontrolling interests | — | — | — | (12 | ) | — | (12 | ) | |||||||||||||||
| Comprehensive income attributable to Willis Group Holdings | $ | 522 | $ | 565 | $ | 504 | $ | 624 | $ | (1,693 | ) | $ | 522 | ||||||||||
| Year Ended December 31, 2012 | |||||||||||||||||||||||
| Willis Group Holdings | The Other Guarantors | The Issuer | Other | Consolidating adjustments | Consolidated | ||||||||||||||||||
| (millions) | |||||||||||||||||||||||
| REVENUES | |||||||||||||||||||||||
| Commissions and fees | $ | — | $ | — | $ | — | $ | 3,458 | $ | — | $ | 3,458 | |||||||||||
| Investment income | — | 1 | — | 17 | — | 18 | |||||||||||||||||
| Other income | — | — | — | 4 | — | 4 | |||||||||||||||||
| Total revenues | — | 1 | — | 3,479 | — | 3,480 | |||||||||||||||||
| EXPENSES | |||||||||||||||||||||||
| Salaries and benefits | (2 | ) | (96 | ) | — | (2,377 | ) | — | (2,475 | ) | |||||||||||||
| Other operating expenses | (4 | ) | (162 | ) | 1 | (416 | ) | — | (581 | ) | |||||||||||||
| Depreciation expense | — | (16 | ) | — | (63 | ) | — | (79 | ) | ||||||||||||||
| Amortization of intangible assets | — | — | — | (59 | ) | — | (59 | ) | |||||||||||||||
| Goodwill impairment | — | — | — | (492 | ) | — | (492 | ) | |||||||||||||||
| Net loss on disposal of operations | — | �� | — | — | (3 | ) | — | (3 | ) | ||||||||||||||
| Total expenses | (6 | ) | (274 | ) | 1 | (3,410 | ) | — | (3,689 | ) | |||||||||||||
| OPERATING (LOSS) INCOME | (6 | ) | (273 | ) | 1 | 69 | — | (209 | ) | ||||||||||||||
| Income from Group undertakings | — | 436 | 79 | 111 | (626 | ) | — | ||||||||||||||||
| Expenses due to Group undertakings | — | (185 | ) | (27 | ) | (414 | ) | 626 | — | ||||||||||||||
| Interest expense | (43 | ) | (69 | ) | (8 | ) | (8 | ) | — | (128 | ) | ||||||||||||
| (LOSS) INCOME FROM CONTINUING OPERATIONS BEFORE INCOME TAXES AND INTEREST IN EARNINGS OF ASSOCIATES | (49 | ) | (91 | ) | 45 | (242 | ) | — | (337 | ) | |||||||||||||
| Income taxes | — | 76 | (11 | ) | (166 | ) | — | (101 | ) | ||||||||||||||
| (LOSS) INCOME FROM CONTINUING OPERATIONS BEFORE INTEREST IN EARNINGS OF ASSOCIATES | (49 | ) | (15 | ) | 34 | (408 | ) | — | (438 | ) | |||||||||||||
| Interest in earnings of associates, net of tax | — | 8 | — | (3 | ) | — | 5 | ||||||||||||||||
| Equity account for subsidiaries | (397 | ) | (390 | ) | (461 | ) | — | 1,248 | — | ||||||||||||||
| LOSS FROM CONTINUING OPERATIONS | (446 | ) | (397 | ) | (427 | ) | (411 | ) | 1,248 | (433 | ) | ||||||||||||
| Discontinued operations, net of tax | — | — | — | — | — | — | |||||||||||||||||
| NET LOSS | (446 | ) | (397 | ) | (427 | ) | (411 | ) | 1,248 | (433 | ) | ||||||||||||
| Less: Net income attributable to noncontrolling interests | — | — | — | (13 | ) | — | (13 | ) | |||||||||||||||
| NET LOSS ATTRIBUTABLE TO WILLIS GROUP HOLDINGS | $ | (446 | ) | $ | (397 | ) | $ | (427 | ) | $ | (424 | ) | $ | 1,248 | $ | (446 | ) | ||||||
| Year Ended December 31, 2012 | |||||||||||||||||||||||
Willis Group Holdings | The Other Guarantors | The Issuer | Other | Consolidating adjustments | Consolidated | ||||||||||||||||||
| (millions) | |||||||||||||||||||||||
| Comprehensive loss | $ | (552 | ) | $ | (494 | ) | $ | (528 | ) | $ | (519 | ) | $ | 1,554 | $ | (539 | ) | ||||||
| Less: Comprehensive income attributable to noncontrolling interests | — | — | — | (13 | ) | — | (13 | ) | |||||||||||||||
| Comprehensive loss attributable to Willis Group Holdings | $ | (552 | ) | $ | (494 | ) | $ | (528 | ) | $ | (532 | ) | $ | 1,554 | $ | (552 | ) | ||||||
| Year Ended December 31, 2011 | |||||||||||||||||||||||
| Willis Group Holdings | The Other Guarantors | The Issuer | Other | Consolidating adjustments | Consolidated | ||||||||||||||||||
| (millions) | |||||||||||||||||||||||
| REVENUES | |||||||||||||||||||||||
| Commissions and fees | $ | — | $ | — | $ | — | $ | 3,414 | $ | — | $ | 3,414 | |||||||||||
| Investment income | — | 2 | — | 29 | — | 31 | |||||||||||||||||
| Other income | — | — | — | 2 | — | 2 | |||||||||||||||||
| Total revenues | — | 2 | — | 3,445 | — | 3,447 | |||||||||||||||||
| EXPENSES | |||||||||||||||||||||||
| Salaries and benefits | (3 | ) | (69 | ) | — | (2,015 | ) | — | (2,087 | ) | |||||||||||||
| Other operating expenses | (17 | ) | (70 | ) | 4 | (573 | ) | — | (656 | ) | |||||||||||||
| Depreciation expense | — | (14 | ) | — | (60 | ) | — | (74 | ) | ||||||||||||||
| Amortization of intangible assets | — | — | — | (68 | ) | — | (68 | ) | |||||||||||||||
| Net gain on disposal of operations | — | — | — | 4 | — | 4 | |||||||||||||||||
| Total expenses | (20 | ) | (153 | ) | 4 | (2,712 | ) | — | (2,881 | ) | |||||||||||||
| OPERATING (LOSS) INCOME | (20 | ) | (151 | ) | 4 | 733 | — | 566 | |||||||||||||||
| Income from Group undertakings | — | 438 | 64 | 119 | (621 | ) | — | ||||||||||||||||
| Expenses due to Group undertakings | — | (180 | ) | (26 | ) | (415 | ) | 621 | — | ||||||||||||||
| Make-whole on repurchase and redemption of senior notes and write-off of unamortized debt issuance costs | — | — | (171 | ) | — | — | (171 | ) | |||||||||||||||
| Interest expense | (34 | ) | (99 | ) | (15 | ) | (8 | ) | — | (156 | ) | ||||||||||||
| (LOSS) INCOME FROM CONTINUING OPERATIONS BEFORE INCOME TAXES AND INTEREST IN EARNINGS OF ASSOCIATES | (54 | ) | 8 | (144 | ) | 429 | — | 239 | |||||||||||||||
| Income taxes | — | 47 | 39 | (117 | ) | (1 | ) | (32 | ) | ||||||||||||||
| (LOSS) INCOME FROM CONTINUING OPERATIONS BEFORE INTEREST IN EARNINGS OF ASSOCIATES | (54 | ) | 55 | (105 | ) | 312 | (1 | ) | 207 | ||||||||||||||
| Interest in earnings of associates, net of tax | — | 8 | — | 4 | — | 12 | |||||||||||||||||
| Equity account for subsidiaries | 258 | 183 | 322 | — | (763 | ) | — | ||||||||||||||||
| INCOME FROM CONTINUING OPERATIONS | 204 | 246 | 217 | 316 | (764 | ) | 219 | ||||||||||||||||
| Discontinued operations, net of tax | — | — | — | 1 | — | 1 | |||||||||||||||||
| NET INCOME | 204 | 246 | 217 | 317 | (764 | ) | 220 | ||||||||||||||||
| Less: Net income attributable to noncontrolling interests | — | — | — | (16 | ) | — | (16 | ) | |||||||||||||||
| NET INCOME ATTRIBUTABLE TO WILLIS GROUP HOLDINGS | $ | 204 | $ | 246 | $ | 217 | $ | 301 | $ | (764 | ) | $ | 204 | ||||||||||
| Year Ended December 31, 2011 | |||||||||||||||||||||||
Willis Group Holdings | The Other Guarantors | The Issuer | Other | Consolidating adjustments | Consolidated | ||||||||||||||||||
| (millions) | |||||||||||||||||||||||
| Comprehensive income | $ | 1 | $ | 48 | $ | 20 | $ | 114 | $ | (167 | ) | $ | 16 | ||||||||||
| Less: Comprehensive income attributable to noncontrolling interests | — | — | — | (15 | ) | — | (15 | ) | |||||||||||||||
| Comprehensive income attributable to Willis Group Holdings | $ | 1 | $ | 48 | $ | 20 | $ | 99 | $ | (167 | ) | $ | 1 | ||||||||||
| As at December 31, 2013 | |||||||||||||||||||||||
| Willis Group Holdings | The Other Guarantors | The Issuer | Other | Consolidating adjustments | Consolidated | ||||||||||||||||||
| (millions) | |||||||||||||||||||||||
| ASSETS | |||||||||||||||||||||||
| CURRENT ASSETS | |||||||||||||||||||||||
| Cash and cash equivalents | $ | 3 | $ | 3 | $ | — | $ | 790 | $ | — | $ | 796 | |||||||||||
| Accounts receivable, net | — | 4 | — | 1,037 | — | 1,041 | |||||||||||||||||
| Fiduciary assets | — | — | — | 8,412 | — | 8,412 | |||||||||||||||||
| Deferred tax assets | — | — | — | 16 | (1 | ) | 15 | ||||||||||||||||
| Other current assets | 1 | 36 | 1 | 186 | (27 | ) | 197 | ||||||||||||||||
| Amounts due from group undertakings | 4,051 | 975 | 793 | 1,484 | (7,303 | ) | — | ||||||||||||||||
| Total current assets | 4,055 | 1,018 | 794 | 11,925 | (7,331 | ) | 10,461 | ||||||||||||||||
| NON-CURRENT ASSETS | |||||||||||||||||||||||
| Investments in subsidiaries | — | 3,716 | 2,705 | — | (6,421 | ) | — | ||||||||||||||||
| Fixed assets, net | — | 66 | — | 415 | — | 481 | |||||||||||||||||
| Goodwill | — | — | — | 2,838 | — | 2,838 | |||||||||||||||||
| Other intangible assets, net | — | — | — | 353 | — | 353 | |||||||||||||||||
| Investments in associates | — | 156 | — | 20 | — | 176 | |||||||||||||||||
| Deferred tax assets | — | — | — | 7 | — | 7 | |||||||||||||||||
| Pension benefits asset | — | — | — | 278 | — | 278 | |||||||||||||||||
| Other non-current assets | 4 | 5 | 9 | 188 | — | 206 | |||||||||||||||||
| Non-current amounts due from group undertakings | — | 1,113 | 518 | — | (1,631 | ) | — | ||||||||||||||||
| Total non-current assets | 4 | 5,056 | 3,232 | 4,099 | (8,052 | ) | 4,339 | ||||||||||||||||
| TOTAL ASSETS | $ | 4,059 | $ | 6,074 | $ | 4,026 | $ | 16,024 | $ | (15,383 | ) | $ | 14,800 | ||||||||||
| LIABILITIES AND STOCKHOLDERS’ EQUITY | |||||||||||||||||||||||
| CURRENT LIABILITIES | |||||||||||||||||||||||
| Fiduciary liabilities | $ | — | $ | — | $ | — | $ | 8,412 | $ | — | $ | 8,412 | |||||||||||
| Deferred revenue and accrued expenses | 2 | 29 | — | 555 | — | 586 | |||||||||||||||||
| Income taxes payable | — | 4 | 5 | 39 | (27 | ) | 21 | ||||||||||||||||
| Short-term debt and current portion of long-term debt | — | — | 15 | — | — | 15 | |||||||||||||||||
| Deferred tax liabilities | — | — | — | 25 | — | 25 | |||||||||||||||||
| Other current liabilities | 62 | 42 | 11 | 300 | — | 415 | |||||||||||||||||
| Amounts due to group undertakings | — | 5,813 | 157 | 1,333 | (7,303 | ) | — | ||||||||||||||||
| Total current liabilities | 64 | 5,888 | 188 | 10,664 | (7,330 | ) | 9,474 | ||||||||||||||||
| NON-CURRENT LIABILITIES | |||||||||||||||||||||||
| Investments in subsidiaries | 985 | — | — | — | (985 | ) | — | ||||||||||||||||
| Long-term debt | 795 | 733 | 782 | 1 | — | 2,311 | |||||||||||||||||
| Liabilities for pension benefits | — | — | — | 136 | — | 136 | |||||||||||||||||
| Deferred tax liabilities | — | 1 | — | 55 | — | 56 | |||||||||||||||||
| Provisions for liabilities | — | — | — | 206 | — | 206 | |||||||||||||||||
| Other non-current liabilities | — | 48 | — | 326 | — | 374 | |||||||||||||||||
| Non-current amounts due to group undertakings | — | 518 | 423 | 690 | (1,631 | ) | — | ||||||||||||||||
| Total non-current liabilities | 1,780 | 1,300 | 1,205 | 1,414 | (2,616 | ) | 3,083 | ||||||||||||||||
| TOTAL LIABILITIES | $ | 1,844 | $ | 7,188 | $ | 1,393 | $ | 12,078 | $ | (9,946 | ) | $ | 12,557 | ||||||||||
| As at December 31, 2013 | |||||||||||||||||||||||
| Willis Group Holdings | The Other Guarantors | The Issuer | Other | Consolidating adjustments | Consolidated | ||||||||||||||||||
| (millions) | |||||||||||||||||||||||
| EQUITY | |||||||||||||||||||||||
| Total Willis Group Holdings stockholders’ equity | 2,215 | (1,114 | ) | 2,633 | 3,918 | (5,437 | ) | 2,215 | |||||||||||||||
| Noncontrolling interests | — | — | — | 28 | — | 28 | |||||||||||||||||
| Total equity | 2,215 | (1,114 | ) | 2,633 | 3,946 | (5,437 | ) | 2,243 | |||||||||||||||
| TOTAL LIABILITIES AND EQUITY | $ | 4,059 | $ | 6,074 | $ | 4,026 | $ | 16,024 | $ | (15,383 | ) | $ | 14,800 | ||||||||||
| As at December 31, 2012 | |||||||||||||||||||||||
| Willis Group Holdings | The Other Guarantors | The Issuer | Other | Consolidating adjustments | Consolidated | ||||||||||||||||||
| (millions) | |||||||||||||||||||||||
| ASSETS | |||||||||||||||||||||||
| CURRENT ASSETS | |||||||||||||||||||||||
| Cash and cash equivalents | $ | 1 | $ | — | $ | — | $ | 499 | $ | — | $ | 500 | |||||||||||
| Accounts receivable, net | — | — | — | 933 | — | 933 | |||||||||||||||||
| Fiduciary assets | — | — | — | 9,271 | — | 9,271 | |||||||||||||||||
| Deferred tax assets | — | — | — | 13 | — | 13 | |||||||||||||||||
| Other current assets | 1 | 79 | 1 | 114 | (14 | ) | 181 | ||||||||||||||||
| Amounts due from group undertakings | 4,091 | 1,070 | 801 | 864 | (6,826 | ) | — | ||||||||||||||||
| Total current assets | 4,093 | 1,149 | 802 | 11,694 | (6,840 | ) | 10,898 | ||||||||||||||||
| NON-CURRENT ASSETS | |||||||||||||||||||||||
| Investments in subsidiaries | — | 2,939 | 2,464 | — | (5,403 | ) | — | ||||||||||||||||
| Fixed assets, net | — | 74 | — | 394 | — | 468 | |||||||||||||||||
| Goodwill | — | — | — | 2,827 | — | 2,827 | |||||||||||||||||
| Other intangible assets, net | — | — | — | 385 | — | 385 | |||||||||||||||||
| Investments in associates | — | 143 | — | 31 | — | 174 | |||||||||||||||||
| Deferred tax assets | — | — | — | 18 | — | 18 | |||||||||||||||||
| Pension benefits asset | — | — | — | 136 | — | 136 | |||||||||||||||||
| Other non-current assets | 5 | 41 | 3 | 157 | — | 206 | |||||||||||||||||
| Non-current amounts due from group undertakings | — | 1,064 | — | — | (1,064 | ) | — | ||||||||||||||||
| Total non-current assets | 5 | 4,261 | 2,467 | 3,948 | (6,467 | ) | 4,214 | ||||||||||||||||
| TOTAL ASSETS | $ | 4,098 | $ | 5,410 | $ | 3,269 | $ | 15,642 | $ | (13,307 | ) | $ | 15,112 | ||||||||||
| LIABILITIES AND STOCKHOLDERS’ EQUITY | |||||||||||||||||||||||
| CURRENT LIABILITIES | |||||||||||||||||||||||
| Fiduciary liabilities | $ | — | $ | — | $ | — | $ | 9,271 | $ | — | $ | 9,271 | |||||||||||
| Deferred revenue and accrued expenses | 2 | — | — | 539 | — | 541 | |||||||||||||||||
| Income taxes payable | — | 4 | 11 | 18 | (14 | ) | 19 | ||||||||||||||||
| Short-term debt and current portion of long-term debt | — | — | 15 | — | — | 15 | |||||||||||||||||
| Deferred tax liabilities | — | — | — | 21 | — | 21 | |||||||||||||||||
| Other current liabilities | 60 | 73 | — | 194 | — | 327 | |||||||||||||||||
| Amounts due to group undertakings | — | 5,714 | 69 | 1,043 | (6,826 | ) | — | ||||||||||||||||
| Total current liabilities | 62 | 5,791 | 95 | 11,086 | (6,840 | ) | 10,194 | ||||||||||||||||
| NON-CURRENT LIABILITIES | |||||||||||||||||||||||
| Investments in subsidiaries | 1,542 | — | — | — | (1,542 | ) | — | ||||||||||||||||
| Long-term debt | 795 | 1,268 | 274 | 1 | — | 2,338 | |||||||||||||||||
| Liabilities for pension benefits | — | — | — | 282 | — | 282 | |||||||||||||||||
| Deferred tax liabilities | — | — | — | 18 | — | 18 | |||||||||||||||||
| Provisions for liabilities | — | — | — | 180 | — | 180 | |||||||||||||||||
| Other non-current liabilities | — | 12 | — | 363 | — | 375 | |||||||||||||||||
| Non-current amounts due to group undertakings | — | — | 423 | 641 | (1,064 | ) | — | ||||||||||||||||
| Total non-current liabilities | 2,337 | 1,280 | 697 | 1,485 | (2,606 | ) | 3,193 | ||||||||||||||||
| TOTAL LIABILITIES | $ | 2,399 | $ | 7,071 | $ | 792 | $ | 12,571 | $ | (9,446 | ) | $ | 13,387 | ||||||||||
| As at December 31, 2012 | |||||||||||||||||||||||
| Willis Group Holdings | The Other Guarantors | The Issuer | Other | Consolidating adjustments | Consolidated | ||||||||||||||||||
| (millions) | |||||||||||||||||||||||
| EQUITY | |||||||||||||||||||||||
| Total Willis Group Holdings stockholders’ equity | 1,699 | (1,661 | ) | 2,477 | 3,045 | (3,861 | ) | 1,699 | |||||||||||||||
| Noncontrolling interests | — | — | — | 26 | — | 26 | |||||||||||||||||
| Total equity | 1,699 | (1,661 | ) | 2,477 | 3,071 | (3,861 | ) | 1,725 | |||||||||||||||
| TOTAL LIABILITIES AND EQUITY | $ | 4,098 | $ | 5,410 | $ | 3,269 | $ | 15,642 | $ | (13,307 | ) | $ | 15,112 | ||||||||||
| Year Ended December 31, 2013 | |||||||||||||||||||||||
| Willis Group Holdings | The Other Guarantors | The Issuer | Other | Consolidating adjustments | Consolidated | ||||||||||||||||||
| (millions) | |||||||||||||||||||||||
| NET CASH PROVIDED BY (USED IN) OPERATING ACTIVITIES | $ | 4 | $ | 399 | $ | 63 | $ | 662 | $ | (567 | ) | $ | 561 | ||||||||||
| CASH FLOWS FROM INVESTING ACTIVITIES | |||||||||||||||||||||||
| Proceeds on disposal of fixed and intangible assets | — | 3 | — | 9 | — | 12 | |||||||||||||||||
| Additions to fixed assets | — | (18 | ) | — | (94 | ) | — | (112 | ) | ||||||||||||||
| Additions to intangible assets | — | — | — | (7 | ) | — | (7 | ) | |||||||||||||||
| Acquisitions of subsidiaries, net of cash acquired | — | (237 | ) | — | (30 | ) | 237 | (30 | ) | ||||||||||||||
| Payments to acquire other investments | — | — | — | (7 | ) | — | (7 | ) | |||||||||||||||
| Proceeds from sale of associates | — | — | — | 4 | — | 4 | |||||||||||||||||
| Proceeds from sale of operations, net of cash disposed | — | — | — | 257 | (237 | ) | 20 | ||||||||||||||||
| Proceeds from intercompany investing activities | 383 | 160 | 132 | 60 | (735 | ) | — | ||||||||||||||||
| Repayments of intercompany investing activities | (347 | ) | (120 | ) | (442 | ) | (780 | ) | 1,689 | — | |||||||||||||
| Net cash provided by (used in) investing activities | 36 | (212 | ) | (310 | ) | (588 | ) | 954 | (120 | ) | |||||||||||||
| CASH FLOWS FROM FINANCING ACTIVITIES | |||||||||||||||||||||||
| Senior notes issued | — | — | 522 | — | — | 522 | |||||||||||||||||
| Debt issuance costs | — | — | (8 | ) | — | — | (8 | ) | |||||||||||||||
| Repayments of debt | — | (521 | ) | (15 | ) | — | — | (536 | ) | ||||||||||||||
| Tender premium on extinguishment of senior notes | — | (65 | ) | — | — | — | (65 | ) | |||||||||||||||
| Proceeds from issue of shares | 155 | — | — | — | — | 155 | |||||||||||||||||
| Excess tax benefits from share-based payment arrangement | — | — | — | 2 | — | 2 | |||||||||||||||||
| Dividends paid | (193 | ) | (230 | ) | (330 | ) | (7 | ) | 567 | (193 | ) | ||||||||||||
| Acquisition of noncontrolling interests | — | — | — | (4 | ) | — | (4 | ) | |||||||||||||||
| Dividends paid to noncontrolling interests | — | — | — | (10 | ) | — | (10 | ) | |||||||||||||||
| Proceeds from intercompany financing activities | — | 1,075 | 147 | 467 | (1,689 | ) | — | ||||||||||||||||
| Repayments of intercompany financing activities | — | (443 | ) | (69 | ) | (223 | ) | 735 | — | ||||||||||||||
| Net cash (used in) provided by financing activities | (38 | ) | (184 | ) | 247 | 225 | (387 | ) | (137 | ) | |||||||||||||
| INCREASE (DECREASE) IN CASH AND CASH EQUIVALENTS | 2 | 3 | — | 299 | — | 304 | |||||||||||||||||
| Effect of exchange rate changes on cash and cash equivalents | — | — | — | (8 | ) | — | (8 | ) | |||||||||||||||
| CASH AND CASH EQUIVALENTS, BEGINNING OF YEAR | 1 | — | — | 499 | — | 500 | |||||||||||||||||
| CASH AND CASH EQUIVALENTS, END OF YEAR | $ | 3 | $ | 3 | $ | — | $ | 790 | $ | — | $ | 796 | |||||||||||
| Year Ended December 31, 2012 | |||||||||||||||||||||||
| Willis Group Holdings | The Other Guarantors | The Issuer | Other | Consolidating adjustments | Consolidated | ||||||||||||||||||
| (millions) | |||||||||||||||||||||||
| NET CASH (USED IN) PROVIDED BY OPERATING ACTIVITIES | $ | (23 | ) | $ | 2,393 | $ | 1,356 | $ | (97 | ) | $ | (3,104 | ) | $ | 525 | ||||||||
| CASH FLOWS FROM INVESTING ACTIVITIES | |||||||||||||||||||||||
| Proceeds on disposal of fixed and intangible assets | — | — | — | 5 | — | 5 | |||||||||||||||||
| Additions to fixed assets | — | (26 | ) | — | (109 | ) | — | (135 | ) | ||||||||||||||
| Additions to intangible assets | — | — | — | (2 | ) | — | (2 | ) | |||||||||||||||
| Acquisitions of subsidiaries, net of cash acquired | — | — | — | (33 | ) | — | (33 | ) | |||||||||||||||
| Payments to acquire other investments | — | — | — | (7 | ) | — | (7 | ) | |||||||||||||||
| Proceeds from sale of operations, net of cash disposed | — | — | — | — | — | — | |||||||||||||||||
| Proceeds from intercompany investing activities | 256 | 176 | 78 | 1,230 | (1,740 | ) | — | ||||||||||||||||
| Repayments of intercompany investing activities | — | (197 | ) | (131 | ) | (81 | ) | 409 | — | ||||||||||||||
| Net cash provided by (used in) investing activities | 256 | (47 | ) | (53 | ) | 1,003 | (1,331 | ) | (172 | ) | |||||||||||||
| CASH FLOWS FROM FINANCING ACTIVITIES | |||||||||||||||||||||||
| Repayments of debt | — | (4 | ) | (11 | ) | — | — | (15 | ) | ||||||||||||||
| Proceeds from issue of other debt | — | — | 1 | — | — | 1 | |||||||||||||||||
| Repurchase of shares | (100 | ) | — | — | — | — | (100 | ) | |||||||||||||||
| Proceeds from issue of shares | 53 | — | — | — | — | 53 | |||||||||||||||||
| Excess tax benefits from share-based payment arrangement | — | — | — | 2 | — | 2 | |||||||||||||||||
| Dividends paid | (185 | ) | (1,220 | ) | (1,069 | ) | (815 | ) | 3,104 | (185 | ) | ||||||||||||
| Proceeds from sale of noncontrolling interests | — | — | — | 3 | — | 3 | |||||||||||||||||
| Acquisition of noncontrolling interests | — | — | — | (39 | ) | — | (39 | ) | |||||||||||||||
| Dividends paid to noncontrolling interests | — | — | — | (11 | ) | — | (11 | ) | |||||||||||||||
| Proceeds from intercompany financing activities | — | 81 | — | 328 | (409 | ) | — | ||||||||||||||||
| Repayments of intercompany financing activities | — | (1,366 | ) | (224 | ) | (150 | ) | 1,740 | — | ||||||||||||||
| Net cash used in financing activities | (232 | ) | (2,509 | ) | (1,303 | ) | (682 | ) | 4,435 | (291 | ) | ||||||||||||
| INCREASE (DECREASE) IN CASH AND CASH EQUIVALENTS | 1 | (163 | ) | — | 224 | — | 62 | ||||||||||||||||
| Effect of exchange rate changes on cash and cash equivalents | — | — | — | 2 | — | 2 | |||||||||||||||||
| CASH AND CASH EQUIVALENTS, BEGINNING OF YEAR | — | 163 | — | 273 | — | 436 | |||||||||||||||||
| CASH AND CASH EQUIVALENTS, END OF YEAR | $ | 1 | $ | — | $ | — | $ | 499 | $ | — | $ | 500 | |||||||||||
| Year Ended December 31, 2011 | |||||||||||||||||||||||
| Willis Group Holdings | The Other Guarantors | The Issuer | Other | Consolidating adjustments | Consolidated | ||||||||||||||||||
| (millions) | |||||||||||||||||||||||
| NET CASH PROVIDED BY (USED IN) OPERATING ACTIVITIES | $ | 44 | $ | (359 | ) | $ | 856 | $ | 131 | $ | (233 | ) | $ | 439 | |||||||||
| CASH FLOWS FROM INVESTING ACTIVITIES | |||||||||||||||||||||||
| Proceeds on disposal of fixed and intangible assets | — | — | — | 13 | — | 13 | |||||||||||||||||
| Additions to fixed assets | — | (25 | ) | — | (86 | ) | — | (111 | ) | ||||||||||||||
| Acquisitions of subsidiaries, net of cash acquired | — | — | — | (10 | ) | — | (10 | ) | |||||||||||||||
| Acquisitions of investments in associates | — | — | — | (2 | ) | — | (2 | ) | |||||||||||||||
| Payments to acquire other investments | — | — | — | (5 | ) | — | (5 | ) | |||||||||||||||
| Proceeds from sale of operations, net of cash disposed | — | — | — | 14 | — | 14 | |||||||||||||||||
| Proceeds from intercompany investing activities | — | 105 | — | 224 | (329 | ) | — | ||||||||||||||||
| Repayments of intercompany investing activities | (711 | ) | (138 | ) | (292 | ) | (101 | ) | 1,242 | — | |||||||||||||
| Net cash (used in) investing activities | (711 | ) | (58 | ) | (292 | ) | 47 | 913 | (101 | ) | |||||||||||||
| CASH FLOWS FROM FINANCING ACTIVITIES | |||||||||||||||||||||||
| Repayments of revolving credit facility | — | (90 | ) | — | — | — | (90 | ) | |||||||||||||||
| Senior notes issued | 794 | — | — | — | — | 794 | |||||||||||||||||
| Debt issuance costs | (7 | ) | — | (5 | ) | — | — | (12 | ) | ||||||||||||||
| Repayments of debt | — | (411 | ) | (500 | ) | — | — | (911 | ) | ||||||||||||||
| Proceeds from issue of term loan | — | — | 300 | — | — | 300 | |||||||||||||||||
| Make-whole on repurchase and redemption of senior notes | — | — | (158 | ) | — | — | (158 | ) | |||||||||||||||
| Proceeds from issue of shares | 60 | — | — | — | — | 60 | |||||||||||||||||
| Excess tax benefits from share-based payment arrangements | — | — | — | 5 | — | 5 | |||||||||||||||||
| Dividends paid | (180 | ) | (47 | ) | — | (186 | ) | 233 | (180 | ) | |||||||||||||
| Acquisition of noncontrolling interests | — | (4 | ) | — | (5 | ) | — | (9 | ) | ||||||||||||||
| Dividends paid to noncontrolling interests | — | — | — | (13 | ) | — | (13 | ) | |||||||||||||||
| Proceeds from intercompany financing activities | — | 1,088 | — | 154 | (1,242 | ) | — | ||||||||||||||||
| Repayments of intercompany financing activities | — | (32 | ) | (201 | ) | (96 | ) | 329 | — | ||||||||||||||
| Net cash provided by (used in) financing activities | 667 | 504 | (564 | ) | (141 | ) | (680 | ) | (214 | ) | |||||||||||||
| INCREASE IN CASH AND CASH EQUIVALENTS | — | 87 | — | 37 | — | 124 | |||||||||||||||||
| Effect of exchange rate changes on cash and cash equivalents | — | — | — | (4 | ) | — | (4 | ) | |||||||||||||||
| CASH AND CASH EQUIVALENTS, BEGINNING OF YEAR | — | 76 | — | 240 | — | 316 | |||||||||||||||||
| CASH AND CASH EQUIVALENTS, END OF YEAR | $ | — | $ | 163 | $ | — | $ | 273 | $ | — | $ | 436 | |||||||||||
| ||||
| ||||
| ||||
2013 and 2012 were as follows:
| Three Months Ended | |||||||||||||||
| March 31, | June 30, | September 30, | December 31, | ||||||||||||
| (millions, except per share data) | |||||||||||||||
| 2013 | |||||||||||||||
| Total revenues | $ | 1,051 | $ | 890 | $ | 795 | $ | 919 | |||||||
| Total expenses | (764 | ) | (719 | ) | (720 | ) | (767 | ) | |||||||
| Net income (loss) | 223 | 107 | (27 | ) | 74 | ||||||||||
| Net income (loss) attributable to Willis Group Holdings | 219 | 105 | (27 | ) | 68 | ||||||||||
| Earnings per share — continuing operations | |||||||||||||||
| — Basic | $ | 1.27 | $ | 0.60 | $ | (0.15 | ) | $ | 0.38 | ||||||
| — Diluted | $ | 1.24 | $ | 0.59 | $ | (0.15 | ) | $ | 0.37 | ||||||
| 2012 | |||||||||||||||
| Total revenues | $ | 1,013 | $ | 842 | $ | 754 | $ | 871 | |||||||
| Total expenses | (696 | ) | (663 | ) | (684 | ) | (1,646 | ) | |||||||
| Net income (loss) | 232 | 110 | 26 | (801 | ) | ||||||||||
| Net income (loss) attributable to Willis Group Holdings | 225 | 108 | 26 | (805 | ) | ||||||||||
| Earnings per share — continuing operations | |||||||||||||||
| — Basic | $ | 1.29 | $ | 0.62 | $ | 0.15 | $ | (4.65 | ) | ||||||
| — Diluted | $ | 1.28 | $ | 0.61 | $ | 0.15 | $ | (4.65 | ) | ||||||
below as of February 14, 2014, the information required by this item with respect to our directors and executive officers, code of ethics, procedures for recommending nominees, audit committee, audit committee financial experts and compliance with Section 16(a) of the Exchange Act will be provided in accordance with Instruction G(3) to Form 10-K no later than April 30, 2014.
Victor P. Krauze —
Before entering the brokerage industry, he was a financial analyst and corporate banker for a regional bank that is now part of Wells Fargo, focusing on the telecommunications industry.
Corporate Governance
The Board’s Committees
The Committees and its members, as of April 24, 2013, are described below in further detail:
| ||||||||||
| ||||||||||
| ||||||||||
| ||||||||||
| ||||||||||
| ||||||||||
| ||||||||||
| ||||||||||
| ||||||||||
| ||||||||||
| ||||||||||
| ||||||||||
|
TheExecutive Committee has the full powers, authorities and discretions of the Board of the Directors, when it is not in session, in the management of the business and affairs of the Company, except as otherwise provided in the resolutions of the Board and under applicable law. The Executive Committee, currently consists of Joseph J. Plumeri (Chairman), Dominic Casserley, James McCann, Joseph A. Califano, Sir Roy Gardner, Wendy E. Lane and Douglas Roberts and did not hold any meetings in 2012. Mr. Plumeri will retire from the Board on July 7, 2013.
TheAudit Committee assists the Board in fulfilling its oversight responsibilities with respect to:
The integrity of the Company’s financial statements;
The selection and oversight of the independent auditors;
The Company’s compliance with legal and regulatory requirements;
The independent auditors’ qualifications and independence;
The performance of the independent auditors and the Company’s internal audit function;
The establishment and maintenance of proper internal accounting controls and procedures; and
The treatment of employees’ concerns regarding accounting or auditing matters as reported under the Company’s whistleblower policy.
In addition, the Audit Committee provides an avenue for communication among internal audit, the independent auditors, management and the Board. The Audit Committee also focuses on major financial risk exposures, the steps management has taken to monitor and control such risks, and, if appropriate, discusses with the independent auditor the guidelines and policies governing the process by which senior management and the relevant departments of the Company assess and manage the Company’s financial risk exposure. The Audit Committee operates under a charter, a copy of which can
be found in the Investor Relations — Corporate Governance section of the Company’s website atwww.willis.com. The Audit Committee currently consists of Douglas B. Roberts (Chairman), Sir Jeremy Hanley, Robyn S. Kravit and Wendy E. Lane and met formally eight times during 2012. In addition to holding formal meetings, the Audit Committee members met informally during the course of the year to discuss and review financial matters related to the Company as well as the Company’s filings with the SEC. After regularly scheduled meetings, the Committee also meets in executive session, which includes meetings with management, the internal auditors and external auditors. Mr. Roberts, Sir Jeremy Hanley and Ms. Lane are considered to be Audit Committee Financial Experts in light of their financial experience described in their biographies above.
TheCompensation Committee determines the Company’s CEO’s compensation and recommends to the Board the compensation of other executive officers and non-employee directors. In addition, the Compensation Committee oversees the administration of the Company’s share-based award plans and, in consultation with senior management, establishes the Company’s general compensation philosophy and oversees the development and implementation of the Company’s compensation programs. In connection with those objectives, the Compensation Committee is also responsible for:
Reviewing and approving annually performance goals and objectives relevant to the compensation of the CEO and other executive officers and evaluating their performance in light of those goals and objectives;
Reviewing and approving compensation policies applicable to the senior management of the Company;
Making recommendations to the Board on the Company’s existing and proposed incentive compensation plans and equity-based plans and overseeing the administration of these plans;
In consultation with senior management, overseeing regulatory compliance with respect to compensation matters;
Reviewing and discussing with senior management the Compensation Discussion and Analysis and approving its inclusion in the Company’s Proxy Statement and Annual Report on Form 10-K;
Reviewing the results of the “say-on-pay” proposals included in the Proxy Statement and the appropriate response;
Annually evaluating the independence of its compensation consultants, legal counsel or other advisors taking into consideration the factors enumerated in the NYSE listing standards and evaluating whether any conflict of interest exists with respect to its Compensation Consultant; and
Reviewing an assessment of compensation risk to determine whether any material risks were deemed to be likely to arise from the Company’s compensation policies and programs, what mitigating factors are in place, and whether these risks would be reasonably likely to have a material adverse effect on its business.
The Compensation Committee operates under a charter, a copy of which can be found in the Investor Relations — Corporate Governance section of the Company’s website atwww.willis.com. The Compensation Committee is currently comprised of Wendy E. Lane (Chairman), Jeffrey B. Lane and James F. McCann and met formally six times during 2012. In addition to holding formal meetings, the Compensation Committee members met informally during the course of the year to discuss compensation related matters and acted from time to time by unanimous written consent. After regularly scheduled meetings, the Committee also meets in executive session, which includes meetings with its Compensation Consultant.
TheRisk Committee is responsible for assisting the Board in:
Monitoring oversight of the Company’s enterprise risk management;
Overseeing, on the basis of proposals from management, the creation, and subsequent iteration, of a framework, for approval by the Board, in relation to the management of risk;
Reviewing the adequacy of the Company’s resources to perform its risk management responsibilities;
Reviewing the activities of the Company’s Enterprise Risk Management Committee (“ERMC”), as well as reviewing and approving annually the Company’s Enterprise Risk Management Policy;
Meeting with the chairman and/or other members of the Company’s ERMC and Audit Committee, as needed or advisable, to discuss the Company’s corporate risk management framework and/or related areas; and
Reviewing and recommending any major transactions or decisions affecting the Company’s risk profile or exposure.
The Risk Committee operates under a charter, a copy of which can be found in the Investor Relations — Corporate Governance section of the Company’s website atwww.willis.com. The Risk Committee currently consists of Sir Roy Gardner (Chairman), Anna C. Catalano and Michael J. Somers and met formally five times in 2012. After regularly scheduled meetings, the Committee also meets in executive session.
TheCorporate Governance and Nominating Committee is responsible for assisting the Board in:
Developing and recommending director independence standards to the Board and periodically reviewing those standards;
Developing and recommending to the Board the director selection process for identifying, considering and recommending candidates to the Board and director qualification standards for use in selecting new nominees and periodically reviewing the process and standards;
Recommending to the Board the nominees to stand for election as directors at the next annual shareholder meeting and in the event of director vacancies;
Recommending to the Board, from time to time, changes the Committee believes is desirable to the size of the Board or any Committee thereof;
Recommending to the independent and non-management directors a nominee for Presiding Independent Director and recommending to the Board nominees and chairman for each Board Committee;
Recommending changes to the Board, from time to time, to the Company’s Corporate Governance Guidelines;
Reviewing the appropriateness of continued service on the Board of members whose circumstances have changed or who contemplate accepting a directorship to another company or an appointment to an audit committee of another company;
Administering and overseeing, on behalf of the Board, the evaluation process for the overall effectiveness of the Board (including the effectiveness of the Committees); and
Assisting the Board in reviewing succession plans prepared by management for all senior management.
The Governance Committee identifies potential director nominees by preparing a candidate profile based upon the current Board’s strengths and needs and from a variety of sources, including engaging search firms or utilizing business contacts of the Board and senior management. Nominees must meet minimum qualification standards with respect to a variety of criteria including integrity, reputation, judgment, experience, maturity, skills and personality, commitment and independence. The Governance Committee may also take into consideration additional factors it deems appropriate, which may include skill, experience with business and other organizations, the interplay of the candidate’s experience with the experience of other Board members and the extent to which the candidate would be a desirable addition to the Board and any committee thereof.
With feedback from the Board members, members of the Governance Committee initiate contact with preferred candidates and, following feedback from interviews conducted by Governance Committee and Board members, recommend candidates to join the Board. The Governance Committee has the authority to retain a search firm to assist with this process. The Governance Committee considers candidates nominated by shareholders and ensures that such nominees are given appropriate consideration in the same manner as other candidates.
The Governance Committee operates under a charter, a copy of which can be found in the Investor Relations — Corporate Governance section of the Company’s website atwww.willis.com. The Governance Committee currently consists of James
McCann (Chairman), Joseph A. Califano and Anna C. Catalano and met formally five times during 2012. After regularly scheduled meetings, the Committee also meets in executive session. Mr. McCann was appointed Chairman of the Governance Committee on October 17, 2012 upon Senator Bradley’s resignation from that role.
2012 Amendments to the Company’s Corporate Governance Guidelines
In 2012, based on the recommendation of the Governance Committee’s recommendation, the Board amended the Company’s Corporate Governance Guidelines to include, among other things, the following policies:
Requiring the CEO to seek approval of the Governance Committee before serving on any other public company board;
Restricting directors (other than the CEO who is further restricted as noted above) from serving on the boards of more than 3 publicly-traded companies in addition to the Company’s Board;
Requiring a director who experiences materially changed circumstances to offer his or her resignation from the Board; and
Prohibiting directors and executive officers from having margin accounts and pledging Company shares.
Our Corporate Governance Guidelines and all Board Committee Charters can be found in the Investor Relations — Corporate Governance section of our website atwww.willis.com. Copies are also available free of charge on request from the Company Secretary, Willis Group Holdings Public Limited Company, c/o Office of General Counsel, One World Financial Center, 200 Liberty Street, New York, NY 10281-1033.
Ethical Code
The Company has adopted an Ethical Code applicable to all our directors, officers and employees, including our CEO, the Group Chief Financial Officer, the Group Financial Controller and all those involved in the Company’s accounting functions. Our Ethical Code can be found in the Investor Relations — Corporate Governance section of our website atwww.willis.com. A copy is also available free of charge on request from the Company Secretary, c/o Office of the General Counsel, Willis Group Holdings Public Limited Company, One World Financial Center, 200 Liberty Street, New York, NY 10281-1033. The Company intends to post on its website any amendments to, or waivers of, a provision of its Ethical Code in accordance with Item 406 of Regulation S-K.
Section 16 Beneficial Ownership Reporting Compliance
Section 16(a) of the Exchange Act requires the Company’s executive officers and directors, and persons who own more than 10% of a registered class of the Company’s equity securities, to file reports of ownership and changes in ownership (Forms 3, 4 and 5) with the SEC and the NYSE. Executive officers, directors and such security holders are required by SEC regulation to furnish the Company with copies of all such forms which they file. To the Company’s knowledge, based solely on a review of the copies of such reports furnished to the Company and information provided by the reporting persons, all of its directors and executive officers made all required filings on time during 2012 with the exception of one delinquent report on Form 4 reporting the sale of 29,000 shares by Sarah Turvill on May 1, 2012.
Named Executive Officer Joseph Plumeri (original target) ($3,750,000) Joseph Plumeri (revised target) ($2,500,000) Michael Neborak ($600,000) Stephen Hearn(1) (£875,000) Timothy Wright(1) (£875,000) Victor Krauze Name and Principal Joseph Plumeri Michael Neborak Stephen Hearn(6) Timothy Wright(6) Victor Krauze Name Joseph Plumeri Michael Neborak Stephen Hearn Victor Krauze Timothy Wright Name Joseph Plumeri Michael Neborak Stephen Hearn Victor Krauze Timothy Wright Name Joseph Plumeri Michael Neborak Stephen Hearn Timothy Wright Victor Krauze Name Plan Name J. Plumeri V. Krauze Name J. Plumeri V. Krauze Joseph J. Plumeri Termination by the Company without Cause, by the officer with Good Reason(1) Termination on Change of Control(2)(7) Termination for Other Reasons(3)(7) Change of Control(6) (7) Name Michael Neborak Termination by the Company without Cause(2)(5) Termination by the Company without Cause on a Change of Control(3) Termination for Other Reasons(4)(5) Change of Control(6) Stephen Hearn(7) Termination by the Company without Cause(2) Termination by the Company without Cause on a Change of Control(3) Termination for Other Reasons(4) Change of Control(6) Timothy Wright(7) Termination by the Company without Cause(2) Termination by the Company without Cause on a Change of Control(3) Termination for Other Reasons(4) Change of Control(6) Victor Krauze Termination by the Company without Cause(2) Termination by the Company without Cause on a Change of Control(3) Termination for Other Reasons(4)(5) Change of Control(6) Name of Non-Employee Director William Bradley(3) Joseph Califano, Jr. Anna Catalano Sir Roy Gardner(4) Sir Jeremy Hanley(5) Robyn Kravit(6) Jeffrey Lane Wendy E. Lane(7) James McCann(8) Douglas Roberts(9) Michael Somers Plan Category Equity Compensation Plans Approved by Security Holders Equity Compensation Plans Not approved by Security Holders Name and Address ValueAct Capital(1) 435 Pacific Avenue, Fourth Floor San Francisco, CA 94133 T. Rowe Price Associates, Inc.(2) 100 E. Pratt Street, Baltimore, MD 21202 Harris Associates L.P.(3) Harris Associates Inc. Two North LaSalle Street, Suite 500 Chicago, IL 60602 Name and Address(1) Joseph Plumeri(3) Joseph Califano, Jr.(4) Anna Catalano(5) Sir Roy Gardner(6) Sir Jeremy Hanley(7) Robyn Kravit(8) Jeffrey Lane(9) Wendy E. Lane(10) James McCann(11) Douglas Roberts(12) Michael Somers(13) Jeffrey W. Ubben(14) Dominic Casserley Stephen Hearn(15) Victor Krauze(16) Michael Neborak Timothy Wright(17) All of our Current Directors, Director Nominees and Executive Officers (19 persons) 30, 2014. Form 10-K no later than April 30, 2014. Audit fees(1) Audit related fees(2) Tax fees(3) All other fees(4) Total fees Global North America International Commissions and fees Global North America International Commissions and fees Operating (Loss) Income Excluding: Goodwill impairment charge(a) Write-off of unamortized cash retention awards(b) Additional incentive accrual for change in remuneration Insurance recovery(d) Loss/(gain) on disposal of operations Write-off of uncollectible accounts receivable and legal fees(e) India JV settlement (f) 2011 Operational Review(g) Financial Services Authority regulatory settlement Adjusted Operating Income Operating Margin, or Operating Income as a percentage of Total Revenues Adjusted Operating Margin, or Adjusted Operating Income as a percentage of Total Revenues Net (Loss) Income from Continuing Operations attributable to Willis Group Holding plc Excluding: Goodwill impairment charge, net of tax ($34, $nil)(a) Write-off of unamortized cash retention awards, net of tax ($62, $nil)(b) Additional incentive accrual for change in remuneration policy, net of tax ($77, $nil)(c) Insurance recovery, net of tax ($4, $nil)(d) Loss/(gain) on disposal of operations, net of tax ($nil, $nil) India JV settlement, net of tax ($nil, $nil)(e) Write-off of uncollectible accounts receivable balance and legal fees, net of tax ($5, $9)(f) 2011 Operational Review charge, net of tax ($nil, $52)(g) Financial Services Authority regulatory settlement, net of tax ($nil, $nil) Make-whole amounts on repurchase and redemption of Senior Notes and write-off of unamortized debt issuance costs, net of tax ($nil, $50) Deferred tax valuation allowance(h) Dilutive impact of potentially issuable shares(i) Adjusted Net Income from Continuing Operations Diluted shares outstanding 3.1 3.2 4.1 4.2 4.3 4.4 4.5 4.6 4.7 4.8 10.2 10.16 10.17 10.18 10.41 10.42 10.43 10.44 21.1 23.1 31.1 31.2 32.1 32.2 /s/ and DirectorCompensation Discussion and Analysisfollowing is an overview and analysis of the Compensation Committee’s philosophy and objectives in designing compensation programs for the Group CEO, the Group CFO, and the Company’s three other most highly compensated executive officers, collectively our “named executive officers.” For the fiscal year ended December 31, 2012, our named executive officers were:Joseph Plumeri (2012 CEO);Michael Neborak (Group CFO);Stephen Hearn (CEO and Chairman, Willis Global);Timothy Wright (CEO, Willis International); andVictor Krauze (CEO and Chairman, Willis North America).Mr. Plumeri resigned as CEO on January 6, 2013 but remained as Chairman of the Board. He will retire as Chairman on July 7, 2013. Mr. Dominic Casserley became the current CEO of the Company, effective January 7, 2013. Mr. Hearn was appointed Deputy CEO, effective January 1, 2013.1.0Executive Summary of our Named Executive Officer 2012 Compensation1.1.BackgroundThe Compensation Committee establishes, implements, and monitors the Company’s compensation programs, philosophy, and objectives. The Committee has two primary objectives: (1)information required by this Item with respect to attract and retain highly qualified executives in the competitive marketplace in which the Company operates; and (2) to create appropriate incentives for our executives to improve their individual performance. To achieve these objectives, the Compensation Committee evaluates and sets the total compensation for each of our named executive officers – base salary, annual incentive compensation, and long-term incentive compensation – considering the scope of the named executive officer’s role, level of expertise, individual performance, Company performance, and compensation paid to similarly-situated executives in our peer group companies. To assist the Compensation Committee in all aspects of the named executive officer and the Company’sdirector compensation program, the Compensation Committee has retained Towers Watson as its independent compensation consultant.The Compensation Committee spent significant time in 2012 reviewing, evaluating, and re-designing our named executive officer compensation program, partly in response to the “say-on-pay” vote at our 2012 Annual General Meeting. While a majority of shareholders approved our 2012 compensation program, the percentage approval was down considerably from 2011 (54% compared to 94%). Although this vote was non-binding, the Board and Compensation Committee wanted to understand why the approval rate was low, especially because our named executive officer compensation program remained essentially unchanged from 2011 to 2012.Accordingly, at the Board’s and Compensation Committee’s direction, management reached out to the Company’s shareholders to understand their concerns. We learned that there was no single area of shareholder concern. Rather, our shareholders expressed a variety of concerns, not all of which related to compensation and included disappointment in the Company’s financial performance, concern about the level of CEO compensation relative to that performance (structured pursuant to his 2010 employment contract), use of guaranteed bonuses, the use of the same financial metrics for short-term and long-term incentive awards, use of non-traditional share ownership guidelines, and the lack of prohibitions against directors and executive officers entering into margin accounts and pledging shares.The Committee and Board considered the results of the vote, the various viewpoints expressed by our shareholders and market factors, and adopted several changes to Company policies and our named executive officer compensation program, including:Revising the Company’s financial metrics for its 2013 annual incentive compensation awards and performance-based long-term incentive awards to emphasize both short-term and long-term financial performance. The annual and long-term incentive awards will have different metrics, all of which will be key drivers to increase cash flow and, therefore, important constituents of shareholder value enhancement.•Confirming our philosophy that incentive pay should be performance driven and not guaranteed. Accordingly, unless there are compelling circumstances (i.e., on a limited basis, in connection with new hires), the Compensation Committee will not approve guaranteed incentive awards.Lowering our new CEO’s total target pay package by 26% compared to Mr. Plumeri and lowering his amount of fixed pay by almost 45%.1.2The Company’s 2012 Financial Performance and Named Executive Officer Compensation2012 was characterized by an ongoing challenging macroeconomic environment, especially in two of our key geographic regions, Western Europe and North America. Reported EPS was ($2.58) and Adjusted EPS was $2.58 ($2.52 excluding the impact of foreign exchange) and our reported Operating Margin was (6.0%) and Adjusted Operating Margin was 21.6% (20.9% excluding the impact of foreign exchange). This compares to 2011 reported EPS of $1.15 and Adjusted EPS of $2.74 and reported Operating Margin of 16.4% and Adjusted Operating Margin of 22.5%. We refer to organic growth in commissions and fees, Adjusted EPS and Adjusted Operating Margin, which are Non-GAAP financial measures. A reconciliation of our GAAP to Non-GAAP financial information can be found in Exhibit A.In a difficult environment, however, the Company also delivered the following:1.3% reported commissions and fees growth and 3.1% organic commissions and fees growth;Significant improvement in the Company’s financial performance in the fourth quarter, with 7.5% organic commissions and fees growth (representing the best organic growth result in over six years) and improved Adjusted Operating Margin by 40 basis points; andSubstantive progress on key growth initiatives (pipelines development and management, producer retention, and recruitment) and operational initiatives (Financial Transformation Project, global brokerage systems, global placement system).While these results showed positive momentum moving into 2013, they did not meet established incentive targets, and, accordingly, the payout of our named executive officers’ 2012 annual incentive compensation awards was below target.Mr. Plumeri’s annual incentive compensation award was calculated under the terms of his 2010 employment agreement, and was based on the Company’s performance measured by growth in Adjusted EPS (for 50% of the award) and Adjusted Operating Margin (for the remaining 50%). The Committee set “threshold,” “target” and “stretch” payout goals of 250%, 375% and 500%, respectively, of his base salary. After the 2012 budget had been approved, however, because of slow EPS growth compared to 2011, Mr. Plumeri proposed and the Compensation Committee agreed, to reduce his target payout from 375% to 250%. Based on the Company’s performance in 2012, Mr. Plumeri was awarded an annual incentive compensation award of $905,963, representing 24% of his original target payout and 36% of his revised target payout.The annual incentive compensation awards for our four other named executive officers were based on a combination of the Company’s performance (60%) and individual and business unit performance (40%)1. Based on that formula, the annual incentive compensation awards to our named executive officers were as follows:Michael Neborak was awarded $528,000, representing 88% of his target payout.Stephen Hearn was awarded £815,000 (or $1,291,775), representing 93% of his target payout.Timothy Wright was awarded £775,000 (or $1,228,375), representing 89% of his target payout.Victor Krauze was awarded $910,000. While he does not have a formal annual incentive compensation award target, this represents 74% of the target used for Messrs. Hearn and Wright.Each named executive officer also received long-term incentive awards. Based on the Company’s financial performance, the performance-based portion of the awards were reduced to 88% of the grant value. As a result, the value of the 2012 long-term incentive awards for our named executive officers were as follows: Joseph Plumeri ($5,280,000); Michael Neborak ($940,000); Stephen Hearn £1,304,732 (or $2,068,000); Timothy Wright £889,590 (or $1,410,000); and Victor Krauze ($1,128,000). Stephen Hearn also received 6,500 restricted stock units in connection with his promotion to Chairman and CEO of Willis Global.2.0The Company’s Named Executive Officer Compensation ProgramThe Compensation Committee is responsible for establishing, implementing and monitoring the Company’s compensation programs, philosophy and objectives. The Company has two primary objectives in designing compensation programs for our named executive officers: (1) to attract and retain highly qualified and talented executives and professionals in the highly competitive marketplace in which the Company operates (which includes large financial services companies); and (2) to create appropriate incentives for our executives to improve their individual performance with the objective of improving the Company’s long-term performance, thereby creating value and wealth for our shareholders. Against those objectives, we consider each named executive officer’s total compensation in the context of compensation paid to similarly-situated executives in our peer group companies, the scope of the role, the individual’s level of expertise and other market factors, and the performance of the individual, his or her business unit and the Company.2.1Compensation Committee ConsultantThe Compensation Committee has the independent authority to hire external consultants and, accordingly, has retained Towers Watson since April 2011 to provide advice to the Compensation Committee on all matters related to the senior executives’ compensation and compensation programs. The Compensation Committee has the independent authority to terminate Towers Watson’s services at its discretion. Representatives from Towers Watson attended all of the Compensation Committee’s regularly scheduled meetings in 2012.Towers Watson reports directly to the Compensation Committee and provides data on U.S. and U.K. executive compensation trends in the sectors in which the Company competes for senior executive talent as well as the broader market. In 2012 and 2013, Towers Watson advised the Compensation Committee on the redesign of the named executive officer compensation program and, in particular, the compensation package of Mr. Casserley, the Company’s new CEO, and certain changes to the compensation packages for the Company’s other executive officers. Towers Watson also assists with selecting appropriate peer companies and assessing non-employee director compensation. The fees paid to Towers Watson in 2012 for these services totaled $167,866.The Compensation Committee uses the data and analysis provided by Towers Watson to better ensure that the Company’s compensation practices are consistent with the Company’s compensation philosophy and objectives for both the amount and composition of executive compensation, including that of the CEO. Based on the data and analysis provided by Towers Watson as well as information from management and outside counsel, the1The Company performance portion (60%) was calculated measuring Adjusted EPS against a target of $2.74 (50%) and Adjusted Operating Margin against a target of 21.8% (50%).Compensation Committee applies business judgment in recommending compensation awards, taking into account the dynamic nature of the insurance sector internationally and the adaptability and response required by the Company’s leadership to manage significant changes that arise during the course of a year.Before its appointment as the consultant to the Compensation Committee in 2011, Towers Watson had been providing investment advisory services for the Company’s UK pension plan and was engaged directly by the fiduciary trustees of the plan. These trustees operate independently of the Company’s management. In addition, Towers Watson also provides human resource consulting services to certain of the Company’s subsidiaries (the majority of which are international subsidiaries where Towers Watson was hired by local management). The additional services provided to the Company’s significant subsidiaries totaled $957,181 for 2012, of which $854,462 related to the services provided for UK pension plan and $102,719 related to the human resource consulting services. The decision to engage Towers Watson for the human resource consulting services before 2011 was originally approved by management and since that time the Compensation Committee has reviewed and approved such services. None of the Towers Watson representatives that advise the Compensation Committee provide any other services to the Company’s subsidiaries. The Compensation Committee determined that those services, based on the independence factors specified in the NYSE listing rules, produced no conflicts of interest.2.2Analysis of Alignment of Pay and PerformanceIn advance of the impending requirement under the Dodd-Frank Wall Street Reform and Consumer Protection Act of 2010, the Compensation Committee directed Towers Watson to analyze the alignment of total executive officers’ pay in relation to the Company’s performance as compared to the peer companies’ performance over a three-year performance measurement period (2009 – 2011). We evaluated our named executive officers’ performance over this period using the following key metrics: total shareholder return, Adjusted EPS growth and Adjusted Operating Margin. This performance was then compared to “realizable/earned pay,” which is defined as the actual value of compensation earned for the three-year measurement period and includes base pay, annual incentive compensation paid, “in the money” value of stock option grants, market value of time-vested RSUs and market/cash value of performance based awards. The analysis indicated in aggregate a strong alignment between our executive officers’ realizable/earned pay (62nd percentile of our peer group) and the Company’s composite performance over the three-year measurement (75th percentile of our peer group) period.2.3Peer Group and Market DataAs providers of insurance brokerage and risk consultancy services, we have no direct competitors of comparable financial size in our marketplace. However, we compete for talent with brokers of all sizes, with insurance carriers, and with companies in other financial services sectors. Accordingly, to assist the Compensation Committee in judging the reasonableness of its compensation recommendations, we typically use data related to a group of peer companies in the insurance sector, some of whom do not directly operate as insurance brokers.The Compensation Committee reviews its peer group on an annual basis to ensure that it remains reasonable and justifiable. It seeks to avoid changes unless there is some significant rationale. The 2012 peer group, which has remained unchanged from 2010, was approved by the Compensation Committee following a review by Towers Watson and subsequent discussions between the Compensation Committee, Towers Watson and management. The peer group is a combination of large and small insurance brokers and insurance carriers and consists of:Insurance BrokersInsurance CarriersAON plcAce LimitedArthur J. Gallagher & Co.Arch Capital Group LimitedBrown & Brown Inc.Axis Capital Holdings LimitedJardine Lloyd Thompson Group plcThe Chubb CorporationMarsh & McLennan Companies, Inc.XL Group plcOur executive officers are based in both the United States and the United Kingdom. The country of each executive officer’s primary location is taken into account when reviewing and determining his or her annual base salary and, particularly, benefits.In order to attract and retain exceptional senior executives, the Compensation Committee generally sets the executive officer’s base salary at the median but evaluates the executive officer’s total compensation (defined as base salary, annual incentive compensation and long-term incentive compensation) in the context of compensation paid to similarly-situated executives in our peer group companies, considering the scope of the role, the individual’s level of expertise and other market factors as well as both the performance of the individual and the Company.The Compensation Committee reviews each element of compensation separately, as well as the total compensation of named executive officers. Compensation differences among the named executive officers reflect their different roles, their contributions, and the different market pay relating to those roles.2.4Redesign of Our Named Executive Officer Compensation for 2013 in Response to Advisory VoteAt our 2012 Annual General Meeting of Shareholders, a majority of votes (72,159,795 votes or approximately 54%) were cast in favor of the compensation of the Company’s named executive officers. Although this vote was non-binding, the Board and the Compensation Committee sought to understand why the approval rate was low, especially because our executive pay program had remained substantially the same as the program that received 94% support the previous year. Accordingly, at the Board and Compensation Committee’s request and under their guidance, management began an outreach program to the Company’s shareholders to gather feedback and enable the Board and the Compensation Committee to better understand shareholder concerns.We solicited feedback through a survey and direct outreach to shareholders representing approximately 73% of the Company’s shares. We then engaged in substantial discussions with investors representing over 40% of our outstanding shares. During these discussions, we learned that there was no single area of shareholder concern. Rather, our shareholders expressed a variety of concerns, not all of which related to compensation and included disappointment in the Company’s financial performance, concern about the level of CEO compensation relative to that performance (structured pursuant to his 2010 employment contract), use of guaranteed bonuses, the use of the same financial metrics for short-term and long-term incentive awards, use of non-traditional share ownership guidelines, and the lack of prohibitions against directors and executive officers entering into margin accounts and pledging shares.The Board and Compensation Committee considered the vote results and the viewpoints expressed by shareholders through the Company’s outreach efforts and, as a result, with input from their outside advisors, adopted several changes to Company policies and to the Company’s executive compensation program. It is important to note, however, that most of these changes did not take effect until 2013 and therefore will not be reflected until our 2014 Proxy Statement. The Board and Compensation Committee, with assistance from management, responded to the outreach program by:Seeking advice from its independent compensation consultant, Towers Watson, regarding the design of its new CEO compensation package, including the level of pay relative to the market, the mix of fixed to variable pay components and the relationship of the CEO’s pay level compared to the other named executive officers’ compensation.Revising Company financial metrics for its annual incentive compensation awards and performance-based long-term incentive awards to differentiate between and to emphasize both short-term and long-term financial performance.For annual incentive compensation awards for 2013, the Board and the Compensation Committee replaced previously used metrics, Adjusted EPS and Adjusted Operating Margin, with organic commissions and fees growth and Adjusted EBITDA. The Board selected those metrics because they believe they are key drivers of increasing cash flow and, therefore, important constituents of shareholder value enhancement. Additionally, Adjusted EBITDA (which excludes the impact of non-cash expenses, depreciation and amortization) is an appropriate short-term metric because it measures cash-based operating income and ensures that appropriate investment in the Company is encouraged.For the long-term incentive compensation awards for 2013, the Board and the Compensation Committee eliminated the one-year performance period targets and adopted three-year performance period targets to encourage sustained financial performance. They also replaced previously used metrics, Adjusted EPS and Adjusted Operating Margin, with organic commissions and fees growth and Adjusted EBIT (modified by a cost of capital charge for acquisitions or a cost of capital credit for dispositions made during the performance period). Adjusted EBIT (modified as described above) is an appropriate long-term metric because it provides management accountability for investment decisions (mergers and acquisitions and capital expenditures) over time.Adopting a strict policy prohibiting directors and executive officers from entering into margin accounts or pledging shares.•Confirming our philosophy that incentive pay should be performance driven and not guaranteed. Accordingly, unless there are material and compelling circumstances (i.e., on a limited basis, in connection with new hires), the Compensation Committee will not approve guaranteed incentive awards. As discussed further below, our new Chief Executive Officer’s compensation does not include any guaranteed annual incentive compensation awards.Revising our executive officer share ownership guidelines to require each executive officer to own shares equivalent in value to a multiple of his or her base salary, as set forth below:PositionMultipleGroup CEO6.0 x base salaryExecutive Officers Leading Major Business Units and Group CFO3.0 x base salaryOther Executive Officers2.0 x base salaryExecutives are required to retain at least 50% of shares received under equity award programs until the ownership guidelines are met.Finally, as discussed below, we changed the design of our new CEO’s compensation.In January 2013, the Board appointed Dominic Casserley as the Company’s new CEO. The Company recruited Mr. Casserley from McKinsey & Company, where he led McKinsey’s Greater China Practice and its UK and Ireland Practice and served as a senior partner and member of the firm’s global board. Consistent with the Compensation Committee’s and Board’s compensation philosophy for 2013 and beyond, we structured the CEO compensation as follows:Lowered the CEO’s total target pay package by over 25% compared to Mr. Plumeri resulting in less disparity between the compensation of the CEO and other named executive officers.Lowered the CEO’s amount of fixed pay by almost 45%, increased the proportion of long-term incentive compensation relative to annual incentive compensation, as illustrated below, and added a cap on his annual incentive compensation awards.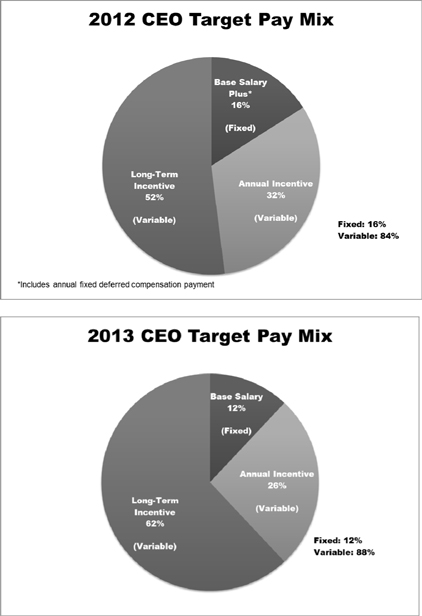
Provided the CEO, as a transition payment, with a one-time sign-on cash award of $1,500,000, which will not be paid until the start of his second year of service. We believed this payment was reasonable and consistent with market practice given that our CEO was moving from McKinsey & Company’s all-cash based compensation system to a system that combines cash and equity.Provided that the CEO’s 2013 annual incentive compensation awards, if any, will be paid partially in equity.Revised the CEO’s 2013 annual incentive compensation award to be based 80% on the Company’s financial metrics and 20% on strategic goals, with no guaranteed payment.Continued the practice of providing a double trigger for accelerating vesting of the CEO’s equity upon a change of control.2.5Summary Chart of the Components of Our Named Executive Officers CompensationThe chart below sets forth the main components, objectives, key features and details of our named executive officer compensation program. It also highlights certain features adopted by the Compensation Committee in response to the Company’s shareholder outreach program that will be included within our 2013 named executive officer compensation and reflected in the 2014 proxy. As discussed in more detail in Section 3.0, the three components of our named executive officers’ compensation are: base salary, annual incentive compensation, and long-term incentive compensation.ComponentObjectiveKey Features/DetailForward-Looking ChangesBASE SALARY(Fixed)• Provide secure base of cash compensation• Attract and retain highly talented executives• Positioned at/around median level in our peer group companies• Salary adjustments made only to reflect changes in responsibilities or when competitive market conditions warrant• Lowered the CEO’s amount of fixed pay by almost 45%.ANNUAL INCENTIVE COMPENSATION(Variable)• Incent and reward executive officer contribution in generating:• strong financial performance at Company• strong financial/strategic performance at their business/functional unit• Retain strong performers• Provide annual performance-driven wealth creation• Awards for the CEO were based 100% and awards for the other named executive officers were based 60% on the Company’s performance against established targets for certain financial metrics(1)(2) that include:• Adjusted Operating Margin• Adjusted EPS• Paid entirely in the form of cash(3)• Payout determined using annual incentive sliding scale that incorporated symmetrical relationship between performance and payouts• Company financial metrics had a higher performance threshold for the CEO than the other named executive officers and the pool established for other employees (resulting in a zero payout to Mr. Plumeri with respect to the Adjusted EPS measure)• The Company utilized a high ratio of variable pay to fixed pay to tie compensation to performance. For example, because performance metrics were not achieved, Mr. Plumeri’s annual incentive award was reduced to 24% of his original target payout and 36% of his reduced target payout.• Annual incentive compensation awards for 2013 performance period will be determined using new revenue and profit metrics(4):• Organic Commissions and Fees Growth• Adjusted EBITDA• Compensation Committee confirmed its philosophy that incentive pay should be performance driven and not guaranteed(5)• Company financial metrics have a higher performance threshold for the CEO and other named executive officers than the pool established for other employees• A cap has been added to the CEO’s annual incentive compensation awards• For the CEO, lowered the proportion of target annual incentive compensation relative to long-term incentive compensationLONG-TERM INCENTIVE COMPENSATION(Variable)• Align executive officers’ interests with those of our shareholders• Incent long-term decision making• Reward exceptional performance by executive officers• Retain strong performers• Grants made in the form of• performance-based RSUs• time-based options• time-based RSUs• Earned performance-based RSUs were based on the Company’s performance against established targets for certain financialmetrics(2)(3) that include:• Adjusted Operating Margin• Adjusted EPS• Earned performance-based RSUs were determined using long-term incentive sliding scale that incorporates symmetrical relationship between performance and payouts• Dividends were not payable on any performance-based RSUs• Earned performance portion of 2013 long-term incentive compensation will be determined using new revenue and profitmetrics that are different from annual incentive compensation metrics(4):• Organic Commissions and Fees Growth• Adjusted EBIT (with Cost of Capital Modifier)• 2013 Long-Term Incentive Program will include three-year performance period to better reflect pay for long-term performance• For CEO, increased the proportion of long-term incentive compensation relative to annual incentive compensation(1)These financial metrics represented how the Company manages its profitability (Adjusted Operating Margin) and enhances growth in shareholder value (Adjusted EPS).(2)These financial metrics were the same for all employees in the Company and its subsidiaries, who received annual incentive compensation awards or performance-based equity.(3)From time to time, the Company may pay a portion of annual incentive compensation awards in the form of RSUs, provided there is sufficient available share capacity.(4)The Board and Compensation Committee believe these metrics are key drivers of cash flow and shareholder value creation.(5)Accordingly, unless there are material and compelling circumstances (i.e., on a limited basis, in connection with new hires), the Compensation Committee will not approve guaranteed incentive awards.3.0Named Executive Officer Compensation for 20123.1The Company’s 2012 Financial Performance2012 was characterized by an ongoing challenging macroeconomic environment, especially in two of our key geographic regions, Western Europe and North America. Reported EPS was ($2.58) and Adjusted EPS was $2.58 ($2.52 excluding the impact of foreign exchange) and our reported Operating Margin was (6.0%) and Adjusted Operating Margin was 21.6% (20.9% excluding the impact of foreign exchange). This compares to 2011 reported EPS of $1.15 and Adjusted EPS of $2.74 and reported Operating Margin of 16.4% and Adjusted Operating Margin of 22.5%.As discussed below, these results were below the incentive targets established by our Compensation Committee and, accordingly, the Committee and the Board reduced our named executive officers’ incentive awards. However, the Company also delivered the following in 2012:1.3% reported commissions and fees growth and 3.1% organic commissions and fees growth:6.1% organic commissions and fees growth in our Global segment;4.9% organic commissions and fees growth in our International segment; and(0.6)% decline in organic commissions and fees in our North America segment, representing a significant improvement over the prior year.Significant improvement in the Company’s financial performance in the fourth quarter, with 7.0% reported commissions and fees growth, 7.5% organic commissions and fees growth (representing the best quarterly organic growth result in over six years) and improvement in Adjusted Operating Margin by 40 basis points.2012 cash flow from operating activities of $525 million, up $86 million, or 20%, from the prior year.$285 million returned to shareholders through share repurchases and dividends.Substantive progress on key growth initiatives (pipeline development and management, producer retention and recruitment) and operational initiatives (Financial Transformation Project, global brokerage systems, global placement system).3.2Named Executive Officers’ Annual CompensationThe key components of our named executive officers’ annual compensation are:Base salary;Annual incentive compensation (payable in cash and/or equity awards); andLong-term incentive compensation.Base Salary — Base salary is intended to provide a fixed level of remuneration to fairly compensate and retain executives for their time and effort based on the individual’s role, experience and skill. The Compensation Committee strives to set base salary at a competitive level in the relevant markets in which our executive officers operate. Base salaries are reviewed by the Compensation Committee for all the Company’s executive officers relative to our peer group and, from time to time, against other U.S. or U.K. survey data, as applicable. The base salary levels are generally positioned around the median of our peer group companies. In line with our compensation philosophy, exceptional performance by our executive officers is generally rewarded through annual and/or long-term incentive compensation and not through base salaries. Before he resigned as CEO effective January 6, 2013, Mr. Plumeri’s base salary had not changed since he joined Willis in October 2000. This reflects the Company’s and Mr. Plumeri’s shared view that his pay was best aligned with shareholder interests if most of his annual compensation was at risk and tied to the Company’s performance.Adjustments to base salaries are made by the Compensation Committee to reflect changes in responsibilities or when competitive market conditions warrant. The following reflects the changes to the base salaries of our named executive officers during the past year:Based on the results of a market review, effective April 2012, Mr. Neborak received an increase to his annual base salary to $600,000 from $500,000.As a result of the increase in responsibilities related to his promotion to Chairman and CEO of Willis Global, Mr. Hearn received an increase in his annual base salary to £500,000 ($792,500) from £400,000 ($634,000), effective January 1, 2012. As a result of the increase in responsibilities related to his promotion to Deputy CEO, Mr. Hearn received a further increase in his annual base salary to £530,000 ($840,050), effective January 1, 2013.As a result of increase of responsibilities related to his promotion to CEO of Willis International, Mr. Wright received an increase in his annual base salary to £500,000 (or $792,500) from £405,000 (or $641,925).Based on the increased scope of his role and increasingly competitive market conditions, effective April 2012, Mr. Krauze received an increase to his annual base salary $700,000 from $625,000.Annual Incentive Compensation — Our annual incentive compensation plan is designed to incent and reward our named executive officers for their contribution in generating strong financial performance at the Company, strong financial or strategic performance at their business or functional unit, as well as to retain strong performers.The Compensation Committee set Mr. Plumeri’s annual incentive compensation for 2012 in accordance with his 2010 employment agreement. Other than Mr. Plumeri, each named executive officer is eligibleInstruction G(3) to receive an annual incentive compensation award under the Company’s Annual Incentive Plan (“AIP”). AIP awards are an integral component of the executive officer’s total compensation and are based on specific company financial results as well as individual executive officer strategic objectives. The AIP is intended to deliver exceptional pay for exceptional performance and provides a well-timed link between recent performance and individual compensation, which is especially pertinent with the de-emphasis on regular base-pay increases.Annual incentive compensation, which may be paid in cash and/or equity, is granted under the Willis Group Senior Management Incentive Plan (the “SMIP”) to the extent named executive officers are “covered employees” within the meaning of Section 162(m) of the Internal Revenue Code of 1986, as amended (“Section 162(m)”). Generally, annual incentive compensation awards to the executive officers are approved and, for named executive officers who are “covered employees” under Section 162(m), are typically certified by the Compensation Committee in February, with payments made in March. Previously, if annual incentive compensation awards were paid in the form of a cash retention award, then the executive officer would be required to repay a proportionate amount of the award if he or she voluntarily left the Company’s employment before a specified date, which was generally three years. In December 2012, the Board changed its Company-wide remuneration policy and eliminated the repayment requirement from prior annual cash retention awards. Awards for 2012 were in the form of standard cash bonuses which do not include a repayment requirement. Current and prior annual incentive compensation awards continue to remain subject to the clawback provisions discussed in Section 4.0.Annual Incentive Compensation Award for Joseph Plumeri (2012 CEO)Pursuant to Mr. Plumeri’s 2010 employment agreement, Mr. Plumeri’s annual incentive compensation award was based 100% on the achievement by the Company of certain performance targets. Accordingly, pursuant to that 2010 agreement, each fiscal year the Compensation Committee established a threshold, target, and stretch financial performance goals (with maximum goals being no greater than 110% of the target goal). In February 2012, consistent with 2011 and based on the criteria in his employment agreement, the Compensation Committee approved annual incentive compensation performance goals of:Threshold PayoutTarget PayoutStretch Payout250% of his base salary if 95% of the performance targets were achieved.375% of his base salary if 100% of the performance targets were achieved.500% of his base salary if 105% of the performance targets were achieved.Upon final approval of the 2012 budget, however, in consideration for the lack of growth in the Adjusted EPS target for 2012 relative to 2011, Mr. Plumeri proposed and the Compensation Committee agreed, to reduce his target payout to 250% (down from 375%) if 100% of the financial targets were achieved. This change is reflected in the revised payout column in the table below entitled “Summary of Annual Incentive Compensation Calculation For all Named Executive Officers.”In 2012, the Company financial measures used for determining Mr. Plumeri’s annual incentive compensation award were Adjusted EPS (for 50% of the payment) and Adjusted Operating Margin (for 50% of the payment). These are measures that represent how the Company manages its profitability (through the use of the Adjusted Operated Margin) and enhances growth in shareholder value (as measured by the Adjusted EPS).Applying the Company’s performance against Mr. Plumeri’s Adjusted EPS target produced the following opportunity:Adjusted
EPS Target Payout
Opportunity
as a % of
Base Salary
(Original) Payout
Opportunity
as a % of
Base Salary
(Revised)(Stretch) $2.88 250% 250% (Target) $2.74 187.5% 125% (Threshold) $2.60 125% 83.5% <$2.60 0% 0% As set forth in the Company’s Annual Report on Form 10-K for the year ended 2012, the Company reported Adjusted EPS of $2.58. The Compensation Committee, however, eliminated the positive impact of foreign exchange (deemed outside of management’s control) and thus reduced, for compensation purposes, 2012 Adjusted EPS to $2.52. Because the Company did not achieve the Adjusted EPS threshold of $2.60, this portion of Mr. Plumeri’s annual incentive compensation award was $0.Applying the Company’s performance against Mr. Plumeri’s Adjusted Operating Margin target produced the following result:Adjusted
Operating
Margin
Target Payout
Opportunity
as a % of
Base Salary
(Original) Payout
Opportunity
as a % of
Base Salary
(Revised)(Stretch) 22.9% 250% 250% (Target) 21.8% 187.5% 125% (Threshold) 20.7% 125% 83.5% <20.7% 0% 0% As set forth in the Company’s Annual Report on Form 10-K for the year ended 2012, the Company reported Adjusted Operating Margin of 21.6%. The Compensation Committee eliminated the positive impact of foreign exchange and this reduced, for compensation purposes, 2012 Adjusted Operating Margin to 20.9%. Because the Company exceeded the 20.7% threshold and met 96% of the 21.8% target, this portion of Mr. Plumeri’s annual incentive compensation award was 48% of his target payout opportunity or 72% of his revised total target payout opportunity or $905,963.Accordingly, based on the formula discussed above, combining the results of both the Adjusted EPS and Adjusted Operating Margin formulas, the Compensation Committee approved an annual incentive compensation award to Mr. Plumeri of $905,963 (i.e., 24% of his total target payout opportunity of $3,750,000 or 36% of his revised total target payout opportunity of $2,500,000). Because Mr. Plumeri is no longer serving as the Company’s CEO and will retire as Chairman of the Board on July 7, 2013, the Compensation Committee elected to pay Mr. Plumeri’s 2012 annual incentive compensation award 100% in cash rather than partially in equity and partially in cash as in prior years.Annual Incentive Compensation Awards for Michael Neborak, Stephen Hearn, Timothy Wright and Victor KrauzeThe 2012 annual incentive compensation awards under the AIP for Messrs. Neborak, Hearn, Wright and Krauze were structured by the Compensation Committee as follows:60% based on the following Company financial results:30% based on how the Company performed against an Adjusted EPS target of $2.74 per share (the same target used for the payout pool for all Company employees in the AIP); and30% based on how the Company performed against an Adjusted Operating Margin target of 21.8% (the same target used for the payout pool for all Company employees in the AIP); and40% based on how the named executive officer performed against individual strategic objectives, which for Messrs. Hearn, Wright and Krauze was largely based on the financial performance of their business units.The resulting percentage was applied against the officer’s annual incentive compensation target award, which is a percentage of the officer’s base salary. Under Mr. Hearn’s amendment to his employment agreement as a result of his promotion to Chairman and CEO of Willis Global in early 2012, he was entitled to receive a minimum AIP for the first year in his new role. Based on his performance as described below, Mr. Hearn’s actual AIP award exceeded this minimum. No executive officer has any guaranteed annual incentives for 2013.Company Performance Portion of Annual Incentive Compensation (60% of AIP)With respect to the EPS-based component of the award, the following scale applied:Adjusted
EPS
Target Payout
as % of
Base Salary$2.88 110% $2.74 100% $2.60 90% $2.47 80% $2.33 70% <$2.33 0% As stated above, the Company reported 2012 Adjusted EPS of $2.58, but the Compensation Committee eliminated the positive impact of foreign exchange, reducing Adjusted EPS to $2.52. Based on the above sliding scale, because the Adjusted EPS result was between the $2.74 and $2.60, this portion of each named executive officer’s annual incentive award was funded at 84%.With respect to the Adjusted Operating Margin component of the award, the following scale applied:Adjusted
Operating
Margin
Target Payout
Measurement22.9% 110% 21.8% 100% 20.7% 90% 19.6% 80% 18.5% 70% <18.5% 0% As stated above, the Company reported 2012 Adjusted Operating Margin of 21.6%, but the Compensation Committee eliminated the positive impact of foreign exchange, reducing Adjusted Operating Margin to 20.9%. Based on the above sliding scale, this produced a payout percentage of 92% for this portion of each of the named executive officer’s annual incentive award.Based on the application of the above two scales, the blended payout percentage for the Company’s performance against the Adjusted EPS and Adjusted Operating Margin targets was 88% of target. This comprised 60% of each of the named executive officer’s annual incentive compensation award.Individual Strategic Objectives and Business Unit Financial Goals (40% of AIP)The Compensation Committee then considered the individual strategic objectives and business unit financial goals based on operating income and organic commissions and fees growth for Messrs. Neborak, Hearn, Wright and Krauze which were established at the beginning of 2012. The Compensation Committee reviewed the executives’ performance against those objectives in the context of the overall Company financial and strategic performance. Key factors and resulting payout decisions are set forth below:Michael NeborakLed efforts to contain group-wide expense growth.Made significant progress in Financial Transformation Project.Completed 3-year Financial Operating Model.As a result of the achievement of these goals, the Compensation Committee funded this portion of his annual incentive compensation award at 88%.Stephen HearnWillis Global achieved $372 million operating income and 6.1% organic commissions and fees growth.Demonstrated leadership in development of a vision and strategy for the alignment of the Global business.Made significant progress in the deployment of an enterprise-wide placement initiative.Demonstrated leadership and support during the CEO transition.As a result of the achievement of these goals, the Compensation Committee funded this portion of his annual incentive compensation award at 100%.Timothy WrightWillis International achieved operating income of $183 million and 4.9% organic commissions and fees growth.Achieved notable year-over-year commissions and fees growth despite poor economies in major markets, with growing momentum in the second half of 2012.Supported the deployment of enterprise-wide placement initiative in all major countries.As a result of the achievement of these goals, the Compensation Committee funded this portion of his annual incentive compensation award at 89%.Victor KrauzeWillis North America achieved $240 million of operating income. Despite a full-year decline in organic commissions and fees of (0.6)%, it achieved substantial shift in growth momentum culminating in 3.1% organic growth in the fourth quarter of 2012.Expanded emphasis on producer recruitment resulting in 3.2% net producer growth in 2012.Continued to successfully deploy Sales 2.0.Despite these achievements, the Compensation Committee funded this portion of his annual incentive compensation award at 54%, reflecting the overall impact of Willis North America’s financial results on Company performance.The following table sets forth the calculation for 2012 annual incentive compensation awards all named executive officers:Summary of Annual Incentive Compensation Calculation for all Named Executive Officers Payout % Relating to
Company Portion of AIP 2012
Salary Bonus
Target as
% of
Salary ($/£) Adjusted
EPS Adjusted
Operating
Margin Payout %
Relating to
Individual
Portion of
AIP Total
Payout
as a % of
Bonus
Target Bonus
Payout $/£ $1,000,000 375% 0% 92% N/A 24% $905,963 $1,000,000 250% 0% 92% N/A 36% $905,963 $600,000 100% 84% 92% 88% 88% $528,000 £500,000
or
($792,500) 175%
or
($1,386,875) 84% 92% 100% 93% £815,000
or
($1,291,775) £500,000
or
($792,500) 175%
or
($1,386,875) 84% 92% 89% 89% £775,000
or
($1,228,375) $700,000 N/A(2) 84% 92% 54% 74% $910,000 (1)Messrs. Hearn and Wright receive their salaries and bonuses in pounds sterling; the above figures have been converted into dollars at the average exchange rate for 2012 (£1:$1.585).(2)Mr. Krauze did not have a formal bonus target. To calculate Mr. Krauze’s 2012 bonus the Compensation Committee utilized the same bonus target as Messrs. Hearn and Wright (175% of salary).All annual incentive compensation awards were paid in cash. Further details of the 2012 annual incentive compensation awards made to our named executive officers are shown in the Bonus and Non-Equity Incentive Plan Columns of the “Summary Compensation” table.Further details regarding the changes made to the 2013 annual incentive compensation program of our CEO and other named executive officers are reflected in Section 2.4, “The Redesign of Our Named Executive Officer Compensation for 2013 in Response to Advisory Vote” and Section 2.5 “Summary Chart of the Components of Our Named Executive Officers Compensation.”Long-Term Incentive CompensationOur long-term incentives are a significant element of our executive officers’ compensation and have typically been in the form of equity awards. For several years, we did not have a consistent long-term incentive program and. in 2010, in light of economic conditions, we did not make regular equity awards to our named executive officers except to satisfy pre-existing commitments or in connection with sign-on equity awards made to attract new competitive talent to the Company. In 2011, we implemented a Long-Term Incentive Program for senior leaders. In that year, we granted options and deferred cash as a portion of the long-term incentive plan as an alternative to the use of RSUs due to the lack of share availability under the Company’s equity plans at the time.2012 Long-Term Incentive ProgramIn April 2012, the Compensation Committee adopted the 2012 Long-Term Incentive Program (the “2012 LTI Program”), which had both performance-based and time-based components to both reward performance and help ensure retention. Grants of options, performance-based RSUs and time-based RSUs were made in December 2012 and, for the performance-based equity, included performance targets established in the second quarter of 2012. All named executive officers, other than Mr. Plumeri, were eligible to participate and, as a result, Messrs. Neborak, Hearn, Wright and Krauze received awards under the 2012 LTI Program.For the named executive officers, their individual 2012 awards were comprised of:Options Performance-Based RSUs Time-Based RSUs 25 % 50% 25% The equity granted under the 2012 LTI Program was made under the recently adopted Willis Group Holdings Public Limited Company 2012 Equity Incentive Plan (the “2012 Plan”). The options, time-based RSUs and performance-based RSUs earned based on the performance of the 2012 targets discussed below, will vest 50% on the second and third anniversaries of the grant date (i.e., December 26, 2014 and December 26, 2015), subject to the continued employment of the participant during the vesting period. Dividends are not payable on any of the equity granted under the 2012 LTI Program.Similar to the annual incentive compensation awards, the amount of performance-based RSUs granted under the 2012 LTI Program would be earned 50% based on the achievement of an Adjusted EPS target of $2.74 and 50% based on the achievement of an Adjusted Operating Margin target of 21.8%. However, if the targets were not achieved at 100%, the earned amount of the performance-based RSU award would be reduced in accordance with the following sliding scales:Performance
Against
Applicable
Adjusted
EPS Target % of Earned
Performance
Based-RSUs$2.74 100% $2.60 90% $2.47 80% <$2.47 0% Performance
Against
Adjusted
Operating
Margin
Target % of Earned
Performance
Based-RSUs21.8% 100% 20.7% 90% 19.6% 80% <19.6% 0% The Compensation Committee applied the same analysis in determining financial performance against applicable targets that they used in determining the annual incentive compensation awards for the named executive officers. As a result, 88% of the performance-based RSUs granted under the 2012 LTI Program were earned by the respective named executive officer and they received long-term incentive awards equal in value to: Michael Neborak ($940,000); Stephen Hearn £1,304,732 (or $2,068,000); Timothy Wright £889,590 (or $1,410,000); and Victor Krauze ($1,128,000).Grants to 2012 Named Executive Officers Outside of the 2012 Long-Term Incentive ProgramIn 2012, under the terms of his 2010 employment agreement, performance-based RSUs were granted to Mr. Plumeri. This was the last equity grant required under Mr. Plumeri’s employment agreement.The RSUs were 100% performance related and similar to the performance-based RSUs granted under the 2012 LTI Program, 50% of the award would be earned if an Adjusted EPS target of $2.74 was met and 50% of the award would be earned if an Adjusted Operating Margin of 21.8% was met. However, if the targets were not achieved at 100%, the amount of the performance-based RSU award would be reduced in accordance with the same equity sliding scale as the 2012 LTI Program. The Compensation Committee applied the same analysis in determining financial performance against applicable targets that they used in determining the annual incentive compensation awards and the 2012 LTI Program for the named executive officers. As a result, 88% of the performance-based RSUs granted to Mr. Plumeri were earned and Mr. Plumeri received a long-term incentive award value equal to $5,280,000.In connection with his promotion in January 2012 from CEO of Willis Re to Chairman and CEO of Willis Global, Mr. Hearn received 6,500 time-based RSUs. These RSUs vest in equal tranches on the first, second and third anniversaries of the grant date.Details of the 2012 equity award grants made to the named executive officers and the awards earned as a result of the Company’s financial performance are contained in the compensation tables “Grant of Plan-Based Awards” and “Outstanding Equity Awards at Fiscal Year End.” Details concerning the employment agreements of the named executive officers are set forth in the sections entitled “Compensation Tables — Joseph Plumeri’s Employment Agreement (2012 CEO)” and “— Other Named Executive Officers’ Employment Agreements.”Long-term incentive awards that are intended to be “qualified performance-based compensation” under Section 162(m) were granted under the SMIP or under a combination of the SMIP and one of the Company’s equity plans or any sub-plans thereto, including the 2012 Plan, the Willis Group Holdings 2008 Share Purchase and Option Plan (the “2008 Plan”), the 2000 Hilb, Rogal and Hamilton Share Incentive Plan (the “2000 HRH Plan”) and the 2007 Hilb Rogal and Hobbs Share Incentive Plan (the “2007 HRH Plan” and together with the 2012 Plan, the 2008 Plan and the 2000 HRH Plan, the “Plans”).Further details regarding the changes made to the 2013 long-term incentive compensation program of our CEO and other named executive officers are reflected in Section 2.4, “The Redesign of Our Named Executive Officer Compensation for 2013 in Response to Advisory Vote” and Section 2.5 “Summary Chart of the Components of Our Named Executive Officers Compensation.”3.3Perquisites and Other BenefitsThe Company does not believe that providing generous executive perquisites is either necessary to attract and retain executive talent or consistent with our pay-for-performance philosophy. Therefore, other than the benefits described in the “Summary Compensation” table, we do not provide perquisites such as personal use of aircraft, excise tax gross-ups, financial planning services, club memberships or vacation homes to our executive officers. Our corporate aircraft use policy permits a guest of an executive officer or director to accompany them on a business flight on Company aircraft if a seat is available and they reimburse the Company the equivalent of a first-class airline ticket.In order for Mr. Plumeri to exercise stock options or to receive RSUs when they vest under our equity programs, he is required by federal law to file a notification and report form under the Hart–Scott–Rodino Antitrust Improvements Act of 1976. The Compensation Committee determined that the Company should pay the filing fee and associated legal costs, since otherwise Mr. Plumeri would not receive the same benefit from the equity compensation components as other executive officers of the Company. Accordingly, “Other Compensation” for Mr. Plumeri in the “Summary Compensation Table” includes the filing fee paid on his behalf during 2012.In addition, the Company provides retirement, life insurance and medical benefits to our executive officers to be competitive with the marketplace in which our executive officers operate (which are the same as those provided to other employees in the workplace).Retirement income is provided to Mr. Plumeri and some other executive officers through our defined benefit retirement plans. The U.S. defined benefit plan was closed to new hires on January 1, 2007 and was frozen on May 15, 2009. Newly hired executive officers only participate in defined contribution plans. The Company also maintains the Willis Pension Scheme (UK), an approved U.K. defined benefit plan. The Willis Pension Scheme (UK) was closed to new members beginning on January 1, 2006. In 2006, it was replaced by a defined contribution plan for new employees. Details of the retirement benefits received by the named executive officers are contained in the compensation tables in the section entitled “Pension Benefits.”For U.S. employees, a 401(k) Plan is available for saving towards retirement. In order to provide the opportunity to accumulate retirement income and improve retention, the Company reinstated a matching contribution (which had been suspended in recent years) to the 401(k) Plan effective as of January 1, 2011. The matching contribution was made on December 31, 2012 for eligible employees who were still employed by the Company on that date.We also maintain a deferred compensation plan for certain U.S. employees whose annual salary is in excess of $225,000 that allows them to plan their tax position through a deferral of part of their annual compensation. Messrs. Plumeri and Krauze both currently participate in this plan. The Company may also make certain contributions to the deferred compensation plan on behalf of Mr. Plumeri. As provided in his 2010 employment agreement, the Company contributes $800,000 annually on behalf of Mr. Plumeri to provide him with retirement income. The final installment of the contribution for Mr. Plumeri’s under this plan was paid on April 15, 2013, reflecting a pro-rata payment for 2013.4.0Clawback PolicyUnder the Company’s clawback policy, the Board, or any of its committees, may to the extent permitted by applicable law, cancel or require reimbursement of any incentive payments or equity-based awards received by an executive officer after December 31, 2008, if and to the extent that (i) the incentive payment or equity award was based on the achievement of Company financial results which are subsequently restated, (ii) the Compensation Committee determines that the executive officer engaged in fraud, negligence or other misconduct that contributed to the need to restate the Company’s financial results and (iii) the incentive payments or equity-based award values made to the executive officer would have been lower if the Company’s results had been properly reported. In such cases, the Company will seek to recover from the executive officer the amount by which the actual incentive payment or equity award for the relevant period exceeded the amount that the executive officer would have received based on the restated results. The Company’s clawback policy is posted on its website under Investor Relations — Corporate Governance.The Company will comply, and has modified its award agreements to so indicate, with the provisions of the Dodd-Frank Act, and will adopt a revised mandatory clawback policy that will require the Company, in the event ofa restatement, to recover from current and former executives any incentive-based compensation, for the three years preceding the restatement, that would not have been awarded under the restated financial statements. The Compensation Committee periodically reviews the Company’s clawback policy and, to ensure full compliance, will propose its final recommendations to the full Board once it has had the benefit of reviewing the SEC’s proposed and final rules for the legislation.5.0Executive Officer and Outside Director Share Ownership GuidelinesWe maintain share ownership guidelines under which executive officers and outside directors are expected to acquire a meaningful level of share ownership in the Company, so as to further align their interests with those of our shareholders. In February 2013, the Compensation Committee revised the executive officer share ownership guidelines to require them to own shares equivalent in value to a multiple of his or her base salary, as set forth below:PositionMultipleGroup CEO6.0 x base salaryExecutive Officers Leading Major Business Units and Group CFO3.0 x base salaryOther Executive Officers2.0 x base salaryExecutives are encouraged to comply with their applicable guideline as soon as practical given their individual circumstances and no later than five years from (i) March 1, 2013 (the date of the implementation of the policy (i.e., March 1, 2018)) or (ii) the date of the executive’s hiring or promotion. The failure to comply with or make reasonable progress towards meeting the share ownership guidelines in a timely fashion will result in the executive being required to retain all net shares acquired by him or her under the exercise of share options or the vesting of RSUs (net of shares surrendered for the payment of the exercise price and any taxes).For purposes of meeting the executive officer share ownership guidelines, the related value using the three-month average share price of the following shares will be counted towards achieving and maintaining compliance: shares owned outright; shares or units held in Willis broad-based share purchase plans (i.e., the ESPP, UK Sharesave); unvested RSUs and RSUs subject to time-based vesting; and unvested earned performance-based RSUs. Options and unearned performance RSUs are not counted as shares owned for purposes of the guidelines.Executives are required to retain at least 50% of the net shares received under equity award programs until the ownership guidelines are met.As discussed below under “Outside Director Compensation,” outside directors are required to hold shares equal to the lesser of 3.5 times the directors’ cash retainer of $100,000 (i.e., $350,000) or 10,000 shares.6.0Anti-Hedging PoliciesThe Company prohibits executive officers and directors from pledging any Company shares, entering into margin accounts, short selling any Company shares, selling shares “against the box” and buying or selling puts or calls relating to Company shares.7.0Share Award PolicyThe Board of Directors’ has a policy governing the granting of options and other share-based awards under the Company’s Plans.It is the Company’s policy to neither backdate option grants or other share-based awards to take advantage of a lower share price nor to schedule grants of options or other share-based awards before or after specific events to take advantage of anticipated movements in the price of our shares.It is also the Company’s policy to grant options with an exercise price no less than the closing sales price as quoted on the NYSE on the date of grant, except in the case of any sharesave sub-plans adopted by the Company for non-U.S. taxpayers outside of the U.S., for which the exercise price of the option is set at a 5% or 10% discount off the closing sales price on the date before employees are invited to participate, consistent with past practice to incent employee ownership.In addition to approving Share-based awards to executive officers, the Compensation Committee is responsible for approving the overall allocation of Share-based awards to the employees of the Company and its subsidiaries and affiliates for the forthcoming year. Implementation of the granting of such awards within the agreed annual plan is delegated to the Share Award Committee consisting of the CEO, the Group Chief Financial Officer and the Group Human Resources Director. The members of the Share Award Committee work closely with the Chairman of the Compensation Committee to ensure that, in particular, the timing of grants is appropriate.Awards may be made at a time when the Company is in possession of material non-public information, so long as the timing of the award is not motivated by an intention to improperly use any such material non-public information for the benefit of the recipient.Under this policy, annual share-based awards are authorized by the Compensation Committee and the grant date shall be the date of that meeting or a date specified by the Compensation Committee no later than 30 days following that meeting. Except as directed by the Compensation Committee, share-based awards granted in connection with a new hire, a promotion or the assignment of additional responsibilities to an existing employee or for retention purposes will be considered granted on March 5th, May 10th, August 10th, November 10th or December 5th (or if the applicable grant date is not a trading day, the next trading day) on the date most closely following the month in which such recipient’s employment or promotion or assignment of new responsibilities commenced and such retention award was approved.8.0Tax and Accounting ImplicationsThe Compensation Committee considers the anticipated tax treatment to the Company and to the executive officers in its review and establishment of compensation programs and payments. Section 162(m) imposes a limit on the amount the Company may deduct for U.S. tax purposes for compensation paid to our CEO and our three most highly compensated executive officers employed at the end of the year (other than the Chief Financial Officer). However, compensation which qualifies as “performance-based” under Section 162(m) is excluded from the limit if, among other requirements, the compensation is payable only upon the attainment of pre-established, objective performance goals under a plan approved by the Company’s shareholders.The SMIP, which was approved by shareholders at the 2005 Annual General Meeting, is intended to comply with the provisions of, and to be administered in compliance with the requirements of, Section 162(m). The Company is also authorized to grant equity awards that qualify as “performance-based” compensation under certain of the Company’s Plans.The SMIP provides for an annual incentive compensation award equal to 5% of the Company’s earnings for the fiscal year, which the Compensation Committee may reduce (but not increase) in its discretion. For this purpose, “earnings” means the Company’s operating income before taxes and extraordinary loss as reported in its audited consolidated financial statements, as adjusted to eliminate the effect of certain events specified in the SMIP. The Compensation Committee also takes other performance metrics into consideration in determining amounts payable under the SMIP (including, among other things, revenue and profit metrics), but the amounts payable under the SMIP may not exceed the amount described above. The Compensation Committee designates the executive officers who participate in the SMIP.The Compensation Committee may consider the following performance criteria when granting performance-based awards: (i) annual revenue, (ii) budget comparisons, (iii) controllable profits, (iv) EPS or Adjusted EPS, (v) expense management, (vi) improvements in capital structure, (vii) net income, (viii) net or gross sales, (ix) operating income (pre- or post-tax), (x) profit margins, (xi) operating or gross margin, (xii) profitability of an identifiable business unit or product, (xiii) return on investments, (xiv) return on sales, (xv) return on stockholders’ equity, (xvi) total return to stockholders, (xvii) assets under management, (xviii) investment management performance, (xix) mutual and other investment fund performance, (xx) cash flow, operating cash flow, or cash flow or operating cash flow per share (before or after dividends), (xxii) price of the shares or any other publicly traded securities of the Company, (xxiii) reduction in costs, (y) return on capital, including return on total capital or return on invested capital, (xiv) improvement in or attainment of expense levels or working capital levels, and (xv) performance of the Company relative to a peer group of companies and/or relevant indexes on any of the foregoing measures.Interpretations of and changes in applicable tax laws and regulations as well as other factors beyond the control of the Compensation Committee can affect deductibility of compensation and there can be no assurance that compensation paid to our executive officers who are covered by Section 162(m) will be treated as qualified performance-based compensation. Our general policy is to preserve the tax deductibility of compensation paid to the CEO and other named executive officers, including annual incentives and equity awards under the terms of the Company’s Plans. The Compensation Committee reserves the right to use its judgment to authorize compensation payments that may not be deductible when the Compensation Committee believes that such payments are appropriate and in the best interests of the Company, taking into consideration changing business conditions and the performance of its employees.The Compensation Committee will continue to monitor developments and assess alternatives for preserving the deductibility of compensation payments and benefits to the extent reasonably practicable, consistent with its compensation policies and as determined to be in the best interests of the Company and its shareholders.It is also the Company’s general policy to deliver equity-based compensation to employees in as tax-efficient a manner as possible, taking into consideration the overall cost to the Company, for which the Company accounts in accordance with FAS 123R.9.0Payments on Change of Control and TerminationHistorically, the Company has been selective in providing for potential payments relating to a change of control. The Compensation Committee may enter into such agreements when in its business judgment it believes that such payments are appropriate and in the best interests of the Company. No named executive officer is entitled to any automatic payments in connection with a change of control of the Company. However, certain equity awards held by our named executive officers vest in part or in full upon a change of control and the deferred cash awards held by our named executive officers may, in the discretion of the Compensation Committee, become payable upon a change of control. Treatment of equity awards in this manner (as opposed to cash payments that are not automatically accelerated) ensures that our executives are motivated primarily by the needs of the businesses for which they are responsible, rather than circumstances that are outside the ordinary course of business—i.e., circumstances that might lead to the termination of an executive’s employment or that might lead to a change in control of the Company. Generally, this is achieved by assuring our named executive officers that they will receive their equity awards if their employment is adversely affected in these circumstances, subject to certain conditions. We believe that these benefits help ensure that affected executives act in the best interests of our shareholders, even if such actions are otherwise contrary to their personal interests. This is critical because these are circumstances in which the actions of our named executive officers may have a material impact upon our shareholders.The Company provides severance protection to key employees in limited circumstances primarily where the employee is terminated by the Company without cause or the employee resigns for good reason. The Compensation Committee believes that severance benefits are a necessary component of a competitive compensation program and, in certain cases, are in consideration for an executive’s agreement not to compete. Messrs. Plumeri, Casserley and Hearn are also entitled to enhanced severance benefits in the event their employment is terminated by us without cause or by the executive for good reason in connection with a change of control in order to avoid any associated distractions. The Compensation Committee believes that its use of severance benefits is not significantly different from the severance benefits typically in place at other companies.Joseph Plumeri (2012 CEO)Mr. Plumeri resigned as the Company’s CEO on January 6, 2013 but will continue to serve as non-executive chairman and as an employee of Willis North America, Inc., a subsidiary of the Company through July 7, 2013.Change of control provisions were included in Mr. Plumeri’s employment agreement when he originally joined the Company. At that time, the Company was privately owned, predominantly by Kohlberg, Kravis & Roberts (“KKR”). In order to recruit an individual of the right caliber to fill the role of Chairman and CEO of the Company as then existed, and given the range of exit strategies available to KKR, it was considered appropriate at that time to include provisions in his employment agreement which provided protection in the case of a change of control.During 2009, the Compensation Committee and the Board of Directors determined that it would be in the best interests of the Company to ensure Mr. Plumeri’s continued services as the Company’s Chairman and CEO until July of 2013. In addition, Mr. Plumeri, the Compensation Committee and the Board of Directors agreed that Mr. Plumeri’s prior employment agreement should be updated to reflect the evolution of best pay practices over the last several years. At the time, two members of the Compensation Committee, Sir Roy Gardner and Mr. McCann, participated in all discussions with Mr. Plumeri regarding his employment agreement and were advised during the negotiations by the Compensation Committee’s consultant.Specifically, it was determined that the provision in Mr. Plumeri’s employment agreement allowing the executive to voluntarily terminate his employment for any reason following a change of control and receive severance payments was inconsistent with best pay practices as well as the Company’s compensation philosophy and objectives. Consequently, the amended employment agreement, which Mr. Plumeri entered into in January 2010, provided that Mr. Plumeri could no longer voluntarily terminate his employment following a “change of control” (as defined in his employment agreement) and receive severance. Instead, it provided that he is eligible to receive severance payments and benefits only if he is involuntarily terminated without “cause” or terminates employment for “good reason” (each as defined in his employment agreement). However, if Mr. Plumeri terminated his employment without “good reason” following a “change of control,” he would be credited with the amount that the Company would have contributed to his deferred compensation benefit account had he remained until the end of his contract of employment, on July 7, 2013. Further information regarding Mr. Plumeri’s employment agreement and details of the change of control and severance provisions are contained in the sections entitled “Compensation Tables — Joseph Plumeri’s Employment Agreement (2012 CEO);” “— Potential Payments to Mr. Plumeri Upon Termination or Change of Control.”Dominic Casserley (Current CEO)Under his employment agreement dated as of October 16, 2012, in the event that Mr. Casserley’s employment is terminated by the Company without “cause,” Mr. Casserley resigns for “good reason” (as such terms are defined in his employment agreement) or Mr. Casserley is terminated as a result of the non-renewal of his employment agreement by the Company within the first four years of employment (a “Qualifying Termination”), Mr. Casserley would be entitled to receive severance payments and benefits, including partial service vesting credit (but not performance-vesting credit) for his annual equity-based long-term incentive awards. In the event of a Qualifying Termination within two years following a “change of control” (as such term is defined in his employment agreement), certain of Mr. Casserley’s severance payments would be paid in a lump sum (rather than installments) and Mr. Casserley would receive full service-vesting credit (but not performance-vesting credit) for each of the annual equity-based long-term incentive awards granted to him. Lastly, upon termination of employment (other than for “cause”) concurrent with or following the expiration of the full five-year term of the agreement, Mr. Casserley would be entitled to partial service-vesting credit (but not performance-vesting credit) for each of the annual equity-based long-term incentive awards granted to him and such termination will be treated as retirement for purposes of compensation previously paid or payable to him. Further information regarding Mr. Casserley’s employment agreement and details of the change of control and severance provisions are contained in the section entitled “Compensation Tables — Dominic Casserley’s Employment Agreement (Current CEO).”Other Named Executive OfficersMichael NeborakIn order to attract Mr. Neborak as the new Group CFO, the Company agreed in his employment agreement that all of his earned and unvested RSUs and options shall immediately vest in the event of a Change of Control (as such term is defined in the applicable Plans and/or RSU agreement). In the event Mr. Neborak is involuntarily terminated without “cause” (as such term is defined in his employment agreement) he is eligible to receive severance payments. Mr. Neborak has also entered into a restrictive covenant agreement with the Company that provides, in part, that we may require that Mr. Neborak refrain from working for, engaging or generally having a financial interest in certain of our competitors after the termination of his employment, in exchange for providing severance payments and continued healthcare coverage to him during such non-compete period.Stephen HearnAt the same time the Board appointed Mr. Casserley as the Company’s new CEO, it promoted Mr. Hearn to the new role of Deputy CEO. Mr. Hearn has been employed by the Company for almost four years and in January 2012 was promoted to Chairman and CEO of Willis Global, encompassing the Company’s global reinsurance, placement and specialty, operations. The Board believes the combination of Mr. Casserley’s external perspective and broad global experience and Mr. Hearn’s internal perspective and deep industry experience is a powerful partnership to drive the Company’s strategic direction.On October 16, 2012, in connection with this promotion to Deputy CEO, Mr. Hearn entered into an amended employment agreement which became effective on January 1, 2013. Under the amended contract, in the event that Mr. Hearn’s employment is terminated without “cause” or Mr. Hearn resigns for “good reason” (as such terms are defined in his employment agreement), Mr. Hearn would be entitled to receive severance payments and benefits including partial acceleration of his long-term incentive awards. In the event that Mr. Hearn’s employment is terminated without “cause” or Mr. Hearn resigns for “good reason” within two years following a “change in control” (as such term is defined in his employment agreement), Mr. Hearn would be entitled to receive an enhanced severance payment.Timothy WrightOn July 19, 2012, Mr. Wright entered into an amendment to his employment agreement which provides that in the event Mr. Wright is terminated by the Company for any reason other than for “cause” (as such term is defined in his amendment), he will be entitled to receive a severance payment.Victor KrauzeIn order to retain the services of Mr. Krauze during the transition from Mr. Plumeri to Mr. Casserley as the Group’s CEO, on October 16, 2012, a Company subsidiary entered into an amendment to Mr. Krauze’s April 8, 2011 promotion letter. Under the amendment, Mr. Krauze is eligible for enhanced severance payments and benefits if before December 31, 2013, he is involuntarily terminated by the Company other than for “good cause” (as such term is defined in the amendment to his promotion letter) or he resigns for “good reason”. “Good reason” in the amendment to his employment agreement means, (i) a material diminution in status, position, authority or duties which in Mr. Krauze’s reasonable judgment is materially inconsistent with and has a material adverse impact on his status, position, authority or duties, (ii) beginning on April 2, 2013 and ending on December 31, 2013, Mr. Krauze’s dissatisfaction with the strategy, policies or operating procedures adopted by Mr. Casserley and (iii) other events constituting good reason. Further, Mr. Krauze’s employment agreement provides that we may require that Mr. Krauze refrain from undertaking any activity deemed to be in competition with the Company for a period of up to 12 months following termination of employment in exchange for monthly payments equivalent to his base salary and continued healthcare coverage to him during the non-compete period. Such payments may be reduced by the amount of any other post-employment payments paid to Mr. Krauze.Further information regarding Messrs. Neborak, Hearn, Wright and Krauze’s employment agreements and Mr. Neborak’s and Mr. Krauze’s restrictive covenant agreements and details of the applicable termination provisions are contained in the sections entitled “Compensation Tables — Other Named Executive Officers’ Employment Agreements” and “— Potential Payments to Other Named Executive Officers Other than the CEO Upon Termination or Change of Control.”COMPENSATION COMMITTEE REPORTThis report is submitted to the shareholders of Willis Group Holdings Public Limited Company by the Compensation Committee of the Board of Directors. The Compensation Committee consists solely of non-executive directors who are independent, as determined by the Board in accordance with the Company’s guidelines and NYSE listing standards.The Compensation Committee has reviewed, and discussed with management, the Compensation Discussion and Analysis contained in this Amendment to the Annual Report on Form 10-K, and based on this review and discussion, recommended to the Board that it be included in this Amendment to the Annual Report on Form 10-K.Submitted by the Compensation Committee of the Board of DirectorsWendy E. Lane (Chairman), Jeffrey B. Lane and James F. McCann.COMPENSATION COMMITTEE INTERLOCKS AND INSIDER PARTICIPATIONNone of our executive officers serves as a member of the Board of Directors or compensation committee of any entity that has one or more of its executive officers serving as a member of the Compensation Committee. In addition, none of our executive officers serves as a member of the compensation committee of any entity that has one or more of its executive officers serving as a member of our Board of Directors.COMPENSATION TABLESSummary Compensation TableThe following table sets forth the total compensation earned for services rendered in 2012 by the Company’s former CEO, Mr. Joseph Plumeri (who resigned as CEO on January 6, 2013 and will retire as Chairman of the Board on July 7, 2013), the Group CFO and each of the three most highly compensated executive officers of the Company.
Position Year Salary
($) Bonus
($)(1) Share
Awards($)(2) Option
Awards
($)(2) Non-Equity
Incentive Plan
Compensation(3) Change in
Pension Value
and
Nonqualified
Deferred
Compensation
Earnings
($)(4) All Other
Compensation
($)(5) Total
($)
Former 2012 CEO 2012 1,000,000 — 6,911,420 — 905,963 (17,281 ) 1,016,660 9,834,043 2011 1,000,000 — 8,539,014 — 729,166 10,164 1,197,933 11,476,277 2010 1,000,000 — 8,106,213 — 2,031,250 (21,461 ) 974,584 12,090,586
Group CFO 2012 575,000 528,000 749,955 249,993 — — 5,000 2,107,948 2011 500,000 450,000 — 182,891 281,250 — 4,167 1,418,308 2010 244,318 500,000 500,007 — — — — 1,244,325
Deputy CEO; CEO & Chairman Willis Global 2012 792,500 1,291,775 1,879,742 549,994 — — 95,100 4,609,111
CEO, Willis International 2012 792,500 1,228,375 1,124,965 374,993 — — 33,085 3,553,918
CEO & Chairman, Willis North America 2012 681,250 910,000 899,979 299,993 — 257,453 23,230 2,814,452 2011 625,000 750,000 1,037,750 243,851 375,000 134,232 9,971 3,175,554 (1)The Bonus column reflects only that portion of the annual incentive compensation award paid in cash to the named executive officers for services rendered for the relevant fiscal year. Because any RSUs or option awards granted as part of an annual compensation award are granted in March of the year following the one in which services are rendered, these equity awards are reflected in the Share Awards and Option Awards columns for the next year. In 2012, all named executive officers were paid 100% of their annual incentive compensation in cash. In 2010 and 2011, Mr. Plumeri’s annual incentive compensation award was paid 50% in cash and 50% in RSUs. Due to the nature of Mr. Plumeri’s employment agreement, his annual incentive compensation is reflected in the column “Non-Equity Incentive Plan Compensation” discussed in footnote (3) below.(2)The Share Awards and Option Awards columns include any RSUs or option awards granted in the recently completed fiscal year as part of an annual incentive compensation award for services rendered in the preceding year as well as any other equity awards made during the course of the relevant fiscal year. The actual earned awards are set forth in the footnotes to the “Grant of Plan-Based Awards” table.For awards subject to performance conditions, the amount included in the table is the full fair value at the grant date based on the probable outcome with respect to the satisfaction of the performance condition consistent with the recognition criteria in FASB ASC Topic 718 (excluding the effect of estimated forfeiture). For more information regarding the equity awards, see the “Grant of Plan-Based Awards” table and the “Outstanding Equity Awards at Fiscal Year End” table.(3)For 2012, the Non-Equity Incentive Plan column reflects the annual incentive compensation award paid 100% in cash to Mr. Plumeri.(4)The US Pension share was closed to new hires on January 1, 2007 and frozen on May 15, 2009. The Willis Pension Scheme (UK) was closed to new members beginning on January 1, 2006.The Change in Pension Value and Nonqualified Deferred Compensation Earnings column includes the aggregate earnings Mr. Plumeri receives under the non-qualified deferred compensation plan, which for 2012 was ($25,741), reflecting investment earnings of $801 offset by Social Security and Medicare taxes totaling $26,542. The Change in Pension Value of $8,460 reflects changes in valuation assumptions required by applicable accounting rules and actuarial standards and a one-year increase in the executive’s age.(5)For 2012, the All Other Compensation column for the named executive officers consisted of:a.For Mr. Plumeri, (i) a deferred compensation credit of $800,000 pursuant to the terms of his previous employment agreement, which he receives for each year he continues to be with the Company and which is paid into a non-qualified deferred compensation plan on his behalf, after the payment of Social Security and Medicare taxes, (ii) the $200,000 Hart–Scott–Rodino Antitrust report filing fee and associated legal fees described in the “Compensation Discussion and Analysis” section and (iii) car charges.b.For Mr. Neborak, the Company’s contribution to his 401(k) Plan.c.For Mr. Hearn, the Company’s contribution to his defined contribution plan.d.For Mr. Wright, contributions to a personal pension arrangement set up by Mr. Wright for his own personal benefit. The Company has no ongoing role in the governance or management of the plan and no residual liabilities in respect of it. The contributions made by the Company to the Willis Stakeholder Pension Scheme in respect of Mr. Wright includes $11,621 in lieu of entitlement to a car allowance.e.For Mr. Krauze, (i) $18,230 tax-gross up for the 2010 calendar year to which he was entitled before his employment contract was amended to eliminate such tax gross-ups and (ii) the Company’s contribution to his defined contribution plan.(6)Messrs. Hearn and Wright receive their salaries and bonuses in pounds sterling and the above figures have been converted into dollars at the average exchange rate for 2012 (£1:$1.585).Grant of Plan-Based AwardsThe following table sets forth the grants of plan-based awards made to the named executive officers during 2012. Estimated
Future
Payouts
Under
Non-
Equity
Incentive
Plan
Awards Estimated
Future
Payouts
Under
Equity
Incentive
Plan
Awards All
Other
Stock
Awards:
Number
of Shares
of Stocks
or Units
(#) All Other
Awards
Number
of
Securities
Underlying
Options
(#) Exercise
or Base
Price of
Option
Awards
($/Share) Grant Date
Fair
Value
of Stock
and
Option
Awards
($) Grant
Date Approval
Date Threshold
($) Target
($) Maximum
($) Threshold
(#) Target
(#) Maximum
(#) — (1) — 1,250,000 1,875,000 2,500,000 — — — — — — — 3/1/12 (2) 2/7/12 — — — — — — 25,783 — — 911,429 5/7/12 (3) 4/24/12 — — — 66,079 165,198 165,198 — — — 5,999,991 12/26/12 (4) 12/10/12 — — — — — — — 34,059 33.54 249,993 12/26/12 (5) 12/10/12 — — — 5,963 14,907 14,907 — — — 499,981 12/26/12 (6) 12/10/12 — — — — — — 7,453 — — 249,974 3/1/12 (7) 2/7/12 — — — — — — 6,500 — — 229,775 12/26/12 (4) 12/10/12 — — — — — — — 74,931 33.54 549,994 12/26/12 (5) 12/10/12 — — — 13,118 32,796 32,796 — — — 1,099,978 12/26/12 (6) 12/10/12 — — — — — — 16,398 — — 549,989 12/26/12 (4) 12/10/12 — — — — — — — 40,871 33.54 299,993 12/26/12 (5) 12/10/12 — — — 7,156 17,889 17,889 — — — 599,997 12/26/12 (6) 12/10/12 — — — — — — 8,944 — — 299,982 12/26/12 (4) 12/10/12 — — — — — — — 51,089 33.54 374,993 12/26/12 (5) 12/10/12 — — — 8,944 22,361 22,361 — — — 749,988 12/26/12 (6) 12/10/12 — — — — — — 11,180 — — 374,977 (1)Pursuant to Mr. Plumeri’s employment agreement, it was originally intended that Mr. Plumeri would receive his 2012 annual incentive compensation 50% in cash and 50% in RSUs, as in prior years. The amounts above represent the target, threshold and maximum cash amounts Mr. Plumeri may receive under his employment agreement. In March 2012, Mr. Plumeri and the Compensation Committee agreed to reduce his target payout to 250% of his base salary if 100% of his performance targets were achieved. As a result of Mr. Plumeri’s resignation as CEO in January 2013, the Compensation Committee determined to pay the 2012 annual incentive compensation 100% in cash. The actual cash amount paid to Mr. Plumeri for his 2012 annual incentive compensation is included in the Non-Equity Incentive Plan Column of the “Summary Compensation” table.(2)As part of Mr. Plumeri’s 2011 annual incentive compensation, time-based RSUs were granted on March 1, 2012 and will vest and settle on July 7, 2013. Dividend equivalents will be paid when the RSUs vest equal to the dividend rate applicable to all record holders on record dates falling between the time of grant and the time of vest.(3)Under Mr. Plumeri’s employment agreement, performance-based RSUs were granted on May 7, 2012, 50% of which were earned if an Adjusted EPS target for 2012 was met and 50% of the award was earned if an Adjusted Operating Margin target for 2012 was met. If the targets were not achieved at 100%, the amount of the award would be reduced on a sliding scale basis. The target and maximum amounts above reflect both the Adjusted EPS and Adjusted Operating Margins hitting at 100%. The threshold amounts reflect the minimum amount that would be earned if performance conditions were met for only one of the two applicable metrics (i.e., if 90% of either the Adjusted Operating Margin or Adjusted EPS target were met, then 80% of the performance-based RSUs as to the applicable Adjusted Operating Margin or Adjusted EPS target will become earned).Based on the applicable performance metrics described in the “Compensation Discussion and Analysis — Long Term Incentive Compensation,” 145,374 of the performance-based RSUs were earned. These earned RSUs will vest and settle on July 7, 2013.(4)Time-based options were granted on December 26, 2012 under the 2012 LTI Program. The options will vest 50% on each of the second and third anniversaries of the grant date.(5)Performance-based RSUs were granted on December 26, 2012 under the 2012 LTI Program, 50% of which were earned if an Adjusted EPS target for 2012 was met and 50% of the award was earned if an Adjusted Operating Margin target for 2012 was met. If the targets were not achieved at 100%, the amount of the award would be reduced on a sliding scale basis. The target and maximum amounts above reflect both the Adjusted EPS and Adjusted Operating Margins hitting at 100%. The threshold amounts reflect the minimum amount that would be earned if performance conditions were met for only one of the two applicable metrics (i.e., if 90% of either the Adjusted Operating Margin or Adjusted EPS target were met, then 80% of the performance-based RSUs as to the applicable Adjusted Operating Margin or Adjusted EPS target will become earned).Based on the applicable performance metrics described in the “Compensation Discussion and Analysis—Named Executive Officers’ Annual Compensation — Long Term Incentive Compensation,” the following performance-based RSUs were earned: Mr. Neborak (13,119), Mr. Hearn (28,860), Mr. Krauze (15,743) and Mr. Wright (19,677). Earned RSUs will vest 50% on each of the second and third anniversaries of the grant date.(6)Time-based RSUs were granted on December 26, 2012 under the 2012 LTI Program. The RSUs will vest 50% on each of the second and third anniversaries of the grant date.(7)Time-based RSUs were granted on March 1, 2012. The RSUs will vest 33%, 33% and 34% on the first, second and third anniversaries of the grant date, respectively.Outstanding Equity Awards at Fiscal Year EndThe following table sets forth the options and share-based awards held by the named executive officers as of December 31, 2012. Number of
Securities
Underlying
Unexercised
Options (#)
Exercisable Number of
Securities
Underlying
Unexercised
Options (#)
Unexercisable Equity
Incentive
Plan
Awards:
Number of
Securities
Underlying
Unexercised
Unearned
Options (#) Option
Exercise
Price Option
Expiration
Date Number of
Shares or
Units of
Stock
That Have
Not
Vested (#) Market
Value of
Shares or
Units of
Stock That
Have Not
Vested
($)(1) Equity
Incentive
Plan
Awards:
Number of
Unearned
Shares,
Units or
Other
Rights
That Have
Not
Vested(#) Equity
Incentive
Plan
Awards:
Market or
Payout
Value of
Unearned
Shares,
Units or
Other
Rights
That Have
Not Vested
(#)(1) 100,000 (2) — — 38.06 3/19/2014 — — — — 500,000 (3) — — 32.78 6/20/2014 — — — — 650,000 (4) — — 37.06 5/6/2015 — — — — — — — — — 25,783 (5) 864,504 — — 57,388 (6) 1,924,220 — — — — — — — 66,200 (7) 2,219,686 — — — — — — — — — 165,198 (8) 5,539,089 — 16,234 (9) — 41.51 5/2/2019 — — — — — 34,059 (10) — 33.54 12/26/2020 — — — — — — — — — 2,719 (11) 91,168 — — — — — — — 2,719 (12) 91,168 — — — — — — — 7,453 (13) 249,899 — — — — — — — — — 14,907 (14) 499,832 6,249 2,083 (15) — 25.79 11/3/15 — — — — — 16,234 (9) — 41.51 5/2/2019 — — — — — 74,931 (10) — 33.54 12/26/2020 — — — — — — — — — 3,400 (16) 114,002 — — — — — — — 6,500 (17) 217,945 — — — — — — — 16,398 (13) 549,825 — — — — — — — — — 32,796 (14) 1,099,650 5,000 (18) — — 30.75 7/1/2013 — — — — 25,000 (19) — — 38.06 3/19/2014 — — — — 26 (20) — — 36.60 9/22/2014 — — — — 50,000 (21) — — 32.78 6/20/2014 — — — — 50,000 (22) — — 39.96 11/5/2015 — — — — 12,499 4,167 (23) — 37.06 5/6/2015 — — — — 20,000 20,000 (24) — 26.17 5/5/2017 — — — — 12,500 37,500 (25) — 31.02 10/1/2018 — — — — — 21,645 (9) — 41.51 5/2/2019 — — — — — 40,871 (10) — 33.54 12/26/2020 — — — — — — — — — 16,750 (26) 561,628 — — — — — — — 8,944 (13) 299,892 — — — — — — — — — 17,889 (14) 599,818 200,000 (27) — — 34.42 9/1/2016 — — — — 20,832 6,943 (28) — 34.42 9/1/2015 — — — — 50,000 50,000 (24) — 26.17 5/5/2017 — — — — — 21,645 (9) — 41.51 5/2/2019 — — — — — 51,089 (10) — 33.54 12/26/2020 — — — — — — — — — 11,180 (13) 374,865 — — — — — — — — — 22,361 (14) 749,764 (1)The market value of shares or units that have not vested has been calculated using the closing price of the Company’s shares on December 31, 2012, as quoted on the NYSE ($33.53), the last business day of the year.(2)Time-based options were granted on March 19, 2004 and are fully exercisable.(3)Time-based options were granted on June 20, 2006 and are fully exercisable.(4)Performance-based options were granted on May 6, 2008 and are fully exercisable.(5)Time-based RSUs were granted on March 1, 2012 and will vest and settle on July 7, 2013.(6)Performance-based RSUs were granted on May 3, 2010. The RSUs will vest 33 1/3% on the first, second and third anniversaries of the grant date and will settle on July 7, 2013.(7)Performance-based RSUs were granted on May 5, 2011. The RSUs will vest 50% on each of the first and second anniversaries of the grant date and will settle on July 7, 2013.(8)Performance-based RSUs were granted on May 7, 2012, 50% of which are earned if an Adjusted EPS target for 2012 is met and 50% of which are earned if an Adjusted Operating Margin target for 2012 is met. If the targets are not achieved at 100%, the amount of the award is reduced on a sliding scale basis. Earned RSUs will vest and settle on July 7, 2013. Based on the applicable performance metrics described in the “Compensation Discussion and Analysis — Named Executive Officers’ Annual Compensation — Long Term Incentive Compensation,” 145,374 of the performance-based RSUs were earned.(9)Performance-based options were granted on May 2, 2011. The options will vest 50% on each of the third and fourth anniversaries of the grant date.(10)Time-based options were granted on December 26, 2012. The options will vest 50% on each of the second and third anniversaries of the grant date.(11)Time-based RSUs were granted on August 2, 2010. The RSUs will vest 33%, 33% and 34% on the first, second and third anniversaries of the grant date, respectively.(12)Performance-based RSUs were granted on August 2, 2010. The RSUs will vest 33%, 33% and 34% on the first, second and third anniversaries of the grant date, respectively.(13)Time-based RSUs were granted on December 26, 2012. The RSUs will vest 50% on each of the second and third anniversaries of the grant date.(14)Performance-based RSUs were granted on December 26, 2012, 50% of which are earned if an Adjusted EPS target for 2012 is met and 50% of which are earned if an Adjusted Operating Margin target for 2012 is met. If the targets are not achieved at 100%, the amount of the award is reduced on a sliding scale basis. Earned RSUs will vest 50% on each of the second and third anniversaries of the grant date. Based on the applicable performance metrics described in the “Compensation Discussion and Analysis — Named Executive Officers’ Annual Compensation — Long Term Incentive Compensation,” the following performance-based RSUs were earned: Mr. Neborak (13,119), Mr. Hearn (28,860), Mr. Krauze (15,743) and Mr. Wright (19,677).(15)Performance-based options were granted on November 3, 2008. The options will become exercisable 50%, 25% and 25% on the third, fourth and fifth anniversaries of the grant date, respectively.(16)Performance-based RSUs were granted on July 1, 2010. The RSUs will vest 33%, 33% and 34% on the first, second and third anniversaries of the grant date, respectively.(17)Time-based RSUs were granted on March 1, 2012. The RSUs will vest 33%, 33% and 34% on the first, second and third anniversaries of the grant date, respectively.(18)Time-based options were granted on July 1, 2003 and are fully exercisable.(19)Time-based options were granted on March 19, 2004 and are fully exercisable.(20)Time-based options were granted on September 22, 2004 and are fully exercisable.(21)Time-based options were granted on June 20, 2006 and are fully exercisable.(22)Time-based options were granted on November 5, 2007 and are fully exercisable.(23)Performance-based options were granted on May 6, 2008. The options will become exercisable 50%, 25% and 25% on the third, fourth and fifth anniversaries of the grant date, respectively.(24)Performance-based options were granted on May 5, 2009. The options will become exercisable 25% on each of the second, third, fourth and fifth anniversaries of the grant date.(25)Performance-based options were granted on October 1, 2010. The options will become exercisable 25% on each of the second, third, fourth and fifth anniversaries.(26)Time-based RSUs were granted on May 2, 2011. The RSUs will vest 33%, 33% and 34% on the first, second and third anniversaries of the grant date, respectively.(27)Time-based options were granted on September 1, 2008 and are fully exercisable.(28)Performance-based options were granted on September 1, 2008. The options will become exercisable 50% on the third anniversary of the grant date and 25% on each of the fourth and fifth anniversaries of the grant date.Option Exercises and Shares VestedThe following table sets forth the share options exercised and the RSU vestings during 2012 by the named executive officers. Option Awards Share-Based Awards Number of
Shares
Acquired on
Exercise
(#) Value
Realized on
Exercise
($) Number of
Shares
Acquired On
Vesting
(#) Value
Realized On
Vesting
($)(1) — — 191,591 (2) 6,968,136 — — 5,276 181,442 — — 3,300 120,417 — — 13,600 493,408 — — 12,500 454,573 (1)The value realized in respect of vested RSUs is calculated using the closing price, as quoted on the NYSE, on the date of such RSUs vesting. If a vesting occurred on non-business day, the closing price on the previous business day was used.(2)Pursuant to the terms of an existing agreement, the settlement of 66,201 RSUs that vested on May 2, 2012, 57,390 RSUs that vested on May 3, 2012 and 68,000 RSUs that vested on May 5, 2012 has been deferred until Mr. Plumeri incurs a separation from service as defined in Section 409A of the Internal Revenue Code.Pension BenefitsWillis North America Inc. Pension Plan — The Company maintains a US retirement program, the Willis North America Inc. Pension Plan, a qualified defined benefits plan. This plan provides members with a pension on normal retirement age of 60 or 65 based on the length of service, pensionable remuneration and when they first joined the plan. Participants are 100% vested in the plan after completing five years of service. Employees also become 100% vested if they are participants in the plan and are employed by Company after reaching age 60. The plan was closed to new hires on January 1, 2007 and was frozen on May 15, 2009.If participants are vested and married, their surviving spouses may be entitled to survivor benefits from the plan, if the participants die before starting retirement benefits. The default death benefit is the survivor portion of a 50% Joint & Survivor annuity commencing at an early or normal retirement date. If participants are active with 10 or more years of service, the death benefit is 50% of the accrued benefit and commences immediately. If participants are age 55 with 10 or more years of service, they may elect an enhanced survivor benefit.As of December 31, 2012, Mr. Plumeri had approximately 12 years of vesting service. The accrued annual benefit for Mr. Plumeri, payable as a normal-form annuity beginning on January 1, 2013, is $56,184 (Mr. Plumeri is over 65). At this retirement age, the years of vesting service and annual maximum average salary for Mr. Plumeri are approximately 11 years and $202,000, respectively.As of December 31, 2012, Mr. Krauze had approximately 16 years of vesting service. The accrued annual benefit for Mr. Krauze, payable as a normal-form annuity beginning at age 65 is $62,043. At a retirement age of 65, the years of vesting service and annual maximum average salary for Mr. Krauze are approximately 28 years and $201,001, respectively. Mr. Krauze can retire early with an unreduced accrued benefit as of February 1, 2022, assuming he remains employed to that date.Also, Willis North America, Inc. has a 401(k) Plan covering its eligible employees and those of its subsidiaries. Shares are available as an investment option to participants in the Willis 401(k) Retirement Savings Plan. In order to provide the opportunity to accumulate retirement income and improve retention, the Company has reinstated a matching contribution (which was suspended in recent years) to the 401(k) Plan effective as of January 1, 2011. The matching contribution was made on December 31, 2012 for eligible employees who were still employed by the Company on that date.Willis Pension Scheme (UK) — The Company also maintains a U.K. retirement program consisting of the Willis Pension Scheme, an approved defined benefits plan. The Willis Pension Scheme (UK) was closed to new members beginning on January 1, 2006. In 2006, it was replaced by a defined contribution plan for new employees. The Willis Pension Scheme (UK) provides members with a pension of up to two thirds of pensionable remuneration on normal retirement age. Normal retirement age is 65 for all benefits accruing after July 1, 2011. Some rights earned before July 1, 2011 can be drawn at the age of 60 on a reduced basis. Members accrue pension at a rate of 1/50th or 1/60thof pensionable remuneration, depending on grade and when they first joined the Willis Pension Scheme (UK), in each case subject to a maximum of two-thirds of pensionable remuneration on retirement. Other members may have different accrual rates due to individual circumstances, such as continuation of existing benefits on joining. Members contribute 10% of their pensionable remuneration.Pensionable remuneration is based on full basic salary less an offset in respect of the U.K. State Pension, currently £5,587, in the case of most members. In addition, pensionable remuneration for members who joined the Scheme after June 1, 1989, is subject to a cap, currently £137,400. On death, pensions based on one half of the members’ pensions are payable to a surviving spouse.Mr. Hearn and Mr. Wright do not participate in the Willis Pension Scheme because they joined the Company after 2006. Mr. Hearn participates in the Willis UK defined contribution plan and the Willis Stakeholder Pension Scheme, which is a series of individual investment policies established in the names of members and administered by a third party to which the Company contributes. The contributions made by the Company to the Willis Stakeholder Pension Scheme in respect of Mr. Hearn are made at the rate of 12% of basic salary in line with a contractual arrangement transferred from an acquired employer and exceed the standard rates payable to most other associates. Mr. Wright established a personal pension arrangement similar to the Willis UK defined contribution plan to which the Company contributes. The Company has no ongoing role in the governance or management of Mr. Wright’s plan and no residual liabilities in respect of it.Rest of World — Elsewhere, pension benefits for our employees are typically provided in the country of operation through defined contribution plans.The following table sets forth the retirement benefits that may be received by the named executive officers that participate in a defined benefit pension scheme: Number
of Years
Credited
Service
(#) Present
Value of
Accumulated
Benefit
($’000) Payments
During
Last Fiscal
Year
($) Willis North America Inc. Pension Plan 12 634 — Willis North America Inc. Pension Plan 16 597 — Non-Qualified Deferred CompensationThe following table sets forth the non-qualified deferred compensation to be received by Mr. Plumeri (the Company’s 2012 CEO) and Mr. Krauze. None of the other named executive officers receives deferred compensation. Executive
Contributions
in Last Fiscal
Year
($) Registrant
Contributions
in Last Fiscal
Year
($) Aggregate
Earnings in
Last Fiscal
Year
($) Aggregate
Withdrawals/
Distributions
($) Aggregate
Balance at
Last Fiscal
Year End
($) 800,000 (1) — (25,741 )(2) — 8,290,384 — — 175,040 — 1,270,796 (1)Effective from October 15, 2003, Mr. Plumeri has received an annual deferred compensation credit of $800,000, which is made to a non-qualified deferred compensation plan on his behalf. Actual payments into the plan are made after deducting Social Security and Medicare Taxes from the $800,000 annual credit.(2)Aggregate earnings are included in Mr. Plumeri’s Change in Pension Value in the “Summary Compensation” table. For 2012, investment earnings of $801 were offset by Social Security and Medicare taxes totaling $26,542.Joseph Plumeri’s Employment Agreement (2012 CEO)During 2009, the Compensation Committee and the Board of Directors determined that it would be in the best interests of the Company to ensure Mr. Plumeri’s continued services as the Company’s Chairman and CEO until July of 2013. In addition, Mr. Plumeri, the Compensation Committee and the Board of Directors agreed that Mr. Plumeri’s prior employment agreement should be updated to reflect the evolution of best pay practices over the last several years. At the time, two members of the Compensation Committee, Sir Roy Gardner and Mr. McCann, participated in all discussions with Mr. Plumeri regarding his employment agreement and were advised during the negotiations by the Compensation Committee’s consultant.On January 6, 2013 Mr. Plumeri resigned as the Group CEO but will continue to serve as non-executive chairman and as an employee of Willis North America, Inc., a subsidiary of the Company. Until his retirement as non-executive chairman and an employee of Willis North America, Inc. on July 7, 2013, all of the terms of Mr. Plumeri’s existing employment agreement dated as of January 1, 2010, will remain in effect, except as amended on October 16, 2012 to reflect his duties, responsibilities and reduced time commitment to the Company as non-executive chairman beginning on January 7, 2013. The rationale for the new arrangements with Mr. Plumeri was to facilitate a seamless transition with the Company’s new CEO, particularly in light of Mr. Plumeri’s long tenure, deep industry knowledge and relationships. The amendment to Mr. Plumeri’s employment agreement also satisfied the requirements for his retirement or earlier resignation to constitute a “mutual retirement” for purposes of Mr. Plumeri’s unvested RSU awards and, as a result, upon Mr. Plumeri’s retirement or his earlier resignation the service requirements for Mr. Plumeri’s RSU awards will be waived.Under his employment agreement, Mr. Plumeri’s annual base salary of $1,000,000 until his retirement date on July 7, 2013, which has not increased since he joined Willis in October 2000, will be maintained. Similarly, Mr. Plumeri will be eligible to receive a pro-rata annual incentive compensation award for 2013, subject to the achievement of performance targets to be determined by the Compensation Committee. Unlike previous awards, which were generally paid 50% in cash and 50% in RSUs, Mr. Plumeri’s 2012 award and the pro-rata award for 2013 will be paid 100% in cash. Mr. Plumeri’s employment agreement provides that the threshold, target and maximum annual incentive payout percentages for 2012 and 2013 are 250%, 375% and 500% of base salary. Mr. Plumeri will also continue to receive a pro rata portion of the same annual deferred compensation credit of $800,000, the last installment of which was contributed on April 15, 2013, subject to his continued employment.In consideration for Mr. Plumeri complying with best pay practices when he amended his agreement in January 2010, at the time the Compensation Committee and Board provided that he would receive a grant of RSUs in 2010 that would vest only upon the achievement of performance and time-based criteria to be determined by the Compensation Committee. The agreement provided that the RSUs would have a grant date value of $6,000,000 and would vest in equal parts over a three-year period. At the time of the execution of the 2010 employment agreement, it was the expectation and intent of the Compensation Committee to award Mr. Plumeri grants of comparable value and containing comparable terms in 2011 and 2012, subject to the Compensation Committee’s good faith evaluation of changes in circumstances of the Company, the performance of the Company and the performance of Mr. Plumeri that justifies as an alternative vehicle or amount of grant. Accordingly, a similar $6,000,000 grant of performance-based RSUs was made in 2011 and 2012. Mr. Plumeri will not be entitled to receive a Long-Term Incentive award during 2013.The employment agreement also contains non-competition, non-solicitation and confidentiality covenants.Further information regarding the change of control and severance provisions in Mr. Plumeri’s employment agreement are contained in the section entitled “Compensation Tables—Potential Payments to Mr. Plumeri Upon Termination or Change of Control.”Dominic Casserley’s Employment Agreement (Current CEO)In negotiating the agreement with Mr. Casserley, the Company considered, among other things, the Company’s peer group compensation, current market practice regarding CEO pay, ISS and shareholder concerns, pay-for-performance concerns, the Committee’s policy to limit the grants of guaranteed compensation, internal executive compensation practices and the opportunity to split the roles of Chairman of the Board and CEO. These considerations were balanced with the fact that the Company needed to provide competitive pay to attract a high caliber candidate.On October 16, 2012, Mr. Casserley executed an employment agreement with a subsidiary of the Company. The employment agreement has an initial term ending on December 31, 2015 and will automatically renew for up to two additionalone-year renewal terms, unless either party provides notice of nonrenewal at least 90 days prior to the end of the initial term or first renewal term, as applicable. Upon a “change of control” (as such term is defined in his employment agreement) the term will automatically extend until and expire upon the second anniversary of the “change of control” or, if later, December 31, 2015. Mr. Casserley’s agreement provides for him to be paid, beginning as of his commencement of employment with the Company on January 7, 2013: (i) an annual base salary of $1,000,000, (ii) an annual incentive award with a target value of 225% of his base salary (i.e., $2,250,000), a maximum value of 400% of his base salary (i.e., $4,000,000), and a lesser value for below target performance as may be established by the Board or the Compensation Committee, such annual incentive compensation awards described in further detail below, (iii) an annual equity-based long-term incentive award of 525% of base salary (i.e., $5,250,000) at target, and upon such other terms and conditions as may be established by the Board or the Compensation Committee for officers generally, (iv) reimbursement of his and his family’s relocation costs to the New York metropolitan area from London, England and, following his termination of employment with the Company other than for “cause” (as such term is defined in his employment agreement), his and his family’s return to the London metropolitan area, (v) employee benefits as are provided generally to other similarly-situated senior management employees of the Company, the use of a car and driver at his principal office location and the use of private aircraft owned or leased by the Company for business travel in accordance with the Company’s policy, and (vi) an employment commencement transition award of $1,500,000 to be paid after the completion of one year of service (i.e., January 7, 2014), 50% of which is subject to repayment if Mr. Casserley resigns without “good reason” (as such term is defined in his employment agreement) prior to the completion of two years of service.With respect to Mr. Casserley’s annual incentive award, if Mr. Casserley is entitled to an annual incentive award exceeding $1,000,000 in respect of the Company’s 2013 fiscal year, then the first $1,000,000 will be paid in cash and any amounts exceeding $1,000,000 up to $2,500,000 will be paid in the form of equity-based awards, with one-third being immediately vested by reason of his completion of one year of service and the remainder subject to vesting on the second and third anniversaries of Mr. Casserley’s employment commencement date if Mr. Casserley is employed by the Company on each of the anniversary dates. One-half of such equity-based awards will be in the form of options to purchase ordinary shares of the Company, and one-half of such equity-based awards will be in the form of RSUs.In the event that Mr. Casserley’s employment is terminated by the Company without “cause,” Mr. Casserley resigns for “good reason” or Mr. Casserley is terminated as a result of the non-renewal of his employment agreement by the Company within the first four years of employment (a “Qualifying Termination”), Mr. Casserley would be entitled to the following benefits: (i) an amount equal to two times the sum of his annual base salary and target annual incentive award, payable in installments over 24 months (the “Severance Payment”), (ii) a pro-rata portion of his annual incentive award for the year in which the termination of employment occurs, based on actual performance, payable at the same time that annual incentive compensation awards are payable generally, (iii) payment of the employment commencement transition award described above, to the extent unpaid, (iv) continued medical coverage at the active employee rate for Mr. Casserley, his spouse and then covered dependents for up to 18 months, (v) two years of service-vesting credit (but not performance-vesting credit) for one half of the annual equity-based long-term incentive awards granted to him during the first three years of service, (vi) one year of service-vesting credit (but not performance-vesting credit) for the remainder of the annual equity-based long-term incentive awards granted to him, (vii) each vested stock option held by Mr. Casserley will remain exercisable for three years following the termination date or, if earlier, the normal expiration date of the stock option, and (viii) accrued benefits including any annual incentive compensation awards earned but unpaid for any completed fiscal year. For purposes of determining the service-vesting credit described above each annual equity-based long-term incentive award will be deemed to have been granted not later than April 30th of the year of grant and vest at a rate not greater less than 1/3rd per year on each of the first three anniversaries of the date of grant.In the event of a Qualifying Termination within two years following a “change of control,” Mr. Casserley would be entitled to the severance benefits described above except that the Severance Payment would be paid in a lump sum and Mr. Casserley would receive full service-vesting credit (but not performance-vesting credit) for each of the annual equity-based long-term incentive awards granted to him.Lastly, upon termination of employment (other than for “cause”) concurrent with or following the expiration of the full five year term of his employment agreement, Mr. Casserley would be entitled to the following benefits: (i) two years of service-vesting credit (but not performance-vesting credit) for each of the annual equity-based long-term incentive awards granted to him, (ii) each vested stock option held by Mr. Casserley will remain exercisable for three years following the termination date or, if earlier, the normal expiration date of the stock option and (iii) such termination will be treated as retirement for purposes of compensation previously paid or payable to him. As described above, for purposes of determining the service-vesting credit described above each annual equity-based long-term incentive award will be deemed to have been granted no later than April 30th of the year of grant and vest at a rate not greater less than 1/3rd per year on each of the first three anniversaries of the date of grant.The agreement also contains non-competition, non-solicitation and confidentiality covenants.Other Named Executive Officers’ Employment AgreementsEach of the other named executive officers’ have an employment agreement with a subsidiary of the Company. The material economic terms of such agreements are described below. Each of the agreements also contains non-competition, non-solicitation and confidentiality covenants.Further information regarding the change of control and severance provisions in Messrs. Neborak, Hearn, Wright and Krauze’s employment and restrictive covenant agreements are contained in the section entitled “Compensation Tables—Potential Payments to Other Named Executive Officers Other than the CEO Upon Termination or Change of Control.”Michael NeborakMr. Neborak’s employment agreement effective as of July 6, 2010 provides for an annual base salary of $500,000, which the Committee increased to $600,000 based on the results of a market review, and an annual incentive award with a target value equal to 100% of his base salary. The employment agreement does not have a fixed term. In the event Mr. Neborak is terminated without “cause,” he will receive severance pay equal to 12 months of base salary. The Company has also entered into a separate restrictive covenant agreement with Mr. Neborak effective as of August 2, 2010, which provides, in part, that we may require that Mr. Neborak refrain from undertaking any activity deemed to be in competition with the Company for a period of up to 12 months following termination of employment, in exchange for monthly payments equivalent to his base salary and the provision of continued medical coverage during such period.Stephen HearnUnder Mr. Hearn’s employment agreement that remained in effect until December 31, 2012, he was entitled to (i) an annual base salary of £500,000 (or $792,500) and (ii) an annual incentive compensation award with a target value of 175% of his base salary, provided that his annual incentive compensation award in respect of the Company’s 2012 fiscal year to be no less than 150% of his base salary. Pursuant to this agreement, in 2012, Mr. Hearn also received 6,500 time-based RSUs as a result of his promotion to Chairman and CEO of Willis Global in early 2012. Pursuant to this agreement, if Mr. Hearn was terminated by the Company for any reason other than for Cause (as defined in such employment agreement), he was entitled to receive an amount equal to his contractual notice pay due to him (i.e., 12 months base salary) and an amount equal to his target annual incentive compensation award at the time of his termination.At the same time the Board appointed Mr. Casserley as the Company’s new CEO, it promoted Mr. Hearn to the new role of Deputy CEO. Mr. Hearn has been employed by the Company for almost four years and in January 2012 was promoted to Chairman and CEO of Willis Global, encompassing the Company’s global reinsurance, placement and specialty, operations. The Board believes the combination of Mr. Casserley’s external perspective and broad global experience and Mr. Hearn’s internal perspective and deep industry experience is a powerful partnership to drive the Company’s strategic direction.In connection with his promotion to Deputy CEO, on October 16, 2012, Mr. Hearn entered into an amended employment agreement which, when it became effective on January 1, 2013, provides (i) an annual base salary of £530,000 ($840,050), (ii) an annual incentive award with a target value of 200% of his base salary (subject to his prior employment agreement that provided for his annual incentive award in respect of the Company’s 2012 fiscal year to be no less than 150% of his base salary), and (iii) an annual long-term incentive award of 260% of his base salary at target. The employment agreement does not have a fixed term. Pursuant to Mr. Hearn’s amended employment agreement, if Mr. Hearn’s employment is terminated by the Company without Cause or by the executive for Good Reason, he would be entitled to: (i) an amount equal to 150% of the sum of his annual base salary and target annual incentive award, which amount will be offset against any pay provided during the 12-month notice period set forth in the employment agreement or any pay in lieu of notice and will be payable in a lump sum, (ii) a pro-rata portion of his annual incentive award for the year in which the termination of employment occurs, based on actual performance, payable at the same time that annual incentive compensation awards are payable generally, (iii) any annual incentive compensation awards earned but unpaid for any prior fiscal year, and (iv) continuation of group medical coverage at the same rate that is applicable to active senior executive officers.Timothy WrightMr. Wright’s employment agreement, dated as of December 17, 2007 and as amended July 19, 2012, provides that Mr. Wright, who originally joined the Company as the Group Chief Operating Officer and currently serves as the CEO of Willis International, is entitled to an annual base salary of £405,000 (or $641,925) and an annual incentive award with a target value equal to 175% of his base salary. As a result of an increase in his responsibilities related to his promotion to CEO of Willis International, Mr. Wright received an increase in his annual base salary to £500,000 (or $792,500). The employment agreement does not have a fixed term. In the event Mr. Wright’s employment is terminated without “Cause” (as defined in his employment agreement), he will receive severance pay equal to the sum of his annual base salary and target annual incentive compensation award at the time he is served with notice of termination.Victor KrauzeMr. Krauze’s employment agreement, effective as of December 3, 2010, and promotion letter, dated as of April 8, 2011, provide for a base salary of $625,000 which the Committee increased to $700,000 in response to market conditions. The Company may terminate his employment agreement at any time by providing him 30, days’ prior written notice. In the event he is terminated without “good cause” (as defined in the promotion letter), he will receive severance pay equal to 12 months of base salary, an amount equal to 12 months of COBRA medical coverage premiums and, on or before March 15, 2013, any AIP award for the 2012 performance period. Further, the agreements provide that if we desire Mr. Krauze to refrain from undertaking any activity deemed to be in competition with the Company for a period of up to 12 months following termination of employment, the Company will make monthly payments equivalent to his base salary. Such payments may be reduced by the amount of any other post-employment payments paid to Mr. Krauze, including any severance payments paid to him in connection with a termination without Good Cause.In order to retain the services of Mr. Krauze during the transition from Mr. Plumeri to Mr. Casserley as the Company’s CEO, on October 16, 2012, a Company subsidiary entered into an amendment to Mr. Krauze’s April 8, 2011 promotion letter. Pursuant to the amendment, Mr. Krauze is eligible for enhanced severance payments and benefits if before December 31, 2013, he is involuntarily terminated by the Company other than for “good cause” or he resigns for “good reason.” The employment agreement does not have a fixed term.Potential Payments to Mr. Plumeri Upon Termination or Change of ControlThe following table shows the estimated payments and benefits that our CEO would have received if his employment had terminated or a Change of Control (defined below) occurred on December 31, 2012. Severance
($) Deferred
Compensation
($) Accrued
Amounts
($)(4) Total
Payments on
Termination
($) Intrinsic
Value of
Unvested
Share-Based
Awards
($)(5) 4,000,000 8,705,727 1,031,762 13,737,489 10,545,990 9,500,000 8,705,727 1,031,762 19,237,489 10,545,990 — 8,705,727 1,031,762 9,737,489 10,545,990 — — — — 10,545,990 (1)Mr. Plumeri’s employment agreement provided that if he was terminated by the Company without Cause or by himself for Good Reason he would be entitled to a lump sum payment equal to $4,000,000 in addition to any accrued benefits. The accrued benefits included: unpaid salary and vacation pay; any bonus due as a result of actual performance but not yet paid for any completed financial year; a pro rata bonus for the year in which the termination occurs based on the performance achieved in that year; amounts due under medical, life insurance, disability and pension plans; and reimbursable business expenses.He would also have credited to his deferred compensation benefit account the amounts he would have received had he remained until the end of the term of his employment agreement (July 7, 2013). On departure, the full amount accrued under the deferred compensation plan would become payable.Further, the RSUs granted to Mr. Plumeri on May 3, 2010, May 2, 2011 and March 1, 2012 would vest in full and the service requirements for the RSUs granted to Mr. Plumeri on May 7, 2012 would be waived.The table above shows the amount Mr. Plumeri would have received had termination taken place on December 31, 2012, and assuming the Board has exercised its discretion to waive the performance requirements applicable to the RSUs granted to Mr. Plumeri on May 7, 2012.(2)Mr. Plumeri’s employment agreement provided that in the event the Company was subject to a Change of Control and Mr. Plumeri’s employment was terminated by the Company (or a successor company) without Cause or by himself for Good Reason within six months prior to or within 24 months following such Change of Control, Mr. Plumeri would receive a payment equal to two times the sum of his base salary and target annual bonus during the year in which the termination of employment occurs. Mr. Plumeri would have also continued to be entitled to receive the accrued benefits described in (1) above and he would have credited to his deferred compensation benefit account the amounts he would have received had he remained until the end of the term of his employment agreement (July 7, 2013). On departure, the full amount accrued under the deferred compensation plan would become payable.Further, in the event the Company was subject to a Change of Control and Mr. Plumeri’s employment was terminated by the Company without Cause or by him for Good Reason, the RSUs granted to Mr. Plumeri on May 3, 2010, May 2, 2011, March 1, 2012 and May 7, 2012 would vest in full.The table above shows the amount Mr. Plumeri would have received had termination taken place on December 31, 2012 by reason of Change of Control, including the value of Mr. Plumeri’s unvested RSUs.(3)Where the employment was terminated by the Company for any reason other than as described in (1) and (2) above, including Disability, mutual retirement and retirement, Mr. Plumeri would be entitled to receive the accrued benefits as described in (1) above including the right to receive the full amount accrued under the deferred compensation plan, provided that in the event of a termination for Cause the executive would not be entitled to a pro-rata bonus. Pursuant to Mr. Plumeri’s amended employment agreement, if he terminated his employment without Good Reason following a Change of Control, he would have credited to his deferred compensation benefit account the amounts he would have received had he remained until the end of the term of his employment agreement (July 7, 2013). On departure the full amount accrued under the deferred compensation plan would become payable.In the event Mr. Plumeri’s termination was due to death, Disability or mutual retirement, the RSUs granted to Mr. Plumeri on May 3, 2010, May 2, 2011 and March 1, 2012 would vest in full and the service requirements for the RSUs granted to Mr. Plumeri on May 7, 2012 would be waived.The table above shows the amount Mr. Plumeri would have received had termination taken place on December 31, 2012 for any reason other than described in (1) and (2) above, except for Cause, and assuming the Board exercised its discretion to waive the performance requirements applicable to the RSUs granted to Mr. Plumeri on May 7, 2012.(4)It has been assumed for this calculation that the Board, through the Compensation Committee, would have determined that Mr. Plumeri be paid a cash award in an amount equal to his full 2012 annual incentive award. The above amount reflects the actual cash amount paid to Mr. Plumeri for his 2012 annual incentive compensation as reflected in the Non-Equity Incentive Plan Column of the “Summary Compensation” table.(5)In addition to the above, it had been agreed that Mr. Plumeri would still retain the benefit of the Company’s directors and officers insurance relating to his services for the period up to and including his date of departure where termination of employment was without Cause or for Good Reason or Change of Control. Also, under the U.S. Pension Plan, in the event of termination of employment for any of the above reasons, Mr. Plumeri would receive the same benefit as other plan participants terminated for similar reasons. For more information please see “Executive Compensation — Compensation Discussion and Analysis — Pension Benefits.”(6)The occurrence of a Change of Control would not trigger any cash payments to Mr. Plumeri, however, the performance requirements applicable to Mr. Plumeri’s RSUs, to the extent not already achieved, would be waived. In addition, upon a Change of Control, the Board would have had discretion to waive the service requirements applicable to Mr. Plumeri’s RSU awards. For the purpose of this section, it has been assumed that such discretion had been exercised.(7)The terms “Cause,” “Good Reason,” “Disability,” “mutual retirement,” and “retirement” are used as defined in Mr. Plumeri’s employment agreement. The term “Cause” includes, among other things, conviction of a felony, willful and continuous disregard for, or serious or persistent breach of material duties and responsibilities, gross negligence or any other form of gross misconduct. The term “Good Reason” includes, among other things, any material diminution of duties, responsibilities or authority, or the assignment to Mr. Plumeri of any duties materially inconsistent with his position or any material breach of his contract of employment by the Company.“Change of Control” is defined in Mr. Plumeri’s agreement as:(a)the acquisition of ownership, directly or indirectly, beneficially or of record, by any Person or group (within the meaning of Securities Exchange Act of 1934 and the rules of the SEC thereunder as in effect on the date hereof), of equity interests representing more than 30% of the aggregate ordinary voting power represented by the issued and outstanding equity interests of the Company;(b)occupation of a majority of the seats (other than vacant seats) on the Board of Directors of the Company by Persons who were neither (i) nominated by the Board of Directors of the Company nor (ii) appointed by directors so nominated; provided a Person shall not be deemed so nominated or appointed if such nomination or appointment is the result of a proxy contest or a threatened proxy contest;(c)the failure of the Company to own, directly or indirectly, at least 50% of the aggregate ordinary voting power represented by the issued and outstanding equity interests of Willis North America, Inc. (or the successor entity owning all or substantially all of the assets previously owned by Willis North America, Inc. if such assets are transferred);(d)a merger, consolidation or other corporate transaction of the Company (a “Transaction”) such that the shareholders of the Company immediately prior to such Transaction do not own more than 50 percent of the aggregate ordinary voting power of the surviving entity (or its parent) immediately after such Transaction in approximately the same proportion to each other as immediately prior to the Transaction;(e)the sale of all or substantially all of the assets of the Company; or(f)approval by the Company’s shareholders of a plan of liquidation or dissolution of the Company.Mr. Plumeri’s employment agreement further provided that the definition of “Change of Control” may be narrowed in some circumstances, to the extent necessary to comply with Section 409A of the Internal Revenue Code.Potential Payments to Named Executive Officers other than Mr. Plumeri Upon Termination or Change of ControlThe following table sets forth the estimated payments and benefits our named executive officers other than the CEO would have received assuming the named executive officer was terminated or a change of control occurred on December 31, 2012. Severance
($) Value of
Unvested
Deferred
Cash
Awards
($) Total
Payments on
Termination
($) Welfare/
Other
($) Intrinsic
Value of
Unvested
Share-
Based
Awards
($)(1) 600,000 562,500 1,162,500 17,628 932,067 600,000 562,500 1,162,500 17,628 932,067 600,000 562,500 1,162,500 17,628 932,067 — 562,500 562,500 — 932,067 2,153,125 562,500 2,715,625 — 1,997,544 2,153,125 562,500 2,715,625 — 1,997,544 — 562,500 562,500 — 1,997,544 — 562,500 562,500 — 1,997,544 2,071,875 750,000 2,821,875 — 1,492,630 2,071,875 750,000 2,821,875 — 1,492,630 — 750,000 750,000 — 1,492,630 — 750,000 750,000 — 1,492,630 1,610,000 2,020,796 3,630,796 12,653 1,702,663 1,610,000 2,020,796 3,630,796 12,653 1,702,663 700,000 2,020,796 2,720,796 12,653 1,702,663 — 2,020,796 2,020,796 — 1,702,663 (1)Mr. Krauze entered into an amendment to his promotion letter dated October 16, 2012 which provides that in the event Mr. Krauze’s employment is terminated by the Company without Good Cause or by the executive for Good Reason prior to December 31, 2013, all earned and outstanding equity and long-term incentive awards granted to him through calendar year 2012 will vest in full. “Good Cause” is defined as (i) gross neglect of duties, (ii) conviction of a felony, (iii) dishonesty, embezzlement, or fraud by the executive in connection with his employment, (iv) the issuance of any final order for the executive’s removal as an associate of the Company by any state or federal regulatory agency, (v) material willful breach of the “Confidential Information and Work for Hire” or “Employee Loyalty, Non-competition and Non-solicitation” provisions in the executive’s employment agreement, (vi) any material breach of the Company’s Code of Ethics, or (vii) failure to maintain any insurance or other license necessary to the performance of the executive’s duties. “Good Reason” is defined as (i) a material diminution in status, position, authority or duties which in Mr. Krauze’s reasonable judgment is materially inconsistent with and has a material adverse impact on his status, position, authority or duties, (ii) a material reduction in base salary, (iii) a material breach by the Company of any material provision in Mr. Krause’s employment agreement or promotion letter and (iv) beginning on April 2, 2013 and ending on December 31, 2013, Mr. Krauze’s dissatisfaction with the strategy, policies or operating procedures adopted by the then CEO of the Company.Mr. Hearn’s employment agreement that was in effect on December 31, 2012 did not provide for the acceleration of his equity or long-term incentive awards upon a termination of employment for any reason. However, Mr. Hearn entered into an amended employment agreement on October 16, 2012 that was effective on January 1, 2013 which provides that in the event Mr. Hearn’s employment is terminated by the Company without Cause or by the executive for Good Reason, any options, restricted shares, deferred cash or other long term incentive awards due to vest during the twelve month period following the termination date will vest on the termination date. “Cause” is defined as (i) gross and or chronic neglect of duties, (ii) conviction of an offence involving moral turpitude, (iii) dishonesty, embezzlement, fraud or other material willful misconduct in connection with employment, (iv) the issuance of any final order for removal as an associate or officer of the Company by any regulatory authority, (v) violation of any obligation or confidence, fiduciary duty, duty of loyalty or other material obligation owed to the Company in any employment or other agreement with the Company or implied as common law, (vi) material breach of the Company’s code of ethics, or (vii) failure to maintain any insurance or license necessary for the performance of duties to the Company. “Good Reason” is defined as (i) a reduction in base salary or a material adverse reduction in benefits (other than (a) in the case of base salary a reduction offset by an increase in bonus opportunity upon the attainment of reasonable performance goals or (b) a general reduction in compensation or benefits affecting a broad group of employees), (ii) a material adverse reduction in principal duties and responsibilities or (iii) a significant transfer away from his primary service area or primary workplace other than as permitted by existing service contracts.The Board may, in its discretion, accelerate each of the unvested option, RSU and deferred cash awards held by Messrs. Neborak, Hearn and Wright upon a termination of employment by the Company without cause.For purposes of this section, it has been assumed that the Company has exercised its discretion to fully vest the option, RSU and deferred cash awards (at the target level of achievement) held by Messrs. Neborak, Hearn and Wright. The table above shows the intrinsic value of all unvested option, RSU and deferred cash awards held by the executives as of December 31, 2012.(2)Mr. Neborak entered into an employment agreement with the Company dated July 6, 2010. The agreement provides that in the event his employment is terminated by the Company without Cause, the executive will receive severance pay equal to 12 months of base salary. “Cause” is defined as (i) gross and or chronic neglect of duties, (ii) conviction of a felony or misdemeanor involving moral turpitude, (iii) material willful dishonesty, embezzlement, fraud or other material willful misconduct in connection with employment, (iv) the issuance of any final order for removal as an associate of the Company by any state or federal regulatory agency, (v) violation of the restrictive covenant provisions in an employment agreement or other agreement with the Company, (vi) material breach of any material duty owed to the Company, including, without limitation the duty of loyalty, (vii) material breach of any other material obligations under an employment or other agreement with the Company, (viii) material breach of the Company’s code of ethics, (ix) failure to achieve reasonable performance goals as specified by the Company or (x) failure to maintain any insurance or license necessary for the performance of duties to the Company.Mr. Krauze entered into an amendment to his promotion letter dated October 16, 2012 which provides that in the event Mr. Krauze’s employment is terminated by the Company without Good Cause or by the executive for Good Reason (each as defined in footnote 1 above) prior to December 31, 2013, the executive will receive (i) 12 months of base salary and medical benefit continuation, (ii) payment of his annual incentive award for the 2012 fiscal year, subject to the achievement of the performance goals established by the Compensation Committee and (iii) a waiver of the repayment obligations applicable to his cash retention awards.Mr. Hearn’s employment agreement that was in effect on December 31, 2012 provided that if Mr. Hearn was terminated by the Company for any reason other than for Cause (as defined in footnote 1 above), he was entitled to receive an amount equal to his contractual notice pay due to him (i.e., 12 months base salary) and an amount equal to his target annual incentive compensation award at the time of his termination. Mr. Hearn entered into an amended employment agreement on October 16, 2012 that was effective on January 1, 2013 which provides that in the event Mr. Hearn’s employment is terminated by the Company without Cause or by the executive for Good Reason, he would be entitled to: (i) an amount equal to 150% of the sum of his annual base salary and target annual incentive award, which amount will be offset against any pay provided during the 12-month notice period set forth in the employment agreement or any pay in lieu of notice and will be payable in a lump sum, (ii) a pro-rata portion of his annual incentive award for the year in which the termination of employment occurs, based on actual performance, payable at the same time that annual incentive compensation awards are payable generally, (iii) any annual incentive compensation awards earned but unpaid for any prior fiscal year, and (iv) continuation of group medical coverage at the same rate that is applicable to active senior executive officers.Mr. Wright entered into an amendment to his employment agreement dated July 19, 2012 which provides that in the event he is terminated by the Company for any reason other than for Cause (as defined in footnote 1 above with respect to Mr. Hearn), he will be entitled to receive an amount equal to the sum of his annual base salary and target annual incentive compensation award at the time he is served with notice of termination, which amount will be offset against any pay provided during the six-month notice period set forth in the employment agreement or any pay in lieu of notice and will be payable in a lump sum.(3)The occurrence of a Change of Control will not trigger any automatic cash payments to Messrs. Neborak, Krauze, Hearn and Wright however, pursuant to his amended employment agreement that was effective on January 1, 2013, upon a termination of employment by the Company without Cause within two years following a Change of Control, Mr. Hearn is entitled to an enhanced severance payment. The enhanced severance payment is equal to 200% (rather than 150%) of the sum of his annual base salary and target annual incentive award, which amount will be offset against any pay provided during the 12-month notice period set forth in his employment agreement or any pay in lieu of notice. Further, the deferred cash awards held by the executives may, in the discretion of the Compensation Committee, vest and become payable. Further, as described below, certain option and RSU awards held by the executives will vest.The amounts payable to Messrs. Neborak, Krauze, Hearn and Wright in respect of termination of employment on December 31, 2012 in connection with a Change of Control would be calculated on the same basis described inTermination by the Company without Cause above.Mr. Neborak’s employment agreement provides that in the event of Change of Control all of his RSUs and options will immediately vest in full.The option award granted to Mr. Krauze on May 6, 2008, the option award granted to Mr. Hearn on November 3, 2008 and the performance-based option award granted to Mr. Wright on September 1, 2008 automatically vest in full upon the occurrence of a Change of Control pursuant to the Company’s 2008 Plan, to the extent such awards are not assumed or substituted. In the event those option awards are assumed or substituted, such options generally vest in full upon a participant’s termination of employment occurring within 24 months following the Change of Control.All other RSU and option awards may vest upon the occurrence of a Change of Control, in the sole discretion of the Board.For purposes of the option, RSU and deferred cash awards, “Change of Control” is defined as (i) the acquisition of ownership, directly or indirectly, beneficially or of record, by any person or group (within the meaning of the Exchange Act and the rules of the SEC thereunder as in effect on the date hereof) of the ordinary shares of the Company representing more than 50% of the aggregate voting power represented by the issued and outstanding ordinary shares of the Company; or (ii) occupation of a majority of the seats (other than vacant seats) on the Board of the Company by persons who were neither (a) nominated by the Company’s Board nor (b) appointed by directors so nominated.For purposes of Mr. Hearn’s amended employment agreement “Change of Control” is defined as: (i) the acquisition of ownership, directly or indirectly, beneficially or of record, by any person or group (within the meaning of the Exchange Act and the rules of the SEC thereunder as in effect on the date hereof) of equity interests representing more than thirty (30%) of the aggregate voting power represented by the issued and outstanding equity interests of the Company; occupation of a majority of the seats (other than vacant seats) on the Board of the Company by persons who were neither (a) nominated by the Company’s Board nor (b) appointed by directors so nominated; (iii) a merger, consolidation or other corporate transaction of the Company such that shareholders of the Company immediately prior to such transaction do not own more than fifty percent (50%) of the aggregate ordinary voting power of the surviving entity (or its parent) immediately after such transaction in approximately the same proportion to each other as immediately prior to the transaction; or (iv) the sale of all or substantially all of the assets of the Company.For purposes of this section it has been assumed that the Company has exercised its discretion to fully vest the option, RSU and deferred cash awards (at the target level of achievement) held by Mr. Neborak, Krauze, Hearn and Wright to the extent that such awards do not automatically vest in full. The table above shows the intrinsic value of all unvested option, RSU and deferred cash awards held by the executives as of December 31, 2012.(4)The unvested option, RSU and deferred cash awards held by Messrs. Neborak, Krauze, Hearn and Wright each vest in full upon a termination of employment due to death or permanent disability;provided, that, performance-based option and deferred cash awards only vest to the extent that performance targets have been achieved on the date of termination of employment. In addition, the Board, in its sole discretion, may accelerate the vesting of all option, RSU and deferred cash awards upon a termination of employment due to retirement.For purposes of this section it has been assumed that the Company has exercised its discretion to fully vest the option, RSU and deferred cash awards (at the target level of achievement) held by Messrs. Neborak, Krauze, Hearn and Wright to the extent that such awards do not automatically vest in full. The table above shows the intrinsic value of all unvested option, RSU and deferred cash awards held by the executives as of December 31, 2012.(5)Mr. Neborak entered into restrictive covenant agreements with the Company, effective on August 2, 2010. The agreement provides, in part, that for a period of 12 months directly following his termination of employment for any reason the executive must refrain from working for, engaging or generally having a financial interest in certain of the Company’s competitors. During the non-compete period the Company is obligated to make payments to the officer equal to the base salary payments the executive would have received if he had remained in the Company’s employ during such period. In addition, the Company is required to pay for the cost of the officer’s medical coverage during the non-compete period. The Company may elect to shorten the non-competition period for Mr. Neborak, in which case the Company would only be obligated to provide the officer with the base salary payments and medical benefits described above during the shortened non-compete period.Mr. Krauze’s employment agreement and promotion letter similarly provide that for a period of up to 12 months directly following Mr. Krauze’s termination of employment for any reason the executive must refrain from working for, engaging or generally having a financial interest in certain of the Company’s competitors. During the non-compete period the Company is obligated to make payments to Mr. Krauze equal to the base salary payments the executive would have received if he had remained in the Company’s employ during such period. In addition, the Company is required to pay for the cost of the officer’s medical coverage during the non-compete period. Such payments may be reduced by the amount of any other post—employment payments paid to Mr. Krauze, including any severance payments paid to him in connection with a termination without Good Cause or for Good Reason (each as defined in footnote 2 above). Further, the Company may elect to shorten the non-competition period, in which case the Company would only be obligated to provide Mr. Krauze with the base salary payments described in this footnote 5 during the shortened non-compete period.The table above shows the payments the officer would have received had a termination of employment taken place on December 31, 2012, assuming that payments and benefits were provided for the full 12 month non-compete period.(6)The occurrence of a Change of Control will not trigger any automatic cash payments to Messrs. Neborak, Krauze, Hearn and Wright. However, as described inTermination by the Company on Change of Control above, certain option and RSU awards held by the executives automatically vest in full upon the occurrence of a Change of Control and the deferred cash and all other option and RSU awards held by the executives may vest upon the occurrence of a Change of Control, in the sole discretion of the Board.For the purpose of this section, it has been assumed that the Company has exercised its discretion to fully vest the option, RSU and deferred cash awards (at the target level of achievement) held by Messrs. Neborak, Krauze, Hearn and Wright to the extent that such awards do not automatically vest in full. The table above shows the intrinsic value of all unvested option, RSU and deferred cash awards held by the executives as of December 31, 2012.(7)Messrs. Hearn and Wright receive their salaries and annual incentive compensation awards in pounds sterling. The dollar figures shown have been calculated at the exchange rate as at December 31, 2012 (£1: $1.625).Compensation Risk AnalysisIn the first quarter of 2010, at the Compensation Committee’s request, its independent Compensation Consultant at the time, Frederick W. Cook & Co., worked with management to conduct a risk assessment of the Company’s compensation programs. This assessment included an inventory of incentive compensation plans then in place at the Company, a review of the design and features of the Company’s compensation programs with key members of management responsible for such programs and an assessment of program design and features relative to compensation risk factors.With assistance from the Company’s Director of Risk, Frederick W. Cook & Co., also reviewed the Company’s risk profile and related risk management processes and the findings of the compensation risk assessment to determine if any material risks were deemed to be likely to arise from the Company’s compensation policies and programs and to determine whether these risks would be reasonably likely to have a material adverse effect on its business. The determination, which was reviewed and affirmed by management and the Compensation Committee, was that the Company’s pay plans and policies were not reasonably likely to have a material adverse effect on the Company. In the first quarter of 2011, this conclusion was reaffirmed.In 2012 and 2013, at the request of the Compensation Committee, Towers Watson (its current independent Compensation Consultant) reviewed the risk assessment conducted by the previous Compensation Consultant and confirmed that the methodology used in that assessment remained valid. Towers Watson has worked with Willis to review its compensation programs and to determine if they had materially changed from the time of the initial risk assessment. As a result of this review, Towers Watson found that the only material change that had occurred was the removal in 2012 of the repayment obligation required under certain cash retention awards under Willis’ annual incentive programs. However, Towers Watson concluded that this action did not pose additional compensation risk because the repayment feature originally had been added to address retention risk versus organizational risk. Accordingly, Towers Watson determined that the 2010 risk assessment findings remain applicable. The Compensation Committee reviewed and affirmed this determination and further commissioned a full risk review of the Company’s compensation programs in 2014.Outside Director CompensationIn 2012, all outside directors (i.e., all directors other than Mr. Plumeri), received an annual cash retainer fee of $100,000. In addition, (i) the Chairman of the Compensation Committee, the Chairman of the Governance Committee and the Chairman of the Risk Committee each received an annual cash fee of $20,000; (ii) the Chairman of the Audit Committee received an annual cash fee of $30,000; and (iii) the other members of the Audit Committee received an annual cash fee of $10,000. The Presiding Independent Director received an annual cash fee of $35,000. In 2012, the Board also authorized a one-time special cash fee of $30,000 for each of Senator Bradley, Wendy E. Lane and James McCann, as members of a CEO Search Committee, for their efforts in selecting a new CEO.In addition, as part of their annual compensation, each non-employee director who is elected at the Company’s Annual General Meeting of Shareholders also receives time-based equity equivalent in value to $100,000 (based on the closing price of the Company’s shares as quoted on the NYSE on the date of grant) that vest in full on the one-year anniversary of the grant date. On May 7, 2012, the non-employee directors received 2,753 RSUs that will vest in full on May 7, 2013.In 2013, the Board also approved an annual fee for the Non-Executive Chairman of the Board of $150,000 payable 50% in equity and 50% in cash, provided that the Non-Executive Chairman may elect to receive the fee 100% in stock.Outside directors are subject to share ownership guidelines that require them to hold Company shares equal to the lesser of 3.5 times the directors’ cash retainer of $100,000 (i.e., $350,000) or 10,000 shares. Incumbent directors must comply by 2016 (i.e., five years of adoption of the guidelines). Ordinary shares, deferred shares, share equivalents, RSUs and restricted shares count toward satisfying the guidelines, but options to purchase shares do not. Each director is prohibited from transferring these shares until six months after he or she leaves Board service (other than to satisfy tax obligations on the vesting/distribution of existing equity awards), but is permitted to transfer any shares in excess of this amount. In the event an outside director has not acquired this threshold of shares, he or she is prohibited from transferring any Company shares (other than to satisfy tax obligations on the vesting/distribution of existing equity awards). In the case of financial hardship, the ownership guidelines would be waived until the hardship no longer applies or such appropriate time as the Compensation Committee determines. All directors currently satisfy the guidelines.Sir Jeremy Hanley receives an additional annual fee of £50,000 for serving on the board of directors of Willis Limited, the Company’s principal insurance broking subsidiary outside of the USA. He has sat on the Willis Limited board of directors since March 12, 2008 and he also serves on the Willis Limited board of directors’ audit committee.The following table sets forth cash and other compensation paid or accrued to the non-employee directors of the Company during 2012. Fees
Earned
or Paid
in Cash
($) Option
Awards
($) Share
Awards
($)(1) All Other
Compensation
($)(2) Total
($) 192,065 — 99,989 — 292,054 100,000 — 99,989 39,548 239,537 100,000 — 99,989 — 199,989 120,000 — 99,989 — 219,989 110,000 — 99,989 — 209,989 110,000 — 99,989 97,034 307,023 100,000 — 99,989 — 199,989 160,000 — 99,989 — 259,989 141,359 — 99,989 8,531 249,879 130,000 — 99,989 51,740 281,729 100,000 — 99,989 — 199,989 (1)Each of the directors received 2,753 RSUs on May 7, 2012 which will vest in full on May 7, 2013 (other than Senator Bradley whose RSUs were forfeited upon his resignation from the Board). The value shown is the full fair value as at the date of grant.(2)In connection with the Company’s redomicile to Ireland, the Company agreed to indemnify any director in the event they may need to pay additional taxes as a result of the redomicile. The above amounts reflect the gross-up payment made to the non-employee directors in 2012 in connection with taxes paid by them for the 2011 fiscal year and, in the case of Mr. McCann, the 2010 fiscal year. The Company also hired Ernst & Young in Dublin, Ireland to prepare the directors’ Irish 2012 tax returns which is expected to be less than $50,000 in the aggregate.(3)The above fees reflect Senator Bradley’s role as the Presiding Independent Director and Chairman of the Governance Committee. He resigned from both positions effective as of October 17, 2012 and resigned from the Board effective as of November 1, 2012. The fees include the one-time special fee approved by the Board of $30,000 for his efforts in selecting a new Group CEO. They also include his 2011 $35,000 fee for serving as the Presiding Independent Director. He originally waived receipt of this fee but subsequently accepted it in 2012.(4)The above fees reflect Sir Roy Gardner’s role as the Chairman of the Risk Committee.(5)The above fees reflect Sir Jeremy Hanley’s role as a member of the Audit Committee. As noted above, he also receives an annual cash fee of £50,000 in connection with his service as a director on the Willis Limited board of directors.(6)The above fees reflect Ms. Kravit’s role as a member of the Audit Committee.(7)The above fees reflect Ms. Lane’s role as the Chairman of the Compensation Committee and a member of the Audit Committee. The fees also include the one-time special fee approved by the Board of $30,000 for her efforts in selecting a new Group CEO.(8)The above fees reflect Mr. McCann’s role as Presiding Independent Director and Chairman of the Governance Committee. He was appointed to these positions effective October 17, 2012. They also include the one-time special fee approved by the Board of $30,000 for his efforts in selecting a new Group CEO.(9)The above fees reflect Mr. Roberts’ role as the Chairman of the Audit Committee.As of December 31, 2012, the non-employee directors owned the following options to purchase shares and RSUs (which include any RSUs, the settlement of which has been deferred): Mr. Califano held 5,942 RSUs; Ms. Catalano held 30,000 options and 4,114 RSUs; Sir Roy Gardner held 30,000 options and 2,753 RSUs; Sir Jeremy Hanley held 30,000 options and 5,942 RSUs; Ms. Kravit held 4,114 RSUs; Mr. Lane held 2,753 RSUs; Ms. Lane held 2,753 RSUs; Mr. McCann held 4,114 RSUs; Mr. Roberts held 5,942 RSUs; and Mr. Somers held 2,753 RSUs.In addition to the foregoing options, 30,000 options held by Mr. Califano, 30,000 options held by Ms. Lane, 30,000 options held by Mr. McCann and 30,000 options held by Mr. Roberts, have been amended such that they will receive the intrinsic value in cash upon exercise rather than receive shares upon payment of the exercise price.For more information regarding the number of shares beneficially owned by each director as of April 24, 2013, see Item 12, “Security Ownership of Certain Beneficial Owners and Management and Related Stockholder Matters.”Securities Authorized for Issuance Under Equity Compensation Plansfollowing table provides information asrequired by this Item with respect to security ownership of December 31, 2012, about thecertain beneficial owners and management equity and securities authorized for issuance under our equity compensation plans and is categorized according to whether or not the equity plan was previously approved by shareholders: Number of
Shares to be
Issued Upon
Exercise of
Outstanding
Options,
Warrants
and Rights Weighted
Average
Exercise
Price of
Outstanding
Options,
Warrants
and
Rights (1) Number of
Shares
Remaining
Available for
Future
Issuance 18,761,121 (2) 32.76 11,228,595 (3) 433,566 (4) 27.08 690,521 (5) 19,194,687 32.67 11,919,116 (1)The weighted-average exercise price set forth in this column is calculated excluding RSUs or other awards for which recipients are not required to pay an exercise price to receive the shares subject to the awards.(2)Includes options and RSUs outstanding under the 2001, 2008 and 2012 Plan.(3)Represents shares available for issuance pursuant to awards that may be granted under the 2012 Plan (10,551,524 shares) and the 2010 North American Employee Stock Purchase Plan (677,071 shares).(4)Includes options and RSUs outstanding under the following plans that were assumed by Willis in connection with the acquisition by Willis of Hilb, Rogal & Hobbs: the 2000 HRH Plan and the 2007 HRH Plan. No future awards will be granted under the 2000 HRH Plan. The above amounts do not include an aggregate of 120,000 options held by certain non-employee directors pursuant to which they will receive the intrinsic value in cash rather than shares upon exercise of the options.(5)Represents shares that remain available for issuance under the 2007 HRH Plan. Willis is authorized to grant awards under the 2007 HRH Plan until 2017 to employees who were formerly employed by Hilb, Rogal & Hobbs and to new employees who have joined Willis or one of its subsidiaries since October 1, 2008, the date that the acquisition of Hilb, Rogal & Hobbs was completed.Security Ownership of Certain Beneficial Owners and ManagementThe following tables show the number of shares beneficially owned, as of April 24, 2013:By each entity which is known to beneficially own 5% or more of our outstanding shares,By each of our current directors and director nominees,By each named executive officer listed in the 2012 Summary Compensation Table andBy each of our current directors, director nominees and executive officers as group.The amounts and percentages of our shares beneficially owned are reportedwill be provided in accordance with Rule 13d-3 of the General Rules and Regulations under the Securities Exchange Act of 1934, as amended (the “Exchange Act”). Under these rules, a person is deemedInstruction G(3) to be a beneficial owner of a security if that person has or shares voting power, which includes the power to vote or to direct the voting of that security, or investment power, which includes the power to dispose of or to direct the disposition of that security. A person is also deemed to be a beneficial owner of any securities of which that person has a right to acquire beneficial ownership within 60 days ofForm 10-K no later than April 24, 2013 (i.e., June 23, 2013). Also, more than one person may be deemed to be a beneficial owner of the same securities and a person may be deemed to be a beneficial owner of securities as to which that person has no economic interest.5% Beneficial Owners Number of
Shares
Beneficially
Owned Percent
Beneficially
Owned 16,500,000 9.5% 14,681,338 8.4% 11,184,000 6.5% (1)The information is based on Amendment No. 3 to the Schedule 13D filed with the SEC on March 1, 2013 jointly by ValueAct Capital Master Fund, L.P.; VA Partners I, LLC; ValueAct Capital Management, L.P.; ValueAct Capital Management, LLC; ValueAct Holdings, L.P. and ValueAct Holdings GP, LLC and updated information provided by ValueAct Capital. The amount beneficially owned includes 16,500,000 shares over which there is shared voting power and shared dispositive power among the joint filers. Percentage of our shares beneficially owned is as reported in their Schedule 13D/A and as updated by ValueAct Capital as of April 24, 2013.(2)The information is based solely on the Schedule 13G filed with the SEC on February 12, 2013 by T. Rowe Price Associates, Inc. The amount beneficially owned includes 4,336,925 shares over which there is sole voting power and 14,681,338 shares over which there is sole dispositive power. Percentage of our shares beneficially owned is as reported in their Schedule 13G as of December 31, 2012.(3)The information is based solely on the Schedule 13G filed with the SEC on February 11, 2013 by Harris Associates L.P. and its general partner, Harris Associates Inc. The amount beneficially owned includes 10,891,000 shares over which there is sole voting power and sole dispositive power. As a result of advisory and other relationships with persons who own the shares, Harris Associates L.P. may be deemed to be the beneficial owner of 11,184,000 shares. Percentage of our shares beneficially owned is as reported in their Schedule 13G as of December 31, 2012.Current Directors, Director Nominees and Executive Officers Number of
Shares
Beneficially
Owned(2) Percent
Beneficially
Owned 3,450,562 2.0 % 14,111 * 42,111 * 47,020 * 47,676 * 10,283 * 10,283 * 10,600 * 12,961 * 18,537 * 5,375 * 16,500,000 9.5 % 27,100 * 10,040 * 216,284 * 7,144 * 311,950 * 20,815,588 12.0 % *Less than 1%.(1)Unless otherwise indicated, the address of each of the persons listed below is c/o Willis Group Holdings Public Limited Company, Grand Mill Quay, Barrow Street, Dublin 4, Ireland.(2)The number of shares that the directors and executive officers are deemed to have a beneficial interest includes shares under options that will be exercisable and/or RSUs that will vest on or before June 23, 2013 as indicated in the following notes. These shares, however, are not deemed outstanding for purposes of computing percentage of beneficial ownership of any other person.(3)Mr. Plumeri’s shares beneficially owned include 66,200 performance-based RSUs, which are scheduled to vest on May 2, 2013, 57,390 performance-based RSUs, which are scheduled to vest on May 3, 2013, 1,250,000 options to purchase shares and 380,977 RSUs with deferred settlement until Mr. Plumeri incurs a separation of service from the Company. Mr. Plumeri will retire as Chairman of the Board on July 7, 2013.(4)Mr. Califano’s shares beneficially owned include 2,753 time-based RSUs, which are scheduled to vest on May 7, 2013, and 3,189 vested RSUs, the settlement of which has been deferred until the earlier of when the director ceases to serve on the Board and January 2, 2017. Additionally, Mr. Califano beneficially owns 30,000 options pursuant to which he will receive the intrinsic value in cash upon exercise rather than receive shares upon payment of the exercise price. These options are not reflected in the above table.(5)Ms. Catalano’s shares beneficially owned include 30,000 options to purchase shares, 2,753 time-based RSUs, which are scheduled to vest on May 7, 2013, and 1,361 vested RSUs, the settlement of which has been deferred until the earlier of when the director ceases to serve on the Board and January 2, 2017.(6)Sir Roy Gardner’s shares beneficially owned include 30,000 options to purchase shares and 2,753 time-based RSUs, which are scheduled to vest on May 7, 2013.(7)Sir Jeremy Hanley’s shares beneficially owned include 30,000 options to purchase shares, 2,753 time-based RSUs, which are scheduled to vest on May 7, 2013, and 3,189 vested RSUs, the settlement of which has been deferred until the earlier of when the director ceases to serve on the Board and January 2, 2017.(8)Ms. Kravit’s shares beneficially owned include 2,753 time-based RSUs, which are scheduled to vest on May 7, 2013, and 1,361 vested RSUs, the settlement of which has been deferred until the earlier of when the director ceases to serve on the Board and January 2, 2017.(9)Mr. Lane’s shares beneficially owned include 2,753 time-based RSUs, which are scheduled to vest on May 7, 2013.(10)Ms. Lane’s shares beneficially owned includes 2,753 time-based RSUs, which are scheduled to vest on May 7, 2013. She also beneficially owns 30,000 options pursuant to which she will receive the intrinsic value in cash upon exercise rather than receive shares upon payment of the exercise price. These options are not reflected in the above table.(11)Mr. McCann’s shares beneficially owned include 2,753 time-based RSUs, which are scheduled to vest on May 7, 2013 and 1,361 vested RSUs, the settlement of which has been deferred until the earlier of when the director ceases to serve on the Board and January 2, 2017. Additionally, Mr. McCann beneficially owns 30,000 options pursuant to which he will receive the intrinsic value in cash upon exercise rather than receive shares upon payment of the exercise price. These options are not reflected in the above table.(12)Mr. Roberts’ shares beneficially owned include 2,753 time-based RSUs, which are scheduled to vest on May 7, 2013, and 3,189 vested RSUs, the settlement of which has been deferred until the earlier of when the director ceases to serve on the Board and January 2, 2017. Additionally, Mr. Roberts beneficially owns 30,000 options pursuant to which he will receive the intrinsic value in cash upon exercise rather than receive shares upon payment of the exercise price. These options are not reflected in the above table.(13)Mr. Somers’ shares beneficially owned include 2,753 time-based RSUs, which are scheduled to vest on May 7, 2013.(14)Mr. Ubben has been nominated as a director by the Board for election at the 2013 Annual General Meeting of Shareholders. Includes 16,500,000 shares of common stock beneficially owned by ValueAct Capital Master Fund, L.P., as to which Mr. Ubben may be deemed a beneficial owner. Mr. Ubben disclaims beneficial ownership of these shares except to the extent of his pecuniary interest therein.(15)Mr. Hearn’s shares beneficially owned include 6,249 options to purchase shares.(16)Mr. Krauze’s shares beneficially owned include 8,250 time-based RSUs, which are scheduled to vest on May 2, 2013, 2,512 shares held indirectly by the Theresa L. Krauze Revocable Trust and 184,192 options to purchase shares (of which 10,000 options are scheduled to vest on May 5, 2013 and 4,167 options are scheduled to vest on May 6, 2013).(17)Mr. Wright’s shares beneficially owned include 295,832 options to purchase shares (of which 25,000 options are scheduled to vest on May 5, 2013).Review and Approval of Related Person TransactionsWillis has adopted written policies and procedures governing and approval of transactions between the Company and any of its directors or executive officers, nominees for directors, any security holder who is known to the Company to own of record or beneficially more than 5% of any class of the Company’s voting securities or their immediate family members (each, a “Related Person”) to determine whether such persons have a direct or indirect material interest. The Company’s directors, nominees for directors and executive officers complete an annual director and officer questionnaire which requires the disclosure of related person transactions. In addition, directors, nominees for directors and executive officers are obligated to advise the Audit Committee of any related person transactions of which they are aware, or become aware, and, in the event that any such transactions involve difficult or complex issues, the directors and executive officers are obligated to advise the Group General Counsel. Further, transactions that are determined to be directly or indirectly material to a Related Person are disclosed in the Company’s Proxy Statement or Annual Report on Form 10 K in accordance with SEC rules. The Audit Committee reviews and approves or ratifies any related person transaction that is required to be disclosed. In the course of its review and approval or ratification of a disclosable related person transaction, the Audit Committee considers, among other factors it deems appropriate:The position within or relationship of the Related Person with the Company;The materiality of the transaction to the Related Person and the Company, including the dollar value of the transaction, without regard to profit or loss;The business purpose for and reasonableness of the transaction (including the anticipated profit or loss from the transaction), taken in the context of the alternatives available to the Company for attaining the purposes of the transaction;Whether the transaction is comparable to a transaction that could be available on an arms-length basis or is on terms that the Company offers generally to persons who are not Related Persons;Whether the transaction is in the ordinary course of the Company’s business and was proposed and considered in the ordinary course of business; andThe effect of the transaction on the Company’s business and operations, including on the Company’s internal control over financial reporting and system of disclosure controls or procedures, and any additional conditions or controls (including reporting and review requirements) that should be applied to such transaction.Any member of the Audit Committee who is a Related Person with respect to a transaction under review may not participate in the deliberations or vote regarding the approval or ratification of the transaction, provided, however, that such director may be counted in determining the presence of a quorum at a meeting at which the Audit Committee considers the transaction.2012 Related Person Transactions Under Item 404 of Regulation S-KDavid Hearn is the brother of Peter Hearn, the Chairman of Willis Re and a 2012 executive officer, and is employed by a Willis subsidiary. David Hearn’s 2012 total compensation (including salary, bonus and long-term incentive awards) was $1,225,000. Both David Hearn and Peter Hearn are unrelated to Stephen Hearn, the Group Deputy CEO, CEO and Chairman of Willis Global. No other transactions are required to be disclosed under Item 404 of Regulation S-K.Board and Committee Member IndependenceBased on the recommendation of the Governance Committee, the Board has determined that, with the exception of Mr. Casserley and Mr. Plumeri (who will retire as Chairman and a member of the Board on July 7, 2013), (i) all the directors and director nominees shown above and (ii) the current members of the Audit Committee, Compensation Committee, Governance Committee and the Risk Committee are independent under the relevant SEC rules, NYSE listing standards and the Board’s Director Independence Standards. The Board’s Director Independence Standards are part of the Company’s Corporate Governance Guidelines adopted by the Board and which comply and meet the requirements of the NYSE’s listing standards.As discussed above, each director nominee has significant experience and affiliationsindependence will be provided in accordance with other organizations. Accordingly, in evaluating the independence of each director, the Governance Committee considered that in the ordinary course of business, the Company provides services (such as insurance broking or consultancy services)Instruction G(3) to receives services from or provides charitable donations to organizations affiliated with the directors. This includes a $150,000 charitable contribution made by the Company to CASA, a charitable organization that employs Messrs. Califano and Lane and whose board includes Messrs. Lane, Califano, and Plumeri. In addition, in the ordinary course of business and on an arm’s length basis, Jeffrey Lane, Robyn Kravit and James McCann receive broking or consultancy services from the Company on a personal basis. However, the Governance Committee determined that, in all of the above cases, the transactions do not impair the relevant director’s independence under the applicable SEC rules, NYSE listing standards or the Company’s Governance Guidelines.followinginformation required by this Item with respect to auditors' services and fees have been, or will be billed by Deloitte LLP and their respective affiliates for professional services rendered to the Company for the fiscal years ended December 31, 2012 and December 31, 2011. 2012 2011 ($ in thousands) 6,942 6,581 227 215 170 124 980 566 8,319 7,486 (1)Fees for the audits of the Company’s annual financial statements and reviews of the financial statements included in the Company’s quarterly reports for that fiscal year, services relating to the Company’s registration statements ($31,000) and U.S. Generally Accepted Accounting Principles (“GAAP”) accounting consultations and Sarbanes-Oxley Section 404 work.(2)Audit related fees relate primarily to professional services such as employee benefit plan audits and non-statutory audits.(3)Tax fees comprise fees for various tax compliance engagements.(4)All other fees in 2012 relate primarily to assist with the Company’s internal review of certain payments made by our U.K. subsidiary between 2005 and 2009, discussed in further detail in the section entitled “Commitments and Contingencies” in Note 22 to our Consolidated Financial Statements included within our Annual Report on Form 10-K, and in 2011 to assist with the Company’s Finance Transformation Project.The Audit Committee approved all of the services described aboveprovided in accordance with the Company’s pre-approval policy.Audit Committee Pre-Approval ProcessThe Audit Committee has adopted a policy regarding the pre-approvalInstruction G(3) to Form 10-K no later than April 30, 2014.services provided by the Company’s independent auditors, which can be found in the Investor Relations — Corporate Governance section of the Company’s website atwww.willis.com. This policy requires all services provided by the Company’s independent auditors, both audit and permitted non-audit services, to be pre-approved by the Audit Committee or the Chairman of the Audit Committee or, in his absence, any other member of the Committee. The pre-approval of audit and permitted non-audit services may be given at any time before the commencement of the specified service. The decisions of a designated member of the Audit Committee shall be reported to the Audit Committee at each of its regularly scheduled meetings.EXHIBIT ARECONCILIATIONOF GAAPTO NON-GAAP INFORMATIONI.Analysis of Commissions and FeesThe following table reconciles organic commissions and fees growth by segment to the percentage change in reported commissions and fees for the three and twelve months ended December 31, 2012: Three months ended
December 31, Change attributable to 2012 2011 %
Change Foreign
currency
translation Acquisitions
and disposals Organic
commissions
and fees
growth(a) $ 237 $ 213 11.3 % (0.3 )% — % 11.6 % 331 316 4.7 % (0.3 )% — % (b) 5.0 %(b) 299 281 6.4 % (1.0 )% — % 7.4 % $ 867 $ 810 7.0 % (0.5 )% — % 7.5 % Twelve months ended
December 31, Change attributable to 2012 2011 %
Change Foreign
currency
translation Acquisitions
and disposals Organic
commissions
and fees
growth(a) $ 1,124 $ 1,073 4.8 % (1.3 )% — % 6.1 % 1,306 1,314 (0.6 )% — % — % (c) (0.6 )% 1,028 1,027 0.1 % (4.8 )% — % 4.9 % $ 3,458 $ 3,414 1.3 % (1.8 )% — % 3.1 % (a)Organic commissions and fees growth excludes: (i) the impact of foreign currency translation; (ii) the first twelve months of net commission and fee revenues generated from acquisitions; (iii) the net commission and fee revenues related to operations disposed of in each period presented; (iv) in North America, legacy contingent commissions assumed as part of the HRH acquisition and that had not been converted into higher standard commission; and (v) investment income and other income from reported revenues.(b)Results for Willis North America showed organic growth of 5.0% attributable, in part, to the reversal in the fourth quarter of 2011 of revenue that was improperly recorded during 2011. Excluding that revenue reversal, organic growth in Willis North America was 3.1%.(c)Included in North America reported commissions and fees were legacy HRH contingent commissions of $nil in the fourth quarter of 2012 and the fourth quarter of 2011 and $2 million in 2012 compared with $5 million in 2011.Our methods of calculating these measures may differ from those used by other companies and therefore comparability may be limited.II.Adjusted Operating IncomeThe following table reconciles operating (loss) income, the most directly comparable GAAP measure, to adjusted operating income, for the twelve months ended December 31, 2012 and 2011: Twelve months ended
December 31, 2012 2011 %
Change $ (209 ) $ 566 NM 492 — 200 —
policy(c) 252 — (10 ) — 3 (4 ) 13 22 11 — — 180 — 11 $ 752 $ 775 (3.0 )% (6.0 )% 16.4 % 21.6 % 22.5 % (a)Non-cash charge recognized related to the impairment of the carrying value of the North America reporting unit’s goodwill.(b)Write-off of unamortized cash retention awards following decision to eliminate the repayment requirement on past awards.(c)Additional incentive accrual recognized following the replacement of annual cash retention awards with annual cash bonuses which will not feature a repayment requirement.(d)Insurance recovery related to previously disclosed improperly recorded revenue in Chicago.(e)Write-off of an uncollectible accounts receivable balance, together with associated legal fees, related to overstatement of Commissions and Fees from the years 2004 to 2011, in Chicago.(f)Settlement with former partners related to the termination of a joint venture arrangement in India.(g)Charge relating to the 2011 Operational Review, including $34 million of severance costs relating to the elimination of approximately 400 position in the fourth quarter of 2011 and $98 million of severance costs relating to the elimination of approximately 1,200 positions for the full year 2011.III.Adjusted Net Income from Continuing OperationsThe following table reconciles net (loss) income from continuing operations and earnings per diluted share from continuing operations, the most directly comparable GAAP measures, to adjusted net income from continuing operations and earnings per diluted share from continuing operations, for the twelve months ended December 31, 2012 and 2011: Twelve months ended
December 31, Per diluted share
Twelve months ended
December 31, 2012 2011 %
Change 2012 2011 %
Change $ (446 ) $ 203 NA $ (2.58 ) $ 1.15 NM 458 — 2.60 — 138 — 0.78 — 175 — 0.99 — (6 ) — (0.03 ) — 3 (4 ) 0.02 (0.02 ) 11 — 0.06 — 8 13 0.05 0.08 — 128 — 0.73 — 11 — 0.06 — 131 — 0.74 113 — 0.64 — — — 0.05 — $ 454 $ 482 (5.8 )% $ 2.58 $ 2.74 (5.8 )% 176 176 (a)Non-cash charge recognized related to the impairment of the carrying value of the North America reporting unit’s goodwill.(b)Write-off of unamortized cash retention awards following decision to eliminate the repayment requirement on past awards.(c)Additional incentive accrual recognized following the replacement of annual cash retention awards with annual cash bonuses which will not feature a repayment requirement.(d)Insurance recovery related to previously disclosed improperly recorded revenue in Chicago.(e)Settlement with former partners related to the termination of a joint venture arrangement in India.(f)Write-off of uncollectible accounts receivable balance, together with associated legal fees, related to overstatement of Commissions and Fees from the years 2004 to 2011, in Chicago.(g)Charge relating to the 2011 Operational Review, including $34 million of severance costs relating to the elimination of approximately 400 positions in the fourth quarter of 2011 and $98 million of severance costs related to the elimination of approximately 1,200 positions for the full year 2011.(h)Valuation allowance against deferred tax assets.(i)Diluted earnings per share are calculated by dividing net income by the average number of shares outstanding during each period. However, potentially issuable shares were not included in the calculation of diluted earnings per share for the three months and twelve months ended December 31, 2012 because the Company’s net loss rendered their impact anti-dilutive. The dilutive impact of potentially issuable shares is included on reconciling to adjusted earnings per share from continuing operations.–— Exhibits, Financial Statement Schedules(a)(3)December 31, 2013. 2.1Underwriting Agreement, dated August 8, 2013, among Trinity Acquisition plc, as issuer, the guarantors named therein and Barclays Capital Inc. and Morgan Stanley & Co. LLC, as representatives of the several underwriters named therein (incorporated herein by reference to Exhibit No. 1.1 to the Company's Form 8-K filed on August 12, 2013 (SEC File No. 001-16503)) 2.1 Scheme of Arrangement between Willis Group Holdings Limited and the Scheme Shareholders (incorporated by reference to Annex A to Willis Group Holdings Limited’sLimited's Definitive Proxy Statement on Schedule 14A filed on November 2, 2009 (SEC File No. 001-16503))Memorandum and Articles of Association of Willis Group Holdings Public Limited Company (incorporated herein by reference to Exhibit No. 3.1 to the Company’sCompany's Form 8-K filed on January 4, 2010 (SEC File No. 001-16503))Certificate of Incorporation of Willis Group Holdings Public Limited Company (incorporated by reference to Exhibit No. 3.2 to the Company’sCompany's Form 8-K filed on January 4, 2010 (SEC File No. 001-16503))Senior Indenture dated as of July 1, 2005, and First Supplemental Indenture, dated as of July 1, 2005, among Willis North America Inc., as the Issuer, Willis Group Holdings Public Limited Company, TA I Limited, TA II Limited, TA III Limited, Trinity Acquisition plc, TA IV Limited and Willis Group Limited, as the Guarantors, and The Bank of New York (f/k/a JPMorgan Chase Bank, N.A.), as the Trustee, for the issuance of the 5.625% senior notes due 2015 (incorporated by reference to Exhibit 4.1 to Willis Group Holdings Limited’sLimited's Form 8-K filed on July 1, 2005 (SEC File No. 001-16503))Second Supplemental Indenture dated as of March 28, 2007 among Willis North America Inc., as the Issuer, Willis Group Holdings Public Limited Company, TA I Limited, TA II Limited, TA III Limited, Trinity Acquisition plc, TA IV Limited and Willis Group Limited, as the Guarantors, and The Bank of New York, as the Trustee, to the Indenture dated as of July 1, 2005, for the issuance of the 6.200% senior notes due 2017 (incorporated by reference to Exhibit 4.1 to Willis Group Holdings Limited’sLimited's Form 8-K filed on March 30, 2007 (SEC File No. 001-16503))Third Supplemental Indenture dated as of October 1, 2008 among Willis North America Inc., as the Issuer, Willis Group Holdings Limited, Willis Investment UK Holdings Limited, TA I Limited, TA II Limited, TA III Limited, Trinity Acquisition plc, TA IV Limited and Willis Group Limited, as the Guarantors, and The Bank of New York Mellon, as the Trustee, to the Indenture dated as of July 1, 2005 (incorporated by reference to Exhibit 4.1 to Willis Group Holdings Limited’sLimited's Form 10-Q filed on November 10, 2008 (SEC File No. 001-16503))Fourth Supplemental Indenture dated as of September 29, 2009 among Willis North America Inc., as the Issuer, Willis Group Holdings Limited, Willis Investment UK Holdings Limited, TA I Limited, TA II Limited, TA III Limited, Trinity Acquisition plc, TA IV Limited and Willis Group Public Limited Company, as the Guarantors, and The Bank of New York, as the Trustee, to the Indenture dated as of July 1, 2005, for the issuance of the 7.000% senior notes due 2019 (incorporated by reference to Exhibit 4.1 to Willis Group Holdings Limited’sLimited's Form 8-K filed on September 29, 2009 (SEC File No. 001-16503))Fifth Supplemental Indenture dated as of December 31, 2009 among Willis North America Inc., as the Issuer, Willis Group Holdings Public Limited Company, Willis Group Holdings Limited, Willis Netherlands Holdings B.V., Willis Investment UK Holdings Limited, TA I Limited, TA II Limited, TA III Limited, Trinity Acquisition plc, TA IV Limited and Willis Group Limited, as the Guarantors, and The Bank of New York Mellon, as the Trustee, to the Indenture dated as of July 1, 2005 (incorporated by reference to Exhibit 4.1 to the Company’sCompany's Form 8-K filed on January 4, 2010 (SEC File No. 001-16503))Sixth Supplemental Indenture dated as of December 22, 2010 among Willis North America Inc., as the Issuer, Willis Group Holdings Public Limited Company, Willis Netherlands Holdings B.V., Willis Investment UK Holdings Limited, TA I Limited, TA II Limited, TA III Limited, Trinity Acquisition plc, TA IV Limited and Willis Group Limited, as the Guarantors, and The Bank of New York Mellon, as the Trustee, to the Indenture dated as of July 1, 2005 (incorporated by reference to Exhibit 4.1 to the Company’sCompany's Form 10-K filed on February 28, 2011 (SEC File No. 001-16503))Indenture, dated as of March 17, 2011, among Willis Group Holdings Public Limited Company, as issuer, Willis Netherlands Holdings B.V., Willis Investment Holdings UK Limited, TA I Limited, Trinity Acquisition plc, Willis Group Limited and Willis North America Inc., as Guarantors, and The Bank of New York Mellon, as Trustee (incorporated by reference to Exhibit 4.1 to the Company’sCompany's Form 8-K filed on March 17, 2011 (SEC File No. 001-16503))First Supplemental Indenture, dated as of March 17, 2011, among Willis Group Holdings Public Limited Company, as Issuer, Willis Netherlands Holdings B.V., Willis Investment Holdings UK Limited, TA I Limited, Trinity Acquisition plc, Willis Group Limited and Willis North America Inc., as guarantors, and The Bank of New York Mellon, as trustee, to the Indenture dated March 17, 2011, for the issuance of the 4.125% senior notes due 2016 and the 5.750% senior notes due 2021 (incorporated by reference to Exhibit 4.2 to the Company’sCompany's Form 8-K filed on March 17, 2011 (SEC File No. 001-16503))10.1Indenture, dated as of August 15, 2013, among Trinity Acquisition plc, as issuer, Willis Group Holdings Public Limited Company, Willis Netherlands Holdings B.V., Willis North America Inc., Willis Investment Holdings UK Limited, TA I Limited and Willis Group Limited, as guarantors, and Wells Fargo Bank, National Association, as trustee (incorporated by reference to Exhibit 4.1 to the Company's Form 8-K filed on August 15, 2013 (SEC File No. 001-16503)) 4.10 First Supplemental Indenture, dated as of August 15, 2013, among Trinity Acquisition plc, as issuer, Willis Group Holdings Public Limited Company, Willis Netherlands Holdings B.V., Willis North America Inc., Willis Investment Holdings UK Limited, TA I Limited and Willis Group Limited, as guarantors, and Wells Fargo Bank, National Association, as trustee, to the Indenture dated August 15, 2013, for the issuance of 4.625% senior notes due 2023 and 6.125% senior notes due 2043 (incorporated by reference to Exhibit 4.2 to the Company's Form 8-K filed on August 15, 2013 (SEC File No. 001-16503)). 10.1 Credit Agreement, dated as of December 16, 2011, among Trinity Acquisition plc, Willis Group Holdings Public Limited Company, the Lenders party thereto, Barclays Bank PLC, as Administrative Agent, Swing Line Lender and as an L/C Issuer (incorporated by reference to Exhibit 10.1 to the Company’sCompany's Form 8-K filed on December 20, 2011 (SEC File No. 001-16503))First Amendment to Credit Agreement, dated as of July 23, 2013, to the Credit Agreement, dated as of December 12, 2011, among Trinity Acquisition PLC, Willis Group Holdings Public Limited Company, the lenders party thereto and Barclays Bank PLC, as Administrative Agent (incorporated by reference to Exhibit 10.1 to the Company's Form 8-K filed on July 25, 2013 (SEC File No. 001-16503)) 10.3 Guaranty Agreement, dated as of December 16, 2011, among Trinity Acquisition plc, Willis Group Holdings Public Limited Company, Barclays Bank PLC, as Administrative Agent (incorporated by reference to Exhibit 10.2 to the Company’sCompany's Form 8-K filed on December 20, 2011 (SEC File No. 001-16503))10.310.4 Deed Poll of Assumption dated as of December 31, 2009 between Willis Group Holdings Limited and Willis Group Holdings Public Limited Company (incorporated by reference to Exhibit 10.4 to the Company’sCompany's Form 8-K filed on January 4, 2010 (SEC File No. 001-16503))†10.410.5 Willis Group Senior Management Incentive Plan (incorporated by reference to Exhibit 10.7 to the Company’sCompany's Form 8-K filed on January 4, 2010 (SEC File No. 001-16503))†10.510.6 Willis Group Holdings 2010 North America Employee Share Purchase Plan (incorporated by reference to Exhibit 10.3 to the Company’sCompany's Form 8-K filed on April 27, 2010 (SEC File No. 001-16503))†10.610.7 Willis Group Holdings 2001 Share Purchase and Option Plan (incorporated by reference to Exhibit 10.9 to the Company’sCompany's Form 8-K filed on January 4, 2010 (SEC File No. 001-16503))†10.710.8 Form of Performance-Based Option Agreement under the Willis Group Holdings 2001 Share Purchase and Option Plan (incorporated by reference to Exhibit 10.2 to the Company’sCompany's Form 10-Q filed on May 10, 2010 (SEC File No. 001-16503))†10.810.9 Form of Time-Based Option Agreement under the Willis Group Holdings 2001 Share Purchase and Option Plan (incorporated by reference to Exhibit 10.16 the Company’sCompany's Form 10-K filed on February 28, 2011 (SEC File No. 001-16503))†10.910.10 Form of Time-Based Restricted Share Unit Award Agreement under the Willis Group Holdings 2001 Share Purchase and Option Plan (for executive officers) (incorporated by reference to Exhibit 10.2 to the Company’sCompany's Form 10-Q filed on August 9, 2011 (SEC File No. 001-16503))†10.1010.11 Form of Restricted Share Unit Award Agreement for Non-employee Directors under the Willis Group Holdings 2001 Share Purchase Option Plan (incorporated by reference to Exhibit 10.14 to the Company’sCompany's Form 10-K filed February 29, 2012 (SEC File No. 001-16503))†10.1110.12 Form of Performance-Based Option Agreement - 2011 Long Term Incentive Program under the Willis Group Holdings 2001 Share Purchase and Option Plan (incorporated by reference to Exhibit 10.1 to the Company’sCompany's Form 8-K filed on May 3, 2011 (SEC File No. 001-16503))†10.1210.13 Form of 2011 Long Term Incentive Program Agreement of Restrictive Covenants and Other Obligations (for US employees) (incorporated by reference to Exhibit 10.2 to the Company’sCompany's Form 8-K filed on May 3, 2011 (SEC File No. 001-16503))†10.1310.14 Form of 2011 Long Term Incentive Program Agreement of Restrictive Covenants and Other Obligations (for UK employees) (incorporated by reference to Exhibit 10.3 to the Company’sCompany's Form 8-K filed on May 3, 2011 (SEC File No. 001-16503))†10.1410.15 Form of 2011 Long Term Incentive Program Cash Award Agreement (incorporated by reference to Exhibit 10.1 to the Company’sCompany's Form 8-K filed on December 20, 2011 (SEC File No. 001-16503))†10.15The Willis Group Holdings 2004 Bonus and Share Plan (incorporated by reference to Exhibit 10.12 to the Company’s Form 8-K filed on January 4, 2010 (SEC File No. 001-16503))†Rules of the Willis Group Holdings Sharesave Plan 2001 for the United Kingdom (incorporated by reference to Exhibit 10.13 to the Company’sCompany's Form 8-K filed on January 4, 2010 (SEC File No. 001-16503))†The Willis Group Holdings Irish Sharesave Plan (incorporated by reference to Exhibit 10.1 to the Company’sCompany's Form 10-Q filed on May 5, 2010 (SEC File No. 001-16503))†The Willis Group Holdings International Sharesave Plan (incorporated by reference to Exhibit 10.15 to the Company’s Form 8-K filed on January 4, 2010 (SEC File No. 001-16503))†10.19Willis Group Holdings 2008 Share Purchase and Option Plan (incorporated by reference to Exhibit 10.16 to the Company’sCompany's Form 8-K filed on January 4, 2010 (SEC File No. 001-16503))†10.2010.19 Form of Performance-Based Restricted Share Units Award Agreement under the Willis Group Holdings 2008 Share Purchase and Option Plan (for executive officers) (incorporated by reference to Exhibit 10.4 to the Company’sCompany's Form 10-Q filed on August 9, 2011 (SEC File No. 001-16503))†10.21Form of Performance-Based Restricted Share Unit Award Agreement granted under the Willis Group Holdings 2008 Share Purchase and Option Plan, dated May 2, 2011, between Joseph J. Plumeri and Willis Group Holdings Public Limited Company (incorporated by reference to Exhibit 10.7 to the Company’s Form 10-Q filed on August 9, 2011 (SEC File No. 001-16503))†10.2210.20 Form of Performance-Based Option Award Agreement under the Willis Group Holdings 2008 Share Purchase and Option Plan (for executive officers) (incorporated by reference to Exhibit 10.3 to the Company’sCompany's Form 10-Q filed on August 9, 2011 (SEC File No. 001-16503))†10.2310.21 Hilb Rogal and Hamilton Company 2000 Share Incentive Plan (incorporated by reference to Exhibit 10.18 to the Company’sCompany's Form 8-K filed on January 4, 2010 (SEC File No. 001-16503))†10.2410.22 Hilb Rogal & Hobbs Company 2007 Share Incentive Plan (incorporated by reference to Exhibit 10.19 to the Company’sCompany's Form 8-K filed on January 4, 2010 (SEC File No. 001-16503))†10.2510.23 Form of Time-Based Restricted Share Unit Award Agreement granted under the Hilb Rogal & Hobbs Company 2007 Share Incentive Plan (incorporated by reference to Exhibit 10.1 to the Company’sCompany's Form 10-Q filed on August 6, 2010 (SEC File No. 001-16503))†10.2610.24 Form of Performance-Based Restricted Share Unit Award Agreement granted under the Hilb Rogal & Hobbs Company 2007 Share Incentive Plan (incorporated by reference to Exhibit 10.6 to the Company’sCompany's Form 10-Q filed on August 9, 2011 (SEC File No. 001-16503))†10.2710.25 Form of Time-Based Option Agreement granted under the Hilb Rogal & Hobbs Company 2007 Share Incentive Plan (incorporated by reference to Exhibit 10.3 to the Company’sCompany's Form 10-Q filed on August 6, 2010 (SEC File No. 001-16503))†10.28 10.26 Form of Performance-Based Option Agreement granted under the Hilb Rogal & Hobbs Company 2007 Share Incentive Plan (incorporated by reference to Exhibit 10.5 to the Company’sCompany's Form 10-Q filed on August 9, 2011 (SEC File No. 001-16503))†10.2910.27 Willis Group Holdings Public Limited Company 2012 Equity Incentive Plan (incorporated by reference to Exhibit 10.1 to the Company’sCompany's 8-K filed on April 30, 2012 (SEC File No. 001-16503))†10.3010.28 Form of Time Based Share Option Award Agreement under the Willis Group Holdings Public Limited Company 2012 Equity Incentive Plan (incorporated by reference to Exhibit 10.1 to the Company’sCompany's Form 10-Q filed on August 9, 2012 (SEC File No. 001-16503))†10.3110.29 Form of Performance Based Share Option Award Agreement under the Willis Group Holdings Public Limited Company 2012 Equity Incentive Plan (incorporated by reference to Exhibit 10.2 to the Company’sCompany's Form 10-Q filed on August 9, 2012 (SEC File No. 001-16503))†10.32Rules of the Willis Group Holdings Public Limited Company 2012 Sharesave Sub-Plan for the United Kingdom to the Willis Group Holdings Public Limited Company 2012 Equity Incentive Plan(incorporated by reference to Exhibit 10.32 to the Company’s Form 10-K filed on February 28, 2013 (SEC File No. 001-16503))†10.3310.30 Form of Time Based Restricted Share Unit Award Agreement under the Willis Group Holdings Public Limited Company 2012 Equity Incentive Plan (incorporated by reference to Exhibit 10.3 to the Company’sCompany's Form 10-Q filed on August 9, 2012 (SEC File No. 001-16503))†10.3410.31 Form of Performance Based Restricted Share Unit Award Agreement under the Willis Group Holdings Public Limited Company 2012 Equity Incentive Plan (incorporated by reference to Exhibit 10.4 to the Company’sCompany's Form 10-Q filed on August 9, 2012 (SEC File No. 001-16503))†10.3510.32 Form of Time Based Restricted Share Unit Award Agreement under the Willis Group Holdings Public Limited Company 2012 Equity Incentive Plan (for Non-Employee Directors) (incorporated by reference to Exhibit 10.5 to the Company’sCompany's Form 10-Q filed on August 9, 2012 (SEC File No. 001-16503))†10.36Form of Performance-Based Restricted Share Unit Award Agreement under the Willis Group Holdings Public Limited Company 2012 Equity Incentive Plan for the 2013 Long-Term Incentive Program*† 10.34 Rules of the Willis Group Holdings Public Limited Company 2012 Sharesave Sub-Plan for the United Kingdom to the Willis Group Holdings Public Limited Company 2012 Equity Incentive Plan (incorporated by reference to Exhibit 10.32 to the Company's Form 10-K filed on February 28, 2013 (SEC File No. 001-16503))† 10.35 Form of 2012 Long Term Incentive Program Agreement of Restrictive Covenants and Other Obligations (for US employees) Plan (incorporated by reference to Exhibit 10.36 to the Company’sCompany's Form 10-K filed on February 28, 2013 (SEC File No. 001-16503))†10.3710.36 Form of 2012 Long Term Incentive Program Agreement of Restrictive Covenants and Other Obligations (for UK employees) Plan (incorporated by reference to Exhibit 10.37 to the Company’sCompany's Form 10-K filed on February 28, 2013 (SEC File No. 001-16503))†10.3810.37 Amended and Restated Willis US 2005 Deferred Compensation Plan (incorporated by reference to Exhibit 10.21 to the Company’sCompany's Form 8-K filed on November 20, 2009 (SEC File No. 001-16503))†10.3910.38 First Amendment to the Amended and Restated Willis U.S. 2005 Deferred Compensation Plan, effective June 1, 2011 (incorporated by reference to Exhibit 10.1 to the Company’sCompany's Form 10-Q filed on August 9, 2011 (SEC File No. 001-16503))†10.40Second Amendment to the Amended and Restated Willis US 2005 Deferred Compensation Plan (incorporated by reference to Exhibit 10. 6 to the Company's Form 10-Q filed on November 5, 2013 (SEC File No. 001-16503))† 10.40 Instrument Comprising A Guarantee In Favour of Willis Pension Trustees Limited in Respect of the Willis Pension Scheme (incorporated by reference to Exhibit 10.1 to the Company’sCompany's Form 8-K filed on April 5 2012 (SEC File No. 001-16503))†Schedule of Contributions for the Willis Pension Scheme (incorporated by reference to Exhibit 10.2 to the Company’sCompany's Form 8-K filed on April 5, 2012 (SEC File No. 001-16503))†Form of Deed of Indemnity of Willis Group Holdings Public Limited Company with directors and officers (incorporated by reference to Exhibit 10.20 to the Company’sCompany's Form 8-K filed on January 4, 2010 (SEC File No. 001-16503))†Form of Indemnification Agreement of Willis North America Inc. with directors and officers (incorporated by reference to Exhibit 10.21 to the Company’sCompany's Form 8-K filed on January 4, 2010 (SEC File No. 001-16503))†Willis Group Holdings Public Limited Company Compensation Policy for Non-Employee Directors (incorporated by reference to Exhibit 10. 1 to the Company's Form 10-Q filed on November 5, 2013 (SEC File No. 001-16503))† 10.45 2010 Amended and Restated Employment Agreement, dated as of January 1, 2010, by and between Willis North America, Inc. and Joseph J. Plumeri (incorporated by reference to Exhibit 10.1 to the Company’sCompany's Form 8-K filed on January 22, 2010 (SEC File No. 001-16503))†10.4510.46 First Amendment to Employment Agreement, dated as of October 16, 2012, by and between Willis North America Inc., a subsidiary of Willis Group Holdings Public Limited Company, and Joseph J. Plumeri (incorporated by reference to Exhibit 10.5 to the Company’sCompany's Form 8-K filed on October 19, 2012 (SEC File No. 001-16503))†10.46Employment Agreement, dated as of October 16, 2012, by and between Willis Group Holdings Public Limited Company and Dominic Casserley (incorporated by reference to Exhibit 10.1 to the Company's Form 8-K filed on October 19, 2012 (SEC File No. 001-16503))† 10.48 Letter agreement, dated January 31, 2014, by and between Willis Group Holdings plc and Dominic Casserley.*† 10.49 Form of Performance BasedTime-Based Restricted Share Unit Award Agreement under the Willis Group Holdings Public Limited Company 2012 Equity Incentive Plan, dated May 7, 201210, 2013 between Joseph J. PlumeriDominic Casserley and Willis Group Holdings Public Limited Company (incorporated by reference to Exhibit 10.610.3 to the Company’sCompany's Form 10-Q filed on August 9, 2012November 5, 2013 (SEC File No. 001-16503))†10.47Form of Performance-Based Restricted Share Unit Award Agreement under the Willis Group Holdings Public Limited Company 2012 Equity Incentive Plan, dated May 10, 2013 between Dominic Casserley and Willis Group Holdings Public Limited Company (incorporated by reference to Exhibit 10.4 to the Company's Form 10-Q filed on November 5, 2013 (SEC File No. 001-16503))† 10.51 Form of Time-Based Share Option Award Agreement under the Willis Group Holdings Public Limited Company 2012 Equity Incentive Plan, dated May 10, 2013 between Dominic Casserley and Willis Group Holdings Public Limited Company (incorporated by reference to Exhibit 10.5 to the Company's Form 10-Q filed on November 5, 2013 (SEC File No. 001-16503))† 10.52 Offer Letter dated June 22, 2010 and Form of Employment Agreement between Willis North America, Inc. and Michael K. Neborak (incorporated by reference to Exhibit 10.1 to the Company’sCompany's Form 8-K filed on June 23, 2010 (SEC File No. 001-16503))†10.4810.53 Agreement of Restrictive Covenants and Other Obligations dated as of August 2, 2010 between the Company and Michael K. Neborak (incorporated by reference to Exhibit 4.1 to Willis Group Holdings Public Limited Company’sCompany's Form 10-K filed on February 28, 2011 (SEC File No. 001-16503))†10.4910.54 Second Restated Employment Agreement, effective as of December 3, 2010, between Willis North America Inc. and Victor Krauze (incorporated by reference to Exhibit 10.45 to the Company’sCompany's Form 10-K filed on February 29, 2012 (SEC File No. 001-16503))†10.5010.55 First Amendment to Offer of Promotion dated as of October 16, 2012, by and between Willis North America Inc., a subsidiary of Willis Group Holdings Public Limited Company, and Victor P. Krauze. (incorporated by reference to Exhibit 10.7 to the Company’sCompany's Form 8-K filed on October 19, 2012)2012 (SEC File No. 001-16503))†10.51Employment Agreement dated as of October 16, 2012, by and between Victor P. Krauze and Willis North America, Inc., a subsidiary of Willis Group Holdings Public Limited Company, and Dominic Casserleydated July 1, 2013 (incorporated by reference to Exhibit 10.110.7 to the Company’sCompany's Form 8-K filed on October 19, 2012)July 1, 2013 (SEC File No. 001-16503))†10.5210.57 Contract of Employment, dated as of February 28, 2011 by and between Willis Limited, a subsidiary of Willis Group Holdings Public Limited Company, and Stephen P. Hearn (incorporated by reference to Exhibit 10.52 to the Company’sCompany's Form 10-K filed on February 28, 2013 (SEC File No. 001-16503))†10.5310.58 Amendment, dated July 19, 2012, to the Contract of Employment, dated as of February 28, 2011 by and between Willis Limited, a subsidiary of Willis Group Holdings Public Limited Company, and Stephen P. Hearn (incorporated by reference to Exhibit 10.53 to the Company’sCompany's Form 10-K filed on February 28, 2013 (SEC File No. 001-16503))†10.5410.59 Contract of Employment, dated as of October 16, 2012 by and between Willis Limited, a subsidiary of Willis Group Holdings Public Limited Company, and Stephen P. Hearn (incorporated by reference to Exhibit 10.6 to the Company’sCompany's Form 8-K filed on October 19, 2012)2012 (SEC File No. 001-16503))†10.5510.60 Contract of Employment, dated as of December 17, 2007 by and between Willis Limited, a subsidiary of Willis Group Holdings Public Limited Company, and Tim Wright (incorporated by reference to Exhibit 10.55 to the Company’sCompany's Form 10-K filed on February 28, 2013 (SEC File No. 001-16503))†10.5610.61 Amendment, dated July 19, 2012, to the Contract of Employment, dated as of December 17, 2007 by and between Willis Limited, a subsidiary of Willis Group Holdings Public Limited Company, and Tim Wright (incorporated by reference to Exhibit 10.56 to the Company’sCompany's Form 10-K filed on February 28, 2013 (SEC File No. 001-16503))†10.5710.62 Confidentiality Agreement dated as of January 17, 2008 between the Willis Group Limited, a subsidiary of Willis Group Holdings Public Limited Company, and Tim Wright (incorporated by reference to Exhibit 10.57 to the Company’sCompany's Form 10-K filed on February 28, 2013 (SEC File No. 001-16503))†10.58Employment Agreement, dated September 15, 2003 between Willis Americas Administration, Inc. and Todd J. Jones*† Investment and Share Purchase10.64Letter Agreement, dated asAugust 1, 2013, between Willis North America Inc., a subsidiary of November 18, 2009 byWillis Group Holdings Public Limited Company, and among Willis Europe BV, Astorg Partners, Soleil, Alcee, the Lucas family shareholders, the Gras family shareholders, key managers of Gras Savoye & Cie and other minority shareholders of Gras Savoye (incorporated by reference to Exhibit 10.37 to the Company’s Form 10-K filed on March 1, 2010 (SEC File No. 001-16503))Todd J. Jones*†10.59Shareholders Agreement dated as of December 17, 2009 by and among Willis Europe BV, Astorg Partners, Soleil, Alcee, the Lucas family shareholders, the Gras family shareholders, key managers of Gras Savoye & Cie and other minority shareholders of Gras Savoye (incorporated by reference to Exhibit 10.38 to the Company’s Form 10-K filed on March 1, 2010 (SEC File No. 001-16503))10.60NominationNominating Agreement, dated April 25, 2013, by and among Willis Group Holdings Public Limited Company, ValueAct Capital Master Fund, L.P., VA Partners I, LLC, ValueAct Capital Management, L.P., ValueAct Capital Management, LLC, ValueAct Holdings, L.P., ValueAct Holdings GP, LLC and their respective affiliates (incorporated by reference to Exhibit 10.1 to the Company’s Form 8-K filed on April 26, 2013 ((SEC File No. 001-16503))10.66 Investment and Share Purchase Agreement dated as of November 18, 2009 by and among Willis Europe BV, Astorg Partners, Soleil, Alcee, the Lucas family shareholders, the Gras family shareholders, key managers of Gras Savoye & Cie and other minority shareholders of Gras Savoye (incorporated by reference to Exhibit 10.37 to the Company's Form 10-K filed on March 1, 2010 (SEC File No. 001-16503)) 12.1Shareholders Agreement dated as of December 17, 2009 by and among Willis Europe BV, Astorg Partners, Soleil, Alcee, the Lucas family shareholders, the Gras family shareholders, key managers of Gras Savoye & Cie and other minority shareholders of Gras Savoye (incorporated by reference to Exhibit 10.38 to the Company's Form 10-K filed on March 1, 2010 (SEC File No. 001-16503)) 10.68 Amended and Restated Shareholders' Agreement, dated as of April 15, 2013, by and among Willis Europe BV, Willis Netherlands Holdings BV, Astorg Partners, GS & Cie Group, Alcee, the Lucas family shareholders, the Gras family shareholders, key managers of Gras Savoye & Cie and other minority shareholders of Gras Savoye (incorporated by reference to Exhibit 10.60 to the Company's Form 10-Q filed on May 8, 2013 (SEC File No. 001-16503)) 12.1 Statement regarding Computation of Ratio of Earnings to Fixed Charges. (incorporated by reference to Exhibit 12.1 to the Company’s Form 10-K filed on February 28, 2013 (SEC File No. 001-16503))*List of subsidiaries (incorporated by reference to Exhibit 21.1 to the Company’s Form 10-K filed on February 28, 2013 (SEC File No. 001-16503))subsidiaries*Consent of Deloitte LLP (incorporated by reference to Exhibit 23.1 to the Company’s Form 10-K filed on February 28, 2013 (SEC File No. 001-16503))LLP*Certification Pursuant to Rule 13a-14(a)* Certification Pursuant to Rule 13a-14(a)* Certification Pursuant to 18 USC. Section 1350 (incorporated by reference to Exhibit 32.1 to the Company’s Form 10-K filed on February 28, 2013 (SEC File No. 001-16503))1350*Certification Pursuant to 18 USC. Section 1350 (incorporated by reference to Exhibit 32.2 to the Company’s Form 10-K filed on February 28, 2013 (SEC File No. 001-16503))1350*101.INS XBRL Instance Document 101.SCH XBRL Taxonomy Extension Schema Document 101.CAL XBRL Taxonomy Extension Calculation Linkbase Document 101.DEF XBRL Taxonomy Extension Definition Linkbase Document 101.LAB XBRL Taxonomy Extension Label Linkbase Document 101.PRE XBRL Taxonomy Extension Presentation Linkbase Document * Filed herewith. † Management contract or compensatory plan or arrangement. By: /s/ MICHAEL K. NEBORAK Michael K. Neborak Group Chief Financial Officer
(Principal Financial and Accounting Officer)By:/s/ DOMINIC CASSERLEY Dominic Casserley Group /s/ SIR ROY GARDNER /s/ THE RT. HON. SIR JEREMY HANLEY, KCMG /s/ ROBYN S. KRAVIT /s/ WENDY E. LANE /s/ JAMES F. McCANN /s/ JAYMIN B. PATEL /s/ DOUGLAS B. ROBERTS /s/ MICHAEL J. SOMERS /s/ JEFFREY W. UBBEN Date: April 26, 2013
77