CANADIAN PACIFIC KANSAS CITY LIMITED FORM 10-K/A TABLE OF CONTENTS

PART III ITEM 10. DIRECTORS, EXECUTIVE OFFICERS AND CORPORATE GOVERNANCE Directors
Directors On April 14, 2023, Canadian Pacific Railway Limited (“CPRL” or “CP”) assumed control of Kansas City Southern (“KCS”) (through an indirect wholly-owned subsidiary), and filed articles of amendment to change CPRL’s name to Canadian Pacific Kansas City Limited (“CPKC” or “Company”). CPKC owns and operates the only freight railway spanning Canada, the United States (“U.S.”), and Mexico. CPKC provides rail and intermodal transportation services over a network of approximately 20,000 miles, serving principal business centres across Canada, the U.S., and Mexico. CPKC transports bulk commodities, merchandise freight, and intermodal traffic. All of the current directors were elected at the last annual and special meeting of shareholders on June 15, 2023. The directors are qualified and experienced, possessing a broad range of skills that facilitate strong oversight of CPKC’s management and strategy and have agreed to serve on our Board. Share Ownership All directors are CPKC shareholders and must meet our director share ownership requirements within five years of joining the Board. Share ownership listed here is as at March 12, 2024 and includes shares directors beneficially own or control, or hold directly or indirectly. Share ownership includes holdings under the Directors’ Deferred Share Unit (DDSU) plan. See page 51 for full details on share ownership by our directors. 1
Director Profile Highlights 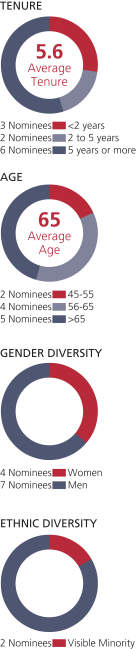
| | | | | | | | Director profilesIsabelle Courville
All nine nominated directors are qualified and experienced, and have agreed to serve on our Board.
All are CP shareholders and must meet our director share ownership requirements within five years of joining the Board.
Share ownership listed here is as at March 15, 2018 and includes shares directors beneficially own or control, or hold directly or indirectly. Share ownership includes holdings under the Directors’ Deferred Share Unit (DDSU) plan.
Directors are elected for a term of one year until the close of the next annual meeting of shareholders, unless a director resigns or is otherwise removed.Chair
| | |
| | | Andrew F. Reardon
Chairman of the Board
|   | | Independent Age:7261 Director since: May 1, 2013 Residence:MarcoMont-Tremblant, Québec, Canada Island, Florida, U.S.A.
20172023 voting results:
99.20%97.74%for
|
| 2017 attendance:DIRECTOR SKILLS AND QUALIFICATIONS
100%
Brings experience in the following areas: senior executive leadership, accounting & financial literacy, accounting & financial expertise, environment, health & safety, executive compensation/human resources, transportation industry knowledge, governance, government/regulatory affairs and legal, risk management, sales & marketing, climate expertise and strategic oversight. |
ChairmanCURRENT PUBLIC COMPANY BOARD EXPERIENCE
Veolia Environnement S.A. (2015 to present) | • | | Chair Research, Innovation and Sustainable Development Committee | |
| • | | Member of Nominations Committee, Purpose Committee and Presidents’ Committee | |
| | | | | | | | OVERALL 2023 ATTENDANCE(1) | | | | | 100% | | | | | | Meeting Attendance | | | | | | | | | | | Board | | 7 of 7 | | | 100% | | | Audit and Finance | | 6 of 6 | | | 100% | | | Governance | | 3 of 3 | | | 100% | | | Compensation | | 6 of 6 | | | 100% | | | Risk and Sustainability | | 3 of 3 | | | 100% | | | Integration | | 3 of 3 | | | 100% | |
BUSINESS EXPERIENCE President of the Board since July Hydro-Québec Distribution and Hydro-Québec TransÉnergie (2007 to 2013) 20 2015. Brings extensiveyears of experience in executive management, law, corporate governancethe Canadian telecommunications industry, including President of Bell Canada’s Enterprise Group (2003 to 2006) and the rail industry BUSINESS EXPERIENCE
Chairman and Chief Executive Officer (2001 to 2008), President and Chief Executive Officer from 2001of Bell Nordiq Group (2002 to 2008, and Vice-President, Law and Human Resources (1992 to 2000) of TTX Company, the leading railcar leasing company in North America
Previously Senior Vice-President, Law and Administration for Illinois Central Railroad2003)
PAST PUBLIC COMPANY BOARD EXPERIENCE | • | | SNC-Lavalin Group Inc. (2017 to 2023) |
Laurentian Bank of Canada (2007 to 2019) (Chair of the Board) Gecina S.A. (2016 to April 2017) TVA Group (2013 to 2016) OTHER EXPERIENCE Other Boards - Current | • | | Institute for Governance of Private and Public Organizations (IGOPP) (2016 to present) (member of Human Resources Committee) |
Other Boards - Past Appvion Inc. (2007Institute of Corporate Directors (ICD) (2013 to 2015) (member2017)
Quebec Institute of the Audit Committee, Compensation Committee and Chair of the Governance Committee)Corporate Directors (IAS) (2013-2022) OTHER EXPERIENCE
Other Boards
TTX Company (2001 to 2008)
Other rail industry boards: Terminal Railroad Association of St. Louis and Peoria and Pekin Union Railway
Presidential appointee to the Railroad Retirement Board (1990 to 1992)
Barriger Railroad Library (St. Louis) Board of Trustees (Board member (1998 to present), and President Emeritus (2009 to 2012)
Other experience
Officer, United States Navy (1967 to 1971)
EDUCATION Bachelor’s degree University of Notre Damein Engineering Physics, École Polytechnique de Montréal Juris Doctor degree, University of Cincinnati
Master’sBachelor’s degree in Taxation, WashingtonCivil Law, McGill University Law School
Doctorate Honoris Causa, Université de Montréal Fellow of the Institute of Corporate Directors SHARE OWNERSHIP Shares: 4,0314,500 DDSUs: 10,463 Options: 063,898
Meets share ownership requirements | (1) | Ms. Courville is an ex-officio member of all standing committees and may attend committee meetings at her discretion. |
2
| | | The Hon. John Baird, P.C.
|   | | Independent
Age:4854 Director since: May 14, 2015 Residence:Toronto, Ontario, Canada 20172023 voting results:
97.94%97.73%for
|
| 2017 attendance:DIRECTOR SKILLS AND QUALIFICATIONS
100%
Brings experience in the following areas: senior executive leadership, environment, health & safety, transportation industry knowledge, governance, government/regulatory affairs and legal, risk management, climate expertise, investment management and strategic oversight. |
Brings senior level executive experience in public policy and regulatory affairs, especially in transport, environment andCanada-U.S. relationsCURRENT PUBLIC COMPANY BOARD EXPERIENCE
Canfor/Canfor Pulp (CPPI) (2016 to present) | | | | | | | | OVERALL 2023 ATTENDANCE | | | | | 100% | | | | | | Meeting Attendance | | | | | | | | | | | Board | | 7 of 7 | | | 100% | | | Governance (Chair) | | 3 of 3 | | | 100% | | | Risk and Sustainability | | 3 of 3 | | | 100% | |
BUSINESS EXPERIENCE Senior Advisor at the law firm of Bennett Jones LLP , Hatch Ltd. (an engineering firm) and(2015 to present) Senior Advisor at Eurasia Group (a geopolitical risk consultancy) (2015 to present) Member of the International Advisory Board, Barrick Gold Corporation (2015 to present) President ofat Grantham Finchley Consulting Inc. (2015 to present) PAST PUBLIC COMPANY BOARD EXPERIENCE Canfor Corporation and Canfor Pulp Products Inc. (2016Osisko Gold Royalties Ltd. (2020 to present) (member of Environmental, Health and Safety Committee; Capital Expenditure Committee and Corporate Governance Committee)January 31, 2024)
OTHER EXPERIENCE Other Boards - Current FWD Group Ltd./FWD Ltd. (2015 to present) (member of AuditRisk Committee) / FWD Group Holdings Ltd. (2022 to present) (Chair of Compensation Committee, member of Nominating and Corporate Governance Committee and Risk Management and Actuarial Committee) PineBridge Investments (2015 to present) Friends of Israel Initiative (2015 to present) (member of the Board)Audit Committee)
Other experience Served as Canadian Foreign Minister, Minister of Transport and Infrastructure, Minister of the Environment, and President of the Treasury Board during his three terms as a Member of the Canadian Parliament (2006 to 2015) Appointed to the Privy Council in 2006 Former Minister of Community and Social Services and Minister of Energy in the Government of Ontario provincial legislature Senior Advisor to Community Living Ontario, an organization that supports individuals with developmental disabilities Advisory Board member toCouncil Member, Prince’s CharitiesTrust Canada, the charitable office of His Royal Highness The Prince of WalesMajesty King Charles III EDUCATION Honours Bachelor of Arts (Political Studies), Queen’s University SHARE OWNERSHIP Shares: 0 DDSUs: 3,23942,235 Options: 0
Has until May 2020 to meet theMeets share ownership requirements
1
| | | | | | | Isabelle CourvilleKeith E. Creel
|  |  | Not Independent Age: 55 Director since: May 14, 2015 Residence: Wellington,Florida, U.S.A. 2023 voting results: 99.91%for |
| DIRECTOR SKILLS AND QUALIFICATIONS President and Chief Executive Officer of the Company since January 31, 2017. Brings experience in the following areas: senior executive leadership, accounting & financial literacy, environment, health & safety, executive compensation/human resources, transportation industry knowledge, governance, government/regulatory affairs and legal, risk management, sales & marketing and strategic oversight. |
| | | | | | | | OVERALL 2023 ATTENDANCE | | | | | 100% | | | | | | Meeting Attendance | | | | | | | | | | | Board | | 7 of 7 | | | Independent
Age:55
Director since:
May 1, 2013
Residence:Rosemère, Québec, Canada
2017 voting results:
94.94%for
2017 attendance:100%
| |
Brings significant executive level management experience including financial and legal expertise
BUSINESS EXPERIENCE President ofHydro-Québec Distribution andHydro-Québec TransÉnergie (2007 to 2013)
20 years of experience inBecame the Canadian telecommunications industry, including President of Bell Canada’s Enterprise Group (2003 to 2006) andfirst President and Chief Executive Officer of Bell Nordiq Group (2002 to 2003)
PUBLIC COMPANY BOARD EXPERIENCE
SNC Lavalin (2017 to present) (memberCPKC on April 14, 2023 with the combination of GovernanceCanadian Pacific and Ethics Committee)Kansas City Southern
Laurentian Bank of Canada (2007 to present) (Chair of the Board and member of Human Resources and Corporate Governance Committee)
Veolia Environment (2015 to present) (member of Audit Committee and Research and Development Committee)
Gecina S.A. (2016 to April 2017) (member of Audit Committee)
TVA Group (2013 to 2016)
OTHER EXPERIENCE
Other Boards
Institute of Corporate Directors (ICD) (2013 to present)
Institute for Governance of Private and Public Organizations (IGOPP) (2016 to present)
EDUCATION
Bachelor’s degree in Engineering Physics, Ecole Polytechnique de Montréal
Bachelor’s degree in Civil Law, McGill University
Doctorate Honoris Causa, University of Montréal
SHARE OWNERSHIP
Shares: 900
DDSUs: 6,292
Options: 0
Meets share ownership requirements
| | | | | | Keith E. Creel
| |  | | | Not Independent
Age:49
Director since:
May 14, 2015
Residence:Wellington,
Florida, U.S.A.
2017 voting results:
99.61%for
2017 attendance:100%
|
President and Chief Executive Officer of CP since January 31, 2017. Brings extensive railroad operating experience and expertise in executive management and marketing and sales
BUSINESS EXPERIENCE
President and Chief Executive Officer of CP (2017 to present, April 14, 2023) President and Chief Operating Officer of CP (February 2013(2013 to January 2017) Named “Railroad Innovator” for 2014 by Progressive Railroading in recognition of his leadership at CP
Executive Vice-President and Chief Operating Officer of Canadian National Railway Company (CN) (2010 to 2013) Other positions at CN included Executive Vice- President,Vice-President, Operations, Senior Vice-President Eastern Region, Senior Vice-President Western Region, and Vice-President of CN’s Prairie division (2002 to 2010) Superintendent and general manager at Grand Trunk Western Railroad (1999 to 2002) Trainmaster and director of corridor operations at Illinois Central Railway prior to its merger with CN in 1999 Superintendent and general manager at Grand Trunk Western Railroad (1999 to 2002)
Began his railroad career in 1992 as an intermodal ramp manager at Burlington Northern Railway in Birmingham, Alabama INDUSTRY RECOGNITIONS Named “2021 CEO of the Year” and “2021 Strategist of the Year” by The Globe and Mail’s Report on Business Magazine Named “Railroader of the Year” for 2022 & 2021 by Railway Age magazine Named “Railroad Innovator” for 2014 by Progressive Railroading in recognition of his leadership at CP. OTHER EXPERIENCE Other Boards - Current Member of the Board of TTX Company (2014 to present)
Representative on American Association of American Railroads Other experience Commissioned officer in the U.S. Army and served in the Persian Gulf War in Saudi Arabia EDUCATION Bachelor of Science in Marketing, Jacksonville State University Advanced Management Program, Harvard Business School SHARE OWNERSHIP Shares: 2,411Shares(1): 96,723
DSUs*DSUs: 164,889
PSUs: 236,415 Options(2): 31,218 Options*: 579,5462,609,378
Meets executive share ownership requirements (see page 31)15) *(1) | | Mr. Creel received a special make-whole DSU grant when he was hiredReflects CPKC shares in 2013Employee Share Purchase Plan, 401(k) and a stand-alone stock option award as part of his executive compensation.personal accounts. |
| (2) | Reflects stock options outstanding as of Record Date. |
3
| | | | | | | Gillian (Jill) H. DenhamAmb. Antonio Garza (Ret.)(1)
| |  |  | | Independent Age:5764 Director since: September 6, 2016June 15, 2023
Residence:Toronto, Ontario, CanadaMexico City, Mexico (U.S. Citizen) 20172023 voting results:
99.30%99.90%for
|
| 2017 attendance:100%DIRECTOR SKILLS AND QUALIFICATIONS
Brings experience in the following areas: senior executive leadership, transportation industry knowledge, governance, government/regulatory affairs and legal, risk management and strategic oversight. |
Brings significant experience in finance, corporate governance, human resources and executive management
BUSINESS EXPERIENCE
Vice Chair Retail Markets for CIBC (2001 to 2005)
Previously held senior positions at Wood Gundy and CIBC, including: Managing Director Head of Commercial Banking andE-Commerce; President of Merchant Banking/Private Equity and Managing Director Head responsible for the bank’s European Operations
CURRENT PUBLIC COMPANY BOARD EXPERIENCE The Greenbriar Companies (2021 to present) | • | | Member of the Nominating and Corporate Governance Committee | |
| | | | | | | | OVERALL 2023 ATTENDANCE(2) | | | | | 100% | | | | | | Meeting Attendance | | | | | | | | | | | Board | | 5 of 5 | | | 100% | | | Governance | | 2 of 2 | | | 100% | | | Risk and Sustainability | | 2 of 2 | | | 100% | |
BUSINESS EXPERIENCE Morneau Shepell Inc. (2008Counsel to the law firm of White & Case LLP, Mexico City (2009 to present)
PAST PUBLIC COMPANY BOARD EXPERIENCE MoneyGram International (2012 to 2023) Americas Technology Acquisition Corp (2022) Kansas City Southern (2010 to April 13, 2023) Basic Energy Services (2010 to 2016) OTHER EXPERIENCE Other Boards - Current Grupo KUA, S.A. de C.V. (Independent Director) Southern Methodist University (Board Trustee member) Americas Council/Council of the Americas Society (Director) Texas Tribune (Director) American Chamber de Mexico (Honorary Director) George W. Bush Foundation (Director) Other Boards - Past Tricolor Holdings, LLC (2019 to 2023) Grupo ODH, Lux S.A.(2014 to 2023) BBVA Compass and the U.S Companies of BBVA (2009 to 2012) Saavi Energia de Mexico (2018 to 2020) Other Experience Chairman, Vianovo Ventures (2009 to present) United States Ambassador to Mexico (2002 to 2009) Chairman, Texas Railroad Commission (1998 to 2002) Vice Chairman, Interstate Oil and Gas Compact Commission (1998-2002) Partner, Bracewell Law Firm (2017) Secretary of State, State of Texas (1995 to 1997) Senior Policy Advisor, Governor of the State of Texas (1994 to 1997) Cameron County Judge (1988 to 1994) EDUCATION JD (Doctor of Jurisprudence), Southern Methodist University School of Law BBA Finance, University of Texas at Austin RECOGNITIONS Aguila Azteca/Aztec Eagle Distinguished Alumni at both the University of Texas at Austin and the Southern Methodist University, Dallas, TX SHARE OWNERSHIP Shares: 12,828 DDSUs: 2,589 Expected to meet share ownership requirements in 2028 | | | Hon. Edward R. Hamberger |  | | Independent Age: 73 Director since: July 15, 2019 Residence: Delray Beach, Florida, U.S.A. 2023 voting results: 99.90% for |
| DIRECTOR SKILLS AND QUALIFICATIONS Brings experience in the following areas: senior executive leadership, accounting & financial literacy, environment, health & safety, executive compensation/human resources, transportation industry knowledge, governance, government/regulatory affairs and legal, risk management and strategic oversight. |
| | | | | | | | OVERALL 2023 ATTENDANCE(3) | | | | | 100% | | | | | | Meeting Attendance | | | | | | | | | | | Board | | 7 of 7 | | | 100% | | | Audit and Finance | | 4 of 4 | | | 100% | | | Integration | | 3 of 3 | | | 100% | | | Risk and Sustainability | | 3 of 3 | | | 100% | |
BUSINESS EXPERIENCE President and Chief Executive Officer, Association of American Railroads (1998 to 2019) OTHER EXPERIENCE Other Boards - Current Transportation Institute, University of Denver (2002 to present) Other Boards - Past Business Advisory Committee, Kellogg School of Management, Northwestern University (2000 to 2019) TTCI (Chair of the Board and Chair of the Governance Committee)Board) (1998 to 2019) National Bank of Canada (2010Railinc Corporation (1998 to present) (member of Human Resources Committee)2019)
Kinaxis Inc. (2016Mineta Transportation Institute, San Jose State University (2005 to present) (member of Nominating and Governance2019)
Baker Donelson, Management Committee and Audit Committee)(1989 to 1998) Markit Ltd. (2014Asociación Mexicana de Ferrocarriles (2005 to 2016)2008)
Penn West Petroleum (2012 to 2016)
Calloway Real Estate Investment Trust (2011 to 2012)
OTHER EXPERIENCE
Other Boards Munich Reinsurance Company of Canada (Chair) (2012 to present)
Temple Insurance Company (Chair) (2012 to present)
Centre for Addiction and Mental Health (CAMH) (Board member and Chair of the Investment Committee)
EDUCATIONExperience
Honours Business Administration (HBA) degree, Ivey Business School, WesternServed as Assistant Secretary for governmental affairs at the U.S. Department of Transportation (1987 to 1989)
EDUCATION Juris Doctor, Georgetown University MBA, Harvard Business SchoolMaster of Science, Foreign Service, Georgetown University
Bachelor of Science, Foreign Service, Georgetown University SHARE OWNERSHIP Shares: 0 DDSUs: 1,50916,527 Options: 0
Has until September 2021Expected to meet share ownership requirements in 2024
| (1) | Identifies as a visible minority. |
| (2) | Mr. Garza was appointed to the Board of CPRC and appointed a member of the CPRC Corporate Governance, Nominating and Social Responsibility Committee and CPRC Risk and Sustainability Committee on April 14, 2023. Mr. Garza was subsequently elected to the Board of CPKC and appointed a member of the CPKC Corporate Governance, Nominating and Society Responsibility Committee and the CPKC Risk and Sustainability Committee on June 15, 2023. |
| (3) | The Hon. Ed Hamberger became Chair of the Integration Committee on January 31, 2023. The Hon. Ed Hamberger ceased to be a member of the Audit and Finance Committee on June 15, 2023. |
4
| | | Janet H. Kennedy |  | | Independent Age: 63 Director since: June 15, 2023 Residence: Naples, Florida, U.S.A. 2023 voting results: 99.93% for |
| DIRECTOR SKILLS AND QUALIFICATIONS Brings experience in the following areas: senior executive leadership, accounting & financial literacy, accounting & financial expertise, executive compensation/human resources, transportation industry knowledge, investment management, governance, risk management, sales & marketing, cybersecurity trainingand strategic oversight. |
CURRENT PUBLIC BOARD EXPERIENCE Duluth Holdings Inc. (2023 to present) | • | | Member of the Audit Committee | |
| | | | | | | | OVERALL 2023 ATTENDANCE(1) | | | | | 100% | | | | | | Meeting Attendance | | | | | | | | | | | Board | | 5 of 5 | | | 100% | | | Audit and Finance | | 3 of 3 | | | 100% | | | Risk and Sustainability | | 2 of 2 | | | 100% | |
BUSINESS EXPERIENCE Vice President, North America Regions of Google Cloud at Google (2019 to April, 2023) Partner/Principal, Americas Advisory Digital Transformation Leader of Ernst & Young (2018 to 2019) Vice President of US Digital Transformation for Microsoft Corp. (2018 to 2019) President of Microsoft Canada (2013 to 2017) Vice President, U.S. Enterprise of Microsoft Corp. (2009 to 2013) Vice President, Central Region EPG for Microsoft Corp. (2002 to 2013) Business Unit Executive for IBM (1990 to 2002) PAST PUBLIC COMPANY BOARD EXPERIENCE Kansas City Southern (2017 to 2018 and from 2019 to April 13, 2023) OTHER EXPERIENCE Other Boards - Past Information Technology Association of Canada (2013 to 2017) Business Council of Canada (2014 to 2017) EDUCATION BSIM, Industrial Mgmt/Industrial Engineering, Purdue University, Daniels School of Business MBA, Queens University of Charlotte Directors Consortium 2018, Stanford Graduate School of Business Executive Education Diligent Cyber Risk and Strategy Certification SHARE OWNERSHIP Shares: 7,944 DDSUs: 2,589 Expected to meet share ownership requirements in 2028 | | | Henry Maier |  | | Independent Age: 70 Director since: June 15, 2023 Residence: Gallatin, Tennessee, U.S.A. 2023 voting results: 93.82% for |
| DIRECTOR SKILLS AND QUALIFICATIONS Brings experience in the following areas: senior executive leadership, accounting & financial literacy, executive compensation/human resources, transportation industry knowledge, governance, risk management, sales & marketingand strategic oversight. |
CURRENT PUBLIC COMPANY BOARD EXPERIENCE CalAmp Corp. (2021 to present) | • | | Member of the Governance and Nominating Committee and the Human Capital Committee | |
CarParts.com (2021 to present) | • | | Member of the Nominating and Corporate Governance Committee | |
CH Robinson Worldwide Inc. (2022 to present) | • | | Member of the Governance Committee and the Capital Allocation and Planning Committee | |
| | | | | | | | OVERALL 2023 ATTENDANCE(2) | | | | | 100% | | | | | | Meeting Attendance | | | | | | | | | | | Board | | 5 of 5 | | | 100% | | | Compensation | | 4 of 4 | | | 100% | | | Integration | | 3 of 3 | | | 100% | |
BUSINESS EXPERIENCE President and Chief Executive Officer of FedEx Ground (2013 to 2021) Executive Vice President, Strategic Planning, Communications, and Contractor Relations for FedEx Corp. (2009 to 2013) PAST PUBLIC COMPANY BOARD EXPERIENCE Kansas City Southern (2017 to April 13, 2023) OTHER EXPERIENCE Other Boards - Past United Way of Southwestern Pennsylvania EDUCATION Bachelor of Arts in Economics, University of Michigan SHARE OWNERSHIP Shares: 26,206 DDSUs: 2,589 Meets share ownership requirements 2
| (1) | Ms. Kennedy was appointed to the Board of CPRC and appointed a member of the CPRC Audit and Finance Committee and CPRC Risk and Safety Committee on April 14, 2023. Ms. Kennedy was subsequently elected to the Board of CPKC and appointed a member of the CPKC Audit and Finance Committee and the CPKC Risk and Safety Committee on June 15, 2023. |
| (2) | Mr. Maier was appointed to the Board of CPRC and appointed a member of the CPRC Management Resources and Compensation Committee and the CPRC Integration Committee on April 14, 2023. Mr. Maier was subsequently elected to the Board of CPKC and appointed a member of the CPKC Management Resources and Compensation Committee and the CPKC Integration Committee on June 15, 2023. |
5
| | | | | | | Rebecca MacDonaldMatthew H. Paull(1)
| |  |  | | Independent Age:6472 Director since: May 17, 2012January 26, 2016
Residence:North York, Ontario, CanadaWilmette, Illinois, U.S.A. 20172023 voting results:
97.60%98.53%for
|
| 2017 attendance:100%DIRECTOR SKILLS AND QUALIFICATIONS
Brings experience in the following areas: senior executive leadership, accounting & financial literacy, accounting & financial expertise, executive compensation/human resources, investment management, governance, government/regulatory affairs and legal, risk management and strategic oversight. |
Brings extensive executive management, marketing, sales and corporate governance experience
BUSINESS EXPERIENCE
Founder and current Executive Chair of Just Energy Group Inc., a Toronto-based independent marketer of deregulated gas and electricity
President and Chief Executive Officer of Just Energy (2001 to 2007)
Founded Energy Savings Income Fund in 1997, another company which aggregated customers in the deregulation of the U.K. natural gas industry
Founded Energy Marketing Inc. in 1989
CURRENT PUBLIC COMPANY BOARD EXPERIENCE Air Products & Chemicals Corporation (2013 to Present) Just Energy Group Inc. (2001 to present) (Executive Chair since 2007)
OTHER EXPERIENCE
Other Boards
Horatio Alger Association in both Canada and the United States
Other experience
Founded the Rebecca MacDonald Centre for Arthritis and Autoimmune Disease at Mount Sinai Hospital in Toronto
Previously Vice-Chair of the Board of Directors of Mount Sinai Hospital
Previously a member of the Board of Governors of the Royal Ontario Museum
EDUCATION
Honorary LLD degree, University of Victoria
SHARE OWNERSHIP
Shares: 0
DDSUs: 9,187
Options: 0
Meets share ownership requirements
| | | | | | Matthew H. Paull
| | |  | | Chair of Audit and Finance Committee | |
| • | | Member of Corporate Governance and Nominating Committee and Executive Committee | |
| | | | | | | | OVERALL 2023 ATTENDANCE(2) | | | | | 90% | | | | | | Meeting Attendance | | | | | | | | | | | Board | | 6 of 7 | | | Independent
Age:66
Director since:
January 26, 2016
Residence:Willmette, Illinois, U.S.A.
2017 voting results:
98.96%for
2017 attendance:86%
| | | Compensation (Chair) | | 6 of 6 | | | 100% | | | Audit and Finance | | 5 of 6 | | | 83% | |
Brings significant expertise in financial markets, corporate finance, accounting and controls, and investor relations and extensive experience in international operations and marketing
BUSINESS EXPERIENCE Senior Executive Vice-President and Chief Financial Officer of McDonald’s Corporation (2001 until his retirement in 2008)
before joining McDonald’s in 1993, was a partner at Ernst & Young where he managed a variety of financial practices during his18-year career and consulted with many leading multinational corporations
| • | | Senior Executive Vice-President and Chief Financial Officer of McDonald’s Corporation (2001 until his retirement in 2008)(3) |
| • | | Before joining McDonald’s in 1993, was a partner at Ernst & Young where he managed a variety of financial practices during his 18-year career and consulted with many leading multinational corporations |
PAST PUBLIC COMPANY BOARD EXPERIENCE Chipotle Mexican Grill Inc. (2016 to present) Air Products & Chemicals Corporation (2013 to present) (Chair of Audit Committee and member of Corporate Governance and Nominating Committee and Executive Committee)
KapStone Paper and Packaging Corporation (2010 to present) (Chair of Audit Committee until 2018 and member2020) (member of Compensation Committee)
Best Buy Co. (2003 to 2013) (lead(Lead independent director and chair of Finance Committee) WMS Industries Inc. (2012 to 2013) KapStone Paper and Packaging Corporation (2010 to 2018) OTHER EXPERIENCE Other Boards - Past Pershing Square Capital Management, L.P. (2008 to 2023) (member of Advisory Board) EDUCATION Master’s degree in Accounting, University of Illinois Bachelor’s degree, University of Illinois SHARE OWNERSHIP Shares: 1,00018,690 DDSUs: 3,35045,791 Options: 0
Has until January 2021 to meet theMeets share ownership requirements
| | | | | | | Jane L. Peverett(1) | |  |  | | Independent Age:5965 Director since: December 13, 2016 Residence:WestVancouver, British Columbia, Canada 20172023 voting results:
99.31%98.93%for
|
| 2017 attendance:100%DIRECTOR SKILLS AND QUALIFICATIONS
Brings experience in the following areas: senior executive leadership, accounting & financial literacy, accounting & financial expertise, environment, health & safety, executive compensation/human resources, governance, government/regulatory affairs and legal, risk management and strategic oversight. |
Brings significant Board and senior management experience and extensive knowledge and training in finance, accounting and corporate governanceCURRENT PUBLIC COMPANY BOARD EXPERIENCE
Northwest Natural Gas Company (2007 to present) | • | | Chair of Audit Committee | |
| • | | Member of Governance Committee and Organization and Executive Compensation Committee | |
Capital Power Corporation (2019 to present) | • | | Member of People, Culture and Governance Committee and the Health, Safety and Environment Committee | |
Suncor Energy Inc. (2023 to present) | • | | Member of the Audit Committee and Governance Committee | |
| | | | | | | | OVERALL 2023 ATTENDANCE | | | | | 100% | | | | | | Meeting Attendance | | | | | | | | | | | Board | | 7 of 7 | | | 100% | | | Audit and Finance (Chair) | | 6 of 6 | | | 100% | | | Governance | | 3 of 3 | | | 100% | |
BUSINESS EXPERIENCE President & Chief Executive Officer of BC Transmission Corporation (electrical transmission) (2005 to 2009) Vice-President, Corporate Services and Chief Financial Officer of BC Transmission Corporation (2003 to 2005)
| • | | Vice-President, Corporate Services and Chief Financial Officer of BC Transmission Corporation (2003 to 2005)(3) |
President of Union Gas Limited (a natural gas storage, transmission and distribution company) (2002 to 2003) Other positions at Union Gas Limited: President & Chief Executive Officer (2001 to 2002); Senior Vice-President Sales & Marketing (2000 to 2001) and Chief Financial Officer (1999 to 2000)
| • | | Other positions at Union Gas Limited: President & Chief Executive Officer (2001 to 2002); Senior Vice-President Sales & Marketing (2000 to 2001) and Chief Financial Officer (1999 to 2000)(3) |
PAST PUBLIC COMPANY BOARD EXPERIENCE CIBC (2009 to present) (Chair of Audit Committee)
Hydro One Limited (2015 to present) (member of Human Resources Committee and Chair of Nominating, Corporate Governance, Public Policy & Regulatory Committee)
Northwest Natural Gas Company (2007 to present) (member of Organization and Executive Compensation Committee and Public Affairs and Environmental Policy Committee)
Encana Corp. (2003 to 2017) Postmedia Network Canada Corp. (2013 to 2016) | • | | HydroOne Limited (2015 to 2018) |
CIBC (2009 to April 2023) OTHER EXPERIENCE Other Boards - Current CSA Group (2019 to present) (Chair of the Board) British Columbia Institute of Corporate Directors Executive CommitteeAdvisory Board EDUCATION Bachelor of Commerce degree, McMaster University Master of Business Administration degree, Queen’s University Certified Management Accountant A Fellow of the Society of Management Accountants Holds the ICD.D designation from the Institute of Corporate Directors SHARE OWNERSHIP Shares: 0 DDSUs: 1,27530,406 Options: 0
Has until January 2021 to meet theMeets share ownership requirements
3
| (1) | Mr. Paull and Ms. Peverett meet the SEC definition of “Audit Committee Financial Expert”. |
| (2) | Mr. Paull missed a one hour board and audit committee meeting during July of 2023 due to a prescheduled ankle surgery. |
| (3) | Mr. Paull is an audit financial expert by virtue of, among other things, having been the CFO of a public company. Ms. Peverett is an audit financial expert by virtue of, among other things her past CFO experience and related background. |
6
| | | | | | | Gordon T. Trafton IIAndrea Robertson
| |  |  | | Independent Age:6460 Director since: January 1, 2017July 15, 2019
Residence:Naperville, Illinois, U.S.A.Calgary, Alberta, Canada 20172023 voting results:
99.16%99.22%for
2017 attendance:100%
|
| DIRECTOR SKILLS AND QUALIFICATIONS Brings experience in the following areas: senior executive leadership, accounting & financial literacy, environment, health & safety, executive compensation/human resources, transportation industry knowledge, governance, government/regulatory affairs and legal, risk management, and strategic oversight. |
| | | | | | | | OVERALL 2023 ATTENDANCE | | | | | 100% | | | | | | Meeting Attendance | | | | | | | | | | | Board | | 7 of 7 | | | 100% | | | Governance | | 3 of 3 | | | 100% | | | Compensation | | 6 of 6 | | | 100% | | | Integration | | 3 of 3 | | | 100% | |
BUSINESS EXPERIENCE Chair of the Board, Calgary Airport Authority (2023 to present) President & Chief Executive Officer, Shock Trauma Air Rescue Service (STARS) (2011 to 2023) President & Chief Operating Officer, STARS (2011 to 2012) Chief Nursing and Health Professions Officer, Alberta Health Services (2009 to 2011) Vice President, Foothills Medical Centre (2008 to 2009) Vice President, Alberta Children’s Hospital (2008 to 2009) Vice President, South Health Campus (2005 to 2007) Brings extensive experienceOTHER EXPERIENCE
Other Boards - Current The Calgary Airport Authority (2017 to present) Other Boards - Past Bow Valley College (2015 to 2018) United Way (2007 to 2013) University of Alberta, Faculty of Medicine & Dentistry (2021 to 2023) EDUCATION Executive Leadership, Harvard University ICD.D Rotman School of Business Masters in the rail industry including executive positionsHealth-Care Administration, Central Michigan University Baccalaureate of Nursing, University of Calgary Executive Fellowship, Wharton University SHARE OWNERSHIP Shares: 0 DDSUs: 16,141 Expected to meet share ownership requirements in rail operations, sales and marketing and risk management2024 | | | Gordon T. Trafton(1) |  | | Independent Age: 70 Director since: January 1, 2017 Residence: Naperville, Illinois, U.S.A. 2023 voting results: 99.28%for |
| DIRECTOR SKILLS AND QUALIFICATIONS Brings experience in the following areas: senior executive leadership, accounting & financial literacy, environment, health & safety, executive compensation/human resources, transportation industry knowledge, governance, government/regulatory affairs and legal, risk management, sales & marketing and strategic oversight. |
| | | | | | | | OVERALL 2023 ATTENDANCE(2) | | | | | 100% | | | | | | Meeting Attendance | | | | | | | | | | | Board | | 7 of 7 | | | 100% | | | Governance | | 2 of 2 | | | 100% | | | Risk and Sustainability (Chair) | | 3 of 3 | | | 100% | | | Integration | | 3 of 3 | | | 100% | |
BUSINESS EXPERIENCE Consultant, Brigadier Consulting (2014 to 2015) Consultant, CPKC (f/k/a Canadian Pacific Railway Limited) (2013) Special Advisor to the Canadian National Railway (CN) leadership team (2009 to his retirement in 2010) Senior Vice-President Strategic Acquisitions and Integration, Canadian National Railway (2003CN (2009 to 2009)2010) Senior Vice-President, Southern Region, Canadian National RailwayCN (2003 to 2009) heldVice-President, Operations Integration, CN (2001 to 2003)
Vice-President, Transportation and IT Services, Illinois Central Railroad (1999 to 2001) Held a number of leadership positions with Illinois Central Railroad and Burlington Northern Railroad OTHER EXPERIENCE Other Boards - Current Leeds School of Business Advisory Board, of Alumni and Friends, University of Colorado Boulder (Chair)(2012 to present) Sacred Cow Consulting, Inc., Advisory Board (2020 to present) Pacific National (2023 to present) EDUCATION Bachelor of Science, Transportation Management from the Leeds School of Business, University of Colorado Boulder SHARE OWNERSHIP Shares: 0 DDSUs: 1,45130,065 Options: 0
Has until January 2022 to meet theMeets share ownership requirements
Notes:
| (1) | Identifies as a visible minority. |
| (2) | Mr. Trafton ceased to be a member of the Corporate Governance, Nominating and Social Responsibility Committee on June 15, 2023. |
7
| Other than as disclosed below, none of the nominated directors is, or has been in the last 10 years: (a) | a director, chief executive officer or chief financial officer of a company that: |
was subject to a cease trade or similar order or an order that denied the issuer access to any exemptions under securities legislation for over 30 consecutive days, that was issued while the proposed director was acting in that capacity, or
was subject to a cease trade or similar order or an order that denied the issuer access to an exemption under securities legislation for over 30 consecutive days, that was issued after the proposed director ceased to be a director, chief executive officer or chief financial officer and which resulted from an event that occurred while that person was acting in that capacity
• was subject to a cease trade or similar order or an order that denied the issuer access to any exemptions under securities legislation for over 30 consecutive days, that was issued while the proposed director was acting in that capacity, or • was subject to a cease trade or similar order or an order that denied the issuer access to an exemption under securities legislation for over 30 consecutive days, that was issued after the proposed director ceased to be a director, chief executive officer or chief financial officer and which resulted from an event that occurred while that person was acting in that capacity (b) | a director or executive officer of a company that, while that proposed director was acting in that capacity, or within a year of that person ceasing to act in that capacity, became bankrupt, made a proposal under any legislation relating to bankruptcy or insolvency or was subject to or instituted any proceedings, arrangement or compromise with creditors or had a receiver, receiver manager or trustee appointed to hold its assets, or |
(c) | become bankrupt, made a proposal under any legislation relating to bankruptcy or insolvency, or become subject to or instituted any proceedings, arrangement or compromise with creditors, or had a receiver, receiver manager or trustee appointed to hold their assets.assets, or(d) subject to any penalties or sanctions imposed by a court relating to securities legislation or by a securities regulatory authority or has entered into a settlement agreement with a securities commission. Ms. Peverett was a director of Postmedia Network Canada Corp. (Postmedia) from April 2013 to January 2016. On October 5, 2016, Postmedia completed a recapitalization transaction under a court-approved plan of arrangement under the CBCA. Approximately US$268.6 million of debt was exchanged for shares that represented approximately 98 percent of the outstanding shares of Postmedia at that time. Postmedia repaid, extended and amended the terms of its outstanding debt obligations. |
Ms. Denham served as a director of Penn West Petroleum from June 2012 to June 2016, which was subject to cease trade orders on its securities following the July 2014 announcement of the review of it accounting practices and restatement of its financial statements. Those cease trade orders ended on September 23, 2014.
Ms. Peverett was a director of Postmedia Network Canada Corp. (Postmedia) from April 2013 to January 2016. On October 5, 2016, Postmedia completed a recapitalization transaction under a court-approved plan of arrangement under the Canada Business Corporations Act. Approximately US$268.6 million of debt was exchanged for shares that represented approximately 98% of the outstanding shares at that time. Postmedia repaid, extended and amended the terms of its outstanding debt obligations.8
4
Executive Officers The information regarding executive officers is included in Part I1 of our 20172023 Form 10-K under Information about our Executive Officers, of the Registrant, following Item 4. Mine Safety Disclosures Section 16(a) Beneficial Ownership Reporting Compliance
Section 16(a) of the Exchange Act required our directors and executive officers, and any certain persons owning more than 10% of our common shares, to file certain reports of ownership and changes in ownership with the SEC. As of June 30, 2017, Section 16(a) of the Exchange Act no longer applied to us because we qualified as a foreign private issuer under U.S. securities laws. Based solely on our review of the copies of Forms 3, 4 and 5 filed between January 1, 2017 and June 30, 2017, we believe that all reports required to be filed under Section 16(a) were made on a timely basis with respect to transactions that occurred during such period.Disclosures.
Code of Business Ethicsethics and business ethics reporting policy(1) Our updated code of business ethics (Code) for the combined CPKC, which now applies to employees of CPKC in Canada and the United States, sets out our expectations for conduct. It covers confidentiality, protecting our assets, avoiding conflicts of interest, fair dealing with third parties, compliance with applicable laws, environmental protection, rules and regulations, as well as reporting any illegal or unethical behaviour, among other things. The codeCode applies to everyone at CP and our subsidiaries: directors, officers, employees (unionized andnon-unionized) and contractors who do work for us. Directors, officers andnon-union employees must sign an acknowledgementacknowledge every year that they have read, understood and agree to comply with the code. Directors mustCode. We have also confirm annuallyintroduced a separate Code of Ethics for CPKC employees in Mexico (Mexico Code). The Mexico Code is largely identical to the Code, with key differences being that the Mexico Code is presented in Spanish and cross references policies for Mexico. We also have a Business ethics reporting policy (Business Ethics Policy) that outlines the processes the Company has established for our personnel and others to report concerns regarding conduct within the Company, including questionable management and/or corporate practices, the potential violation of any applicable law, or a potential violation of the Code. Our Business Ethics Policy now applies to employees in Canada and the United States. We have a separate but largely identical Business Ethics Reporting Policy for our Mexico based employees (Mexico Business Ethics Policy), with the key differences being reference to Mexico based policies and presentation in Spanish. Legacy CP All legacy Canadian Pacific non-unionized employees were required to complete online scenario based training to ensure that they have compliedunderstood the legacy CP Code of Business Ethics. For the 2022/2023 survey year, 100 percent of non-union employees completed this training. In addition, legacy CP unionized employees in the Teamsters Canada Rail Conference (Train and Engine) were also required to complete scenario based training and 100% of those employees completed the scenario based training. Legacy KCS and Legacy KCSM All legacy KCS and KCSM employees completed the legacy KCS and KCSM conflict of interest survey questionnaire. The survey was launched prior to integration with legacy CP and the code. The code is partprocess was completed shortly after the combination of the termsCPKC. 100 percent of legacy KCS and conditions of employment fornon-unionKCSM employees and contractors must agree to follow principles of standards of business conduct consistent with those set out in our code as part of the terms of engagement.management completed this survey. We also have a supplemental code of ethics for the CEO and other senior financial officers (the CFO(including the Executive Vice-President and Chief Financial Officer, the Vice-President Capital Markets, Senior Vice-President of Accounting, Planning and Procurement and the Assistant Vice-President and Controller) which sets out our longstandinglong-standing principles of conduct for these senior roles. A copyThe latest version of the code (and any amendments)Code and the business ethics reporting policy is posted on our website (www.cpr.ca)(investor.cpkcr.com/governance). Only the Board or Governance Committee (audit committee(Audit and Finance Committee in the case of the CEO and senior financial officers) can waive an aspect of the code.Code. Any waivers are posted on our website. NoneNo waivers were requested or granted in 2017.2023.
Monitoring compliance and updating the Code The Governance Committee is responsible for monitoring compliance with the Code, reviewing it periodically and recommending changes as appropriate, and promptly disclosing any aspects of the Code that have been waived. The Audit and Finance Committee ensures compliance with the Code. Corporate Governance CPKC has a strong governance culture and we have adopted many leading policies and practices. As a U.S. and Canadian listed company, our corporate governance practices comply with or exceed the requirements ofpractices outlined by the Canadian Securities Administrators (CSA) in National Policy58-201 Effective Corporate Governance Guidelines and the Toronto Stock Exchange (TSX), Item 407 of RegulationS-K ofTSX, the SEC and the NYSE. | (1) | Our Code of Business Ethics and the Code of Business Ethics for Mexico employees were updated in November, 2023. Our Business Ethics Reporting Policy and Business Ethics Reporting Policy for employees in Mexico were updated in February, 2024. |
9
We regularly review our policies and practices and make changes as appropriate, so we stay at the forefront of good governance as standards and guidelines continue to evolve in Canada and the United States. The Board and the Governance Committee are responsible for developing our approach to corporate governance. This includes annual reviews of the corporate governance principles and guidelines which were established by the Board, as well as the terms of reference for the Board and each of the New York StockBoard’s standing committees. CP’s corporate governance principles and guidelines are available on our website at investor.cpr.ca/governance. Audit and Finance Committee CP’s Audit and Finance Committee has been established in accordance with Section 3(a)(58)(A) of the Exchange (NYSE). Act and NYSE standards and CSA National Instrument 52-110-Audit Committees. The current members of the Audit and Finance Committee are Jane Peverett (Chair), Isabelle Courville, Jill Denham, David Garza-Santos, Janet Kennedy and Matthew Paull, all of whom are independent. All members of the Audit and Finance Committee are “financially literate” as required by the NYSE and applicable Canadian securities laws. Of the current Audit and Finance Committee members, Ms. Peverett, Ms. Kennedy, Ms. Courville and Mr. Paull have been determined to be “audit committee financial experts” as defined by the SEC. If significant corporate governance differences between CP’s corporate governance practices and Item 303A of the NYSE arise, they will be disclosed on our website at investor.cpr.ca/governance. CP’s audit committee has been established in accordance with Section 3(a)(58)(A) the Exchange Act and NYSE standards and CSA National Instrument52-110. The current members of the audit committee are Jane Peverett (chair), Jill Denham and Andrew Reardon, all of whom are independent. All members of the audit committee are “financially literate” as required by the NYSE and CSA. Ms. Peverett and Mr. Reardon have been determined to meet the audit committee financial expert criteria prescribed by the SEC.
10
ITEM 11. EXECUTIVE COMPENSATION As a foreign private issuer in the United States, we are deemed to comply with this Item if we provide information required by Items 6.B and 6.E.2 of Form20-F, with more detailed information provided if otherwise made publicly available or required to be disclosed in Canada. We have provided information required by Items 6.B and 6.E.2 of Form20-F in our management proxy circular related to the Meeting (the “proxy circular”) and have filed it through the Canadian System for Electronic Document Analysis and Retrieval (“SEDAR”), the Canadian equivalent of the SEC’s Next-Generation EDGAR system, at www.sedar.com. In addition, our proxy circular has been furnished to the SECthis Annual Report on Form8-K.10-K/A. As a foreign private issuer in the U.S., we are not required to disclose executive compensation according to the requirements of RegulationS-K that apply to U.S. domestic 5
issuers, and we are otherwise not required to adhere to the U.S. requirements relative to certain other proxy disclosures and requirements. Our executive compensation disclosure complies with Canadian requirements, which are, in most respects, substantially similar to the U.S. rules. We generally attempt to comply with the spirit of the U.S. proxy rules when possible and to the extent that they do not conflict, in whole or in part, with required Canadian corporate or securities requirements or disclosure. All dollar amounts included in this Item 11 are in Canadian dollars, unless otherwise expressly stated to be in U.S. dollars. EXECUTIVE COMPENSATIONCompensation Committee Interlocks and Insider Participation
Our executive compensation program is designed to pay for performance,There were no reportable interlocks or insider participation affecting the Company’s Management Resources and to align management’s interests with our business strategy andCompensation Committee during the interestsyear ended December 31, 2023. None of our shareholders.executive officers serves as a member of the board of directors or compensation committee of any entity that has one or more executive officers serving as a member of our Board or our Management Resources and Compensation Committee.
The next section describes our compensation program and explains the 2017 compensation decisions for our named executives:
Keith E. Creel, President and Chief Executive Officer
Nadeem S. Velani, Executive Vice-President and Chief Financial Officer
Robert A. Johnson, Executive Vice-President Operations
Laird J. Pitz, Senior Vice-President and Chief Risk Officer
Jeffrey J. Ellis, Chief Legal Officer and Corporate Secretary
E. Hunter Harrison, former Chief Executive Officer (resigned on January 31, 2017)
Compensation Committee Report The Management Resources and Compensation Committee has reviewed and discussed the Compensation Discussion and Analysis contained in this Annual Report on Form 10-K/A with management resourcesof the Company and, compensation committeebased on such review and discussion, the Management Resources and Compensation Committee recommended to the Board that the information set forth under “Compensation Discussion and Analysis” below be included in this Annual Report on Form 10-K/A. Respectfully submitted, Management Resources and Compensation Committee Matthew Paull (Chair) Isabelle Courville Jill Denham Henry Maier Andrea Robertson 11
PART III – EXECUTIVE COMPENSATION COMPENSATION DISCUSSION AND ANALYSIS The Compensation Committee has reviewed and discussed the Compensation Discussion and Analysis with management. Based on its review, and on the discussion described above, on February 14, 2018, the Compensation Committee recommended to the full Board that the Compensation Discussion and Analysis be included in this 10-K/A. Our executive compensation program is designed to pay for performance, to align management interests with our business strategy and the Circularinterests of our shareholders, and this Annual Report on Form to engage and retain our executives. This section of our 10-K/A.A provides shareholders with descriptions of our compensation programs and 2023 compensation decisions for our Named Executive Officers (NEOs), listed below. Compensation Committee
| 2023 NAMED EXECUTIVE OFFICERS | Keith E. Creel President and Chief Executive Officer | Nadeem S. Velani Executive Vice-President and Chief Financial Officer | John K. Brooks Executive Vice-President and Chief Marketing Officer | Mark A. Redd(1) Executive Vice-President and Chief Operating Officer | John F. Orr(2) Executive Vice-President and Chief Transformation Officer |
Isabelle Courville (Chair)
| (1) | Until April 13, 2023, Mr. Redd held the role of Executive Vice-President Operations at CP. He was appointed Executive Vice-President and Chief Operating Officer of CPKC effective April 14, 2023. |
| (2) | Until April 13, 2023, Mr. Orr held the role of Executive Vice-President Operations at KCS. He was appointed Executive Vice-President and Chief Transformation Officer of CPKC effective April 14, 2023. Mr. Orr’s employment with the company terminated on March 19, 2024. |
John Baird
Rebecca MacDonald
Matthew Paull
Andrew Reardon
Gordon Trafton
Where to find it 612
COMPENSATION DISCUSSION AND ANALYSIS
Our approach to executive compensation We believe in the importance of paying for performance and aligning management’s interests with those of our shareholders.
Our executive compensation program supports our railroad-focusedoperations-focused culture, is closely linked to the critical metrics that drive the achievement of our strategic plan without taking on undue risk, and is designed to create long-term sustainable value for our shareholders. The key elements of our approach to executive compensation include: | • | | competitive market pay practices to attract and retain talent |
| • | | a compensation mix that is incentive-driven with a large portion of total direct compensation that is variable or “at-risk” to support our pay for performance culture |
| • | | compensation components paying out over multiple performance periods to link to our short and long-term business strategy |
| • | | alignment management’s interests with those of our shareholders through equity-based compensation and share ownership requirements |
We have five key performance driversfoundations designed to focus us on our goal of being the best railroad company in North America: 1. | Provide customers with industry-leading rail service |
4. | Remain a leader in rail safety |
We implemented several changes to our compensation program in 2017, as disclosed in last year’s proxy circular. These changes were the result of an extensive shareholder engagement program and an extensive review of executive compensation by the Compensation Committee, the Board and our human resources group. You can read about the program changes starting on page 15, and in the letter of the Compensation Committee chair beginning on page 5 of the Circular.
We received a 71.11% votefor our 2017 advisory vote on executive compensation, compared to 49.9% in 2016. The Compensation Committee continues to focus on making sure our compensation program pays for performance, reflects sound principles, supports long-term sustainable value, is clear and transparent and aligns with shareholder interests.
Compensation mix Attracting and retaining high calibreperforming executives is key to our long-term sustainable growth and success. We believe strong performance should yield Built into our compensation pay mix is a significant rewards. Our executive compensation includes fixed and variable(at-risk)emphasis on incentive-driven pay andwhere the proportion ofat-risk pay increases by level. Executives earn more if we perform well, and less when performance is not as strong. A significant portioncomponent of executive at-riskpay is tiedequity-based compensation, which links directly to the value of our shares, aligningensuring alignment with shareholder interests.the interest of our shareholders. We also require our executives to own CPCPKC equity and our share ownership guidelines increase by executive level (see page 10)15).
Variable cash compensation is more focused on corporate results for executives (75% of target) than for other employees (50% of target) who have more emphasis placed on individual
| | | | | | | | | Target total direct compensation mix for our NEOs is shown in the graph. 91 percent of our CEO’s and an average of 80 percent of our other NEOs’ target total direct compensation is at risk. | | | | 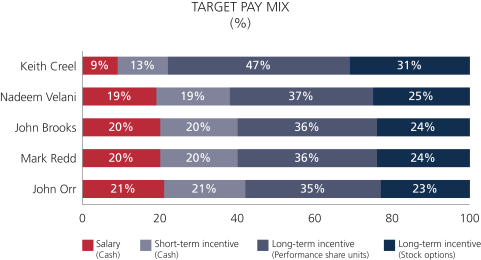 |
13
Benchmarking The peer group used in 2023 was unchanged from the prior year and departmental goals. This supports our view that the short-term incentive plan should be tied to overall corporate performance and the areasconsisted of our business that each employee influences directly.Class I peers plus 11 capital-intensive Canadian companies.
7
The table below showsAs a larger, more complex North American entity, the pay mix forCompensation Committee reviewed and approved updates to our current named executives based on their total target compensation.

Benchmarking
We benchmark the compensation for our named executives against a peer group of companies that consists of BNSF Railway, CN, CSX Corporation, Kansas City Southern Railroad, Norfolk Southern Corporation and Union Pacific Corporation.
These companies areto better reflect the Class 1 railroads, the North American railroad companies thatmarket we compete with for executive talent. Benchmarking against thisThe group continues to include our Class I railroad peers plus, effective for 2024, 14 capital-intensive North American companies. For certain positions within the organization, we apply a heavier weighting to Class I railroad peers.
Our revised compensation peer group ensuresis comprised of 11 Canadian companies and eight (8) U.S. companies that each component of our compensation program is competitiveare similar in geography, size, industry and in line with our strongest competitors, so we can attractbusiness complexity. Size criteria considers metrics such as EBITDA (Earnings Before Interest, Tax, Depreciation and retain experienced railroad executives with highly specialized skills. We reviewed the peer group in 2017 to make sure it is still a relevantAmortization), market capitalization, enterprise value and appropriate benchmark in the context of our growth strategy and operations and do not plan to make changes to the comparator group for 2018.total assets. | | | | | | | Class I Railroads | | North American Capital-Intensive Companies | | | | | BNSF Railway Company | | Air Canada | | Enbridge Inc. | | Suncor Energy Inc. | | | | | | Canadian National Railway Company | | Barrick Gold Corporation | | FedEx Corporation | | TC Energy Corporation | | | | | | CSX Corporation | | BCE Inc. | | Nutrien Ltd. | | TELUS Corporation | | | | | | Norfolk Southern Corporation | | Canadian Natural Resources Ltd. | | Old Dominion Freight Line Inc. | | United Parcel Services Inc. | | | | | | Union Pacific Corporation | | Cenovus Energy Inc. | | Republic Services Inc. | | |
8
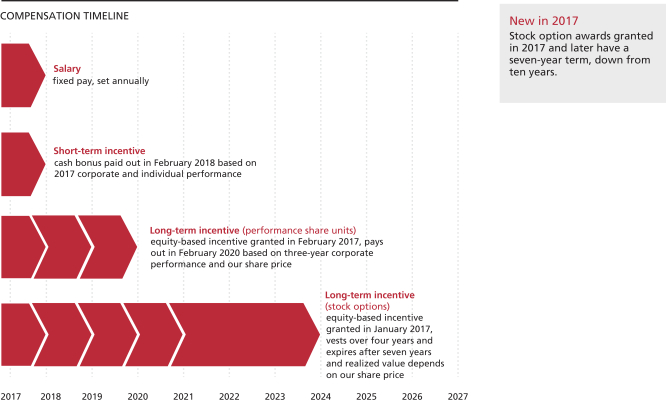
Compensation pays out over time Variable pay includes short and long-term incentive awards to drive annual and longer-term performance and align with shareholder interests.
Incentive awards are cash and equity-based. Equity-based awards vest at the end of three years for performance share units and over four years for stock options. Stock options expire at the end of seven years.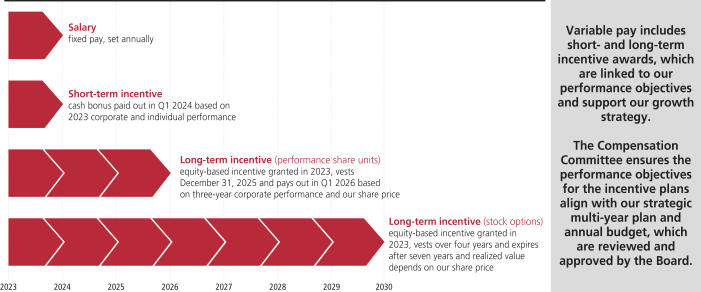
The Compensation Committee ensures the performance objectives for the incentive plans align directly with our strategic plan, which is reviewed and approved by the Board.
14
Executives are CPCPKC shareholders We require executives and senior management employees to own equity in the companyCompany so they have a stake in our future success. Share ownership requirements are set as a multiple of base salary and increase by level. ExecutivesThe ownership requirement must satisfy the requirementbe achieved within five years of the employee being appointed to their position and can meet the requirementsbe met by holding common shares or deferred share units (DSUs). TheNotional shares in the form of PSUs, restricted share units (RSUs), and stock options do not count towards ownership requirements. Once executives have met their initial shareholding requirements, they are required to maintain compliance, which is reported annually to the Compensation Committee. Starting in 2024, the CEO must maintain the ownership level of sixseven times his base salary for one year after he retires or leaves CP.the cessation of employment. Executives have the opportunity to participate in the Senior Executive’s DSU Plan (see page 44 for further plan details). DSUs are redeemedmust be held for cash no earlier thana minimum of six months after the executive retires or leaves the company or untilCompany. The units are redeemed for cash, with (i) Canadian-resident executives being entitled to elect a date of payment between the enddate that is six months following their departure from the Company and December 15th of the following calendar year, forin compliance with Canadian executives. Payment totax rules; and (ii) U.S. resident executives who participate inbeing paid six months after their departure from the DSU plan is made after thesix-month waiting period to beCompany, in compliance with U.S. tax regulations. 9
The table below shows the share ownership requirement by executive level, which appliedapplicable to approximately 77143 executives and senior management employees in 2017.2023. | | | | | | | Executive Level | | 2023 Ownership requirement requirement (as a multiple of base salary) | | CEO
| | | | 6x | Starting in 2024, the Board approved increased share ownership requirement for the CEO (7x), Executive Vice-President (5x) and Senior Vice-President (3x) levels, consistent with our commitment to align executive compensation with shareholder interests and market competitive practices. | Executive Vice-President
CEO | | | 3x | | Senior Vice-President
6x | | | 2x | | Executive Vice-President | | | 1.5 to 2x | | Senior management
4x | | | 1xSenior Vice-President | | 2x | | | Vice-President | | 1.5 to 2x | | | Senior management | | 1x | | |
We use the acquisition value or our closing share price on the last trading day of the year (whichever is higher) to value the holdings.Equity ownership (as at December 31, 2023)
Mr. Creel, Mr. Velani, Mr. Johnson, Mr. Pitz and Mr. Ellis are expected to meet their requirement within the five-year period following their appointment. We used our closing share price on December 29, 2017 to value their share ownership: $229.66 for the TSX or US$182.76 on the NYSE, depending on whether the executive is paid in Canadian or U.S. dollars. You can read about each executive’s share ownership in the profiles beginning on page 27.
| | | | | | | | | | | | | | | | | | | | | | | | | | | | | | | | | | Executive | |
| 2023
Requirement
(as a multiple of salary) |
| |
| Minimum
ownership
value ($)(1) |
| |
| Shares
($)(2) |
| |
| Deferred
share units ($)(2) |
| |
| Total
ownership value ($)(2) |
| |
| Total
ownership (as a multiple of salary) |
| | | | | | | | | Keith Creel | | | 6x | | | | 10,713,060 | | | | 10,075,117 | | | | 17,210,372 | | | | 27,285,489 | | | | 15.28x | | | | | | | | | | Nadeem Velani | | | 4x | | | | 3,805,920 | | | | 438,429 | | | | 7,805,207 | | | | 8,243,636 | | | | 8.66x | | | | | | | | | | John Brooks | | | 4x | | | | 3,650,376 | | | | 1,385,313 | | | | 1,775,437 | | | | 3,160,750 | | | | 3.46x | | | | | | | | | | Mark Redd(3) | | | 4x | | | | 3,623,924 | | | | 2,528,836 | | | | 2,278,986 | | | | 4,807,822 | | | | 5.31x | | | | | | | | | | John Orr | | | 4x | | | | 2,777,460 | | | | 3,435 | | | | 2,163,251 | | | | 2,166,686 | | | | 3.12x | |
| (1) | Minimum ownership values for Messrs. Creel, Brooks, Redd and Orr have been converted to Canadian dollars using a year-end exchange rate of $1.3226. |
| (2) | Values for Messrs. Creel, Brooks, Redd and Orr are based on US$79.06, the closing NYSE share price on December 29, 2023 (the last trading day of the year), converted to Canadian dollars using a year-end exchange rate of $1.3226. Values for Mr. Velani are based on $104.84, the closing TSX share price on December 29, 2023. |
15
Compensation governance Disciplined decision-making process Executive compensation decisions involve management, the Compensation Committee and the Board. The Board has final approval for setting, amending and adopting any equity compensation plans or awards, subject to applicable shareholder approval requirements. The Compensation Committee also receives advice and support from an external consultantconsultants from time to time.time and since June 2020, has retained Frederic W. Cook & Co., Inc. (FW Cook) as an independent compensation consultant to provide objective analysis and assessment of the Company’s executive compensation program. In 2023, management received advice and support from Willis Towers Watson plc (WTW), and other external consultants to the Company, but not FW Cook. 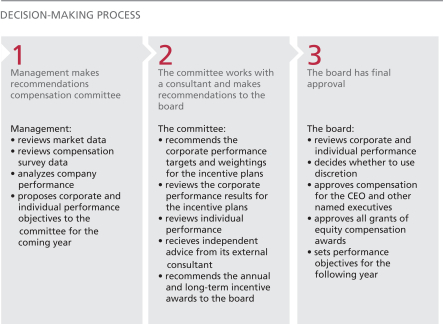 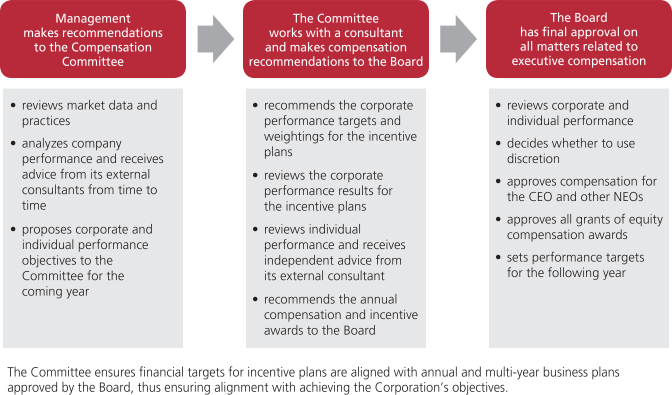
The Board has final approval on all matters relating to executive compensation. It can also use its discretion to adjust pay decisions as appropriate.
10
Qualified and experienced Compensation Committee Compensation Committee Interlocks and Insider Participation
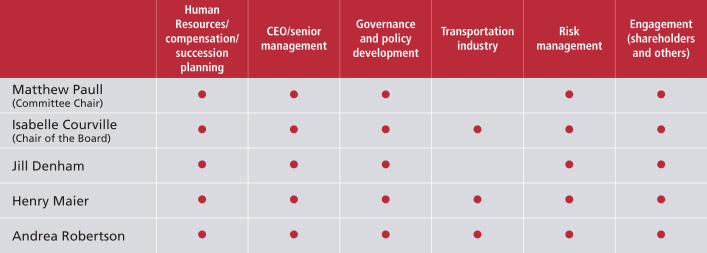
The Compensation Committee is responsible for our compensation philosophy, and strategy and for program design. The Compensation Committee consists of sixfive independent directors. The Compensation Committee has the relevant skills, background and experience for carryingto carry out its duties. The table below shows the key skills and experience of each member: | | | | | | | | | | | | | | | | | | | | | | | | | | | Human resources/
compensation/
succession planning
| | | CEO/senior
management | | | Governance
and policy
development | | | Transportation
industry
| | | Risk
management | | | Engagement
(shareholders
and others) | | Isabelle Courville
(Committee Chair)
| | ✓ | | | | ✓ | | | | ✓ | | | | | | | | ✓ | | | | ✓ | | | John Baird
| | | | | | ✓ | | | | ✓ | | | | ✓ | | | | ✓ | | | | ✓ | | | Rebecca MacDonald
| | ✓ | | | | ✓ | | | | ✓ | | | | | | | | ✓ | | | | | | | Andrew Reardon
(Chairman of the Board)
| | ✓ | | | | ✓ | | | | ✓ | | | | ✓ | | | | ✓ | | | | ✓ | | | Matthew Paull
| | | | | | ✓ | | | | ✓ | | | | ✓ | | | | ✓ | | | | ✓ | | | Gordon Trafton
| | ✓ | | | | ✓ | | | | ✓ | | | | ✓ | | | | ✓ | | | | | | |
16
Compensation Committee members also have specific human resources and compensation-related experience, including: direct responsibility for executive compensation matters membership on other human resources committees compensation plan design, and administration, compensation decision-making, risk management and understanding the Board’s role in the oversight of these practices understanding the principles and practices related to leadership development, talent management, succession planning and employment contracts engagement with investors on compensation issues financial literacy, oversight of financial analysis related to compensation plan design and practices oversight of labour matters and a unionized workforce
pension benefit oversight, investment management recruitment of senior executives The Compensation Committee has no interlocks or insider participation. None of the members were employed by or had any relationship with CPCPKC during 20172023 requiring disclosure under Item 404 or Item 407(e)(4) of RegulationS-K of the Exchange Act. You can read about the background and experience of each member in the director profiles beginning on page 1.2. Our Compensation Committee members also serve on other standing committees. Mr. Paull and Ms. Denham are members of the Audit and Finance Committee, Mr. Maier is a member of the Integration Committee and Ms. Robertson is a member of the Governance Committee. Ms. Courville, in her capacity as Chair of the Board, is an ex-officio member of all standing committees and may attend committee meetings at her discretion. This cross-membership provides directors with a broader perspective of risk oversight and a deeper understanding of our enterprise risks, ultimately strengthening overall risk management. 11
Independent advice The Compensation Committee and management retain separate independent executive compensation advisors to provide advice on compensation-related matters and to avoid any conflicts of interest:interest. | | | | | | Compensation Committee advisor FW Cook | | Management Compensation advisor WTW | | | • The Compensation Committee retained Meridian Compensation Partners LLC (Meridian)retains FW Cook to act as itsan independent compensation consultant for early 2017advisor, attending committee meetings (unless otherwise requested by the Committee Chair) • In 2017 Meridian advised the Compensation Committee on various matters relating to executive compensation and assisted the Compensation Committee with the 2016 compensation risk review • The Compensation Committee has also engaged Kingsdale Advisors as a compensation consultant on an as needed basis
• The Compensation Committee chair approves all compensation-related fees and work performed by the external consultantFW Cook
| | • Management engages Willis Towers WatsonWTW to provide market survey data, analysis and advice relating to executivemanagement related to compensation matters |
The next table below shows the fees paid to MeridianFW Cook and Willis Towers WatsonWTW in 20162022 and 2017.2023 for compensation advisory services. | | | | | | | | | | | | | | | | | | | | | | | | 2023 | | | 2022 | | | | | | | | | | | Committee advisor | | | Management advisor | | | Committee advisor | | | Management advisor | | | | | | | | Fees | | FW Cook (1) | | | WTW | | | FW Cook (1) | | | WTW | | | | | | | | Executive compensation-related fees | | $ | 125,378 | | | $ | 74,667 | | | $ | 119,864 | | | $ | 57,808 | | | | | | | | Other fees(2) | | $ | 0 | | | $ | 947,315 | | | $ | 0 | | | $ | 1,161,580 | | | | | | | | Total fees | | $ | 125,378 | | | $ | 1,021,982 | | | $ | 119,864 | | | $ | 1,219,388 | |
| (1) | FW Cook fees have been converted to Canadian dollars using the average exchange rate for 2023 of $1.3497. |
| (2) | In addition to the amounts shown in the table, a one-time fee of $13,500 for Committee advice from an independent consultant was paid in 2022. No such fees were incurred in 2023. |
Fees paid In 2023, $74,667 was paid to WTW for compensation advisory services provided to management. Fees paid to Meridian in 2017 reflect work conducted early in the year, prior to ending the engagement. Any fees paid to Kingsdale for executive compensation services in 2017 were part of the overall retainer described on page 13 of the Circular. | | | | | | | | | | | | | | | | | | | | | | | | 2017 | | | | | | 2016 | | | | | Meridian | | | Willis Towers Watson | | | | | | Meridian | | | Willis Towers Watson | | Executive compensation-related fees | | $ | 50,751 | | | $ | 78,923 | | | | | | | $ | 170,267 | | | $ | 59,264 | | Other fees | | | - | | | $ | 1,975,629 | | | | | | | | - | | | $ | 2,215,142 | | Total fees | | $ | 50,751 | | | $ | 2,054,552 | | | | | | | $ | 170,267 | | | $ | 2,274,406 | |
Fees paid
In 2016, $170,267 was paid to Meridian for executive compensation advisory fees provided to the Compensation Committee. This is 100% of the total fees paid to Meridian in 2016. In 2017, $50,751 was paid to Meridian for executive compensation advisory fees. This is 100% of the total fees paid to Meridian in 2017.
In 2017, $78,923 was paid to Willis Towers Watson for executive compensation advisory fees provided to management. The total executive compensation fees represent 4% of the $2,054,552 paid in total to Willis Towers WatsonWTW for all services provided to management, including actuarial and pension and benefits consulting, corporate risk and insurance broking services.were $1,021,982. The total executive compensation fees represent 7.3 percent of the total fees in 2023.
17
Compensation risk Effective risk management is integral to achieving our business strategies and to our long-term success. The Board believes that our executive compensation program should not increase our risk profile. The Compensation Committee is responsible for overseeing compensation risk. It reviews the executive compensation program, incentive plan design and our policies and practices to make sureensure they encourage the right decisions and actions to reward performance and align management interests with shareholder interests. Incentive plan targets are linked to our corporate objectives and our corporate risk profile. The Compensation Committee believes that our approach to goal setting, establishing performance measures and targets and evaluating performance results helps mitigate risk-taking that could reward poor judgment by executives or have a negative effect on shareholder value. All of the Compensation Committee members other than Mr. Paull are also a member of the Governance Committee. Mr. Reardon and Mr. Paull are also members of the finance committee and Mr. Reardon is a member of the audit committee. This cross-membership strengthens risk oversight because it gives the directors a broader perspective of risk oversight and a deeper understanding of our enterprise risks.
12
Regular riskRisk review
The Compensation Committee conducts a comprehensive compensation risk review every two yearsperiodically to make sureensure that we have identified theany compensation risks and have appropriate measures in place to mitigate those risks. An independent consultant assists the Compensation Committee with the review, which includes looking at:oversight of: the targets for STIP and the short-term incentive and performance share unitPSU plan, anticipated payout levels and the risks associated with achieving targettargeted performance the design of the long-term incentive awards, which rewardsreward sustainable financial and operating performance the compensation program, policies and practices to ensure alignment with our enterprise risk management practices.practices The last review wasWTW completed attheir risk assessment in 2023 and concluded that there were no risks identified as arising from the end of 2016 in conjunction with all the changesCompany’s compensation programs that were being proposed to the 2017 compensation plans. Based on the findings of the review, the Compensation Committee concluded that our compensation program, policies and practices are not reasonably likely to have ana material adverse effect on our business or the company overall.Company.
Managing compensation risk We mitigateOur commitment to risk mitigation of the Company’s executive compensation program is reflected in three ways:the following practices and policies:
| | | 1. Plan design | | • We use a mix of fixed and variable(at-risk) compensation and a significant proportion isat-risk pay
• Short and long-term incentive plans have specific performance measures that are closely aligned with the achievement of our business strategy and performance required to achieve results in accordance with guidance provided to the market
• The payout curve for the short-term incentive plan is designed asymmetrically to reflect the significant stretch in target performance
• The payout under the short-term incentive plan is capped and not guaranteed, and the Compensation Committee has discretion to reduce the awards
• The long-term incentive plan has overlapping vesting periods to address longer-term risks and maintain executives’ exposure to the risks of their decision-making through unvested share based awards
| 2. Policies | | • We promote an ethical culture and everyone is subject to a code of business ethics
• We have share ownership requirements for executives and senior management so they have a stake in our future success
• We have a disclosure and insider trading/reporting policy to protect our interests and ensure high business standards and appropriate conduct
• Our anti-hedging policy prohibits directors, officers and employees from hedging our shares and share-based awards
• Our anti-pledging policy prohibits directors and senior officers from holding our shares in a margin account or otherwise pledging them as security
• We also have a policy that prohibits employees from forward selling shares that may be delivered on the future exercise of stock options, or otherwise monetizing their option awards, other than through exercising the options and subsequently selling the shares through a public venue or the company’s cashless exercise option
• Our clawback policy allows us to recoup incentive pay from current and former senior executives as appropriate (see below)
• DSUs held by the CEO and executives are not settled for cash until six months after leaving the company
• Our whistleblower policy applies to all employees and prohibits retaliation against anyone who makes a complaint acting in good faith
| 3. Mitigation measures | | • More senior roles have a significant portion of their compensation deferred
• We must achieve a specific threshold of operating income, otherwise no short-term incentive awards are granted
• Financial performance is verified by our external auditor (completion of annual financial statement audit) before the Board makes any decisions about short-term incentive
• The Compensation Committee adopted principles for adjusting payout under the short-term incentive plan, and provides them to the Board as part of their review of the Compensation Committee’s recommendations and performance overall
• Environmental principles are fundamental to how we achieve our financial and operational objectives, and the Compensation Committee takes them into account when exercising discretion and determining the short-term incentive awards
• Safety is considered as part of individual performance under the short-term incentive for the CEO and executives in operations roles in addition to being a specific STIP measure
• We regularly benchmark executive compensation against our comparator group of companies
• Different performance scenarios are stress tested and back tested to understand possible outcomes
|
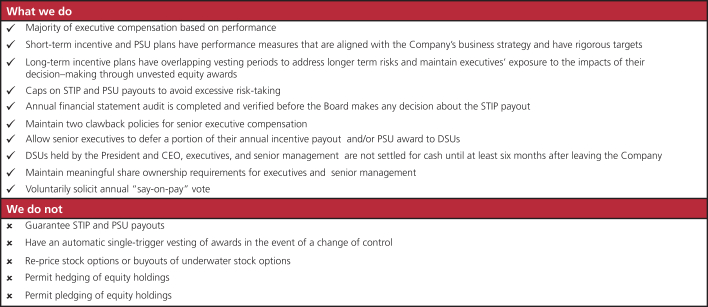
13
Key policies In addition to CP’sthe code of business ethics and the business ethics reporting policy for the Company, a number of other policies act to mitigate compensation risk. You can read more about ethical behaviour at CP and our code of business ethics and other policies beginning on page 59. 18
Clawbacks In compliance with the U.S. Securities and Exchange Commission (SEC) mandatory clawback rule and the New York Security Exchange (NYSE) listing standards, the Company adopted and implemented a Dodd-Frank clawback policy for certain executive officers, effective December 1, 2023 (Dodd-Frank Clawback Policy). The Dodd-Frank Clawback Policy mandates the recovery of thiserroneously awarded incentive-based compensation received by covered executives during the three completed fiscal years immediately preceding the date that the Company is required to prepare an accounting restatement. Recovery of incentive-based compensation pursuant to our Dodd-Frank policy is on a “no-fault” basis, meaning that misconduct, fault or responsibility by the covered executive officer is not required to trigger recovery. The Dodd-Frank Clawback Policy applies to each current and former “executive officer” of the Company as defined under Item 401(b) of Regulation S-K, including our NEOs. See Item 8, Financial Statements and Supplementary Data, Note 24: Stock-based compensation in our Annual Report on Form 10-K/Aform 10-K filed with the SEC and page 84 ofsecurities regulatory authorities in Canada on February 27, 2024 for more details. For the Circular. Clawbacks
OurCompany’s senior executives not subject to the Dodd-Frank Clawback Policy, we amended our pre-existing clawback policy (the Senior Executive Clawback Policy) to align the restatement requirement with the Dodd-Frank Clawback Policy, effective December 1, 2023. The Senior Executive Clawback Policy allows the Board to recoup shortshort- and long-term incentive compensation paid to a current or former senior executive not subject to the Dodd-Frank Clawback Policy if:
the incentiveincentive-based compensation received was calculatedwould have been lower based on an accounting restatement that corrects an error in previously issued financial resultsstatements that is material to the previously issued financial statements, or that would result in a material misstatement if the error were subsequently materially restated or corrected in wholethe current period or left uncorrected in part;the current period; and the senior executive engaged in gross negligence, fraud or intentional misconduct that caused or contributed to the need for the restatement or correction, as admitted by the senior executive or as reasonably determined by the Board; andBoard. Under the incentive compensation would have been lower based onSenior Executive Clawback Policy, the restated or corrected results. The Board has sole discretion to determine whether it is in our best interests to pursue reimbursement of all or part of the incentive compensation and these actions would be separate from any actions by law enforcement agencies, regulators or other authorities.
The adoption of the Dodd-Frank Clawback Policy and the amendment to the Senior Executive Clawback Policy reflect the Board’s continued commitment to the stewardship of good governance and accountability of corporate executives to our shareholders. We expect to amend our clawback policy going forward as may be required by changes in applicable laws and listing requirements. Anti-hedging Our disclosure and insider trading and reporting policy prohibits directors, executive officers and employees from buying financial instruments that are designed to hedge or offset a decrease in the market value of equity awards or CP shares they hold directly or indirectly. Anti-pledging Our anti-pledging policy prohibits directors and executive officers from holding any CPCPKC securities in a margin account or otherwise pledging the securities as collateral for a loan. Non-compete and Non-solicitation 14We are mindful of the demand for experienced and talented railroaders, particularly those with backgrounds in precision scheduled railroading. To manage near-term retention risk, our long-term incentive award agreements contain non-compete, non-solicitation and other restrictive clauses, including non-disclosure restrictions.
19
Compensation program Total direct compensation consists of salary, an annual short-term incentive and a long-term incentive award that focus executives on driving strong financial, operational and customer satisfaction results and building shareholder value.award. Executives also receive pension benefits and perquisites as part of their overall compensation. | | | | | | | | | | | | | | | | Element | | Purpose | | Risk mitigating features | | Link to business and
talent strategies
| | New in 2017Why it is important | | | | | Salary 
| | Salary
CashFixed cash
(see page 16)21) | | • competitive level of fixed pay to reflect scope of responsibilities and market data • reviewed annually | | • external advisor benchmarksbenchmarked against our comparator group to ensure appropriate levels and fairnessmarket competitiveness | | • attract and retain talent • no automatic or guaranteed increases to promote a performance culture | | | | | | Short-term 
| | Short-term incentive
CashVariable cash bonus
(see page 16)21) | | • performance-based incentive to reward achievement of annual performance incentivecorporate and individual objectives to attract and retain highly qualified leaders • setestablished target awards based on level of employee | | • set targetyear-end performance at the beginning of the year to assess actual performance at the end of the yearis measured against predetermined, approved targets • actual payouts are based on the achievement ofpre-determined corporate and individual objectives • corporate performance has an operating income hurdle • payouts are capped
• no guaranteerange from 0 percent to a maximum of a minimum payout200 percent of target awards
| | • attract and retain highly qualified leaders
• motivate high corporate and individual performance • useperformance metrics that are based onaligned to the Company’s strategic plan and approved annually • align personal objectives with area of responsibility and role in achieving financial, safety and operating results | | New measures and weightings:
• operating ratio reduced from 50% to 40%
• operating income increased from 25% to 40%
• added a safety measure at 10%
• added an operational
measure at 10%
| | | | | | Deferred compensation Deferred share units (see page 48)44) | | • encourages share ownership while aligning management interests with growth in shareholder value • executives and senior management can elect to receive thetheir short-term incentive and their annual PSU grant in DSUs if they have not yet met their share ownership requirement • company provides a 25%25 percent match of the deferral amount in DSUs, subject to a cap | | • deferral limited to the amount neededrequired to meet the executive’s share ownership guidelines • aligns management interests with growth in shareholder value • helps retain key executive talent
• company contributionsmatching DSUs vest after three years and matching PDSUs vest immediately | | • sustained alignment of executive and shareholder interests because the value of DSUs is tied directly to our share price • cannot be redeemed for cash until a minimum of six months after the executive leaves CPthe Company | | | | | | | | Long-term incentive (LTIP) Performance share units (see page 20) | | | | | | New allocation | | Performance share units
(see page 22)24)
| | • equity-based incentive alignsto align with shareholder interests and focuses on three-year performance • accounts for 60%60 percent of an executive’s long-term incentive award (up from 50% in 2016) • vest after three years | | • usepre-defined market predefined return and financial metrics • the number of units that vest is based on a performance multiplierfactor that is capped • no guarantee of a minimum payout | | • focuses the leadership team on achieving challenging medium-term performance goals • ultimate valuepayout based on share price and company performance • attract and retain highly qualified leaders | | Represents 60% of LTIP award for executives (100% for other levels of management)
New measures and weightings:
• return on invested capital replaces operating ratio
• update of peer group for assessing relative TSR
• increased the weighting of TSR from 20% to 40%
| | | | | | Long-term incentive Stock options (see page 23)24) | | • equity-based incentive to align with long-term performance and growth in share price • accounts for 40%40 percent of an executive’s long-term incentive award (down from 50% in 2016) • vestvests over four years, term is now seven years | | • focuses on appreciation in our share price, aligning with shareholder interests • only granted to senior management and executives | | • focuses the leadership team on creating sustainable long-term value | | | Represents 40% of LTIP award for executives
Grants in 2017 and later have a seven-year term, down from
10 years
| | | 
| | Pension Defined contribution and defined benefit pension planplans (see page 47)43) | | • pension benefit based on pay, age and service and is competitive with the market • supplemental plan for executivessenior management and senior managersexecutives | | • balances risk management of highly performance-focused pay packagepackages that have a high percentage of variable pay | | • attract and retain highly qualified leaders | | | | | | | | Perquisites Flexible spending account (see page 42)37) | | • market competitive with the marketbenefit to support health and well-being | | • new restrictionscapped perquisites for the CEO and executives | | • attract and retain highly qualified leaders | | No tax equalization for the CEO
Use of aircraft limited to corporate travel and family visits within North America
|
1520
20172023 Executive compensation
Salary Salaries are setWe review salaries every year based on the executive’s performance, leadership abilities, responsibilities and experience as well as succession and retention considerations. The Compensation Committee also considers the economic outlook and the median salary andcompetitive pay practices of the comparator group before making its decisions.
recommending the salary increases for Board approval. For 2023, we reviewed salaries for NEOs and other executives and made adjustments as needed for increased responsibilities of the new CPKC entity. The table below showsoutlines the annualbase salaries the named executives were paid as at December 31, 2017.of all NEOs, which are set in U.S. dollars consistent with industry practice. | | | | | | | | | | 2017 | | % change from 2016 | | Keith Creel | | US$1,125,000 | | | 17.6% | | Nadeem Velani | | $460,000 | | | 10.8% | | Robert Johnson | | US$435,000 | | | 0% | | Laird Pitz | | US$366,000 | | | 4.6% | | Jeff Ellis | | $445,000 | | | 0% | |
| | | | | | | | Executive | | 2023 (in USD) | | percent change from 2022 | | 2022 (in USD) | | | | | | Keith Creel | | 1,350,000 | | 12.5% | | 1,200,000 | | | | | | Nadeem Velani | | 720,000 | | 9.1% | | 660,000 | | | | | | John Brooks | | 690,000 | | 13.1% | | 610,000 | | | | | | Mark Redd | | 685,000 | | 16.1% | | 590,000 | | | | | | John Orr | | 525,000 | | n/a | | n/a |
Mr. Creel received a 17.6% increase when he became CEO on January 31, 2017. Mr. Velani received a step increase to bring his salary closer to the market median as a result of his appointment as Executive Vice-President and CFO. Mr. Pitz received an increase in 2017 when he was promoted to Senior Vice-President and Chief Risk Officer.
Short-term incentive plan (STIP) The short-term incentive award is an annual incentive that focuses executives on achieving strong annual financial, safety, and operational results. The table below summarizes the terms of our current STIP. | | | What it is Purpose | | • Cash bonus for achievingpre-determinedperformance-based incentive to achieve predefined annual corporate and individual performance objectivesgoals that are tied directly to our strategy and operational requirementsobjectives • Target awards are based on the executive’s level, benchmarked at the 50th percentile of our peer group and expressed as a percentage of base salary
| Payout Term | | • Corporatemeasure performance over a one-year period | | Payout | | • corporate performance is assessed against financial, safety and operational measures • Individualindividual performance is assessed againstbased on individual performance objectives • No guaranteeawards are pro-rated for eligibility in calendar performance year and can range from 0 to 200 percent of a minimum payoutbase salary • cash awards are paid out in February following the performance year | | Restrictions | | • Mustmust meet minimum level of corporate and individual performance • Must achieve corporate operating income hurdleperformance modifier for any payout on individual or corporate performance to occur • Performance multiplier is capped for exceptional performance
• Actualeach metric and actual award is capped as a percentageat 200 percent of base salary
| If the executive retires | | • Executive must give three months’ noticetarget for exceptional performance to limit payout and excessive risk-taking
• Award for the current year ispro-rated to the retirement date
|
16
The table below showsWe calculate each STIP award by multiplying the 2017executive base salary by their short-term incentive awarded totarget as well as the named executives. Salaries in U.S. dollars have been converted into Canadian dollars using an average exchange rate of $1.2986.
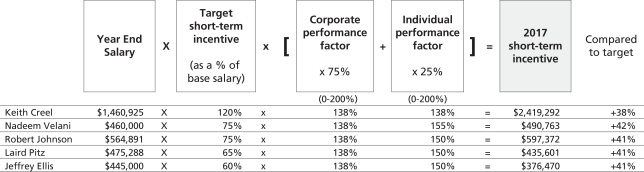
We use financial andnon-financial measures to assess corporate performance. Individual performance is assessed against individual performance objectives for the year and otherpre-determined goals that reflect the strategic and operational priorities critical to each executive’s role.
Corporate and individual performance factors are at capped at 200% to limit payouts and avoid excessive risk-taking.
An employee’s payout on the individual component of the STIP may be zero or range from 50% to 200%. Any award payable under the individual component is subject to a minimum level of corporate performance. No award is payable unless the minimum corporate hurdle is achieved.as shown below:
Actual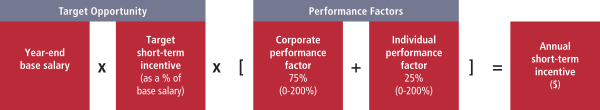
Our STIP awards are also capped astarget is based on a percentage of base salary as shown inand the tablepayout opportunity ranges from 0 percent to 200 percent of the right. Assessingexecutive’s target. For executives, the STIP target is weighted at 75 percent for corporate results and 25 percent for individual performance, whereas most other employees have greater emphasis placed on individual and departmental goals with their corporate and individual performance weighted at 50 percent each. This is based on our view that the annual bonus should be tied to overall corporate performance
Last year we announced a number and the areas of changes to the measures for 2017 to reflect CP’s transition to focus on sustainable growth.
| | | | | | | | | | | | | | | | | | | | Payout as a % of base salary | | | Level | | Below
hurdle | | | Minimum | | | Target | | | Maximum | | CEO | | | 0 | % | | | 60 | % | | | 120 | % | | | 240 | % | Other named executives | | | 0 | % | | | 30-37.5 | % | | | 60-75 | % | | | 120-150 | % |
| | | We created a balanced scorecard to assess performance and support our focus on growth by:
• increasing the emphasis onoperating income and reducing the emphasis oncost reduction so the two metrics have equal weighting
• introducing twonon-financial measures to the scorecard:safety andoperating performance.
Safety and operating performance had previously formed part of the individual performance assessment. Including the two measures in the scorecard with specific targets and weightings creates more rigour and transparency in the performance assessment.
| | New in 2017
We changed the weightings of two core financial measures to support our growth strategy and introduced twonon-financial measures to create a more balanced assessment of performance.
Free cash flow was removed as a metric given its volatility from year to year. The weighting of ROIC was increased as a long-term measure to ensure we deploy free cash flow in a responsible manner.
|
17
Corporate performanceour business that each employee can influence directly.
The table below shows the 2017 scorecard and results. The targets were set with adequate stretch to motivate strong performance. The Board sets a corporate hurdle for operating income. There is no payout if we do not achieve that corporate hurdle. If we achieve the hurdle but corporate performance factor consists of financial, operating and safety measures of varying weights that total 100 percent. The year end result of each measure is below threshold for all measures, then only the individual performance factor is used to calculate the awards. Corporate results between 50% and 200% of targetassessed against predetermined targets that are interpolated. For 2017, the operating income hurdle was set at $2 billion.
| | | | | | | | | | | | | | | | | | | | | | | | | | | | | | | Performance measure | | Why it’s important | | Threshold (50%) | | | Target (100%) | | | Exceptional (200%) | | | 2017
reported
result | | | 2017 STIP result | | | Weighting | | | Score | | Financial measures | | | | | | | | | | | | | | | | | | | | | | | | | | | | | | | STIP Operating ratio Operating expenses divided by total revenues based on an assumed fuel price and foreign exchange rate | | Continues our focus on driving down costs while focusing on growth strategy | | | 57.50 | % | | | 57.25 | % | | | 56.75 | % | | | 57.4 | % | | | adj. 57.1 | % | |
| 40% (new)
(reduced
from 50%
in 2016) |
| | | 137 | % | STIP Operating income ($ millions) Total revenues less total operating expenses based on an assumed foreign exchange rate | | Highlights the importance of revenue growth to our corporate strategy | | | 2,705 | | | | 2,745 | | | | 2,865 | | | | 2,793 | | |
| adj.
2,816 |
| |
| 40%(new)
(increased
from 25%
in 2016) |
| | | 159 | % | Safety measure(new) | | | | | | | | | | | | | | | | | | | | | | | | | | | | | | | Federal Railroad Administration’s (FRA) frequency of train accidents per million train miles relative to Class 1 railroads | | Safety is our top priority, and the measure pays out at maximum only if we achieve the stretch target and remain the best in the industry Introducing this measure recognizes the feedback we received from shareholders who asked for safety to be explicitly included as a performance measure | | | 1.30 | | | | 1.19 | | | | 1.15 | | | | 0.99 | | | | 0.99 | | | | 10% | | | | 200 | % | Operating measure(new) | | | | | | | | | | | | | | | | | | | | | | | | | | | | | | | Train speed measures the time and movement of trains in miles per hour from origin to destination It is a key component oftrip plan compliance and critical to the service we provide customers and to our growth strategy. Trip plan compliance, as a stand-alone measure, is a relatively new measure at CP. In 2018, now that we have built up enough historical data, we plan to use it as an operating performance measure for STIP rewards. | | Train speed reflects our operating performance and is a key measure for improved asset utilization and delivery times, leading to an enhanced customer experience Introducing this measure incorporates feedback from shareholders and provides a more balanced scorecard of performance criteria | | | 23.7 | | | | 24.0 | | | | 24.6 | | | | 23.4 | | | | 23.4 | | | | 10% | | | | 0 | % | Corporate performance factor | | | | | | | | | | | | | | | | | | | | | | | | | | | 138 | % |
Notes:
The measurementthe beginning of train speed excludes bulk trains, local trains, passenger trainsthe year (see page 22 for a complete review of the targets and trains used for repairing track. Hours of delay caused by customer and foreign railroad issues are removed from the transit time. For all mainline trains, total train hours (excluding foreign railway and customer delays), divided by total train miles.
The target for train speed recognized that 2016 was a record year supported by an environment with softer volumes. Maintaining the target reflected an expectation that speed would be maintained as the network gained more volume.
The 2017 targetresults for the frequency of train accidents per million train miles relative to Class 1 railroads was based on the three-year average. CP has been a leader in safety for over a decade, and 2016 was a record safety year by CP and industry standards. The 2017 target reflected an expectation that CP would maintain its industry-leading safety performance.
18
CP delivered record financial performance in 2017. A growing top line coupled with disciplined cost control measures produced record operating income and adjusted earnings for the company. The reported operating ratio came in at 57.4% and reported operating income was $2,793 million – both areall-time bests for the company. From a safety perspective, CP’s personal injury rate improved one percent and our train accident frequency led the industry in this key safety metric. In 2017, CP continued to invest significantly in the capital program with an overall investment of $1.34 billion during 2017 while at the same time maintaining its strong commitment to shareholders by returning $691 million through share buybacks and dividends.
The Compensation Committee may adjust the results for unusual ornon-recurring items that are outside our normal business and do not accurately reflect our ongoing operating results or business trends and affect the comparability of our financial performance year over year. Results under the short-term incentive plan may therefore differ from our reported GAAP results. Significant items that were adjusted so that they do not impact, either favourably or unfavourably, the assumptions made when the STIP targets were planned include: a management transition recovery related to the retirement of Hunter Harrison as CEO; foreign exchange; fuel price; and land sales, all of which were adjusted to reflect assumptions made in our 2017 budget in order to incent good business decisions, made at the right time, to receive the best return.
Assessing individual performance
Executives set individual performance objectives before the start of every financial year.
2023 STIP). The individual performance factor is based on the executive’s performance against thoseannual objectives and otherpre-definedadditional predetermined quantitative and qualitative goals that reflect the strategic and operational priorities critical to each executive’s role, including operational management, safety,role. 21
2023 STIP awards The table below shows the calculation of the STIP awarded to each NEO based on the 2023 corporate and individual performance factors. The salaries of Messrs. Creel, Brooks, Redd and Orr have been converted to Canadian dollars using an average exchange rate of $1.3497 for 2023. 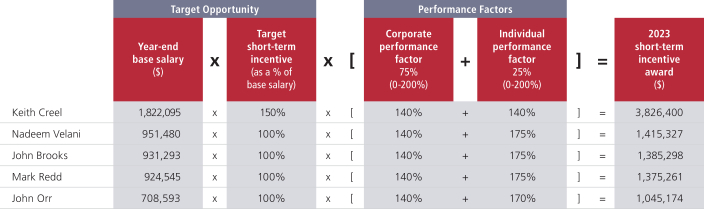
Assessing individual performance Individual performance objectives are set at the start of every financial year. The Compensation Committee sets the individual performance factor for the CEO. The CEO reviews the performance of his direct reports against their objectives, and other objectives. Each objective has a minimum, target and maximum.recommends their individual performance factors to the Compensation Committee. The individual performance factor ranges from 0%0 to 200%200 percent. The individual performance factor for the CEO cannot exceed the STIP corporate performance factor and accordingly Mr. Creel’s performance factor was capped at 140 percent. This ensures the payout factor for the CEO aligns with the Company’s overall performance.
See the profiles beginning on page 30 to read about each executive’s individual performance highlights in 2023. Assessing corporate performance 2023 was a transformative year for the Company. Since the close of the KCS acquisition in April 2023, our combined CPKC team has steadily built momentum, bringing new competition to supply chains and creating more value for our customers, while remaining steadfast on the integration of our operations, service and safety. In 2023, CPKC led the industry with the lowest FRA-reportable train accident frequency among Class I railroads, building on CP’s legacy of 17 consecutive years leading the industry. This resulted in a 32 percent improvement in FRA-reportable train accident frequency and a 12 percent improvement in FRA-reportable personal injury rate when comparing to 2022 on a combined full year basis(1). From a financial perspective, we delivered an operating ratio (OR) of 65 percent and a core adjusted combined OR(2) of 62 percent, reported diluted earnings per share (EPS) of $4.21 and core adjusted combined diluted EPS(2) of $3.84, an increase of two percent. CPKC delivered volume growth and best-in-class earnings growth in 2023. The hard work and dedication of the CPKC family in 2023 resulted in a STIP corporate performance payout of 140 percent for the NEOs. 2023 STIP scorecard results The table below shows the 2023 scorecard and results. The targets were set with stretch goals to motivate strong performance and create shareholder value as we continue to focus on our multi-year plan and remain a leader in safety. For the 2023 performance year and our first year as a combined entity, the Board approved consolidated CPKC financial targets and bifurcated safety targets for Canada/U.S. and Mexico. The 2024 scorecard will measure safety on a consolidated basis reflecting the commitment to safety and the expansion of industry-leading practices throughout the network. There is no payout on a measure if corporate performance is below threshold and if all corporate measures are below threshold, then only the individual performance factor is used to calculate the award payment. Corporate results between 50 and 200 percent of target are interpolated. | (1) | The FRA metrics have been determined through combining operations performance data of CP and KCS and aligning KCS operations metrics to CPKC’s performance measure definitions where applicable. |
| (2) | Core adjusted combined operating ratio and core adjusted combined diluted EPS are non-GAAP measures. These measures are defined and reconciled on pages 50 - 55 of the Company’s 2023 Form 10-K. |
22
Consistent with our plan design, STIP results are routinely adjusted (favourably and unfavourably) for certain planning assumptions and other one-time items outside of normal business. As a result, STIP results will differ from reported GAAP results. In 2023, results were adjusted for differences between actual and budgeted foreign exchange rates and land sales as well as the impact of regulatory changes not fully quantifiable at the time of target setting. | | | | | | | | | | | | | | | | | Performance measure (Weighting) | | Why the measure is important | | Threshold (50%) | | Target (100%) | | Maximum (200%) | | 2023 STIP Result | | Score | | | | | | | | | | | Financial measures | | | | | | | | | | | | | | | | | | | | | | | | | STIP Operating ratio (35%)(1) Operating expenses divided by total revenues | | Focuses the Company on growth at a low incremental cost | | 61.5% | | 61.0% | | 60.2% | | 60.7% | | | 142% | | | | | | | | | | STIP Operating income (35%)(2) ($ millions) Total revenues less total operating expenses | | Highlights the importance of revenue growth to our corporate strategy | | 5,325 | | 5,474 | | 5,692 | | 5,497 | | | 111% | | | | | | | | | | | Safety measures(3) | | | | | | | | | | | | | | | | | | | | | | | | | | FRA Train Accident Frequency (15%) Number of FRA-reportable train accidents per million train miles | | The Company has long been an industry leader in rail safety and we are more focused on it than ever to protect our people, our communities, the environment and our customers’ goods | | Canada and
U.S. | | 1.25 | | 1.19 | | 1.13 | | 0.91 | | | 200% | | | | Mexico | | 2.37 | | 2.26 | | 2.14 | | 1.34 | | | 200% | | | | | | | | | | | FRA Personal Injury Frequency (15%) Number of FRA-reportable injuries per 200,000 employee hours | | We make the safety of our employees our top priority | | Canada and
U.S. | | 1.20 | | 1.14 | | 1.08 | | 1.05 | | | 200% | | | | Mexico | | 1.51 | | 1.43 | | 1.35 | | 1.46 | | | 81% | | | | Corporate performance factor for NEOs | | | 140% | |
| (1) | STIP operating ratio is derived from CPKC’s Core adjusted combined operating ratio which is a non-GAAP measure. This measure is defined and reconciled on pages 50 - 55 of the Company’s 2023 Form 10-K. |
| (2) | STIP operating income is derived from CPKC’s Core adjusted combined operating income, which is a non-GAAP measure. This measure is further defined and discussed in Part VII - Other Information About Non-GAAP measures on pages 105-108 of the Company’s 2024 Management Proxy Circular, filed as Exhibit 99.1 to the Company’s Current Report on Form 8-K filed on March 21, 2024 (Acc. No. 0001193125-24-073962) (the “2024 Proxy Circular”). |
| (3) | Certain safety actuals can continue to settle over time. The Company’s 2023 achievements demonstrated in this table reflect actuals as of the time the Compensation Committee approved the overall payout. |
23
Long-term incentive plan (LTIP) Our long-term incentive awards focus executives on medium- and longer-term performance to create sustainable shareholder value. The table below summarizes the terms of our current long-term incentive plans. | | | | | | | | | | | | | 2017 individual performance factor | | | | | Performance share units (60% weighting) | | | | In response to shareholder feedback,
in 2016 we introduced a cap on the
individual performance factor for the
CEO, so his individual performance
factor cannot exceed the corporate
performance factor.Stock options (40% weighting)
This makes sure that the payout factor
for the CEO aligns with the CEO’s
overall responsibility for CP’s
performance.
| | | | | | Purpose | | Keith Creel• notional share units to align compensation with medium-term financial and market objectives
| | | | 138%• equity-based compensation to align executives with long-term performance of our shares and business | | | | | | Term | | | | | | | | | | | Nadeem Velani• three years
| | | 155% | | | | | | | | | | | Robert Johnson
| | | 150% | | | | | | | | | | | Laird Pitz
| | | 150% | | | | | | | | | | | Jeffrey Ellis
| | | 150% | | | | | | | | | | | | | | | | | | | | | | | | | The Compensation Committee sets the individual performance factor for the CEO. The CEO reviews the performance of his direct reports against their objectives, and recommends their individual performance factors to the Compensation Committee. | | | | | | | | | | | | | | | | | | | | | | | | | | |
See the profiles beginning on page 27 to read about each executive’s individual performance in 2017.
Compensation Committee Discretion
The Compensation Committee has developed principles for the use of discretion. Adjustments should not relieve management from the consequences of their decision-making. Adjustments should also neither reward nor penalize management for decisions on discretionary transactions, events outside their control (such as foreign exchange rates and fuel prices that are beyond the assumptions used in the planning process) or transactions outside normal corporate planning and budgeting.
As a result, the Compensation Committee can reduce the corporate performance factor for any executive officer as it deems appropriate, as long as it follows the principles. The Board can also use its discretion to adjust the targets and payouts up or down, following the principles set out by the Compensation Committee.
19
Long-term incentive plan
| | | Long-term incentive awards focus executives on medium and longer-term performance to create sustainable shareholder value.
Target awards are set based on the competitive positioning of each executive’s compensation and the practices of companies in our peer group in order to attract and retain experienced railroad executives with highly specialized skills.
| | New in 2017
To ensure a stronger link between pay and performance, the allocation of performance share units was increased to 60% and the allocation of stock options was reduced to 40% (previously the weighting was 50% for each).
The stock option term was shortened from ten years to• seven years
|
| | | | | | | Performance share units (60%) | | Stock options (40%) | What they areVesting | | • Notional sharethe number of units that vest is based on performance over a three-year period • cliff vest at the end of three years basedto the extent performance vesting conditions are met and Board approves | | | | • vest 25 percent annually over four years beginning on absolute and relative performance and the pricefirst anniversary of CP common sharesthe grant date | | | | | | Payout | | • Rightspaid out in cash based on units vested and the average closing share price for the 30-trading days prior to the end of the performance period on the TSX or NYSE • may be paid out in shares at the discretion of the CEO • accumulates quarterly dividends • no guarantee of a minimum payout • if performance is exceptional on all measures the Board may approve a payout of up to 250 percent | | | | • right to buy CPCompany shares at a specified price in the future | Vesting and
payout
| | • Cliff vest at the end of three years based on performance against threepre-defined financial and market metrics
after vesting • No guarantee of a minimum payout | | • Vest 25% every year beginning on the anniversary of the grant date
does not attract dividends • Expire at the end of seven years (down from ten years) • Onlyonly have value if our share price increases above the exercise price
| | Dividend equivalents | | | | Restrictions | | • Earned quarterly and compound over the three-year period | | • Do not earn dividend equivalents
| Restrictions | | • Must meet minimum level of performance
• Performance multiplier is capped for exceptional performance
| | • Cannot be exercised during a blackout period
| If the
executive retires
| | • Must give three months’ notice
• Award continues to vest and executive is entitled to receive the full value as long as they have worked for six months of the performance period, otherwise the award is forfeited
| | • Must give three months’ notice
• Options continue to vest, but expire five years after the retirement date or on the normal expiry date, whichever is earlier
|
Stock options are usually granted in January immediately after the fourth quarter financial statement blackout period ends, while performance share units (PSUs) are awarded in February after the Compensation Committee has reviewed theyear-end financial results in detail.
At the CEO’s recommendation, the Board may eliminate or adjust an executive’s actual grant (but may not increase a grant more than 25% above an executive’s target). In determining adjustments, the Compensation Committee considers the competitive positioning of each individual’s compensation, among other factors.
The Board does not take into consideration the amount or terms of previous awards when making grants because:
it could encourage an option holder to exercise their options earlier than planned to avoid a reduction in future grants because of a significant number of outstanding options
it might disadvantage long-serving employees and others who are committed to the stock
long-term incentive awards are granted to motivate and the value is contingent on strong future performance
20
Grants are also made for special situations like retention or new hires. Special grants can include PSUs, RSUs, DSUs or options. These grants are made on the first Tuesday of the month following approval. If we are in a blackout period, the grant is made after the blackout has been lifted.
2017 long-term incentive awards
To determine the appropriate value of long-term incentive grants provided to the named executives, the Compensation Committee considers the practices of our comparator group and external market data as well as internal factors including executive retention, dilutive impact and long-term value creation. The CEO did not recommend any adjustments to the 2017 awards.
The table below shows the 2017 long-term incentives awarded to the named executives.
| | | | | | | Target as a % of base salary | | Keith Creel
| | | 400% | | Nadeem Velani
| | | 225% | | Robert Johnson
| | | 225% | | Laird Pitz
| | | 115% | | Jeffery Ellis
| | | 115% | |
| | | | | | | | | | | | | | | | | | | | | | | | | | | | | | | | 2017 long-term | | | | | | | | | | | | | | | | | | | | | | | incentive | | | > | | | Allocation | | | | | award | | | | | | Performance share units | | | | | | Stock options | | | | | (grant value) | | | | | | $ | | | # | | | | | | $ | | | # | | | | | | | | | | | | | | | | | | | | | | | | | | | | | | | Keith Creel | | | 14,924,418 | | | | | | | | 4,407,788 | | | | 22,294 | | | | | | | | 10,516,630 | | | | 229,871 | | Nadeem Velani | | | 985,045 | | | | | | | | 782,395 | | | | 3,903 | | | | | | | | 202,650 | | | | 4,644 | | Robert Johnson | | | 1,514,778 | | | | | | | | 958,705 | | | | 4,849 | | | | | | | | 556,073 | | | | 11,557 | | Laird Pitz | | | 622,931 | | | | | | | | 394,237 | | | | 1,994 | | | | | | | | 228,694 | | | | 4,753 | | Jeffrey Ellis | | | 604,199 | | | | | | | | 386,888 | | | | 1,930 | | | | | | | | 217,311 | | | | 4,980 | |
Notes:
See the summary compensation table on page 41 for details about how we calculated the grant date fair values of the performance share units and stock options. Both were calculated in accordance with FASB ASC Topic 718.
The amount for Mr. Creel includes the performance stock option grant that he received in 2017 as described below.
The grant value of the awards based on the NYSE trading price has been converted to Canadian dollars using a 2017 average exchange rate of $1.2986.
As disclosed in last year’s proxy, when Mr. Creel became CEO on January 31, 2017, he received a special grant of performance stock options, designed to motivate strong CEO performance, build his equity ownership and retain him during a period of significant change in the railroad industry. To make the upfront grant, the Compensation Committee reduced Mr. Creel’s target long-term incentive award to 400% of salary for the next five years (from the market median of 500% among the Class 1 railroads), and used the difference (5 years x 100%) to make the award, which was allocated 100% to performance stock options (see page 23 for details about the vesting and performance conditions).
21
Performance share units (PSUs)
| | | PSU awards focus executives on achieving medium-term goals within a three-year performance period.
The Board sets performance measures, thresholds and targets at the beginning of the performance period.
The number of units that vest is based on our performance over the three-year period. We must achieve threshold performance level on a measure otherwise the payout factor for that measure is zero and a portion of the award is forfeited.not paid out
| | | | • no exercises can be made during a blackout period • financial assistance is not provided to facilitate the purchase of shares under the stock option plan | | | | | | Assignment | | • not permitted other than by operation of law | | | | • options will continue to vest and expire on the scheduled expiry date if the holder’s employment ends due to permanent disability. If an option holder dies, the options will expire 12 months following the date of death and may be exercised by the holder’s estate. • can only be assigned to the holder’s family trust, holding corporation or retirement trust, or a legal representative of a holder’s estate or a person who acquires the holder’s rights by bequest or inheritance | Termination Provisions | | | | | | | | | | Resignation | | • all units forfeited | | | | • 30 days to exercise any vested options; unvested options are forfeited | | | | | | Retirement | | • units continue to vest provided the unit holder meets the retirement age and service requirements and has a minimum participation period of six months during the performance is exceptionalperiod | | | | • options continue to vest provided the option holder meets the retirement age and service requirements, and expire on a measure, the Board may approve a payoutearlier of up to 200%.five years from retirement or the original expiry date | | | | | Termination without Cause | | New• pro-rated to termination date with payout based on actual performance as long as unit holder has a minimum of six months of service in 2017
We are putting more emphasis on return on invested capital and total shareholder return to better align incentive pay with shareholder interests.the performance period
| | | | Based on shareholder feedback, we eliminated operating ratio• six months to exercise vested options; unvested options continue to vest for six months following termination date
| | | | | Termination with Cause | | • all units forfeited | | | | • all options forfeited | | | | | Change of Control | | • if a PSU unit holder is terminated without cause following a change of control, PSUs granted prior to the change of control vest as of the termination date, and PSUs granted after the change of control are forfeited | | | | • if the optionholder is terminated without cause following a long-term measure to reduce overlap with the STIP measures.change of control, then all options vest immediately(1) |
| (1) | Stock options have a double trigger clause requiring a change of control and the option holder to be terminated without cause. |
Stock options and PSUs earn additional unitsare approved and granted to NEOs and eligible employees annually after the fourth quarter financial statement blackout period, and after the Compensation Committee has reviewed the year-end financial results. 24
Grants are also made during the year for special situations such as dividend equivalents atretention or new hires. Special grants can include PSUs, stock options, RSUs or DSUs. These grants to employees, excluding the same rateexecutives reporting to the CEO, are made following CEO approval on the first Tuesday of the month, when there is no blackout in effect. If the Company is in a blackout period, the grant is made after the blackout has been lifted. In addition, the CEO, the Chair of the Board and the Chair of the Compensation Committee have authority to grant options to certain employees based on defined parameters, such as dividends paidthe position of the employee and the expected value of the option award. The CEO and the Chair of the Compensation Committee did not grant any options to executive officers in 2023. 2023 Long-term incentive awards To determine the appropriate value of annual long-term incentive grants provided to the NEOs, the Compensation Committee considers the practices of our comparator group and internal factors, including executive retention, dilutive impact and long-term value creation. Long-term incentive awards are typically granted annually to NEOs and eligible employees. Synergy performance award 2023 was a transformative year for CPKC with the completion of the KCS acquisition and the delivery of EBITDA synergies is a key component of the merger value proposition supported by shareholders and regulators. In recognition of this critical long-term value driver, and mindful of the high demand for Class I railroad talent with Precision Scheduled Railroading experience, the Compensation Committee approved a one-time synergy performance award for a small group of key senior leaders (excluding the CEO) on our common shares.May 17, 2023. The synergy performance award consists of PSUs with vesting conditions directly linked to the achievement of EBITDA synergies with a relative TSR modifier. The synergy performance award will only payout if a threshold level of synergies and relative TSR are achieved, with an opportunity for up to a 250 percent payout if exceptional synergy results are achieved in combination with the top TSR performance amongst the Class I railroads. Payout is paid out in cash based oncapped at 100 percent if CPKC’s TSR is negative. The performance period covers April 28, 2023 to December 1, 2026 and requires the number of units that are earned and the average closing share price for the 30 trading days priorparticipant to be actively employed at the end of the performance period, offering an important retention benefit in addition to performance incentive. Messrs. Velani, Brooks, Redd and Orr were granted synergy performance awards with target grant values equal to 1.25x their 2023 LTIP target. The table below shows the 2023 long-term incentives awards for the NEOs, with the grant date value of the awards. | | | | | | | | | | | | | | | | | | Executive | | Grant Date | | Share Price on Date of Grant ($) | | | Award Type | | Units (#) | | | Grant Date Award
Value ($)(1) | | | | | | | | | Keith Creel (2) | | February 2, 2023 | | | US$79.29 (NYSE) | | | PSUs | | | 77,203 | | | | $8,262,088 | | | | | | | | US$79.29 (NYSE) | | | Options | | | 176,323 | | | | $5,506,930 | | Nadeem Velani(3),(4) | | February 2, 2023 | | | $105.58 (TSX) | | | PSUs | | | 6,317 | | | | $ 666,896 | | | | | | | | $105.58 (TSX) | | | Options | | | 54,188 | | | | $1,512,387 | | | | | | | | $105.58 (TSX) | | | DSUs | | | 20,498 | | | | $2,164,143 | | | | | May 17, 2023 | | | $110.79 (TSX) | | | PSUs | | | 44,839 | | | | $4,967,713 | | John Brooks(4),(5) | | February 2, 2023 | | | US$79.29 (NYSE) | | | PSUs | | | 17,882 | | | | $1,913,691 | | | | | | | | US$79.29 (NYSE) | | | Options | | | 41,926 | | | | $1,309,435 | | | | | May 2, 2023 | | | US$78.16 (NYSE) | | | PSUs | | | 1,112 | | | | $ 117,308 | | | | | | | | US$78.16 (NYSE) | | | Options | | | 2,607 | | | | $ 81,281 | | | | | May 17, 2023 | | | US$82.40 (NYSE) | | | PSUs | | | 39,337 | | | | $4,374,875 | | Mark Redd(4),(6) | | February 2, 2023 | | | US$79.29 (NYSE) | | | PSUs | | | 15,854 | | | | $1,696,659 | | | | | | | | US$79.29 (NYSE) | | | Options | | | 37,172 | | | | $1,160,958 | | | | | | | | US$79.29 (NYSE) | | | DSUs | | | 1,843 | | | | $ 197,272 | | | | | May 2, 2023 | | | US$78.16 (NYSE) | | | PSUs | | | 2,451 | | | | $ 258,562 | | | | | | | | US$78.16 (NYSE) | | | Options | | | 5,746 | | | | $ 179,149 | | | | | May 17, 2023 | | | US$82.40 (NYSE) | | | PSUs | | | 39,052 | | | | $4,343,179 | | John Orr(4),(7) | | April 28, 2023 | | | US$78.84 (NYSE) | | | PSUs | | | 13,462 | | | | $1,432,496 | | | | | | | | US$78.84 (NYSE) | | | Options | | | 31,562 | | | | $ 987,876 | | | | | | | US$78.84 (NYSE) | | | DSUs | | | 20,611 | | | | $2,193,263 | | | | | May 17, 2023 | | | US$82.40 (NYSE) | | | PSUs | | | 27,436 | | | | $3,051,302 | |
| (1) | See the Summary compensation table on page 36 for details on how we calculate the grant date fair values of the PSUs, stock options and DSUs. They were calculated in accordance with FASB ASC Topic 718. The grant value of the awards based on the NYSE trading price has been converted to Canadian dollars using a 2023 average exchange rate of $1.3497. |
25
| (2) | As per the terms of the employment agreement amendment dated March 21, 2021, Mr. Creel’s 2023 LTIP target grant value was reduced by US$2.1 million (C$2.8 million) in consideration for the special upfront stock option grant Mr. Creel received on March 27, 2021. This is the second of four planned reductions to Mr. Creel’s annual LTIP award in each year of 2022, 2023, 2024 and 2025 for a total aggregate reduction of US$8.4 million. See Employment agreements on page 38 for more details. |
| (3) | Mr. Velani elected to defer a portion of his 2023 annual PSU grant to DSUs. |
| (4) | Messrs. Velani, Brooks, Redd and Orr received the one-time, synergy performance awards (discussed above) on May 17, 2023 |
| (5) | Mr. Brooks received additional PSUs and stock options on May 2, 2023 to reflect his new compensation level following the completion of the KCS transaction. |
| (6) | Mr. Redd received additional PSUs and stock options on May 2, 2023 to reflect his appointment as Executive Vice-President and Chief Operating Officer of the combined company and new compensation level. |
| (7) | In connection with Mr. Orr’s commencement of employment as CPKC’s Executive Vice-President and Chief Transformation Officer on April 14, 2023, he received an annual grant of PSUs and stock options as well as a one-time discretionary award on April 28, 2023 of DSUs in lieu of a cash payment that would have been owed under the merger agreement if Mr. Orr had resigned following the merger. |
Performance share units (PSUs) PSUs focus executives on achieving medium-term goals within a three-year performance period. The Board sets performance measures, thresholds and targets at the TSX or NYSE, as applicable. The award may be paid out in shares, onbeginning of the CEO’s recommendation, using theafter-tax value.performance period. 20172023 PSU awards
The performance periodAfter thoughtful consideration, with our shareholders in mind, the Board approved modest changes for the 20172023 PSU awards is January 1, 2017plan design to December 31, 2019. Performance will be assessed againstfurther strengthen the link between pay and performance for CPKC executives and employees. We have continued to challenge the Company with a maximum target for the remaining Free cash flow (FCF)(1) and relative TSR performance measures into payout up to 250 percent. In addition, we have increased the total weighting of relative TSR from 30 percent to 40 percent to place greater emphasis on shareholder value return as we continue to integrate the combined Company. The table below. Awards will be prorated if results fall between threshold and exceptional.below summarizes the resulting 2023 PSU plan design.
| | | | | | | | | | | | | | | | | | | | 2017 PSU performance measures | | Why the measure is important | | Threshold (50%) | | | Target (100%) | | | Exceptional (200%) | | | Weighting | | PSU three-year average return on invested capital (ROIC) Net operating profit after tax divided by average invested capital | | Focuses executives on the effective use of capital as we grow. Ensures shareholders’ capital is employed in a value-accretive manner | | | 14.5% | | | | 15% | | | | 15.5% | | |
| 60% (new)
(increased
from 20% in
2016) |
| Total shareholder return Measured over three years. The percentile ranking of CP’s CAGR relative to the companies that make up the S&P TSX Capped Industrial Index | | Compares our TSR to a broad range of Canadian investment alternatives Aligns long-term incentive compensation with long-term shareholder interests | |
| 25th
percentile |
| |
| 50th
percentile |
| |
| 75th
percentile |
| |
| 20%(new)
(increased
from 10% in
2016) |
| Total shareholder return Measured over three years. The percentile ranking of CP’s CAGR relative to the companies that make up the S&P 1500 Road and Rail Index | | Compares our TSR to the companies that make up the S&P 1500 Road and Rail Index, a broad range of transportation peers, rather than the narrow group of publicly traded Class 1 peers making the payout less volatile and more consistent with the broader industry Aligns long-term incentive compensation with long-term shareholder interests | |
| 25th
percentile |
| |
| 50th
percentile |
| |
| 75th
percentile |
| |
| 20%(new)
(increased
from 10% in
2016) |
|
| | | | | | | | | | | | | | 2023 PSU performance measures | | Why the measure is important | | Weighting | | Threshold | | Target | | Stretch | | Maximum | | | 50% | | 100% | | 200% | | 250% | Three-year cumulative Free Cash Flow (FCF)(1) FCF calculated as cash from operating activities less cash used in investing activities, adjusted for changes in cash and cash equivalents balances | | Incents strong cash flow generation and disciplined capital reinvestment to support the Company’s growth strategy and in turn generate shareholder value | | 60% | | $8,750 | | $9,150 | | $9,950 | | $10,350 | Total shareholder return (TSR) Measured over three years. The percentile ranking of the Company’s TSX Compound Annual Growth Rate (CAGR) relative to the companies that make up the S&P/TSX 60 index | | Compares our TSR on the TSX to the broader S&P/TSX 60 to reflect our performance relative to the Canadian market Aligns long-term incentive compensation with long-term shareholder interests | | 20% | | 25th
percentile | | 50th
percentile | | 75th
percentile | | 85th
percentile | Total shareholder return (TSR) Measured over three years. The percentile ranking of the Company’s NYSE CAGR relative to the companies that make up the S&P 500 Industrials Index | | Compares our TSR on the NYSE relative to a group of large U.S. industrial companies with similar macroeconomic exposure Aligns long-term incentive compensation with long-term shareholder interests | | 20% | | 25th
percentile | | 50th
percentile | | 75th
percentile | | 85th
percentile | | | | | | | | | Potential maximum payout | | | | | | | | | | | | 250% |
| (1) | Free Cash Flow is derived from CPKC’s Adjusted combined free cash, which is a non-GAAP measure. This measure is further defined and discussed in Part VII - Other Information About Non-GAAP measures on pages 105-108 of the Company’s 2024 Proxy Circular. |
At the end of the three-year performance period, the starting point for determining relative TSR will be the10-day trading average of the closing share price of CP shares on the two indicesappropriate index prior to January 1, 20172023 and the closingending point will be the10-day trading average of the closing share price of CP shares on the two indicesappropriate index prior to December 31, 2019.January 1, 2026. TSR is adjusted over the period to reflect dividends paid and the multiplier ispaid. Awards will be interpolated if our performance fallsresults fall between the ranges.threshold and exceptional. If results are below the threshold level for any of the performance measures, units for that specific measure will be forfeited.not vest. 2024 PSU Awards For 2024, the PSU plan design will include a synergy-related EBITDA target with a relative Class I Railroad TSR modifier. This design change will focus and incentivize all LTIP-eligible employees, including the CEO (who did not receive a Synergy Performance Award on May 17, 2023) on this important measure for the performance period covering January 1, 2024 to 2226
Stock options
| | | Stock options focus executives on longer-term performance. Options have a seven-year term and vest 25% each year beginning on the anniversary date of the grant. The grant price is the last closing price of our common shares on the TSX or the NYSE on the grant date. Options only have value for the holder if our share price increases above the grant price.
2017 stock option awards
The table below shows the details of the 2017 annual option award grant.
| | New in 2017
We reduced the term of stock options granted in 2017 and later to seven years from ten years.
|
| | | | | | | | | | | | | | | | Grant value ($) | | | # of options | | | Grant price | | Keith Creel | | | 1,630,352 | | | | 33,884 | | | | US$150.99 (NYSE) | | | | | 896,816 | | | | 18,762 | | | | US$151.14 (NYSE) | | Nadeem Velani | | | 202,650 | | | | 4,644 | | | | $201.49 (TSX) | | Robert Johnson | | | 556,073 | | | | 11,557 | | | | US$150.99 (NYSE) | | Laird Pitz | | | 228,694 | | | | 4,753 | | | | US$150.99 (NYSE) | | Jeffrey Ellis | | | 217,311 | | | | 4,980 | | | | $201.49 (TSX) | |
December 31, 2026. The grant valuesynergy EBITDA target with relative TSR modifier will have a 40 percent weighting and FCF remains in the plan design with a 20 percent weighting. Recognizing the capital-intensive nature of our business and shareholder’s appreciation for ROIC as a PSU financial measure, we intend to re-introduce it as a measure once we reach the appropriate stage of the stock option awards based on the NYSE trading priceCPKC integration. No changes have been converted to Canadian dollars using a 2017 average exchange rate of $1.2986. As disclosed in last year’s proxy, when Mr. Creel became CEO on January 31, 2017, he received a special grant of performance stock options, designed to motivate strong CEO performance, build his equity ownership and retain him during a period of significant change in the railroad industry (see below and the details on page 29). Mr. Creel also received an annual option award of $1,630,352 that was granted on January 20, 2017, and his grant of $896,816 on February 1, 2017 reflects the additional options he received to bring him to the CEO level of 400% of salary. See summary compensation table on page 41 for more information.
We calculated the number of options to be granted to each executive by dividing the grant value by the theoretical value of an option (using the Willis Towers Watson binomial option pricing methodology), appliedmade to our 30-day average closing share price on the TSX or the NYSE prior to the day of the grant.
CEO performance stock options
Mr. Creel’s performance stock options cliff vest on February 1, 2022 (five years from the grant date) based on our five-year total shareholder return relative to two equally weighted measures:
50% of the options will vest if our TSR is at or above the 60th percentile of the companies that make up the S&P/TSX Capped Industrial Index
the other 50% of the options will vest if our TSR is at or above the 60th percentile of the companies that make up the S&P 1500 Road and Rail Index.
Performance will be assessed over a five-year period. The starting point for determining relative TSR will bemeasures (40 percent combined weighting) for the10-day trading average of the closing price of CP shares and the two indices prior to February 1, 2017 and the closing point will be the10-day trading average of the closing price of CP shares and the two indices prior to January 31, 2022. 2024 PSU design.
Stock options Stock options focus executives on long-term performance. The options expire on February 1, 2024. The table below shows the details of the special, upfront grant of performance stock options. | | | | | | | | | | | | | | | | Grant value ($) | | | # of options | | | Exercise price | | | Keith Creel | | | 7,989,462 | | | | 177,225 | | | US$151.14 (NYSE) | | The performance stock options expire after seven years. |
The grant value of the performance stock options is based on our shares traded on the NYSE and have been converted to Canadian dollars using a 2017 average exchange rate of $1.2986.
23
About the stock optionManagement Stock Option Incentive plan
The management stock option incentive plan (stock option plan) was introduced in October 2001.
Regular stock Stock options granted before 2017 expire 10 years from the date of grant and generally vest 25%25 percent each year over four years, beginning on the first anniversary of the grant date.
Stock options Options awarded on or after January 1, 2017 and later have a seven-year term (reduced from 10 years). Ifand vest 25 percent each year over four years beginning on the first anniversary date of the grant. The grant price is the closing price of our shares on the TSX, if the option is granted in Canadian dollars or the NYSE, if the option is granted in United States dollars, on the applicable grant date. Options only have value for the holder if our current share price increases above the grant price before the expiry of the option.
For all grants, if the expiry date falls within a blackout period, the expiry date will be extended to 10 business days afterfollowing the endlast date of the blackout period date.period. If a further blackout period is imposed before the end of the extension, the term will be extended another 10 days after the end of the additional blackout period. Options may be granted by the Board, the Compensation Committee, the Chief Executive Officer, the Chair of the Board or the Chair of the Compensation Committee, as the case may be, as administrator of the option plan, as determined from time to time (the Administrator), to any officer, employee or consultant of the Company or any subsidiary, including a family trust, personal holding corporation and retirement trust (together, Eligible Persons). The exercise price of shares subject to an option will be determined or ratified by the Administrator and will not be less than the market price of the shares at the date on which an option is granted, calculated as the closing price of a board lot of the shares on the TSX (if the option is granted in Canadian dollars) or on the NYSE (if the option is granted in United States dollars) on (i) the last trading day preceding the grant date, if the option is granted before the close of trading on the grant date or (ii) the grant date, if the option is granted after the close of trading on the grant date. The exercise price may also be as permitted or required by the TSX or NYSE, as applicable. CPKC is also entitled to issue share appreciation rights (SARs) pursuant to the terms of the option plan to Eligible Persons at the same time as the grant of an option. SARs, if granted, will have the following terms (or such other terms as are consistent with the related options): | a. | the number of SARs to be granted shall, in the sole discretion of the Administrator, be: |
| i. | one SAR for every two optioned shares, or |
| ii. | one SAR for each optioned share; |
| b. | the reference price for a SAR will be same as the exercise price of the related option; |
| c. | SARs may be exercise from time to time by an optionholder as follows: |
| i. | on and after the second anniversary of the grant date, as to 50% of the SARs or any part thereof; |
| ii. | on and after the third anniversary of the grant date, as to the remaining 50% of the SARs or any part thereof; |
| d. | exercise of SARs will result in a reduction in the number of option shares on the basis of one optioned share for each exercised SAR; and |
| e. | exercise of an option will result in a reduction in the number of SARs on the basis of: |
| i. | one SAR for each optioned share purchased in excess of 50% of the number of optioned shares, where one SAR was granted for every two optioned shares; and |
| ii. | one SAR for each optioned share purchased, where one SAR was granted for each optioned share. |
| f. | The expiry date of a SAR will be ten years after the grant date. |
CPKC did not grant any SARs in 2023 and as of December 31, 2023, CPKC does not have any SARs outstanding. 27
About the stock option plan The table below sets out the limits for issuing options under the plan: | | | | | | | | | As a %percent of the number of shares outstanding | | | Maximum number of shares that, together with any other share compensation arrangement, may be reserved for issuance to insiders as options | | 10% | | | Maximum number of shares that may be issued under the option plan and any other share compensation arrangements to insiders in a one-year period | | 10% | | | Maximum number of shares that may be issued under the option plan and any other share compensation arrangements to any insider in a one-year period | | 5% | | | | | As a percent of the number of shares outstanding at the time the shares were reserved | | | Maximum number of shares that may be reserved for issuance to insidersany person as options | | 10% | Maximum number of options that may be granted to insiders in aone-year period5%
| | 10% | Maximum number of options that may be granted to any insider in aone-year period
| | 5% | | | As a % of the number of shares outstanding at
the time the shares were reserved | Maximum number of options that may be granted to any person
| | 5% |
We measuredilution by determining the number of options available for issuance and the number of options outstanding as a percentage of outstanding shares. Our dilution at the end of 2023 was 3.0 percent. Notwithstanding the limits noted above, the dilution level, measured by the number of options available for issuance as a percentage of outstanding shares. Our potential dilutionshares continues to be capped, at the enddiscretion of 2017 was 2%. The maximum dilution allowed by the Board, is 7%. The option grant price is the last closing market price of shares on the grant date on the TSX or the NYSE (for grants after December 15, 2014 depending on the currency of the grant).at 7 percent.
The table below shows theburn ratefor the last three fiscal years, calculated by dividing the number of stock options granted in the fiscal year by the weighted average number of outstanding shares for the year. | | (as at December 31) | | 2015 | | | 2016 | | | 2017 | | as at December 31 | | | 2021 | | | 2022 | | | 2023 | | | | | Number of options granted | | | 317,202 | | | | 403,740 | | | | 396,980 | | Number of options granted | | Number of options granted | | Number of options granted | | | | 1,346,358 | | | | 839,108 | | | | 856,332 | | | | | Weighted number of shares outstanding | | | 159,733,222 | | | | 149,565,498 | | | | 145,863,318 | | Weighted number of shares outstanding | | Weighted number of shares outstanding | | Weighted number of shares outstanding | | | | 679,709,375 | | | | 929,976,385 | | | | 931,320,259 | | | | | Burn rate | | | 0.20% | | | | 0.27% | | | | 0.25% | | Burn rate | | Burn rate | | Burn rate | | | | 0.20% | | | | 0.09% | | | | 0.09% | |
The table below shows the options outstanding and available for grant from the Stock Option Plan as at December 31, 2017.2023. | | | | | | | | | | | | Number of options/shares | | | Percentage of outstanding shares | | Options outstanding (as at December 31, 2017) | | | 1,361,950 | | | | 0.94 | | Options available to grant (as at December 31, 2017) | | | 1,555,922 | | | | 1.07 | | Shares issued on exercise of options in 2017 | | | 319,403 | | | | 0.22 | | Options granted in 2017 | | | 369,980 | | | | 0.26 | |
| | | | | | | | | as at December 31, 2023 | | Number of options/shares | | | Percent of outstanding shares | | | | | | Options outstanding | | | 6,471,932 | | | | 0.69% | | | | | | Options available to grant | | | 21,758,323 | | | | 2.33% | | | | | | Shares issued on exercise of options | | | 1,634,195 | | | | 0.18% | | | | | | Options granted | | | 856,332 | | | | 0.09% | |
Since the launch of the management stock option incentive plan in October 2001, a total of 18,078,642110,393,210 shares have been available for issuance under the plan and 15,160,77082,162,955 shares have been issued through the exercise of options. A stand-alone option award was granted to Mr. Creel in 2013,options as disclosed in prior proxy circulars.at December 31, 2023. The award was not granted under the management stock option incentive plan.
We do not provide financial assistance to option holders to facilitate the purchase of shares under the plan.
24
Other things to know
There is a double trigger on options so that if there is a change of control and only if an option holder is terminated without cause, all of his or her stock options will vest immediately accordinglast share pool increase to the change in control provisions inManagement Stock Option Incentive Plan was an increase of 20,000,000 shares reserved for issuance thereunder, approved at the stock option plan.
If an employee retires, the options continue to vest and expire on the original expiry date or five years from retirement, whichever is earlier.
If an employee is terminated without cause, the employee has six months to exercise any vested options. If the employee resigns, the employee has 30 days to exercise any vested options. If an employee is terminated with cause all options are cancelled.
Options will continue to vest and expire on its normal expiry date if the holder’s employment ends due to permanent disability.
If an option holder dies, the options will expire 12 months following his death and may be exercised by the holder’s estate. Options can only be assigned to the holder’s family trust, personal holding corporation or retirement trust, or a legal representativeannual meeting of an option holder’s estate or a person who acquires the option holder’s rights by bequest or inheritance.
The CEO, the Chairmanshareholders of the Board and the Compensation Committee chair have authority to grant options to certain employees basedCompany held on defined parameters, such as the position of the employee and the expected value of the option award:
In 2016, the Compensation Committee authorized a pool of 100,000 options for allocation by the CEO, who granted 3,150 options to one employee to recognize performance and for retention.
The Compensation Committee reduced the approved amount in 2017 to 50,000 for allocation by the CEO and 3,998 were granted from this pool.
The Compensation Committee has again approved 50,000 options that the CEO may allocate at his discretion in 2018.April 27, 2022.
Making changes to the stock option plan The Board can make the following changes to the stock option plan without shareholder approval: changes to clarify information or to correct an error or omission changes of an administrative or aare housekeeping nature changes to eligibility to participate in the stock option plan terms, conditions and mechanics of granting stock option awards changes to vesting, exercise, early expiry or cancellation amendments that are designed to comply with the law or regulatory requirements.requirements The Board must receive shareholder approval to make other changes, including the following, among other things: an increase to the maximum number of shares that may be issued under the plan a decrease in the exercise price a grant of options in exchange for, or related to, options being cancelled or surrendered.surrendered 28
The Board has made two amendments to the stock option plan since it was introduced in 2001: Onon February 28, 2012, the stock option plan was amended so that a change of control would not trigger accelerated vesting of options held by a participant, unless the person is terminated without cause or constructively dismisseddismissed; and | • | | Onon November 19, 2015, the stock option plan was amended to providenet stock settlementas a method of exercise, which allows an option holder to exercise options without the need for us to sell the securities on the open market, resulting in less dilution. |
25
Payout of 20152021 PSU award The 20152021 PSU grant for the performance period of January 1, 20152021 to December 31, 20172023 vested on December 31, 2023 and was paid out on February 23, 2018.15, 2024. The named executivesNEOs and all other eligible employees received aan overall performance payout factor of 160%135 percent on the award which includes dividends earned up to the payment date.award. The table below shows the difference between the actual payout value and the target grant value for each named executive. 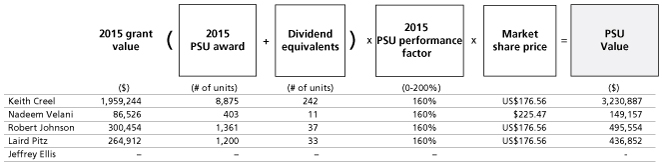
For Mr. Velani, the market share priceNEO. The 2021 PSU grant was calculated using $225.47, the average30-day trading price of our shares prior to December 31, 2017 on the TSX. For Mr. Creel, Mr. Johnsona CP standalone award and Mr. Pitz, the market share price was US$176.56, the average30-day trading price of our shares prior to December 31, 2017 on the NYSE, and the value of these shares were converted to Canadian dollars using theyear-end exchange rate of $1.2545. For comparability, for Mr. Creel, Mr. Johnson and Mr. Pitz, the 2015 grant value was converted using an exchange rate of 1.2787.
Mr. EllisOrr was not eligible for the 2015 Performance Plan payout as he was not ana CP employee of CP at the time of grant.
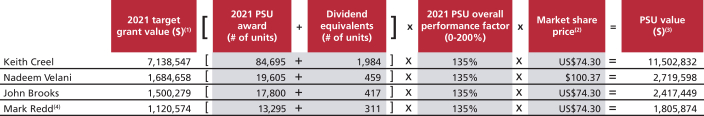
| (1) | The grant value for Messrs. Creel, Brooks and Redd was converted to Canadian dollars using an exchange rate of $1.2535 for 2021. The target grant value represents PSUs only. For Mr. Redd, the target grant values excludes the value of the PSUs deferred to PDSUs. |
| (2) | Reflects the 30-day average closing share price prior to December 31, 2023 on the TSX ($100.37) and NYSE (US$74.30) when both markets were open. |
| (3) | The PSU payout value for Messrs. Creel, Brooks and Redd was converted using a 2023 year-end exchange rate of $1.3226. |
| (4) | Mr. Redd elected to defer a portion of his 2021 PSU award to PDSUs. The PSU value reflects the cash payout for the PSUs that were not deferred. Mr. Redd received an additional 533 PDSUs as a result of the 2021 PSU performance factor, and a further 511 matching PDSUs, respectively, on February 6, 2024. See About deferred compensation section on page 44 for more details. |
How we calculated the 20152021 PSU performance factor The PSU performance factor for the three-year period from January 1, 2015 to December 31, 2017 is 160%, as shown in the table below. The payout value has been calculated in accordance with the terms of the performance share unitPSU plan and the 20152021 award agreement.
| | | | | | | | | | | | | | | | | | | | | | | | | | PSU measures | | Threshold 50% | | | Target 100% | | | Maximum 200% | | | PSU Result | | | Weighting | | | Factor | | PSU Operating ratio Operating expenses divided by total revenues | | | 64% | | | | 62% | | | | 60% | | | | adj. 57.1% | | | | 50% | | | | 200% | | PSU 2015 to 2017 average ROIC Net operating profit after tax divided by average invested capital | | | 13% | | | | 14% | | | | 15% | | | | adj. 15.1% | | | | 30% | | | | 200% | | Total shareholder return Three-year CAGR relative to the S&P/TSX 60 Index | | | 0% | | | | 1% | | | | 5% | | | | -5.6% | | | | 10% | | | | 0% | | Total shareholder return Ranking at the end of the three years relative to Class 1 Railroads | | | 4 | | | | 3 | | | | 1 | | | | 5 | | | | 10% | | | | 0% | | PSU performance factor | | | | | | | | | | | | | | | | | | | | | | | 160% | |
We make certain assumptions when we set the plan targets. Results under the PSU plan are adjusted to reflect changes to those assumptions so we measure the true operating performance of the business. Operating ratio was adjusted to reflect the following items: foreign exchange, This includes provisions for adjusting ROIC results for items such as the impact of a higher than forecaston-highway diesel (OHD)the KCS acquisition, fuel price assumptions, pension assumptions and land sales. ROIC was adjusted forregulatory changes implemented during the performanceplan period that were not quantifiable at the time of the pension plan as its impact on the balance sheet was not a good indicationtarget setting and outside of management’s ability to deliver returns from the core business on its invested capital.direct control.
| | | | | | | | | | | | | | | | | | | | | | | | | | | | PSU performance measures | | Threshold (50%) | | | Target
(100%) | | | Stretch (200%) | | | Maximum (250%) | | | PSU
result | | | Weighting | | | PSU
performance
factor | | | | | | | | | | 3-Year Average Adjusted ROIC(1) | | | 15.6% | | | | 16.4% | | | | 16.8% | | | | 17.2% | | | | 16.66% | | | | 70% | | | 164% | | | | | | | | | | TSR to S&P/TSX 60 Index(2) | |
| 25th
percentile |
| |
| 50th
percentile |
| |
| 75th
percentile |
| | | n/a | | |
| 42nd
percentile |
| | | 15% | | | 84% | | | | | | | | | | TSR to Class I railroads(2) | | | 4th | | | | 3rd | | | | 1st | | | | n/a | | | | 4th | | | | 15% | | | 50% | | | | | | | | | | PSU performance factor | | | | | | | | | | | | | | | | | | | | | | | | | | 135% |
26
| (1) | Adjusted ROIC is derived for CP standalone in a manner consistent with Core adjusted combined ROIC, except that impacts of the KCS acquisition and KCS results are removed from CP’s results, and further adjusted as described above. Core adjusted combined ROIC is a Non-GAAP measure, which is further defined and discussed in Part VII - Other Information About Non-GAAP measures on pages 105-108 of the Company’s 2024 Proxy Circular. |
| (2) | TSR performance was rated against companies in the respective indices at the beginning and end of performance periods in accordance with the terms of the PSU plan and the 2021 award agreement. |
29
KEITH E. CREEL PRESIDENT AND CHIEF EXECUTIVE OFFICERNEO executive profiles
| | | | | | Keith E. Creel | | President and Chief Executive Officer |
| | |  
| | Mr. Creel was appointed asbecame the first President and Chief Executive Officer (CEO)of CPKC on April 14, 2023 with the combination of Canadian Pacific and Kansas City Southern. Prior to the merger, he served as President and Chief Executive Officer of CP, a position he assumed in January 31, 2017. Mr. Creel was previously CP’sjoined the Company in February 2013 as President and Chief Operating Officer (COO). Prior to joining Canadian Pacific, Mr. Creel had a very successful operatingOfficer. He began his railroad career which began at Burlington Northern as a management traineeRailway in operations1992 and eventually led tohas held progressively more senior operating positions throughout his becomingcareer at Illinois Central and later at Canadian National (CN) where he held the EVPposition of Executive Vice President and COO at CN in 2010.Chief Operating Officer.
Mr. Creel obtainedholds a Bachelor of Science in marketing from Jacksonville State University and has completed the Advanced Management Program at the Harvard Business School. He served as a commissioned officer in the U.S. Army during which time he served in theand is a Persian Gulf War.War veteran. Recognized for his leadership, he was named by Progressive Railroading as Railroad Innovator for 2014 and by Railway Age as Railroader of the Year in 2021. He was also recognized by The Globe and Mail’s Report on Business as their CEO of the Year and Strategist of the Year in 2021. |
2017 performanceAccomplishments in 2023
Keith CreelUnder Mr. Creel’s leadership, Canadian Pacific and Kansas City Southern combined on April 14, 2023, to create CPKC, the only single-line rail network connecting Canada, the U.S. and Mexico. Integration activities across the combined network during the period since control have been successful, with no service interruptions or negative impacts on customers, communities, connecting railroads or safety. CPKC has continued to execute to plan while ensuring compliance with all conditions imposed by the STB.
Combined total revenues(1) increased five percent to $13.9 billion from $13.2 billion in 2022 and combined volume increased by one percent. Core adjusted combined diluted earnings per share(2) increased two percent to $3.84 from $3.77 in 2022. CPKC led the industry with the lowest FRA-reportable train accident frequency among Class I railroads on a combined basis, building on CP’s legacy of 17 consecutive years of industry leadership. This resulted in a 32 percent improvement in FRA-reportable train accident frequency and a 12 percent improvement in FRA-reportable personal injury rate when comparing to 2022 on a combined full year basis.(3) Our Home Safe program was appointed Presidentextended across the KCS territory contributing to outstanding safety results, along with continued investment in technology solutions including wayside detector systems, washout prevention and CEObroken rail detection technology. Use of innovative data analytics and machine learning warns of impending failures, allowing for proactive actions to be taken. Recognizing people as our most important asset, 2023 focused on January 31, 2017,cultural integration of 20,000 employees across three countries. This has included employee engagement surveys, regular employee townhalls across the network and enhanced focus on leadership development and diversity and inclusion. CPKC was recognized as one of Canada’s Top 100 Employers for the second consecutive year, Alberta’s Top 75 Employers for the fourth consecutive year, and achieved the Military Friendly Employer designation. CPKC continues to build a more sustainable future for our people, business, society, and the environment. As a newly combined company, CPKC established a consolidated greenhouse gas (GHG) emissions reduction target and announced its commitment to develop a future target aligned with a 1.5°C future and supporting the global economy to achieve net-zero emissions by 2050. In recognition of its continued commitment to continuous improvement and transparent disclosure, CPKC was named to the Dow Jones Sustainability World Index (DJSI World) and to the North America Index (DJSI North America). CPKC continues to be an industry leader with our innovative hydrogen locomotive strategy. In addition to two low-horsepower locomotives regularly deployed in-service, a high horsepower AC locomotive achieved first movement on its own power with plans to deploy the AC beginning with testing in 2024. CPKC and CSX recently announced a planned transition that had been in place since he was recruitedcollaboration to CP in February 2013 as President and COO. As President and CEO, Mr. Creel is responsible for providing leadership and strategic vision for CP leading CP’s transition from a corporate turnaround to a growth-focused company.develop additional low-horsepower hydrogen locomotives, positively impacting industry-wide long-term sustainability. In 2017 Mr. Creel focused on the following key areas:
1.(1) | Strategic directionCombined Total Revenues for the year ended December 31, 2023 and year ended December 31, 2022 represent combined operating information and are determined by translating KCS’s historical U.S. dollar denominated revenues to Canadian dollars at the Bank of Canada daily exchange rate, aligning KCS’s revenues into Freight and Non-freight revenues consistent with CPKC’s financial statement captions, and eliminating intercompany transactions between CP and KCS in a consistent manner with Article 11. In 2023, CPKC reported total revenues of $12.6 billion, an increase of 42 percent from $8.8 billion in 2022. |
| (2) | Core adjusted combined diluted EPS is a non-GAAP measure. This measure is defined and reconciled on pages 50 – 54 of the Company’s 2023 Form 10-K. |
| (3) | Refer to Footnote 1 FRA metrics on page 22. |
30
CPKC held its inaugural investor day where the executive team outlined the strategic plan and provided multi-year financial guidance. To support these targets, a number of strategic initiatives were launched with promising early progress: Flagship Mexico Midwest Express service launched May 11, the first and only single-line rail connection between Mexico and the U.S. Midwest bringing customers a truck-competitive service. Secured new multi-year agreements with Schneider and Knight-Swift for intermodal transportation services along the single-line north-south corridor. New agreement signed with Americold, creating an innovative cold storage ecosystem between the U. S. and Mexico. CPKC added 1,000 new refrigerated intermodal containers (reefers) more than doubling the existing fleet. Launched a cross border international intermodal service from Lazaro Cardenas into the continental United States, offering a unique west coast option for shippers. | • | | Reached agreement with CSX and G&W (operating as “MNBR” or Meridian & Bigbee Railroad LLC in Mississippi and Alabama) to establish a new freight corridor(1) for shippers that connects Mexico, Texas and the U.S Southeast. Furthermore, G&W committed to expanding service to Alberta and the Alberta Industrial Heartland in conjunction with CPKC. |
| 2. | | | | 2023 Compensation 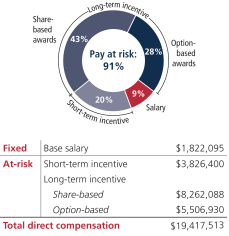
| Employee engagement and team development | | | At CPKC, the STIP individual performance factor for the
CEO cannot exceed the corporate performance factor. This
ensures the payout factor for the CEO aligns with the
Company’s overall performance. Consistent with our pay for performance philosophy for
Mr. Creel, his STIP award for 2023 is directly linked to
CPKC’s corporate performance factor of 140 percent. |
2024 Compensation The Compensation Committee, with guidance and advice from FW Cook, conducted a comprehensive review of Mr. Creel’s compensation in conjunction with competitive market information as well as corporate and individual performance. Based on the findings of this review, the Committee adjusted Mr. Creel’s long-term incentive target for a total target direct compensation increase of US$975,000 (C$1.29 million). As per the terms of Mr. Creel’s employment agreement amendment dated March 21, 2021, the 2024 LTIP target grant value will be reduced by US$2.1 million (C$2.8 million) in consideration for the special upfront stock option grant Mr. Creel received on March 27, 2021. See Employment agreements on page 38 for more details. | (1) | Subject to regulatory approval by the U.S. Surface Transportation Board. |
4. | Operating and safety performance |
2017 highlights
CP delivered record financial and safety performance in 2017.
Our total revenues grew by 5% to $6.55 billion which, combined with our disciplined operating model, produced record operating income and anall-time best operating ratio.
We invested $1.34 billion in our capital program and demonstrated our commitment to shareholders by returning approximately $691 million through share buybacks and dividends. We also increased our quarterly dividend by 12.5%, from $0.50 to $0.5625, and announced a new share repurchase program. Our total shareholder return for 2017 was 21%.
Throughout, we remained steadfast in our commitment to safety. We improved our train accident frequency rates by 12%, which marked the 12th consecutive year that we have led the industry on this key safety metric.
Strategic direction
Mr. Creel’s planned succession to the President and CEO role began when he arrived at CP in 2013 to work alongside the late legendary railroader Hunter Harrison and lay out a path for CP. CP achieved an extraordinary turnaround under the leadership of Mr. Harrison and Mr. Creel.
As President and CEO, Mr. Creel quickly began setting the direction for the next chapter of the CP story. CP has spent the last five years right sizing the organization and our asset base and improving our operations and service using CP’s precision railroading model. Our network now has the fastest and shortest transit times in the key markets we serve. Mr. Creel is leveraging those strengths and applying his20-plus years of railroading experience and the talent of his leadership team to grow our top line and achieve long term sustainable growth.
Our focus on safety, service and innovation, combined with our financial strength and our ability to capitalize on our network and deliver in a disciplined and cost-effective way, are key elements for achieving our strategy.
Employee engagement and team development
Building on his commitment to our people when he joined CP, Mr. Creel has devoted a significant amount of time in 2017 to deepen our relationship with employees in all areas of the business and support retention to help our future growth. He hosted a series of town halls and implemented CEO round tables to hear first-hand from employees across our network and respond to their questions, concerns and ideas about our strategy and our business. Under Mr. Creel’s leadership, CP conducted an employee engagement survey fornon-union employees, to solicit feedback and identify areas for opportunity. Mr. Creel is leading our efforts to increase diversity throughout the organization. At Mr. Creel’s direction we are also introducing new programs and tools to strengthen leadership and accountability, improve retention and outreach, and support the recruitment of women and indigenous peoples.
2731
Significant work was done in 2017 to collaborate proactively with our union partners to reach a number of long-term labour agreements before expiry. Ratification of the new five-year agreements with the Canadian Pacific Police Association, the United Steelworkers (USW) and the Teamsters Canada Rail Conference Maintenance of Way Employees Division (TCRC-MWED) bring labour stability for the company and our employees and align employees’ interests with our growth objectives, while supporting a common vision that was in the best interest of all stakeholders.
As part of his appointment as President and CEO, Mr. Creel established a new leadership team and structure that better leverages ourbest-in-class service to meet the needs of current and future customers and support our long term sustainable growth strategy in the years ahead. These changes include the appointment of John Brooks as Chief Marketing Officer and the recruitment of two new vice-presidents in sales and marketing.
Business development
CP is creating the foundation for top line growth by focusing on new business opportunities and enhancing service. In 2017 we expanded our market reach through initiatives such as our sales presence in Asia, daily service from Vancouver to Detroit, and expansion into the Ohio Valley. CP is the first railroad to offer a direct route from Vancouver to the Ohio Valley. We are already experiencing gains in market share through these enhanced offerings.
Additionally, we enhanced our service offerings such as our new “live” lift operation at Portal, North Dakota, our new large-scale, multi-commodity transload facility in Vancouver, and the roll out of our Auto Grate technology at all of our intermodal terminals. These initiatives makes it easier and faster for our customers to do business, provide more efficient transload services and increase network fluidity which provides our customers with a strategic advantage.
Operating and safety performance
We remain grounded in our foundations of precision railroading and continue to fine-tune our operations in our constant pursuit of operational, service and safety excellence while controlling costs. In 2017, CP moved 5% more volume, while sustaining key operating metrics and improving overall safety performance. CP ended 2017 with an industry-leading FRA train accident rate of 0.99. This result not only represents a 12% improvement over 2016, but also represents the 12th consecutive year that CP has led the industry on this metric. CP’s FRA personal injury rate was 1.65, a 1% improvement over 2016.
In 2017, CP continued to roll out its Home Safe program – an initiative designed to take CP’s safety culture to the next level. Home Safe is a commitment to be vigilant about personal safety and the safety ofco-workers. It is based on 100% compliance to operating rules and safety practices, partnering with all employees, and treating each other with mutual respect. It is the commitment each employee makes to watch out for each other and to let someone know if they are at risk.
Mr. Creel also championed our trip plan effort. His leadership has involved setting clear direction and expectations on how to set and measure trip plans, and hold Operations accountable for execution. In 2017, CP continued to develop and refine our ability to measure trip plan. Trip plan is a detailed schedule for a shipment that has become CP’s cornerstone operating principle. It aligns our service plan and customer expectations, fromcut-off to local service, through to the delivery at destination. Through trip plan, CP is generating superior service that is consistent and aligned with market requirements, while controlling costs through improved efficiencies. CP will continue to refine and enhance our trip planning processes in 2018, by modifying schedules and business rules to ensure we meet market needs.
Stakeholder engagement
Mr. Creel led a range of engagement activities in 2017 with a broad group of external stakeholders, including shareholders, senior legislators and policy makers, regulators, First Nations, and industry associations. Mr. Creel had numerous meetings in Ottawa and other locations to advocate for a balanced approach to industry regulation and legal changes to allow the proactive use of locomotive voice and video recorders to prevent incidents and improve rail safety. He had discussions with senior government officials in Canada and the U.S. to discuss the importance of the North American Free Trade Agreement to the North American economy. In addition, Mr. Creel met with current and prospective shareholders to thoroughly communicate our growth strategy and build confidence in the new management team.
All of these initiatives support our efforts to build on our operating efficiency, customer service and safety record, without compromise, and focus on growing CP into the future and creating long-term value for our customers, our employees and our shareholders. The Compensation Committee completed the assessment of CEO performance, which was discussed with and approved by the Board. Mr. Creel was assessed as exceeding his overall individual performance objectives and leading the company to achieve strong corporate performance.
28
2017 compensation
The table below shows the compensation awarded to Mr. Creel for 2017, compared to the previous two years.
| | | | | | | | | | | | | | | 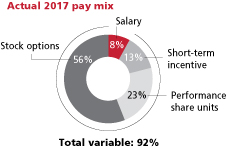
| | Compensation ($’000) | | 2017 | | | 2016 | | | 2015 | | | | Fixed | | | | | | | | | | | | | | | Base earnings | | | 1,437 | | | | 1,261 | | | | 1,164 | | | | Variable | | | | | | | | | | | | | | | Short-term incentive | | | 2,419 | | | | 1,901 | | | | 1,602 | | | | Long-term incentive | | | | | | | | | | | | | | | - PSUs | | | 4,408 | | | | 2,404 | | | | 1,959 | | | | - Stock options | | | 10,517 | | | | 2,131 | | | | 2,130 | | | | Total direct compensation | | | 18,781 | | | | 7,697 | | | | 6,855 | | | | Total target direct compensation | | | 9,058 | | | | 6,336 | | | | 5,836 | | | | Notes: Salary is the actual amount received that year. Payments made in U.S. dollars have been converted to Canadian dollars using an average exchange rate for the year: $1.2986 for 2017, $1.3248 for 2016 and $1.2787 for 2015. In 2017, Mr. Creel received 177,225 performance stock options that cliff vest in five years based on our relative TSR against the companies that make up the S&P/TSX Capped Industrial Index and the companies that make up the S&P 1500 Road and Rail Index (see the2017 Long-term incentive – CEO granton page 23 and the summary compensation table on page 41 for details). | |
We signed a new employment agreement with Mr. Creel effective January 31, 2017, which sets out the terms of his compensation as CEO. The new agreement was designed to align his compensation closer to the market median of our peer group, does not include tax equalization and limits his use of the corporate aircraft to corporate travel and family visits within North America.
Salary
Mr. Creel received a 17.6% increase to US$1.125 million when he became CEO on January 31, 2017.
Short-term incentive
Based on our 2017 corporate performance and the assessment of his individual performance, Mr. Creel received a cash bonus of $2,419,292 for 2017, calculated as follows:
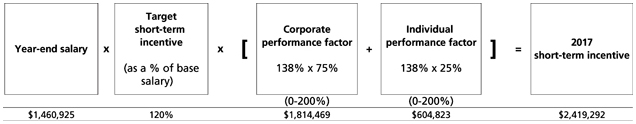
Year-end salary and the 2017 STIP award were paid in U.S. dollars and have been converted to Canadian dollars using an average exchange rate of $1.2986 for 2017.
Long-term incentive
Mr. Creel received annual 2017 long-term incentive awards with a total grant value of $6,934,956, 100% of his target award. The grant was allocated 60% PSUs and 40% stock options.
As disclosed in last year’s proxy, when Mr. Creel became CEO on January 31, 2017, he received a special grant of performance stock options, designed to motivate strong CEO performance, build his equity ownership and retain him during a period of significant change in the railroad industry. To make the upfront grant, the Compensation Committee reduced Mr. Creel’s target long-term incentive award to 400% of salary for the next five years (from the market median of 500% among the Class 1 railroads), and used the difference (5 years x 100%) to make the award, which was allocated 100% to performance stock options (see page 23 for details about the vesting and performance conditions).
29
Realized and realizable pay The value of Mr. Creel’s incentive compensation is based on our performance over the period and, for the long-term incentive, our share price when the awards vest. The graph below shows the three-year average of Mr. Creel’s granted and realized and realizable pay from 20152021 to 2017.2023. 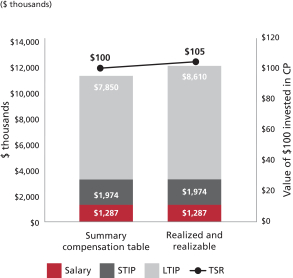
Notes:
Summary compensation table: average of salary earned, actual cash bonus received, and long-term incentives granted (using the grant date fair value from 2015 to 2017 as disclosed in the summary compensation table on page 41). The compensation figures have been converted to Canadian dollars using the following average exchange rates: $1.2787 for 2015, $1.3248 for 2016 and $1.2986 for 2017.
Realized and realizable: average of salary earned, actual cash bonus received, the value of long-term incentive awards that have vested or been exercised, and the estimated current value of unvested long-term incentive awards granted from 2015 to 2017:
vested PSUs and stock options are valued at the time of vesting or exercise
the value of vested 2015 PSUs payable in February 2018 was calculated using the30-day average trading price of our shares prior to December 31, 2017 of US$176.56 on the NYSE with a performance multiplier of 1.6 and includes dividends earned up to the payment date
the value of unvested 2016 and 2017 PSU’s are based on the closing price of our shares on December 29, 2017 of US$182.76 on the NYSE with a performance multiplier of 1.0. PSUs include reinvestment of additional units received as dividend equivalents
the value of unvested/unexercised stock options is based on the closing price of our shares on December 29, 2017 of US$182.76 on the NYSE
the compensation figures for salary earned and actual bonus received have been converted to Canadian dollars using the following average exchange rates: $1.2787 for 2015, $1.3248 for 2016 and $1.2986 for 2017.
the value of any realized and realizable PSUs and Options have been converted into Canadian dollars using the 2017year-end exchange rate of $1.2545
We also compare the realized and realizable value of $100 awarded in total direct compensation to Mr. Creel in each year to the value of $100 invested in CP shares on the first trading day of the period, assuming reinvestment of dividends, to show a meaningful comparison of shareholder value.
30
| | | | | 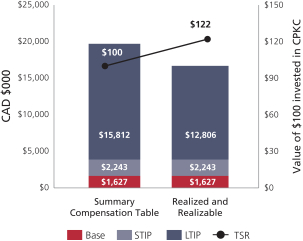 | | | | Summary compensation table. Reflectsaverage of salary earned, actual cash bonus and long-term incentives granted as disclosed in the Summary compensation table on page 36 Realized and realizable. Reflectsaverage of salary earned, actual cash bonus, the value of long-term incentive awards that have vested or been exercised and the estimated current value of unvested long-term incentive awards granted from 2021to 2023 • the value of vested 2021 PSUs paid in February 2024 was calculated using the 30-day average trading price of our shares prior to December 31, 2023 of US$74.30 on the NYSE with a performance multiplier of 135 percent and includes reinvested dividends up to the payment date • the value of unvested 2022 and 2023 PSUs are based on the closing price of our shares on December 29, 2023 of US$79.06 on the NYSE with a performance multiplier of 100 percent and includes reinvested dividends • the value of unvested/unexercised stock options is based on the closing price of our shares on December 29, 2023 of US$79.06 on the NYSE • the values for salary earned and actual cash bonus are as disclosed in the Summary compensation table on page 36 • the value of any realized and realizable PSUs and stock options have been converted into Canadian dollars using the 2023 year-end exchange rate of $1.3226 |
Pay linked to shareholder value The table below shows Mr. Creel’s total direct compensation in Canadian dollars in each of the last three years, compared to its realized and realizable value as at December 31, 2017.2023. We also compare the realized and realizable value of $100 awarded in total direct compensation to Mr. Creel in each year to the value of $100 invested in CP shares on the first trading day of the period, assuming reinvestment of dividends, to show a meaningful comparison of shareholder value. | | | | | | | | | | | | | | | | | | | | | | (Cdn$) | | | | | | | | | | | Value of $100 | | | | | Compensation
awarded | | | Realized and realizable value
of compensation as at
December 31, 2017 | | | Period | | | Keith Creel | | | Shareholder | | 2015 | | $ | 6,855,631 | | | $ | 6,288,021 | | | | Jan 1, 2015 to Dec 31, 2017 | | | | 92 | | | | 105 | | 2016 | | $ | 7,696,926 | | | $ | 11,193.523 | | | | Jan 1, 2016 to Dec 31, 2017 | | | | 145 | | | | 132 | | 2017 | | $ | 18,780,304 | | | $ | 18,131,928 | | | | Jan 1, 2017 to Dec 31, 2017 | | | | 97 | | | | 121 | |
| | | | | | | | | | | | | | | | | | | | | | Year | | Compensation awarded ($) | | | Realized and realizable value
of compensation as at December 31, 2023 ($) | | | Period | | | Value of $100 | | | | Keith Creel | | | Shareholder | | | | ($) | | | ($) | | 2021(1) | | | 25,883,203 | | | | 24,121,282 | | | | Jan 1, 2021 to Dec 31, 2023 | | | | 93 | | | | 122 | | 2022(2) | | | 13,743,780 | | | | 12,157,552 | | | | Jan 1, 2022 to Dec 31, 2023 | | | | 88 | | | | 117 | | 2023 | | | 19,417,513 | | | | 13,749,251 | | | | Jan 1, 2023 to Dec 31, 2023 | | | | 71 | | | | 105 | |
| (1) | Compensation awarded in 2021 is higher than 2022 and 2023 as a result of the special upfront grant of stock options in March 2021 and has normalized in 2022 and 2023. |
| (2) | As per the terms of Mr. Creel’s employment agreement amendment dated March 21, 2021, Mr. Creel’s 2022 and 2023 LTIP target grant values were reduced by US$2.1 million (C$2.8 million) in consideration for the special upfront stock option grant Mr. Creel received on March 27, 2021. There are four planned reductions to Mr. Creel’s annual LTIP award in each year of 2022, 2023, 2024 and 2025 for a total aggregate reduction of US$8.4 million. See Employment agreements on page 38 for more details. |
Mr. Creel’s compensation awarded isvalues are as disclosed in the summarySummary compensation table. He receives his compensation in U.S. dollars. Annual compensation figures have been converted to Canadian dollars using the following average exchange rates: $1.2787 for 2015, $1.3248 for 2016 and $1.2986 for 2017. Mr. Creel’s realized and realizable value for salary earned and actual bonus received have been converted to Canadian dollars using the following average exchange rates: $1.2787$1.2535 for 2015, $1.32482021, $1.3013 for 20162022 and $1.2986$1.3497 for 2017.2023. The value of any realized and realizable long-term incentive is converted into Canadian dollars using the 20172023 year-end exchange rate of $1.2545. Equity ownership (at December 31, 2017)
| | | | | | | | | | | | | | | Requirement (as a multiple of salary) | | Minimum
ownership value ($) | | | Shares ($) | | Deferred share
units ($) | | Total ownership
value ($) | | Total ownership (as a multiple of salary) | | 6x | | $ | 8,467,875 | | | 552,707 | | 7,157,512 | | 7,710,219 | | | 5.46x | |
Mr. Creel is on track to meeting his share ownership requirements by January 2022. Values are based on US$182.76, the closing price of our common shares on the NYSE on December 29, 2017 and have been converted using ayear-end exchange rate of $1.2545.
Mr. Creel received a special make-whole DSU grant when he was hired in 2013. These vested in 2016, but he cannot redeem them until six months after he retires or leaves the company.$1.3226.
3132
NADEEM S. VELANI EXECUTIVE VICE-PRESIDENT AND CHIEF FINANCIAL OFFICER
| | | | 
| | Nadeem S. Velani | | Mr. Velani was appointed Vice-President and Chief Financial Officer on October 18, 2016 and was appointed Executive Vice-President and Chief Financial Officer on October 17, 2017.
|
| | | 
| | Mr. Velani isserves as a key member of the senior managementCPKC executive leadership team responsible for thewith duties including long-term strategic direction of the Company. Other responsibilities includeplanning, financial planning, investor relations, reporting and accounting systems, as well as pension,procurement, treasury, investor relations and tax functions.tax. Prior to the merger, Mr. Velani joinedserved as Executive Vice-President and Chief Financial Officer at CP since October 2017, initially appointed VP and CFO in October 2016. Before joining CP in March 2013, and most recently served as Vice-President Investor Relations. Prior to CP, Mr. Velani spent approximately 15 years at CN where he worked in a variety of leadership positions in financial planning, salesStrategic and marketing, investor relationsFinancial Planning, Investor Relations, Sales and Marketing and the Office of the President and CEO. Mr. Velani holds a Bachelor of Economics degree from Western University, an MBA in Finance/International Business from McGill and completed the Advanced Management Program at Harvard Business School. Mr. Velani is a well-respected CFO having been named Canada’s CFO Of The Year in 2020, and recognized as one of the Top 50 Best Executives by the Globe and Mail’s Report on Business in the same year. |
2017 performance
The CEO assessed Mr. Velani’s performance in 2017 against his individual performance objectives, which included developing a culture and organizational structure in finance better aligned to support an operations-focused company, building a strong team of financial leaders, reviewing the pension plan investment strategy and improving the financial planning, budgeting and forecasting process. In addition, Mr. Velani was responsible for leading an update of the company’s strategic multi-year plan.
All aspects of these functions were taken into consideration as part of the assessment. Mr. Velani was assessed as exceeding his individual performance objectives for the year.
The assessment was reviewed by the Compensation Committee, and approved by the Board.
2017 compensation
The table below is a summary of the compensation awarded to Mr. Velani for 2017, compared to the two previous years.
| | | | | | | | | | | | | | | 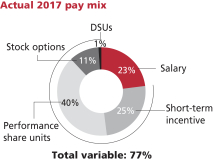
| | Compensation ($’000) | | 2017 | | | 2016 | | | 2015 | | | | Fixed | | | | | | | | | | | | | | | Base earnings | | | 451 | | | | 299 | | | | 224 | | | | Variable | | | | | | | | | | | | | | | Short-term incentive | | | 491 | | | | 374 | | | | 153 | | | | Long-term incentive | | | | | | | | | | | | | | | - PSUs | | | 782 | | | | 132 | | | | 87 | | | | - Stock options | | | 203 | | | | 105 | | | | 72 | | | | - DSUs | | | 24 | | | | - | | | | 15 | | | | Total direct compensation | | | 1,951 | | | | 910 | | | | 551 | | | | Total target direct compensation | | | 1,840 | | | | 1,141 | | | | 576 | |
Salary
Mr. Velani received a 10.8% step increase in 2017 to bring his salary closer to the market median and as a result of his appointment as Executive Vice-President and CFO on October 17, 2017.
2017 short-term incentive
Based on our 2017 corporate performance and the assessment of his individual performance, Mr. Velani received a cash bonus of $490,763 for 2017, calculated as follows:

32
2017 long-term incentive
Mr. Velani also received annual 2017 long-term incentive awards in the form of PSUs and Options with a total grant value of $985,045. When options were granted on January 20, 2017, Mr. Velani’s target was 115% of base salary of $415,000. This grant was allocated at 40% of target in stock options. When PSUs were granted, Mr. Velani’s target increased to 225% of base salary. This grant was allocated at 60% of target in PSUs.
Equity ownership (at December 31, 2017)
| | | | | | | | | | | | | | | | | | | | | Requirement (as a multiple of salary) | | Minimum
ownership value ($) | | | Shares ($) | | | Deferred share
units ($) | | �� | Total ownership
value ($) | | | Total ownership (as a multiple of salary) | | 3x | | | 1,380,000 | | | | 184,354 | | | | 368,825 | | | | 553,179 | | | | 1.20x | |
Mr. Velani is on track to meeting his share ownership requirements by February 2022. Values are based on $229.66, the closing price of our common shares on the TSX on December 29, 2017.
33
ROBERT A. JOHNSON EXECUTIVE VICE-PRESIDENT, OPERATIONS
| | | | | | | 2023 Performance highlights: | | 2023 Compensation: | • Combined total revenues(1) increased by five percent to $13.9 billion from $13.2 billion in 2022. Core adjusted combined diluted EPS(1) was $3.84, up two percent from last year. • Provided strong oversight of the Company’s capital structure including the repayment of $2.4 billion in debt, an important step in ensuring the Company returns to its target leverage of 2.5x adjusted combined net debt to adjusted combined EBITDA.(1). • Led the update of the strategic multi-year plan presented at CPKC’s inaugural investor day. • Progressed execution of integration objectives including successful go-live Day 1 financial reporting for a consolidated CPKC as well as integration of controls, external auditors, and accounting policies; completed $3.0 billion debt exchange of seven series KCS notes for new CPRC notes, with 97% acceptance. • Ensured the disciplined deployment of $2.7 billion in capital investment supporting integration and enabling synergies. • Co-chaired Company’s Diversity and Leadership Development Steering Committee, championing company-wide leadership programs and diversity initiatives. • Named to Institutional Investor’s All-Canada Executive Team as Top CFO in capital goods/industrial sector in 2023. • Qualified as a railroad conductor. | | 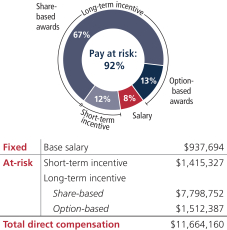
|
| | | | | | John K. Brooks | | Executive Vice-President and Chief Marketing Officer |
| | |  
| | Mr. JohnsonBrooks is responsible for CPKC’s commercial business units and leads sales and marketing professionals across North America. Mr. Brooks is also responsible for strengthening partnerships with existing customers, generating new opportunities for growth, enhancing the value of the company’s service offerings and developing strategies to optimize CPKC’s book of business. Prior to the merger, Mr. Brooks served as Executive Vice-President and Chief Marketing Officer at CP since February 14, 2019. He began his railroading career with Union Pacific and later helped start I&M Rail Link, LLC, which was appointedpurchased by the Dakota, Minnesota and Eastern Railroad (DM&E) in 2002. Mr. Brooks was Vice-President of Marketing at the DM&E prior to it being acquired by CP in 2007. Mr. Brooks holds a Bachelor of Arts in Finance from the University of Northern Iowa. |
| | | | | | | 2023 Performance highlights: | | 2023 Compensation: | • Delivered record combined total revenues(1) of $13.9 billion, up five percent from 2022. Record revenue year in Bulk, Forest Products, Metals & Minerals and Automotive businesses. • Successfully executed Day 1 control of KCS with customers and interline partners including alignment and roll out of tariff applications. • Launched CPKC’s flagship Mexico Midwest Express service, the first and only single-line rail connection between Mexico and the U.S. Midwest. Active engagement with Schneider National to become the anchor customer. • Established a new partnership with Americold, creating an innovative cold storage ecosystem between the United States and Mexico. • Developed new automotive service solution through creation of a closed loop system linking auto manufacturing plants in Mexico and Canada with U.S. end-markets. • Launched a cross border international intermodal service from Lazaro Cardenas into the continental United States, offering a unique west coast option for shippers. • Strengthened commercial relationships with customers through key contract renewals. • Supported the development of land assets and industrial projects throughout the network to foster future growth. | | 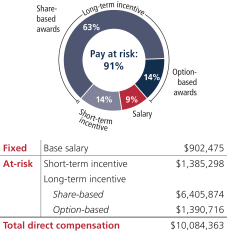
|
| (1) | Refer to Footnote 1 Combined Total Revenues on page 30. Refer to Footnote 2 Core adjusted combined diluted EPS on page 30. Adjusted combined net debt to adjusted combined EBITDA is a non-GAAP measure. This measure is further defined and discussed in Part VII - Other Information About Non-GAAP measures on pages 105-108 of the Company’s 2024. Proxy Circular. |
33
| | | | | | Mark A. Redd | | Executive Vice-President and Chief Operating Office- |
| | | 
| | Mr. Redd oversees the 24/7 operations of CPKC’s network, north of Beaumont TX, including network transportation, operations, mechanical, engineering, training and safety. Prior to the merger, Mr. Redd served as Executive Vice-President Operations at CP since September 2019, having first joined the company in April2013. He also spent more than 20 years at KCS, holding a variety of 2016. In this role, Mr. Johnson has overall operational responsibility for CP’s railleadership positions in network and field operations, including aspects of operational safety, service, engineering and mechanical servicesVice-President Transportation where he oversaw key operating functions in both Canada and the U.S. with a focus on train performance and overall fluidity of the network. Prior to this appointment, Robert was CP’s Senior Vice-President Operations, Southern Region.Mexico.
Mr. Johnson’s railroad career spans over 36 years. He spent 32Redd holds Bachelor’s and Master’s degrees of those years were spent with BNSF where he held successively more responsible rolesScience in operations, transportation, engineering,Management from the University of Phoenix and service excellence. His most recent position at BNSF was General Manager, Northwest Division, overseeingday-to-day operations for that region.an Executive MBA from the University of Missouri – Kansas City. |
2017 performance
The CEO assessed Mr. Johnson’s performance in 2017 against his individual performance objectives in the areas of operational performance, cost control and safety. Mr. Johnson was instrumental in the implementation of our new “live” lift operation which enhances our cross-border operations at Portal, North Dakota for our intermodal traffic moving between Western Canada and the U.S. Midwest. Live lift allows us to lift single containers off trains for inspection by Canadian and U.S. authorities rather than having intermodal carsset-off. Mr. Johnson led the development of our new large-scale, multi-commodity transload facility in Vancouver as well as the implementation of operational efficiencies within that region to provide customers with more efficient services for imported and exported goods. Mr. Johnson championed our operational safety in 2017 which lead to a newall-time low train accident frequency. Mr. Johnson was assessed as having exceeded his overall individual performance objectives.
The assessment was reviewed by the Compensation Committee and reviewed and approved by the Board.
2017 compensation
The table below is summary of the compensation awarded to Mr. Johnson for 2017, compared to the two previous years.
| | | | | | | | | | | | | | | 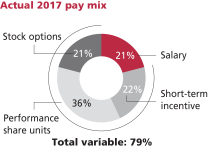
| | Compensation ($’000) | | 2017 | | | 2016 | | | 2015 | | | | Fixed | | | | | | | | | | | | | | | Base earnings | | | 565 | | | | 532 | | | | 425 | | | | Variable | | | | | | | | | | | | | | | Short-term incentive | | | 597 | | | | 648 | | | | 362 | | | | Long-term incentive | | | | | | | | | | | | | | | - PSUs | | | 959 | | | | 359 | | | | 300 | | | | - Stock options | | | 556 | | | | 318 | | | | 327 | | | | Total direct compensation | | | 2,677 | | | | 1,857 | | | | 1,414 | | | | Total target direct compensation | | | 2,260 | | | | 2,305 | | | | 1,203 | | | | Notes: Salary is the actual amount received that year. Payments made in U.S. dollars have been converted to Canadian dollars using an average exchange rate for the year: $1.2986 for 2017, $1.3248 for 2016 and $1.2787 for 2015. | |
Salary
Mr. Johnson did not receive a salary increase in 2017. Variances are due to foreign exchange.
2017 short-term incentive
Based on our 2017 corporate performance and the assessment of his individual performance, Mr. Johnson received a cash bonus of $597,372 for 2017, calculated as follows:

34
Year end salary and the 2017 STIP award were made in U.S. dollars have been converted to Canadian dollars using an average exchange rate of $1.2986 for 2017.
2017 long-term incentive
Mr. Johnson received 2017 long-term incentive awards in the form of PSUs and Options with a total grant value of $1,514,778, 100% of his target award. The grant was allocated 60% PSUs and 40% stock options.
Equity ownership (at December 31, 2017)
| | | | | | | | | | | | | | | | | | | | | Requirement (as a multiple of salary) | | Minimum
ownership value ($) | | | Shares ($) | | | Deferred share
units ($) | | | Total ownership
value ($) | | | Total ownership (as a multiple of salary) | | 3x | | | 1,637,123 | | | | 52,649 | | | | 1,275,641 | | | | 1,328,290 | | | | 2.43x | |
Mr. Johnson is on track to meeting his share ownership requirements by April 2021. Values are based on the US$182.76 closing price of our shares on the NYSE on December 29, 2017 and have been converted using ayear-end exchange rate of $1.2545.
35
LAIRD J. PITZ VICE-PRESIDENT AND CHIEF RISK OFFICER
| | | | | |  | | 2023 Compensation: | • Oversaw the successful integration of CP and KCS operations during the first several months of control with no service interruptions or negative impacts on customers, communities or connecting railroads while delivering significant operating improvements. • Operationalized CPKC’s flagship Mexico Midwest Express service connecting San Luis Potosi to Chicago with unmatched velocity, performance and reliability. • Expanded our Home Safe program, safety walkabouts and safety integration plan across the KCS territory, resulting in the FRA-reportable train accident frequency declining 32 percent on a combined basis(1) and the FRA-reportable personal injury frequency declining 12 percent for the combined CPKC network(1). • Championed the development and deployment of innovative solutions to improve safety and service including wayside detector systems, washout prevention technology, and rollout of cost-effective broken rail detection technology. • Advanced low horsepower hydrogen strategy which included moving two hydrogen units into service in Q4. Also, the first high horsepower hydrogen powered unit conducted a successful movement test. • Co-chaired the Company’s Diversity and Leadership Development Steering Committee, championing company-wide leadership programs and diversity initiatives. Also actively championed leadership development and succession planning across the Operations function. | | 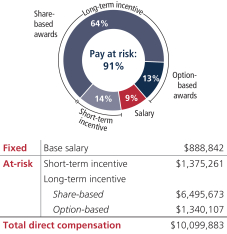
|
| | | | | | John F. Orr | | Executive Vice-President and Chief Transformation Officer |
| | | 
| | Mr. Pitz was promotedOrr joined CPKC as Executive Vice-President and Chief Transformation Officer on April 14, 2023 and is responsible for network operations planning and design, labour relations and regulatory affairs as well as fully accountable for Mexico Operations. Previously, Mr. Orr served as Executive Vice-President Operations for Kansas City Southern from 2021 to 2023 overseeing Transportation, Engineering, Mechanical, Network operations, Health-Safety-Environmental and Labour Relations. A fourth-generation railroader, Mr. Orr began his railroad career at CN in 1985 building his career and holding various leadership positions including Senior Vice-President and Chief Risk Officer in October of 2017. This was part of the overall realignment of the risk and insurance functions for succession purposes, and to retain Mr. Pitz for the necessary developments of the succession candidates. He is responsible for all aspects of risk-management in Canada and the U.S., including police services, casualty and general claims, environmental risk, field safety and systems, operational regulatory affairs and training, disability management and forensic audit investigations. Mr. Pitz joined CP on April 2, 2014, as Vice-President of Security and Risk Management.Transportation Officer. Mr. Pitz,Orr holds a Vietnam War veteranBachelor of Arts in Environmental Studies from University of Waterloo and former FBI special agent, is a40-year careerhas most recently completed the Advanced Management Program at Harvard University. He has also completed additional business coursework and professional who has directed strategicdevelopment in leadership from University of Waterloo, University of Guelph, University of Western Ontario and operational risk-mitigation, security and crisis-management functions for companies operating in a wide range of fields including defence, logistics and transportation.Niagara Leadership Institute. |
2017 individual performance
The CEO assessed Mr. Pitz’s performance in 2017 against his individual performance objectives, which focused mainly on reducing risk and liability for the company. This included mitigating risk in several key areas: safety, environmental, police security, casualty management, regulatory/operating practices, forensic and internal audit and disability management. Under Mr. Pitz’s leadership, CP has made significant progress in mitigating its overall risk, including the following results in 2017: $200,000 settlement of a $250 million class action lawsuit, claims recoveries in excess of $40 million including a 40% reduction in CP’s Federal Employers Liability Act (FELA) liability ($4.8 million). Mr. Pitz was assessed as having exceeded his overall individual performance objectives.
The assessment was reviewed by the Compensation Committee, and reviewed and approved by the Board.
2017 compensation
The table below is a summary of the compensation awarded to Mr. Pitz for 2017, compared to the two previous years. Mr. Pitz was promoted to Senior Vice-President & Chief Risk Officer on October 17, 2017, and received a 4.6% increase in base salary and an increase in short-term and long-term incentive awards to recognize his increased areas of responsibility.
| | | | | | | | | | | | | | |  | | Compensation ($’000) | | 2017 | | | 2016 | | | 2015 | | | | Fixed | | | | | | | | | | | | | | | Base earnings | | | 458 | | | | 438 | | | | 406 | | | | Variable | | | | | | | | | | | | | | | Short-term incentive | | | 436 | | | | 417 | | | | 331 | | | | Long-term incentive | | | | | | | | | | | | | | | - PSUs | | | 394 | | | | 315 | | | | 265 | | | | - Stock options | | | 229 | | | | 279 | | | | 288 | | | | -DSUs | | | - | | | | 83 | | | | 83 | | | | Total direct compensation | | | 1,517 | | | | 1,531 | | | | 1,373 | | | | Total target direct compensation | | | 1,331 | | | | 1,275 | | | | 1,126 | | | | Notes: Salary is the actual amount received that year. Payments made in U.S. dollars have been converted to Canadian dollars using an average exchange rate for the year: $1.2986 for 2017, $1.3248 for 2016 and $1.2787 for 2015. Mr. Pitz received a company matching contribution of DSUs in 2016 and 2015 as a result of deferring 100% of his 2015 and 2014 short-term incentive (see page 48 for information about deferred compensation). | |
Salary
Mr. Pitz received a 4.6% increase in base salary when he was promoted to Senior Vice-President and Chief Risk Officer on October 17, 2017.
36
2017 short-term incentive
Based on our 2017 corporate performance and the assessment of his individual performance, Mr. Pitz received a cash bonus of $435,601 for 2017, calculated as follows:
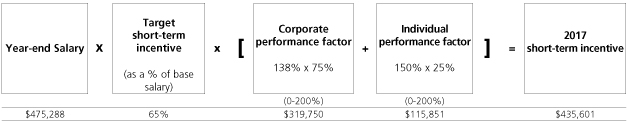
Year-end salary and 2017 STIP award were made in U.S. dollars and have been converted to Canadian dollars using an average exchange rate of $1.2986 for 2017.
2017 long-term incentive
Mr. Pitz also received 2017 annual long-term incentive awards in the form of PSUs and Options with a total grant value of $622,931, 100% of his target award. The grant was allocated 60% PSUs and 40% stock options.
Equity ownership(at December 31, 2017)
| | | | | | | | | | | | | | | | | | | | | Requirement (as a multiple of salary) | | Minimum
ownership value ($) | | | Shares ($) | | | Deferred share
units ($) | | | Total ownership
value ($) | | | Total ownership (as a multiple of salary) | | 2x | | | 918,294 | | | | 7,107 | | | | 996,557 | | | | 1,003,664 | | | | 2.19x | |
Mr. Pitz has met his share ownership requirements. Values are based on US$182.76, the closing price of our shares on the NYSE on December 29, 2017 and have been converted using ayear-end exchange rate of $1.2545.
37
JEFFREY J. ELLIS CHIEF LEGAL OFFICER AND CORPORATE SECRETARY
| | | | | | | 2023 Performance highlights: 
| | Mr. Ellis was appointed Chief Legal Officer2023 Compensation:
| • Key contributor to obtaining STB approval including hearing testimony and Corporate Secretary effective November 23, 2015.final arguments; also developed and led the post-merger STB-mandated control process including reporting and oversight. Mr. Ellis is accountable for • Led Mexico operational task force, driving significant improvement in key operating metrics such as dwell, velocity, car miles per car day; delivered best-ever peak volumes in Q4 contributing to the overall strategic leadership, oversight and performancesuccess of the legal, corporate secretarial, government relationsflagship Mexico Midwest Express.
• Adapted automotive operations to enable best in class service and public affairs functionsasset cycles to the Mexico industrial heartland. • Reinvigorated the Mexico safety program including rules and knowledge testing across 100% of CPthe operational management team, resulting in a 50 percent reduction in train accident frequency. • Improved consistency of service out of Lazaro Cardenas and laid the foundation to deliver on strategic initiatives such as the new Laredo International Bridge and Celaya Bypass. • Developed the labour strategy for CPKC and helped attain labour agreements that will be foundational for long-term productivity improvements and stability. • Continued to develop regulatory relationships in Canada, U.S. and the U.S.Mexico. | | Prior to joining CP in 2015, Mr. Ellis was the U.S. General Counsel at BMO Financial Group. Before joining BMO in 2006, Mr. Ellis was with the law firm of Borden Ladner Gervais LLP in Toronto, Canada.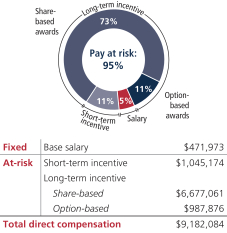
Mr. Ellis has B.A. and M.A. degrees from the University of Toronto, J.D. and LL.M. degrees from Osgoode Hall Law School, and an MBA from the Richard Ivey School of Business, University of Western Ontario. He is a member of the bars of New York, Illinois and Ontario.Excludes long-term non-equity incentive (refer to Summary compensation table on page 36 for more details)
|
2017 performance
The CEO assessed Mr. Ellis’ performance in 2017 against his individual performance objectives, which included managing the company’s legal risk to achieve optimal outcomes across a variety of litigation matters, helping CP’s business achieve its goals through legal support on transactions and commercial contracts and creating conditions for success in communication and public affairs, marketing and government affairs by providing executive leadership and support on key issues such as brand awareness, rail safety and other external affairs priorities, while encouraging a balanced, fair and market-driven regulatory environment in Canada and the U.S. Mr. Ellis was assessed as having exceeded his overall individual performance objectives.
The assessment was reviewed by the Compensation Committee, and reviewed and approved by the Board.
2017 compensation
The table below is summary of the compensation awarded to Mr. Ellis for 2017, compared to the two previous years.
| | | | | | | | | | | | | | | 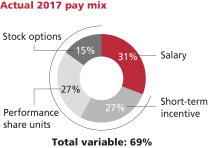
| | Compensation ($’000) | | 2017 | | | 2016 | | | 2015 | | | | Fixed | | | | | | | | | | | | | | | Base earnings | | | 443 | | | | 422 | | | | 27 | | | | Variable | | | | | | | | | | | | | | | Short-term incentive | | | 376 | | | | 401 | | | | 29 | | | | Long-term incentive | | | | | | | | | | | | | | | - PSUs | | | 387 | | | | 269 | | | | - | | | | - Stock options | | | 217 | | | | 215 | | | | - | | | | Make Whole Hiring Costs | | | | | | | | | | | | | | | - Cash Payment | | | - | | | | - | | | | 244 | | | | - PSU | | | - | | | | 126 | | | | - | | | | - Stock options | | | - | | | | 101 | | | | - | | | | - DSU | | | - | | | | 60 | | | | - | | | | Total direct compensation | | | 1,423 | | | | 1,594 | | | | 300 | | | | Total target direct compensation | | | 1,224 | | | | 1,224 | | | | 1,018 | |
Salary
Mr. Ellis did not receive an increase in salary in 2017. Salary as shown above reflects actual salary earned in the year. Mr. Ellis’ last salary increase was effective April 1, 2016.
2017 short-term incentive
Based on our 2017 corporate performance and the CEO’s assessment of his individual performance, Mr. Ellis received for a cash bonus of $376,470 for 2017, calculated as follows:
| (1) | Refer to Footnote 1 FRA metrics on page 22. |

3834
2017 long-term incentive
Mr. Ellis also received 2017 long-term incentive awards with a total grant value of $604,199, 100% of his target award. The grant was allocated 60% PSUs and 40% stock options.
Equity ownership(at December 31, 2017)
| | | | | | | | | | | | | | | | | | | | | Requirement (as a multiple of salary) | | Minimum
ownership value ($) | | | Shares ($) | | | Deferred share
units ($) | | | Total ownership
value ($) | | | Total ownership (as a multiple of salary) | | 2x | | | 890,000 | | | | 73,154 | | | | 84,596 | | | | 157,750 | | | | 0.35x | |
Mr. Ellis is on track to meeting his share ownership requirements by November 2020. Values are based on $229.66, the closing price of our shares on the TSX on December 29, 2017.
39
Share performance and cost of management The graph below shows the total shareholder return of $100 invested in CPCPKC shares compared to the two major market indices over the last five years ending December 31, 2017 and assumes2023, assuming reinvestment of dividends. CP The graph also shows the total compensation awarded to our NEOs for each of the past five years. CPKC shares have outperformed the S&P/TSX Composite Indexindex and the S&P 500 Index overindex since 2019 while our NEOs’ total compensation has directly aligned with the last fiveincreasing value provided to our shareholders in recent years. It shows a strong correlation betweenWe have delivered significant shareholder value andas our cumulative total return for the total direct compensation paid to our named executives over the same period. Our share pricefive-year period ending December 31, 2023 was 126 percent on the TSX was $160.65 at the beginning of the performance period (US$151.32and 132 percent on the NYSE) comparedNYSE. With our unparalleled network access and service offerings, we will continue to $229.66 at the end of 2017 (US$182.76 on the NYSE), a growth in share appreciation of 43.0%, creating significantcreate long-term value for our shareholders. Our
The total shareholder return overcompensation value for NEOs as disclosed in the five year period was 48.2%, assuming reinvestmentSummary compensation table is 0.4 percent of dividends.our Combined total revenues(1) of $13.9 billion for 2023. 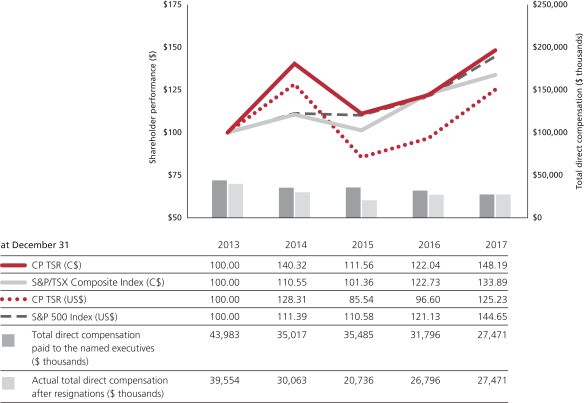 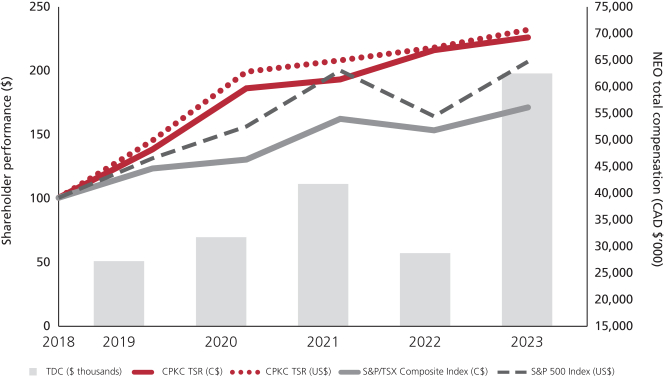
Notes:
| | | | | | | | | | | | | | | | | | | | | as at December 31 | | 2019 | | | 2020 | | | 2021 | | | 2022 | | | 2023 | | CPKC TSR (C$) | | | 138 | | | | 186 | | | | 193 | | | | 216 | | | | 226 | | CPKC TSR (US$) | | | 145 | | | | 199 | | | | 208 | | | | 218 | | | | 232 | | S&P/TSX Composite Index (C$) | | | 123 | | | | 130 | | | | 162 | | | | 153 | | | | 171 | | S&P 500 Index (US$) | | | 131 | | | | 156 | | | | 200 | | | | 164 | | | | 207 | | TDC ($ thousands)(1) | | | 27,352 | | | | 31,855 | | | | 41,754 | | | | 28,917 | | | | 62,384 | |
•(1) | | Total direct compensation(TDC) is the total compensation awarded toof the named executives,NEOs (excluding pension), as reported in the summarySummary compensation table in prior years.In Compensation awarded in 2023 is higher than prior years where there were more than five named executives, we usedas a result of the followingSynergy Awards granted to calculate total direct compensationNEOs (excluding the CEO) in the table above:May 2023 and is expected to normalize in 2024. |
2017:We used the following NEOs to calculate total direct compensation in the table above: 2023: Keith Creel, Nadeem Velani, Robert Johnson, Laird PitzJohn Brooks, Mark Redd and John Orr 2022, 2021 and 2020: Keith Creel, Nadeem Velani, John Brooks, Mark Redd and Jeffrey Ellis 2016: Hunter Harrison,2019: Keith Creel, Nadeem Velani, Keith Creel, Robert Johnson and Laird Pitz 2015: Hunter Harrison, Mark Erceg, Keith Creel,John Brooks, Laird Pitz and Mark WallaceRedd
2014: Hunter Harrison, Bart Demosky, KeithMessrs. Creel, Robert JohnsonBrooks, Pitz, Redd and Anthony Marquis 2013: Hunter Harrison, Keith Creel, Brian Grassby, Paul Guthrie and Jane O’Hagan
Mr. Harrison, Mr. Creel, Mr. Johnson and Mr. Pitz areOrr were paid in U.S. dollars and their amounts have been converted using the following average exchange rates: $1.2986$1.3497 for 2017, $1.32482023, $1.3013 for 2016, $1.27872022, $1.2535 for 2015, $1.10452021, $1.3415 for 20142020 and $1.0299$1.3269 for 2013.
Actual total direct compensation after resignations are the net amounts after Mr. Harrison, Mr. Erceg and Mr. Demosky left CP and forfeited amounts reported in the summary compensation table in prior proxy statements.2019.
40
| (1) | Refer to Footnote 1 Combined Total Revenues on page 30. |
35
EXECUTIVE COMPENSATION DETAILS
Summary compensation table The table below shows annual compensation in Canadian dollars for our six named executivesfive NEOs for the three fiscal years ended December 31, 2017. Keith2023, 2022 and 2021. Messrs. Creel, succeeded Hunter Harrison as Chief Executive Officer on January 31, 2017, when Mr. Harrison resigned from CP. All of the named executives except Mr. VelaniBrooks, Redd and Mr. Ellis wereOrr are paid in U.S. dollars. Theirdollars and their compensation has been converted to Canadian dollars using the average exchange rates for the year: $1.2986$1.3497 for 2017, $1.32482023, $1.3013 for 20162022 and $1.2787$1.2535 for 2015.2021. Mr. Velani is paid in Canadian dollars.
| | | | | | | | | | | | | | | | | | | | | | | | | | | | | | | | | | | | | | | | | | | | | | | | | | | | Non-equity Incentive
plan compensation
($) | | | | | | | | | | | | Name and principal position | | Year | | | Salary ($) | | | Share-based
awards
($) | | | Option-based
awards
($) | | | Annual
incentive
plans | | | Long-term
incentive
plans | | | Pension
value
($) | | | All other
compensation
($) | | | Total
compensation
($) | | Keith E. Creel | | | 2017 | | | | 1,436,594 | | | | 4,407,788 | | | | 10,516,630 | | | | 2,419,292 | | | | - | | | | 398,894 | | | | 926,402 | | | | 20,105,600 | | President and Chief | | | 2016 | | | | 1,261,123 | | | | 2,403,912 | | | | 2,131,126 | | | | 1,900,765 | | | | - | | | | 348,529 | | | | 833,257 | | | | 8,878,712 | | Executive Officer | | | 2015 | | | | 1,164,270 | | | | 1,959,244 | | | | 2,130,228 | | | | 1,601,889 | | | | - | | | | 328,426 | | | | 486,557 | | | | 7,670,614 | | E. Hunter Harrison | | | 2017 | | | | 361,369 | | | | - | | | | - | | | | - | | | | - | | | | - | | | | 6,452,479 | | | | 6,813,848 | | Former Chief | | | 2016 | | | | 2,904,595 | | | | - | | | | 4,999,757 | | | | 6,557,760 | | | | - | | | | - | | | | 4,367,682 | | | | 18,829,794 | | Executive Officer | | | 2015 | | | | 2,803,522 | | | | 4,887,846 | | | | 5,314,137 | | | | 6,002,537 | | | | - | | | | 13,492 | | | | 1,173,789 | | | | 20,195,323 | | Nadeem S. Velani | | | 2017 | | | | 451,355 | | | | 806,073 | | | | 202,650 | | | | 490,763 | | | | - | | | | 101,027 | | | | 49,523 | | | | 2,101,391 | | Executive Vice-President | | | 2016 | | | | 298,838 | | | | 131,634 | | | | 105,305 | | | | 373,500 | | | | - | | | | 49,682 | | | | 42,015 | | | | 1,000,974 | | and Chief Financial Officer | | | 2015 | | | | 223,972 | | | | 102,039 | | | | 78,833 | | | | 152,819 | | | | - | | | | 33,308 | | | | 30,457 | | | | 621,428 | | Robert A. Johnson | | | 2017 | | | | 564,891 | | | | 958,705 | | | | 556,073 | | | | 597,372 | | | | - | | | | 114,037 | | | | 54,819 | | | | 2,845,897 | | Executive Vice-President, | | | 2016 | | | | 532,056 | | | | 358,674 | | | | 317,991 | | | | 648,324 | | | | - | | | | 86,189 | | | | 54,931 | | | | 1,998,165 | | Operations | | | 2015 | | | | 425,160 | | | | 300,454 | | | | 326,539 | | | | 362,141 | | | | - | | | | 88,425 | | | | 57,035 | | | | 1,559,754 | | Laird J. Pitz | | | 2017 | | | | 457,901 | | | | 394,237 | | | | 228,694 | | | | 435,601 | | | | - | | | | 82,361 | | | | 41,137 | | | | 1,639,931 | | Senior Vice-President | | | 2016 | | | | 437,720 | | | | 397,394 | | | | 279,071 | | | | 417,312 | | | | - | | | | 74,178 | | | | 41,203 | | | | 1,646,878 | | and Chief Risk Officer | | | 2015 | | | | 406,126 | | | | 347,920 | | | | 287,967 | | | | 331,166 | | | | - | | | | 70,499 | | | | 37,901 | | | | 1,481,579 | | Jeffrey J. Ellis | | | 2017 | | | | 443,479 | | | | 386,888 | | | | 217,311 | | | | 376,470 | | | | - | | | | 101,277 | | | | 50,540 | | | | 1,575,965 | | Chief Legal Officer and | | | 2016 | | | | 421,918 | | | | 455,239 | | | | 316,312 | | | | 400,500 | | | | - | | | | 50,275 | | | | 50,638 | | | | 1,694,882 | | Corporate Secretary | | | 2015 | | | | 26,946 | | | | - | | | | - | | | | 28,922 | | | | - | | | | 2,964 | | | | 247,468 | | | | 306,300 | |
Notes:
Salary
Salary earned during the year. Salary differs from annualized salary because annual increases generally go into effect on April 1.
Share-based awards
PSUs were granted on February 21, 2017. The grant date fair value of share awards granted to each named executive has been calculated in accordance with FASB ASC Topic 718: Compensation – Stock Compensation, which represents the grant date fair value (with reference to the Shares underlying the awards), measured using a latticed-based valuation model assuming the probable outcome of the applicable performance conditions and excluding the effect for estimated forfeitures during the applicable vesting periods. The 2017 grant date accounting fair value of the awards is $200.46 per share granted on the TSX or $152.25 per share granted on the NYSE. See Item 8, Financial Statements and Supplementary Data, Note 21: Stock-based compensation of our 2017 Form 10-K for more details.
We value our PSUs using the binomial lattice model methodology. The grant date expected fair value was $162.37 on the TSX and US$123.32 on the NYSE.
Mr. Velani’s amount includes the value of matching DSU’s granted in 2017.
Mr. Harrison forfeited his 2015 PSU grant when he resigned from CP.
Option awards
Stock options were granted on January 20, 2017. The grant date fair value of stock option awards granted to each named executive has been calculated in accordance with FASB ASC Topic 718: Compensation – Stock Compensation. We used the Black-Scholes option-pricing model (with reference to the shares underlying the options). The grant date accounting fair value of the awards is $43.64 per share granted on the TSX or $37.05 per share granted on the NYSE. Additional options were granted to Mr. Creel on February 1, 2017 to bring him to the CEO level. The grant date accounting fair value is US$36.81 per
41
share. For the special performance grant made on February 1, 2017, the grant date accounting fair value is US$34.72 per share.See Incentive plan awards on page 44 for details about the 2018 awards. See Item 8, Financial Statements and Supplementary Data, Note 21: Stock-based compensation of our 2017 Form 10-K for more details.
To calculate the number of options that an executive receives, we use Willis Towers Watson’s binomial Option pricing methodology which is fundamentally similar to the methodology used to determine the accounting fair value; however, some of the underlying assumptions are different. For example, the binomial methodology assumes a slightly lower historical volatility, a higher risk-free rate and includes a discount to account for vesting restrictions. The grant price on January 20, 2017 was $201.49 on the TSX with an underlying value of $42.31 and was US $150.99 on the NYSE with an underlying value of US$34.73.
Mr. Harrison forfeited his option awards when he resigned from CP.
Non-equity incentive plan compensation
Cash bonus earned under our short-term incentive plan for 2017 and paid in February 2018.
Pension value
Mr. Creel, Mr. Velani and Mr. Ellis participate in the Canadian defined contribution plan (DC plan) and in the defined contribution supplemental plan (DC SERP).
Mr. Creel, Mr. Johnson and Mr. Pitz participate in the U.S. defined contribution plan and the U.S. supplemental executive retirement plan.
SeeRetirement plans on page 47 for more details.
All other compensation
The named executives also receive certain benefits and perquisites. The table below shows the breakdown of all other compensation for 2017:
| | | | | | | | | | | | | | | | | | | | | | | | | | | | | | | | | | | | | | | | | | | | | | | | Perquisites | | | Other compensation | | | Name | | Personal
use of
company
aircraft | | | Auto
benefits | | | Housing
allowance | | | Financial
and tax
planning | | | Additional
medical | | | Club
memberships | | | 401K
Plan | | | Employer
share
purchase
plan
match | | | Tax
reimbursement | | | Post-
employment
payments | | | Total | | Keith Creel | | | 570,649 | | | | 28,387 | | | | 77,270 | | | | 29,708 | | | | - | | | | 33,023 | | | | 7,012 | | | | 27,843 | | | | 152,510 | | | | - | | | | 926,402 | | Hunter Harrison | | | 83,361 | | | | - | | | | 3,921 | | | | - | | | | 42,286 | | | | - | | | | - | | | | - | | | | - | | | | 6,322,911 | | | | 6,452,479 | | Nadeem Velani | | | - | | | | 20,432 | | | | - | | | | - | | | | - | | | | 11,200 | | | | - | | | | 8,937 | | | | 8,954 | | | | - | | | | 49,523 | | Robert Johnson | | | - | | | | 22,091 | | | | - | | | | - | | | | - | | | | 14,544 | | | | 8,863 | | | | 9,321 | | | | - | | | | - | | | | 54,819 | | Laird Pitz | | | - | | | | 17,178 | | | | - | | | | - | | | | - | | | | 14,544 | | | | 9,415 | | | | - | | | | - | | | | - | | | | 41,137 | | Jeffrey Ellis | | | - | | | | 19,679 | | | | - | | | | - | | | | - | | | | 11,200 | | | | - | | | | 8,781 | | | | 10,880 | | | | - | | | | 50,540 | |
42
Notes:
| | | | | | | | | | | | | | | | | | | | | | | | | | | | | | | | | | | | | | | | | | | | | | | | | | | | Non-equity incentive
plan compensation | | | | | | | | | | | Executive and principal position | | Year | | | Salary ($)(1) | | | Share-based
awards ($)(2) | | | Option-based
awards ($)(3) | | | Annual
incentive
plan ($)(4) | | | Long-term
incentive
plan (S)(5) | | | Pension
Values ($)(6) | | | All other
compensation ($)(7) | | | Total ($) | | | | | | | | | | | | Keith E. Creel | | | 2023 | | | | 1,822,095 | | | | 8,262,088 | | | | 5,506,930 | | | | 3,826,400 | | | | - | | | | 302,762 | | | | 359,277 | | | | 20,079,552 | | President and Chief | | | 2022 | | | | 1,561,560 | | | | 6,960,936 | | | | 4,655,218 | | | | 566,066 | | | | - | | | | 499,916 | | | | 279,850 | | | | 14,523,546 | | Executive Officer | | | 2021 | | | | 1,496,068 | | | | 7,138,547 | | | | 14,910,982 | | | | 2,337,606 | | | | - | | | | 608,541 | | | | 237,237 | | | | 26,728,981 | | | | | | | | | | | | Nadeem S. Velani | | | 2023 | | | | 937,694 | | | | 7,798,752 | | | | 1,512,387 | | | | 1,415,327 | | | | - | | | | 173,485 | | | | 87,520 | | | | 11,925,165 | | Executive Vice-President | | | 2022 | | | | 833,193 | | | | 1,878,184 | | | | 1,315,942 | | | | 399,325 | | | | - | | | | 232,289 | | | | 69,608 | | | | 4,728,541 | | and Chief Financial Officer | | | 2021 | | | | 806,821 | | | | 1,684,658 | | | | 997,455 | | | | 1,102,552 | | | | - | | | | 248,433 | | | | 53,715 | | | | 4,893,634 | | | | | | | | | | | | John K. Brooks | | | 2023 | | | | 902,475 | | | | 6,405,874 | | | | 1,390,716 | | | | 1,385,298 | | | | - | | | | 449,531 | | | | 108,024 | | | | 10,641,918 | | Executive Vice-President | | | 2022 | | | | 788,913 | | | | 1,712,572 | | | | 1,169,671 | | | | 371,098 | | | | - | | | | 289,889 | | | | 96,199 | | | | 4,428,342 | | and Chief Marketing Officer | | | 2021 | | | | 722,525 | | | | 1,566,074 | | | | 920,156 | | | | 999,666 | | | | - | | | | 534,527 | | | | 90,248 | | | | 4,833,196 | | | | | | | | | | | | Mark A. Redd | | | 2023 | | | | 888,842 | | | | 6,495,673 | | | | 1,340,107 | | | | 1,375,261 | | | | - | | | | 151,421 | | | | 108,583 | | | | 10,359,887 | | Executive Vice-President | | | 2022 | | | | 757,194 | | | | 1,513,731 | | | | 1,037,043 | | | | 358,931 | | | | - | | | | 137,801 | | | | 100,518 | | | | 3,905,218 | | and Chief Operating Officer | | | 2021 | | | | 645,748 | | | | 1,444,831 | | | | 1,010,560 | | | | 814,384 | | | | - | | | | 104,262 | | | | 89,381 | | | | 4,109,166 | | | | | | | | | | | | John Orr(8) | | | 2023 | | | | 471,973 | | | | 6,677,061 | | | | 987,876 | | | | 1,045,174 | | | | 1,214,730 | | | | - | | | | 57,600 | | | | 10,454,414 | | Executive Vice-President | | | | | | | - | | | | - | | | | - | | | | - | | | | - | | | | - | | | | - | | | | - | | and Chief Transformation Officer | | | | | | | - | | | | - | | | | - | | | | - | | | | - | | | | - | | | | - | | | | - | |
| (1) | Salary. Represents salary earned in the year. Mr. Velani’s salary is set in U.S. dollars and was paid in Canadian dollars based on an average exchange rate of 1.3412 in 2023. |
| (2) | Share-based awards. Includes PSUs and DSUs awards, where applicable. All award values reflects the grant date accounting fair value calculated in accordance with FASB ASC Topic 718: Compensation - Stock Compensation. See Item 8, Financial Statements and Supplementary Data, Note 24: Stock-based compensation in our Annual Report on form 10-K filed with the SEC and securities regulatory authorities in Canada on February 27, 2024 for more details. See 2023 Long-term incentive awards on page 25 for the grant date accounting fair value of the share-based awards granted to each NEO. |
Use of company aircraft | | To calculate the number of PSUs our NEOs receive, we use the WTW binomial lattice model and the 30-day average closing share price on the TSX or the NYSE prior to the grant date. The WTW binomial lattice model valuation is based on a set of assumptions for the terms of an award, including a performance period of three years, three-year cliff vesting schedule, payout range percentage from threshold to maximum depending on the grant and the risk of forfeiture of five percent. The resulting valuation as a percent of the market price of a CPKC share on the grant date and the grant date fair values of our 2023 PSU awards on both a binomial and accounting valuation basis are shown in the table below. |
| | | | | | | | | | | | | | | | | | | | WTW Expected Life Binomial Methodology | | | Accounting Valuation Methodology | | 2023 PSU awards | | Valuation % | | | Grant date fair value (TSX / NYSE) | | | Valuation % | | | Grant date fair value (TSX / NYSE) | | | | | | | February 2, 2023 | | | 83 | % | | $ | 87.63 / US$65.81 | | | | 100 | % | | $ | 105.58 / US$79.29 | | | | | | | April 28, 2023 | | | 83 | % | | $ | 88.64 / US$65.44 | | | | 100 | % | | $ | 106.80 / US$78.84 | | | | | | | May 2, 2023 | | | 83 | % | | $ | 88.34 / US$64.87 | | | | 100 | % | | $ | 106.43 / US$78.16 | | | | | | | May 17, 2023 | | | 83 | % | | $ | 91.96 / US$68.39 | | | | 100 | % | | $ | 110.79 / US$82.40 | |
| For 2023, Mr. Velani’s and Mr. Redd’s amounts include the 16,969 PDSUs and 3,277 PDSUs credited to Mr. Velani and Mr. Redd, respectively, on February 2, 2023, as a result of the 2020 PSU performance factor, and the additional 5,759 and 1,843 matching PDSUs credited to Mr. Velani and Mr. Redd, respectively, under the terms of the Senior Executive Deferred Share Plan. See the About deferred compensation section on page 44 for more details. |
| In connection with Mr. Orr’s commencement of employment as CPKC’s Executive Vice-President and Chief Transformation Officer on April 14, 2023, he received an annual grant of PSUs and stock options as well as a one-time discretionary award on April 28, 2023 of DSUs in lieu of a cash payment that would have been owed under the merger agreement if Mr. Orr had resigned following the merger. |
36
| Mr. Redd’s 2023 amount excludes the 533 PDSUs credited to Mr. Redd on February 6, 2024, as a result of the 2021 PSU performance factor, and the additional 511 matching PDSUs credited to Mr. Redd, under the terms of the Senior Executive Deferred Share Plan. See the About deferred compensation section on page 44 for more details. |
| (3) | Option-based awards. The grant date fair value of stock option awards granted to each NEO has been calculated in accordance with FASB ASC Topic 718: Compensation - Stock Compensation. See Item 8, Financial Statements and Supplementary Data, Note 24: Stock-based compensation in our Annual Report on Form 10-K filed with the SEC and securities regulatory authorities in Canada on February 27, 2024 for more details. |
| To calculate the number of stock options our NEOs receive, we use the WTW binomial lattice model and the 30-day average closing share price on the TSX or the NYSE prior to the grant date. The WTW binomial lattice model valuation is based on a set of assumptions for the terms of an award, including the option term, four-year pro-rated vesting schedule, expected life of an award, the one-year historical dividend yield, three-year daily volatility, risk-free rate and risk of forfeiture of five percent. The resulting valuation as a percent of the market price of a CPKC share on the grant date and the grant date fair values of our 2023 stock options awards on both a binomial and accounting valuation basis are shown in the table below. |
| | | | | | | | | | | | | | | | | | | | WTW Expected Life Binomial Methodology | | | Accounting Valuation Methodology | | 2023 Stock option awards | | Valuation % (TSX / NYSE) | | | Grant date fair value (TSX / NYSE) | | | Valuation % (TSX /NYSE) | | | Grant date fair value (TSX / NYSE) | | | | | | | February 2, 2023 | | | 21.5% / 23.6% | | | | $22.70 / US$18.71 | | | | 26.4% / 29.2% | | | | $27.91 / US$23.14 | | | | | | | April 28, 2023 | | | 23.6% | | | | US$18.61 | | | | 29.4% | | | | US$23.19 | | | | | | | May 2, 2023 | | | 23.6% | | | | US$18.45 | | | | 29.6% | | | | US$23.10 | |
| Mr. Creel’s 2021 amount includes a special upfront grant on March 27, 2021 in relation to amendments to his executive employment agreement made on March 21, 2021 to retain him until at least year 2026. The grant date fair value of this grant is US$16.24 on the NYSE and is calculated in accordance with FASB ASC Topic 718: Compensation - Stock Compensation. In consideration of this special upfront grant, the Company and Mr. Creel agreed to amend his current employment agreement to reduce the value of the annual long-term incentive plan award Mr. Creel is entitled to receive by US$2.1 million in each year of 2022, 2023, 2024 and 2025 (an aggregate of US$8.4 million). See Employment agreements on page 38 for more details. |
| Mr. Redd’s 2021 amount also includes the incremental fair value of $247,071 (US$197,105) to reflect the discretion approved by Board for his July 20, 2018 performance stock options (PSOs) granted when he was not an NEO. The incremental fair value is calculated in accordance with FASB ASC Topic 718: Compensation - Stock Compensation and reflects the fair value of incremental options allowed to vest due to exercise of positive discretion as calculated using the Black-Scholes option-pricing model at the modification date. |
| (4) | Non-equity annual incentive. Cash bonus earned under our short-term incentive plan for 2023 and paid in February 2024. |
| (5) | Non-equity long-term incentive. Reflects amounts for Mr. Orr under the terms and conditions of his employment with KCS prior to the CPKC Control Date of April 14, 2023. Mr. Orr’s 2023 amount reflects his KCS cash-based retention award of US$1.2 million granted on May 21, 2021 to promote retention and incentivize the completion of the merger with CP. Twenty-five percent of the retention award (US$300,000) was paid out in December 2021 in connection with the closing of the merger, and the remaining 75 percent of the retention award (US$900,000) was paid on June 1, 2023. |
| (6) | Pension. Messrs. Creel and Velani participate in the Canadian defined contribution plan (DC plan) and in the defined contribution supplemental plan (DC SERP). Messrs. Creel and Redd participate in the U.S. defined contribution plan and the U.S. supplemental executive retirement plan. Mr. Brooks participates in the Company’s Pension Plan for U.S. Management Employees. See Retirement plans on page 43 for more details. |
| (7) | All other compensation. The NEOs receive certain benefits and perquisites which are competitive with our comparator group. The table below shows the breakdown of all other compensation for 2023. The values in the table have been converted to Canadian dollars using the 2023 average exchange rate of $1.3497. |
| | | | | | | | | | | | | | | | | | | | | | | | | | | | | | | | | | | | | | | | Perquisites | | | Other compensation | | | | | | | | | | | | | | | Executive | | Personal
use of
company
aircraft ($)(a) | | | Auto
benefits
($)(b) | | | Housing
allowance
($)(c) | | | Financial
and tax
planning
($)(d) | | | Additional
medical
($)(e) | | | Club
benefits
($)(f) | | | 401(k)
match
($)(g) | | | Employer
share
purchase
plan
match ($)(h) | | | Total ($) | | | | | | | | | | | | Keith Creel | | | 222,559 | | | | 31,291 | | | | 1,492 | | | | 26,994 | | | | - | | | | 33,743 | | | | 7,288 | | | | 35,910 | | | | 359,277 | | | | | | | | | | | | Nadeem Velani | | | - | | | | 57,754 | | | | - | | | | - | | | | - | | | | 11,200 | | | | - | | | | 18,566 | | | | 87,520 | | | | | | | | | | | | John Brooks | | | - | | | | 43,163 | | | | - | | | | 13,629 | | | | 6,654 | | | | 15,117 | | | | 11,592 | | | | 17,869 | | | | 108,024 | | | | | | | | | | | | Mark Redd | | | - | | | | 48,876 | | | | - | | | | 13,629 | | | | - | | | | 15,117 | | | | 13,362 | | | | 17,599 | | | | 108,583 | | | | | | | | | | | | John Orr | | | - | | | | 28,850 | | | | - | | | | - | | | | - | | | | 15,117 | | | | 6,618 | | | | 7,015 | | | | 57,600 | |
| (a) | Calculated by multiplying the variable cost per air hour by the number of hours used for travel and includes costs for fuel, maintenance, landing fees and other miscellaneous costs. The year over year increase to this amount is primarily due to higher fuel prices in 2023. As Mr. Creel is required to travel frequently for business, the Company prefers he uses our corporate aircraft within North America to ensure his safety, security and ability to immediately travel across the Company’s network. As an executive of a Calgary-based company, enabling the CEO to visit his family in the Eastern and Southern United States is an important retention tool. Non-corporate use of the corporate jetaircraft has been limited to personal and family visits for Mr. Creel only.visits. |
37
Auto benefits | | Includes(b) | Reflects the cost of a company-leased vehicle and reimbursement of related operating costs.costs and where applicable, a car allowance. A taxable reimbursement of auto benefits is provided for executives with vehicles that meets a CFCR (Combined Fuel Consumption Ratio from the Canadian federal government) of 11.8L per 100KM or less. Effective March 31, 2023, the Company began to phase out company-leased vehicles and provide a car allowance program instead. |
Housing allowance | | For reasonable accommodation(c) | Reflects total costs pro-rated for the days Mr. Creel is in Calgary to provide reasonable accommodation. |
| (d) | Reflects the cost of executive financial counselling provided for Messrs. Creel, Brooks, and Mr. Harrison in Calgary. The valueRedd. Messrs. Velani and Orr did not use the company provided service. |
| (e) | Under the U.S. medical benefits plan, available to all U.S. employees, the majority of the cost of a medical examination is based oncovered by the totalplan. Only incremental operating costs for condo fees, housekeeping and other miscellaneous coststhe executive medical are paid for by us. | Financial and tax planning | | For Mr. Creel, financial and tax planning services according to his current contract. | Additional medical | | Forthe Company. In Canada, executive physical examinations and other fees related to medical expenses for Mr. Harrison thatmedicals are not covered under ourthe group health plans.benefit plan. |
Club memberships | | (f) | Included in the perquisites program available to all executives.senior executives is a value of $11,200 in their respective home currency. Value of CEO’s club membership of $33,743 reflects the Canadian dollar conversion of US$25,000. |
401K plan | | Mr. Creel, Mr. Johnson and Mr. Pitz also receive matching contributions to the 401k plan. | ESPP match | (g) | IncludesReflects matching company contributions to the employee share purchase401(k) plan for Messrs. Creel, Brooks, Redd and Orr.
|
| (h) | Company contributions to the Employee Share Purchase Plan (ESPP). The named executivesOur NEOs participate in the ESPP on the same terms and using the same formulas as for other participants. The ESPP is available See page 42 to all employees and providesread more about the opportunity to purchase common shares on the open market through payroll deductions. Employees contribute between 1% and 10% of their base salary to the plan every pay period. We match 33% on the first 6% ofnon-unionized employees’ contributions that vest after four consecutive quarters. Employees must be participants in the plan at the time of vesting in order to receive the company match. As of December 31, 2017, approximately 34% of our employees participated in the plan.ESPP.
| Tax reimbursements | | Includes automobile-relatedgross-ups (if the executive is eligible). As well, Mr. Creel received a tax equalization payment for taxes incurred in 2016. He is no longer eligible for such payment in 2017. | Post-employment payments | | Mr. Harrison received a lower cash payout in lieu of the vested 2014 PSUs. |
| (8) | Mr. Orr’s amounts for 2023 reflects CPKC compensation including equity and non-equity awards from April 14 (Control Date) to December 31. |
Employment agreements Except for Mr. Creel, employment agreements for executive officers are set out in a standard offer letter template. The letters contain the standard terms, as described in the CD&A and includeincluding an annual salary, participation in the short and long-term incentive plans as approved annually by the Compensation Committee, participation in the benefit plans or programs generally available to management employees and modest perquisites. As of the date of this 10-K/A, all of our NEOs have a two-year non-compete and non-solicitation agreement tied to their Company employment, except that in March 2024, in connection with Mr. Orr’s resignation, the Company agreed to waive enforcement of Mr. Orr’s non-competition provision solely with respect to his employment with NS. Mr. Creel’s 2017 employment agreement includes: reasonable living accommodation in Calgary use of the corporate jetaircraft for business commuting and family visits within North America | • | | non-disclosure, non-solicitation and confidentiality covenants |
non-disclosure,non-solicitation covenants
severance provisions as described on page 4945 reimbursement for club memberships of up to US$25,000 annually reimbursement for financial services of up to US$25,00020,000 annually AsOn March 21, 2021, in connection with the announcement of the 2017 taxmerger with KCS, the Company entered into a stock option agreement and amendment to Mr. Creel’s executive employment agreement with the intent to retain him until at least year 2026. If Mr. Creel no longer receives tax equalization benefitsvoluntarily resigns or retires prior to January 31, 2026 any PSUs granted after March 1, 2021 will not be deemed retirement-eligible as a resultpreviously provided in the PSU plan and his prior employment agreement. The 517,385 options granted to Mr. Creel in connection with these amendments to his executive employment agreement will expire on March 27, 2028 and will be subject to the terms and conditions of working for CPthe Plan. In consideration of the Award, the Company and Mr. Creel agreed to amend his current employment agreement to reduce the value of the annual long-term incentive plan award Mr. Creel is entitled to receive by US$2.1 million in Canada,each year of 2022, 2023, 2024 and cannot use the corporate jet for purposes other than for corporate travel and family visits within North America.
Mr. Ellis has an offer letter that also includes a modest severance package for a termination without cause. The letter also includes anon-compete/non-solicit agreement.2025 (an aggregate of US$8.4 million).
4338
Incentive plan awards Outstanding share-based awards and option-based awards The table below shows all vested and unvested equity incentive awards that arewere outstanding as of December 31, 2017.2023. See Long-term incentivesincentive planbeginning on page 2024 for more information about our stock option and share-based awards. | | | | | | | Option-based awards | | | | Share-based awards | | | Name | | Grant date | | Number of securities
underlying
unexercised
options
(#) | | Option
exercise
price
($) | | Option
expiration Date | | Value of
unexercised in-the-money
options
($) | | Grant
type | | Number of
shares or units
of shares that
have not
vested
(#) | | Market or
payout value of
share-based
awards that
have not vested
($) | | Market or payout
value of vested
share-based
awards not paid
out or distributed
($) | | Keith Creel | | 4-Feb-2013 | | | 119,325 | | | 115.78 | | | 4-Feb-2023 | | | 13,588,731 | | | | | | | | | | | | | | | | | | | | | | | | | Option-based awards (1) | | | | Share-based awards (2) | | | | | | | | | | | | | | | | | | | | | | | | | | | | | | | | Executive | | | Grant
date | | | Number of
securities
underlying
unexercised
options (#) | | | Option
exercise
price ($) | | | Option expiration
date | | | Value of
unexercised
in-the-money
options ($) (1) | | | Grant
type | | Number of
shares or units
of shares that
have not
vested (#) | | | Market or
payout value of
share-based
awards that
have not vested ($) | | | Market or payout
value of vested
share-based
awards not paid
out or distributed ($) | | | Keith Creel (3) | | Keith Creel (3) | | Keith Creel (3) | | Keith Creel (3) | | | | | | | | | | | | | | | | 22-Feb-2013 | | | 53,350 | | | 119.18 | | | 22-Feb-2023 | | | 5,894,108 | | | | | | | | | | | | 31-Jan-2014 | | | 39,900 | | | 168.84 | | | 31-Jan-2024 | | | 2,426,718 | | | | | | | | | | | | 24-Jul-2014 | | | 47,940 | | | 210.32 | | | 24-Jul-2024 | | | 927,160 | | | | | | | | | | | | 23-Jan-2015 | | | 33,910 | | | 175.92 | | | 23-Jan-2025 | | | 290,974 | | | | | | | | | | | | 22-Jan-2016 | | | 55,250 | | | 116.80 | | | 22-Jan-2026 | | | 4,571,762 | | | | | | | | | | | | 20-Jan-2017 | | | 33,884 | | | 150.99 | | | 20-Jan-2024 | | | 1,350,463 | | | | | | | | | | | | 1-Feb-2017 | | | 18,762 | | | 151.14 | | | 1-Feb-2024 | | | 744,238 | | | | | | | | | | | | 1-Feb-2017 | | | 177,225 | | | 151.14 | | | 1-Feb-2024 | | | 7,030,035 | | | | | | | | | | | | 6-Feb-2013 | | | | | | | | | | | DSU | | | | | | 7,157,512 | | | 6-Feb-13 | | | | | | | DSU | | | | | | | 17,210,372 | | | | 23-Jan-2015 | | | | | | | | | | | PSU | | | | | | 3,230,887 | | | 29-Jan-21 | | | | | | | PSU | | | | | | | 11,502,832 | | | | 23-Feb-2016 | | | | | | | | | | | PSU | | 15,091 | | | 3,459,873 | | | | | | 21-Feb-2017 | | | | | | | | | | | PSU | | 22,468 | | | 5,151,306 | | | | Total | | | 579,546 | | | | 36,824,189 | | | | 37,559 | | | | 8,611,179 | | | | 10,388,399 | | | | | | 2,557,331 | | | | | | | | 90,325,966 | | | | | | 153,531 | | | | 16,054,026 | | | | 28,713,204 | | Nadeem Velani | | 2-Apr-2013 | | | 2,310 | | | 126.34 | | | 2-Apr-2023 | | | 238,669 | | | | | | | | | | | | 31-Jan-2014 | | | 1,820 | | | 168.84 | | | 31-Jan-2024 | | | 110,692 | | | | | | | | | | | | 23-Jan-2015 | | | 1,539 | | | 218.78 | | | 23-Jan-2025 | | | 16,744 | | | | | | | | | | | | 22-Jan-2016 | | | 2,927 | | | 165.74 | | | 22-Jan-2026 | | | 187,094 | | | | | | | | | | | | 20-Jan-2017 | | | 4,644 | | | 201.49 | | | 20-Jan-2024 | | | 130,821 | | | | | | | | | | | | 26-Feb-2014 | | | | | | | | | | | DSU | | | | | | 152,164 | | | | 23-Jan-2015 | | | | | | | | | | | PSU | | | | | | 149,157 | | | | 19-Feb-2015 | | | | | | | | | | | DSU | | 67 | | | 15,397 | | | 61,589 | | | | 23-Feb-2016 | | | | | | | | | | | PSU | | 796 | | | 182,733 | | | | | 26-Feb-14 | | | | | | | DSU | | | | | | | 366,288 | | | | 21-Feb-2017 | | | | | | | | | | | PSU | | 3,933 | | | 903,367 | | | | | 19-Feb-15 | | | | | | | DSU | | | | | | | 185,320 | | | | 24-Feb-2017 | | | | | | | | | | | DSU | | 122 | | | 27,935 | | | 111,741 | | | 24-Feb-17 | | | | | | | DSU | | | | | | | 336,227 | | | | | | 22-Feb-19 | | | | | | | DSU | | | | | | | 731,675 | | | | | | 31-Jan-20 | | | | | | | DSU | | | | | | | 4,025,071 | | | | | | 2-Feb-23 | | | | | | | DSU | | 14,818 | | | 1,553,562 | | | 607,064 | | | | | | 29-Jan-21 | | | | | | | PSU | | | | | | | 2,719,598 | | | | | | | | | | | Total | | | 13,240 | | | | 684,020 | | | | 4,918 | | | | 1,129,432 | | | | 474,651 | | | | | | 427,008 | | | | | | | | 14,111,331 | | | | | | 87,098 | | | | 9,131,407 | | | | 8,971,243 | | Robert Johnson | | 2-Jul-2013 | | | 3,640 | | | 129.54 | | | 2-Jul-2023 | | | 364,437 | | | | | | | | | | | John Brooks | | John Brooks | | John Brooks | | John Brooks | | | | | | | | | | | | | | | | | | | | | | | | | | | | | | | | | 6-Sep-12 | | | | | | | DSU | | | | | | | 545,178 | | | | 31-Jan-2014 | | | 5,870 | | | 168.84 | | | 31-Jan-2024 | | | 357,013 | | | | | | | | | | | 22-Feb-19 | | | | | | | DSU | | | | | | | 447,277 | | | | 23-Jan-2015 | | | 5,198 | | | 175.92 | | | 23-Jan-2025 | | | 44,603 | | | | | | | | | | | 29-Jan-21 | | | | | | | DSU | | 797 | | | 83,386 | | | 333,545 | | | | 22-Jan-2016 | | | 8,244 | | | 116.80 | | | 22-Jan-2026 | | | 682,165 | | | | | | | | | | | 31-Jan-22 | | | | | | | DSU | | 700 | | | 73,210 | | | 292,841 | | | | 20-Jan-2017 | | | 11,557 | | | 150.99 | | | 20-Jan-2024 | | | 460,610 | | | | | | | | | | | 29-Jan-21 | | | | | | | PSU | | | | | | | 2,417,449 | | | | 24-Jun-2013 | | | | | | | | | | | DSU | | | | | | 1,275,641 | | | | 23-Jan-2015 | | | | | | | | | | | PSU | | | | | | 495,554 | | | | 23-Feb-2016 | | | | | | | | | | | PSU | | 2,252 | | | 516,228 | | | | | | 21-Feb-2017 | | | | | | | | | | | PSU | | 4,887 | | | 1,120,422 | | | | Total | | | 34,509 | | | | 1,908,828 | | | | 7,139 | | | | 1,636,650 | | | | 1,771,195 | | | | | | 313,257 | | | | | | | | 9,322,389 | | | | | | 78,052 | | | | 8,161,487 | | | | 4,036,290 | | Laird Pitz | | 3-Jun-2014 | | | 3,150 | | | 187.00 | | | 3-Jun-2024 | | | 134,379 | | | | | | | | | | | | 23-Jan-2015 | | | 4,584 | | | 175.92 | | | 23-Jan-2025 | | | 39,334 | | | | | | | | | | | | 22-Jan-2016 | | | 5,426 | | | 116.80 | | | 22-Jan-2026 | | | 448,984 | | | | | | | | | | | | 20-Jan-2017 | | | 4,753 | | | 150.99 | | | 20-Jan-2024 | | | 189,433 | | | | | | | | | | | | 19-Feb-2015 | | | | | | | | | | | DSU | | 351 | | | 80,374 | | | 321,498 | | | | 23-Jan-2015 | | | | | | | | | | | PSU | | | | | | 436,852 | | | | 23-Feb-2016 | | | | | | | | | | | DSU | | 519 | | | 118,937 | | | 475,748 | | | | 23-Feb-2016 | | | | | | | | | | | PSU | | 1,976 | | | 453,012 | | | | | | 21-Feb-2017 | | | | | | | | | | | PSU | | 2,010 | | | 460,739 | | | | Total | | | 17,913 | | | | 812,130 | | | | 4,856 | | | | 1,113,062 | | | | 1,234,098 | | Jeffrey Ellis | | 22-Jan-2016 | | | 5,981 | | | 165.74 | | | 22-Jan-2026 | | | 382,306 | | | | | | | | | | | | 22-Jan-2016 | | | 2,811 | | | 165.74 | | | 22-Jan-2026 | | | 179,679 | | | | | | | | | | | | 20-Jan-2017 | | | 4,980 | | | 201.49 | | | 20-Jan-2024 | | | 140,287 | | | | | | | | | | | | 22-Jan-2016 | | | | | | | | | | | DSU | | 74 | | | 16,919 | | | 67,677 | | | | 23-Feb-2016 | | | | | | | | | | | PSU | | 2,389 | | | 548,668 | | | | | | 21-Feb-2017 | | | | | | | | | | | PSU | | 1,945 | | | 446,707 | | | | Total | | | 13,772 | | | | 702,272 | | | | 4,408 | | | | 1,012,294 | | | | 67,677 | |
4439
| | | | | | | | | | | | | | | | | | | | | | | | | | | | | | | | | | | | | | | | | | | | | | Option-based awards (1) | | | | | Share-based awards (2) | | | | | | | | | | | | | | | | | | | | | | | | | | | | | | | | | | | | | | | | | Executive | | Grant
date | | | Number of
securities
underlying
unexercised
options (#) | | | Option
exercise
price ($) | | | Option expiration
date | | | Value of
unexercised
in-the-money
options ($) (1) | | | Grant
type | | Number of
shares or units
of shares that
have not
vested (#) | | | Market or
payout value of
share-based
awards that
have not vested ($) | | | Market or payout
value of vested
share-based
awards not paid
out or distributed ($) | | Mark Redd | | | 25-Jan-19 | | | | 19,980 | | | | 41.06 | | | | 25-Jan-26 | | | | 1,004,171 | | | | | | | | | | | | | | | | | | | 3-Sep-19 | | | | 6,485 | | | | 46.95 | | | | 3-Sep-26 | | | | 275,409 | | | | | | | | | | | | | | | | | | | 31-Jan-20 | | | | 47,935 | | | | 53.16 | | | | 31-Jan-27 | | | | 1,642,030 | | | | | | | | | | | | | | | | | | | 29-Jan-21 | | | | 41,350 | | | | 67.24 | | | | 31-Jan-28 | | | | 646,430 | | | | | | | | | | | | | | | | | | | 31-Jan-22 | | | | 46,360 | | | | 71.40 | | | | 31-Jan-29 | | | | 469,679 | | | | | | | | | | | | | | | | | | | 2-Feb-23 | | | | 37,172 | | | | 79.29 | | | | 2-Feb-30 | | | | - | | | | | | | | | | | | | | | | | | | 2-May-23 | | | | 5,746 | | | | 78.16 | | | | 2-May-30 | | | | 6,840 | | | | | | | | | | | | | | | | | | | 19-Feb-15 | | | | | | | | | | | | | | | | | | | DSU | | | | | | | | | | | 236,438 | | | | | 22-Feb-19 | | | | | | | | | | | | | | | | | | | DSU | | | | | | | | | | | 379,415 | | | | | 31-Jan-20 | | | | | | | | | | | | | | | | | | | DSU | | | | | | | | | | | 893,344 | | | | | 29-Jan-21 | | | | | | | | | | | | | | | | | | | DSU | | | 230 | | | | 24,001 | | | | 96,005 | | | | | 31-Jan-22 | | | | | | | | | | | | | | | | | | | DSU | | | 570 | | | | 59,641 | | | | 238,565 | | | | | 2-Feb-23 | | | | | | | | | | | | | | | | | | | DSU | | | | | | | | | | | 193,803 | | | | | 29-Jan-21 | | | | | | | | | | | | | | | | | | | PSU | | | | | | | | | | | 1,805,874 | | | | | 31-Jan-22 | | | | | | | | | | | | | | | | | | | PSU | | | 15,937 | | | | 1,666,398 | | | | | | | | | 2-Feb-23 | | | | | | | | | | | | | | | | | | | PSU | | | 15,941 | | | | 1,666,820 | | | | | | | | | 2-May-23 | | | | | | | | | | | | | | | | | | | PSU | | | 2,460 | | | | 257,243 | | | | | | | | | 17-May-23 | | | | | | | | | | | | | | | | | | | PSU | | | 39,198 | | | | 4,098,677 | | | | | | Total | | | | | | | 205,028 | | | | | | | | | | | | 4,044,559 | | | | | | 74,336 | | | | 7,772,780 | | | | 3,843,444 | | John Orr | | | 28-Apr-23 | | | | 31,562 | | | | 78.84 | | | | 28-Apr-30 | | | | 9,184 | | | | | | | | | | | | | | | | | | | 28-Apr-23 | | | | | | | | | | | | | | | | | | | DSU | | | 4,138 | | | | 432,650 | | | | 1,730,602 | | | | | 28-Apr-23 | | | | | | | | | | | | | | | | | | | PSU | | | 13,512 | | | | 1,412,895 | | | | | | | | | 17-May-23 | | | | | | | | | | | | | | | | | | | PSU | | | 27,538 | | | | 2,879,527 | | | | | | Total | | | | | | | 31,562 | | | | | | | | | | | | 9,184 | | | | | | 45,188 | | | | 4,725,072 | | | | 1,730,602 | |
| (1) | Option-based awards. Regular options granted before 2017 vest 25 percent each year for four years beginning on the first anniversary of the grant date and expire 10 years from the grant date. Grants made in 2017 and onwards have the same vesting schedule and expire seven years from the grant date. All exercise prices for grants received prior to 2015 are in Canadian dollars. With respect to Messrs. Creel Brooks, Redd and Orr, exercise prices for option awards that were granted in 2015 and later are in U.S. dollars. All of Mr. Velani’s exercise prices are in Canadian dollars. |
| Value of unexercised in-the-money options. For stock options granted in Canadian dollars, the value of unexercised in-the-money options at 2023 year-end is based on $104.84, the closing share price on the TSX on December 29, 2023. For U.S. dollar stock option grants, the value of unexercised in-the-money options at 2023 year-end is based on US$79.06, the closing share price on the NYSE on December 29, 2023. |
| (2) | Share-based awards. Values include reinvested dividends. The unvested 2022 and 2023 PSU values are based on an assumed payout at target (100 percent). For Mr. Velani, the value of unvested PSUs and DSUs is based on $104.84, the closing share price on the TSX on December 29, 2023. For Messrs. Creel,. Brooks, Redd and Orr, the value of unvested PSUs and DSUs is based on US$79.06 our closing share price on the NYSE on December 29, 2023, converted to Canadian dollars using a year-end exchange rate of $1.3226. |
| The vested 2021 PSU values are based on an overall performance factor of 135 percent and a payout price of $100.37 and US$74.30 on the TSX and NYSE, respectively (see Payout of 2021 PSU award on page 29 for more details). Mr. Redd elected to defer a portion of his January 29, 2021 PSU award to PDSUs and received an additional 533 PDSUs, on February 6, 2024, respectively as a result of the overall 2021 PSU performance factor of 135 percent and a further 511 matching PDSUs, respectively, under the terms of the Senior Executive Deferred Share Plan on February 6, 2024. Value of the vested 2021 PDSUs are included in the table above. See the About deferred compensation section on page 44 for more details. |
| Vested and unvested DSU awards are deferred and cannot be redeemed until the NEO leaves the Company. |
| Messrs. Velani, Brooks, Redd and Orr were awarded a one-time, special PSU grant on May 17, 2023 to incentivize the delivery of synergies to our shareholders. See Synergy performance award on page 25 for more details. |
| (3) | Mr. Creel was awarded an upfront performance stock option grant on February 1, 2017 when he became CEO on January 31, 2017. These performance stock options vested on February 1, 2022 based on our five-year TSR relative to two equally weighted measures: the S&P/TSX Capped Industrial Index and the S&P 1500 Road and Rail Index. The threshold for vesting is for CPKC’s TSR being at or above the 60th percentile relative to each index at the end of the performance period on January 31, 2022. The Company’s TSR performance relative to the S&P/TSX Capped Industrial and S&P 1500 Road and Rail indices both exceeded the 60th percentile, vesting 100 percent of the grant. |
| On March 27, 2021, Mr. Creel was awarded a special stock option grant in conjunction with amendments to his executive employment agreement made on March 21, 2021. See Employment agreements on page 38 for more details. |
40
Notes:
Options
In general regular options granted before 2017 vest 25% each year for four years beginning on the anniversary of the grant date and expire 10 years from the grant date. Grants made in 2017 expire seven years from grant date. Exercise prices are shown in Canadian dollars, except that, with respect to Mr. Creel, Mr. Johnson and Mr. Pitz option awards that were made in 2015 or later, exercise prices are in U.S dollars.
Value of unexercisedin-the-money options at 2017year-end
Based on $229.66, our closing share price on the TSX on December 29, 2017. For all the named executives except Mr. Velani and Mr. Ellis, option awards made in 2015 or later have been valued based on US$182.76, our closing share price on the NYSE on December 29, 2017 and converted into Canadian dollars using ayear-end exchange rate of $1.2545.
Mr. Creel was awarded performance stock options on July 24, 2014. These options vested upon meeting certain performance hurdles: 50% of the options vested upon CP achieving an annual operating ratio of 63%, and the other 50% vested upon CP achieving an annual operating income of $2,618 million. The options are not exercisable until June 1, 2018.
Mr. Creel was also awarded performance stock options on February 1, 2017. These options will vest on February 1, 2022 provided certain performance metrics are achieved. See page 23 for details. Amount reflects the market value of shares or units of shares that have not vested.
Mr. Velani and Mr. Ellis: the value of unvested PSUs and DSUs is based on $229.66, our closing share price on the TSX on December 29, 2017.
Mr. Creel, Mr. Johnson and Mr. Pitz: the value of PSUs or DSUs is based on US$182.76, our closing share price on the NYSE on December 29, 2017, converted into Canadian dollars using ayear-end exchange rate of $1.2545.
PSUs assume a payout at target (100%) for the 2016 and 2017 grants. The 2015 PSU value reflects a payout at 160% on the award which includes dividends earned up to the payment date. The DSU awards are deferred and cannot be redeemed until the executive leaves the company.
Incentive plan awards – value vested or earned during the year The table below shows the amount of incentive compensation that vested or was paidearned in 2017.2023. | | | | | | | | | | | | | | Name | | Option-based awards – Value vested during the year ($) | | | Share-based awards – Value vested during the year ($) | | | Non-equity incentive plan compensation –
Value earned during the year ($) | | Keith Creel | | | 7,825,458 | | | | 3,230,887 | | | | 2,419,292 | | Nadeem Velani | | | 138,267 | | | | 436,074 | | | | 490,763 | | Robert Johnson | | | 362,089 | | | | 995,884 | | | | 597,372 | | Laird Pitz | | | 193,139 | | | | 436,852 | | | | 435,601 | | Jeffrey Ellis | | | 140,560 | | | | 67,677 | | | | 376,470 | |
Notes:
Share-based awards – value vested during the year
Includes 2015 PSUs that vested at 160% on December 31, 2017 and includes dividends earned up to the payment date. The value realized on vesting is calculated by multiplying the number of shares acquired on vesting by $225.47, the average30-day trading price of our shares prior to December 31, 2017 on the TSX for Mr. Velani, and US$176.56 on the NYSE for Mr. Creel, Mr. Johnson and Mr. Pitz converted to Canadian dollars using theyear-end exchange rate of $1.2545 and by multiplying the achieved performance factor.
Mr. Velani’s amount includes the value of DSUs that vested in 2017 and RSUs that vested on May 8, 2017. Mr. Ellis’ amount includes the value of DSUs that vested in 2017. Mr. Johnson’s amount includes the value of RSUs that vested on May 8, 2017.
| | | | | | | | | | | | | Executive | | Option-based awards - value vested during the year ($)(1) | | | Share-based awards - value vested during the year ($)(2) | | | Non-equity incentive plan compensation - value earned during the year ($) | | | | | | Keith Creel | | | 7,777,721 | | | | 11,502,832 | | | | 3,826,400 | | | | | | Nadeem Velani | | | 2,230,484 | | | | 2,719,598 | | | | 1,415,327 | | | | | | John Brooks | | | 1,489,124 | | | | 2,417,449 | | | | 1,385,298 | | | | | | Mark Redd | | | 967,872 | | | | 2,096,310 | | | | 1,375,261 | | | | | | John Orr | | | - | | | | 1,782,728 | | | | 1,045,174 | |
| (1) | Option-based awards—value vested during the year. Includes the aggregate dollar value that would have been realized if the options were exercised on the date of vest. It is calculated as the difference between the closing price (on each of the stock option vest dates in 2023) and the exercise price, converted to Canadian dollars where applicable using the exchange rate on the vest date. |
| (2) | Share-based awards—value vested during the year. Includes DSUs that have vested during the year and are valued as of the vest date and converted to Canadian dollars where applicable. Also includes, the payout value of the 2021 PSUs and the value of 2021 PDSUs (including the 533 PDSUs credited to Mr. Redd, respectively, on February 6, 2024 as a result of the 2021 PSU performance factor, and a further 511 matching PDSUs credited to Mr. Redd, respectively, on February 6, 2024, under the terms of the Senior Executive Deferred Share Unit Plan), which vested at 135 percent on December 31, 2021. The 2021 PSU value for Messrs. Creel, Brooks and Redd have been converted to Canadian dollars using the year-end exchange rate of $1.3226. See Payout of 2021 PSU award on page 29 and the Outstanding share-based awards and option-based awards on page 39 for more details. |
45
Option exercises and vested stock awards The table below shows the options exercised and sold by the named executivesNEOs in 2017.2023. | | | | | | | | | | | | | | Name | | Number of options exercised and sold | | | Option exercise price ($) | | | Value realized ($) | | Keith Creel | | | - | | | | - | | | | - | | Nadeem Velani | | | - | | | | - | | | | - | | Robert Johnson | | | - | | | | - | | | | - | | Laird Pitz | | | 1,809 | | | US$ | 116.80 | | | | 89,745 | | Jeffrey Ellis | | | - | | | | - | | | | - | |
| | | | | | | | | | | | | Executive | | Number of options exercised and sold | | | Option exercise price ($) | | | Value realized ($) (1) | | Keith Creel(2) | | | 32,580 | | | US$ | 30.20 | | | | 2,056,104 | | | | | 753,795 | | | US$ | 30.23 | | | | 47,627,878 | | | | | | 149,625 | | | $ | 33.77 | | | | 9,715,955 | |
Value realized is calculated using the market price of the shares acquired on exercise of the respective options less the exercise price for those options. The value has been converted to Canadian dollars using the exercise date exchange rate of $1.2182.
| (1) | Based on the market price of shares less the option exercise price on the date of exercise; converted to Canadian dollars using the exchange rate on the exercise date for exercises on the NYSE. |
| (2) | Mr. Creel’s exercises are for options, which are scheduled to expire in January, February and July of 2024, and are being exercised and sold in accordance with the automatic securities disposition plans he established on August 2, 2022. |
41
Equity compensation plan information The table below shows the securities authorized for issuance under equity compensation plansatplans at December 31, 2017.2023. These include the issuance of securities upon exercise of options outstanding under the management stock option incentive plan and the director stock option plan. The table also shows the remaining number of shares available for issuance and includes 340,0001,700,000 shares under the director stock option plan. On July 21, 2003, the Board suspended any additional grants of options under the director stock option plan and there are no outstanding options under that plan. | | Plan category | | Number of securities to
be issued upon exercise
of outstanding options,
warrants and rights | | Weighted-average
exercise price of
outstanding options,
warrants and rights | | Number of securities remaining
available for future issuance under equity
compensation plans (excluding securities
reflected in the first column) | | Plan Category | | | Number of securities to
be issued upon exercise
of outstanding options,
warrants and rights | | | Weighted-average
exercise price of
outstanding options,
warrants and rights ($) | | | Number of securities remaining
available for future issuance under equity
compensation plans (excluding securities
reflected in the first column) | | | | Equity compensation plans approved by security holders | | 1,481,275 | | | $ | 150.54 | | | 1,895,922 | | Equity compensation plans approved by security holders | | Equity compensation plans approved by security holders | | Equity compensation plans approved by security holders | | | | 6,471,932 | | | | 71.03 | | | | 21,758,323 | | | | Equity compensation plans not approved by security holders | | | - | | | | - | | | | - | | Equity compensation plans not approved by security holders | | Equity compensation plans not approved by security holders | | Equity compensation plans not approved by security holders | | | | - | | | | - | | | | - | | | Total | | | 1,481,275 | | | $ | 150.54 | | | | 1,895,922 | | Total | | Total | | Total | | | | 6,471,932 | | | | 71.03 | | | | 21,758,323 | |
See page 2428 to read more about the management stock option incentive plan. You can also read about the two equity compensation plans in our audited consolidated financial statements for the year ended December 31, 2017,2023, available on our website (www.cpr.ca)(investor.cpkcr.com/financials), and on SEDAR (www.sedar.com) and EDGAR (www.sec.gov). Employee Share Purchase Plan (ESPP) 46The Company’s ESPP is available to all employees and provides the opportunity to purchase shares on the open market through payroll deductions which aligns employees’ interests with those of shareholders. Employees may contribute between one percent and ten percent of their base salary to the ESPP every pay period. CPKC provides a 33 percent match on the first six percent of non-unionized and specified unionized employees’ contributions which vest at the end of the four consecutive quarters. Employees must remain participants of the ESPP at the time of vesting in order to receive the CPKC match.
In 2023, approximately 51 percent of our employees participated in the ESPP. 42
Retirement plans Canadian pension plans Mr.Messrs. Creel Mr.and Velani and Mr. Ellis participated in our defined contributionDC plan (DC plan) in 2017.2023.
Participants contribute between 4%4 and 6%6 percent of their earningsbase salary depending on their age and years of service, and the companyCompany contributes between 4%4 and 8%8 percent of earnings.a participant’s base salary and annual bonus. For eligible executives, CPKC contributes an additional 6 percent of base salary and annual bonus. Total contributions are limited to the maximum allowed under theIncome Tax Act(Canada) ($26,01031,560 for 2017)2023). Defined contribution plan table | | | | Accumulated value at start of year ($) | | | Compensatory ($) | | | Accumulated value at year end ($) | | | Executive | | | Accumulated value at start of year ($) | | | Compensatory ($) | | | Accumulated value at year end ($) | | Keith Creel | | | 402,371 | | | | 376,688 | | | | 842,518 | | | | 3,679,510 | | | | 279,682 | | | | 4,345,477 | | Nadeem Velani | | | 186,475 | | | | 101,027 | | | | 315,592 | | | | 1,677,790 | | | | 173,485 | | | | 2,167,936 | | Jeffrey Ellis | | | 66,157 | | | | 101,277 | | | | 183,455 | |
Mr.Messrs. Creel Mr.and Velani and Mr. Ellis also participate in the DC SERP, a defined contribution supplemental plan (DC SERP), anon-registered plan that provides benefitsnotional contributions in excess of theIncome Tax Act (Canada) limits forat the same Company contribution rate as in the DC plan. Specifically, the SERP provides a company contribution equal to 6% of a participant’s base salary and annual bonus.Plan. Company contributions vest after two years and employeesof employment. Employees do not contribute to the plan.DC SERP.
U.S. retirement plans Our U.S. retirement program has threefive elements: a qualified defined benefit pension plan (closed plan) which provides annual benefit accruals funded by employer contributions determined from U.S. Internal Revenue Service (IRS) rules; | • | | a non-qualified defined benefit pension plan (closed plan) for certain employees whose compensation exceeds the U.S. Internal Revenue Code limit (US$330,000 for 2023); |
a voluntary qualified 401(k) plan with employer matchmatch; a qualified defined contribution plan which provides automatic employer contributionscontributions; and | • | | a nonqualifiednon-qualified defined contribution plan for certain employees whose compensation exceeds theU.S. Internal Revenue Code (IRS) limits limit (US$270,000330,000 for 2017)2023). |
CPKC pension plan for U.S. management employees (closed plan) CPKC sponsors a defined benefit pension plan comprised of a Basic Defined Benefit Pension Plan (Basic DB Plan) and a Supplemental Pension Plan, which provides retirement benefits in excess of the Basic DB Plan. The benefit is based on age, service and a percentage of final average compensation. The pension formula uses the final average monthly earnings and calculates a benefit of 0.5 percent up to the Tier 1 Railroad Retirement Board limit and 1.25 percent in excess of that limit, and multiplies that by the years of service to a maximum of 30 years. An unreduced pension is available for all employees under the Basic DB Plan and the Supplemental Pension Plan as early as age 62 with 30 years of service with the normal retirement benefit payable at age 65. The table below summarizes Mr. Brooks’ participation in the Basic DB Plan and Supplemental Pension Plan in 2023. The values in the table have been converted to Canadian dollars using the 2023 average exchange rate of $1.3497. | | | | | | | | | | | | | | | | | | | | | | | | | | | | | | | | | | | | Years of credited service | | | Annual benefits payable | | | Opening present
value of defined
benefit obligation
($) | | | Compensatory
change ($) | | | Non-compensatory
change ($) | | | Closing present
value of defined
benefit
obligation ($) | | | Executive | | At December 31, 2023 | | | At age 65 | | | At year end ($) | | | At age 65 ($) | | John Brooks | | | 15.17 | | | | 27.25 | | | | 296,631 | | | | 608,189 | | | | 2,333,925 | | | | 449,531 | | | | 264,339 | | | | 3,047,795 | |
The present value of the defined benefit obligation is based on the assumptions and methods used for financial statement reporting. In previous years, it was assumed that Mr. Brooks’ accrued benefit would be paid at age 65. The present value was determined using a discount rate of 5.23 percent and mortality adjusted actuarial assumptions. 401(k) plan Individuals can makepre-tax or post-tax (Roth) contributions to the 401(k) plan subject to limitationslimits imposed by the IRS in the U.S.IRS. The companyCompany provides a matching contribution of 50%50 percent on the first 6%six percent of eligible earnings. All contributions vest immediately. 43
U.S. Salaried Retirement Income Plansalaried retirement income plan The U.S. Salaried Retirement Income Plan is employer-funded with an annual contribution amount equal to 3.5%3.5 percent of eligible earnings, which include base salary and annual bonus. These earnings are subject to compensation limitationslimits imposed by the IRS in the U.S. These amounts are included in the summary compensation table under All other compensation.IRS. Supplemental defined contribution plan (U.S. DC SERP) The U.S. DC SERP is an unfunded, nonqualifiednon-qualified defined contribution plan that provides an additional company contribution equal to 6%six percent of eligible earnings without regard to the limitationslimits imposed by the IRS in the U.S.IRS. Eligible earnings include base salary and annual bonus. In addition, for earnings in excess of the limitationslimits imposed by the U.S. Internal Revenue Code, an additional 3.5%3.5 percent contribution is made. Company contributions cliff vest at the end of three years. Mr.Messrs. Creel Mr. Johnson and Mr. PitzRedd participated in the U.S. DC SERP in 2017.
| | | | | | | | | | | | | | | | Accumulated value at start of year ($) | | | Compensatory ($) | | | Accumulated value at year end ($) | | Keith Creel | | | 705,262 | | | | 22,206 | | | | 846,244 | | Robert Johnson | | | 176,959 | | | | 114,037 | | | | 299,094 | | Laird Pitz | | | 99,062 | | | | 82,361 | | | | 187,811 | |
47
2023. The values intable below shows the table have beenU.S. Salaried Retirement Income Plan and U.S. DC SERP account information as at December 31, 2023 with values converted to Canadian dollars using the 20172023 average exchange rate of $1.2986.$1.3497. | | | | | | | | | | | | | | Executive | | Accumulated value at start of year ($) | | | Compensatory ($) | | | Accumulated value at year end ($) | | Keith Creel | | | 1,149,826 | | | | 23,080 | | | | 1,394,356 | | Mark Redd | | | 600,082 | | | | 151,421 | | | | 894,794 | |
About deferred compensation Executive officers and members of senior management who have not met their share ownership requirement can choose to defer all or parta portion of their short-term incentive by receiving itor PSU grant as deferred share units. They cannot defer more than the amount needed to meet the requirement, which includes our 25% match of the amount deferredDSUs. The short-term incentive DSUs are granted in the year the bonus is actually paid.paid and may receive a 25 percent match. The matching units vest after three years. Elections must be made beforedeferred amount, including the beginning ofmatch, cannot exceed the new fiscal year.amount needed to meet the ownership requirement. The amount is converted to bonus DSUs using the average market price of a CPCPKC common share for the 10 trading days immediately before December 31 of the applicable performance year. The matching units vest after three years.
Eligible executives can elect to defer a portion of their PSU grant prior to start of the performance period. These Performance DSUs are subject to the same performance and vesting conditions as the corresponding PSU grant. To align with the granting practice of the PSU plan, the elected amount converted to Performance DSUs is based on the market closing price of a CPKC common share for the 30 trading days prior to the grant date. The Performance DSUs may receive a 25 percent match upon vesting (subject to a matching DSU cap), three years from the grant date. To defer any compensation, elections must be made by June 30th of the calendar year prior to the new fiscal year. Matching DSUs cannot exceed 20 percent of the executives’ total ownership requirement. The table below shows the number and value of DSUs outstanding and their value based on our closing share price onas at December 29, 2017.31, 2023. | | | | | | | | | | | | | | | | | | | | Unvested DSUs (#) | | | Vested DSUs (#) | | | Total units ($) | | | Value as at
December 31, 2017 ($) | | Keith Creel | | | - | | | | 31,218 | | | | 31,218 | | | | 7,157,426 | | Nadeem Velani | | | 189 | | | | 1,417 | | | | 1,606 | | | | 368,834 | | Robert Johnson | | | - | | | | 5,564 | | | | 5,564 | | | | 1,275,672 | | Laird Pitz | | | 869 | | | | 3,477 | | | | 4,346 | | | | 996,418 | | Jeffrey Ellis | | | 74 | | | | 295 | | | | 369 | | | | 84,745 | |
| | | | | | | | | | | | | | | | | | Executive | | Unvested DSUs (#) | | | Vested DSUs (#) | | | Total Units (#) | | | Value as at December 31, 2023 ($)(1) | | Keith Creel | | | 0 | | | | 164,591 | | | | 164,591 | | | | 17,210,372 | | Nadeem Velani | | | 14,818 | | | | 59,630 | | | | 74,448 | | | | 7,805,208 | | John Brooks | | | 1,497 | | | | 15,482 | | | | 16,979 | | | | 1,775,438 | | Mark Redd(2) | | | 800 | | | | 20,995 | | | | 21,795 | | | | 2,278,986 | | John Orr | | | 4,138 | | | | 16,551 | | | | 20,689 | | | | 2,163,252 | |
Mr. Creel received a special make-whole DSU grant when he was hired in 2013.
We valued the outstanding DSUs using $229.66, our closing share price on the TSX on December 29, 2017 for Mr. Velani and Mr. Ellis, and US$182.76, our closing share price on the NYSE and converted to Canadian dollars using ayear-end exchange rate of $1.2545 for Mr. Creel, Mr. Johnson and Mr. Pitz.
| (1) | We valued the outstanding DSUs using $104.84, our closing share price on the TSX on December 29, 2023 for Mr. Velani and US$79.06, our closing share price on the NYSE and converted to Canadian dollars using a year-end exchange rate of $1.3226 for Messrs. Creel, Brooks, Redd and Orr. |
| (2) | Mr. Redd’s vested DSU amount includes 533 PDSUs resulting from the overall 2021 PSU performance factor of 135 percent that was applied to the 2021 PDSU grant and the associated 511 matching PDSUs credited on February 6, 2024. |
DSUs are redeemed for cash six months after the executive retires or leaves the company, or up untilCompany, with: (i) Canadian-resident executives being entitled to elect a date of payment between the enddate that is six months following their departure from the Company and December 15th of the following calendar year, forin compliance with Canadian executives.tax rules; and (ii) U.S. resident executives who participate inbeing paid six months after their departure from the DSU plan must redeem their DSUs after thesix-month waiting period to beCompany, in compliance with U.S. tax regulations. We useused the average market price of a CP common share for the 10 trading days immediately before the payment date to calculate the amount, which the participant receives in a lump sum.sum less withholding taxes. 4844
Termination and change in control Termination of employment We have policies to cover different kinds of termination of employment. Mr. Creel is covered under the terms of the newhis employment agreement effective January 31, 2017, as amended December 18, 2018 and March 21, 2021, that includesnon-competition,non-solicitation and confidentiality restrictions. Mr. Ellis has an agreement for termination without cause which also includesnon-competition,non-solicitationMessrs. Velani, Brooks, Redd and confidentiality restrictions. Mr. Velani, Mr. Johnson and Mr. PitzOrr are subject to the same terms as all other employees for voluntaryresignation, retirement, termination retirementwith cause, termination without cause and termination for cause.change in control. Messrs. Velani, Brooks, Redd and Orr have signed non-competition, non-solicitation agreements in each year of their employment with the Company that also have confidentiality restrictions. | | | | | | | | | | | | | | Resignation | | Retirement | | TerminationRetirement
with cause
| | Termination without with cause | | Termination without
cause | | Change in control | | Severance | | None | | None | | None | | Mr. Creel: 24 months of base salary Mr. Ellis: 12 months of base salary Other named executives: per legislative requirementsNEOs: pursuant to applicable law | | None | Short-term incentive | | Forfeited | | Award for current year ispro-rated to retirement date | | Forfeited | | EqualMr. Creel: equal to the target award for severance period for Mr. Creel Equal to target bonus for 12 months for Mr. Ellis.
Other named executives:NEOs: award for current year ispro-rated to termination date as per plan | | None | | DSUs | | Unvested DSUs are forfeited | | Unvested DSUs are forfeited | | Unvested DSUs are forfeited | | Unvested DSUs are forfeited | | Unvested units vest early if the holder is terminated following change ofin control | Performance share units | | Forfeited | | Award continues to vest based on performance factors and executive is entitled to receive the full value as long as they have worked for six months of the performance period, otherwise the award is forfeited | | Forfeited | | Pro-ratedMr. Creel: subject to retirement provisions Other NEOs: pro-rated based on active service within the performance period and based on actual performance at the end of the performance period | | Only vest if the executive is terminated following a change ofin control PSUs vest at target,pro-rated based on active service within the performance period | | Stock options | | Vested options are exercisable for 30 days or until the expiry date, whichever comes first. first Unvested options are forfeited Performance stock options are forfeited | | Options continue to vest Award expires five years after the retirement date or the normal expiry date, whichever is earlier Performance stock options are forfeited | | Forfeited | | VestedMr. Creel: subject to retirement provisions Other NEOs: vested options are exercisable for six months following termination as well as any options that vest during thesix-month period Performance stock options are forfeited | | Options only vest early if the option holder is terminated following the change of control. in control Performance stock options are forfeited | | Pension | | No additional value | | No additional value | | No additional value | | No additional value | | No additional value | | ESPP shares | | Unvested shares are forfeited | | Unvested shares vest | | Unvested shares are forfeited | | Unvested shares vest if holder is terminated without cause | | Unvested shares vest | | Benefits | | End on resignationlast day worked | | Post-retirement life insurance of $50,000 and a health spending account based on years of service (same for all employees) | | End on resignationtermination date | | 12 months health and dental for Mr. EllisEnd on last day worked | | None | | Perquisites | | Any unused flex perquisite dollars are forfeited | | Any unused flex perquisite dollars are forfeited | | Any unused flex perquisite dollars are forfeited | | Any unused flex perquisite dollars are forfeited | | Any unused flex perquisite dollars are forfeited |
We entered into a separation agreement with Mr. Harrison on January 18, 2017, under which he resigned from CP as CEO effective January 31, 2017. He was the only named executive with a change in control agreement with CP.
4945
The next table below shows the estimated incremental amounts that would be paid to Mr. Creel, and Mr. Ellis if theirhis employment had been terminated without cause on December 31, 2017. None of the named executive receives an excise2023. There is no extra taxgross-up provision for any termination benefit. | | | | | | | Severance payment | | | | | | | | | | | | | | | Name | | Severance period
(# of months) | | | Base pay
($) | | | Short-term
Incentive
($) | | | Additional
retirement
benefits
($) | | | Other
benefits
($) | | | Value of vesting
of options and
equity-based
awards
($) | | | Payable on
termination
without
cause
($) | | | Severance period (# of months) | | | Base pay ($) | | | Short-term
incentive ($) | | | Additional
retirement
benefits ($) | | | Other
benefits(1) ($) | | | Value of vesting
of options and
equity-based
awards (2) ($) | | | Payable on
termination
without
cause ($) | | Keith Creel | | | 24 | | | | 2,822,625 | | | | 3,387,150 | | | | - | | | | 34,169 | | | | 6,369,723 | | | | 12,613,667 | | | | 24 | | | | 3,571,020 | | | | 5,356,530 | | | | — | | | | 39,651 | | | | 41,697,254 | | | | 50,664,455 | | Jeffrey Ellis | | | 12 | | | | 445,000 | | | | 267,000 | | | | - | | | | 14,592 | | | | 690,249 | | | | 1,416,841 | | Total | | | | | 3,267,625 | | | | 3,654,150 | | | | - | | | | 48,761 | | | | 7,059,972 | | | | 14,030,508 | |
Notes:
•(1) | | Other benefitsinclude the cost of group benefits for Mr. Ellis for the severance period, andReflects the value of accelerated vesting of shares purchased under the Employee Share Purchase PlanESPP for Mr. Creel and Mr. Ellis.Creel. |
•(2) | | For Mr. Creel,Reflects thevalue of vesting ofstock options and equity-based awards is vesting per the value of options vesting within six months following terminationretirement provisions in accordance with our stock option and the prorated value as of the termination date of PSU awards. Itplans. Mr. Creel’s calculation is based on $229.66,US$79.06, our closing share price on the TSXNYSE on December 29, 2017 and US$182.76, the closing price of our shares on the NYSE,2023, converted intoto Canadian dollars using ayear-end exchange rate of $1.2545. |
• | | For Mr. Ellis, thevalue of vesting of options and equity-based awards is based on $229.66, our closing share price on the TSX on December 29, 2017.$1.3226. |
5046
CEO pay ratio
DirectorCPKC is proactively providing transparency and public disclosure related to CEO pay as compared to the median employee. As our proxy is governed under Canadian Securities Administrators (CSA) regulations; we are not required by Section 953(b) of the Dodd-Frank Wall Street Reform and Consumer Protection Act (Dodd-Frank Act) and Item 402(u) of Regulation S-K to disclose information about the ratio of the annual total compensation of our median employee and the annual total compensation (pay ratio) of Mr. Creel, our President and CEO. In support of the Board’s commitment to progressive disclosure practices we have determined and are disclosing the CEO pay ratio for 2023 in the table below.
| | | | | For December 31 | | 2023 | | CEO pay ratio | | | 159:1 | | Excluding employees located in Mexico(1) | | | 149:1 | | (1) To facilitate benchmarking with our U.S. Class I railroad peers, we also provide the pay ratio of the
total annual compensation of our CEO and employees located in Canada and the U.S. | |
To identify our median employee, we conducted an analysis of the total compensation of our employee population in Canada, U.S. and Mexico, other than our CEO, who were employed by the Company on December 31, 2023. We have determined that using the taxable income reported on the T4 box 14 employment income and W-2 box 1 income for employees in Canada and the U.S., provides a reasonable and consistent estimate for evaluating annual total compensation. We used aggregate payroll data to provide a reasonable estimate of the annual total compensation in Mexico. The median employee annual total compensation for 2023 of employees located in Canada, U.S. and Mexico is $126,086 while the median annual total compensation of employees located in Canada and the U.S. is $134,435. In accordance with applicable U.S. disclosure rules, we calculated 2023 annual total compensation for our median employees using the same methodology that we use to determine our NEOs’ annual total compensation in the Summary compensation table on page 36. The pay ratio is a reasonable estimate calculated in a manner consistent with SEC rules based on our payroll and employment records and the methodology described above. The SEC rules for identifying the median compensated employee and calculating the pay ratio based on that employee’s annual total compensation allow companies to adopt a variety of methodologies, to apply certain exclusions and to make reasonable estimates and assumptions that reflect their compensation practices. As such, the pay ratio reported by other companies may not be comparable to the pay ratio reported above, as other companies may have different employment and compensation practices and may utilize different methodologies, exclusions, estimates and assumptions in calculating their own pay ratios. 47
Director compensation for 2023 | | | | | Our director compensation program shares the same objective as our executive compensation program: to attract and retain qualified directors and to align the interests of directors and shareholders. Flat fee retainer We pay directors a flat fee retainer, which is easy to administer and reflects the director’s ongoing oversight and responsibilities throughout the year and attendance at Board and committee meetings. Directors receive 100%100 percent of their annual retainer in Director Deferred Share Units (DDSUs) until they have met their share ownership requirements. After that, they must receive at least 50%50 percent of their retainer in DDSUs, and can receive the balance in cash. Directors must make their election before the beginning of each calendar year. Directors must meet their share ownership requirements within five years of joining the Board, and must hold their DDSUs for one year after they retire from the Board. The table below shows the flat fee retainers for 2017.2023. In 20172023, Canadian directorsdirectors’ fees were paid inconverted to Canadian dollars and the number of DDSUs received was based on the trading price of our shares on the TSX, whileTSX. U.S. directors were paid in U.S. dollars and the number of DDSUs they receivereceived was based on the trading price of our shares on the NYSE. | | | | | | Aligning director and shareholder interests Directors receive their annual retainer in deferred share units so they have an ongoing stake in our future success, aligning their interests with those of our shareholders. About DDSUs DDSUs are granted to directors under the director deferred share unit plan. Onlynon-employee directors participate in the plan. A DDSU is a bookkeeping entry that has the same value as one CP common share. DDSUs earn additional units as dividend equivalents at the same rate as dividends paid on our shares. Directors receive a cash amount for their DDSUs one year after they leave the Board, based on the market value of our shares at the time of redemption, less any withholding taxes.vest immediately. | | | | | |
| | | | 2023 Annual Director Compensation | | Annual retainer | | | | Retainer | Board Chair retainer Compensation – All Directors | | $395,000 | | | | | US$280,000 | Director Additional retainer – Chair of Governance Committee, Risk and Sustainability Committee and Integration Committee | | $235,000 | | | | | US$30,000 | Additional retainer – Chair of Audit and Finance Committee chair retainerand Compensation Committee | | $30,000US$40,000 | Additional retainer – Board Chair | | | | | | | | | | | US$195,000 |
We reimburse directors for travel andout-of-pocket expenses related to attending their Board and committee meetings and other business on behalf of CP.the Company. Mr. Creel does not receive any director compensation because he is compensated in his role as President and CEO. Benchmarking SimilarOur comparator group in 2023 remained unchanged from 2022 and consisted of five Class I railroad peers as well as 11 capital-intensive Canadian companies. There have been no changes to executive compensation, we benchmark director compensation so we can attract the right director talent and be competitive with the market.since 2022.
We use a comparator group of 21 companies, which are capital-intensive Canadian businesses ranging fromone-third to three times the size of CP based on size of assets.
The 2017 compensation comparator group included the following companies:
| | | | | Agrium
Air Canada
ATCO Group
Bell Canada (new)
Bombardier
Canadian Tire (new)
CGI Group Inc. (new)
| | Canadian National Railway
Canadian Natural Resources Limited (new)
Cenovus Energy
Encana
Finning International Inc.
Kinross Gold Corp.
Maple Leaf Foods
| | PotashCorp
Rogers Communications
SNC-Lavalin Group
Suncor Energy (new)
Teck Resources
Telus
TransAlta Corporation
|
51
We also look at the director compensation of the Class 1 railroads as a secondary reference.
Independent advice The Governance Committee may engage an independent consultant with respect to director compensation. The Governance Committee makes its own decisions, which may reflect factors and considerations other than the information and recommendations provided by its external consultant.
Board assessment and evaluation process The Governance Committee did not engagediscusses goals related to corporate governance, strategic planning, Board succession, shareholder engagement and director education and provides recommendations to the Board on these matters. The Board has a comprehensive annual Board assessment and evaluation process that includes a review of individual directors (including peer reviews), review of each of the Board’s committee mandates, committee chairs, the Board Chair and the overall functioning of the Board. In 2023, the Board’s Chair facilitated the evaluation process and met with directors. Peer reviews were also part of the evaluation process. She also received feedback given by senior management who interact with the Board regularly. The Chair of the Board presented the responses and findings for the Board and management in January 2024 and addressed these findings with the Board in early 2024. 48
2023 Director Compensation The Governance Committee reviews director compensation every two to three years based on the directors’ responsibilities, time commitment and the compensation provided by comparable companies. Each director is paid an external compensation consultant in 2017. 2017 director compensationannual retainer of U.S.$280,000. The chairs of the Compensation Committee and the Audit and Finance Committee receive an additional U.S.$40,000 per year. All other Committee chairs receive an additional U.S.$30,000 per year and the Board Chair receives an additional U.S.$195,000(1) per year.
We paid directors a total of approximately $2,650,506$4,138,872 in 20172023 as showndetailed in the table below. Directors receive a flat fee retainer to cover their ongoing oversight and responsibilities throughout the year, and theirthey do not receive additional compensation for attendance at Board and committee meetings. AllDirectors receive 100 percent of ourtheir annual retainer in director deferred share units (DDSUs) until they have met their share ownership requirements. After that, directors are required to receive at least 50%50 percent of their compensation in director deferred share units (DDSUs).DDSUs. The total representstotals listed in the chart below represent (1) the approximate dollar value of DDSUs credited to each director’s DDSU account in 2017,2023, based on the closing fair market value of our common shares on the grant date plus (2) the cash portion paid whereif a director elected to receive a portion of their compensation in cash.
Mr. Creel does not receive compensation in respect of his role as a director compensation because he is compensated in respect of his role as President and CEO (see pages 2730 and 4136 for details). Former director Hunter Harrison also received no director compensation as he was compensated as CEO during his tenure.He is therefore not included in the chart below. All figures in the chart below are in Canadian dollars. | | Name | | Fees
earned
($) | | | Share-based
awards
($) | | | Option-based
awards
($) | | | Non-equity incentive
plan compensation
($) | | | Pension value
($) | | | All other
compensation
($) | | | Total
($) | | | Fees earned(2) (paid in cash) ($) | | | Share-based
awards(1),(2) (DDSUs) ($) | | | All other
compensation(2)(3)(5) ($) | | | Total ($) | | | % of Total Fees Taken in DDSUs | | John Baird | | | - | | | | 235,987 | | | | - | | | | - | | | | - | | | | 1,000 | | | | 236,987 | | | | 0 | | | | 416,069 | | | | 1,000 | | | | 417,069 | | | | 100 | | Isabelle Courville | | | 132,500 | | | | 133,056 | | | | - | | | | - | | | | - | | | | 1,000 | | | | 266,556 | | | | 317,769 | | | | 318,763 | | | | 1,000 | | | | 637,532 | | | | 50 | | Jill Denham | | | - | | | | 235,987 | | | | - | | | | - | | | | - | | | | 1,000 | | | | 236,987 | | | | 112,390 | | | | 263,063 | | | | 1,000 | | | | 376,453 | | | | 70 | | William Fatt | | | - | | | | 228,846 | | | | - | | | | - | | | | - | | | | 1,000 | | | | 229,846 | | Rebecca MacDonald | | | - | | | | 266,113 | | | | - | | | | - | | | | - | | | | 1,000 | | | | 267,113 | | Antonio Garza(4) | | | | 0 | | | | 201,270 | | | | 66,182 | | | | 267,452 | | | | 100 | | David Garza-Santos(4) | | | | 0 | | | | 201,270 | | | | 1,397 | | | | 202,667 | | | | 100 | | Edward Hamberger | | | | 0 | | | | 308,758 | | | | 1,350 | | | | 310,108 | | | | 100 | | Janet Kennedy(4) | | | | 0 | | | | 201,270 | | | | 41,888 | | | | 243,158 | | | | 100 | | Henry Maier(4) | | | | 0 | | | | 201,270 | | | | 41,871 | | | | 243,141 | | | | 100 | | Matthew Paull | | | - | | | | 326,824 | | | | - | | | | - | | | | - | | | | 1,000 | | | | 327,824 | | | | 0 | | | | 321,325 | | | | 1,350 | | | | 322,675 | | | | 100 | | Jane Peverett | | | - | | | | 255,391 | | | | - | | | | - | | | | - | | | | 1,000 | | | | 256,391 | | | | 214,076 | | | | 214,745 | | | | 1,000 | | | | 429,821 | | | | 50 | | Andrew Reardon | | | - | | | | 518,392 | | | | - | | | | - | | | | - | | | | 1,000 | | | | 519,392 | | Andrea Robertson | | | | 0 | | | | 375,804 | | | | 1,000 | | | | 376,804 | | | | 100 | | Gordon Trafton | | | - | | | | 308,410 | | | | - | | | | - | | | | - | | | | 1,000 | | | | 309,410 | | | | 155,000 | | | | 155,642 | | | | 1,350 | | | | 311,992 | | | | 50 | |
Ms. Courville elected to receive 50% of her annual director compensation in DDSUs with the remaining 50% paid in cash.
The value of the share-based awards has been calculated in accordance with Financial Accounting Standards Board Accounting Standards Codification Topic 718 (FASB ASC 718) using the grant date fair value.
•(1) | The value of the share-based awards has been calculated in accordance with Financial Accounting Standards Board Accounting Standards Codification Topic 718 (FASB ASC 718) using the grant date fair value, which is prescribed by the Directors’ Deferred Share Unit Plan. |
| (2) | All directors fees are initially determined in U.S. dollars. The value of director share-based awards, and cash and other payments, as applicable, is paid in their local currency. Ms. Kennedy and Messrs. Garza, Garza-Santos, Hamberger, Maier, Paull and Trafton were paid in U.S. dollars and their amounts have been converted to Canadian dollars using the 2023 average exchange rate of $1.3497. Ms. Courville, Denham, Peverett and Robertson and the Mr. Baird were paid in Canadian dollars based on the exchange rate on the grant date. |
| (3) | Each director was provided with a $1,000 donation in local currency (with exception of Mr. Garza-Santos whose payment was made in U.S. dollars) to the charity of their choice in December 20172023 in gratitude for their year of service. This amount appears underAll other compensation.compensation. |
| (4) | Messrs. Garza, Garza-Santos, and Maier and, Ms. Kennedy each joined the Board on June 15, 2023. |
| (5) | Prior to the Control Date, KCS paid group term life and accidental death and dismemberment premiums (AD&D) for Messrs. Garza, Garza-Santos and Maier, and Ms. Kennedy. In addition, they were provided a two-for-one match of eligible charitable contributions made (up to a maximum of U.S.$30,000). In addition, Mr. Garza was paid annual director fees of U.S.$36,000 by KCS’s wholly owned subsidiary, Kansas City Southern de Mexico, S.A. de C.V. (KCSM), for serving as Chairman of its board of directors. These amounts are detailed in the table below and have been converted to Canadian dollars using the 2023 average exchange rate of $1.3497. |
| | | | | | | | | | | | | | | | | | Name | | Group Term Life
Premiums | | | AD&D
Premiums | | | Charitable Matching
Gifts | | | KCSM Director Fees | | Antonio Garza | | | 40 | | | | 7 | | | | 16,196 | | | | 48,589 | | David Garza-Santos | | | 40 | | | | 7 | | | | 0 | | | | 0 | | Janet Kennedy | | | 40 | | | | 7 | | | | 40,491 | | | | 0 | | Henry Maier | | | 26 | | | | 4 | | | | 40,491 | | | | 0 | |
49
Mr. Paull, Mr. Reardon and Mr. Trafton were paid in U.S. dollars and theirIncentive plan awards Outstanding share-based awards have been converted to Canadian dollars using the 2017 average exchange rateand option-based awards The table below shows all vested and unvested equity incentive awards held by directors, that are outstanding as of $1.2986. The Governance Committee reviews director compensation every two to three years based on the directors’ responsibilities and time commitment and the compensation provided by comparable companies. In 2017 the committee completed a review of our director compensation program and based on its recommendation,On July 21, 2003, the Board amendedsuspended any additional grants of options under the director compensation program to pay allstock option plan. There are no outstanding options under that plan.
Non-employee directors fees in U.S. dollars instead ofare not granted stock options under the past practice of paying directors in their local currency. As a result, the Board approved that, effective January 1, 2018, each director will be paid an annual retainer of US$200,000. Committee chairs receive an additional US$30,000 per year and the Board Chair receives an annual retainer of US$395,000. No other changes were made to the director compensation program in 2017.Management Stock Option Incentive Plan. | | | | | | | | | | | | | | | Share-based awards | | | Name | | Number of
shares or units
of shares that
have not
vested (#) | | | Market or
payout value of
share-based
awards that
have not vested ($) | | | Market or payout
value of vested
share-based
awards not paid
out or distributed ($)(1) | | John Baird | | | - | | | | - | | | | 4,420,107 | | Isabelle Courville | | | - | | | | - | | | | 6,687,077 | | Jill Denham | | | - | | | | - | | | | 3,148,525 | | Antonio Garza | | | - | | | | - | | | | 270,403 | | David Garza-Santos | | | - | | | | - | | | | 270,403 | | Edward Hamberger | | | - | | | | - | | | | 1,725,194 | | Janet Kennedy | | | - | | | | - | | | | 270,403 | | Henry Maier | | | - | | | | - | | | | 270,403 | | Matthew Paull | | | - | | | | - | | | | 4,779,462 | | Jane Peverett | | | - | | | | - | | | | 3,182,145 | | Andrea Robertson | | | - | | | | - | | | | 1,689,338 | | Gordon Trafton | | | - | | | | - | | | | 3,138,060 | |
52
| (1) | Calculated based on the closing price of our shares on December 29, 2023 (the last trading day of the year) on the TSX ($104.84), in the case of directors resident in Canada, and on the NYSE (U.S.$79.06) which was converted to Canadian dollars using the year-end exchange rate of $1.3226, in the case of the directors resident in the U.S. and Mexico. |
50
ITEM 12. SECURITY OWNERSHIP OF CERTAIN BENEFICIAL OWNERS AND MANAGEMENT AND RELATED STOCKHOLDER MATTERS Equity Compensation Plan Information See Item 11 – “Executive Compensation—Equity Compensation Plan Information” for information regarding our equity compensation plans on page 46.42. Beneficial Ownership Table The table below sets forth the number and percentage of outstanding Shares of Common Stockcommon shares beneficially owned by each person, or group of persons, known by Canadian PacificCPKC based on publicly available information as of March 15, 2017,February 27, 2024, to own beneficially more than five percent of our Common Stock,common shares, each of our directors, each of our NEOs and all directors and executive officers as a group. Unless otherwise indicated in the table, the address of each of the individuals named below is c/o Canadian Pacific, 7550 Ogden Dale Road S.E., Calgary, Alberta, T2C 4X9.
| | | | | | | | | Name of Beneficial Owner | | Shares of Common Stock Beneficially Owned | | | Percent of Common Stock Outstanding | | John Baird(a)
| | | - | | | | - | | Isabelle Courville(a)
| | | 900 | | | | - | | Jill Denham(a)
| | | - | | | | - | | William Fatt(a)
| | | - | | | | - | | Rebecca MacDonald(a)
| | | - | | | | - | | Matthew Paull(a)
| | | 1,000 | | | | - | | Jane Peverett(a)
| | | - | | | | - | | Andrew Reardon(a)
| | | 4,031 | | | | - | | Gordon T. Trafton II(a)
| | | - | | | | - | | Keith Creel(b)
| | | 2,561 | | | | * | | Jeffrey Ellis(b)
| | | 360 | | | | * | | Robert Johnson(b)
| | | 300 | | | | * | | Laird Pitz(b)
| | | 52 | | | | * | | Nadeem Velani(b)
| | | 852 | | | | * | | All current executive officers and directors as a group
| | | 18,744 | | | | * | |
| | | | | | | | | | Name of beneficial owner | | Common shares beneficially owned | | | Percent of class | | John Baird(a) | | | 0 | | | | * | | Isabelle Courville(a) | | | 4,500 | | | | * | | Jill Denham(a) | | | 0 | | | | * | | Antonio Garza(a) | | | 12,828 | | | | * | | David Garza-Santos(a) | | | 10,411 | | | | * | | Edward Hamberger(a) | | | 0 | | | | * | | Janet Kennedy(a) | | | 7,944 | | | | * | | Henry Maier(a) | | | 26,206 | | | | * | | Matthew Paull(a) | | | 18,690 | | | | * | | Jane Peverett(a) | | | 0 | | | | * | | Andrea Robertson(a) | | | 0 | | | | * | | Gordon Trafton(a) | | | 0 | | | | * | | Keith Creel(a)(b)(c) | | | 2,100,513 | | | | * | | Nadeem Velani(b)(d) | | | 344,091 | | | | * | | John Brooks(b)(e) | | | 253,991 | | | | * | | Mark Redd(b)(f) | | | 162,230 | | | | * | | John Orr(b)(g) | | | 8,352 | | | | * | | TCI Fund Management Limited(i) | | | 55,514,385 | | | | 5.96 | % | All current executive officers and directors as a group (24 Persons) | | | 3,471,370 | | | | * | |
| * | Represents less than one percent of the outstanding Common Stock.common shares. |
| (a) | See Directors’ Profiles in “Item 10. Directors, Executive Officers and Corporate Governance” above for disclosure with respect to DDSUs. The address of each director is c/o Canadian Pacific, 7550 Ogden Dale Road S.E., Calgary, Alberta, T2C 4X9. |
| (b) | See “Compensation Details –- Deferred Compensation Plans” in Item 11. Executive Compensation, for disclosure with respect to NEO DSUs. The address of each executive officer is c/o Canadian Pacific, 7550 Ogden Dale Road S.E., Calgary, Alberta, T2C 4X9. |
| (c) | The common shares owned by Mr. Creel comprise (i) 2,003,895 shares issuable upon the exercise of stock options that have vested or will vest within the next 60 days and (ii) 96,618 shares held by Mr. Creel directly. |
| (d) | The common shares owned by Mr. Velani comprise (i) 339,795 shares issuable upon the exercise of stock options that have vested or will vest within the next 60 days and (ii) 4,296 shares held by Mr. Velani directly. |
| (e) | The common shares owned by Mr. Brooks comprise (i) 240,607 shares issuable upon the exercise of stock options that have vested or will vest within the next 60 days and (ii) 13,384 shares held by Mr. Brooks directly. |
| (f) | The common shares owned by Mr. Redd comprise (i) 137,888 shares issuable upon the exercise of stock options that have vested or will vest within the next 60 days and (ii) 24,342 shares held by Mr. Redd directly. |
| (g) | The common shares owned by Mr. Orr comprise (i) 7,891 shares issuable upon the exercise of stock options that have vested or will vest within the next 60 days and (ii) 461 shares held by Mr. Orr directly. Mr. Orr’s employment with the company terminated on March 19, 2024 and all unvested options were forfeited. |
| (h) | The common shares owned by all current executive officers and directors as a group comprise (i) 3,191,836 shares issuable upon the exercise of stock options that have vested or will vest within the next 60 days and (ii) 279,534 shares held directly. |
| (i) | Based upon statements in the Schedule 13G/A filed by TCI Fund Management Limited (“TCI Fund”) and Christopher Hohn on February 14, 2024, TCI Fund and Christopher Hohn have (i) shared voting power over 55,514,385 shares of CPKC’s common shares; and (ii) shared dispositive power of 55,514,385 common shares. The Children’s Investment Master Fund (“TCIF”) is the investment manager of TCI Fund and CIFF Capital UK LP (“CIFF”). Mr. Hohn, as managing director of TCIF, may be deemed to beneficially own the shares held by the TCI Fund and CIFF. The address of each of TCI Fund and Mr. Hohn is 7 Clifford Street, London W1S 2FT, United Kingdom. |
51
ITEM 13. CERTAIN RELATIONSHIPS AND RELATED TRANSACTIONS, AND DIRECTOR INDEPENDENCE Related party transactions Directors, officers and employees are required to report any related party transactions in accordance with CPKC policies. The Company considers its related party transactions obligation seriously and reviews related party transactions for all employees at the level of General Manager and above. Our accounting and legal departments work together to comply withreview any related party transactions reported by officers and employees. Our internal audit department validates the code.work done at the VP level and above. In 2017,2023, there were no transactions between CPthe Company and a related person as described in Item 404 of RegulationS-K, which defines aS-K. The Board reviews related person as: aparty transactions when it does its annual review of director nominated director or executive officer of CP
an immediate family member of a director, nominated director or executive officer, or
someone who beneficially owns more than 5% of our shares or a member of their immediate family.
independence. Any director who has a material interest in a transaction or agreement involving CPthe Company must disclose the interest to the CEO and the ChairmanChair of the Board immediately and does not participate in any discussions or votes on the matter. The Board reviews related party transactions when it does its annual review of director independence. Our accounting and legal departments review any related party transactions reported by officers and employees.
53
Independence The Board has adopted standards for director independence based on the criteria of the NYSE, SEC and CSA. ItThe Board reviews director independence continually and annually using director questionnaires as well as by reviewing updated biographical information, meeting with directors individually, and conducting a comprehensive assessment of all business and other relationships and interests of each director with respect to CPthe Company and our subsidiaries. In 20172023, the Board determinedconfirmed that each director, except for Mr. Creel, is independent in accordance with the standards for independence established by the NYSE andNI 58-101 Disclosure of Corporate Governance Practices. the CSA. Mr. Creel is not independent because of his position as President and Chief Executive Officer of CP.CEO.
The Board has also determinedconfirmed that each member of the audit committeeAudit and Finance Committee meets the additional independence standards for audit committee members under the NYSE, Section 10A(m)(3) andRule 10A-3(b)(1) of the Exchange Act, andNI Section 1.5 of National Instrument 52-110Audit Committees.Committees. All members of the Audit and Finance Committee are financially literate. In addition, four of the six members of the currently constituted Audit and Finance Committee meet the definition of audit committee financial expert, as defined by the SEC. 52
ITEM 14. PRINCIPAL ACCOUNTING FEES AND SERVICES The table below shows the fees we paid to DeloitteEY in 20172023 and 20162022 for audit andnon-audit services. Representatives of EY will participate at the Annual General Meeting and will have an opportunity to make a statement and respond to any questions from shareholders. | | | | | | | | | | For the year ended December 31 | | 2017 | | | 2016 | | Audit fees | | $ | 3,834,100 | | | $ | 2,398,500 | | | for audit of our annual financial statements, reviews of quarterly reports and services relating to statutory and regulatory filings or engagements (including attestation services and audit of financial statements of certain subsidiaries and certain pension and benefits plans, and advice on accounting and/or disclosure matters) | | | | | | | | | Audit-related fees | | $ | 21,000 | | | $ | 289,800 | | | for assurance and services related to the audit but not included in the audit fees above, including securities filings, compliance review of third-party agreements, refinancing of subsidiary companies and accounting training | | | | | | | | | Tax fees | | $ | 153,100 | | | $ | 147,000 | | | for services relating to tax compliance, tax planning and tax advice and access fees for taxation database resources | | | | | | | | | All other fees | | $ | 34,600 | | | $ | 26,100 | | | for services provided relating to CP’s corporate sustainability report | | | | | | | | | Total | | $ | 4,042,800 | | | $ | 2,861,400 | |
| | | | | | | | | | For the year ended December 31 | | 2023 | | | 2022 | | Audit fees for audit of our annual financial statements, reviews of quarterly reports and services relating to statutory and regulatory filings or engagements (including attestation services and audit or interim review of financial statements of certain subsidiaries and certain pension and benefits plans, and advice on accounting and/or disclosure matters) | | $ | 6,190,800 | | | $ | 3,404,000 | | Audit-related fees for services related to the audit but not included in the audit fees above, including securities filings | | $ | 153,100 | | | $ | — | | Tax fees for services relating to tax compliance, tax planning and tax advice | | $ | 1,389,000 | | | $ | — | | All other fees | | $ | — | | | $ | — | | Total | | $ | 7,732,900 | | | $ | 3,404,000 | |
Pre-approval of audit services and fees The audit committeeAudit and Finance Committee has a written policy forpre-approving audit andnon-audit services by the independentexternal auditor and their fees, in accordance with the applicable laws and requirements of stock exchanges and securities regulatory authorities. The policy sets out the following governance procedures: the audit committeepre-approves| • | | The Audit and Finance Committee pre-approves the terms of the annual engagement of the external auditor the Boardpre-approves the fees for the annual engagement of the external auditor.
|
| • | | The Audit and Finance Committee is responsible for pre-approving annual audit and non-audit services, as well as pre-approving the external auditor’s compensation for audit and non-audit services. |
The Senior Vice-President, Accounting, Planning and budgeted amounts for the audit andnon-audit services at least annually the controllerProcurement submits reports at least quarterly to the audit committeeAudit and Finance Committee listing the services that were performed or planned to be performed by the external auditorauditor.
any additionalnon-audit services to be provided by the external auditor that were not included in the list ofpre-approved services or exceed the budgeted amount by more than 10% must each bepre-approved by the audit committee| • | | Any additional services to be provided by the external auditor that were not included in the list of pre-approved services or any services to be performed that will exceed the budgeted amount by more than 10 percent must each be pre-approved by the Audit and Finance Committee or the committee chair. The committee chair must report any additional pre-approvals at the next committee meeting. |
The committee chair must report any additionalpre-approvals at the next committee meeting the audit committeeAudit and Finance Committee reviews the policy as necessary to make sure it continues to reflect our needsneeds.
ourOur chief internal auditor monitors compliance with the policy. The audit committeeAudit and Finance Committee or committee chair must be satisfied that any services itpre-approves will not compromise the independence of the external auditor. The committeepre-approved all services performed by the external auditor in 2017,2023, in accordance with the policy. 5453
PART IV
PART IV ITEM 15. | EXHIBITS, FINANCIAL STATEMENT SCHEDULE |
ITEM 15. EXHIBITS, FINANCIAL STATEMENT SCHEDULE Part IV (Item 15) of the 20172023 Form 10-K is hereby amended solely to add the following exhibits required to be filed in connection with this Amendment No. 1.1 (b) Exhibits Exhibits are listed in the exhibit index below. | * | Filed with this Amendment No. 1 on Form 10-K/A |
ITEM 16. Form 10-K Summary 55Not applicable.
54
SIGNATURES Pursuant to the requirements of Section 13 or 15(d) of the Securities Exchange Act of 1934, the Company has duly caused this report to be signed on its behalf by the undersigned, thereunto duly authorized. | | | | CANADIAN PACIFIC RAILWAY LIMITED | | (Registrant) | | | | By: | | /s/ KEITH CREEL | | | Keith Creel | | | Chief Executive Officer |
Dated: April 5, 201826, 2024 Pursuant to the requirements of the Securities Exchange Act of 1934, this report has been signed below by the following persons on behalf of the Company and in the capacities indicated on April 5, 2018.26, 2024. | | | | Signature | | Title | | | * Keith Creel
| | President, Chief Executive Officer and Director (Principal (Principal Executive Officer) | | Keith Creel | | | /s/ NADEEM VELANI
Nadeem Velani*
| | Executive Vice-President and Chief Financial Officer (Principal (Principal Financial Officer and Principal Accounting Officer) | | Nadeem Velani | | | * Andrew F. Reardon
| | ChairmanChair of the Board of Directors | | Isabelle Courville | | | * John R. Baird
| | Director | | John R. Baird | | | * Isabelle Courville
| | Director | | Edward R. Hamberger | | | * Gillian H. Denham
| | Director | | Matthew H. Paull | | | * Rebecca MacDonald
| | Director | | Jane L. Peverett | | | * Matthew H. Paull
| | Director | | Andrea Robertson | | | * Jane L. Peverett
| | Director | | Gordon T. Trafton | | | * Gordon T. Trafton II
| | Director | | Antonio Garza | | | * | | Director | | Janet Kennedy | | | * | | Director | | Henry Maier |
| | | | *By: | | /s/ NADEEM VELANI | | | Nadeem Velani | | | Attorney-in-Fact |
5655
|
|