UNITED STATES
SECURITIES AND EXCHANGE COMMISSION
Washington, D.C. 20549
| FORM | 10-K | ||||
| ☒ | ANNUAL REPORT PURSUANT TO SECTION 13 OR 15(d) OF THE SECURITIES EXCHANGE ACT OF 1934 | |||||||
For the fiscal year ended December 31, 20202023
or
| ☐ | TRANSITION REPORT PURSUANT TO SECTION 13 OR 15(d) OF THE SECURITIES EXCHANGE ACT OF 1934 | |||||||
For the transition period fromto
Commission file number001-15254

ENBRIDGE INC.
(Exact Name of Registrant as Specified in Its Charter)
| Canada | 98-0377957 | |||||||
(State or Other Jurisdiction of Incorporation or Organization) | (I.R.S. Employer Identification No.) | |||||||
200, 425 - 1st Street S.W.
Calgary, Alberta, Canada T2P 3L8
(Address of Principal Executive Offices) (Zip Code)
(403) 231-3900
(Registrant’s telephone number, including area code (403)231-3900Telephone Number, Including Area Code)
Securities registered pursuant to Section 12(b) of the Act:
Title of each class | Trading Symbol(s) | Name of each exchange on which registered | ||||||||
Common Shares | ENB | New York Stock Exchange | ||||||||
Securities registered pursuant to Section 12(g) of the Act: None
Indicate by check mark if the registrant is a well-known seasoned issuer, as defined in Rule 405 of the Securities Act. Yes
☒
No ☐
Indicate by check mark if the registrant is not required to file reports pursuant to Section 13 or Section 15(d) of the Act. Yes
☐
No ☒
Indicate by check mark whether the registrant (1) has filed all reports required to be filed by Section 13 or 15(d) of the Securities Exchange Act of 1934 during the preceding 12 months (or for such shorter period that the registrant was required to file such reports), and (2) has been subject to such filing requirements for the past 90 days. Yes
☒
No ☐
Indicate by check mark whether the registrant has submitted electronically every Interactive Data File required to be submitted pursuant to Rule 405 of Regulation(§ (§232.405 of this chapter) during the preceding 12 months (or for such shorter period that the registrant was required to submit such files). Yes
S-T
☒
No ☐
Indicate by check mark whether the registrant is a large accelerated filer, an accelerated filer, a or a smaller reporting company, or an emerging growth company. See the definitions of “large accelerated filer,” “accelerated filer”, “smaller reporting company”company,” and “emerging"emerging growth company”company" in Rule
non-accelerated
filer,12b-2
of the Exchange Act.| Large accelerated filer | ☒ | Accelerated filer | ☐ | |||||||||||||
| ☐ | ||||||||||||||||
| Smaller reporting company | ☐ | |||||||||||||||
| Emerging growth company | ☐ | |||||||||||||||
If an emerging growth company, indicate by check mark if the registrant has elected not to use the extended transition period for complying with any new or revised financial accounting standards provided pursuant to Section 13(a) of the Exchange Act.
☐
Indicate by check mark whether the registrant has filed a report on and attestation to its management’smanagement's assessment of the effectiveness of its internal control over financial reporting under Section 404(b) of the Sarbanes-Oxley Act (15 U.S.C. 7262(b)) by the registered public accounting firm that prepared or issued its audit report. Yes
☒
No ☐If securities are registered pursuant to Section 12(b) of the Act, indicate by check mark whether the financial statements of the registrant included in the filing reflect the correction of an error to previously issued financial statements. ☒
Indicate by check mark whether any of those error corrections are restatements that required a recovery analysis of incentive-based compensation received by any of the registrant's executive officers during the relevant recovery period pursuant to § 240.10D-1(b). ☐
Indicate by check mark whether the registrant is a shell company (as defined in Rule 12b-2 of the Exchange Act). Yes ☐ No ☒
The aggregate market value of the registrant’s common shares held by2020,2023, was approximately US$59.275.1 billion.
non-affiliates
computed by reference to the price at which the common equity was last sold on June 30, As at February 5, 2021,2, 2024, the registrant had 2,025,495,6032,125,586,356 common shares outstanding.
DOCUMENTS INCORPORATED BY REFERENCE:
Not applicable.
EXPLANATORY NOTE
Enbridge Inc., a corporation existing under the, qualifies as a foreign private issuer in the United States (US) for purposes of the Securities Exchange Act of 1934, as amended (the “Exchange Act”)Exchange Act). Although, as a foreign private issuer, Enbridge Inc. is not required to do so, Enbridge Inc. currently files annual reports on Form(“SEC”)(SEC) instead of filing the reporting forms available to foreign private issuers.
Canada Business Corporations Act
10-K,
quarterly reports on Form10-Q,
and current reports on Form8-K
with the Securities and Exchange Commission Enbridge Inc. preparesintends to prepare and filesfile a management proxyinformation circular and related material under Canadian requirements. As Enbridge Inc.’s management proxyinformation circular is not filed pursuant to Regulation 14A, Enbridge Inc. may not incorporate by reference information required by Part III of itsthis Formproxyinformation circular.
10-K
from its management 10-K,
Enbridge Inc. | PAGE | |||||||||||||
| PART I | |||||||||||||
| Item 1. | |||||||||||||
| Item 1A. | |||||||||||||
| Item 1B. | |||||||||||||
| Item 1C. | |||||||||||||
| Item 2. | |||||||||||||
| Item 3. | |||||||||||||
| Item 4. | |||||||||||||
| PART II | |||||||||||||
| Item 5. | |||||||||||||
| Item 6. | |||||||||||||
| Item 7. | |||||||||||||
| Item 7A. | |||||||||||||
| Item 8. | |||||||||||||
| Item 9. | |||||||||||||
| Item 9A. | |||||||||||||
| Item 9B. | |||||||||||||
| Item 9C. | |||||||||||||
| PART III | |||||||||||||
| Item 10. | |||||||||||||
Item 11. | |||||||||||||
Item 12. | |||||||||||||
Item 13. | |||||||||||||
Item 14. | |||||||||||||
| PART IV | |||||||||||||
| Item 15. | |||||||||||||
Item 16. | |||||||||||||
| Signatures | |||||||||||||
3
Pamela L. Carter  Age 71 Franklin, Tennessee, USA Independent Director since February 27, 2017 Latest date of retirement May 2025 2020 annual meeting votes for: 85.23% | Ms. Carter was the Vice President of Cummins Inc. and President of Cummins Distribution Business, a division of Cummins Inc., a designer, manufacturer and marketer of diesel engines and related components and power systems, from 2008 until her retirement in 2015. Ms. Carter joined Cummins Inc. in 1997 as Vice President – General Counsel and Corporate Secretary and held various management positions within Cummins. Prior to joining Cummins Inc., Ms. Carter served in the private practice of law as partner and associate and in various capacities with the State of Indiana, including Parliamentarian in the Indiana House of Representatives, Deputy Chief-of-Staff to governor Evan Bayh, Executive Assistant for Health Policy & Human Services and Securities Enforcement Attorney for the Office of the Secretary of State. She served as the Attorney General for the State of Indiana from 1993 to 1997 and was the first African-American woman to be elected state attorney general in the U.S.A. Ms. Carter holds a BA (Bachelor of Arts) from the University of Detroit, MSW (Master of Social Work) from the University of Michigan, J.D. (Doctor of Jurisprudence) from McKinney School of Law, Indiana University, and Public Administration from Harvard Kennedy School. Ms. Carter received a 2018 Sandra Day O’Connor Board Excellence Award honoring her for her demonstrated commitment to board excellence and diversity. She also received an award as one of the top 100 board members from NACD in 2018 and top 25 director from Black Enterprise, 2018. | |||||||||||||||||
Enbridge Board/Board committee memberships | 2020 meeting attendance 1 | |||||||||||||||||
Board of Directors | 6 out of 6 | 100% | ||||||||||||||||
| Corporate Social Responsibility | 4 out of 4 | 100% | ||||||||||||||||
| Governance (Chair) | 3 out of 4 | 75% | ||||||||||||||||
Human Resources & Compensation 2 | 2 out of 2 | 100% | ||||||||||||||||
Total | 15 out of 16 | 94% | ||||||||||||||||
Enbridge securities held 3 | ||||||||||||||||||
Enbridge shares | DSUs 4 | Total market value of Enbridge shares & DSUs 5 | Minimum required 6 | |||||||||||||||
44,639 | 11,744 | $2,494,943 | $925,880 | |||||||||||||||
Other board/board committee memberships 7 | ||||||||||||||||||
Public 7 | ||||||||||||||||||
Hewlett Packard Enterprise Company (public technology company) | Director Chair, human resources and compensation committee Member, audit committee | |||||||||||||||||
Broadridge Financial Solutions, Inc. (public financial services company) | Director Chair, audit committee Member, governance and nominating committee | |||||||||||||||||
Former U.S.-listed company directorships (last 5 years) | ||||||||||||||||||
CSX Corporation | ||||||||||||||||||
Spectra Energy Corp | ||||||||||||||||||
Marcel R. Coutu  Age 67 Calgary, Alberta, Canada Independent Director since July 28, 2014 Latest date of retirement May 2029 2020 annual meeting votes for: 89.05% | Mr. Coutu was the Chairman of Syncrude Canada Ltd. (integrated oil sands project) from 2003 to 2014 and was the President and Chief Executive Officer of Canadian Oil Sands Limited from 2001 until January 2014. From 1999 to 2001, he was Senior Vice President and Chief Financial Officer of Gulf Canada Resources Limited. Prior to 1999, Mr. Coutu held various executive positions with TransCanada PipeLines Limited and various positions in the areas of corporate finance, investment banking and mining and oil and gas exploration and development. Mr. Coutu holds an HBSc (Bachelor of Science, Honours Earth Science) from the University of Waterloo and an MBA (Master of Business Administration) from the University of Western Ontario. | |||||||||||||||||
Enbridge Board/Board committee memberships | 2020 meeting attendance 1 | |||||||||||||||||
Board of Directors | 5 out of 6 | 83% | ||||||||||||||||
Audit, Finance & Risk | 5 out of 5 | 100% | ||||||||||||||||
Human Resources & Compensation | 4 out of 4 | 100% | ||||||||||||||||
Total | 14 out of 15 | 93% | ||||||||||||||||
Enbridge securities held 3 | ||||||||||||||||||
Enbridge shares | DSUs 4 | Total market value of Enbridge shares & DSUs 5 | Minimum required 6 | |||||||||||||||
46,900 | 39,090 | $3,805,069 | $925,880 | |||||||||||||||
Other board/board committee memberships 7 | ||||||||||||||||||
Public 7 | ||||||||||||||||||
Brookfield Asset Management Inc. (public global asset management company) | Director Chair, audit committee Member, management resources and compensation committee | |||||||||||||||||
Power Corporation of Canada (public international management and holding company) | Director Member, audit committee and human resources committee | |||||||||||||||||
The Great-West Lifeco Inc. (public international financial services holding company that is an indirect subsidiary of Power Corporation of Canada) | Director Member, governance and nominating committee, human resources committee and investment committee | |||||||||||||||||
IGM Financial Inc. (public personal financial services company that is an indirect subsidiary of Power Corporation of Canada) | Director Member, human resources committee | |||||||||||||||||
Not-for-profit 7 | ||||||||||||||||||
Calgary Stampede Foundation | Director | |||||||||||||||||
Susan M. Cunningham  Age 65 Houston, Texas, USA Independent Director since February 13, 2019 Latest date of retirement May 2031 2020 annual meeting votes for: 97.37% | Ms. Cunningham has been an Advisor for Darcy Partners (consulting firm) since 2017. From 2014 to 2017, Ms. Cunningham was Executive Vice President, EHSR (Environment, Health, Safety, Regulatory) and New Frontiers (global exploration, new ventures, geoscience and business innovation) at Noble Energy, Inc. From 2001 to 2013, she held various senior management roles with Noble Energy, Inc. Prior thereto, Ms. Cunningham held positions with Texaco U.S.A., Statoil Energy, Inc. and Amoco Corporation. Ms. Cunningham holds a BA in Geology and Geography from McMaster University and is a graduate of Rice University’s Executive Management Program. She was also Chairman of the OTC (Offshore Technology Conference) from 2010 to 2011. | |||||||||||||||||
Enbridge Board/Board committee memberships | 2020 meeting attendance 1 | |||||||||||||||||
Board of Directors | 6 out of 6 | 100% | ||||||||||||||||
Corporate Social Responsibility (Chair) 8 | 2 out of 2 | 100% | ||||||||||||||||
Human Resources & Compensation | 4 out of 4 | 100% | ||||||||||||||||
Safety & Reliability | 4 out of 4 | 100% | ||||||||||||||||
Total | 16 out of 16 | 100% | ||||||||||||||||
Enbridge securities held 3 | ||||||||||||||||||
Enbridge shares | DSUs 4 | Total market value of Enbridge shares & DSUs 5 | Minimum required 6 | |||||||||||||||
2,581 | 7,827 | $460,564 | $925,880 | |||||||||||||||
Other board/board committee memberships 7 | ||||||||||||||||||
Public 7 | ||||||||||||||||||
Oil Search Limited (public oil and gas exploration and production) | Director Member, audit and financial risk committee, sustainability committee and project and technology committee | |||||||||||||||||
Whiting Petroleum Corporation (public oil and gas exploration and production) | Director Chair, ESG committee Member, audit committee | |||||||||||||||||
Gregory L. Ebel  Age 56 Houston, Texas, USA Independent Director since February 27, 2017 Latest date of retirement May 2039 2020 annual meeting votes for: 91.77% | Mr. Ebel served as Chairman, President and Chief Executive Officer of Spectra Energy Corp (“Spectra Energy”) from January 1, 2009 to February 27, 2017 at which time he became a Director of Enbridge and Chair of the Enbridge Board. Prior to that time, Mr. Ebel served as Spectra Energy’s Group Executive and Chief Financial Officer beginning in January 2007. He served as President of Union Gas Limited from January 2005 until January 2007, and Vice President, Investor & Shareholder Relations of Duke Energy Corporation from November 2002 until January 2005. Mr. Ebel joined Duke Energy in March 2002 as Managing Director of Mergers and Acquisitions in connection with Duke Energy’s acquisition of Westcoast Energy Inc. Mr. Ebel holds a BA (Bachelor of Arts, Honours) from York University and is a graduate of the Advanced Management Program at the Harvard Business School. | |||||||||||||||||||||
Enbridge Board/Board committee memberships 9 | 2020 meeting attendance 1 | |||||||||||||||||||||
Board of Directors (Chair) | 6 out of 6 | 100% | ||||||||||||||||||||
Total | 6 out of 6 | 100% | ||||||||||||||||||||
Enbridge securities held 3 | ||||||||||||||||||||||
Enbridge shares | DSUs 4 | Stock Options 10 | Total market value of Enbridge shares & DSUs (excluding stock options) 5 | Minimum required 6 | ||||||||||||||||||
651,845 | 32,217 | 405,408 | $30,269,732 | $925,880 | ||||||||||||||||||
Other board/board committee memberships 7 | ||||||||||||||||||||||
Public 7 | ||||||||||||||||||||||
The Mosaic Company (public producer and marketer of concentrated phosphate and potash) | Chair of the Board Member, audit committee and corporate governance and nominating committee | |||||||||||||||||||||
Baker Hughes Company (public supplier of oilfield services and products) | Director Chair, audit committee Member, governance and corporate responsibility committee | |||||||||||||||||||||
Former U.S.-listed company directorships (last 5 years) | ||||||||||||||||||||||
Spectra Energy Corp | ||||||||||||||||||||||
J. Herb England  Age 74 Naples, Florida, USA Independent Director since January 1, 2007 Latest date of retirement May 2022 2020 annual meeting votes for: 96.74% | Mr. England has been Chair & Chief Executive Officer of Stahlman-England Irrigation Inc. (contracting company) in southwest Florida since 2000. From 1993 to 1997, Mr. England was the Chair, President & Chief Executive Officer of Sweet Ripe Drinks Ltd. (fruit beverage manufacturing company). Prior to 1993, Mr. England held various executive positions with John Labatt Limited (brewing company) and its operating companies, including the position of Chief Executive Officer of Labatt Brewing Company – Prairie Region (brewing company), Catelli Inc. (food manufacturing company) and Johanna Dairies Inc. (dairy company). In 1993, Mr. England retired as Senior Vice President, Finance and Corporate Development & Chief Financial Officer of John Labatt Limited. Mr. England holds a BA (Bachelor of Arts) from the Royal Military College of Canada and an MBA (Master of Business Administration) from York University. He also has a CA (Chartered Accountant) designation. | |||||||||||||||||
Enbridge Board/Board committee memberships | 2020 meeting attendance 1 | |||||||||||||||||
Board of Directors | 6 out of 6 | 100% | ||||||||||||||||
Audit, Finance & Risk | 5 out of 5 | 100% | ||||||||||||||||
Corporate Social Responsibility 11 | 2 out of 2 | 100% | ||||||||||||||||
Governance | 4 out of 4 | 100% | ||||||||||||||||
Total | 17 out of 17 | 100% | ||||||||||||||||
Enbridge securities held 3 | ||||||||||||||||||
Enbridge shares | DSUs 4 | Total market value of Enbridge shares & DSUs 5 | Minimum required 6 | |||||||||||||||
37,306 | 86,576 | $5,481,792 | $925,880 | |||||||||||||||
Other board/board committee memberships 7 | ||||||||||||||||||
Public 7 | ||||||||||||||||||
FuelCell Energy, Inc. (public fuel cell company in which Enbridge holds a small interest) | Chair of the Board Member, audit and finance committee and nominating and governance committee | |||||||||||||||||
Private 7 | ||||||||||||||||||
Stahlman - England Irrigation Inc. (private contracting company) | Chair of the Board Chief executive officer | |||||||||||||||||
USA Grading Inc. (private excavating, grading and underground utilities company) | Director | |||||||||||||||||
Former U.S.-listed company directorships (last 5 years) | ||||||||||||||||||
Enbridge Energy Management, LLC | ||||||||||||||||||
Gregory J. Goff  Age 64 San Antonio, Texas, USA Independent Director since February 11, 2020 Latest date of retirement May 2032 2020 annual meeting votes for: 99.57% | Mr. Goff was Executive Vice Chairman of Marathon Petroleum Corporation from October 2018 until his retirement in December 2019. He was President and Chief Executive Officer of Andeavor (an integrated downstream energy company) from 2010 to 2018 and Chairman from December 2014 to 2018. Prior thereto, Mr. Goff held a number of senior leadership positions with ConocoPhillips Corporation (an oil and gas exploration and production company). Mr. Goff holds a B.S. (Bachelor of Science) and an MBA (Master of Business Administration) from the University of Utah. | |||||||||||||||||
Enbridge Board/Board committee memberships | 2020 meeting attendance 1 | |||||||||||||||||
Board of Directors | 6 out of 6 | 100% | ||||||||||||||||
Governance 12 | 2 out of 2 | 100% | ||||||||||||||||
Human Resources & Compensation 12 | 2 out of 2 | 100% | ||||||||||||||||
Total | 10 out of 10 | 100% | ||||||||||||||||
Enbridge securities held 3 | ||||||||||||||||||
| | Enbridge shares | DSUs 4 | Total market value of Enbridge shares & DSUs 5 | Minimum required 6 | ||||||||||||||
- | 3,644 | $161,230 | $925,880 | |||||||||||||||
Other board/board committee memberships 7 | ||||||||||||||||||
Public 7 | ||||||||||||||||||
Avient Corporation (formerly PolyOne Corporation) (public company producing specialty polymers) | Director Chair, EHS committee Member, governance and corporate responsibility committee | |||||||||||||||||
V. Maureen Kempston Darkes  Age 72 Toronto, Ontario, Canada Lauderdale-by-the-Sea, Florida, USA Independent Director since November 2, 2010 Latest date of retirement May 2024 2020 annual meeting votes for: 97.25% | Ms. Kempston Darkes is the retired Group Vice President and President Latin America, Africa and Middle East, General Motors Corporation (automotive corporation and vehicle manufacturer). From 1994 to 2001, she was the President and General Manager of General Motors of Canada Limited and Vice President of General Motors Corporation. Ms. Kempston Darkes holds a BA (Bachelor of Arts) and an LLB (Bachelor of Laws), both from the University of Toronto. | |||||||||||||||||
Enbridge Board/Board committee memberships | 2020 meeting attendance 1 | |||||||||||||||||
Board of Directors | 6 out of 6 | 100% | ||||||||||||||||
Corporate Social Responsibility 13 | 2 out of 2 | 100% | ||||||||||||||||
Human Resources & Compensation (Chair) | 4 out of 4 | 100% | ||||||||||||||||
Safety & Reliability | 4 out of 4 | 100% | ||||||||||||||||
Total | 16 out of 16 | 100% | ||||||||||||||||
Enbridge securities held 3 | ||||||||||||||||||
| | Enbridge shares | DSUs 4 | Total market value of Enbridge shares & DSUs 5 | Minimum required 6 | ||||||||||||||
21,735 | 57,789 | $3,518,945 | $925,880 | |||||||||||||||
Other board/board committee memberships 7 | ||||||||||||||||||
Public 7 | ||||||||||||||||||
Brookfield Asset Management Inc. (public global asset management company) | Director Chair, risk management committee Member, management resources and compensation committee | |||||||||||||||||
Canadian National Railway Company 14 (public railway company) | Director Chair, strategic planning committee Member, audit committee, finance committee and pension and investment committee | |||||||||||||||||
Former U.S.-listed company directorships (last 5 years) | ||||||||||||||||||
| | Schlumberger Limited | | | |||||||||||||||
Teresa S. Madden  Age 65 Boulder, Colorado, USA Independent Director since February 12, 2019 Latest date of retirement May 2031 2020 annual meeting votes for: 98.59% | Ms. Madden was the Executive Vice President and Chief Financial Officer of Xcel Energy, Inc., an electric and natural gas utility, from 2011 until her retirement in 2016. She joined Xcel in 2003 as Vice President, Finance, Customer & Field Operations and was named Vice President and Controller in 2004. Prior thereto, Ms. Madden held positions with Rogue Wave Software, Inc. as well as New Century Energies and Public Service Company of Colorado, predecessor companies of Xcel Energy. Ms. Madden holds a BS (Bachelor of Science) in Accounting from Colorado State University and an MBA (Master of Business Administration) from Regis University. | |||||||||||||||||
Enbridge Board/Board committee memberships | 2020 meeting attendance 1 | |||||||||||||||||
Board of Directors | 6 out of 6 | 100% | ||||||||||||||||
| Audit, Finance & Risk (Chair) | 5 out of 5 | 100% | ||||||||||||||||
| Governance | 4 out of 4 | 100% | ||||||||||||||||
Total | 15 out of 15 | 100% | ||||||||||||||||
Enbridge securities held 3 | ||||||||||||||||||
| | Enbridge shares | DSUs 4 | Total market value of Enbridge shares & DSUs 5 | Minimum required 6 | ||||||||||||||
1,000 | 7,934 | $395,338 | $925,880 | |||||||||||||||
Other board/board committee memberships 7 | ||||||||||||||||||
Public 7 | ||||||||||||||||||
The Cooper Companies, Inc. (public medical device company) | Director Member, audit committee | |||||||||||||||||
| | Former U.S.-listed company directorships (last 5 years) | | ||||||||||||||||
| | Peabody Energy Corp. | | | |||||||||||||||
Al Monaco  Age 61 Calgary, Alberta, Canada Not Independent Director since February 27, 2012 Latest date of retirement May 2035 2020 annual meeting votes for: 97.99% | Mr. Monaco joined Enbridge in 1995 and has held increasingly senior positions. He has been President & Chief Executive Officer of Enbridge since October 1, 2012 and served as Director and President of Enbridge from February 27, 2012 to September 30, 2012. Mr. Monaco holds an MBA (Master of Business Administration) from the University of Calgary and has a Chartered Professional Accountant designation. | |||||||||||||||||
Enbridge Board/Board committee memberships 15 | 2020 meeting attendance 1 | |||||||||||||||||
Board of Directors | 6 out of 6 | 100% | ||||||||||||||||
Enbridge securities held 3 | ||||||||||||||||||
Enbridge shares | Stock Options | Total market value of Enbridge shares (excluding stock options) 5 | Minimum required 16 | |||||||||||||||
920,699 | 4,465,600 | $40,740,931 | N/A | |||||||||||||||
Other board/board committee memberships 7 | ||||||||||||||||||
Public 7 | ||||||||||||||||||
Weyerhaeuser Company (public timberlands company and wood products manufacturer) | Director Member, compensation committee | |||||||||||||||||
Private 7 | ||||||||||||||||||
DCP Midstream, LLC (a private 50/50 joint venture between Enbridge and Phillips 66 and the general partner of DCP Midstream GP, LLC, the general partner of DCP Midstream GP, LP, the general partner of DCP Midstream Partners, LP, a midstream master limited partnership with public unitholders) | Director Member, human resources and compensation committee | |||||||||||||||||
Not-for-profit 7 | ||||||||||||||||||
American Petroleum Institute (not-for-profit | Director Member, executive committee and finance committee | |||||||||||||||||
Business Council of Canada (not-for-profit, non-partisan organization composed of CEOs of Canada’s leading enterprises) | Member | |||||||||||||||||
Business Council of Alberta | Member | |||||||||||||||||
U.S. National Petroleum Council | Member | |||||||||||||||||
Catalyst Canada Advisory Board | Member | |||||||||||||||||
Stephen S. Poloz  Age 65 Ottawa, Ontario, Canada Independent Director since June 4, 2020 Latest date of retirement May 2031 | Mr. Poloz was Governor of the Bank of Canada from June 3, 2013 until completion of his seven-year term on June 2, 2020. He also served as Chairman for the Board of Directors of the Bank and a member of the Board of Directors of the Bank for International Settlements (BIS). Mr. Poloz held a number of senior positions with the Bank prior thereto. Mr. Poloz served as managing editor of The International Bank Credit Analyst, the flagship publication of BCA Research and is the former President & Chief Executive Officer of Export Development Canada. Mr. Poloz holds a BA (Bachelor of Arts) (Honours) from Queen’s University and MA (Master of Arts) (Economics) and PhD (Doctor of Philosophy) (Economics), both from the University of Western Ontario. He is a Certified International Trade Professional and a graduate of Columbia University’s Senior Executive Program. | |||||||||||||||||
Enbridge Board/Board committee memberships | 2020 meeting attendance 1 | |||||||||||||||||
Board of Directors 17 | 3 out of 3 | 100% | ||||||||||||||||
Audit, Finance & Risk 17 | 2 out of 2 | 100% | ||||||||||||||||
Safety & Reliability 17 | 1 out of 1 | 100% | ||||||||||||||||
Total | 6 out of 6 | 100% | ||||||||||||||||
Enbridge securities held 3 | ||||||||||||||||||
Enbridge shares | DSUs 4 | Total market value of Enbridge shares & DSUs 5 | Minimum required 6 | |||||||||||||||
- | 2,676 | $118,398 | $925,880 | |||||||||||||||
Other board/board committee memberships 7 | ||||||||||||||||||
Public 7 | ||||||||||||||||||
CGI Inc. (public IT and business consulting services company) | Director Member, audit and risk management committee | |||||||||||||||||
Dan C. Tutcher  Age 72 Houston, Texas, USA Independent Director since May 3, 2006 Latest date of retirement May 2024 2020 annual meeting votes for: 97.81% | Mr. Tutcher is on the Board of Directors of Gulf Capital Bank, where he is Chairman of Governance Committee. Mr. Tutcher was Managing Director, Public Securities on the Energy Infrastructure Equities team for Brookfield’s Public Securities Group from October 2018 until February 2021. Prior to joining Brookfield in 2018, Mr. Tutcher was President & Chair of the Board of Trustees of Center Coast MLP & Infrastructure Fund since 2013 and a Principal in Center Coast Capital Advisors L.P. since its inception in 2007. He was the Group Vice President, Transportation South of Enbridge, as well as President of Enbridge Energy Company, Inc. (general partner of former Enbridge sponsored affiliate Enbridge Energy Partners, L.P.) and Enbridge Energy Management, L.L.C. (another former Enbridge sponsored vehicle) from May 2001 until May 1, 2006. From 1992 to May 2001, he was the Chair of the Board of Directors, President & Chief Executive Officer of Midcoast Energy Resources, Inc. Mr. Tutcher holds a BBA (Bachelor of Business Administration) from Washburn University. | |||||||||||||||||
Enbridge Board/Board committee memberships | 2020 meeting attendance 1 | |||||||||||||||||
Board of Directors | 6 out of 6 | 100% | ||||||||||||||||
| Corporate Social Responsibility | 3 out of 4 | 75% | ||||||||||||||||
| Safety & Reliability (Chair) | 3 out of 4 | 75% | ||||||||||||||||
Total | 12 out of 14 | 86% | ||||||||||||||||
Enbridge securities held 3 | ||||||||||||||||||
Enbridge shares | DSUs 4 | Total market value of Enbridge shares & DSUs 5 | Minimum required 6 | |||||||||||||||
637,523 | 138,662 | $34,346,186 | $925,880 | |||||||||||||||
Other board/board committee memberships 7 | ||||||||||||||||||
Private 7 | ||||||||||||||||||
Gulf Capital Bank | Director Chair, governance committee | |||||||||||||||||
Former U.S.-listed company directorships (last 5 years) | ||||||||||||||||||
Center Coast MLP & Infrastructure Fund | ||||||||||||||||||
| "we", "our", "us" and "Enbridge" | Enbridge Inc. | |||||||
| Allowance for funds used during construction |
| Aitken Creek | Aitken Creek Gas Storage Facility and Aitken Creek North Gas Storage Facility | |||||||
| AOCI | Accumulated other comprehensive income/(loss) | |||||||
| ARO | Asset retirement obligations | |||||||
| ASC | Accounting Standards Codification | |||||||
| Aux Sable | US Midstream ownership |
| British Columbia | ||||||||
| bcf/d | Billion cubic feet per day | |||||||
| CE Regulation | Clean Electricity Regulation | |||||||
| CER | Canada Energy Regulator | |||||||
| CTS | Competitive Toll Settlement | |||||||
| DAPL | Dakota Access Pipeline | |||||||
| Dawn | An extensive network of |
| Dawn Hub | ||||||||||||||||
| DCP | DCP Midstream, LP | |||||||||||||||
| EBITDA | Earnings before interest, income taxes and depreciation and amortization | |||||||||||||||
| EEP | Enbridge Energy Partners, L.P. | |||||||||||||||
| EIEC | Enbridge Ingleside Energy Center | |||||||||||||||
| Enbridge Gas | Enbridge Gas Inc. | |||||||||||||||
| ESG | Environment, Social and Governance | |||||||||||||||
| Exchange Act | ||||||||||||||||
Finance & Risk Committee | Social Responsibility Committee | Committee | Resources & Compensation Committee | Reliability Committee | ||||||||||||||||
| FERC | Federal Energy Regulatory Commission | |||||||
| GHG | Greenhouse gas | |||||||
| Gray Oak | Gray Oak Pipeline, LLC | |||||||
| H2 | Hydrogen gas | |||||||
| IJT | International Joint Tariff | |||||||
| IR | Incentive Regulation | |||||||
| ISO | Incentive Stock Options | |||||||
| kbpd | Thousand barrels per day | |||||||
| LMCI | Land Matters Consultation Initiative | |||||||
| LNG | Liquefied natural gas | |||||||
| M&N | Maritimes & Northeast Pipeline | |||||||
4
| M&N Canada | Canadian portion of our Maritimes & Northeast Pipeline | |||||||
| Moda | Moda Midstream Operating, LLC | |||||||
| MTS | Mainline Tolling Settlement | |||||||
| MW | Megawatts | |||||||
| NCIB | Normal course issuer bid | |||||||
| NEXUS | NEXUS Gas Transmission Pipeline | |||||||
| NGL | Natural gas liquids | |||||||
| Noverco | Noverco Inc. | |||||||
| OBPS | Output-based pricing system | |||||||
| OCI | Other comprehensive income/(loss) | |||||||
| OEB | Ontario Energy Board | |||||||
| OPEB | Other postretirement benefit obligations | |||||||
| Phase 1 | Phase to establish 2024 base rates on a cost-of-service basis | |||||||
| Phase 1 Decision | On December 21, 2023, the Ontario Energy Board issued its Decision and Order on Phase 1 | |||||||
| PPA | Power purchase agreement | |||||||
| PSU | Performance Stock Units | |||||||
| RNG | Renewable natural gas | |||||||
| ROU | Right-of-use | |||||||
| RSU | Restricted Stock Units | |||||||
| SEC | US Securities and Exchange Commission | |||||||
| SEP | Spectra Energy Partners, LP | |||||||
| Spectra Energy | Spectra Energy Corp | |||||||
| Texas Eastern | Texas Eastern Transmission, LP | |||||||
| TGE | Tri Global Energy, LLC | |||||||
| the Acquisitions | On September 5, 2023, we announced that Enbridge had entered into three separate definitive agreements with Dominion Energy, Inc. to acquire The East Ohio Gas Company, Questar Gas Company and its related Wexpro companies, and Public Service Company of North Carolina | |||||||
| the Board | Board | |||||||
| the Lakehead System Settlement | On May 24, 2023, Enbridge filed an Offer of Settlement with the Federal Energy Regulatory Commission for the Lakehead System | |||||||
| the Moda Acquisition | On October 12, 2021, through a wholly-owned US subsidiary, we acquired all | |||||||
| the | Spectra Energy Partners, LP and Enbridge Energy Partners, L.P. | |||||||
| Tres Palacios | Tres Palacios Holdings LLC | |||||||
| TSX | Toronto Stock Exchange | |||||||
| UK | The United Kingdom | |||||||
| US | United States of | |||||||
| US GAAP | Generally accepted accounting principles in the | |||||||
| Vector | Vector Pipeline L.P. |
| Variable interest entities |
| Westcoast | Westcoast Energy Inc. | |||||||
5
CONVENTIONS
The terms "we", "our", "us" and "Enbridge" as used in this report refer collectively to Enbridge Inc. and its subsidiaries unless the context suggests otherwise. These terms are used for convenience only and are not intended as a precise description of Contentsany separate legal entity within Enbridge.
FORWARD-LOOKING INFORMATION
public company | ||||
were: | ||||
 | ||||
 | ||||
 | ||||
 | ||||
 | ||||
 | ||||
Although we believe these forward-looking statements are reasonable based on the foundationinformation available on the date such statements are made and processes used to prepare the information, such statements are not guarantees of future performance and readers are cautioned against placing undue reliance on forward-looking statements. By their nature, these statements involve a variety of assumptions, known and unknown risks and uncertainties and other factors, which may cause actual results, levels of activity and achievements to differ materially from those expressed or implied by such statements. Material assumptions include assumptions about the following: the expected supply of, demand for, export of and prices of crude oil, natural gas, NGL, LNG and renewable energy; anticipated utilization of assets; exchange rates; inflation; interest rates; availability and price of labor and construction materials; the stability of our strategic plan is a continued focus onsupply chain; operational reliability; maintenance of support and regulatory approvals for our projects and transactions; anticipated in-service dates; weather; the safetiming, terms and reliable transportationclosing of energy to end use markets, which is always our number one priority.
6
Executive | Annual base salary increase 1 | Base salary reduction 2 | Short-term incentive payment | Medium-term incentive award | Long-term incentive award | |||||||||||||||
Al Monaco | 5% | -15% | 207% | 520% | 130% | |||||||||||||||
Colin K. Gruending | 25% 3 | -10% | 130% | 320% | 80% | |||||||||||||||
John K. Whelen | 3% | -10% | 127% | 320% | 80% | |||||||||||||||
William T. Yardley | 3% | -10% | 121% | 320% | 80% | |||||||||||||||
Vern D. Yu | 20% 3 | -10% | 114% | 320% | 80% | |||||||||||||||
Robert R. Rooney | 5% | -10% | 114% | 280% | 70% | |||||||||||||||
“at risk”. |
Executive | Base salary at January 1, 2020 1 | April 1, 2020 increase % | Base salary at April 1, 2020 1 | June 1, 2020 reduction % | Base salary at December 31, 2020 1 | Total % change in base salary in 2020 | ||||||||||||||||||
Al Monaco | $ | 1,630,000 | 5% | $ | 1,712,000 | -15% | $ | 1,455,200 | -11% | |||||||||||||||
Colin K. Gruending | $ | 525,000 | 25% | $ | 656,300 | -10% | $ | 590,670 | 13% | |||||||||||||||
John K. Whelen | $ | 641,200 | 3% | $ | 660,400 | -10% | $ | 594,360 | -7% | |||||||||||||||
William T. Yardley | $ | 725,290 | 3% | $ | 747,075 | -10% | $ | 672,367 | -7% | |||||||||||||||
Vern D. Yu | $ | 569,300 | 20% | $ | 683,200 | -10% | $ | 614,880 | 8% | |||||||||||||||
Robert R. Rooney | $ | 569,300 | 5% | $ | 597,800 | -10% | $ | 538,020 | -5% | |||||||||||||||
Executive | 2020 target STIP (% of base salary) | 2020 target STIP 1 2 | Performance Measure Weighting | 2019 target STIP (% of base salary) | ||||||||||||||||||||
Corporate | Business Unit | Individual | ||||||||||||||||||||||
Al Monaco | 145 | % | $ | 2,241,900 | 60 | % | 20 | % | 20 | % | 140 | % | ||||||||||||
Colin K. Gruending | 90 | % | $ | 528,370 | 60 | % | 20 | % | 20 | % | 80 | % | ||||||||||||
John K. Whelen 3 | 90 | % | $ | 488,240 | 60 | % | 20 | % | 20 | % | 80 | % | ||||||||||||
William T. Yardley | 90 | % | $ | 630,020 | 40 | % | 40 | % | 20 | % | 80 | % | ||||||||||||
Vern D. Yu | 90 | % | $ | 555,120 | 40 | % | 40 | % | 20 | % | 80 | % | ||||||||||||
Robert R. Rooney | 80 | % | $ | 445,920 | 60 | % | 20 | % | 20 | % | 75 | % | ||||||||||||
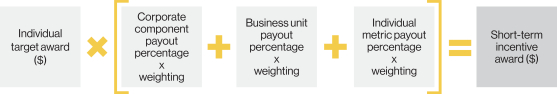
Executive | Corporate multiplier | x | Weight | + | Business Unit multiplier | x | Weight | + | Individual multiplier | x | Weight | = | Overall multiplier | |||||||||||||||||||||||||||||||||||||||
Al Monaco | 1.27 | x | 60 | % | + | 1.34 | x | 20 | % | + | 2.00 | x | 20 | % | = | 1.43 | ||||||||||||||||||||||||||||||||||||
Colin K. Gruending | 1.27 | x | 60 | % | + | 1.50 | x | 20 | % | + | 1.90 | x | 20 | % | = | 1.44 | ||||||||||||||||||||||||||||||||||||
John K. Whelen | 1.27 | x | 60 | % | + | 1.56 | x | 20 | % | + | 1.70 | x | 20 | % | = | 1.41 | ||||||||||||||||||||||||||||||||||||
William T. Yardley | 1.27 | x | 40 | % | + | 1.15 | x | 40 | % | + | 1.90 | x | 20 | % | = | 1.35 | ||||||||||||||||||||||||||||||||||||
Vern D. Yu | 1.27 | x | 40 | % | + | 0.95 | x | 40 | % | + | 1.90 | x | 20 | % | = | 1.27 | ||||||||||||||||||||||||||||||||||||
Robert R. Rooney | 1.27 | x | 60 | % | + | 1.50 | x | 20 | % | + | 1.80 | x | 20 | % | = | 1.42 | ||||||||||||||||||||||||||||||||||||
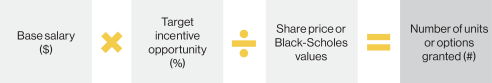
Executive | Base salary 1 2 ($) | x | STIP target (%) | x | Overall multiplier | = | Calculated award ($) 1 | Actual award ($) 1 | ||||||||||||||||||||||||
Al Monaco | 1,546,139 | x | 145 | % | x | 1.43 | = | 3,205,919 | 3,205,919 | |||||||||||||||||||||||
Colin K. Gruending | 587,074 | x | 90 | % | x | 1.44 | = | 761,904 | 761,904 | |||||||||||||||||||||||
John K. Whelen | 542,492 | x | 90 | % | x | 1.41 | = | 690,766 | 690,766 | |||||||||||||||||||||||
William T. Yardley | 700,018 | x | 90 | % | x | 1.35 | = | 849,262 | 849,262 | |||||||||||||||||||||||
Vern D. Yu | 616,801 | x | 90 | % | x | 1.27 | = | 703,893 | 703,893 | |||||||||||||||||||||||
Robert R. Rooney | 557,394 | x | 80 | % | x | 1.42 | = | 634,091 | 634,091 | |||||||||||||||||||||||
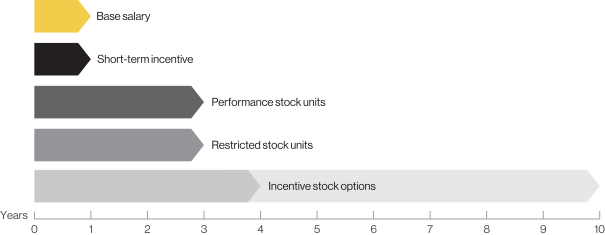
Executive | Total 2020 target medium- and long- term incentives | Annual grant | ||||||||||||
PSUs | RSUs | ISOs | ||||||||||||
Al Monaco | 650 | % | 390% | 130 | % | 130 | % | |||||||
Colin K. Gruending | 400 | % | 240% | 80 | % | 80 | % | |||||||
John K. Whelen | 400 | % | 240% | 80 | % | 80 | % | |||||||
William T. Yardley | 400 | % | 240% | 80 | % | 80 | % | |||||||
Vern D. Yu | 400 | % | 240% | 80 | % | 80 | % | |||||||
Robert R. Rooney | 350 | % | 210% | 70 | % | 70 | % | |||||||
Executive | Number of PSUs granted (#) | Grant value (as % of base salary) 1 | ||||||
Al Monaco | 124,500 | 390% | ||||||
Colin K. Gruending | 24,680 | 240% | ||||||
John K. Whelen | 30,140 | 240% | ||||||
William T. Yardley | 35,260 | 240% | ||||||
Vern D. Yu | 26,760 | 240% | ||||||
Robert R. Rooney | 23,410 | 210% | ||||||
Executive | Number of RSUs granted (#) | Grant value (as % of base salary) 1 | ||||||
Al Monaco | 41,500 | 130% | ||||||
Colin K. Gruending | 8,230 | 80% | ||||||
John K. Whelen | 10,050 | 80% | ||||||
William T. Yardley | 11,750 | 80% | ||||||
Vern D. Yu | 8,920 | 80% | ||||||
Robert R. Rooney | 7,800 | 70% | ||||||
Executive | Number of ISOs granted (#) | Grant value (as % of base salary) 1 | ||||||
Al Monaco | 614,200 | 130 | % | |||||
Colin K. Gruending | 121,740 | 80 | % | |||||
John K. Whelen | 148,680 | 80 | % | |||||
William T. Yardley | 129,020 | 80 | % | |||||
Vern D. Yu | 132,010 | 80 | % | |||||
Robert R. Rooney | 115,510 | 70 | % | |||||
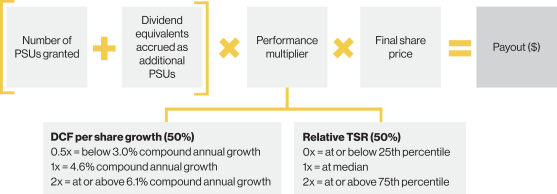
Executive | PSUs granted (#) | + | Notionally reinvested dividends (#) | Total PSUs (#) | x | Performance multiplier | x | Final share price 1 2 ($) | = | Payout ($) | ||||||||||||||||||||||||||||||
Al Monaco | 103,590 | + | 22,849 | 126,439 | x | 1.82x | x | 42.26 | = | 9,724,864 | ||||||||||||||||||||||||||||||
Colin K. Gruending | 6,440 | + | 1,421 | 7,861 | x | 1.82x | x | 42.26 | = | 604,577 | ||||||||||||||||||||||||||||||
John K. Whelen | 27,125 | + | 5,983 | 33,108 | x | 1.82x | x | 42.26 | = | 2,546,456 | ||||||||||||||||||||||||||||||
William T. Yardley | 32,070 | + | 7,092 | 39,162 | x | 1.82x | x | 41.88 | = | 2,984,853 | ||||||||||||||||||||||||||||||
Vern D. Yu | 16,440 | + | 3,626 | 20,066 | x | 1.82x | x | 42.26 | = | 1,543,361 | ||||||||||||||||||||||||||||||
Robert R. Rooney | 20,090 | + | 4,431 | 24,521 | x | 1.82x | x | 42.26 | = | 1,886,017 | ||||||||||||||||||||||||||||||
Executive | Total phantom stock units (#) | x | Final share price 1 2 ($) | = | Payout ($) 2 3 | |||||||||||||||
William T. Yardley | 17,908 | x | 53.76 | = | 962,820 | |||||||||||||||
Executive | RSUs granted (#) | + | Notionally reinvested dividends (#) | Total RSUs (#) | x | Final share price 1 ($) | = | Payout ($) | ||||||||
Colin K. Gruending | 4,960 | + | 998 | 5,958 | x | 38.25 | = | 227,877 | ||||||||
Executive | RSUs granted (#) | + | Notionally reinvested dividends (#) | Total RSUs (#) | x | Final share price 1 2 ($) | = | Payout 2 ($) | ||||||||||||||||||||||||
William T. Yardley | 8,084 | + | 522 | 8,606 | x | 37.61 | = | 323,675 | ||||||||||||||||||||||||
 |

 |
 |
Executive 8 | Credited service (years) | Annual benefits payable | Accrued obligation at Jan 1, 2020 ($) | Compensatory change 1 ($) | Non- compensatory change 2 ($) | Accrued obligation at Dec 31, 2020 ($) | ||||||||||||||||||||||
At year end ($) | At age 65 ($) | |||||||||||||||||||||||||||
A | B | C | A+B+C | |||||||||||||||||||||||||
Al Monaco 3 | 22.08 | 1,463,000 | 1,625,000 | 26,182,000 | 1,462,000 | 2,333,000 | 29,977,000 | |||||||||||||||||||||
Colin K. Gruending 4 | 17.25 | 232,000 | 530,000 | 4,681,000 | 1,017,000 | 675,000 | 6,373,000 | |||||||||||||||||||||
John K. Whelen 5 | 23.03 | 447,000 | 447,000 | 8,039,000 | 525,000 | 1,438,000 | 10,002,000 | |||||||||||||||||||||
William T. Yardley 6 7 | 20.13 | 201,000 | 363,000 | 2,778,000 | 396,000 | 289,000 | 3,463,000 | |||||||||||||||||||||
Vern D. Yu | 19.75 | 343,000 | 525,000 | 6,368,000 | 1,177,000 | 877,000 | 8,422,000 | |||||||||||||||||||||
Robert R. Rooney | 3.92 | 67,000 | 86,000 | 895,000 | 349,000 | 136,000 | 1,380,000 | |||||||||||||||||||||
Executive | Accumulated value at Jan 1, 2020 ($) | Compensatory change 1 ($) | Accumulated value at Dec 31, 2020 ($) | |||||||||
Al Monaco | 72,413 | - | 77,811 | |||||||||
Colin K. Gruending | 79,400 | - | 82,499 | |||||||||
John K. Whelen | 79,579 | - | 83,086 | |||||||||
Vern D. Yu | 79,916 | - | 84,966 | |||||||||
publicly update or revise any shares owned by the Advisor; and
Nature of work | Approximate fees in 2020 ($) | Approximate fees in 2019 ($) | ||||||||
Executive compensation related fees 1 | 296,735 | 296,632 | ||||||||
All other fees 2 | 5,658,518 | 6,148,371 | ||||||||
Total | 5,955,253 | 6,445,003 | ||||||||
Name and principal position 1 | Year | Salary ($) | Stock- based awards 2 ($) | Option- based awards 3 ($) | Non- equity incentive plan compen- sation 4 | Pension value 5 ($) | All other compen- sation 6 ($) | Total ($) | ||||||||||||||||||||||||||||||||
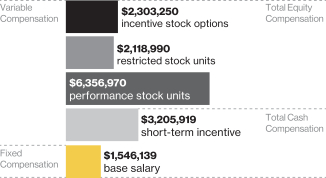
Al Monaco President & Chief Executive Officer | 2020 | 1,546,139 | 8,475,960 | 2,303,250 | 3,205,919 | 1,462,000 | 61,568 | 17,054,836 | ||||||||||||||||||||||||||||||||
| 2019 | 1,592,878 | 6,129,560 | 3,327,732 | 3,687,712 | 3,195,000 | 60,502 | 17,993,384 | |||||||||||||||||||||||||||||||||
| 2018 | 1,479,450 | 4,439,868 | 2,777,446 | 3,473,453 | 1,141,000 | 68,509 | 13,379,726 | |||||||||||||||||||||||||||||||||
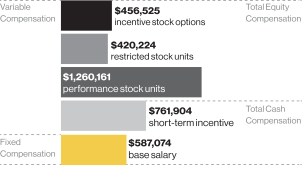
Colin K. Gruending Executive Vice President & Chief Financial Officer | 2020 | 587,074 | 1,680,385 | 456,525 | 761,904 | 1,017,000 | 12,032 | 4,514,919 | ||||||||||||||||||||||||||||||||
| 2019 | 467,122 | 1,225,912 | 316,315 | 583,360 | 1,498,000 | 25,460 | 4,116,169 | |||||||||||||||||||||||||||||||||
| 2018 | 361,656 | 496,675 | 172,549 | 338,078 | 421,000 | 231,272 | 2,021,230 | |||||||||||||||||||||||||||||||||
John K. Whelen Former Executive Vice President | 2020 | 542,492 | 2,052,101 | 557,550 | 690,766 | 525,000 | 73,105 | 4,441,015 | ||||||||||||||||||||||||||||||||
| 2019 | 635,849 | 1,604,385 | 870,883 | 821,199 | 645,000 | 17,568 | 4,594,884 | |||||||||||||||||||||||||||||||||
| 2018 | 619,500 | 1,244,477 | 758,499 | 886,132 | 126,000 | 33,466 | 3,668,074 | |||||||||||||||||||||||||||||||||
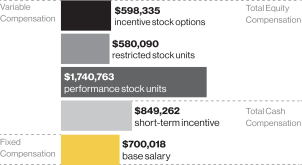
William T. Yardley Executive Vice President & President, Gas Transmission & Midstream | 2020 | 700,018 | 2,320,853 | 598,335 | 849,262 | 396,000 | 32,065 | 4,896,533 | ||||||||||||||||||||||||||||||||
| 2019 | 732,029 | 3,828,546 | 1,069,747 | 767,701 | 351,400 | 32,993 | 6,782,416 | |||||||||||||||||||||||||||||||||
| 2018 | 751,161 | 1,570,650 | 847,539 | 968,697 | 359,000 | 32,958 | 4,530,005 | |||||||||||||||||||||||||||||||||
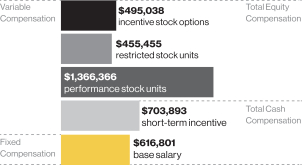
Vern D. Yu Executive Vice President & President, Liquids Pipelines | 2020 | 616,801 | 1,821,821 | 495,038 | 703,893 | 1,177,000 | 22,579 | 4,837,131 | ||||||||||||||||||||||||||||||||
| 2019 | 564,541 | 1,424,276 | 773,196 | 711,996 | 1,478,000 | 22,648 | 4,974,657 | |||||||||||||||||||||||||||||||||
| 2018 | 450,000 | 723,196 | 440,752 | 900,000 | 122,000 | 29,030 | 2,664,978 | |||||||||||||||||||||||||||||||||
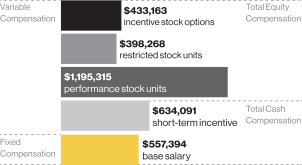
Robert R. Rooney Executive Vice President & Chief Legal Officer | 2020 | 557,394 | 1,593,583 | 433,163 | 634,091 | 349,000 | 18,167 | 3,585,397 | ||||||||||||||||||||||||||||||||
| 2019 | 564,541 | 1,139,225 | 618,565 | 689,992 | 286,000 | 10,283 | 3,308,606 | |||||||||||||||||||||||||||||||||
| 2018 | 550,000 | 883,759 | 538,734 | 729,299 | 236,000 | 20,742 | 2,958,534 | |||||||||||||||||||||||||||||||||
Year granted | C$ | US$ | ||||||||
2020 | 51.06 | 38.75 | ||||||||
2019 | 48.81 | 36.97 | ||||||||
2018 | 43.99 | 38.59 | ||||||||
February 2020 | February 2019 | February 2018 | ||||||||||||||||||||||||||||
Assumptions | C$ | US$ | C$ | US$ | C$ | US$ | ||||||||||||||||||||||||
Expected option term | 6 years | 6 years | 6 years | 6 years | 6 years | 6 years | ||||||||||||||||||||||||
Expected volatility | 17.587% | 20.283% | 18.318% | 21.802% | 21.077% | 21.893% | ||||||||||||||||||||||||
Expected dividend yield | 5.847% | 5.847% | 5.961% | 5.961% | 6.377% | 6.377% | ||||||||||||||||||||||||
Risk free interest rate | 1.314% | 1.416% | 1.615% | 2.333% | 2.088% | 2.694% | ||||||||||||||||||||||||
Exercise price | $55.54 | $41.97 | $48.30 | $36.71 | $43.02 | $33.97 | ||||||||||||||||||||||||
Option value | $3.75 | $3.64 | $4.03 | $4.07 | $3.82 | $3.40 | ||||||||||||||||||||||||
Executive | Matching contribution under retirement savings plan ($) | Excess flexible benefit credit a ($) | Unused vacation ($) | Personal use of company aircraft ($) | Parking ($) | Other benefits b ($) | Total ($) | ||||||||||||||||||||||||||||
Al Monaco | - | 40,854 | - | 7,865 | 6,108 | 6,741 | 61,568 | ||||||||||||||||||||||||||||
Colin K. Gruending | - | 7,232 | - | - | 4,800 | - | 12,032 | ||||||||||||||||||||||||||||
John K. Whelen | - | 4,244 | 59,817 | - | 4,200 | 4,844 | 73,105 | ||||||||||||||||||||||||||||
William T. Yardley | 21,786 | - | - | 8,950 | - | 1,329 | 32,065 | ||||||||||||||||||||||||||||
Vern D. Yu | - | 12,083 | - | - | 4,800 | 5,696 | 22,579 | ||||||||||||||||||||||||||||
Robert R. Rooney | - | 11,872 | - | - | 4,800 | 1,495 | 18,167 | ||||||||||||||||||||||||||||
Option-based awards 1 | Share-based awards | |||||||||||||||||||||||||||||||
Number of securities underlying unexercised options (#) | Option exercise price 2 ($) | Option expiry date | Value of in-the-money unexercised options 3 | Number of units that have not vested 4 5 (#) | Market or payout value of units not vested 3 ($) | Market or value of vested share-based awards not paid out or distributed 3 6 ($) | ||||||||||||||||||||||||||
Named executive officer | Vested ($) | Unvested ($) | ||||||||||||||||||||||||||||||
Al Monaco | 614,200 | 55.54 | 2/20/2030 | 0 | 0 | 43,966 | 1,789,860 | |||||||||||||||||||||||||
| 825,740 | 48.30 | 2/21/2029 | 0 | 0 | 131,898 | 5,369,580 | ||||||||||||||||||||||||||
| 727,080 | 43.02 | 2/27/2028 | 0 | 0 | 141,635 | 5,765,960 | ||||||||||||||||||||||||||
| 584,000 | 55.84 | 2/28/2027 | 0 | 0 | - | - | 9,724,864 | |||||||||||||||||||||||||
| 365,000 | 44.06 | 3/1/2026 | 0 | 0 | ||||||||||||||||||||||||||||
| 196,000 | 59.08 | 3/2/2025 | 0 | 0 | ||||||||||||||||||||||||||||
| 199,000 | 48.81 | 3/13/2024 | 0 | 0 | ||||||||||||||||||||||||||||
| 229,000 | 44.83 | 2/27/2023 | 0 | 0 | ||||||||||||||||||||||||||||
| 147,500 | 38.34 | 3/2/2022 | 349,575 | 0 | ||||||||||||||||||||||||||||
Colin K. Gruending | 121,740 | 55.54 | 2/20/2030 | 0 | 0 | 8,719 | 354,953 | |||||||||||||||||||||||||
| 78,490 | 48.30 | 2/21/2029 | 0 | 0 | 26,147 | 1,064,428 | ||||||||||||||||||||||||||
| 45,170 | 43.02 | 2/27/2028 | 0 | 0 | 28,108 | 1,144,261 | ||||||||||||||||||||||||||
| 48,670 | 55.84 | 2/28/2027 | 0 | 0 | - | - | 604,577 | |||||||||||||||||||||||||
| 64,600 | 44.06 | 3/1/2026 | 0 | 0 | ||||||||||||||||||||||||||||
| 64,780 | 59.08 | 3/2/2025 | 0 | 0 | ||||||||||||||||||||||||||||
| 66,500 | 48.81 | 3/13/2024 | 0 | 0 | ||||||||||||||||||||||||||||
| 72,000 | 44.83 | 2/27/2023 | 0 | 0 | ||||||||||||||||||||||||||||
| 69,750 | 38.34 | 3/2/2022 | 165,308 | 0 | ||||||||||||||||||||||||||||
John K. Whelen | 148,680 | 55.54 | 11/15/2025 | 0 | 0 | 2,772 | 112,848 | |||||||||||||||||||||||||
| 216,100 | 48.30 | 11/15/2023 | 0 | 0 | 9,749 | 396,900 | ||||||||||||||||||||||||||
| 198,560 | 43.02 | 11/15/2023 | 0 | 0 | 23,432 | 953,936 | ||||||||||||||||||||||||||
| 152,910 | 55.84 | 11/15/2023 | 0 | 0 | - | - | 2,546,456 | |||||||||||||||||||||||||
| 82,430 | 44.06 | 11/15/2023 | 0 | 0 | ||||||||||||||||||||||||||||
| 109,670 | 59.08 | 11/15/2023 | 0 | 0 | ||||||||||||||||||||||||||||
| 92,700 | 48.81 | 11/15/2023 | 0 | 0 | ||||||||||||||||||||||||||||
| 78,550 | 44.83 | 2/27/2023 | 0 | 0 | ||||||||||||||||||||||||||||
| 77,050 | 38.34 | 3/2/2022 | 182,609 | 0 | ||||||||||||||||||||||||||||
| 84,000 | 28.78 | 2/14/2021 | 1,002,540 | 0 | ||||||||||||||||||||||||||||
William T. Yardley | 129,020 | US41.97 | 2/20/2030 | 0 | 0 | 12,448 | 507,343 | |||||||||||||||||||||||||
| 202,700 | US36.71 | 2/21/2029 | 0 | 0 | 37,355 | 1,522,460 | ||||||||||||||||||||||||||
| 182,520 | US33.97 | 2/27/2028 | 0 | 0 | 44,312 | 1,806,034 | ||||||||||||||||||||||||||
| 56,580 | US41.64 | 2/28/2027 | 0 | 0 | 36,471 | 7 | 1,486,427 | |||||||||||||||||||||||||
| 58,941 | US28.87 | 2/16/2026 | 234,292 | 0 | - | - | 2,984,853 | |||||||||||||||||||||||||
Vern D. Yu | 132,010 | 55.54 | 2/20/2030 | 0 | 0 | 9,450 | 384,712 | |||||||||||||||||||||||||
| 191,860 | 48.30 | 2/21/2029 | 0 | 0 | 28,350 | 1,154,136 | ||||||||||||||||||||||||||
| 115,380 | 43.02 | 2/27/2028 | 0 | 0 | 32,911 | 1,339,789 | ||||||||||||||||||||||||||
| 93,300 | 55.84 | 2/28/2027 | 0 | 0 | - | - | 1,543,361 | |||||||||||||||||||||||||
| 96,750 | 44.06 | 3/1/2026 | 0 | 0 | ||||||||||||||||||||||||||||
| 82,340 | 59.08 | 3/2/2025 | 0 | 0 | ||||||||||||||||||||||||||||
| 83,350 | 48.81 | 3/13/2024 | 0 | 0 | ||||||||||||||||||||||||||||
| 83,250 | 44.83 | 2/27/2023 | 0 | 0 | ||||||||||||||||||||||||||||
| 64,350 | 38.34 | 3/2/2022 | 152,510 | 0 | ||||||||||||||||||||||||||||
Robert R. Rooney | 115,510 | 55.54 | 2/20/2030 | 0 | 0 | 8,264 | 336,407 | |||||||||||||||||||||||||
| 153,490 | 48.30 | 2/21/2029 | 0 | 0 | 24,801 | 1,009,654 | ||||||||||||||||||||||||||
| 141,030 | 43.02 | 2/27/2028 | 0 | 0 | 26,324 | 1,071,648 | ||||||||||||||||||||||||||
| 167,200 | 55.84 | 2/28/2027 | 0 | 0 | - | - | 1,886,017 | |||||||||||||||||||||||||
Executive | Value vested during the year | Value earned during the year | ||||||||||
Option-based awards 1 2 ($) | Share-based awards 1 3 ($) | Non-equity incentive plan 1 4 ($) | ||||||||||
Al Monaco | 3,406,926 | 9,724,864 | 3,205,919 | |||||||||
Colin K. Gruending | 321,146 | 832,454 | 5 | 761,904 | ||||||||
John K. Whelen | 888,481 | 2,546,456 | 690,766 | |||||||||
William T. Yardley | 333,142 | 4,271,348 | 6 | 849,262 | ||||||||
Vern D. Yu | 704,506 | 1,543,361 | 703,893 | |||||||||
Robert R. Rooney | 544,704 | 1,886,017 | 634,091 | |||||||||
Grant date | Grant price | 2020 vesting date | Closing price on 2020 vesting date | |||||||||
2/29/2016 | $44.06 | 2/28/2020 | $49.96 | |||||||||
2/28/2017 | $55.84 | 2/28/2020 | $49.96 | |||||||||
2/28/2017 | US$41.64 | 2/28/2020 | US$37.43 | |||||||||
2/27/2018 | $43.02 | 2/27/2020 | $50.84 | |||||||||
2/27/2018 | US$33.97 | 2/27/2020 | US$37.66 | |||||||||
2/21/2019 | $48.30 | 2/21/2020 | $55.31 | |||||||||
2/21/2019 | US$36.71 | 2/21/2020 | US$41.87 | |||||||||
 | ||||||||||||
 | ||||||||||||
Named executive officer 1 | Triggering event 2 | Base salary 3 ($) | Short- term incentive 4 ($) | Medium- term incentive 5 ($) | Long- term incentive 6 ($) | Pension 7 ($) | Benefits 8 ($) | Total payout ($) | ||||||||||||||||||||||
Al Monaco | CIC | - | - | - | - | - | - | 0 | ||||||||||||||||||||||
| Death | - | - | 12,925,401 | - | - | 55,969 | 12,981,370 | |||||||||||||||||||||||
| Retirement | - | - | 5,883,086 | - | - | 55,969 | 5,939,056 | |||||||||||||||||||||||
| Voluntary or for cause termination | - | - | - | - | - | 55,969 | 55,969 | |||||||||||||||||||||||
| Involuntary termination without cause | 4,365,600 | 10,741,747 | 12,925,401 | - | 3,771,000 | 252,009 | 32,055,757 | |||||||||||||||||||||||
| Involuntary or good reason termination after a CIC | 4,365,600 | 10,741,747 | 12,925,401 | - | 3,771,000 | 252,009 | 32,055,757 | |||||||||||||||||||||||
Colin K. Gruending | CIC | - | - | - | - | - | - | 0 | ||||||||||||||||||||||
| Death | - | - | 3,707,902 | - | - | 22,718 | 3,730,620 | |||||||||||||||||||||||
| Voluntary or for cause termination | - | - | - | - | - | 22,718 | 22,718 | |||||||||||||||||||||||
| Involuntary termination without cause | 1,181,340 | 921,438 | 3,691,385 | - | 1,551,000 | 88,954 | 7,434,117 | |||||||||||||||||||||||
| Involuntary or good reason termination after a CIC | 1,181,340 | 921,438 | 3,691,385 | - | 1,551,000 | 88,954 | 7,434,117 | |||||||||||||||||||||||
John K. Whelen 9 | Retirement | - | - | 709,308 | - | - | 59,817 | 769,125 | ||||||||||||||||||||||
William T. Yardley | CIC | - | - | - | - | - | - | 0 | ||||||||||||||||||||||
| Death | - | - | 5,322,264 | - | - | 25,860 | 5,348,124 | |||||||||||||||||||||||
| Retirement | - | - | 2,597,159 | - | - | 25,860 | 2,623,019 | |||||||||||||||||||||||
| Voluntary or for cause termination | - | - | - | - | - | 25,860 | 25,860 | |||||||||||||||||||||||
| Involuntary termination without cause | 1,344,735 | 2,212,254 | 5,298,656 | - | 837,000 | 94,914 | 9,787,559 | |||||||||||||||||||||||
| Involuntary or good reason termination after a CIC | 1,344,735 | 2,212,254 | 5,298,656 | - | 837,000 | 94,914 | 9,787,559 | |||||||||||||||||||||||
Vern D. Yu | CIC | - | - | - | - | - | - | 0 | ||||||||||||||||||||||
| Death | - | - | 2,878,638 | - | - | 23,649 | 2,902,287 | |||||||||||||||||||||||
| Voluntary or for cause termination | - | - | - | - | - | 23,649 | 23,649 | |||||||||||||||||||||||
| Involuntary termination without cause | 1,229,760 | 1,611,996 | 2,860,736 | - | 2,159,000 | 100,581 | 7,962,073 | |||||||||||||||||||||||
| Involuntary or good reason termination after a CIC | 1,229,760 | 1,611,996 | 2,860,736 | - | 2,159,000 | 100,581 | 7,962,073 | |||||||||||||||||||||||
Robert R. Rooney | CIC | - | - | - | - | - | - | 0 | ||||||||||||||||||||||
| Death | - | - | 2,417,709 | - | - | 20,693 | 2,438,402 | |||||||||||||||||||||||
| Retirement | - | - | 1,098,013 | - | - | 20,693 | 1,118,706 | |||||||||||||||||||||||
| Voluntary or for cause termination | - | - | - | - | - | 20,693 | 20,693 | |||||||||||||||||||||||
| Involuntary termination without cause | 1,076,040 | 1,419,291 | 2,402,055 | - | 971,000 | 87,933 | 5,956,319 | |||||||||||||||||||||||
| Involuntary or good reason termination after a CIC | 1,076,040 | 1,419,291 | 2,402,055 | - | 971,000 | 87,933 | 5,956,319 | |||||||||||||||||||||||
NON-GAAP AND OTHER FINANCIAL MEASURES
A | B | C | ||||||||||
Plans approved by security holders | Number of securities to be issued upon exercise of outstanding options, warrants and rights (#) | Weighted-average exercise price of outstanding options, warrants and rights ($) | Number of securities remaining available for future issue under equity compensation plans (excluding securities reflected in column A) (#) | |||||||||
2019 LTIP | 11,683,418 | 50.91 | 3 4 | 38,016,582 | ||||||||
Prior stock option plans 1 | 24,146,312 | 48.82 | 3 | — | ||||||||
Spectra 2007 LTIP 2 | 775,806 | 36.78 | 3 | — | ||||||||
| | 1.8770% of total issued and outstanding Enbridge shares | | ||||||||||
Awards outstanding | # outstanding | % of total issued and outstanding Enbridge shares | ||||||
2019 LTIP | 11,683,418 | 0.5768 | ||||||
Incentive stock option plan | 24,146,312 | 1.1922 | ||||||
Performance stock option plan | 0 | 0.0000 | ||||||
Spectra 2007 LTIP – stock options 1 | 775,806 | 0.0383 | ||||||
Awards outstanding | 2020 | 2019 | 2018 | |||
2019 LTIP | 0.2529% | 0.3348% | — | |||
Incentive stock option plan 1 | — | — | 0.3350% | |||
Performance stock option plan 2 | — | — | — | |||
Spectra 2007 LTIP – stock options 3 | — | — | — | |||
Spectra Energy options | Spectra Energy phantom units | Total Enbridge shares issuable under Spectra 2007 LTIP | Percentage of issued and outstanding Enbridge shares | |||
775,806 | 0 | 775,806 | 0.0383% | |||
(not retirement eligible) | ||
(retirement eligible) | ||
2020 Directors’ Compensation Plan retainers 1 | ||||||||||||||||||||||||||||||||||||
Annual amount (US$) | Cash | Enbridge shares | DSUs | Cash | Enbridge shares | DSUs | ||||||||||||||||||||||||||||||
Compensation component | Before minimum share ownership | After minimum share ownership | ||||||||||||||||||||||||||||||||||
Board retainer | 285,000 (until May 31 242,250 (from June 1 | ) ) |  |  | ||||||||||||||||||||||||||||||||
Additional retainers | ||||||||||||||||||||||||||||||||||||
Chair of the Board retainer | 265,000 (until May 31 225,250 (from June 1 | ) ) | ||||||||||||||||||||||||||||||||||
Board committee chair retainer | Up to 50% | Up to 50% | | 50% to 100% | | Up to 65% | Up to 65% | | 35% to 100% | | ||||||||||||||||||||||||||
• Audit, Finance & Risk | 25,000 | |||||||||||||||||||||||||||||||||||
• Human Resources & Compensation | 20,000 | |||||||||||||||||||||||||||||||||||
• Safety & Reliability | 15,000 | |||||||||||||||||||||||||||||||||||
• Corporate Social Responsibility | 15,000 | |||||||||||||||||||||||||||||||||||
• Governance | 15,000 | |||||||||||||||||||||||||||||||||||
Travel Fee | 1,500 | 100% | - | - | 100% | - | - | |||||||||||||||||||||||||||||
Director | Cash (%) | Enbridge shares (%) | DSUs (%) | |||
Pamela L. Carter | 40 | 25 | 35 | |||
Marcel R. Coutu | - | - | 100 | |||
Susan M. Cunningham | 30 | 20 | 50 | |||
Gregory L. Ebel | 50 | - | 50 | |||
J. Herb England | - | 65 | 35 | |||
Gregory J. Goff | 50 | - | 50 | |||
V. Maureen Kempston Darkes | - | - | 100 | |||
Teresa S. Madden | 50 | - | 50 | |||
Al Monaco 1 | - | - | - | |||
Stephen S. Poloz | 30 | - | 70 | |||
Dan C. Tutcher | - | - | 100 | |||
Former Directors | ||||||
Charles W. Fischer 2 | 50 | - | 50 | |||
Catherine L. Williams 3 | 20 | 40 | 40 | |||
Share based awards 2 | All other compensation | Total | ||||||||||||||||||||||||||||||||||
Fees earned 1 (cash) | Enbridge Shares 3 | DSUs 3 | Other fees 4 | Dividends on DSUs 5 | ||||||||||||||||||||||||||||||||
Director | ($) | (#) | ($) | (#) | ($) | ($) | (#) | ($) | ($) | |||||||||||||||||||||||||||
Pamela L. Carter | 147,200 | 2,080 | 92,000 | 2,915 | 128,800 | 2,073 | 78 | 3,279 | 373,353 | |||||||||||||||||||||||||||
Marcel R. Coutu | - | - | - | 7,872 | 347,987 | - | 211 | 8,881 | 356,868 | |||||||||||||||||||||||||||
Susan M. Cunningham | 108,261 | 1,634 | 72,174 | 4,090 | 180,435 | 2,073 | 108 | 4,536 | 367,479 | |||||||||||||||||||||||||||
Gregory L. Ebel | 335,777 | - | - | 7,596 | 335,777 | 20,793 | 204 | 8,569 | 700,916 | |||||||||||||||||||||||||||
J. Herb England | - | 5,274 | 233,916 | 2,841 | 125,955 | 2,073 | 78 | 3,281 | 365,226 | |||||||||||||||||||||||||||
Gregory J. Goff | 151,270 | - | - | 3,486 | 151,270 | 2,073 | 82 | 3,428 | 308,041 | |||||||||||||||||||||||||||
V. Maureen Kempston Darkes | - | - | - | 8,430 | 372,295 | 2,073 | 225 | 9,433 | 383,801 | |||||||||||||||||||||||||||
Teresa S. Madden | 184,729 | - | - | 4,193 | 184,729 | 2,073 | 110 | 4,600 | 376,131 | |||||||||||||||||||||||||||
Al Monaco 6 | - | - | - | - | - | - | - | - | - | |||||||||||||||||||||||||||
Stephen S. Poloz | 75,521 | - | - | 2,602 | 106,723 | - | 22 | 911 | 183,155 | |||||||||||||||||||||||||||
Dan C. Tutcher | - | - | - | 8,083 | 356,614 | - | 213 | 8,947 | 365,561 | |||||||||||||||||||||||||||
Former Directors | ||||||||||||||||||||||||||||||||||||
Charles W. Fischer 7 | 100,259 | - | - | 2,124 | 100,259 | - | 17 | 757 | 201,275 | |||||||||||||||||||||||||||
Catherine L. Williams 8 | 38,605 | 1,181 | 57,155 | 1,182 | 57,155 | - | 13 | 575 | 153,491 | |||||||||||||||||||||||||||
Director | Enbridge shares (#) | Enbridge stock options (#) | DSUs(#) | Total Enbridge shares + DSUs (#) | Market (at risk) value of equity holdings (C$) 1,2 | |||||||||||||||
Pamela L. Carter | ||||||||||||||||||||
2021 | 44,639 | - | 11,744 | 56,383 | 2,494,943 | |||||||||||||||
2020 | 42,559 | - | 8,056 | 50,615 | 2,576,810 | |||||||||||||||
Change | 2,080 | - | 3,688 | 5,768 | (81,867 | ) | ||||||||||||||
Marcel R. Coutu | ||||||||||||||||||||
2021 | 46,900 | - | 39,090 | 85,990 | 3,805,069 | |||||||||||||||
2020 | 29,400 | - | 28,595 | 57,995 | 2,952,525 | |||||||||||||||
Change | 17,500 | - | 10,495 | 27,995 | 852,544 | |||||||||||||||
Susan M. Cunningham | ||||||||||||||||||||
2021 | 2,581 | - | 7,827 | 10,408 | 460,564 | |||||||||||||||
2020 | 947 | - | 3,281 | 4,228 | 215,247 | |||||||||||||||
Change | 1,634 | - | 4,546 | 6,180 | 245,317 | |||||||||||||||
Gregory L. Ebel 3 | ||||||||||||||||||||
2021 | 651,845 | 405,408 | 32,217 | 684,062 | 30,269,732 | |||||||||||||||
2020 | 651,845 | 405,408 | 22,489 | 674,334 | 34,330,344 | |||||||||||||||
Change | - | - | 9,728 | 9,728 | (4,060,612 | ) | ||||||||||||||
J. Herb England | ||||||||||||||||||||
2021 | 37,306 | - | 86,576 | 123,882 | 5,481,792 | |||||||||||||||
2020 | 32,032 | - | 77,530 | 109,562 | 5,577,801 | |||||||||||||||
Change | 5,274 | - | 9,046 | 14,320 | (96,010 | ) | ||||||||||||||
Gregory J. Goff | ||||||||||||||||||||
2021 | - | - | 3,644 | 3,644 | 161,230 | |||||||||||||||
2020 | - | - | - | - | - | |||||||||||||||
Change | - | - | 3,644 | 3,644 | 161,230 | |||||||||||||||
V. Maureen Kempston Darkes | ||||||||||||||||||||
2021 | 21,735 | - | 57,789 | 79,524 | 3,518,945 | |||||||||||||||
2020 | 21,735 | - | 45,396 | 67,131 | 3,417,639 | |||||||||||||||
Change | - | - | 12,393 | 12,393 | 101,306 | |||||||||||||||
Teresa S. Madden | ||||||||||||||||||||
2021 | 1,000 | - | 7,934 | 8,934 | 395,338 | |||||||||||||||
2020 | - | - | 3,281 | 3,281 | 167,036 | |||||||||||||||
Change | 1,000 | - | 4,653 | 5,653 | 228,303 | |||||||||||||||
Al Monaco 4 | ||||||||||||||||||||
2021 | 920,699 | 4,465,600 | - | 920,699 | 40,740,931 | |||||||||||||||
2020 | 876,512 | 3,987,520 | - | 876,512 | 44,623,226 | |||||||||||||||
Change | 44,187 | 478,080 | - | 44,187 | (3,882,295 | ) | ||||||||||||||
Stephen S. Poloz | ||||||||||||||||||||
2021 | - | - | 2,676 | 2,676 | 118,398 | |||||||||||||||
2020 | - | - | - | - | - | |||||||||||||||
Change | - | - | 2,676 | 2,676 | 118,398 | |||||||||||||||
Dan C. Tutcher | ||||||||||||||||||||
2021 | 637,523 | - | 138,662 | 776,185 | 34,346,186 | |||||||||||||||
2020 | 637,523 | - | 120,743 | 758,266 | 38,603,322 | |||||||||||||||
Change | - | - | 17,919 | 17,919 | (4,257,136 | ) | ||||||||||||||
Total | ||||||||||||||||||||
2021 | 2,364,228 | 4,871,008 | 388,159 | 2,752,387 | 121,793,128 | |||||||||||||||
2020 | 2,292,553 | 4,392,928 | 309,371 | 2,601,924 | 132,463,951 | |||||||||||||||
Change | 71,675 | 478,080 | 78,788 | 150,463 | (10,670,823 | ) | ||||||||||||||
The non-GAAP
and other financial measures7
PART I
ITEM 1. BUSINESS
Enbridge is a leading North American energy infrastructure company. Our core businesses include Liquids Pipelines, which consists of pipelines and terminals in Canada and the US that transport and export various grades of crude oil and other liquid hydrocarbons; Gas Transmission and Midstream, which consists of investments in natural gas pipelines and gathering and processing facilities in Canada and the US; Gas Distribution and Storage, which consists of natural gas utility operations that serve residential, commercial and industrial customers in Ontario and Québec; and Renewable Power Generation, which consists primarily of investments in wind and solar assets, as well as geothermal, waste heat recovery and transmission assets, in North America and Europe.
Enbridge is a public company, with common shares that trade on the Toronto Stock Exchange (TSX) and New York Stock Exchange (NYSE) under the symbol ENB. We were incorporated on April 13, 1970 under the Companies Ordinance of the Northwest Territories and were continued under the Canada Business Corporations Act on December 15, 1987.
A more detailed description of each of our businesses and underlying assets is provided below under Business Segments.
CORPORATE VISION AND STRATEGY
VISION
Enbridge exists to fuel people’s quality of life in a safe, clean, and socially responsible manner. Our vision is to provide energy, in a planet-friendly way, everywhere people need it. In pursuing this vision, we seek to play a critical role in enabling the economic and social well-being of society by providing access to affordable, reliable, and secure energy through our infrastructure franchises that transport, distribute, and generate energy including liquids, natural gas, renewable power, and low-carbon fuels. We recognize that the energy system is changing, and we aim to provide a bridge to a cleaner energy future by ensuring that people continue to have access to the energy they need today while investing in the lower-carbon platforms that will sustain us going forward.
Our leading investor value proposition is founded on our ability to deliver predictable cash flows and a growing stream of dividends year-over-year through investment in, and efficient operation of, energy infrastructure assets that are strategically positioned between key supply basins and strong demand-pull markets as well as targeted areas of growing renewable and new energy demand. Our assets are underpinned by long-term contracts, regulated cost-of-service tolling frameworks, power purchase agreements (PPAs), and other low-risk commercial arrangements.
Everyday, we strive to be the first-choice energy delivery company in North America and beyond—for customers, communities, investors, regulators, policymakers, and employees. We approach this goal with a focus on worker and public safety, ESG leadership, stakeholder relations, community investment, and employee engagement.
STRATEGY
Our strategy is underpinned by a deep understanding of energy supply and demand fundamentals. Through disciplined capital allocation, which is aligned with our outlook on energy markets, we have become an industry leader with a diversified portfolio across both conventional and lower-carbon energies. Our assets have reliably generated low-risk, resilient cash flows through many different commodity, economic, and geopolitical environments. We believe that our asset quality and diversity are key differentiators that allow us to be flexible in an uncertain business environment.
8
In order to continue to be an industry leader and value creator going forward, we maintain a robust strategic planning approach. We regularly conduct scenario and resiliency analysis on both our assets and business strategy. We test various value enhancement and maximization options, and we regularly engage with our Board of Directors (the Board) to ensure alignment and maintain active oversight. This Board participation includes updates and discussions throughout the year and a dedicated annual Strategic Planning session. Going forward, we will continue to use this comprehensive approach to guide our investment and portfolio decisions.
Predictable cash flows and ratable growth are hallmarks of our investor value proposition. Our robust portfolio of project development opportunities, the integration of recent strategic acquisitions, and ongoing efficiency improvements are expected to drive our growth in the near term (2024-2025) and the medium term to come. We remain confident in our balanced growth strategy and expect to continue to selectively invest in our diversified footprint of both conventional businesses and complementary lower-carbon platforms, such as renewable power, renewable natural gas (RNG), carbon capture and storage (CCS), blue ammonia, and hydrogen gas (H2). Additionally, ESG continues to be integral to our strategy; we are committed to reducing our emissions, building lasting relationships with our stakeholders, and promoting diversity, equity, and inclusion.
In alignment with our strategy, we progressed several of our priorities in 2023. For example:
•We announced the strategic acquisition of three US gas utilities in Ohio, Utah, and North Carolina. If completed, the Acquisitions will create the largest natural gas utility franchise in North America, lower our already industry-leading business risk profile, and secure visible, low-risk, long-term, rate base growth.
•Our Liquids Pipelines business delivered record volumes on the Mainline and Permian systems, exported record volumes through our Enbridge Ingleside Energy Center (EIEC), reached a tolling agreement for the Mainline system, sanctioned the Enbridge Houston Oil Terminal, assumed operatorship of Gray Oak Pipeline (Gray Oak), and advanced contracting open seasons for the Flanagan South Pipeline (Flanagan South), Gray Oak and Southern Lights pipelines, further strengthening our premier heavy and light oil delivery and export system.
•Our Gas Transmission and Midstream business acquired Aitken Creek Gas Storage facility and Aitken Creek North Gas Storage facility (collectively, Aitken Creek) in British Columbia and Tres Palacios Holdings LLC in Texas, achieved a final investment decision on the Rio Bravo Pipeline, advanced the Woodfibre LNG Project, and have been successfully executing on open seasons for both the Algonquin pipeline and Texas Eastern Transmission line. We continue to capitalize on strong gas fundamentals to deliver safe, reliable, and sustainable energy to North Americans while simultaneously growing LNG exports.
•Within our existing Gas Distribution and Storage business, we have progressed our rate rebasing application in Ontario, added over 46,000 new customers, and advanced Ontario’s largest greenhouse gas (GHG) reduction project to shift Arcelor Mittal’s steel-making operations from coal to natural gas. We continue to fuel Ontarians’ quality of life and economic growth through providing cost-effective, reliable, and sustainable energy to the province.
•Our Renewable Power Generation business continues to execute its growth strategy with significant progress on our European offshore wind portfolio including a 1,000 megawatt (MW) project award for the Normandy (Centre Manche 1) project in France, increased working interest at the Hohe See and Albatros projects in Germany, and ongoing construction of three additional projects in France. Our North American onshore business continued its growth through the ongoing advancement of our large development portfolio (currently greater than 4,500 MW) and through the investment in the Fox Squirrel solar project in Ohio.
9
•Our New Energy Technologies team, in collaboration with each business unit, advanced our low-carbon strategy through the acquisition of Morrow Renewables’ RNG assets, the creation of a strategic partnership with Yara to progress a blue ammonia export project at our EIEC near Corpus Christi, Texas, the sanctioning of the Longview RNG Project in Washington state with Divert Inc., and the continued development of prioritized lower-carbon technologies.
•We have made meaningful progress towards our ESG goals this year. We have continued to strengthen our relationships with Indigenous communities across North America while advancing our reconciliation commitments. We also increased the diversity of our Board and workforce. We are continuing on our path to net zero by lowering our emissions with multiple levers including system modernization, methane reduction technologies, powering our operations with cleaner-energy sources, and continued investment in our lower-carbon businesses.
•We continue to recycle capital at attractive valuations and in 2023 this included the announced sale of our interests in the Alliance Pipeline and Aux Sable facility. We remain focused on disciplined capital allocation, portfolio optimization and diversification, the continued enhancement of our industry leading cash flow profile, and financial strength and flexibility. In addition, we continue to prioritize operating cost reductions to increase our profitability and competitiveness.
These achievements are discussed in further detail in Part II. Item 7. Management’s Discussion and Analysis of Financial Condition and Results of Operations.
Looking ahead, our near-term strategic priorities remain similar to years past. As always, proactively advancing the safety of our assets, protecting the environment, and maintaining the reliability of our system remain our top priorities. We are focused on enhancing the value of our existing assets through further optimization, capitalizing on our extensive infrastructure to meet evolving customer needs, prioritizing in-franchise organic growth and export-driven opportunities, and developing lower-carbon platforms across all our businesses. We will continue to invest where we can advance our strategy, build sustainable competitive advantage, and achieve attractive risk-adjusted returns.
Our key strategic priorities include:
Safety and Operational Reliability
Safety and operational reliability are the foundation of our strategy. We strive to achieve and maintain industry leadership in all facets of safety - process, public, and personal - and ensure the highest standards of reliability and integrity across our system to protect our communities and the environment.
Extend Growth
The table belowcornerstone of our growth lies in the successful execution of our slate of secured projects (currently $24 billion through 2028) on schedule, at the lowest practical cost, while maintaining the highest standards for safety, quality, customer satisfaction, and environmental and regulatory compliance. For a discussion of our current portfolio of capital projects refer to Part II. Item 7. Management's Discussion and Analysis of Financial Condition and Results of Operations - Growth Projects - Commercially Secured Projects.
In the near term we will be focused on closing the US gas utilities transactions and successfully integrating each utility. Beyond that, we will continue to seek to identify additional high-quality growth opportunities across all our platforms. We will remain disciplined and deploy capital towards only the best uses, prioritizing balance sheet strength, investment in low capital intensity growth, and regulated utility or utility-like projects. We will carefully assess our remaining investable capacity, deploying capital to the most value-enhancing opportunities available to us, including further organic growth, complementary accretive "tuck-in" acquisitions that improve our competitive positioning, or further strengthening of our balance sheet.
10
Looking ahead, we see strong utilization of our existing network and opportunities for future growth within each of our businesses. For example, we expect that:
•Our liquids pipelines infrastructure will remain a vital connection between key supply basins and demand-pull markets such as the refinery hubs in the US Midwest, eastern Canada, and the US Gulf Coast. Our premier liquids system and export infrastructure will also enable crude, clean fuels, and other export opportunities. Building on our early experience, we expect CCS to provide additional new growth opportunities, over the longer-term.
•Our natural gas transmission business will seek extension and expansion opportunities driven by new load demand from gas-fired power generation, industrial growth, and coastal LNG plants. Looking forward, producing and blending RNG into our system will enhance asset longevity and enable us to offer differentiated lower-carbon solutions to customers. Over the longer-term, we plan to scale similar opportunities with H2 production, blending, and transportation to further decarbonize our gas offerings and extend asset life.
•Our Ontario-based gas distribution and storage business will continue to grow through customer additions, productivity enhancements, modernization investments, and facilities that blend H2 and RNG into the gas supply. Additionally, we will continue to thoughtfully expand our offerings to customers, including additional demand-side management, low-carbon, and distributed energy programs.
•Our renewables business is increasingly well positioned to capitalize on the growth of renewables in Europe and North America. We will continue to leverage our expanded internal capabilities and our strong existing partnerships to successfully execute on our large development portfolio and secure the next wave of projects for the future.
In addition, we aim to drive growth through a continuing focus on optimization, modernization, productivity, and efficiency across all our businesses. Examples include: the application of drag-reducing agents and pump station modifications to optimize throughput on our liquids system, the execution of toll settlements and rate case filings to optimize revenue within our liquids pipeline and gas transmission franchises, the expansion of lower-carbon gas offerings to modernize and integrate value chains at our gas utility, and the creation of sustainable cost savings across the organization through innovation, process improvement and system enhancements.
Maintain Financial Strength and Flexibility
Our financing strategies are designed to retain strong, investment-grade credit ratings to ensure we have the financial capacity to meet our capital funding needs and the flexibility to manage capital market disruptions. We expect that the current secured capital program can be readily financed through internally generated cash flow, available balance sheet capacity, and selective asset monetizations. For further discussion on our financing strategies, refer to Part II. Item 7. Management's Discussion and Analysis of Financial Condition and Results of Operations - Liquidity and Capital Resources.
Disciplined Capital Allocation
We assess the latest fundamental trends, monitor the business landscape, and proactively conduct business development activities with the goal of identifying an industry-leading capital deployment opportunity set. We screen, analyze, and assess opportunities using a disciplined investment framework with the objective of effectively deploying capital to grow while driving attractive risk-adjusted returns, within our low-risk "utility-like" business model.
11
All investment opportunities are evaluated based on their potential to advance our strategy, mitigate risks, support our ESG goals, and create additional financial flexibility. Our primary emphasis in the near term is on low capital intensity opportunities to enhance returns across existing businesses (organic expansions and optimizations), system modernization, and utility rate-based investments. We also remain focused on larger projects where commercial constructs fit our investor value proposition and where we can effectively manage risks during the execution phase. While we will be focused in the near-term on closing our US gas utilities transactions, we are continuing to assess other strong value-enhancing opportunities, including accretive acquisitions that can complement our portfolio.
In evaluating typical investment opportunities, we also consider other potential capital allocation alternatives. Other alternatives for capital deployment depend on our current outlook and include further debt reduction and dividend increases.
Lead in Energy Transition Over Time
As the global population grows and standards of living continue to improve around the world, we expect energy demand to rise. We, and our society, increasingly recognize the need for secure and reliable energy while concurrently reducing global GHG emissions. Accordingly, energy systems around the world are being reshaped as industry participants, regulators, and consumers seek to balance these factors. As a diversified energy infrastructure company, we believe that we are well positioned to play a key role in the energy transition by lowering the emission-intensity of the conventional fuels we transport and store, supporting the switching from higher emission energy sources to lower-carbon options for our customers, and leading the development and construction of future lower-carbon energy infrastructure that the world needs, along with regulators, policy makers, and other key stakeholders.
We believe that diversification and innovation will play a significant role in the transition to a lower-emission future. To date, we have made large investments in natural gas infrastructure, emissions reduction technologies, and renewable energy assets, helping to decrease our emissions and further expand our platforms to enable energy transition across the globe. Our focus areas in renewable energy remain in offshore wind, utility-scale onshore projects, and integrated clean-energy offerings and solutions for customers. We are also taking a leadership role in other lower-carbon platforms like RNG, blue ammonia, CCS, and H2 where we can leverage our infrastructure, capabilities, and stakeholder relationships to accelerate growth and extend the value of our existing assets. Additionally, all our new investments need to have a clear path to achieve net-zero emissions, in alignment with our ESG goals.
We work closely with our customers and stakeholders to maintain a pulse on the pace of the energy transition and are actively leveraging our ESG leadership and world-class execution capabilities to advance our positioning as a differentiated energy provider. We regularly test our assets under various transition scenarios to ensure the resiliency of our business.
STRATEGIC ENABLERS
To successfully execute on our strategy and build competitive advantage, we focus on having leading-edge capabilities in ESG, talent, technology, operations, development, and growth capabilities.
Environmental, Social and Governance
Sustainability is integral to our ability to deliver energy in a safe and reliable manner. How well we perform as a steward of our environment; as a safe operator of essential energy infrastructure; as a diverse and inclusive employer; and as a responsible corporate citizen is inextricably linked to our ability to achieve our strategic priorities and create long-term value for all our stakeholders.
12
In 2023, we published our 22nd annual Sustainability Report outlining our progress against our ESG goals1. In particular, we:
•made meaningful progress towards our interim emissions intensity and net-zero GHG emissions goals through modernization and innovation of our system, and continued investment in solar self-power, front of the meter renewables, and execution of additional renewable power PPAs;
•enhanced our efforts to ensure that our workforce and the Board better reflect the diversity of our communities, empowering our workforce through employee resource groups and advancing on our diversity, equity, and inclusion commitments; and
•continued to drive improvements towards our goal of zero safety incidents and injuries and progressed implementation of robust cyber defense programs.
Since setting our ESG goals in 2020, we have made considerable progress integrating sustainability into our strategy, governance, operations, and decision-making. We have linked ESG performance to incentive compensation and are making meaningful progress towards these goals by executing on our action plans.
We aim to continuously strengthen our ESG approach and are undertaking the following additional actions:
•proactively working with organizations that are advancing emissions measurement and reduction guidelines for the midstream sector;
•collaborating with key suppliers on emissions reduction plans;
•further developing lower-carbon energy partnerships to drive innovation across our businesses, with a focus on renewable power, RNG, H2 and CCS; and
•continue to advance our commitment to meaningful reconciliation and to building respectful and collaborative Indigenous partnerships.
We provide annual progress updates in our annual Sustainability Report which can be found at https://www.enbridge.com/sustainability-reports. Unless otherwise specifically stated, none of the information contained on, or connected to, the Enbridge website, including our annual Sustainability Report, is incorporated by reference in, or otherwise part of, this Annual Report on Form 10-K.
Talent
Our employees are essential to our success and our focus remains on enhancing the capabilities and skills of our people. We are evolving our talent strategy enhancing our employee experience, and growing our focus on learning and development. We value diversity and diverse thought, and have embedded inclusive practices in our programs, processes, and approach to people management. Furthermore, we strive to maintain industry-competitive compensation, flexibility, and retention programs that provide both short- and long-term performance incentives.
Technology
We recognize the vital role technology plays in helping us achieve our strategic objectives. We are committed to pursuing innovation and technology solutions that further our safety and reliability, maximize revenues, improve efficiencies, and enable transition to new, cleaner energy solutions. We continue to focus on resilience and reliability of our systems from a cybersecurity perspective and work to enhance our capabilities and educate our workforce to protect our critical infrastructure system from increasing threats.
1All percentages or specific goals regarding inclusion, diversity, equity and accessibility are aspirational goals which we intend to achieve in a manner compliant with state, local, provincial and federal law, including, but not limited to, US federal regulations, Equal Employment Opportunity Commission, Department of Labor and Office of Federal Contract Compliance Programs.
13
Operations & Development
As a major infrastructure developer and operator, Enbridge focuses on excellence in our business, specifically in safety, regulatory, project execution, and efficiency. Safety is foundational at Enbridge and our safety-first mindset reflects our commitment to protecting the public, our workers, the environment, and the health of our pipelines and facilities. We recognize the importance of having strong trusted relationships with our regulators as we plan and execute projects and sustain ongoing operations. We are committed to being proactive on regulatory matters at the federal, regional, and local levels to ensure we develop and maintain a safe and reliable energy system that our customers and the public can count on.
Robust project development, execution, governance, stakeholder relations, and supply chain processes are also key to delivering projects on time, at high quality, and within estimated costs. We continually seek ways to improve our organizational efficiency and effectiveness across all our core functions, including by streamlining structures, simplifying processes, improving accountability, and effectively managing risk to drive top-tier performance.
Growth Capabilities
To achieve our vision and mission, we emphasize specific capabilities that will help us grow and build competitive advantage within our core and potential new businesses. We are increasing our focus on our customers to ensure we are responsive to their needs while also proactively helping them meet their decarbonization objectives. We are continuing to invest in leading corporate development capabilities to ensure we can identify and execute on attractive capital recycling opportunities and acquisitions. Finally, we believe that the future energy system will not only continue to be highly integrated, but also become more complex. This will require an ecosystem of stakeholders, from customers and lenders to original equipment manufacturers and regulators, to develop and manage. We believe it is critical to have strengths in partnership structuring and relationship management to build and maintain the robust energy infrastructure system that the world needs.
BUSINESS SEGMENTS
During 2023, the activities were carried out through five business segments: Liquids Pipelines; Gas Transmission and Midstream; Gas Distribution and Storage; Renewable Power Generation; and Energy Services, as discussed below.
14
LIQUIDS PIPELINES
Liquids Pipelines consists of pipelines and terminals in Canada and the US that transport and export various grades of crude oil and other liquid hydrocarbons.
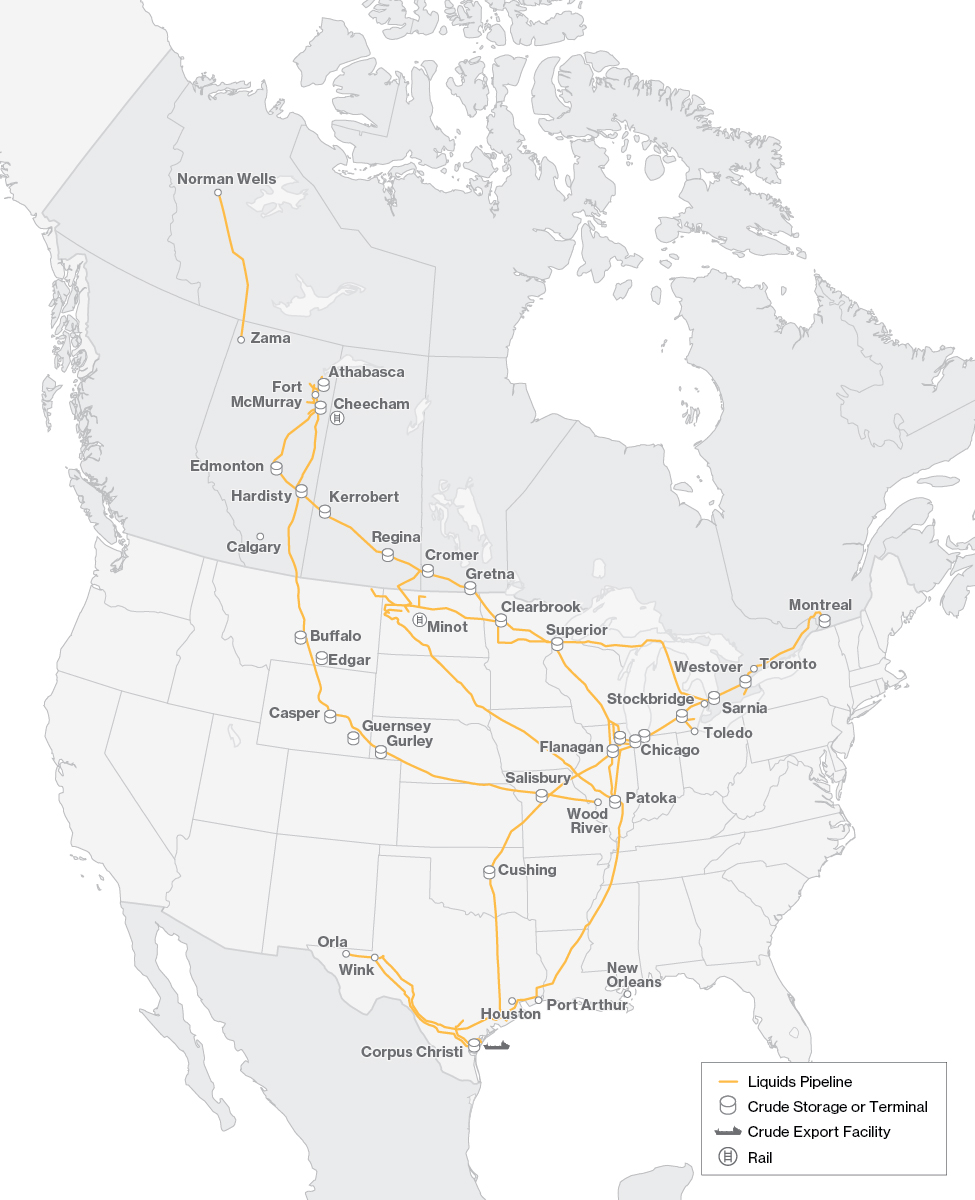
15
MAINLINE SYSTEM
The Mainline System is comprised of the Canadian Mainline and the Lakehead System. The Canadian Mainline is a common carrier pipeline system which transports various grades of crude oil and other liquid hydrocarbons within western Canada and from western Canada to the Canada/US border near Gretna, Manitoba and Neche, North Dakota and from the US/Canada border near Port Huron, Michigan and Sarnia, Ontario to eastern Canada. The Canadian Mainline includes six adjacent pipelines with a combined operating capacity of approximately 3.2 million barrels per day (mmbpd) that connect with the Lakehead System at the Canada/US border, as well as five pipelines that deliver crude oil and refined products into eastern Canada. Through our predecessors, we have operated, and frequently expanded, the Canadian Mainline since 1949. The Lakehead System is the portion of the Mainline System in the US. It is an interstate common carrier pipeline system regulated by the Federal Energy Regulatory Commission (FERC) and is the primary transporter of crude oil and liquid petroleum from western Canada to the US.
Tolling Framework
The Competitive Toll Settlement (CTS) which governed tolls on the Canadian Mainline, with the exception of Lines 8 and 9 which are tolled on a separate basis, expired on June 30, 2021. The CTS was a 10-year negotiated agreement and provided for a Canadian Local Toll for deliveries within western Canada, as well as an International Joint Tariff (IJT) for crude oil shipments originating in western Canada, on the Canadian Mainline, and delivered into the US, via the Lakehead System, and into eastern Canada. The IJT tolls were denominated in US dollars.
Enbridge has reached an agreement on a negotiated settlement with shippers for tolls on its Mainline System. The Mainline Tolling Settlement (MTS) covers both the Canadian and US portions of the Mainline and would see the Mainline continuing to operate as a common carrier system available to all shippers on a monthly nomination basis. The MTS is subject to regulatory approval and the term is seven and a half years through the end of 2028, with revised interim tolls effective on July 1, 2023.
The MTS includes:
•an IJT, for heavy crude oil movements from Hardisty to Chicago, comprised of a Canadian Mainline Toll of $1.65 per barrel plus a Lakehead System Toll of US$2.57 per barrel, plus the applicable Line 3 Replacement surcharge;
•toll escalation for operation, administration, and power costs tied to US consumer price and power indices;
•tolls that continue to be distance and commodity adjusted, and utilize a dual currency IJT; and
•a financial performance collar providing incentives for Enbridge to optimize throughput and cost, but also providing downside protection in the event of extreme supply or demand disruptions or unforeseen operating cost exposure. This performance collar is intended to ensure the Mainline earns 11% to 14.5% returns, on a deemed 50% equity capitalization, which is similar to the returns earned on average during the previous tolling agreement.
Approximately 70% of Mainline deliveries are tolled under this settlement, while approximately 30% of deliveries are tolled on a full path basis to markets downstream of the Mainline. The other continuing feature is that the Mainline toll flexes up or down US$0.035 per barrel for 50,000 barrel per day changes in throughput.
The expected financial outcome from this settlement is in line with previously reported financial results after taking into consideration the previously recognized provision, inflationary cost adjustments and increased volumes. Enbridge filed an application with the Canada Energy Regulator (CER) for approval of the MTS on December 15, 2023, with unanimous support from its Representative Stakeholder Group. The CER indicated in its process letter that no dissenting comments were received by January 19, 2024 and that it may decide on the application or it may establish further process steps.
16
Lakehead System Local Tolls
Transportation rates are governed by the FERC for deliveries from the Canada/US border near Neche, North Dakota, Clearbrook, Minnesota and other points to principal delivery points on the Lakehead System. The Lakehead System periodically adjusts these transportation rates as allowed under the FERC’s index methodology and tariff agreements, the main components of which are index rates and the Facilities Surcharge Mechanism. Index rates, the base portion of the transportation rates for the Lakehead System, are subject to an annual inflationary adjustment which cannot exceed established ceiling rates as approved by the FERC. The Facilities Surcharge Mechanism allows the Lakehead System to recover costs associated with certain shipper-requested projects through an incremental surcharge in addition to the existing base rates and is subject to annual adjustment on April 1 of each year.
On May 24, 2023, Enbridge filed an Offer of Settlement with the FERC for the Lakehead System (the Lakehead System Settlement). In addition to resolving litigation related to the Index portion of the Lakehead System rate, the Lakehead System Settlement also includes a depreciation truncation date of December 31, 2048 for the rate base applicable to the Index and Facilities Surcharge and agreement on the terms for future recovery through the Facilities Surcharge of costs related to two Line 5 projects: the Wisconsin Relocation Project and the Straits of Mackinac Tunnel. The Lakehead System Settlement was certified by the Settlement Judge on June 23, 2023 and was approved by the FERC Commissioners on November 27, 2023. Lakehead System tolls were revised effective December 1, 2023 to reflect the terms of the Lakehead System Settlement.
REGIONAL OIL SANDS SYSTEM
The Regional Oil Sands System includes seven intra-Alberta long-haul pipelines: the Athabasca Pipeline, Waupisoo Pipeline, Woodland and Woodland Extension Pipelines, Wood Buffalo and Wood Buffalo Extension/Athabasca Twin pipeline system and the Norlite Pipeline System (Norlite), as well as two large terminals: the Athabasca Terminal located north of Fort McMurray, Alberta and the Cheecham Terminal, located south of Fort McMurray, Alberta. The Regional Oil Sands System also includes numerous laterals and related facilities which currently provide access for oil sands production from the three major oil sands deposits, Athabasca, Cold Lake and Peace River.
The combined capacity of the intra-Alberta long-haul pipelines is approximately 1,120 thousand barrels per day (kbpd) to Edmonton and 1,415 kbpd into Hardisty, with Norlite providing approximately 218 kbpd of diluent capacity into the Fort McMurray region. We have a 50% interest in the Woodland Pipeline and a 70% interest in Norlite. The Regional Oil Sands System is anchored by long-term agreements with multiple oil sands producers that provide cash flow stability and also include provisions for the recovery of some of the operating costs of this system.
On October 5, 2022, we completed a transaction with Athabasca Indigenous Investments Limited Partnership (Aii), a newly created entity representing 23 First Nation and Metis communities, pursuant to which Aii acquired an 11.6% non-operating interest in the seven intra-Alberta long-haul pipelines in the Regional Oil Sands System.
GULF COAST AND MID-CONTINENT
Gulf Coast includes Flanagan South, Spearhead Pipeline, Seaway Crude Pipeline System (Seaway Pipeline), the Mid-Continent System (Cushing Terminal), Gray Oak, and the EIEC.
Flanagan South is a 950 kilometer (590 mile), 36-inch diameter interstate crude oil pipeline that originates at our terminal at Flanagan, Illinois, a delivery point on the Lakehead System, and terminates in Cushing, Oklahoma. Flanagan South has a capacity of approximately 660 kbpd.
17
Spearhead Pipeline is a long-haul pipeline that delivers crude oil from Flanagan, Illinois, a delivery point on the Lakehead System, to Cushing, Oklahoma. The Spearhead Pipeline has a capacity of approximately 193 kbpd.
We have a 50% interest in the 1,078 kilometer (670 mile) Seaway Pipeline, including the 805 kilometer (500 mile), 30-inch diameter long-haul system between Cushing, Oklahoma and Freeport, Texas, as well as the Texas City Terminal and Distribution System which serve refineries in the Houston and Texas City areas. Total aggregate capacity on the Seaway Pipeline system is approximately 950 kbpd. Seaway Pipeline also includes 8.8 million barrels of crude oil storage tank capacity on the Texas Gulf Coast.
The Mid-Continent System is comprised of storage terminals at Cushing Terminal, consisting of over 110 individual storage tanks ranging in size from 78 to 570 thousand barrels. Total storage shell capacity of Cushing Terminal is approximately 26 million barrels. A portion of the storage facilities are used for operational purposes, while the remainder are contracted to various crude oil market participants for their term storage requirements. Contract fees include fixed monthly storage fees, throughput fees for receiving and delivering crude to and from connecting pipelines and terminals, and blending fees.
Gray Oak is a 1,368 kilometer (850 mile) crude oil system, with origination points in the Eagle Ford and Permian Basins in West Texas. Gray Oak has delivery points at the US Gulf Coast and Houston refining region. It has an expected average annual capacity of 900 kbpd and transports light crude oil. During December 31, 2023, our effective economic interest in Gray Oak increased to 68.5% from 58.5% as a result of our acquisition of Rattler Midstream’s 10% interest in the pipeline. We assumed operatorship of Gray Oak in April 2023.
In October 2021, we acquired Moda Midstream Operating, LLC, which included the EIEC, located near Corpus Christi, Texas. This terminal is comprised of 15.6 million barrels of storage and 1.5 mmbpd of export capacity. We also acquired a 20% interest in the 670-kbpd Cactus II Pipeline, a 100% interest in the 300-kbpd Viola Pipeline, and a 100% interest in the 350-thousand-barrel Taft Terminal. In November 2022, we acquired an additional 10% ownership interest in Cactus II Pipeline, bringing our total non-operating ownership to 30%.
OTHER
Other includes Southern Lights Pipeline, Express-Platte System, Bakken System and Feeder Pipelines and Other.
Southern Lights Pipeline is a single stream 180 kbpd 16/18/20-inch diameter pipeline that ships diluent from the Manhattan Terminal near Chicago, Illinois to three western Canadian delivery facilities, located at the Edmonton and Hardisty terminals in Alberta and the Kerrobert terminal in Saskatchewan. Both the Canadian portion of Southern Lights Pipeline and the US portion of Southern Lights Pipeline receive tariff revenues under long-term contracts with committed shippers. Southern Lights Pipeline capacity is 90% contracted with the remaining 10% of the capacity assigned for shippers to ship uncommitted volumes. A fully subscribed open season was completed in December 2023, which has ensured contract levels remain at 90% through mid-2030,
18
The Express-Platte System consists of the Express Pipeline and the Platte Pipeline, and crude oil storage of approximately 5.6 million barrels. It is an approximate 2,736 kilometer (1,700 mile) long crude oil transportation system, which begins at Hardisty, Alberta, and terminates at Wood River, Illinois. The 310 kbpd Express Pipeline carries crude oil to US refining markets in the Rocky Mountains area, including Montana, Wyoming, Colorado and Utah. The 145 to 164 kbpd Platte Pipeline, which interconnects with the Express Pipeline at Casper, Wyoming, transports crude oil predominantly from the Bakken shale and western Canada to refineries in the Midwest. The Express Pipeline capacity is typically committed under long-term take-or-pay contracts with shippers. A small portion of the Express Pipeline capacity and all of the Platte Pipeline capacity is used by uncommitted shippers who pay only for the pipeline capacity they actually use in a given month.
The Bakken System consists of the North Dakota System and the Bakken Pipeline System. The North Dakota System services the Bakken Basin in North Dakota and is comprised of a crude oil gathering and interstate pipeline transportation system. The gathering system provides delivery to Clearbrook, Minnesota for service on the Lakehead system or a variety of interconnecting pipelines. The interstate portion of the system has both US and Canadian components that extend from Berthold, North Dakota into Cromer, Manitoba.
Tariffs on the US portion of the North Dakota System are regulated by the FERC. The Canadian portion is categorized as a Group 2 pipeline, and as such, its tolls are regulated by the CER on a complaint basis.
We have an effective 27.6% interest in the Bakken Pipeline System, which connects the Bakken Basin in North Dakota to markets in eastern PADD II and the US Gulf Coast. The Bakken Pipeline System consists of the Dakota Access Pipeline from the Bakken area in North Dakota to Patoka, Illinois, and the Energy Transfer Crude Oil Pipeline from Patoka, Illinois to Nederland, Texas. Current capacity is approximately 750 kbpd of crude oil with the potential to be expanded through additional pumping horsepower. The Bakken Pipeline System is anchored by long-term throughput commitments from a number of producers.
Feeder Pipelines and Other includes a number of liquids storage assets and pipeline systems in Canada and the US.
Key assets included in Feeder Pipelines and Other are the Hardisty Contract Terminal and Hardisty Storage Caverns located near Hardisty, Alberta, a key crude oil pipeline hub in western Canada and the Southern Access Extension (SAX) Pipeline which originates in Flanagan, Illinois and delivers to Patoka, Illinois. We have an effective 65% interest in the 300 kbpd SAX pipeline. The majority of the SAX Pipeline's capacity is commercially secured under long-term take-or-pay contracts with shippers.
Feeder Pipelines and Other also includes Patoka Storage, the Toledo pipeline system and the Norman Wells (NW) System. Patoka Storage is comprised of four storage tanks with 480 thousand barrels of shell capacity located in Patoka, Illinois. The 180 kbpd Toledo pipeline system connects with the Lakehead System and delivers to Ohio and Michigan. The 45 kbpd NW System transports crude oil from Norman Wells in the Northwest Territories to Zama, Alberta and has a cost-of-service rate structure based on established terms with shippers.
COMPETITION
Competition for our liquids pipelines network comes primarily from infrastructure or logistics alternatives (rail, trucking) that transport liquid hydrocarbons from production basins in which we operate to markets in Canada, the US and internationally. Competition from existing and proposed pipelines, such as the Trans Mountain Pipeline expansion, is based primarily on access to supply, end use markets, the cost of transportation, contract structure and the quality and reliability of service. Additionally, volatile crude price differentials and insufficient pipeline capacity on either our or competitors' pipelines can make transportation of crude oil by rail competitive, particularly to markets not currently served by pipelines.
19
We believe that our liquids pipelines systems will continue to provide competitive and attractive options to producers in the Western Canadian Sedimentary Basin (WCSB), North Dakota, and the Permian Basin, due to our market access, competitive tolls and flexibility through our multiple delivery and storage points. We also employ long-term agreements with shippers, which mitigates competition risk by ensuring consistent supply to our liquids pipelines network. We have a proven track record of successfully executing projects to meet the needs of our customers.
SUPPLY AND DEMAND
We have an established and successful history of being the largest transporter of crude oil to the US, the world’s largest market for crude oil. We expect US demand for Canadian crude oil production will support the use of our infrastructure for the foreseeable future.
Under most base case forecasts, demand is expected to grow into the next decade, primarily driven by emerging economies in regions outside the Organization for Economic Cooperation and Development (OECD), such as India and China. In North America, demand growth for transportation fuels is expected to moderate over time due to vehicle fuel efficiency improvement and increasing sales of electric vehicles.
Due to the accelerated developments of offshore production in both Brazil and Guyana and continued growth from Canada and the US, it is expected that Organization of Petroleum Exporting Countries (OPEC) will try to manage prices with continued quota constraints, delaying its growth from its supply. However, production in some OPEC countries, like Iran and Venezuela, has the potential to increase from current levels. In the US, growth will likely be driven by the Permian Basin, a large and cost competitive light crude oil resource base. In addition, heavy crude oil growth is expected from the WCSB as additional egress availability will likely support expansion of existing projects and some potential new greenfield facilities.
Our Mainline System was effectively fully utilized in 2023 delivering 3.2 mmbpd. Refinery demand in the upper Midwest PADD II market has been strong. On the US Gulf Coast, lower supply of heavy crude from Latin America and the Middle East is driving increased demand for Canadian heavy crude. Many of the refineries connected to the Mainline System are complex and competitive in the global context.
The anticipated combination of long-term demand growth in non-OECD nations, domestic demand contraction over time, and continued production growth in the Permian Basin and WCSB highlights the importance of our strategic asset footprint and reinforces the need for additional export-oriented infrastructure. We believe that we are well positioned to meet these evolving supply and demand fundamentals through expansion of system capacity for incremental access to the US Gulf Coast, and through further development of our EIEC in Corpus Christi, the largest crude oil export facility in North America.
Opposition to fossil fuel development in conjunction with evolving consumer preferences and new technology could underpin energy transition scenarios impacting long-term supply and demand of crude oil. We continue to closely monitor the evolution of all of these factors to be able to pro-actively adapt our business to help meet our customers’ and society’s energy needs.
20
GAS TRANSMISSION AND MIDSTREAM
Gas Transmission and Midstream consists of our investments in natural gas pipelines and gathering and processing facilities in Canada and the US, including US Gas Transmission, Canadian Gas Transmission, US Midstream and other assets.
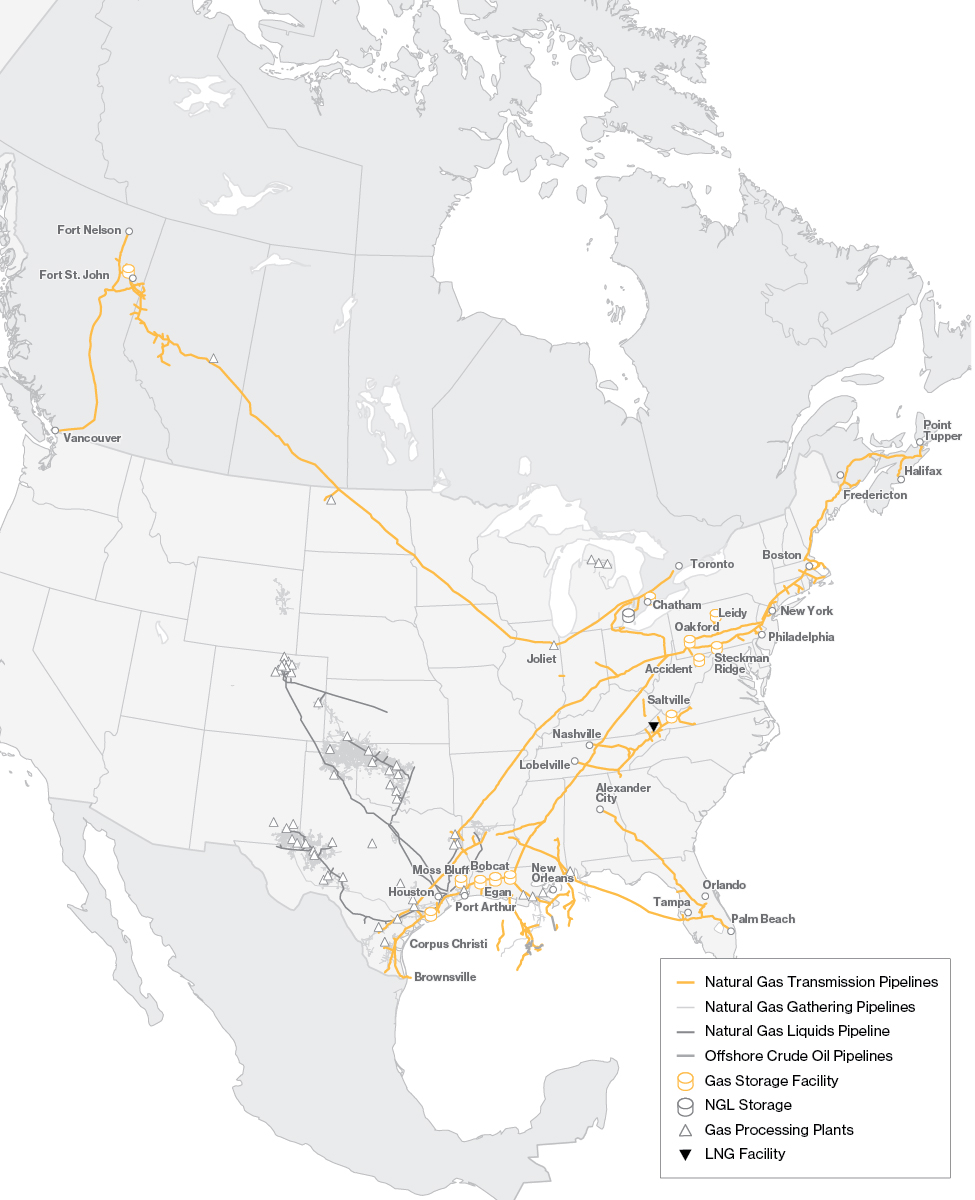
21
US GAS TRANSMISSION
US Gas Transmission includes ownership interests in Texas Eastern Transmission, LP (Texas Eastern), Algonquin Gas Transmission, LLC (Algonquin), Maritimes & Northeast (M&N) (US and Canada), East Tennessee Natural Gas, LLC (East Tennessee), Gulfstream Natural Gas System, L.L.C. (Gulfstream), Sabal Trail Transmission, LLC (Sabal Trail), NEXUS Gas Transmission, LLC (NEXUS), Valley Crossing Pipeline, LLC (Valley Crossing), Southeast Supply Header, LLC (SESH), Vector Pipeline L.P. (Vector) and certain other gas pipeline and storage assets. The US Gas Transmission business primarily provides transmission and storage of natural gas through interstate pipeline systems for customers in various regions of the northeastern, southern and midwestern US.
The Texas Eastern interstate natural gas transmission system extends from supply and demand centers in the Gulf Coast region of Texas and Louisiana to supply and demand centers in Ohio, Pennsylvania, New Jersey and New York. Texas Eastern's onshore system has a peak day capacity of 12.0 billion cubic feet per day (bcf/d) of natural gas on approximately 13,765 kilometers (8,553 miles) of pipeline and associated compressor stations. Texas Eastern is also connected to five affiliated storage facilities that are partially or wholly-owned by other entities within the US Gas Transmission business, including the Tres Palacios storage facility that we acquired on April 3, 2023.
The Algonquin interstate natural gas transmission system connects with Texas Eastern’s facilities in New Jersey and extends through New Jersey, New York, Connecticut, Rhode Island and Massachusetts where it connects to M&N US. The system has a peak day capacity of 3.1 bcf/d of natural gas on approximately 1,820 kilometers (1,131 miles) of pipeline with associated compressor stations.
M&N US has a peak day capacity of 0.8 bcf/d of natural gas on approximately 552 kilometers (343 miles) of mainline interstate natural gas transmission system, including associated compressor stations, which extends from northeastern Massachusetts to the border of Canada near Baileyville, Maine. M&N Canada has a peak day capacity of 0.5 bcf/d on approximately 885 kilometers (550 miles) of interprovincial natural gas transmission mainline system that extends from Goldboro, Nova Scotia to the US border near Baileyville, Maine. We have a 78% interest in M&N US and M&N Canada.
East Tennessee’s interstate natural gas transmission system has a peak day capacity of 1.9 bcf/d of natural gas, crosses Texas Eastern’s system at two locations in Tennessee and consists of two mainline systems totaling approximately 2,449 kilometers (1,522 miles) of pipeline in Tennessee, Georgia, North Carolina and Virginia, with associated compressor stations. East Tennessee has a LNG storage facility in Tennessee and also connects to the Saltville storage facilities in Virginia.
Valley Crossing is an approximately 285 kilometer (177 mile) intrastate natural gas transmission system, with associated compressor stations. The pipeline infrastructure is located in Texas and provides market access of up to 2.6 bcf/d of design capacity to the Comisión Federal de Electricidad, Mexico’s state-owned utility.
Vector is an approximately 560 kilometer (348 mile) pipeline travelling between Joliet, Illinois in the Chicago area and Ontario. Vector can deliver 1.7 bcf/d of natural gas, of which 455 million cubic feet per day (mmcf/d) is leased to NEXUS. We have a 60% interest in Vector.
Gulfstream is an approximately 1,199 kilometer (745 mile) interstate natural gas transmission system with associated compressor stations. Gulfstream has a peak day capacity of 1.4 bcf/d of natural gas from Mississippi, Alabama, Louisiana and Texas, crossing the Gulf of Mexico to markets in central and southern Florida. We have a 50% interest in Gulfstream.
22
Sabal Trail is an approximately 832 kilometer (517 mile) interstate pipeline that provides firm natural gas transportation. Facilities include a pipeline, laterals and various compressor stations. The pipeline infrastructure is located in Alabama, Georgia and Florida, and adds approximately 1.0 bcf/d of capacity enabling the access of onshore gas supplies. We have a 50% interest in Sabal Trail.
NEXUS is an approximately 414 kilometer (257 mile) interstate natural gas transmission system with associated compressor stations. NEXUS transports natural gas from our Texas Eastern system in Ohio to our Vector interstate pipeline in Michigan, with peak day capacity of 1.4 bcf/d. Through its interconnect with Vector, NEXUS provides a reconciliationconnection to Dawn Hub, the largest integrated underground storage facility in Canada and one of thenon-GAAPmeasures largest in North America, located in southwestern Ontario adjacent to comparable GAAP measures.the Greater Toronto Area. We have a 50% interest in NEXUS.
SESH is an approximately 462 kilometer (287 mile) interstate natural gas transmission system with associated compressor stations. SESH extends from the Perryville Hub in northeastern Louisiana where the shale gas production of eastern Texas, northern Louisiana and Arkansas, along with conventional production, is reached from six major interconnections. SESH extends to Alabama, interconnecting with 14 major north-south pipelines and three high-deliverability storage facilities and has a peak day capacity of 1.1 bcf/d of natural gas. We have a 50% interest in SESH.
Transmission and storage services are generally provided under firm agreements where customers reserve capacity in pipelines and storage facilities. The vast majority of these agreements provide for fixed reservation charges that are paid monthly regardless of the actual volumes transported on the pipelines, plus a small variable component that is based on volumes transported, injected or withdrawn, which is intended to recover variable costs.
Interruptible transmission and storage services are also available where customers can use capacity if it exists at the time of the request and are generally at a higher toll than long-term contracted rates. Interruptible revenues depend on the amount of volumes transported or stored and the associated rates for this service. Storage operations also provide a variety of other value-added services including natural gas parking, loaning and balancing services to meet customers’ needs.
CANADIAN GAS TRANSMISSION
Canadian Gas Transmission is comprised of Westcoast Energy Inc.’s (Westcoast) British Columbia (BC) Pipeline, Alliance Pipeline and other minor midstream gas gathering pipelines. It also includes the Aitken Creek Gas Storage facility, located in BC, Canada, which we acquired on November 1, 2023.
BC Pipeline provides natural gas transmission services, transporting processed natural gas from facilities located primarily in northeastern BC to markets in BC and the US Pacific Northwest. It has a peak day capacity of 3.6 bcf/d of natural gas on approximately 2,950 kilometers (1,833 miles) of transmission pipeline in BC and Alberta, as well as associated mainline compressor stations. BC Pipeline is regulated by the CER under cost-of-service regulation.
Alliance Pipeline is an approximately 3,000 kilometer (1,864 mile) integrated, high-pressure natural gas transmission pipeline with approximately 860 kilometers (534 miles) of lateral pipelines and related infrastructure. It transports liquids-rich natural gas from northeast BC, northwest Alberta and the Bakken area in North Dakota to the Alliance Chicago gas exchange hub downstream of the Aux Sable Liquid Products LP NGL extraction and fractionation plant at Channahon, Illinois. The system has a peak day capacity of 1.8 bcf/d of natural gas. We have a 50% interest in Alliance Pipeline.
On December 13, 2023, we announced that Enbridge has entered into a definitive agreement to sell our 50.0% interest in the Alliance Pipeline and our interest in Aux Sable (including 42.7% interest in Aux Sable Midstream LLC and Aux Sable Liquid Products L.P., and 50% interest in Aux Sable Canada LP) to Pembina Pipeline Corporation for $3.1 billion, including approximately $0.3 billion of non-recourse debt, subject to customary closing adjustments. Closing is expected to occur in the first half of 2024, subject to the receipt of regulatory approvals and satisfaction of customary closing conditions.
The majority of transportation services provided by Canadian Gas Transmission are under firm agreements, which provide for fixed reservation charges that are paid monthly regardless of actual volumes transported on the pipeline, plus a small variable component that is based on volumes transported to recover variable costs. Canadian Gas Transmission also provides interruptible transmission services where customers can use capacity if it is available at the time of request. Payments under these services are based on volumes transported.
US MIDSTREAM
US Midstream includes a 42.7% interest in each of Aux Sable Liquid Products LP and Aux Sable Midstream LLC, and a 50% interest in Aux Sable Canada LP (collectively, Aux Sable). Aux Sable Liquid Products LP owns and operates a NGL extraction and fractionation plant at Channahon, Illinois, outside Chicago, near the terminus of Alliance Pipeline. Aux Sable also owns facilities connected to Alliance Pipeline that facilitatedelivery of liquids-rich natural gas for processing at the Aux Sable plant. These facilities include the Palermo Conditioning Plant and the Prairie Rose Pipeline in the Bakken area of North Dakota, owned and operated by Aux Sable Midstream US, and Aux Sable Canada’s interests in the Montney area of BC, comprising the Septimus Pipeline. Aux Sable Canada also owns a facility which processes refinery/upgrader offgas in Fort Saskatchewan, Alberta.
As of August 17, 2022, US Midstream also includes a 13.2% effective economic interest in DCP Midstream, LP (DCP). Prior to August 17, 2022, we had a 28.3% effective economic interest in DCP. DCP is a joint venture, with a diversified portfolio of assets, engaged in the business of gathering, compressing, treating, processing, transporting, storing and selling natural gas; producing, fractionating, transporting, storing and selling NGL; and recovering and selling condensate. DCP owns and operates more than 36 plants and approximately 86,905 kilometers (54,000 miles) of natural gas and NGL pipelines, with operations in nine states across major producing regions.
OTHER
Other consists primarily of our offshore assets. Enbridge Offshore Pipelines is comprised of 12 natural gas gathering and FERC regulated transmission pipelines and five oil pipelines. These pipelines are located in four major corridors in the Gulf of Mexico, extending to deepwater developments, and include almost 2,200 kilometers (1,365 miles) of underwater pipe and onshore facilities with total capacity of approximately 6.6 bcf/d.
In 2023, Enbridge acquired a 10% equity investment in Divert Inc., a RNG infrastructure company, which provides Enbridge with an option to invest up to $1.3 billion (US$1.0 billion) in food waste to RNG projects across the US.
On January 2, 2024, through a wholly-owned US subsidiary, we acquired the first six Morrow Renewables operating landfill gas-to-RNG production facilities located in Texas and Arkansas. The acquired assets align with and advance our low-carbon strategy.
COMPETITION
Our natural gas transmission and storage businesses compete with similar facilities that serve our supply and market areas in the transmission and storage of natural gas. The principal elements of competition are location, rates, terms of service, flexibility and reliability of service.
24
The natural gas transported in our business competes with other forms of energy available to our customers and end-users, including electricity, coal, propane, fuel oils, nuclear and renewable energy. Factors that influence the demand for natural gas include price changes, the availability of natural gas and other forms of energy, levels of business activity, long-term economic conditions, conservation, legislation, governmental regulations, the ability to convert to alternative fuels, weather and other factors.
Competitors predominantly include interstate/interprovincial and intrastate/intraprovincial pipelines or their affiliates and other midstream businesses that transport, gather, treat, process and market natural gas or NGL. Because pipelines are generally the most efficient mode of transportation for natural gas over land, the most significant competitors of our natural gas pipelines are other pipeline companies.
SUPPLY AND DEMAND
Our gas transmission assets make up one of the largest natural gas transportation networks in North America, driving connectivity between prolific supply basins and major demand centers within the continent. Our systems have been integral to the transition in supply and demand markets over the last decade, and we expect to continue to play a part as the energy landscape evolves.
Natural gas production in the Appalachian and Permian Basins has grown dramatically in the past decade. Today, these regions produce more than 53 bcf/d of natural gas on a combined basis. Improved technology and increased shale gas drilling have increased the supply of low-cost natural gas. As well, there has been, and continues to be, a corresponding increase in demand for our natural gas infrastructure in North America. Through a series of expansions and reversals on our core systems, combined with the execution of greenfield projects and strategic acquisitions, we have been able to meet the needs of both producers and consumers. Our US Gas Transmission systems were initially designed to transport natural gas from the Gulf Coast to the supply-constrained northeast markets. Our asset base now has the capability to transport diverse bi-directional supply to the northeast, southeast, Midwest, Gulf Coast and LNG markets on a fully subscribed and highly utilized basis.
The northeast market continues its role as a predominantly supply constrained region with steady demand. The bi-directional capabilities offered by our US Gas Transmission system allow us to deliver in an efficient manner to our regional customers. The region has seen an increase in natural gas supply due to the development of the Marcellus and Utica shales in the Appalachia region.
The southeast market is linked to multiple, highly liquid supply pools that include the Marcellus and Utica shale developments, offering consistent supply and stable pricing to a growing population of end-use customers across our multiple systems under long-term, utility-like arrangements.
With connectivity to Appalachian and western Canadian supply through our systems, the Midwest market has access to two of the lowest cost gas producing regions on the continent. As demand in the region is expected to remain stable over the next decade, maintaining this link will remain important. Flexibility in supply for this market is especially critical to maintaining liquidity and price stability as natural gas continues to replace coal-fired generation.
Gulf Coast demand growth is being driven by an increase in the volume of LNG exports, an ongoing wave of gas-intensive petrochemical facilities and additional pipeline exports to Mexico. Demand in these markets in the region is anticipated to grow by approximately 20 bcf/d through 2040. The Gulf Coast market has been the beneficiary of low-cost capacity on our assets as the relationship between supply and market centers has shifted. Such cost-effective capacity is difficult to access or replicate, offering existing shippers and transporters stability of capacity and utilization. Tide-water market access and proximity to Mexico continue to make this region a platform of global trade as pipeline and LNG exports continue their growth trajectory. In 2023, the US exported over 11.9 bcf/d of natural gas to LNG markets, primarily from the Gulf Coast region.
25
Western Canada is also a source of low-cost supply seeking access to premium markets in North America and globally. One of the few vital links to demand centers in the Pacific Northwest is our own systems in the region, which are highly utilized. The continental supply profile has shifted to natural gas shale plays such as the Montney and Duvernay within western Canada. These plays will fulfill an integral role as Canada enters the global market as an LNG exporter. Western Canada's production is forecasted to increase from 18 bcf/d in 2023 to 22 bcf/d by 2040. This growth will support an additional 4 bcf/d of LNG exports. These supply shifts have shaped our growth strategies and affect the nature of the projects anticipated in the capital expenditures discussed below in Part II. Item 7. Management’s Discussion and Analysis of Financial Condition and Results of Operations - Growth Projects - Commercially Secured Projects.
Global energy demand is expected to increase approximately 21% by 2050, according to the recently released International Energy Agency’s Stated Policy Scenario, driven primarily by economic growth in non-OECD countries. According to the Stated Policy Scenario, natural gas will play an important role in meeting this energy demand, and gas consumption is anticipated to grow by approximately 11% during this period as one of the world’s most significant energy sources. North American exports are expected to play a significant part in meeting global demand, underscoring the ability of our assets to remain highly utilized by shippers, and highlighting the need for incremental transportation solutions across North America, as well as for the further build-out of export facilities to meet international demand.
The long-term effects on global gas markets of the ongoing conflict in Ukraine remain uncertain. In 2022, Europe saw a sharp rise in natural gas prices due to a decrease in supply from Russia. Global LNG markets responded, and LNG cargoes were redirected from the Asian market to Europe which allowed Europe to meet peak demand during what turned out to be a mild winter. Natural gas storage volumes have been strong entering the 2023-2024 winter season in Europe, and mild winter temperatures have thus far helped to moderate prices. The outlook for gas prices remains somewhat volatile but is generally anticipated to see a gradual normalization.
Europe continues to seek lower-carbon gas supplies and has accelerated plans to develop hydrogen as an alternative to natural gas. The global hydrogen market is still relatively immature, but with incentives being put in place such as those in the US Inflation Reduction Act, hydrogen production at large scale is becoming increasingly commercialized, which has led to a growing export market. Given its proximity to low-cost natural gas supplies and suitable geologic storage for carbon dioxide, the US Gulf Coast is well positioned to be a leading export hub to supply blue hydrogen to international markets. Given these rapidly changing global fundamentals, and coupled with growing appetite for lower-carbon hydrogen, we believe we are well positioned to provide value-added solutions to shippers and meet both regional and international demand.
Opposition to natural gas development, including new pipeline projects, has been increasing in recent years. This may challenge continued growth of the North American gas market and the ability to efficiently connect supply and demand. We are responding to the need for regional infrastructure with additional investments in Canadian and US gas transportation facilities. Progress on the development and construction of our commercially secured growth projects is discussed in Part II. Item 7. Management’s Discussion and Analysis of Financial Condition and Results of Operations - Growth Projects - Commercially Secured Projects.
26
RNG is seen as a sustainable and more environmentally friendly alternative to traditional natural gas, derived from organic waste sources such as agricultural residues, food waste, and other organic waste material. The production process most commonly involves the anaerobic digestion of these organic materials, resulting in the generation of biogas composed primarily of methane. Unlike conventional natural gas, RNG is considered carbon-neutral or even carbon-negative, as the carbon dioxide that is ultimately released during combustion is offset by the carbon captured during the organic matter's growth. This closed-loop cycle can contribute to mitigating GHG emissions and help to address climate change concerns. RNG can be seamlessly integrated into existing natural gas infrastructure, offering a versatile energy source for heating, transportation, and electricity generation. As societies increasingly prioritize sustainability, RNG has the potential to play an important role in the transition towards a cleaner and more resilient energy future. We believe that RNG is poised for growth as the global focus on sustainable energy solutions intensifies. Global RNG consumption is expected to increase with a 11% compound annual growth rate until 2050, according to the recently released International Energy Agency’s Stated Policy Scenario.
GAS DISTRIBUTION AND STORAGE
Gas Distribution and Storage consists of our natural gas utility operations, the core of which is Enbridge Gas Inc. (Enbridge Gas), which serves residential, commercial and industrial customers throughout Ontario. This business segment also includes natural gas distribution activities in Québec.
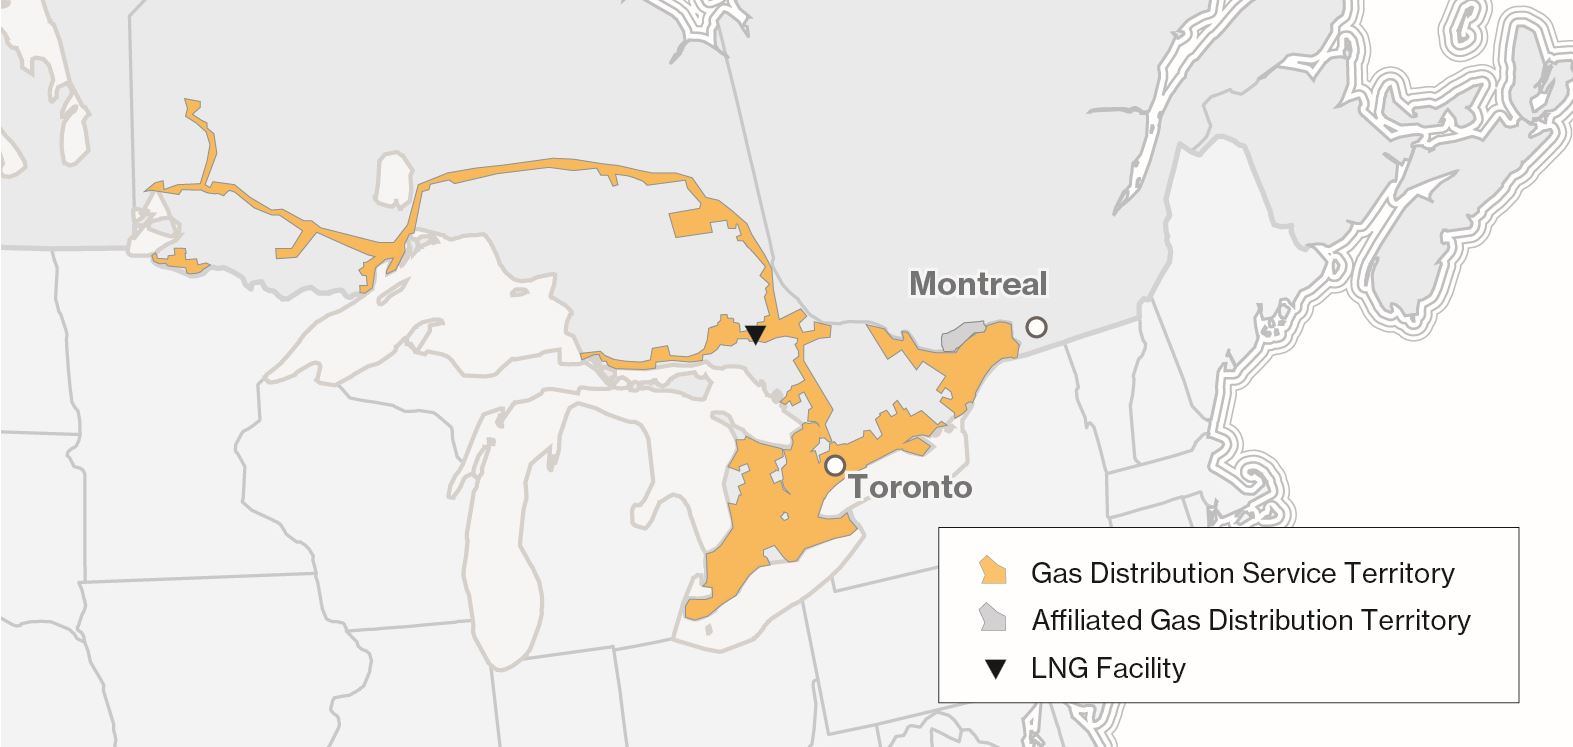
ENBRIDGE GAS
Enbridge Gas is a rate-regulated natural gas distribution utility with storage and transmission services. Enbridge Gas' distribution system, supported by storage and compression assets, carries natural gas from the point of local supply to customers and serves residential, commercial and industrial customers across Ontario.
There are three principal interrelated aspects of the natural gas distribution business in which Enbridge Gas is directly involved: Distribution, Transportation and Storage.
27
Distribution
Enbridge Gas’ principal source of revenue arises from distribution of natural gas to customers. The services provided to residential, small commercial and industrial heating customers are primarily on a general service basis, without a specific fixed term or fixed price contract. The services provided to larger commercial and industrial customers are usually on an annual contract basis under firm or interruptible service contracts. Under a firm contract, Enbridge Gas is obligated to deliver natural gas to the customer up to a maximum daily volume. The service provided under an interruptible contract is similar to that of a firm contract, except that it allows for service interruption at Enbridge Gas’ option primarily to meet seasonal or peak demands. The Ontario Energy Board (OEB) approves rates for both contract and general services. The distribution system consists of approximately 151,000 kilometers (93,827 miles) of pipelines that carry natural gas from the point of local supply to customers.
Customers have a choice with respect to natural gas supply. Customers may purchase and deliver their own natural gas to points upstream of the distribution system or directly into Enbridge Gas’ distribution system, or, alternatively, they may choose a system supply option, whereby customers purchase natural gas from Enbridge Gas’ supply portfolio. To acquire the necessary volume of natural gas to serve its customers, Enbridge Gas maintains a diversified natural gas supply portfolio, acquiring supplies on a delivered basis in Ontario, as well as acquiring supply from multiple supply basins across North America.
Transportation
Enbridge Gas contracts for firm transportation service, primarily with TransCanada Pipelines Limited (TransCanada), Vector and NEXUS, to meet its annual natural gas supply requirements. The transportation service contracts are not directly linked with any particular source of natural gas supply. Separating transportation contracts from natural gas supply allows Enbridge Gas flexibility in obtaining its own natural gas supply and accommodating the requests of its direct purchase customers for assignment of TransCanada capacity. Enbridge Gas forecasts the natural gas supply needs of its customers, including the associated transportation and storage requirements.
In addition to contracting for transportation service, Enbridge Gas offers firm and interruptible transportation services on its own Dawn-Parkway pipeline system. Enbridge Gas’ transmission system consists of approximately 3,800 kilometers (2,361 miles) of high pressure pipeline and five mainline compressor stations and has an effective peak daily demand capacity of 7.6 bcf/d. Enbridge Gas’ transmission system also links an extensive network of underground storage pools at the Tecumseh Gas Storage facility and Dawn Hub (collectively, Dawn) to major Canadian and US markets, and forms an important link in moving natural gas from western Canada and US supply basins to central Canadian and northeastern US markets.
As the supply of natural gas in areas close to Ontario has continued to grow, there has been increased demand to access these diverse supplies at Dawn and transport them along the Dawn-Parkway pipeline system to markets in Ontario, eastern Canada and the northeastern US. Enbridge Gas delivered 2,218 bcf of gas through its distribution and transmission system in 2023. A substantial amount of Enbridge Gas’ transportation revenue is generated by fixed annual demand charges, with the average length of a long-term contract being approximately 17 years and the longest remaining contract term being 17 years.
Storage
Enbridge Gas’ business is highly seasonal as daily market demand for natural gas fluctuates with changes in weather, with peak consumption occurring in the winter months. Utilization of storage facilities permits Enbridge Gas to take delivery of natural gas on favorable terms during off-peak summer periods for subsequent use during the winter heating season. This practice permits Enbridge Gas to minimize the annual cost of transportation of natural gas from its supply basins, assists in reducing its overall cost of natural gas supply and adds a measure of security in the event of any short-term interruption of transportation of natural gas to Enbridge Gas’ franchise areas.
28
Enbridge Gas’ storage facility at Dawn is located in southwestern Ontario, and has a total working capacity of approximately 284 bcf in 33 underground facilities located in depleted gas fields. Dawn is the largest integrated underground storage facility in Canada and one of the largest in North America. Approximately 180 bcf of the total working capacity is available to Enbridge Gas for utility operations. Enbridge Gas also has storage contracts with third parties for 21 bcf of storage capacity.
Dawn offers customers an important link in the movement of natural gas from western Canadian and US supply basins to markets in central Canada and the northeast US. Dawn's configuration provides flexibility for injections, withdrawals and cycling. Customers can purchase both firm and interruptible storage services at Dawn. Dawn offers customers a wide range of market choices and options with easy access to upstream and downstream markets. During 2023, Dawn provided services such as storage, balancing, gas loans, transport, exchange and peaking services to approximately 200 counterparties.
A substantial amount of Enbridge Gas’ storage revenue is generated by fixed annual demand charges, with the average length of a long-term contract being approximately three years and the longest remaining contract term being 13 years.
GAZIFÈRE
We wholly own Gazifère Inc. (Gazifère), a natural gas distribution company that serves approximately 45,000 customers in western Québec. Gazifère is regulated by the Québec Régie de l’énergie.
US GAS UTILITIES
On September 5, 2023, we announced that Enbridge had entered into three separate definitive agreements with Dominion Energy, Inc. to acquire The East Ohio Gas Company, Questar Gas Company and its related Wexpro companies, and Public Service Company of North Carolina for an aggregate purchase price of $19.1 billion (US$14.0 billion). If completed, the Acquisitions will create North America's largest natural gas utility platform delivering over 9 bcf/d to approximately 7 million customers across multiple regulatory jurisdictions. The Acquisitions are expected to close in 2024, subject to the satisfaction of customary closing conditions including the receipt of certain regulatory approvals, which are not cross-conditional.
COMPETITION
Enbridge Gas’ distribution system is regulated by the OEB and is subject to regulation in a number of areas, including rates. Enbridge Gas is not generally subject to third-party distribution competition within its franchise areas.
Enbridge Gas competes with other forms of energy available to its customers and end-users, including electricity, coal, propane and fuel oils. Factors that influence the demand for natural gas include weather, price changes, the availability of natural gas and other forms of energy, the level of business activity, conservation, legislation including the federal carbon pricing law, governmental regulations, the ability to convert to alternative fuels and other factors.
SUPPLY AND DEMAND
We anticipate that demand for natural gas in North America will stabilize over the long term with potential growth in peak day demands; however, there are risks to the natural gas market that may challenge its growth prospects. The recent decision by the OEB on Enbridge Gas' application to establish 2024 base rates, net-zero carbon policies, evolving customer preferences for lower-carbon fuels and more efficient technologies, combined with increasing opposition to natural gas development in North America, may reduce the markets’ ability to efficiently deploy capital to connect supply and demand. We monitor these factors closely to be able to develop our business strategy to align with shifts in customer preferences and public policy requirements.
29
The recent decision by the OEB on Enbridge Gas' application to establish 2024 base rates includes changes to the revenue horizon over which costs can be recovered for small volume customer connections. The implications of the recent OEB decision are being assessed. Refer to Regulation - Government Regulations - Gas Distribution and Storage for further discussion.
Enbridge Gas continues to focus on promoting conservation and energy efficiency by undertaking activities focused on reducing natural gas consumption through various demand side management programs offered across all markets and sourcing supply with a smaller carbon footprint. In addition to our existing and proposed RNG programs, we are also continuing our efforts to source other lower-carbon supplies, such as responsibly sourced natural gas, and H2.
Over the past decade, growth in the North American gas supply landscape, driven mainly by the development of unconventional gas resources in the Montney, Permian, Marcellus and Utica supply basins, has resulted in lower annual commodity prices and narrower seasonal price spreads. However, over the past two years, geopolitical unrest has increased and led to elevated concerns with energy security in regions such as Europe and Asia. In response, one of the key supply sources supporting global energy security has been US LNG, which has introduced additional competition for North American supply. These market dynamics have resulted in higher and more volatile natural gas prices across many US and Canadian natural gas trading points. Unregulated storage values are primarily determined by the difference in value between winter and summer natural gas prices. As a result of the recent volatility exhibited in natural gas prices, storage values have risen.
30
RENEWABLE POWER GENERATION
Renewable Power Generation consists primarily of investments in wind and solar assets, as well as geothermal, waste heat recovery, and transmission assets. In North America, assets are primarily located in the provinces of Alberta, Ontario and Québec, and in the states of Colorado, Texas, Indiana, Ohio and West Virginia. In Europe, we hold equity interests in operating offshore wind facilities in the coastal waters of the United Kingdom, France, and Germany, as well as interests in several offshore wind projects under construction and active development in France and the United Kingdom.
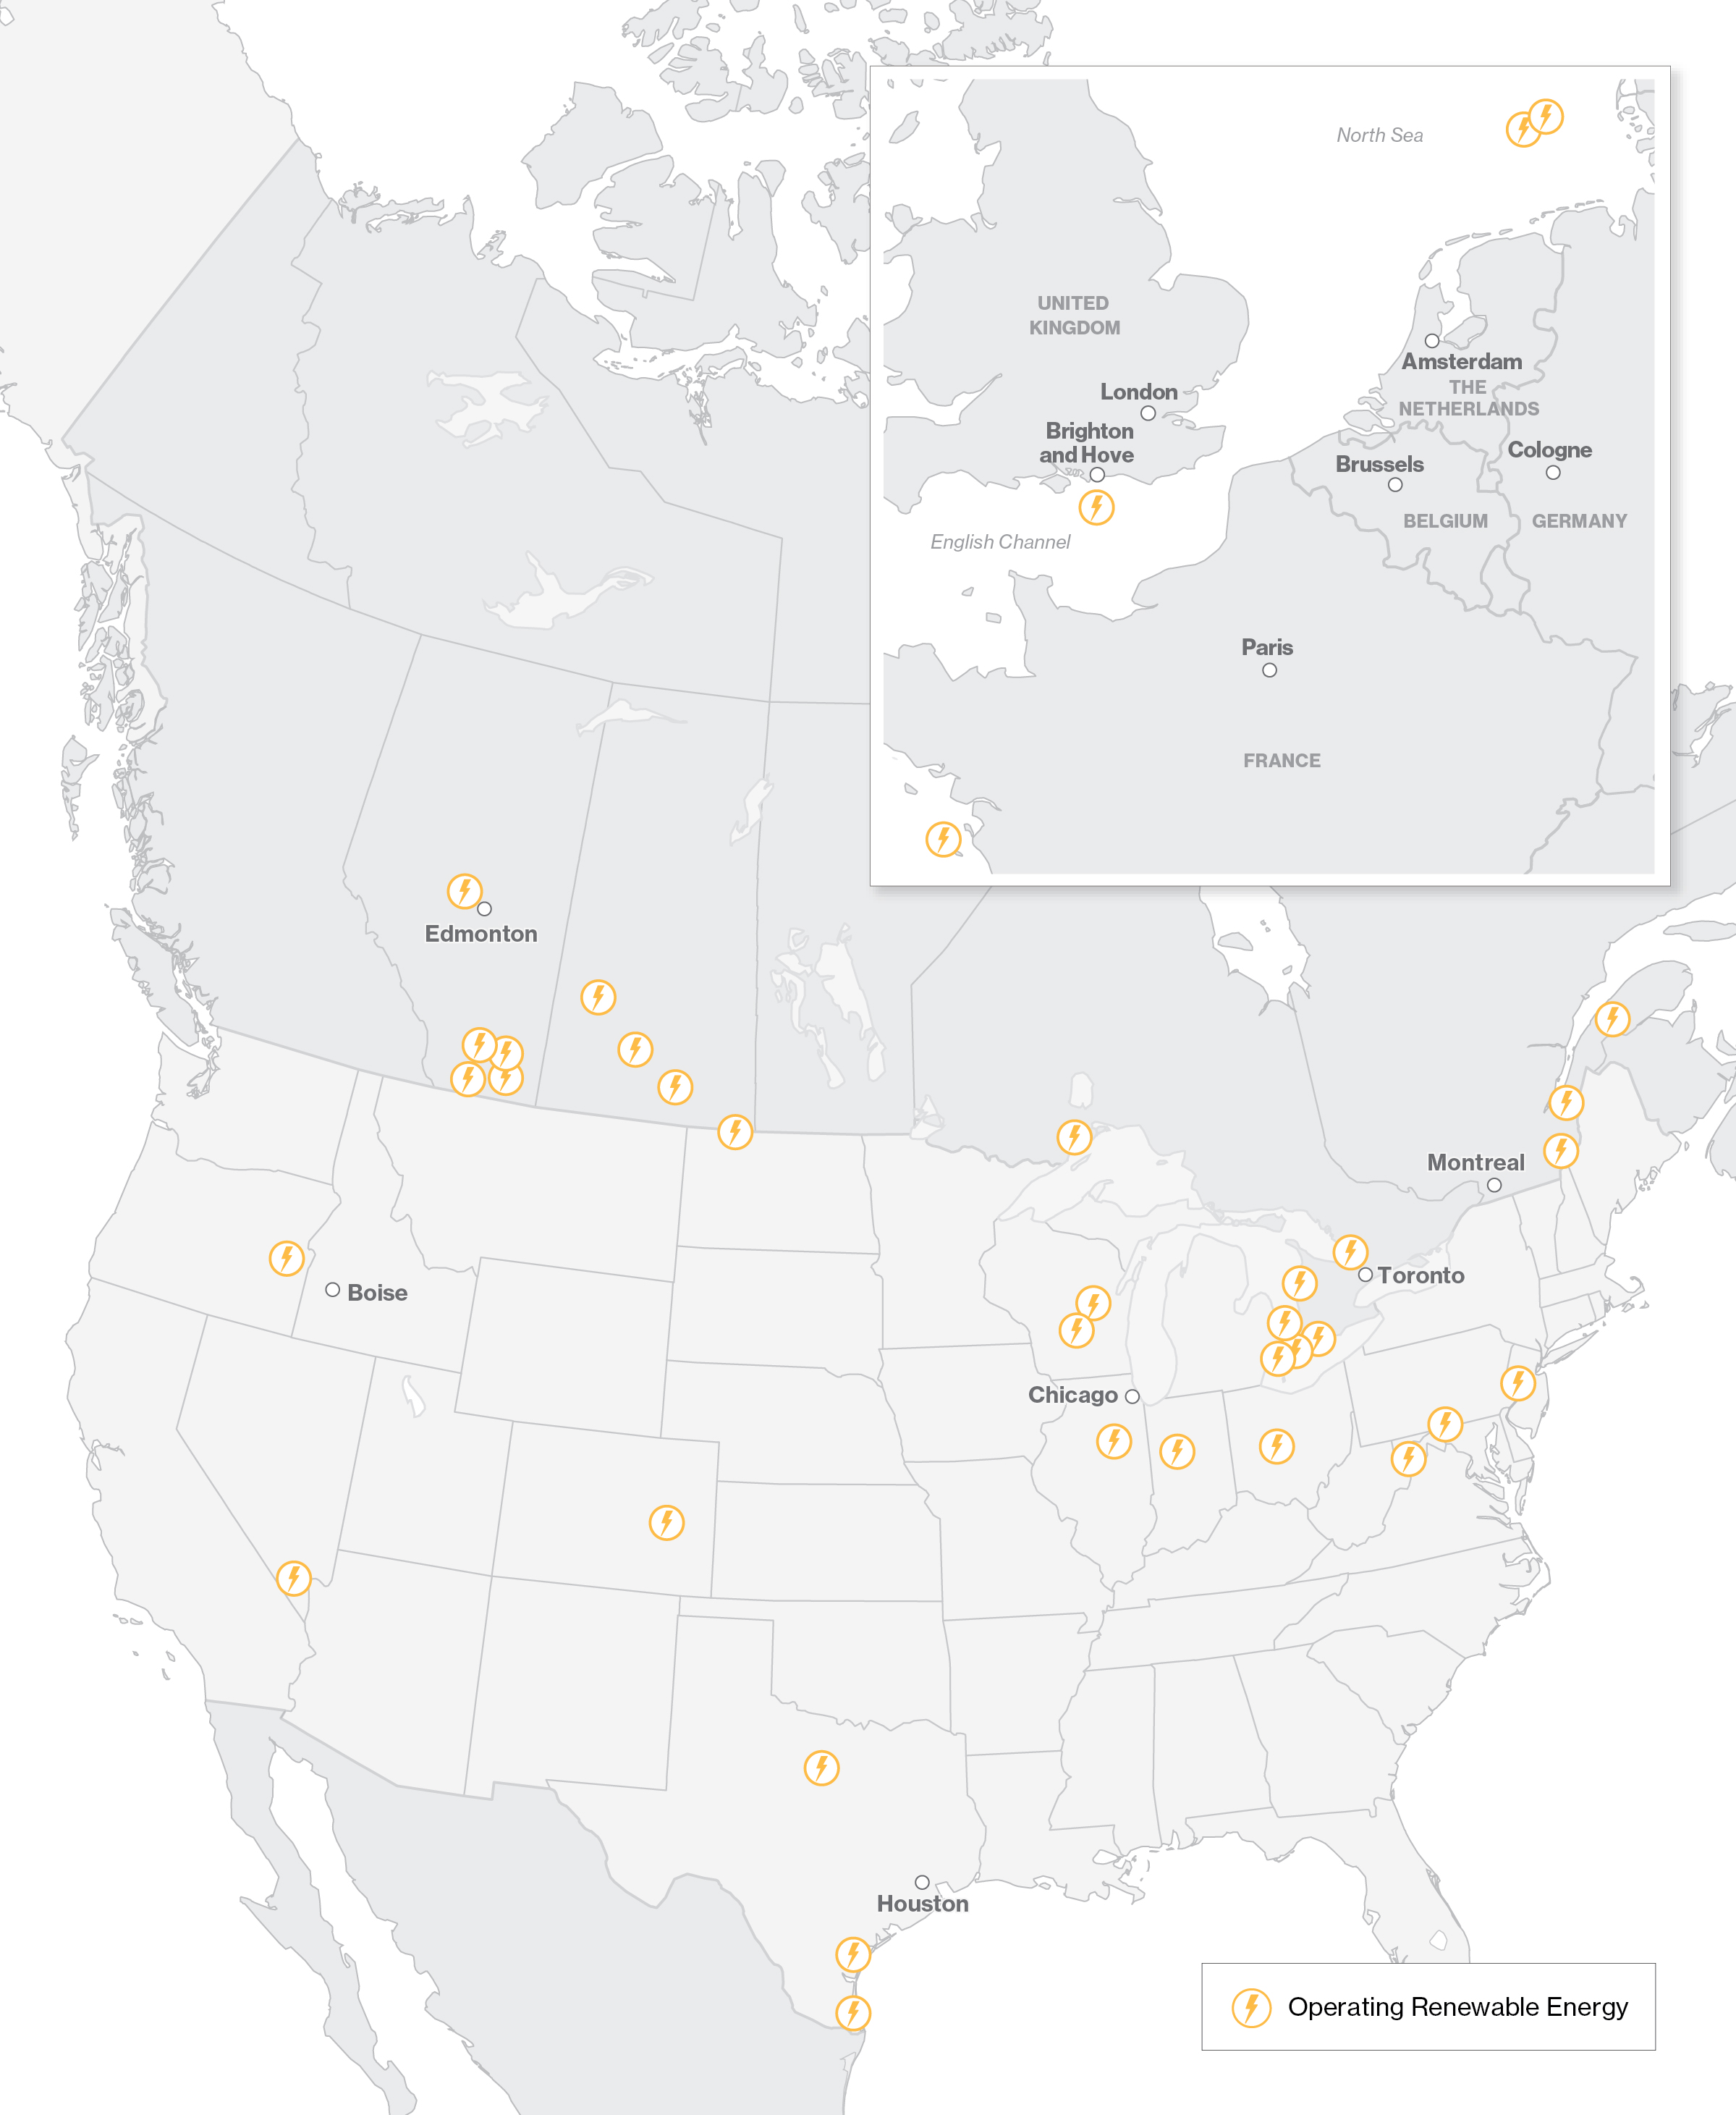
31
Combined Renewable Power Generation investments represent approximately 2,371 MW of net generation capacity, which primarily consists of approximately:
•1,399 MW generated by North American wind facilities;
•526 MW generated by European offshore wind facilities;
•186 MW expected to be generated by the Fécamp and Calvados Offshore Wind Projects in France, both of which are currently under construction;
•6 MW expected to be generated by the Provence Grand Large Floating Offshore Wind Project in France, which is under construction; and
•198 MW generated by North American solar facilities in operation, with an additional 30 MW in projects in pre-construction and under construction.
The vast majority of the power produced from these facilities is sold under long-term PPAs.
Renewable Power Generation also includes our 24.1% interest in the East-West Tie, a 450-MW transmission line in northwestern Ontario, which entered operations in March 2022.
JOINT VENTURES / EQUITY INVESTMENTS
Most of our investments in Canadian wind and solar assets and two of our US renewable assets are held within a joint venture in which we maintain a 51% interest and which we manage and operate. One of our US solar projects is held within a separate joint venture in which we hold a 50% stake.
We also own interests in European offshore wind facilities through the following table presentsjoint ventures:
•a 24.9% interest in Rampion Offshore Wind, located in the reconciliationUnited Kingdom;
•a 49.9% interest in Hohe See and Albatros Offshore Wind, located in Germany;
•a 25.5% interest in the Saint-Nazaire Offshore Wind Project, located in France;
•a 25% interest in the Provence Grande Large Floating Offshore Wind Project, under construction in France;
•a 17.9% interest in the Fécamp Offshore Wind Project, under construction in France; and
•a 21.7% interest in the Calvados Offshore Wind Project, under construction in France.
COMPETITION
Renewable Power Generation operates in the North American and European power markets, which are subject to competition and supply and demand fundamentals for power in the jurisdictions in which it operates. The majority of revenue is generated pursuant to long-term PPAs (or has been substantially hedged). As such, financial performance is not significantly impacted by fluctuating power prices arising from supply/demand imbalances or the actions of competing facilities during the term of the applicable contracts. However, the renewable energy sector includes large utilities, small independent power producers and private equity investors, which are expected to aggressively compete for new project development opportunities and for the right to supply customers when contracts expire.
To grow in an environment of heightened competition, we strategically seek opportunities to collaborate with well-established renewable power developers and financial partners and to target regions with commercial constructs consistent with our low risk business model. In addition, we have expertise in completing and delivering large scale infrastructure projects.
SUPPLY AND DEMAND
Renewable power generation in North America and Europe is expected to grow significantly over the next 20 years due to the replacement of older fossil fuel-based sources of electricity generation in support of announced governmental carbon emissions reduction targets. Any additional governmental actions toward reducing emissions and/or increasing electrification will further accelerate renewable electricity demand growth and electrification across all sectors.
32
On the demand side, North American economic growth over the longer term and the continued electrification and transition to lower-carbon strategies within the residential, transportation and industrial sectors are expected to drive growing electricity demand. Furthermore, voluntary GHG emissions reduction targets are becoming increasingly expected by stakeholders, which is driving significant demand from corporate electricity end-users for clean electricity and environmental attributes. However, continued efficiency gains are expected to make the economy less energy-intensive and temper overall demand growth.
On the supply side in North America, legislation is accelerating the retirement of aging coal-fired generation, while generation from conventional nuclear power is also forecast to decline. As a result, North America requires significant new generation capacity from preferred technologies. Gas-fired and renewable energy facilities, including solar and wind (which make up the bulk of our renewable power assets), are generally the preferred sources to replace coal-fired generation due to their lower-carbon intensities. Governments are also proposing tax incentives to support low-emission and renewable energy generation resource development. As renewable energy takes an increasing share of certain states’ and provinces’ electricity grids, governments are also proposing tax incentives for natural gas and battery development to help firm the variable generation on the grid.
Falling capital and operating costs of wind and solar, combined with their improving capacity factors, are expected to continue the ongoing trend of making renewable energy more competitive and support investment over the long-term, regardless of available government incentives. Generation from renewable sources is expected to double over the next two decades in North America. Aside from the construction of new wind and solar facilities, other growth opportunities include repowering projects to increase output from, and extend the project-life of, our existing facilities.
In Europe, the renewable energy outlook is robust. Demand for electricity is expected to gradually increase over the next two decades, driven by electrification of transportation and buildings, and the desire to reduce reliance on gas sourced from Russia. Energy efficiency gains are expected to temper, but not eliminate, demand growth. Renewable power is expected to play a significant role in Europe’s ability to meet its aggressive lower-carbon and renewable energy targets.
On the supply side, the International Energy Agency expects coal to fall by more than 90% from 2020 levels, while nuclear is expected to fall by one-third, by 2040. Over the same period, it anticipates power generation from renewable sources will more than double, including installed (onshore and offshore) wind more than doubling and photovoltaics solar power nearly tripling. We, through our European joint ventures, continue to invest in offshore wind projects in the United Kingdom, France and Germany, and to explore opportunities to meet the growing demand.
ENERGY SERVICES
The Energy Services businesses in Canada and the US provide physical commodity marketing and logistical services to North American refiners, producers, and other customers.
Energy Services is primarily focused on servicing customers across the value chain and capturing value from quality, time, and location price differentials when opportunities arise. To execute these strategies, Energy Services transports and stores on both Enbridge-owned and third-party assets using a combination of contracted pipeline, storage, railcar, and truck capacity agreements.
Effective January 1, 2024, to better align how the chief operating decision-maker reviews operating performance and resource allocation across operating segments, we transferred our Canadian and US crude oil businesses from the Energy Services segment to the Liquids Pipelines segment. The Energy Services segment will cease to exist and the remainder of the business will be reported in the Eliminations and Other segment.
33
COMPETITION
Energy Services’ earnings are primarily generated from arbitrage opportunities which, by their nature, can be replicated by competitors. An increase in market participants entering into similar arbitrage strategies could have an impact on our earnings. Efforts to mitigate competition risk include diversification of the marketing business by transacting at the majority of major hubs in North America and establishing long-term relationships with clients and pipelines.
ELIMINATIONS AND OTHER
Eliminations and Other includes operating and administrative costs that are not allocated to business segments, the impact of foreign exchange hedge settlements and the activities of our wholly-owned captive insurance subsidiaries. The principal activity of our captive insurance subsidiaries is providing insurance and reinsurance coverage for certain insurable property and casualty risk exposures of our operating subsidiaries and certain equity investments. Eliminations and Other also includes new business development activities and corporate investments.
REGULATION
GOVERNMENT REGULATION
Pipeline Regulation
Our Liquids Pipelines and Gas Transmission and Midstream assets are subject to numerous operational rules and regulations mandated by governments and applicable regulatory authorities, breaches of which could result in fines, penalties, operating restrictions and an overall increase in operating and compliance costs.
In the US, our interstate pipeline operations are subject to pipeline safety laws and regulations administered by the Pipeline and Hazardous Materials Safety Administration (PHMSA), an agency within the United States Department of Transportation (DOT). These laws and regulations require us to comply with a significant set of requirements for the design, construction, maintenance and operation of our interstate pipelines. These laws and regulations, among other things, include requirements to monitor and maintain the integrity of our pipelines and to operate them within permissible pressures.
PHMSA continues to review existing regulations and establish new regulations to support safety standards that are designed to improve operations integrity management processes. In this climate of increasingly stringent regulation, pipeline failure or failures to comply with applicable regulations could result in reduction of allowable operating pressures as authorized by PHMSA, which would reduce available capacity on our pipelines. Should any of these risks materialize, it may have an adverse effect on our operations, capital expenditures, earnings, cash flows, financial condition and competitive advantage.
Our ability to establish transportation and storage rates on our US interstate natural gas facilities is subject to regulation by the FERC, whose rulings and policies could have an adverse impact on the ability to recover the full cost of operating these pipeline and storage assets, including a reasonable rate of return. Regulatory or administrative actions by the FERC such as rate proceedings, applications to certify construction of new facilities, and depreciation and amortization policies can affect our business, including decreasing tariff rates and revenues and increasing our costs of doing business.
In Canada, our pipelines are subject to safety regulations administered by the CER or provincial regulators. Applicable legislation and regulations require us to comply with a significant set of requirements for the design, construction, maintenance and operation of our pipelines. Among other obligations, this regulatory framework imposes requirements to monitor and maintain the integrity of our pipelines.
34
As in the US, laws and regulations addressing enhanced pipeline safety in Canada have been enacted over the past few years. The changes demonstrate an increased focus on the implementation of management systems to address key areas, such as emergency management, integrity management, safety, security and environmental protection. The CER has authority to impose administrative monetary penalties for non-compliance with the regulatory regime it administers, as well as to impose financial requirements for future abandonment and major pipeline releases.
A key component of pipeline safety and reliability is the approach to integrity management that uses reliability targets and safety case assessments. A long history of extensive inline inspection has provided by operating activitiesdetailed knowledge of the assets in our pipeline systems. Our pipelines are assessed and maintained in a proactive manner ensuring reliability targets are met. Furthermore, the integrity management program has an independent step to DCF. DCFcheck the results of integrity assessments to validate the effectiveness of the program and to ensure that the operational risk remains as low as reasonably practicable throughout the integrity inspection and assessment cycle. As inspection technology, pipeline materials and construction practices improve with time, and new data on threats and pipeline condition are gathered, our methods of maintaining fitness for service evolves, with a strong focus on continual improvement in every aspect of integrity management.
Our pipelines also face economic regulatory risk. Broadly defined, economic regulatory risk is defined as cash flow provided by operating activities beforethe risk that governments or regulatory agencies reject or revise proposed commercial arrangements, applications or policies, upon which future and current operations are dependent. Our pipelines are subject to the actions of various regulators, including the CER and the FERC, with respect to tariffs and tolls. The rejection or revision of applications for approval of new tariff structures or proposed commercial arrangements and changes in operatinginterpretation of existing regulations by courts or regulators could have an adverse effect on our revenues and earnings.
Gas Distribution and Storage
Our gas distribution and storage utility operations are regulated by the OEB and the Québec Régie de l’énergie, among others. To the extent that the regulators’ future actions are different from current expectations, the timing and amount of recovery or refund of amounts recorded in the Consolidated Statements of Financial Position, or amounts that would have been recorded in the Consolidated Statements of Financial Position in the absence of the effects of regulation, could be different from the amounts that are eventually recovered or refunded.
Enbridge Gas' distribution rates, were set under a five-year incentive regulation (IR) framework using a price cap mechanism, which ended on December 31, 2023. The price cap mechanism established new rates each year through an annual base rate escalation at inflation less a 0.3% productivity factor, in addition to annual updates for certain costs to be passed through to customers, and where applicable, provided for the recovery of material discrete incremental capital investments beyond those that could be funded through base rates. The IR framework included the continuation and establishment of certain deferral and variance accounts, as well as an earnings sharing mechanism that required Enbridge Gas to share equally with customers any earnings in excess of 150 basis points over the annual OEB approved return on equity (ROE).
In October 2022, Enbridge Gas filed its application with the OEB to establish a 2024 through 2028 IR rate setting framework. The application initially sought approval in two phases to establish 2024 base rates (Phase 1) on a cost-of-service basis and to establish a price cap rate setting mechanism (Phase 2) to be used for the remainder of the IR term. A third phase (Phase 3) has been established with the OEB as part of the Phase 1 Partial Settlement Proposal (Settlement Proposal).
35
On August 17, 2023, the OEB approved the Settlement Proposal to support the determination of just and reasonable rates effective January 1, 2024. Items resolved in whole or in part include:
•additions to rate base up to and including 2022;
•interest rates on debt and return on equity;
•deferral and variance accounts;
•Indigenous engagement; and
•rate implementation approach for 2024.
On December 21, 2023, the OEB issued its Decision and Order on Phase 1 (Phase 1 Decision). The decision addressed three main areas: energy transition, Enbridge Gas Distribution Inc. and Union Gas Limited amalgamation and harmonization issues, and other issues. The Phase 1 Decision included the following key findings or orders:
•energy transition risk requires Enbridge Gas to carry out a risk assessment to consider further risk mitigation measures in three areas: system access and expansion capital spending, system renewal capital spending and depreciation policy;
•our 2024 capital plan must be reduced by $250 million with a focus on monitoring, repair and life extension of our assets and liabilities (including changesa further $50 million of capitalized indirect overhead costs must be expensed, escalating to $250 million per year during the IR term with an offsetting adjustment to revenues in environmental liabilities) less distributionseach year;
•all new small volume customers wishing to noncontrolling interestsconnect to natural gas pay their full connection costs as an upfront charge rather than through rates over time effective January 1, 2025;
•approval of a harmonized depreciation methodology that reduced the level of depreciation sought and redeemable noncontrolling interests, preference share dividendsadjusted asset lives including extensions of service life for certain asset classes;
•an increase in equity thickness from 36% to 38% effective for 2024; and maintenance capital expenditures,
•January 1, 2024 will be the effective date for 2024 rates.
The issues addressed in the Settlement Proposal and further adjustedthe Phase 1 Decision resulted in the following items not approved for unusual,non-recurringornon-operatingfactors. Management also uses DCF to assessfuture recovery, and the performance of the company and to set its dividend payout target. DCFsubsequent impairments recognized for the year ended December 31, 20202023:
•a portion of undepreciated capital projects removed from 2024 rate base of $41 million;
•undepreciated integration capital costs removed from 2024 rate base of $84 million; and
•pre-2017 Union Gas Limited related pension balances of $156 million.
Enbridge Gas filed a Notice of Appeal in the Ontario Divisional Court on January 22, 2024 regarding four aspects of the Phase 1 Decision: small volume customer revenue horizon, the 2024 capital plan reduction, the extension of service life for certain asset classes and equity thickness. On January 29, 2024 Enbridge Gas also filed a Notice of Motion with the OEB requesting the OEB to review and vary five aspects of the Phase 1 Decision: small volume customer revenue horizon, the 2024 capital plan reduction, integration capital, depreciation and equity thickness. The outcome of these proceedings is uncertain.
The Phase 1 Decision results in interim rates, pending phases 2 and 3 of the proceeding, resolution of the Notice of Appeal, Notice of Motion and any possible legislative steps that could be undertaken by the Government of Ontario further to the Ontario Minister of Energy's December 22, 2023 news release. Phase 2 will establish and determine the incentive rate mechanism for the remainder of the rebasing term, and gas cost and unregulated storage cost allocation. Phase 3 will address cost allocation and the harmonization of rates and rate classes between legacy rate zones.
36
Enbridge Gas continues to develop opportunities to support a lower-carbon future in Ontario. In 2021, we received OEB approval of an Integrated Resource Planning (IRP) framework and integrated the framework into our planning practices. The framework requires Enbridge Gas to consider facility and non-pipe demand and/or supply side alternatives (IRP alternatives) to address the systems needs of its regulated operations, where certain parameters have been met. The framework also allows Enbridge Gas to pursue an IRP alternative (or combination of IRP alternatives and facility alternative) where it is found to be in the best interests of Enbridge Gas and its customers, taking into account reliability and safety, cost-effectiveness, public policy, optimized scoping, and risk management.
On July 19, 2023, Enbridge Gas filed an application seeking approval for the cost consequences associated with two IRP pilot projects. The projects are designed to implement demand-side IRP alternatives, including enhanced targeted energy efficiency and residential demand response programs, in combination with supply-side IRP alternatives, in select communities in order to mitigate identified system constraints and associated facility projects. The pilot projects are intended to provide learnings on the performance of the selected IRP alternatives, including the potential for scalability, that can be leveraged in future IRP alternative plan design. An OEB decision is expected during 2024.
Renewable Power Generation
Renewable Power Generation is subject to numerous operational rules and regulations mandated by governments and applicable regulatory authorities, breaches of which could result in fines, penalties, operating restrictions and an overall increase in operating and compliance costs.
The North American Electric Reliability Council (NERC) is an international regulatory authority responsible for establishing and enforcing reliability standards to reduce risks to the reliability and security of the grid in Canada, the US, and Mexico. It is subject to oversight from the FERC in the US and provincial governments in Canada. The FERC has authority over many markets in the US and is tasked with ensuring safe, reliable, and secure interstate transmission of electricity, natural gas, and oil. This includes establishing reliability standards and determining certain pricing aspects of transmission development and access, among others. NERC and FERC standards and pricing decisions are also updated from time to time and could impact our operations, capital expenditures, earnings, and cash flows, though some of these impacts could be positive for our business.
At the US federal level, our Renewable Power Generation assets are subject to legislation overseen by the US Fish and Wildlife Service, which is aimed at reducing the impact of development and human activity on wildlife, along with other federal environmental permitting legislation. These federal environmental laws are subject to change from time to time which could require Enbridge to obtain new permits, update practices, or amend operations and operating expenditures.
In Canada, the Federal Government does not generally regulate the electricity sector, though it has imposed a federal carbon price on other sectors via its output-based pricing system (OBPS) and has proposed a Clean Electricity Regulation (CE Regulation) that would require Canada’s electricity grid to reach net-zero by 2035. The CE Regulation is expected to come into effect in 2024.
Policy changes may also provide new opportunities for existing assets and new developments. The US passed the Inflation Reduction Act in late 2022, which established long-term production and investment tax credits for renewable power generation, battery storage projects and for related manufacturing supply chains. Similarly, Canada has prepared legislation that would establish competitive tax credits for renewable power generation and battery storage projects, which it anticipates passing in early 2024. Changes to these tax programs could impact development plans.
37
Renewable Power Generation is also subject to provincial and state regulations governing the energy resource mix on the grid, emissions levels of the electricity grid, and market regulations related to emergency operations, extreme weather preparedness, and market participation, among others. These regulations may change from time to time, which could impact Enbridge’s operations and increase the costs of participating in regional electricity markets. In 2023, Texas introduced firming requirements that would require new wind and solar projects to be paired with batteries or other firm power supply and/or introduced caps on the percentage of the grid’s power that can be provided by variable generation. Other state and provincial governments are considering similar legislation.
Our Renewable Power Generation assets in France and Germany each have federal policies in place and are subject to directives and regulations established and enforced by the European Union (EU). These include the Renewable Energy Directive, the European Green Deal, and ongoing work on financing mechanisms and transmission directives and programs. The EU is also responsible for establishing environmental protection rules and permitting standards. During 2022, member states of the EU introduced extraordinary and temporary measures to address high energy prices including caps and demand reduction goals. As the minimum PPA prices in Germany and France are still honored, there are no negative implications to our PPA prices. The federal policies and regulations in place are subject to change from time to time, which could impact our operations and related expenditures; however, the EU’s general direction is to facilitate increased renewable power integration to its grid.
The United Kingdom (UK) government is responsible for establishing renewable energy and carbon pricing policies for the entire UK, as well as long-term electricity sector planning and procurement mechanisms and structure for auctions that are administered at the national level, e.g., England, Scotland, within the UK. Each country within the UK is also responsible for establishing its own environmental and permitting regulations. This process is still ongoing following Brexit and in some cases continues to result in more volatile merchant power prices; however, expanded interconnectors to Europe and policies aimed at increasing domestic renewable capacity are in progress. Governments have introduced temporary price controls, effective January 1, 2023, to address the significant increase in energy prices. The impact of merchant exposure on our Renewable Power Generation asset in the UK is limited by fixed revenue payments backed by the UK government.
Energy Services
Energy Services is regulated by government authorities in the areas of commodity trading, import and export compliance and the transportation of commodities. Non-compliance with governing rules and regulations could result in fines, penalties and operating restrictions. These consequences would have an adverse effect on operations, earnings, cash flows, financial condition and competitive advantage. Energy Services retains dedicated professional staff and has a robust regulatory compliance program (including targeted training) to mitigate these potential risks associated with the business.
In the US, commodity marketing is regulated by the Commodity Futures Trading Commission, the FERC, the SEC, the Federal Trade Commission, the various commodity exchanges, the US Department of Justice and state regulators. The provincial and territorial securities regulators similarly regulate commodity marketing within Canada and are members of the Canadian Securities Administrators. These various regulators enforce, among other things, the prohibition of market manipulation, fraud and disruptive trading.
The regulation of wholesale sales of electric energy is also regulated by the FERC, which authorizes Energy Services to sell electricity at market-based rates.
38
The export of natural gas out of Alberta is regulated by the Alberta Energy Regulator. The import and export of commodities between Canada and the US is subject to regulation by the CER and the US Department of Energy, as well as customs authorities. In particular, import and export permits are required, with associated regular reporting requirements. Breaches of import and export rules and permits could result in an inability to perform day to day operations, and can negatively impact the earnings of the business.
The transportation of crude oil and natural gas liquids by railcar or truck is regulated by the US DOT, Transport Canada and provincial regulation. Each jurisdiction requires compliance with security, safety, emergency management, and environmental laws and regulations related to ground transportation of commodities. Risks associated with transportation of crude or natural gas liquids include unplanned releases. In the event of a release, remediation of the affected area would be required. Energy Services engages third parties, such as Emergency Response Assistance Canada, the Chemical Transportation Emergency Center and the Canadian Transport Emergency Center to assist in such remediation.
ENVIRONMENTAL REGULATION
Pipeline Regulation
Our Liquids Pipelines and Gas Transmission and Midstream assets are subject to numerous federal, state and provincial environmental laws and regulations affecting many aspects of our present and future operations, including air emissions, water quality, water discharge and waste. These laws and regulations generally require us to obtain and comply with a wide variety of environmental licenses, permits and other approvals.
In particular, in the US, compliance with major Clean Air Act regulatory programs may cause us to incur significant capital expenditures to obtain permits, evaluate off-site impacts of our operations, install pollution control equipment, and otherwise assure compliance. Some equipment in states in which we operate are affected by the Good Neighbor Rule establishing new emission limits for nitrogen oxides. In addition, there are evolving regulations on environmental justice that could impact Enbridge facilities. The precise nature of these compliance obligations at each of our facilities has not been finally determined and may depend in part on future regulatory changes. In addition, compliance with new and emerging environmental regulatory programs may significantly increase our operating costs compared to historical levels.
In the US, climate change action is evolving at federal, state and regional levels. Pursuant to federal regulations, we are currently subject to an obligation to report our GHG emissions at our largest emitting facilities. On December 2, 2023 the Environmental Protection Agency (EPA) released a final rule to minimize methane emissions for new and existing crude oil and natural gas facilities, coupled later with a fee for excess emissions. The current US presidential administration has been convertedimplementing policies designed to DCFcombat climate change and reduce GHG emissions. In addition, a number of states have joined regional GHG initiatives, and a number are developing their own programs that would mandate reductions in GHG emissions. Public interest groups and regulatory agencies are increasingly focusing on the emission of methane associated with natural gas development and transmission as a source of GHG emissions. Based on proposed changes to measure, report and mitigate GHG emissions the expectation is that there will be a significant increase in costs to maintain and report compliance for businesses in our industry.
39
Canada has adopted a pan-Canadian approach to pricing carbon emissions to incent GHG emission reductions across all sectors of the economy. This approach was adopted in 2016 and entails both a consumer price on carbon, and an intensity-based system for industry which addresses competitiveness and carbon leakage. Provinces and territories may implement their own system of carbon pricing provided it meets the federal benchmark (and if they fail to do so the federal system will be imposed on them). In March 2022, Canada published its 2030 Emissions Reduction Plan (ERP) which builds on the Pan-Canadian Framework, and Net-Zero Emissions Accountability Act, and details the roadmap for Canada to meet its domestic climate target of a 40-45% reduction in GHG emissions by 2030 and attaining net-zero emissions by 2050. The ERP details the complementary policies and programs that Canada will enact to enable it to meet its domestic climate goal. Effective January 1, 2023, the federal carbon price was increased from $50 to $65 per tonne of carbon dioxide equivalent (tCO2e). This will increase by $15 per tonne each year and rise to $170 per tCO2e in 2030.
Gas Distribution and Storage
Our Gas Distribution and Storage operations, facilities and workers are subject to municipal, provincial and federal legislation which regulates the protection of the environment and the health and safety of workers. Environmental legislation primarily includes regulation of spills and emissions to air, land and water; hazardous waste management; the assessment and management of excess soil and contaminated sites; protection of environmentally sensitive areas, and species at risk and their habitats; and the reporting and reduction of GHG emissions.
Gas distribution system operation, as with any industrial operation, has the potential risk of abnormal or emergency conditions, or other unplanned events that could result in releases or emissions exceeding permitted levels. These events could result in injuries to workers or the public, adverse impacts to the environment, property damage and/or regulatory infractions including orders and fines. We could also incur future liability for soil and groundwater contamination associated with past and present site activities.
In addition to gas distribution, we also operate gas storage facilities and a small volume of oil and brine production in southwestern Ontario. Environmental risk associated with these facilities has the potential for unplanned releases. In the event of a release, remediation of the affected area would be required. There would also be potential for fines and orders under environmental legislation, and potential third-party liability claims by any affected landowners.
The gas distribution system and our other operations must maintain environmental approvals and permits from regulators to operate. As a result, these assets and facilities are subject to periodic inspections and/or audits. Reports are submitted to our regulators as required to demonstrate we are in good standing with our environmental requirements. Failure to maintain regulatory compliance could result in operational interruptions, fines, and/or orders for additional pollution control technology or environmental mitigation.
As environmental regulations continue to evolve and become more stringent, the cost to maintain compliance and the time required to obtain approvals continues to increase. A recent example includes the implementation of the new excess soil management requirements (Ontario Regulation 406/19) which has resulted in an increase in soil management costs and effort.
As in previous years, in 2023 we reported operational GHG emissions, including emissions from stationary combustion, flaring, venting and fugitive sources to Environment and Climate Change Canada, the Ontario Ministry of Environment, Conservation and Parks, and a number of voluntary reporting programs. In accordance with the provincial GHG regulations, stationary combustion and flaring emissions related to storage and transmission operations were verified in detail by a third-party accredited verifier with no material discrepancies found.
40
Enbridge Gas utilizes emissions data management processes and systems to help with the data capture and mandatory and voluntary reporting needs. Quantification methodologies and emission factors are updated in our systems as required. Enbridge Gas continues to work with industry associations to refine quantification methodologies and emissions factors, as well as best management practices to minimize emissions.
In October 2018, the federal government confirmed that Ontario is subject to the federal government’s carbon pricing program, otherwise known as the Federal Carbon Pricing Backstop Program. This program consists of two components: a carbon charge levied on fossil fuels, including natural gas, and an OBPS. This program applies in whole or in part to any province or territory that requested it or that did not have an equivalent carbon pricing system in place by January 1, 2019.
The federal carbon charge took effect on April 1, 2019 at a rate of 3.91 cents/cubic meter (m3) of natural gas and is applicable to the majority of customers. Enbridge Gas is registered as a natural gas distributor with the Canada Revenue Agency and remits the federal carbon charge on a monthly basis. The charge increases annually on April 1 of each year, rising to 12.39 cents/m3 in 2023. As confirmed by the federal government in July 2021, the federal carbon price will increase by $15 per tonne each year beginning in 2023, rising to $170 per tCO2e in 2030. This will equate to a federal carbon charge of 32.40 cents/m3 in 2030.
In September 2020, Ontario and the federal government announced that the federal government has accepted that Ontario’s Emission Performance Standards (EPS) will replace the federal OBPS for industrial facilities. In March 2021, the federal government announced that the federal OBPS would stand down in Ontario at the end of 2021 and Ontario would transition to the EPS effective January 1, 2022. In September 2021, the Greenhouse Gas Pollution Pricing Act was amended to remove Ontario as a covered province, enabling the EPS to take effect on January 1, 2022. Effective January 1, 2022, Enbridge Gas transitioned out of the federal OBPS to the provincial EPS. Enbridge Gas is registered with the Ontario Ministry of the Environment, Conservation and Parks as a covered facility under the EPS and has an annual compliance obligation for its facility-related stationary combustion and flaring emissions associated with its transmission and storage operations. Enbridge Gas must remit payment annually on the portion of emissions that exceed its total annual emissions limit. Payment is due the year following a compliance period and as such, Enbridge Gas remitted payment for its 2022 EPS compliance obligation in November 2023. Enbridge Gas will remit payment for its 2023 EPS compliance obligation in 2024.
Enbridge Gas applies to the OEB annually through a Federal Carbon Pricing Program application for approval of just and reasonable rates effective April 1 each year for the Enbridge Gas Distribution Inc. and Union Gas Limited rate zones, to recover the costs associated with the Federal Carbon Charge and EPS Regulation as a pass-through to customers.
Renewable Power Generation
In summer 2023, the Federal Government of Canada introduced its draft CE Regulation that would cap emissions on electricity generation resources on Canada’s grid. The CE Regulation would cap emissions from electricity generation sources at, or near zero tCO2e per megawatt hour. Details of the CE Regulation and related compliance are under negotiation with the provinces at this time, at least one of which has taken steps to formally resist the adoption of the CE Regulation. The Federal Government anticipates adopting the CE Regulation in 2024, which would begin to apply to projects in 2035, as drafted.
Similarly, the US EPA introduced emissions caps for utilities that would apply to certain coal and natural gas generation facilities by 2035. The caps would require applicable facilities to either capture a portion of carbon emissions and/or to co-fire using hydrogen.
Enbridge’s Renewable Power Generation resources are substantially non-emitting.
41
HUMAN CAPITAL RESOURCES
WORKFORCE SIZE AND COMPOSITION
As at December 31, 2023, we had approximately 11,500 regular employees, including approximately 1,500 unionized employees across our North American operations. This total rises to just over 13,400 if temporary employees and contractors are included. We have a strong preference for direct employment relationships but where we have collectively bargained-for employees, we have mature working relationships with our labor unions and the parties have traditionally committed themselves to the achievement of renewal agreements without a work stoppage.
SAFETY
We believe all injuries, incidents and occupational illnesses are preventable. Our overall focus on employee and contractor safety, continues to result in strong performance compared against industry benchmarks and we are actively engaged in continuous improvement exercises as we pursue our goal of zero incidents.
DIVERSITY, EQUITY AND INCLUSION
In 2020, we announced Enbridge’s ESG goals – including goals to increase representation of women, underrepresented ethnic and racial groups (including Indigenous peoples), people with disabilities and veterans – to ensure our workforce is reflective of the communities where we operate. In executing on our ESG strategy, we continue to track progress towards these representation goals in 2023. Consistent with our culture, we remain committed to open, two-way dialogue related to our goals, enhancing transparency and accountability for all stakeholders.
Diversity Representation Goals
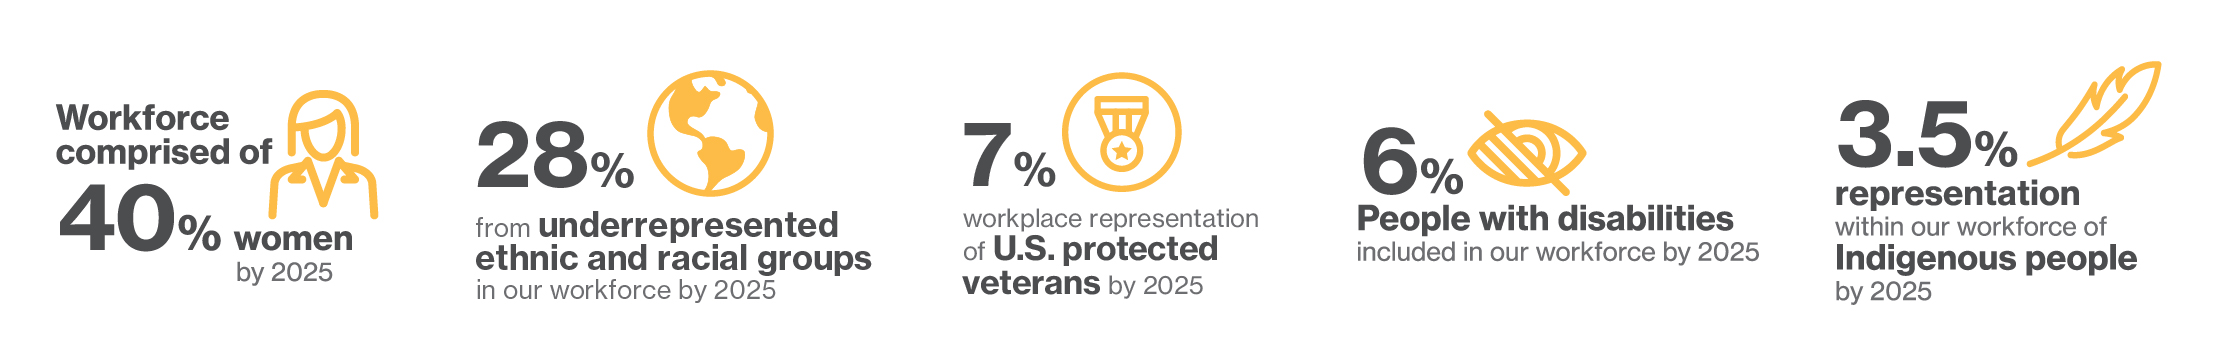
PRODUCTIVITY AND DEVELOPMENT
We continually invest in our people’s personal and professional development and productivity because we recognize their success is our success. Employees are provided access to leading productivity tools and technology, and can opt in to a range of development and growth opportunities through a variety of channels, which encourages employees to build new skills needed for our core and emerging lines of business and the broader energy transition.
42
EXECUTIVE OFFICERS
The following table sets forth information regarding our executive officers as at February 9, 2024:
| Name | Age | Position | ||||||
| Gregory L. Ebel | 59 | President & Chief Executive Officer | ||||||
| Patrick R. Murray | 49 | Executive Vice President & Chief Financial Officer | ||||||
| Colin K. Gruending | 54 | Executive Vice President & President, Liquids Pipelines | ||||||
| Cynthia L. Hansen | 59 | Executive Vice President & President, Gas Transmission and Midstream | ||||||
| Michele E. Harradence | 55 | Executive Vice President & President, Gas Distribution & Storage | ||||||
| Matthew A. Akman | 56 | Executive Vice President, Corporate Strategy & President, Power | ||||||
| Reginald D. Hedgebeth | 56 | Executive Vice President, External Affairs and Chief Legal Officer | ||||||
| Maximilian G. Chan | 45 | Senior Vice President & Corporate Development Officer | ||||||
| Laura J. Sayavedra | 56 | Senior Vice President, Safety, Projects & Chief Administrative Officer | ||||||
Gregory L. Ebel was appointed President and Chief Executive Officer (CEO) on January 1, 2023. Mr. Ebel is also a member of the Enbridge Board of Directors. Mr. Ebel served as Chair of the Enbridge Board of Directors following the merger of Enbridge and Spectra Energy Corp (Spectra Energy) in 2017 until January 1, 2023. Prior to that time, he served as Chairman, President and CEO of Spectra Energy from 2009 until February 27, 2017. Previously, Mr. Ebel also served as Spectra Energy’s Group Executive and Chief Financial Officer beginning in 2007, President of Union Gas Limited from 2005 until 2007, and Vice President, Investor & Shareholder Relations of Duke Energy Corporation from 2002 until 2005.
Patrick R. Murray was appointed Executive Vice President & Chief Financial Officer (CFO) on July 1, 2023. Mr. Murray has oversight for all of Enbridge’s financial affairs including investor relations, financial reporting, financial planning, treasury, tax, insurance, risk and audit management functions. He also leads Enbridge’s technology and information services teams. Prior to assuming his current role, Mr. Murray was Senior Vice President & Chief Accounting Officer of Enbridge from June 2020 to June 2023, Vice President, Financial Planning & Analysis and Controller from June 2019 to May 2020,and Vice President, Financial Planning & Analysis from February 2017 to June 2019. Mr. Murray joined Enbridge over 25 years ago and has held a variety of roles within internal audit, corporate accounting, investor relations, treasury, and corporate development during that time.
Colin K. Gruending was appointed Executive Vice President and President, Liquids Pipelines on October 1, 2021. Mr. Gruending is responsible for the overall leadership and operations of Enbridge’s Liquids Pipelines business. Previously, he served as our Executive Vice President and Chief Financial Officer from June 2019 to October 2021; Senior Vice President, Corporate Development and Investment Review from May 2018 to June 2019; and Vice President, Corporate Development and Investment Review from February 2017 to May 2018.
Cynthia L. Hansen was appointed Executive Vice President and President, Gas Transmission and Midstream on March 1, 2022. Ms. Hansen is responsible for the overall leadership and operations of Enbridge’s natural gas pipeline and midstream business across North America. Previously, she served as our Executive Vice President, Gas Distribution and Storage from June 2019 to March 2022 and as Executive Vice President, Utilities and Power Operations from February 2017 to June 2019. Ms. Hansen is also the Executive Sponsor for Asset and Work Management Transformation across Enbridge, working with other business unit leaders.
43
Michele E. Harradence was appointed Executive Vice President & President, Gas Distribution & Storage on March 5, 2023. She is responsible for the overall leadership and operations of Ontario-based Enbridge Gas, as well as Gazifère, which serves the Gatineau region of Québec. Prior to assuming her current role, Ms. Harradence was Senior Vice President & President, Gas Distribution and Storage from March 2022 to March 2023. Prior thereto, she was Senior Vice President and Chief Operations Officer of Enbridge’s Gas Transmission and Midstream business unit from June 2019 to March 2022 and Senior Vice President Operations, Gas Transmission and Midstream from February 2017 to June 2019.
Matthew A. Akman was appointed Executive Vice President, Corporate Strategy & President, Power on March 5, 2023. Mr. Akman is responsible for the overall leadership and operations of Enbridge’s power business and also leads our new energy technologies and corporate strategy efforts. Prior to assuming his current role, Mr. Akman was Senior Vice President, Corporate Strategy & President, Power from January 2023 to March 2023. Prior thereto, he was Senior Vice President, Strategy, Power & New Energy Technologies from October 2021 to December 2022, and Senior Vice President, Strategy & Power from June 2019 to October 2021. Mr. Akman joined Enbridge in early 2016 as our head of Corporate Strategy and also previously held responsibilities for Corporate Development and Investor Relations.
Reginald D. Hedgebeth was appointed Executive Vice President, External Affairs and Chief Legal Officer on January 1, 2024. Mr. Hedgebeth leads our legal, public affairs, communications & sustainability, corporate security and aviation teams across the organization. Prior to joining Enbridge, Mr. Hedgebeth served as Chief Legal Officer of Capital Group from January 2021 to June 2023, Executive Vice President, General Counsel and Chief Administrative Officer of Marathon Oil Corporation from April 2017 to December 2020 and, prior to its merger with Enbridge in 2017, General Counsel, Corporate Secretary and Chief Ethics and Compliance Officer for Spectra Energy.
Maximilian G. Chan was appointed Senior Vice President & Corporate Development Officer on March 1, 2022. He was later appointed to the Executive Leadership team on May 8, 2023. Mr. Chan is responsible for the oversight of mergers and acquisitions, capital allocation, investment review, integration and corporate growth objectives. Prior to assuming his current role, Mr. Chan was Vice President, Treasury and Head of Enterprise Risk for Enbridge from February 2020 to March 2022,and Vice President, Treasury from July 2018 to February 2020.
Laura J. Sayavedra was appointed Senior Vice President, Safety, Projects & Chief Administrative Officer on January 1, 2024. Ms. Sayavedra is responsible for the oversight of our safety, capital project execution, human resources, real estate and supply chain management functions. Prior to assuming her current role, Ms. Sayavedra was Senior Vice President, Safety & Reliability, Projects and Unify from March 2022 to December 2023. Prior to that, she led Finance Transformation at Enbridge, and prior to its merger with Enbridge in 2017, was also Vice President & Treasurer for Spectra Energy, and CFO of Spectra Energy Partners LP. She has held various finance, strategy, and business development executive leadership roles.
ADDITIONAL INFORMATION
Additional information about us is available on our website at www.enbridge.com, on SEDAR+ at www.sedarplus.ca and on EDGAR at www.sec.gov. The aforementioned information is made available in accordance with legal requirements and is not, unless otherwise specifically stated, incorporated by reference into this Annual Report on Form 10-K. We make available free of charge, through our website, annual reports on Form 10-K, quarterly reports on Form 10-Q and current reports on Form 8-K and amendments to those reports filed or furnished pursuant to Section 13(a) or 15(d) of the Exchange Act, as well as proxy statements, as soon as reasonably practicable after we electronically file such material with, or furnish it to, the SEC. Reports, proxy statements and other information filed with the SEC may also be obtained through the SEC’s website (www.sec.gov).
44
ENBRIDGE GAS INC.
Additional information about Enbridge Gas can be found in its annual information form, financial statements and MD&A for the year ended December 31, 2023, which have been filed with the securities commissions or similar authorities in each of the provinces of Canada. These documents contain detailed disclosure with respect to Enbridge Gas and are publicly available on SEDAR+ at www.sedarplus.ca. These documents are not, unless otherwise specifically stated, incorporated by reference into this Annual Report on Form 10-K.
ENBRIDGE PIPELINES INC.
Additional information about Enbridge Pipelines Inc. (EPI) can be found in its annual information form, financial statements and MD&A for the year ended December 31, 2023, which have been filed with the securities commissions or similar authorities in each of the provinces of Canada. These documents contain detailed disclosure with respect to EPI and are publicly available on SEDAR+ at www.sedarplus.ca. These documents are not, unless otherwise specifically stated, incorporated by reference into this Annual Report on Form 10-K.
WESTCOAST ENERGY INC.
Additional information about Westcoast can be found in its financial statements and MD&A for the year ended December 31, 2023, which have been filed with the securities commissions or similar authorities in each of the provinces of Canada. These documents contain detailed disclosure with respect to Westcoast and are publicly available on SEDAR+ at www.sedarplus.com. These documents are not, unless otherwise specifically stated, incorporated by reference into this Annual Report on Form 10-K.
ITEM 1A. RISK FACTORS
The following risk factors could materially and adversely affect our business, operations, financial results, market price or value of our securities. This list is not exhaustive, and we place no priority or likelihood based on order of presentation or grouping under sub-captions.
RISKS RELATED TO CLIMATE CHANGE
Climate change risks could adversely affect our reputation, strategic plan, business, operations and financial results, and these effects could be material.
Climate change is a systemic risk that presents both physical and transition risks to our organization. A summary of these risks is outlined below. Given the interconnected nature of climate change-related impacts, we also discuss these risks within the context of other risks impacting Enbridge throughout Item 1A. Risk Factors. Climate change and its associated impacts may also increase our exposure to, and magnitude of, other risks identified in Item 1A. Risk Factors. Our business, financial condition, results of operations, cash flows, reputation, access to and cost of capital or insurance, business plans or strategy may all be materially adversely impacted as a result of climate change and its associated impacts.
PHYSICAL RISKS
Climate-related physical risks, resulting from changing and more extreme weather, can damage our assets and affect the safety and reliability of our operations. Climate-related physical risks may be acute or chronic. Acute physical risks are those that are event-driven, including increased frequency and severity of extreme weather events, such as heavy snowfall, heavy rainfall, floods, landslides, fires, hurricanes, cyclones, tornados, tropical storms, ice storms, and extreme temperatures. Chronic physical risks are longer-term shifts in climate patterns, such as long-term changes in precipitation patterns, or sustained higher temperatures, which may cause sea level rises or chronic heat waves.
45
Our assets are exposed to potential damage or other negative impacts from these kinds of events, which could result in reduced revenue from business disruption or reduced capacity and may also lead to increased costs due to repairs and required adaptation measures. Such events may also result in personal injury, loss of life or damage to property and the environment. We have experienced operational interruptions and damage to our assets from such weather events in the past, and we expect to continue to experience climate-related physical risks in the future, potentially with increasing frequency or severity.
TRANSITION RISKS
Transition risks relate to the transition to a lower-emissions economy, which may increase our cost of operations, impact our business plans, and influence stakeholder decisions about our company, each of which could adversely impact our reputation, strategic plan, business, operations or financial results. These transition risks include the following categories:
•Policy and legal risks
Policy and legal risks may result from evolving government policy, legislation, regulations and regulatory decisions focused on climate change, as well as changing political and public opinion, stakeholder opposition, legal challenges, litigation and regulatory proceedings. Foreign and domestic governments continue to evaluate and implement policy, legislation, and regulations regarding reduction of GHG emissions, adaptation to climate change, and transition to a lower-carbon economy. Such policies, laws and regulations vary at the federal, state, provincial and municipal levels in which Enbridge operates and are continually evolving. The implementation of these measures may be accelerated by international multilateral agreements, increasing physical impacts of climate change, and changing political and public opinion. Enbridge is currently required to adhere to a number of carbon-pricing mechanisms, including explicit carbon prices (i.e., in BC) and implicit carbon prices (i.e., Canadian federal OBPS). In Canada, the federal government has proposed new clean electricity regulations and is considering options to cap and cut oil and gas sector GHG emissions, which may impact our business. Such evolving policy, legislation and regulation could impact commodity demand and the overall energy mix we deliver and may result in significant expenditures and resources, as well as increased costs for our customers. In recent years, there has been an increase in climate-related regulatory action and litigation which has the potential to adversely impact our reputation, business, operations and financial results.
•Technology risks
Our success in executing our strategic plan, including adapting to the energy transition over time and attaining our GHG emissions reduction goals and targets, depends, in part, on technology (including technology still under development), innovation and continued diversification with renewable power and other lower-carbon energy infrastructure as well as modernization of our infrastructure, all of which could require significant capital expenditures and resources, that could materially differ from our original estimates and expectations. There is also a risk that GHG emissions reduction technology does not materialize as expected, making it more difficult to reduce emissions, or that political or public opinion regarding such technologies continues to evolve.
46
•Market risks
Climate change concerns, increased demand for lower-carbon and zero-emissions energy, alternative and new energy sources and technologies, changing customer behavior and reduced energy consumption could impact the demand for our services or securities. In recent years, there has been a push toward certain investors decreasing the carbon intensity of their portfolios and pressure for banks and insurance providers to reduce or cease support for oil and natural gas and related infrastructure businesses and projects. Potential impacts include increased costs to manage these risks, adverse impacts to our access to and cost of capital, and reduced demand for, or value of, our securities. The pace and scale of the transition to a lower-carbon economy may pose a risk if Enbridge diversifies either too quickly or too slowly. Similarly, uncertainty in market signals, such as abrupt and unexpected shifts in energy costs and demands, including due to climate change concerns, can impact revenue through reduced throughput volumes on our pipeline transportation systems.
•Reputational risks
Companies across all sectors and industries are facing changing expectations or increasing scrutiny from stakeholders related to their approach to climate change and GHG emissions. Companies in the energy industry are experiencing stakeholder opposition to both existing and new infrastructure, as well as organized opposition to oil and natural gas extraction and shipment of oil and natural gas products. If we are not able to achieve our GHG emissions reduction goals and targets, are not able to meet future climate, emissions or other regulatory or reporting requirements, or are not able to meet or manage current and future expectations and issues regarding climate change that are important to our stakeholders, it could negatively impact our reputation and, in turn, our business, operations or financial results.
•Disclosure risks
Enbridge currently provides certain climate-related disclosures, and from time to time, establishes and publicly announces goals and commitments related to climate change, including reduction of GHG emissions. Standards and processes for climate-related disclosure, setting goals and targets, and measuring and reporting on progress are still developing for our sector and continue to evolve. Our internal controls and processes also continue to evolve, and our climate-related disclosures, goals and targets are based on assumptions that are subject to change. Aligning with evolving requirements has required and may continue to require us to incur significant costs. There can be no assurance that our current or future disclosures and goals, the pathways by which we plan to reach our goals, or the methodologies that we currently use to measure and report on progress, will align with new and evolving standards and processes, legal requirements or expectations of stakeholders. Such misalignment may result in reputational harm, regulatory action or other legal action.
RISKS RELATED TO OPERATIONAL DISRUPTION OR CATASTROPHIC EVENTS
Operation of complex energy infrastructure involves many hazards and risks that may adversely affect our business, financial results and the environment.
These operational risks include adverse weather conditions, natural disasters, accidents, the breakdown or failure of equipment or processes, and lower than expected levels of operating capacity and efficiency. These operational risks could be catastrophic in nature.
Operational risk is also intensified by climate change. Climate change presents physical risks that may affect the safety and reliability of our operations. These include acute physical risks, such as heavy snowfall, heavy rainfall, floods, landslides, fires, hurricanes, cyclones, tornados, tropical storms, ice storms, and extreme temperatures, and chronic physical risks, such as long-term changes in precipitation patterns, or sustained higher temperatures.
47
Our assets and operations are exposed to potential damage or other negative impacts from these operational risks, which could result in reduced revenue from business disruption or reduced capacity and may also lead to increased costs due to repairs and required adaptation measures. Such events have led to, and could in the future lead to, rupture or release of product from our pipeline systems and facilities, resulting in damage to property and the environment, personal injury or loss of life, which could result in substantial losses for which insurance may not be sufficient or available and for which we may bear part or all of the cost.
An environmental incident is an event that may cause environmental harm and could lead to increased operating and insurance costs, thereby negatively impacting earnings. An environmental incident could have lasting reputational impacts and could impact our ability to work with various stakeholders. For pipeline and storage assets located near populated areas, including residential communities, commercial business centers, industrial sites and other public gathering locations, the level of damage resulting from these events could be greater.
We have experienced such events in the past, and expect to continue to incur significant costs in preparing for or responding to operational risks and events. We expect to continue to experience climate-related physical risks, potentially with increasing frequency and severity, and we cannot guarantee that we will not experience catastrophic or other events in the future. In addition, we could be subject to litigation and significant fines and penalties from regulators in connection with any such events.
A service interruption could have a significant impact on our operations, and negatively impact financial results, relationships with stakeholders and our reputation.
A service interruption due to a major power disruption, curtailment of commodity supply, operational incident, security incident (cyber or physical), availability of gas supply or distribution or other reasons could have a significant impact on our operations and negatively impact financial results, relationships with stakeholders, our reputation or the safety of our end-use customers. Service interruptions that impact our crude oil and natural gas transportation services can negatively impact shippers’ operations and earnings as they are dependent on our services to move their product to market or fulfill their own contractual arrangements, and this has in the past and may again lead to claims against us. We have experienced, and may again experience, service interruptions, restrictions or other operational constraints, including in connection with the kinds of operational incidents referred to in the previous risk factor.
Our operations involve safety risks to the public and to our workers and contractors.
Several of our pipelines and distribution systems are operated in close proximity to populated areas and a major incident could result in injury or loss of life to members of the public. In addition, given the natural hazards inherent in our operations, our workers and contractors are subject to personal safety risks. A public safety incident or an injury or loss of life to our workers or contractors, which we have experienced in the past and, despite the precautions we take, may experience in the future, could result in reputational damage to us, material repair costs or increased operating and insurance costs.
Cyber attacks and other cybersecurity incidents pose threats to our technology systems and could materially adversely affect our business, operations, reputation or financial results.
Our business is dependent upon information systems and other digital technologies for controlling our plants, pipelines and other assets, processing transactions and summarizing and reporting results of operations. The secure processing, maintenance and transmission of information is critical to our operations.
48
Cybersecurity risks have increased in recent years as a result of the proliferation of new technologies and the increased sophistication of cyber attacks and financially motivated cybercrime, as well as due to international and domestic political factors including geopolitical tensions, armed hostilities, war, civil unrest, sabotage, terrorism and state-sponsored or other cyber espionage. Human error or malfeasance can also contribute to a cyber incident, and cyber attacks can be internal as well as external and occur at any point in our supply chain. Because of the critical nature of our infrastructure and our use of information systems and other digital technologies to control our assets, we face a heightened risk of cyber attacks, such as ransomware, theft, misplaced or lost data, programming errors, phishing attacks, denial of service attacks, acts of vandalism, computer viruses, malware, hacking, malicious attacks, software vulnerabilities, employee errors and/or malfeasance, or other attacks, security or data breaches or other cybersecurity incidents. Cyber threat actors have attacked and threatened to attack energy infrastructure, and various government agencies have increasingly stressed that these attacks are targeting critical infrastructure, including pipelines, public utilities, and power generation, and are increasing in sophistication, magnitude, and frequency. Additionally, these risks may escalate during periods of heightened geopolitical tensions. New cybersecurity legislation, regulations and orders have been recently implemented or proposed, resulting in additional actual and anticipated regulatory oversight and compliance requirements, which will require significant internal and external resources. We cannot predict the potential impact to our business of potential future legislation, regulations or orders relating to cybersecurity.
We have experienced an increase in the number of attempts by external parties to access our systems or our company data without authorization, and we expect this trend to continue. Although we devote significant resources and security measures to prevent unwanted intrusions and to protect our systems and data, whether such data is housed internally or by external third parties, we and our third party vendors have experienced and expect to continue to experience cyber attacks of varying degrees in the conduct of our business. To-date, these prior cyber attacks have not, to our knowledge, had a material adverse effect on our business, operations or financial results. However, there is a risk that any such incidents could have a material adverse effect on us in the future.
Our technology systems or those of our vendors or other service providers are expected to become the target of further cyber attacks or security breaches which could compromise our data and systems or our access thereto by us, our customers or others, affect our ability to correctly record, process and report transactions, result in the loss of information, or cause operational disruption or incidents. There can be no assurance that our business continuity plans will be completely effective in avoiding disruption and business impacts.Furthermore, we and some of our third-party service providers (who may in turn also use third-party service providers) collect, process or store sensitive data in the ordinary course of our business, including personal information of our employees, residential gas distribution customers, land owners and investors, as well as intellectual property or other proprietary business information of ours or our customers or suppliers.We and some of our third-party services providers will process increasing amounts of personal information upon the closing of the previously announced acquisitions of gas utilities in the US, due to their large residential customer bases.
As a result of the foregoing, we could experience loss of revenues, repair, remediation or restoration costs, regulatory action, fines and penalties, litigation, breach of contract or indemnity claims, cyber extortion, ransomware, implementation costs for additional security measures, loss of customers, customer dissatisfaction, reputational harm, be liable under laws that protect the privacy of personal information, other negative consequences, or other costs or financial loss.These risks may be heightened, and the consequences magnified, upon closing of the Acquisitions. Regardless of the method or form of cyber attack or incident, any or all of the above could materially adversely affect our reputation, business, operations or financial results.
49
In addition, a cyber attack could occur and persist for an extended period without detection. Any investigation of a cyber attack or other security incident may be inherently unpredictable, and it would take time before the completion of any investigation and availability of full and reliable information. During such time, we may not know the extent of the harm or how best to remediate it, and certain errors or actions could be repeated or compounded before they are discovered and remediated, all or any of which could further increase the costs and consequences of a cyber attack or other security incident, and our remediation efforts may not be successful. The inability to implement, maintain and upgrade adequate safeguards could materially and adversely affect our results of operations, cash flows, and financial condition. Moreover, recent rulemakings may require us to disclose information about a cybersecurity incident before it has been completely investigated or remediated in full or even in part. As cyber attacks continue to evolve, we may be required to expend significant additional resources to continue to modify or enhance our protective measures or to investigate and remediate any information security vulnerabilities.
Furthermore, media reports about a cyber attack or other significant security incident affecting Enbridge, whether accurate or not, or, under certain circumstances, our failure to make adequate or timely disclosures to the public, law enforcement, other regulatory agencies or affected individuals following any such event, whether due to delayed discovery or otherwise, could negatively impact our operating results and result in other negative consequences, including damage to our reputation or competitiveness, harm to our relationships with customers, partners, suppliers, investors, and other third parties, interruption to our management, remediation or increased protection costs, significant litigation or regulatory action, fines or penalties, all of which could materially adversely affect our business, operations, reputation or financial results.
Terrorist attacks and threats, escalation of military activity in response to these attacks or acts of war, and other civil unrest or activism could adversely affect our business, operations or financial results.
Terrorist attacks and threats (which may take the form of cyber attacks), escalation of military activity, armed hostilities, war, sabotage, or civil unrest or activism may have significant effects on general economic conditions and may cause fluctuations in consumer confidence and spending and market liquidity, each of which could adversely affect our business. Future terrorist attacks, rumors or threats of war, actual conflicts involving the US or Canada, or military or trade disruptions may significantly affect our operations and those of our customers. Strategic critical infrastructure targets, such as energy-related assets, are at greater risk of cyber attack and may be at greater risk of other future attacks than other targets in the US and Canada. Enbridge’s infrastructure and projects under construction could be direct targets or indirect casualties of a cyber or physical attack. In addition, increased environmental activism against pipeline construction and operation could potentially result in work delays, reduced demand for our products and services, new legislation or public policy or increased stringency thereof, or denial or delay of permits and rights-of-way.
Pandemics, epidemics or infectious disease outbreaks, such as the COVID-19 pandemic, may adversely affect local and global economies and our business, operations or financial results.
Disruptions caused by pandemics, epidemics or infectious disease outbreaks could materially adversely affect our business, operations, financial results and forward-looking expectations. Governments' emergency measures to combat the spread could include restrictions on business activity and travel, as well as requirements to isolate or quarantine. The duration and magnitude of such impacts will depend on many factors that we may not be able to accurately predict. COVID-19 and government responses interrupted business activities and supply chains, disrupted travel, and contributed to significant volatility in the financial and commodity markets.
Disruptions related to pandemics, epidemics or infectious disease outbreaks could have the effect of heightening many of the other risks described in this Item 1A. Risk Factors.
50
RISKS RELATED TO OUR BUSINESS AND INDUSTRY
There are utilization risks with respect to our assets.
With respect to our Liquids Pipelines assets, we are exposed to throughput risk on the Canadian Mainline, and we are exposed to throughput risk under certain tolling agreements applicable to other Liquids Pipelines assets, such as the Lakehead System. A decrease in volumes transported can directly and adversely affect our revenues and earnings. Factors such as changing market fundamentals, capacity bottlenecks, regulatory restrictions, maintenance and operational incidents on our system and upstream or downstream facilities, and increased competition can all impact the utilization of our assets. Market fundamentals, such as commodity prices and price differentials, weather, gasoline price and consumption, alternative and new energy sources and technologies, and global supply disruptions outside of our control can impact both the supply of and demand for crude oil and other liquid hydrocarbons transported on our pipelines.
With respect to our Gas Transmission and Midstream assets, gas supply and demand dynamics continue to change due to shifts in regional and global production and consumption. These shifts can lead to fluctuations in commodity prices and price differentials, which could result in our system not being fully utilized in some areas. Other factors affecting system utilization include operational incidents, regulatory restrictions, system maintenance, and increased competition.
With respect to our Gas Distribution and Storage assets, customers are billed on both a fixed charge and volumetric basis and our ability to collect the total revenue requirement (the cost of providing service, including a reasonable return to the utility) depends on achieving the forecast distribution volume established in the rate-making process. The probability of realizing such volume is contingent upon four key forecast variables: weather, economic conditions, pricing of competitive energy sources and growth in the number of customers. Weather is a significant driver of delivery volumes, given that a significant portion of our Gas Distribution customer base uses natural gas for space heating. Distribution volume may also be impacted by the increased adoption of energy efficient technologies, along with more efficient building construction, that continue to place downward pressure on consumption. In addition, conservation efforts by customers may further contribute to a decline in annual average consumption. Sales and transportation service to large volume commercial and industrial customers is more susceptible to prevailing economic conditions. As well, the pricing of competitive energy sources affects volume distributed to these sectors as some customers have the ability to switch to an alternate fuel. Even in those circumstances where we attain our respective total forecast distribution volume, our Gas Distribution business may not earn its expected ROE due to other forecast variables, such as the mix between the higher margin residential and commercial sectors and the lower margin industrial sector. Our Gas Distribution business remains at risk for the actual versus forecast large volume contract commercial and industrial volumes.
With respect to our Renewable Power Generation assets, earnings from these assets are highly dependent on weather and atmospheric conditions as well as continued operational availability of these energy producing assets. While the expected energy yields for Renewable Power Generation projects are predicted using long-term historical data, wind and solar resources are subject to natural variation from year-to-year and from season-to-season. Any prolonged reduction in wind or solar resources at any of the Renewable Power Generation facilities could lead to decreased earnings and cash flows. Additionally, inefficiencies or interruptions of Renewable Power Generation facilities due to operational disturbances or outages resulting from weather conditions or other factors, could also impact earnings.
51
Our assets vary in age and were constructed over many decades which causes our inspection, maintenance or repair costs to increase.
Our pipelines vary in age and were constructed over many decades. Pipelines are generally long-lived assets, and pipeline construction and coating techniques have changed over time. Depending on the era of construction and construction techniques, some assets require more frequent inspections, which has resulted in and is expected to continue to result in increased maintenance or repair expenditures in the future. Any significant increase in these expenditures could adversely affect our business, operations or financial results.
Competition may result in a reduction in demand for our services, fewer project opportunities or assumption of risk that results in weaker or more volatile financial performance than expected.
Our Liquids Pipelines business faces competition from competing carriers available to ship liquid hydrocarbons to markets in Canada, the US and internationally and from proposed pipelines that seek to access basins and markets currently served by our Liquids Pipelines. Competition among existing pipelines is based primarily on the cost of transportation, access to supply, the quality and reliability of service, contract carrier alternatives and proximity to markets. The liquids transported in our pipelines currently, or are expected to increasingly, compete with other emerging alternatives for end-users, including, but not limited to, electricity, electric batteries, biofuels, and hydrogen. Additionally, we face competition from alternative storage facilities. Our natural gas transmission and storage businesses compete with similar facilities that serve our supply and market areas in the transmission and storage of natural gas. The natural gas transported in our business also competes with other forms of energy available to our customers and end-users, including electricity, coal, propane, fuel oils, and renewable energy. Our Renewable Power Generation business faces competition in the procurement of long-term power purchase agreements and from other fuel sources in the markets in which we operate. Competition in all of our businesses, including competition for new project development opportunities, could have a negative impact on our business, financial condition or results of operations.
Completion of our secured projects and maintenance programs are subject to various regulatory, operational and market risks, which may affect our ability to drive long-term growth.
Our project execution continues to face challenges with intense scrutiny on regulatory and environmental permit applications, politicized permitting, public opposition including protests, action to repeal permits, and resistance to land access. We have experienced permit denials, in particular, in relation to necessary maintenance on the Line 5 Pipeline on the Bad River Reservation in northern Wisconsin based on a stated desire of the Bad River Band to shut down the pipeline.
Continued challenges with global supply chains have created unpredictability in materials cost and availability. Labor shortages and inflationary pressures have increased costs of engineering and construction services.
Other events that can and have delayed project completion and increased anticipated costs include contractor or supplier non-performance, extreme weather events or geological factors beyond our control.
52
Changing expectations of stakeholders regarding ESG and climate change practices could erode stakeholder trust and confidence, damage our reputation and influence actions or decisions about our company and industry and have negative impacts on our business, operations or financial results.
Companies across all sectors and industries are facing changing expectations or increasing scrutiny from stakeholders related to their approach to ESG matters of greatest relevance to their business and to their stakeholders. For energy companies, climate change, GHG emissions, safety and stakeholder and Indigenous relations remain primary focus areas, while other environmental elements such as biodiversity, human rights, and supply chain are ascendant. Companies in the energy industry are experiencing stakeholder opposition to new and existing infrastructure, as well as organized opposition to oil and natural gas extraction and shipment of oil and natural gas products. Changing expectations of our practices and performance across these ESG areas may impose additional costs or create exposure to new or additional risks. We are also exposed to the risk of higher costs, delays, project cancellations, loss of ability to secure new growth opportunities, new restrictions or the cessation of operations of existing pipelines due to increasing pressure on governments and regulators, and legal action, such as the legal challenges to the operation of Line 5 in Michigan and Wisconsin.
Our operations, projects and growth opportunities require us to have strong relationships with key stakeholders, including local communities, Indigenous groups and others directly impacted by our activities, as well as governments, regulatory agencies, investors and investor advocacy groups, investment funds, financial institutions, insurers and others, which are increasingly focused on ESG practices and performance. Enhanced public awareness of climate change has driven an increase in demand for lower-carbon and zero-emissions energy. There have been efforts in recent years affecting the investment community, including certain investors increasing investments in lower-carbon assets and businesses while decreasing the carbon intensity of their portfolios through, among other measures, divestments of companies with high exposure to GHG-intensive operations and products. Certain stakeholders have also pressured commercial and investment banks and insurance providers to reduce or stop financing and providing insurance coverage to oil and natural gas and related infrastructure businesses and projects. Managing these risks requires significant effort and resources. Potential impacts could also include changing investor sentiment regarding investment in Enbridge, which could impair our access to and increase our cost of capital, including penalties associated with our sustainability-linked financing and could adversely impact demand for, or value of, our securities.
Over the past year, geopolitical uncertainty, slowing Canadian and US economies and continuing inflationary pressures have underscored the critical need for access to secure, affordable energy.
The pace and scale of the transition to a lower-emission economy may pose a risk if Enbridge diversifies either too quickly or too slowly. Similarly, unexpected shifts in energy demands, including due to climate change concerns, can impact revenue through reduced throughput volumes on our pipeline transportation systems.
53
We have long been committed to strong ESG practices, performance and reporting, and in 2020 introduced a set of ESG goals to strengthen transparency and accountability. The goals include increasing diversity and inclusion within our organization and reducing GHG emissions from our operations to net-zero by 2050, with corporate and business unit action plans aligned to our strategic priority to adapt to the energy transition over time. The costs associated with meeting our ESG goals, including our GHG emissions reduction goals, could be significant. There is also a risk that some or all of the expected benefits and opportunities of achieving our ESG goals may fail to materialize, may cost more than anticipated to achieve, may not occur within the anticipated time periods or may no longer meet changing stakeholder expectations. Similarly, there is a risk that emissions reduction technologies do not materialize as expected making it more difficult to reduce emissions. If we are not able to achieve our ESG goals, are not able to meet current and future climate, emissions or related reporting requirements of regulators, or are unable to meet or manage current and future expectations regarding issues important to investors or other stakeholders (including those related to climate change), it could erode stakeholder trust and confidence, which could negatively impact our reputation, business, operations or financial results.
Our forecasted assumptions may not materialize as expected, including on our expansion projects, acquisitions and divestitures.
We evaluate expansion projects, acquisitions and divestitures on an ongoing basis. Planning and investment analysis is highly dependent on accurate forecasting assumptions and to the extent that these assumptions do not materialize, financial performance may be lower or more volatile than expected. Volatility and unpredictability in the economy, both locally and globally, and changes in cost estimates, project scoping and risk assessment could result in a loss of profits. Similarly, uncertainty in market signals, such as abrupt and unexpected shifts in energy costs and demands, as we saw in 2020 resulting from the COVID-19 pandemic, have impacted, and may in the future impact, revenue through reduced throughput volumes on our pipeline transportation systems.
One or all of the Acquisitions may not occur on the terms contemplated in the applicable Purchase and Sale Agreement or at all, or may not occur within the expected time frame, which may negatively affect the benefits we expect to obtain from the Acquisitions.
We cannot provide any assurance that the Acquisitions will be completed in the manner, on the terms and on the time frame currently anticipated, or at all. Completion of each of the Acquisitions is subject to the satisfaction or waiver of a number of conditions as set forth in the applicable Purchase and Sale Agreement that are beyond our control and may prevent, delay or otherwise materially adversely affect its completion.
The success of the Acquisitions will depend on, among other things, our ability to integrate the US gas utilities into our business in a manner that facilitates growth opportunities and achieves anticipated results. There is a significant degree of difficulty and management distraction inherent in the process of integrating an acquisition, including challenges integrating certain operations and functions (including regulatory functions), technologies, organizations, procedures, policies and operations, addressing differences in the business cultures of Enbridge and the US gas utilities and retaining key personnel. The integration may be complex and time consuming and involve delays or additional and unforeseen expenses. The integration process and other disruptions resulting from the Acquisitions may also disrupt our ongoing business.
Any failure to realize the anticipated benefits of the Acquisitions, additional unanticipated costs or other factors could negatively impact our earnings or cash flows, decrease or delay any beneficial effects of the Acquisitions and negatively impact our business, financial condition and results of operations.
54
Our insurance coverage may not fully cover our losses in the event of an accident, natural disaster or other hazardous event, and we may encounter increased cost arising from the maintenance of, or lack of availability of, insurance.
Our operations are subject to many hazards inherent in our industry as described in this Item 1A. Risk Factors. We maintain an insurance program for us, our subsidiaries and certain of our affiliates to mitigate a certain portion of our risks. However, not all potential risks arising from our operations are insurable, or are insured by us as a result of availability, high premiums and for various other reasons. Enbridge self-insures a significant portion of certain risks through our wholly-owned captive insurance subsidiaries, and Enbridge’s insurance coverage is subject to terms and conditions, exclusions and large deductibles or self-insured retentions which may reduce or eliminate coverage in certain circumstances.
Enbridge’s insurance policies are generally renewed on an annual basis and, depending on factors such as market conditions, the premiums, terms, policy limits and/or deductibles can vary substantially. We can give no assurance that we will be able to maintain adequate insurance in the future at rates or on other terms we consider commercially reasonable. In such case, we may decide to self-insure additional risks.
A significant self-insured loss, uninsured loss, a loss significantly exceeding the limits of our insurance policies, a significant delay in the payment of a major insurance claim, or the failure to renew insurance policies on similar or favorable terms could materially and adversely affect our business, financial condition and results of operations.
Our business is exposed to changes in market prices including interest rates and foreign exchange rates. Our risk management policies cannot eliminate all risks and may result in material financial losses. In addition, any non-compliance with our risk management policies could adversely affect our business, operations or financial results.
Our use of debt financing exposes us to changes in interest rates on both future fixed rate debt issuances and floating rate debt. While our financial results are denominated in Canadian dollars, many of our businesses have foreign currency revenues or expenses, particularly the US dollar. Changes in interest rates and foreign exchange rates could materially impact our financial results.
We use financial derivatives to manage risks associated with changes in foreign exchange rates, interest rates, commodity prices, power prices and our share price to reduce volatility of our cash flows. Based on our risk management policies, substantially all of our financial derivatives are associated with an underlying asset, liability and/or forecasted transaction and not intended for speculative purposes.
These policies cannot, however, eliminate all risk, including unauthorized trading. Although this activity is monitored independently by our Risk Management function, we can provide no assurance that we will detect and prevent all unauthorized trading and other violations, particularly if deception, collusion or other intentional misconduct is involved, and any such violations could adversely affect our business, operations or financial results.
To the extent that we hedge our exposure to market prices, we will forego the benefits we would otherwise experience if these were to change in our favor. In addition, hedging activities can result in losses that might be material to our financial condition, results of operations and cash flows. Such losses have occurred in the past and could occur in the future. See Part II, Item 7A. Quantitative and Qualitative Disclosures about Market Risk and Item 8. Financial Statements and Supplementary Data for a discussion of our derivative instruments and related hedging activities.
55
We rely on access to short-term and long-term capital markets to finance capital requirements and support liquidity needs. Cost effective access to those markets can be affected, particularly if we or our rated subsidiaries are unable to maintain an investment-grade credit rating.
A significant portion of our consolidated asset base is financed with debt. The maturity and repayment profile of debt used to finance investments often does not correlate to cash flows from assets. Accordingly, we rely on access to both short-term and long-term capital markets as a source of liquidity for capital requirements not satisfied by cash flows from operations and to refinance investments originally financed with debt. Our senior unsecured long-term debt is currently rated investment-grade by various rating agencies. If the rating agencies were to rate us or our rated subsidiaries below investment-grade, our borrowing costs would increase, perhaps significantly. Consequently, we would likely be required to pay a higher interest rate in future financings and our potential pool of investors and funding sources could decrease.
We maintain revolving credit facilities at various entities to backstop commercial paper programs, for borrowings and for providing letters of credit. These facilities typically include financial covenants and failure to maintain these covenants at a particular entity could preclude that entity from accessing the credit facility, which could impact liquidity. Furthermore, if our short-term debt rating were to be downgraded, access to the commercial paper market could be significantly limited. Although this would not affect our ability to draw under our credit facilities, borrowing costs could be significantly higher.
If we are not able to access capital at competitive rates or at all, our ability to finance operations and implement our strategy may be affected. An inability to access capital on favorable terms or at all may limit our ability to pursue enhancements or acquisitions that we may otherwise rely on for future growth or to refinance our existing indebtedness. Any downgrade or other event negatively affecting the credit ratings of our subsidiaries could make their costs of borrowing higher or access to funding sources more limited, which in turn could increase our need to provide liquidity in the form of capital contributions or loans to such subsidiaries, thus reducing the liquidity and borrowing availability of the consolidated group.
Our Liquids Pipelines growth rate and results may be indirectly affected by commodity prices.
Wide commodity price basis between Western Canada and global tidewater markets have negatively impacted producer netbacks and margins in the past years that largely resulted from pipeline infrastructure takeaway capacity from producing regions in Western Canada and North Dakota which are operating at capacity. A protracted long-term outlook for low crude oil prices could result in delay or cancellation of future projects.
The tight conventional oil plays of Western Canada, the Permian Basin, and the Bakken region of North Dakota have short cycle break-even time horizons, typically less than 24 months, and high decline rates that can be well managed through active hedging programs and are positioned to react quickly to market signals. Accordingly, during periods of comparatively low prices, drilling programs, unsupported by hedging programs, will be reduced and as such, supply growth from tight oil basins may be lower, which may impact volumes on our pipeline systems.
Our Energy Services and Gas Transmission and Midstream results may be adversely affected by commodity price volatility.
Within our US Midstream assets, we hold investments in DCP and Aux Sable, which are engaged in the businesses of gathering, treating, processing and selling natural gas and natural gas liquids. The financial results of these businesses are directly impacted by changes in commodity prices. To a lesser degree, the financial results of our US Transmission business are subject to fluctuation in power prices which impact electric power costs associated with operating compressor stations.
56
Energy Services generates margin by capitalizing on quality, time and location differentials when opportunities arise. Changing market conditions that impact the prices at which we buy and sell commodities have in the past limited margin opportunities and impeded Energy Services' ability to cover capacity commitments and could do so again in the future. Other market conditions, such as backwardation, have likewise limited margin opportunities.
We are exposed to the credit risk of our customers, counterparties, and vendors.
We are exposed to the credit risk of multiple parties in the ordinary course of our business. Generally, our customers are rated investment-grade, are otherwise considered creditworthy or provide us security to satisfy credit concerns. However, we cannot predict to what extent our business would be impacted by deteriorating conditions in the economy, including possible declines in the creditworthiness of our customers, vendors, or counterparties. It is possible that payment or performance defaults from these entities, if significant, could adversely affect our earnings and cash flows.
Our business requires the retention and recruitment of a skilled and diverse workforce, and difficulties in recruiting and retaining our workforce could result in a failure to implement our business plans.
Our operations and management require the retention and recruitment of a skilled and diverse workforce, including engineers, technical personnel, other professionals and executive officers and senior management. We and our affiliates compete with other companies in the energy industry, and for some jobs the broader labor market, for this skilled workforce. If we are unable to retain current employees and/or recruit new employees of comparable knowledge and experience, our business could be negatively impacted. In addition, we could experience increased costs to retain and recruit these professionals.
RISKS RELATED TO GOVERNMENT REGULATION AND LEGAL RISKS
Many of our operations are regulated and failure to secure timely regulatory approval for our proposed projects, or loss of required approvals for our existing operations, could have a negative impact on our business, operations or financial results.
The nature and degree of regulation and legislation affecting permitting and environmental review for energy infrastructure companies in Canada and the US continues to evolve.
Within the US and in Canada, pipeline companies continue to face opposition from anti-energy/anti-pipeline activists, Indigenous and tribal groups and communities, citizens, environmental groups, and politicians concerned with the safety of pipelines and their potential environmental effects. In the US, the EPA redefined the Waters of the United States to align with the U.S. Supreme Court’s May 25, 2023 Sackett v. EPA decision that limits the scope of waters regulated by the Clean Water Act, issued new rules under Section 401 of the Clean Water Act broadening the scope of state review for water quality certifications, released rules on methane control and reporting, Cross-state Ozone Pollution (The Good Neighbor Plan), and the Power Plant Rule. The Council for Environmental Quality published immediately applicable guidance for conducting analyses under the National Environmental Policy Act (NEPA), followed by a new rule governing implementation of NEPA in federal actions that may significantly change environmental scope and cost assessments. The FERC has focused on the relationship between natural gas and electric power generation, particularly in connection with reliability issues during severe weather events. The PHMSA issued a draft rule on leak detection and repair. Federal agencies also issued guidance on how environmental justice concerns should be considered and addressed. Many other regulations adopted during the previous US presidential administration are being challenged in multiple courts and some have been overturned by reviewing courts. The current US administration may take further action to modify or reverse regulations that were promulgated by the previous US administration.
57
In March of 2023, the Supreme Court of Canada heard the Attorney General of Canada’s appeal of the Alberta Court of Appeal’s non-binding decision that the federal Impact Assessment Act (IAA) is unconstitutional. The IAA includes impact assessment requirements that could apply to either federally or provincially regulated pipeline projects that fall within prescribed criteria or that the federal Minister of Environment otherwise designates for review. The potential for any pipeline project to be subject to IAA requirements adds significant uncertainty as to regulatory timelines and outcomes. The Alberta Court of Appeal found that the IAA is an impermissible federal overreach into provincial jurisdiction that would amount to a de facto expropriation of provincial natural resources and proprietary interests by the federal government. The Supreme Court of Canada issued its decision on October 13, 2023, with a majority of the court (5-2) finding that the federal impact assessment regime is outside of the federal Parliament’s authority and that the IAA should focus more narrowly on effects within federal jurisdiction. The decision is a non-binding advisory reference case, so the IAA and associated regulations are not "struck down"; however, the federal government will take the Supreme Court of Canada’s guidance and in collaboration with provinces and Indigenous groups, will seek to amend the IAA so that it is constitutional. The resulting amendments could impact the risks and timing of potential future regulatory approvals and the scope of federal review of intraprovincial pipeline projects.
Our operations are subject to numerous environmental laws and regulations, including those relating to climate change, GHG emissions and climate-related disclosure, compliance with which may require significant capital expenditures, increase our cost of operations, and affect or limit our business plans, or expose us to environmental liabilities.
We are subject to numerous environmental laws and regulations affecting many aspects of our past, current, and future operations, including air emissions, water and soil quality, wastewater discharges, solid waste and hazardous waste.
If we are unable to obtain or maintain all required environmental regulatory approvals and permits for our operating assets and projects or if there is a delay in obtaining any required environmental regulatory approvals or permits, the operation of existing facilities or the development of new facilities could be prevented, delayed, or become subject to additional costs. Failure to comply with environmental laws and regulations may result in the imposition of civil or criminal fines, penalties and injunctive measures affecting our operating assets. We expect that changes in environmental laws and regulations, including those related to climate change, GHG emissions and climate-related disclosure, could result in a material increase in our cost of compliance with such laws and regulations, such as costs to monitor and report our emissions and install new emission controls to reduce emissions. We may not be able to include some or all of such increased costs in the rates charged for utilization of our pipelines or other facilities.
Our operations are subject to operational regulation and other requirements, including compliance with easements and other land tenure documents, and failure to comply with applicable regulations and other requirements could have a negative impact on our reputation, business, operations or financial results.
Operational risks relate to compliance with applicable operational rules and regulations mandated by governments, applicable regulatory authorities, or other requirements that may be found in easements, permits, or other agreements that provide a legal basis for our operations, breaches of which could result in fines, penalties, awards of damages, operating restrictions (including shutdown of lines) and an overall increase in operating and compliance costs.
We do not own all of the land on which our pipelines, facilities and other assets are located and we obtain the rights to construct and operate our pipelines and other assets from third parties or government entities. In addition, some of our pipelines, facilities and other assets cross Indigenous lands pursuant to rights-of-way or other land tenure interests. Our loss of these rights, including through our inability to renew them as they expire, could have an adverse effect on our reputation, operations and financial results. We have experienced litigation in relation to certain Line 5 and other easements; refer to Part II. Item 7. Management's Discussion and Analysis of Financial Condition and Results of Operations - Legal and Other Updates.
58
Regulatory scrutiny over our assets and operations has the potential to increase operating costs or limit future projects. Regulatory enforcement actions issued by regulators for non-compliant findings can increase operating costs and negatively impact reputation. Potential regulatory changes and legal challenges could have an impact on our future earnings from existing operations and the cost related to the construction of new projects. Regulators' future actions may differ from current expectations, or future legislative changes may impact the regulatory environments in which we operate. While we seek to mitigate operational regulation risk by actively monitoring and consulting on potential regulatory requirement changes with the respective regulators directly, or through industry associations, and by developing response plans to regulatory changes or enforcement actions, such mitigation efforts may be ineffective or insufficient. While we believe the safe and reliable operation of our assets and adherence to existing regulations is the best approach to managing operational regulatory risk, the potential remains for regulators or other government officials to make unilateral decisions that could disrupt our operations or have an adverse financial impact on us.
Our operations are subject to economic regulation and failure to secure regulatory approval for our proposed or existing commercial arrangements could have a negative impact on our business, operations or financial results.
Our Liquids Pipelines, Gas Transmission and Gas Distribution assets face economic regulation risk. Broadly defined, economic regulation risk is the risk that governments or regulatory agencies change or reject proposed or existing commercial arrangements or policies, including permits and regulatory approvals for both new and existing projects or agreements, upon which future and current operations are dependent. Our Mainline System, other liquids pipelines, gas transmission and distribution assets are subject to the actions of various regulators, including the CER, the FERC, and the OEB with respect to the rates, tariffs, and tolls for these assets. The changing or rejecting of commercial arrangements, including decisions by regulators on the applicable permits and tariff structure or changes in interpretations of existing regulations by courts or regulators such as with respect to the negotiated settlements applicable to our Mainline System, could have an adverse effect on our revenues and earnings.
Our Renewable Power Generation assets in Canada and the US are subject to directives, regulations, and policies of federal, provincial and state governments. These measures are variable and can change as a result of, among other things, tax rate changes and a change in the government, which can have a negative impact on our commercial arrangements.
Our Renewable Power Generation assets in Europe (France, Germany and the UK) are also subject to the directives, regulations and policies established and enforced by the EU and the UK government. These measures are variable and can include price controls, caps and demand reduction goals, all of which can have a negative impact on our revenues and earnings.
59
We are subject to changes in our tax rates, the adoption of new US, Canadian or international tax legislation or exposure to additional tax liabilities.
We are subject to taxes in the US, Canada and numerous foreign jurisdictions. Due to economic and political conditions, tax rates in various jurisdictions may be subject to significant change. Our effective tax rates could be affected by changes in the mix of earnings in countries with differing statutory tax rates, changes in the valuation of deferred tax assets and liabilities, or changes in tax laws or their interpretation. In particular, Canada and other OECD countries have introduced a minimum tax rate to be applied on a global basis.The final legislation and list of the participating countries remains uncertain.In addition, the US enacted the Inflation Reduction Act in 2022 however key regulations still remain outstanding that could impact the interpretation of that act. All of these measures could cause our effective tax rate to increase.
We are also subject to the examination of our tax returns and other tax matters by the US Internal Revenue Service, the Canada Revenue Agency and other tax authorities and governmental bodies. We regularly assess the likelihood of an adverse outcome resulting from these examinations to determine the adequacy of our provision for taxes. There can be no assurance as to the outcome of these examinations. If our effective tax rates were to increase, particularly in the US or Canada, or if the ultimate determination of our taxes owed is for an amount in excess of amounts previously accrued, our financial condition and operating results could be materially adversely affected.
We are involved in numerous legal proceedings, the outcomes of which are uncertain, and resolutions adverse to us could adversely affect our financial results.
We are subject to numerous legal proceedings. In recent years, there has been an increase in climate and disclosure-related litigation against governments as well as companies involved in the energy industry. There is no assurance that we will not be impacted by such litigation, or by other legal proceedings. Litigation is subject to many uncertainties, and we cannot predict the outcome of individual matters with assurance. It is reasonably possible that the final resolution of some of the matters in which we are involved or new matters could require additional expenditures, in excess of established reserves, over an extended period of time and in a range of amounts that could adversely affect our financial results or affect our reputation. Refer to Part II. Item 7. Management's Discussion and Analysis of Financial Condition and Results of Operations - Legal and Other Updates for a discussion of certain legal proceedings with recent developments.
ITEM 1B. UNRESOLVED STAFF COMMENTS
None.
ITEM 1C. CYBERSECURITY
Cybersecurity risk management, strategy and governance
Risk oversight and management is a key role for the Board and its committees. The Board is responsible for identifying and understanding Enbridge’s principal risks and ensuring that appropriate systems are implemented to monitor, manage and mitigate those risks. The committees of the Board have oversight over risks within their respective mandates.
Oversight of cybersecurity is integrated into the responsibilities of the Board. The Audit, Finance and Risk Committee (the AFRC) provides oversight of cybersecurity matters, particularly as they relate to financial risk and controls, integrity of financial data and public disclosures, and security of the cyber landscape across data and digital. The Safety and Reliability Committee (SRC) has oversight responsibility for security (physical, data and cyber) including as it relates to operational risk and controls, safety, operations integrity and reliability, and asset operations.
60
Management provides regular reports to the Board at every meeting to review our top risks, identify trends and help manage risk. This includes quarterly reports to the AFRC and SRC on cybersecurity matters. In addition, on an annual basis management prepares and provides to the Board and its committees a corporate risk assessment (CRA), which analyzes and prioritizes enterprise-wide risks (including cybersecurity), highlighting top risks and trends. The annual CRA is an integrated enterprise-wide process. We assess and rank risks based on impact and probability, and we strive to ensure that mitigation measures are appropriately designed, prioritized and resourced. The CRA report is reviewed by the Board committees with responsibility for the risk category relevant to their mandate and is provided to the Board, which coordinates Enbridge's overall risk management approach. Complementary to the CRA, management prepares and provides to the SRC an annual top operational risk report that highlights the highest consequence operational risks across Enbridge and includes further detail on the risks and their treatment. This information helps inform the Board about the potential impact of top operational risks and that appropriate treatments are in place to manage those risks.
Cybersecurity has been identified as a top risk as attacks against participants in our industry have continued to increase in sophistication and frequency over the years. Cybersecurity risk is described in Item 1A. Risk Factors.
Enbridge’s management is responsible for the implementation of risk management strategies and monitoring performance. The technology and information services (TIS) function is centralized under the Senior Vice President & Chief Information Officer (CIO), who has over two decades of international leadership in the business of technology. We also engage independent third parties to assess our cybersecurity program, track their recommendations and use those to further improve the program. Reporting to the CIO is the Chief Information Security Officer who is in charge of our cybersecurity program and oversees the 24x7x365 Security Operations Center (SOC).
We conduct continuous assessments of our cybersecurity standards, perform regular tests of our ability to respond and recover, and monitor for potential threats. To further mitigate threats, we collaborate with governments and regulatory agencies, and take part in external events to learn and share. Our workforce participates in regular security awareness training, including exercises to build capabilities to identify and report suspect phishing emails to our SOC. In the last year, we continued to expand the cybersecurity training and simulated testing we administer to high-risk groups within the organization. A tailored cybersecurity training course has been implemented for team members in operational technology roles, and we have increased the frequency of phishing simulation tests.
We have a cybersecurity third party risk management program, which is an evolving, cross-functional program to help assess and mitigate risks from third party vendors and other service providers. Our cybersecurity team also uses several layers of defense and protection technologies, cybersecurity experts, and automated alerting and response mechanisms to reduce risk to Enbridge.
Although cybersecurity risks have not materially affected us, including our business strategy, results of operations or financial condition, to date, we have experienced an increasing number of cybersecurity threats in recent years. For more information about the cybersecurity risks we face, see the risk factor entitled "Cyber attacks and other cybersecurity incidents pose threats to our technology systems and could materially adversely affect our business, operations, reputation or financial results." in Item 1A. Risk Factors.
61
ITEM 2. PROPERTIES
Descriptions of our properties and maps depicting the locations of our liquids and natural gas systems are included in Part I. Item 1. Business.
In general, our systems are located on land owned by others and are operated under easements and rights-of-way, licenses, leases or permits that have been granted by private land-owners, Indigenous communities, public authorities, railways or public utilities. Our liquids pipeline systems have pumping stations, tanks, terminals and certain other facilities that are located on land that is owned by us and/or used by us under easements, licenses, leases or permits. Additionally, our natural gas pipeline systems have natural gas compressor stations, of which the vast majority are located on land that is owned by us. The remainder of these compressor stations and other assets, like meter and valve stations, and underground gas storage fields, are used by us under easements, leases or permits.
Titles to Enbridge owned properties or affiliate entities may be subject to encumbrances in some cases. We believe that none of these burdens should materially detract from the value of these properties or materially interfere with their use in the operation of our business.
ITEM 3. LEGAL PROCEEDINGS
We are involved in various legal and regulatory actions and proceedings which arise in the ordinary course of business. While the final outcome of such actions and proceedings cannot be predicted with certainty, management believes that the resolution of such actions and proceedings will not have a material impact on our consolidated financial position or results of operations. Refer to Part II. Item 7. Management's Discussion and Analysis of Financial Condition and Results of Operations - Legal and Other Updates for discussion of certain legal proceedings with recent developments.
SEC regulations require the disclosure of any proceeding under environmental laws to which a governmental authority is a party unless the registrant reasonably believes it will not result in monetary sanctions over a certain threshold. Given the size of our operations, we have elected to use a threshold of US$1 million for the purposes of determining proceedings requiring disclosure.
On October 17, 2022, four separate comprehensive enforcement resolutions were announced with the Minnesota Pollution Control Agency, Minnesota Department of Natural Resources (DNR), Fond du Lac Band of Lake Superior Chippewa, and Minnesota Attorney General’s Office related to alleged violations that occurred during construction of Line 3 Replacement (L3R). The Minnesota Attorney General filed a misdemeanor criminal charge for the taking of water without a permit at the Clearbrook aquifer, with this charge against us to be dismissed following one year of compliance with the state water appropriation rules. As part of its ongoing post-construction monitoring activities for L3R, Enbridge reported groundwater flow near Moose Lake in Aitkin County to the DNR. Enbridge has completed the agency approved corrective action at the site.
ITEM 4. MINE SAFETY DISCLOSURES
Not applicable.
62
PART II
ITEM 5. MARKET FOR REGISTRANT'S COMMON EQUITY, RELATED STOCKHOLDER MATTERS AND ISSUER PURCHASES OF EQUITY SECURITIES
Common Stock
Enbridge common stock is traded on the TSX and NYSE under the symbol ENB. As at February 2, 2024, there were 73,123 registered shareholders of record of Enbridge common stock. A substantially greater number of holders of Enbridge common stock are beneficial holders, whose shares are held by banks, brokers and other financial institutions.
Securities Authorized for Issuance Under Equity Compensation Plans
The information required by this Item will be contained in our Form 10-K/A, which will be filed no later than 120 days after December 31, 2023.
Recent Sales of Unregistered Equity Securities
None.
Issuer Purchases of Equity Securities
| Period | Total number of shares purchased | Average price paid per share | Total number of shares purchased as part of publicly announced plans or programs | Maximum number of shares that may yet be purchased under the plans or programs1 | ||||||||||
October 2023 (October 1 - October 31) | — | N/A | — | 25,433,807 | ||||||||||
November 2023 (November 1 - November 30) | — | N/A | — | 25,433,807 | ||||||||||
December 2023 (December 1 - December 31) | — | N/A | — | 25,433,807 | ||||||||||
1On January 4, 2023, the TSX approved our normal course issuer bid (NCIB), which commenced on January 6, 2023 and expired on January 5, 2024. Our NCIB permitted us to purchase, for cancellation, up to 27,938,163 of the outstanding common shares of Enbridge to an aggregate amount of up to $1.5 billion through the facilities of the TSX, the NYSE and other designated exchanges and alternative trading systems.
63
Total Shareholder Return
The following graph reflects the comparative changes in the value from January 1, 2019 through December 31, 2023 of $100 invested in (1) Enbridge Inc.’s common shares traded on the TSX, (2) the S&P/TSX Composite index, (3) the S&P 500 index, (4) our US peer group (comprising, by stock symbols, CNP, D, DTE, DUK, EPD, ET, KMI, MMP, NEE, NI, OKE, PAA, PCG, SO, SRE and WMB) and (5) our Canadian peer group (comprising, by stock symbols, CU, FTS, PPL and TRP). The amounts included in the table were calculated assuming the reinvestment of dividends.
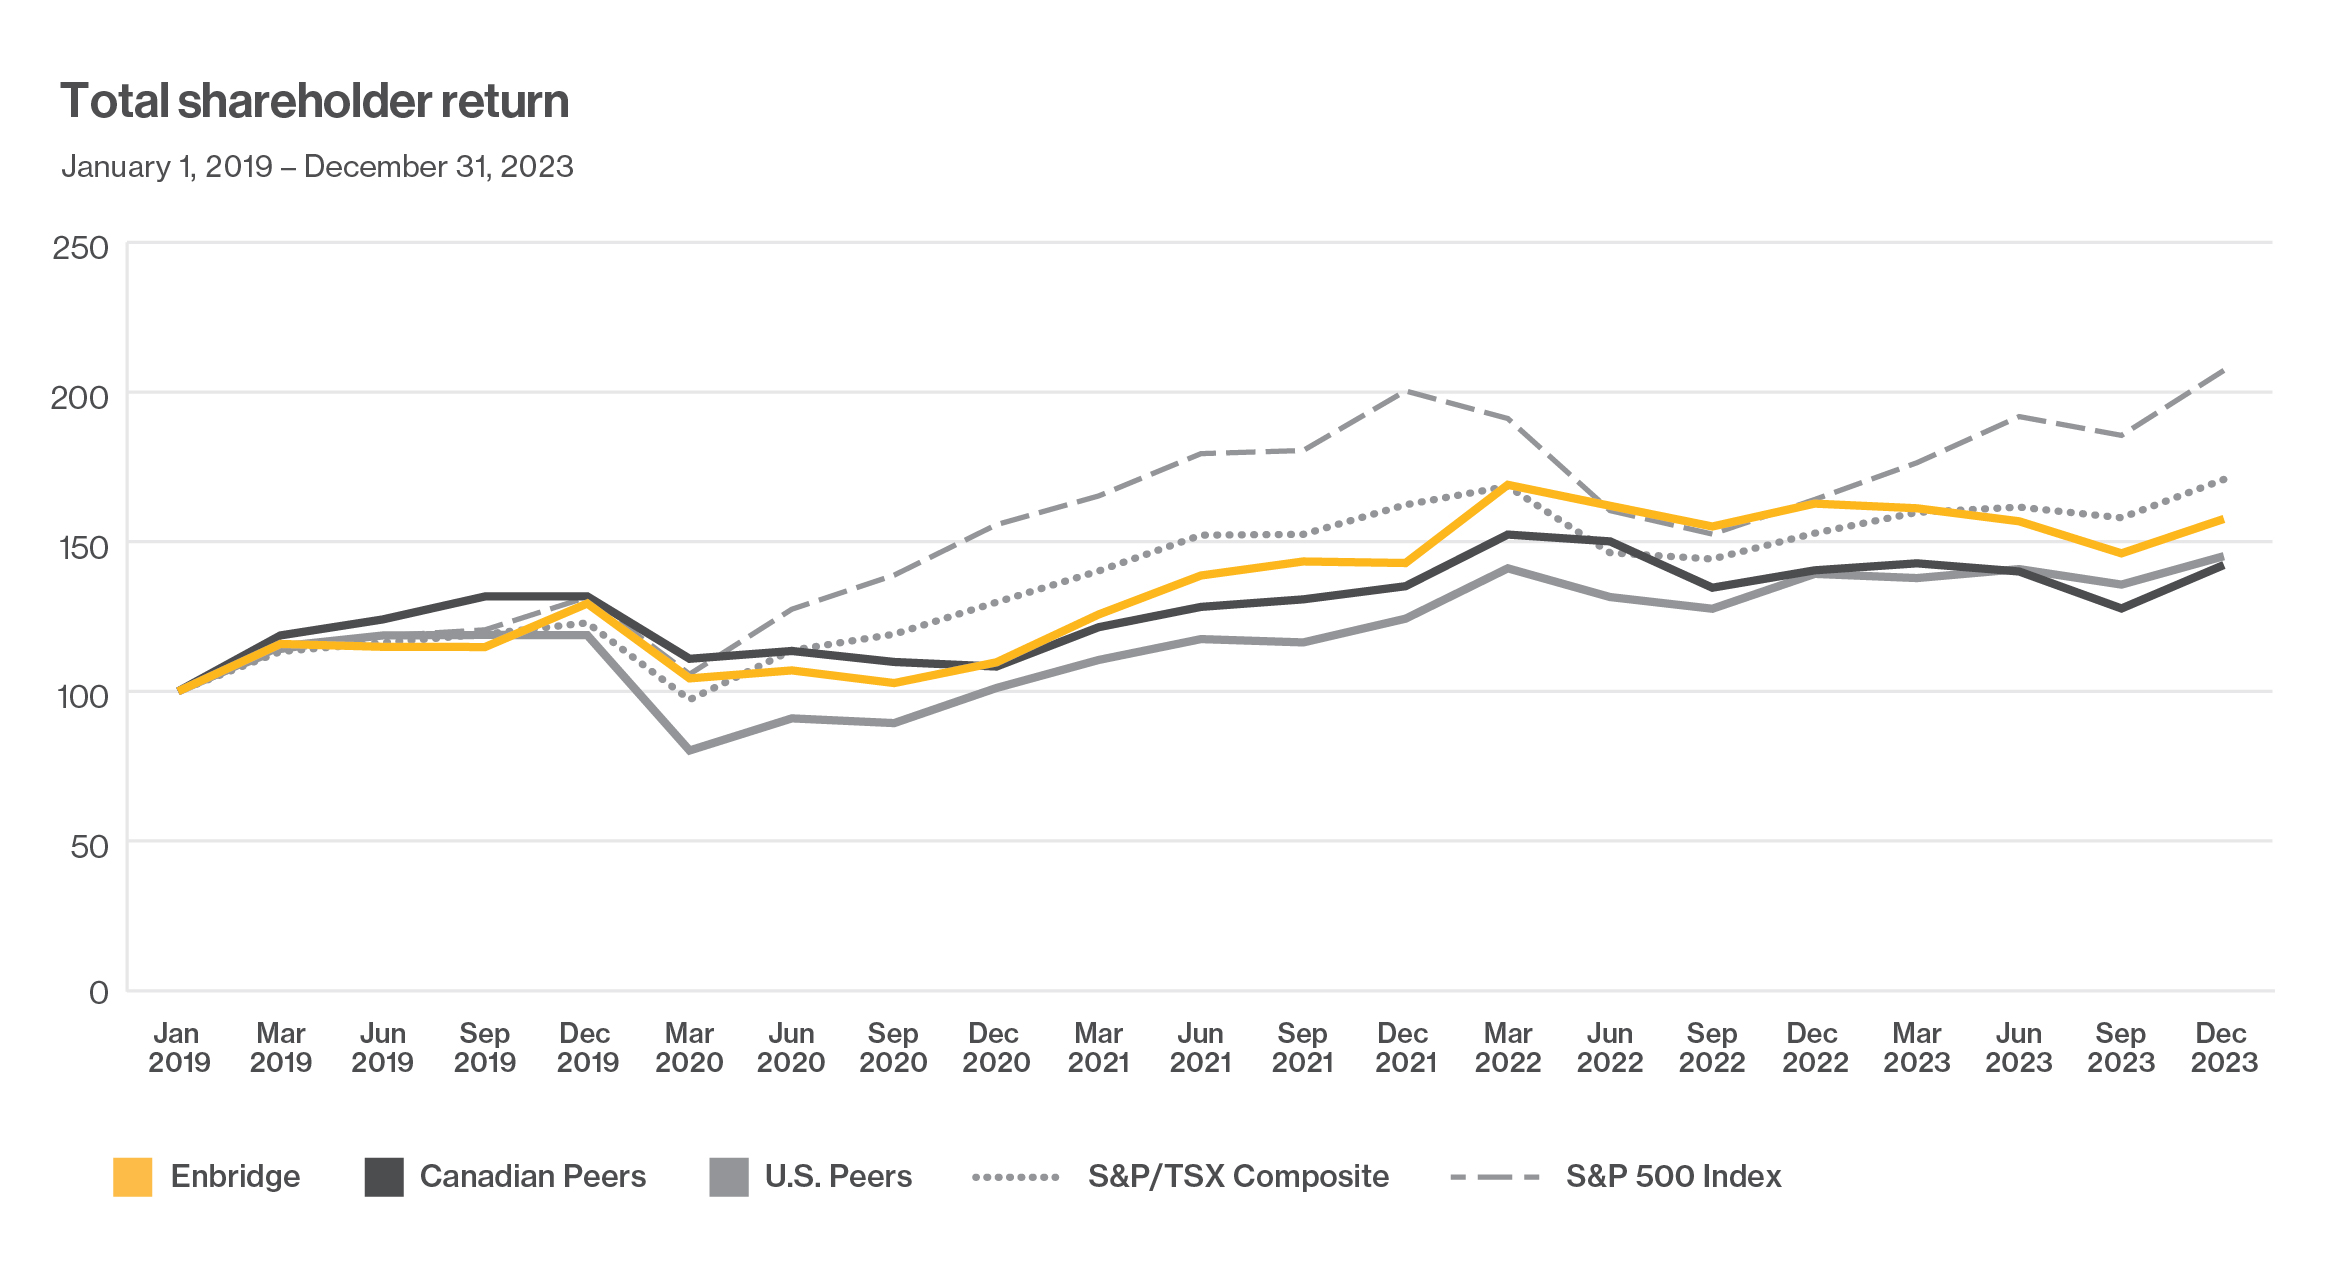
| January 1, 2019 | December 31, | |||||||||||||||||||
| 2019 | 2020 | 2021 | 2022 | 2023 | ||||||||||||||||
| Enbridge Inc. | 100.00 | 129.34 | 109.69 | 142.87 | 162.72 | 157.79 | ||||||||||||||
| S&P/TSX Composite | 100.00 | 122.88 | 129.76 | 162.32 | 152.83 | 170.79 | ||||||||||||||
| S&P 500 Index | 100.00 | 131.49 | 155.68 | 200.37 | 164.08 | 207.21 | ||||||||||||||
US Peers1 | 100.00 | 118.76 | 101.11 | 124.27 | 139.24 | 145.15 | ||||||||||||||
| Canadian Peers | 100.00 | 131.71 | 108.28 | 135.12 | 140.43 | 142.20 | ||||||||||||||
1For the purpose of the graph, it was assumed that CAD:US dollar conversion ratio remained at 1:1 for the years presented.
ITEM 6. [Reserved]
64
ITEM 7. MANAGEMENT'S DISCUSSION AND ANALYSIS OF FINANCIAL CONDITION AND RESULTS OF OPERATIONS
INTRODUCTION
The following discussion and analysis of our financial condition and results of operations is based on and should be read in conjunction with "Forward-Looking Information" and "Non-GAAP and Other Financial Measures", Part I. Item 1A. Risk Factors and our consolidated financial statements and the accompanying notes included in Part II. Item 8. Financial Statements and Supplementary Data of this Annual Report on Form 10-K.
This section of our Annual Report on Form 10-K discusses 2023 and 2022 items and year-over-year comparisons between 2023 and 2022. For discussion of 2021 items and year-over-year comparisons between 2022 and 2021, refer to Part II. Item 7. Management's Discussion and Analysis of Financial Condition and Results of Operations of our Annual Report on Form 10-K for the year ended December 31, 2022.
RECENT DEVELOPMENTS
MAINLINE TOLLING AGREEMENT
Enbridge Inc. (Enbridge) has reached an agreement on a negotiated settlement with shippers for tolls on its Mainline System. The Mainline Tolling Settlement (MTS) covers both the Canadian and US portions of the Mainline and would see the Mainline continuing to operate as a common carrier system available to all shippers on a monthly nomination basis. The MTS is subject to regulatory approval and the term is seven and a half years through the end of 2028, with revised interim tolls effective on July 1, 2023.
The MTS includes:
•an International Joint Toll (IJT), for heavy crude oil movements from Hardisty to Chicago, comprised of a Canadian Mainline Toll of $1.65 per barrel plus a Lakehead System Toll of US$2.57 per barrel, plus the applicable Line 3 Replacement (L3R) surcharge;
•toll escalation for operation, administration, and power costs tied to US consumer price and power indices;
•tolls that continue to be distance and commodity adjusted, and utilize a dual currency IJT; and
•a financial performance collar providing incentives for Enbridge to optimize throughput and cost, but also providing downside protection in the event of extreme supply or demand disruptions or unforeseen operating cost exposure. This performance collar is intended to ensure the Mainline earns 11% to 14.5% returns, on a deemed 50% equity capitalization, which is similar to the returns earned on average during the previous tolling agreement.
Approximately 70% of Mainline deliveries are tolled under this settlement, while approximately 30% of deliveries are tolled on a full path basis to markets downstream of the Mainline. The other continuing feature is that the Mainline toll flexes up or down US$0.035 per barrel for 50,000 barrel per day changes in throughput.
The expected financial outcome from this settlement is in line with previously reported financial results after taking into consideration the previously recognized provision, inflationary cost adjustments and increased volumes. Enbridge filed an application with the Canada Energy Regulator (CER) for approval of the MTS on December 15, 2023, with unanimous support from its Representative Stakeholder Group. The CER indicated in its process letter that no dissenting comments were received by January 19, 2024 and that it may decide on the application or it may establish further process steps.
65
On May 24, 2023, Enbridge filed an Offer of Settlement with the Federal Energy Regulatory Commission (FERC) for the Lakehead System (the Lakehead System Settlement). In addition to resolving litigation related to the Index portion of the Lakehead System rate, the Lakehead System Settlement also includes a depreciation truncation date of December 31, 2048 for the rate base applicable to the Index and Facilities Surcharge and agreement on the terms for future recovery through the Facilities Surcharge of costs related to two Line 5 projects: the Wisconsin Relocation Project and the Straits of Mackinac Tunnel. The Lakehead System Settlement was certified by the Settlement Judge on June 23, 2023 and was approved by the FERC Commissioners on November 27, 2023. Lakehead System tolls were revised effective December 1, 2023 to reflect the terms of the Lakehead System Settlement.
ACQUISITIONS
Acquisition of Renewable Natural Gas (RNG) Facilities
On January 2, 2024, through a wholly-owned US subsidiary, we acquired the first six Morrow Renewables operating landfill gas-to-RNG production facilities located in Texas and Arkansas for total consideration of $1.4 billion (US$1.1 billion), of which $0.5 billion (US$0.4 billion) was paid at close and $0.9 billion (US$0.7 billion) is payable within two years. The total consideration for all seven facilities is $1.6 billion (US$1.2 billion). Combined RNG production of the facilities is approximately 4.5 bcf per year. The acquired assets align with and advance our low-carbon strategy.
Fox Squirrel Solar
On November 15, 2023, we acquired a 50% interest in a newly formed partnership with EDF Renewables North America to participate in the initial phase of a solar power facility in Ohio. Cash consideration includes an upfront payment of $157 million (US$115 million) and subsequent capital commitments up to $398 million (US$291 million). Investments past the first phase are contingent on certain conditions being met. An additional payment of $164 million (US$123 million) was made at Phase 1 in-service in December 2023.
Hohe See and Albatros Offshore Wind Facilities
On November 3, 2023, we acquired an additional 24.45% interest in the Hohe See Offshore Wind Facilities and Albatros Offshore Wind Facilities (the Offshore Wind Facilities), through the acquisition of a 49% interest in Enbridge Renewable Infrastructure Investments S.à r.l (ERII), for $391 million (€267 million) of cash and assumed debt of $524 million (€358 million), bringing our interest in the Offshore Wind Facilities to 49.9%. The Hohe See Offshore Wind Facilities and Albatros Offshore Wind Facilities are located approximately 100 kilometers off the northern coast of Germany and came into service in 2019 and 2020, respectively.
Aitken Creek Gas Storage
On November 1, 2023, through a wholly-owned Canadian subsidiary, we acquired a 93.8% interest in Aitken Creek Gas Storage Facility and a 100% interest in Aitken Creek North Gas Storage Facility (collectively, Aitken Creek), located in BC, Canada, for $400 million, subject to other customary closing adjustments (the Aitken Creek Acquisition). Aitken Creek is the only underground natural gas storage facility in BC and connects to all major natural gas pipelines in western Canada. The Aitken Creek Acquisition enables us to continue to meet regional energy needs and to support increasing demand for liquefied natural gas (LNG) exports.
66
US Gas Utilities
On September 5, 2023, we announced that Enbridge had entered into three separate definitive agreements with Dominion Energy, Inc. to acquire The East Ohio Gas Company, Questar Gas Company and its related Wexpro companies, and Public Service Company of North Carolina for an aggregate purchase price of $19.1 billion (US$14.0 billion), comprised of $12.8 billion (US$9.4 billion) of cash consideration and $6.3 billion (US$4.6 billion) of assumed debt, subject to customary closing adjustments (together, the Acquisitions). If completed, the Acquisitions will create North America's largest natural gas utility platform delivering over 9 billion cubic feet (bcf) per day to approximately 7 million customers across multiple regulatory jurisdictions. The Acquisitions are expected to close in 2024, subject to the satisfaction of customary closing conditions including the receipt of certain regulatory approvals, which are not cross-conditional.
On September 8, 2023, we closed a public offering of 102,913,500 common shares at a price of $44.70 per share for gross proceeds of $4.6 billion which is intended to finance a portion of the aggregate cash consideration payable for the Acquisitions. Refer to Financing Update for further details on the debt issuances and credit facility obtained to support the Acquisitions.
Tres Palacios Holdings LLC
On April 3, 2023, we acquired Tres Palacios Holdings LLC (Tres Palacios) for $451 million (US$335 million) of cash. Tres Palacios is a natural gas storage facility located in the US Gulf Coast and its infrastructure serves Texas gas-fired power generation and LNG exports, as well as Mexico pipeline exports. Tres Palacios is comprised of three natural gas storage salt caverns with a total FERC-certificated working gas capacity of approximately 35 billion bcf and also owns an integrated 62-mile natural gas header pipeline system, with eleven inter- and intrastate natural gas pipeline connections.
ASSET MONETIZATION
Disposition of Alliance Pipeline and Aux Sable
On December 13, 2023, we announced that Enbridge has entered into a definitive agreement to sell our 50.0% interest in the Alliance Pipeline and our interest in Aux Sable (including 42.7% interest in Aux Sable Midstream LLC and Aux Sable Liquid Products L.P., and 50% interest in Aux Sable Canada LP) to Pembina Pipeline Corporation for $3.1 billion, including approximately $0.3 billion of non-recourse debt, subject to customary closing adjustments. Closing is expected to occur in the first half of 2024, subject to the receipt of regulatory approvals and satisfaction of customary closing conditions. The sales proceeds will fund a portion of the Acquisitions and be used for debt reduction.
GAS TRANSMISSION AND MIDSTREAM PROCEEDINGS
Texas Eastern Transmission
The Stipulation and Agreement for Texas Eastern Transmission, LP’s (Texas Eastern) consolidated 2021 rate cases was approved by the FERC on November 30, 2022, and became effective on January 1, 2023. Texas Eastern received FERC approval on April 3, 2023 to implement the settled rates and other settlement provisions.
Maritimes & Northeast Pipeline
The toll settlement agreement for the Canadian portion of the Maritimes & Northeast (M&N) Pipeline (M&N Canada) expired in December 2023. M&N Canada reached a toll settlement with shippers for the effective period from January 1, 2024 to December 31, 2025. On November 28, 2023, M&N Canada filed the 2024 - 2025 toll settlement agreement with the CER for review and approval. A CER decision is expected in the first quarter of 2024.
67
GAS DISTRIBUTION AND STORAGE RATE APPLICATIONS
Incentive Regulation Rate Application
In October 2022, Enbridge Gas Inc. (Enbridge Gas) filed its application with the Ontario Energy Board (OEB) to establish a 2024 through 2028 Incentive Regulation (IR) rate setting framework. The application initially sought approval in two phases to establish 2024 base rates (Phase 1) on a cost-of-service basis and to establish a price cap rate setting mechanism (Phase 2) to be used for the remainder of the IR term. A third phase (Phase 3) has been established with the OEB as part of the Phase 1 Partial Settlement Proposal (Settlement Proposal).
On August 17, 2023, the OEB approved the Settlement Proposal to support the determination of just and reasonable rates effective January 1, 2024. Items resolved in whole or in part include:
•additions to rate base up to and including 2022;
•interest rates on debt and return on equity;
•deferral and variance accounts;
•Indigenous engagement; and
•rate implementation approach for 2024.
On December 21, 2023, the OEB issued its Decision and Order on Phase 1 (Phase 1 Decision). The decision addressed three main areas: energy transition, Enbridge Gas Distribution Inc. and Union Gas Limited amalgamation and harmonization issues, and other issues. The Phase 1 Decision included the following key findings or orders:
•energy transition risk requires Enbridge Gas to carry out a risk assessment to consider further risk mitigation measures in three areas: system access and expansion capital spending, system renewal capital spending and depreciation policy;
•our 2024 capital plan must be reduced by $250 million with a focus on monitoring, repair and life extension of our assets and a further $50 million of capitalized indirect overhead costs must be expensed, escalating to $250 million per year during the IR term with an offsetting adjustment to revenues in each year;
•all new small volume customers wishing to connect to natural gas pay their full connection costs as an upfront charge rather than through rates over time effective January 1, 2025;
•approval of a harmonized depreciation methodology that reduced the level of depreciation sought and adjusted asset lives including extensions of service life for certain asset classes;
•an increase in equity thickness from 36% to 38% effective for 2024; and
•January 1, 2024 will be the effective date for 2024 rates.
The issues addressed in the Settlement Proposal and the Phase 1 Decision resulted in the following items not approved for future recovery, and the subsequent impairments recognized for the year ended December 31, 2023:
•a portion of undepreciated capital projects removed from 2024 rate base of $41 million;
•undepreciated integration capital costs removed from 2024 rate base of $84 million; and
•pre-2017 Union Gas Limited related pension balances of $156 million.
Enbridge Gas filed a Notice of Appeal in the Ontario Divisional Court on January 22, 2024 regarding four aspects of the Phase 1 Decision: small volume customer revenue horizon, the 2024 capital plan reduction, the extension of service life for certain asset classes and equity thickness. On January 29, 2024 Enbridge Gas also filed a Notice of Motion with the OEB requesting the OEB to review and vary five aspects of the Phase 1 Decision: small volume customer revenue horizon, the 2024 capital plan reduction, integration capital, depreciation and equity thickness. The outcome of these proceedings is uncertain.
68
The Phase 1 Decision results in interim rates, pending phases 2 and 3 of the proceeding, resolution of the Notice of Appeal, Notice of Motion and any possible legislative steps that could be undertaken by the Government of Ontario further to the Ontario Minister of Energy's December 22, 2023 news release. Phase 2 will establish and determine the incentive rate mechanism for the remainder of the rebasing term, and gas cost and unregulated storage cost allocation. Phase 3 will address cost allocation and the harmonization of rates and rate classes between legacy rate zones.
Purchase Gas Variance
The Purchase Gas Variance Account (PGVA) captures the difference between actual and forecasted natural gas prices reflected in rates. Account balances are typically recovered or refunded over a prospective 12-month period through Quarterly Rate Adjustment Mechanism (QRAM) applications.
In March 2023, the April 1, 2023 QRAM application was filed and approved by the OEB, which included an adjustment to the prior rate mitigation approved as part of the July 1, 2022 QRAM. The recovery of the outstanding PGVA balance from the extended recovery period approved as part of the July 1, 2022 QRAM will now be completed by March 31, 2024. In June, September and December 2023, the July 1, 2023, October 1, 2023, and January 1, 2024 QRAM applications, respectively, were filed and approved by the OEB with no adjustments to the prior period rate mitigation plans and did not include any additional rate mitigation measures.
As at December 31, 2023, Enbridge Gas' PGVA liability balance was $16 million.
FINANCING UPDATE
We completed long-term debt issuances totaling US$8.5 billion and $3.9 billion during the year ended December 31, 2023, including aggregate amounts of US$2.3 billion of 10-year sustainability-linked senior notes in March 2023 and $400 million of 10-year sustainability-linked medium-term notes in May 2023.
We increased our credit facilities in March 2023 by approximately $500 million. During our annual renewal process, we renewed and extended approximately $15.4 billion of our credit facilities with maturities ranging from 2024-2028.
In September 2023, we obtained commitments for a US$9.4 billion senior unsecured bridge term loan credit facility to support the Acquisitions. The commitment for this facility was subsequently reduced to nil as at December 31, 2023 as a result of the September 2023 $4.6 billion equity offering, the September 2023 subordinated long-term debt issuances, and the November 2023 senior notes long-term debt issuances.
In September 2023, we closed a public offering of 102,913,500 common shares at a price of $44.70 per share for gross proceeds of $4.6 billion which is intended to finance a portion of the aggregate cash consideration payable for the Acquisitions.
Our 2023 financing activities have provided significant liquidity that we expect will enable us to fund our current portfolio of capital projects and acquisitions without requiring access to the capital markets for the next 12 months should market access be restricted or pricing be unattractive. Refer to Liquidity and Capital Resources.
As at December 31, 2023, after adjusting for the impact of floating-to-fixed interest rate swap hedges, less than 5% of our total debt is exposed to floating rates. Refer to Part II. Item 8. Financial Statements and Supplementary Data - Note 23 - Risk Management and Financial Instruments for more information on our interest rate hedging program.
69
NORMAL COURSE ISSUER BID
On January 4, 2023, the Toronto Stock Exchange (TSX) approved our normal course issuer bid (NCIB), which commenced on January 6, 2023 and expired on January 5, 2024. Our NCIB permitted us to purchase, for cancellation up to 27,938,163 of the outstanding common shares of Enbridge to an aggregate amount of up to $1.5 billion through the facilities of the TSX, the New York Stock Exchange and other designated exchanges and alternative trading systems.
RESULTS OF OPERATIONS
| Year ended December 31, | 2023 | 2022 | 2021 | ||||||||
| (millions of Canadian dollars, except per share amounts) | |||||||||||
Segment earnings/(loss) before interest, income taxes and depreciation and amortization1 | |||||||||||
| Liquids Pipelines | 9,499 | 8,364 | 7,897 | ||||||||
| Gas Transmission and Midstream | 4,264 | 3,126 | 3,671 | ||||||||
| Gas Distribution and Storage | 1,592 | 1,827 | 2,117 | ||||||||
| Renewable Power Generation | 149 | 262 | 508 | ||||||||
| Energy Services | (37) | (417) | (313) | ||||||||
| Eliminations and Other | 837 | (1,124) | 356 | ||||||||
Earnings before interest, income taxes and depreciation and amortization1 | 16,304 | 12,038 | 14,236 | ||||||||
| Depreciation and amortization | (4,613) | (4,317) | (3,852) | ||||||||
| Interest expense | (3,812) | (3,179) | (2,655) | ||||||||
| Income tax expense | (1,821) | (1,604) | (1,415) | ||||||||
| (Earnings)/loss attributable to noncontrolling interests and redeemable noncontrolling interests | 133 | 65 | (125) | ||||||||
| Preference share dividends | (352) | (414) | (373) | ||||||||
| Earnings attributable to common shareholders | 5,839 | 2,589 | 5,816 | ||||||||
| Earnings per common share attributable to common shareholders | 2.84 | 1.28 | 2.87 | ||||||||
| Diluted earnings per common share attributable to common shareholders | 2.84 | 1.28 | 2.87 | ||||||||
1 Non-GAAP financial measures.
EARNINGS ATTRIBUTABLE TO COMMON SHAREHOLDERS
Year ended December 31, 2023 compared with year ended December 31, 2022
Earnings attributable to common shareholders increased by $3.2 billion due to certain infrequent or other non-operating factors, primarily explained by the following:
•the absence in 2023 of a goodwill impairment of $2.5 billion relating to our Gas Transmission reporting unit;
•a non-cash, net unrealized derivative fair value gain of $1,127 million ($856 million after-tax) in 2023, compared with a net unrealized loss of $1,246 million ($950 million after-tax) in 2022, reflecting changes in the mark-to-market value of derivative financial instruments used to manage foreign exchange, interest rate, and commodity risks;
•the absence in 2023 of: an asset impairment loss of $227 million ($173 million after-tax) to our Magic Valley Wind Farm (Magic Valley); an asset impairment loss of $183 million ($137 million after-tax) on the US and Canadian components of the interstate pipeline within the North Dakota System of our Bakken System, an impairment of $44 million ($34 million after-tax) for lease assets due to office relocation plans, and an asset impairment loss of $40 million ($30 million after-tax) relating to MacKay River line within our Alberta Regional Oil Sands System;
70
•a gain of $151 million ($129 million after-tax) and a deferred tax adjustment of $69 million were recognized as a result of Southern Lights Pipeline's (Southern Lights) discontinuation of regulatory accounting;
•the absence in 2023 of a transaction cost of $114 million in relation to our investment purchase in the Woodfibre LNG project;
•a deferred income tax recovery of $104 million related to a tax adjustment on asset impairments;
•a non-cash, net unrealized gain of $73 million ($55 million after-tax) in 2023, compared with a net unrealized loss of $27 million ($21 million after-tax) in 2022, reflecting the revaluation of derivatives used to manage the profitability of transportation and storage transactions, as well as to manage the exposure to movements in commodity prices;
•the receipt of a litigation claim settlement of $68 million ($52 million after-tax) in 2023; and
•a non-cash, net unrealized gain of $35 million ($33 million after-tax) in 2023, compared with a net unrealized loss of $25 million ($22 million after-tax) in 2022, reflecting changes in the mark-to-market value of equity fund investments held by our wholly-owned captive insurance subsidiaries.
The factors above were partially offset by:
•the absence in 2023 of a gain of $1,076 million ($732 million after-tax) on the closing of the joint venture merger transaction with Phillips 66 (P66) realigning our indirect economic interests in Gray Oak Pipeline LLC (Gray Oak) and DCP Midstream, LP (DCP);
•a realized loss of $638 million ($479 million after-tax) due to termination of foreign exchange hedges, as foreign exchange risks inherent within the Competitive Toll Settlement (CTS) framework are not present in the negotiated Mainline tolling agreement;
•an impairment loss of $261 million ($20 million after-tax and net of noncontrolling interest) to our Chapman Ranch wind facilities;
•an impairment of $281 million ($232 million after-tax) recognized to certain capital projects, capital costs and pension balances in the fourth quarter of 2023 as a result of the OEB's Phase 1 Decision on Enbridge Gas' application;
•a deferred tax adjustment of $120 million as a result of deregulation of parts of the Canadian Mainline including Line 9 and L3R;
•a provision adjustment and settlement of $124 million ($95 million after-tax) related to a litigation matter;
•the absence in 2023 of a gain of $118 million ($89 million after-tax) on Texas Eastern recorded to reflect a settlement with a transportation customer undergoing bankruptcy;
•an asset retirement loss of $86 million ($65 million after-tax) related to our Alberta Regional Oil Sands System;
•an impairment loss of $82 million ($63 million after-tax) to certain Offshore equity investments in our Gas Transmission and Midstream segment; and
•transaction costs of $31 million ($24 million after-tax) incurred as a result of the Acquisitions.
The non-cash, unrealized derivative fair value gains and losses discussed above generally arise as a result of our comprehensive economic hedging program to mitigate foreign exchange, interest rate and commodity price risks. This program creates volatility in reported short-term earnings through the recognition of unrealized non-cash gains and losses on derivative instruments used to hedge these risks. Over the long-term, we believe our hedging program supports the reliable cash flows and dividend growth upon which our investor value proposition is based.
71
After taking DCFinto consideration the factors above, the remaining $51 million increase in earnings attributable to common shareholders is primarily explained by the following significant business factors:
•higher contributions from the Mainline System in our Liquids Pipelines segment driven by increased volumes due to increased crude demand, net of C$9,440a lower L3R surcharge and lower Mainline System tolls as a result of revised interim tolls effective July 1, 2023;
•higher contributions from our Liquids Pipelines segment due to increased ownership of the Gray Oak Pipeline and Cactus II Pipeline acquired in the second half of 2022 and the Enbridge Ingleside Energy Center (EIEC) due to higher demand;
•the recognition of revenues in our Gas Transmission and Midstream segment attributable to the Texas Eastern rate case settlement;
•higher distribution charges at our Gas Distribution and Storage segment resulting from increases in rates and customer base as well as higher demand in the contract market;
•higher contributions from our Energy Services segment primarily due to the expiration of transportation commitments and favorable margins due to less pronounced market structure backwardation; and
•the favorable effect of translating US dollar earnings at a higher average exchange rate in 2023, as compared to 2022; partially offset by
•a reduction in earnings from our Gas Transmission and Midstream segment primarily due to our decreased interest in DCP as a result of a joint venture merger transaction with P66 that closed in the third quarter of 2022;
•higher operating and administrative costs in our Gas Transmission and Midstream and Gas Distribution and Storage segments;
•lower commodity prices impacting the DCP and Aux Sable joint ventures in our Gas Transmission and Midstream segment;
•higher interest expense primarily due to higher interest rates and higher average principal; and
•higher depreciation and amortization expense as a result of several projects placed into service in the second half of 2022.
REVENUES
We generate revenues from three primary sources: transportation and other services, gas distribution sales and commodity sales.
Transportation and other services revenues of $19.8 billion, $18.5 billion and $16.2 billion for the years ended December 31, 2023, 2022 and 2021, respectively, were earned from our crude oil and natural gas pipeline transportation businesses and also include power generation revenues from our portfolio of renewable and power generation assets. For our transportation assets operating under market-based arrangements, revenues are driven by volumes transported and the corresponding tolls for transportation services. For assets operating under take-or-pay contracts, revenues reflect the terms of the underlying contract for services or capacity. For rate-regulated assets, revenues are charged in accordance with tolls established by the regulator and, in most cost-of-service based arrangements, are reflective of our cost to provide the service plus a regulator-approved rate of return.
Gas distribution sales revenues of $4.8 billion, $5.7 billion and $4.0 billion for the years ended December 31, 2023, 2022 and 2021, respectively, were recognized in a manner consistent with the underlying rate-setting mechanism mandated by the regulator. Revenues generated by the gas distribution businesses are primarily driven by volumes delivered, which vary with weather and customer composition and utilization, as well as regulator-approved rates. The cost of natural gas is passed through to customers through rates and does not ultimately impact earnings due to its flow-through nature.
72
Commodity sales revenues of $19.0 billion, $29.2 billion and $26.9 billion for the years ended December 31, 2023, 2022 and 2021, respectively, were generated primarily through our Energy Services operations. Energy Services includes the purchase and sale of crude oil, natural gas, power and NGL to generate a margin, which is typically a small fraction of gross revenue. Sales revenue generated from these operations reflect activity levels which are driven by differences in commodity prices between locations, grades and points in time, rather than on absolute prices. Any residual commodity margin risk is closely monitored and managed. Revenues from these operations depend on activity levels, which vary from year-to-year depending on market conditions and commodity prices.
Our revenues also include changes in unrealized derivative fair value gains and losses related to foreign exchange and commodity price contracts used to manage exposures from movements in foreign exchange rates and commodity prices. The mark-to-market accounting creates volatility and impacts the comparability of revenues in the short-term, but we believe over the long-term, the economic hedging program supports reliable cash flows.
BUSINESS SEGMENTS
LIQUIDS PIPELINES
| Year ended December 31, | 2023 | 2022 | 2021 | ||||||||
| (millions of Canadian dollars) | |||||||||||
Earnings before interest, income taxes and depreciation and amortization | 9,499 | 8,364 | 7,897 | ||||||||
Year ended December 31, 2023 compared with year ended December 31, 2022
EBITDA was positively impacted by $500 million due to certain infrequent or other non-operating factors, primarily explained by the following:
•a non-cash, net unrealized gain of $607 million in 2023, compared with a net unrealized loss of $183 million in 2022, reflecting net fair value gains and losses arising from changes in the mark-to-market value of derivative financial instruments used to manage foreign exchange and commodity price risks;
•a gain of $151 million recognized as a result of Southern Lights' discontinuation of regulatory accounting;
•the absence in 2023 of: a total asset impairment loss of $183 million on the US and Canadian components of the interstate pipeline within the North Dakota System of our Bakken System, and an asset impairment loss of $40 million relating to MacKay River line within our Alberta Regional Oil Sands System, partially offset by an asset retirement loss in 2023 of $86 million related to our Alberta Regional Oil Sands System; and
•the receipt of a litigation claim settlement of $68 million in 2023; partially offset by
•a realized loss of $638 million due to termination of foreign exchange hedges, as foreign exchange risks inherent within the CTS framework are not present in the negotiated Mainline tolling agreement.
73
After taking into consideration the factors above, the remaining $635 million increase is primarily explained by the following significant business factors:
•higher Mainline System ex-Gretna average throughput of 3.1 million barrels per day (mmbpd) in 2023 as compared to 3.0 mmbpd in 2022, and higher Line 9 deliveries to eastern Canada driven by higher crude demand, net of a lower L3R surcharge and lower Mainline System tolls as a result of revised interim Mainline tolls effective July 1, 2023;
•higher contributions from the Gulf Coast and Mid-Continent System due primarily to increased ownership of Gray Oak Pipeline and Cactus II Pipeline acquired in the second half of 2022 and the EIEC due to higher demand; and
•the favorable effect of translating US dollar earnings at a higher average exchange rate in 2023, as compared to 2022; partially offset by
•higher power costs as a result of increased volumes and power prices.
GAS TRANSMISSION AND MIDSTREAM
| Year ended December 31, | 2023 | 2022 | 2021 | ||||||||
| (millions of Canadian dollars) | |||||||||||
| Earnings before interest, income taxes and depreciation and amortization | 4,264 | 3,126 | 3,671 | ||||||||
Year ended December 31, 2023 compared with year ended December 31, 2022
EBITDA was positively impacted by $1.2 billion due to certain infrequent or other non-operating factors primarily explained by the following:
•the absence in 2023 of a goodwill impairment of $2.5 billion; partially offset by
•the absence in 2023 of: a gain of $1,076 million on the closing of the joint venture merger transaction with P66 realigning our effective economic interests in Gray Oak and DCP, and a gain of $118 million on Texas Eastern recorded for a customer bankruptcy settlement;
•a provision adjustment and settlement of $124 million related to a litigation matter; and
•an impairment loss of $82 million to certain Offshore equity investments.
After taking into consideration the factors above, we saw a $19 million decrease, primarily explained by the following significant business factors:
•a reduction in earnings from our investment in DCP as a result of our decreased interest due to the
joint venture merger transaction with P66 that closed during the third quarter of 2022;
•higher operating and administrative costs;
•lower commodity prices impacting our DCP and Aux Sable joint ventures;
•lower AECO-Chicago basis differential impacting our investment in Alliance Pipeline, partially offset by
•the favorable effect of translating US dollar earnings at a higher average exchange rate in 2023, as compared to 2022;
•favorable contracting on our US Gas Transmission and Storage assets;
•the recognition of revenues attributable to the Texas Eastern rate case settlement effective for 2023; and
•contributions from the Tres Palacios acquisition in the second quarter of 2023 and Aitken Creek in the fourth quarter of 2023.
74
GAS DISTRIBUTION AND STORAGE
| Year ended December 31, | 2023 | 2022 | 2021 | ||||||||
| (millions of Canadian dollars) | |||||||||||
| Earnings before interest, income taxes and depreciation and amortization | 1,592 | 1,827 | 2,117 | ||||||||
Year ended December 31, 2023 compared with year ended December 31, 2022
EBITDA was negatively impacted by $252 million due to an impairment of $281 million recognized to certain capital projects, capital costs and pension balances in the fourth quarter of 2023 as a result of the OEB's Phase 1 Decision.
After taking into consideration the factors above, the remaining $17 million increase is primarily explained by the following significant business factors:
•higher distribution charges resulting from increases in rates and customer base, as well as higher demand in the contract market; partially offset by
•when compared with the normal weather forecast embedded in rates, warmer than normal weather in 2023 negatively impacted 2023 EBITDA by approximately $86 million year over year; and
•higher operating and administrative costs primarily due to higher pension related costs.
RENEWABLE POWER GENERATION
| Year ended December 31, | 2023 | 2022 | 2021 | ||||||||
| (millions of Canadian dollars) | |||||||||||
| Earnings before interest, income taxes and depreciation and amortization | 149 | 262 | 508 | ||||||||
Year ended December 31, 2023 compared with year ended December 31, 2022
EBITDA was negatively impacted by $122 million due to certain infrequent or non-operating factors, primarily explained by:
•an impairment loss of $261 million to Chapman Ranch wind facilities, partially offset by the absence in 2023 of an impairment loss of $227 million to Magic Valley; and
•a non-cash, net unrealized loss of $72 million in 2023, compared with a net unrealized gain of $8 million in 2022, reflecting changes in the mark-to-market value of derivative financial instruments used to manage commodity price risks.
After taking into consideration the negative factors above, the remaining $9 million increase is primarily explained by the following significant business factors:
•fees earned on certain wind and solar development contracts;
•higher contribution from the Hohe See and Albatros Offshore Wind Facilities as a result of the November 2023 acquisition of an additional 24.45% interest in these facilities; and
•contributions from the Saint-Nazaire Offshore Wind Project, which reached full operating capacity in December 2022; partially offset by
•lower energy pricing at European offshore wind facilities; and
•weaker wind resources at Canadian and US onshore wind facilities.
75
ENERGY SERVICES
| Year ended December 31, | 2023 | 2022 | 2021 | ||||||||
| (millions of Canadian dollars) | |||||||||||
| Loss before interest, income taxes and depreciation and amortization | (37) | (417) | (313) | ||||||||
EBITDA from Energy Services is dependent on market conditions and results achieved in one period may not be indicative of results to be achieved in future periods.
Year ended December 31, 2023 compared with year ended December 31, 2022
EBITDA was positively impacted by $117 million due to certain non-operating factors, primarily explained by a non-cash, net unrealized gain of $73 million in 2023, compared with a net unrealized loss of $27 million in 2022, reflecting the revaluation of derivatives used to manage the profitability of transportation and storage transactions, as well as to manage the exposure to movements in commodity prices.
After taking into consideration the factor above, the remaining $263 million increase is primarily explained by the following significant business factors:
•expiration of certain less attractive transportation commitments;
•more favorable margins realized on facilities where we hold capacity obligations and storage opportunities as compared to 2022; and
•less pronounced market structure backwardation as compared to 2022.
ELIMINATIONS AND OTHER
| Year ended December 31, | 2023 | 2022 | 2021 | ||||||||
| (millions of Canadian dollars) | |||||||||||
| Earnings/(loss) before interest, income taxes and depreciation and amortization | 837 | (1,124) | 356 | ||||||||
Eliminations and Other includes operating and administrative costs that are not allocated to business segments, the impact of foreign exchange hedge settlements and the activities of our wholly-owned captive insurance subsidiaries. Eliminations and Other also includes the impact of new business development activities and corporate investments.
Year ended December 31, 2023 compared with year ended December 31, 2022
EBITDA was positively impacted by $1.9 billion due to certain infrequent or non-operating factors, primarily explained by:
•a non-cash, net unrealized gain of $623 million in 2023, compared with a net unrealized loss of $1,090 million in 2022, reflecting changes in the mark-to-market value of derivative financial instruments used to manage foreign exchange risk;
•the absence in 2023 of: $114 million of transaction costs in relation to our investment purchase in the Woodfibre LNG Project, and an impairment of $44 million for lease assets due to office relocation plans; and
•a non-cash, net unrealized gain of $35 million in 2023, compared with a net unrealized loss of $25 million in 2022, reflecting changes in the mark-to-market value of equity fund investments held by our wholly-owned captive insurance subsidiaries; partially offset by
•transaction costs of $31 million incurred as a result of the Acquisitions.
After taking into consideration the non-operating factors above, we saw a $18 million increase in EBITDA that is primarily explained by higher investment income from the pre-funding of the Acquisitions.
76
GROWTH PROJECTS - COMMERCIALLY SECURED PROJECTS
The following table summarizes the status of our significant commercially secured projects, organized by business segment:
| Enbridge's Ownership Interest | Estimated Capital Cost1 | Expenditures to Date2 | Status2 | Expected In-Service Date | ||||||||||||||||
| (Canadian dollars, unless stated otherwise) | ||||||||||||||||||||
| GAS TRANSMISSION AND MIDSTREAM | ||||||||||||||||||||
| 1. | Texas Eastern Venice Extension Project3 | 100 | % | US$477 million | US$170 million | Under construction | 2023 - 2024 | |||||||||||||
| 2. | Texas Eastern Modernization | 100 | % | US$394 million | US$37 million | Pre-construction | 2025 - 2026 | |||||||||||||
| 3. | T-North Expansion | 100 | % | $1.2 billion | $70 million | Pre-construction | 2026 | |||||||||||||
| 4. | Rio Bravo Pipeline5 | 100 | % | US$1.2 billion | US$66 million | Pre-construction | 2026 | |||||||||||||
| 5. | Woodfibre LNG6 | 30 | % | US$1.5 billion | US$310 million | Under construction | 2027 | |||||||||||||
| 6. | T-South Expansion4 | 100 | % | $4.0 billion | $67 million | Pre-construction | 2028 | |||||||||||||
| RENEWABLE POWER GENERATION | ||||||||||||||||||||
| 7. | Fécamp Offshore Wind7 | 17.9 | % | $692 million | $528 million | Under construction | 1Q-2024 | |||||||||||||
| (€471 million) | (€362 million) | |||||||||||||||||||
| 8. | Calvados Offshore Wind8 | 21.7 | % | $954 million | $307 million | Under construction | 2025 | |||||||||||||
| (€645 million) | (€214 million) | |||||||||||||||||||
| 9. | Fox Squirrel Solar | 50 | % | US$406 million | US$152 million | Under construction | 2023-2024 | |||||||||||||
1These amounts are estimates and are subject to upward or downward adjustment based on various factors. Where appropriate, the amounts reflect our share of joint venture projects.
2Expenditures to date and status of the project are determined as at December 31, 2023.
3Includes the $37 million Gator Express Project placed into service in August 2023. Total estimated capital cost consists of the reversal and expansion of Texas Eastern's Line 40 expected to be completed in 2024.
4Capital cost estimates will be updated prior to filing the regulatory applications.
5Rio Grande LNG has reached a final investment decision for three liquefaction trains. Current estimated capital cost is based on two liquefaction trains and an update to the estimated capital cost is expected to be provided in 2024.
6Our equity contribution is approximately US$893 million, with the remainder financed through non-recourse project level debt. Capital cost estimates will be updated prior to the 60% engineering milestone, at which point Enbridge's preferred return will be set.
7Our equity contribution is $103 million, with the remainder financed through non-recourse project level debt.
8Our equity contribution is $181 million, with the remainder financed through non-recourse project level debt.
Risks related to the development and completion of growth projects are described under Part I. Item 1A.Risk Factors.
GAS TRANSMISSION AND MIDSTREAM
The following commercially secured growth projects are currently in various stages of construction:
•Texas Eastern Venice Extension Project –A reversal and expansion of Texas Eastern’s Line 40 from its existing New Roads compressor station to a new delivery point with the proposed Gator Express pipeline just south of Texas Eastern’s Larose compressor station. The project is expected to deliver 1.5 billion cubic feet per day (bcf/d) of natural gas to Venture Global Plaquemines LNG, LLC’s LNG export facility located in Plaquemines Parish, Louisiana and is underpinned by long-term take or pay contracts.
77
•Texas Eastern Modernization – This program is the modernization of compression facilities in Pennsylvania and New Jersey to increase safety and reliability and reduce associated greenhouse gas emissions at multiple sites on our Texas Eastern system. The program will be completed in stages over a period of years beginning in 2024.
•T-North Expansion – An expansion of Westcoast Energy Inc.'s (Westcoast) BC Pipeline in northern BC that includes pipeline looping, additional compressor units and other ancillary station modifications to support 535 million cubic feet per day (mmcf/d) of additional capacity. The project will be underpinned by a cost-of-service commercial model with a target in-service date of 2026. On January 8, 2024, we filed the regulatory application with the CER.
•Rio Bravo Pipeline – In July 2023, the Rio Grande LNG export facility, owned by NextDecade Corporation (NextDecade), reached a final investment decision. As a result, the construction on our previously announced Rio Bravo Pipeline project is anticipated to proceed after obtaining necessary regulatory approvals. The first phase of the Rio Bravo Pipeline is designed to transport 2.6 bcf/d of natural gas feedstock to NextDecade's Rio Grande LNG export facility in the Port of Brownsville, Texas. The project is expected to achieve commercial operations in 2026.
•Woodfibre LNG Project –Construction of liquefaction and floating storage facilities in Squamish, BC, as well as an expansion of the BC Pipeline System. The project is expected to be placed into service in 2027.
•T-South Expansion – An expansion of Westcoast's BC Pipeline's T-South section that includes pipeline looping, additional compressor units and other ancillary station modifications to support 300 mmcf/d of additional capacity. The project is expected to be placed in service in 2028 and will be underpinned by a cost-of-service commercial model.
RENEWABLE POWER GENERATION
The following commercially secured growth projects are expected to be placed into service from 2023 to
2025:
•Fécamp Offshore Wind Project – An offshore wind project that will be comprised of 71 wind turbines located off the northwest coast of France and is expected to generate approximately 500 megawatts (MW). Project revenues are underpinned by a 20-year fixed price power purchase agreement (PPA).
•Calvados Offshore Wind Project – An offshore wind project located off the northwest coast of France that is expected to generate approximately 448 MW. Project revenues are underpinned by a 20-year fixed price PPA.
•Fox Squirrel Solar – A fully contracted, ground-mounted solar facility in Ohio with expected installed capacity of approximately 577 MW. The initial phase successfully commenced operations in December 2023. We plan to invest in the following phases in 2024, assuming certain conditions are met. Project revenues are underpinned by a 20-year fixed price PPA.
78
LIQUIDITY AND CAPITAL RESOURCES
The maintenance of financial strength and flexibility is fundamental to our growth strategy, particularly in light of the significant number and size of capital projects and acquisitions currently secured or under development. Access to timely funding from capital markets could be limited by factors outside our control including, but not limited to, financial market volatility resulting from economic and political events both inside and outside North America. To mitigate such risks, we actively manage financial plans and strategies to ensure we maintain sufficient liquidity to meet routine operating and future capital requirements. In the near term, we generally expect to utilize cash from operations together with commercial paper issuance and/or credit facility draws and the proceeds of capital market offerings to fund liabilities as they become due, finance capital expenditures, fund debt retirements and pay common and preference share dividends. We target maintaining sufficient liquidity through the use of committed credit facilities with a diversified group of banks and financial institutions to enable us to fund all anticipated requirements for approximately one year without accessing the capital markets.
Material contractual obligations arising in the normal course of business primarily consist of long-term contracts, annual debt maturities and related interest obligations, rights-of-way and leases. See Part II. Item 8. Financial Statements and Supplementary Data - Note 17 - Debt and Note 26 - Leases for amounts outstanding at December 31, 2023, related to debt and leases.
Long-term contracts are contracts that we have signed for the purchase of services, pipe and other materials totaling $8.9 billion which are expected to be paid over the next five years. Remaining long-term contracts primarily consist of the following purchase obligations: firm capacity payments for natural gas and crude oil transportation and storage contracts, natural gas purchase commitments, service and product purchase obligations and power commitments.
Our financing plan is regularly updated to reflect evolving capital requirements and financial market conditions and identifies a variety of potential sources of debt and equity funding alternatives, including reinstatement of our dividend reinvestment and share purchase plan or at-the-market equity issuances.
CAPITAL MARKET ACCESS
We ensure ready access to capital markets, subject to market conditions, through maintenance of shelf prospectuses that allow for issuance of long-term debt, equity and other forms of long-term capital when market conditions are attractive. In accordance with our funding plan, we completed the following long-term debt issuances totaling US$8.5 billion and $3.9 billion in 2023:
| Entity | Issuance date | Type of issuance | Amount | ||||||||
| (in millions of Canadian dollars, unless stated otherwise) | |||||||||||
| Enbridge Inc. | March 2023 | Sustainability-linked senior notes | US$2,300 | ||||||||
| Enbridge Inc. | March 2023 | Senior notes | US$700 | ||||||||
| Enbridge Inc. | May 2023 | Medium-term notes | $1,100 | ||||||||
| Enbridge Inc. | May 2023 | Sustainability-linked medium-term notes | $400 | ||||||||
| Enbridge Inc. | September 2023 | Fixed-to-fixed subordinated notes | US$2,000 | ||||||||
| Enbridge Inc. | September 2023 | Fixed-to-fixed subordinated notes | $1,000 | ||||||||
| Enbridge Inc. | November 2023 | Senior notes | US$3,500 | ||||||||
| Enbridge Gas Inc. | October 2023 | Medium-term notes | $1,000 | ||||||||
| Enbridge Pipelines Inc. | August 2023 | Medium-term notes | $350 | ||||||||
79
Credit Facilities, Ratings and Liquidity
To ensure ongoing liquidity and to mitigate the risk of capital market disruption, we maintain ready access to funds through committed bank credit facilities and actively manage our bank funding sources to optimize pricing and other terms. The following table provides details of our committed credit facilities, inclusive of term loans, at December 31, 2023:
Maturity1 | Total Facilities | Draws2 | Available | |||||||||||
| (millions of Canadian dollars) | ||||||||||||||
| Enbridge Inc. | 2024-2028 | 8,876 | 3,177 | 5,699 | ||||||||||
| Enbridge (U.S.) Inc. | 2025-2028 | 8,373 | 670 | 7,703 | ||||||||||
| Enbridge Pipelines Inc. | 2025 | 2,000 | 449 | 1,551 | ||||||||||
| Enbridge Gas Inc. | 2025 | 2,500 | 400 | 2,100 | ||||||||||
| Total committed credit facilities | 21,749 | 4,696 | 17,053 | |||||||||||
1Maturity date is inclusive of the one-year term out option for certain credit facilities.
2Includes facility draws and commercial paper issuances that are back-stopped by credit facilities.
In March 2023, Enbridge Gas increased its 364-day extendible credit facility from $2.0 billion to $2.5 billion and in July 21, 2023, the facility's maturity date was extended to July 2025, which includes a one-year term out provision from July 2024.
In July 2023, Enbridge Pipelines Inc. extended the maturity date of its 364-day extendible credit facility to July 2025, which includes a one-year term out provision from July 2024.
In July 2023, we renewed approximately $6.8 billion of our 364-day extendible credit facilities, extending the maturity dates to July 2025, which includes a one-year term out provision from July 2024. We also renewed approximately $7.6 billion of our five-year credit facilities, extending the maturity dates to July 2028. Further, we extended our three-year credit facilities, extending the maturity dates to July 2026.
In September 2023, we obtained commitments for a US$9.4 billion senior unsecured bridge term loan credit facility to support the Acquisitions. The commitment for this facility was subsequently reduced to nil as at December 31, 2023 as a result of the September 2023 $4.6 billion equity offering, the September 2023 subordinated long-term debt issuances, and the November 2023 senior notes long-term debt issuances.
In addition to the committed credit facilities noted above, we maintain $1.1 billion of uncommitted demand letter of credit facilities, of which $572 million was unutilized as at December 31, 2023. As at December 31, 2022, we had $1.3 billion of uncommitted demand letter of credit facilities, of which $689 million was unutilized.
As at December 31, 2023, our net available liquidity totaled $23.0 billion (2022 - $10.0 billion), consisting of available credit facilities of $17.1 billion (2022 - $9.1 billion) and unrestricted Cash and cash equivalents of $5.9 billion (2022 - $861 million) as reported in the Consolidated Statements of Financial Position.
Our credit facility agreements and term debt indentures include standard events of default and covenant provisions, whereby accelerated repayment and/or termination of the agreements may result if we were to default on payment or violate certain covenants. As at December 31, 2023, we were in compliance with all debt covenants and expect to continue to comply with such covenants.
80
Cash flow growth, ready access to liquidity from diversified sources and a stable business model have enabled us to manage our credit profile. We actively monitor and manage key financial metrics with the objective of sustaining investment grade credit ratings from the major credit rating agencies and ongoing access to bank funding and term debt capital on attractive terms. In 2023, our credit ratings with DBRS Morningstar, Fitch Ratings, Moody's Investor Services, Inc. and Standard & Poor's were all affirmed. Key measures of financial strength that are closely managed include the ability to service debt obligations from operating cash flow and the ratio of debt to EBITDA.
There are no material restrictions on our cash. Total Restricted cash of $84 million, as reported in the Consolidated Statements of Financial Position, primarily includes cash collateral and future pipeline abandonment costs collected and held in trust. Cash and cash equivalents held by certain subsidiaries may not be readily accessible for alternative use by us.
Excluding current maturities of long-term debt, as at December 31, 2023 and 2022, we had a positive and negative working capital positions of $3.0 billion and $2.1 billion, respectively. In 2023, the major contributing factor to the positive working capital position was the increase in cash associated with pre-funding of the Acquisitions. In 2022, the major contributing factor to the negative working capital position was the current liabilities associated with our growth capital program.
SOURCES AND USES OF CASH
| Year ended December 31, | 2023 | 2022 | 2021 | ||||||||
| (millions of Canadian dollars) | |||||||||||
| Operating activities | 14,201 | 11,230 | 9,256 | ||||||||
| Investing activities | (6,043) | (5,270) | (10,657) | ||||||||
| Financing activities | (2,864) | (5,428) | 1,236 | ||||||||
| Effect of translation of foreign denominated cash and cash equivalents and restricted cash | (216) | 55 | (5) | ||||||||
| Net change in cash and cash equivalents and restricted cash | 5,078 | 587 | (170) | ||||||||
Significant sources and uses of cash for the years ended December 31, 2023 and 2022 are summarized below:
Operating Activities
Typically, the primary factors impacting cash provided by operating activities year-over-year include changes in our operating assets and liabilities in the normal course due to various factors, including the impact of fluctuations in commodity prices and activity levels on working capital within our business segments, the timing of tax payments, as well as timing of cash receipts and payments generally. Refer to Part II. Item 8. Financial Statements and Supplementary Data - Note 28. Changes in Operating Assets and Liabilities. Cash provided by operating activities is also impacted by changes in earnings and certain infrequent or other non-operating factors, as discussed under Results of Operations, as well as Distributions from equity investments.
Investing Activities
Cash used in investing activities primarily relates to capital expenditures to execute our capital program, which is further described in Growth Projects - Commercially Secured Projects. The timing of project approval, construction and in-service dates impacts the timing of cash requirements. Cash used in investing activities is also impacted by acquisitions and dispositions as discussed under Recent Developments, and changes in contributions to, and distributions from, our equity investments.
81
A summary of additions to property, plant and equipment for the years ended December 31, 2023, 2022 and 2021 is set out below:
| Year ended December 31, | 2023 | 2022 | 2021 | ||||||||
| (millions of Canadian dollars) | |||||||||||
| Liquids Pipelines | 1,158 | 1,418 | 4,051 | ||||||||
| Gas Transmission and Midstream | 1,890 | 1,647 | 2,353 | ||||||||
| Gas Distribution and Storage | 1,451 | 1,499 | 1,343 | ||||||||
| Renewable Power Generation | 100 | 50 | 16 | ||||||||
| Energy Services | — | — | 1 | ||||||||
| Eliminations and Other | 55 | 33 | 54 | ||||||||
| Total capital expenditures | 4,654 | 4,647 | 7,818 | ||||||||
2023
The increase in cash used in investing activities primarily resulted from the following factors:
•the absence in 2023 of the proceeds received from the completion of a joint venture merger transaction for DCP Midstream, LLC in August 2022; and
•higher cash outflows related to acquisitions in 2023 when compared to 2022.
The factors above were partially offset by higher distributions in 2023 mainly related to our investment in NEXUS Gas Transmission, LLC.
2022
The decrease in cash used in investing activities primarily resulted from the following factors:
•lower capital expenditures due to the US L3R program that was placed into service in the fourth quarter of 2021;
•lower cash outflows related to acquisitions in 2022 when compared to 2021; and
•proceeds received from the completion of a joint venture merger transaction for DCP Midstream LLC in August 2022.
The factors above were partially offset by:
•the absence in 2022 of proceeds received from dispositions in 2021 related to sale of our interest in Noverco Inc. in December 2021; and
•increased investments held by our wholly-owned captive insurance subsidiaries.
Financing Activities
Cash used in financing activities primarily relates to issuances and repayments of external debt, as well as transactions with our common and preference shareholders relating to dividends, share issuances, share redemptions and common share repurchases under our NCIB. Cash used in financing activities is also impacted by changes in distributions to, and contributions from, noncontrolling interests.
2023
The decrease in cash used in financing activities primarily resulted from the following factors:
•higher long-term debt issuances in 2023 when compared to the same period in 2022;
•our public offering of common shares, which closed on September 8, 2023, resulting in the issuance of 102,913,500 common shares at a price of $44.70 per share for gross proceeds of $4.6 billion, which is intended to finance a portion of the aggregate cash consideration payable for the Acquisitions; and
•the absence in 2023 of the redemption of Preference Shares, Series 17 and Series J in the first and second quarters of 2022, respectively.
82
The factors above were partially offset by:
•higher net commercial paper and credit facility repayments in 2023 when compared to the same period in 2022;
•net repayments of short-term borrowings in 2023 when compared to net issuances in 2022;
•the absence in 2023 of proceeds received from the sale of a non-operating interest in seven pipelines from our Regional Oil Sands System in October 2022;
•higher long-term debt repayments in 2023 when compared to the same period in 2022; and
•increased common share dividend payments primarily due to the increase in our common share dividend rate and an increase in the number of common shares outstanding.
2022
The increase in cash used in financing activities primarily resulted from the following factors:
•net commercial paper and credit facility repayments in 2022 when compared to draws in 2021;
•higher long-term debt repayments along with lower long-term debt issuances in 2022 when compared to 2021;
•the redemption of Preference Shares, Series 17 and Series J in the first and second quarters of 2022, respectively;
•the repurchase and cancellation of 2,737,965 common shares under our NCIB for approximately $151 million in 2022; and
•increased common share dividend payments primarily due to the increase in our common share dividend rate.
The factors above were partially offset by:
•proceeds received from the sale of a non-operating interest in seven pipelines from our Regional Oil Sands System in October 2022; and
•the absence in 2022 of the redemption of Westcoast's preferred shares in the first quarter of 2021.
OFF-BALANCE SHEET ARRANGEMENTS
We enter into guarantee arrangements in the normal course of business to facilitate commercial transactions with third parties and can include financial guarantees, stand-by letters of credit, debt guarantees, surety bonds and indemnifications. Please see Part II. Item 8. Financial Statements and Supplementary Data - Note 31 - Guarantees for further discussion of guarantee arrangements.
We do not have material off-balance sheet financing entities or structures, except for guarantee arrangements and financings entered into for our equity investments. For additional information on these commitments, please refer to Part II. Item 8. Financial Statements and Supplementary Data -Note 30 - Commitments and Contingencies and Note 12 - Variable Interest Entities.
We do not have material off-balance sheet arrangements that have or are reasonably likely to have a current or future effect on our financial condition, revenues or expenses, results of operations, liquidity, capital expenditures or capital resources.
83
OUTSTANDING PREFERENCE SHARES
Characteristics of our outstanding preference shares are as follows:
| Dividend Rate | Dividend1 | Per Share Base Redemption Value2 | Redemption and Conversion Option Date2,3 | Right to Convert Into3,4 | |||||||||||||
| (Canadian dollars unless otherwise stated) | |||||||||||||||||
| Preference Shares, Series A | 5.50 | % | $1.37500 | $25 | — | — | |||||||||||
| Preference Shares, Series B | 5.20 | % | $1.30052 | $25 | June 1, 2027 | Series C | |||||||||||
Preference Shares, Series D5 | 5.41 | % | $1.35300 | $25 | March 1, 2028 | Series E | |||||||||||
Preference Shares, Series F6 | 5.54 | % | $1.38452 | $25 | June 1, 2028 | Series G | |||||||||||
Preference Shares, Series G7 | 6.96 | % | $1.90704 | $25 | June 1, 2028 | Series F | |||||||||||
Preference Shares, Series H8 | 6.11 | % | $1.52800 | $25 | September 1, 2028 | Series I | |||||||||||
Preference Shares, Series I9 | 7.19 | % | $1.81004 | $25 | September 1, 2028 | Series H | |||||||||||
| Preference Shares, Series L | 5.86 | % | US$1.46448 | US$25 | September 1, 2027 | Series M | |||||||||||
| Preference Shares, Series N | 6.70 | % | $1.67400 | $25 | December 1, 2028 | Series O | |||||||||||
| Preference Shares, Series P | 4.38 | % | $1.09476 | $25 | March 1, 2024 | Series Q | |||||||||||
| Preference Shares, Series R | 4.07 | % | $1.01825 | $25 | June 1, 2024 | Series S | |||||||||||
Preference Shares, Series 110 | 6.70 | % | US$1.67592 | US$25 | June 1, 2028 | Series 2 | |||||||||||
| Preference Shares, Series 3 | 3.74 | % | $0.93425 | $25 | September 1, 2024 | Series 4 | |||||||||||
| Preference Shares, Series 5 | 5.38 | % | US$1.34383 | US$25 | March 1, 2024 | Series 6 | |||||||||||
| Preference Shares, Series 7 | 4.45 | % | $1.11224 | $25 | March 1, 2024 | Series 8 | |||||||||||
| Preference Shares, Series 9 | 4.10 | % | $1.02424 | $25 | December 1, 2024 | Series 10 | |||||||||||
| Preference Shares, Series 11 | 3.94 | % | $0.98452 | $25 | March 1, 2025 | Series 12 | |||||||||||
| Preference Shares, Series 13 | 3.04 | % | $0.76076 | $25 | June 1, 2025 | Series 14 | |||||||||||
| Preference Shares, Series 15 | 2.98 | % | $0.74576 | $25 | September 1, 2025 | Series 16 | |||||||||||
Preference Shares, Series 1911 | 6.21 | % | $1.55300 | $25 | March 1, 2028 | Series 20 | |||||||||||
1The holder is entitled to receive a fixed cumulative quarterly preferential dividend, as declared by the Board of Directors. With the exception of Preference Shares, Series A, such fixed dividend rate resets every five years beginning on the initial Redemption and Conversion Option Date. Preference Shares, Series G and I contain a feature where the dividend rate resets on a quarterly basis. The Preference Shares, Series 19 contain a feature where the fixed dividend rate, when reset every five years, will not be less than 4.90%. No other series of preference shares has this feature.
2Preference Shares, Series A may be redeemed any time at our option. For all other series of preference shares, we may at our option, redeem all or a portion of the outstanding preference shares for the Per Share Base Redemption Value plus all accrued and unpaid dividends on the Redemption Option Date and on every fifth anniversary thereafter.
3The holder will have the right, subject to certain conditions, to convert their shares into Cumulative Redeemable Preference Shares of a specified series on a one-for-one basis on the Conversion Option Date and every fifth anniversary thereafter at an ascribed issue price equal to the Per Share Base Redemption Value.
4With the exception of Preference Shares, Series A, after the Redemption and Conversion Option Date, holders may elect to receive quarterly floating rate cumulative dividends per share at a rate equal to: $25 x (number of days in quarter/number of days in year) x three month Government of Canada treasury bill rate + 2.4% (Series C), 2.4% (Series E), 2.5% (Series G), 2.1% (Series I), 2.7% (Series O), 2.5% (Series Q), 2.5% (Series S), 2.4% (Series 4), 2.6% (Series 8), 2.7% (Series 10), 2.6% (Series 12), 2.7% (Series 14), 2.7% (Series 16), or 3.2% (Series 20); or US$25 x (number of days in quarter/number of days in year) x three month US Government treasury bill rate + 3.2% (Series M), 3.1% (Series 2), or 2.8% (Series 6).
5The quarterly dividend per share paid on Preference Shares, Series D was increased to $0.33825 from $0.27875 on March 1, 2023 due to reset of the annual dividend on March 1, 2023.
6The quarterly dividend per share paid on Preference Shares, Series F was increased to $0.34613 from $0.29306 on June 1, 2023 due to reset of the annual dividend on June 1, 2023.
7On June 1, 2023, 1,827,695 of the outstanding Preference Shares, Series F were converted into Preference Shares, Series G.
8The quarterly dividend per share paid on Preference Shares, Series H was increased to $0.38200 from $0.27350 on September 1, 2023 due to reset of the annual dividend on September 1, 2023.
9On September 1, 2023, 2,350,602 of the outstanding Preference Shares, Series H were converted into Preference Shares, Series I.
10 The quarterly dividend per share paid on Preference Shares, Series 1 was increased to US$0.41898 from US$0.37182 on June 1, 2023 due to reset of the annual dividend on June 1, 2023.
11 The quarterly dividend per share paid on Preference Shares, Series 19 was increased to $0.38825 from $0.30625 on March 1, 2023 due to reset of the annual dividend on March 1, 2023.
84
DIVIDENDS
We have paid common share dividends in every year since we became a publicly traded company in 1953. In November 2023, we announced a 3.1% increase in our quarterly dividend to $0.9150 per common share, or $3.66 annualized, effective with the dividend payable on March 1, 2024, thereby declaring a dividend increase for 29 straight years.
For the years ended December 31, 2023 and 2022, total dividends paid were $7.3 billion and $7.0 billion, respectively, all of which were paid in cash and reflected in Cash Flows from Financing Activities in the Consolidated Statements of Cash Flows.
On November 28, 2023, our Board of Directors declared the following quarterly dividends. All dividends are payable on March 1, 2024 to shareholders of record on February 15, 2024.
| Dividend per share | |||||
Common Shares1 | $0.91500 | ||||
| Preference Shares, Series A | $0.34375 | ||||
| Preference Shares, Series B | $0.32513 | ||||
| Preference Shares, Series D | $0.33825 | ||||
| Preference Shares, Series F | $0.34613 | ||||
Preference Shares, Series G2 | $0.47676 | ||||
| Preference Shares, Series H | $0.38200 | ||||
Preference Shares, Series I3 | $0.45251 | ||||
| Preference Shares, Series L | US$0.36612 | ||||
Preference Shares, Series N4 | $0.41850 | ||||
| Preference Shares, Series P | $0.27369 | ||||
| Preference Shares, Series R | $0.25456 | ||||
| Preference Shares, Series 1 | US$0.41898 | ||||
| Preference Shares, Series 3 | $0.23356 | ||||
| Preference Shares, Series 5 | US$0.33596 | ||||
| Preference Shares, Series 7 | $0.27806 | ||||
| Preference Shares, Series 9 | $0.25606 | ||||
| Preference Shares, Series 11 | $0.24613 | ||||
| Preference Shares, Series 13 | $0.19019 | ||||
| Preference Shares, Series 15 | $0.18644 | ||||
| Preference Shares, Series 19 | $0.38825 | ||||
1The quarterly dividend per common share was increased 3.1% to $0.9150 from $0.8875, effective March 1, 2024.
2The quarterly dividend per share paid on Preference Shares, Series G was increased to $0.47676 from $0.47245 on December 1, 2023 due to reset on a quarterly basis.
3The quarterly dividend per share paid on Preference Shares, Series I was increased to $0.45251 from $0.44814 on December 1, 2023 due to reset on a quarterly basis following the date of issuance.
4The quarterly dividend per share paid on Preference Shares, Series N was increased to $0.41850 from $0.31788 on December 1, 2023 due to reset of the annual dividend on December 1, 2023.
85
SUMMARIZED FINANCIAL INFORMATION
On January 22, 2019, Enbridge entered into supplemental indentures with its wholly-owned subsidiaries, Spectra Energy Partners, LP (SEP) and Enbridge Energy Partners, L.P. (EEP) (the Partnerships), pursuant to which Enbridge fully and unconditionally guaranteed, on a senior unsecured basis, the payment obligations of the Partnerships with respect to the outstanding series of notes issued under the respective indentures of the Partnerships. Concurrently, the Partnerships entered into a subsidiary guarantee agreement pursuant to which they fully and unconditionally guaranteed, on a senior unsecured basis, the outstanding series of senior notes of Enbridge. The Partnerships have also entered into supplemental indentures with Enbridge pursuant to which the Partnerships have issued full and unconditional guarantees, on a senior unsecured basis, of senior notes issued by Enbridge subsequent to January 22, 2019. As a result of the guarantees, holders of any of the outstanding guaranteed notes of the Partnerships (the Guaranteed Partnership Notes) are in the same position with respect to the net assets, income and cash flows of Enbridge as holders of Enbridge's outstanding guaranteed notes (the Guaranteed Enbridge Notes), and vice versa. Other than the Partnerships, Enbridge subsidiaries (including the subsidiaries of the Partnerships, collectively, the Subsidiary Non-Guarantors), are not parties to the subsidiary guarantee agreement and have not otherwise guaranteed any of Enbridge's outstanding series of senior notes.
Consenting SEP notes and EEP notes under Guarantee
SEP Notes1 | EEP Notes2 | ||||
| 4.750% Senior Notes due 2024 | 5.875% Notes due 2025 | ||||
| 3.500% Senior Notes due 2025 | 5.950% Notes due 2033 | ||||
| 3.375% Senior Notes due 2026 | 6.300% Notes due 2034 | ||||
| 5.950% Senior Notes due 2043 | 7.500% Notes due 2038 | ||||
| 4.500% Senior Notes due 2045 | 5.500% Notes due 2040 | ||||
| 7.375% Notes due 2045 | |||||
1As at December 31, 2023, the aggregate outstanding principal amount of SEP notes was approximately US$3.2 billion.
2As at December 31, 2023, the aggregate outstanding principal amount of EEP notes was approximately US$2.4 billion.
86
Enbridge Notes under Guarantees
USD Denominated1 | CAD Denominated2 | ||||
| Floating Rate Senior Notes due 2024 | 3.950% Medium-term Notes due 2024 | ||||
| 3.500% Senior Notes due 2024 | 2.440% Medium-term Notes due 2025 | ||||
| 2.150% Senior Notes due 2024 | 3.200% Medium-term Notes due 2027 | ||||
| 2.500% Senior Notes due 2025 | 5.700% Medium-term Notes due 2027 | ||||
| 2.500% Senior Notes due 2025 | 6.100% Medium-term Notes due 2028 | ||||
| 4.250% Senior Notes due 2026 | 4.900% Medium-term Notes due 2028 | ||||
| 1.600% Senior Notes due 2026 | 2.990% Medium-term Notes due 2029 | ||||
| 5.969% Senior Notes due 2026 | 7.220% Medium-term Notes due 2030 | ||||
| 5.900% Senior Notes due 2026 | 7.200% Medium-term Notes due 2032 | ||||
| 3.700% Senior Notes due 2027 | 6.100% Sustainability-Linked Medium-term Notes due 2032 | ||||
| 6.000% Senior Notes due 2028 | 3.100% Sustainability-Linked Medium-term Notes due 2033 | ||||
| 3.125% Senior Notes due 2029 | 5.360% Sustainability-Linked Medium-term Notes due 2033 | ||||
| 6.200% Senior Notes due 2030 | 5.570% Medium-term Notes due 2035 | ||||
| 2.500% Sustainability-Linked Senior Notes due 2033 | 5.750% Medium-term Notes due 2039 | ||||
| 5.700% Sustainability-Linked Senior Notes due 2033 | 5.120% Medium-term Notes due 2040 | ||||
| 4.500% Senior Notes due 2044 | 4.240% Medium-term Notes due 2042 | ||||
| 5.500% Senior Notes due 2046 | 4.570% Medium-term Notes due 2044 | ||||
| 4.000% Senior Notes due 2049 | 4.870% Medium-term Notes due 2044 | ||||
| 3.400% Senior Notes due 2051 | 4.100% Medium-term Notes due 2051 | ||||
| 6.700% Senior Notes due 2053 | 6.510% Medium-term Notes due 2052 | ||||
| 5.760% Medium-term Notes due 2053 | |||||
| 4.560% Medium-term Notes due 2064 | |||||
1As at December 31, 2023, the aggregate outstanding principal amount of the Enbridge US dollar denominated notes was approximately US$15.7 billion.
2As at December 31, 2023, the aggregate outstanding principal amount of the Enbridge Canadian dollar denominated notes was approximately $11.0 billion.
Rule 3-10 of the US Securities and Exchange Commission's (SEC) Regulation S-X provides an exemption from the reporting requirements of the Securities Exchange Act of 1934, as amended (the Exchange Act) for fully consolidated subsidiary issuers of guaranteed securities and subsidiary guarantors and allows for summarized financial information in lieu of filing separate financial statements for each of the Partnerships.
The following Summarized Combined Statement of Earnings and the Summarized Combined Statements of Financial Position combines the balances of EEP, SEP and Enbridge.
Summarized Combined Statement of Earnings
| Year ended December 31, | 2023 | ||||
| (millions of Canadian dollars) | |||||
| Operating loss | (149) | ||||
| Earnings | 4,273 | ||||
| Earnings attributable to common shareholders | 3,921 | ||||
87
Summarized Combined Statements of Financial Position
| December 31, | 2023 | 2022 | ||||||
| (millions of Canadian dollars) | ||||||||
| Cash and cash equivalents | 6,525 | 425 | ||||||
| Accounts receivable from affiliates | 3,440 | 2,486 | ||||||
| Short-term loans receivable from affiliates | 3,291 | 5,232 | ||||||
| Other current assets | 491 | 969 | ||||||
| Long-term loans receivable from affiliates | 45,702 | 43,873 | ||||||
| Other long-term assets | 3,303 | 4,111 | ||||||
| Accounts payable to affiliates | 2,264 | 1,375 | ||||||
| Short-term loans payable to affiliates | 807 | 1,745 | ||||||
| Trade payable and accrued liabilities | 743 | 716 | ||||||
| Other current liabilities | 7,256 | 8,036 | ||||||
| Long-term loans payable to affiliates | 35,556 | 37,626 | ||||||
| Other long-term liabilities | 52,096 | 47,447 | ||||||
The Guaranteed Enbridge Notes and the Guaranteed Partnership Notes are structurally subordinated to the indebtedness of the Subsidiary Non-Guarantors in respect of the assets of those Subsidiary Non-Guarantors.
Under US bankruptcy law and comparable provisions of state fraudulent transfer laws, a guarantee can be voided, or claims may be subordinated to all other debts of that guarantor if, among other things, the guarantor, at the time the indebtedness evidenced by its guarantee or, in some states, when payments become due under the guarantee:
•received less than reasonably equivalent value or fair consideration for the incurrence of the guarantee and was insolvent or rendered insolvent by reason of such incurrence;
•was engaged in a business or transaction for which the guarantor’s remaining assets constituted unreasonably small capital; or
•intended to incur, or believed that it would incur, debts beyond its ability to pay those debts as they mature.
The guarantees of the Guaranteed Enbridge Notes contain provisions to limit the maximum amount of liability that the Partnerships could incur without causing the incurrence of obligations under the guarantee to be a fraudulent conveyance or fraudulent transfer under US federal or state law.
Each of the Partnerships is entitled to a right of contribution from the other Partnership for 50% of all payments, damages and expenses incurred by that Partnership in discharging its obligations under the guarantees for the Guaranteed Enbridge Notes.
88
Under the terms of the guarantee agreement and applicable supplemental indentures, the guarantees of either of the Partnerships of any Guaranteed Enbridge Notes will be unconditionally released and discharged automatically upon the occurrence of any of the following events:
•any direct or indirect sale, exchange or transfer, whether by way of merger, sale or transfer of equity interests or otherwise, to any person that is not an affiliate of Enbridge, of any of Enbridge’s direct or indirect limited partnership of other equity interests in that Partnership as a result of which the Partnership ceases to be a consolidated subsidiary of Enbridge;
•the merger of that Partnership into Enbridge or the other Partnership or the liquidation and dissolution of that Partnership;
•the repayment in full or discharge or defeasance of those Guaranteed Enbridge Notes, as contemplated by the applicable indenture or guarantee agreement;
•with respect to EEP, the repayment in full or discharge or defeasance of each of the consenting EEP notes listed above;
•with respect to SEP, the repayment in full or discharge or defeasance of each of the consenting SEP notes listed above; or
•with respect to any series of Guaranteed Enbridge Notes, with the consent of holders of at least a majority of the outstanding principal amount of that series of Guaranteed Enbridge Notes.
The guarantee obligations of Enbridge will terminate with respect to any series of Guaranteed Partnership Notes if that series is discharged or defeased.
The Partnerships also guarantee the obligations of Enbridge under its existing credit facilities.
LEGAL AND OTHER UPDATES
LIQUIDS PIPELINES
Line 5 Easement (Bad River Band)
On July 23, 2019, the Bad River Band of the Lake Superior Tribe of Chippewa Indians (the Band) filed a complaint in the US District Court for the Western District of Wisconsin (the Court) over our Line 5 pipeline and right-of-way across the Bad River Reservation (the Reservation). Only a small portion of the total easements across 12 miles of the Reservation are at issue. The Band alleges that our continued use of Line 5 to transport crude oil and related liquids across the Reservation is a public nuisance under federal and state law and that the pipeline is in trespass on certain tracts of land in which the Band possesses ownership interests. The complaint seeks an Order prohibiting us from using Line 5 to transport crude oil and related liquids across the Reservation and requiring removal of the pipeline from the Reservation. Subsequently amended versions of the complaint also seek recovery of profits-based damages based on an unjust enrichment theory. Enbridge has responded to each claim in the initial and amended complaints with an answer, defenses and counterclaims.
On August 29, 2022, the Government of Canada released a statement formally invoking the dispute settlement provisions of the 1977 Transit Pipelines Treaty in respect of this litigation; reiterating its concerns about the uninterrupted transmission of hydrocarbons through Line 5. On September 7, 2022, the Court issued a decision on cross-motions for summary judgment. The Court determined that the Band's nuisance claim raised factual issues that could not be resolved on summary judgment. The Court further determined that Enbridge is in trespass on 12 parcels on the Reservation and that the Band is entitled to some measure of profits-based damages and to an injunction, with the level of damages and scope of the injunction to be determined at trial, which occurred October 24 through November 1, 2022.
On May 9, 2023, the Band filed an Emergency Motion for Injunctive Relief asking the Court to require Enbridge to purge and shutdown Line 5 on the Reservation due to significant erosion at the Meander. Enbridge responded and a hearing was held on May 18, 2023 in front of Judge Conley who indicated that he did not find the Band had proven imminence but his final ruling on all issues would be provided soon.
89
On June 26, 2023, the Court issued its Final Order ruling that (1) Enbridge shall adopt and implement its 2022 Monitoring and Shutdown Plan with the Court's modifications by July 5, 2023; (2) Enbridge owes the Band $5,151,668 for past trespass on the 12 allotted parcels; (3) Enbridge must continue to pay money on a quarterly basis using the formula set in its Order as long as Line 5 operates in trespass on the 12 allotted parcels (approximately $400,000 per year); (4) Enbridge must cease operation of Line 5 on any parcel within the Band's tribal territory without a valid right of way by June 16, 2026 and thereafter arrange prompt, reasonable remediation at those sites; and (5) The Court declined to allow for the Relocation to be completed prior to having to cease operations. The Final Judgment was entered on June 29, 2023. Enbridge filed its Notice of Appeal on June 30, 2023 and the Band filed its Notice of Cross Appeal on July 27, 2023. On December 12, 2023, the 7th Circuit requested the US to file a brief in this appeal as amicus curiae to address the effect of the Agreement Between the US and Canada Concerning Transit Pipelines, 28 U.S.T. 7449 (1977), and any other issues that the US believes to be material. Briefing by the parties was complete on December 15, 2023. Oral argument is scheduled in February 2024, and we anticipate a decision in 2024.
Michigan Line 5 Dual Pipelines - Straits of Mackinac Easement
In 2019, the Michigan Attorney General (AG) filed a complaint in the Michigan Ingham County Circuit Court (the Circuit Court) that requests the Circuit Court to declare the easement granted in 1953 that we have for the operation of Line 5 in the Straits of Mackinac (the Straits) to be invalid and to prohibit continued operation of Line 5 in the Straits. On December 15, 2021, Enbridge removed the case to the US District Court in the Western District of Michigan (US District Court), where it was assigned to Judge Janet T. Neff. The removal of the AG's case to federal court followed a November 16, 2021 ruling which held that the similar (and now dismissed) 2020 lawsuit brought by the Governor of Michigan to force Line 5's shutdown raised important federal issues that should be heard in federal court. On December 21, 2021, the AG made a request to file a motion to remand the 2019 case, which the US District Court allowed on January 5, 2022. However, after full briefing, on August 18, 2022, Judge Neff denied the AG's motion to remand. On August 30, 2022, the AG filed a motion to certify the August 18 Order to pursue an appeal on the jurisdictional issue, which Enbridge opposed. On February 21, 2023, that motion was granted and shortly after, on March 2, 2023, the AG filed her Petition for Permission to Appeal in the 6th Circuit Court of Appeals (6th Circuit).
On July 21, 2023, the 6th Circuit granted the AG's Petition for Permission to appeal the US District Court's August 18 Order denying remand to state court. The 6th Circuit's briefing was completed by the end of 2023 and oral argument has been scheduled for March 2024. We anticipate a decision in 2024.
Dakota Access Pipeline
We own an effective interest of 27.6% in the Bakken Pipeline System, which is inclusive of the Dakota Access Pipeline (DAPL). The Standing Rock Sioux Tribe and the Cheyenne River Sioux Tribe filed lawsuits in 2016 with the US Court for the District of Columbia (the District Court) contesting the lawfulness of the Army Corps easement for DAPL, including the adequacy of the Army Corps' environmental review and tribal consultation process. The Oglala Sioux and Yankton Sioux Tribes also filed lawsuits alleging similar claims in 2018.
On June 14, 2017, the District Court found the Army Corps' environmental review to be deficient and ordered the Army Corps to conduct further study concerning spill risks from DAPL.
On March 25, 2020, in response to amended complaints from the Tribes, the District Court found that the Army Corps' subsequent environmental review completed in August 2018 was also deficient and ordered the Army Corps to prepare an Environmental Impact Statement (EIS) to address unresolved controversy pertaining to potential spill impacts resulting from DAPL. On July 6, 2020, the District Court issued an order vacating the Army Corps' easement for DAPL and ordering that the pipeline be shut down by August 5, 2020. On that day, the US Court of Appeals for the District of Columbia Circuit stayed the District Court's July 6 order to shut down and empty the pipeline.
90
On January 26, 2021, the US Court of Appeals affirmed the District Court's decision, holding that the Army Corps is required to prepare an EIS and that the Army Corps' easement for DAPL is vacated. The US Supreme Court subsequently denied the request of Dakota Access, LLC to review the decision that an EIS is required. The US Court of Appeals also determined that, absent an injunction proceeding, the District Court could not order DAPL's operations to cease. While not an issue before, the US Court of Appeals also recognized that the Army Corps could consider whether to allow DAPL to continue to operate in the absence of an easement.
The Army Corps earlier indicated that it did not intend to exercise its authority to bar DAPL's continued operation, notwithstanding the absence of an easement.
On September 8, 2023, the Army Corps issued its draft EIS, which assesses the impacts of DAPL under five alternative scenarios: denying the easement removing the pipeline; denying the easement and leaving the pipeline in place; granting the easement with the prior conditions (which allow for the ongoing operation, maintenance and ultimate removal of the pipeline and its related facilities); granting the easement with some new safety conditions; and rerouting the pipeline. The Army Corps did not identify a preferred alternative. The public comment period that commenced on the issuance of the draft EIS closed on December 13, 2023. The pipeline will remain operational while the environmental review process continues.
GAS TRANSMISSION AND MIDSTREAM
Aux Sable
The previously reported claim filed against Aux Sable by a counterparty to an NGL supply agreement was settled and discontinued during the fourth quarter of 2023. A provision was recognized for this claim in the third quarter of 2023.
OTHER LITIGATION
We and our subsidiaries are subject to various other legal and regulatory actions and proceedings which arise in the normal course of business, including interventions in regulatory proceedings and challenges to regulatory approvals and permits. While the final outcome of such actions and proceedings cannot be predicted with certainty, management believes that the resolution of such actions and proceedings will not have a material impact on our consolidated financial position or results of operations.
TAX MATTERS
We and our subsidiaries maintain tax liabilities related to uncertain tax positions. While fully supportable in our view, these tax positions, if challenged by tax authorities, may not be fully sustained on review.
CRITICAL ACCOUNTING POLICIES AND ESTIMATES
Our consolidated financial statements are prepared in accordance with US GAAP, which requires management to make estimates, judgments and assumptions that affect the amounts reported in our consolidated financial statements and accompanying notes. In making judgments and estimates, management relies on external information and observable conditions, where possible, supplemented by internal analysis as required. We believe our most critical accounting policies and estimates discussed below have an impact across the various segments of our business.
91
BUSINESS COMBINATIONS
We apply the provisions of Accounting Standards Codification 805 Business Combinations in accounting for our acquisitions. The acquired assets and assumed liabilities are recorded at their estimated fair values at the date of acquisition. Goodwill represents the excess of the purchase price over the fair value of net identifiable assets. While we use our best estimates and assumptions to accurately value assets acquired and liabilities assumed at the date of acquisition, as well as any contingent consideration, our estimates are inherently uncertain and subject to refinement. During the measurement period, which may be up to one year from the acquisition date, we record adjustments to the assets acquired and liabilities assumed with a corresponding offset to goodwill. Upon conclusion of the measurement period, or the final determination of values for assets acquired or liabilities assumed, whichever comes first, any subsequent adjustments are recorded to our Consolidated Statements of Earnings.
Accounting for business combinations requires significant judgment, estimates and assumptions at the acquisition date. In developing estimates of fair values at the acquisition date, we utilize a variety of factors including market data, historical and future expected cash flows, growth rates and discount rates. The subjective nature of our assumptions increases the risk associated with estimates surrounding the projected performance of the acquired entity.
GOODWILL IMPAIRMENT
Goodwill represents the excess of the purchase price over the fair value of net identifiable assets upon acquisition of a business. The carrying value of goodwill, which is not amortized, is assessed for impairment annually or more frequently if events or changes in circumstances arise that suggest the carrying value of goodwill may be impaired. We perform our annual review of the goodwill balance on April 1.
We perform our annual review for impairment at the reporting unit level, which is identified by assessing whether the components of our operating segments constitute businesses for which discrete information is available, whether segment management regularly reviews the operating results of those components, and whether the economic and regulatory characteristics are similar. Our reporting units are Liquids Pipelines, Gas Transmission, Gas Distribution and Storage, and Renewable Power Generation. The Renewable Power Generation reporting unit had goodwill beginning in the third quarter of 2022.
We have the option to first assess qualitative factors to determine whether it is necessary to perform the quantitative goodwill impairment assessment. When performing a qualitative assessment, we determine the drivers of fair value for each reporting unit and evaluate whether those drivers have been positively or negatively affected by relevant events and circumstances since the last fair value assessment. Our evaluation includes, but is not limited to, the assessment of macroeconomic trends, changes to regulatory environments, capital accessibility, operating income trends, and changes to industry conditions. Based on our assessment of qualitative factors, if we determine it is more likely than not that the fair value of the reporting unit is less than its carrying amount, a quantitative goodwill impairment assessment is performed.
The quantitative goodwill impairment assessment involves determining the fair value of our reporting units and comparing those values to the carrying value of each reporting unit. If the carrying value of a reporting unit, including allocated goodwill, exceeds its fair value, goodwill impairment is measured at the amount by which the reporting unit's carrying value exceeds its fair value. This amount should not exceed the carrying amount of goodwill. The fair value of our reporting units is estimated using a discounted cash flow technique. The determination of fair value using the discounted cash flow technique requires the use of estimates and assumptions related to discount rates, projected operating income, expected future capital expenditures and working capital levels, as well as terminal value growth rates for the Liquids Pipelines, Gas Transmission, and Renewable Power Generation reporting units, and projected regulatory rate base and rate base multiple for the Gas Distribution and Storage reporting unit.
92
The allocation of goodwill to held-for-sale and disposed businesses is based on the relative fair value of businesses included in the relevant reporting unit.
On April 1, 2023, we performed our annual goodwill impairment assessment which consisted of a qualitative assessment for the Liquids Pipelines, Gas Transmission, Gas Distribution and Storage, and Renewable Power Generation reporting units and did not identify impairment indicators. Due to an impairment recorded in 2022 for the Gas Transmission reporting unit and the OEB decision on Phase 1 for Enbridge Gas, we performed a quantitative assessment for the Gas Transmission and Gas Distribution and Storage reporting units as at December 1, 2023, which did not result in the recognition of an impairment charge for either reporting unit. Also, we did not identify any indicators of goodwill impairment during the remainder of 2023.
The Gas Transmission reporting unit remains at risk as the quantitative test performed resulted in the fair value exceeding carrying value by less than 10% and once the Alliance Pipeline and Aux Sable disposition closes in 2024, the fair value of the reporting unit will decrease.
ASSET IMPAIRMENT
We evaluate the recoverability of our property, plant and equipment when events or circumstances, such as economic obsolescence, business climate, legal or regulatory changes, or other factors, indicate that we may not recover the carrying amount of our assets. We regularly monitor our businesses, the market and business environments to identify indicators that could suggest an asset may not be recoverable. If it is determined that the carrying value of an asset exceeds its expected undiscounted cash flows, we will assess the fair value of the asset. An impairment loss is recognized when the carrying amount of the asset exceeds its fair value.
With respect to equity method investments, we assess at each balance sheet date whether there is objective evidence that the investment is impaired by completing a qualitative or quantitative analysis of factors impacting the investment. If there is objective evidence of impairment, we determine whether the decline below carrying value is other-than-temporary. If the decline is determined to be other-than-temporary, an impairment charge is recorded in earnings with an offsetting reduction to the carrying value of the investment.
Asset fair value is determined using present value techniques. The determination of fair value using present value techniques requires the use of projections and assumptions regarding future cash flows and weighted average cost of capital. Any changes to these projections and assumptions could result in revisions to the evaluation of the recoverability of the asset and the recognition of an impairment loss in the Consolidated Statements of Earnings.
ASSETS HELD FOR SALE
We classify assets as held for sale when management commits to a formal plan to actively market an asset or a group of assets and when management believes it is probable the sale of the assets will occur within one year. We measure assets classified as held for sale at the lower of their carrying value and their estimated fair value less costs to sell.
93
REGULATORY ACCOUNTING
Certain parts of our businesses are subject to regulation by various authorities including, but not limited to, the CER, the FERC, the Alberta Energy Regulator, the BC Energy Regulator, the OEB and the Québec Régie de l'énergie. Regulatory bodies exercise statutory authority over matters such as construction, rates and ratemaking, and agreements with customers. To recognize the economic effects of the actions of the regulator, the timing of recognition of certain revenues and expenses in these operations may differ from that otherwise expected under US GAAP for non-rate-regulated entities.
Key determinants in the ratemaking process are:
•costs of providing service, including operating costs, capital invested, depreciation expense and taxes;
•allowed rate of return, including the equity component of the capital structure and related income taxes;
•interest costs on the debt component of the capital structure; and
•contract and volume throughput assumptions.
The allowed rate of return is determined in accordance with the applicable regulatory model and may impact our profitability. The rates for a number of our projects are based on a cost-of-service recovery model that follows the regulators' authoritative guidance. Under the cost-of-service tolling methodology, we calculate tolls based on forecast volumes and cost. A difference between forecast and actual results causes an over- or under-recovery in any given year. Regulatory assets represent amounts that are expected to be recovered from customers in future periods through rates. Regulatory liabilities represent amounts that are expected to be refunded to customers in future periods through rates, amounts collected from customers in advance of costs being incurred, or to be paid to cover future abandonment costs in relation to the CER's Land Matters Consultation Initiative (LMCI) and for future removal and site restoration costs as approved by the regulator. If there are changes in our assessment of the probability of recovery for a regulatory asset, we reduce its carrying amount to the balance that we expect to recover from customers in future periods through rates. If a regulator later excludes from allowable costs all or a part of costs that were capitalized as a regulatory asset, we reduce the carrying amount of the asset by the excluded amounts.
The recognition of regulatory assets and liabilities is based on the actions, or expected future actions, of the regulator. To the extent that the regulator's actions differ from our expectations, the timing and amount of recovery or settlement of regulatory balances could differ significantly from those recorded. In the absence of rate regulation, we would generally not recognize regulatory assets or liabilities and the earnings impact would be recorded in the period the expenses are incurred or revenues are earned. A regulatory asset or liability is recognized in respect of deferred income taxes when it is expected the amounts will be recovered or settled through future regulator-approved rates. During the fourth quarter of 2023, Southern Lights Pipeline completed an open season to negotiate new transportation service agreements effective 2025. We do not expect to renew the agreements under a cost-of-service toll methodology, therefore Southern Lights Pipeline is no longer subject to rate-regulated accounting. As a result, the related regulatory liabilities, regulatory tax assets and associated regulatory deferred tax liabilities were derecognized.
As at December 31, 2023 and 2022, our regulatory assets totaled $5.7 billion and $6.5 billion, respectively, and regulatory liabilities totaled $3.8 billion.
94
DEPRECIATION
Depreciation of property, plant and equipment, our largest asset with a net book value at December 31, 2023 and 2022, of $104.6 billion and $104.5 billion, respectively, is charged in accordance with two primary methods. For distinct assets, depreciation is generally provided on a straight-line basis over the estimated useful lives of the assets commencing when the asset is placed in service. For largely homogeneous groups of assets with comparable useful lives, the pool method of accounting is followed whereby similar assets are grouped and depreciated as a pool. When group assets are retired or otherwise disposed of, gains and losses are not reflected in earnings but are booked as an adjustment to accumulated depreciation.
When it is determined that the estimated service life of an asset no longer reflects the expected remaining period of benefit, prospective changes are made to the estimated service life. Estimates of useful lives are based on third-party engineering studies, experience and/or industry practice. There are a number of assumptions inherent in estimating the service lives of our assets including the level of development, exploration, drilling, reserves and production of crude oil and natural gas in the supply areas served by our pipelines, as well as the demand for crude oil and natural gas and the integrity of our systems. Changes in these assumptions could result in adjustments to the estimated service lives, which could result in material changes to depreciation expense in future periods in any of our business segments. For certain rate-regulated operations, depreciation rates are approved by the regulator and the regulator may require periodic studies or technical updates on useful lives which may change depreciation rates.
PENSION AND OTHER POSTRETIREMENT BENEFITS
We use certain assumptions relating to the calculation of defined benefit pension and other postretirement liabilities and net periodic benefit costs. These assumptions comprise management's best estimates of expected return on plan assets, future salary levels, other cost escalations, retirement ages of employees, and other actuarial factors including discount rates and mortality. We determine discount rates by reference to rates of high-quality long-term corporate bonds with maturities that approximate the timing of future payments anticipated to be made under each of the respective plans. The expected return on plan assets is determined using market-related values and assumptions on the asset mix consistent with the investment policy relating to the assets and their projected returns. The assumptions are reviewed annually by our independent actuaries. Actual results that differ from results based on assumptions are amortized over future periods and, therefore, could materially affect the expense recognized and the recorded obligation in future periods.
The following sensitivity analysis identifies the impact on the consolidated financial statements for the year ended December 31, 2023 of a 0.5% change in key pension and other postretirement benefits (OPEB) obligation assumptions:
| Canada | United States | ||||||||||||||||||||||
| Obligation | Expense | Obligation | Expense | ||||||||||||||||||||
| (millions of Canadian dollars) | |||||||||||||||||||||||
| Pension | |||||||||||||||||||||||
| Decrease in discount rate | 297 | 12 | 52 | 3 | |||||||||||||||||||
| Decrease in expected return on assets | — | 21 | — | 5 | |||||||||||||||||||
| Decrease in rate of salary increase | (60) | (5) | (5) | (1) | |||||||||||||||||||
| OPEB | |||||||||||||||||||||||
| Decrease in discount rate | 15 | 1 | 5 | — | |||||||||||||||||||
| Decrease in expected return on assets | N/A | N/A | — | 1 | |||||||||||||||||||
95
CONTINGENT LIABILITIES
Provisions for claims filed against us are determined on a case-by-case basis. Case estimates are reviewed on a regular basis and are updated as new information is received. The process of evaluating claims involves the use of estimates and a high degree of management judgment. Claims outstanding, the final determination of which could have a material impact on our financial results and certain subsidiaries and investments, are detailed in Legal and Other Updates and Part II. Item 8. Financial Statements and Supplementary Data - Note 30. Commitments and Contingencies. In addition, any unasserted claims that later may become evident could have a material impact on our financial results and certain subsidiaries and investments.
ASSET RETIREMENT OBLIGATIONS
Asset retirement obligations (ARO) associated with the retirement of long-lived assets are measured at fair value and recognized as Other current liabilities or Other long-term liabilities in the period in which they can be reasonably determined. Fair value approximates the cost a third party would charge to perform the tasks necessary to retire such assets and is recognized at the present value of expected future cash flows. The discount rates used to estimate the present value of expected future cash flows for the years ended December 31, 2023 and 2022 ranged from 1.5% to 9.0%. ARO is added to the carrying value of the associated asset and depreciated over the asset's useful life. The corresponding liability is accreted over time through charges to earnings and is reduced by actual costs of decommissioning and reclamation. Our estimates of retirement costs could change as a result of changes in cost estimates and regulatory requirements. Currently, for the majority of our assets, there is insufficient data or information to reasonably determine the timing of settlement for estimating the fair value of the ARO. In these cases, the fair value of ARO is considered indeterminate for accounting purposes, as there is no data or information that can be derived from past practice, industry practice or the estimated economic life of the asset.
In 2009, the CER issued a decision related to the LMCI, which required holders of an authorization to operate a pipeline under the CER Act to file a proposed process and mechanism to set aside funds to pay for future abandonment costs in respect of the sites in Canada used for the operation of a pipeline. The CER's decision stated that, while pipeline companies are ultimately responsible for the full costs of abandoning pipelines, abandonment costs are a legitimate cost of providing service and are recoverable from the users of the pipeline upon approval by the CER. Following the CER's final approval of the collection mechanism and the set-aside mechanism for LMCI, we began collecting and setting aside funds to cover future abandonment costs effective January 1, 2015. The funds collected are held in trusts in accordance with the CER decision. The funds collected from shippers are reported within Transportation and other services revenues and Restricted long-term investments. Concurrently, we reflect the future abandonment cost as an increase to Operating and administrative expense and Other long-term liabilities.
CHANGES IN ACCOUNTING POLICIES
Refer to Part II. Item 8. Financial Statements and Supplementary Data - Note 3. Changes in Accounting Policies.
ITEM 7A. QUANTITATIVE AND QUALITATIVE DISCLOSURES ABOUT MARKET RISK
Our earnings, cash flows and other comprehensive income (OCI) are subject to movements in foreign exchange rates, interest rates, commodity prices and our share price.
The following summarizes the types of market risks to which we are exposed and the risk management instruments used to mitigate them. We use a combination of qualifying and non-qualifying derivative instruments to manage the risks noted below.
96
Foreign Exchange Risk
We generate certain revenues, incur expenses and hold a number of investments and subsidiaries that are denominated in currencies other than Canadian dollars. As a result, our earnings, cash flows and OCI are exposed to fluctuations resulting from foreign exchange rate variability.
We employ financial derivative instruments to hedge foreign currency denominated earnings exposure. A combination of qualifying and non-qualifying derivative instruments is used to hedge anticipated foreign currency denominated revenues and expenses and to manage variability in cash flows. We hedge certain net investments in US dollar-denominated investments and subsidiaries using foreign currency derivatives and US dollar-denominated debt.
Interest Rate Risk
Our earnings and cash flows are exposed to short-term interest rate variability due to the regular repricing of our variable rate debt, primarily commercial paper. We monitor our debt portfolio mix of fixed and variable rate debt instruments to manage a consolidated portfolio of floating rate debt within the Board of Directors' approved policy limit of a maximum of 30% of floating rate debt as a percentage of total debt outstanding. We primarily use qualifying derivative instruments to manage interest rate risk. Pay fixed-receive floating interest rate swaps may be used to hedge against the effect of future interest rate movements. We have implemented a hedging program to partially mitigate the impact of short-term interest rate volatility on interest expense via the execution of floating-to-fixed interest rate swaps and costless collars. These swaps have an average fixed rate of 4.1%.
Our earnings and cash flows are also exposed to variability in longer term interest rates ahead of anticipated fixed rate term debt issuances. Forward starting interest rate swaps are used to hedge against the effect of future interest rate movements. We have established a program including some of our subsidiaries to partially mitigate our exposure to long-term interest rate variability on forecasted term debt issuances via execution of floating-to-fixed interest rate swaps with an average swap rate of 3.5%.
Commodity Price Risk
Our earnings, cash flows and OCI are exposed to changes in commodity prices as a result of our ownership interests in certain assets and investments, as well as through the activities of our energy services subsidiaries. These commodities include natural gas, crude oil, power and NGL. We employ financial and physical derivative instruments to fix a portion of the variable price exposures that arise from physical transactions involving these commodities. We use primarily non-qualifying derivative instruments to manage commodity price risk.
Equity Price Risk
Equity price risk is the risk of earnings fluctuations due to changes in our share price. We have exposure to our own common share price through the issuance of various forms of stock-based compensation, which affect earnings through the revaluation of outstanding units every period. We use equity derivatives to manage the earnings volatility derived from one form of stock-based compensation, restricted stock units. We use a combination of qualifying and non-qualifying derivative instruments to manage equity price risk.
Market Risk Management
We have a Risk Policy to minimize the likelihood that adverse cash flow impacts arising from movements in market prices will exceed a defined risk tolerance. We identify and measure all material market risks including commodity price risks, interest rate risks, foreign exchange risk and equity price risk using a standardized measurement methodology. Our market risk metric consolidates the exposure after accounting for the impact of offsetting risks and limits the consolidated cash flow volatility arising from market related risks to an acceptable approved risk tolerance threshold. Our market risk metric is Cash Flow at Risk (CFaR).
97
CFaR is a statistically derived measurement used to measure the maximum cash flow loss that could potentially result from adverse market price movements over a one month holding period for price sensitive non-derivative exposures and for derivative instruments we hold or issue as recorded in the Consolidated Statements of Financial Position as at December 31, 2023. CFaR assumes that no further mitigating actions are taken to hedge or otherwise minimize exposures and the selection of a one month holding period reflects the mix of price risk sensitive assets at Enbridge. As a practical matter, a large portion of Enbridge’s exposure could be hedged or unwound in a much shorter period if required to mitigate the risks.
The consolidated CFaR policy limit for Enbridge is 3.5% of its forward 12 month normalized cash flow. At December 31, 2023 and 2022 CFaR was $100 million and $144 million or 0.9% and 1.3%, respectively, of estimated 12 month forward normalized cash flow.
LIQUIDITY RISK
Liquidity risk is the risk that we will not be able to meet our financial obligations, including commitments and guarantees, as they become due. In order to mitigate this risk, we forecast cash requirements over a 12 month rolling time period to determine whether sufficient funds will be available and maintain substantial capacity under our committed bank lines of credit to address any contingencies. Our primary sources of liquidity and capital resources are funds generated from operations, the issuance of commercial paper and draws under committed credit facilities and long-term debt, which includes debentures and medium-term notes. Our shelf prospectuses with securities regulators enable ready access to either the Canadian or US public capital markets, subject to market conditions. In addition, we maintain sufficient liquidity through committed credit facilities with a diversified group of banks and institutions which, if necessary, enables us to fund all anticipated requirements for approximately one year without accessing the capital markets. We were in compliance with all the terms and conditions of our committed credit facility agreements and term debt indentures as at December 31, 2023. As a result, all credit facilities are available to us and the banks are obligated to fund us under the terms of the facilities. We also identify a variety of other potential sources of debt and equity funding alternatives, including reinstatement of our dividend reinvestment and share purchase plan or at-the-market equity issuances.
CREDIT RISK
Entering into derivative instruments may result in exposure to credit risk from the possibility that a counterparty will default on its contractual obligations. In order to mitigate this risk, we enter into risk management transactions primarily with institutions that possess strong investment grade credit ratings. Credit risk relating to derivative counterparties is mitigated through the maintenance and monitoring of credit exposure limits and contractual requirements, netting arrangements and ongoing monitoring of counterparty credit exposure using external credit rating services and other analytical tools.
We generally have a policy of entering into individual International Swaps and Derivatives Association, Inc. agreements, or other similar derivative agreements, with the majority of our financial derivative counterparties. These agreements provide for the net settlement of derivative instruments outstanding with specific counterparties in the event of bankruptcy or other significant credit events and reduce our credit risk exposure on financial derivative asset positions outstanding with the counterparties in those circumstances.
FAIR VALUE MEASUREMENTS
Our financial assets and liabilities measured at fair value on a recurring basis include derivatives and other financial instruments. We also disclose the fair value of other financial instruments not measured at fair value. The fair value of financial instruments reflects our best estimates of market value based on generally accepted valuation techniques or models and is supported by observable market prices and rates. When such values are not available, we use discounted cash flow analysis from applicable yield curves based on observable market inputs to estimate fair value.
98
ITEM 8. FINANCIAL STATEMENTS AND SUPPLEMENTARY DATA
Report of Independent Registered Public Accounting Firm
To the Shareholders and Board of Directors of Enbridge Inc.
Opinions on the Financial Statements and Internal Control over Financial Reporting
We have audited the accompanying consolidated statements of financial position of Enbridge Inc. and its subsidiaries (together, the Company) as of December 31, 2023 and 2022, and the related consolidated statements of earnings, comprehensive income, changes in equity and cash flows for each of the three years in the period ended December 31, 2023, including the related notes (collectively referred to as the consolidated financial statements). We also have audited the Company’s internal control over financial reporting as of December 31, 2023, based on criteria established in Internal Control – Integrated Framework (2013) issued by the Committee of Sponsoring Organizations of the Treadway Commission (COSO).
In our opinion, the consolidated financial statements referred to above present fairly, in all material respects, the financial position of the Company as of December 31, 2023 and 2022, and the results of its operations and its cash flows for each of the three years in the period ended December 31, 2023 in conformity with accounting principles generally accepted in the United States of America. Also in our opinion, the Company maintained, in all material respects, effective internal control over financial reporting as of December 31, 2023, based on criteria established in Internal Control – Integrated Framework (2013) issued by the COSO.
Basis for Opinions
The Company’s management is responsible for these consolidated financial statements, for maintaining effective internal control over financial reporting, and for its assessment of the effectiveness of internal control over financial reporting, included in Management’s Annual Report on Internal Control over Financial Reporting appearing under Item 9A. Our responsibility is to express opinions on the Company’s consolidated financial statements and on the Company’s internal control over financial reporting based on our audits. We are a public accounting firm registered with the Public Company Accounting Oversight Board (United States) (PCAOB) and are required to be independent with respect to the Company in accordance with the U.S. federal securities laws and the applicable rules and regulations of the Securities and Exchange Commission and the PCAOB.
We conducted our audits in accordance with the standards of the PCAOB. Those standards require that we plan and perform the audits to obtain reasonable assurance about whether the consolidated financial statements are free of material misstatement, whether due to error or fraud, and whether effective internal control over financial reporting was maintained in all material respects.
Our audits of the consolidated financial statements included performing procedures to assess the risks of material misstatement of the consolidated financial statements, whether due to error or fraud, and performing procedures that respond to those risks. Such procedures included examining, on a test basis, evidence regarding the amounts and disclosures in the consolidated financial statements. Our audits also included evaluating the accounting principles used and significant estimates made by management, as well as evaluating the overall presentation of the consolidated financial statements. Our audit of internal control over financial reporting included obtaining an understanding of internal control over financial reporting, assessing the risk that a material weakness exists, and testing and evaluating the design and operating effectiveness of internal control based on the assessed risk. Our audits also included performing such other procedures as we considered necessary in the circumstances. We believe that our audits provide a reasonable basis for our opinions.
99
Definition and Limitations of Internal Control over Financial Reporting
A company’s internal control over financial reporting is a process designed to provide reasonable assurance regarding the reliability of financial reporting and the preparation of financial statements for external purposes in accordance with generally accepted accounting principles. A company’s internal control over financial reporting includes those policies and procedures that (i) pertain to the maintenance of records that, in reasonable detail, accurately and fairly reflect the transactions and dispositions of the assets of the company; (ii) provide reasonable assurance that transactions are recorded as necessary to permit preparation of financial statements in accordance with generally accepted accounting principles, and that receipts and expenditures of the company are being made only in accordance with authorizations of management and directors of the company; and (iii) provide reasonable assurance regarding prevention or timely detection of unauthorized acquisition, use, or disposition of the company’s assets that could have a material effect on the financial statements.
Because of its inherent limitations, internal control over financial reporting may not prevent or detect misstatements. Also, projections of any evaluation of effectiveness to future periods are subject to the risk that controls may become inadequate because of changes in conditions, or that the degree of compliance with the policies or procedures may deteriorate.
Critical Audit Matters
The critical audit matter communicated below is a matter arising from the current period audit of the consolidated financial statements that was communicated or required to be communicated to the audit committee and that (i) relates to accounts or disclosures that are material to the consolidated financial statements and (ii) involved our especially challenging, subjective, or complex judgments. The communication of critical audit matters does not alter in any way our opinion on the consolidated financial statements, taken as a whole, and we are not, by communicating the critical audit matter below, providing a separate opinion on the critical audit matter or on the accounts or disclosures to which it relates.
Goodwill Impairment Assessment
As described in Notes 2 and 15 to the consolidated financial statements, the Company’s goodwill balance was $31,848 million at December 31, 2023. As disclosed by management, an annual goodwill impairment assessment is performed at the reporting unit level as of April 1 of each year, or more frequently if events or circumstances indicate that the carrying value of goodwill may be impaired. Management has the option to first assess qualitative factors to determine whether it is necessary to perform the quantitative goodwill impairment assessment. In making the qualitative assessment, management considers macroeconomic trends, changes to regulatory environments, capital accessibility, operating income trends and changes to industry conditions. The quantitative goodwill impairment assessment involves determining the fair value of the Company’s reporting units and comparing those values to the carrying value of each reporting unit, including goodwill. Fair value is estimated using a discounted cash flow technique. The determination of fair value using the discounted cash flow technique requires the use of estimates and assumptions related to discount rates, projected operating income, expected future capital expenditures and working capital levels, as well as terminal value growth rates for the Liquids Pipelines, Gas Transmission and Midstream (Gas Transmission), and Renewable Power Generation reporting units, and projected regulatory rate base and rate base multiple for the Gas Distribution and Storage (Gas Distribution) reporting unit. Management performed a qualitative goodwill impairment assessment as of April 1, 2023 for the following reporting units: Liquids Pipelines, Gas Transmission, Gas Distribution and Renewable Power Generation and did not identify impairment indicators. Due to the Ontario Energy Board decision on Phase 1 for Enbridge Gas Inc., announced in December 2023, management performed a quantitative assessment for the Gas Distribution reporting unit as of December 1, 2023. In addition, management performed a quantitative assessment for the Gas Transmission reporting unit as of December 1, 2023. Neither assessment resulted in the recognition of an impairment charge of either reporting unit.
100
The principal considerations for our determination that performing procedures relating to the goodwill impairment assessment is a critical audit matter are the significant judgments required by management when developing such significant assumptions as discount rates, projected operating income, expected future capital expenditures, terminal value growth rates, projected regulatory rate base and rate base multiple used to estimate the fair value of the Gas Transmission and Gas Distribution reporting units, as applicable, as of December 1, 2023. This led to a high degree of auditor judgment, effort and subjectivity in performing procedures to evaluate the reasonableness of management’s significant assumptions used in the quantitative assessment. In addition, the audit effort involved the use of professionals with specialized skill and knowledge.
Addressing the matter involved performing procedures and evaluating audit evidence in connection with forming our overall opinion on the consolidated financial statements.These procedures included testing the effectiveness of controls relating to management’s quantitative goodwill impairment assessment, including controls over the determination of the fair value estimates of the Company’s reporting units. These procedures also included, among others, testing management’s process for developing the fair value estimates of the Gas Transmission and Gas Distribution reporting units.
Testing management’s process for developing the fair value estimates included evaluating the appropriateness of the discounted cash flow models; testing the completeness and accuracy of underlying data used in the models; and evaluating the reasonableness of significant assumptions used by management in determining the fair value estimates, including discount rates, projected operating income, expected future capital expenditures, projected regulatory rate base and rate base multiple and terminal value growth rates. Assessing the reasonableness of projected operating income, expected future capital expenditures and the projected regulatory rate base involved evaluating whether these significant assumptions were reasonable considering the current and past performance of the Company’s reporting units, external industry data and evidence obtained in other areas of the audit, as applicable. Professionals with specialized skill and knowledge were used to assist in evaluating the appropriateness of management’s discounted cash flow models and evaluating the reasonableness of significant assumptions used in the models, specifically discount rates, terminal value growth rates and the rate base multiple.
/s/PricewaterhouseCoopers LLP
Chartered Professional Accountants
Calgary, Canada
February 9, 2024
We have served as the Company's auditor since 1949.
101
ENBRIDGE INC.
CONSOLIDATED STATEMENTS OF EARNINGS
| Year ended December 31, | 2023 | 2022 | 2021 | ||||||||
| (millions of Canadian dollars, except per share amounts) | |||||||||||
| Operating revenues | |||||||||||
| Commodity sales | 18,981 | 29,150 | 26,873 | ||||||||
| Gas distribution sales | 4,839 | 5,653 | 4,026 | ||||||||
| Transportation and other services | 19,829 | 18,506 | 16,172 | ||||||||
Total operating revenues (Note 4) | 43,649 | 53,309 | 47,071 | ||||||||
| Operating expenses | |||||||||||
| Commodity costs | 18,526 | 28,942 | 26,608 | ||||||||
| Gas distribution costs | 2,840 | 3,647 | 2,094 | ||||||||
| Operating and administrative | 8,600 | 8,219 | 6,712 | ||||||||
| Depreciation and amortization | 4,613 | 4,317 | 3,852 | ||||||||
| Impairment of long-lived assets | 419 | 541 | — | ||||||||
Impairment of goodwill (Note 15) | — | 2,465 | — | ||||||||
| Total operating expenses | 34,998 | 48,131 | 39,266 | ||||||||
| Operating income | 8,651 | 5,178 | 7,805 | ||||||||
Income from equity investments (Note 13) | 1,816 | 2,056 | 1,600 | ||||||||
Gain on joint venture merger transaction (Note 13) | — | 1,076 | — | ||||||||
Other income/(expense) (Note 27) | 1,224 | (589) | 979 | ||||||||
Interest expense (Note 17) | (3,812) | (3,179) | (2,655) | ||||||||
| Earnings before income taxes | 7,879 | 4,542 | 7,729 | ||||||||
Income tax expense (Note 24) | (1,821) | (1,604) | (1,415) | ||||||||
| Earnings | 6,058 | 2,938 | 6,314 | ||||||||
| (Earnings)/loss attributable to noncontrolling interests | 133 | 65 | (125) | ||||||||
| Earnings attributable to controlling interests | 6,191 | 3,003 | 6,189 | ||||||||
| Preference share dividends | (352) | (414) | (373) | ||||||||
| Earnings attributable to common shareholders | 5,839 | 2,589 | 5,816 | ||||||||
Earnings per common share attributable to common shareholders (Note 6) | 2.84 | 1.28 | 2.87 | ||||||||
Diluted earnings per common share attributable to common shareholders (Note 6) | 2.84 | 1.28 | 2.87 | ||||||||
The accompanying notes are an integral part of these consolidated financial statements.
102
ENBRIDGE INC.
CONSOLIDATED STATEMENTS OF COMPREHENSIVE INCOME
| Year ended December 31, | 2023 | 2022 | 2021 | ||||||||
| (millions of Canadian dollars) | |||||||||||
| Earnings | 6,058 | 2,938 | 6,314 | ||||||||
| Other comprehensive income/(loss), net of tax | |||||||||||
| Change in unrealized gain on cash flow hedges | 220 | 847 | 162 | ||||||||
| Change in unrealized gain/(loss) on net investment hedges | 409 | (971) | 49 | ||||||||
| Other comprehensive income/(loss) from equity investees | 6 | (6) | (12) | ||||||||
| Excluded components of fair value hedges | 12 | (35) | (5) | ||||||||
| Reclassification to earnings of loss on cash flow hedges | 14 | 143 | 235 | ||||||||
| Reclassification to earnings of pension and other postretirement benefits (OPEB) amounts | (18) | (10) | 21 | ||||||||
| Reclassification to earnings of (gain)/loss on equity investees | — | 16 | (62) | ||||||||
| Actuarial gain/(loss) on pension and OPEB | (130) | 312 | 394 | ||||||||
| Foreign currency translation adjustments | (1,728) | 4,406 | (507) | ||||||||
| Other comprehensive income/(loss), net of tax | (1,215) | 4,702 | 275 | ||||||||
| Comprehensive income | 4,843 | 7,640 | 6,589 | ||||||||
| Comprehensive (income)/loss attributable to noncontrolling interests | 131 | (21) | (95) | ||||||||
| Comprehensive income attributable to controlling interests | 4,974 | 7,619 | 6,494 | ||||||||
| Preference share dividends | (352) | (414) | (373) | ||||||||
| Comprehensive income attributable to common shareholders | 4,622 | 7,205 | 6,121 | ||||||||
The accompanying notes are an integral part of these consolidated financial statements.
103
ENBRIDGE INC.
CONSOLIDATED STATEMENTS OF CHANGES IN EQUITY
| Year ended December 31, | 2023 | 2022 | 2021 | ||||||||
| (millions of Canadian dollars, except per share amounts) | |||||||||||
Preference shares (Note 20) | |||||||||||
| Balance at beginning of year | 6,818 | 7,747 | 7,747 | ||||||||
| Redemption of preference shares | — | (929) | — | ||||||||
| Balance at end of year | 6,818 | 6,818 | 7,747 | ||||||||
Common shares (Note 20) | |||||||||||
| Balance at beginning of year | 64,760 | 64,799 | 64,768 | ||||||||
| Shares issued, net of issue costs | 4,485 | — | — | ||||||||
| Shares issued on exercise of stock options | 3 | 53 | 31 | ||||||||
| Shares issued on vesting of restricted stock units (RSU), net of tax | 12 | — | — | ||||||||
| Share purchases at stated value | (80) | (88) | — | ||||||||
| Other | — | (4) | — | ||||||||
| Balance at end of year | 69,180 | 64,760 | 64,799 | ||||||||
| Additional paid-in capital | |||||||||||
| Balance at beginning of year | 275 | 365 | 277 | ||||||||
| Stock-based compensation | 71 | 36 | 28 | ||||||||
| Stock options exercised | (3) | (50) | (23) | ||||||||
| Vested RSUs | (20) | — | — | ||||||||
| Purchase of noncontrolling interest | (28) | (43) | — | ||||||||
| Change in reciprocal interest | — | — | 98 | ||||||||
| Other | (27) | (33) | (15) | ||||||||
| Balance at end of year | 268 | 275 | 365 | ||||||||
| Deficit | |||||||||||
| Balance at beginning of year | (15,486) | (10,989) | (9,995) | ||||||||
| Earnings attributable to controlling interests | 6,191 | 3,003 | 6,189 | ||||||||
| Preference share dividends | (352) | (414) | (373) | ||||||||
| Common share dividends declared | (7,423) | (7,023) | (6,818) | ||||||||
| Dividends paid to reciprocal shareholder | — | — | 8 | ||||||||
| Share purchases in excess of stated value | (45) | (63) | — | ||||||||
| Balance at end of year | (17,115) | (15,486) | (10,989) | ||||||||
Accumulated other comprehensive income/(loss) (Note 22) | |||||||||||
| Balance at beginning of year | 3,520 | (1,096) | (1,401) | ||||||||
| Other comprehensive income/(loss) attributable to common shareholders, net of tax | (1,217) | 4,616 | 305 | ||||||||
| Balance at end of year | 2,303 | 3,520 | (1,096) | ||||||||
| Reciprocal shareholding | |||||||||||
| Balance at beginning of year | — | — | (29) | ||||||||
| Change in reciprocal interest | — | — | 29 | ||||||||
| Balance at end of year | — | — | — | ||||||||
| Total Enbridge Inc. shareholders' equity | 61,454 | 59,887 | 60,826 | ||||||||
Noncontrolling interests (Note 19) | |||||||||||
| Balance at beginning of year | 3,511 | 2,542 | 2,996 | ||||||||
| Earnings/(loss) attributable to noncontrolling interests | (133) | (65) | 125 | ||||||||
| Other comprehensive income/(loss) attributable to noncontrolling interests, net of tax | |||||||||||
| Change in unrealized gain/(loss) on cash flow hedges | 35 | (28) | (15) | ||||||||
| Foreign currency translation adjustments | (33) | 114 | (15) | ||||||||
| 2 | 86 | (30) | |||||||||
| Comprehensive income/(loss) attributable to noncontrolling interests | (131) | 21 | 95 | ||||||||
| Distributions | (363) | (259) | (271) | ||||||||
| Contributions | 11 | 1,105 | 15 | ||||||||
| Redemption of noncontrolling interests | — | — | (293) | ||||||||
| Purchase of noncontrolling interests | 2 | 55 | — | ||||||||
| Other | (1) | 47 | — | ||||||||
| Balance at end of year | 3,029 | 3,511 | 2,542 | ||||||||
| Total equity | 64,483 | 63,398 | 63,368 | ||||||||
| Dividends paid per common share | 3.55 | 3.44 | 3.34 | ||||||||
The accompanying notes are an integral part of these consolidated financial statements.
104
ENBRIDGE INC.
CONSOLIDATED STATEMENTS OF CASH FLOWS
| Year ended December 31, | 2023 | 2022 | 2021 | ||||||||
| (millions of Canadian dollars) | |||||||||||
| Operating activities | |||||||||||
| Earnings | 6,058 | 2,938 | 6,314 | ||||||||
| Adjustments to reconcile earnings to net cash provided by operating activities: | |||||||||||
| Depreciation and amortization | 4,613 | 4,317 | 3,852 | ||||||||
Deferred income tax expense (Note 24) | 1,420 | 957 | 1,091 | ||||||||
Unrealized derivative fair value (gain)/loss, net (Note 23) | (1,180) | 1,280 | (173) | ||||||||
Income from equity investments (Note 13) | (1,816) | (2,056) | (1,600) | ||||||||
| Distributions from equity investments | 1,998 | 1,827 | 1,630 | ||||||||
| Impairment of long-lived assets | 419 | 541 | — | ||||||||
Impairment of goodwill (Note 15) | — | 2,465 | — | ||||||||
Gain on joint venture merger transaction (Note 13) | — | (1,076) | — | ||||||||
(Gain)/loss on dispositions (Note 27) | (15) | 12 | (319) | ||||||||
| Other | 393 | 37 | (73) | ||||||||
Changes in operating assets and liabilities (Note 28) | 2,311 | (12) | (1,466) | ||||||||
| Net cash provided by operating activities | 14,201 | 11,230 | 9,256 | ||||||||
| Investing activities | |||||||||||
| Capital expenditures | (4,654) | (4,647) | (7,818) | ||||||||
| Long-term, restricted and other investments | (1,276) | (1,041) | (640) | ||||||||
| Distributions from equity investments in excess of cumulative earnings | 1,151 | 763 | 533 | ||||||||
| Additions to intangible assets | (222) | (174) | (275) | ||||||||
| Acquisitions | (954) | (828) | (3,785) | ||||||||
Proceeds from joint venture merger transaction (Note 13) | — | 522 | — | ||||||||
| Proceeds from dispositions | — | — | 1,263 | ||||||||
| Net change in affiliate loans | (27) | 135 | 65 | ||||||||
| Other | (61) | — | — | ||||||||
| Net cash used in investing activities | (6,043) | (5,270) | (10,657) | ||||||||
| Financing activities | |||||||||||
| Net change in short-term borrowings | (1,596) | 481 | 394 | ||||||||
| Net change in commercial paper and credit facility draws | (8,157) | (1,333) | 2,960 | ||||||||
| Debenture and term note issues, net of issue costs | 15,377 | 7,547 | 8,032 | ||||||||
| Debenture and term note repayments | (4,819) | (4,198) | (2,264) | ||||||||
Sale of noncontrolling interest in subsidiary (Note 8) | — | 1,092 | — | ||||||||
| Contributions from noncontrolling interests | 11 | 13 | 15 | ||||||||
| Distributions to noncontrolling interests | (363) | (259) | (271) | ||||||||
| Common shares issued, net of issue costs | 4,450 | 3 | 5 | ||||||||
| Common shares repurchased | (125) | (151) | — | ||||||||
| Preference share dividends | (352) | (338) | (367) | ||||||||
| Common share dividends | (7,276) | (6,968) | (6,766) | ||||||||
| Redemption of preference shares | — | (1,003) | — | ||||||||
| Redemption of preferred shares held by subsidiary | — | — | (415) | ||||||||
| Net change in affiliate loan | 71 | — | — | ||||||||
| Other | (85) | (314) | (87) | ||||||||
| Net cash provided by/(used in) financing activities | (2,864) | (5,428) | 1,236 | ||||||||
| Effect of translation of foreign denominated cash and cash equivalents and restricted cash | (216) | 55 | (5) | ||||||||
| Net change in cash and cash equivalents and restricted cash | 5,078 | 587 | (170) | ||||||||
| Cash and cash equivalents and restricted cash at beginning of year | 907 | 320 | 490 | ||||||||
| Cash and cash equivalents and restricted cash at end of year | 5,985 | 907 | 320 | ||||||||
| Supplementary cash flow information | |||||||||||
| Cash paid for income taxes | 578 | 495 | 489 | ||||||||
| Cash paid for interest, net of amount capitalized | 3,380 | 2,920 | 2,427 | ||||||||
| Property, plant and equipment and intangible assets non-cash accruals | 813 | 937 | 831 | ||||||||
The accompanying notes are an integral part of these consolidated financial statements.
105
ENBRIDGE INC.
CONSOLIDATED STATEMENTS OF FINANCIAL POSITION
| December 31, | 2023 | 2022 | ||||||
| (millions of Canadian dollars; number of shares in millions) | ||||||||
| Assets | ||||||||
| Current assets | ||||||||
| Cash and cash equivalents | 5,901 | 861 | ||||||
| Restricted cash | 84 | 46 | ||||||
| Trade receivables and unbilled revenues | 4,410 | 5,616 | ||||||
Other current assets (Note 9) | 2,440 | 3,255 | ||||||
| Accounts receivable from affiliates | 85 | 114 | ||||||
Inventory (Note 10) | 1,479 | 2,255 | ||||||
| 14,399 | 12,147 | |||||||
Property, plant and equipment, net (Note 11) | 104,641 | 104,460 | ||||||
Long-term investments (Note 13) | 16,793 | 15,936 | ||||||
Restricted long-term investments (Note 23) | 717 | 593 | ||||||
| Deferred amounts and other assets | 8,041 | 9,542 | ||||||
Intangible assets, net (Note 14) | 3,537 | 4,018 | ||||||
Goodwill (Note 15) | 31,848 | 32,440 | ||||||
Deferred income taxes (Note 24) | 341 | 472 | ||||||
| Total assets | 180,317 | 179,608 | ||||||
| Liabilities and equity | ||||||||
| Current liabilities | ||||||||
Short-term borrowings (Note 17) | 400 | 1,996 | ||||||
| Trade payables and accrued liabilities | 4,308 | 6,172 | ||||||
Other current liabilities (Note 16) | 5,659 | 5,220 | ||||||
| Accounts payable to affiliates | 26 | 105 | ||||||
| Interest payable | 958 | 763 | ||||||
Current portion of long-term debt (Note 17) | 6,084 | 6,045 | ||||||
| 17,435 | 20,301 | |||||||
Long-term debt (Note 17) | 74,715 | 72,939 | ||||||
| Other long-term liabilities | 8,653 | 9,189 | ||||||
Deferred income taxes (Note 24) | 15,031 | 13,781 | ||||||
| 115,834 | 116,210 | |||||||
Commitments and contingencies (Note 30) | ||||||||
| Equity | ||||||||
Share capital (Note 20) | ||||||||
| Preference shares | 6,818 | 6,818 | ||||||
Common shares (2,125 and 2,025 outstanding at December 31, 2023 and 2022, respectively) | 69,180 | 64,760 | ||||||
| Additional paid-in capital | 268 | 275 | ||||||
| Deficit | (17,115) | (15,486) | ||||||
Accumulated other comprehensive income (Note 22) | 2,303 | 3,520 | ||||||
| Total Enbridge Inc. shareholders’ equity | 61,454 | 59,887 | ||||||
Noncontrolling interests (Note 19) | 3,029 | 3,511 | ||||||
| 64,483 | 63,398 | |||||||
| Total liabilities and equity | 180,317 | 179,608 | ||||||
Variable Interest Entities (VIEs) (Note 12)
The accompanying notes are an integral part of these consolidated financial statements.
106
NOTES TO THE CONSOLIDATED FINANCIAL STATEMENTS
INDEX
| PAGE | ||||||||
| 1. | Business Overview | |||||||
| 2. | Significant Accounting Policies | |||||||
| 3. | Changes in Accounting Policies | |||||||
| 4. | Revenue | |||||||
| 5. | Segmented Information | |||||||
| 6. | Earnings per Common Share | |||||||
| 7. | Regulatory Matters | |||||||
| 8. | Acquisitions and Dispositions | |||||||
| 9. | Other Current Assets | |||||||
| 10. | Inventory | |||||||
| 11. | Property, Plant and Equipment | |||||||
| 12. | Variable Interest Entities | |||||||
| 13. | Long-Term Investments | |||||||
| 14. | Intangible Assets | |||||||
| 15. | Goodwill | |||||||
| 16. | Other Current Liabilities | |||||||
| 17. | Debt | |||||||
| 18. | Asset Retirement Obligations | |||||||
| 19. | Noncontrolling Interests | |||||||
| 20. | Share Capital | |||||||
| 21. | Stock Option and Stock Unit Plans | |||||||
| 22. | Components of Accumulated Other Comprehensive Income/(Loss) | |||||||
| 23. | Risk Management and Financial Instruments | |||||||
| 24. | Income Taxes | |||||||
| 25. | Pension and Other Postretirement Benefits | |||||||
| 26. | Leases | |||||||
| 27. | Other Income/(Expense) | |||||||
| 28. | Changes in Operating Assets and Liabilities | |||||||
| 29. | Related Party Transactions | |||||||
| 30. | Commitments and Contingencies | |||||||
| 31. | Guarantees | |||||||
| 32. | Quarterly Financial Data (Unaudited) | |||||||
| 33. | Subsequent Event | |||||||
107
1. BUSINESS OVERVIEW
The terms "we", "our", "us" and "Enbridge" as used in this report refer collectively to Enbridge Inc. and its subsidiaries unless the context suggests otherwise. These terms are used for convenience only and are not intended as a precise description of any separate legal entity within Enbridge.
Enbridge is a publicly traded energy transportation and distribution company. We conduct our business through five business segments: Liquids Pipelines, Gas Transmission and Midstream, Gas Distribution and Storage, Renewable Power Generation, and Energy Services. These reporting segments are strategic business units established by senior management to facilitate the achievement of our long-term objectives, to aid in resource allocation decisions and to assess operational performance.
LIQUIDS PIPELINES
Liquids Pipelines consists of pipelines and terminals in Canada and the United States (US) that transport and export various grades of crude oil and other liquid hydrocarbons, including the Mainline System, Regional Oil Sands System, Gulf Coast and Mid-Continent, and Other. On October 12, 2021, we acquired Moda Midstream Operating, LLC (Moda) (Note 8), which includes the Enbridge Ingleside Energy Center, and is a component of Gulf Coast and Mid-Continent.
GAS TRANSMISSION AND MIDSTREAM
Gas Transmission and Midstream consists of our investments in natural gas pipelines and gathering and processing facilities in Canada and the US, including US Gas Transmission, Canadian Gas Transmission, US Midstream, and Other. This segment also includes certain investments in renewable natural gas (RNG) facilities.
GAS DISTRIBUTION AND STORAGE
Gas Distribution and Storage consists of our natural gas utility operations, the core of which is Enbridge Gas Inc. (Enbridge Gas), which serves residential, commercial and industrial customers throughout Ontario. This business segment also includes natural gas distribution activities in Québec. We sold our investment in Noverco Inc. (Noverco), previously reported in the Gas Distribution and Storage segment, to Trencap L.P. on December 30, 2021 (Note 13).
RENEWABLE POWER GENERATION
Renewable Power Generation consists primarily of investments in wind and solar assets, as well as geothermal, waste heat recovery, and transmission assets. In North America, assets are primarily located in the provinces of Alberta, Ontario and Québec, and in the states of Colorado, Texas, Indiana, Ohio and West Virginia. We also hold interests in offshore wind facilities in operation, under construction and in active development in the United Kingdom, France and Germany. This segment also includes Tri Global Energy, LLC (TGE) which was acquired on September 27, 2022 (Note 8).
ENERGY SERVICES
Our Energy Services businesses in Canada and the US undertake physical commodity marketing activity and logistical services to manage our volume commitments on various pipeline systems. This segment also provides energy marketing services to North American refiners, producers and other customers.
ELIMINATIONS AND OTHER
In addition to the segments described above, Eliminations and Other includes operating and administrative costs that are not allocated to business segments, the impact of foreign exchange hedge settlements and the activities of our wholly-owned captive insurance subsidiaries. The principal activity of our captive insurance subsidiaries is providing insurance and reinsurance coverage for certain insurable property and casualty risk exposures of our operating subsidiaries and certain equity investments. Eliminations and Other also includes new business development activities and corporate investments.
108
2. SIGNIFICANT ACCOUNTING POLICIES
These consolidated financial statements are prepared in accordance with accounting principles generally accepted in the United States of America (US GAAP). Amounts are stated in Canadian dollars unless otherwise noted. As a Securities and Exchange Commission (SEC) registrant, we are permitted to use US GAAP for the purposes of meeting both our Canadian and US continuous disclosure requirements.
BASIS OF PRESENTATION AND USE OF ESTIMATES
The preparation of financial statements in conformity with US GAAP requires management to make estimates and assumptions that affect the reported amounts of assets, liabilities, revenues and expenses, as well as the disclosure of contingent assets and liabilities in the consolidated financial statements. Significant estimates and assumptions used in the preparation of the consolidated financial statements include, but are not limited to: variable consideration included in revenue(Note 4); carrying values of regulatory assets and liabilities (Note 7); purchase price allocations (Note 8); unbilled revenues; expected credit losses; depreciation rates and carrying value of property, plant and equipment (Note 11); amortization rates and carrying value of intangible assets (Note 14); measurement of goodwill (Note 15); fair value of asset retirement obligations (ARO) (Note 18); valuation of stock-based compensation (Note 21); fair value of financial instruments (Note 23); provisions for income taxes (Note 24); assumptions used to measure retirement benefits and OPEB (Note 25); commitments and contingencies (Note 30); and estimates of losses related to environmental remediation obligations (Note 30). Actual results could differ from these estimates.
Certain comparative figures in our consolidated financial statements have been reclassified to conform to the current year's presentation.
PRINCIPLES OF CONSOLIDATION
The consolidated financial statements include our accounts and the accounts of our subsidiaries and VIEs for which we are the primary beneficiary. A VIE is a legal entity that does not have sufficient equity at risk to finance its activities without additional subordinated financial support or is structured such that equity investors lack the ability to make significant decisions relating to the entity's operations through voting rights or do not substantively participate in the gains and losses of the entity. Upon inception of a contractual agreement, we perform an assessment to determine whether the arrangement contains a variable interest in a legal entity and whether that legal entity is a VIE. The primary beneficiary has both the power to direct the activities of the VIE that most significantly impact the entity's economic performance and the obligation to absorb losses, or the right to receive benefits from, the VIE that could potentially be significant to the VIE. Where we conclude that we are the primary beneficiary of a VIE, we consolidate the accounts of that VIE. We assess all variable interests in the entity and use our judgment when determining if we are the primary beneficiary. Other qualitative factors that are considered include decision-making responsibilities, the VIE capital structure, risk and rewards sharing, contractual agreements with the VIE, voting rights and level of involvement of other parties. We assess the primary beneficiary determination for a VIE on an ongoing basis if there are changes in the facts and circumstances related to a VIE. If an entity is determined to not be a VIE, the voting interest entity model is applied, where an investor holding the majority voting rights consolidates the entity. The consolidated financial statements also include the accounts of any limited partnerships where we represent the general partner and, based on all facts and circumstances, control such limited partnerships, unless the limited partner has substantive participating rights or substantive kick-out rights. For certain investments where we retain an undivided interest in assets and liabilities, we record our proportionate share of assets, liabilities, revenues and expenses.
All intercompany accounts and transactions are eliminated upon consolidation. Ownership interests in subsidiaries represented by other parties that do not control the entity are presented in the consolidated financial statements as activities and balances attributable to noncontrolling interests. Investments and entities over which we exercise significant influence are accounted for using the equity method.
109
REGULATION
Certain parts of our businesses are subject to regulation by various authorities including, but not limited to, the Canada Energy Regulator (CER), the Federal Energy Regulatory Commission (FERC), the Alberta Energy Regulator, the BC Energy Regulator, the Ontario Energy Board (OEB) and the Québec Régie de l’énergie. Regulatory bodies exercise statutory authority over matters such as construction, rates and ratemaking, and agreements with customers. To recognize the economic effects of the actions of the regulator, the timing of recognition of certain revenues and expenses in these operations may differ from that otherwise expected under US GAAP for non-rate-regulated entities.
Regulatory assets represent amounts that are expected to be recovered from customers in future periods through rates. Regulatory liabilities represent amounts that are expected to be refunded to customers in future periods through rates, amounts collected from customers in advance of costs being incurred, or to be paid to cover future abandonment costs in relation to the CER's Land Matters Consultation Initiative (LMCI) and for future removal and site restoration costs as approved by the regulator. If there are changes in our assessment of the probability of recovery for a regulatory asset, we reduce its carrying amount to the balance that we expect to recover from customers in future periods through rates. If a regulator later excludes from allowable costs all or a part of costs that were capitalized as a regulatory asset, we reduce the carrying amount of the asset by the excluded amounts. The recognition of regulatory assets and liabilities is based on the actions, or expected future actions, of the regulator. To the extent that the regulator's actions differ from our expectations, the timing and amount of recovery or settlement of regulatory balances could differ significantly from those recorded. In the absence of rate regulation, we would generally not recognize regulatory assets or liabilities and the earnings impact would be recorded in the period the expenses are incurred or revenues are earned. A regulatory asset or liability is recognized in respect of deferred income taxes when it is expected the amounts will be recovered or settled through future regulator-approved rates.
During the fourth quarter of 2023, Southern Lights Pipeline completed an open season to negotiate new transportation service agreements. We do not expect to renew the agreements under a cost-of-service toll methodology, therefore Southern Lights Pipeline is no longer subject to rate-regulated accounting. As a result, the related regulatory liabilities, regulatory tax assets and associated regulatory deferred tax liabilities were derecognized. We believe that the recovery of our remaining regulatory assets as at December 31, 2023 is probable over the periods described in Note 7 - Regulatory Matters.
Effective January 1, 2015, we began collecting and setting aside funds to cover future pipeline abandonment costs for all CER-regulated pipelines as a result of the regulatory requirements under the LMCI. The funds collected are held in trusts in accordance with the CER decision. The funds collected from shippers are reported within Transportation and other services revenues in the Consolidated Statements of Earnings and Restricted long-term investments in the Consolidated Statements of Financial Position. Concurrently, we reflect the future abandonment cost as an increase to Operating and administrative expense in the Consolidated Statements of Earnings and Other long-term liabilities in the Consolidated Statements of Financial Position.
An allowance for funds used during construction (AFUDC) is included in the cost of property, plant and equipment and is depreciated over future periods as part of the total cost of the related asset. AFUDC includes both an interest component and, if approved by the regulator, a cost of equity component, which are both capitalized based on rates set out in a regulatory agreement. The corresponding impact on earnings is included in Interest expense for the interest component and Other income/(expense) for the equity component. In the absence of rate regulation, we would capitalize interest using a capitalization rate based on our cost of borrowing, whereas the capitalized equity component, the corresponding earnings during the construction phase and the subsequent depreciation relating to the equity component would not be recognized. The equity component of AFUDC is included as a non-cash reconciling item to earnings within Cash Flows from Operating Activities in the Consolidated Statements of Cash Flows.
110
Under the pool method prescribed by certain regulators, it is not possible to identify the carrying value of the equity component of AFUDC or its effect on depreciation. Similarly, gains and losses on the retirement of certain specific fixed assets in any given year cannot be identified or quantified.
With the approval of regulators, certain operations capitalize a percentage of specified operating costs. These operations are authorized to charge depreciation and earn a return on the net book value of such capitalized costs in future years. In the absence of rate regulation, a portion of such operating costs would be charged to earnings in the year incurred.
For certain regulated operations to which US GAAP guidance for phase-in plans applies, negotiated depreciation rates recovered in transportation tolls may be less than the depreciation expense calculated in accordance with US GAAP in early years of long-term contracts but recovered in future periods when tolls exceed depreciation. Depreciation expense on such assets is recorded in accordance with US GAAP and no regulatory asset is recorded.
REVENUE RECOGNITION
For businesses that are not rate-regulated, revenues are recorded when products have been delivered or services have been performed, the amount of revenue can be reliably measured and collectability is reasonably assured. Customer creditworthiness is assessed prior to agreement signing and throughout the contract duration. Certain revenues from our liquids and natural gas pipeline businesses are recognized under the terms of committed delivery contracts, rather than the cash tolls received.
Long-term take-or-pay contracts, under which shippers are obligated to pay fixed amounts ratably over the contract period regardless of volumes shipped, may contain make-up rights. Make-up rights are earned by shippers when minimum volume commitments are not utilized during the period but under certain circumstances can be used to offset overages in future periods, subject to expiry. We recognize revenues associated with make-up rights at the earlier of when the make-up volume is shipped, the make-up right expires, or when it is determined that the likelihood that the shipper will utilize the make-up right is remote. We also have long-term contracts where the revenue profile does not align with the cash receipt schedule, resulting in the recognition of deferred revenue.
Certain offshore pipeline transportation contracts require us to provide transportation services for the life of the underlying producing fields. Under these arrangements, shippers pay us a fixed monthly toll for a defined period of time which may be shorter than the estimated reserve life of the underlying producing fields, resulting in a contract period which extends past the period of cash collection. Fixed monthly toll revenues are recognized ratably over the committed volume made available to shippers throughout the contract period, regardless of when cash is received.
For the years ended December 31, 2023, 2022 and 2021, cash received net of revenue recognized for contracts under make-up rights and similar deferred revenue arrangements was $210 million, $238 million and $127 million, respectively.
For rate-regulated businesses, revenues are recognized in a manner that is consistent with the underlying agreements as approved by the regulators. Natural gas utility revenues are recorded based on regular meter readings and estimates of customer usage from the last meter reading to the end of the reporting period. Estimates are based on historical consumption patterns and heating degree days experienced. Heating degree days is a measure of coldness that is indicative of volumetric requirements for natural gas utilized for heating purposes in our distribution franchise areas.
Our Energy Services segment enters into commodity purchase and sale arrangements that are recorded on a gross basis as we are acting as the principal in the transactions.
111
No non-affiliated customer exceeded 10.0% of our third-party revenues for the years ended December 31, 2023 and 2022. Our largest non-affiliated customer accounted for approximately 13.5% of our third-party revenues for the year ended December 31, 2021.
DERIVATIVE INSTRUMENTS AND HEDGING
Non-qualifying Derivatives
Non-qualifying derivative instruments are used primarily to economically hedge foreign exchange, interest rate and commodity price earnings exposure. Non-qualifying derivatives are measured at fair value with changes in fair value recognized in earnings in Commodity sales, Transportation and other services revenues, Commodity costs, Operating and administrative expense, Other income/(expense) and Interest expense.
Derivatives in Qualifying Hedging Relationships
We use derivative financial instruments to manage our exposure to changes in commodity prices, foreign exchange rates, interest rates and certain compensation tied to our share price. Hedge accounting is optional and requires us to document the hedging relationship and test the hedging item's effectiveness in offsetting changes in fair values or cash flows of the underlying hedged item on an ongoing basis. We present the earnings effects of hedging items with the hedged transaction. Derivatives in qualifying hedging relationships are categorized as cash flow hedges, fair value hedges or net investment hedges.
Cash Flow Hedges
We use cash flow hedges to manage our exposure to changes in commodity prices, foreign exchange rates, interest rates and certain compensation tied to our share price. The change in the fair value of a cash flow hedging instrument is recorded in Other comprehensive income/(loss) (OCI) and is reclassified to earnings when the hedged item impacts earnings.
If a derivative instrument designated as a cash flow hedge ceases to be effective or is terminated, hedge accounting is discontinued and the gain or loss at that date is deferred in OCI and recognized in earnings concurrently with the related transaction. If an anticipated hedged transaction is no longer probable, the gain or loss is recognized immediately in earnings. Subsequent gains and losses from derivative instruments for which hedge accounting has been discontinued are recognized in earnings in the period in which they occur.
Fair Value Hedges
We may use fair value hedges to hedge the fair value of debt instruments. The change in the fair value of the hedging instrument is recorded in earnings with changes in the fair value of the hedged risk of the asset or liability that is designated as part of the hedging relationship. If a fair value hedge is discontinued or ceases to be effective, the hedged risk of the asset or liability ceases to be remeasured at fair value and the cumulative fair value adjustment to the carrying value of the hedged item is recognized in earnings over the remaining life of the hedged item.
Net Investment Hedges
Gains and losses arising from the translation of our net investment in foreign operations from their functional currencies to Enbridge's Canadian dollar presentation currency are included in cumulative translation adjustments (CTA), a component of OCI. We currently have designated a portion of our US dollar-denominated debt, as well as a portfolio of foreign exchange forward contracts in prior periods, as a hedge of our net investment in US dollar-denominated investments and subsidiaries. As a result, the change in fair value of the foreign currency derivatives, as well as the translation of US dollar-denominated debt, are reflected in OCI. Amounts recognized previously in Accumulated other comprehensive income/(loss) (AOCI) are reclassified to earnings when there is a reduction of the hedged net investment resulting from the disposal of a foreign operation.
112
Classification of Derivatives
We recognize the fair value of derivative instruments in the Consolidated Statements of Financial Position as current and non-current assets or liabilities depending on the timing of settlements and the resulting cash flows associated with the instruments. Fair value amounts related to cash flows occurring beyond one year are classified as non-current.
Cash inflows and outflows related to derivative instruments are classified as Cash Flows from Operating Activities in the Consolidated Statements of Cash Flows.
Balance Sheet Offset
Assets and liabilities arising from derivative instruments may be offset in the Consolidated Statements of Financial Position when we have the legal right and intention to settle them on a net basis.
TRANSACTION COSTS
Transaction costs are incremental costs directly related to the acquisition of a financial asset or the issuance of a financial liability. We incur transaction costs primarily from the issuance of debt and account for these costs as a reduction to Long-term debt in the Consolidated Statements of Financial Position. These costs are amortized using the effective interest rate method over the term of the related debt instrument and are recorded in Interest expense.
EQUITY INVESTMENTS
Equity investments over which we exercise significant influence, but do not have controlling financial interests, are accounted for using the equity method. These investments are initially measured at cost and are adjusted for our proportionate share of undistributed equity earnings or loss. Our equity investments are increased for contributions made to, and decreased for distributions received from, the investee. To the extent an equity investee undertakes activities necessary to commence its planned principal operations, we capitalize interest costs associated with the investment during such period.
RESTRICTED LONG-TERM INVESTMENTS
Long-term investments that are restricted as to withdrawal or usage for the purposes of the CER's LMCI are presented as Restricted long-term investments in the Consolidated Statements of Financial Position.
OTHER INVESTMENTS
Generally, we classify equity investments in entities over which we do not exercise significant influence and that do not have readily determinable fair values as other investments measured using the fair value measurement alternative (FVMA). These investments are recorded at cost less impairment, if any, and adjusted for the impact of observable price changes occurring in orderly transactions for an identical or similar investment of the same issuer. Investments in equity securities measured using the FVMA are reviewed for impairment each reporting period and written down to their fair value if objective evidence of impairment is identified. Equity investments with readily determinable fair values are measured at fair value through earnings. Dividends received from investments in equity securities are recognized in earnings when the right to receive payment is established.
Investments in debt securities are classified as available-for-sale and measured at fair value through OCI.
NONCONTROLLING INTERESTS
Noncontrolling interests represent ownership interests attributable to third parties in certain consolidated subsidiaries. The portion of equity not owned by us in such entities is reflected as Noncontrolling interests within the equity section of the Consolidated Statements of Financial Position.
113
INCOME TAXES
Income taxes are accounted for using the liability method. Deferred income tax assets and liabilities are recorded based on temporary differences between the tax bases of assets and liabilities and their carrying values for accounting purposes. Deferred income tax assets and liabilities are measured using the tax rate that is expected to apply when the temporary differences reverse. For our regulated operations, a deferred income tax liability or asset is recognized with a corresponding regulatory asset or liability, respectively, to the extent that taxes can be recovered through rates. Any interest and/or penalty incurred related to tax is reflected in Income tax expense.
FOREIGN CURRENCY TRANSACTIONS AND TRANSLATION
Foreign currency transactions are those transactions whose terms are denominated in a currency other than the currency of the primary economic environment in which Enbridge or a reporting subsidiary operates, referred to as the functional currency. Transactions denominated in foreign currencies are translated to the functional currency using the exchange rate prevailing at the date of the transaction. Monetary assets and liabilities denominated in foreign currencies are translated to the functional currency using the exchange rate in effect as at the balance sheet date. Exchange gains and losses resulting from the translation of monetary assets and liabilities are included in earnings in the period in which they arise.
Gains and losses arising from the translation of foreign operations' functional currencies to our Canadian dollar presentation currency are included in the CTA component of AOCI and are recognized in earnings upon sale of the foreign operation. Asset and liability accounts are translated at the exchange rates in effect as at the balance sheet date, while revenues and expenses are translated using monthly average exchange rates.
CASH AND CASH EQUIVALENTS
Cash and cash equivalents include short-term investments with a term to maturity of three months or less when purchased.
RESTRICTED CASH
Cash and cash equivalents that are restricted as to withdrawal or usage for the purposes of the CER's LMCI or in accordance with specific commercial and debt arrangements are presented as Restricted cash in the Consolidated Statements of Financial Position.
LOANS AND RECEIVABLES
Long-term notes receivable from affiliates are measured at amortized cost using the effective interest rate method, net of any impairment losses recognized. Trade receivables and unbilled revenues are measured at cost. Interest income is recognized in earnings as it is earned with the passage of time.
CURRENT EXPECTED CREDIT LOSSES
For accounts receivable, a loss allowance matrix is utilized to measure lifetime expected credit losses. The matrix contemplates historical credit losses by age of receivables, adjusted for any forward-looking information and management expectations. Other loan receivables and applicable off-balance sheet commitments utilize a discounted cash flow methodology which calculates the current expected credit losses based on historical default probability rates associated with the credit rating of the counterparty and the related term of the loan or commitment, adjusted for forward-looking information and management expectations. Trade receivables and unbilled revenues are presented net of allowance for expected credit losses of $100 million and $92 million as at December 31, 2023 and 2022, respectively.
NATURAL GAS IMBALANCES
The Consolidated Statements of Financial Position include balances as a result of differences in gas volumes received from, and delivered for, customers. As settlement of certain imbalances is in-kind, changes in the balances do not have an effect on our Consolidated Statements of Earnings or Consolidated Statements of Cash Flows. Most natural gas volumes owed to or by us are valued at natural gas market index prices as at the balance sheet dates.
114
INVENTORY
Inventory is comprised of natural gas held in storage by Enbridge Gas, crude oil and natural gas held primarily by businesses in our Energy Services segment, and materials and supplies. Natural gas held in storage by Enbridge Gas is recorded at the quarterly prices approved by the OEB in the determination of distribution rates. The actual price of gas purchased may differ from the OEB approved price. The difference between the approved price and the actual cost of gas purchased is deferred as a liability for future refund, or as an asset for collection, as approved by the OEB. Other inventory is recorded at the lower of cost, as determined on a weighted average basis, or market value. Upon disposition, other commodities inventory is recorded to Commodity costs in the Consolidated Statements of Earnings at the weighted average cost of inventory, including any adjustments recorded to reduce inventory to market value. Materials and supplies inventory is recorded at the lower of average cost or net realizable value.
PROPERTY, PLANT AND EQUIPMENT
Property, plant and equipment is recorded at historical cost. Expenditures for construction, expansion, major renewals and betterments are capitalized. Maintenance and repair costs are expensed as incurred. Expenditures for project development are capitalized if they are expected to have future benefit. We capitalize interest incurred during construction for non-rate-regulated assets. For rate-regulated assets, AFUDC is included in the cost of property, plant and equipment and is depreciated over future periods as part of the total cost of the related asset.
Two primary methods of depreciation are utilized. For distinct assets, depreciation is generally provided on a straight-line basis over the estimated useful lives of the assets commencing when the asset is placed in service. For largely homogeneous groups of assets with comparable useful lives, the pool method of accounting is followed whereby similar assets are grouped and depreciated as a pool. When group assets are retired or otherwise disposed of, gains and losses are not reflected in earnings but are booked as an adjustment to accumulated depreciation.
LEASES
We recognize an arrangement as a lease when a customer has the right to obtain substantially all of the economic benefits from the use of an asset, as well as the right to direct the use of the asset. We recognize right-of-use (ROU) assets and the related lease liabilities in the Consolidated Statements of Financial Position for operating lease arrangements with a term of 12 months or longer. We do not separate non-lease components from the associated lease components of our lessee contracts and account for both components as a single lease component. We combine lease and non-lease components within a contract for operating lessor leases when certain conditions are met. ROU assets are assessed for impairment using the same approach applied for other long-lived assets.
Lease liabilities and ROU assets require the use of judgment and estimates which are applied in determining the term of a lease, appropriate discount rates, whether an arrangement contains a lease, whether there are any indicators of impairment for ROU assets and whether any ROU assets should be grouped with other long-lived assets for impairment testing. The lease term may include periods associated with options to extend or terminate the lease if it is reasonably certain the options will be exercised.
DEFERRED AMOUNTS AND OTHER ASSETS
Deferred amounts and other assets primarily consists of costs that regulatory authorities have permitted, or are expected to permit, to be recovered through future rates, including: deferred income taxes; the fair value adjustment to long-term debt for certain regulated entities; actual cost of removal of previously retired or decommissioned plant assets; the difference between the actual cost and approved cost of natural gas reflected in rates; and actuarial gains and losses arising from defined benefit pension plans for Enbridge Gas.
115
INTANGIBLE ASSETS
Intangible assets consist primarily of certain software costs, customer relationships and emission allowances. We capitalize costs incurred during the application development stage of internal use software projects. Customer relationships represent the underlying relationship from long-term agreements with customers that are capitalized upon acquisition. Intangible assets are generally amortized on a straight-line basis over their expected lives, commencing when the asset is available for use, with the exception of emission allowances, which are not amortized as they will be used to satisfy compliance obligations as they come due.
GOODWILL
Goodwill represents the excess of the purchase price over the fair value of net identifiable assets upon acquisition of a business. The carrying value of goodwill, which is not amortized, is assessed for impairment annually or more frequently if events or changes in circumstances arise that suggest the carrying value of goodwill may be impaired. We perform our annual review of the goodwill balance on April 1.
We perform our annual review for impairment at the reporting unit level, which is identified by assessing whether the components of our operating segments constitute businesses for which discrete information is available, whether segment management regularly reviews the operating results of those components, and whether the economic and regulatory characteristics are similar. Our reporting units are Liquids Pipelines, Gas Transmission, Gas Distribution and Storage, and Renewable Power Generation. The Renewable Power Generation reporting unit had goodwill beginning in the third quarter of 2022.
We have the option to first assess qualitative factors to determine whether it is necessary to perform the quantitative goodwill impairment assessment. When performing a qualitative assessment, we determine the drivers of fair value for each reporting unit and evaluate whether those drivers have been positively or negatively affected by relevant events and circumstances since the last fair value assessment. Our evaluation includes, but is not limited to, the assessment of macroeconomic trends, changes to regulatory environments, capital accessibility, operating income trends, and changes to industry conditions. Based on our assessment of qualitative factors, if we determine it is more likely than not that the fair value of the reporting unit is less than its carrying amount, a quantitative goodwill impairment assessment is performed.
The quantitative goodwill impairment assessment involves determining the fair value of our reporting units and comparing those values to the carrying value of each reporting unit. If the carrying value of a reporting unit, including allocated goodwill, exceeds its fair value, goodwill impairment is measured at the amount by which the reporting unit's carrying value exceeds its fair value. This amount should not exceed the carrying amount of goodwill. The fair value of our reporting units is estimated using a discounted cash flow technique. The determination of fair value using the discounted cash flow technique requires the use of estimates and assumptions related to discount rates, projected operating income, expected future capital expenditures and working capital levels, as well as terminal value growth rates for the Liquids Pipelines, Gas Transmission, and Renewable Power Generation reporting units, and projected regulatory rate base and rate base multiple for the Gas Distribution and Storage reporting unit.
The allocation of goodwill to held-for-sale and disposed businesses is based on the relative fair value of businesses included in the relevant reporting unit.
116
On April 1, 2023, we performed our annual goodwill impairment assessment which consisted of a qualitative assessment for the Liquids Pipelines, Gas Transmission, Gas Distribution and Storage, and Renewable Power Generation reporting units and did not identify impairment indicators. Due to an impairment recorded in 2022 for the Gas Transmission reporting unit and the OEB decision on Phase 1 for Enbridge Gas, we performed a quantitative assessment for the Gas Transmission and Gas Distribution and Storage reporting units as at December 1, 2023, which did not result in the recognition of an impairment charge for either reporting unit. Also, we did not identify any indicators of goodwill impairment during the remainder of 2023.
IMPAIRMENT
We review the carrying values of our long-lived assets as events or changes in circumstances warrant. If it is determined that the carrying value of an asset exceeds its expected undiscounted cash flows, we will calculate fair value based on the discounted cash flows and write the asset down to the extent that the carrying value exceeds the fair value.
With respect to investments in debt securities and equity investments, we assess at each balance sheet date whether there is objective evidence that a financial asset is impaired by completing a quantitative or qualitative analysis of factors impacting the investment. If there is objective evidence of impairment, we value the expected discounted cash flows using observable market inputs. We determine whether the decline below carrying value is other-than-temporary for equity method investments or is due to a credit loss for investments in debt securities. If the decline is determined to be other-than-temporary for equity method investments or is due to a credit loss for investments in debt securities, an impairment charge is recorded in earnings with an offsetting reduction to the carrying value of the investment.
ASSET RETIREMENT OBLIGATIONS
ARO associated with the retirement of long-lived assets are measured at fair value and recognized as Other current liabilities or Other long-term liabilities in the period in which they can be reasonably determined. Fair value approximates the cost a third party would charge to perform the tasks necessary to retire such assets and is recognized at the present value of expected future cash flows. ARO is added to the carrying value of the associated asset and depreciated over the asset's useful life. The corresponding liability is accreted over time through charges to earnings and is reduced by actual costs of decommissioning and reclamation. Our estimates of retirement costs could change as a result of changes in cost estimates and regulatory requirements. Currently, for the majority of our assets, it is not possible to make a reasonable estimate of ARO due to the indeterminate timing and scope of the asset retirements.
PENSION AND OTHER POSTRETIREMENT BENEFITS
We sponsor defined benefit and defined contribution pension plans, as well as defined benefit OPEB plans.
Obligations and net periodic benefit costs for defined benefit pension and OPEB plans are estimated using the projected unit credit method, which is based on years of service, as well as our best estimates of actuarial assumptions such as discount rates, future salary levels, other cost escalations, employees' retirement ages, and mortality.
We determine discount rates using market yields of high-quality corporate bonds with maturities that approximate the estimated timing of future benefit payments.
Plan assets are measured at fair value. The expected return on plan assets is determined using the long-term target asset mixes in our investment policies and long-term market expectations.
117
Actuarial gains and losses arise from the difference between the actual and expected return on plan assets, and changes in actuarial assumptions such as discount rates. Periodic net actuarial gains and losses and prior service costs are accumulated and presented as follows in the Consolidated Statements of Financial Position:
•as a component of AOCI, for our non-utilities' defined benefit pension plans and all defined benefit OPEB plans; and
•as a component of Deferred amounts and other assets and/or Other long-term liabilities, for our utilities' defined benefit pension plans, to the extent that the net actuarial gains and losses and prior service costs have been permitted or are expected to be permitted by the regulators, to be recovered through future rates.
Net periodic benefit cost is recognized in earnings and includes:
•current service cost;
•interest cost;
•expected return on plan assets;
•amortization of prior service costs over the expected average remaining service life of the plans' active employee group; and
•amortization of net actuarial gains and losses in excess of 10% of the greater of the benefit obligation or the fair value of plan assets over the expected average remaining service life of the plans' active employee group.
Our utility operations also record regulatory adjustments for the difference between net periodic benefit costs for accounting versus ratemaking purposes. Offsetting regulatory assets or liabilities are recorded to the extent net periodic benefit costs are expected to be recovered from or refunded to customers, respectively, in future rates. In the absence of rate regulation, regulatory assets or liabilities would not be recorded and net periodic benefit costs would be charged to earnings and OCI on an accrual basis.
For defined contribution plans, our contributions are expensed when the contribution occurs.
STOCK-BASED COMPENSATION
Incentive stock options (ISO) granted are recorded using the fair value method. Under this method, compensation expense is measured at the grant date based on the fair value of the ISO granted as calculated by the Black-Scholes-Merton model and is recognized on a straight-line basis over the shorter of the vesting period or the period to early retirement eligibility, with a corresponding credit to Additional paid-in capital. Balances in Additional paid-in capital are transferred to Share capital when the options are exercised.
Performance stock units (PSU) and certain RSUs are cash-settled awards for which the related liability is remeasured each reporting period. These PSUs vest at the completion of a three-year term and RSUs vest one-third annually from the grant date. During the vesting term, compensation expense is recorded based on the number of units outstanding and the current market price of Enbridge's common shares with an offset to Other current liabilities or Other long-term liabilities. The value of the PSUs is also dependent on our performance relative to performance targets set out under the plan. We also award share-settled RSUs to certain senior management employees which vest at the completion of a three-year term. Beginning in 2023, share-settled units were granted to other employees, which vest one-third annually from the grant date. During the vesting term, compensation expense is recorded based on the number of units granted and the market price of Enbridge's common shares on the day immediately preceding the grant date, with an offset to Additional paid-in capital. There is no associated liability recorded for share-settled awards.
118
COMMITMENTS, CONTINGENCIES AND ENVIRONMENTAL LIABILITIES
We expense or capitalize, as appropriate, expenditures for ongoing compliance with environmental regulations that relate to past or current operations. We expense costs incurred for remediation of existing environmental contamination caused by past operations that do not benefit future periods by preventing or eliminating future contamination. We record liabilities for environmental matters when assessments indicate that remediation efforts are probable and the costs can be reasonably estimated. Estimates of environmental liabilities are based on currently available facts, existing technology and presently enacted laws and regulations, taking into consideration the likely effects of inflation and other factors. These amounts also consider prior experience in remediating contaminated sites, other companies' clean-up experience and data released by government organizations. Our estimates are subject to revision in future periods based on actual costs or new information and are included in Other current liabilities and Other long-term liabilities in the Consolidated Statements of Financial Position at their undiscounted amounts. There is always a potential of incurring additional costs in connection with environmental liabilities due to variations in any or all of the categories described above, including modified or revised requirements from regulatory agencies, in addition to fines and penalties, as well as expenditures associated with litigation and settlement of claims. We evaluate recoveries from insurance coverage separately from the liability and, when recovery is probable, we record and report an asset separately from the associated liability in the Consolidated Statements of Financial Position.
Liabilities for other commitments and contingencies are recognized when, after fully analyzing available information, we determine it is either probable that an asset has been impaired or that a liability has been incurred, and the amount of impairment or loss can be reasonably estimated. When a range of probable loss can be estimated, we recognize the most likely amount, or if no amount is more likely than another, the minimum of the range of probable loss is accrued. We expense legal costs associated with loss contingencies as such costs are incurred.
3. CHANGES IN ACCOUNTING POLICIES
CHANGES IN ACCOUNTING POLICIES
There were no changes in accounting policies during the year ended December 31, 2023.
FUTURE ACCOUNTING POLICY CHANGES
Segment Reporting
Accounting Standards Update (ASU) 2023-07 was issued in November 2023 to improve reportable segment disclosure requirements primarily through enhanced disclosures about significant segment expenses and to require in interim period financial statements all disclosures about a reportable segment's profit or loss and assets that are currently required annually. The new ASU requires entities to disclose the title and position of the individual or the name of the group or committee identified as the chief operating decision-maker (CODM) of each segment. ASU 2023-07 is effective January 1, 2024, with interim period disclosure requirements effective after January 1, 2025 and should be applied retrospectively to all prior periods presented in the financial statements. We are currently assessing the impact of the new standard on our consolidated financial statements.
Income Tax Disclosures
ASU 2023-09 was issued in December 2023 to improve income tax disclosures by requiring specified categories in the annual rate reconciliation that meet quantitative thresholds and further disaggregation on income taxes paid by jurisdiction. ASU 2023-09 is effective January 1, 2025 and should be applied prospectively, with retrospective application being permitted. We are currently assessing the impact of the new standard on our consolidated financial statements.
119
4. REVENUE
REVENUE FROM CONTRACTS WITH CUSTOMERS
Major Products and Services
| Liquids Pipelines | Gas Transmission and Midstream | Gas Distribution and Storage | Renewable Power Generation | Energy Services | Eliminations and Other | Consolidated | |||||||||||||||||
| Year ended December 31, 2023 | |||||||||||||||||||||||
| (millions of Canadian dollars) | |||||||||||||||||||||||
| Transportation revenue | 11,875 | 5,302 | 814 | — | — | — | 17,991 | ||||||||||||||||
| Storage and other revenue | 257 | 461 | 355 | — | — | — | 1,073 | ||||||||||||||||
| Gas distribution revenue | — | — | 4,859 | — | — | — | 4,859 | ||||||||||||||||
| Electricity and transmission revenue | — | — | — | 259 | — | — | 259 | ||||||||||||||||
| Commodity sales | — | 17 | — | — | — | — | 17 | ||||||||||||||||
| Total revenue from contracts with customers | 12,132 | 5,780 | 6,028 | 259 | — | — | 24,199 | ||||||||||||||||
| Commodity sales | — | — | — | — | 18,964 | — | 18,964 | ||||||||||||||||
Other revenue1,2 | 257 | 72 | (58) | 215 | — | — | 486 | ||||||||||||||||
| Intersegment revenue | 474 | 2 | 6 | 3 | 25 | (510) | — | ||||||||||||||||
| Total revenue | 12,863 | 5,854 | 5,976 | 477 | 18,989 | (510) | 43,649 | ||||||||||||||||
| Liquids Pipelines | Gas Transmission and Midstream | Gas Distribution and Storage | Renewable Power Generation | Energy Services | Eliminations and Other | Consolidated | |||||||||||||||||
| Year ended December 31, 2022 | |||||||||||||||||||||||
| (millions of Canadian dollars) | |||||||||||||||||||||||
| Transportation revenue | 11,283 | 5,012 | 782 | — | — | — | 17,077 | ||||||||||||||||
| Storage and other revenue | 235 | 350 | 308 | — | — | — | 893 | ||||||||||||||||
| Gas gathering and processing revenue | — | 22 | — | — | — | — | 22 | ||||||||||||||||
| Gas distribution revenue | — | — | 5,643 | — | — | — | 5,643 | ||||||||||||||||
| Electricity and transmission revenue | — | — | — | 281 | — | — | 281 | ||||||||||||||||
| Total revenue from contracts with customers | 11,518 | 5,384 | 6,733 | 281 | — | — | 23,916 | ||||||||||||||||
| Commodity sales | — | — | — | — | 29,150 | — | 29,150 | ||||||||||||||||
Other revenue1,2 | (81) | 39 | (20) | 305 | — | — | 243 | ||||||||||||||||
| Intersegment revenue | 615 | 3 | 16 | (4) | 25 | (655) | — | ||||||||||||||||
| Total revenue | 12,052 | 5,426 | 6,729 | 582 | 29,175 | (655) | 53,309 | ||||||||||||||||
| Liquids Pipelines | Gas Transmission and Midstream | Gas Distribution and Storage | Renewable Power Generation | Energy Services | Eliminations and Other | Consolidated | |||||||||||||||||
| Year ended December 31, 2021 | |||||||||||||||||||||||
| (millions of Canadian dollars) | |||||||||||||||||||||||
| Transportation revenue | 9,492 | 4,364 | 676 | — | — | — | 14,532 | ||||||||||||||||
| Storage and other revenue | 147 | 255 | 246 | — | — | — | 648 | ||||||||||||||||
| Gas gathering and processing revenue | — | 49 | — | — | — | — | 49 | ||||||||||||||||
| Gas distribution revenue | — | — | 4,026 | — | — | — | 4,026 | ||||||||||||||||
| Electricity and transmission revenue | — | — | — | 177 | — | — | 177 | ||||||||||||||||
| Total revenue from contracts with customers | 9,639 | 4,668 | 4,948 | 177 | — | — | 19,432 | ||||||||||||||||
| Commodity sales | — | — | — | — | 26,873 | — | 26,873 | ||||||||||||||||
Other revenue1,2 | 375 | 42 | 13 | 336 | — | — | 766 | ||||||||||||||||
| Intersegment revenue | 567 | 1 | 19 | (1) | 44 | (630) | — | ||||||||||||||||
| Total revenue | 10,581 | 4,711 | 4,980 | 512 | 26,917 | (630) | 47,071 | ||||||||||||||||
1Includes realized and unrealized gains and losses from our hedging program which for the year ended December 31, 2023 were a net of $97 million loss (2022 - $431 million loss; 2021 - $59 million gain).
2Includes revenues from lease contracts. Refer to Note 26 - Leases.
120
We disaggregate revenue into categories which represent our principal performance obligations within each business segment. These revenue categories represent the most significant revenue streams in each segment and consequently are considered to be the most relevant revenue information for management to consider in evaluating performance.
Contract Balances
| Contract Receivables | Contract Assets | Contract Liabilities | |||||||||
| (millions of Canadian dollars) | |||||||||||
| Balance as at December 31, 2023 | 2,802 | 400 | 2,591 | ||||||||
| Balance as at December 31, 2022 | 3,183 | 230 | 2,241 | ||||||||
Contract receivables represent the amount of receivables derived from contracts with customers.
Contract assets represent the amount of revenue which has been recognized in advance of payments received for performance obligations we have fulfilled (or have partially fulfilled) and prior to the point in time at which our right to the payment is unconditional. Amounts included in contract assets are transferred to accounts receivable when our right to the consideration becomes unconditional.
Contract liabilities represent payments received for performance obligations which have not been fulfilled. Contract liabilities primarily relate to make-up rights and deferred revenue. Revenue recognized during the year ended December 31, 2023 included in contract liabilities at the beginning of the year is $246 million. Increases in contract liabilities from cash received, net of amounts recognized as revenue during the year ended December 31, 2023, were $632 million.
Performance Obligations
| Segment | Nature of Performance Obligation | ||||
| Liquids Pipelines | •Transportation and storage of crude oil and natural gas liquids (NGL) | ||||
| Gas Transmission and Midstream | •Transportation, storage, gathering, compression and treating of natural gas | ||||
•Transportation of NGL | |||||
•Sale of crude oil, natural gas and NGL | |||||
| Gas Distribution and Storage | •Supply and delivery of natural gas | ||||
•Transportation of natural gas | |||||
•Storage of natural gas | |||||
| Renewable Power Generation | •Generation and transmission of electricity | ||||
•Delivery of electricity from renewable energy generation facilities | |||||
There was no material revenue recognized during the year ended December 31, 2023 from performance obligations satisfied in previous periods.
Payment Terms
Payments are received monthly from customers under long-term transportation, commodity sales, and gas gathering and processing contracts. Payments from Gas Distribution and Storage customers are received on a continuous basis based on established billing cycles.
Certain contracts in our US offshore business provide for us to receive a series of fixed monthly payments (FMPs) for a specified period that is less than the period during which the performance obligations are satisfied. As a result, a portion of the FMPs are recorded as contract liabilities. The FMPs are not considered to be a financing arrangement as payments are scheduled to match the production profiles of offshore oil and gas fields, which generate greater revenue in the initial years of their productive lives.
121
Revenue to be Recognized from Unfulfilled Performance Obligations
Total revenue from performance obligations expected to be fulfilled in future periods is $59.1 billion, of which $7.5 billion is expected to be recognized during the year ending December 31, 2024.
The revenues excluded from the amounts above based on optional exemptions available under Accounting Standards Codification (ASC) 606, as explained below, represent a significant portion of our overall revenues and revenues from contracts with customers. Certain revenues such as flow-through operating costs charged to shippers are recognized at the amount for which we have the right to invoice our customers and are excluded from the amounts of revenue to be recognized in the future from unfulfilled performance obligations above. Variable consideration is excluded from the amounts above due to the uncertainty of the associated consideration, which is generally resolved when actual volumes and prices are determined. For example, we consider interruptible transportation service revenues to be variable revenues since volumes cannot be estimated. Additionally, the effect of escalation on certain tolls which are contractually escalated for inflation has not been reflected in the amounts above as it is not possible to reliably estimate future inflation rates. Revenues for periods extending beyond the current rate settlement term for regulated contracts where the tolls are periodically reset by the regulator are excluded from the amounts above since future tolls remain unknown. Finally, revenues from contracts with customers which have an original expected duration of one year or less are excluded from the amounts above.
SIGNIFICANT JUDGMENTS MADE IN RECOGNIZING REVENUE
Long-Term Transportation Agreements
For long-term transportation agreements, significant judgments pertain to the period over which revenue is recognized and whether the agreement provides for make-up rights for the shippers. Transportation revenue earned from firm contracted capacity arrangements is recognized ratably over the contract period. Transportation revenue from interruptible or volumetric-based arrangements is recognized when services are performed.
Variable Consideration
Revenue from arrangements subject to variable consideration is recognized only to the extent that it is probable that a significant reversal in the amount of cumulative revenue recognized will not occur when the uncertainty associated with the variable consideration is subsequently resolved. Uncertainties associated with variable consideration relate principally to differences between estimated and actual volumes and prices. These uncertainties are resolved each month when actual volumes are sold or transported and actual tolls and prices are determined.
During the first six months of 2023, revenue for the Canadian Mainline was recognized in accordance with the terms of the Competitive Toll Settlement (CTS), which expired on June 30, 2021. The tolls in place on June 30, 2021 continued on an interim basis until July 1, 2023 when revised interim tolls took effect. Until a new commercial arrangement is approved, the tolls are subject to finalization and adjustment applicable to the interim period, if any. Due to the uncertainty of adjustment to tolling pursuant to a CER decision and potential customer negotiations, interim toll revenue recognized during the year ended December 31, 2023 is considered variable consideration.
122
Recognition and Measurement of Revenue
| Liquids Pipelines | Gas Transmission and Midstream | Gas Distribution and Storage | Renewable Power Generation | Consolidated | ||||||||||||||||
| Year ended December 31, 2023 | ||||||||||||||||||||
| (millions of Canadian dollars) | ||||||||||||||||||||
| Revenue from products transferred at a point in time | — | 17 | 138 | — | 155 | |||||||||||||||
Revenue from products and services transferred over time1 | 12,132 | 5,763 | 5,890 | 259 | 24,044 | |||||||||||||||
| Total revenue from contracts with customers | 12,132 | 5,780 | 6,028 | 259 | 24,199 | |||||||||||||||
| Liquids Pipelines | Gas Transmission and Midstream | Gas Distribution and Storage | Renewable Power Generation | Consolidated | ||||||||||||||||
| Year ended December 31, 2022 | ||||||||||||||||||||
| (millions of Canadian dollars) | ||||||||||||||||||||
| Revenue from products transferred at a point in time | — | — | 127 | — | 127 | |||||||||||||||
Revenue from products and services transferred over time1 | 11,518 | 5,384 | 6,606 | 281 | 23,789 | |||||||||||||||
| Total revenue from contracts with customers | 11,518 | 5,384 | 6,733 | 281 | 23,916 | |||||||||||||||
| Liquids Pipelines | Gas Transmission and Midstream | Gas Distribution and Storage | Renewable Power Generation | Consolidated | ||||||||||||||||
| Year ended December 31, 2021 | ||||||||||||||||||||
| (millions of Canadian dollars) | ||||||||||||||||||||
| Revenue from products transferred at a point in time | — | — | 70 | — | 70 | |||||||||||||||
Revenue from products and services transferred over time1 | 9,639 | 4,668 | 4,878 | 177 | 19,362 | |||||||||||||||
| Total revenue from contracts with customers | 9,639 | 4,668 | 4,948 | 177 | 19,432 | |||||||||||||||
1Revenue from crude oil and natural gas pipeline transportation, storage, natural gas gathering, compression and treating, natural gas distribution, natural gas storage services and electricity sales.
Performance Obligations Satisfied Over Time
For arrangements involving the transportation and sale of petroleum products and natural gas where the transportation services or commodities are simultaneously received and consumed by the shipper or customer, we recognize revenue over time using an output method based on volumes of commodities delivered or transported. The measurement of the volumes transported or delivered corresponds directly to the benefits received by the shippers or customers during that period.
Determination of Transaction Prices
Prices for transportation and gas processing services are determined based on the capital cost of the facilities, pipelines and associated infrastructure required to provide such services, plus a rate of return on capital invested that is determined either through negotiations with customers or through regulatory processes for those operations that are subject to rate regulation.
Prices for commodities sold are determined by reference to market price indices, plus or minus a negotiated differential and in certain cases a marketing fee.
Prices for natural gas sold and distribution services provided by regulated natural gas distribution operations are prescribed by regulation.
123
5. SEGMENTED INFORMATION
| Year ended December 31, 2023 | Liquids Pipelines | Gas Transmission and Midstream | Gas Distribution and Storage | Renewable Power Generation | Energy Services | Eliminations and Other | Consolidated | ||||||||||||||||
| (millions of Canadian dollars) | |||||||||||||||||||||||
Operating revenues (Note 4) | 12,863 | 5,854 | 5,976 | 477 | 18,989 | (510) | 43,649 | ||||||||||||||||
| Commodity and gas distribution costs | — | (15) | (2,871) | (20) | (18,975) | 515 | (21,366) | ||||||||||||||||
| Operating and administrative | (4,629) | (2,380) | (1,285) | (261) | (52) | 7 | (8,600) | ||||||||||||||||
Impairment of long-lived assets1 | 145 | — | (281) | (283) | — | — | (419) | ||||||||||||||||
Income/(loss) from equity investments (Note 13) | 1,007 | 688 | 2 | 140 | — | (21) | 1,816 | ||||||||||||||||
Other income (Note 27) | 113 | 117 | 51 | 96 | 1 | 846 | 1,224 | ||||||||||||||||
| Earnings/(loss) before interest, income taxes and depreciation and amortization | 9,499 | 4,264 | 1,592 | 149 | (37) | 837 | 16,304 | ||||||||||||||||
| Depreciation and amortization | (4,613) | ||||||||||||||||||||||
Interest expense (Note 17) | (3,812) | ||||||||||||||||||||||
Income tax expense (Note 24) | (1,821) | ||||||||||||||||||||||
| Earnings | 6,058 | ||||||||||||||||||||||
Capital expenditures2 | 1,158 | 1,944 | 1,451 | 100 | — | 55 | 4,708 | ||||||||||||||||
Total property, plant and equipment, net (Note 11) | 51,851 | 31,016 | 18,766 | 2,706 | 4 | 298 | 104,641 | ||||||||||||||||
| Year ended December 31, 2022 | Liquids Pipelines | Gas Transmission and Midstream | Gas Distribution and Storage | Renewable Power Generation | Energy Services | Eliminations and Other | Consolidated | ||||||||||||||||
| (millions of Canadian dollars) | |||||||||||||||||||||||
Operating revenues (Note 4) | 12,052 | 5,426 | 6,729 | 582 | 29,175 | (655) | 53,309 | ||||||||||||||||
| Commodity and gas distribution costs | — | — | (3,693) | (16) | (29,525) | 645 | (32,589) | ||||||||||||||||
| Operating and administrative | (4,287) | (2,254) | (1,289) | (255) | (49) | (85) | (8,219) | ||||||||||||||||
| Impairment of long-lived assets | (245) | — | — | (235) | (13) | (48) | (541) | ||||||||||||||||
Impairment of goodwill (Note 15) | — | (2,465) | — | — | — | — | (2,465) | ||||||||||||||||
Income/(loss) from equity investments (Note 13) | 785 | 1,133 | 1 | 141 | — | (4) | 2,056 | ||||||||||||||||
Gain on joint venture merger transaction (Note 13) | — | 1,076 | — | — | — | — | 1,076 | ||||||||||||||||
Other income/(expense) (Note 27) | 59 | 210 | 79 | 45 | (5) | (977) | (589) | ||||||||||||||||
| Earnings/(loss) before interest, income taxes and depreciation and amortization | 8,364 | 3,126 | 1,827 | 262 | (417) | (1,124) | 12,038 | ||||||||||||||||
| Depreciation and amortization | (4,317) | ||||||||||||||||||||||
Interest expense (Note 17) | (3,179) | ||||||||||||||||||||||
Income tax expense (Note 24) | (1,604) | ||||||||||||||||||||||
| Earnings | 2,938 | ||||||||||||||||||||||
Capital expenditures2 | 1,418 | 1,690 | 1,499 | 50 | — | 33 | 4,690 | ||||||||||||||||
Total property, plant and equipment, net (Note 11) | 53,567 | 29,666 | 17,857 | 3,082 | 6 | 282 | 104,460 | ||||||||||||||||
124
| Year ended December 31, 2021 | Liquids Pipelines | Gas Transmission and Midstream | Gas Distribution and Storage | Renewable Power Generation | Energy Services | Eliminations and Other | Consolidated | ||||||||||||||||
| (millions of Canadian dollars) | |||||||||||||||||||||||
Operating revenues (Note 4) | 10,581 | 4,711 | 4,980 | 512 | 26,917 | (630) | 47,071 | ||||||||||||||||
| Commodity and gas distribution costs | (25) | — | (2,147) | — | (27,174) | 644 | (28,702) | ||||||||||||||||
| Operating and administrative | (3,431) | (1,877) | (1,143) | (180) | (48) | (33) | (6,712) | ||||||||||||||||
Income/(loss) from equity investments (Note 13) | 759 | 702 | 42 | 101 | — | (4) | 1,600 | ||||||||||||||||
Other income/(expense) (Note 27) | 13 | 135 | 385 | 75 | (8) | 379 | 979 | ||||||||||||||||
| Earnings/(loss) before interest, income taxes and depreciation and amortization | 7,897 | 3,671 | 2,117 | 508 | (313) | 356 | 14,236 | ||||||||||||||||
| Depreciation and amortization | (3,852) | ||||||||||||||||||||||
Interest expense (Note 17) | (2,655) | ||||||||||||||||||||||
Income tax expense (Note 24) | (1,415) | ||||||||||||||||||||||
| Earnings | 6,314 | ||||||||||||||||||||||
Capital expenditures2 | 4,051 | 2,420 | 1,343 | 16 | 1 | 54 | 7,885 | ||||||||||||||||
| Total property, plant and equipment, net | 52,530 | 27,028 | 16,904 | 3,315 | 23 | 267 | 100,067 | ||||||||||||||||
1The Liquids Pipelines segment includes the impact of a gain resulting from the derecognition of a net regulatory liability due to the discontinuance of regulatory accounting for our Southern Lights Pipeline (Note 7).
2Includes equity component of AFUDC.
The measurement basis for preparation of segmented information is consistent with our significant accounting policies (Note 2).
GEOGRAPHIC INFORMATION
Revenues1
| Year ended December 31, | 2023 | 2022 | 2021 | ||||||||
| (millions of Canadian dollars) | |||||||||||
| Canada | 23,781 | 27,498 | 20,474 | ||||||||
| US | 19,868 | 25,811 | 26,597 | ||||||||
| 43,649 | 53,309 | 47,071 | |||||||||
1Revenues are based on the country of origin of the product or service sold.
Property, Plant and Equipment1
| December 31, | 2023 | 2022 | ||||||
| (millions of Canadian dollars) | ||||||||
| Canada | 48,570 | 47,602 | ||||||
| US | 56,071 | 56,858 | ||||||
| 104,641 | 104,460 | |||||||
1Amounts are based on the location where the assets are held.
Change in Reportable Segments
Effective January 1, 2024, to better align how the CODM reviews operating performance and resource allocation across operating segments, we transferred our Canadian and US crude oil businesses from the Energy Services segment to the Liquids Pipelines segment. The Energy Services segment will cease to exist and the remainder of the business will be reported in the Eliminations and Other segment. Beginning in the first quarter of 2024, prior period comparable results for segmented information will be recast to reflect the change in reportable segments. This segment reporting change will have no impact on our consolidated results.
125
6. EARNINGS PER COMMON SHARE
BASIC
Earnings per common share is calculated by dividing earnings attributable to common shareholders by 2,020 million, the weighted average number of Enbridgecommon shares outstanding asoutstanding. On December 30, 2021, we closed the sale of December 31, 2020. For purposes of the 2020 STIP award determinations as described on page 26, DCF was converted to DCF per share by taking DCF of C$9,473 million and dividing by 2,020 million, theour minority ownership in Noverco. The weighted average number of Enbridgecommon shares outstanding was reduced by our pro-rata weighted average interest in our own common shares of approximately 2 million as at December 31, 2021 resulting from our reciprocal investment in Noverco.
DILUTED
The treasury stock method is used to determine the dilutive impact of stock options and RSUs. This method assumes any proceeds from the exercise of stock options and vesting of RSUs would be used to purchase common shares at the average market price during the period.
Weighted average shares outstanding used to calculate basic and diluted earnings per share are as follows:
| December 31, | 2023 | 2022 | 2021 | ||||||||
| (number of shares in millions) | |||||||||||
| Weighted average shares outstanding | 2,056 | 2,025 | 2,023 | ||||||||
| Effect of dilutive options and RSUs | 2 | 4 | 2 | ||||||||
| Diluted weighted average shares outstanding | 2,058 | 2,029 | 2,025 | ||||||||
For the years ended December 31, 2023, 2022 and 2021, 19.3 million, 10.4 million and 18.6 million, respectively, of anti-dilutive stock options with a weighted average exercise price of $54.42, $56.49 and $52.89, respectively, were excluded from the diluted earnings per common share calculation.
7. REGULATORY MATTERS
We record assets and liabilities that result from regulated ratemaking processes that would not be recorded under US GAAP for non-regulated entities. See Note 2 - Significant Accounting Policies for further discussion. Our significant regulated businesses and the related accounting impacts are described below.
Under the current authorized rate structure for certain operations, income tax costs are recovered in rates based on the current income tax payable and do not include accruals for deferred income tax. However, as income taxes become payable as a result of the reversal of temporary differences that created the deferred income taxes, it is expected that rates will be adjusted to recover these taxes. Since most of these temporary differences are related to property, plant and equipment costs, this recovery is expected to occur over the life of the related assets. In the absence of rate-regulated accounting, this regulatory tax asset and the related earnings impact would not be recorded.
126
LIQUIDS PIPELINES
Canadian Mainline
Canadian Mainline includes the Canadian portion of our Mainline system. The CTS which governed tolls paid for products shipped on the Canadian Mainline, with the exception of Lines 8 and 9 which are tolled on a separate basis, expired on June 30, 2021 at which point the tolls in place became interim. Enbridge has reached an agreement on a new negotiated settlement, the Mainline Tolling Settlement (MTS), for tolls on its Mainline System. The settlement is subject to regulatory approval and the term is seven and a half years through the end of 2028, with revised interim tolls effective on July 1, 2023. The MTS continues with the previous CTS framework with a Canadian Local Toll for all volumes shipped on the Canadian Mainline and an International Joint Tariff for all volumes shipped from western Canadian receipt points to delivery points on our Lakehead System. We have recognized a regulatory asset of $1.9 billion as at December 31, 2023 (2022 - $2.1 billion) to offset deferred income taxes, as a CER rate order governing flow-through income tax treatment permits future recovery. No other material regulatory assets or liabilities are recognized under the terms of the MTS. During the year ended December 31, 2023, we wrote off $160 million related to regulatory tax assets and $40 million of regulatory deferred tax liabilities that are no longer probable to be flowed through future tolls.
Southern Lights Pipeline
The US and Canadian portions of the Southern Lights Pipeline are regulated by the FERC and CER, respectively. Shippers on the Southern Lights Pipeline are subject to long-term transportation contracts under a cost-of-service toll methodology. Toll adjustments are filed annually with the regulators and provide for the recovery of allowable operating and debt financing costs, plus a pre-determined after-tax return on equity (ROE) of 10%. During the fourth quarter of 2023, Southern Lights Pipeline completed an open season to negotiate new transportation service agreements effective 2025. We do not expect to renew the agreements under a cost-of-service toll methodology, therefore Southern Lights Pipeline is no longer subject to rate-regulated accounting. As a result, $151 million of net regulatory liabilities, $92 million of regulatory tax assets and $23 million of regulatory deferred tax liabilities were derecognized in the year.
GAS TRANSMISSION AND MIDSTREAM
British Columbia Pipeline and Maritimes & Northeast Canada
British Columbia Pipeline and Maritimes & Northeast Canada
British Columbia (BC) Pipeline and Maritimes & Northeast Canada (M&N Canada) are regulated by the CER. Rates are approved by the CER through negotiated toll settlement agreements based on cost-of-service. Both our BC Pipeline and M&N Canada systems currently operate under the terms of their respective 2022 - 2026 and 2022 - 2023 settlement agreements, which stipulate an allowable ROE and the continuation and establishment of certain deferral and variance accounts. The toll settlement agreement for M&N Canada expired in December 2023. M&N Canada reached a toll settlement with shippers for the effective period from January 1, 2024 to December 31, 2025. On November 28, 2023, M&N Canada filed the 2024 - 2025 toll settlement agreement with the CER for review and approval. A CER decision is expected in the first quarter of 2024.
US Gas Transmission
Most of our US gas transmission and storage services are regulated by the FERC and may also be subject to the jurisdiction of various other federal, state and local agencies. The FERC regulates natural gas transmission in US interstate commerce including the establishment of rates for services, while rates for intrastate commerce and/or gathering services are regulated by the state gas commissions. Cost-of-service is the basis for the calculation of regulated tariff rates, although the FERC also allows the use of negotiated and discounted rates within contracts with shippers that may result in a rate that is above or below the FERC-regulated recourse rate for that service.
127
GAS DISTRIBUTION AND STORAGE
Enbridge Gas
Enbridge Gas' distribution rates, commencing in 2019, were set under a five-year Incentive Regulation (IR) framework using a price cap mechanism ending December 31, 2023. The price cap mechanism establishes new rates each year through an annual base rate escalation at inflation less a 0.3% stretch factor, annual updates for certain costs to be passed through to customers, and where applicable, the recovery of material discrete incremental capital investments beyond those that can be funded through base rates. The IR framework includes the continuation and establishment of certain deferral and variance accounts, as well as an earnings sharing mechanism that requires Enbridge Gas to share equally with customers any earnings in excess of 150 basis points over the annual OEB approved ROE.
On December 21, 2023, we received a decision from the OEB on Phase 1 of our 2024 - 2028 Incentive Regulation rate setting framework (Phase 1 Decision). The Phase 1 Decision established new interim rates effective January 1, 2024. In addition, the Phase 1 Decision resulted in the following items not approved for future recovery, and the subsequent impairments recognized for the year ended December 31, 2023:
•a portion of undepreciated capital projects in Property, plant and equipment, net and Intangible assets, net were removed from 2024 rate base of $41 million;
•undepreciated integration capital costs in Intangible assets, net were removed from 2024 rate base of $84 million;
•pre-2017 Union Gas related pension balances in Deferred amounts and other assets of $156 million.
128
FINANCIAL STATEMENT EFFECTS
Accounting for rate-regulated activities has resulted in the recognition of the following regulatory assets and liabilities in the Consolidated Statements of Financial Position.
| December 31, | 2023 | 2022 | Recovery/Refund Period Ends | ||||||||
| (millions of Canadian dollars) | |||||||||||
| Current regulatory assets | |||||||||||
| Purchase gas variance | 15 | 190 | 2024 | ||||||||
| Under-recovery of fuel costs | 75 | 109 | 2024 | ||||||||
| Other current regulatory assets | 380 | 305 | 2024 | ||||||||
Total current regulatory assets1 (Note 9) | 470 | 604 | |||||||||
| Long-term regulatory assets | |||||||||||
Deferred income taxes2 | 4,456 | 4,473 | Various | ||||||||
Long-term debt3 | 348 | 378 | 2032-2046 | ||||||||
Negative salvage4 | 180 | 265 | Various | ||||||||
| Purchase gas variance | — | 244 | 2024 | ||||||||
Accounting policy changes5 | — | 219 | 2024 | ||||||||
Pension plan receivable6 | 1 | 40 | Various | ||||||||
| Other long-term regulatory assets | 252 | 244 | Various | ||||||||
Total long-term regulatory assets1 | 5,237 | 5,863 | |||||||||
| Total regulatory assets | 5,707 | 6,467 | |||||||||
| Current regulatory liabilities | |||||||||||
| Purchase gas variance | 31 | — | 2024 | ||||||||
| Other current regulatory liabilities | 276 | 167 | 2024 | ||||||||
Total current regulatory liabilities7 | 307 | 167 | |||||||||
| Long-term regulatory liabilities | |||||||||||
Future removal and site restoration reserves8 | 1,693 | 1,615 | Various | ||||||||
Regulatory liability related to US income taxes9 | 854 | 918 | 2050-2072 | ||||||||
Pipeline future abandonment costs (Note 23) | 745 | 610 | Various | ||||||||
Pension plan payable6 | 143 | 231 | Various | ||||||||
| Other long-term regulatory liabilities | 86 | 250 | Various | ||||||||
Total long-term regulatory liabilities7 | 3,521 | 3,624 | |||||||||
| Total regulatory liabilities | 3,828 | 3,791 | |||||||||
1Current regulatory assets are included in Other current assets, while long-term regulatory assets are included in Deferred amounts and other assets.
2Represents the regulatory offset to deferred income tax liabilities to the extent that it is expected to be included in future regulator-approved rates and recovered from customers. The recovery period depends on the timing of the reversal of temporary differences. In the absence of rate-regulated accounting, this regulatory balance and the related earnings impact would not be recorded. The balance as at December 31, 2023 is net of regulatory deferred tax write-offs.
3Represents our regulatory offset to the fair value adjustment to debt acquired in our merger with Spectra Energy Corp. (Spectra Energy). The offset is viewed as a proxy for the regulatory asset that would be recorded in the event such debt was extinguished at an amount higher than the carrying value.
4The negative salvage balance represents the recovery in future rates of the actual cost of removal of previously retired or decommissioned plant assets, as approved by the FERC.
5In 2022, this deferral primarily consisted of unamortized accumulated actuarial gains/losses and past service costs incurred by Union Gas Limited, relating to the period up to our merger with Spectra Energy, which were previously recorded in AOCI. The amortization of this balance is recognized as a component of accrual-based pension expenses, which are included in Other income/(expense) and recovered in rates, as previously approved by the OEB. The Phase 1 Decision disallowed recovery of the remaining balance related to pre-2017 pension amounts and was impaired with a nil balance as at December 31, 2023. The residual balance in this account pertains to the impact of other accounting changes during the deferred rebasing period and were approved for disposition in 2024 in the Phase 1 Decision and subsequently transferred to Other current regulatory assets as at December 31, 2023.
6Represents the regulatory offset to our pension liability to the extent that it is expected to be included in regulator-approved future rates and recovered from customers. The settlement period for this balance is not determinable. In the absence of rate-regulated accounting, this regulatory balance and the related pension expense would be recorded in earnings and OCI.
7Current regulatory liabilities are included in Other current liabilities, while long-term regulatory liabilities are included in Other long-term liabilities.
129
8Future removal and site restoration reserves consists of amounts collected from customers, with the approval of the OEB, to fund future costs of removal and site restoration relating to property, plant and equipment. These costs are collected as part of the depreciation expense charged on property, plant and equipment that is reflected in rates. The settlement of this balance will occur over the long-term as costs are incurred. In the absence of rate-regulated accounting, depreciation rates would not include a charge for removal and site restoration and costs would be charged to earnings as incurred with recognition of revenue for amounts previously collected.
9The regulatory liability related to US income taxes resulted from the US tax reform legislation dated December 22, 2017. These balances will be refunded to customers in accordance with the respective rate settlements approved by the FERC.
8. ACQUISITIONS AND DISPOSITIONS
ACQUISITIONS
Aitken Creek Gas Storage
On November 1, 2023, through a wholly-owned Canadian subsidiary, we acquired a 93.8% interest in Aitken Creek Gas Storage Facility and a 100% interest in Aitken Creek North Gas Storage Facility (collectively, Aitken Creek), located in BC, Canada, for $400 million, subject to other customary closing adjustments (the Aitken Creek Acquisition). Aitken Creek is the only underground natural gas storage facility in BC and connects to all major natural gas pipelines in western Canada. The Aitken Creek Acquisition enables us to continue to meet regional energy needs and to support increasing demand for liquefied natural gas (LNG) exports.
We accounted for the Aitken Creek Acquisition using the acquisition method as prescribed by ASC 805 Business Combinations. In accordance with valuation methodologies described in ASC 820 Fair Value Measurements, the acquired assets and assumed liabilities are recorded at their estimated fair values as at the date of acquisition.
The following table summarizes the estimated preliminary fair values that were assigned to the net assets of Aitken Creek:
| November 1, 2023 | |||||
| (millions of Canadian dollars) | |||||
| Fair value of net assets acquired: | |||||
| Current assets (a) | 105 | ||||
| Property, plant and equipment (b) | 466 | ||||
| Current liabilities | 20 | ||||
| Long-term liabilities (c) | 130 | ||||
| Goodwill (d) | 46 | ||||
| Purchase price: | |||||
| Cash | 397 | ||||
| Additional consideration (e) | 70 | ||||
| 467 | |||||
a) Current assets consist primarily of inventory which is short-term in nature and represents natural gas held in storage. Fair value was determined using the market price of natural gas at the date of acquisition.
b) Aitken Creek's property, plant and equipment constitutes an integrated system of cavern storage facilities, associated header pipeline, and land and right-of-ways. The depreciated replacement cost approach was adopted as the primary valuation methodology to determine the fair value of property, plant and equipment, excluding the reservoir storage asset. In determining replacement cost, both indirect costing using relevant inflation indices and direct costing using relevant market quotes were utilized. Adjustments were then applied for physical deterioration as well as functional and economic obsolescence.
130
Fair value of the reservoir storage asset was determined using a residual approach whereby the adjusted purchase price was allocated to the fair value of the net tangible assets, excluding the reservoir storage asset, with the remaining value allocated to the reservoir storage asset. The income approach was also utilized to corroborate that the cash flows attributable to the reservoir storage asset support the residual value.
c) Long-term liabilities consist primarily of a deferred income tax liability arising from temporary differences between the tax bases of assets and liabilities and their carrying values for accounting purposes at the date of acquisition.
d) Goodwill is primarily attributable to the recognition of a deferred income tax liability. The goodwill balance recognized has been assigned to our Gas Transmission and Midstream segment and is not tax deductible.
e) The $70 million of additional consideration recognized in the purchase price represents the fair value of derivative contracts and working gas as at March 31, 2023.
Upon completion of the Aitken Creek Acquisition, we began consolidating Aitken Creek. For the period beginning November 1, 2023 through to December 31, 2023, operating revenues and earnings attributable to common shareholders generated by Aitken Creek were immaterial. The impact to our supplemental pro forma consolidated operating revenues and earnings attributable to common shareholders for the years ended December 31, 2023 and 2022, as if the Aitken Creek Acquisition had been completed on January 1, 2022, was also immaterial.
Acquisitions of US Gas Utilities
On September 5, 2023, we announced that Enbridge had entered into three separate definitive agreements with Dominion Energy, Inc. to acquire The East Ohio Gas Company, Questar Gas Company and its related Wexpro companies, and Public Service Company of North Carolina for an aggregate purchase price of $19.1 billion (US$14.0 billion), comprised of $12.8 billion (US$9.4 billion) of cash consideration and $6.3 billion (US$4.6 billion) of assumed debt, subject to customary closing adjustments (together, the Acquisitions). The Acquisitions are expected to close in 2024, subject to the satisfaction of customary closing conditions including the receipt of certain regulatory approvals, which are not cross-conditional.
On September 8, 2023, we closed a public offering of 102,913,500 common shares at a price of $44.70 per share for gross proceeds of $4.6 billion which is intended to finance a portion of the aggregate cash consideration payable for the Acquisitions.
We closed two offerings in September 2023 and four offerings in November 2023 for aggregate principal amounts of US$5.5 billion and $1.0 billion. The proceeds from the September 2023 offerings and a portion of the November 2023 offerings are intended to finance a portion of the aggregate cash consideration payable for the Acquisitions. Refer to Note 17 - Debt for further details on the debt issuances and credit facility obtained to support the Acquisitions.
Tres Palacios Holdings LLC
On April 3, 2023, we acquired Tres Palacios Holdings LLC (Tres Palacios) for $451 million (US$335 million) of cash. Tres Palacios is a natural gas storage facility located in the US Gulf Coast and its infrastructure serves Texas gas-fired power generation and LNG exports, as well as Mexico pipeline exports.
131
We allocated assets with a fair value of $790 million (US$588 million) to Property, plant and equipment, net, of which $254 million (US$189 million) relates to storage cavern right-of-use assets, and recorded the related lease liabilities of $7 million (US$5 million) and $248 million (US$184 million) to Current portion of long-term debt and Long-term debt, respectively, in the Consolidated Statements of Financial Position. The acquired assets are included in our Gas Transmission and Midstream segment.
Tri Global Energy, LLC
On September 27, 2022, through a wholly-owned US subsidiary, we acquired all of the outstanding common units in TGE for cash consideration of $295 million (US$215 million) plus potential contingent payments of up to $72 million (US$53 million) dependent on the achievement of performance milestones by TGE (the TGE Acquisition).TGE is an onshore renewable project developer in the US with a development portfolio of wind and solar projects. The TGE Acquisition enhances Enbridge's renewable power platform and accelerates our North American growth strategy.
We accounted for the TGE Acquisition using the acquisition method as prescribed by ASC 805 Business Combinations. In accordance with valuation methodologies described in ASC 820 Fair Value Measurements, the acquired assets and assumed liabilities are recorded at their estimated fair values as at the date of acquisition.
The following table summarizes the estimated fair values that were assigned to the net assets of TGE:
| September 27, 2022 | |||||
| (millions of Canadian dollars) | |||||
| Fair value of net assets acquired: | |||||
| Current assets | 5 | ||||
| Property, plant and equipment | 3 | ||||
| Long-term investments | 8 | ||||
| Intangible assets (a) | 117 | ||||
| Long-term assets | 3 | ||||
| Current liabilities | 61 | ||||
| Long-term debt | 18 | ||||
| Long-term liabilities (b) | 105 | ||||
| Goodwill (c) | 392 | ||||
| Purchase price: | |||||
| Cash | 295 | ||||
| Contingent consideration (d) | 49 | ||||
| 344 | |||||
a) Intangible assets consist of compensation expected to be earned by TGE on existing development contracts once certain project development milestones are met. Fair value was determined using a discounted cash flow method which is an income-based approach to valuation that estimates the present value of future projected benefits from the contracts. The intangible assets will be amortized on a straight-line basis over an expected useful life of three and a half years.
b) Long-term liabilities consist primarily of obligations payable to third parties which are contingent on milestones being met for certain projects. Fair value represents the present value of the future cash flow payments at the date of the TGE Acquisition.
c) Goodwill is primarily attributable to expected future returns from new opportunities to develop wind and solar projects, as well as enhanced scale and operational diversity of our renewable projects portfolio. The goodwill balance recognized has been assigned to our Renewable Power Generation segment and is tax deductible over 15 years.
132
d) We agreed to pay additional contingent consideration of up to US$53 million to TGE's former
common unit holders if performance milestones are met on certain projects. The US$36 million of contingent consideration recognized in the purchase price represents the fair value of contingent
consideration at the date of acquisition. The fair value was determined using an income-based approach.
Upon completion of the TGE Acquisition, we began consolidating TGE. For the period beginning September 27, 2022 through to December 31, 2022, operating revenues and earnings attributable to common shareholders generated by TGE were immaterial. The impact to our supplemental pro forma consolidated operating revenues and earnings attributable to common shareholders for the years ended December 31, 2022 and 2021, as if the TGE Acquisition had been completed on January 1, 2021, was also immaterial.
Moda Midstream Operating, LLC
On October 12, 2021, through a wholly-owned US subsidiary, we acquired all of the outstanding membership interests in Moda for $3.7 billion (US$3.0 billion) of cash plus potential contingent payments of up to US$150 million dependent on performance of the assets (the Moda Acquisition). Moda owns and operates a light crude export platform with very large crude carrier capability. The Moda Acquisition aligns with and advances our US Gulf Coast export strategy and enables connectivity to low-cost and long-lived reserves in the Permian and Eagle Ford basins.
We accounted for the Moda Acquisition using the acquisition method as prescribed by ASC 805 Business Combinations. In accordance with valuation methodologies described in ASC 820 Fair Value Measurements, the acquired assets and assumed liabilities were recorded at their estimated fair values as at the date of acquisition.
The following table summarizes the estimated fair values that were assigned to the net assets of Moda:
| October 12, 2021 | |||||
| (millions of Canadian dollars) | |||||
| Fair value of net assets acquired: | |||||
| Current assets | 62 | ||||
| Property, plant and equipment (a) | 1,480 | ||||
| Long-term investments (b) | 427 | ||||
| Intangible assets (c) | 1,781 | ||||
| Current liabilities | 59 | ||||
| Long-term liabilities | 17 | ||||
| Goodwill (d) | 268 | ||||
| Purchase price: | |||||
| Cash | 3,755 | ||||
| Contingent consideration (e) | 187 | ||||
| 3,942 | |||||
a) Due to the specialized nature of Moda's property, plant and equipment, which includes groups of assets configured for use as storage facilities, pipelines and export terminals, the depreciated replacement cost approach was adopted as the primary valuation methodology. In determining replacement cost, both indirect costing using relevant inflation indices and direct costing using relevant market quotes were utilized. Adjustments were then applied for physical deterioration as well as functional and economic obsolescence. The fair value of land was determined using a market approach, which is based on rents and offerings for comparable properties.
133
b) Long-term investments represent Moda's 20% equity interest in Cactus II Pipeline LLC (Cactus II). The fair value of Cactus II was determined using the discounted cash flow method. The discounted cash flow method is an income-based approach to valuation which estimates the present value of future projected benefits from the investment.
c) Intangible assets consist primarily of customer relationships associated with long-term take-or-pay contracts. Fair value was determined using an income-based approach by estimating the present value of the after-tax earnings attributable to the contracts, including earnings associated with expected renewal terms, and will be amortized on a straight-line basis over an expected useful life of 10 years.
d) Goodwill is primarily attributable to uncontracted future revenues, existing assembled assets that cannot be duplicated at the same cost by a new entrant, and enhanced scale and geographic diversity which provide greater optionality and platforms for future growth. The goodwill balance recognized has been assigned to our Liquids Pipelines segment and is tax deductible over 15 years.
e) We agreed to pay additional contingent consideration of up to US$150 million to Moda's former membership interest holders if Moda's monthly volumes of crude oil loaded onto a vessel equal or exceed specified throughput levels. These performance requirements terminate the earlier of December 31, 2020.2023 or the date the final contingent payment is made. The US$150 million of contingent consideration recognized in the purchase price represents the fair value of contingent consideration at the date of acquisition and was fully settled as at December 31, 2022.
Acquisition-related expenses incurred were approximately $21 million for the year ended December 31, 2021 and are included in Operating and administrative expense in the Consolidated Statements of Earnings.
Upon completion of the Moda Acquisition, we began consolidating Moda. For purposesthe period beginning October 12, 2021 through to December 31, 2021, Moda generated approximately $80 million in operating revenues and $9 million in earnings attributable to common shareholders.
Our supplemental pro forma consolidated financial information for the year ended December 31, 2021, including the results of 2018 PSU payout determinationsoperations for Moda as describedif the Moda Acquisition had been completed on pageJanuary 1, 2020, are as follows:
| Year ended December 31, | 2021 | |||||||
| (unaudited; millions of Canadian dollars) | ||||||||
| Operating revenues | 47,339 | |||||||
Earnings attributable to common shareholders1,2 | 5,771 | |||||||
1Acquisition-related expenses of $21 million (after-tax $16 million) were excluded from earnings attributable to common shareholders for the year ended December 31, DCF2021.
2Includes the amortization of fair value adjustments recorded for acquired property, plant and equipment, long-term investments and intangible assets of $193 million (after-tax of $145 million) for the year ended December 31, 2021.
DISPOSITIONS
Athabasca Regional Oil Sands System
On October 5, 2022, we closed the sale of an 11.6% non-operating interest in seven pipelines in the Athabasca region of northern Alberta from our Regional Oil Sands System to Athabasca Indigenous Investments Limited Partnership (Aii), an entity representing 23 First Nation and Métis communities, for total consideration of approximately $1.1 billion, less customary closing adjustments. No gain or loss was convertedrecognized on the sale and a noncontrolling interest was recorded in our Consolidated Statements of Financial Position as at December 31, 2022 to DCF perreflect the interest held by Aii (Note 19).
134
Subsequent to the sale, we maintained an 88.4% controlling interest in these assets, which are a component of our Liquids Pipelines segment, and continue to manage, operate and provide administrative services to them.
9. OTHER CURRENT ASSETS
| December 31, | 2023 | 2022 | ||||||
| (millions of Canadian dollars) | ||||||||
Derivative assets (Note 23) | 623 | 1,015 | ||||||
Regulatory assets (Note 7) | 470 | 604 | ||||||
| Gas imbalances | 209 | 461 | ||||||
| Income taxes receivable | 347 | 323 | ||||||
| Other | 791 | 852 | ||||||
| 2,440 | 3,255 | |||||||
10. INVENTORY
| December 31, | 2023 | 2022 | ||||||
| (millions of Canadian dollars) | ||||||||
| Natural gas | 938 | 1,491 | ||||||
| Crude oil | 413 | 652 | ||||||
| Other | 128 | 112 | ||||||
| 1,479 | 2,255 | |||||||
11. PROPERTY, PLANT AND EQUIPMENT
| Weighted Average | |||||||||||
| December 31, | Depreciation Rate | 2023 | 2022 | ||||||||
| (millions of Canadian dollars) | |||||||||||
| Pipelines | 2.9 | % | 66,698 | 66,528 | |||||||
| Facilities and equipment | 3.1 | % | 37,634 | 37,028 | |||||||
Land and right-of-way1 | 2.3 | % | 3,600 | 3,637 | |||||||
| Gas mains, services and other | 2.6 | % | 15,346 | 14,491 | |||||||
| Storage | 2.5 | % | 4,929 | 3,477 | |||||||
| Wind turbines, solar panels and other | 4.1 | % | 4,511 | 4,912 | |||||||
| Other | 10.1 | % | 1,652 | 1,611 | |||||||
| Under construction | — | % | 2,829 | 2,316 | |||||||
| Total property, plant and equipment | 137,199 | 134,000 | |||||||||
| Total accumulated depreciation | (32,558) | (29,540) | |||||||||
| Property, plant and equipment, net | 104,641 | 104,460 | |||||||||
1The measurement of weighted average depreciation rate excludes non-depreciable assets.
Depreciation expense for the years ended December 31, 2023, 2022 and 2021 was $4.0 billion, $3.8 billion and $3.5 billion, respectively.
IMPAIRMENT
Chapman Ranch Wind Farm
Chapman Ranch Wind Farm (Chapman Ranch) is experiencing financial challenges associated with the original equipment integrity. As a result, we have recognized an impairment loss of $251 million for the year ended December 31, 2023, which is included in Impairment of long-lived assets in the Consolidated Statements of Earnings and is part of our Renewable Power Generation segment.
135
Magic Valley Wind Farm
In 2022, Magic Valley Wind Farm (Magic Valley) had commercial challenges caused by electricity transmission congestion and a negative price differential arising from higher transmission costs resulting in a lower electricity sale price. As a result, we recognized an impairment loss of $227 million for the year ended December 31, 2022, which is included in Impairment of long-lived assets in the Consolidated Statements of Earnings and is part of our Renewable Power Generation segment.
Bakken Pipeline System
For the year ended December 31, 2022, we recognized an impairment loss of $183 million on the US and Canadian components of the interstate pipeline transportation system within the North Dakota System of our Bakken Pipeline System in connection with the expiration of certain long-term take-or-pay contracts in 2023. This loss is included in Impairment of long-lived assets in the Consolidated Statements of Earnings and is part of our Liquids Pipelines segment.
Impairment charges were based on the amount by which the carrying value of the assets exceeded fair value, determined using expected discounted future cash flows.
12. VARIABLE INTEREST ENTITIES
CONSOLIDATED VARIABLE INTEREST ENTITIES
Our consolidated VIEs consist of legal entities where we are the primary beneficiary. We are the primary beneficiary when our variable interest(s) provide us with (i) the power to direct the activities of the VIE that most significantly impact the VIE's economic performance and (ii) the obligation to absorb losses of the VIE or the right to receive benefits from the VIE that could potentially be significant to the VIE. We determine whether we are the primary beneficiary of a VIE by considering qualitative and quantitative factors, including, but not limited to: decision-making responsibilities, the VIE capital structure, risk and rewards sharing, contractual agreements with the VIE, voting rights and level of involvement of other parties.
136
The following table includes assets to be used to settle liabilities of our consolidated VIEs. The creditors of the liabilities of our consolidated VIEs do not have recourse to our general credit as the primary beneficiary. These assets and liabilities are included in the Consolidated Statements of Financial Position.
| December 31, | 2023 | 2022 | ||||||
| (millions of Canadian dollars) | ||||||||
| Assets | ||||||||
| Cash and cash equivalents | 442 | 426 | ||||||
| Restricted cash | 9 | 12 | ||||||
| Trade receivables and unbilled revenue | 144 | 185 | ||||||
| Other current assets | 8 | 14 | ||||||
| Accounts receivable from affiliates | 5 | 23 | ||||||
| Inventory | 11 | 12 | ||||||
| 619 | 672 | |||||||
| Property, plant and equipment, net | 7,105 | 7,707 | ||||||
| Long-term investments | 14 | 14 | ||||||
| Restricted long-term investments | 106 | 98 | ||||||
| Deferred amounts and other assets | 148 | 158 | ||||||
| Intangible assets, net | 84 | 102 | ||||||
| 8,076 | 8,751 | |||||||
| Liabilities | ||||||||
| Trade payables and accrued liabilities | 83 | 99 | ||||||
| Other current liabilities | 145 | 152 | ||||||
| Accounts payable to affiliates | 4 | 21 | ||||||
| 232 | 272 | |||||||
| Long-term debt | 1 | — | ||||||
| Other long-term liabilities | 971 | 859 | ||||||
| Deferred income taxes | 5 | 5 | ||||||
| 1,209 | 1,136 | |||||||
| 6,867 | 7,615 | |||||||
We do not have obligations to provide additional financial support to any of our consolidated VIEs.
UNCONSOLIDATED VARIABLE INTEREST ENTITIES
We currently hold interests in several non-consolidated VIEs where we are not the primary beneficiary as we do not have the power to direct the activities of the VIEs that most significantly impact their economic performance. These interests include investments in limited partnerships that are assessed to be VIEs due to the limited partners not having substantive kick-out rights or participating rights. The power to direct the activities of a majority of these non-consolidated limited partnership VIEs is shared amongst the partners. Each partner has representatives that make up an executive committee that makes significant decisions for the VIE, and none of the partners may make significant decisions unilaterally.
137
The carrying amount of these VIEs and our estimated maximum exposure to loss as at December 31, 2023 and 2022 are presented below:
| Carrying Amount of | Maximum Exposure to | |||||||
| December 31, 2023 | the VIE | Loss | ||||||
| (millions of Canadian dollars) | ||||||||
Aux Sable Liquid Products L.P.1 | 105 | 130 | ||||||
Rampion Offshore Wind Limited2 | 391 | 452 | ||||||
Vector Pipeline L.P.3 | 191 | 320 | ||||||
Woodfibre LNG Limited Partnership4 | 778 | 2,854 | ||||||
Fox Squirrel Solar LLC5 | 312 | 661 | ||||||
Other4 | 132 | 230 | ||||||
| 1,909 | 4,647 | |||||||
| Carrying Amount of | Maximum Exposure to | |||||||
| December 31, 2022 | the VIE | Loss | ||||||
| (millions of Canadian dollars) | ||||||||
Aux Sable Liquid Products L.P.1 | 91 | 117 | ||||||
EIH S.á r.l.6 | 37 | 637 | ||||||
Rampion Offshore Wind Limited2 | 413 | 468 | ||||||
Vector Pipeline L.P.3 | 195 | 325 | ||||||
Woodfibre LNG Limited Partnership4 | 635 | 2,476 | ||||||
Other4 | 245 | 443 | ||||||
| 1,616 | 4,466 | |||||||
1As at December 31, 2023 and 2022, the maximum exposure to loss includes a guarantee by us for our respective share of the VIE's borrowing on a bank credit facility.
2As at December 31, 2023 and 2022, the maximum exposure to loss includes our parental guarantees that have been committed in project contracts in which we would be liable for in the event of default by taking DCFthe VIE.
3As at December 31, 2023 and 2022, the maximum exposure to loss includes the carrying value of C$9,848outstanding affiliate loans receivable for $24 million and dividing$25 million held by 2,020us as at December 31, 2023 and 2022, respectively, and an outstanding credit facility for $105 million as at December 31, 2023 and 2022.
4As at December 31, 2023 and 2022, the maximum exposure to loss includes our parental guarantees that have been committed in connection with the project for which we would be liable in the event of default by the VIE.
5In November 2023, Enbridge acquired a 50% interest in Fox Squirrel JV, LLC (Fox Squirrel Solar LLC). Refer to Note 13 - Long-Term Investments. Fox Squirrel Solar LLC is a VIE due to its lack of sufficient equity at risk to finance its activities. Enbridge does not hold decision-making rights to direct Fox Squirrel Solar LLC's activities that most significantly impacts its economic performance. As at December 31, 2023, the maximum exposure to loss includes our parental guarantees that have been committed in project contracts in which we would be liable for in the event of default by the VIE.
6As at December 31, 2023, EIH S.á r.l no longer met the requirements of a VIE as a result of a VIE reconsideration event. As at December 31, 2022, the maximum exposure to loss includes our parental guarantees that have been committed in connection with the three French offshore wind projects for which we would be liable in the event of default by the VIE and an outstanding affiliate loan receivable for $56 million.
We do not have an obligation to and did not provide any additional financial support to the VIEs during the years ended December 31, 2023 and 2022.
138
13. LONG-TERM INVESTMENTS
| Ownership | |||||||||||
| December 31, | Interest | 2023 | 2022 | ||||||||
| (millions of Canadian dollars) | |||||||||||
| EQUITY INVESTMENTS | |||||||||||
| Liquids Pipelines | |||||||||||
MarEn Bakken Company LLC1 | 75.0 | % | 1,819 | 1,968 | |||||||
DCP Midstream, LLC (Class B Units)2 | 90.0 | % | 1,486 | 1,394 | |||||||
| Seaway Crude Holdings LLC | 50.0 | % | 2,661 | 2,744 | |||||||
Illinois Extension Pipeline Company, L.L.C.3 | 65.0 | % | 584 | 622 | |||||||
Cactus II Pipeline LLC4 | 30.0 | % | 618 | 658 | |||||||
| Other | 30.0% - 43.8% | 84 | 76 | ||||||||
| Gas Transmission and Midstream | |||||||||||
Alliance Pipeline5, 7 | 50.0 | % | 359 | 430 | |||||||
Aux Sable6, 7 | 42.7% - 50.0% | 229 | 214 | ||||||||
DCP Midstream, LLC (Class A Units)8 | 23.4 | % | 367 | 317 | |||||||
| Gulfstream Natural Gas System, L.L.C. | 50.0 | % | 1,224 | 1,274 | |||||||
| NEXUS Gas Transmission, LLC | 50.0 | % | 1,220 | 1,813 | |||||||
| Sabal Trail Transmission, LLC | 50.0 | % | 1,467 | 1,535 | |||||||
| Southeast Supply Header, LLC | 50.0 | % | 80 | 86 | |||||||
| Steckman Ridge, LP | 50.0 | % | 87 | 91 | |||||||
Vector Pipeline9 | 60.0 | % | 191 | 195 | |||||||
Woodfibre LNG Limited Partnership10 | 30.0 | % | 777 | 635 | |||||||
| Offshore - various joint ventures | 22.0% - 74.3% | 217 | 314 | ||||||||
| Gas Distribution and Storage | |||||||||||
| Other | 30.0% - 50.0% | 22 | 20 | ||||||||
| Renewable Power Generation | |||||||||||
EIH S.à r.l.11 | 51.0 | % | 52 | 37 | |||||||
| Hohe See and Albatros Offshore Wind Facilities | 49.9 | % | 1,701 | 163 | |||||||
| Rampion Offshore Wind Limited | 24.9 | % | 391 | 413 | |||||||
| East-West Tie Limited Partnership | 24.1 | % | 132 | 241 | |||||||
| Fox Squirrel Solar LLC | 50.0 | % | 312 | — | |||||||
| Other | 16.4% - 50.0% | 110 | 107 | ||||||||
| OTHER LONG-TERM INVESTMENTS | |||||||||||
| Gas Transmission and Midstream | |||||||||||
| Ara Divert HoldCo, Inc. | 106 | — | |||||||||
| Other | 22 | 22 | |||||||||
| Gas Distribution and Storage | |||||||||||
| Other | 24 | 48 | |||||||||
| Renewable Power Generation | |||||||||||
| Other | 21 | 31 | |||||||||
| Eliminations and Other | |||||||||||
Other12 | 430 | 488 | |||||||||
| 16,793 | 15,936 | ||||||||||
1Owns a 49.0% interest in Bakken Pipeline Investments LLC. Bakken Pipeline Investments LLC owns 75.0% of the Bakken Pipeline System, resulting in a 27.6% effective interest in the Bakken Pipeline System by us.
2We own 90.0% of the Class B units of DCP Midstream, LLC. These units track to a 65.0% ownership in Gray Oak Pipeline, LLC (Gray Oak), resulting in a 58.5% effective interest in Gray Oak by us. On January 9, 2023, we acquired an additional 10.0% direct interest in Gray Oak for cash consideration of $230 million (US$172 million), bringing our effective interest to 68.5%.
3Owns the Southern Access Extension Project.
4On October 12, 2021, we acquired a 20.0% equity interest in Cactus II through the Moda Acquisition (Note 8). On November 2, 2022, we acquired an additional 10.0% ownership in Cactus II for cash consideration of $241 million (US$177 million), bringing our total non-operating ownership to 30.0%.
5Includes Alliance Pipeline Limited Partnership in Canada and Alliance Pipeline L.P. in the US.
6Includes Aux Sable Canada LP in Canada and Aux Sable Liquid Products L.P. and Aux Sable Midstream LLC in the US.
139
7On December 13, 2023, we announced that Enbridge had entered into a definitive agreement to sell its 50.0% interest in the Alliance Pipeline and interest in Aux Sable to Pembina Pipeline Corporation for $3.1 billion, including approximately $0.3 billion of non-recourse debt, subject to customary closing adjustments.
8We own 23.4% of the Class A units of DCP Midstream, LLC. These units track to a 56.5% ownership in DCP Midstream, LP (DCP), resulting in a 13.2% effective interest in DCP by us.
9Includes Vector Pipeline Limited Partnership in Canada and Vector Pipeline L.P. in the US.
10 On November 29, 2022, we acquired an effective 30.0% interest in Woodfibre LNG Limited Partnership (Woodfibre) for cash consideration of $533 million (US$392 million). Woodfibre will operate a LNG export facility in BC being constructed by us and our partners.
11 Owns a 50.0% interest in Éolien Maritime France SAS (EMF). Through our investment in EMF, we own equity interests in three French offshore wind projects, including effective interests in Saint-Nazaire (25.5%), Fécamp (17.9%) and Calvados (21.7%).
12 Consists of investments in exchange-traded funds and debt securities held by our wholly-owned captive insurance subsidiaries. Refer to Note 23 - Risk Management and Financial Instruments.
Equity investments include the unamortized excess of the purchase price over the underlying net book value of the investees' assets at the purchase date. As at December 31, 2023, this basis difference was $3.5 billion (2022 - $3.4 billion), of which $1.7 billion (2022 - $1.5 billion) was amortizable.
For the years ended December 31, 2023, 2022 and 2021, distributions received from equity investments were $3.1 billion, $2.6 billion and $2.2 billion, respectively.
Summarized combined financial information of our unconsolidated equity investments (presented at 100%) is as follows:
| Year ended December 31, | 2023 | 20221 | 20211 | ||||||||
| (millions of Canadian dollars) | |||||||||||
| Operating revenues | 22,586 | 30,026 | 22,551 | ||||||||
| Operating expenses | 17,111 | 23,835 | 17,446 | ||||||||
| Earnings | 4,818 | 5,123 | 3,656 | ||||||||
| Earnings attributable to Enbridge | 1,816 | 2,056 | 1,600 | ||||||||
| December 31, | 2023 | 20221 | ||||||
| (millions of Canadian dollars) | ||||||||
| Current assets | 5,842 | 5,328 | ||||||
| Non-current assets | 61,141 | 61,393 | ||||||
| Current liabilities | 6,194 | 5,631 | ||||||
| Non-current liabilities | 23,957 | 23,208 | ||||||
| Noncontrolling interests | 4,124 | 4,640 | ||||||
1 Balances have been updated to reflect the impact of revisions made to conform to the current year's presentation. These revisions do not have an effect on our previously reported consolidated statements of earnings, comprehensive income, changes in equity, cash flows or financial position.
OTHER EQUITY INVESTMENT TRANSACTIONS
Fox Squirrel Solar LLC
On November 15, 2023, we acquired a 50% interest in a newly formed partnership with EDF Renewables North America to participate in the initial phase of a solar power facility in Ohio. Cash consideration includes an upfront payment of $157 million (US$115 million) and subsequent capital commitments up to $398 million (US$291 million). Investments past the first phase are contingent on certain conditions being met. An additional payment of $164 million (US$123 million) was made at Phase 1 in-service in December 2023.
140
Hohe See and Albatros Offshore Wind Facilities
On November 3, 2023, we acquired an additional 24.45% interest in the Hohe See Offshore Wind Facilities and Albatros Offshore Wind Facilities (the Offshore Wind Facilities), through the acquisition of a 49% interest in Enbridge Renewable Infrastructure Investments S.à r.l (ERII), for $391 million (€267 million) of cash and assumed debt of $524 million (€358 million), bringing our interest in the Offshore Wind Facilities to 49.9%. The Hohe See Offshore Wind Facilities and Albatros Offshore Wind Facilities are located approximately 100 kilometers off the northern coast of Germany and came into service in 2019 and 2020, respectively. Subsequent to the purchase, our interest in ERII is consolidated and our interest in the Offshore Wind Facilities will continue to be accounted for as an equity method investment included in the Renewable Power Generation segment.
DCP Midstream, LLC
On August 17, 2022, we completed a joint venture merger transaction with Phillips 66 resulting in a single joint venture, DCP Midstream, LLC, holding both our and Phillips 66's indirect ownership interests in Gray Oak and DCP. Our ownership in DCP Midstream, LLC consists of Class A and Class B Interests which track to our investments in DCP, included in the Gas Transmission and Midstream segment, and Gray Oak, included in the Liquids Pipelines segment, respectively. Through our investment in DCP Midstream, LLC, we increased our effective economic interest in Gray Oak to 58.5% from 22.8% and reduced our effective economic interest in DCP to 13.2% from 28.3%. As a result of the transaction, Enbridge assumed operatorship of Gray Oak in the second quarter of 2023.
We determined the fair value of our decrease in economic interest in DCP based on the unadjusted quoted market price of DCP's publicly traded common units on the transaction closing date. The fair value of our increased economic interest in Gray Oak was determined using the fair value prescribed to the change in our economic interest in DCP. As a result of the merger transaction and the realignment of our economic interests in DCP and Gray Oak, we also received cash consideration of approximately $522 million (US$404 million) and recorded an accounting gain of $1.1 billion (US$832 million) to Gain on joint venture merger transaction in the Consolidated Statements of Earnings. Both DCP and Gray Oak continue to be accounted for as equity method investments.
Noverco Inc.
On June 7, 2021, IPL System Inc., a wholly-owned subsidiary of Enbridge, entered into a purchase and sale agreement to sell its 38.9% common share and preferred share interest in Noverco to Trencap L.P. On December 30, 2021, we closed the sale of Noverco for cash proceeds of $1.1 billion. After closing adjustments, a gain on disposal of $303 million before tax was included in Other income/(expense) in the Consolidated Statements of Earnings for the year ended December 31, 2021. Noverco was previously included in our Gas Distribution and Storage segment.
IMPAIRMENT OF EQUITY INVESTMENTS
PennEast Pipeline Company, LLC
PennEast Pipeline Company, LLC (PennEast) is a joint venture formed to develop a natural gas transmission pipeline to serve local distribution companies and power generators in southeastern Pennsylvania and New Jersey, is owned 20.0% by Enbridge, and is recorded as an equity method investment. In the third quarter of 2021, PennEast determined further development of the project was no longer viable and development of the project was ceased. As a result, we recorded an other-than-temporary impairment loss of $111 million on our investment for the year ended December 31, 2021 based on the estimated fair value of our share of the net assets. The carrying value of this investment was nil as at December 31, 2023 and 2022.
Our investment in PennEast formed part of our Gas Transmission and Midstream segment. The impairment loss was recorded within Income from equity investments in the Consolidated Statements of Earnings.
141
14. INTANGIBLE ASSETS
| December 31, 2023 | Weighted Average Amortization Rate | Cost | Accumulated Amortization | Net | ||||||||||
| (millions of Canadian dollars) | ||||||||||||||
| Software | 12.0 | % | 1,921 | (1,090) | 831 | |||||||||
| Power purchase agreements | 4.3 | % | 58 | (24) | 34 | |||||||||
Project agreement1 | 4.0 | % | 158 | (41) | 117 | |||||||||
| Customer relationships | 8.6 | % | 2,636 | (675) | 1,961 | |||||||||
| Other intangible assets | 8.2 | % | 603 | (185) | 418 | |||||||||
| Under development | — | % | 176 | — | 176 | |||||||||
| 5,552 | (2,015) | 3,537 | ||||||||||||
| December 31, 2022 | Weighted Average Amortization Rate | Cost | Accumulated Amortization | Net | ||||||||||
| (millions of Canadian dollars) | ||||||||||||||
| Software | 10.9 | % | 2,019 | (1,042) | 977 | |||||||||
| Power purchase agreements | 4.2 | % | 64 | (23) | 41 | |||||||||
Project agreement1 | 4.0 | % | 163 | (36) | 127 | |||||||||
| Customer relationships | 8.6 | % | 2,701 | (459) | 2,242 | |||||||||
| Other intangible assets | 5.9 | % | 621 | (148) | 473 | |||||||||
| Under development | — | % | 158 | — | 158 | |||||||||
| 5,726 | (1,708) | 4,018 | ||||||||||||
1Represents a project agreement acquired from the merger of Enbridge and Spectra Energy.
For the years ended December 31, 2023, 2022 and 2021, our amortization expense related to intangible assets totaled $535 million, $483 million and $348 million, respectively. Our expected amortization expense associated with existing intangible assets for each of the years 2024 to 2028 is $514 million.
15. GOODWILL
| Liquids Pipelines | Gas Transmission and Midstream | Gas Distribution and Storage | Renewable Power Generation | Energy Services | Consolidated | ||||||||||||||||||
| (millions of Canadian dollars) | |||||||||||||||||||||||
| Balance at January 1, 2022 | 8,041 | 19,335 | 5,397 | — | 2 | 32,775 | |||||||||||||||||
| Impairment | — | (2,465) | — | — | — | (2,465) | |||||||||||||||||
| Foreign exchange and other | 506 | 1,236 | — | (4) | — | 1,738 | |||||||||||||||||
Acquisition3 | — | — | — | 392 | — | 392 | |||||||||||||||||
Balance at December 31, 20221,2 | 8,547 | 18,106 | 5,397 | 388 | 2 | 32,440 | |||||||||||||||||
| Foreign exchange and other | (205) | (425) | — | (8) | — | (638) | |||||||||||||||||
Acquisition4 | — | 46 | — | — | — | 46 | |||||||||||||||||
Balance at December 31, 20231,2 | 8,342 | 17,727 | 5,397 | 380 | 2 | 31,848 | |||||||||||||||||
1Gross goodwill as at December 31, 2023 and 2022 was $35.9 billion and $36.5 billion, respectively.
2Accumulated impairment as at December 31, 2023 and 2022 was $4.1 billion.
3In 2022, we recorded $392 million of goodwill related to the acquisition of TGE. Refer to Note 8 - Acquisitions and Dispositions.
4In 2023, we recorded $46 million of goodwill related to the acquisition of Aitken Creek. Refer to Note 8 - Acquisitions and Dispositions.
142
IMPAIRMENT
Gas Transmission
During the year ended December 31, 2022, we recorded goodwill impairment of $2.5 billion related to our Gas Transmission reporting unit. The fair value of the reporting unit, determined using a combination of discounted cash flow and earnings multiples techniques, was impacted by a rise in cost of capital and lower projected long term growth rates for our existing assets. No impairment was recorded for the year ended December 31, 2023.
16. OTHER CURRENT LIABILITIES
| December 31, | 2023 | 2022 | ||||||
| (millions of Canadian dollars) | ||||||||
| Dividends payable | 1,975 | 1,825 | ||||||
| Deferred credits | 1,313 | 1,056 | ||||||
Derivative liabilities (Note 23) | 738 | 898 | ||||||
| Taxes payable | 596 | 683 | ||||||
| Other | 1,037 | 758 | ||||||
| 5,659 | 5,220 | |||||||
143
17. DEBT
| December 31, | Weighted Average Interest Rate10 | Maturity | 2023 | 2022 | ||||||||||
| (millions of Canadian dollars) | ||||||||||||||
| Enbridge Inc. | ||||||||||||||
| US dollar senior notes | 4.6 | % | 2024 - 2053 | 14,636 | 12,060 | |||||||||
| Medium-term notes | 4.5 | % | 2024 - 2064 | 8,598 | 8,223 | |||||||||
| Sustainability-linked bonds | 4.7 | % | 2032 - 2033 | 6,751 | 3,355 | |||||||||
Fixed-to-fixed subordinated term notes1 | 7.5 | % | 2080 - 2084 | 7,156 | 3,596 | |||||||||
Fixed-to-floating rate subordinated term notes2 | 5.8 | % | 2077 - 2078 | 5,828 | 6,736 | |||||||||
Floating rate notes3 | 2024 | 791 | 1,491 | |||||||||||
| Fixed-to-floating non-call notes | 6.0 | % | 2026 | 923 | — | |||||||||
| Commercial paper and credit facility draws | 4.7 | % | 2024 - 2028 | 3,177 | 7,984 | |||||||||
Other4 | 17 | 15 | ||||||||||||
| Enbridge (U.S.) Inc. | ||||||||||||||
| Commercial paper and credit facility draws | 5.6 | % | 2025 - 2028 | 670 | 4,199 | |||||||||
Other4 | 263 | 7 | ||||||||||||
| Enbridge Energy Partners, L.P. | ||||||||||||||
| Senior notes | 6.5 | % | 2025 - 2045 | 3,231 | 3,320 | |||||||||
| Enbridge Gas Inc. | ||||||||||||||
| Medium-term notes | 4.2 | % | 2024 - 2053 | 10,185 | 9,535 | |||||||||
| Debentures | 9.1 | % | 2024 - 2025 | 210 | 210 | |||||||||
| Commercial paper and credit facility draws | 5.2 | % | 2025 | 400 | 2,000 | |||||||||
Other4 | 2 | 1 | ||||||||||||
| Enbridge Pipelines (Southern Lights) L.L.C. | ||||||||||||||
| Senior notes | 4.0 | % | 2040 | 791 | 921 | |||||||||
| Enbridge Pipelines Inc. | ||||||||||||||
Medium-term notes5 | 4.3 | % | 2024 - 2053 | 5,425 | 5,425 | |||||||||
| Debentures | 8.2 | % | 2024 | 200 | 200 | |||||||||
| Commercial paper and credit facility draws | 5.4 | % | 2025 | 449 | 312 | |||||||||
Other4 | 4 | — | ||||||||||||
| Enbridge Southern Lights LP | ||||||||||||||
| Senior notes | 4.0 | % | 2040 | 214 | 222 | |||||||||
| Spectra Energy Capital, LLC | ||||||||||||||
| Senior notes | 7.0 | % | 2032 - 2038 | 228 | 234 | |||||||||
| Algonquin Gas Transmission, LLC | ||||||||||||||
| Senior notes | 3.3 | % | 2024 - 2029 | 1,121 | 1,152 | |||||||||
| East Tennessee Natural Gas, LLC | ||||||||||||||
| Senior notes | 3.1 | % | 2024 | 251 | 258 | |||||||||
| Texas Eastern Transmission, LP | ||||||||||||||
| Senior notes | 4.7 | % | 2028 - 2048 | 3,362 | 3,455 | |||||||||
| Spectra Energy Partners, LP | ||||||||||||||
| Senior notes | 4.3 | % | 2024 - 2045 | 4,220 | 4,336 | |||||||||
| Tri Global Energy, LLC | ||||||||||||||
| Senior notes | — | 18 | ||||||||||||
Blauracke GmbH6 | ||||||||||||||
| Senior notes | 2.1 | % | 2032 | 521 | — | |||||||||
| Westcoast Energy Inc. | ||||||||||||||
| Medium-term notes | 4.9 | % | 2024 - 2041 | 1,225 | 1,225 | |||||||||
| Debentures | 8.1 | % | 2025 - 2026 | 275 | 275 | |||||||||
| Fair value adjustment | 514 | 608 | ||||||||||||
Other7 | (439) | (393) | ||||||||||||
Total debt8 | 81,199 | 80,980 | ||||||||||||
| Current maturities | (6,084) | (6,045) | ||||||||||||
Short-term borrowings9 | (400) | (1,996) | ||||||||||||
| Long-term debt | 74,715 | 72,939 | ||||||||||||
1For an initial five or 10 years, the notes carry a fixed interest rate. Subsequently, during each reset period the interest rate will be reset to equal to the Five-Year US Treasury rate or Five-Year Government of Canada bond yield plus a margin. The notes would be converted automatically into Conversion Preference Shares in the event of bankruptcy and related events.
2For an initial five or 10 years, the notes carry a fixed interest rate. Subsequently, the interest rate will be floating and set to equal to the Canadian Dollar Offered Rate or the Secured Overnight Financing Rate (SOFR) plus a margin. The notes would be converted automatically into Conversion Preference Shares in the event of bankruptcy and related events.
3The notes carry an interest rate equal to SOFR plus a margin of 40 basis points and SOFR plus a margin of 63 basis points.
4Primarily finance lease obligations.
5Included in medium-term notes is $100 million with a maturity date of 2112.
144
6In November 2023, as a part of the acquisition of an additional 49% interest in ERII, we assumed debt of $524 million (€358 million). As at December 31, 2023 $61 million (€42 million) and $460 million (€316 million) are recorded within Current portion of long-term debt and Long-term debt, respectively, on the Consolidated Statements of Financial Position. Refer to Note 13 - Long-Term Investments for further details on the transaction.
7Primarily unamortized discounts, premiums and debt issuance costs.
82023 - $37 billion, US$33 billion and €359 million; 2022 - $38 billion, US$31 billion and nil. Totals exclude capital lease obligations, unamortized discounts, premiums and debt issuance costs and fair value adjustment.
9Weighted average interest rates on outstanding commercial paper were 5.2% as at December 31, 2023 (2022 - 4.5%).
10 Calculated based on term notes, debentures, commercial paper and credit facility draws outstanding as at December 31, 2023.
As at December 31, 2023, all outstanding debt was unsecured.
CREDIT FACILITIES
The following table provides details of our committed credit facilities as at December 31, 2023:
Maturity1 | Total Facilities | Draws2 | Available | |||||||||||
| (millions of Canadian dollars) | ||||||||||||||
| Enbridge Inc. | 2024-2028 | 8,876 | 3,177 | 5,699 | ||||||||||
| Enbridge (U.S.) Inc. | 2025-2028 | 8,373 | 670 | 7,703 | ||||||||||
| Enbridge Pipelines Inc. | 2025 | 2,000 | 449 | 1,551 | ||||||||||
| Enbridge Gas Inc. | 2025 | 2,500 | 400 | 2,100 | ||||||||||
| Total committed credit facilities | 21,749 | 4,696 | 17,053 | |||||||||||
1Maturity date is inclusive of the one-year term out option for certain credit facilities.
2Includes facility draws and commercial paper issuances that are back-stopped by credit facilities.
In March 2023, Enbridge Gas increased its 364-day extendible credit facility from $2.0 billion to 2.5 billion and in July 21, 2023, the facility's maturity date was extended to July 2025, which includes a one-year term out provision from July 2024.
In July 2023, Enbridge Pipelines Inc. extended the maturity date of its 364-day extendible credit facility to July 2025, which includes a one-year term out provision from July 2024.
In July 2023, we renewed approximately $6.8 billion of our 364-day extendible credit facilities, extending the maturity dates to July 2025, which includes a one-year term out provision from July 2024. We also renewed approximately $7.6 billion of our five-year credit facilities, extending the maturity dates to July 2028. Further, we extended our three-year credit facilities, extending the maturity dates to July 2026.
In September 2023, we obtained commitments for a US$9.4 billion senior unsecured bridge term loan credit facility to support the Acquisitions. The commitment for this facility was subsequently reduced to nil as at December 31, 2023 as a result of the September 2023 $4.6 billion equity offering, the September 2023 subordinated long-term debt issuances, and the November 2023 senior notes long-term debt issuances.
In addition to the committed credit facilities noted above, we maintain $1.1 billion of uncommitted demand letter of credit facilities, of which $572 million was unutilized as at December 31, 2023. As at December 31, 2022, we had $1.3 billion of uncommitted demand letter of credit facilities, of which $689 million was unutilized.
Our credit facilities carry a weighted average numberstandby fee of Enbridge shares outstanding0.1% per annum on the unused portion and draws bear interest at market rates. Certain credit facilities serve as a back-stop to the commercial paper programs and we have the option to extend such facilities, which are currently scheduled to mature from 2024 to 2028.
145
As at December 31, 2023 and 2022, commercial paper and credit facility draws, net of short-term borrowings and non-revolving credit facilities that mature within one year, of $3.8 billion and $10.5 billion, respectively, were supported by the availability of long-term committed credit facilities and, therefore, have been classified as long-term debt.
LONG-TERM DEBT ISSUANCES
During the year ended December 31, 2023, we completed the following long-term debt issuances totaling US$8.5 billion and $3.9 billion:
| Company | Issue Date | Principal Amount | ||||||||||||
| (millions of Canadian dollars unless otherwise stated) | ||||||||||||||
| Enbridge Inc. | ||||||||||||||
| March 2023 | 5.70% | sustainability-linked senior notes due March 20331 | US$2,300 | |||||||||||
| March 2023 | 5.97% | senior notes due March 20262 | US$700 | |||||||||||
| May 2023 | 4.90% | medium-term notes due May 2028 | $600 | |||||||||||
| May 2023 | 5.36% | sustainability-linked medium-term notes due May 20333 | $400 | |||||||||||
| May 2023 | 5.76% | medium-term notes due May 2053 | $500 | |||||||||||
| September 2023 | 8.50% | fixed-to-fixed subordinated notes due January 20844 | US$1,250 | |||||||||||
| September 2023 | 8.25% | fixed-to-fixed subordinated notes due January 20845 | US$750 | |||||||||||
| September 2023 | 8.75% | fixed-to-fixed subordinated notes due January 20846 | $700 | |||||||||||
| September 2023 | 8.50% | fixed-to-fixed subordinated notes due January 20847 | $300 | |||||||||||
| November 2023 | 5.90% | senior notes due November 2026 | US$750 | |||||||||||
| November 2023 | 6.00% | senior notes due November 2028 | US$750 | |||||||||||
| November 2023 | 6.20% | senior notes due November 2030 | US$750 | |||||||||||
| November 2023 | 6.70% | senior notes due November 2053 | US$1,250 | |||||||||||
| Enbridge Gas Inc. | ||||||||||||||
| October 2023 | 5.46% | medium-term notes due October 2028 | $250 | |||||||||||
| October 2023 | 5.70% | medium-term notes due October 2033 | $400 | |||||||||||
| October 2023 | 5.67% | medium-term notes due October 2053 | $350 | |||||||||||
| Enbridge Pipelines Inc. | ||||||||||||||
| August 2023 | 5.82% | medium-term notes due August 2053 | $350 | |||||||||||
1The sustainability-linked senior notes are subject to a sustainability performance target of 35% reduction in emissions intensity from 2018 levels at an observation date of December 31, 2020.2030. If the target is not met, on September 8, 2031, the interest rate will be set to equal 5.70% plus 50 basis points.
2We have the option to call the notes at par after one year from issuance. Refer to Note 23 - Risk Management and Financial Instruments.
3The sustainability-linked senior notes are subject to a sustainability performance target of 35% reduction in emissions intensity from 2018 levels at an observation date of December 31, 2030. If the target is not met, on November 26, 2031, the interest rate will be set to equal 5.36% plus 50 basis points.
4For the initial 10 years, the notes carry a fixed interest rate. At year 10, the interest rate will be reset to equal to the Five-Year US Treasury rate plus a margin of 4.43%. Subsequent to year 10, every five years, the Five-year US treasury rate is reset. At year 30, the interest rate will be reset to equal to the Five-Year US Treasury rate plus a margin of 5.18%.
5For the initial five years, the notes carry a fixed interest rate. At year five, the interest rate will be reset to equal to the Five-Year US Treasury rate plus a margin of 3.79%. At year 10, the interest rate will be reset to equal the Five-Year US Treasury rate plus a margin of 4.04%. Subsequent to year 10, every five years, the Five-Year US Treasury rate is reset. At year 25, the interest rate will be reset to equal to the Five-Year US Treasury rate plus a margin of 4.79%.
6For the initial 10 years, the notes carry a fixed interest rate. At year 10, the interest rate will be reset to equal to the Five-Year Government of Canada bond yield plus a margin of 4.96%. Subsequent to year 10, every five years, the Government of Canada bond yield rate is reset. At year 30, the interest rate will be reset to equal to the Five-Year Government of Canada bond yield plus a margin of 5.71%.
7For the initial five years, the notes carry a fixed interest rate. At year five, the interest rate will be reset to equal to the Five-Year Government of Canada bond yield plus a margin of 4.30%. At year 10, the interest rate will be reset to equal the Five-Year Government of Canada bond yield plus a margin of 4.55%. Subsequent to year 10, every five years, the Five-Year Government of Canada bond yield is reset. At year 25, the interest rate will be reset to equal to the Five-Year Government of Canada bond yield plus a margin of 5.30%.
146
LONG-TERM DEBT REPAYMENTS
During the year ended December 31, 2023, we completed the following long-term debt repayments totaling $1.4 billion and US$2.5 billion, respectively:
| Company | Repayment Date | Principal Amount | ||||||||||||
| (millions of Canadian dollars, unless otherwise stated) | ||||||||||||||
| Enbridge Inc. | ||||||||||||||
| January 2023 | 3.94% | medium-term notes | $275 | |||||||||||
| February 2023 | Floating rate notes1 | US$500 | ||||||||||||
| April 2023 | 6.38% | fixed-to-floating rate subordinated notes2 | US$600 | |||||||||||
| June 2023 | 3.94% | medium-term notes | $450 | |||||||||||
| October 2023 | 4.00% | senior notes | US$800 | |||||||||||
| October 2023 | 0.55% | senior notes | US$500 | |||||||||||
| Enbridge Gas Inc. | ||||||||||||||
| July 2023 | 6.05% | medium-term notes | $100 | |||||||||||
| July 2023 | 3.79 | % | medium-term notes | $250 | ||||||||||
| Enbridge Pipelines (Southern Lights) L.L.C. | ||||||||||||||
| June and December 2023 | 3.98% | senior notes | US$80 | |||||||||||
| Enbridge Pipelines Inc. | ||||||||||||||
| August 2023 | 3.79% | medium-term notes | $250 | |||||||||||
| November 2023 | 6.35% | medium-term notes | $100 | |||||||||||
| Enbridge Southern Lights LP | ||||||||||||||
| June 2023 | 4.01% | senior notes | $9 | |||||||||||
| Tri Global Energy, LLC | ||||||||||||||
| January 2023 | 10.00% | senior notes | US$4 | |||||||||||
| January 2023 | 14.00% | senior notes | US$9 | |||||||||||
1Notes carried an interest rate set to equal the SOFR plus a margin of 40 basis points.
2The five-year callable notes, with an original maturity date of April 2078, were all redeemed at par.
DEBT COVENANTS
Our credit facility agreements and term debt indentures include standard events of default and covenant provisions whereby accelerated repayment and/or termination of the agreements may result if we were to default on payment or violate certain covenants. As at December 31, 2023, we were in compliance with all debt covenants.
ANNUAL DEBT MATURITIES
As at December 31, 2023, we have commitments as detailed below:
| Total | Less than 1 year | 2 years | 3 years | 4 years | 5 years | Thereafter | |||||||||||||||||
| (millions of Canadian dollars) | |||||||||||||||||||||||
Annual debt maturities1 | 80,438 | 6,067 | 6,405 | 5,630 | 3,377 | 5,307 | 53,652 | ||||||||||||||||
1Includes debentures, term notes, commercial paper and credit facility draws based on the facility's maturity date and excludes short-term borrowings, debt discounts, debt issuance costs, finance lease obligations and fair value adjustment. We have the ability under certain debt facilities to call and repay the obligations prior to scheduled maturities. Therefore, the actual timing of future cash repayments could be materially different than presented above.
INTEREST EXPENSE
| Year ended December 31, | 2023 | 2022 | 2021 | ||||||||
| (millions of Canadian dollars) | |||||||||||
| Debentures and term notes | 3,439 | 2,910 | 2,806 | ||||||||
| Commercial paper and credit facility draws | 519 | 388 | 114 | ||||||||
| Amortization of fair value adjustment | (45) | (45) | (50) | ||||||||
| Capitalized interest | (101) | (74) | (215) | ||||||||
| 3,812 | 3,179 | 2,655 | |||||||||
18. ASSET RETIREMENT OBLIGATIONS
Our ARO relate mostly to the retirement of Contentspipelines, renewable power generation assets and obligations related to right-of way agreements and contractual leases for land use.
The discount rates used to estimate the present value of the expected future cash flows for the years ended December 31, 2023 and 2022 ranged from1.5% to 9.0%.
A reconciliation of movements in our ARO liabilities is as follows:
| December 31, | 2023 | 2022 | ||||||
| (millions of Canadian dollars) | ||||||||
| Obligations at beginning of year | 488 | 502 | ||||||
| Liabilities acquired | 1 | — | ||||||
| Liabilities incurred | — | 30 | ||||||
| Liabilities settled | (23) | (126) | ||||||
| Change in estimate and other | 5 | 51 | ||||||
| Foreign currency translation adjustment | (6) | 24 | ||||||
| Accretion expense | 28 | 7 | ||||||
| Obligations at end of year | 493 | 488 | ||||||
| Presented as follows: | ||||||||
| Other current liabilities | 136 | 83 | ||||||
| Other long-term liabilities | 357 | 405 | ||||||
| 493 | 488 | |||||||
19. NONCONTROLLING INTERESTS
The following table provides additional information regarding Noncontrolling interests as presented in our Consolidated Statements of Financial Position:
| December 31, | 2023 | 2022 | ||||||
| (millions of Canadian dollars) | ||||||||
| Algonquin Gas Transmission, LLC | 384 | 400 | ||||||
Enbridge Athabasca Midstream Investor Limited Partnership1 | 1,086 | 1,106 | ||||||
| Maritimes & Northeast Pipeline, L.L.C. | 559 | 582 | ||||||
| Renewable energy assets | 885 | 1,302 | ||||||
| Maritimes & Northeast Pipeline Limited Partnership | 111 | 117 | ||||||
| Other | 4 | 4 | ||||||
| 3,029 | 3,511 | |||||||
1On October 5, 2022, we closed the sale of an 11.6% non-operating interest in certain assets from our Regional Oil Sands System to Aii. Refer to Note 8 - Acquisitions and Dispositions.
148
20. SHARE CAPITAL
Our authorized share capital consists of an unlimited number of common shares with no par value and an unlimited number of preference shares.
COMMON SHARES
| 2023 | 2022 | 2021 | ||||||||||||||||||
| December 31, | Number of Shares | Amount | Number of Shares | Amount | Number of Shares | Amount | ||||||||||||||
| (millions of Canadian dollars; number of shares in millions) | ||||||||||||||||||||
| Balance at beginning of year | 2,025 | 64,760 | 2,026 | 64,799 | 2,026 | 64,768 | ||||||||||||||
| Shares issued, net of issue costs | 103 | 4,485 | — | — | — | — | ||||||||||||||
| Shares issued on exercise of stock options | — | 3 | 2 | 53 | — | 31 | ||||||||||||||
| Shares issued on vesting of RSUs, net of tax | — | 12 | — | — | — | — | ||||||||||||||
Share purchases at stated value1 | (3) | (80) | (3) | (88) | — | — | ||||||||||||||
| Other | — | — | — | (4) | — | — | ||||||||||||||
| Balance at end of year | 2,125 | 69,180 | 2,025 | 64,760 | 2,026 | 64,799 | ||||||||||||||
1 Reflects the repurchase and cancellation of common shares under our normal course issuer bid.
149
PREFERENCE SHARES
| 2023 | 2022 | 2021 | ||||||||||||||||||
| December 31, | Number of Shares | Amount | Number of Shares | Amount | Number of Shares | Amount | ||||||||||||||
| (millions of Canadian dollars; number of shares in millions) | ||||||||||||||||||||
| Preference Shares, Series A | 5 | 125 | 5 | 125 | 5 | 125 | ||||||||||||||
| Preference Shares, Series B | 20 | 500 | 20 | 500 | 18 | 457 | ||||||||||||||
Preference Shares, Series C1 | — | — | — | — | 2 | 43 | ||||||||||||||
| Preference Shares, Series D | 18 | 450 | 18 | 450 | 18 | 450 | ||||||||||||||
| Preference Shares, Series F | 18 | 454 | 20 | 500 | 20 | 500 | ||||||||||||||
Preference Shares, Series G2 | 2 | 46 | — | — | — | — | ||||||||||||||
| Preference Shares, Series H | 12 | 291 | 14 | 350 | 14 | 350 | ||||||||||||||
Preference Shares, Series I3 | 2 | 59 | — | — | — | — | ||||||||||||||
Preference Shares, Series J4 | — | — | — | — | 8 | 199 | ||||||||||||||
| Preference Shares, Series L | 16 | 411 | 16 | 411 | 16 | 411 | ||||||||||||||
| Preference Shares, Series N | 18 | 450 | 18 | 450 | 18 | 450 | ||||||||||||||
| Preference Shares, Series P | 16 | 400 | 16 | 400 | 16 | 400 | ||||||||||||||
| Preference Shares, Series R | 16 | 400 | 16 | 400 | 16 | 400 | ||||||||||||||
| Preference Shares, Series 1 | 16 | 411 | 16 | 411 | 16 | 411 | ||||||||||||||
| Preference Shares, Series 3 | 24 | 600 | 24 | 600 | 24 | 600 | ||||||||||||||
| Preference Shares, Series 5 | 8 | 206 | 8 | 206 | 8 | 206 | ||||||||||||||
| Preference Shares, Series 7 | 10 | 250 | 10 | 250 | 10 | 250 | ||||||||||||||
| Preference Shares, Series 9 | 11 | 275 | 11 | 275 | 11 | 275 | ||||||||||||||
| Preference Shares, Series 11 | 20 | 500 | 20 | 500 | 20 | 500 | ||||||||||||||
| Preference Shares, Series 13 | 14 | 350 | 14 | 350 | 14 | 350 | ||||||||||||||
| Preference Shares, Series 15 | 11 | 275 | 11 | 275 | 11 | 275 | ||||||||||||||
Preference Shares, Series 175 | — | — | — | — | 30 | 750 | ||||||||||||||
| Preference Shares, Series 19 | 20 | 500 | 20 | 500 | 20 | 500 | ||||||||||||||
| Issuance costs | (135) | (135) | (155) | |||||||||||||||||
| Balance at end of year | 6,818 | 6,818 | 7,747 | |||||||||||||||||
1On June 1, 2022, all outstanding Preference Shares, Series C were converted to Preference Shares, Series B.
2On June 1, 2023, 1,827,695 of the outstanding Preference Shares, Series F were converted into Preference Shares, Series G.
3On September 1, 2023, 2,350,602 of the outstanding Preference Shares, Series H were converted into Preference Shares, Series I.
4On June 1, 2022, we redeemed our US$200 million outstanding Cumulative Redeemable Preference Shares, Series J.
5On March 1, 2022, we redeemed our $750 million outstanding Cumulative Redeemable Minimum Rate Reset Preference Shares, Series 17.
150
Characteristics of our outstanding preference shares are as follows:
| Dividend Rate | Dividend1 | Per Share Base Redemption Value2 | Redemption and Conversion Option Date2,3 | Right to Convert Into3,4 | |||||||||||||
| (Canadian dollars unless otherwise stated) | |||||||||||||||||
| Preference Shares, Series A | 5.50 | % | $1.37500 | $25 | — | — | |||||||||||
| Preference Shares, Series B | 5.20 | % | $1.30052 | $25 | June 1, 2027 | Series C | |||||||||||
Preference Shares, Series D5 | 5.41 | % | $1.35300 | $25 | March 1, 2028 | Series E | |||||||||||
Preference Shares, Series F6 | 5.54 | % | $1.38452 | $25 | June 1, 2028 | Series G | |||||||||||
Preference Shares, Series G7 | 6.96 | % | $1.90704 | $25 | June 1, 2028 | Series F | |||||||||||
Preference Shares, Series H8 | 6.11 | % | $1.52800 | $25 | September 1, 2028 | Series I | |||||||||||
Preference Shares, Series I9 | 7.19 | % | $1.81004 | $25 | September 1, 2028 | Series H | |||||||||||
| Preference Shares, Series L | 5.86 | % | US$1.46448 | US$25 | September 1, 2027 | Series M | |||||||||||
Preference Shares, Series N10 | 6.70 | % | $1.67400 | $25 | December 1, 2028 | Series O | |||||||||||
| Preference Shares, Series P | 4.38 | % | $1.09476 | $25 | March 1, 2024 | Series Q | |||||||||||
| Preference Shares, Series R | 4.07 | % | $1.01825 | $25 | June 1, 2024 | Series S | |||||||||||
Preference Shares, Series 111 | 6.70 | % | US$1.67592 | US$25 | June 1, 2028 | Series 2 | |||||||||||
| Preference Shares, Series 3 | 3.74 | % | $0.93425 | $25 | September 1, 2024 | Series 4 | |||||||||||
| Preference Shares, Series 5 | 5.38 | % | US$1.34383 | US$25 | March 1, 2024 | Series 6 | |||||||||||
| Preference Shares, Series 7 | 4.45 | % | $1.11224 | $25 | March 1, 2024 | Series 8 | |||||||||||
| Preference Shares, Series 9 | 4.10 | % | $1.02424 | $25 | December 1, 2024 | Series 10 | |||||||||||
| Preference Shares, Series 11 | 3.94 | % | $0.98452 | $25 | March 1, 2025 | Series 12 | |||||||||||
| Preference Shares, Series 13 | 3.04 | % | $0.76076 | $25 | June 1, 2025 | Series 14 | |||||||||||
| Preference Shares, Series 15 | 2.98 | % | $0.74576 | $25 | September 1, 2025 | Series 16 | |||||||||||
Preference Shares, Series 1912 | 6.21 | % | $1.55300 | $25 | March 1, 2028 | Series 20 | |||||||||||
1The holder is entitled to receive a fixed cumulative quarterly preferential dividend, as declared by the Board of Directors. With the exception of Preference Shares, Series A, such fixed dividend rate resets every five years beginning on the initial Redemption and Conversion Option Date. Preference Shares, Series G and I contain a feature where the dividend rate resets on a quarterly basis. The Preference Shares, Series 19 contain a feature where the fixed dividend rate, when reset every five years, will not be less than 4.90%. No other series of preference shares has this feature.
2Preference Shares, Series A may be redeemed any time at our option. For all other series of preference shares, we may at our option, redeem all or a portion of the outstanding preference shares for the Per Share Base Redemption Value plus all accrued and unpaid dividends on the Redemption Option Date and on every fifth anniversary thereafter.
3The holder will have the right, subject to certain conditions, to convert their shares into Cumulative Redeemable Preference Shares of a specified series on a one-for-one basis on the Conversion Option Date and every fifth anniversary thereafter at an ascribed issue price equal to the Per Share Base Redemption Value.
4With the exception of Preference Shares, Series A, after the Redemption and Conversion Option Date, holders may elect to receive quarterly floating rate cumulative dividends per share at a rate equal to: $25 x (number of days in quarter/number of days in year) x three month Government of Canada treasury bill rate + 2.4% (Series C), 2.4% (Series E), 2.5% (Series G), 2.1% (Series I), 2.7% (Series O), 2.5% (Series Q), 2.5% (Series S), 2.4% (Series 4), 2.6% (Series 8), 2.7% (Series 10), 2.6% (Series 12), 2.7% (Series 14), 2.7% (Series 16), or 3.2% (Series 20); or US$25 x (number of days in quarter/number of days in year) x three month US Government treasury bill rate + 3.2% (Series M), 3.1% (Series 2), or 2.8% (Series 6).
5The quarterly dividend per share paid on Preference Shares, Series D was increased to $0.33825 from $0.27875 on March 1, 2023 due to reset of the annual dividend on March 1, 2023.
6The quarterly dividend per share paid on Preference Shares, Series F was increased to $0.34613 from $0.29306 on June 1, 2023 due to reset of the annual dividend on June 1, 2023.
7On June 1, 2023, 1,827,695 of the outstanding Preference Shares, Series F were converted into Preference Shares, Series G. The quarterly dividend per share paid on Preference Shares, Series G was increased to $0.47676 from $0.47245 on December 1, 2023 due to reset on a quarterly basis.
8The quarterly dividend per share paid on Preference Shares, Series H was increased to $0.38200 from $0.27350 on September 1, 2023 due to reset of the annual dividend on September 1, 2023.
9On September 1, 2023, 2,350,602 of the outstanding Preference Shares, Series H were converted into Preference Shares, Series I. The quarterly dividend per share paid on Preference Shares, Series I was increased to $0.45251 from $0.44814 on December 1, 2023 due to reset on a quarterly basis following the date of issuance.
10 The quarterly dividend per share paid on Preference Shares, Series N was increased to $0.41850 from $0.31788 on December 1, 2023 due to reset of the annual dividend on December 1, 2023.
11 The quarterly dividend per share paid on Preference Shares, Series 1 was increased to US$0.41898 from US$0.37182 on June 1, 2023 due to reset of the annual dividend on June 1, 2023.
12 The quarterly dividend per share paid on Preference Shares, Series 19 was increased to $0.38825 from $0.30625 on March 1, 2023 due to reset of the annual dividend on March 1, 2023.
151
SHAREHOLDER RIGHTS PLAN
The Shareholder Rights Plan is designed to encourage the fair treatment of our shareholders in connection with any takeover offer. Rights issued under the plan become exercisable when a person and any related parties acquires or announces its intention to acquire 20% or more of our outstanding common shares without complying with certain provisions set out in the plan or without approval of our Board of Directors. Should such an acquisition occur, each rights holder, other than the acquiring person and related parties, will have the right to purchase our common shares at a 50% discount to the market price at that time.
21. STOCK OPTION AND STOCK UNIT PLANS
We maintain three primary vehicles under our long-term incentive plan (the Plan): ISOs, PSUs and RSUs. Total stock-based compensation expense recorded for the years ended December 31, 2023, 2022 and 2021 was $154 million, $260 million and $157 million, respectively. The number of common shares authorized for share-settled awards under the Plan was 181 million as at December 31, 2023, 2022 and 2021.
INCENTIVE STOCK OPTIONS
Certain key employees are granted ISOs to purchase common shares at the grant date market price. ISOs vest in equal annual installments over a four-year period and expire 10 years after the issue date.
| December 31, 2023 | Number | Weighted Average Exercise Price | Weighted Average Remaining Contractual Life (years) | Aggregate Intrinsic Value | ||||||||||
| (number of options in thousands; weighted average exercise price in Canadian dollars; intrinsic value in millions of Canadian dollars) | ||||||||||||||
| Options outstanding at beginning of year | 27,624 | 48.46 | ||||||||||||
| Options granted | 3,053 | 53.11 | ||||||||||||
Options exercised1 | (648) | 45.70 | ||||||||||||
| Options cancelled or expired | (1,300) | 53.84 | ||||||||||||
| Options outstanding at end of year | 28,729 | 50.79 | 5.3 | 45 | ||||||||||
Options vested at end of year2 | 20,235 | 50.64 | 4.1 | 36 | ||||||||||
1The total intrinsic value of ISOs exercised during the years ended December 31, 2023, 2022 and 2021 was $2 million, $66 million and $24 million, respectively, and cash received on exercise was nil, $3 million and $2 million, respectively.
2The total fair value of ISOs vested during the years ended December 31, 2023, 2022 and 2021 was $20 million, $21 million and $25 million, respectively.
152
Weighted average assumptions used to determine the fair value of ISOs granted using the Black-Scholes-Merton model are as follows:
| Year ended December 31, | 2023 | 2022 | 2021 | ||||||||
Fair value per option (Canadian dollars)1 | 6.05 | 5.07 | 4.10 | ||||||||
| Valuation assumptions | |||||||||||
Expected option term (years)2 | 6 | 6 | 6 | ||||||||
Expected volatility3 | 22.2 | % | 21.9 | % | 25.5 | % | |||||
Expected dividend yield4 | 6.7 | % | 6.5 | % | 7.6 | % | |||||
Risk-free interest rate5 | 3.5 | % | 1.8 | % | 0.7 | % | |||||
1Options granted to US employees are based on the New York Stock Exchange prices. The option value and assumptions shown are based on a weighted average of the US and the Canadian options. The fair value per option for the years ended December 31, 2023, 2022 and 2021 were $5.38, $4.78 and $3.91, respectively, for Canadian employees and US$5.23, US$4.62 and US$3.65, respectively, for US employees.
2The expected option term is six years based on historical exercise practice and five years for retirement eligible employees.
3Expected volatility is determined with reference to historic daily share price volatility and consideration of the implied volatility observable in call option values near the grant date.
4The expected dividend yield is the current annual dividend at the grant date divided by the current stock price.
5The risk-free interest rate is based on the Government of Canada's Canadian bond yields and the US Treasury bond yields.
Compensation expense recorded for the years ended December 31, 2023, 2022 and 2021 for ISOs was $18 million, $15 million and $16 million, respectively. As at December 31, 2023, unrecognized compensation expense related to non-vested ISOs was $11 million. The expense is expected to be fully recognized over a weighted average period of approximately two years.
PERFORMANCE STOCK UNITS
PSUs are granted to certain key employees where cash awards are paid following a three-year performance cycle. Awards are calculated by multiplying the number of units outstanding at the end of the performance period by Enbridge's weighted average share price for 20 days prior to the maturity of the grant and by a performance multiplier. The performance multiplier ranges from zero, if our performance fails to meet threshold performance levels, to a maximum of 2.0 if we perform within the highest range of the performance targets. The performance multiplier is derived through a calculation of our Total Shareholder Return percentile rank relative to a specified peer group of companies and our distributable cash flow per share, adjusted for unusual, infrequent or other non-operating factors, relative to targets established at the time of grant. Beginning in 2023, the performance multiplier also includes a greenhouse gas reduction component. To calculate the 2023 expense, a multiplier of 1.0 was used for 2023 PSU grants, 1.25 for 2022 PSU grants and 1.25 for the 2021 PSU grants.
| December 31, 2023 | Number | Weighted Average Remaining Contractual Life (years) | Aggregate Intrinsic Value | ||||||||
| (number of units in thousands; intrinsic value in millions of Canadian dollars) | |||||||||||
| Units outstanding at beginning of year | 3,249 | ||||||||||
| Units granted | 2,128 | ||||||||||
| Units cancelled | (214) | ||||||||||
Units matured1 | (2,218) | ||||||||||
| Dividend reinvestment | 235 | ||||||||||
| Units outstanding at end of year | 3,180 | 1.1 | 175 | ||||||||
1The total amount paid during the years ended December 31, 2023, 2022 and 2021 for PSUs was $123 million, $90 million and $70 million, respectively.
153
Compensation expense recorded for the years ended December 31, 2023, 2022 and 2021 for PSUs was $59 million, $169 million and $56 million, respectively. As at December 31, 2023, unrecognized compensation expense related to non-vested PSUs was $54 million. The expense is expected to be fully recognized over a weighted average period of approximately two years.
RESTRICTED STOCK UNITS
Employees may also be granted cash-settled or share-settled RSUs under the Plan. Cash-settled RSUs are paid to certain key employees, vesting in equal installments on each of the first, second and third anniversaries of the grant date. Share-settled awards are given to non-executive senior management employees and vest following a three-year maturity period. Beginning in 2023, share-settled units were granted to non-senior management employees. These units vest on each of the first, second and third anniversaries of the grant date. RSU holders receive cash or shares equal to Enbridge's weighted average share price for 20 days prior to the maturity of the grant multiplied by the number of units outstanding on the maturity date.
| December 31, 2023 | Number | Weighted Average Grant Date Fair Value2 | Weighted Average Remaining Contractual Life (years) | Aggregate Intrinsic Value | ||||||||||
| (number of units in thousands; intrinsic value in millions of Canadian dollars) | ||||||||||||||
| Units outstanding at beginning of year | 3,565 | 49.64 | ||||||||||||
| Units granted | 1,373 | 52.05 | ||||||||||||
| Units cancelled | (246) | 52.06 | ||||||||||||
Units matured1 | (1,401) | 51.05 | ||||||||||||
| Dividend reinvestment | 280 | 50.88 | ||||||||||||
| Units outstanding at end of year | 3,571 | 50.69 | 0.9 | 177 | ||||||||||
1The total amount paid during the years ended December 31, 2023, 2022 and 2021 for RSUs was $56 million, $32 million and $72 million, respectively.
2Weighted average grant date fair value excludes cash-settled units.
Compensation expense recorded for the years ended December 31, 2023, 2022 and 2021 for RSUs was $77 million, $76 million and $85 million, respectively. As at December 31, 2023, unrecognized compensation expense related to non-vested RSUs was $60 million. The expense is expected to be fully recognized over a weighted average period of approximately two years.
154
22. COMPONENTS OF ACCUMULATED OTHER COMPREHENSIVE INCOME/(LOSS)
Changes in AOCI attributable to our common shareholders for the years ended December 31, 2023, 2022 and 2021 are as follows:
Cash Flow Hedges | Excluded Components of Fair Value Hedges | Net Investment Hedges | Cumulative Translation Adjustment | Equity Investees | Pension and OPEB Adjustment | Total | |||||||||||||||||
| (millions of Canadian dollars) | |||||||||||||||||||||||
| Balance as at January 1, 2023 | 121 | (35) | (1,137) | 4,348 | 5 | 218 | 3,520 | ||||||||||||||||
| Other comprehensive income/(loss) retained in AOCI | 232 | 62 | 409 | (1,695) | 6 | (158) | (1,144) | ||||||||||||||||
| Other comprehensive (income)/loss reclassified to earnings | |||||||||||||||||||||||
Interest rate contracts1 | 28 | — | — | — | — | — | 28 | ||||||||||||||||
Foreign exchange contracts2 | — | (47) | — | — | — | — | (47) | ||||||||||||||||
Amortization of pension and OPEB actuarial gain3 | — | — | — | — | — | (24) | (24) | ||||||||||||||||
| 260 | 15 | 409 | (1,695) | 6 | (182) | (1,187) | |||||||||||||||||
| Tax impact | |||||||||||||||||||||||
| Income tax on amounts retained in AOCI | (47) | (14) | — | — | — | 28 | (33) | ||||||||||||||||
| Income tax on amounts reclassified to earnings | (14) | 11 | — | — | — | 6 | 3 | ||||||||||||||||
| (61) | (3) | — | — | — | 34 | (30) | |||||||||||||||||
| Balance as at December 31, 2023 | 320 | (23) | (728) | 2,653 | 11 | 70 | 2,303 | ||||||||||||||||
Cash Flow Hedges | Excluded Components of Fair Value Hedges | Net Investment Hedges | Cumulative Translation Adjustment | Equity Investees | Pension and OPEB Adjustment | Total | |||||||||||||||||
| (millions of Canadian dollars) | |||||||||||||||||||||||
| Balance as at January 1, 2022 | (897) | — | (166) | 56 | (5) | (84) | (1,096) | ||||||||||||||||
| Other comprehensive income/(loss) retained in AOCI | 1,125 | (35) | (971) | 4,292 | (6) | 411 | 4,816 | ||||||||||||||||
| Other comprehensive (income)/loss reclassified to earnings | |||||||||||||||||||||||
Interest rate contracts1 | 186 | — | — | — | — | — | 186 | ||||||||||||||||
Foreign exchange contracts2 | (4) | — | — | — | — | — | (4) | ||||||||||||||||
Other contracts4 | 4 | — | — | — | — | — | 4 | ||||||||||||||||
Amortization of pension and OPEB actuarial gain3 | — | — | — | — | — | (14) | (14) | ||||||||||||||||
| Other | — | — | — | — | 16 | — | 16 | ||||||||||||||||
| 1,311 | (35) | (971) | 4,292 | 10 | 397 | 5,004 | |||||||||||||||||
| Tax impact | |||||||||||||||||||||||
| Income tax on amounts retained in AOCI | (250) | — | — | — | — | (99) | (349) | ||||||||||||||||
| Income tax on amounts reclassified to earnings | (43) | — | — | — | — | 4 | (39) | ||||||||||||||||
| (293) | — | — | — | — | (95) | (388) | |||||||||||||||||
| Balance as at December 31, 2022 | 121 | (35) | (1,137) | 4,348 | 5 | 218 | 3,520 | ||||||||||||||||
155
Cash Flow Hedges | Excluded Components of Fair Value Hedges | Net Investment Hedges | Cumulative Translation Adjustment | Equity Investees | Pension and OPEB Adjustment | Total | |||||||||||||||||
| (millions of Canadian dollars) | |||||||||||||||||||||||
| Balance as at January 1, 2021 | (1,326) | 5 | (215) | 568 | 66 | (499) | (1,401) | ||||||||||||||||
| Other comprehensive income/(loss) retained in AOCI | 238 | (5) | 49 | (492) | (12) | 520 | 298 | ||||||||||||||||
| Other comprehensive (income)/loss reclassified to earnings | |||||||||||||||||||||||
Interest rate contracts1 | 296 | — | — | — | — | — | 296 | ||||||||||||||||
Commodity contracts5 | 1 | — | — | — | — | — | 1 | ||||||||||||||||
Foreign exchange contracts2 | 5 | — | — | — | — | — | 5 | ||||||||||||||||
Other contracts4 | 2 | — | — | — | — | — | 2 | ||||||||||||||||
| Equity investment disposal | — | — | — | — | (66) | — | (66) | ||||||||||||||||
Amortization of pension and OPEB actuarial loss and prior service costs3 | — | — | — | — | — | 28 | 28 | ||||||||||||||||
| Other | 17 | — | — | (20) | 3 | — | — | ||||||||||||||||
| 559 | (5) | 49 | (512) | (75) | 548 | 564 | |||||||||||||||||
| Tax impact | |||||||||||||||||||||||
| Income tax on amounts retained in AOCI | (61) | — | — | — | — | (126) | (187) | ||||||||||||||||
| Income tax on amounts reclassified to earnings | (69) | — | — | — | 4 | (7) | (72) | ||||||||||||||||
| (130) | — | — | — | 4 | (133) | (259) | |||||||||||||||||
| Balance as at December 31, 2021 | (897) | — | (166) | 56 | (5) | (84) | (1,096) | ||||||||||||||||
1Reported within Interest expense in the Consolidated Statements of Earnings.
2Reported within Transportation and other services revenues and Other income/(expense) in the Consolidated Statements of Earnings.
3These components are included in the computation of net periodic benefit (credit)/cost and are reported within Other income/(expense) in the Consolidated Statements of Earnings.
4Reported within Operating and administrative expense in the Consolidated Statements of Earnings.
5Reported within Transportation and other services revenues, Commodity sales, Commodity costs and Operating and administrative expense in the Consolidated Statements of Earnings.
23. RISK MANAGEMENT AND FINANCIAL INSTRUMENTS
MARKET RISK
Our earnings, cash flows and OCI are subject to movements in foreign exchange rates, interest rates, commodity prices and our share price (collectively, market risks). Formal risk management policies, processes and systems have been designed to mitigate these risks.
The following summarizes the types of market risks to which we are exposed and the risk management instruments used to mitigate them. We use a combination of qualifying and non-qualifying derivative instruments to manage the risks noted below.
Foreign Exchange Risk
We generate certain revenues, incur expenses and hold a number of investments and subsidiaries that are denominated in currencies other than Canadian dollars. As a result, our earnings, cash flows and OCI are exposed to fluctuations resulting from foreign exchange rate variability.
We employ financial derivative instruments to hedge foreign currency denominated earnings exposure. A combination of qualifying and non-qualifying derivative instruments is used to hedge anticipated foreign currency denominated revenues and expenses and to manage variability in cash flows. We hedge certain net investments in US dollar-denominated investments and subsidiaries using foreign currency derivatives and US dollar-denominated debt.
156
The foreign exchange risks inherent within the CTS framework are not present in MTS. Accordingly, our foreign exchange hedging program related to the Canadian Mainline is no longer required, and the related derivatives were terminated in the first quarter of 2023 for a realized loss of $638 million.
Interest Rate Risk
Our earnings, cash flows and OCI are exposed to short-term interest rate variability due to the regular repricing of our variable rate debt, primarily commercial paper. We monitor our debt portfolio mix of fixed and variable rate debt instruments to manage a consolidated portfolio of floating rate debt within the Board of Directors' approved policy limit of a maximum of 30% of floating rate debt as a percentage of total debt outstanding. We primarily use qualifying derivative instruments to manage interest rate risk. Pay fixed-receive floating interest rate swaps may be used to hedge against the effect of future interest rate movements. We have implemented a hedging program to partially mitigate the impact of short-term interest rate volatility on interest expense via the execution of floating-to-fixed interest rate swaps and costless collars. These swaps have an average fixed rate of 4.1%.
On March 8, 2023, we issued US$700 million of three-year fixed rate notes, which include the right for us to call at par after the first year. A corresponding fixed-to-floating cancellable swap was also executed which gives the swap counterparty a similar right to cancel the swap after the first year. This swap has a fixed rate of 6.0%.
Our earnings and cash flows are also exposed to variability in longer term interest rates ahead of anticipated fixed rate term debt issuances. Forward starting interest rate swaps are used to hedge against the effect of future interest rate movements. We have established a program including some of our subsidiaries to partially mitigate our exposure to long-term interest rate variability on forecasted term debt issuances via execution of floating-to-fixed interest rate swaps with an average swap rate of 3.5%.
Commodity Price Risk
Our earnings, cash flows and OCI are exposed to changes in commodity prices as a result of our ownership interests in certain assets and investments, as well as through the activities of our energy services subsidiaries. These commodities include natural gas, crude oil, power and NGL. We employ financial and physical derivative instruments to fix a portion of the variable price exposures that arise from physical transactions involving these commodities. We use primarily non-qualifying derivative instruments to manage commodity price risk.
Equity Price Risk
Equity price risk is the risk of earnings fluctuations due to changes in our share price. We have exposure to our own common share price through the issuance of various forms of stock-based compensation, which affect earnings through the revaluation of outstanding units every period. We use equity derivatives to manage the earnings volatility derived from one form of stock-based compensation, RSUs. We use a combination of qualifying and non-qualifying derivative instruments to manage equity price risk.
TOTAL DERIVATIVE INSTRUMENTS
We generally have a policy of entering into individual International Swaps and Derivatives Association, Inc. (ISDA) agreements, or other similar derivative agreements, with the majority of our financial derivative counterparties. These agreements provide for the net settlement of derivative instruments outstanding with specific counterparties in the event of bankruptcy or other significant credit events and reduce our credit risk exposure on financial derivative asset positions outstanding with the counterparties in those circumstances.
The following table summarizes the Consolidated Statements of Financial Position location and carrying value of our derivative instruments, as well as the maximum potential settlement amounts, in the event of the specific circumstances described above. All amounts are presented gross in the Consolidated Statements of Financial Position.
157
| December 31, 2023 | Derivative Instruments Used as Cash Flow Hedges | Derivative Instruments Used as Fair Value Hedges | Non- Qualifying Derivative Instruments | Total Gross Derivative Instruments as Presented | Amounts Available for Offset | Total Net Derivative Instruments | |||||||||||||||||
| (millions of Canadian dollars) | |||||||||||||||||||||||
| Other current assets | |||||||||||||||||||||||
| Foreign exchange contracts | — | 41 | 98 | 139 | (32) | 107 | |||||||||||||||||
| Interest rate contracts | 31 | — | 34 | 65 | (32) | 33 | |||||||||||||||||
| Commodity contracts | — | — | 418 | 418 | (270) | 148 | |||||||||||||||||
| Other contracts | — | — | 1 | 1 | (1) | — | |||||||||||||||||
| 31 | 41 | 551 | 623 | (335) | 288 | ||||||||||||||||||
| Deferred amounts and other assets | |||||||||||||||||||||||
| Foreign exchange contracts | — | 16 | 319 | 335 | (122) | 213 | |||||||||||||||||
| Interest rate contracts | 51 | — | 2 | 53 | (21) | 32 | |||||||||||||||||
| Commodity contracts | — | — | 75 | 75 | (41) | 34 | |||||||||||||||||
| 51 | 16 | 396 | 463 | (184) | 279 | ||||||||||||||||||
| Other current liabilities | |||||||||||||||||||||||
| Foreign exchange contracts | — | (44) | (84) | (128) | 32 | (96) | |||||||||||||||||
| Interest rate contracts | (183) | — | (3) | (186) | 32 | (154) | |||||||||||||||||
| Commodity contracts | (11) | — | (412) | (423) | 270 | (153) | |||||||||||||||||
| Other contracts | — | — | (1) | (1) | 1 | — | |||||||||||||||||
| (194) | (44) | (500) | (738) | 335 | (403) | ||||||||||||||||||
| Other long-term liabilities | |||||||||||||||||||||||
| Foreign exchange contracts | — | (17) | (481) | (498) | 122 | (376) | |||||||||||||||||
| Interest rate contracts | (3) | — | (85) | (88) | 21 | (67) | |||||||||||||||||
| Commodity contracts | (7) | — | (159) | (166) | 41 | (125) | |||||||||||||||||
| (10) | (17) | (725) | (752) | 184 | (568) | ||||||||||||||||||
| Total net derivative liability | |||||||||||||||||||||||
| Foreign exchange contracts | — | (4) | (148) | (152) | — | (152) | |||||||||||||||||
| Interest rate contracts | (104) | — | (52) | (156) | — | (156) | |||||||||||||||||
| Commodity contracts | (18) | — | (78) | (96) | — | (96) | |||||||||||||||||
| Other contracts | — | — | — | — | — | — | |||||||||||||||||
| (122) | (4) | (278) | (404) | — | (404) | ||||||||||||||||||
158
| December 31, 2022 | Derivative Instruments Used as Cash Flow Hedges | Derivative Instruments Used as Fair Value Hedges | Non- Qualifying Derivative Instruments | Total Gross Derivative Instruments as Presented | Amounts Available for Offset | Total Net Derivative Instruments | |||||||||||||||||
| (millions of Canadian dollars) | |||||||||||||||||||||||
| Other current assets | |||||||||||||||||||||||
| Foreign exchange contracts | — | — | 46 | 46 | (41) | 5 | |||||||||||||||||
| Interest rate contracts | 649 | — | 11 | 660 | — | 660 | |||||||||||||||||
| Commodity contracts | — | — | 302 | 302 | (182) | 120 | |||||||||||||||||
| Other contracts | — | — | 7 | 7 | — | 7 | |||||||||||||||||
| 649 | — | 366 | 1,015 | (223) | 792 | ||||||||||||||||||
| Deferred amounts and other assets | |||||||||||||||||||||||
| Foreign exchange contracts | — | 156 | 153 | 309 | (138) | 171 | |||||||||||||||||
| Interest rate contracts | 254 | — | — | 254 | — | 254 | |||||||||||||||||
| Commodity contracts | — | — | 61 | 61 | (25) | 36 | |||||||||||||||||
| Other contracts | 1 | — | 2 | 3 | — | 3 | |||||||||||||||||
| 255 | 156 | 216 | 627 | (163) | 464 | ||||||||||||||||||
| Other current liabilities | |||||||||||||||||||||||
| Foreign exchange contracts | — | (42) | (524) | (566) | 41 | (525) | |||||||||||||||||
| Commodity contracts | (48) | — | (284) | (332) | 182 | (150) | |||||||||||||||||
| (48) | (42) | (808) | (898) | 223 | (675) | ||||||||||||||||||
| Other long-term liabilities | |||||||||||||||||||||||
| Foreign exchange contracts | — | — | (1,116) | (1,116) | 138 | (978) | |||||||||||||||||
| Interest rate contracts | (3) | — | (1) | (4) | — | (4) | |||||||||||||||||
| Commodity contracts | (37) | — | (133) | (170) | 25 | (145) | |||||||||||||||||
| (40) | — | (1,250) | (1,290) | 163 | (1,127) | ||||||||||||||||||
| Total net derivative asset/(liability) | |||||||||||||||||||||||
| Foreign exchange contracts | — | 114 | (1,441) | (1,327) | — | (1,327) | |||||||||||||||||
| Interest rate contracts | 900 | — | 10 | 910 | — | 910 | |||||||||||||||||
| Commodity contracts | (85) | — | (54) | (139) | — | (139) | |||||||||||||||||
| Other contracts | 1 | — | 9 | 10 | — | 10 | |||||||||||||||||
| 816 | 114 | (1,476) | (546) | — | (546) | ||||||||||||||||||
159
The following table summarizes the maturity and notional principal or quantity outstanding related to our derivative instruments:
| 2023 | 2022 | ||||||||||||||||||||||||||||||||||
| As at December 31, | 2024 | 2025 | 2026 | 2027 | 2028 | Thereafter | Total | Total | |||||||||||||||||||||||||||
Foreign exchange contracts - US dollar forwards - purchase (millions of US dollars) | 1,360 | 500 | — | — | — | 1,860 | 2,155 | ||||||||||||||||||||||||||||
Foreign exchange contracts - US dollar forwards - sell (millions of US dollars) | 6,582 | 5,327 | 4,697 | 4,091 | 3,162 | 888 | 24,747 | 27,610 | |||||||||||||||||||||||||||
Foreign exchange contracts - British pound (GBP) forwards - sell (millions of GBP) | 30 | 30 | 28 | 32 | — | — | 120 | 149 | |||||||||||||||||||||||||||
Foreign exchange contracts - Euro forwards - sell (millions of Euro) | 141 | 126 | 121 | 81 | 67 | 195 | 731 | 697 | |||||||||||||||||||||||||||
Foreign exchange contracts - Japanese yen forwards - purchase (millions of yen) | — | 84,800 | — | — | — | — | 84,800 | 84,800 | |||||||||||||||||||||||||||
Interest rate contracts - short-term pay fixed rate (millions of Canadian dollars) | 5,903 | 1,881 | 1,122 | 74 | 25 | 13 | 9,018 | 9,356 | |||||||||||||||||||||||||||
Interest rate contracts - short-term debt receive fixed rate (millions of Canadian dollars) | 918 | 923 | 174 | — | — | — | 2,015 | — | |||||||||||||||||||||||||||
Interest rate contracts - long-term pay fixed rate (millions of Canadian dollars)1 | 4,582 | 580 | — | — | — | — | 5,162 | 7,851 | |||||||||||||||||||||||||||
Interest rate contracts - costless collar (millions of Canadian dollars) | — | 1,098 | 41 | — | — | — | 1,139 | — | |||||||||||||||||||||||||||
Equity contracts (millions of Canadian dollars) | 34 | 13 | — | — | — | — | 47 | 80 | |||||||||||||||||||||||||||
Commodity contracts - natural gas (billions of cubic feet) | 31 | 32 | 13 | 10 | — | — | 86 | 93 | |||||||||||||||||||||||||||
Commodity contracts - crude oil (millions of barrels) | 6 | — | — | — | — | — | 6 | 16 | |||||||||||||||||||||||||||
Commodity contracts - power (megawatt per hour (MW/H)) | 49 | (14) | (26) | (53) | (57) | (30) | (22) | 2 | (14) | 2 | |||||||||||||||||||||||||
1Represents the notional of long-term debt issuances hedged
2Total is an average net purchase/(sale) of power.
Derivatives Designated as Fair Value Hedges
The following table presents foreign exchange derivative instruments that are designated and qualify as fair value hedges, the realized and unrealized gain or loss on the derivative is included in Other income/(expense) or Interest expense in the Consolidated Statements of Earnings. The offsetting loss or gain on the hedged item attributable to the hedged risk is included in Other income/(expense) in the Consolidated Statements of Earnings. Any excluded components are included in the Consolidated Statements of Comprehensive Income.
| Year ended December 31, | 2023 | 2022 | ||||||
| (millions of Canadian dollars) | ||||||||
| Unrealized gain/(loss) on derivative | (132) | 262 | ||||||
| Unrealized gain/(loss) on hedged item | 131 | (254) | ||||||
| Realized loss on derivative | (47) | (110) | ||||||
| Realized gain on hedged item | — | 85 | ||||||
160
The Effect of Derivative Instruments on the Statements of Earnings and Comprehensive Income
The following table presents the effect of cash flow hedges and fair value hedges on our consolidated earnings and consolidated comprehensive income, before the effect of income taxes:
| Year ended December 31, | 2023 | 2022 | 2021 | ||||||||
| (millions of Canadian dollars) | |||||||||||
| Amount of unrealized gain/(loss) recognized in OCI | |||||||||||
| Cash flow hedges | |||||||||||
| Foreign exchange contracts | — | 3 | (29) | ||||||||
| Interest rate contracts | 201 | 1,151 | 252 | ||||||||
| Commodity contracts | 68 | (53) | (28) | ||||||||
| Other contracts | (2) | (4) | 1 | ||||||||
| Fair value hedges | |||||||||||
| Foreign exchange contracts | 15 | (35) | (5) | ||||||||
| 282 | 1,062 | 191 | |||||||||
| Amount of loss reclassified from AOCI to earnings | |||||||||||
Foreign exchange contracts1 | — | 13 | 5 | ||||||||
Interest rate contracts2 | 28 | 186 | 296 | ||||||||
Commodity contracts3 | — | — | 1 | ||||||||
Other contracts3 | — | 4 | 2 | ||||||||
| 28 | 203 | 304 | |||||||||
1Reported within Transportation and other services revenues and Other income/(expense) in the Consolidated Statements of Earnings.
2Reported within Interest expense in the Consolidated Statements of Earnings.
3Reported within Operating and administrative expense in the Consolidated Statements of Earnings.
We estimate that a loss of $18 million from AOCI related to cash flow hedges will be reclassified to earnings in the next 12 months. Actual amounts reclassified to earnings depend on the foreign exchange rates, interest rates and commodity prices in effect when derivative contracts that are currently outstanding mature. For all forecasted transactions, the maximum term over which we are hedging exposures to the variability of cash flows is 2 years as at December 31, 2023.
Non-Qualifying Derivatives
The following table presents the unrealized gains and losses associated with changes in the fair value of our non-qualifying derivatives:
| Year ended December 31, | 2023 | 2022 | 2021 | ||||||||
| (millions of Canadian dollars) | |||||||||||
Foreign exchange contracts1 | 1,292 | (1,344) | 92 | ||||||||
Interest rate contracts2 | (63) | 10 | 2 | ||||||||
Commodity contracts3 | (41) | 50 | 71 | ||||||||
Other contracts4 | (8) | 4 | 8 | ||||||||
| Total unrealized derivative fair value gain/(loss), net | 1,180 | (1,280) | 173 | ||||||||
1For the respective years ended, reported within Transportation and other services revenues (2023 - $645 million gain; 2022 - $238 million loss; 2021 - $98 million gain) and Other income/(expense) (2023 - $647 million gain; 2022 - $1,106 million loss; 2021 - $6 million loss) in the Consolidated Statements of Earnings.
2Reported as an increase within Interest expense in the Consolidated Statements of Earnings.
3For the respective years ended, reported within Transportation and other services revenues (2023 - $35 million loss; 2022 - $13 million gain; 2021 - $9 million gain), Commodity sales (2023 - $153 million gain; 2022 - $89 million gain; 2021 - $160 million gain), Commodity costs (2023 - $94 million loss; 2022 - $102 million loss; 2021 - $105 million loss) and Operating and administrative expense (2023 - $65 million loss; 2022 - $50 million gain; 2021 - $7 million gain) in the Consolidated Statements of Earnings.
4Reported within Operating and administrative expense in the Consolidated Statements of Earnings.
161
LIQUIDITY RISK
Liquidity risk is the risk that we will not be able to meet our financial obligations, including commitments and guarantees, as they become due. In order to mitigate this risk, we forecast cash requirements over a 12-month rolling time period to determine whether sufficient funds will be available and maintain substantial capacity under our committed bank lines of credit to address any contingencies. Our primary sources of liquidity and capital resources are funds generated from operations, the issuance of commercial paper and draws under committed credit facilities and long-term debt, which includes debentures and medium-term notes. Our shelf prospectuses with securities regulators enable ready access to either the Canadian or US public capital markets, subject to market conditions. In addition, we maintain sufficient liquidity through committed credit facilities with a diversified group of banks and institutions which, if necessary, enables us to fund all anticipated requirements for approximately one year without accessing the capital markets. We were in compliance with all the terms and conditions of our committed credit facility agreements and term debt indentures as at December 31, 2023. As a result, all credit facilities are available to us and the banks are obligated to fund us under the terms of the facilities. We also identify a variety of other potential sources of debt and equity funding alternatives, including reinstatement of our dividend reinvestment and share purchase plan or at-the-market equity issuances.
CREDIT RISK
Entering into derivative instruments may result in exposure to credit risk from the possibility that a counterparty will default on its contractual obligations. In order to mitigate this risk, we enter into risk management transactions primarily with institutions that possess strong investment grade credit ratings. Credit risk relating to derivative counterparties is mitigated through the maintenance and monitoring of credit exposure limits and contractual requirements, netting arrangements and ongoing monitoring of counterparty credit exposure using external credit rating services and other analytical tools.
We have credit concentrations and credit exposure, with respect to derivative instruments, in the following counterparty segments:
| December 31, | 2023 | 2022 | ||||||
| (millions of Canadian dollars) | ||||||||
| Canadian financial institutions | 457 | 644 | ||||||
| US financial institutions | 252 | 277 | ||||||
| European financial institutions | 107 | 334 | ||||||
| Asian financial institutions | 121 | 224 | ||||||
Other1 | 125 | 105 | ||||||
| 1,062 | 1,584 | |||||||
1Other is comprised of commodity clearing house and physical natural gas and crude oil counterparties.
As at December 31, 2023, we did not provide any letters of credit in lieu of providing cash collateral to our counterparties pursuant to the terms of the relevant ISDA agreements. We held no cash collateral on derivative asset exposures as at December 31, 2023 and 2022.
Gross derivative balances have been presented without the effects of collateral posted. Derivative assets are adjusted for non-performance risk of our counterparties using their credit default swap spread rates and are reflected at fair value. For derivative liabilities, our non-performance risk is considered in the valuation.
162
Credit risk also arises from trade and other long-term receivables, and is mitigated through credit exposure limits and contractual requirements, the assessment of credit ratings and netting arrangements. Within Enbridge Gas, credit risk is mitigated by the utility's large and diversified customer base and the ability to recover an estimate for expected credit losses through the ratemaking process. We actively monitor the financial strength of large industrial customers and, in select cases, have obtained additional security to minimize the risk of default on receivables. Generally, we utilize a loss allowance matrix which contemplates historical credit losses by age of receivables, adjusted for any forward-looking information and management expectations to measure lifetime expected credit losses of receivables. The maximum exposure to credit risk related to non-derivative financial assets is their carrying value.
FAIR VALUE MEASUREMENTS
Our financial assets and liabilities measured at fair value on a recurring basis include derivatives and other financial instruments. We also disclose the fair value of other financial instruments not measured at fair value. The fair value of financial instruments reflects our best estimates of market value based on generally accepted valuation techniques or models and is supported by observable market prices and rates. When such values are not available, we use discounted cash flow analysis from applicable yield curves based on observable market inputs to estimate fair value.
FAIR VALUE OF FINANCIAL INSTRUMENTS
We categorize our financial instruments measured at fair value into one of three different levels depending on the observability of the inputs employed in the measurement.
Level 1
Level 1 includes financial instruments measured at fair value based on unadjusted quoted prices for identical assets and liabilities in active markets that are accessible at the measurement date. An active market for a financial instrument is considered to be a market where transactions occur with sufficient frequency and volume to provide pricing information on an ongoing basis. Our Level 1 instruments consist primarily of exchange-traded derivatives used to mitigate the risk of crude oil price fluctuations, US and Canadian treasury bills, investments in exchange-traded funds held by our captive insurance subsidiaries, as well as restricted long-term investments in exchange-traded funds that are held in trust in accordance with the CER's regulatory requirements under the LMCI.
Level 2
Level 2 includes financial instrument valuations determined using directly or indirectly observable inputs other than quoted prices included within Level 1. Financial instruments in this category are valued using models or other industry standard valuation techniques derived from observable market data. Such valuation techniques include inputs such as quoted forward prices, time value, volatility factors and broker quotes that can be observed or corroborated in the market for the entire duration of the financial instrument. Derivatives valued using Level 2 inputs include non-exchange traded derivatives such as over-the-counter foreign exchange forward and cross-currency swap contracts, interest rate swaps, physical forward commodity contracts, as well as commodity swaps and options for which observable inputs can be obtained.
We have also categorized the fair value of our long-term debt, investments in debt securities held by our captive insurance subsidiaries, and restricted long-term investments in Canadian government bonds held in trust in accordance with the CER's regulatory requirements under the LMCI as Level 2. The fair value of our long-term debt is based on quoted market prices for instruments of similar yield, credit risk and tenor. When possible, the fair value of our restricted long-term investments is based on quoted market prices for similar instruments and, if not available, based on broker quotes.
163
Level 3
Level 3 includes derivative valuations based on inputs which are less observable, unavailable or where the observable data does not support a significant portion of the derivative's fair value. Generally, Level 3 derivatives are longer dated transactions, occur in less active markets, occur at locations where pricing information is not available or have no binding broker quote to support Level 2 classification. We have developed methodologies, benchmarked against industry standards, to determine fair value for these derivatives based on the extrapolation of observable future prices and rates. Derivatives valued using Level 3 inputs primarily include long-dated derivative power, NGL and natural gas contracts, basis swaps, commodity swaps, and power and energy swaps, as well as physical forward commodity contracts. We do not have any other financial instruments categorized in Level 3.
We use the most observable inputs available to estimate the fair value of our derivatives. When possible, we estimate the fair value of our derivatives based on quoted market prices. If quoted market prices are not available, we use estimates from third-party brokers. For non-exchange traded derivatives classified in Levels 2 and 3, we use standard valuation techniques to calculate the estimated fair value. These methods include discounted cash flows for forwards and swaps and Black-Scholes-Merton pricing models for options. Depending on the type of derivative and nature of the underlying risk, we use observable market prices (interest, foreign exchange, commodity and share price) and volatility as primary inputs to these valuation techniques. Finally, we consider our own credit default swap spread, as well as the credit default swap spreads associated with our counterparties, in our estimation of fair value.
Fair Value of Derivatives
We have categorized our derivative assets and liabilities measured at fair value as follows:
| December 31, 2023 | Level 1 | Level 2 | Level 3 | Total Gross Derivative Instruments | ||||||||||
| (millions of Canadian dollars) | ||||||||||||||
| Financial assets | ||||||||||||||
| Current derivative assets | ||||||||||||||
| Foreign exchange contracts | — | 139 | — | 139 | ||||||||||
| Interest rate contracts | — | 65 | — | 65 | ||||||||||
| Commodity contracts | 142 | 103 | 173 | 418 | ||||||||||
| Other contracts | — | 1 | — | 1 | ||||||||||
| 142 | 308 | 173 | 623 | |||||||||||
| Long-term derivative assets | ||||||||||||||
| Foreign exchange contracts | — | 335 | — | 335 | ||||||||||
| Interest rate contracts | — | 53 | — | 53 | ||||||||||
| Commodity contracts | — | 24 | 51 | 75 | ||||||||||
| — | 412 | 51 | 463 | |||||||||||
| Financial liabilities | ||||||||||||||
| Current derivative liabilities | ||||||||||||||
| Foreign exchange contracts | — | (128) | — | (128) | ||||||||||
| Interest rate contracts | — | (186) | — | (186) | ||||||||||
| Commodity contracts | (136) | (76) | (211) | (423) | ||||||||||
| Other contracts | — | (1) | — | (1) | ||||||||||
| . | (136) | (391) | (211) | (738) | ||||||||||
| Long-term derivative liabilities | ||||||||||||||
| Foreign exchange contracts | — | (498) | — | (498) | ||||||||||
| Interest rate contracts | — | (88) | — | (88) | ||||||||||
| Commodity contracts | — | (22) | (144) | (166) | ||||||||||
| — | (608) | (144) | (752) | |||||||||||
| Total net financial asset/(liability) | ||||||||||||||
| Foreign exchange contracts | — | (152) | — | (152) | ||||||||||
| Interest rate contracts | — | (156) | — | (156) | ||||||||||
| Commodity contracts | 6 | 29 | (131) | (96) | ||||||||||
| Other contracts | — | — | — | — | ||||||||||
| 6 | (279) | (131) | (404) | |||||||||||
164
| December 31, 2022 | Level 1 | Level 2 | Level 3 | Total Gross Derivative Instruments | ||||||||||
| (millions of Canadian dollars) | ||||||||||||||
| Financial assets | ||||||||||||||
| Current derivative assets | ||||||||||||||
| Foreign exchange contracts | — | 46 | — | 46 | ||||||||||
| Interest rate contracts | — | 660 | — | 660 | ||||||||||
| Commodity contracts | 65 | 90 | 147 | 302 | ||||||||||
| Other contracts | — | 7 | — | 7 | ||||||||||
| 65 | 803 | 147 | 1,015 | |||||||||||
| Long-term derivative assets | ||||||||||||||
| Foreign exchange contracts | — | 309 | — | 309 | ||||||||||
| Interest rate contracts | — | 254 | — | 254 | ||||||||||
| Commodity contracts | — | 17 | 44 | 61 | ||||||||||
| Other contracts | — | 3 | — | 3 | ||||||||||
| — | 583 | 44 | 627 | |||||||||||
| Financial liabilities | ||||||||||||||
| Current derivative liabilities | ||||||||||||||
| Foreign exchange contracts | — | (566) | — | (566) | ||||||||||
| Commodity contracts | (60) | (77) | (195) | (332) | ||||||||||
| (60) | (643) | (195) | (898) | |||||||||||
| Long-term derivative liabilities | ||||||||||||||
| Foreign exchange contracts | — | (1,116) | — | (1,116) | ||||||||||
| Interest rate contracts | — | (4) | — | (4) | ||||||||||
| Commodity contracts | — | (38) | (132) | (170) | ||||||||||
| — | (1,158) | (132) | (1,290) | |||||||||||
| Total net financial asset/(liability) | ||||||||||||||
| Foreign exchange contracts | — | (1,327) | — | (1,327) | ||||||||||
| Interest rate contracts | — | 910 | — | 910 | ||||||||||
| Commodity contracts | 5 | (8) | (136) | (139) | ||||||||||
| Other contracts | — | 10 | — | 10 | ||||||||||
| 5 | (415) | (136) | (546) | |||||||||||
The significant unobservable inputs used in the fair value measurement of Level 3 derivative instruments were as follows:
| December 31, 2023 | Fair Value | Unobservable Input | Minimum Price | Maximum Price | Weighted Average Price | Unit of Measurement | ||||||||||||||
| (fair value in millions of Canadian dollars) | ||||||||||||||||||||
Commodity contracts - financial1 | ||||||||||||||||||||
| Natural gas | (6) | Forward gas price | 2.66 | 8.29 | 3.78 | $/mmbtu2 | ||||||||||||||
| Crude | (7) | Forward crude price | 69.01 | 92.76 | 80.35 | $/barrel | ||||||||||||||
| Power | (87) | Forward power price | 29.75 | 145.24 | 59.21 | $/MW/H | ||||||||||||||
Commodity contracts - physical1 | ||||||||||||||||||||
| Natural gas | 14 | Forward gas price | 0.86 | 11.85 | 3.42 | $/mmbtu2 | ||||||||||||||
| Crude | (7) | Forward crude price | 64.51 | 98.11 | 82.85 | $/barrel | ||||||||||||||
| Power | (38) | Forward power price | 18.20 | 164.84 | 58.46 | $/MW/H | ||||||||||||||
| (131) | ||||||||||||||||||||
1Financial and physical forward commodity contracts are valued using a market approach valuation technique.
2One million British thermal units (mmbtu).
If adjusted, the significant unobservable inputs disclosed in the table above would have a direct impact on the fair value of our Level 3 derivative instruments. The significant unobservable inputs used in the fair value measurement of Level 3 derivative instruments include forward commodity prices. Changes in forward commodity prices could result in significantly different fair values for our Level 3 derivatives.
165
Changes in the net fair value of derivative assets and liabilities classified as Level 3 in the fair value hierarchy were as follows:
| Year ended December 31, | 2023 | 2022 | ||||||
| (millions of Canadian dollars) | ||||||||
| Level 3 net derivative liability at beginning of period | (136) | (108) | ||||||
| Total gain/(loss), unrealized | ||||||||
Included in earnings1 | (48) | 6 | ||||||
| Included in OCI | 67 | (54) | ||||||
| Settlements | (14) | 20 | ||||||
| Level 3 net derivative liability at end of year | (131) | (136) | ||||||
1Reported within Transportation and other services revenues, Commodity costs and Operating and administrative expense in the Consolidated Statements of Earnings.
There were no transfers into or out of Level 3 as at December 31, 2023 or 2022.
Net Investment Hedges
We currently have designated a portion of our US dollar-denominated debt as a hedge of our net investment in US dollar-denominated investments and subsidiaries.
During the years ended December 31, 2023 and 2022, we recognized unrealized foreign exchange gains of $645 million and losses of $954 million, respectively, on the translation of US dollar-denominated debt, in OCI. No unrealized gains or losses on the change in fair value of our outstanding foreign exchange forward contracts were recognized in OCI during the years ended December 31, 2023 and 2022. No realized gains or losses associated with the settlement of foreign exchange forward contracts were recognized in OCI during the years ended December 31, 2023 and 2022. During the years ended December 31, 2023 and 2022, we recognized a realized loss of $236 million and $21 million, respectively, associated with the settlement of US dollar-denominated debt that had matured during the period, in OCI.
Fair Value of Other Financial Instruments
Certain long-term investments in other entities with no actively quoted prices are classified as FVMA investments and are recorded at cost less impairment. The carrying value of FVMA investments totaled $173 million and $102 million as at December 31, 2023 and 2022, respectively.
We have wholly-owned captive insurance subsidiaries whose principal activity is providing insurance and reinsurance coverage for certain insurable property and casualty risk exposures of our operating subsidiaries and certain equity investments. As at December 31, 2023, the fair value of investments inequity funds and debt securities held by our captive insurance subsidiaries was $287 million and $284 million, respectively (2022 - $335 million and $298 million, respectively). Our investments in debt securities had a cost basis of $279 million as at December 31, 2023 (2022 - $295 million). These investments in equity funds and debt securities are recognized at fair value, classified as Level 1 and Level 2 in the fair value hierarchy, respectively, and are recorded in Other current assets and Long-term investments in the Consolidated Statements of Financial Position. There were unrealized holding gains of $34 million for the year ended December 31, 2023 (2022 - losses of $26 million).
As at December 31, 2023 and 2022, our long-term debt had a carrying value of $81.2 billion and $79.3 billion, respectively, before debt issuance costs and a fair value of $78.1 billion and $73.5 billion, respectively. We also have non-current notes receivable carried at book value and recorded in Deferred amounts and other assets in the Consolidated Statements of Financial Position. As at December 31, 2023 and 2022, the non-current notes receivable had a carrying value of $53 million and $752 million, respectively, which also approximates their fair value.
166
As at December 31, 2023 and 2022, we had investments with a fair value of $717 million and $593 million, respectively, included in Restricted long-term investments in the Consolidated Statements of Financial Position. These securities are classified as available-for-sale and represent restricted funds which are collected from customers and held in trust for the purpose of funding pipeline abandonment in accordance with the CER's regulatory requirements.
We had restricted long-term investments held in trust totaling $263 million and $236 million as at December 31, 2023 and 2022, respectively, which are classified as Level 1 in the fair value hierarchy. We also had restricted long-term investments held in trust totaling $454 million (cost basis - $486 million) and $357 million (cost basis - $437 million) as at December 31, 2023 and 2022, respectively, which are classified as Level 2 in the fair value hierarchy. There were unrealized holding gains of $51 million and losses $122 million on these investments for the years ended December 31, 2023 and 2022, respectively. Within Other long-term liabilities we had estimated future abandonment costs related to LMCI of $745 million and $610 million as at December 31, 2023 and 2022, respectively (Note 7).
The fair value of financial assets and liabilities other than derivative instruments, certain long-term investments in other entities, restricted long-term investments, investments held by our captive insurance subsidiaries, long-term debt and non-current notes receivable described above approximate their carrying value due to the short period to maturity.
24. INCOME TAXES
INCOME TAX RATE RECONCILIATION
| Year ended December 31, | 2023 | 2022 | 2021 | ||||||||
| (millions of Canadian dollars) | |||||||||||
| Earnings before income taxes | 7,879 | 4,542 | 7,729 | ||||||||
| Canadian federal statutory income tax rate | 15 | % | 15 | % | 15 | % | |||||
| Expected federal taxes at statutory rate | 1,182 | 681 | 1,159 | ||||||||
| Increase/(decrease) resulting from: | |||||||||||
Provincial and state income taxes1 | 411 | 108 | 228 | ||||||||
Foreign and other statutory rate differentials2 | 187 | 295 | 134 | ||||||||
Effects of rate-regulated accounting3 | (106) | (122) | (139) | ||||||||
Write-off of regulatory deferrals3,4 | 115 | — | — | ||||||||
Part VI.1 tax, net of federal Part I deduction3,5 | 66 | 76 | 73 | ||||||||
US Minimum Tax6 | 100 | 107 | — | ||||||||
Non-taxable portion of gain on sale of investment3,7 | — | — | (23) | ||||||||
Valuation allowance3 | (12) | 6 | 5 | ||||||||
Accounting impairment of non-deductible goodwill3,8 | — | 370 | — | ||||||||
Noncontrolling interests3,9 | 19 | 9 | (17) | ||||||||
| Investment and production tax credits | (47) | — | — | ||||||||
Other3 | (94) | 74 | (5) | ||||||||
| Income tax expense | 1,821 | 1,604 | 1,415 | ||||||||
| Effective income tax rate | 23.1 | % | 35.3 | % | 18.3 | % | |||||
1The change in provincial and state income taxes from 2022 to 2023 reflects the decrease in earnings from Canadian operations and changes to the state tax apportionment partially offset by a reduction in earnings from US operations before considering the 2022 non-deductible goodwill impairment. Refer to Note 15 - Goodwill.
2The change in foreign and other statutory rate differentials from 2022 to 2023 reflects the decrease in earnings from US operations before considering the 2022 non-deductible goodwill impairment. Refer to Note 15 - Goodwill.
3The provincial and state tax component of these items is included in the Provincial and state income taxes above.
4The amount in 2023 includes the federal tax impact of the de-recognition of rate regulated accounting for income tax relating to Southern Lights Canada and portions of the Canadian Mainline including Line 9 and L3R. Refer to Note 7 - Regulatory Matters.
5Part VI.1 tax is a tax levied on preferred share dividends paid in Canada.
6There was no US Minimum Tax in 2021 as a result of tax losses from bonus tax depreciation.
7The amount in 2021 relates to the federal impact of the gain on sale of the investment in Noverco.
8The amount in 2022 relates to the federal impact of the non-deductible goodwill impairment relating to the Gas Transmission reporting unit. Refer to Note 15 - Goodwill.
167
9The amount includes the federal tax impact of impairment to Chapman Ranch in 2023 and Magic Valley in 2022 attributable to noncontrolling interests. Refer to Note 11 - Property, Plant and Equipment.
COMPONENTS OF PRETAX EARNINGS AND INCOME TAXES
| Year ended December 31, | 2023 | 2022 | 2021 | ||||||||
| (millions of Canadian dollars) | |||||||||||
| Earnings before income taxes | |||||||||||
| Canada | 2,233 | 583 | 3,399 | ||||||||
| US | 4,620 | 2,865 | 3,336 | ||||||||
| Other | 1,026 | 1,094 | 994 | ||||||||
| 7,879 | 4,542 | 7,729 | |||||||||
| Current income taxes | |||||||||||
| Canada | 100 | 360 | 162 | ||||||||
| US | 191 | 201 | 80 | ||||||||
| Other | 110 | 86 | 82 | ||||||||
| 401 | 647 | 324 | |||||||||
| Deferred income taxes | |||||||||||
| Canada | 456 | (358) | 344 | ||||||||
| US | 974 | 1,309 | 741 | ||||||||
| Other | (10) | 6 | 6 | ||||||||
| 1,420 | 957 | 1,091 | |||||||||
| Income tax expense | 1,821 | 1,604 | 1,415 | ||||||||
COMPONENTS OF DEFERRED INCOME TAXES
Deferred income tax assets and liabilities are recognized for the future tax consequences of differences between carrying amounts of assets and liabilities and their respective tax bases. Major components of deferred income tax assets and liabilities are as follows:
| December 31, | 2023 | 2022 | ||||||
| (millions of Canadian dollars) | ||||||||
| Deferred income tax liabilities | ||||||||
| Property, plant and equipment | (9,202) | (9,096) | ||||||
| Investments | (7,765) | (7,099) | ||||||
| Regulatory assets | (1,338) | (1,291) | ||||||
| Other | (52) | (46) | ||||||
| Total deferred income tax liabilities | (18,357) | (17,532) | ||||||
| Deferred income tax assets | ||||||||
| Financial instruments | 271 | 456 | ||||||
| Loss carryforwards | 1,745 | 2,259 | ||||||
| Other | 1,798 | 1,723 | ||||||
| Total deferred income tax assets | 3,814 | 4,438 | ||||||
| Less valuation allowance | (147) | (215) | ||||||
| Total deferred income tax assets, net | 3,667 | 4,223 | ||||||
| Net deferred income tax liabilities | (14,690) | (13,309) | ||||||
| Presented as follows: | ||||||||
| Total deferred income tax assets | 341 | 472 | ||||||
| Total deferred income tax liabilities | (15,031) | (13,781) | ||||||
| Net deferred income tax liabilities | (14,690) | (13,309) | ||||||
A valuation allowance has been established for certain loss and credit carryforwards, and outside basis temporary differences on investments that reduce deferred income tax assets to an amount that will more likely than not be realized.
168
As at December 31, 2023, we recognized the benefit of unused tax loss carryforwards of $1.3 billion (2022 - $2.1 billion) in Canada which expire in 2030 and beyond.
As at December 31, 2023, we recognized the benefit of unused tax loss carryforwards of $6.4 billion (2022 - $8.1 billion) in the US. Unused tax loss carryforwards of $0.1 billion (2022 - $0.2 billion) begin to expire in 2024, and unused tax loss carryforwards of $6.3 billion (2022 - $7.9 billion) have no expiration.
We have not provided for deferred income taxes on the difference between the carrying value of substantially all of our foreign subsidiaries and their corresponding tax basis as the earnings of those subsidiaries are intended to be permanently reinvested in their operations. As such, these investments are not anticipated to give rise to income taxes in the foreseeable future. The difference between the carrying values of the investments and their tax bases is largely a result of unremitted earnings and currency translation adjustments. The unremitted earnings and currency translation adjustment for which no deferred taxes have been recognized in respect of foreign subsidiaries were $6.6 billion and $8.0 billion for the periods ended December 31, 2023 and 2022, respectively. If such earnings are remitted, in the form of dividends or otherwise, we may be subject to income taxes and foreign withholding taxes. The determination of the amount of unrecognized deferred income tax liabilities applicable to such amounts is not practicable.
Enbridge and certain of our subsidiaries are subject to taxation in Canada, the US and other foreign jurisdictions. The material jurisdictions in which we are subject to potential examinations include the US (Federal) and Canada (Federal, Alberta and Québec). We are open to examination by Canadian tax authorities for the 2016 to 2023 tax years and by US tax authorities for the 2020 to 2023 tax years. We are currently under examination for income tax matters in Canada for the 2017 to 2020 tax years. We are not currently under examination for income tax matters in any other material jurisdiction where we are subject to income tax.
UNRECOGNIZED TAX BENEFITS
| Year ended December 31, | 2023 | 2022 | ||||||
| (millions of Canadian dollars) | ||||||||
| Unrecognized tax benefits at beginning of year | 55 | 76 | ||||||
| Gross decreases for tax positions of prior year | (2) | (17) | ||||||
| Change in translation of foreign currency | (1) | 1 | ||||||
| Lapses of statute of limitations | (7) | (5) | ||||||
| Unrecognized tax benefits at end of year | 45 | 55 | ||||||
The unrecognized tax benefits as at December 31, 2023, if recognized, would impact our effective income tax rate. We do not anticipate further adjustments to the unrecognized tax benefits during the next 12 months that would have a material impact on our consolidated financial statements.
We recognize accrued interest and penalties related to unrecognized tax benefits as a component of income taxes. Interest and penalties included in income taxes for both years ended December 31, 2023 and 2022 were a $1 million expense. As at December 31, 2023 and 2022, interest and penalties of $14 million and $13 million, respectively, have been accrued.
169
25. PENSION AND OTHER POSTRETIREMENT BENEFITS
PENSION PLANS
We sponsor Canadian and US contributory and non-contributory registered defined benefit and defined contribution pension plans, which provide benefits covering substantially all employees. The Canadian pension plans provide defined benefit and defined contribution pension benefits to our Canadian employees. The US pension plans provide defined benefit pension benefits to our US employees. We also sponsor supplemental non-contributory defined benefit pension plans, which provide non-registered benefits for certain employees in Canada and the US.
Defined Benefit Pension Plan Benefits
Benefits payable from the defined benefit pension plans are based on each plan participant's years of service and final average remuneration. Some benefits are partially inflation-indexed after a plan participant’s retirement. Our contributions are made in accordance with independent actuarial valuations. Participant contributions to contributory defined benefit pension plans are based upon each plan participant's current eligible remuneration.
Defined Contribution Pension Plan Benefits
Our contributions are based on each plan participant's current eligible remuneration. Our contributions for some defined contribution pension plans are also based on age and years of service. Our defined contribution pension benefit costs are equal to the amount of contributions required to be made by us.
170
Benefit Obligations, Plan Assets and Funded Status
The following table details the changes in the projected benefit obligation, the fair value of plan assets and the recorded assets or liabilities for our defined benefit pension plans:
| Canada | US | ||||||||||||||||
| December 31, | 2023 | 2022 | 2023 | 2022 | |||||||||||||
| (millions of Canadian dollars) | |||||||||||||||||
| Change in projected benefit obligation | |||||||||||||||||
| Projected benefit obligation at beginning of year | 3,630 | 4,600 | 1,029 | 1,184 | |||||||||||||
| Service cost | 81 | 131 | 40 | 43 | |||||||||||||
| Interest cost | 184 | 127 | 47 | 24 | |||||||||||||
| Participant contributions | 31 | 29 | — | — | |||||||||||||
Actuarial (gain)/loss1 | 359 | (1,069) | 31 | (201) | |||||||||||||
| Benefits paid | (193) | (187) | (76) | (94) | |||||||||||||
| Foreign currency exchange rate changes | — | — | (29) | 77 | |||||||||||||
| Other | — | (1) | (6) | (4) | |||||||||||||
Projected benefit obligation at end of year2 | 4,092 | 3,630 | 1,036 | 1,029 | |||||||||||||
| Change in plan assets | |||||||||||||||||
| Fair value of plan assets at beginning of year | 4,234 | 4,536 | 1,080 | 1,160 | |||||||||||||
| Actual return/(loss) on plan assets | 427 | (235) | 78 | (64) | |||||||||||||
| Employer contributions | 27 | 91 | 5 | 4 | |||||||||||||
| Participant contributions | 31 | 29 | — | — | |||||||||||||
| Benefits paid | (193) | (187) | (76) | (94) | |||||||||||||
| Foreign currency exchange rate changes | — | — | (29) | 78 | |||||||||||||
| Other | 2 | — | (6) | (4) | |||||||||||||
Fair value of plan assets at end of year3 | 4,528 | 4,234 | 1,052 | 1,080 | |||||||||||||
| Overfunded status at end of year | 436 | 604 | 16 | 51 | |||||||||||||
| Presented as follows: | |||||||||||||||||
| Deferred amounts and other assets | 636 | 764 | 116 | 141 | |||||||||||||
| Other current liabilities | (8) | (9) | (5) | (5) | |||||||||||||
| Other long-term liabilities | (192) | (151) | (95) | (85) | |||||||||||||
| 436 | 604 | 16 | 51 | ||||||||||||||
1Primarily due to the decrease in the discount rate used to measure the defined benefit obligations (2022 - primarily due to increase in the discount rate used to measure the defined benefit obligations).
2The accumulated benefit obligation for our Canadian pension plans was $3.8 billion and $3.4 billion as at December 31, 2023 and 2022, respectively. The accumulated benefit obligation for our US pension plans was $1.0 billion as at December 31, 2023 and 2022.
3Assets in the amount of $14 million (2022 - $10 million) and $62 million (2022 - $58 million), related to our Canadian and US non-registered supplemental pension plan obligations, are held in grantor trusts and rabbi trusts that, in accordance with federal tax regulations, are not restricted from creditors. These assets are committed for the future settlement of benefit obligations included in the underfunded status as at the end of the year, however they are excluded from plan assets for accounting purposes.
171
Certain of our pension plans have accumulated benefit obligations in excess of the fair value of plan assets. For these plans, the accumulated benefit obligation and fair value of plan assets were as follows:
| Canada | US | ||||||||||||||||
| December 31, | 2023 | 2022 | 2023 | 2022 | |||||||||||||
| (millions of Canadian dollars) | |||||||||||||||||
| Accumulated benefit obligation | 394 | 360 | 99 | 89 | |||||||||||||
| Fair value of plan assets | 243 | 218 | — | — | |||||||||||||
Certain of our pension plans have projected benefit obligations in excess of the fair value of plan assets. For these plans, the projected benefit obligation and fair value of plan assets were as follows:
| Canada | US | ||||||||||||||||
| December 31, | 2023 | 2022 | 2023 | 2022 | |||||||||||||
| (millions of Canadian dollars) | |||||||||||||||||
| Projected benefit obligation | 416 | 377 | 99 | 90 | |||||||||||||
| Fair value of plan assets | 243 | 218 | — | — | |||||||||||||
Amount Recognized in Accumulated Other Comprehensive Income
The amount of pre-tax AOCI relating to our pension plans are as follows:
| Canada | US | ||||||||||||||||
| December 31, | 2023 | 2022 | 2023 | 2022 | |||||||||||||
| (millions of Canadian dollars) | |||||||||||||||||
| Net actuarial (gain)/loss | 51 | (64) | 74 | 40 | |||||||||||||
| Prior service cost | — | — | 1 | 1 | |||||||||||||
Total amount recognized in AOCI1 | 51 | (64) | 75 | 41 | |||||||||||||
1Excludes amounts related to CTA.
Net Periodic Benefit (Credit)/Cost and Other Amounts Recognized in Comprehensive Income
The components of net periodic benefit (credit)/cost and other amounts recognized in pre-tax Comprehensive income related to our pension plans are as follows:
| Canada | US | |||||||||||||||||||||||||
| Year ended December 31, | 2023 | 2022 | 2021 | 2023 | 2022 | 2021 | ||||||||||||||||||||
| (millions of Canadian dollars) | ||||||||||||||||||||||||||
| Service cost | 81 | 131 | 139 | 40 | 43 | 44 | ||||||||||||||||||||
Interest cost1 | 184 | 127 | 101 | 47 | 24 | 17 | ||||||||||||||||||||
Expected return on plan assets1 | (271) | (295) | (252) | (77) | (85) | (73) | ||||||||||||||||||||
Amortization/settlement of net actuarial (gain)/loss1 | — | 8 | 54 | (4) | — | 11 | ||||||||||||||||||||
Amortization/curtailment of prior service credit1 | — | — | — | — | (2) | — | ||||||||||||||||||||
| Net periodic benefit (credit)/cost | (6) | (29) | 42 | 6 | (20) | (1) | ||||||||||||||||||||
| Defined contribution benefit cost | 12 | 10 | 7 | — | — | — | ||||||||||||||||||||
| Net pension (credit)/cost recognized in Earnings | 6 | (19) | 49 | 6 | (20) | (1) | ||||||||||||||||||||
| Amount recognized in OCI: | ||||||||||||||||||||||||||
| Amortization/settlement of net actuarial (gain)/loss | — | (2) | (25) | 4 | — | (11) | ||||||||||||||||||||
| Amortization/curtailment of prior service credit | — | — | — | — | 2 | — | ||||||||||||||||||||
| Net actuarial (gain)/loss arising during the year | 115 | (288) | (291) | 30 | (52) | (99) | ||||||||||||||||||||
| Total amount recognized in OCI | 115 | (290) | (316) | 34 | (50) | (110) | ||||||||||||||||||||
| Total amount recognized in Comprehensive income | 121 | (309) | (267) | 40 | (70) | (111) | ||||||||||||||||||||
1Reported within Other income/(expense) in the Consolidated Statements of Earnings.
172
Actuarial Assumptions
The weighted average assumptions made in the measurement of the projected benefit obligation and net periodic benefit cost of our pension plans are as follows:
| Canada | US | ||||||||||||||||||||||
| 2023 | 2022 | 2021 | 2023 | 2022 | 2021 | ||||||||||||||||||
| Projected benefit obligation | |||||||||||||||||||||||
| Discount rate | 4.6 | % | 5.1 | % | 3.2 | % | 4.7 | % | 4.9 | % | 2.6 | % | |||||||||||
| Rate of salary increase | 3.0 | % | 2.9 | % | 2.9 | % | 2.6 | % | 2.8 | % | 2.8 | % | |||||||||||
| Cash balance interest credit rate | N/A | N/A | N/A | 4.5 | % | 4.3 | % | 4.3 | % | ||||||||||||||
| Net periodic benefit cost | |||||||||||||||||||||||
| Discount rate | 5.3 | % | 3.2 | % | 2.6 | % | 4.9 | % | 2.6 | % | 2.2 | % | |||||||||||
| Rate of return on plan assets | 6.5 | % | 6.6 | % | 6.2 | % | 7.4 | % | 7.4 | % | 7.3 | % | |||||||||||
| Rate of salary increase | 2.9 | % | 2.9 | % | 2.3 | % | 2.8 | % | 2.8 | % | 2.7 | % | |||||||||||
| Cash balance interest credit rate | N/A | N/A | N/A | 4.3 | % | 4.3 | % | 4.3 | % | ||||||||||||||
OTHER POSTRETIREMENT BENEFIT PLANS
We sponsor funded and unfunded defined benefit OPEB Plans, which provide non-contributory supplemental health, dental, life and health spending account benefit coverage for certain qualifying retired employees.
Benefit Obligations, Plan Assets and Funded Status
The following table details the changes in the accumulated postretirement benefit obligation, the fair value of plan assets and the recorded assets or liabilities for our defined benefit OPEB plans:
| Canada | US | ||||||||||||||||
| December 31, | 2023 | 2022 | 2023 | 2022 | |||||||||||||
| (millions of Canadian dollars) | |||||||||||||||||
| Change in accumulated postretirement benefit obligation | |||||||||||||||||
| Accumulated postretirement benefit obligation at beginning of year | 211 | 274 | 136 | 173 | |||||||||||||
| Service cost | 3 | 4 | 1 | 1 | |||||||||||||
| Interest cost | 11 | 7 | 6 | 3 | |||||||||||||
| Participant contributions | — | — | 5 | 6 | |||||||||||||
Actuarial (gain)/loss1 | 13 | (66) | 4 | (37) | |||||||||||||
| Benefits paid | (10) | (8) | (20) | (21) | |||||||||||||
| Foreign currency exchange rate changes | — | — | (3) | 11 | |||||||||||||
| Accumulated postretirement benefit obligation at end of year | 228 | 211 | 129 | 136 | |||||||||||||
| Change in plan assets | |||||||||||||||||
| Fair value of plan assets at beginning of year | — | — | 185 | 201 | |||||||||||||
| Actual return/(loss) on plan assets | — | — | 14 | (21) | |||||||||||||
| Employer contributions | 10 | 8 | 7 | 7 | |||||||||||||
| Participant contributions | — | — | 5 | 6 | |||||||||||||
| Benefits paid | (10) | (8) | (20) | (21) | |||||||||||||
| Foreign currency exchange rate changes | — | — | (4) | 13 | |||||||||||||
| Fair value of plan assets at end of year | — | — | 187 | 185 | |||||||||||||
| Overfunded/(underfunded) status at end of year | (228) | (211) | 58 | 49 | |||||||||||||
| Presented as follows: | |||||||||||||||||
| Deferred amounts and other assets | — | — | 73 | 75 | |||||||||||||
| Other current liabilities | (12) | (12) | — | — | |||||||||||||
| Other long-term liabilities | (216) | (199) | (15) | (26) | |||||||||||||
| (228) | (211) | 58 | 49 | ||||||||||||||
1Primarily due to the decrease in the discount rate used to measure the defined benefit obligations (2022 - primarily due to increase in the discount rate used to measure the benefit obligations).
173
Certain of our OPEB plans have accumulated benefit obligations in excess of the fair value of plan assets. For these plans, the accumulated benefit obligation and fair value of plan assets were as follows:
| Canada | US | ||||||||||||||||
| December 31, | 2023 | 2022 | 2023 | 2022 | |||||||||||||
| (millions of Canadian dollars) | |||||||||||||||||
| Accumulated benefit obligation | 228 | 211 | 78 | 76 | |||||||||||||
| Fair value of plan assets | — | — | 63 | 50 | |||||||||||||
Amount Recognized in Accumulated Other Comprehensive Income
The amount of pre-tax AOCI relating to our OPEB plans are as follows:
| Canada | US | ||||||||||||||||
| December 31, | 2023 | 2022 | 2023 | 2022 | |||||||||||||
| (millions of Canadian dollars) | |||||||||||||||||
| Net actuarial gain | (82) | (101) | (96) | (102) | |||||||||||||
| Prior service credit | (1) | (1) | (22) | (30) | |||||||||||||
Total amount recognized in AOCI1 | (83) | (102) | (118) | (132) | |||||||||||||
1Excludes amounts related to CTA.
Net Periodic Benefit (Credit)/Cost and Other Amounts Recognized in Comprehensive Income
The components of net periodic benefit (credit)/cost and other amounts recognized in pre-tax Comprehensive income related to our OPEB plans are as follows:
| Canada | US | ||||||||||||||||||||||
| Year ended December 31, | 2023 | 2022 | 2021 | 2023 | 2022 | 2021 | |||||||||||||||||
| (millions of Canadian dollars) | |||||||||||||||||||||||
| Service cost | 3 | 4 | 6 | 1 | 1 | 1 | |||||||||||||||||
Interest cost1 | 11 | 7 | 7 | 6 | 3 | 3 | |||||||||||||||||
Expected return on plan assets1 | — | — | — | (11) | (12) | (10) | |||||||||||||||||
Amortization/settlement of net actuarial gain1 | (6) | (1) | — | (6) | (6) | (1) | |||||||||||||||||
Amortization/curtailment of prior service credit1 | — | — | — | (8) | (7) | (7) | |||||||||||||||||
| Net periodic benefit (credit)/cost recognized in Earnings | 8 | 10 | 13 | (18) | (21) | (14) | |||||||||||||||||
| Amount recognized in OCI: | |||||||||||||||||||||||
| Amortization/settlement of net actuarial gain | 6 | 1 | — | 6 | 6 | 1 | |||||||||||||||||
| Amortization/curtailment of prior service credit | — | — | — | 8 | 7 | 7 | |||||||||||||||||
| Net actuarial (gain)/loss arising during the year | 13 | (67) | (50) | — | (4) | (80) | |||||||||||||||||
| Total amount recognized in OCI | 19 | (66) | (50) | 14 | 9 | (72) | |||||||||||||||||
| Total amount recognized in Comprehensive income | 27 | (56) | (37) | (4) | (12) | (86) | |||||||||||||||||
1Reported within Other income/(expense) in the Consolidated Statements of Earnings.
The weighted average assumptions made in the measurement of the accumulated postretirement benefit obligation and net periodic benefit cost of our OPEB plans are as follows:
| Canada | US | ||||||||||||||||||||||
| 2023 | 2022 | 2021 | 2023 | 2022 | 2021 | ||||||||||||||||||
| Accumulated postretirement benefit obligation | |||||||||||||||||||||||
| Discount rate | 4.6 | % | 5.3 | % | 3.2 | % | 4.7 | % | 4.9 | % | 2.4 | % | |||||||||||
| Net periodic benefit cost | |||||||||||||||||||||||
| Discount rate | 5.3 | % | 3.2 | % | 2.6 | % | 4.9 | % | 2.4 | % | 2.0 | % | |||||||||||
| Rate of return on plan assets | N/A | N/A | N/A | 5.9 | % | 6.0 | % | 6.0 | % | ||||||||||||||
174
Assumed Health Care Cost Trend Rates
The assumed rates for the next year used to measure the expected cost of benefits are as follows:
| Canada | US1 | ||||||||||||||||
| 2023 | 2022 | 2023 | 2022 | ||||||||||||||
| Health care cost trend rate assumed for next year | 4.0 | % | 4.0 | % | 4.7 | % | 4.7 | % | |||||||||
| Rate to which the cost trend is assumed to decline (ultimate trend rate) | 4.0 | % | 4.0 | % | 3.3 | % | 3.3 | % | |||||||||
| Year that the rate reaches the ultimate trend rate | N/A | N/A | 2022 - 2045 | 2021 - 2045 | |||||||||||||
1In addition, under the Enbridge Employee Services, Inc., Health Reimbursement Account Plan, health care costs will increase by 5.0% every three years.
PLAN ASSETS
We manage the investment risk of our pension funds by setting a long-term asset mix policy for each plan after consideration of: (i) the nature of pension plan liabilities; (ii) the investment horizon of the plan; (iii) the going concern and solvency funded status and cash flow requirements of the plan; (iv) our operating environment and financial situation and our ability to withstand fluctuations in pension contributions; and (v) the future economic and capital markets outlook with respect to investment returns, volatility of returns and correlation between assets.
The overall expected rate of return on plan assets is based on the asset allocation targets with estimates for returns based on long-term expectations.
The asset allocation targets and major categories of plan assets are as follows:
| Canada | US | ||||||||||||||||||||||
| Target | December 31, | Target | December 31, | ||||||||||||||||||||
| Asset Category | Allocation | 2023 | 2022 | Allocation | 2023 | 2022 | |||||||||||||||||
| Equity securities | 46.0 | % | 41.4 | % | 38.2 | % | 45.0 | % | 39.5 | % | 38.3 | % | |||||||||||
| Fixed income securities | 23.2 | % | 29.6 | % | 31.7 | % | 20.0 | % | 19.4 | % | 20.5 | % | |||||||||||
Alternatives1 | 30.8 | % | 29.0 | % | 30.1 | % | 35.0 | % | 41.1 | % | 41.2 | % | |||||||||||
1Alternatives include investments in private debt, private equity, infrastructure and real estate funds. Fund values are based on the net asset value of the funds that invest directly in the aforementioned underlying investments. The values of the investments have been estimated using the capital accounts representing the plan's ownership interest in the funds.
175
Pension Plans
The following table summarizes the fair value of plan assets for our pension plans recorded at each fair value hierarchy level:
| Canada | US | ||||||||||||||||||||||||||||
Level 11 | Level 22 | Level 33 | Total | Level 11 | Level 22 | Level 33 | Total | ||||||||||||||||||||||
| (millions of Canadian dollars) | |||||||||||||||||||||||||||||
| December 31, 2023 | |||||||||||||||||||||||||||||
| Cash and cash equivalents | 227 | — | — | 227 | 8 | — | — | 8 | |||||||||||||||||||||
Equity securities4 | |||||||||||||||||||||||||||||
| Canada | — | 3 | — | 3 | — | — | — | — | |||||||||||||||||||||
| Global | — | 1,871 | — | 1,871 | — | 416 | — | 416 | |||||||||||||||||||||
Fixed income securities4 | |||||||||||||||||||||||||||||
| Government | — | 446 | — | 446 | — | 46 | — | 46 | |||||||||||||||||||||
| Corporate | — | 667 | — | 667 | — | 149 | — | 149 | |||||||||||||||||||||
Alternatives5 | — | — | 1,290 | 1,290 | — | — | 433 | 433 | |||||||||||||||||||||
| Forward currency contracts | — | 24 | — | 24 | — | — | — | — | |||||||||||||||||||||
| Total pension plan assets at fair value | 227 | 3,011 | 1,290 | 4,528 | 8 | 611 | 433 | 1,052 | |||||||||||||||||||||
| December 31, 2022 | |||||||||||||||||||||||||||||
| Cash and cash equivalents | 272 | — | — | 272 | 13 | — | — | 13 | |||||||||||||||||||||
Equity securities4 | |||||||||||||||||||||||||||||
| Canada | — | 355 | — | 355 | — | — | — | — | |||||||||||||||||||||
| Global | — | 1,263 | — | 1,263 | — | 414 | — | 414 | |||||||||||||||||||||
Fixed income securities4 | |||||||||||||||||||||||||||||
| Government | 201 | 435 | — | 636 | — | 87 | — | 87 | |||||||||||||||||||||
| Corporate | — | 433 | — | 433 | — | 121 | — | 121 | |||||||||||||||||||||
Alternatives5 | — | — | 1,291 | 1,291 | — | — | 445 | 445 | |||||||||||||||||||||
| Forward currency contracts | — | (16) | — | (16) | — | — | — | — | |||||||||||||||||||||
| Total pension plan assets at fair value | 473 | 2,470 | 1,291 | 4,234 | 13 | 622 | 445 | 1,080 | |||||||||||||||||||||
1Level 1 assets include assets with quoted prices in active markets for identical assets.
2Level 2 assets include assets with significant observable inputs.
3Level 3 assets include assets with significant unobservable inputs.
4Pension plan assets include $61 million (2022 - $32 million) of equity and fixed income securities investments held with related parties.
5Alternatives include investments in private debt, private equity, infrastructure and real estate funds.
Changes in the net fair value of pension plan assets classified as Level 3 in the fair value hierarchy were as follows:
| Canada | US | ||||||||||||||||
| December 31, | 2023 | 2022 | 2023 | 2022 | |||||||||||||
| (millions of Canadian dollars) | |||||||||||||||||
| Balance at beginning of year | 1,291 | 1,064 | 445 | 337 | |||||||||||||
| Unrealized and realized gains/(losses) | (41) | 155 | (12) | 78 | |||||||||||||
| Purchases and settlements, net | 40 | 72 | — | 30 | |||||||||||||
| Balance at end of year | 1,290 | 1,291 | 433 | 445 | |||||||||||||
176
OPEB Plans
The following table summarizes the fair value of plan assets for our US funded OPEB plans recorded at each fair value hierarchy level:
Level 11 | Level 22 | Level 33 | Total | ||||||||||||||||||||||||||
| (millions of Canadian dollars) | |||||||||||||||||||||||||||||
| December 31, 2023 | |||||||||||||||||||||||||||||
| Cash and cash equivalents | 3 | — | — | 3 | |||||||||||||||||||||||||
| Equity securities | |||||||||||||||||||||||||||||
| US | — | 36 | — | 36 | |||||||||||||||||||||||||
| Global | — | 62 | — | 62 | |||||||||||||||||||||||||
| Fixed income securities | |||||||||||||||||||||||||||||
| Government | 42 | 3 | — | 45 | |||||||||||||||||||||||||
| Corporate | — | 12 | — | 12 | |||||||||||||||||||||||||
Alternatives4 | — | — | 29 | 29 | |||||||||||||||||||||||||
| Total OPEB plan assets at fair value | 45 | 113 | 29 | 187 | |||||||||||||||||||||||||
| December 31, 2022 | |||||||||||||||||||||||||||||
| Cash and cash equivalents | 2 | — | — | 2 | |||||||||||||||||||||||||
| Equity securities | |||||||||||||||||||||||||||||
| US | — | 34 | — | 34 | |||||||||||||||||||||||||
| Global | — | 62 | — | 62 | |||||||||||||||||||||||||
| Fixed income securities | |||||||||||||||||||||||||||||
| Government | 46 | 5 | — | 51 | |||||||||||||||||||||||||
| Corporate | — | 8 | — | 8 | |||||||||||||||||||||||||
Alternatives4 | — | — | 28 | 28 | |||||||||||||||||||||||||
| Total OPEB plan assets at fair value | 48 | 109 | 28 | 185 | |||||||||||||||||||||||||
1Level 1 assets include assets with quoted prices in active markets for identical assets.
2Level 2 assets include assets with significant observable inputs.
3Level 3 assets include assets with significant unobservable inputs.
4Alternatives includes investments in private debt, private equity, infrastructure and real estate.
Changes in the net fair value of US funded OPEB plan assets classified as Level 3 in the fair value hierarchy were as follows:
| December 31, | 2023 | 2022 | |||||||||||||||
| (millions of Canadian dollars) | |||||||||||||||||
| Balance at beginning of year | 28 | 22 | |||||||||||||||
| Unrealized and realized gains | 1 | 4 | |||||||||||||||
| Purchases and settlements, net | — | 2 | |||||||||||||||
| Balance at end of year | 29 | 28 | |||||||||||||||
177
EXPECTED BENEFIT PAYMENTS
| Year ending December 31, | 2024 | 2025 | 2026 | 2027 | 2028 | 2029-2033 | ||||||||||||||
| (millions of Canadian dollars) | ||||||||||||||||||||
| Pension | ||||||||||||||||||||
| Canada | 207 | 213 | 219 | 224 | 230 | 1,234 | ||||||||||||||
| US | 87 | 87 | 87 | 86 | 81 | 393 | ||||||||||||||
| OPEB | ||||||||||||||||||||
| Canada | 13 | 13 | 13 | 13 | 13 | 70 | ||||||||||||||
| US | 16 | 15 | 14 | 13 | 12 | 49 | ||||||||||||||
EXPECTED EMPLOYER CONTRIBUTIONS
In 2024, we expect to contribute approximately $18 million and $5 million to the Canadian and US pension plans, respectively, and $13 million and $6 million to the Canadian and US OPEB plans, respectively.
RETIREMENT SAVINGS PLANS
In addition to the pension and OPEB plans discussed above, we also have defined contribution employee savings plans available to US employees. Employees may participate in a matching contribution where we match a certain percentage of before-tax employee contributions of up to 6.0% of eligible pay per pay period. For the year ended December 31, 2023, pre-tax employer matching contribution costs were $33 million ($30 million in 2022 and $27 million in 2021).
26. LEASES
LESSEE
We incur operating lease expenses related primarily to real estate, pipelines, storage and equipment. Our operating leases have remaining lease terms of 1 month to 35 years as at December 31, 2023.
For the years ended December 31, 2023, 2022 and 2021, we incurred operating lease expenses of $131 million, $118 million and $95 million, respectively. Operating lease expenses are reported under Operating and administrative expense in the Consolidated Statements of Earnings.
For the years ended December 31, 2023, 2022 and 2021, operating lease payments to settle lease liabilities were $129 million, $123 million and $118 million, respectively. Operating lease payments are reported under Operating activities in the Consolidated Statements of Cash Flows.
178
Supplemental Statements of Financial Position Information
| December 31, 2023 | December 31, 2022 | |||||||
| (millions of Canadian dollars, except lease term and discount rate) | ||||||||
Operating leases1 | ||||||||
Operating lease right-of-use assets, net2 | 669 | 680 | ||||||
Operating lease liabilities - current3 | 98 | 87 | ||||||
Operating lease liabilities - long-term3 | 652 | 677 | ||||||
| Total operating lease liabilities | 750 | 764 | ||||||
| Finance leases | ||||||||
Finance lease right-of-use assets, net4 | 287 | 62 | ||||||
Finance lease liabilities - current5 | 19 | 17 | ||||||
Finance lease liabilities - long-term5 | 264 | 39 | ||||||
| Total finance lease liabilities | 283 | 56 | ||||||
| Weighted average remaining lease term | ||||||||
| Operating leases | 12 years | 12 years | ||||||
| Finance leases | 31 years | 5 years | ||||||
| Weighted average discount rate | ||||||||
| Operating leases | 4.5 | % | 4.2 | % | ||||
| Finance leases | 5.7 | % | 4.4 | % | ||||
1Affiliate ROU assets, current lease liabilities and long-term lease liabilities as at December 31, 2023 were $42 million (December 31, 2022 - $47 million), $5 million (December 31, 2022 - $5 million) and $38 million (December 31, 2022 - $43 million), respectively.
2Operating lease ROU assets are reported under Deferred amounts and other assets in the Consolidated Statements of Financial Position.
3Current operating lease liabilities and long-term operating lease liabilities are reported under Other current liabilities and Other long-term liabilities, respectively, in the Consolidated Statements of Financial Position.
4Finance lease ROU assets are reported under Property, plant and equipment, net in the Consolidated Statements of Financial Position.
5Current finance lease liabilities and long-term finance lease liabilities are reported under Current portion of long-term debt and Long-term debt in the Consolidated Statements of Financial Position.
As at December 31, 2023, our operating and finance lease liabilities are expected to mature as follows:
| Operating leases | Finance leases | |||||||
| (millions of Canadian dollars) | ||||||||
| 2024 | 130 | 31 | ||||||
| 2025 | 120 | 25 | ||||||
| 2026 | 106 | 25 | ||||||
| 2027 | 96 | 18 | ||||||
| 2028 | 75 | 18 | ||||||
| Thereafter | 459 | 502 | ||||||
| Total undiscounted lease payments | 986 | 619 | ||||||
| Less imputed interest | (236) | (336) | ||||||
| Total | 750 | 283 | ||||||
179
LESSOR
We receive revenues from operating leases primarily related to natural gas and crude oil storage and processing facilities, rail cars, and wind power generation assets. Our operating leases have remaining lease terms of 3 month to 28 years as at December 31, 2023.
| Year ended December 31, | 2023 | 2022 | 2021 | ||||||||
| (millions of Canadian dollars) | |||||||||||
| Operating lease income | 241 | 266 | 263 | ||||||||
| Variable lease income | 299 | 321 | 333 | ||||||||
Total lease income1 | 540 | 587 | 596 | ||||||||
1Lease income is recorded under Transportation and other services in the Consolidated Statements of Earnings.
As at December 31, 2023, our future lease payments to be received under operating lease contracts where we are the lessor are as follows:
| Operating leases | |||||
| (millions of Canadian dollars) | |||||
| 2024 | 225 | ||||
| 2025 | 206 | ||||
| 2026 | 201 | ||||
| 2027 | 199 | ||||
| 2028 | 201 | ||||
| Thereafter | 1,612 | ||||
| Future lease payments | 2,644 | ||||
27. OTHER INCOME/(EXPENSE)
| Year ended December 31, | 2023 | 2022 | 2021 | ||||||||
| (millions of Canadian dollars) | |||||||||||
| Gain/(loss) on dispositions | 15 | (12) | 319 | ||||||||
| Realized foreign currency gain/(loss) | (129) | 92 | 126 | ||||||||
| Unrealized foreign currency gain/(loss) | 821 | (1,094) | 160 | ||||||||
| Net defined pension and OPEB credit | 135 | 239 | 150 | ||||||||
| Other | 382 | 186 | 224 | ||||||||
| 1,224 | (589) | 979 | |||||||||
28. CHANGES IN OPERATING ASSETS AND LIABILITIES
| Year ended December 31, | 2023 | 2022 | 2021 | ||||||||
| (millions of Canadian dollars) | |||||||||||
| Trade receivables and unbilled revenues | 1,125 | (572) | (1,030) | ||||||||
| Other current assets | 1,278 | (395) | (198) | ||||||||
| Accounts receivable from affiliates | 18 | 17 | (38) | ||||||||
| Inventory | 763 | (599) | (118) | ||||||||
| Deferred amounts and other assets | 23 | 1 | (195) | ||||||||
| Trade payables and accrued liabilities | (1,542) | 585 | 652 | ||||||||
| Other current liabilities | 339 | 515 | (565) | ||||||||
| Accounts payable to affiliates | (66) | 16 | 52 | ||||||||
| Interest payable | 199 | 58 | 43 | ||||||||
| Other long-term liabilities | 174 | 362 | (69) | ||||||||
| 2,311 | (12) | (1,466) | |||||||||
180
29. RELATED PARTY TRANSACTIONS
Related party transactions are conducted in the normal course of business and, unless otherwise noted, are measured at the exchange amount, which is the amount of consideration established and agreed to by the related parties.
We provide transportation services to several significantly influenced investees which we record as transportation and other services revenue. We also purchase and sell natural gas and crude oil with several of our significantly influenced investees. These revenues and costs are recorded as commodity sales and commodity costs. We contract for firm transportation services to meet our annual natural gas supply requirements which we record as gas distribution costs.
Our transactions with significantly influenced investees are as follows:
| Year ended December 31, | 2023 | 2022 | 2021 | ||||||||
| (millions of Canadian dollars) | |||||||||||
| Transportation and other revenues | 169 | 185 | 237 | ||||||||
| Commodity sales | — | 51 | 20 | ||||||||
Operating and administrative1 | 625 | 503 | 380 | ||||||||
Commodity costs2 | 63 | 778 | 790 | ||||||||
| Gas distribution costs | 140 | 136 | 131 | ||||||||
1During the years ended December 31, 2023, 2022 and 2021, we had Operating and administrative costs from the Seaway Crude Pipeline System of $632 million, $495 million and $389 million, respectively. These costs are a result of an operational contract where we utilize capacity on Seaway Crude Pipeline System assets for use in our Liquids Pipelines business.
2During the years ended December 31, 2023, 2022 and 2021, we had Commodity costs from Aux Sable Canada LP of $2 million, $571 million and $447 million, respectively.
LONG-TERM NOTES RECEIVABLE FROM AFFILIATES
As at December 31, 2023, amounts receivable from affiliates include a series of notes totaling $54 million (2022 - $752 million). This change in balance is primarily due to notes receivable from ERII which, beginning November 2023, eliminated upon consolidation. Refer to the Other Equity Investment Transactionssection of Note 13 - Long-Term Investments for further details on the Offshore Wind Facilities transaction. The remaining loans which require quarterly or semi-annual interest payments at annual interest rates ranging from 4% to 8%. Interest income recognized from these notes totaled $21 million, $30 million and $39 million for the years ended December 31, 2023, 2022 and 2021, respectively. The amounts receivable from affiliates are included in Deferred amounts and other assets in the Consolidated Statements of Financial position.
181
30. COMMITMENTS AND CONTINGENCIES
COMMITMENTS
As at December 31, 2023, we have commitments as detailed below:
| Total | Less than 1 year | 2 years | 3 years | 4 years | 5 years | Thereafter | |||||||||||||||||
| (millions of Canadian dollars) | |||||||||||||||||||||||
Purchase of services, pipe and other materials, including transportation1 | 11,018 | 4,193 | 1,421 | 1,206 | 1,039 | 996 | 2,163 | ||||||||||||||||
Maintenance agreements2 | 473 | 51 | 52 | 52 | 53 | 34 | 231 | ||||||||||||||||
Right-of-ways commitments3 | 1,328 | 44 | 45 | 45 | 45 | 45 | 1,104 | ||||||||||||||||
| Total | 12,819 | 4,288�� | 1,518 | 1,303 | 1,137 | 1,075 | 3,498 | ||||||||||||||||
1Includes capital and operating commitments. Consists primarily of firm capacity payments that provide us with uninterrupted firm access to natural gas and crude oil transportation and storage contracts; contractual obligations to purchase physical quantities of natural gas; and power commitments.
2Consists primarily of maintenance service contracts for our wind and solar assets.
3Our right-of-way obligations primarily consist of non-lease agreements that existed at the time of adopting Topic 842 Leases, at which time we elected a practical expedient that allowed us to continue our historical treatment.
ENVIRONMENTAL
We are subject to various Canadian and US federal, provincial/state and local laws relating to the protection of the environment. These laws and regulations can change from time to time, imposing new obligations on us.
Environmental risk is inherent to liquid hydrocarbon and natural gas pipeline operations, and Enbridge and its affiliates are, at times, subject to environmental remediation obligations at various sites where we operate. We manage this environmental risk through appropriate environmental policies, programs and practices to minimize any impact our operations may have on the environment. To the extent that we are unable to recover payment for environmental liabilities from insurance or other potentially responsible parties, we will be responsible for payment of costs arising from environmental incidents associated with our operating activities.
AUX SABLE
The previously reported claim filed against Aux Sable by a counterparty to an NGL supply agreement was settled and discontinued during the fourth quarter of 2023. A provision was recognized for this claim in the third quarter of 2023.
OTHER LITIGATION
We and our subsidiaries are subject to various other legal and regulatory actions and proceedings which arise in the normal course of business, including interventions in regulatory proceedings and challenges to regulatory approvals and permits. While the final outcome of such actions and proceedings cannot be predicted with certainty, management believes that the resolution of such actions and proceedings will not have a material impact on our consolidated financial position or results of operations.
TAX MATTERS
We and our subsidiaries maintain tax liabilities related to uncertain tax positions. While fully supportable in our view, these tax positions, if challenged by tax authorities, may not be fully sustained on review.
182
INSURANCE
We maintain an insurance program for us, our subsidiaries and certain of our affiliates to mitigate a certain portion of our risks. However, not all potential risks arising from our operations are insurable, or are insured by us as a result of availability, high premiums and for various other reasons. We self-insure a significant portion of certain risks through our wholly-owned captive insurance subsidiaries, which require certain assumptions and management judgments regarding the frequency and severity of claims, claim development and settlement practices and the selection of estimated loss among estimates derived using different methods. Our insurance coverage is also subject to terms and conditions, exclusions and large deductibles or self-insured retentions which may reduce or eliminate coverage in certain circumstances.
Our insurance policies are generally renewed on an annual basis and, depending on factors such as market conditions, the premiums, terms, policy limits and/or deductibles can vary substantially. We can give no assurance that we will be able to maintenance adequate insurance in the future at rates or on other terms we consider commercially reasonable. In such case, we may decide to self-insure additional risks.
In the unlikely event multiple insurable incidents occur which exceed coverage limits within the same insurance period, the total insurance coverage will be allocated among entities on an equitable basis based on an insurance allocation agreement we have entered into with us and other subsidiaries.
31. GUARANTEES
In the normal course of conducting business, we may enter into agreements which indemnify third parties and affiliates. We may also be a party to agreements with subsidiaries, jointly owned entities, unconsolidated entities such as equity method investees, or entities with other ownership arrangements that require us to provide financial and performance guarantees. Financial guarantees include stand-by letters of credit, debt guarantees, surety bonds and indemnifications. To varying degrees, these guarantees involve elements of performance and credit risk, which are not included in our Consolidated Statements of Financial Position. Performance guarantees require us to make payments to a third party if the guaranteed entity does not perform on its contractual obligations, such as debt agreements, purchase or sale agreements, and construction contracts and leases.
We typically enter into these arrangements to facilitate commercial transactions with third parties. Examples include indemnifying counterparties pursuant to sale agreements for assets or businesses in matters such as breaches of representations, warranties or covenants, loss or damages to property, environmental liabilities, and litigation and contingent liabilities. We may indemnify third parties for certain liabilities relating to environmental matters arising from operations prior to the purchase or transfer of certain assets and interests. Similarly, we may indemnify the purchaser of assets for certain tax liabilities incurred while we owned the assets, a misrepresentation related to taxes that result in a loss to the purchaser or other certain tax liabilities related to those assets.
The likelihood of having to perform under these guarantees and indemnifications is largely dependent upon future operations of various subsidiaries, investees and other third parties, or the occurrence of certain future events. We cannot reasonably estimate the total maximum potential amounts that could become payable to third parties and affiliates under such agreements described above; however, historically, we have not made any significant payments under guarantee or indemnification provisions. While these agreements may specify a maximum potential exposure, or a specified duration to the guarantee or indemnification obligation, there are circumstances where the amount and duration are unlimited. As at December 31, 2023, guarantees and indemnifications have not had, and are not reasonably likely to have, a material effect on our financial condition, changes in financial condition, earnings, liquidity, capital expenditures or capital resources.
183
32. QUARTERLY FINANCIAL DATA (UNAUDITED)
| Q1 | Q2 | Q3 | Q4 | Total | |||||||||||||
| (unaudited; millions of Canadian dollars, except per share amounts) | |||||||||||||||||
| 2023 | |||||||||||||||||
| Operating revenues | 12,075 | 10,432 | 9,844 | 11,298 | 43,649 | ||||||||||||
| Operating income | 2,662 | 2,350 | 1,794 | 1,845 | 8,651 | ||||||||||||
| Earnings | 1,866 | 2,001 | 623 | 1,568 | 6,058 | ||||||||||||
| Earnings attributable to controlling interests | 1,817 | 1,935 | 621 | 1,818 | 6,191 | ||||||||||||
| Earnings attributable to common shareholders | 1,733 | 1,848 | 532 | 1,726 | 5,839 | ||||||||||||
| Earnings per common share | |||||||||||||||||
| Basic | 0.86 | 0.91 | 0.26 | 0.81 | 2.84 | ||||||||||||
| Diluted | 0.85 | 0.91 | 0.26 | 0.81 | 2.84 | ||||||||||||
| 2022 | |||||||||||||||||
| Operating revenues | 15,097 | 13,215 | 11,573 | 13,424 | 53,309 | ||||||||||||
| Operating income/(loss) | 2,420 | 1,520 | 1,778 | (540) | 5,178 | ||||||||||||
| Earnings/(loss) | 2,057 | 607 | 1,383 | (1,109) | 2,938 | ||||||||||||
| Earnings/(loss) attributable to controlling interests | 2,029 | 595 | 1,362 | (983) | 3,003 | ||||||||||||
| Earnings/(loss) attributable to common shareholders | 1,927 | 450 | 1,279 | (1,067) | 2,589 | ||||||||||||
| Earnings/(loss) per common share | |||||||||||||||||
| Basic | 0.95 | 0.22 | 0.63 | (0.53) | 1.28 | ||||||||||||
| Diluted | 0.95 | 0.22 | 0.63 | (0.53) | 1.28 | ||||||||||||
33. SUBSEQUENT EVENT
Acquisition of RNG Facilities
On January 2, 2024, through a wholly-owned US subsidiary, we acquired the first six Morrow Renewables operating landfill gas-to-RNG production facilities located in Texas and Arkansas for total consideration of $1.4 billion (US$1.1 billion), of which $0.5 billion (US$0.4 billion) was paid at close and $0.9 billion (US$0.7 billion) is payable within two years (the RNG Facilities Acquisition). The total consideration for all seven facilities is $1.6 billion (US$1.2 billion). The acquired assets align with and advance our low-carbon strategy.
We will account for the RNG Facilities Acquisition using the acquisition method as prescribed by ASC 805 Business Combinations. The acquired assets and assumed liabilities will be recorded at their estimated fair values as at the date of acquisition, with any remaining amount allocated to goodwill. Due to the proximity of the acquisition date to the release date of our annual consolidated financial statements, we have not performed our initial accounting for the RNG Facilities Acquisition. The preliminary purchase price allocation will be disclosed in the first quarter of 2024 after asset and liability valuations become available.
184
ITEM 9. CHANGES IN AND DISAGREEMENTS WITH ACCOUNTANTS ON ACCOUNTING AND FINANCIAL DISCLOSURE
None.
ITEM 9A. CONTROLS AND PROCEDURES
DISCLOSURE CONTROLS AND PROCEDURES
Disclosure controls and procedures are designed to provide reasonable assurance that information required to be disclosed in reports filed with, or submitted to, securities regulatory authorities is recorded, processed, summarized and reported within the time periods specified under Canadian and US securities law. As at December 31, 2023, an evaluation was carried out under the supervision of and with the participation of our management, including the Chief Executive Officer and Chief Financial Officer, of the effectiveness of the design and operations of our disclosure controls and procedures (as defined in Rule 13a-15(e) and 15d-15(e) under the Exchange Act). Based on that evaluation, the Chief Executive Officer and Chief Financial Officer concluded that the design and operation of these disclosure controls and procedures were effective in ensuring that information required to be disclosed by us in reports that we file with or submit to the SEC and the Canadian Securities Administrators is recorded, processed, summarized and reported within the time periods required.
INTERNAL CONTROL OVER FINANCIAL REPORTING
Management’s Annual Report on Internal Control over Financial Reporting
Our management is responsible for establishing and maintaining adequate internal control over financial reporting as such term is defined in the rules of the SEC and the Canadian Securities Administrators. Our internal control over financial reporting is a process designed under the supervision and with the participation of executive and financial officers to provide reasonable assurance regarding the reliability of financial reporting and the preparation of our financial statements for external reporting purposes in accordance with US GAAP.
Our internal control over financial reporting includes policies and procedures that:
•pertain to the maintenance of records that, in reasonable detail, accurately and fairly reflect transactions and dispositions of our assets;
•provide reasonable assurance that transactions are recorded as necessary to permit preparation of financial statements in accordance with US GAAP; and
•provide reasonable assurance regarding prevention or timely detection of unauthorized acquisition, use or disposition of our assets that could have a material effect on the financial statements.
Our internal control over financial reporting may not prevent or detect all misstatements because of inherent limitations. Additionally, projections of any evaluation of effectiveness to future periods are subject to the risk that controls may become inadequate because of changes in conditions or deterioration in the degree of compliance with our policies and procedures.
Our management assessed the effectiveness of our internal control over financial reporting as at December 31, 2023, based on the framework established in Internal Control – Integrated Framework (2013) issued by the Committee of Sponsoring Organizations of the Treadway Commission. Based on this assessment, our management concluded that we maintained effective internal control over financial reporting as at December 31, 2023.
185
The effectiveness of our internal control over financial reporting as at December 31, 2023 has been audited by PricewaterhouseCoopers LLP, Independent Registered Public Accounting Firm appointed by our shareholders. As stated in their Report of Independent Registered Public Accounting Firm which appears in Item 8.Financial Statements and Supplementary Data, they expressed an unqualified opinion on the effectiveness of our internal control over financial reporting as at December 31, 2023.
Changes in Internal Control Over Financial Reporting
During the three months ended December 31, 2023, there has been no material change in our internal control over financial reporting.
ITEM 9B. OTHER INFORMATION
NORMAL COURSE ISSUER BID
On January 4, 2023, the TSX approved our prior NCIB, which commenced on January 6, 2023 and expired on January 5, 2024. Our prior NCIB permitted us to purchase, for cancellation, up to 27,938,163 of the outstanding common shares of Enbridge to an aggregate amount of up to $1.5 billion through the facilities of the TSX, the New York Stock Exchange and other designated exchanges and alternative trading systems.
OFFICERS AND DIRECTORS TRADING ARRANGEMENTS
Certain of our officers and directors have made elections to participate in, and are participating in, our compensation and benefit plans involving Enbridge stock, such as our 401(k) plan and directors’ compensation plan, and may from time to time make elections which may be designed to satisfy the affirmative defense conditions of Rule 10b5-1 under the Exchange Act or may constitute non-Rule 10b5-1 trading arrangements (as defined in Item 408(c) of Regulation S-K).
ITEM 9C. DISCLOSURE REGARDING FOREIGN JURISDICTIONS THAT PREVENT INSPECTIONS
Not applicable.
186
PART III
ITEM 10. DIRECTORS, EXECUTIVE OFFICERS AND CORPORATE GOVERNANCE
Directors of Registrant
The information required by this Item will be disclosed in our Form 10-K/A, which will be filed no later than 120 days after December 31, 2023. This information will also be disclosed in the management information circular that we prepare in accordance with Canadian corporate and securities law requirements.
Executive Officers of Registrant
The information regarding executive officers is included in Part I. Item 1. Business - Executive Officers.
Code of Ethics for Chief Executive Officer and Senior Financial Officers
The information required by this Item will be disclosed in our Form 10-K/A, which will be filed no later than 120 days after December 31, 2023. This information will also be disclosed in the management information circular that we prepare in accordance with Canadian corporate and securities law requirements.
ITEM 11. EXECUTIVE COMPENSATION
The information required by this Item will be disclosed in our Form 10-K/A, which will be filed no later than 120 days after December 31, 2023. This information will also be disclosed in the management information circular that we prepare in accordance with Canadian corporate and securities law requirements.
ITEM 12. SECURITY OWNERSHIP OF CERTAIN BENEFICIAL OWNERS AND MANAGEMENT AND RELATED STOCKHOLDER MATTERS
Name of beneficial owner | Number of Enbridge shares held | Number of Enbridge shares acquirable within 60 days | Total Enbridge shares beneficially owned | Percent of common shares outstanding | ||||||||||||
Pamela L. Carter | 44,639 | - 1 | 44,639 | * | ||||||||||||
Marcel R. Coutu | 46,900 | - | 46,900 | * | ||||||||||||
Susan M. Cunningham | 2,581 | - | 2,581 | * | ||||||||||||
Gregory L. Ebel | 651,845 | 405,408 | 1,057,253 | * | ||||||||||||
J. Herb England | 37,306 | - 1 | 37,306 | * | ||||||||||||
Gregory J. Goff | - | - | - | * | ||||||||||||
V. Maureen Kempston Darkes | 21,735 | - | 21,735 | * | ||||||||||||
Teresa S. Madden | 1,000 | - | 1,000 | * | ||||||||||||
Al Monaco | 920,699 | 2,832,230 | 3,752,929 | * | ||||||||||||
Stephen S. Poloz | - | - | - | |||||||||||||
Dan C. Tutcher | 637,523 | - | 637,523 | * | ||||||||||||
Colin K. Gruending | 59,432 | 489,859 | 549,291 | * | ||||||||||||
Robert R. Rooney | 48,656 | 378,596 | 427,252 | * | ||||||||||||
William T. Yardley | 122,012 | 386,016 | 508,028 | * | ||||||||||||
Vern D. Yu | 164,753 | 718,808 | 883,561 | * | ||||||||||||
John K. Whelen | 204,203 | 887,450 | 1,091,653 | * | ||||||||||||
All current executive officers and directors as a group 2 | 3,083,199 | 6,824,589 | 9,907,788 | * | ||||||||||||
ITEM 13. CERTAIN RELATIONSHIPS AND RELATED TRANSACTIONS, AND DIRECTOR INDEPENDENCE
The information required by this Item will be disclosed in our Form 10-K/A, which will be filed no later than 120 days after December 31, 2023. This information will also be disclosed in the management information circular that we prepare in accordance with Canadian corporate and securities law requirements.
ITEM 14. PRINCIPAL ACCOUNTANT FEES AND SERVICES
The information required by this Item will be disclosed in our Form 10-K/A, which will be filed no later than 120 days after December 31, 2023. This information will also be disclosed in the management information circular that we prepare in accordance with Canadian corporate and securities law requirements.
2020 (C$) | 2019 (C$) | Description of fee category | ||||
Audit fees | 14,764,000 | 16,928,000 | Represents the aggregate fees for audit services. | |||
Audit-related fees | 816,000 | 431,000 | Represents the aggregate fees for assurance and related services by the company’s auditors that are reasonably related to the performance of the audit or review of the company’s financial statements and are not included under “Audit fees”. During fiscal years 2020 and 2019, the services provided in this category include services related to prospectus offerings. | |||
Tax fees | 1,417,000 | 1,993,000 | Represents the aggregate fees for professional services rendered by the company’s auditors for tax compliance, tax advice and tax planning. | |||
All other fees | 366,000 | 320,000 | Represents the aggregate fees for products and services provided by the company’s auditors other than those services reported under “Audit fees”, “Audit-related fees” and “Tax fees”. During fiscal years 2020 and 2019, these fees include those related to French translation work. | |||
Total fees | 17,363,000 | 19,672,000 | ||||
PART IV
ITEM 15. EXHIBITSEXHIBIT AND FINANCIAL STATEMENT SCHEDULES
(a) Consolidated Financial Statements, Supplemental Financial Data and Supplemental Schedules included in Part IV (Item 15)II of this annual report are as follows:
Enbridge Inc.:
Report of Independent Registered Public Accounting Firm (PCAOB ID 271)
Consolidated Statements of Earnings
Consolidated Statements of Comprehensive Income
Consolidated Statements of Changes in Equity
Consolidated Statements of Cash Flows
Consolidated Statements of Financial Position
Notes to the Original FilingConsolidated Financial Statements
All schedules are omitted because they are not required or because the required information is hereby amended solely to addincluded in the following exhibits required to be filed in connection with this Amendment No. 1.
Consolidated Financial Statements or Notes.(b) Exhibits:
Reference is made to the “Index of Exhibits” following Item 16., which is hereby incorporated into this Item.
Form
10-K
SummaryITEM 16. FORM
10-K
SUMMARYNot applicable.
INDEX OF EXHIBITS
Each exhibit identified below is included as a part of this Amendment No. 1.annual report. Exhibits included in this filing are designated by an asterisk (“*”).
; all exhibits not so designated are incorporated by reference to a prior filing as indicated. Exhibits designated with a “+” constitute a management contract or compensatory plan arrangement.Exhibit | Name of Exhibit | ||||||||||
| 3.1 | Articles of Continuance of the Corporation, dated December 15, 1987 (incorporated by reference to Exhibit 2.1(a) to Enbridge’s Registration Statement on Form S-8 filed May 7, 2001) | ||||||||||
| 3.2 | Certificate of Amendment, dated August 2, 1989, to the Articles of the Corporation (incorporated by reference to Exhibit 2.1(b) to Enbridge’s Registration Statement on Form S-8 filed May 7, 2001) | ||||||||||
| 3.3 | Articles of Amendment of the Corporation, dated April 30, 1992 (incorporated by reference to Exhibit 2.1(c) to Enbridge’s Registration Statement on Form S-8 filed May 7, 2001) | ||||||||||
| 3.4 | Articles of Amendment of the Corporation, dated July 2, 1992 (incorporated by reference to Exhibit 2.1(d) to Enbridge’s Registration Statement on Form S-8 filed May 7, 2001) | ||||||||||
| 3.5 | Articles of Amendment of the Corporation, dated August 6, 1992 (incorporated by reference to Exhibit 2.1(e) to Enbridge’s Registration Statement on Form S-8 filed May 7, 2001) | ||||||||||
| 3.6 | Articles of Arrangement of the Corporation dated December 18, 1992, attaching the Arrangement Agreement, dated December 15, 1992 (incorporated by reference to Exhibit 2.1(f) to Enbridge’s Registration Statement on Form S-8 filed May 7, 2001) | ||||||||||
| 3.7 | Certificate of Amendment of the Corporation (notarial certified copy), dated December 18, 1992 (incorporated by reference to Exhibit 2.1(g) to Enbridge’s Registration Statement on Form S-8 filed May 7, 2001) | ||||||||||
| 3.8 | Articles of Amendment of the Corporation, dated May 5, 1994 (incorporated by reference to Exhibit 2.1(h) to Enbridge’s Registration Statement on Form S-8 filed May 7, 2001) | ||||||||||
| 3.9 | Certificate of Amendment, dated October 7, 1998 (incorporated by reference to Exhibit 2.1(i) to Enbridge’s Registration Statement on Form S-8 filed May 7, 2001) | ||||||||||
| 3.10 | Certificate of Amendment, dated November 24, 1998 (incorporated by reference to Exhibit 2.1(j) to Enbridge’s Registration Statement on Form S-8 filed May 7, 2001) | ||||||||||
| 3.11 | Certificate of Amendment, dated April 29, 1999 (incorporated by reference to Exhibit 2.1(k) to Enbridge’s Registration Statement on Form S-8 filed May 7, 2001) | ||||||||||
189
190
191
| * | |||||||||||
| Certain instruments defining the rights of holders of long-term debt securities of the Registrant and its subsidiaries are omitted pursuant to Item 601(b)(4)(iii) of Regulation S-K. The Registrant hereby undertakes to furnish to the SEC, upon request, copies of any such instruments. | |||||||||||
192
| + | |||||||||||
| + | |||||||||||
| + | |||||||||||
| + | |||||||||||
| + | |||||||||||
| + | |||||||||||
| + | |||||||||||
| + | |||||||||||
| + | |||||||||||
| + | |||||||||||
| + | |||||||||||
| + | |||||||||||
| + | |||||||||||
| + | |||||||||||
| + | |||||||||||
193
| + | |||||||||||
| + | |||||||||||
| + | |||||||||||
| + | |||||||||||
| + | |||||||||||
| + | |||||||||||
| + | |||||||||||
| + | |||||||||||
| + | |||||||||||
| + | |||||||||||
| + | |||||||||||
| + | |||||||||||
| + | |||||||||||
| + | |||||||||||
| + | |||||||||||
| + | |||||||||||
194
| + | |||||||||||
| +* | |||||||||||
| + | |||||||||||
| + | |||||||||||
| + | |||||||||||
| + | |||||||||||
| + | |||||||||||
| + | |||||||||||
| + | |||||||||||
| + | |||||||||||
| + | |||||||||||
| + | |||||||||||
| + | |||||||||||
| + | |||||||||||
| + | |||||||||||
195
| + | |||||||||||
| + | |||||||||||
| * | |||||||||||
| * | |||||||||||
| * | |||||||||||
| * | |||||||||||
| * | |||||||||||
| * | |||||||||||
| * | |||||||||||
| 101 | * | Inline XBRL Document Set for the consolidated financial statements and accompanying notes in Part II. Item 8 “Financial Statements and Supplementary Data” of this Annual Report on Form 10-K | |||||||||
| 104 | * | Cover Page Interactive | |||||||||
SIGNATURES
POWER OF ATTORNEY
Each person whose signature appears below appoints Reginald D. Hedgebeth, Patrick R. Murray and Karen K. L. Uehara, and each of Contentsthem, any of whom may act without the joinder of the other, as their true and lawful attorneys-in-fact and agents, with full power of substitution, for him or her and in his or her name, place and stead, in any and all capacities, to sign any and all amendments to this Annual Report of Enbridge on Form 10-K, and to file the same, with all exhibits thereto, and all other documents in connection therewith, with the Securities and Exchange Commission, granting unto said attorneys-in-fact and agents, and each of them, full power and authority to do and perform each and every act and thing requisite and necessary to be done, as fully to all intents and purposes as he or she might or would do in person, hereby ratifying and confirming all that said attorneys-in-fact and agents or any of them or their or his or her substitute and substitutes, may lawfully do or cause to be done by virtue hereof.
Pursuant to the requirements of Section 13 or 15(d) of the Securities Exchange Act of 1934, the registrant has duly caused this report to be signed on its behalf by the undersigned, thereunto duly authorized.
| ENBRIDGE INC. | |||||||||||||||||
| Date: | February 9, 2024 | By: | /s/ Gregory L. Ebel | ||||||||||||||
| President and Chief Executive Officer | |||||||||||||||||
197
Pursuant to the requirements of the Securities Exchange Act of 1934, this report has been signed below on February 9, 2024 by the following persons on behalf of the registrant and in the capacities indicated.
| /s/ Gregory L. Ebel | |||||||||||
| Gregory L. Ebel | Patrick R. Murray | ||||||||||
| President and Chief Executive Officer | Executive Vice President and Chief Financial Officer | ||||||||||
| (Principal Executive Officer) | (Principal Financial Officer) | ||||||||||
| /s/ Melissa M. LaForge | /s/ Pamela L. Carter | ||||||||||
| Melissa M. LaForge | Pamela L. Carter | ||||||||||
| Senior Vice President and Chief Accounting Officer | Chair of the Board of Directors | ||||||||||
| (Principal Accounting Officer) | |||||||||||
| /s/ Mayank (Mike) M. Ashar | /s/ Gaurdie E. Banister | ||||||||||
| Mayank (Mike) M. Ashar | Gaurdie E. Banister | ||||||||||
| Director | Director | ||||||||||
| /s/ Susan M. Cunningham | /s/ Jason B. Few | ||||||||||
| Susan M. Cunningham | Jason B. Few | ||||||||||
| Director | Director | ||||||||||
| /s/ Teresa S. Madden | /s/ Manjit Minhas | ||||||||||
| Teresa S. Madden | Manjit Minhas | ||||||||||
| Director | Director | ||||||||||
| /s/ Stephen S. Poloz | /s/ S. Jane Rowe | ||||||||||
| Stephen S. Poloz | S. Jane Rowe | ||||||||||
| Director | Director | ||||||||||
| /s/ Dan C. Tutcher | /s/ Steven W. Williams | ||||||||||
| Dan C. Tutcher | Steven W. Williams | ||||||||||
| Director | Director | ||||||||||