UNITED STATES
SECURITIES AND EXCHANGE COMMISSION
WASHINGTON, DC 20549
FORM 10-K
____________________
(Mark One)
| x | ANNUAL REPORT PURSUANT TO SECTION 13 OR 15(d) OF THE SECURITIES EXCHANGE ACT OF 1934 | ||||
For the fiscal year ended December 31, 20202023
OR
| o | TRANSITION REPORT PURSUANT TO SECTION 13 OR 15(d) OF THE SECURITIES EXCHANGE ACT OF 1934 | ||||
For the transition period fromto
_________________ to _______________________
Commission File Number:
001-39544
____________________
Bakkt Holdings, Inc.
(Exact Name of Registrant as Specified in Itsits Charter)
____________________
| Delaware | 98-1550750 | |||||
(State or incorporation or | (I.R.S. Employer Identification No.) | |||||
10000 Avalon Boulevard, Suite 1000 Alpharetta, Georgia | 30009 | |||||
(Address of | (Zip Code) | |||||
Registrant’s telephone number, including area code: (678)
534-5849
Securities registered pursuant to Section 12(b) of the Act:
Title of each class | Trading Symbol(s) | Name of each exchange on which registered | |||||||||
Class A Common Stock, par value $0.0001 per share | BKKT | ||||||||||
Warrants to purchase Class A Common Stock | BKKT WS | ||||||||||
Securities registered pursuant to Section 12(g) of the Act:
Indicate by check mark if the registrant is a well-known seasoned issuer, as defined in Rule 405 of the Securities Act.Yes ☐ oNo ☒
xIndicate by check mark if the registrant is not required to file reports pursuant to Section 13 or Section 15(d) of the Act.Yes ☐ oNo ☒
xIndicate by check mark whether the registrant (1) has filed all reports required to be filed by Section 13 or 15(d) of the Securities Exchange Act of 1934 during the preceding 12 months (or for such shorter period that the registrant was required to file such reports), and (2) has been subject to such filing requirements for the past 90 days.Yes ☒ xNo ☐
oIndicate by check mark whether the registrant has submitted electronically every Interactive Data File required to be submitted pursuant to Rule 405 of Regulation(Section (§ 232.405 of this chapter) during the preceding 12 months (or for such shorter period that the registrant was required to submit such files).Yes ☒ xNo ☐o
S-T
Indicate by check mark whether the registrant is a large accelerated filer, an accelerated filer, afiler”filer,” “smaller reporting company”company,” and “emerging growth company” in Rule 12b-2 of the Exchange Act.
non-accelerated
filer, a smaller reporting company, or an emerging growth company. See the definitions of “large accelerated filer,” “accelerated | Large accelerated filer | o | Accelerated filer | o | ||||||||
| Non-accelerated filer | x | Smaller reporting company | x | ||||||||
| Emerging growth company | x | ||||||||||
If an emerging growth company, indicate by check mark if the registrant has elected not to use the extended transition period for complying with any new or revised financial accounting standards provided pursuant to Section 13(a) of the Exchange Act. (Check one):o
Indicate by check mark whether the registrant has filed a report on and attestation to its management’s assessment of the effectiveness of its internal control over financial reporting under Section 404(b) of the Sarbanes-Oxley Act (15 U.S.C. 7262(b)) by the registered public accounting firm that prepared or issued its audit report. ☐o
If an emerging growth company,securities are registered pursuant to Section 12(b) of the Act, indicate by check mark ifwhether the Registrant has elected notfinancial statements of the registrant included in the filing reflect the correction of an error to usepreviously issued financial statements. ☐
Indicate by check mark whether any of those error corrections are restatements that required a recovery analysis of incentive-based compensation received by any of the extended transitionregistrant's executive officers during the relevant recovery period for complying with any new or revised financial accounting standards provided pursuant to Section 13(a) of the Exchange Act.§240.10D-1(b). ☐
Indicate by check mark whether the registrant is a shell company (as defined in Rule Exchange Act). Yes ☒ oNo ☐x
12b-2
of theAs of March 18, 2024, there were 141,798,069 shares of the closing price for theregistrant’s Class A ordinary shares on such date, as reported on the Nasdaq, was $223,907,781.60.
Documents Incorporated by Reference
Portions of the registrant’s Proxy Statement relating to the 2024 Annual Meeting of Stockholders are incorporated by reference into Part III of this Annual Report on Form 10-K. The Proxy Statement will be filed with the Securities and Exchange Commission within 120 days after the end of the registrant’s fiscal year ended December 31, 2023.
-1-
TABLE OF CONTENTS
| Page | ||||||||||||
1B. | ||||||||||||
| Unresolved Staff Comments | ||||||||||||
| Item 1C. | Cybersecurity | |||||||||||
7. | ||||||||||||
| Management’s Discussion and Analysis of Financial Condition and Results of Operations | ||||||||||||
CAUTIONARY NOTE REGARDING FORWARD-LOOKING STATEMENTS
10-K
may include, for example, statements about:•our future financial performance;
•the expected benefits we will realize from our acquisition of Apex Crypto LLC, which we have since renamed Bakkt Crypto Solutions, LLC (“Bakkt Crypto”);
•us closing the useremaining portion of proceeds not held in the trust account or available to us from interest incomeour February 2024 financings on the trust account balance;
•expansion plans and opportunities, including our plans to expand to international markets.
You should not place undue reliance on these forward-looking statements. Should one or more of a number of known and unknown risks and uncertainties materialize, or should any of our assumptions prove incorrect, our actual results or performance may be materially different from those expressed or implied by these forward-looking statements. Some factors that could cause actual results to differ include, but are not limited to:
•our ability to grow and manage growth profitably;
•our ability to continue as a going concern;
•changes in our business strategy;
•changes in the market in which we compete, including with respect to our competitive landscape, technology evolution or changes in applicable laws or regulations;
•our inability to maintain the listing of our securities laws.on the New York Stock Exchange (the “NYSE”);
•changes in the markets that we target;
•disruptions in the crypto market that subject us to additional risks, including the risk that banks may not provide banking services to us;
•the possibility that we may be adversely affected by other economic, business, and/or competitive factors;
-3-
•the inability to launch new services and products or to profitably expand into new markets and services, or the inability to continue offering existing services or products;
•our ability to achieve the expected benefits from the acquisition of Bakkt Crypto;
•our failure to comply with extensive government regulation, oversight, licensure and appraisals;
•uncertain regulatory regime governing blockchain technologies and crypto;
•the inability to develop and maintain effective internal controls and procedures;
•the exposure to any liability, protracted and costly litigation or reputational damage relating to our data security;
•the impact of any goodwill or other intangible assets impairments on our operating results;
•the impact of any pandemics or other public health emergencies; and
•other risks and uncertainties indicated in this Annual Report on Form 10-K, including those set forth under “Risk Factors.”
-4-
PART I
Item 1. Business.Business
Overview
In this section and elsewhere in this Annual Report on Form 10-K, we use the following terms, which are defined as follows:
•“Client” means businesses with whom we contract to provide services to customers on our platform, and includes financial institutions, hedge funds, merchants, retailers, third party partners, and other businesses (except in the accompanying notes to the consolidated financial statements, where we refer to revenue earned from customers, instead of clients. The term customers is in accordance with the Financial Accounting Standards Board (“FASB”) Accounting Standards Codification (“ASC”) Topic 606, Revenue from Contracts with Customers.).
•“Crypto” or “Crypto asset” means an asset that is built using blockchain technology, including virtual currencies (as used in the State of New York), coins, cryptocurrencies, stablecoins, and other tokens. Our platform enables transactions in certain supported crypto assets. For purposes of this Form 10-K, we use crypto assets, virtual currency, coins, and tokens interchangeably.
•“Customer” means an individual user of our platform. Customers include customers of our loyalty clients who use our platform to transact in loyalty points, as well as customers of our clients who transact in crypto through, and have accounts on, our platform (except as defined for ASC 606 purposes above).
•“Loyalty points” means loyalty and/or reward points that are issued by clients to their customers.
Founded in 2018, Bakkt builds technology that enables our clients to deliver new opportunities to their customers through Software as a Service (“SaaS”) and Application Programming interface (“API”) solutions that unlock crypto and drive loyalty, powering engagement and performance. The global market for crypto, while nascent, is rapidly evolving and expanding. We believe we are well-positioned to provide innovative, multi-faceted product solutions and grow with this evolving market. Our platform is well positioned to power commerce by enabling businesses, institutions, and consumers, to better manage, transact with and monetize crypto.
Our platform is built to operate across various crypto assets and offers clients the flexibility to choose some or all of our capabilities, and the manner in which these capabilities are enabled for consumers, based on their needs and objectives. Some clients may choose to enable our capabilities directly in their experience, while others may want a “ready-to-go” storefront and leverage capabilities such as our web-based technology. Our institutional-grade platform, born out of our former parent company, Intercontinental Exchange, Inc. (“ICE”), supports “know your customer” (“KYC”) and anti-money laundering (“AML”) capabilities, and other anti-fraud measures to combat financial crime.
Our Corporate Structure
We operate primarily through the following entities:
Bakkt Marketplace: Bakkt Marketplace, LLC (“Bakkt Marketplace”) and Bakkt Crypto Solutions, LLC (“Bakkt Crypto”) - through these entities we operate integrated platforms that provide customers with the ability to buy, sell and store crypto in a simple, intuitive digital experience accessed via APIs or embedded web experience. Bakkt Marketplace holds a New York State virtual currency license (commonly referred to as a “BitLicense”), and money transmitter licenses from all states throughout the United States (“U.S.”) where such licenses are required for the operation of its business, and is registered as a money services business with the Financial Crimes Enforcement Network of the U.S. Department of the Treasury. Bakkt Crypto similarly holds a BitLicense and money transmitter licenses in various states, where its business requires. Currently, all of the outstanding equity interests of Bakkt Crypto are held by Bakkt Marketplace. The Bakkt Crypto and Bakkt Marketplace platforms generally are operated separately, though Bakkt Marketplace provides fiat funding services to Bakkt Crypto in instances where a client does not have that capability. The Bakkt Marketplace platform
was originally conceived and built in connection with a consumer app that enabled crypto asset transactions, and, at the time, represented a direct-to-consumer business model, which is no longer being pursued by the Company. In contrast, the Bakkt Crypto platform was originally conceived and built as an embedded crypto trading platform that would be integrated into client environments to service customers in those environments. In March of 2024, we obtained approval to merge Bakkt Crypto with and into Bakkt Marketplace, with the surviving entity of the merger to be renamed Bakkt Crypto Solutions, LLC. The two platforms will be combined into one business, which will be operated by the surviving entity. Similar to the Bakkt Crypto business model, the combined business will focus on a client-led, or “business-to-business-to-consumer” (“B2B2C”), strategy in which crypto asset solutions can be embedded into client environments.
Bakkt Crypto: In April 2023, we acquired Apex Crypto LLC (“Apex Crypto”), a platform for integrated crypto trading, which we renamed Bakkt Crypto. This platform supports clients with a range of crypto solutions. We are leveraging Bakkt Crypto’s proprietary trading platform and existing relationships with liquidity providers to provide a wider range of crypto assets and competitive pricing to our customers. Bakkt Crypto complements our B2B2C growth strategy by broadening our business partnerships to broker-dealers, registered investment advisors, fintechs and neo-banks. Specifically, Bakkt Crypto offers customers the ability to purchase, sell, store and, in approved jurisdictions, deposit and withdraw approved crypto assets, all from within the applications of our clients with whom customers already have a relationship. Using Bakkt Crypto’s platform, customers can purchase approved crypto assets, store crypto assets in custodial wallets, liquidate their holdings, and transfer supported crypto assets between a custodial wallet maintained by Bakkt Crypto and external wallets in certain jurisdictions, if enabled by the client.
As part of our acquisition of Bakkt Crypto, we also acquired its agreements with more than 30 third-party partners pursuant to which the partners made Bakkt Crypto’s crypto asset trading service available to their customer base. The agreements with these third-party fintech partners (referred to as clients) provide for licensing of their front-end trading platforms by Bakkt Crypto and cooperation between the parties in facilitating customers’ transactions in crypto assets. The agreements are for a term of either one or two years and can be terminated by either party for breach or in case of a change of control. In most cases, the agreements also contain provisions giving Bakkt Crypto discretion in the choice of crypto assets offered to each client through its platform and, in some cases, exclusivity covenants pursuant to which clients have agreed not to refer their customers to other crypto asset trading platforms.
Bakkt Crypto is regularly exploring additional ways to innovate and provide additional products and services to its clients. Bakkt Crypto is in the process of developing, subject to applicable regulatory approvals, a solution to facilitate international remittances where users can remit fiat currency, with Bakkt leveraging crypto rails to settle the transaction, and conversion of certain loyalty and rewards points into supported crypto assets. We are actively pursuing opportunities to provide crypto asset trading services in jurisdictions outside of the United States, including the United Kingdom, Hong Kong, Spain and throughout Latin America, subject to applicable local regulatory approvals. Bakkt Crypto is currently live with customers in Europe, Latin America and Asia. Bakkt Crypto executes a de minimis amount of trades for entity accounts in jurisdictions other than the State of New York. Subject to applicable regulatory approvals, Bakkt Crypto intends to expand the provision of trading services for institutional clients.
Bakkt Trust: Bakkt Trust Company LLC (“Bakkt Trust”) is a blank checkNew York limited-purpose trust company incorporatedthat is chartered by and subject to the supervision and oversight of New York Department of Financial Services (“NYDFS”) and governed by an independent Board of Managers. Bakkt Trust provides our institutional-grade qualified custody solution, which caters to more experienced market participants and also supports our consumer-facing crypto business. Bakkt Trust’s custody solution also provides support to Bakkt Marketplace with respect to all crypto assets supported by the Company. See “—Crypto Assets and Services Offered by Bakkt.”
Bakkt Brokerage: We acquired Bumped Financial, LLC (which we have since renamed Bakkt Brokerage, LLC, “Bakkt Brokerage”), a registered broker-dealer, in February 2023. Bakkt Brokerage is not engaged in any business activities at this time and we have no current plans for it to engage in future business activities.
-6-
Bakkt Loyalty Solutions: We operate our Loyalty Solutions business primarily in the United States and in Canada under the legal entities Bridge2 Solutions, LLC, Bridge2 Solutions Canada Ltd and Aspire Loyalty Travel Solutions, LLC. This business enables clients (including financial institutions, airlines and other loyalty sponsors) to enable their customers - who hold their loyalty points - to redeem those points for items including travel and merchandise. To that end, our Loyalty Solutions business enables point redemption and fulfillment (including travel reservations).
Crypto Market Developments
Over approximately the last eighteen months, the crypto markets were impacted by, among other developments, significant decreases and volatility in crypto asset prices, a loss of confidence in many participants in the crypto asset ecosystem, regulatory actions and adverse publicity around specific companies, the crypto industry and crypto assets more broadly, including as a Cayman Islands exempted companyresult of continued industry-wide consequences from the Chapter 11 bankruptcy filings of crypto asset exchange FTX, crypto hedge fund Three Arrows, crypto miners Compute North and Core Scientific, and crypto lenders Celsius Network, Voyager Digital and BlockFi. In addition, the liquidity of the crypto asset markets has been adversely impacted by these bankruptcy filings as, among other things, certain entities affiliated with FTX and other former participants had engaged in significant trading activity. Although we did not have any exposure to these companies, and we do not have material assets that may not be recovered or may otherwise be lost or misappropriated due to the bankruptcies, we were nonetheless impacted by, and continue to be impacted by, the broader conditions in the crypto markets.
The crypto markets also have been and continue to be impacted by the broader macroeconomic conditions, including the strength of the overall macroeconomic environment, high and rising interest rates, spikes in inflation rates, general market volatility, and geopolitical concerns. We expect the macroeconomic environment and the state of the crypto markets to remain dynamic in the near-term.
In addition, crypto assets and crypto market participants have recently faced increased scrutiny by regulators. For example, in 2023, the SEC has brought charges against a number of crypto asset exchanges, including Bittrex, Coinbase, Binance, Kraken, and other crypto asset service providers, identifying a number of crypto assets as securities and alleging violations of, and non-compliance with, U.S. federal securities laws. We continue to monitor regulatory developments in this area and assess our business model and the assets we support in light of such developments. For more information see “—Regulation—Regulation of Our Virtual Currency Business,” below.
Crypto Assets and Services Offered by Bakkt
Retail Customers
We currently provide, or intend to provide, the following crypto-related services for retail customers. These services are provided through our clients which have a direct relationship with such customers and utilize our trading platform and custody services.
•crypto asset trading;
•custody services for the crypto assets supported for trading;
•external transfers of crypto assets (through Bakkt Crypto); and
•crypto rewards (expected to become available in the first half of 2024).
Our management regularly considers whether to make any potential additional crypto assets available on July 31, 2020.our platform, consistent with our policies and procedures. See “—Policies and Procedures—Listing-Related Policies.”
Bakkt Crypto, Bakkt Marketplace and Bakkt Trust facilitate transactions in, and provide services for, the crypto assets listed in the tables below.
Bakkt Marketplace / Bakkt Crypto
-7-
| Supported For | ||||||||||||||||||||||||||
| Crypto Asset | Symbol | Trading | Transfers | Rewards | ||||||||||||||||||||||
| Bitcoin | BTC | Yes | Yes* | No, planned first half 2024 | ||||||||||||||||||||||
| Bitcoin Cash | BCH | Yes | Yes* | No | ||||||||||||||||||||||
| Dogecoin | DOGE | Yes* | Yes* | No | ||||||||||||||||||||||
| Ethereum | ETH | Yes | Yes* | No | ||||||||||||||||||||||
| Ethereum Classic | ETC | Yes* | Yes* | No | ||||||||||||||||||||||
| Litecoin | LTC | Yes | Yes* | No | ||||||||||||||||||||||
| Shiba Inu | SHIB | Yes* | Yes* | No | ||||||||||||||||||||||
| USD Coin | USDC | Yes* | Yes* | No | ||||||||||||||||||||||
* Except for the State of New York
Bakkt Trust
| Supported for | ||||||||||||||||||||
| Crypto Asset | Symbol | Custody | Transfers | |||||||||||||||||
| Bitcoin | BTC | Yes | Yes | |||||||||||||||||
| Bitcoin Cash | BCH | Yes | Yes | |||||||||||||||||
| Dogecoin | DOGE | Yes | Yes | |||||||||||||||||
| Ethereum | ETH | Yes | Yes | |||||||||||||||||
| Ethereum Classic | ETC | Yes | Yes | |||||||||||||||||
| Litecoin | LTC | Yes | Yes | |||||||||||||||||
| Shiba Inu | SHIB | Yes | Yes | |||||||||||||||||
| USD Coin | USDC | Yes | Yes | |||||||||||||||||
Our management regularly considers whether to make any potential additional crypto assets available on our platform, consistent with our policies and procedures. See “-Policies and Procedures - Listing-Related Policies.”
Following the acquisition of Bakkt Crypto, and as further detailed in the table below, we delisted 37 of the 45 crypto assets that had historically been available for trading on the Bakkt Crypto platform. We first requested the delisting of certain crypto assets from the Bakkt Crypto platform in connection with our due diligence review of the Bakkt Crypto business in 2022. Following the closing of our acquisition of Bakkt Crypto on April 1, 2023, and in light of regulatory developments, we undertook an updated review of all crypto assets then available on the Bakkt Crypto platform and determined that it was appropriate to delist certain additional assets. This review took into account a number of factors, including: (i) scores assigned to each crypto asset based on a rating framework that weighs various factors drawn from SEC and judicial sources; (ii) whether the crypto asset was sold in an initial coin offering; (iii) whether the crypto asset was backed by a single entity; and (iv) whether the crypto asset used “proof of stake” validation. Our review also accounted for the potential impacts of delisting on our clients and customers. We have also directed the delisting of certain crypto assets in response to charges recently filed by the SEC against crypto asset exchanges alleging that those crypto assets are securities. We believe that these delistings will not have a material impact on our business and results of operations in future periods. While the delisted crypto assets represented approximately 15% of gross profit of Bakkt Crypto at the time of its acquisition by the Company, many of these crypto assets constitute what is referred to in the fintech industry as “meme coins.” Historically, many meme coins have been subject to anecdotal spikes in trading activity that may not repeat for a protracted period of time if at all. In implementing our coin delisting decisions, we have attempted to mitigate impacts on our business and our clients and customers by affording customers a period in which to exit their positions in the impacted crypto assets as part of an orderly wind-down. We expect our listing and delisting decisions to continue to evolve based on relevant regulatory and judicial precedent.
-8-
| Crypto Asset (Symbol) | Date of Delisting | |||||||
| AMP | December 6, 2022 | |||||||
| CRO; DASH; ONE; LUNA; LUNC; ZEC | February 15, 2023 | |||||||
| ALGO; MANA | April 21, 2023 | |||||||
| COMP; GALA; YFI; LRC; ICP; BAT; LINK; APE; MKR; REN; BNT; SNX; ATOM; GRT; AAVE; FIL; XTZ; AVAX; UNI; XLM; CHZ; SUSHI; CRV; ENJ; FTM; SOL; ADA; MATIC | September 19, 2023 | |||||||
Crypto Asset Trading
We have agreements with clients that entitle us to receive recurring subscription revenues in the form of platform fees from clients for the use of our platforms by their customers.
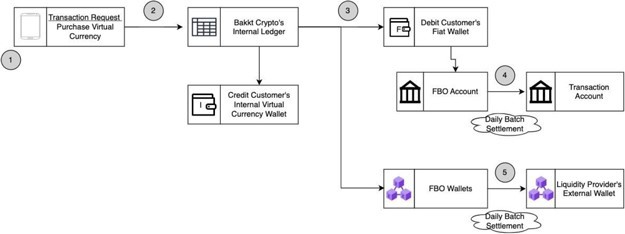
Customers may purchase approved crypto assets directly through Bakkt Crypto utilizing one of four funding sources:
•the customer’s fiat wallet (see Fig. 1 below);
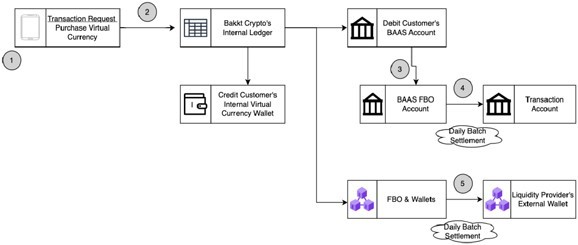
•the customer’s Banking as a Service (“BaaS”) provider account (see Fig. 2 below);
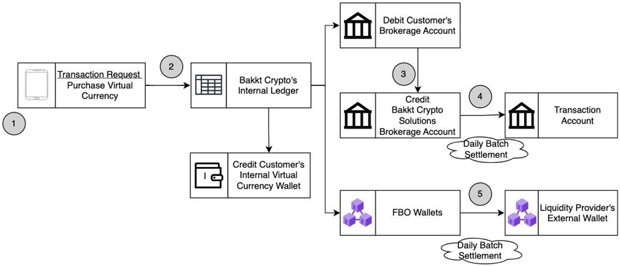
•the customer’s brokerage account (see Fig. 3 below); or
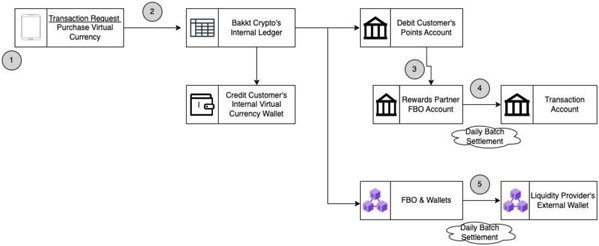
•the customer’s points/rewards account with a participating loyalty client (see Fig. 4 below; expected to become available in the first half of 2024).
Customers may sell crypto assets through Bakkt Crypto. The sale proceeds from a sale can be directed to one of three potential customer accounts:
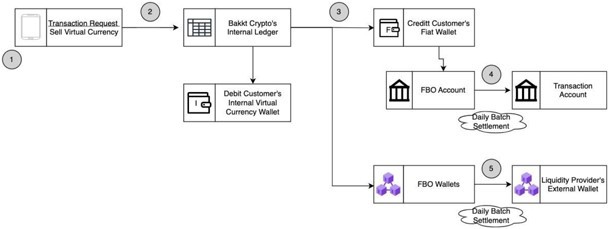
•the customer’s fiat wallet (see Fig. 5 below);
•the customer’s BaaS account (see Fig. 6 below); or
•the customer’s brokerage account (see Fig. 7 below).
The funding source is specific to the client relationship through which the customer account was opened and is not specified by the individual customer account holder. For example, if a customer opens an account with a client where trades are funded via a BaaS relationship, all sale and purchase transaction-related funds will flow through the customer’s BaaS account. Customers submit all purchase and sale orders through the user interface of the client with which they have opened an account.
With respect to customer purchase and sale orders, Bakkt Crypto operates as a riskless principal and offsets each customer order it fills by routing a corresponding order to a liquidity provider on a one-to-one basis. Bakkt Crypto settles its transactions with liquidity providers on a net basis. For more information, see “—Crypto Assets and Services Offered by Bakkt–Crypto Asset Trading–Liquidity Providers” below.
Customers can submit an order request to purchase crypto assets by specifying the dollar value or coin quantity that they wish to purchase. The client’s user interface displays the estimated price or quantity, as applicable, as well as any transaction fees.
Before sending a purchase order request, the client must verify that sufficient funds are available in the applicable customer funding source. If the customer account has sufficient funds, the client then sends the order to Bakkt Crypto. Upon receipt of the purchase order, Bakkt Crypto accepts and processes the purchase order and records any order fill transactions on Bakkt Crypto’s internal ledger. Bakkt Crypto recognizes the revenue from markup and/or trade fees at this time in the flow using explicit journal types in the transaction ledgering.
-9-
If the customer’s funding source is a fiat wallet, Bakkt Marketplace will debit the customer’s fiat wallet on its internal ledger. During the daily net settlement period fiat funds are transmitted from the for benefit of (“FBO”) account to the Bakkt Crypto transaction account.
Fig. 1 Crypto Assets Purchase Through A Fiat Wallet
If the customer’s funding source is a BaaS account, Bakkt Crypto sends a message to the client that a trade has been executed. The client then instructs the BaaS provider to transfer the funds from the customer’s BaaS account to its BaaS FBO account. The BaaS provider will debit the customer’s fiat wallet on its internal ledger. During the daily batch settlement period, fiat funds are transmitted from the BaaS FBO account to the Bakkt Crypto transaction account.
A BaaS account is one where a client, through its banking relationships, offers customers the ability to withdraw fiat currency from, or transfer or deposit fiat currency into, the customer’s BaaS account with that client. In those instances, those customers would utilize their BaaS account to purchase supported crypto assets from Bakkt Crypto, as depicted in Figure 2, below, and to deposit the proceeds of sales of supported crypto assets to Bakkt Crypto, as depicted in Figure 6, below. Our client, not the Company, was incorporatedmaintains the relationship with the BaaS provider and the Company is not itself regulated as a bank.
Fig. 2 Crypto Assets Purchase Through A Customer’s BaaS Account
If the customer’s funding source is a brokerage account, Bakkt Crypto sends a message to ledger the funds from the customer’s brokerage account at the brokerage’s clearing firm to Bakkt Crypto brokerage account at the brokerage’s
-10-
clearing firm. During the daily batch settlement period, fiat funds are transmitted from the Bakkt Crypto brokerage account to the Bakkt Crypto transaction account.
Fig. 3 Crypto Assets Purchase Through A Customer’s Brokerage Account
If the customer’s funding source is a points account at a points/rewards client, Bakkt Crypto will debit the customer’s points account. During the daily batch settlement, funds are transferred from the rewards client account to the Bakkt Crypto transaction account.
Fig. 4 Crypto Assets Purchase Through A Customer’s Points/Rewards Account
For sales, customers submit an order request via the client with which they have a relationship to Bakkt Crypto to sell crypto assets by specifying the dollar value or quantity that they wish to sell. For market orders, the client displays the estimated price or estimated quantity, which is inclusive of any markup. If the client is charging any trade fees, those will be displayed and included in the total trade value. Once confirmed by the customer, the order is then sent to Bakkt Crypto by the client. Upon receipt of the order, Bakkt Crypto accepts and processes the sale order and records the order fill transaction on Bakkt Crypto’s internal ledger by recording a debit to the customer’s crypto asset account.
If the customer’s funding source is a fiat wallet, Bakkt Marketplace will credit the customer’s fiat wallet on its internal ledger. During the daily batch settlement period, fiat funds are transmitted from the Bakkt Crypto transaction account to the FBO account.
-11-
Fig. 5 Crypto Assets Sale with proceeds to the Customer’s Fiat Wallet Hosted by Bakkt Crypto
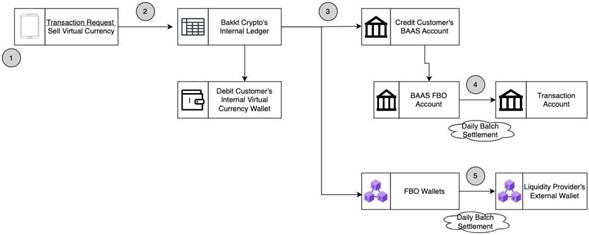
If the customer’s funding source is a BaaS account, Bakkt Crypto sends a message to the client that a trade has been executed. The client then instructs the BaaS provider to transfer the funds from its BaaS FBO account to the customer’s BaaS account. The BaaS will credit the customer’s fiat wallet on its internal ledger. During the daily batch settlement period, fiat funds are transmitted from the Bakkt Crypto transaction account to the BaaS FBO account.
Fig. 6 Crypto Assets Sale with Proceeds to the Customer’s BaaS Account
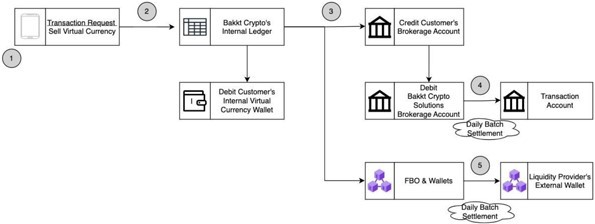
If the customer’s funding source is a brokerage account, Bakkt Crypto sends a message to ledger the funds from the Bakkt Crypto brokerage account at the brokerage’s clearing firm to the customer’s brokerage account at the brokerage’s clearing firm. During the daily batch settlement period, fiat funds are transmitted from the Bakkt Crypto transaction account to the Bakkt Crypto brokerage account.
-12-
Fig. 7 Crypto Assets Sale with Proceeds to the Customer’s Brokerage Account
Liquidity Providers
Bakkt Crypto currently has relationships with seven liquidity providers, with at least three providers servicing each supported crypto asset in order to provide consistent liquidity. Bakkt Crypto utilizes a proprietary, internal system to aggregate quotes from its liquidity providers by asset, side, price and size, which Bakkt Crypto uses to determine what quotes to provide, as principal, to its clients for display to customers.
To fill customer orders as a riskless principal, the Bakkt Crypto platform compares customer orders to the aggregated best bid or offer prices quoted by Bakkt Crypto’s liquidity providers. If a customer order is marketable, Bakkt Crypto routes an offsetting order for its own account, on a one-to-one basis, to the liquidity provider quoting the best price. Customers may place market orders or limit orders on the Bakkt Crypto platform. Market orders are, by definition, marketable when they are placed. As such, when a customer market order is received, Bakkt Crypto will offset that order by routing an order for its own account to the relevant liquidity provider on an “immediate or cancel” basis. Limit orders may be marketable when they are placed or may become marketable when the aggregated market price, as determined by Bakkt Crypto’s proprietary internal system, aligns with the limit price selected by the customer. The Bakkt Crypto platform holds customer limit orders that are not marketable at the time they are placed on Bakkt Crypto’s internal order book and evaluates such orders for marketability on an ongoing basis as liquidity providers change their best bid or offer prices. Should a customer limit order become marketable as the aggregated best price changes, the Bakkt Crypto platform would, at that point, place an offsetting order for its own account with a liquidity provider.
Upon receipt of a fill confirmation from the liquidity provider servicing one of Bakkt Crypto’s offsetting orders, Bakkt Crypto will fill the corresponding customer transaction out of its own account, as riskless principal. In other words, the Bakkt Crypto platform is structured to execute the offsetting order for Bakkt Crypto’s own account prior to executing the corresponding customer order.
Bakkt Crypto has written agreements with all of its liquidity providers. Under these agreements, Bakkt Crypto is granted access to proprietary trading platforms of the liquidity providers for the purpose of effectingplacing orders for purchase or sale of crypto assets. Bakkt Crypto acts as principal in such transactions with liquidity providers. Orders cannot be withdrawn, cancelled or amended. After the liquidity provider accepts the order, it issues a merger, share exchange, asset acquisition, share purchase, reorganization or similar business combination with one or more businesses or entities (a “Business Combination”).
transaction confirmation. The Company’s sponsor is affiliated with Victory Park Capital Advisors, LLC (“VPC”), a registered investment advisor withparties then are obligated to deliver fiat currency and crypto assets according to the SEC founded in 2007. VPC’s institutional investor base is diversified geographically and includes sovereign wealth funds, insurance companies, financial institutions, foundations, endowments and family offices for which it has invested approximately $6.0 billion in over 115 transactions across North America, Europe, Latin America, Africa, Southeast Asia and Oceania. As part of those investments, VPC has provided financing to financial technology or financial services (collectively “Fintech”) businesses backed by someterms of the world’s leading venture capital firmstransaction. The agreements contain customary representations and haswarranties and confidentiality, limitation of liability and indemnification provisions. The agreements do not have a long track recordset term and generally may be cancelled by either party for convenience on prior written notice of executing debt and equity financing30 to 60 days, with some agreements providing for no such notice obligations or a notice obligation of seven days.
-13-
Settlement is conducted on a net basis on the blockchain supporting the crypto asset. Bakkt Crypto is not required to pre-fund any transactions with someliquidity providers. Instead, Bakkt Crypto settles with liquidity providers on a daily basis; however, in instances where a liquidity provider’s settlement balance is less than $30,000 for a given token, or $50,000 across all tokens, Bakkt Crypto will settle with those liquidity providers on the last business day of the largest global Fintech companies, including with Square (U.S. NYSE:SQ), iZettle (Sweden, acquired by PayPalapplicable month, or when the settlement balance exceeds those levels, if sooner. At settlement, fiat currency and crypto assets are exchanged to settle trading obligations from the previous period. In periods of heavy trading volumes, Bakkt Crypto and the liquidity providers may agree to perform more frequent settlements in 2018), Zip Co (Australia ASX:Z1P), Funding Circle (UK LSE:FCH), Kabbage (US), Dave (US), Avant (US), Fundbox (US), Konfio (Mexico), and WeFox (Germany). VPC’s investments have enabled portfolio companiesorder to scale quickly and capture leading market positions. These representative transactions demonstrate VPC’s ability to identify early-stage Fintech companies with strong long-term growth prospects. VPC’s Fintech investment history and robust networkdecrease the exposure of industry relationships furnishunsettled transactions.
Custody Services for the firm with a detailed understanding of the long-term capital needs of the highest growth Fintech businesses globally.Crypto Assets Supported for Trading
Prior to the Public Offering,acquisition of Bakkt Crypto, we did not use third party custodians, other than minimal amounts at liquidity providers that also provide custody for the purpose of facilitating trading and settlement. In connection with our acquisition of Bakkt Crypto, we acquired third-party custodial relationships with Coinbase Custody Trust Company (“Coinbase Custody”) and BitGo Trust Company (“BitGo”), which are currently used by Bakkt Crypto for custody and crypto asset transfers, where applicable. In addition, Bakkt Crypto also self-custodies select crypto assets (less than 8% of total customer crypto assets were self-custodied as of December 31, 2023) to facilitate customer withdrawals utilizing the Fireblocks Vault service. Self-custodying customer crypto assets through the use of Fireblocks third-party custody software involves risks related to our reliance on August 3, 2020, the Sponsor paid $25,000, or approximately $0.004 per share,third party for certain services. These include the implementation of Secure Multi-Party Computation (MPC) key creation software, the provision of software that facilitates a Secure Transfer Environment for the transfer of crypto assets, and workflow authorization functionality ensuring that only Bakkt Crypto specified authorized persons are able to cover certainaccess the wallets for authorized purposes.
Under the BitGo Custody Agreement, BitGo, at Bakkt Crypto’s direction, establishes and maintains wallets for the storage of crypto assets, including cold wallets where BitGo holds all of the Company’skeys, and all of those keys are stored offline (“Vault”). BitGo serves as custodian of crypto assets stored in these wallets. BitGo is required to use reasonable best efforts to keep all custodial coins received by BitGo in safe custody on behalf of Bakkt Crypto and to keep all keys to the custodial wallet held by BitGo secure and to maintain at least one backup key. BitGo is also required to exercise all reasonable best efforts to prevent unauthorized access to or use of the keys held by BitGo to the custodial wallet. Bakkt Crypto does not have inspection rights under the BitGo Custody Agreement. The BitGo Custody Agreement has an initial one-year term and renews automatically for successive one-year periods unless either party provides notice to the other party of its intent not to renew at least 60 days prior to the expiration of the then-current term.
Under the Coinbase Custody Agreement, Coinbase Custody provides Bakkt with a segregated custody account controlled and secured by Coinbase Custody to store certain crypto assets supported by Coinbase Custody on Bakkt Crypto’s behalf. Crypto assets in the custodial account are not treated as general assets of Coinbase Custody, and Coinbase Custody is a fiduciary and custodian on Bakkt Crypto’s behalf. Under the Coinbase Custody Agreement, Coinbase Custody securely stores crypto asset private keys in offline storage. Under the Coinbase Custody Agreement, Coinbase Custody has implemented and agrees to maintain a reasonable information security program with policies and procedures reasonably designed to safeguard its electronic systems and Bakkt Crypto’s confidential information. Coinbase Custody is required to keep timely and accurate records as to the deposit, disbursement, investment and reinvestment of crypto assets and maintain accurate books and records of the custody services in accordance with applicable law and its own internal document retention policies. Bakkt Crypto does not have inspection rights under the Coinbase Custody Agreement. The Coinbase Custody Agreement remains effective until terminated by either party by providing at least 30 days’ prior written notice to the other party.
Under the Fireblocks License Agreement, Fireblocks has granted Bakkt Crypto a non-exclusive, non-sublicensable, non-transferable license to generate wallets through the Fireblocks Vault service. The service allows Bakkt Crypto to access and use crypto asset wallets that store private and public keys, interact with various blockchains and monitor its balances of crypto assets.
-14-
Our intention is to consolidate our self-custodial services while still offering diversification across custodians for clients that request it.
Bakkt Trust holds at least 90% of the crypto assets held in custody in cold storage and formation costsup to 10% of crypto assets (not to exceed $25.0 million in exchangenotional value at any one time) in warm or hot wallets.
Bakkt Crypto holds all crypto assets, including customer crypto assets and the immaterial inventory of crypto assets that Bakkt Crypto maintains for 5,750,000 Class B ordinary shares, par value $0.0001 per share (the “founder shares”). In September 2020,purposes such as facilitating blockchain fee payments and accommodating the Sponsor transferred an aggregateimpacts of 60,000 founder sharesrounding, in omnibus wallets. With respect to mode of storage, a small percentage of all crypto assets (generally not more than 2%) are held in warm or hot storage in order to facilitate daily settlement and customer withdrawals, while the vast majority of crypto assets are held in cold storage and accessed, as needed, to replenish the warm or hot wallets. The amounts of crypto assets held in warm/hot storage and cold storage are monitored daily by our custody operations team and reviewed by management on a monthly basis.
Assets stored by Coinbase Custody and BitGo are held 100% in segregated cold storage. “Segregated” means that Bakkt Crypto customer assets are held in unique addresses on the respective blockchains and do not include assets of other BitGo or Coinbase clients, or of BitGo or Coinbase themselves. Both entities are SOC 1 certified. At this time, Bakkt Crypto does not utilize third parties other than Coinbase Custody and BitGo to hold customer crypto assets as custodian.
To ensure the security of crypto assets, we do not disclose the geographic location where such assets are held or the identity of the persons who have access to them or the authority to release those assets from wallets. Private keys are held in controlled locations dispersed through the United States according to SOC 1 audit procedures to ensure appropriate security. There are dedicated team members responsible for daily reconciliation of wallet holdings. New members of our custody operations team are required to complete training and test simulations and are provided with a runbook on our custody procedures. New members of the Company’s boardcustody operations team, like all our employees, also are subject to background checks and drug testing. The daily reconciliations prepared by the custody team are reviewed and analyzed by management monthly and provided to external auditors at least annually, or as otherwise requested. Designated individuals within the custody operations team are responsible for the initiation and approval of directors, resultingoutbound wallet transactions, as per our policies and procedures. Access rights are managed according to the principle of least privilege. These rights are maintained according to our IT security policy and subject to quarterly review by our IT security team. The existence, exclusive ownership and software functionality of private digital keys and other ownership records are subject to annual audits conducted by external auditors.
No insurance provider has inspection rights in respect of the crypto assets held in storage.
External Transfers of Crypto Assets (through Bakkt Crypto)
Other than in the Sponsor holding 5,690,000 founder shares. The numberState of founder shares outstanding was determined based onNew York, we make available to customers the expectationability to transfer crypto assets to external wallets. Because we have structured our platforms to be client-configurable in several aspects, each client has the discretion to enable this transfer feature for its customers. Crypto assets made available to customers residing in the State of New York will not be transferable to external wallets until that the total sizecapability is approved by NYDFS, which we plan to seek in 2024.
Institutional Client Business – Crypto Custody Services
Bakkt Trust currently provides custody services to customers of Bakkt Marketplace and Bakkt Crypto and to its own institutional customers with respect to all of the Company’s initial public offering would becrypto assets which we support for trading. For a maximumlist of 23,000,000 units ifthese crypto assets, see the underwriters’ over-allotment option was exercised in full,table for Bakkt Trust under “—Crypto Assets and therefore that such founder shares would represent 20% of the outstanding shares after the Public Offering. Up to 750,000 of the founder shares were subject toServices Offered by Bakkt” above.
Bakkt Rewards
Customers that elect this service will opt into the program through the client’s loyalty program user interface and then be referred to a Bakkt-managed front end to authorize account creation and conversion of certain client loyalty points into bitcoin. The exchange rate governing the conversion will be determined by (i) the redemption rate of client loyalty points to USD (which is set by the client), and (ii) the prevailing market price for bitcoin, which includes a markup agreed upon between the underwriters’ over-allotment was exercised. In connectionclient and Bakkt. The bitcoin will then be accessible to the customer via a Bakkt-managed interface, which will allow customers to sell bitcoin for USD, link their account at the client with their bank account, deposit or withdraw fiat currency, and buy, sell and hold other approved crypto assets. The Bakkt-managed interface will not allow customers to open an account directly unless they are referred via a supported client.
Bakkt Rewards will initially be supported by the underwriters’ partial exerciseBakkt Marketplace platform and, once it combines with Bakkt Crypto, by the platform of the over-allotment optioncombined entity.
Other Potential Services
As part of our ongoing review of potential services, we continually evaluate how we can most effectively improve our platform and the forfeiture of the remaining over-allotment option on October 1, 2020, 565,700 founder shares were forfeited and 184,300 founder shares are no longer subject to forfeiture resulting in an aggregate of 5,184,300 Founder Shares outstanding at December 31, 2020.
Policies and Procedures
We and our subsidiaries have a comprehensive set of policies and procedures relating to crypto assets and crypto asset-related services.
General
Self-dealing and other potential conflicts of interest are addressed by our Insider Trading Policy, Code of Business Conduct and Ethics, Related Person Transactions Policy and Cryptocurrency Listing Policy. Employees are trained in these areas and attest to review these documents and policies upon hire and annually. Operationally, there are segregations of duties and information tied to trading, listing and money movements, including protections for whistleblowers, compliance reviews, and blackout periods. Orders are entered into our systems where transactions are executed at best available prices with market makers and liquidity sources, designed to further insulate customer activities and prevent front-running and other illegal activities.
Custody-Related Policies
Bakkt Trust stores client and internal assets on an omnibus basis in a combination of warm and cold wallets. Bakkt Trust uses an internal ledger to delineate client and internal assets. Bakkt Trust completes hourly automated reconciliations to confirm balances across the termsinternal ledger, internal node, and subjectexternal node match. Every deposit into Bakkt Trust is checked using industry-leading “know-your-customer” (“KYC”) providers to check the provenance of the assets deposited before moving the funds out of the deposit wallet. Deposited funds may be moved into a segregated quarantine wallet if they do not pass the KYC screening and require further investigation.
-16-
Bakkt Crypto makes use of third-party providers of custodial services, including Coinbase Custody Trust Company, LLC and BitGo Trust Company, to hold customer crypto assets as custodian in cold storage as well as in hot or warm wallets as necessary. Bakkt Crypto also self-custodies customer crypto assets using the Fireblocks Vault service. All wallets hosted by Bakkt Crypto are omnibus wallets, which may contain both crypto assets held for the benefit of customers and the limited quantity of crypto assets held by Bakkt Crypto in its own account as inventory. Bakkt Crypto does not, and historically did not, operate a proprietary trading business.
Listing-Related Policies
We maintain crypto asset listing and delisting policies for each of Bakkt Marketplace (which policy also covers Bakkt Crypto, as its wholly owned subsidiary) and Bakkt Trust (the “Listing Policies”), the purpose of which is to provide a framework for the review and approval of new crypto assets, and continued offering of crypto assets, for customer transactions and custody services, respectively. The Listing Policies were revised to accommodate new guidance issued by the NYDFS in November 2023, and were subsequently approved by the NYDFS. Material revisions to the conditions thereof,Listing Policies require prior written approval from the following transactions will occur (togetherNYDFS.
The Listing Policies require the covered entity to undertake and document a risk assessment for each new crypto asset, which considers a number of risks, including legal and regulatory risk, and entails a review of the regulatory status of the crypto asset. Other risks covered by the risk assessment include integrity and legitimacy risk (i.e., risks associated with the other agreementscreation, governance, issuance, and transactions contemplated by the Merger Agreement, the “Proposed Transaction”):
Under the Listing Policies, we utilize the risk assessment to consider various factors when making a decision to approve a new crypto asset for listing, including, among others, the appropriateness of the crypto asset to our business model and client base and whether the crypto asset is supported by other reputable markets or trading venues. In order to assess the Merger Agreement (the “Closing”),regulatory status of a crypto asset, we consider the applicable laws, rules and case law, and other factors relevant to the determination of the security status of a crypto asset, and the positions of the SEC as expressed in various crypto-related enforcement actions and lawsuits. We may also solicit the opinion of outside counsel.
We are required to monitor each of the crypto assets for material changes and for changes in the risk assessment conducted during the listing evaluation, and to ensure their offering remains consistent with our mission and values, general safety and soundness, and protection of customers. Should we determine that removal of a crypto asset is consistent with NYDFS guidance and regulations, and with safety and soundness, we will delist the crypto asset in accordance with the Delaware Limited Liability Company Act, as amended (“DLLCA”), Merger Sub will merge (the “Merger”) with and into Bakkt, the separate corporate existence of Merger Sub will cease and Bakkt will be the surviving limited liability company,Listing Policies.
The Listing Policies do not ascribe specific weighting to particular factors or inputs to be renamed Bakkt Opco Holdings, LLC (“Bakkt Opco”);
Sales and Marketing
We market our platform to our clients. We do not engage in any direct-to-consumer marketing for the acquisition or engagement of customers. As part of client engagement, we may assist them in developing their crypto assets marketing strategy but any such strategy is ultimately executed by clients at their discretion. We also have a sponsorship agreement with Caesars Entertainment pursuant to which the theater at Planet Hollywood Resort & Casino in Las Vegas is branded as the “Bakkt Holdings, Inc.Theater.” (referredHowever, potential customers are not able to hereinafter as “Bakkt Pubco”);sign up directly with us and
need to access our platform through a client environment.Clients may choose to market our crypto asset services to customers. In order to ensure we comply with applicable laws and regulations, we retain the right to review customer-facing marketing materials proposed to be used by clients. In specific instances, we require clients to disclose the services we provide and the related risks in such materials.
We market our products and services to potential clients using multiple business-to-business channels, such as (i) Company-owned domains (e.g., our website and blog and its social media platforms), (ii) direct marketing, including email marketing and targeted digital advertisements to potential clients, and (iii) indirect marketing to potential clients via partnerships with existing clients and other third parties to promote branding and product access for potential clients through existing client channels.
Since customers must agree to our terms of use in order to utilize the services offered by our platforms, as part of customer onboarding, we collect data about customers from the applicable client and/or customer in accordance with our privacy policy. This data is used to complete required processes (e.g., Customer Identification Program and KYC verification) and to service customers.
We have built an extensive vendor network across various industries including financial services, travel and entertainment, retail and platform companies. While we have made significant headway building partnerships in these industries, there remain significant untapped growth opportunities in each area. For example, traditional financial institutions are facing increased competition from a broader group of fintech entrants. We expect that the pressure on them to provide innovative products and increased competition will continue to grow. Our ability to stand up capabilities within client ecosystems makes our platform an attractive solution for such financial institutions seeking an intuitive, tightly integrated, low risk solution to offer crypto and loyalty services.
We believe our growing network of clients provides potential for increased scale and substantiates the viability of our business plan. As our partnerships go live, we will offer to retail clients marketing resources to drive consumer adoption and usage of our platform. The successful activation and implementation of these partnerships are expected to be a significant driver for our transaction growth and associated revenue, including crypto trading revenue. We believe we will benefit from a positive network effect, where the value of our network will generally increase as we add new clients, vendors, customers and crypto to our platform.
Insurance Matters
We maintain types and amounts of insurance coverage that we believe are appropriate and consistent with customary industry practices. Our insurance policies cover employee-related accidents and injuries, property damage, business interruption, storm damage, facilities, cyber, crime and liability deriving from our activities. Our insurance policies also cover directors and officers’, employee and fiduciary liability. The insurance policies include exclusions aimed at delineating and clarifying the scope of coverage. Examples of key customary exclusions include exclusions for losses arising from force majeure events or theft, fraud, or dishonest acts committed by any principal shareholders, partners or directors of the insured entity. Losses stemming from the network failure of a digital asset cryptographic protocol, as well as those associated with illegal activities like money laundering, are expressly excluded.
We may also be covered for certain liabilities by insurance policies issued to third parties, including, but not limited to, our dealers and vendors.
We maintain $230 million of insurance coverage, which includes $200 million of cold storage coverage and $30 million of hot storage coverage. The $30 million of hot storage coverage is in excess of a $10 million loss retention. There is no retention applicable to the $200 million of cold storage coverage. All supporting insurers maintain a minimum A.M. Best rating of “A”. The $30 million of hot storage coverage has a three-year term, expiring October 2024. The $200 million of cold storage coverage has a one-year term, expiring November 2024.
The $30 million of hot storage coverage policy is non-cancellable, other than due to non-payment of premium. The $200 million of cold storage coverage policy may only be cancelled upon: 1) the Company’s election to cancel, 2) the
insurer’s election to cancel, on 90 days’ notice to the Company, 3) the Company’s change in ownership or control or seizure by a receiver, trustee, or government entity, 4) voluntary liquidation of the Company, 5) exhaustion of the coverage limit, or 6) non-payment of premium. The $30 million of hot storage coverage policy has no automatic or guaranteed renewal provisions, although we expect to renew such coverage prior to its expiration. The $200 million of cold storage policy has a one-year guaranteed renewal provision. There are no carrier inspection rights, but an affirmative proof of loss statement would need to be completed in the event of a loss.
Loyalty
We offer a full spectrum of supplier content through configurable, white-label e-commerce storefronts that clients can make available for their customers to purchase via redemption of loyalty points. Our redemption catalog spans a variety of rewards categories including travel, gift cards and merchandise, including a unique Apple product and services storefront. Our travel solution offers a retail e-commerce booking platform with direct supplier integrations, as well as a U.S.-based call center for live-agent booking and servicing. Our platform provides a unified shopping experience that is built to seamlessly extend our clients’ loyalty strategies and user experience for their loyalty programs. Functionality includes a mobile-optimized user interface, numerous configurations to support diverse program needs, promotional campaign services, comprehensive fraud protection capabilities and the ability to split payments across both loyalty points and credit cards. We recognize that businesses want to offer consumers choice, innovation and a frictionless experience, and our platform and service offerings were constructed with this in mind.
We have thoughtfully built a unique and powerful platform with end-to-end services, including easily consumable technology services, customer support and compliance infrastructure, for our clients.
Our Clients
Our clients include financial institutions, fintechs, broker-dealers, neobanks, registered investment advisers, funds, merchants, and other businesses. Our crypto-related capabilities facilitate new asset acquisition opportunities for their customers, in addition to the secure safekeeping of acquired crypto assets and crypto assets stored on behalf of institutional clients. Our loyalty-related capabilities deepen our clients’ relationships with their customers by strengthening the value proposition of their loyalty programs. Our thousands of redemption options enable our clients to meet their customers where they are, deliver the products and services they desire, and meet the expectations of next generation audiences by offering crypto redemption options.
Our dependence on a limited number of clients exposes us disproportionately to the risk of any of those clients choosing to no longer partner with us, to the economic performance of such clients or their respective industries or to any events, circumstances, or risks affecting such clients or their respective industries. For more information, please see our risk factors described in “Item 1A. Risk Factors - Related to Our Business, Finances and Operations”.
Revenue Model
We primarily generate revenue when clients or their customers use our services to buy, sell and/or store crypto or transact in loyalty points across our platform in the following key areas:
•Subscription and service revenue. We receive a recurring subscription revenue stream from client platform fees as well as service revenue from software development fees and call center support.
•Transaction revenue. We generate transaction revenue from crypto buy/sell transactions, where we charge a markup on both legs of the transaction, and through loyalty redemption volumes, where we earn a margin from the difference of the value of the points being redeemed and the cost of fulfilling the redemption request.
Our loyalty revenue has seasonality and is typically higher in the fourth quarter, driven by holiday spending and the travel bookings.
-19-
Revenue generated from our crypto services had been immaterial prior to our acquisition of Bakkt Crypto; however, revenue from crypto services is now a significant driver of our business, and we expect crypto services revenue to increase as we grow our client base and our customers. As a result of the Merger, the aggregate considerationour acquisition of Bakkt Crypto, we expect loyalty revenue, which prior to be received in respect of the Merger by all of the Bakkt interest holders will be an aggregateCrypto acquisition was the source of 208,200,000 common units of Bakkt Opco (“Bakkt Opco Units”) and 208,200,000 shares of class V common stock of Bakkt PubCo, which will benon-economic,voting shares of Bakkt Pubco.
Growth Strategy
We go to market using a platform strategy, driven by our clients. We partner with leading companies and expect to grow customers on our platform through those relationships, in addition to our direct institutional clients. We have already built an extensive network of clients across numerous industries including financial institutions, merchants and travel and entertainment. These clients include Webull, Public.com, Blockchain.com, Swan Bitcoin, and Caesars. We believe this strategy will enable us to add transacting accounts and volume more quickly and more efficiently than a direct-to-consumer model, given our limited operating history and the novelty of the crypto space for some customers.
As part of this approach, we have developed our platform to be flexible and scalable to accommodate how different clients may want to implement our solutions. Depending on each client’s specific needs and objectives, that client can choose to add one, some or all of our capabilities, and can also choose the manner in which those capabilities are enabled. Clients can choose to fully or partially embed our capabilities directly through Bakkt hosted user interfaces such as our Custody client portal.
We believe our growth will come from adding clients and correspondingly, their customers, and increasing transaction activity as well as strategic acquisitions. Our acquisition of Bakkt Crypto has provided scale and meaningful transaction volume from Bakkt Crypto’s active client base which we are working to leverage to sell additional products and services on the same platform. Leveraging Bakkt Crypto’s proprietary trading platform and existing relationships with liquidity providers, we provide a wide range of assets and competitive pricing to our clients.
Our growth strategies include the following:
•Adding clients. We are focused on continuing to build strong client relationships. Acquiring customers through our clients is an efficient and scalable way to grow our business. Bakkt Crypto has significantly expanded our crypto client base into a number of new and rapidly growing client verticals, such as fintechs, trading and brokerage platforms and neobanks. In addition to growing our retail trading clients, we continue to invest in the institutional side of our business, initially with our relaunched qualified custodian product and as a key agent for collaborative custody through our partnership with Unchained.
•Adding customers. We are focused onactivating our existing clients and supporting our clients in marketing campaigns to drive new customer acquisition and engagement of existing customers. Our existing clients provide us with an addressable market of well over 100 million potential users, who we will focus on bringing onto our platform.
•Expanding our offering. We aim to increase the breadth and depth of our product offering - with respect to both retail customers and institutional clients - in order to increase its appeal to clients and customers. With respect to our retail product offerings, we made numerous enhancements to our platform over the last year in addition to the expanded capabilities from the acquisition of Bakkt Pubco will be held by Bakkt Opco and its subsidiaries, and Bakkt Pubco’s only direct assets will consist of Bakkt Opco Units. Assuming no redemptions of public shares in connectionCrypto, which has been enhanced with the Proposed Transaction, uponaddition of fiat funding. We believe Bakkt Crypto accelerated our product road map by providing new capabilities to our platform including the Closingaddition of 6 coins to our platform and deposit and withdrawal functionality in jurisdictions where permitted. The integration with Bakkt Pubco is expectedMarketplace enabled direct fiat funding capabilities, user management and onboarding and compliance functionality, each of which continue to own approximately 22%be enhanced with additions such as wire
-20-
We have also reinvested in growing our institutional offerings, starting with the relaunch of our qualified custody platform in November 2023, and subsequently expanding custody support for 6 additional crypto assets and in the process of expanding our operational coverage to support evening and weekend withdrawal processing. Custody serves as the basis for our institutional offerings, which the PIPE Investors have collectively subscribedcan then be leveraged to add additional functionality to both our institutional clients and retail clients and customers. For instance, in March 2024 we launched a partnership with Unchained Capital to support their Collaborative Custody vault offering. Bakkt leverages our secure custody infrastructure, vault and operational capabilities to secure one of three private keys and act as a key agent in a multi-signature wallet in which two of three signatures are required to transfer assets, which results in custody that does not rely on any single party.
We continue to invest in enhancing these custodial solutions with additional offerings to expand our addressable market. This includes enhancements to expand support from traditional long term buy and hold custody clients to service more active trading clients and funds, such as being a custodian for 32,500,000 Bakkt Pubco Class A Shares for an aggregate purchase price equal to $325,000,000 (the “PIPE Investment”).
•Market expansion. After the acquisition of Bakkt Crypto, we are seeing significant opportunity in expanding our retail offerings internationally beyond the U.S. We have expanded into new markets, and expect to continue to do so with our clients. We are currently live with our clients in Europe, Latin America and Asia, and are exploring additional expansion opportunities. Ultimately, the decision as to when and where to expand continues to be driven by client and customer demand and the regulatory environment in those markets.
Over time, we will continue to invest in our business combination described hereinto provide best-in-class products and services. Some of those longer-term planned enhancements include:
•Crypto enhancements.We expect to expand our crypto capabilities to products and services that will appeal to both retail and institutional clients. Our institutional-grade crypto custody solution is subject to certain conditions as further describedour foundation. By increasing the acceptance of crypto investing in the Merger Agreement.
•Evaluate additional strategic acquisitions. We will continue to be opportunistic and evaluate strategic acquisitions that have compelling benefits for our business.
•Loyalty enhancements. As we serve existing loyalty clients with large active customer populations, we can create deeper relationships across merchants with Bakkt Disclosure Statement.at the center of these loyalty networks. As loyalty programs seek new ways to leverage customer data and behaviors to deliver value, we believe our platform will enable clients to more effectively acquire, re-activate and engage customers. Additionally, we continue to evaluate additional loyalty offerings and suppliers to meet the needs of our clients.
-21-
How We Are Different
The markets in which we operate are seeking an initial business combination. As a result,highly competitive, rapidly changing and highly innovative. We believe that we are well-positioned given our sponsor, officers and directors could have conflicts of interest in determining whetherunique ability to present business combination opportunities to us or to any other special purpose acquisition company with which they may become involved. In particular, certainprovide all of our officerscapabilities under one platform, combined with our institutional-grade, secure and directors are actively engaged in VPC Acquisition Holdings II (“VPC II”) and VPC Acquisition Holdings III, Inc. (“VPC III”), both special purpose acquisition companieslicensed infrastructure. We believe this provides a competitive differentiation that each completed their initial public offering on March 9, 2021, respectively, and will continuewould be difficult to serve as officers and directors of VPC II and VPC III until their initial business combinations are completed. VPC II and VPC III, like us, may pursue initial business combination targets in any business or industry and is expected to have a similar window as us in which it may complete its initial business combination. Any such companies, businesses or investments, including VPC II and VPC III, may present additional conflicts of interest in pursuing an initial business combination. However,replicate. Although we do not believe that we have any such potential conflicts would materially affectsingle direct competitor for the full range of products we provide through our ability to complete our initial business combination.
We believe that our business model provides us with significant competitive advantages, including:
•Multi-faceted approach to security and compliance. We enable responsible and secure access to crypto for an indefinite periodour clients. Our compliance measures, controls and rigorous risk management practices are at the core of time.how we operate. Our infrastructure provides multiple layers of protection and provides heightened security and compliance. This includes a separate and independent board for Bakkt Trust. As a public company, we are subject to significant and comprehensive regulations. Across our entities, we possess two BitLicenses from NYDFS, a limited-purpose trust charter (also from NYDFS), and state money transmitter licenses. We intend to effectuate our initial business combination, including the Proposed Transaction, using cash held in the trust account, the proceedshave robust policies and programs that govern crypto-related activity, such as a cyber security program, information security policy, global AML policy, and Bank Secrecy Act (“BSA”)/Office of Foreign Assets Control (“OFAC”) of the saleU.S. Department of the Treasury program. These measures are all designed to protect our sharesclients and stockholders.
•Client-led strategy. We seek to leverage our existing and new client relationships with leading brands to add customers to our platform. By partnering with these brands and their existing customer bases, we believe customers are more likely to embrace the new asset classes offered on our platform. We also believe that, as a relatively new brand, this approach will allow us to scale customers and revenue more quickly.
•Institutional-grade platform. Our platform architecture is engineered to natively support crypto across a wide range of classes, with scalability and strong regulatory and compliance controls. Our platform includes a custody platform that we designed and built in connectionpartnership with our initial business combination (including pursuantmajority investor, ICE. Our platform was designed with these principles in mind to forward purchase agreements or backstop agreements we may enter into), shares issued to the owners of the target, debt issued to bank or other lenders or the owners of the target, orprovide safe, reliable infrastructure for consumers in their everyday use. We believe that it also serves as a combination of the foregoing. We may seek to complete our initial business combination with a company or business that may be financially unstable or in its early stages of development or growth, which would subject us to the numerous risks inherent in such companiesspringboard for additional products and businesses.
•Trusted and scalable capabilities. Our approach, built to scale with technology, privacy, security and compliance at the core, is informed by our team's decades of such criteria. While we consider it likely that our board of directors will be able to make an independent determination of the fair market value of our initial business combination, it may be unable to do so if it is less familiar or experienced with the business of a particular target or if there iscollective experience. Our platform moves a significant amount of uncertainty asvolume across asset classes every day, and we handle customer service for many of the largest financial institutions in the country. We believe these pillars, when applied to the value of the target’s assetsrapidly evolving crypto space, provide confidence to customers, merchants, institutions and loyalty clients that participate in our ecosystem.
Sales and Marketing
Our go-to-market strategy is “business-to-business-to-consumer”, or prospects. In addition, pursuant“B2B2C”, in which we acquire customers primarily via client relationships. We believe our focused approach on building scalable partnerships with valued brands will drive strong growth in customers. Our goal is to Nasdaq rules, any initial business combination must be approved by a majorityprovide our clients with opportunities to leverage Bakkt’s capabilities to drive mutually beneficial customer acquisition and engagement. Customers of our independent directors.
crypto clients access our platform through a client environment. Similarly, customers of our loyalty clients may only access our redemption storefronts through clients’ loyalty program user experiences.Our marketing efforts are focused on business-to-business (“B2B”) activities to acquire new clients. We utilize multiple B2B channels, such as Bakkt-owned domains (e.g., our website and blog and its social media platforms) and direct marketing to potential clients, such as email marketing and targeted digital advertisements. We also engage in indirect marketing to potential clients via partnerships with existing clients and other third parties to promote branding and product access for potential clients through existing client channels.
Customer Care
Our customer service channels are at the core of our loyalty and travel redemption offerings to clients, providing seamless and easy-to-leverage support for the wide array of loyalty and travel redemption transactions on our platform. We strive to provide our clients and their customers with a high-quality experience. We provide customer service that is designed to meet the requirements of our clients. Our customer service agents undergo a rigorous training program and are continually monitored and trained as new capabilities are added to the platform. New clients are able to leverage our deep expertise in customer support as they roll out new offerings to their customer bases.
Technology
Our core platforms were built in-house and are maintained by our skilled technical staff who have deep industry expertise across crypto and loyalty solutions. We leverage a modern software and cloud infrastructure stack to offer off-the-shelf or bespoke solutions for our clients, depending on their needs. Additionally, our platform implements advanced strategies and controls to enable KYC, AML, and other anti-fraud measures to combat financial crime.
Our modern embedded web experiences and API-driven platform allow us to partner and easily integrate with clients, including through the following:
•Via standard SSO and API integrations, our multi-storefront loyalty redemption platform is provided as SaaS and powers rewards redemption for several of the top loyalty programs in the US. The platform is built upon highly scalable proprietary technology and is directly integrated with dozens of suppliers for real-time redemption of merchandise, gift cards and travel services. Additionally, our multi-location call center teams leverage our platform to provide agent assisted transactions and redemption servicing.
•Our crypto solutions operate in an institutional-grade crypto custody and trading platform, anchored by our performance hardened trade execution engine. The custody platform is built to safeguard crypto with multi-signature wallet policies, hardware security modules and offline storage of private key material, blockchain surveillance and AML/KYC compliance integrated into the core of the platform and our operation team’s procedures. Our trade execution engine was built with speed and scale at its core to deliver equities-grade trading performance to provide liquidity for the purchase and sale of crypto to our clients.
Cybersecurity
Each of our products is architected, deployed, and managed through a common controls environment designed to protect our customers' confidential information using a combination of administrative, physical, and technical controls. We maintain a comprehensive cyber security program, managed by a dedicated team of security professionals, leveraging multiple layers of defenses to protect our loyalty and crypto clients’ consumer data, as well as crypto wallets, including crypto that is kept in custody. Our administrative, technical, and physical controls include the use of separation of duties, physical and logical access controls, biometrics, hardware security modules, advanced cryptographic algorithms, dedicated security monitoring, and other controls to protect our environment and restrict unauthorized access. Additionally, we regularly utilize independent external parties to assess and provide added assurance that our products are designed appropriately and operating effectively. We currently maintain independent SSAE-18 SOC 1 Type II and SOC 2 Type II attestation reports for our crypto platform and SOC 2 Type II attestation reports for our loyalty platform. We also maintain controls aligned to the Payment Card Industry Data Security Standard ("PCI-DSS") for in-scope systems where cardholder
-23-
data is stored or acquires 50%processed. We comply with NYDFS cybersecurity requirements which impose strict rules related to establishing a detailed cybersecurity plan, enacting a comprehensive cybersecurity policy, and maintaining an ongoing reporting system for cybersecurity events.
Regulation
International, federal and state laws and regulations apply to many key aspects of our business. Any actual or moreperceived failure to comply with these requirements may result in, among other things, revocation of required licenses or registrations, loss of approved status, regulatory or governmental investigations, administrative enforcement actions, sanctions, civil and criminal liability, private litigation, reputational harm, or constraints on our ability to continue to operate. We operate in a regulatory environment that is evolving rapidly and increasing in scope. As such, it is possible that current or future laws or regulations could be enacted, interpreted or applied in a manner that would prohibit, alter, or impair our existing or planned products and services, or that could require costly, time-consuming, or otherwise burdensome compliance measures. Further, additional laws and regulations may apply to our businesses as we expand outside of the voting securitiesUnited States in the future. For more information, please see our risk factors described in “Item 1A. Risk Factors - Risks Related to Regulation, Taxation and Laws”.
Regulation of Our Money Transmission Business. Bakkt Marketplace and Bakkt Crypto maintain a money transmitter license in each jurisdiction in which they operate that requires such a license for our activities. In all other jurisdictions where Bakkt Marketplace and Bakkt Crypto operate, we have established with the applicable licensing body that a money transmitter license is not required at this time. We will comply with new license requirements as they arise. Bakkt Marketplace and Bakkt Crypto are also registered as a "Money Services Business" with the U.S. Department of Treasury’s Financial Crimes Enforcement Network (“FinCEN”). These licenses and registrations subject us to, among other things, record-keeping requirements, reporting requirements, bonding requirements, limitations on the investment of customer funds, and examination by state and federal regulatory agencies. These licensing laws also address matters such as change in control, and regulatory approval of controlling shareholders, directors, and senior management of the target, our shareholders priorlicensed entity.
Regulation of Our Virtual Currency Business. We provide crypto custody services through Bakkt Trust, a limited purpose trust company that is chartered under the New York Banking Law and subject to the business combination may collectively own a minority interest in the post-transaction company, as is expected if the Proposed Transaction is consummated, depending on valuations ascribed to the targetsupervision and us in the business combination transaction. For example,oversight of NYDFS. Consequently, we could pursue a transaction in which we issue a substantial number of new shares in exchange for all of the outstanding capital stock, shares or other equity interests of a target, as we have agreed to domust comply with laws, rules and regulations promulgated pursuant to the Merger Agreement. In this case,New York Banking Law with respect to the crypto custody services we would acquireprovide through Bakkt Trust, including those related to capitalization, corporate governance, anti-money laundering, disclosure, reporting and examination, as well as supervisory guidance and requirements. Bakkt Trust is also subject to FinCEN requirements as a 100% controlling interestfinancial institution.
We are subject in the target. However,certain jurisdictions to licensing and regulatory requirements as a result of offering our clients the issuanceability to aggregate, buy, sell, convert, and send virtual currency through our platform. Consequently, we must comply with laws, rules and regulations promulgated by federal or state regulators in those jurisdictions in order to provide our services, including requirements related to capitalization, consumer protection, anti-money laundering, disclosure, reporting and examination, as well as supervisory guidance and requirements. Bakkt Marketplace and Bakkt Crypto also have virtual currency licenses (“BitLicenses”) from the NYDFS, which subject them to NYDFS's oversight with respect to business activities conducted in New York State and with New York residents. In October 2023, the governor of California signed into law the Digital Financial Assets Law (“DFAL”), which establishes a substantial numberrequired licensing framework administered by the California Department of new shares,Financial Protection and Innovation (“DFPI”) for entities engaged in digital financial asset business activity in the state of California. We expect that our shareholders immediatelybusiness will require licensure under the DFAL and will therefore take steps to obtain necessary licenses prior to the enactment’s effective date of July 1, 2025. The DFAL provides that the DFPI may issue a conditional license to companies, such as our initialsubsidiaries, that maintain licenses to conduct virtual currency business combination could own less thanactivity in New York or hold a majority of our issued and outstanding shares subsequent to our initial business combination,charter as is expected if the Proposed Transaction is consummated. If less than 100% of the equity interests or assets of a target business or businesses are owned or acquired by the post-transactionNew York limited purpose trust company the portion of such business or businesses that is owned or acquired is what will be taken into account for purposes of the 80% of net assets test described above. If the business combination involves more than one target business, the 80% of net assets test will be based on the aggregate value of all of the target businesses.
Broker-Dealer Regulation. The Exchange Act requires that any person who is a broker or a dealer and effects or induces securities transactions must register with the SEC. A broker is defined as “any person engaged in the business of effecting transactions in securities for the account of others,” while a dealer is defined as “any person engaged in the business of buying and selling securities for such person’s own account,” in each case, subject to exceptions. In order to be able to act as a broker and advise clients interested in transactions that involve securities, we acquired Bakkt Brokerage, a registered broker-dealer. Broker-dealers are subject to regulation, examination, investigation, and disciplinary action by the SEC, FINRA, and state securities regulators, as well as other governmental authorities and self-regulatory organizations with which they are registered or licensed or of which they are a member. Bakkt Brokerage is registered as a broker-dealer in 52 U.S. states and territories. The regulation of broker-dealers covers all aspects of the broker-dealer business and operations, including, depending the scope of its activities, among other things, sales and trading practices and reporting requirements, client onboarding, advertising and marketing, publication or distribution of research, margin lending, uses and safekeeping of clients’ funds and securities, capital adequacy, recordkeeping, reporting, fee arrangements, disclosures to clients, suitability, acting in client’s best interests when making recommendations to retail customers, customer privacy, data protection, information security and cybersecurity, the safeguarding of customer information, the sharing of customer information, best execution of customer orders, public offerings, customer qualifications for margin and options transactions, registration of personnel, business continuity planning, transactions with affiliates, conflicts, and the conduct of directors, officers and employees. Broker-dealers are also subject to anti-money laundering rules and requirements issued by FinCEN under the U.S. Bank Secrecy Act.
Privacy and Information Cybersecurity Regulations. Aspects of our operations or business are subject to laws and regulation in the United States and in foreign jurisdictions relating to privacy, data protection and cybersecurity. Accordingly, we publish our privacy policies and terms of service, which describe our practices concerning the use, protection, transmission, and disclosure of information. As our business continues to expand in the United States and beyond, and as laws and regulations continue to be passed and their interpretations continue to evolve in numerous jurisdictions, additional laws and regulations may become relevant to us.
Regulatory authorities around the world are considering numerous legislative and regulatory proposals concerning privacy, data protection and cybersecurity. In addition, the interpretation and application of these laws and regulations in the United States and elsewhere are often uncertain and in a state of flux. As our business continues to develop and expand, we continue to monitor the additional rules and regulations that may become relevant. For additional information regarding these laws and regulations and related risks, please see “Risk Factors – Risks Related to Regulation, Taxation, and Laws – Complying with evolving laws and requirements relating to privacy, and other data related laws and requirements may be expensive and force us to make changes to our business, and failure to comply with such laws and requirements could result in substantial harm to our business.”
Consumer Protection Regulation. The Consumer Financial Protection Bureau and other federal and state regulatory agencies, including the Federal Trade Commission, broadly regulate financial products, enforce consumer protection laws applicable to credit, deposit, prepaid products, and payments, and other similar products. Such agencies have broad consumer protection mandates, and they promulgate, interpret, and enforce laws, rules and regulations, including with respect to unfair, deceptive, and abusive acts and practices that may impact or apply to our business.
For example, under federal and state financial privacy laws and regulations, we must provide notice to consumers of our policies on sharing non-public information with third parties, among other requirements. In addition, under the Electronic Fund Transfer Act, we are required to disclose the terms of, and any fees applicable to, our electronic fund
-25-
transfer services to consumers prior to their use of the service, among other requirements. We are further required to extend error resolution and limited liability protections to customers who use our card product.
Anti-Money Laundering and Counter-Terrorism Regulation. We are subject to AML laws and regulations in the United States, including the BSA, as amended, and its implemented regulations enforced by FinCEN, as well as laws designed to prevent the use of the financial systems to facilitate terrorist activities. We have implemented a comprehensive AML compliance program designed to prevent our payments network and custody services from being used to facilitate money laundering, terrorist financing, and other illicit activity. Our program is also designed to prevent our network and other services from being used to facilitate business in countries, or with persons or entities, included on designated lists promulgated by OFAC and equivalent authorities in other countries. Our AML compliance program is comprised of policies, procedures, reporting protocols, including reporting requirements for suspicious transactions, and internal controls, including the designation of a compliance officer, training for employees, and a regular independent review of the program. It is designed to address applicable legal and regulatory requirements and to assist in managing risk associated with money laundering and terrorist financing.
Indirect Regulatory Requirements. We maintain relationships with certain clients, including banks and other financial institutions in the United States, that are regulated by state, local and federal agencies. Because of these relationships, we may be subject to indirect regulation or examination by these institutions' regulators. We generally seek to account for these types of indirect regulatory requirements in our commercial agreements. We also have clients that are investments advisors. The SEC has recently proposed changes to its investment adviser custody rule, which could affect the terms upon which we can offer custody services to those clients.
Escheatment and Unclaimed Property Regulations. There is regulatory uncertainty regarding how states and jurisdictions treat virtual currencies and other crypto assets under unclaimed property laws and regulations. Unclaimed property laws, as may be applicable, require us to report and to remit certain government authorities the property of others held by us that has been unclaimed for a specified period of time. We have policies and procedures designed to help us comply with these laws.
Intellectual Property
The protection of our intellectual property and all corresponding rights throughout the world, including our trademarks, service marks, trade dress, logos, trade names, domain names, goodwill, patents, copyrights, works of authorship (whether or not copyrightable), software and trade secrets, know-how, and proprietary and other confidential information, together with all applications, registrations, renewals, extensions, improvements and counterparts in connection with any of the foregoing, is important to the success of our business. We seek to protect our intellectual property rights by filing applications in various patent, trademark and other government offices, and relying on applicable laws and regulations in the U.S. and internationally, as well as a variety of administrative procedures. We have sought to register our core brands as domain names and as trademarks and service marks in the U.S. and a large number of other jurisdictions. We also have in place an active program to continue to secure, police and enforce trademarks, service marks, trade dress, logos, trade names, and domain names that correspond to our brands in markets of interest. We have filed patent applications in the U.S. covering certain aspects of our proprietary technology and new innovations. We also rely on contractual restrictions to protect our proprietary rights where appropriate when offering or procuring products and services. We have routinely entered into confidentiality and invention disclosure and assignment agreements with our employees and contractors, and non-disclosure agreements with external parties with whom we will,conduct business to control access to, and use and disclosure of, our proprietary information.
Human Capital
Our employees are essential in propelling our success. We hold our employees to high standards, both in work product and ethics, and aim to create a culture of accountability and results. Our performance expectations and attributes empower our company. They reflect how we expect employees to operate, collaborate and make decisions. At Bakkt, we
-26-
strive to challenge the status quo with new ideas, have open and honest communications, appreciate our diversity of thought, take ownership and accountability for delivering valuable results and act with integrity, respect and reliability.
In a complex industry, it is critical for employees to act ethically. We provide regular training to help our employees understand and comply with the many regulations in our industry and with our company policies. We expect managers to set the tone for their teams and to lead by example, including by embracing ethical behavior and sharing its importance with their team. Managers are expected to help their teams understand our company policies and encourage them to report any violations of policy or law. As a company, we help ensure Bakkt’s non-retaliation policy is strictly followed.
At Bakkt, we understand that our success is built by operating as a unified company – one culture and team across the crypto landscape, with a focus on growth and innovation. We are committed to diversity throughout our company. It is our policy that employees are treated, and treat each other, with fairness, respect and dignity. We embrace our employees’ differences, while valuing a diverse, inclusive and safe workplace. We aim to promote diversity and inclusion through a number of employee engagement events including internal and external speaker sessions to foster learning on relevant and important topics. Our employees come from a wide variety of backgrounds to work toward a common vision for the Company. Our CEO brings our teams together in bi-weekly all hands calls and sends weekly email updates for transparency regarding our company strategy and goals.
We strive to hold employees accountable for their work performance while providing incentives for excellence in their contributions to the Company. We encourage open collaboration to put out the best ideas and solutions to better adapt to changing markets and other challenges Bakkt faces. Our commitment to our employees is reflected in our ability to attract high-caliber talent, continuously innovate, and provide exceptional service and solutions to our clients.
As of December 31, 2023, we had a total of 747 employees, all of whom were full-time employees, and are located in the United States. We also engage temporary employees, consultants and employers of record as needed to support our operations. Collectively, approximately 16% of our workforce is dedicated to engineering, design, or product roles. Our core locations are Alpharetta, GA, Scottsdale, AZ and New York City, NY. None of our employees are represented by a labor union or covered by a collective bargaining agreement. We have not experienced any work stoppages, and we consider our relations with our employees to be good.
Available Information
Our website is http://www.bakkt.com, and our investor relations website is located at https://investors.bakkt.com, where we make available, free of charge, our Annual Reports on Form 10-K, Quarterly Reports on Form 10-Q and Current Reports on Form 8-K and amendments to those reports filed or furnished pursuant to our amended and restated memorandum and articles of association: (a) conduct
We use our investor relations website to post important information for investors, including news releases, analyst presentations, and (b) file tender offer documentssupplemental financial information, and as a means of disclosing material non-public information and for complying with our disclosure obligations under Regulation FD. We use these channels as well as social media to communicate with the SEC prior to completingpublic about our initial business combination which contain substantially the same financial and other information about the initial business combination and the redemption rights ascompany. It is required under Regulation 14A of the Exchange Act, which regulates the solicitation of proxies. We do not currently plan to conduct redemptions for the Proposed Transaction pursuant to tender offer rules.
Item 1A. Risk Factors.
-27-
financial statements and accompanying notes, before making a decision to invest in our securities. Our business, financial condition, results of operations or prospects could also be harmed by risks and uncertainties not currently known to us or that we currently do not believe are material. If any of the following eventsrisks actually occur, our business, financial condition, and operating results mayof operations or prospects could be materially adversely affected. In that event, the trading price of our securities could decline, and you could lose allpart or partall of your investment. When available,
Risk Factor Summary
Our business is subject to numerous risks and uncertainties that you should consider before investing in our securities. These risks are described more fully below and include, but are not limited to, risks relating to the preliminary proxy statement/prospectus includedfollowing:
Risks Related to Our Business, Finances and Operations
•Our business model is newly developed and may encounter additional risks and challenges as it grows.
•Our platform is still in the registration statementearly stages of its release, will be further developed, and is largely untested.
•We have limited operating history and a history of operating losses.
•If we are unable to attract, retain or grow our relationships with our existing clients, our business, financial condition, results of operations and future prospects would be materially and adversely affected.
•Some of our current and prospective clients require the amendments theretoapproval of their own regulators in order to deploy our solutions, especially our crypto solutions, and if they are unable to obtain those approvals on a timely basis, or at all, our results of operations and future prospects would be materially and adversely affected.
•A large percentage of our revenue is concentrated with a small number of clients; the definitive proxy statement/prospectusloss of any such client would materially and adversely affect our business, financial condition, results of operations and future prospects. Moreover, because of our B2B2C go-to-market model, the loss of any client – regardless of the reason – increases the risk that the customers that originally emanated from that client will transition to another provider or stop doing business with us, which would harm our business.
•We may not realize the anticipated benefits of past or future investments, strategic transactions, or acquisitions and integration of these acquisitions may disrupt our business and management.
Risks Related to Crypto
•Disruptions in the crypto market subject us to additional risks, including the risk that banks may not provide banking services to us.
•There may be a general perception among regulators and others that crypto is used to facilitate illegal activity such as fraud, money laundering, tax evasion and ransomware scams.
•Crypto custodial solutions and related technology, including our systems and custodial arrangements, are subject to risks related to a loss of funds due to theft, employee or vendor sabotage, security and cybersecurity risks, system failures and other documents filedoperational issues the loss, destruction or other compromise of our private keys and a lack of sufficient insurance.
•Our failure to be filed by the Companysafeguard and manage our customers’ crypto could adversely impact our business, operating results, and financial condition.
•Crypto does not have extensive historical precedent and distributed ledger technology continues to rapidly evolve.
•We may encounter technical issues in connection with the Proposed Transaction,integration of supported crypto assets and changes and upgrades to their underlying networks, which could adversely affect our business.
Risks Related to Regulation, Taxation and Laws
•We are subject to extensive government regulation, oversight, licensure and appraisals and our failure to comply could materially harm our business.
-28-
•The regulatory regime governing blockchain technologies and crypto is uncertain, and new regulations or policies may alter or significantly adversely affect our business practices with respect to crypto.
•A crypto asset’s status as a “security” in any relevant jurisdiction is subject to a high degree of uncertainty, and if crypto assets on our platform are later determined to be securities, we may be subject to regulatory scrutiny, investigations, fines, and other penalties, which may adversely affect our business, operating results, and financial condition.
•We are subject to significant litigation risk and risk of regulatory liability and penalties. Any current or future litigation against us could be costly and time-consuming to defend.
Risks Related to Information Technology and Data
•Actual or perceived cyberattacks, security incidents, or breaches could result in serious harm to our reputation, business and financial condition.
Risks Related to Risk Management and Financial Reporting
•If we are unable to maintain effective internal controls over financial reporting, we may be unable to produce timely and accurate financial statements, which could have a material effect on our business.
Risks Related to Our Securities
•The trading market for our securities has in the past been and could in the future be impacted by market volatility. Stock run-ups, divergences in valuation ratios relative to those seen during traditional markets, high short interest or short squeezes, and strong and atypical retail investor interest in the markets may impact the demand for our securities.
Risks Related to Our Business, Finances and Operations
Our business model is newly developed and may encounter additional risks and challenges as it grows.
Our vision is that our clients will contain risk factorsutilize our platform as the go-to solution enabling customers to transact in crypto and loyalty points. Most of the assets that we have incorporated and intend to incorporate into our platform in the future are already being handled by incumbent providers. There can be no assurance that our platform will gain the acceptance of clients or customers or generate the anticipated synergies. Because some of the crypto assets that are anticipated to be available on our platform have not previously been available for the uses our platform is intended to cover, it is difficult to predict the preferences and requirements of clients or customers, and our platform, design and technology may not appeal to such clients or customers, or may be incompatible with new or emerging forms of crypto or related technologies. Failure to Bakkt, VIHachieve acceptance would impede our ability to develop and sustain a commercial business.
We primarily generate revenue when customers transact in crypto and loyalty points on our platform. Our success depends on bringing on clients and on the transaction volume from these customers. If we are not able to bring new clients onto the platform, many of whom will pay us subscription fees for our platform services, our revenue and business concern could be negatively impacted. Additionally, much of our future revenue depends on transaction fees earned from customers transacting in crypto and loyalty points and the Proposed Transaction.margin we charge in connection with those transactions. If we are not able to continue to grow our base of clients, we will not be able to continue to grow our customer base, our revenues or our business, which could negatively impact our business, financial condition and results of operations and may cause us to be unable to continue as a going concern.
The attractiveness of our platform depends upon, among other things:
•the number and variety of assets and other capabilities in which customers can transact through our platform;
•our reputation, as well as clients’ and customers’ experience and satisfaction with, and trust and perception of, our platform;
•technological innovation;
•regulatory compliance and data security; and
•services and products offered by competitors.
Moreover, clients may choose to contract with other providers of services that are competitive with ours. If we fail to retain existing clients, attract new clients, or continually expand usage and transaction volume on our platform, our business, financial condition, results of operations and prospects will be materially and adversely affected.
We will have both increased financial and reputational risks if there is a failure to launch one or more features, or if the launch of a new feature is unsuccessful. Also, there can be no assurance that we will receive support from clients to launch features as planned or that we will operate as anticipated. We also require regulatory approvals, including, for example, to add new crypto assets, products, and functionalities to our platform, and may require additional licenses and/or consultation with or approval of regulators to add, modify or discontinue certain aspects of our business model, which could lead to delays or other complexities in effectuating such changes and have a material adverse effect on our business and plan of operations.
Further, our business model entails numerous risks, including risks relating to our ability to:
•manage the complexity of our business model to stay current with the industry and new technologies;
•successfully enter new categories, markets and jurisdictions in which we may have limited or no prior experience;
•integrate into multiple distributed ledger technologies as they currently exist and as they evolve;
•successfully develop and integrate products, systems and personnel into our business operations;
•obtain and maintain required licenses and regulatory approvals for our business; and
•respond to, and comply with the evolving regulatory landscape for crypto and crypto platforms.
Our platform is in its early stages of release, will be further developed, and is largely untested. Any failure by us to successfully execute on the development of our platform would have an adverse effect on our business, results of operations and financial condition.
Our platform is in the early stages of release and will be further refined and developed, and certain areas of our platform are still under development and largely untested on a commercial scale. We are working to expand our service offerings, including, for example offering crypto rewards. Our platform will require additional development in order to add all of the additional functionalities and features planned by our management and activate our service offerings. There can be no assurance that the additional functionalities and features currently planned for our platform will be successfully developed in a blank check companytimely fashion or at all. The addition of functionalities to our platform may require regulatory approvals, may increase our regulatory obligations and the degree of regulatory scrutiny we face, and may make regulatory compliance more complex and burdensome. We will have both increased financial and reputational risks if there is a failure to launch one or more functionalities, or if the launch of a new functionality is unsuccessful. Also, there can be no assurance that we will receive the necessary regulatory approvals or support from clients to launch features as planned or that we will operate as anticipated. Any problems that we encounter with nothe development or operation of our platform, including technical, legal and regulatory problems, could have a material adverse effect on our business, financial condition and results of operations.
We have a limited operating history and no revenues,a history of operating losses, which make it difficult to forecast our future results of operations. Further, we expect to reduce our operating expenses in the foreseeable future, and youwe may not achieve or sustain profitability to absorb our targeted expense base.
We were founded in 2018 and have no basisexperienced net losses in the periods from inception through December 31, 2023. For example, our revenue was $727.0 million and $56.2 million in the years ended December 31, 2023 and December 31, 2022, respectively, and we generated net losses of $225.8 million and $1,989.9 million in the years ended
-30-
December 31, 2023 and December 31, 2022, respectively. You should not rely on which to evaluatethe revenue growth of any prior quarterly or annual period as an indication of our future performance. As a result of our limited operating history, our ability to achieveaccurately forecast our future results of operations is limited and subject to a number of uncertainties, including our ability to plan for and model future growth. Prior to the Bakkt Crypto acquisition, our historical revenue was achieved largely as the result of our white-labeled loyalty redemption product, which reflects little revenue from the launch of our broader crypto platform, and therefore should not be considered indicative of our future performance.
Because of our limited operating history and the fact that our current and historical revenue prior to the Bakkt Crypto Acquisition was largely not derived from our currently planned business model, our future revenue growth is difficult to predict. Even if we experience strong revenue growth, in future periods our revenue or revenue growth could decline for a number of reasons, including slowing demand for our platform, increased competition, changes to technology, a decrease in the growth of our overall market, or our failure, for any reason, to take advantage of growth opportunities. We have also encountered, and will continue to encounter, risks and uncertainties frequently experienced by growing companies in rapidly changing industries, such as the risks and uncertainties described below. If our assumptions regarding these risks and uncertainties and our future revenue growth are incorrect or change, or if we do not address these risks successfully, our operating and financial results could differ materially from our expectations, and our business objective.
company. We may not be able to completeachieve the operating expense reductions we are targeting to align with our initialrevenue growth assumptions. Our efforts to operate our business combination by September 25, 2022, in which case we would cease all operations except for the purpose of winding up and we would redeem our public shares and liquidate.
Our quarterly results, including revenue, expenses, consumer metrics and subject usother key metrics, are derived from transactions that occur during that quarter. Accordingly, our quarterly results have fluctuated and are likely to additional trading restrictions.
Other factors that may cause fluctuations in our quarterly results include:
•our ability to attract and retain clients and customers;
•transaction volume and mix;
•rates of repeat transaction and fluctuations in usage of our platform, including seasonality;
•the amount and timing of our expenses related to acquiring clients and customers and the maintenance and expansion of our business, operations and infrastructure;
•changes to our relationships with our clients;
•general economic, industry and market conditions;
-31-
•competitive dynamics in the industry in which we operate;
•the amount and timing of stock-based compensation expenses;
•network outages, cyberattacks, or other actual or perceived security incidents or breaches or data privacy violations;
•changes in laws and regulations that impact our business;
•the cost and outcomes of existing or potential claims or litigation; and
•the timing of expenses related to the development or acquisition of technologies or businesses and potential future charges for impairment of goodwill from acquired technologies or businesses.
If we are unable to attract, retain or grow our relationships with our existing clients, our business, financial condition, results of operations and future prospects would be materially and adversely affected. Moreover, sales efforts to large clients involve risks that may not be present or that are present to a lesser extent with respect to sales to smaller organizations.
For our platform to be successful, we must continue our existing partnerships, and successfully develop new, partnerships with clients. Our ability to retain and grow our relationships with our clients depends on the willingness of those clients to establish a commercial relationship with us. If clients with whom we develop partnerships fail to market or do not effectively market our platform to their customers, or customers fail to adopt our platform through these marketing efforts in such numbers as we have projected, our customer acquisition costs may increase and our business, financial condition and results of operations may be adversely affected.
Sales to large clients involve risks that may not be present or that are present to a lesser extent with sales to smaller organizations, such as longer sales cycles, more complex requirements and substantial upfront sales costs. For example, large clients may require considerable time to evaluate and test our platform prior to making a decision, or may request pricing models that may decrease our potential margins. Several factors influence the length and variability of our sales cycle, including the need to educate potential clients about the uses and benefits of our platform, the discretionary nature of purchasing and budget cycles, and the competitive nature of evaluation and purchasing approval processes. In order for our sales efforts to large organizations to be successful, we often must be able to engage with senior officers of the organization. As a result, the length of our sales cycle, from identification of the opportunity to deal closure, may vary significantly for each client, with sales to large enterprises typically taking longer to complete. If we fail to effectively manage the risks associated with sales cycles and sales to large clients, our business, financial condition and results of operations may be adversely affected.
Moreover, when we execute an agreement with a client, we are still dependent on that client to deploy our platform. Larger clients, in particular, often delay deployment for a lengthy period of time after executing an agreement. Even when clients begin their integration into our platform, they do so on a limited basis while frequently requiring that we provide implementation services, which may include customization and controls that limit the functionality of our platform, and negotiate pricing discounts, which increases our upfront investment in the sales effort with no guarantee that sales to these clients will justify our upfront investment, which can be substantial. If a client delays deployment for lengthy periods of time, our consumer and revenue growth may not achieve expectations and our business, financial condition and results of operations may be adversely affected.
Our agreements with our clients have terms that range from approximately one to three years, and in some cases, our existing clients can generally terminate these agreements without cause upon 30 to 90 days’ prior written notice. In addition, many of those agreements also provide for the right of the client to terminate the agreement, or for us to pay financial penalties, in the event that we breach certain service level agreements with respect to the operation of our platform. The termination of one or more of our agreements with a client would result in a reduction in a loss of transacting accounts, transaction volume and whether therevenue attributable to customers generated from that client relationship, and our business, financial condition, results of operations and future prospects would be materially and adversely affected.
-32-
Additionally, certain terms of our client agreements remain subject to further discussion and refinement before they can be implemented, including the transactionpotential products and services to bring to market. Our ability to realize the intended benefits of these partnerships will depend on our ability to finalize such agreements, for such products and services, and to do so on terms sufficiently favorable to us. While we continue to negotiate client agreement terms, we may be unable to agree to terms with such clients on commercially advantageous terms or at all, which may adversely affect our business and prospects.
Furthermore, our ability to retain existing, or obtain new, clients and customers may be impacted to the extent that clients choose not to partner with us, or customers choose not to transact or to engage in fewer transactions on our platform, in each case, because we do not currently offer or plan to cease offering certain crypto assets. For example, Bakkt has delisted a substantial majority of the crypto assets that had historically been available for trading on the Bakkt Crypto platform. The decision to delist those crypto assets has impacted, and may in the future further impact, our revenues as additional crypto assets are delisted and may impact the expected synergies and benefits from the Bakkt Crypto acquisition. If clients do not engage with us, or if customers choose not to transact or make fewer transactions on our platform, as a result of the decision to delist those crypto assets or our decision not to offer other crypto assets, our revenues will be adversely impacted.
Any of the foregoing could, among other things, adversely impact our stock price, make us less competitive compared to our peers and otherwise significantly adversely affect our business.
Some of our current and prospective clients require the approval of their own regulators in order to deploy our solutions, especially our crypto solutions, and if they are unable to obtain those approvals on a timely basis, or at all, our results of operations and future prospects would be materially and adversely affected.
Some of our current and prospective clients themselves are regulated entities that may be restricted from engaging with us. For instance, several banks to whom we seek to provide our crypto solutions are regulated by the Federal Reserve, the Office of the Comptroller of the Currency, and/or the Federal Deposit Insurance Corporation. Pursuant to statements made by these regulators in the last several months, banks they regulate are required to consult with, and potentially obtain the approval of, their relevant regulator before “engaging in crypto-related activities.” If these banks, or other current or prospective clients that are regulated entities, are unable to obtain the approval of their regulators, or the timing of such approvals is delayed, that failure or delay would materially and adversely affect our results of operations and future prospects.
We face substantial and increasingly intense competition worldwide in the industries in which we operate.
The crypto and loyalty and rewards industries are highly competitive, rapidly changing, highly innovative, and increasingly subject to regulatory scrutiny and oversight. Although we do not believe that we have any single direct competitor for the full range of products we provide through our platform, we compete against a wide range of businesses in the crypto and loyalty industries generally, including those that are larger than us, have greater name recognition, larger pools of deployable capital, longer operating histories, or a dominant or more secure position, or offer other products and services to customers that we do not offer, as well as smaller or younger companies that may be more agile in responding quickly to regulatory and technological changes. Many of the areas in which we compete evolve rapidly with changing and disruptive technologies, shifting consumer needs, and frequent introductions of new products and services. Competition also may intensify as businesses enter into business combinations and partnerships, and established companies in other segments expand to become competitive with different aspects of our business.
We compete primarily on the basis of the following:
•ability to attract, retain and engage clients (and in turn, customers) on our platform;
•ability to demonstrate to clients that they may achieve incremental revenue and attract new customers by using and offering our services to their customers;
•confidence in the safety, security, privacy and control of customer information on our platform;
-33-
•ability to develop products and services across multiple commerce channels, including crypto and loyalty points; and
•system reliability, regulatory compliance and data security.
We partner with many businesses and consider the ability to continue establishing these partnerships important to our business. Competition for relationships with these clients is intense and there can be no assurance that we will be able to continue to establish, grow, or maintain these client relationships.
Some of our current and potential competitors have larger customer bases, broader geographic scope, volume, scale, resources and market share than we do, which may provide them significant competitive advantages. Some competitors may also be subject to less burdensome licensing, anti-money laundering, counter-terrorist financing and other regulatory requirements. They may devote greater resources to the development, promotion and sale of products and services, and offer lower prices or more effectively offer their own innovative programs, products and services.
We also compete against a large number of decentralized and noncustodial platforms. On these platforms, customers can interact directly with a market-making smart contract or on-chain trading mechanism to exchange one type of crypto for another without any centralized intermediary. These platforms are typically not as easy to use as our platform, and some lack the speed and liquidity of centralized platforms, but various innovative models and incentives have been designed to bridge the gap. In addition, such platforms have low startup and entry costs as market entrants often remain unregulated and have minimal operating and regulatory costs. If the demand for decentralized platforms grows and we are unable to compete with these decentralized and noncustodial platforms, our business may be adversely affected.
If we are not able to differentiate our products and services from those of our competitors, drive value for our clients and customers, or effectively and efficiently align our resources with our goals and objectives, we may not be able to compete effectively in the market.
If our platform does not meet our service level commitments, our revenue and reputation may be negatively impacted.
We typically commit, through service level agreements or otherwise, requireto maintaining a minimum service levels with respect to our platform’s functionality, availability and response time. If we are unable to meet these commitments, we may be obligated to provide clients with remedies set forth below. A failure to meet service level commitments, even for a relatively short duration, could cause us to seek shareholder approval. Evenbe contractually obligated to issue credits or refunds to a large number of affected clients and customers, or could result in the dissatisfaction or loss of clients and customers. Affected participants could also choose to pursue other legal remedies that may be available to them.
In addition, we rely on public cloud providers, such as Microsoft Azure and Google Cloud, and any availability interruption in the public cloud could result in us not meeting our service-level commitments. In some cases, we may not have a contractual right with our public cloud providers that compensates us for any losses due to availability interruptions in the public cloud.
Any of the above circumstances or events may impact our revenues, harm our reputation, impair our ability to develop our platform and grow our base of clients and customers, subject us to financial penalties and liabilities under our service level agreements and otherwise harm our business, financial condition and results of operations.
We face operational, legal and other risks related to our reliance on third party vendors, over which we have no control.
We face operational risk because we rely on third party vendors to provide us with financial, technology and other services and to facilitate certain of our business activities, including, for example, marketing services, fulfillment services, cloud-based computer and data storage and other IT solutions and payment processing.
-34-
These third parties may be subject to financial, legal, regulatory and labor issues, cyberattacks, security incidents, privacy breaches, service terminations, disruptions or interruptions, or other problems, which may impose additional costs or requirements on us or prevent these third parties from providing services to us or our customers on our behalf, which could harm our business. Additionally, the Consumer Financial Protection Bureau (“CFPB”) and other regulators have issued guidance stating that institutions under their supervision may be held responsible for the actions of the companies with which they contract. Accordingly, we could be adversely impacted to the extent our vendors fail to comply with the legal requirements applicable to the particular products or services being offered.
In some cases, vendors are the sole source, or one of a limited number of sources, of the services they provide to us. For example, we are solely reliant on our agreement with our cloud computing web services provider for the provision of cloud infrastructure services to support our platform. Most of our vendor agreements are terminable by the vendor with little or no notice, and if our current vendors were to terminate their agreements with us or otherwise stop providing services to us on acceptable terms, we seek shareholder approval,may be unable to procure alternatives from other vendors in a timely and efficient manner and on acceptable terms, or at all. If any vendor fails to provide the services we require, fails to meet contractual requirements (including compliance with applicable laws and regulations), fails to maintain adequate data privacy controls and electronic security systems, or suffers a cyberattack or other security incident or breach, we could be subject to CFPB, Federal Trade Commission, SEC, and other regulatory enforcement actions, claims from third parties, including our customers, incur significant costs to resolve any issues or suffer economic and reputational harm, any of which could have an adverse effect on our business.
If we cannot keep pace with rapid technological developments to provide new and innovative products and services, the use of our products and services may not develop, and, consequently, our business would suffer.
Rapid, significant and disruptive technological changes impact the industries in which we operate, including developments in crypto (including distributed ledger and blockchain technologies). As a result, we expect new services and technologies to continue to emerge and evolve, and we cannot predict the effects of technological changes on our business. In addition to our own initiatives and innovations, we rely in part on third parties for the development of and access to new or evolving technologies. These third parties may restrict or prevent our access to, or utilization of, those technologies, as well as their platforms or products. In addition, we may not be able to accurately predict which technological developments or innovations will become widely adopted and how those technologies may be regulated. We expect that new services and technologies applicable to the industries in which we operate will continue to emerge and may be superior to, or render obsolete, the technologies we currently expectuse in our products and services. Developing and incorporating new technologies into our products and services may require substantial expenditures, take considerable time, and ultimately may not be successful. In addition, our ability to adopt new products and services and to develop new technologies may be inhibited by industry-wide standards, payments networks, changes to laws and regulations, resistance to change from clients or customers, third-party intellectual property rights, or other factors. Our success will depend on our ability to develop and incorporate new technologies and adapt to technological changes and evolving industry standards. If we are unable to do so in a timely or cost-effective manner, our business could be harmed.
A large percentage of our revenue is concentrated with a small number of clients; the loss of any such client would materially and adversely affect our business, financial condition, results of operations and future prospects. Moreover, because of our B2B2C go-to-market model, the loss of any client – regardless of the reason – increases the risk that the customers that originally emanated from that client will transition to another provider or stop doing business with us, which would harm our business.
The concentration of a significant portion of our business and transaction volume with a limited number of clients exposes us disproportionately to the risk of any of those clients choosing to no longer partner with us, to the economic performance of such clients or their respective industries or to any events, circumstances, or risks affecting such clients or their respective industries. Any such loss could make our platform less appealing to existing and potential customers. Accordingly, the loss of any significant client relationship could materially and adversely affect our business, results of operations, financial condition and future prospects.
-35-
Acquisitions, strategic investments, partnerships, or alliances may be difficult to identify. We may not realize the anticipated benefits of past or future investments, strategic transactions or acquisitions and integration of these acquisitions may pose integration challenges, divert the attention of management, disrupt our business, dilute stockholder value or otherwise adversely affect our business, financial condition and results of operations.
We have in the past and may in the future seek to acquire or invest in businesses, joint ventures, partnerships, alliances and platform technologies that we believe could complement or expand our platform, enhance our technology, or otherwise offer growth opportunities.
We may not realize the anticipated benefits of past or future investments, strategic transactions, or acquisitions, and these transactions involve numerous risks that are not within our control. These risks include the following, among others:
•difficulty in assimilating the operations, systems, and personnel of the acquired business;
•difficulty in effectively integrating the acquired technologies or products with our current products and technologies;
•difficulty in maintaining controls, procedures and policies during the transition and integration;
•disruption of our ongoing business and distraction of our management and employees from other opportunities and challenges due to integration issues;
•difficulty integrating the acquired business’s accounting, management information and other administrative systems;
•inability to retain key technical and managerial personnel of the acquired business;
•inability to retain key customers, vendors and other business clients of the acquired business;
•inability to achieve the financial and strategic goals for the acquired and combined businesses;
•incurring acquisition-related costs or amortization costs for acquired intangible assets that could impact our results of operations;
•regulatory changes that affect the value of the businesses we acquire or our plans for integration of those businesses, or that expose us to additional regulation or litigation in connection with the Proposed Transaction,acquired businesses;
•significant post-acquisition investments which may lower the holdersactual benefits realized through the acquisition;
•potential failure of the due diligence process to identify significant issues with product quality, legal, and financial liabilities among other things; and
•potential inability to assert that internal controls over financial reporting are effective.
In particular, the acquisition of Bakkt Crypto presents risks to our business, including because:
•our ability to retain the legacy clients of Bakkt Crypto, and expand those relationships, is a key growth driver for us;
•we are in the process of replacing and/or augmenting many of our founder shares will participate in the vote on such approval. Accordingly, existing systems and relationships (e.g., agreements with crypto liquidity providers) with those historically used by Bakkt Crypto;
•we may completeneed to be able to accommodate the significantly increased volume on our initial business combination, including platform;
•the Proposed Transaction, even if a majority of our public shareholders do not approvecompletion of the business combination we complete.
integration of the Bakkt Crypto business—which includes, among other things, merging legal entities, eliminating duplicative licenses, and adjusting the amount of regulatory capital associated therewith—remains subject to regulatory approval, the delay of which extends the timeline for our recognition of the full benefits of the transaction;•we may have increased liability and/or regulatory risk from the list of additional crypto assets on our platform and from the pre-acquisition activities of Bakkt Crypto, even after we elected to effectdelist certain of the investment decision regardingcrypto assets on the Bakkt Crypto platform; and
•the commercial relationship with Apex Clearing Corporation that is a potential business combination, includingpart of the Proposed Transaction, may be limited to the exerciseacquisition of your right to redeem your shares fromBakkt Crypto is a key growth driver for us, for cash.
Our failure to address these risks, or opportunity to vote on the business combination, unless we seek such shareholder vote, as we currently expect to doother problems encountered in connection with our past or future investments, strategic transactions, or acquisitions, could cause us to fail to realize the Proposed Transaction. Accordingly, your only opportunityanticipated benefits of these acquisitions or investments, cause us to effectincur unanticipated liabilities, and harm our business generally. Future acquisitions could also result in dilutive issuances of our equity securities, the investment decision regardingincurrence of debt, contingent liabilities, amortization expenses, incremental expenses or the write-off of goodwill, any of which could harm our initialfinancial condition or results of operations, and the trading price of our Class A Common Stock could decline. For example, under the purchase agreement for the acquisition of Bakkt Crypto, we agreed to issue cash consideration of $55.0 million, up to $45 million in shares of our Class A Common Stock depending on Bakkt Crypto's achievement of certain profitability targets for the fourth quarter of 2022, and up to an additional $100.0 million in shares of our Class A Common Stock depending on Bakkt Crypto's achievement of certain financial targets through 2025. Through March 8, 2024, we have delivered approximately $9.1 million of shares of Class A Common Stock in respect of such obligations under such purchase agreement.
We may require additional capital to support the growth of our business, combinationand such capital might not be available on acceptable terms, if at all.
We have funded our operations since inception primarily through equity financings and payments received from our platform. We cannot be certain when or if our operations will generate sufficient cash to fully fund our ongoing operations or the growth of our business. We intend to continue to make investments to support our business, which may require us to engage in equity or debt financings to secure additional funds. For example, in March 2024 we consummated concurrent registered direct offerings whereby we issued and sold an aggregate of 37,679,541 shares of our Class A Common Stock, warrants to purchase an aggregate of 48,898,110 shares of Class A Common Stock at an exercise price of $1.02 per share, and pre-funded warrants to purchase an aggregate of 11,218,570 shares of Class A Common Stock at an exercise price of $0.0001 per share for aggregate net proceeds of $39.7 million. We also agreed to seek stockholder approval to, among other things, issue to our majority stockholder, ICE, in a subsequent closing of the registered direct offering with ICE (the “ICE Offering”) an additional 8,772,016 shares of Class A Common Stock and warrants to purchase an aggregate of 8,772,016 shares of Class A Common Stock at an exercise price of $1.02 per share for aggregate gross proceeds of $7.6 million.
Additional financing may not be available on terms favorable to us, if at all. If adequate funds are not available on acceptable terms, we may be limitedunable to exercising your redemptioninvest in future growth opportunities, which could harm our business, financial condition, or results of operations. If we incur debt, the debt holders would have rights senior to holders of existing securities to make claims on our assets, and the terms of any debt could restrict our operations, including our ability to pay dividends on our Class A Common Stock. Furthermore, if we issue additional equity securities, stockholders will experience dilution, and the new equity securities could have rights senior to those of our existing securities. Our decision to issue securities in the future will depend on numerous considerations, including factors beyond our control, thus we cannot predict or estimate the amount, timing, or nature of any future issuances of debt or equity securities. As a result, our stockholders bear the risk of future issuances of debt or equity securities reducing the value of our securities and diluting their interests.
We may not complete the subsequent closing of the ICE Offering within the periodtime frame we anticipate or at all, which could have an adverse effect on our business, financial results, operations and/or the market price of time (which will be at least 20 business days) set forth in our tender offer documents mailed to our public shareholders in which we describe our initial business combination.Class A Common Stock.
In connection with the Proposed Transaction,ICE Offering, we agreed to seek stockholder approval to, among other things, issue an additional 8,772,016 shares of Class A Common Stock and warrants to purchase 8,772,016 shares of Class A Common Stock, which could result in aggregate gross proceeds to us of approximately $7.6 million (the “Subsequent ICE Closing”).
The consummation of the Subsequent ICE Closing is subject to certain closing conditions, a number of which are not within our initial shareholders and management teamcontrol, including stockholder approval of the securities issuable under the Subsequent ICE Closing. Although we have entered into a voting support agreement with ICE, pursuant to which ICE agreed, among other things, to vote in favor of such initial business combination, including the Proposed Transaction, regardless of how our public shareholders vote.