Section 409A of the Internal Revenue Code
Section 409A of the Code imposes additional significant taxes in the event that an executive officer, director or service provider receives “deferred compensation” that does not satisfy the requirements of Section 409A of the Code. Although we do not maintain a traditional nonqualified deferred compensation planopportunity for our
executive officers, Section 409A of the Code does applystockholders to
certain severance arrangements, bonus arrangements and equity awards, and we have structured all such arrangements and awards inreceive a
manner to either avoid or comply with the applicable requirements of Section 409A of the Code. For ournon-employee
directors, we provide aNon-Employee
Directors’ Deferred Compensation Program, which has been structured to comply with the applicable requirements of Section 409A of the Code.Accountingpremium for Stock-Based Compensation
We follow the Financial Accounting Standard Board’s Accounting Standards Codification Topic 718 (“”) for our stock-based compensation awards. FASB ASC Topic 718 requires us to measure the compensation expense for all share-based payment awards made to our employees andnon-employee
members of our board of directors, including options to purchasetheir shares of our common stock and
could also affect the price that some investors are willing to pay for our common stock.Our bylaws provide that the Court of Chancery of the State of Delaware is the exclusive forum for substantially all disputes between us and our stockholders, which could limit our stockholders’ ability to obtain a favorable judicial forum for disputes with us or our directors, officers or employees.
Our bylaws provide that the Court of Chancery of the State of Delaware is the exclusive forum for the following types of actions or proceedings under Delaware statutory or common law:
•any derivative action or proceeding brought on our behalf;
•any action asserting a breach of fiduciary duty owed by our directors, officers, employees or our stockholders;
•any action asserting a claim against us arising under the Delaware General Corporation Law; and
•any action asserting a claim against us that is governed by the internal-affairs doctrine (the “Delaware Forum Provision”).
The Delaware Forum Provision would not apply to suits brought to enforce a duty or liability created by the Exchange Act or any other claim under the Securities Act, for which the United States District Court for the Northern District of California has sole and exclusive jurisdiction (the “Federal Forum Provision”), as we are based in the State of California. In addition, our bylaws provide that any person or entity purchasing or otherwise acquiring any interest in shares of our capital stock is deemed to have notice of and consented to the Delaware Forum Provision and the Federal Forum Provision; provided, however, that stockholders cannot and will not be deemed to have waived our compliance with the U.S. federal securities laws and the rules and regulations thereunder.
The Delaware Forum Provision and the Federal Forum Provision may limit a stockholder’s ability to bring a claim in a judicial forum that it finds favorable for disputes with us or our directors, officers or employees, which may discourage lawsuits against us and our directors, officers and employees. If a court were to find the Delaware Forum Provision and the Federal Forum Provision in our bylaws to be inapplicable or unenforceable in an action, we may incur additional costs associated with resolving the dispute in other jurisdictions, which could seriously harm our business.
We do not expect to declare any dividends in the foreseeable future.
We have never paid dividends and we do not anticipate declaring any cash dividends to holders of our common stock in the foreseeable future. Consequently, investors may need to rely on sales of their common stock after price appreciation, which may never occur, as the only way to realize any future gains on their investment. Investors seeking cash dividends should not purchase our common stock.
General Risks
Our business is subject to the risks of pandemics, earthquakes, fire, floods and other natural catastrophic events, and to interruption by man-made problems such as power disruptions, computer viruses, data security breaches, terrorism or war.
Our business operations are subject to interruption by natural disasters, flooding, fire, power shortages, public health epidemics or pandemics, terrorism, political unrest, cyber-attacks, geopolitical instability, war, the effects of climate change and other events beyond our control. For example, our corporate headquarters are located in the San Francisco Bay Area, a region known for seismic activity. A significant natural disaster, such as an earthquake, fire or flood, occurring at our headquarters, at one of our other facilities or where a business partner is located could adversely affect our business, results of operations and financial condition. Further, if a natural disaster or man-made problem were to affect our service providers, this could adversely affect the ability of our customers to use our products and platform. Natural disasters, public health epidemics or pandemics, such as the COVID-19 pandemic, and geopolitical events, such as the war in Ukraine and conflict in the Middle East, could cause disruptions in our or our customers’ businesses, national economies or the world economy as a whole.
We also rely on our network and third-party infrastructure and enterprise applications and internal technology systems for our engineering, sales and marketing, and operations activities. Although we maintain incident management and disaster
response plans, in the event of a major disruption caused by a natural disaster or man-made problem, we may be unable to continue our operations and may endure system interruptions, reputational harm, delays in our development activities, lengthy interruptions in service, breaches of data security and loss of critical data, any of which could adversely affect our business, results of operations and financial condition.
In addition, computer malware, viruses and computer hacking, fraudulent use attempts and phishing attacks have become more prevalent in our industry, have occurred on our platform in the past and may occur on our platform in the future. Though it is difficult to determine what, if any, harm may directly result from any specific interruption or attack, any failure to maintain performance, reliability, security, integrity and availability of our products and technical infrastructure to the satisfaction of our customers may harm our reputation and our ability to retain existing customers and attract new customers. In addition, global climate change could result in certain types of natural disasters occurring more frequently or with more intense effects. Any such events may result in users being subject to service disruptions or outages, and we may not be able to recover our technical infrastructure in a timely manner to maintain or resume operations, which may adversely affect our financial results.
Our reputation and/or business could be negatively impacted by ESG matters and/or our reporting of such matters.
There is an increasing focus from regulators, certain investors, and other stakeholders concerning ESG matters, both in the United States and internationally. We communicate certain ESG-related initiatives, goals, and/or commitments regarding environmental matters, diversity, responsible sourcing and social investments, and other matters in our annual Impact and DEI Report, on our website, in our filings with the SEC, and elsewhere. These initiatives, goals, or commitments could be difficult to achieve and costly to implement. We could fail to achieve, or be perceived to fail to achieve, our ESG-related initiatives, goals, or commitments. In addition, we could be criticized for the timing, scope or nature of these initiatives, goals, or commitments, or for any revisions to them. To the extent that our required and voluntary disclosures about ESG matters increase, we could be criticized for the accuracy, adequacy, or completeness of such disclosures. Our actual or perceived failure to achieve our ESG-related initiatives, goals, or commitments could negatively impact our reputation, result in ESG-focused investors not purchasing and holding our stock, or otherwise materially harm our business.
Item 1B. Unresolved Staff Comments
None.
Item 1C. Cybersecurity
Our board of directors recognizes the critical importance of maintaining the trust and confidence of our customers, clients, business partners and employees. Our board of directors is actively involved in oversight of our risk management program, and cybersecurity represents an important component of our overall approach to enterprise risk management (“ERM”).
Risk Management and Strategy
We have policies, standards, processes and practices for assessing, identifying, and managing material risk from cybersecurity threats that are integrated into our ERM systems and processes. Our cross-functional approach to cybersecurity risk management is focused on preserving the confidentiality, integrity, and availability of our information systems by identifying, preventing and mitigating cybersecurity threats and effectively responding to cybersecurity incidents when they occur. As part of this approach, we have implemented controls and procedures that provide for the prompt escalation of certain cybersecurity incidents to enable timely decisions by management regarding the public disclosure and reporting of such incidents.
Our cybersecurity program is focused on the following key areas:
•Governance. As discussed in more detail under the heading “Governance” below, our board of directors’ oversight of cybersecurity risk is supported by our audit committee, which regularly interacts with our ERM function, our Chief Digital Officer (“CDO”), our Chief Information Security Officer (“CISO”), other members of management, and relevant committees and working groups, including management’s Enterprise Risk Committee (“ERC”), Cyber Incident Task Force (“CITF”), and Security Incident Response Team (“SIRT”), in its oversight of cybersecurity-related risk.
•Risk Assessment.We devote significant resources and designate high-level personnel, including our ERC, which includes our Chief Legal Officer (“CLO”), our CDO, our CISO, our Vice President of Internal Audit, and our Vice President of Ethics, Compliance and Risk Management, to manage the cybersecurity risk assessment and mitigation process. We conduct
security assessments both internally and with the assistance of third parties to identify cybersecurity threats periodically and to identify any potentially material changes in our business practices that may affect information systems that are vulnerable to such cybersecurity threats. These security assessments include identification of reasonably foreseeable internal and external risks, the likelihood and potential impact of such risks, and the sufficiency and effectiveness of existing policies, procedures, systems, and controls to manage such risks. Risk themes identified during our risk assessments guide annual cybersecurity planning activities and investments to improve security coverage, technology capabilities and processes.
•Technical Safeguards. We deploy, maintain, and regularly monitor the effectiveness of technical safeguards that are designed to protect our information systems from cybersecurity threats. We align our security program to recognized frameworks and industry standards. We make investments in core security capabilities, including awareness and training, identity and access, incident response, product security, cloud security, enterprise security, risk management, and supply chain risk, in order to enable us to better identify, protect, detect, respond to, and recover from evolving security threats. Our technical safeguards include firewalls, intrusion prevention and detection systems, anti-malware functionality and access controls, which are evaluated and improved through internal and external security assessments and cybersecurity threat intelligence. We regularly assess our safeguards through internal testing by our assurance teams. We also leverage external third-party testing (e.g., penetration testing, attack surface mapping, and security maturity assessments) and seek third-party certifications (e.g., SOC2, ISO, and PCI DSS). Following our risk assessments, we evaluate whether and/or how to re-design and/or enhance our safeguards to reasonably address any identified risks or gaps.
•Incident Response and Recovery Planning. We have established comprehensive incident response and recovery plans that address the full lifecycle of our response to a cybersecurity incident. These plans are periodically tested and evaluated.
•Third-Party Risk Management. We maintain a comprehensive, risk-based approach to identifying and overseeing cybersecurity risks presented by third parties, including vendors, service providers and other external users of our systems, as well as the systems of third parties that could adversely impact our business in the event of a cybersecurity incident affecting those third-party systems. We perform due diligence on vendors, service providers and other third-party users of our systems at initial onboarding and periodically thereafter. We require that third-party service providers have the ability to implement and maintain reasonable and appropriate security measures, consistent with applicable laws, in connection with their work with us, and to promptly report any actual or suspected breach of their security measures that may affect our company.
•Security Awareness and Training. Our security awareness program requires that employees and certain contractors complete comprehensive security training upon joining the company and annually thereafter. The training covers critical security topics to ensure our workforce stays informed about top-of-mind security areas, such as phishing. The training helps ensure that our personnel have the knowledge and skills required to protect our digital assets and critical data. In addition, we conduct awareness campaigns on cybersecurity threats as a means to equip our personnel with effective tools to address such threats and to communicate our evolving information security policies, standards, processes and practices.
We engage in the periodic assessment and testing of our cybersecurity policies, standards, processes and practices, including through audits, assessments, tabletop exercises, threat modeling, vulnerability testing and other exercises focused on evaluating the effectiveness of our cybersecurity measures and planning. To assist with such assessment and testing, we engage assessors, consultants, auditors, and other third parties to perform assessments on our cybersecurity measures, including for third-party testing and certifications (as described above under “Technical Safeguards”), information security maturity assessments, customer audits, and independent reviews of our information security control environment and operating effectiveness. The material results of such assessments, audits and reviews are reported to our audit committee, and we adjust our cybersecurity policies, standards, processes and practices as necessary based on the information provided.
To date, cybersecurity threats, including as a result of any previous cybersecurity incidents, have not materially affected our company, including our business strategy, results of operations, or financial condition. For additional information regarding whether any risks from cybersecurity threats, including as a result of any previous cybersecurity incidents, are reasonably likely to materially affect our company in the future, including our business strategy, results of operations, or financial condition, see Part I, Item 1A, “Risk Factors” in this Annual Report on Form 10-K.
Governance
Our board of directors, in coordination with our audit committee, oversees our ERM process, including the management of cybersecurity risks, and is responsible for monitoring and assessing strategic risk exposure. Our management team and its committees, including our ERC, our CITF, our SIRT, and our core information security operational teams, in partnership with our engineering teams, are responsible for the day-to-day management and mitigation of the material cybersecurity risks we face.
Our board of directors administers its cybersecurity risk oversight function through our audit committee. Our audit committee receives regular presentations and reports on cybersecurity risks, which address a wide range of topics including recent developments, evolving standards, vulnerability assessments, third-party and independent reviews, the threat environment, technological trends and information security considerations arising with respect to our peers and third parties, and risks relating to cybersecurity incidents. Our board of directors receives quarterly updates from our audit committee on ERM and cybersecurity risks.
Our ERC, comprised of our CLO, our CDO, our CISO, our Vice President of Internal Audit, and our Vice President of Ethics, Compliance and Risk Management, among others, oversees our ERM activities, including cybersecurity-related risks. Our CDO and our CISO (who reports to our CDO) are primarily responsible for the assessment and management of our material risks from cybersecurity threats, working collaboratively and cross-functionally to design and implement our cybersecurity policies and processes, including those described in “Risk Management and Strategy” above, and for responding to any cybersecurity incidents. In addition, our CITF (which includes our CDO, our CISO, our CLO, and our Chief Financial Officer (“CFO”)) is primarily responsible for evaluating cybersecurity incidents, gathering and assessing facts relevant to applicable regulatory reporting and disclosure obligations, making recommendations to our Chief Executive Officer and CFO regarding such disclosure, and advising our board of directors and audit committee on the effectiveness of policies and procedures related to the disclosure of cybersecurity incidents.
To facilitate our cybersecurity risk management program, multidisciplinary teams throughout our company are deployed to address cybersecurity threats and to respond to cybersecurity incidents. Through ongoing communications with these teams, our CDO, our CISO, and the SIRT monitor the detection, mitigation and remediation of cybersecurity threats and incidents in real time, and report such threats and incidents to the CITF when appropriate.
Our CDO has over 25 years of experience at technology companies and has been in the security space for over 18 years, including serving as chief security officer at a public company and leading security engineering at another public company. Our CDO also serves on the board of directors of a publicly traded cybersecurity company. Our CDO holds an undergraduate degree in electronics engineering and a graduate degree in business administration and management. Our CISO has over 18 years of experience managing cybersecurity risks in the technology industry, including serving as the acting chief security officer at a public company and holding other senior cybersecurity leadership and operational roles at other companies. Our CISO holds an undergraduate degree in computer engineering and graduate degrees in electrical engineering and business administration. Our CFO, CLO, VP of Internal Audit, and VP of Ethics, Compliance and Risk Management each hold undergraduate and/or graduate degrees in their respective fields, and have over 10 years of experience managing risks at the Company and at similar companies, including risks arising from cybersecurity threats.
Item 2. Properties
We lease all of our facilities and do not own any real property. Our headquarters, which serves as our principal offices for our business segments, is located in San Francisco, California, where we actively occupy 83,372 square feet of office space at 101 Spear Street. In 2022, we announced our decision to become a remote-first company allowing our employees the flexibility to work remotely on a permanent basis. As a result of this decision, we permanently closed several of our offices, including a portion of our headquarters space. The financial impact on our results of operations from closing these offices is described in Note 6 and Note 10 to our consolidated financial statements included elsewhere in this Annual Report on Form 10-K.
We lease additional office space in various other locations in South America, Europe and Asia. This includes our international headquarters in Dublin, Ireland, and regional offices used for business operations, sales, support, and product development for our business segments. Additional information regarding our lease commitments is available in Note 10 to our consolidated financial statements included elsewhere in this Annual Report on Form 10-K.
We believe that our remaining facilities are adequate and suitable for our current needs and that, should it be needed, suitable additional or alternative space will be available to accommodate our operations.
Item 3. Legal Proceedings
Refer to Note 17(b) to our consolidated financial statements included elsewhere in this Annual Report on Form 10-K for a description of our current material legal proceedings.
Item 4. Mine Safety Disclosures
Not applicable.
PART II
Item 5. Market for Registrant's Common Equity, Related Stockholder Matters and Issuer Purchases of Equity Securities
Market Information for Common Stock
Our Class A common stock (“common stock”) is traded on the New York Stock Exchange under the symbol “TWLO.” Our Class B common stock is neither listed nor traded, and no Class B common stock is currently issued or outstanding.
Holders of Record
As of January 31, 2024, we had 251 holders of record of our Class A common stock. There are no holders of record of our Class B common stock. The actual number of stockholders is greater than this number of holders of record and includes stockholders who are beneficial owners but whose shares are held in street name by brokers and other nominees.
Dividend Policy
We have never declared or paid any cash dividends on our capital stock. We intend to retain any future earnings and do not expect to pay any dividends in the foreseeable future.
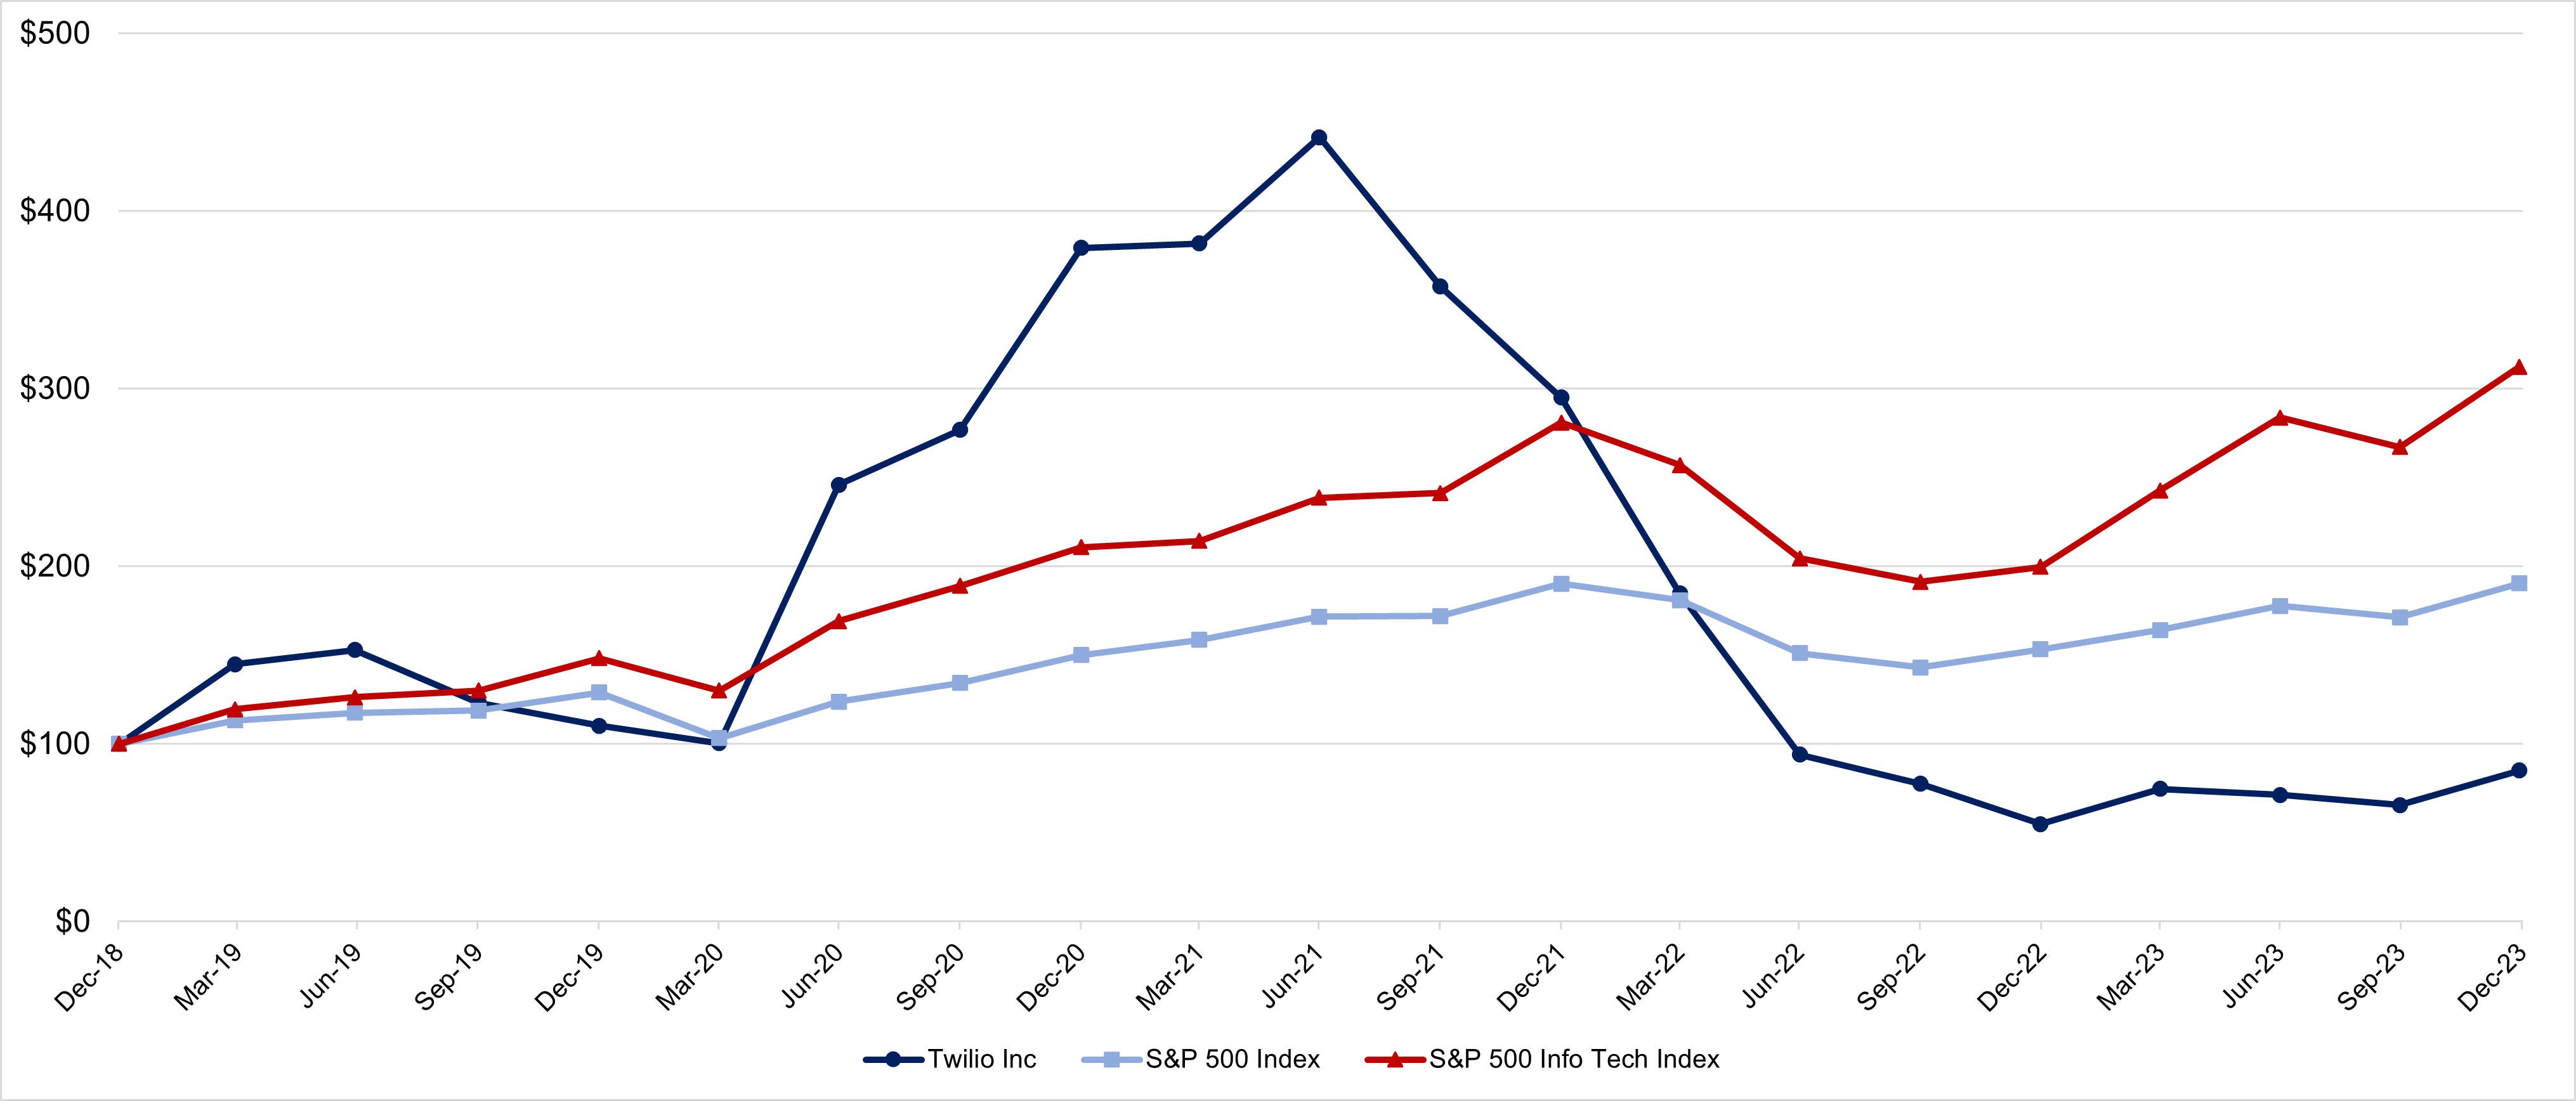
Stock Performance Graph
This performance graph shall not be deemed "soliciting material" or to be "filed" with the SEC for purposes of Section 18 of the Securities Exchange Act of 1934, as amended (the “Exchange Act”), or otherwise subject to the liabilities under that Section, and shall not be deemed to be incorporated by reference into any filing of Twilio Inc. under the Securities Act of 1933, as amended (the “Securities Act”), or the Exchange Act.
We have presented below the cumulative five-year total return to our stockholders in comparison to the S&P 500 Index and S&P 500 Information Technology Index. An investment of $100 (with reinvestment of all dividends) is assumed to have been made in our common stock and in each respective index at the market closing price on the last trading day for the fiscal year ended December 31, 2018, and its relative performance is tracked through the last trading day for the fiscal year ended December 31, 2023. The comparisons are based on historical data and are not indicative of, nor intended to forecast, the future performance of our common stock.
Sales of Unregistered Securities
During the year ended December 31, 2023, we issued 88,408 shares of our unregistered common stock to an independent donor advised fund to further our Twilio.org philanthropic goals. The shares were “restricted securities” for purposes of Rule 144 under the Securities Act, and had an aggregate fair market value on the date of donation of $5.3 million. The foregoing transaction did not involve any underwriters, any underwriting discounts or commissions, or any public offering. We believe the offer, sale and issuance of the above shares were exempt from registration under the Securities Act by virtue of Section 4(a)(2) of the Securities Act because the issuance of the shares did not involve a public offering.
Issuer Purchases of Equity Securities
The following table summarizes the share repurchase activity for the three months ended December 31, 2023:
| | | | | | | | | | | | | | | | | | | | | | | | | | | | | | | |
| | | | | | | | | | | | | |
| | Total Number of Shares Purchased(1) | | Average Price Paid Per Share(2) | | | | Total Number of Shares Purchased as Part of Publicly Announced Plans or Programs(1) | | Approximate Dollar Value of Shares that May Yet Be Purchased Under the Plans or Programs(1) | | |
| | (In thousands) | | | | | | (In thousands) | | (In millions) | | | |
| October 1 - 31, 2023 | | 943 | | | $ | 53.42 | | | | | 943 | | | $ | 399 | | | | |
| November 1 - 30, 2023 | | 758 | | | $ | 54.16 | | | | | 758 | | | $ | 358 | | | | |
| December 1 - 31, 2023 | | 415 | | | $ | 72.75 | | | | | 415 | | | $ | 328 | | | | |
| | 2,116 | | | | | | | 2,116 | | | | | | |
_____________________________
(1) In February 2023, our board of directors authorized a share repurchase program to repurchase up to $1.0 billion in aggregate value of our Class A common stock. Repurchases under the program can be made through open market transactions, privately negotiated transactions and other means in compliance with applicable federal securities laws, including through Rule 10b5-1 plans. We have discretion in determining the conditions under which shares may be repurchased from time to time. The program expires on December 31, 2024. Refer to Note 18 — Stockholders' Equity in Part II, Item 8, of this Annual Report on Form 10-K for additional information related to share repurchases.
(2) Average price paid per share includes costs associated with the repurchases.
Item 6. [Reserved]
Item 7. Management’s Discussion and Analysis of Financial Condition and Results of Operations
The following discussion and analysis of our financial condition and results of operations should be read in conjunction with our consolidated financial statements and related notes appearing elsewhere in this Annual Report on Form 10-K. In addition to historical financial information, the following discussion contains forward-looking statements that are based upon current plans, expectations and beliefs that involve risks and uncertainties. Our actual results may differ materially from those anticipated in these forward-looking statements as a result of various factors, including those set forth under Part I, Item 1A, “Risk Factors” in this Annual Report on Form 10-K.
Overview
We enable businesses of all sizes to revolutionize how they engage with their customers by delivering seamless, trusted and personalized customer experiences at scale. Our leading customer engagement platform comprises communications APIs that enable developers to embed numerous forms of messaging, voice, and email interactions into their customer-facing applications, as well as software products that target specific engagement needs, including our customer data platform, digital engagement centers, marketing campaigns and advanced account security solutions. This combination of flexible APIs and software solutions helps businesses of all sizes and across numerous industries to benefit from smarter and more streamlined engagement at every step of the customer journey, including reduced customer acquisition costs, lasting loyalty and increased customer value. Our platform, which combines our highly customizable communications APIs with customer data management capabilities, allows businesses to break down data silos and build a comprehensive single source for their customer data that is organized into unique profiles that are easily accessible by all their business teams. Empowered with this information and the insights it enables, businesses using our platform can provide robust, personalized and effective communications to their customers at every stage of their customer relationships. The value proposition of our offerings has become stronger and our
products have become more strategic to our customers as more and more businesses have prioritized building more personalized and more differentiated customer engagement experiences through digital channels.
In February 2023, we began operating our business in two business units: Communications and Data & Applications, which has since been renamed Segment. Our Communications business consists of a variety of APIs and software solutions to optimize communications between our customers and their end users. Our key Communications offerings include Messaging, Voice, Email, Flex, Marketing Campaigns, and User Identity and Authentication. Our Segment business consists of software products that enable businesses to leverage their first-party data to create unique customer profiles and achieve more effective customer engagement. Our key Segment offerings are Segment and Engage. Together, our Communications and Segment products power our customer engagement platform. We believe that our two business units are complementary and address adjacent needs and related problems for our customers. Our goal is to create a flywheel for effective customer engagement by combining Segment’s user profiles with our rich Communications data to drive more personalized and intelligent customer interactions. We believe that our business unit structure enables each business unit to execute toward its respective goals with appropriate focus and independence, best positioning us to achieve our long-term plan of creating the leading customer engagement platform.
For a comprehensive overview of our business, our platform and our products refer to Part I, Item 1, “Business,” included elsewhere in this Annual Report on Form 10-K.
In the years ended December 31, 2023, 2022, and 2021, our revenue was $4.2 billion, $3.8 billion and $2.8 billion, respectively, and our net loss was $1.0 billion, $1.3 billion and $949.9 million, respectively. In the years ended December 31, 2023, 2022, and 2021, our 10 largest Active Customer Accounts generated an aggregate of 10%, 12% and 11% of our total revenue, respectively.
Recent Developments
Business Unit Reorganization. In February 2023, we began operating our business in two business units: Twilio Communications (“Communications”) and Twilio Data & Applications (“Data & Applications”). We determined that as of the end of the second quarter of 2023 we had two operating and reportable segments, Communications and Data & Applications, and that our segment measure of profitability was non-GAAP gross profit.
In the fourth quarter of 2023, we further modified the organization of our business units by moving our Flex and Marketing Campaigns products from the Data & Applications reportable segment into the Communications reportable segment. We also renamed our Data & Applications segment to Segment. The fourth quarter reorganization did not change our reportable segment structure; however, it changed the reporting unit structure within our operating segments. Reporting units are the level below the operating segment level at which we allocate and test goodwill. As a result of these changes, we reallocated goodwill to the newly formed reporting units after each reorganization. We were required to test goodwill for impairment immediately before and immediately after each time our reporting unit structure changed. In the second quarter of 2023, we performed a goodwill impairment assessment immediately before and immediately after the reorganization and the change in the reporting unit structure and concluded that goodwill was not impaired.
Prior to testing goodwill in the fourth quarter of 2023, we identified a change in Segment’s performance, which indicated that certain intangible assets in our Segment reportable segment may not be recoverable. We performed an impairment assessment, as required by the accounting guidance, and recorded a $285.7 million aggregate impairment loss related to Segment’s developed technology and customer relationship intangible assets. We engaged an external expert to assist us with the valuation analysis. The loss is recorded in the impairment of long-lived assets line item of our consolidated financial statements for the year ended December 31, 2023, included elsewhere in this Annual Report on Form 10-K.
After the impairment loss was recorded in the fourth quarter of 2023, we performed a goodwill impairment assessment and concluded that goodwill was not impaired immediately before and immediately after the reorganization and the change in the reporting unit structure.
Further, in January 2024, our newly appointed Chief Executive Officer (“CEO”), who is also our Chief Operating Decision Maker (“CODM”), began reviewing segment operating results using non-GAAP income from operations as the segment measure of profitability. As such, we have disclosed our segment related information to reflect management’s current view of the business.
Refer to Note 6, Note 8 and Note 12 to our consolidated financial statements included elsewhere in this Annual Report on Form 10-K for additional information on the restructuring, impairment and segment reporting.
Share Repurchase Program. In February 2023, our board of directors authorized a share repurchase program pursuant to which we may repurchase up to $1.0 billion in aggregate value of our common stock until the program expires on December 31, 2024. Repurchases under this program can be made through open market, private transactions or other means in compliance with applicable federal securities laws and could include repurchases pursuant to Rule 10b5-1 trading plans. We have discretion in determining the conditions under which shares may be repurchased from time to time.
In the year ended December 31, 2023, we repurchased $672.1 million in aggregate value, or 11.3 million shares, of our common stock under this program. As of December 31, 2023, approximately $327.9 million of the originally authorized amount remained available for future repurchases.
Workforce Reduction Plans. In February 2023, we announced a workforce restructuring plan (the “February 2023 Plan”) to eliminate approximately 17% of our workforce. The execution of the February 2023 Plan was substantially completed in the first quarter of 2023. In December 2023, we announced another restructuring plan (the “December 2023 Plan”) to further eliminate approximately 5% of our workforce. In the year ended December 31, 2023, the cumulative restructuring expenses incurred under the February 2023 Plan and December 2023 Plan were $165.7 million and were related to employee severance, benefits, vesting of equity awards and facilitation costs. The estimated remaining expenses related to both plans are not expected to be significant. For additional details refer to Note 7 to our consolidated financial statements included elsewhere in this Annual Report on Form 10-K.
Sabbatical Program. In February 2023, we announced that we will be sunsetting our employee sabbatical program that we introduced effective July 1, 2022. The sabbatical program was intended to provide our tenured employees with a paid leave of four consecutive weeks after every three years of service. Employees who had accumulated more than three years of service as of the program’s effective date became eligible for their benefit immediately. As of December 31, 2023, the remaining liability of $5.5 million related to the accumulated benefits for employees who remain eligible under this program until its expiration. As of December 31, 2022, the accrued sabbatical liability was $30.7 million.
Remote-First Company. In 2022, we announced our decision to become a remote-first company, allowing our employees the flexibility to work remotely on a permanent basis. As part of our new operating strategy, we permanently closed several of our offices in 2022 and 2023. These office closures resulted in an impairment of several long-lived assets, including our operating lease assets, leasehold improvements and property and equipment. In the year ended December 31, 2023, we recorded a total impairment loss of $34.8 million related to our permanent office closures.
Impairment of Strategic Investment. In the first quarter of 2023, we recorded a $46.2 million impairment loss associated with one of our investments from 2021 to reduce its carrying amount to fair value.
Divestiture of IoT Assets. In the second quarter of 2023, we completed the sale of our IoT asset group for a stock consideration of $15.8 million. The loss on divestiture and related expenses recorded in the year ended December 31, 2023 were not significant.
Divestiture of ValueFirst Business. In the third quarter of 2023, we completed the sale of our ValueFirst business for a total cash sales price of $45.5 million, or $38.2 million in proceeds, net of cash divested. In the year ended December 31, 2023, we recorded a $28.8 million loss on divestiture and an additional $3.3 million in related expenses. For additional details refer to Note 5 to our consolidated financial statements included elsewhere in this Annual Report on Form 10-K.
Factors Affecting Our Results of Operations
We are focused on profitable growth. To increase revenue and grow market share, we intend to further enhance our ISV relationships, improve our self-service capabilities, cross-sell our products, drive product innovation, expand internationally, and enhance Segment interoperability. We also intend to optimize our business and take measures to reduce costs, including simplifying our business processes, modernizing our infrastructure, focusing on self-service, leveraging AI, and implementing other initiatives targeted at improving efficiencies in our business. We are also conducting an operational review of our Segment business, which we expect to complete in March 2024.
Our revenue is primarily derived from usage-based fees, which can lead to variability in our results of operations and at times create differences between our forecasts and actual results. Our usage-based revenue is also more immediately impacted by changes in consumer spending and macroeconomic conditions than our subscription-based revenue.
Our gross margin is impacted by a number of factors, including the timing and extent of our investments in our operations; our product mix; our ability to manage our cloud infrastructure‑related and network service provider fees, including
A2P SMS fees; the mix of U.S. revenue compared to international revenue; changes in foreign exchange rates; the timing of amortization of capitalized software development costs and acquired intangibles; and the extent to which we periodically choose to adjust prices of our products.
Our gross profit is impacted by our product mix. Our cost of revenue and gross profit are also impacted by changes in hosting fees and network service providers’ fees and our ability to pass these costs through to our customers. We also experience seasonal trends due to increased consumer activity in the fourth quarter, which may result in lower sequential revenue in the first quarter.
We are winding down our video product and the software component of our Zipwhip business in 2024, which we expect will negatively impact revenue growth rates in 2024.
We are also migrating part of Segment’s architecture to a new infrastructure provider in 2024, which we expect to allow us to recognize greater operational efficiency and scale up new AI-driven products and features. We expect this migration will take several quarters and result in overlapping expenses with our original and new vendors for much of 2024, which we expect to negatively impact Segment gross margins until we complete the migration.
We expect our recent workforce restructurings and recent office closures will reduce our operating expenses. We are also modifying our employee compensation program by introducing a new cash bonus program and reducing or eliminating our use of equity compensation for certain employees, which will primarily impact our expenses commencing in the first quarter of 2024.
Key Business Metrics
We review a number of operational and financial metrics, including Active Customer Accounts and Dollar-Based Net Expansion Rate, to evaluate our business, measure our performance, identify trends affecting our business, formulate business plans and make strategic decisions.
The following table summarizes our year-over-year revenue growth and Dollar-Based Net Expansion Rate for the years ended December 31, 2023, 2022 and 2021, and the number of Active Customer Accounts as of December 31, 2023, 2022 and 2021.
| | | | | | | | | | | | | | | | | | | | | | |
| | Year Ended | | |
| | December 31, | | |
| | 2023 | | 2022 | | 2021 | | |
| Active Customer Accounts | | 305,000 | | | 290,000 | | | 256,000 | | | |
| Total Revenue (in thousands) | | $ | 4,153,945 | | | $ | 3,826,321 | | | $ | 2,841,839 | | | |
| Total Revenue Growth Rate | | 9 | % | | 35 | % | | 61 | % | | |
| Dollar-Based Net Expansion Rate | | 103 | % | | 121 | % | | 131 | % | | |
|
|
Active Customer Accounts
We define an Active Customer Account at the end of any period as an individual account, as identified by a unique account identifier, for which we have recognized at least $5 of revenue in the last month of the period. A single organization may constitute multiple unique Active Customer Accounts if it has multiple account identifiers, each of which is treated as a separate Active Customer Account. Active Customer Accounts excludes customer accounts from Zipwhip, Inc. (“Zipwhip”). Communications Active Customer Accounts and Segment Active Customer Accounts are calculated using the same methodology, but using only revenue recognized from accounts in the respective segment. When presented in this Annual Report on Form 10-K, (i) the number of Active Customer Accounts is rounded down to the nearest thousand, (ii) the number of Communications Active Customer Accounts is rounded down to the nearest thousand, and (iii) the number of Segment Active Customer Accounts is rounded down to the nearest hundred.
We believe that the number of Active Customer Accounts, on an aggregate basis and at the segment level, is an important indicator of the growth of our business, the market acceptance of our platform and future revenue trends. We believe that use of our platform by customers at or above the $5 per month threshold is a stronger indicator of potential future engagement than trial usage of our platform or usage at levels below $5 per month. In the three years ended December 31, 2023, 2022 and 2021, revenue from Active Customer Accounts represented over 99% of total revenue in each period.
Dollar‑Based Net Expansion Rate
Our Dollar-Based Net Expansion Rate compares the total revenue from all Active Customer Accounts and customer accounts from Zipwhip in a quarter to the same quarter in the prior year. To calculate the Dollar-Based Net Expansion Rate, we first identify the cohort of Active Customer Accounts and customer accounts from Zipwhip that were Active Customer Accounts or customer accounts from Zipwhip in the same quarter of the prior year. The Dollar-Based Net Expansion Rate is the quotient obtained by dividing the revenue generated from that cohort in a quarter, by the revenue generated from that same cohort in the corresponding quarter in the prior year. When we calculate Dollar-Based Net Expansion Rate for periods longer than one quarter, we use the average of the applicable quarterly Dollar-Based Net Expansion Rates for each of the quarters in such period. Revenue from acquisitions does not impact the Dollar-Based Net Expansion Rate calculation until the quarter following the one-year anniversary of the applicable acquisition, unless the acquisition closing date is the first day of a quarter. As a result, for the year ended December 31, 2023, our Dollar-Based Net Expansion Rate excludes the contributions from acquisitions made after October 1, 2022. Revenue from divestitures does not impact the Dollar-Based Net Expansion Rate calculation beginning in the quarter the divestiture closed, unless the divestiture closing date is the last day of a quarter. As a result, for the year ended December 31, 2023, our Dollar-Based Net Expansion Rate excludes the contributions from divestitures made after December 31, 2022. Communications Dollar-Based Net Expansion Rate and Segment Dollar-Based Net Expansion Rate are calculated using the same methodology, but using only revenue attributable to the respective segment and Active Customer Accounts and customer accounts from Zipwhip for that respective segment.
We believe that measuring Dollar-Based Net Expansion Rate, on an aggregate basis and at the segment level, provides an important indication of the performance of our efforts to increase revenue from existing customers. Our ability to drive growth and generate incremental revenue depends, in part, on our ability to maintain and grow our relationships with existing Active Customer Accounts and to increase their use of the platform. An important way in which we have historically tracked performance in this area is by measuring the Dollar-Based Net Expansion Rate for Active Customer Accounts. Our Dollar-Based Net Expansion Rate increases when such Active Customer Accounts increase their usage of a product, extend their usage of a product to new applications or adopt a new product. Our Dollar-Based Net Expansion Rate decreases when such Active Customer Accounts cease or reduce their usage of a product or when we lower usage prices on a product. As our customers grow their businesses and extend the use of our platform, they sometimes create multiple customer accounts with us for operational or other reasons. As such, when we identify a significant customer organization (defined as a single customer organization generating more than 1% of revenue in a quarterly reporting period) that has created a new Active Customer Account, this new Active Customer Account is tied to, and revenue from this new Active Customer Account is included with, the original Active Customer Account for the purposes of calculating this metric.
Key Components of Statements of Operations
Revenue
Revenue. We recognize revenue from our products on either a usage basis or a subscription basis, depending on the nature of the product and the type of customer contract. Our reportable segments contain products that may follow either revenue recognition model.
The majority of our Communications segment revenue is derived from usage-based fees. The usage-based fees are earned when customers access our cloud-based platform and start using the products. Some examples of our usage-based products are Messaging and Voice. For Messaging products, we primarily charge fees related to the number of text messages sent or received. For Voice products, we primarily charge fees for minutes of call duration. Some examples of the subscription-based Communications products are Email, Marketing Campaigns and Flex. For these products we recognize revenue evenly over the contract term.
Our Segment segment revenue is derived from Segment and Engage products that are subscription-based. For these products we recognize revenue evenly over the contract term. When our usage-based products are embedded into our subscription-based products, we charge for each product separately on a usage or subscription basis, respectively, and record the revenue in the reportable segment in which each product resides.
Most of our usage-based customers gain access to our products and solutions through our e-commerce self-service sign-up format, which requires an upfront prepayment via credit card that is drawn down as they use our products. Pricing is generally based on a publicly available, self-serve pricing matrix that generally allows customers to receive tiered discounts as their usage of our products increases. Many of our larger usage-based customers enter into contractual arrangements with us for a period of at least 12 months. These contracts may include negotiated terms and typically include minimum revenue commitments of varying durations. Usage-based customers subject to such contracts are typically invoiced monthly in arrears for products used. In the years ended December 31, 2023, 2022 and 2021, we generated 71%, 73% and 72% of our revenue, respectively, from usage-based fees.
Subscription-based fees are earned in accordance with subscription pricing terms. For our subscription-based products, customers generally enter into negotiated contracts, which are typically one to three years in duration. Subscription customers are generally invoiced in advance at the start of the contract term. In the years ended December 31, 2023, 2022 and 2021, we generated 29%, 27% and 28% of our revenue, respectively, from non-usage‑based fees.
Amounts that have been charged via credit card or invoiced are recorded in revenue, deferred revenue or customer deposits, depending on whether the revenue recognition criteria have been met. Our deferred revenue and customer deposits liability balance is not a meaningful indicator of our future revenue at any point in time because the number of contracts with our invoiced customers that contain terms requiring any form of prepayment is not significant.
We define U.S. revenue as revenue from customers with IP addresses or mailing addresses at the time of registration in the United States. We define international revenue as revenue from customers with IP addresses or mailing addresses at the time of registration outside of the United States.
Cost of Revenue and Gross Profit
Cost of Revenue. Cost of revenue consists primarily of fees paid to network service providers. Cost of revenue also includes cloud infrastructure fees, direct costs of personnel, such as salaries and stock‑based compensation for our customer support employees, and other non‑personnel costs, such as depreciation and amortization expense related to data centers and hosting equipment, and amortization of capitalized internal-use software development costs and acquired intangible assets. Costs of revenue are generally directly attributable to each segment. Certain costs of revenue are allocated to segments based on methodologies that best reflect the patterns of consumptions of these costs.
Our arrangements with network service providers require us to pay fees based on the volume of phone calls initiated or text messages sent, as well as the number of telephone numbers acquired by us to service our customers. Our arrangements with our cloud infrastructure providers require us to pay fees based on our server capacity consumption.
Gross Profit. Gross profit represents revenue less cost of revenue.
Operating Expenses
The most significant components of operating expenses are personnel costs, which consist of salaries, benefits, sales commissions and bonuses and stock‑based compensation. We also incur other non‑personnel costs related to our general overhead expenses.
Research and Development. Research and development expenses consist primarily of personnel costs, outsourced engineering services, cloud infrastructure fees for staging and development of our products, depreciation, amortization of capitalized internal-use software development costs and an allocation of our general overhead expenses. We capitalize the portion of our software development costs that meets the criteria for capitalization. Research and development expenses are generally directly attributable to each segment. Certain research and development expenses are allocated to segments based on methodologies that best reflect the patterns of consumptions of these costs. A small percentage of research and development costs, such as costs related to digital architecture and information security, are not allocated to segments because they support company-wide processes and are managed on a company-wide level.
We are focusing our research and development investment in the highest impact product areas for our future. We are investing strategically in alignment with our focus on building a trusted, leading customer engagement platform.
Sales and Marketing. Sales and marketing expenses consist primarily of personnel costs, including commissions and bonuses to our sales employees. Sales and marketing expenses also include expenditures related to advertising, marketing, brand awareness activities, costs related to our SIGNAL customer and developer conferences, credit card processing fees, professional services fees, depreciation, amortization of acquired intangible assets and an allocation of our general overhead expenses. Sales and marketing expenses are generally directly attributable to each segment. Certain sales and marketing expenses are allocated to segments based on methodologies that best reflect the patterns of consumptions of these costs. A small percentage of sales and marketing costs, such as costs related to corporate communications and global brand awareness, are not allocated to segments because they support company-wide processes and are managed on a company-wide level.
We focus our sales and marketing efforts on generating awareness of our company, platform and products, creating sales leads and establishing and promoting our brand, both domestically and internationally.
General and Administrative. General and administrative expenses consist primarily of personnel costs for our accounting, finance, legal, human resources and administrative support personnel. General and administrative expenses also include costs related to business acquisitions and dispositions, legal and other professional services fees, certain taxes, depreciation and amortization, charitable contributions and an allocation of our general overhead expenses. General and administrative expenses are allocated to each segment when they are directly attributable to each segment or are allocated to segments based on methodologies that best reflect the patterns of consumptions of these costs. A significant portion of general and administrative costs, such as costs related to corporate governance, legal and certain finance and accounting functions, support company-wide processes and are managed on a company-wide level and, therefore, are considered corporate costs and are not allocated to segments.
We expect that we will incur costs associated with supporting the growth of our business. We may also incur higher than usual losses related to deterioration of quality of certain financial assets caused by macroeconomic conditions.
Restructuring Costs. Restructuring costs consist primarily of personnel costs, such as employee severance payments, benefits and certain facilitation costs, associated with our workforce reductions, which are described in Note 6 to our consolidated financial statements included elsewhere in this Annual Report on Form 10-K. Restructuring costs also include stock-based compensation expense related to vesting of stock-based awards of the impacted employees.
Impairment of Long-Lived Assets. Impairment of long-lived assets consists of impairment of intangible assets and certain operating right-of-use assets and the associated leasehold improvements and property and equipment when the carrying amounts exceed their respective fair values.
Other Expenses, Net
Our other expenses, net consist primarily of our share of losses from our equity method investment; impairment charges and gains and losses related to our strategic investments and marketable securities, including interest income; and debt-related costs, including interest expense.
(Provision for) Benefit From Income Taxes
Our (provision for) benefit from income taxes consists primarily of income taxes, withholding taxes in foreign jurisdictions in which the Company conducts business and tax benefits related to the release of valuation allowance from historically completed acquisitions.
The primary difference between our effective tax rate and the federal statutory rate relates to the valuation allowance the Company established on the federal, state and certain foreign net operating losses and credits.
Non-GAAP Financial Measures
We use the following non‑GAAP financial information, collectively, to evaluate our ongoing operations and for internal planning and forecasting purposes. We believe that non‑GAAP financial information, when taken collectively, may be helpful to investors because it provides consistency and comparability with past financial performance, facilitates period‑to‑period comparisons of results of operations and assists in comparisons with other companies, many of which use similar non‑GAAP financial information to supplement their results of operations reported in accordance with generally accepted accounting principles (“GAAP”). Non‑GAAP financial information is presented for supplemental informational purposes only, should not be considered a substitute for financial information presented in accordance with GAAP and may be different from similarly‑titled non‑GAAP measures used by other companies. Whenever we use a non‑GAAP financial measure, a reconciliation is provided to the most closely applicable financial measure stated in accordance with GAAP. The users of our consolidated financial statements are encouraged to review the related GAAP financial measures and the reconciliation of these non‑GAAP financial measures to their most directly comparable GAAP financial measures.
Non‑GAAP Gross Profit and Non‑GAAP Gross Margin
For the periods presented, we define non‑GAAP gross profit and non‑GAAP gross margin as GAAP gross profit and GAAP gross margin, respectively, adjusted to exclude, as applicable, certain expenses as presented in the table below:
| | | | | | | | | | | | | | | | | | | | | | | | | | |
| | | | | | | | |
| | Year Ended December 31, | | | | | | |
| | 2023 | | 2022 | | 2021 | | | | | | |
| Reconciliation: | | (In thousands) |
| GAAP gross profit | | $ | 2,043,930 | | | $ | 1,813,577 | | | $ | 1,390,713 | | | | | | | |
| GAAP gross margin | | 49 | % | | 47 | % | | 49 | % | | | | | | |
| Non-GAAP adjustments: | | | | | | | | | | | | |
| Stock-based compensation | | 26,343 | | | 21,136 | | | 14,074 | | | | | | | |
| Amortization of acquired intangibles | | 113,266 | | | 122,653 | | | 114,896 | | | | | | | |
| Payroll taxes related to stock-based compensation | | 699 | | | 539 | | | — | | | | | | | |
| Non-GAAP gross profit | | $ | 2,184,238 | | | $ | 1,957,905 | | | $ | 1,519,683 | | | | | | | |
| Non-GAAP gross margin | | 53 | % | | 51 | % | | 53 | % | | | | | | |
Non‑GAAP Operating Expenses
For the periods presented, we define non‑GAAP operating expenses (including categories of operating expenses) as GAAP operating expenses (and categories of operating expenses) adjusted to exclude, as applicable, certain expenses as presented in the table below:
| | | | | | | | | | | | | | | | | | | | | | | | | | |
| | | | | | | | |
| | Year Ended December 31, | | | | | | |
| | 2023 | | 2022 | | 2021 | | | | | | |
| Reconciliation: | | (In thousands) |
| GAAP operating expenses | | $ | 2,920,471 | | | $ | 3,018,885 | | | $ | 2,306,297 | | | | | | | |
| Non-GAAP adjustments: | | | | | | | | | | | | |
| Stock-based compensation | | (636,499) | | | (763,149) | | | (618,211) | | | | | | | |
| Amortization of acquired intangibles | | (79,041) | | | (83,528) | | | (83,888) | | | | | | | |
| Acquisition and divestiture related expenses | | (5,555) | | | (2,621) | | | (7,449) | | | | | | | |
| Loss on net assets divested | | (32,277) | | | — | | | — | | | | | | | |
| Payroll taxes related to stock-based compensation | | (12,286) | | | (23,293) | | | (48,417) | | | | | | | |
| Charitable contributions | | (17,346) | | | (9,541) | | | (31,169) | | | | | | | |
| Restructuring costs | | (165,733) | | | (76,636) | | | — | | | | | | | |
| Impairment of long-lived assets | | (320,504) | | | (97,722) | | | — | | | | | | | |
| Non-GAAP operating expenses | | $ | 1,651,230 | | | $ | 1,962,395 | | | $ | 1,517,163 | | | | | | | |
Non‑GAAP Income (Loss) from Operations and Non‑GAAP Operating Margin
For the periods presented, we define non‑GAAP income (loss) from operations and non‑GAAP operating margin as GAAP income (loss) from operations and GAAP operating margin, respectively, adjusted to exclude, as applicable, certain expenses as presented in the table below:
| | | | | | | | | | | | | | | | | | | | | | | | | | |
| | | | | | | | |
| | Year Ended December 31, | | | | | | |
| | 2023 | | 2022 | | 2021 | | | | | | |
| Reconciliation: | | (In thousands) |
| GAAP loss from operations | | $ | (876,541) | | | $ | (1,205,308) | | | $ | (915,584) | | | | | | | |
| GAAP operating margin | | (21) | % | | (32) | % | | (32) | % | | | | | | |
| Non-GAAP adjustments: | | | | | | | | | | | | |
| Stock-based compensation | | 662,842 | | | 784,285 | | | 632,285 | | | | | | | |
| Amortization of acquired intangibles | | 192,307 | | | 206,181 | | | 198,784 | | | | | | | |
| Acquisition and divestiture related expenses | | 5,555 | | | 2,621 | | | 7,449 | | | | | | | |
| Loss on net assets divested | | 32,277 | | | — | | | — | | | | | | | |
| Payroll taxes related to stock-based compensation | | 12,985 | | | 23,832 | | | 48,417 | | | | | | | |
| Charitable contributions | | 17,346 | | | 9,541 | | | 31,169 | | | | | | | |
| Restructuring costs | | 165,733 | | | 76,636 | | | — | | | | | | | |
| Impairment of long-lived assets | | 320,504 | | | 97,722 | | | — | | | | | | | |
| Non-GAAP income (loss) from operations | | $ | 533,008 | | | $ | (4,490) | | | $ | 2,520 | | | | | | | |
| Non-GAAP operating margin | | 13 | % | | — | % | | — | % | | | | | | |
Results of Operations
The following table sets forth our results of operations for the periods presented. The period-to-period comparison of our historical results are not indicative of the results that may be expected in the future.
| | | | | | | | | | | | | | | | | | | | |
| | |
| | Year Ended December 31, |
| | 2023 | | 2022 | | 2021 |
| Consolidated Statements of Operations Data: | | (In thousands, except share and per share amounts) |
| Revenue | | $ | 4,153,945 | | | $ | 3,826,321 | | | $ | 2,841,839 | |
Cost of revenue (1) (2) | | 2,110,015 | | | 2,012,744 | | | 1,451,126 | |
| Gross profit | | 2,043,930 | | | 1,813,577 | | | 1,390,713 | |
| Operating expenses: | | | | | | |
Research and development (1) (2) | | 942,790 | | | 1,079,081 | | | 789,219 | |
Sales and marketing (1) (2) | | 1,022,985 | | | 1,248,032 | | | 1,044,618 | |
General and administrative (1) (2) | | 468,459 | | | 517,414 | | | 472,460 | |
Restructuring costs (1) | | 165,733 | | | 76,636 | | | — | |
| Impairment of long-lived assets | | 320,504 | | | 97,722 | | | — | |
| Total operating expenses | | 2,920,471 | | | 3,018,885 | | | 2,306,297 | |
| Loss from operations | | (876,541) | | | (1,205,308) | | | (915,584) | |
| Other expenses, net: | | | | | | |
| Share of losses from equity method investment | | (121,897) | | | (35,315) | | | — | |
| Impairment of strategic investments | | (46,154) | | | — | | | — | |
| Other income (expenses), net | | 47,863 | | | (3,009) | | | (45,345) | |
| Total other expenses, net | | (120,188) | | | (38,324) | | | (45,345) | |
| Loss before (provision for) benefit from income taxes | | (996,729) | | | (1,243,632) | | | (960,929) | |
| (Provision for) benefit from income taxes | | (18,712) | | | (12,513) | | | 11,029 | |
| Net loss attributable to common stockholders | | $ | (1,015,441) | | | $ | (1,256,145) | | | $ | (949,900) | |
Net loss per share attributable to common
stockholders, basic and diluted | | $ | (5.54) | | | $ | (6.86) | | | $ | (5.45) | |
Weighted-average shares used in computing net
loss per share attributable to common
stockholders, basic and diluted | | 183,327,844 | | | 182,994,038 | | | 174,180,465 | |
__________________________________
(1) Includes stock-based compensation expense as follows:
| | | | | | | | | | | | | | | | | | | | | | | | | |
| | | | | |
| | Year Ended December 31, | | | |
| | 2023 | | 2022 | | 2021 | | | |
| | (In thousands) |
| Cost of revenue | | $ | 26,343 | | | $ | 21,136 | | | $ | 14,074 | | | | |
| Research and development | | 331,526 | | | 374,846 | | | 258,672 | | | | |
| Sales and marketing | | 183,389 | | | 240,109 | | | 213,351 | | | | |
| General and administrative | | 121,584 | | | 148,194 | | | 146,188 | | | | |
| Restructuring costs | | 13,015 | | | 14,275 | | | — | | | | |
| Total | | $ | 675,857 | | | $ | 798,560 | | | $ | 632,285 | | | | |
____________________________________
(2) Includes amortization of acquired intangibles as follows:
| | | | | | | | | | | | | | | | | | | | | | | | | |
| | | | | |
| | Year Ended December 31, | | | |
| | 2023 | | 2022 | | 2021 | | | |
| | (In thousands) |
| Cost of revenue | | $ | 113,266 | | | $ | 122,653 | | | $ | 114,896 | | | | |
| Research and development | | 1,913 | | | 1,680 | | | 1,260 | | | | |
| Sales and marketing | | 77,128 | | | 81,841 | | | 82,493 | | | | |
| General and administrative | | — | | | 7 | | | 135 | | | | |
| Total | | $ | 192,307 | | | $ | 206,181 | | | $ | 198,784 | | | | |
The following table sets forth our results of operations for each of the periods presented as a percentage of our total revenue:
| | | | | | | | | | | | | | | | | | | | | | |
| | | | |
| | Year Ended December 31, | | |
| | 2023 | | 2022 | | 2021 | | |
| Consolidated Statements of Operations, as a percentage of revenue: ** | | | | | | | | |
| Revenue | | 100 | % | | 100 | % | | 100 | % | | |
| Cost of revenue | | 51 | | | 53 | | | 51 | | | |
| Gross profit | | 49 | | | 47 | | | 49 | | | |
| Operating expenses: | | | | | | | | |
| Research and development | | 23 | | | 28 | | | 28 | | | |
| Sales and marketing | | 25 | | | 33 | | | 37 | | | |
| General and administrative | | 11 | | | 14 | | | 17 | | | |
| Restructuring costs | | 4 | | | 2 | | | — | | | |
| Impairment of long-lived assets | | 8 | | | 3 | | | — | | | |
| Total operating expenses | | 70 | | | 79 | | | 81 | | | |
| Loss from operations | | (21) | | | (32) | | | (32) | | | |
| Other expenses, net | | | | | | | | |
| Share of losses from equity method investment | | (3) | | | (1) | | | — | | | |
| Impairment of strategic investments | | (1) | | | — | | | — | | | |
| Other income (expenses), net | | 1 | | | * | | (2) | | | |
| Total other expenses, net | | (3) | | | (1) | | | (2) | | | |
| Loss before (provision for) benefit from income taxes | | (24) | | | (33) | | | (34) | | | |
| (Provision for) benefit from income taxes | | * | | * | | * | | |
| Net loss attributable to common stockholders | | (24 | %) | | (33 | %) | | (33 | %) | | |
| | | | | | | | |
____________________________________
* Less than 0.5% of revenue.
** Columns may not add up to 100% due to rounding.
Comparison of Fiscal Years Ended December 31, 2023, 2022 and 2021
Revenue
| | | | | | | | | | | | | | | | | | | | | | | | | | | | | | | | | | | | | | | | | | | | |
| | | | | | | | | | |
| | Year Ended December 31, | | | | | | | | |
| | 2023 | | 2022 | | 2021 | | 2022 to 2023 Change | | 2021 to 2022 Change |
| | (Dollars in thousands) |
| Twilio Communications | | $ | 3,858,693 | | | $ | 3,550,087 | | | $ | 2,640,874 | | | $ | 308,606 | | | 9 | % | | $ | 909,213 | | | 34 | % |
| Twilio Segment | | 295,252 | | | 276,234 | | | 200,965 | | | 19,018 | | | 7 | % | | 75,269 | | | 37 | % |
| Consolidated total revenue | | $ | 4,153,945 | | | $ | 3,826,321 | | | $ | 2,841,839 | | | $ | 327,624 | | | 9 | % | | $ | 984,482 | | | 35 | % |
2023 compared to 2022
In 2023, Communications revenue increased by $308.6 million, or 9%, compared to the same period last year. This increase was primarily attributable to a 5% increase in the number of Communications Active Customer Accounts from over 282,000 as of December 31, 2022, to over 297,000 as of December 31, 2023, as well as the increased usage of our products by our existing customers, as reflected in our Communications Dollar‑Based Net Expansion Rate of 103%. These increases were offset by a decrease of $59.8 million related to revenue from our ValueFirst and IoT businesses, which were divested during 2023.
In 2023, Segment revenue increased by $19.0 million, or 7%, compared to the same period last year. This increase was primarily attributable to a 4% increase in the number of Segment Active Customer Accounts from over 7,700 as of December 31, 2022 to over 8,000 as of December 31, 2023.Our Segment Dollar‑Based Net Expansion Rate was 97% for the year ended December 31, 2023, due to higher contraction and customer churn compared to the same period last year.
In 2023, consolidated total revenue increased by $327.6 million, or 9%, compared to the same period last year. This increase was primarily attributable to a 5% increase in the number of Active Customer Accounts, from over 290,000 as of December 31, 2022 to over 305,000 as of December 31, 2023, as well as the increased usage of our products by our existing customers, as reflected in our Dollar-Based Net Expansion Rate of 103%.
In 2023, U.S. revenue and international revenue represented $2.8 billion, or 66%, and $1.4 billion, or 34%, of total revenue, respectively. In 2022, U.S. revenue and international revenue represented $2.5 billion, or 66%, and $1.3 billion, or 34%, of total revenue, respectively.
2022 compared to 2021
In 2022, Communications revenue increased by $909.2 million, or 34%, compared to the same period in the prior year. This increase was primarily attributable to a 13% increase in the number of Communications Active Customer Accounts from over 249,000 as of December 31, 2021, to over 282,000 as of December 31, 2022, as well as the increased usage of our products by our existing customers, as reflected in our Communications Dollar‑Based Net Expansion Rate of 121%.
In 2022, Segment revenue increased by $75.3 million, or 37%, compared to the same period in the prior year. This increase was primarily attributable to a 4% increase in the number of Segment Active Customer Accounts from over 7,400 as of December 31, 2021 to over 7,700 as of December 31, 2022.Our Segment Dollar‑Based Net Expansion Rate was 116% for the year ended December 31, 2022.
In 2022, consolidated total revenue increased by $984.5 million, or 35%, compared to the same period in the prior year. This increase was primarily attributable to a 13% increase in the number of Active Customer Accounts, from over 256,000 as of December 31, 2021, to over 290,000 as of December 31, 2022, as well as an increase in the usage of our products by our existing customers, as reflected in our Dollar-Based Net Expansion Rate of 121%.
In 2022, U.S. revenue and international revenue represented $2.5 billion, or 66%, and $1.3 billion, or 34%, of total revenue, respectively. In 2021, U.S. revenue and international revenue represented $1.9 billion, or 68%, and $914.5 million, or 32%, of total revenue, respectively.
Cost of Revenue and Gross Profit
| | | | | | | | | | | | | | | | | | | | | | | | | | | | | | | | | | | | | | | | | | | | |
| | | | | | | | | | |
| | Year Ended December 31, | | | | | | | | |
| | 2023 | | 2022 | | 2021 | | 2022 to 2023 Change | | 2021 to 2022 Change |
| | (Dollars in thousands) |
| | | | | | | | | | | | | | |
| | | | | | | | | | | | | | |
| | | | | | | | | | | | | | |
| | | | | | | | | | | | | | |
| | | | | | | | | | | | | | |
| | | | | | | | | | | | | | |
| | | | | | | | | | | | | | |
| Cost of revenue | | $ | 2,110,015 | | | $ | 2,012,744 | | | $ | 1,451,126 | | | $ | 97,271 | | | 5 | % | | $ | 561,618 | | | 39 | % |
| Gross profit | | $ | 2,043,930 | | | $ | 1,813,577 | | | $ | 1,390,713 | | | $ | 230,353 | | | 13 | % | | $ | 422,864 | | | 30 | % |
2023 compared to 2022
In 2023, cost of revenue increased by $97.3 million, or 5%, compared to the same period last year. This increase was primarily attributable to a $51.4 million increase in network service providers’ costs, net of the impact of the hedging instruments, and a $28.7 million increase in hosting fees, which support the growth in usage of our products by our new and existing customers. The increase was also attributable to a $20.3 million increase in amortization of capitalized internal-use software development costs due to additional internal-use software projects placed in service in the current year.
In 2023, gross profit increased by $230.4 million, or 13%, compared to the same period last year. This increase was attributable to the factors impacting our revenue and cost of revenue, as described above.
2022 compared to 2021
In 2022, cost of revenue increased by $561.6 million, or 39%, compared to the same period in the prior year. The increase was primarily attributable to a $477.0 million increase in network service providers’ costs, net of the impact of hedging instruments, and a $40.8 million increase in hosting fees, which supported the growth in usage of our products by our new and existing customers.
In 2022, gross profit increased $422.9 million, or 30%, compared to the same period last year. This increase was attributable to the factors impacting our revenue and cost of revenue, as described above.
Operating Expenses
| | | | | | | | | | | | | | | | | | | | | | | | | | | | | | | | | | | | | | | | | | | | | | | |
| | | | | | | | | | | | | |
| | Year Ended December 31, | | | | | | | | | | | |
| | 2023 | | 2022 | | 2021 | | 2022 to 2023 Change | | 2021 to 2022 Change | | |
| | (Dollars in thousands) |
| Research and development | | $ | 942,790 | | | $ | 1,079,081 | | | $ | 789,219 | | | $ | (136,291) | | | (13) | % | | $ | 289,862 | | | 37 | % | | | |
| Sales and marketing | | 1,022,985 | | | 1,248,032 | | | 1,044,618 | | | (225,047) | | | (18) | % | | 203,414 | | | 19 | % | | | |
| General and administrative | | 468,459 | | | 517,414 | | | 472,460 | | | (48,955) | | | (9) | % | | 44,954 | | | 10 | % | | | |
| Restructuring costs | | 165,733 | | | 76,636 | | | — | | | 89,097 | | | 116 | % | | 76,636 | | | 100 | % | | | |
| Impairment of long-lived assets | | 320,504 | | | 97,722 | | | — | | | 222,782 | | | 228 | % | | 97,722 | | | 100 | % | | | |
| Total operating expenses | | $ | 2,920,471 | | | $ | 3,018,885 | | | $ | 2,306,297 | | | $ | (98,414) | | | (3) | % | | $ | 712,588 | | | 31 | % | | | |
2023 compared to 2022
In 2023, research and development expenses decreased by $136.3 million, or 13%, compared to the same period last year. The decrease was primarily attributable to a $140.7 million decrease in total personnel costs, which was mostly driven by the restructuring of our workforce in September 2022, February 2023 and December 2023, that contributed to an 8% decrease in average research and development headcount in 2023. For further detail on the restructuring plans refer to Note 7 to our consolidated financial statements included elsewhere in this Annual Report on Form 10-K.
In 2023, sales and marketing expenses decreased by $225.0 million, or 18%, compared to the same period last year. The decrease was primarily attributable to a $183.2 million decrease in total personnel costs, which was mostly driven by the restructuring of our workforce in September 2022, February 2023 and December 2023, that contributed to a 14% decrease in average sales and marketing headcount in 2023. Sales and marketing expenses also decreased due to a $21.5 million decrease in advertising expenses. For further detail on the restructuring plans refer to Note 7 to our consolidated financial statements included elsewhere in this Annual Report on Form 10-K.
In 2023, general and administrative expenses decreased by $49.0 million, or 9%, compared to the same period last year. The decrease was primarily attributable to a $78.1 million decrease in total personnel costs, which was mostly driven by the restructuring of our workforce in September 2022, February 2023 and December 2023, that contributed to a 21% decrease in average general and administrative headcount in 2023. These decreases were partially offset by a $32.3 million loss on divestiture related to the sale of our ValueFirst business and our IoT asset group. For further detail on the restructuring plans and divestitures, refer to Note 7 and Note 5, respectively, to our consolidated financial statements included elsewhere in this Annual Report on Form 10-K.
In 2023, restructuring costs increased by $89.1 million, or 116%, compared to the same period last year. The increase was primarily attributable to our restructuring activities under the February 2023 Plan and December 2023 Plan, which collectively had a more substantial financial impact than our restructuring activities undertaken in September 2022. For further detail refer to Note 7 to our consolidated financial statements included elsewhere in this Annual Report on Form 10-K.
In 2023, impairment of long-lived assets increased by $222.8 million, or 228%, compared to the same period last year. The increase was primarily attributable to the impairment of Segment intangible assets of $285.7 million in 2023, as a result of the performance of our Segment segment described in detail in Note 6 to our consolidated financial statements included elsewhere in this Annual Report on Form 10-K. This increase was partially offset by a $62.9 million decrease in impairments of operating right-of-use assets and property and equipment due to fewer office closures in 2023 compared to 2022.
2022 compared to 2021
In 2022, research and development expenses increased by $289.9 million, or 37%, compared to the same period in the prior year. The increase was primarily attributable to a $264.4 million increase in personnel costs, net of capitalized costs, largely as a result of a 33% increase in average research and development headcount as we continued to focus on enhancing our Segment and Flex products and strengthening our platform infrastructure.
In 2022, sales and marketing expenses increased by $203.4 million, or 19%, compared to the same period in the prior year. The increase was primarily attributable to a $175.5 million increase in personnel costs, largely as a result of a 26% increase in average sales and marketing headcount as we continued to expand our sales efforts globally. The increase was also due to a $13.4 million increase in advertising expenses.
In 2022, general and administrative expenses increased by $45.0 million, or 10%, compared to the same period in the prior year. The increase was primarily attributable to a $32.0 million increase in personnel costs, comprised of a $29.9 million, or 20%, increase in personnel costs before stock-based compensation, and a $2.0 million increase in stock-based compensation. The increase in personnel costs were largely a result of a 21% increase in average general and administrative headcount to support the growth of our business globally. The increase was also attributable to a $28.3 million increase in our bad debt expense. These increases were partially offset by a $21.6 million decrease in charitable contribution expense that we made through Twilio.org.
In 2022, we incurred $76.6 million in restructuring costs as a result of restructuring activities undertaken in September 2022, as described in Note 7 to our consolidated financial statements included elsewhere in this Annual Report on Form 10-K.
In 2022, we incurred $97.7 million in impairment charges related to our operating lease assets and other long-lived assets. The impairment charges were triggered by office closures in 2022 as described in Note 6 to our consolidated financial statements included elsewhere in this Annual Report on Form 10-K.
Other Expenses, net | | | | | | | | | | | | | | | | | | | | | | | | | | | | | | | | | | | | | | | | | | | | |
| | | | | | | | | | |
| | Year Ended December 31, | | | | | | | | |
| | 2023 | | 2022 | | 2021 | | 2022 to 2023 Change | | 2021 to 2022 Change |
| | (Dollars in thousands) | |
| Share of losses from equity method investment | | $ | 121,897 | | | $ | 35,315 | | | $ | — | | | $ | 86,582 | | | 245 | % | | $ | 35,315 | | | 100 | % |
| Impairment of strategic investments | | 46,154 | | | — | | | — | | | 46,154 | | | 100 | % | | — | | | — | % |
| Other (income) expenses, net | | (47,863) | | | 3,009 | | | 45,345 | | | (50,872) | | | (1,691) | % | | (42,336) | | | (93) | % |
| Total other expenses, net | | $ | 120,188 | | | $ | 38,324 | | | $ | 45,345 | | | $ | 81,864 | | | 214 | % | | $ | (7,021) | | | (15) | % |
2023 compared to 2022
In 2023, other expenses, net, increased by $81.9 million, or 214%, compared to the same period last year. The increase was primarily attributable to a $86.6 million increase in our share of losses from our equity method investment and a $46.2 million increase related to an impairment of a strategic investment, partially offset by a $53.8 million increase in income related to our investments. For further detail refer to Notes 3 and 11 to our consolidated financial statements included elsewhere in this Annual Report on Form 10-K.
2022 compared to 2021
In 2022, other expenses, net, decreased by $7.0 million, or 15%, compared to the same period in the prior year. The decrease was attributable to the $29.0 million loss from debt extinguishment in 2021 that did not recur in 2022, and a $13.3 million increase in interest income related to our investments, which was partially offset by a $35.3 million increase in our share of losses from our equity method investment. The net decrease in the remaining other expenses, net, categories were not significant either individually or in the aggregate. For further detail refer to Notes 3 and 11 to our consolidated financial statements included elsewhere in this Annual Report on Form 10-K.
Segment Results of Operations
The following table presents the results for non-GAAP operating income (loss), as reviewed by our CODM, for each of our Communications and Segment segments for the years ended December 31, 2023, 2022 and 2021:
| | | | | | | | | | | | | | | | | | | | | | | | | | | | | | | | | | | | | | | | | | | | |
| | | | | | | | | | |
| | Year Ended December 31, | | | | | | | | |
| | 2023 | | 2022 | | 2021 | | 2022 to 2023 Change | | 2021 to 2022 Change |
| | (Dollars in thousands) | | | | |
| | | | | | | | | | | | | | |
| Twilio Communications | | $ | 841,990 | | | $ | 318,680 | | | $ | 276,496 | | | $ | 523,310 | | | 164 | % | | $ | 42,184 | | | 15 | % |
| Twilio Segment | | $ | (72,430) | | | $ | (29,695) | | | $ | (13,006) | | | $ | (42,735) | | | 144 | % | | $ | (16,689) | | | 128 | % |
| | | | | | | | | | | | | | |
2023 compared to 2022
In 2023, Communications non-GAAP income from operations increased by $523.3 million, or 164%, compared to the same period last year. The increase was driven by an increase in Communications revenue of $308.6 million, as described in the Revenue section above, and a decrease in Communications operating expenses, partially offset by an increase in Communications cost of revenue. The decrease in operating expenses was primarily attributable to a $254.1 million decrease in total Communications personnel costs, which was mainly due to the restructuring of our workforce in September 2022, February 2023 and December 2023, that contributed to a 16% decrease in average Communications headcount in 2023. The increase in Communications cost of revenue was primarily attributable to a $19.5 million increase in hosting fees and a $51.3 million increase in network service providers’ costs, net of the impact of hedging instruments, to support the increase in revenue due to the growth in usage of our products by our new and existing customers.
In 2023, Segment non-GAAP loss from operations increased by $42.7 million, or 144%, compared to the same period last year. The increase was driven by an increase in Segment operating expenses and cost of revenue, partially offset by an increase in Segment revenue of $19.0 million, as described in the Revenue section above. The increase in operating expenses was primarily attributable to a $25.2 million increase in total Segment personnel costs, which was mainly due to a 12% increase in average Segment headcount in 2023, as we continued to focus on enhancing our Segment product and expanding our sales efforts. The increase in Segment cost of revenue was primarily attributable to a $9.2 million increase in hosting fees and a $4.9 million increase in amortization of capitalized internal-use software development costs.
2022 compared to 2021
In 2022, Communications non-GAAP income from operations increased by $42.2 million, or 15%, compared to the same period in the prior year. The increase was driven by an increase in Communications revenue of $909.2 million, as described in the Revenue section above, offset by an increase in Communications operating expenses and Communications cost of revenue. The increase in operating expenses was primarily attributable to a $259.6 million increase in Communications personnel costs, largely as a result of a 26% increase in average Communications headcount as we continued to focus on enhancing our products and expanding our sales efforts globally, a $24.9 million increase in bad debt expense, a $16.2 million increase in software subscription costs, and an $11.1 million increase in travel related expenses. The increase in Communications cost of revenue was primarily attributable to a $477.0 million increase in network service providers’ costs, including the impact of hedging instruments, a $30.7 million increase in hosting fees, and a $14.7 million increase in support costs, all of which supported the growth in usage of our products by new and existing customers. The net increase in the remaining operating expenses and cost of revenue categories were not significant either individually or in the aggregate.
In 2022, Segment non-GAAP loss from operations increased by $16.7 million, or 128%, compared to the same period in the prior year. The increase was driven by an increase in Segment operating expenses and Segment cost of revenue, offset by an increase in Segment revenue of $75.3 million, as described in the Revenue section above. The increase in operating expenses was primarily attributable to a $67.9 million increase in Segment personnel costs, largely as a result of a 50% increase in average Segment headcount as we continued to focus on enhancing our products and expanding our sales efforts globally, and a $9.1 million increase in advertising costs. The increase in Segment cost of revenue was primarily attributable to a $10.2 million increase in hosting fees and a $5.8 million increase in support costs.
Liquidity and Capital Resources
As of December 31, 2023, we had cash and cash equivalents of $655.9 million and short-term marketable securities of $3.4 billion. Cash equivalents consist of money market funds. Short-term marketable securities consist primarily of U.S. treasury securities, non-U.S. government securities, high credit quality corporate debt securities and commercial paper. The cash and cash equivalents and short-term marketable securities are held for working capital purposes.
Our principal sources of liquidity have been (i) the net proceeds of $979.0 million, $1.4 billion and $1.8 billion, net of underwriting discounts and offering expenses paid by us, from our public equity offerings in June 2019, August 2020 and February 2021, respectively; (ii) the aggregate net proceeds of approximately $984.7 million, after deducting purchaser discounts and debt issuance costs paid by us, from the issuance of our 2029 Notes and 2031 Notes in March 2021 (each, as defined below); (iii) the net proceeds of $228.4 million, after deducting transaction costs paid by us, from settlement of our capped call arrangements in June 2021; and (iv) the payments received from customers using our products.
Our primary uses of cash include operating costs, such as personnel-related costs, network service provider costs, cloud infrastructure costs, facility-related spending, as well as, from time to time, acquisitions, investments and share repurchases. Our principal contractual and other commitments consist of obligations under our 2029 Notes and 2031 Notes, our operating leases for office space that we occupy, sublease or hold to sublease, and contractual commitments to our cloud infrastructure and network service providers. Refer to Note 10, Note 14 and Note 17(a) to our consolidated financial statements included elsewhere in this Annual Report on Form 10-K for discussions of our obligations and commitments related to leases, debt and other purchase obligations.
We may, from time to time, consider acquisitions of, or investments in, complementary businesses, products, services, capital infrastructure or technologies which might affect our liquidity requirements or cause us to secure additional financing or issue additional equity or debt securities. There can be no assurance that additional credit lines or financing instruments will be available in amounts or on terms acceptable to us, if at all.
We believe that our cash, cash equivalents and marketable securities balances, as well as the cash flows generated by our operations, will be sufficient to satisfy our anticipated cash needs for working capital and capital expenditure needs, including authorized share repurchases, for the next 12 months and beyond. However, our belief may prove to be incorrect, and we could utilize our available financial resources sooner than we currently expect. We may be required to seek additional equity or debt financing in order to meet our future capital requirements. In the event that additional financing is required from outside sources, we may not be able to raise it on terms acceptable to us, or at all. If we are unable to raise additional capital when desired, our business, results of operations and financial condition would be adversely affected. Our future capital requirements, the adequacy of our available funds and our cash from operations depend on many factors and are affected by various risks and uncertainties, including those set forth in Part I, Item 1A, “Risk Factors.”
Share Repurchase Program
In February 2023, our board of directors authorized a share repurchase program pursuant to which we may repurchase up to $1.0 billion in aggregate value of our common stock. Repurchases under the program will be made through open market, private transactions or other means in compliance with applicable federal securities laws, and could include repurchases pursuant to Rule 10b5-1 trading plans. We have discretion in determining the conditions under which shares may be repurchased from time to time. The program expires on December 31, 2024.
In the year ended December 31, 2023, we purchased $672.1 million in aggregate value, or 11.3 million shares, of our common stock on the open market under this program. As of December 31, 2023, approximately $327.9 million of the originally authorized amount remains available for future repurchases.
2029 Notes and 2031 Notes
In March 2021, we issued and sold $1.0 billion aggregate principal amount of senior notes, consisting of $500.0 million principal amount of 3.625% notes due 2029 (the “2029 Notes”) and $500.0 million principal amount of 3.875% notes due 2031 (the “2031 Notes,” and together with the 2029 Notes, the “Notes”). These Notes are described in detail in Note 14 to our consolidated financial statements included elsewhere in this Annual Report on Form 10-K.
Cash Flows
The following table summarizes our cash flows:
| | | | | | | | | | | | | | | | | | | | | | |
| | | | |
| | Year Ended December 31, | | |
| | 2023 | | 2022 | | 2021 | | |
| | (In thousands) |
| Cash provided by (used in) operating activities | | $ | 414,752 | | | $ | (254,368) | | | $ | (58,192) | | | |
| Cash provided by (used in) investing activities | | 228,603 | | | (616,452) | | | (2,489,996) | | | |
| Cash (used in) provided by financing activities | | (643,610) | | | 45,007 | | | 3,096,325 | | | |
| Effect of exchange rate changes on cash, cash equivalents and restricted cash | | 108 | | | 60 | | | (191) | | | |
| Net (decrease) increase in cash, cash equivalents and restricted cash | | $ | (147) | | | $ | (825,753) | | | $ | 547,946 | | | |
Cash Flows from Operating Activities
In 2023, cash provided by operating activities consisted primarily of our net loss of $1.0 billion adjusted for non-cash items, including $675.9 million of stock-based compensation expense, $284.4 million of depreciation and amortization expense, $320.5 million of impairment of intangible assets and other long-lived assets, $72.9 million amortization of deferred commissions, $27.0 million of non-cash reduction in our operating right-of-use asset, $121.9 million of share of losses from equity method investments, $51.9 million of provision for bad debt and $230.6 million of cumulative changes in operating assets and liabilities. With respect to changes in operating assets and liabilities, accounts receivable and prepaid expenses increased $141.4 million primarily due to revenue growth, timing of cash receipts and pre-payments of our cloud infrastructure fees and certain operating expenses. Accounts payable and other current liabilities decreased $39.4 million primarily driven by lower personnel-related accruals due to lower headcount, including a $25.2 million decrease in the sabbatical benefit accrual driven by lower headcount and the sunsetting of the program. The impairment of intangible assets and other long lived assets is described further in Note 6 to our consolidated financial statements included elsewhere in this Annual Report on Form 10-K.
In 2022, cash used in operating activities consisted primarily of our net loss of $1.3 billion adjusted for non-cash items, including $798.6 million of stock-based compensation expense reflecting the impact of the September 2022 restructuring plan, $279.1 million of depreciation and amortization expense, $97.7 million of impairment of operating lease and other long-lived assets, $57.9 million of amortization of deferred commissions, $47.2 million of non-cash reduction in our operating right-of-use asset, $35.3 million of share of losses from equity method investments, $35.0 million of provision for bad debt, $33.2 million of net amortization of investment premium and discount and $396.6 million of cumulative changes in operating assets and liabilities. With respect to changes in operating assets and liabilities, accounts receivable and prepaid expenses increased $289.0 million primarily due to revenue growth, timing of cash receipts and pre-payments of our cloud infrastructure fees and certain operating expenses. Accounts payable and other current liabilities increased $105.8 million primarily due to increases in transaction volumes, and the impact from the then new sabbatical employee benefit that we introduced effective July 1, 2022. Operating lease liabilities decreased $54.5 million due to payments made against our operating lease obligations. Other long-term assets increased $146.5 million primarily due to an increase in the sales commissions balances related to the growth of our business. The impairment of operating lease and other long lived assets is described further in Note 6 to our consolidated financial statements included elsewhere in this Annual Report on Form 10-K.
Cash Flows from Investing Activities
In 2023, cash provided by investing activities was $228.6 million primarily consisting of $247.4 million of maturities and sales of marketable securities and other investments, net of purchases, and $38.2 million of proceeds from divestitures, net of cash divested, partially offset by $39.9 million related to capitalized software development costs and $11.3 million related to purchases of long-lived assets.
In 2022, cash used in investing activities was $616.5 million primarily consisting of $498.9 million of purchases of marketable securities and other investments, net of maturities and sales, $45.8 million related to capitalized software development costs, $37.4 million of net cash paid to acquire other businesses and $34.4 million related to purchases of long-lived assets.
Cash Flows from Financing Activities
In 2023, cash used in financing activities was $643.6 million primarily consisting of $668.8 million of cash paid to repurchase 11.3 million shares of our common stock in the open market, including related costs, offset by $43.8 million in proceeds from stock options exercised by our employees and shares issued under our employee stock purchase plan.
In 2022, cash provided by financing activities was $45.0 million primarily consisting of $59.6 million in proceeds from stock options exercised by our employees and shares issued under our employee stock purchase plan, offset by $13.4 million in principal payments on debt and finance leases.
Critical Accounting Policies and Estimates
Our consolidated financial statements are prepared in accordance with U.S. GAAP. The preparation of these consolidated financial statements requires us to make estimates and assumptions that affect the reported amounts of assets, liabilities, revenue, expenses and related disclosures. We evaluate our estimates and assumptions on an ongoing basis. Our estimates are based on historical experience and various other assumptions that we believe to be reasonable under the circumstances. Our actual results could differ from these estimates.
We believe that the accounting policies, assumptions and estimates associated with revenue recognition have the greatest potential impact on our consolidated financial statements. Therefore, we consider these to be our critical accounting policies and estimates.
See Note 2 to our consolidated financial statements included elsewhere in this Annual Report on Form 10-K for a discussion of our accounting policies.
Revenue Recognition
Revenue is recognized upon transfer of control of promised products or services to customers in an amount that reflects the consideration we expect to receive in exchange for those products or services. We enter into contracts that can include various combinations of products and services, which are generally capable of being distinct and accounted for as separate performance obligations. Revenue is recognized net of allowances for credits and any taxes collected from customers, which are subsequently remitted to governmental authorities.
Our revenue is derived from usage and non-usage based fees. Our usage-based fees are earned from certain of our Communications products when customers access our platform. Platform usage is considered a monthly series comprising one performance obligation and usage-based fees are recognized as revenue in the period in which the usage occurs.
Our subscription-based fees are derived from our software products, such as Segment, Engage, Flex, Email and Marketing Campaigns, and certain other non-usage-based contracts, such as with the sales of short codes and customer support. Non-usage-based contracts revenue is recognized on a ratable basis over the contractual term which is generally from one to three years.
Our arrangements do not contain general rights of return. However, credits may be issued on a case-by-case basis. Credits are accounted for as variable consideration, are estimated based on historical trends and are recorded against revenue. The contracts do not provide customers with the right to take possession of the software supporting the applications. Amounts that have been invoiced are recorded in accounts receivable and in revenue or deferred revenue depending on whether the revenue recognition criteria have been met.
Recent Accounting Pronouncements Not Yet Adopted
See Note 2(af) to the consolidated financial statements included elsewhere in this Annual Report on Form 10-K for a discussion of recent accounting pronouncements not yet adopted.
Item 7A.Quantitative and Qualitative Disclosures about Market Risk
We are exposed to certain market risks in the ordinary course of our business, including sensitivities as follows:
Interest Rate Risk
We had cash and cash equivalents of $655.9 million and marketable securities of $3.4 billion as of December 31, 2023. In any given period, cash and cash equivalents may consist of bank deposits, money market funds, reverse repurchase agreements and commercial paper. Marketable securities consist primarily of U.S. treasury securities, non-U.S. government securities and high credit quality corporate debt securities. The cash and cash equivalents and marketable securities are held for working capital purposes. Such interest‑earning instruments carry a degree of interest rate risk. To date, fluctuations in interest income have not been significant. The primary objective of our investment activities is to preserve principal while maximizing income without significantly increasing risk. We do not enter into investments for trading or speculative purposes and have not used any derivative financial instruments to manage our interest rate risk exposure. In March 2021, we issued $1.0 billion aggregate principal amount of our 2029 Notes and 2031 Notes carrying fixed interest rates of 3.625% and 3.875%, respectively. Due to the short‑term nature of our investments and fixed rate nature of our debt, we have not been exposed to, nor do we anticipate being exposed to, material risks due to changes in interest rates. A hypothetical 10% change in interest rates during any of the periods presented would not have had a material impact on our consolidated financial statements included elsewhere in this Annual Report on Form 10-K.
Currency Exchange Risks
The functional currency of most of our foreign subsidiaries is the U.S. dollar. The local currencies of our foreign subsidiaries are the Australian dollar, the Bermuda dollar, the Brazilian real, the British pound, the Canadian dollar, the Colombian peso, the Czech Republic koruna, the Euro, the Hong Kong dollar, the Indian rupee, the Japanese yen, the Mexican peso, the Polish zloty, the Serbian dinar, the Singapore dollar and the Swedish krona.
The majority of our subsidiaries remeasure monetary assets and liabilities at period-end exchange rates, while non-monetary items are remeasured at historical rates. Revenue and expense accounts are remeasured at the average exchange rate in effect during the month in which a transaction occurs. If there is a change in foreign currency exchange rates, the conversion of our foreign subsidiaries’ financial statements into U.S. dollars would result in a realized gain or loss which is recorded in our consolidated statements of operations included elsewhere in this Annual Report on Form 10-K.
We enter into foreign currency derivative hedging transactions to mitigate our exposure to market risks that may result from changes in foreign currency exchange rates. For further information, refer to Note 9 to our consolidated financial statements included elsewhere in this Annual Report on Form 10-K.
A hypothetical 10% change in foreign exchange rates during any of the periods presented would not have had a material impact on our consolidated financial statements.
Item 8. Financial Statements and Supplementary Data
INDEX TO CONSOLIDATED FINANCIAL STATEMENTS
Report of Independent Registered Public Accounting Firm
To the Stockholders and Board of Directors
Twilio Inc.:
Opinions on the Consolidated Financial Statements and Internal Control Over Financial Reporting
We have audited the accompanying consolidated balance sheets of Twilio Inc. and subsidiaries (the Company) as of December 31, 2023 and 2022, the related consolidated statements of operations, comprehensive loss, stockholders’ equity, and cash flows for each of the years in the three-year period ended December 31, 2023, and the related notes (collectively, the consolidated financial statements). We also have audited the Company’s internal control over financial reporting as of December 31, 2023, based on criteria established in Internal Control – Integrated Framework (2013) issued by the Committee of Sponsoring Organizations of the Treadway Commission.
In our opinion, the consolidated financial statements referred to above present fairly, in all material respects, the financial position of the Company as of December 31, 2023 and 2022, and the results of its operations and its cash flows for each of the years in the three-year period ended December 31, 2023, in conformity with U.S. generally accepted accounting principles. Also in our opinion, the Company maintained, in all material respects, effective internal control over financial reporting as of December 31, 2023 based on criteria established in Internal Control – Integrated Framework (2013) issued by the Committee of Sponsoring Organizations of the Treadway Commission.
Basis for Opinions
The Company’s management is responsible for these consolidated financial statements, for maintaining effective internal control over financial reporting, and for its assessment of the effectiveness of internal control over financial reporting, included in the accompanying Annual Report on Internal Control Over Financial Reporting. Our responsibility is to express an opinion on the Company’s consolidated financial statements and an opinion on the Company’s internal control over financial reporting based on our audits. We are a public accounting firm registered with the Public Company Accounting Oversight Board (United States) (PCAOB) and are required to be independent with respect to the Company in accordance with the U.S. federal securities laws and the applicable rules and regulations of the Securities and Exchange Commission and the PCAOB.
We conducted our audits in accordance with the standards of the PCAOB. Those standards require that we plan and perform the audits to obtain reasonable assurance about whether the consolidated financial statements are free of material misstatement, whether due to error or fraud, and whether effective internal control over financial reporting was maintained in all material respects.
Our audits of the consolidated financial statements included performing procedures to assess the risks of material misstatement of the consolidated financial statements, whether due to error or fraud, and performing procedures that respond to those risks. Such procedures included examining, on a test basis, evidence regarding the amounts and disclosures in the consolidated financial statements. Our audits also included evaluating the accounting principles used and significant estimates made by management, as well as evaluating the overall presentation of the consolidated financial statements. Our audit of internal control over financial reporting included obtaining an understanding of internal control over financial reporting, assessing the risk that a material weakness exists, and testing and evaluating the design and operating effectiveness of internal control based on the assessed risk. Our audits also included performing such other procedures as we considered necessary in the circumstances. We believe that our audits provide a reasonable basis for our opinions.
Definition and Limitations of Internal Control Over Financial Reporting
A company’s internal control over financial reporting is a process designed to provide reasonable assurance regarding the reliability of financial reporting and the preparation of financial statements for external purposes in accordance with generally accepted accounting principles. A company’s internal control over financial reporting includes those policies and procedures that (1) pertain to the maintenance of records that, in reasonable detail, accurately and fairly reflect the transactions and dispositions of the assets of the company; (2) provide reasonable assurance that transactions are recorded as necessary to permit preparation of financial statements in accordance with generally accepted accounting principles, and that receipts and expenditures of the company are being made only in accordance with authorizations of management and directors of the company; and (3) provide reasonable assurance regarding prevention or timely detection of unauthorized acquisition, use, or disposition of the company’s assets that could have a material effect on the financial statements.
Because of its inherent limitations, internal control over financial reporting may not prevent or detect misstatements. Also, projections of any evaluation of effectiveness to future periods are subject to the risk that controls may become inadequate because of changes in conditions, or that the degree of compliance with the policies or procedures may deteriorate.
Critical Audit Matter
The critical audit matter communicated below is a matter arising from the current period audit of the consolidated financial statements that was communicated or required to be communicated to the audit committee and that: (1) relates to accounts or disclosures that are material to the consolidated financial statements and (2) involved our especially challenging, subjective, or complex judgments. The communication of a critical audit matter does not alter in any way our opinion on the consolidated financial statements, taken as a whole, and we are not, by communicating the critical audit matter below, providing a separate opinion on the critical audit matter or on the accounts or disclosures to which it relates.
Evaluation of the sufficiency of audit evidence over revenue recognition
As discussed in Note 2(e) to the consolidated financial statements, the Company's revenue is derived from usage and non-usage-based fees earned from customers accessing the Company's cloud-based platform. As of December 31, 2023, the Company recorded $4.2 billion in revenues, a portion of which related to Programmable Messaging and Programmable Voice APIs. The Company’s revenue recognition process is highly automated, and revenue is recorded within the Company’s general ledger through reliance on customized and proprietary information technology (IT) systems.
We identified the evaluation of the sufficiency of audit evidence over revenue recognition related to the Company’s Programmable Messaging and Programmable Voice APIs as a critical audit matter. This matter required especially subjective auditor judgment because of the large number of information technology (IT) applications involved in the revenue recognition process. Auditor judgment was required in determining the nature and extent of audit evidence obtained over these information systems that process revenue transactions. Involvement of IT professionals with specialized skills and knowledge was required to assist with the performance and evaluation of certain procedures and determination of IT applications subject to testing.
The following are the primary procedures we performed to address this critical audit matter. We applied auditor judgment to determine the nature and extent of procedures to be performed over revenue recognition. We evaluated the design and tested the operating effectiveness of certain internal controls related to the Company’s Programmable Messaging and Programmable Voice revenue recognition process. We involved IT professionals with specialized skills and knowledge, who assisted in testing controls related to the Company’s general information technology and application controls related to the systems utilized within the Company’s Programmable Messaging and Programmable Voice revenue recognition process. For a sample of customer agreements, we compared the pricing reflected in the Company’s revenue IT system to the contractually agreed upon pricing with the customer. For a sample of revenue transactions, we compared the amounts recognized for consistency with underlying documentation, including contracts with customers. We assessed the recorded revenue by comparing revenue to underlying cash receipts. We evaluated credits issued after year end to assess the revenue recorded within the period. In addition, we evaluated the overall sufficiency of audit evidence obtained by assessing the results of procedures performed, including appropriateness of the nature and extent of such evidence.
/s/ KPMG LLP
We have served as the Company’s auditor since 2013.
San Francisco, California
February 27, 2024
TWILIO INC.
Consolidated Balance Sheets
| | | | | | | | | | | | | | |
| | As of December 31, |
| | 2023 | | 2022 |
| | (In thousands, except share and per share amounts) |
| ASSETS | | | | |
| Current assets: | | | | |
| Cash and cash equivalents | | $ | 655,931 | | | $ | 651,752 | |
| | | | |
| Short-term marketable securities | | 3,356,064 | | | 3,503,317 | |
| Accounts receivable, net | | 562,773 | | | 547,507 | |
| | | | |
| | | | |
| Prepaid expenses and other current assets | | 329,204 | | | 281,510 | |
| Total current assets | | 4,903,972 | | | 4,984,086 | |
| Property and equipment, net | | 209,639 | | | 263,979 | |
| Operating right-of-use assets | | 73,959 | | | 121,341 | |
| Equity method investment | | 593,582 | | | 699,911 | |
| Intangible assets, net | | 350,490 | | | 849,935 | |
| Goodwill | | 5,243,266 | | | 5,284,153 | |
| Other long-term assets | | 234,799 | | | 360,899 | |
| | | | |
| Total assets | | $ | 11,609,707 | | | $ | 12,564,304 | |
| LIABILITIES AND STOCKHOLDERS' EQUITY | | | | |
| Current liabilities: | | | | |
| Accounts payable | | $ | 119,615 | | | $ | 124,605 | |
| Accrued expenses and other current liabilities | | 424,311 | | | 490,221 | |
| Deferred revenue and customer deposits | | 144,499 | | | 139,110 | |
| Operating lease liability, current | | 49,872 | | | 54,222 | |
| | | | |
| | | | |
| | | | |
| Total current liabilities | | 738,297 | | | 808,158 | |
| Operating lease liability, noncurrent | | 120,770 | | | 164,551 | |
| Finance lease liability, noncurrent | | 9,191 | | | 21,290 | |
| Long-term debt, net | | 988,953 | | | 987,382 | |
| Other long-term liabilities | | 19,944 | | | 23,881 | |
| | | | |
| Total liabilities | | 1,877,155 | | | 2,005,262 | |
| Commitments and contingencies (Note 17) | | | | |
| Stockholders' equity: | | | | |
| Preferred stock, $0.001 par value, 100,000,000 shares authorized, none issued | | — | | | — | |
| Class A and Class B common stock, $0.001 par value per share | | | | |
| Authorized shares 1,003,170,181 and 1,100,000,000 as of December 31, 2023 and 2022; Issued and outstanding shares 181,945,771 and 185,975,709 as of December 31, 2023 and 2022 | | 182 | | | 186 | |
| Additional paid-in capital | | 14,797,723 | | | 14,055,853 | |
| Accumulated other comprehensive income (loss) | | 619 | | | (121,161) | |
| Accumulated deficit | | (5,065,972) | | | (3,375,836) | |
| Total stockholders’ equity | | 9,732,552 | | | 10,559,042 | |
| Total liabilities and stockholders’ equity | | $ | 11,609,707 | | | $ | 12,564,304 | |
See accompanying notes to consolidated financial statements.
TWILIO INC.
Consolidated Statements of Operations
| | | | | | | | | | | | | | | | | | | | | | |
| | Year Ended December 31, | | |
| | 2023 | | 2022 | | 2021 | | |
| | (In thousands, except share and per share amounts) |
| Revenue | | $ | 4,153,945 | | | $ | 3,826,321 | | | $ | 2,841,839 | | | |
| Cost of revenue | | 2,110,015 | | | 2,012,744 | | | 1,451,126 | | | |
| Gross profit | | 2,043,930 | | | 1,813,577 | | | 1,390,713 | | | |
| Operating expenses: | | | | | | | | |
| Research and development | | 942,790 | | | 1,079,081 | | | 789,219 | | | |
| Sales and marketing | | 1,022,985 | | | 1,248,032 | | | 1,044,618 | | | |
| General and administrative | | 468,459 | | | 517,414 | | | 472,460 | | | |
| Restructuring costs | | 165,733 | | | 76,636 | | | — | | | |
| Impairment of long-lived assets | | 320,504 | | | 97,722 | | | — | | | |
| Total operating expenses | | 2,920,471 | | | 3,018,885 | | | 2,306,297 | | | |
| Loss from operations | | (876,541) | | | (1,205,308) | | | (915,584) | | | |
| Other expenses, net: | | | | | | | | |
| Share of losses from equity method investment | | (121,897) | | | (35,315) | | | — | | | |
| Impairment of strategic investments | | (46,154) | | | — | | | — | | | |
| Other income (expenses), net | | 47,863 | | | (3,009) | | | (45,345) | | | |
| Total other expenses, net | | (120,188) | | | (38,324) | | | (45,345) | | | |
| Loss before provision for income taxes | | (996,729) | | | (1,243,632) | | | (960,929) | | | |
| Provision for income taxes | | (18,712) | | | (12,513) | | | 11,029 | | | |
| Net loss attributable to common stockholders | | $ | (1,015,441) | | | $ | (1,256,145) | | | $ | (949,900) | | | |
| Net loss per share attributable to common stockholders, basic and diluted | | $ | (5.54) | | | $ | (6.86) | | | $ | (5.45) | | | |
| Weighted-average shares used in computing net loss per share attributable to common stockholders, basic and diluted | | 183,327,844 | | | 182,994,038 | | | 174,180,465 | | | |
See accompanying notes to consolidated financial statements.
TWILIO INC.
Consolidated Statements of Comprehensive Loss
| | | | | | | | | | | | | | | | | | | | | | |
| | Year Ended December 31, | | |
| | 2023 | | 2022 | | 2021 | | |
| | (In thousands) |
| Net loss | | $ | (1,015,441) | | | $ | (1,256,145) | | | $ | (949,900) | | | |
| Other comprehensive income (loss): | | | | | | | | |
| Unrealized gain (loss) on marketable securities | | 99,742 | | | (83,049) | | | (27,215) | | | |
| Foreign currency translation | | 5,587 | | | (5,587) | | | (266) | | | |
Net change in market value of effective foreign currency
forward exchange contracts | | 898 | | | 556 | | | 294 | | | |
Share of other comprehensive income (loss) from equity method investment | | 15,553 | | | (14,940) | | | — | | | |
| Total other comprehensive income (loss) | | 121,780 | | | (103,020) | | | (27,187) | | | |
| Comprehensive loss attributable to common stockholders | | $ | (893,661) | | | $ | (1,359,165) | | | $ | (977,087) | | | |
See accompanying notes to consolidated financial statements.
TWILIO INC.
Consolidated Statements of Stockholders’ Equity
| | | | | | | | | | | | | | | | | | | | | | | | | | | | | | | | | | | | | | | | | | | | | | | | | | |
| | Common Stock
Class A | | Common Stock
Class B | | Additional Paid-In Capital | | Accumulated Other Comprehensive Income (Loss) | | Accumulated Deficit | | Total Stockholders' Equity |
| | Shares | | Amount | | Shares | | Amount | | | | |
| | (In thousands, except share amounts) |
| Balance as of December 31, 2022 | | 176,358,104 | | | $ | 174 | | | 9,617,605 | | | $ | 12 | | | $ | 14,055,853 | | | $ | (121,161) | | | $ | (3,375,836) | | | $ | 10,559,042 | |
| Net loss | | — | | | — | | | — | | | — | | | — | | | — | | | (1,015,441) | | | (1,015,441) | |
| Exercises of vested stock options | | 238,474 | | | — | | | 127,982 | | | — | | | 7,344 | | | — | | | — | | | 7,344 | |
| Vesting of restricted stock units | | 5,939,641 | | | 7 | | | — | | | — | | | (7) | | | — | | | — | | | — | |
| Value of equity awards withheld for tax liability | | (38,655) | | | — | | | — | | | — | | | (2,565) | | | — | | | — | | | (2,565) | |
| Conversion of shares of Class B common stock into shares of Class A common stock | | 9,745,587 | | | 12 | | | (9,745,587) | | | (12) | | | — | | | — | | | — | | | — | |
| Shares of Class A common stock issued and donated to charity | | 88,408 | | | — | | | — | | | — | | | 5,346 | | | — | | | — | | | 5,346 | |
| Unrealized gain on marketable securities | | — | | | — | | | — | | | — | | | — | | | 99,742 | | | — | | | 99,742 | |
Repurchases of shares of Class A common stock including related costs | | (11,292,516) | | | (11) | | | — | | | — | | | — | | | — | | | (674,695) | | | (674,706) | |
| Foreign currency translation | | — | | | — | | | — | | | — | | | — | | | 5,587 | | | — | | | 5,587 | |
| | | | | | | | | | | | | | | | |
| Shares issued under ESPP | | 906,728 | | | — | | | — | | | — | | | 36,496 | | | — | | | — | | | 36,496 | |
| Net change in market value of effective foreign currency forward exchange contracts | | — | | | — | | | — | | | — | | | — | | | 898 | | | — | | | 898 | |
| Share of other comprehensive loss from equity method investment | | — | | | — | | | — | | | — | | | — | | | 15,553 | | | — | | | 15,553 | |
| Stock-based compensation | | — | | | — | | | — | | | — | | | 682,241 | | | — | | | — | | | 682,241 | |
| Stock-based compensation - restructuring | | — | | | — | | | — | | | — | | | 13,015 | | | — | | | — | | | 13,015 | |
| Balance as of December 31, 2023 | | 181,945,771 | | | $ | 182 | | | — | | | $ | — | | | $ | 14,797,723 | | | $ | 619 | | | $ | (5,065,972) | | | $ | 9,732,552 | |
See accompanying notes to consolidated financial statements.
TWILIO INC.
Consolidated Statements of Stockholders’ Equity
| | | | | | | | | | | | | | | | | | | | | | | | | | | | | | | | | | | | | | | | | | | | | | | | | | |
| | Common Stock
Class A | | Common Stock
Class B | | Additional Paid-In Capital | | Accumulated Other Comprehensive Income (Loss) | | Accumulated Deficit | | Total Stockholders' Equity |
| | Shares | | Amount | | Shares | | Amount | | | | |
| | (In thousands, except share amounts) |
| Balance as of December 31, 2021 | | 170,625,994 | | | $ | 168 | | | 9,842,105 | | | $ | 12 | | | $ | 13,169,118 | | | $ | (18,141) | | | $ | (2,119,691) | | | $ | 11,031,466 | |
| Net loss | | — | | | — | | | — | | | — | | | — | | | — | | | (1,256,145) | | | (1,256,145) | |
| Exercises of vested stock options | | 373,793 | | | — | | | 392,231 | | | — | | | 22,500 | | | — | | | — | | | 22,500 | |
| Vesting of restricted stock units | | 4,277,266 | | | 4 | | | — | | | — | | | (4) | | | — | | | — | | | — | |
| Value of equity awards withheld for tax liability | | (6,250) | | | — | | | — | | | — | | | (1,098) | | | — | | | — | | | (1,098) | |
| Conversion of shares of Class B common stock into shares of Class A common stock | | 616,731 | | | — | | | (616,731) | | | — | | | — | | | — | | | — | | | — | |
| Shares of Class A common stock issued and donated to charity | | 88,408 | | | — | | | — | | | — | | | 9,541 | | | — | | | — | | | 9,541 | |
| Unrealized loss on marketable securities | | — | | | — | | | — | | | — | | | — | | | (83,049) | | | — | | | (83,049) | |
| Foreign currency translation | | — | | | — | | | — | | | — | | | — | | | (5,587) | | | — | | | (5,587) | |
| Shares returned from escrow | | (152,239) | | | — | | | — | | | — | | | (387) | | | — | | | — | | | (387) | |
| Shares issued under ESPP | | 534,401 | | | 2 | | | — | | | — | | | 37,063 | | | — | | | — | | | 37,065 | |
| Net change in market value of effective foreign currency forward exchange contracts | | — | | | — | | | — | | | — | | | — | | | 556 | | | — | | | 556 | |
| Share of other comprehensive loss from equity method investment | | — | | | — | | | — | | | — | | | — | | | (14,940) | | | — | | | (14,940) | |
| Stock-based compensation | | — | | | — | | | — | | | — | | | 804,845 | | | — | | | — | | | 804,845 | |
| Stock-based compensation - restructuring | | — | | | — | | | — | | | — | | | 14,275 | | | — | | | — | | | 14,275 | |
| Balance as of December 31, 2022 | | 176,358,104 | | | $ | 174 | | | 9,617,605 | | | $ | 12 | | | $ | 14,055,853 | | | $ | (121,161) | | | $ | (3,375,836) | | | $ | 10,559,042 | |
See accompanying notes to consolidated financial statements.
TWILIO INC.
Consolidated Statements of Stockholders’ Equity
| | | | | | | | | | | | | | | | | | | | | | | | | | | | | | | | | | | | | | | | | | | | | | | | | | | | | | | | |
| | Common Stock
Class A | | Common Stock
Class B | | Additional Paid-In Capital | | Accumulated Other Comprehensive Income (Loss) | | Accumulated Deficit | | Total Stockholders' Equity | | | | | | |
| | Shares | | Amount | | Shares | | Amount | | | | | | | | | | |
| | (In thousands, except share amounts) | | | | | | |
| Balance as of December 31, 2020 | | 153,496,222 | | | $ | 151 | | | 10,551,302 | | | $ | 13 | | | $ | 9,613,246 | | | $ | 9,046 | | | $ | (1,169,791) | | | $ | 8,452,665 | | | | | | | |
| Net loss | | — | | | — | | | — | | | — | | | — | | | — | | | (949,900) | | | (949,900) | | | | | | | |
| Exercises of vested stock options | | 1,779,320 | | | 2 | | | 509,499 | | | — | | | 87,693 | | | — | | | — | | | 87,695 | | | | | | | |
| Vesting of restricted stock units | | 3,515,913 | | | 4 | | | — | | | — | | | (4) | | | — | | | — | | | — | | | | | | | |
| Value of equity awards withheld for tax liability | | (32,002) | | | — | | | — | | | — | | | (10,388) | | | — | | | — | | | (10,388) | | | | | | | |
| Conversion of shares of Class B common stock into shares of Class A common stock | | 1,218,696 | | | 1 | | | (1,218,696) | | | (1) | | | — | | | — | | | — | | | — | | | | | | | |
| Equity component from partial settlement and redemption of convertible senior notes due 2023 | | 4,846,965 | | | 5 | | | — | | | — | | | 335,637 | | | — | | | — | | | 335,642 | | | | | | | |
| Settlement of capped call, net of related costs | | — | | | — | | | — | | | — | | | 225,233 | | | — | | | — | | | 225,233 | | | | | | | |
| Shares of Class A common stock issued under ESPP | | 198,926 | | | — | | | — | | | — | | | 48,465 | | | — | | | — | | | 48,465 | | | | | | | |
| Shares of Class A common stock issued and donated to charity | | 88,408 | | | — | | | — | | | — | | | 31,169 | | | — | | | — | | | 31,169 | | | | | | | |
| Issuance of shares of Class A common stock in connection with a follow-on public offering, net of underwriters' discounts and issuance costs | | 4,312,500 | | | 4 | | | — | | | — | | | 1,765,709 | | | — | | | — | | | 1,765,713 | | | | | | | |
| Shares of Class A common stock issued in acquisition | | 1,116,816 | | | 1 | | | — | | | — | | | 419,169 | | | — | | | — | | | 419,170 | | | | | | | |
| Value of equity awards assumed in acquisition | | — | | | — | | | — | | | — | | | 1,511 | | | — | | | — | | | 1,511 | | | | | | | |
| Shares of Class A common stock subject to future vesting | | 84,230 | | | — | | | — | | | — | | | — | | | — | | | — | | | — | | | | | | | |
| Unrealized loss on marketable securities | | — | | | — | | | — | | | — | | | — | | | (27,215) | | | — | | | (27,215) | | | | | | | |
| Foreign currency translation | | — | | | — | | | — | | | — | | | — | | | (266) | | | — | | | (266) | | | | | | | |
| Net change in market value of effective foreign currency forward exchange contracts | | — | | | — | | | — | | | — | | | — | | | 294 | | | — | | | 294 | | | | | | | |
| Stock-based compensation | | — | | | — | | | — | | | — | | | 651,678 | | | — | | | — | | | 651,678 | | | | | | | |
| Balance as of December 31, 2021 | | 170,625,994 | | | $ | 168 | | | 9,842,105 | | | $ | 12 | | | $ | 13,169,118 | | | $ | (18,141) | | | $ | (2,119,691) | | | $ | 11,031,466 | | | | | | | |
See accompanying notes to consolidated financial statements.
TWILIOINC.
Consolidated Statements of Cash Flows
| | | | | | | | | | | | | | | | | | | | | | |
| | | | |
| | Year Ended December 31, | | |
| | 2023 | | 2022 | | 2021 | | |
| CASH FLOWS FROM OPERATING ACTIVITIES: | | (In thousands) |
| Net loss | | $ | (1,015,441) | | | $ | (1,256,145) | | | $ | (949,900) | | | |
| Adjustments to reconcile net loss to net cash provided by (used in) operating activities: | | | | | | | | |
| Depreciation and amortization | | 284,413 | | | 279,127 | | | 258,378 | | | |
| Non-cash reduction to the right-of-use asset | | 26,971 | | | 47,160 | | | 48,786 | | | |
| Net amortization of investment premium and discount | | (44) | | | 33,165 | | | 36,158 | | | |
| Impairment of long-lived assets | | 320,504 | | | 97,722 | | | — | | | |
| | | | | | | | |
| Stock-based compensation including restructuring | | 675,857 | | | 798,560 | | | 632,285 | | | |
| Amortization of deferred commissions | | 72,892 | | | 57,913 | | | 31,541 | | | |
| | | | | | | | |
| Realized and unrealized losses on equity securities | | 8,043 | | | — | | | — | | | |
| Provision for doubtful accounts | | 51,859 | | | 35,012 | | | 7,210 | | | |
| Value of shares of Class A common stock issued and donated to charity | | 5,346 | | | 9,541 | | | 31,169 | | | |
| Share of losses from equity method investment | | 121,897 | | | 35,315 | | | — | | | |
| Impairment of strategic investments | | 46,154 | | | — | | | — | | | |
| Loss on net assets divested | | 32,277 | | | — | | | — | | | |
| Loss on extinguishment of debt | | — | | | — | | | 28,965 | | | |
| Other adjustments | | 14,669 | | | 4,905 | | | 2,329 | | | |
| Changes in operating assets and liabilities: | | | | | | | | |
| Accounts receivable | | (85,093) | | | (194,655) | | | (117,943) | | | |
| Prepaid expenses and other current assets | | (56,283) | | | (94,326) | | | (78,012) | | | |
| Other long-term assets | | (2,328) | | | (146,458) | | | (121,225) | | | |
| Accounts payable | | 12,370 | | | 30,336 | | | 10,191 | | | |
| Accrued expenses and other current liabilities | | (51,816) | | | 75,430 | | | 127,554 | | | |
| Deferred revenue and customer deposits | | 5,371 | | | (2,688) | | | 45,634 | | | |
| Operating lease liabilities | | (56,340) | | | (54,450) | | | (49,046) | | | |
| Other long-term liabilities | | 3,474 | | | (9,832) | | | (2,266) | | | |
| Net cash provided by (used in) operating activities | | 414,752 | | | (254,368) | | | (58,192) | | | |
| CASH FLOWS FROM INVESTING ACTIVITIES: | | | | | | | | |
| Acquisitions, net of cash acquired and payments related to prior period acquisitions | | (5,770) | | | (37,410) | | | (491,522) | | | |
| Divestitures, net of cash divested | | 38,194 | | | — | | | — | | | |
| Purchases of marketable securities and other investments | | (1,953,003) | | | (1,938,337) | | | (3,523,232) | | | |
| Proceeds from sales and maturities of marketable securities | | 2,200,417 | | | 1,439,477 | | | 1,614,779 | | | |
| Capitalized software development costs | | (39,925) | | | (45,761) | | | (43,973) | | | |
| Purchases of long-lived and intangible assets | | (11,310) | | | (34,421) | | | (46,048) | | | |
| Net cash provided by (used in) investing activities | | 228,603 | | | (616,452) | | | (2,489,996) | | | |
| CASH FLOWS FROM FINANCING ACTIVITIES: | | | | | | | | |
| Proceeds from public offerings, net of underwriters' discounts | | — | | | — | | | 1,766,400 | | | |
| Payments of costs related to public offerings | | — | | | (35) | | | (687) | | | |
| Proceeds from issuance of senior notes due 2029 and 2031, net of issuance costs | | — | | | — | | | 984,723 | | | |
| Proceeds from settlements of capped call, net of settlement costs | | — | | | — | | | 228,412 | | | |
| Principal payments on debt and finance leases | | (16,134) | | | (13,423) | | | (8,295) | | | |
| Value of equity awards withheld for tax liabilities | | (2,565) | | | (1,098) | | | (10,388) | | | |
| Repurchases of shares of Class A common stock and related costs | | (668,751) | | | — | | | — | | | |
| Proceeds from exercises of stock options and shares of Class A common stock issued under ESPP | | 43,840 | | | 59,563 | | | 136,160 | | | |
| | | | | | | | |
| Net cash (used in) provided by financing activities | | (643,610) | | | 45,007 | | | 3,096,325 | | | |
| Effect of exchange rate changes on cash, cash equivalents and restricted cash | | 108 | | | 60 | | | (191) | | | |
| NET (DECREASE) INCREASE IN CASH, CASH EQUIVALENTS AND RESTRICTED CASH | | (147) | | | (825,753) | | | 547,946 | | | |
| CASH, CASH EQUIVALENTS AND RESTRICTED CASH—Beginning of period | | 656,078 | | | 1,481,831 | | | 933,885 | | | |
| CASH, CASH EQUIVALENTS AND RESTRICTED CASH —End of period | | $ | 655,931 | | | $ | 656,078 | | | $ | 1,481,831 | | | |
| Cash paid for income taxes, net | | $ | 37,818 | | | $ | 7,413 | | | $ | 6,147 | | | |
| Cash paid for interest | | $ | 38,389 | | | $ | 37,500 | | | $ | 20,637 | | | |
| NON-CASH FINANCING ACTIVITIES: | | | | | | | | |
| | | | | | | | |
| | | | | | | | |
| | | | | | | | |
| Value of common stock issued and equity awards assumed in acquisition | | $ | — | | | $ | — | | | $ | 420,681 | | | |
| Value of common stock issued to settle convertible senior notes due 2023 | | $ | — | | | $ | — | | | $ | 1,704,969 | | | |
| | | | | | | | |
| | | | | | | | |
| | | | | | | | |
| | | | | | | | |
| RECONCILIATION OF CASH, CASH EQUIVALENTS AND RESTRICTED CASH TO THE CONSOLIDATED BALANCE SHEETS | | | | | | | | |
| Cash and cash equivalents | | $ | 655,931 | | | $ | 651,752 | | | $ | 1,479,452 | | | |
| Restricted cash in other current assets | | — | | | 4,314 | | | 1,536 | | | |
| Restricted cash in other long-term assets | | — | | | 12 | | | 843 | | | |
| Total cash, cash equivalents and restricted cash | | $ | 655,931 | | | $ | 656,078 | | | $ | 1,481,831 | | | |
See accompanying notes to consolidated financial statements.
TWILIO INC.
Notes to Consolidated Financial Statements
1. Organization and Description of Business
Twilio Inc. (the “Company”) was incorporated in the state of Delaware on March 13, 2008. Today's leading companies trust Twilio's Customer Engagement Platform (CEP) to build direct, personalized relationships with their customers everywhere in the world. Twilio enables companies to use communications and data to add intelligence and security to every step of their customers’ journey, from sales to marketing to growth, customer service and many more engagement use cases in a flexible, programmatic way.
The Company’s headquarters are located in San Francisco, California, and the Company has subsidiaries across North America, South America, Europe, Asia and Australia.
2. Summary of Significant Accounting Policies
(a)Basis of Presentation
The accompanying consolidated financial statements have been prepared in accordance with generally accepted accounting principles in the United States of America (“U.S. GAAP”).
(b)Principles of Consolidation
The consolidated financial statements include the Company and its wholly owned subsidiaries. All significant intercompany balances and transactions have been eliminated.
(c)Use of Estimates
The preparation of financial statements in conformity with U.S. GAAP requires management to make estimates and assumptions that affect the reported amounts of assets and liabilities, disclosure of contingent assets and liabilities at the date of the financial statements and the reported amounts of revenues and expenses during the reporting period. These estimates are used for, but not limited to, revenue allowances and sales credit reserves; recoverability of long-lived and intangible assets; capitalization and useful life of the Company’s capitalized internal-use software development costs; fair values of acquired intangible assets and goodwill; accruals and contingencies. Estimates are based on historical experience and on various assumptions that the Company believes are reasonable under current circumstances. However, future events are subject to change and best estimates and judgments may require further adjustments, therefore, actual results could differ materially from those estimates. Management periodically evaluates such estimates and they are adjusted prospectively based upon such periodic evaluation.
(d)Concentration of Credit Risk
Financial instruments that potentially expose the Company to a concentration of credit risk consist primarily of cash, cash equivalents, restricted cash, marketable securities and accounts receivable. The Company maintains cash, restricted cash, cash equivalents and marketable securities with financial institutions. Certain balances held by such financial institutions exceed insured limits.
The Company sells its services to a wide variety of customers. If the financial condition or results of operations of any significant customer deteriorate substantially, the Company’s operating results could be adversely affected. To reduce credit risk, management performs credit evaluations of the financial condition of new customers and periodic re-evaluations, as needed, of existing customers. The Company does not require collateral from its credit customers and maintains reserves for estimated credit losses on customer accounts when considered necessary. Actual credit losses may differ from the Company’s estimates. During the years ended December 31, 2023, 2022 and 2021, no customer organization accounted for more than 10% of the Company’s total revenue.
As of December 31, 2023 and 2022, no customer organization represented more than 10% of the Company’s gross accounts receivable.
(e)Revenue Recognition
Revenue is recognized upon transfer of control of promised products or services to customers in an amount that reflects the consideration the Company expects to receive in exchange for those products or services. The Company enters into contracts that can include various combinations of products and services, which are generally capable of being distinct and accounted for as separate performance obligations. Revenue is recognized net of allowances for credits and any taxes collected from customers, which are subsequently remitted to governmental authorities.
The Company determines revenue recognition through the following steps:
•Identification of the contract, or contracts, with a customer;
•Identification of the performance obligations in the contract;
•Determination of the transaction price;
•Allocation of the transaction price to the performance obligations in the contract; and,
•Recognition of revenue when, or as, the Company satisfies a performance obligation.
Nature of Products and Services
The Company recognizes revenue from its products on either a usage basis or a subscription basis, depending on the nature of the product and the type of customer contract. The Company’s reportable segments may contain products that follow either revenue recognition model.
The majority of the revenue in the Communications segment is derived from usage‑based fees. These fees are earned when customers access the Company’s cloud-based platform and start using the Company’s products. Platform access is considered a monthly series comprised of one performance obligation and usage-based fees are recognized as revenue in the period in which the usage occurs. Some examples of the usage-based products are Messaging and Voice. For the Messaging products, the fees relate to the number of text messages sent or received. For the Voice products, the fees primarily relate to minutes of call duration. In the years ended December 31, 2023, 2022 and 2021, the revenue from usage-based fees represented 71%, 73% and 72% of total revenue, respectively.
Subscription-based fees are derived from various products in both the Communications and Segment segments. Subscription-based products include products such as Segment, Engage, Flex, Email and others. Subscription-based contracts revenue is recognized on a ratable basis over the contractual term which is generally between one to three years. In the years ended December 31, 2023, 2022 and 2021, the revenue from non-usage-based fees represented 29%, 27%, and 28% of total revenue, respectively. When usage-based products are embedded into subscription-based products, the Company charges for each product separately and records the respective revenue into the reportable segment in which each product resides.
No significant judgments are required in determining whether products and services are considered distinct performance obligations and should be accounted for separately versus together, or to determine the stand-alone selling price.
The Company's arrangements do not contain general rights of return. However, credits may be issued on a case-by-case basis. The contracts do not provide customers with the right to take possession of the software supporting the applications. Amounts that have been invoiced are recorded in accounts receivable and in revenue or deferred revenue depending on whether the revenue recognition criteria have been met.
The Company defines U.S. revenue as revenue from customers with IP addresses or mailing addresses at the time of registration in the United States. The Company defines international revenue as revenue from customers with IP addresses or mailing addresses at the time of registration outside of the United States.
Remaining Performance Obligations
Revenue allocated to remaining performance obligations represents unearned revenue and amounts that were and will be invoiced and recognized as revenue in future periods for non-cancelable subscription arrangements with terms greater than one year. The Company applies the optional exemption of not disclosing the transaction price allocated to the remaining performance obligations for its usage-based contracts and contracts with original duration of less than one year. Revenue allocated to remaining performance obligations for contracts with durations of greater than one year was $144.0 million as of December 31, 2023, of which 67% is expected to be recognized over the next 12 months and 93% is expected to be recognized over the next 24 months.
(f)Deferred Revenue and Customer Deposits
Deferred revenue is recorded when a non-cancellable contractual right to bill exists or when cash payments are received in advance of future usage on non-cancelable contracts. Customer refundable prepayments are recorded as customer deposits. As of December 31, 2023 and 2022, the Company recorded $144.5 million and $139.1 million as its deferred revenue and customer deposits, respectively, that are included in deferred revenue and customer deposits in the accompanying consolidated balance sheets. During the years ended December 31, 2023, 2022 and 2021, the Company recognized $120.5 million, $124.9 million and $70.1 million of revenue, respectively, that was included in the deferred revenue and customer deposits balance as of the end of the previous year.
(g)Deferred Sales Commissions
The Company records an asset for the incremental costs of obtaining a contract with a customer, for example, sales commissions that are earned upon execution of contracts. The Company uses the portfolio of data method to determine the estimated period of benefit of capitalized commissions which is generally determined to be up to five years. Amortization expense related to these capitalized costs related to initial contracts, upsells and renewals, is recognized on a straight line basis over the estimated period of benefit of the capitalized commissions. The Company applies the optional exemption of expensing these costs as incurred with amortization periods of one year or less.
Total net capitalized commission costs as of December 31, 2023 and 2022, were $200.1 million and $239.1 million, respectively, and are included in prepaid expenses and other current assets and other long‑term assets in the accompanying consolidated balance sheets. Amortization of these assets was $72.9 million, $57.9 million and $31.5 million in the years ended December 31, 2023, 2022 and 2021, respectively, and is included in sales and marketing expense in the accompanying consolidated statements of operations.
(h)Cost of Revenue
Cost of revenue consists primarily of fees paid to network service providers. Cost of revenue also includes cloud infrastructure fees, direct costs of personnel, such as salaries and stock‑based compensation for our customer support employees, and other non‑personnel costs, such as depreciation and amortization expense related to data centers and hosting equipment, amortization of capitalized internal-use software development costs and acquired intangible assets. Costs of revenue are generally directly attributable to each segment. Certain costs of revenue are allocated to segments based on methodologies that best reflect the patterns of consumptions of these costs.
(i)Research and Development Expense
Research and development expenses consist primarily of personnel costs, outsourced engineering services, cloud infrastructure fees for staging and development of the Company’s products, depreciation, amortization of capitalized internal-use software development costs and an allocation of general overhead expenses. The Company capitalizes the portion of its software development costs that meets the criteria for capitalization. Research and development expenses are generally directly attributable to each segment. Certain research and development expenses are allocated to segments based on methodologies that best reflect the patterns of consumptions of these costs. Certain research and development costs are not allocated to segments because they support company-wide processes and are managed on a company-wide level.
(j)Internal-Use Software Development Costs
Certain costs of platform and other software applications developed for internal use are capitalized. The Company capitalizes qualifying internal-use software development costs that are incurred during the application development stage. Capitalization of costs begins when two criteria are met: (i) the preliminary project stage is completed and (ii) it is probable that the software will be completed and used for its intended function. Capitalization ceases when the software is substantially complete and ready for its intended use, including the completion of all significant testing. The Company also capitalizes costs related to specific upgrades and enhancements when it is probable the expenditures will result in additional functionality. Costs incurred for maintenance, minor upgrades and enhancements are expensed. Costs related to preliminary project activities and post-implementation operating activities are also expensed as incurred.
Capitalized costs of platform and other software applications are included in property and equipment. These costs are amortized over the estimated useful life of the software on a straight-line basis over three years. Management evaluates the useful life of these assets on an annual basis and tests for impairment whenever events or changes in circumstances occur that could impact the recoverability of these assets. The amortization of costs related to the platform applications is included in cost of revenue, while the amortization of costs related to software applications developed for internal use is included in operating expenses.
(k)Advertising Costs
Advertising costs are expensed as incurred and were $71.1 million, $92.6 million and $78.8 million in the years ended December 31, 2023, 2022 and 2021, respectively. Advertising costs are included in sales and marketing expenses in the accompanying consolidated statements of operations.
(l)Restructuring Costs
The Company records restructuring expenses when management commits to a restructuring plan, the restructuring plan identifies all significant actions, the period of time to complete the restructuring plan indicates that significant changes to the plan are not likely and employees who are impacted have been notified of the pending involuntary termination.
(m)Stock-Based Compensation
All stock-based compensation to employees is measured on the grant date based on the fair value of these awards. This cost isthe awards on the date of grant. These costs are recognized as an expense following the straight-line attribution method over the requisite service period. This calculationThe Company uses the Black-Scholes option pricing model to measure the fair value of its stock options and the purchase rights issued under the Company's 2016 Employee Stock Purchase Plan, as amended (the “ESPP”). The fair value of the restricted stock units is performed for accounting purposesdetermined using the closing fair value of the Company's Class A common stock on the date of grant and reportedrecognized as an expense following straight-line attribution method over the requisite service period. Forfeitures are recorded in the executive compensation tables required byperiod in which they occur.
The Black-Scholes option pricing model requires the federal securities laws, even thoughuse of complex assumptions, which determine the recipientfair value of stock options and the purchase rights issued under the ESPP. If any of the awardsassumptions used in the Black-Scholes model change, stock-based compensation for future options may never realize anydiffer materially compared to that associated with previous grants. These assumptions include:
•Fair value of the common stock. The Company uses the market closing price of its Class A common stock, as reported on the New York Stock Exchange, for the fair value.
•Expected term. The expected term represents the period that the stock option or the purchase right is expected to be outstanding. The Company uses the simplified calculation of expected term, which reflects the weighted-average time-to-vest and the contractual life of the stock option or the purchase right;
•Expected volatility. Prior to July 2021, the expected volatility was derived from an average of the historical volatilities of the Class A common stock of the Company and several other entities with characteristics similar to those of the Company, such awards.as the size and operational and economic similarities to the Company's principal business operations. Beginning in July 2021, the expected volatility was derived from the average of the historical volatilities of the Class A common stock of the Company.
82
Compensation Risk Assessment